Candidate biomarkers in exosome-like vesicles purified from rat and mouse urine samples
Upload
independentCategory
view
0download
0
For Peer Review
Micellar electrokinetic chromatography for the determination of cortisol in urine samples in view of
biomedical studies
Journal: Electrophoresis
Manuscript ID: elps.201000144.R1
Wiley - Manuscript type: Short Communication
Date Submitted by the Author:
30-Apr-2010
Complete List of Authors: Olędzka, Ilona; Medical University, Pharmaceutical Chemistry
Keywords: cortisol, micellar-electrokinetic capillary chromatography, biomarker of stress
Wiley-VCH
ELECTROPHORESISpe
er-0
0599
464,
ver
sion
1 -
10 J
un 2
011
Author manuscript, published in "Electrophoresis 31, 14 (2010) 2356" DOI : 10.1002/elps.201000144

For Peer Review
2
Micellar electrokinetic chromatography for the determination of cortisol
in urine samples in view of biomedical studies
Ilona Olędzka*, Alina Plenis, Lucyna Konieczna, Piotr Kowalski, Tomasz Bączek
Department of Pharmaceutical Chemistry, Medical University of Gdańsk, Hallera 107, 80-
416, Gdańsk, Poland
* Corresponding author: Tel.: +48 58 3493136; Fax: +48 58 3493130;
e-mail: [email protected]
Keywords: cortisol, micellar-electrokinetic capillary chromatography, biomarker of stress
Page 1 of 32
Wiley-VCH
ELECTROPHORESIS
123456789101112131415161718192021222324252627282930313233343536373839404142434445464748495051525354555657585960
peer
-005
9946
4, v
ersi
on 1
- 10
Jun
201
1

For Peer Review
3
Abstract
Micellar electrokinetic capillary chromatographic (MEKC) method used for
determination of cortisol in urine was developed and elaborated. In turn, the measurements of
urinary free cortisol provided the diagnostic information for excess adrenal production of
cortisol. MEKC realized by the addition of anionic surfactant sodium dodecyl sulfate (SDS)
to the buffer solution, was demonstrated as to be the appropriate mode for the separation of
cortisol and dexamethasone used as internal standard. A buffer solution composed of 10 mM
sodium tetraborate and 50 mM SDS at pH 8.8 was used. The MEKC assay was evaluated by
analyzing a series of urine samples containing cortisol in variable concentrations. The
proposed method was validated for specificity, linearity, limits of detection and quantitation,
precision and trueness. The quantitation limit for cortisol equaled 5 ng/ml. The method was
selective, and reliable for identity and enable to detect changes of endogenous levels of
cortisol in urine under different stress situations.
Page 2 of 32
Wiley-VCH
ELECTROPHORESIS
123456789101112131415161718192021222324252627282930313233343536373839404142434445464748495051525354555657585960
peer
-005
9946
4, v
ersi
on 1
- 10
Jun
201
1
For Peer Review
4
1 Introduction
Cortisol is the major glucocorticoid produced by the adrenal glands in humans. It
regulates a myriad of biological function and has anti-inflammatory and immunosuppressive
effects. Moreover, it was found that it is also a biological biomarker of stress, anxiety and
depression. Urinary free cortisol (UFC) reflects the fraction of nonprotein bound plasma
cortisol. It is commonly and perhaps uncritically assumed that only free cortisol is the
biologically active fraction. Furthermore, measurements of UFC is important in the diagnosis
and management of adrenal disorders [1].
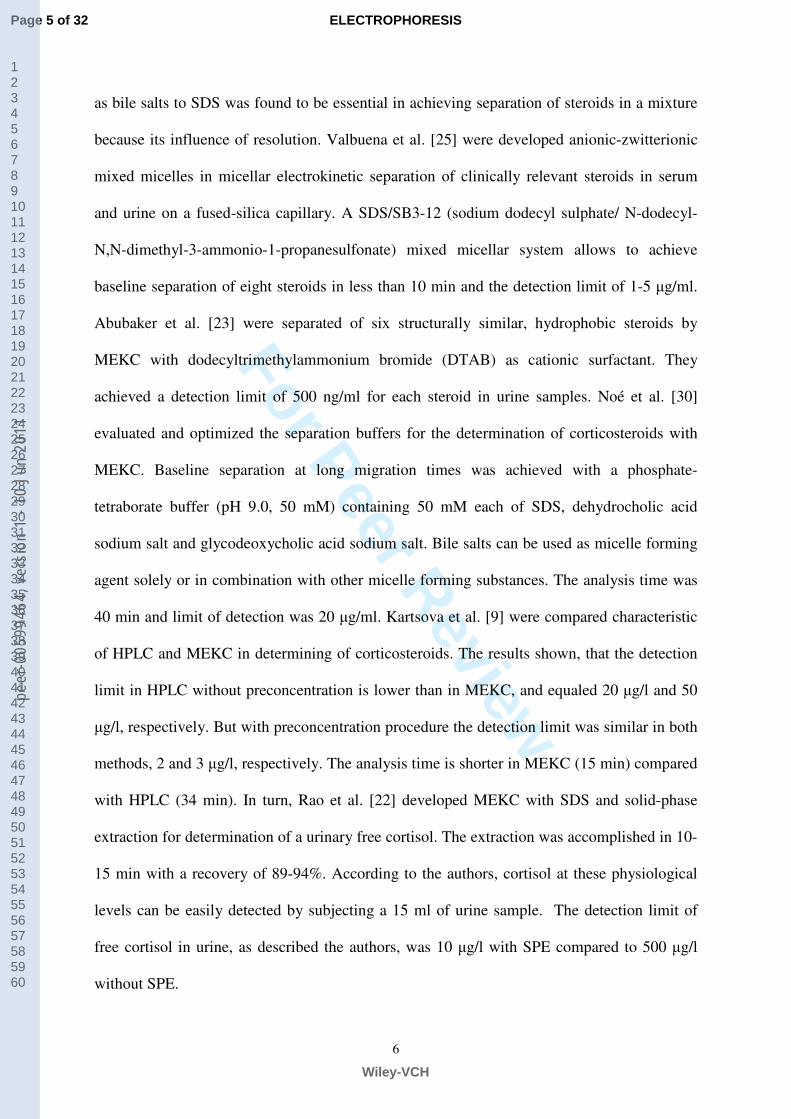
Several methods for the determination of cortisol in various types of biological
samples (plasma, serum, urine, saliva) have been described in recent years, unfortunately all
of them possess also several limitations [2-11]. The measuring cortisol in saliva has many
advantages including the easy of sampling. It is stress-free, non-invasive, and allows for
frequent and rapid sampling [2, 4, 8, 10]. However, salivary cortisol levels are only 50-70%
of serum free cortisol levels due to the conversion of cortisol to cortisone by 11β-
hydroxysteroid dehydrogenase type 2 activity in saliva [7]. On the other hand, the sampling of
blood may itself induce stress, and the sample represents a cumulative response [7, 11].
Kartsova et al. [9] studied the MEKC with UV detection for determining corticosteroids in
biological fluids such as, blood, serum and urine, with the use of various versions of online
preconcentration. However, the method employed a labor intensive manual liquid/liquid
extraction procedure with methylene chloride (chloroform). Despite the successful use of
halogenated solvents, such as dichloromethane and chloroform, this solvents should be
avoided when new methods are developed, since these solvents are banned from use in a
number of countries because of their negative effects on the environment.
Page 3 of 32
Wiley-VCH
ELECTROPHORESIS
123456789101112131415161718192021222324252627282930313233343536373839404142434445464748495051525354555657585960
peer
-005
9946
4, v
ersi
on 1
- 10
Jun
201
1

For Peer Review
5
In clinical laboratories, steroid hormones in urine are usually analyzed by
immunological techniques [8, 10], high-performance liquid chromatography [3, 6, 12-14], gas
chromatography (GC) [15], liquid chromatography (LC) [16-19], liquid chromatography-
tandem mass spectrometry (LC-MS/MS) [20], thin-layer chromatography (TLC) [21] and
capillary electrophoresis (CE) [9, 22-25]. The immunoassay methods are rapid and simple,
but the authors of a large number of publication point to the fact that most immunoassay
applications for urinary free cortisol do not measure cortisol alone, but also the interfering
material with apparently cortisol metabolites or adrenally derived cortisol prevailing.
Although the HPLC method does not suffer from cross-reactivity between the different
corticosteroids, the resolution of the method is low and rather large volumes of eluents are
required. The application of MEKC to urine samples is potentially difficult due to the low
sensitivity for absorbance detection, clogging of capillaries and current errors. However,
through pretreatment of samples the concentrations of the analytes can be increased
sufficiently for clinical applications. Since its introduction in 1984 by Terabe et al. [26],
micellar electrokinetic chromatography has gained wide popularity. It has been used for the
separation of various hydrophobic compounds such as steroids. In MEKC anionic or cationic
surfactants were added at a higher concentration than the critical micelle concentration
(CMC) to the electrolyte solution, forming a pseudo-stationary micellar phase. The migration
order for neutral analytes is related to the hydrophobicity of the analyte: more hydrophobic
analytes migrate slower than less hydrophobic ones. The migration time of the neutral analyte
is limited between the migration time of electroosmotic flow (EOF) and of the micelle.
Steroids, which are electrically neutral and high lipophilic drugs, can be separated by using
MEKC mode [25-30]. Nishi et al. [27] were the first to demonstrate the applicability of
MEKC for separating various corticosteroids on a fused-silica capillary using a sodium
dodecyl sulfate (SDS)-bile salts mixed micelle system. Addition of the organic modifiers such
Page 4 of 32
Wiley-VCH
ELECTROPHORESIS
123456789101112131415161718192021222324252627282930313233343536373839404142434445464748495051525354555657585960
peer
-005
9946
4, v
ersi
on 1
- 10
Jun
201
1
For Peer Review
6
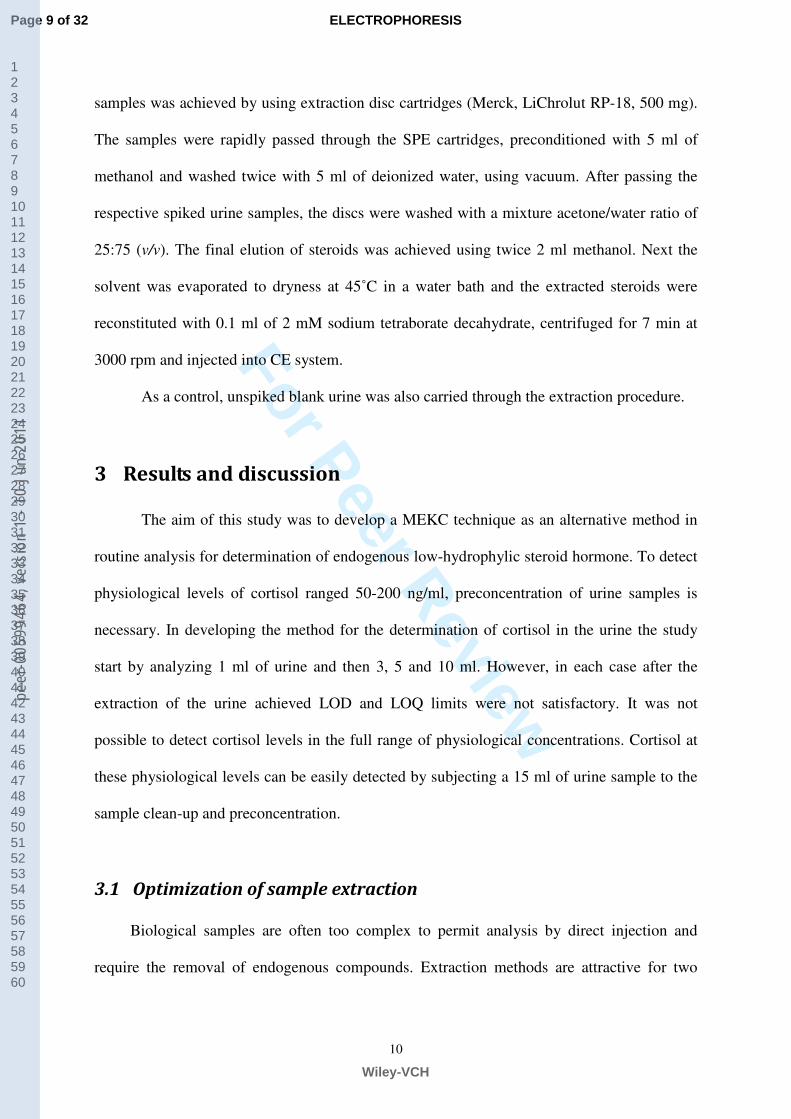
as bile salts to SDS was found to be essential in achieving separation of steroids in a mixture
because its influence of resolution. Valbuena et al. [25] were developed anionic-zwitterionic
mixed micelles in micellar electrokinetic separation of clinically relevant steroids in serum
and urine on a fused-silica capillary. A SDS/SB3-12 (sodium dodecyl sulphate/ N-dodecyl-
N,N-dimethyl-3-ammonio-1-propanesulfonate) mixed micellar system allows to achieve
baseline separation of eight steroids in less than 10 min and the detection limit of 1-5 µg/ml.
Abubaker et al. [23] were separated of six structurally similar, hydrophobic steroids by
MEKC with dodecyltrimethylammonium bromide (DTAB) as cationic surfactant. They
achieved a detection limit of 500 ng/ml for each steroid in urine samples. Noé et al. [30]
evaluated and optimized the separation buffers for the determination of corticosteroids with
MEKC. Baseline separation at long migration times was achieved with a phosphate-
tetraborate buffer (pH 9.0, 50 mM) containing 50 mM each of SDS, dehydrocholic acid
sodium salt and glycodeoxycholic acid sodium salt. Bile salts can be used as micelle forming
agent solely or in combination with other micelle forming substances. The analysis time was
40 min and limit of detection was 20 µg/ml. Kartsova et al. [9] were compared characteristic
of HPLC and MEKC in determining of corticosteroids. The results shown, that the detection
limit in HPLC without preconcentration is lower than in MEKC, and equaled 20 µg/l and 50
µg/l, respectively. But with preconcentration procedure the detection limit was similar in both
methods, 2 and 3 µg/l, respectively. The analysis time is shorter in MEKC (15 min) compared
with HPLC (34 min). In turn, Rao et al. [22] developed MEKC with SDS and solid-phase
extraction for determination of a urinary free cortisol. The extraction was accomplished in 10-
15 min with a recovery of 89-94%. According to the authors, cortisol at these physiological
levels can be easily detected by subjecting a 15 ml of urine sample. The detection limit of
free cortisol in urine, as described the authors, was 10 µg/l with SPE compared to 500 µg/l
without SPE.
Page 5 of 32
Wiley-VCH
ELECTROPHORESIS
123456789101112131415161718192021222324252627282930313233343536373839404142434445464748495051525354555657585960
peer
-005
9946
4, v
ersi
on 1
- 10
Jun
201
1

For Peer Review
7
To summarize a portion of the research on steroid hormone MEKC analysis
published during the last decade, our opinion is that, although many systematic investigations
have been carried out to establish new analytical methods for these compounds in complex
biological matrices, there are still problems in analyzing at the trace levels.
In the present study, a solid-phase extraction (SPE) coupled MEKC with UV detection
as a potential analytical method for the separation of urinary free cortisol was elaborated. The
main advantages of MEKC are high efficiency, speed, solvent saving and minimal sample
requirement (sample size 10-30 nl injected). Our work proposes an easy and rapid method
using MEKC with UV detector to determine cortisol in human urine. The UV detector has
been the most popular and useful, whereas mass spectrometry (MS) has been less frequently
applied in common laboratories due to the high instrumentation cost. Since most commercial
CE instruments are equipped with UV-Vis detectors, many applications have been published
using absorbance detection. Researchers applying UV detection have mostly used the method
of pre-concentration of following large volume of urine, namely 2 ml [9], 10 ml [24] and 15
ml [22]. For that reason we decided to develop 15 ml volume sample. This manner allowed to
us to determine this hormone in real samples, because the concentration of free steroids in
biological fluids are at the level of ng/ml. Due to steroids are non-volatile and unstable in high
temperature the GC is rarely used in clinical practice. In turn, thanks to steroids have UV
absorption at 254 nm, they should be easily detect with UV detectors. Due to the path length
sensitivity of absorbance measurements, several attempts have been made to improve
detection limits. Moreover, to improve detection of cortisol, in our paper, preconcentration of
urine samples has been employed. Validation aspects such as linearity, specificity,
repeatability, precision, trueness and sensitivity were successfully assessed. Additionally, the
application of MEKC method to screen for level of cortisol in human urine samples was also
investigated in this study.
Page 6 of 32
Wiley-VCH
ELECTROPHORESIS
123456789101112131415161718192021222324252627282930313233343536373839404142434445464748495051525354555657585960
peer
-005
9946
4, v
ersi
on 1
- 10
Jun
201
1

For Peer Review
8
2 Materials and methods
2.1 Chemicals and reagents
The buffer solution for CE analysis was prepared from sodium tetraborate decahydrate
and sodium dodecyl sulfate (SDS) (Merck, Germany). Cortisol (11β,17α,21-trihydroxypregn-
4-ene-3,20-dione) and dexamethasone (9α-Fluoro-11β,17α,21-trihydroxy-16α-methylpregn-
1,4-dien-3,20-dione) were purchased from Sigma (St. Louis, MO, USA) and were of a
minimum purity of 99%. Each of steroids was accurately weighed, dissolved in methanol and
diluted to an appropriate concentration. All solutions of the analytes were stored at 4°C until
analysis to avoid decomposition.
Dichloromethane, acetone and methanol were obtained from Merck (Germany).
Highly pure water was obtained from Milli-Q equipment (Millipore, Bedford, MA, USA).
2.2 Apparatus
Analysis was done using a Beckman P/ACE 2100 (Beckman Instruments, Fullerton,
CA, USA) equipped with Gold software for data analysis, selectable fixed-wavelength UV
detector and an autosampler. The capillary cartridge contained a 75 µm i.d. unmodified silica
capillary, 57 cm total length and 51 cm effective length to the detector. The voltage was
maintained at 20 kV. Detection of steroids was performed at 254 nm (wavelength of
absorption maximum). The background electrolyte for electrophoretic separation consisted of
50 mM SDS and 10 mM sodium tetraborate (pH = 8.8). Analytes were introduced into the
capillary at anode via a 5 s, whereas the detector was set on the cathode end of the capillary.
In order to equilibrate the capillary and minimize hysteresis effects, the capillary was
Page 7 of 32
Wiley-VCH
ELECTROPHORESIS
123456789101112131415161718192021222324252627282930313233343536373839404142434445464748495051525354555657585960
peer
-005
9946
4, v
ersi
on 1
- 10
Jun
201
1

For Peer Review
9
regenerated between each run by treatment with 0.1 M hydrochloric acid (0.3 min), next with
methanol (0.7 min), then with regeneration solution 0.1 M sodium hydroxide (1 min) and
finally with triple distilled water (1 min). Each day before analysis the system was first
purged with regeneration solution for 5 min, followed triple distilled water for 10 min and the
working buffer solution for next 10 min.
2.3 Sample preparation
The urine was obtained from adult volunteers and frozen at -20ºC. Before extraction
samples were left to thaw and equilibrate to room temperature. Cortisol levels were
standardized by correction for creatinine excretion, with results expressed as cortisol-to-
creatinine ratio. The amount of cortisol in the urine reflects the average cortisol concentration
in the blood at the time that the urine was formed. However, this measurement is affected by
the concentration of the urine. Due to creatinine is a product of muscle metabolism and it is
normally lost in the urine at a relatively steady rate, the ratio of cortisol to creatinine in the
urine can be used to account for the effect of urine concentration. Simple stress may cause a
mild increase in urinary cortisol/creatinine ratio. The presence of other illnesses may also
result in increased cortisol production by the adrenal glands and thereby increase this ratio [8,
13, 16]. The level of creatinine in urine samples of subjects was studied, because the
increased value indicate of renal failure and/or a reduced glomerular filtration. It may cause
an increase (or decrease) the contents of designated substances in urine.
Creatinine in urine was investigated using a diagnostic kit for the determination of
creatinine PZ CORMAY (Lublin, Poland). The colorimetric method based on reaction with
picrinic acid, according to the methodology supplied, was used.
Urine samples (15 ml) were spiked with 500 ng/ml dexamethasone (internal standard)
and various concentrations (5-400 ng/ml) of cortisol. Preconcentration of cortisol from urine
Page 8 of 32
Wiley-VCH
ELECTROPHORESIS
123456789101112131415161718192021222324252627282930313233343536373839404142434445464748495051525354555657585960
peer
-005
9946
4, v
ersi
on 1
- 10
Jun
201
1
For Peer Review
10
samples was achieved by using extraction disc cartridges (Merck, LiChrolut RP-18, 500 mg).
The samples were rapidly passed through the SPE cartridges, preconditioned with 5 ml of
methanol and washed twice with 5 ml of deionized water, using vacuum. After passing the
respective spiked urine samples, the discs were washed with a mixture acetone/water ratio of
25:75 (v/v). The final elution of steroids was achieved using twice 2 ml methanol. Next the
solvent was evaporated to dryness at 45˚C in a water bath and the extracted steroids were
reconstituted with 0.1 ml of 2 mM sodium tetraborate decahydrate, centrifuged for 7 min at
3000 rpm and injected into CE system.
As a control, unspiked blank urine was also carried through the extraction procedure.
3 Results and discussion
The aim of this study was to develop a MEKC technique as an alternative method in
routine analysis for determination of endogenous low-hydrophylic steroid hormone. To detect
physiological levels of cortisol ranged 50-200 ng/ml, preconcentration of urine samples is
necessary. In developing the method for the determination of cortisol in the urine the study
start by analyzing 1 ml of urine and then 3, 5 and 10 ml. However, in each case after the
extraction of the urine achieved LOD and LOQ limits were not satisfactory. It was not
possible to detect cortisol levels in the full range of physiological concentrations. Cortisol at
these physiological levels can be easily detected by subjecting a 15 ml of urine sample to the
sample clean-up and preconcentration.
3.1 Optimization of sample extraction
Biological samples are often too complex to permit analysis by direct injection and
require the removal of endogenous compounds. Extraction methods are attractive for two
Page 9 of 32
Wiley-VCH
ELECTROPHORESIS
123456789101112131415161718192021222324252627282930313233343536373839404142434445464748495051525354555657585960
peer
-005
9946
4, v
ersi
on 1
- 10
Jun
201
1

For Peer Review
11
reasons [31]. They selectively collect the analyte of interest plus a part of the endogenous
components, whereas the other endogenous components are removed. Secondly, the analyte
can simultaneously be concentrated by one or two orders of magnitude. The main
disadvantages of extraction techniques are the time and effort they require and the potential of
losses of the analyte. In order to isolate the test compound from the urine extraction the
following procedure were investigated: liquid-liquid extraction (LLE) and solid phase
extraction (SPE). In LLE hydrophobic sample components (i.e., cortisol) are extracted with a
water-immiscible organic phase [14]. The various organic solvents as eluting solvents were
used in this study (such as, ethyl acetate and dichloromethane). After extraction, the solvents
can be evaporated and the residue reconstituted in a suitable buffer. The use of large amounts
of organic solvents in LLE is a disadvantages as far as environmental and health aspects are
concerned. During the solid phase extraction the sample was passed over a disposable column
with nonpolar filling LC-18 by which some of the analytes was retained. After
preconditioning of the sorbent the sample was applied. The sorbent was then selectively
washed to remove undesirable components without the loss of the analyte of interest. The
analytes are then eluted using a minimum of solvent which can be evaporated and redissolved
in a buffer. Moreover, the SPE, now the most widely used, has many advantages such as the
possibility of isolation and concentration of volatile and non-volatile analytes, which has a
positive effect on further analysis and allows the lower limit of detection and determination of
test compounds. In addition, it allows the storage of test compounds adsorbed on the sorbent
for a long time and eliminates the formation of emulsions that occur during the extraction
LLE. An important advantage is the reduction in the use of organic solvents [22].
Additionally, SPE can be easily incorporated into automated analytical procedures, which can
lead to greater trueness and precision, as well as greater laboratory productivity. As a result,
SPE has gained popularity in analytical labs, whereas the use of LLE is waning. The results of
Page 10 of 32
Wiley-VCH
ELECTROPHORESIS
123456789101112131415161718192021222324252627282930313233343536373839404142434445464748495051525354555657585960
peer
-005
9946
4, v
ersi
on 1
- 10
Jun
201
1
For Peer Review
12
extraction efficiency of cortisol after various organic solvents used as eluents were presented
in Table 1.
The influence of extraction type on the extraction efficiency was tested on urine
samples spiked to level 20, 100 and 400 ng/ml of analytes. Different sorbent and organic
solvents were tested for clean-up of the sample extract. Precipitation of organic material and
extraction of cortisol was achieved by adding methanol, dichloromethane and acetonitrile to
urine samples. The research has been shown that, the best extraction procedure based on using
methanol. Best overall recovery for the hormone was obtained on C18 sorbents. The extraction
efficiency after using methanol and C18 sorbents equaled 103.4% for 20 ng/ml, 97.6% for 100
ng/ml and 100.4% for 400 ng/ml. LLE was initially evaluated but the extract were found to be
too dirty for MECK. The important reasons for the assay SPE are the cleaner background and
higher recovery of cortisol and internal standard than after LLE, therefore SPE was proposed
for removing the matrix of the sample. Recoveries (mean ± SD) were also determined for the
internal standard after SPE with methanol extraction procedure and being for concentration
500 ng/ml 86.9 ± 7.9%.
3.2 Optimization of running buffer
The constitution of the running buffer solution, including buffer composition,
concentration and pH value, was considered as an important factor in MEKC because of its
influence on the separation. The most commonly used surfactant is sodium dodecyl sulfate
(SDS) which is an anionic surfactant and is attracted by the anode. However, the EOF causes
the micelles to migrate to the cathode, in a slower rate than the bulk of the buffer. The
different velocities of the EOF and the micellar phase permit electrophoretic separations, and
provide a way to resolve charged as well as neutral molecules. Neutral solutes partition
between the micelles and the background electrolyte, and are separated solely on
Page 11 of 32
Wiley-VCH
ELECTROPHORESIS
123456789101112131415161718192021222324252627282930313233343536373839404142434445464748495051525354555657585960
peer
-005
9946
4, v
ersi
on 1
- 10
Jun
201
1
For Peer Review
13
chromatographic basis, whereas for ionic solutes separation is based on chromatography and
electrophoresis. The micelles can be considered as a moving pseudostationary phase.
Selectivity in MEKC is dependent on the concentration of the micelle-forming agent, the
buffer pH and the use of additives, including organic modifiers and salts. It is important that
surfactants present in concentration below the CMC also affect the mobility of analytes due to
complexation of the analyte with one or more surfactant molecules [23, 25, 30]. SDS was
added into the running buffer in this study. The SDS micelles enhanced solubility of the
analytes and offered good resolution. The influence of the SDS concentration in the optimized
tetraborate buffer was further evaluated for the resolution of the cortisol and dexamethasone
(I.S.). The concentration of the micelle forming agent (SDS) was tested from 10 to 50 mM.
Raising the concentration of SDS in buffer resulted in a increase of migration times for
compounds of interest. At a concentration of 50 mM of SDS the peaks were separated to the
baseline. The neutral components of the test sample such as steroids are separated because of
different distribution coefficients between a polar aqueous buffer and nonpolar micelles.
Second important parameter for MEKC separation is the pH of the buffer system.
We studied the separation of cortisol in both alkaline and acidic buffer under conditions of
MEKC with the use of SDS as micelle forming agent. In theory, the separation of steroids,
being neutral molecules, should be independent of pH [9]. However, at basic pH the increased
EOF reduced migration times of steroids but gave better efficiencies for resolved steroids
when compared to the ones obtained at pH below 7. In alkaline pH the elution order of
steroids corresponds to increasing hydrophobocity of the analytes. On the contrary, it is
inverted in an acidic medium more hydrophobic steroids are eluted sooner. Reduced EOF
under acidic conditions allows partitioning for a longer time period, thereby resulting in
baseline separation of steroids. The migration time reached a minimum at pH 8.8 and then
started to increase at more alkaline pH. At pH greater than 10 significantly loss in resolution.
Page 12 of 32
Wiley-VCH
ELECTROPHORESIS
123456789101112131415161718192021222324252627282930313233343536373839404142434445464748495051525354555657585960
peer
-005
9946
4, v
ersi
on 1
- 10
Jun
201
1

For Peer Review
14
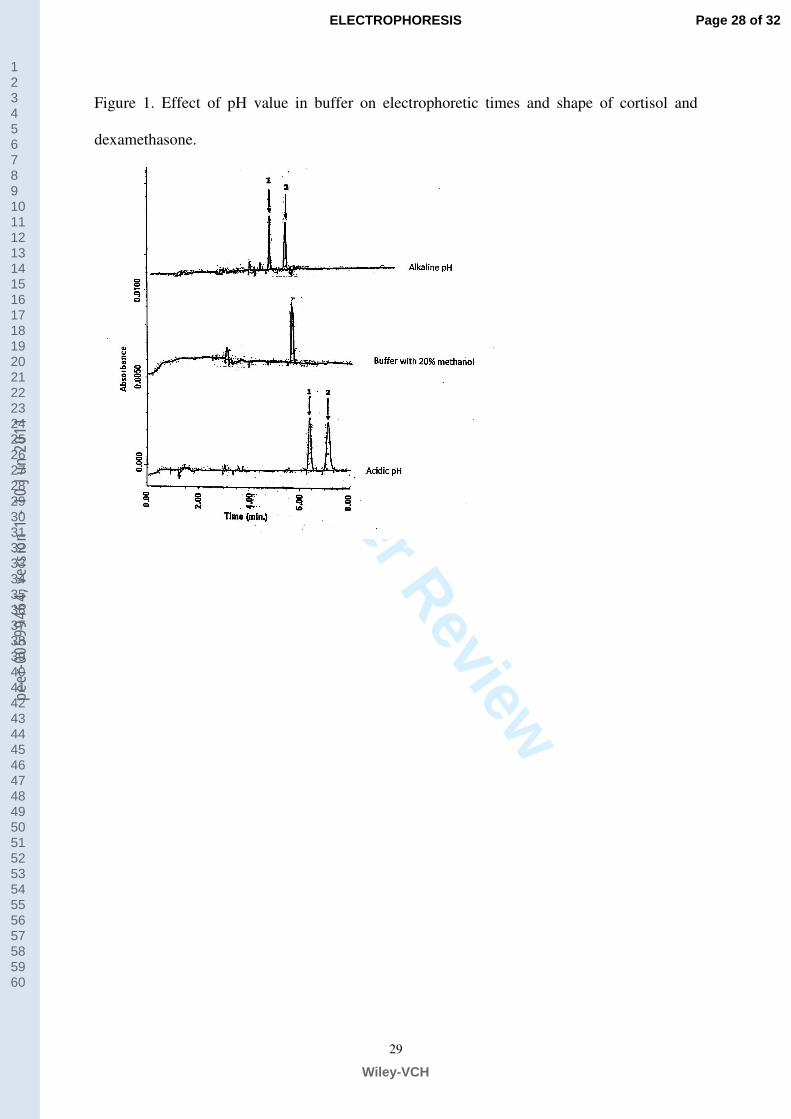
The influence on migration time and separation efficiency of the organic modifier
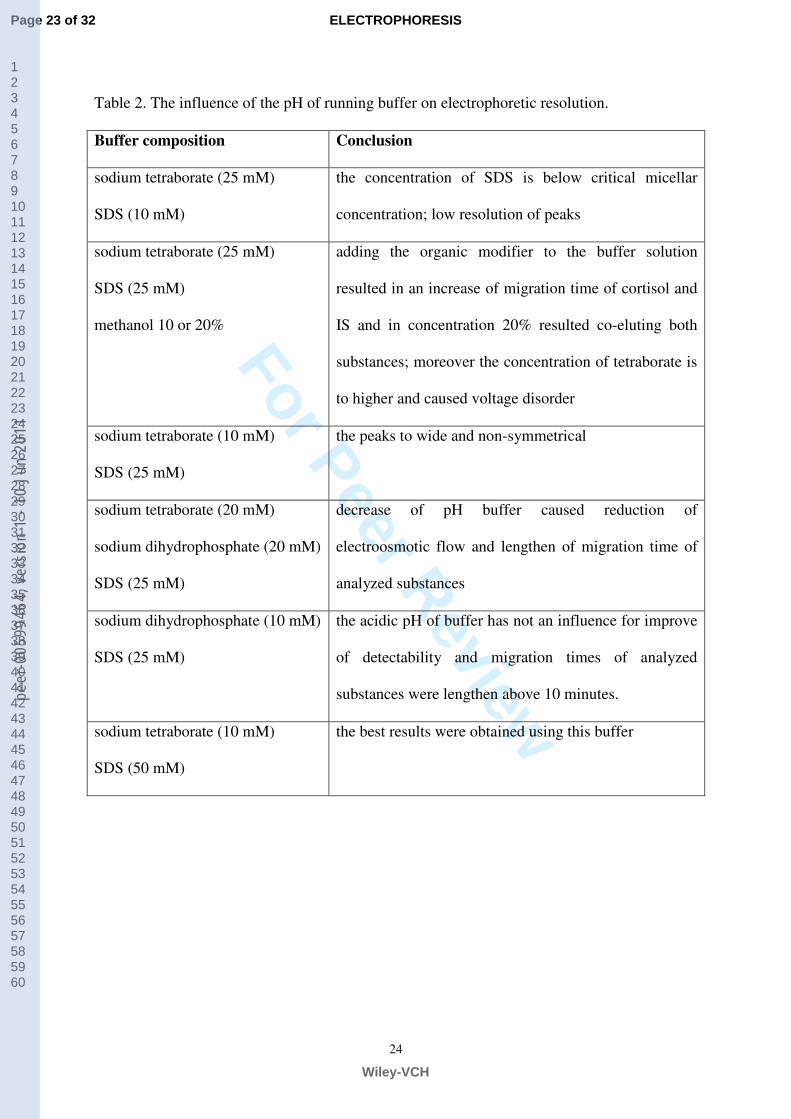
methanol (10-20%) added to buffer solution was also investigated. Generally, addition of
methanol to the buffer resulted in decrease of separation efficiency. The using of number of
borate and phosphate buffers and various concentration of SDS was investigated and the
results were presented in Table 2. The exemplary electropherograms showing the effect of pH
value in buffer on electrophoretic times and shape of cortisol and dexamethasone are depicted
in Figure 1.
Finally, the 10 mM borate buffer with the addition of 50 mM SDS (pH= 8.8) was
chosen as a running buffer for the subsequent experiments.
3.3 Optimization of instrument parameters
The effect of separation voltage on resolution was investigated at voltage range of 10-
25 kV. As expected, increase of voltage shortened the migration time and sharpened the peak
shape. On the other hand, higher voltage resulted in higher CE currents and Joule heating
which led to baseline noise and falling separation efficiency. A voltage of 20 kV was selected
as a good compromise between resolution and migration time.
The UV absorption spectra of cortisol and dexamethasone were examined in order to
optimize the detection wavelength. The research indicated that, only a very limited number of
solvents have low UV cut-off in combination with good steroid solvability. Water has a cut-
off below 210 nm, but does not dissolve the steroids. An alternative may be acetonitrile or
diethyl ether, as they easily dissolve a number of polar steroids and also have UV cut-offs
around or below 210 nm. Hexane and cyclohexane are even better with UV transparency
down towards 200 nm. The most commonly used solvents are lower unbranched aliphatic
alcohols such as ethanol and methanol, as they readily dissolve most steroids and offer UV
arounds 205 nm [22, 25, 32]. Our experience has shown that cortisol and the internal standard
Page 13 of 32
Wiley-VCH
ELECTROPHORESIS
123456789101112131415161718192021222324252627282930313233343536373839404142434445464748495051525354555657585960
peer
-005
9946
4, v
ersi
on 1
- 10
Jun
201
1

For Peer Review
15
(dexamethasone) dissolve in running buffer containing methanol show maximum absorbance
at a wavelength of 254 nm. For this reason, this wavelength detector has been selected for
further study as optimal.
Hydrodynamic injection mode was used for introducing the samples into the capillary.
The injection time of sample (2-20 s) was tested to achieve the required sensitivity for the
separation of cortisol and dexamethasone. It was observed that 5 s was enough to allow good
resolution for the analytes studied and maximum peak enhancement. Longer injections caused
an increase of peak signal, however, at the same time, a decrease of migration time and
deterioration of separation efficiency was observed.
Moreover, it was observed that decreasing the capillary temperature to 16˚C or
increasing it to 30˚C deteriorated resolution. Best resolution was achieved at 25˚C.
3.4 Validation of the method
The developed methods were then subjected to method validation according to GLP
guidelines. Migration times, peak areas and peak heights were measured with a data
processor. The validation characteristics which should be considered comprised trueness,
precision, specificity, detection limit, quantification limit, linearity and stability. These
characteristics are summarized in Tables 3-5.
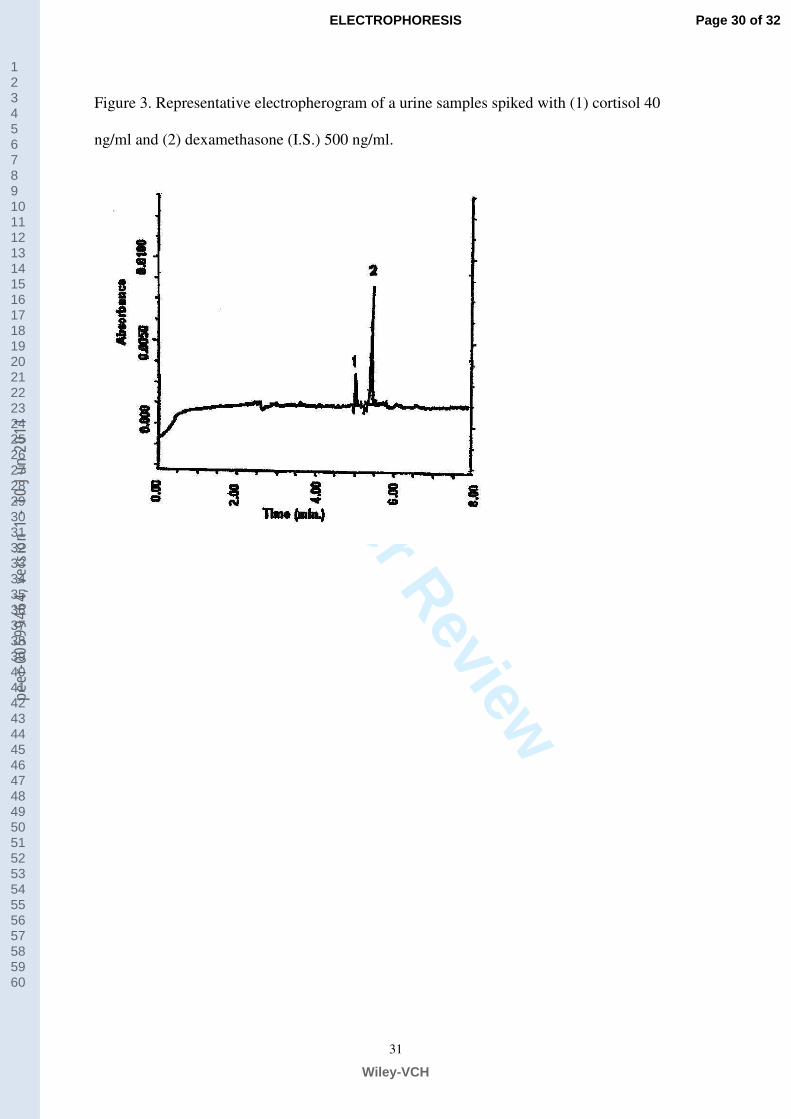
Specificity
Specificity was determined on the basis of blank and extract samples.
Electropherograms obtained from extracts of blank urine and urine spiked with cortisol are
shown in Figures 2 and 3, respectively. The blank urine samples were obtained in following
step. Then four grams of activated charcoal were added to 100 ml urine and mixed using a
Page 14 of 32
Wiley-VCH
ELECTROPHORESIS
123456789101112131415161718192021222324252627282930313233343536373839404142434445464748495051525354555657585960
peer
-005
9946
4, v
ersi
on 1
- 10
Jun
201
1
For Peer Review
16
magnetic stirrer for 2 h. The mixture was then centrifuged for 2 h at 3000 rpm. After
centrifugation the supernatant urine was filtered using a glass filter (grade 4).
No interferences were observed during the electrophoretic run of the urine samples in
the area where steroid or internal standard peaks appear. Additionally, the specificity of
method have been confirmed by the identification of steroid peaks and internal standard in
term of the migration time and UV spectrum.
Linearity
Although different statistical tests, like e.g., such as the F-value of the Lack-of-fit
(LOF) test and Mandel’s fitting test have been recently suggested to evaluate the goodness of
fit of the calibration curves because of the disputable or even controversial position of the
correlation coefficient r as linearity indicators [33-35], that last indicator is still the most often
used in the practice. It is considered as commonly used parameter for evaluation of linearity,
and curves with r ≥ 0.995 are usually treated as linear. For this reason the proposed method
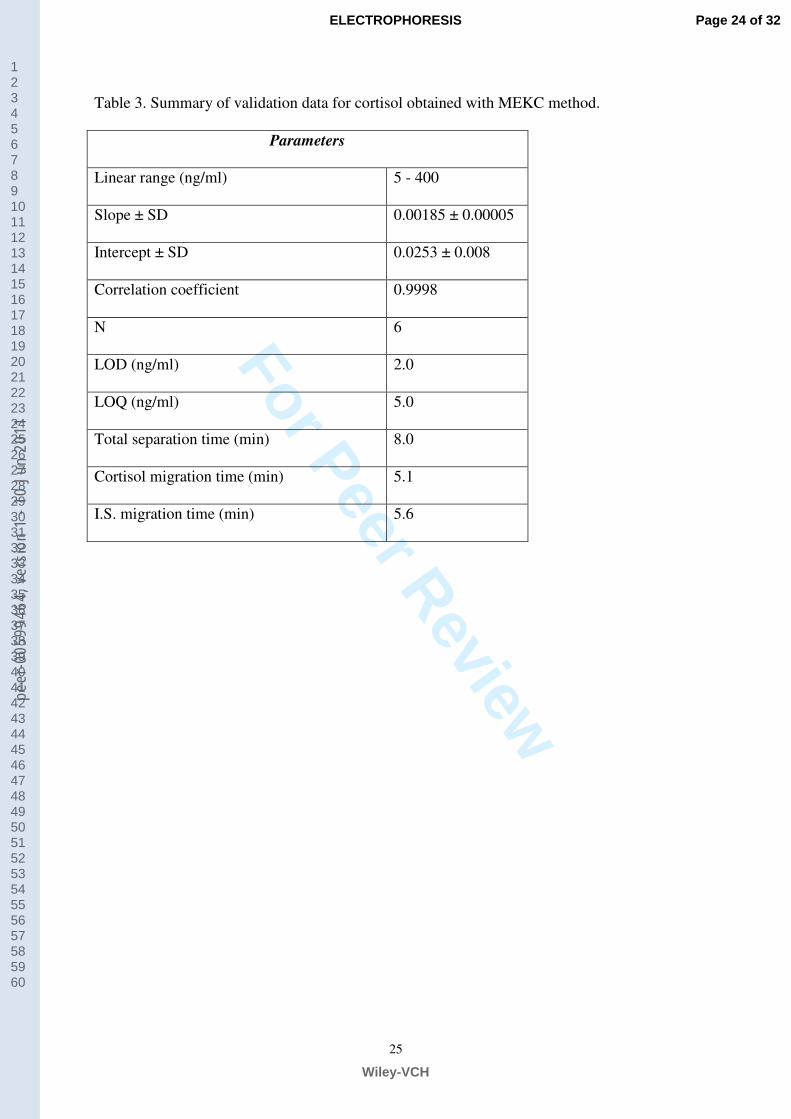
could be linear in the range of concentration from 5 to 400 ng/ml. Method linearity (n = 6) for
cortisol were determined by the addition of cortisol to charcool-stripped urine over the range
of 5-400 ng/ml. Each sample was analyzed according the extraction procedure and the
concentration were calculated from a calibration curve. The calibration curves were
constructed by plotting the analyte/IS peak high ratio (y) against analyte concentrations (x).
The correlation coefficient r = 0.998 and the r2 = 0.996, suggesting that our development
method has good linearity.
Limit of detection (LOD) and limit of quantification (LOQ)
The limit of detection (LOD) was determined with a signal-to-noise ratio of 3 and
equaled about 2 ng/ml. The method gave the detection limit enough to determination the
Page 15 of 32
Wiley-VCH
ELECTROPHORESIS
123456789101112131415161718192021222324252627282930313233343536373839404142434445464748495051525354555657585960
peer
-005
9946
4, v
ersi
on 1
- 10
Jun
201
1
For Peer Review
17
cortisol levels in human urine (50-200 ng/ml). The limit of quantitation (LOQ), defined as the
lowest concentration level at which the assay was validated, was found to be 5 ng/ml.
Precision
The precision of method was determined by calculating the relative standard deviation
(RSD) for the repeated measurements. Repeatability data were obtained repeating the same
experiment, and on the same day and in the same laboratory. The precision for repeatability
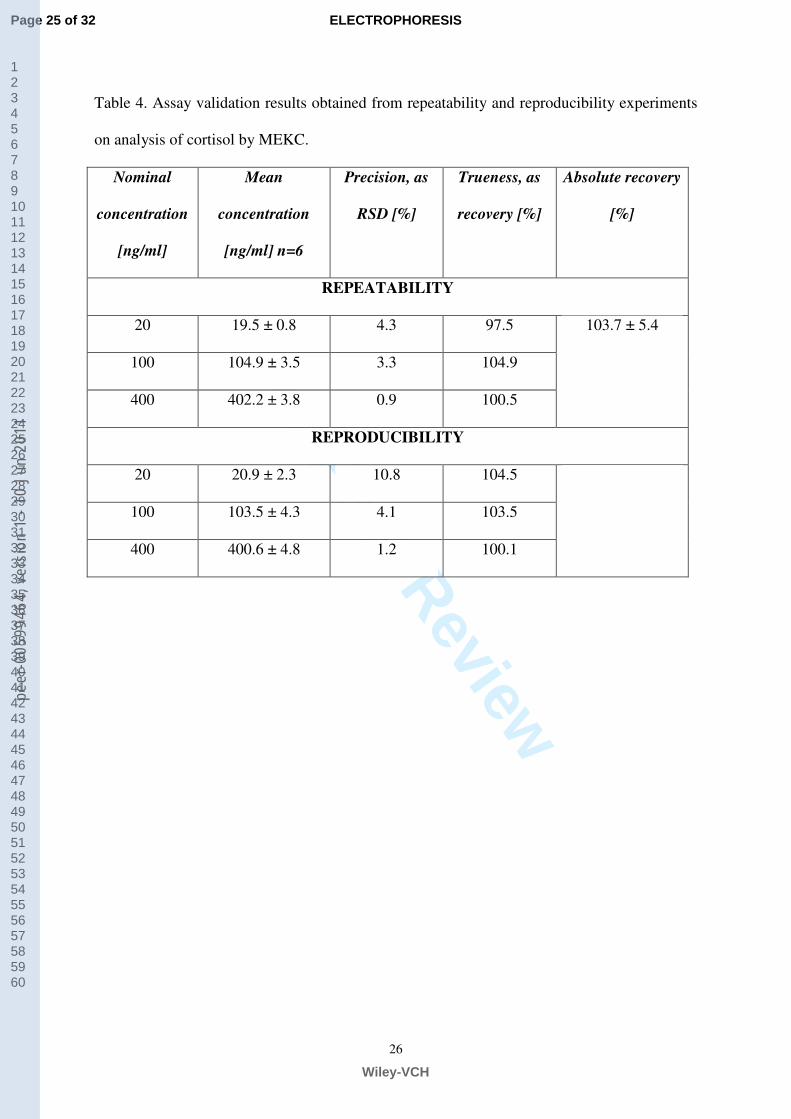
ranged from 4.3% for 20 ng/ml to 0.9% for 400 ng/ml. The intermediate precision data were
obtained by repeating the reproducibility experiment on a different day with newly prepared
samples, buffer solution for CE. Good precision (no more than 10%) was demonstrated in
independent assays performed in different days (Table 4).
The SPE procedure was estimated by determination of percent recoveries of cortisol
from urine at three concentration 20, 100, 400 ng/ml. The relative standard deviation (RSD)
by both LLE and SPE procedures were presented in Table 1. In turn, the precision of the data
of the chosen extraction procedure (SPE methanol) such as mean measured concentration ±
SD, recovery and RSD were shown in Table 4. The results confirmed the high repeatability
and reproducibility of our method with RDS between 0.9-4.3% and 1.2-10.8%, respectively.
Trueness
Samples were prepared by addition of known amounts of cortisol. The expected
concentration was calculated as endogenous and plus spiked concentration and the percent
recovery equaled (found concentration/expected concentration) x 100. The mean recovery
was 103.7%.
Page 16 of 32
Wiley-VCH
ELECTROPHORESIS
123456789101112131415161718192021222324252627282930313233343536373839404142434445464748495051525354555657585960
peer
-005
9946
4, v
ersi
on 1
- 10
Jun
201
1
For Peer Review
18
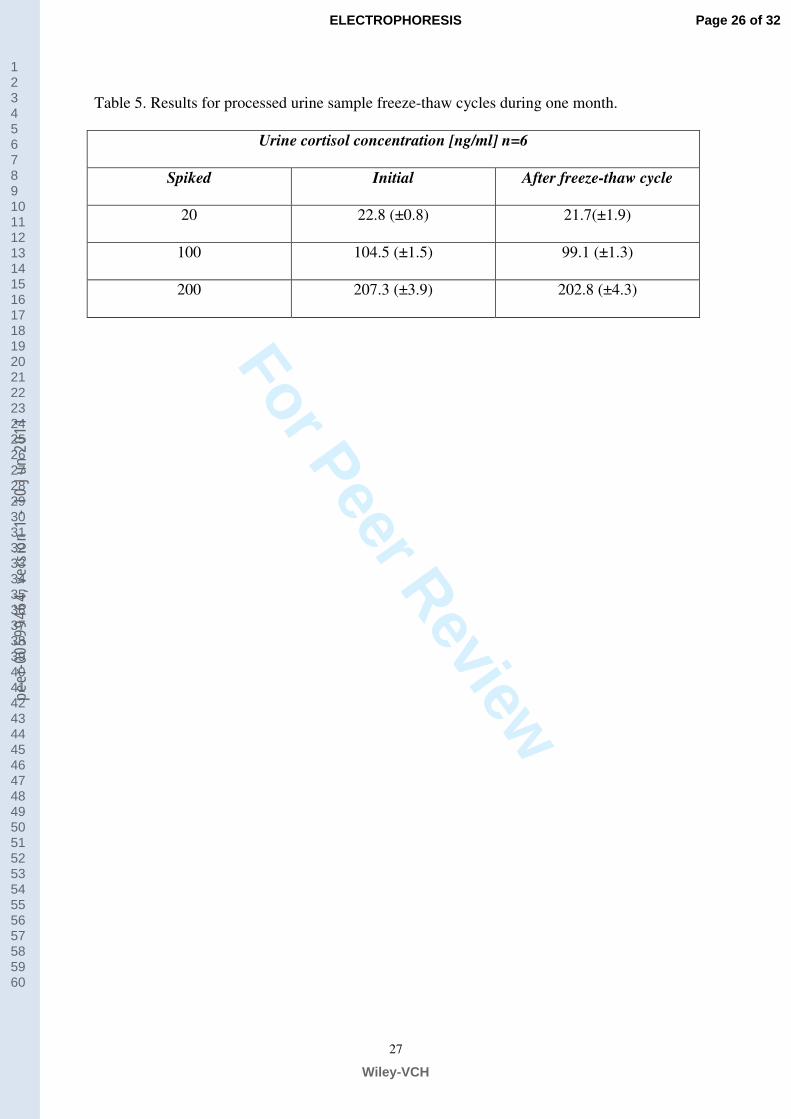
Stability
Freeze-thaw stability was studied using urine samples at three different concentration
were (20, 100 and 200 ng/ml). Test indicated that cortisol in urine samples were stable for at
one month when stored at -20˚C (Table 5).
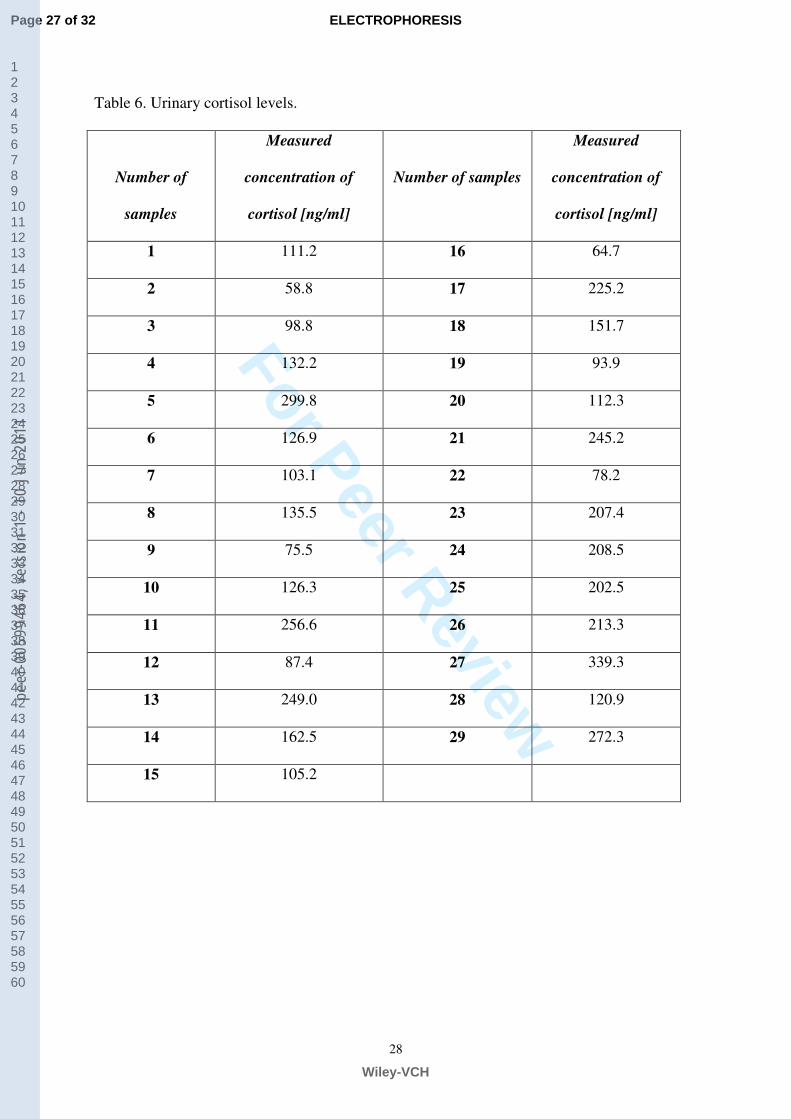
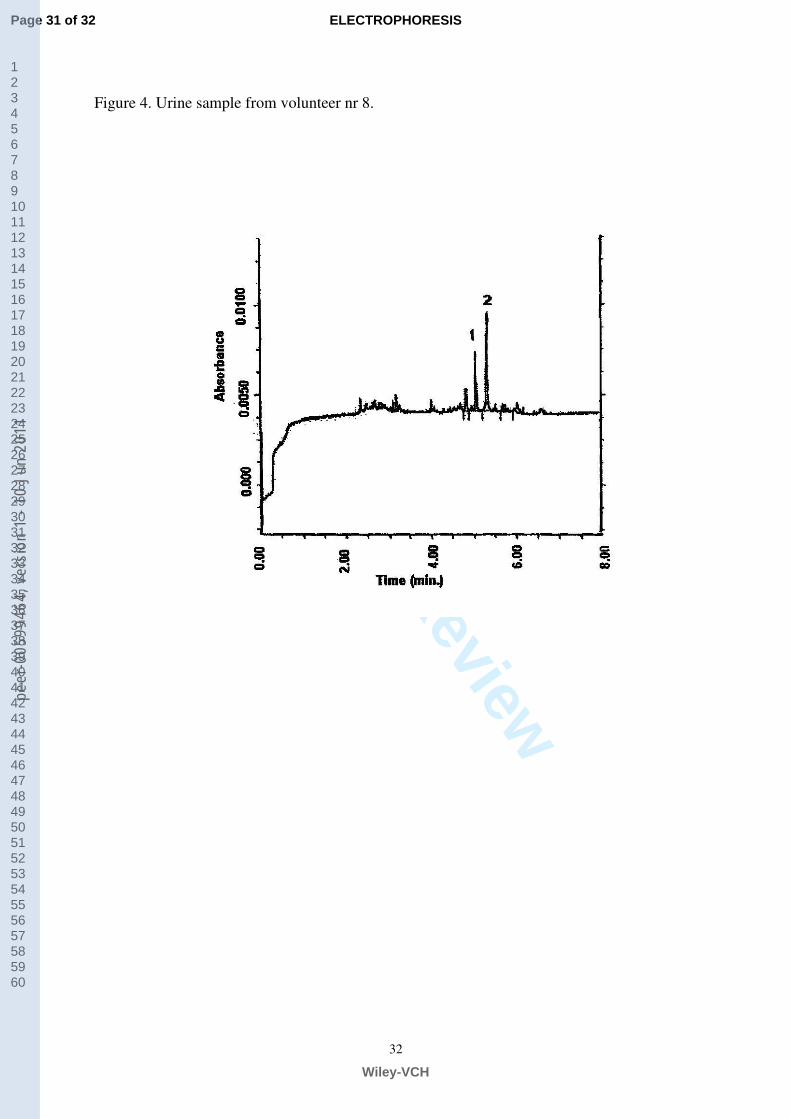
3.5 Application to the real urine sample
As an application, real urine samples from 29 healthy male volunteers, aged 18-28
years were collected and investigated by the method presented here. Their average age was 23
± 5 years, body weight of 73.6 ± 17.1 kg and height of 168 ± 5.8 cm (average ± standard
deviation). Urinary creatinine levels from 29 healthy volunteers was measured in all samples
using a diagnostic kit for the determination of creatinine PZ CORMAY (Lublin, Poland).
The obtained results indicated that the concentration of creatinine in urine samples were
between 0.91 and 1.37 mg/dl. It confirmed that no volunteer possessed a dysfunction of
kidney. All samples were collected in polyethylene urine containers and then frozen at -20˚C.
Urinary free cortisol levels found and measured by MEKC expressed as cortisol-to-creatinine
ratio are presented in Table 6. Concentrations of cortisol in the urine of most volunteers fit
within the physiological range, 50-200 ng/ml. The average concentration equaled 160.8 ±
76.7 ng/ml. Few volunteers indicated concentrations exceeded established standards and
could be testified to the increased susceptibility to stress and diseases of the existence of
hormone. However, the final diagnosis requires additional research. The electropherograms of
real urine samples from volunteer 8 (Figure 4) and volunteers 16 (Figure 5) were presented.
The results of MEKC method established in this paper could be successfully applied to
the determination of the stress biomarker in the urine samples. This method is especially
convenient for analysis of number of samples.
Page 17 of 32
Wiley-VCH
ELECTROPHORESIS
123456789101112131415161718192021222324252627282930313233343536373839404142434445464748495051525354555657585960
peer
-005
9946
4, v
ersi
on 1
- 10
Jun
201
1

For Peer Review
19
4 Conclusions
The results reported here indicated the applicability of MEKC method for
determination of cortisol in human urine. Among the presented publications, developed
MEKC-UV [9, 22, 24], our experience allowed to achieve the lowest limit of detection and
extraction procedure with methanol as the eluent, giving the high recoveries of 97.5-104.9%.
It was evidenced that the proposed technique could be the method of choice because, as
described earlier, it is faster, cheaper, more accurate than other MEKC-UV methods and it
may be applied also to large amounts of urine samples successfully. It provides also great
potential because urine is biological matrix readily obtainable through noninvasive collection
procedures.
The method is automated, simple, rapid, sensitive and can be applied easily to the
analysis of urine samples. One important drawback of CE could lay in detectability, because
of the low sample injection volume and the short optical path-length. Due to the extremely
small diameter of capillary, volumes of the order of nanoliters are typically injected. For the
same reason, the light path at the on-capillary detector window is very short, reducing the
signal produced by the sample. On the other hand, CE offer greater separation efficiency,
significantly reduced analysis time and operating costs in comparison to liquid
chromatographic methods. For instance, the buffer solution used in MEKC are typically
water-based and when properly refrigerated can be stored for long periods of time.
In conclusion, the analytical procedure developed in this work is fast, specific, precise,
reproducible and sensitive, although simple UV detection was used. The extraction of the
analytes is based on a simple extraction step. Finally, data was generated more quickly
because of easy of the process and its potential to be automated. The present analysis method
Page 18 of 32
Wiley-VCH
ELECTROPHORESIS
123456789101112131415161718192021222324252627282930313233343536373839404142434445464748495051525354555657585960
peer
-005
9946
4, v
ersi
on 1
- 10
Jun
201
1
For Peer Review
20
can also be proposed for clinical application.
5 References
[1] Letellier, M., Levesque, A., Daigle, F., Clin. Biochem. 1997, 30 (6), 473-477
[2] Hellhammer, D. H., Wüst, S., Kudielka, B. M., Psychoneuroendocrinology, 2009,
34, 163-171
[3] Shi, H., Xu, X., Ding, Y., Liu, S., Li, L., Kang, W., Anal. Biochem., 2009, 387,
178-183
[4] Neary, J. P., Malbon, L., McKenzie, D.C., J. Sci. Med. Sport, 2002, 5 (2), 108-114
[5] Kinoshita, H., Okabayashi, M., Kaneko, M., Yasuda, M., Abe, K., Machida, A.,
Ohkubo, T., Kamata, T., Yakushiji, F., J. Altern. Complement. Med., 2009, 15(4),
439-443
[6] Newsome, S., Chen, K., Hoang, J., Wilson, J.D., Potter, J.M., Hickman, P.E., Inter.
Med. Journal, 2008, 38, 178-182
[7] Levine, A., Zagoory-Sharon, O., Feldman, R., Lewis, J.G., Weller, A., Physiol.
Behav., 2007, 90, 43-53
[8] Beerda, B., Schilder, M.B.H., Janssen, N.S.C.R.M., Mol, J.A., Horm. Behav., 1996,
30, 272-279
[9] Kartsova, L.A., Bessonova, E.A., J. Anal. Chem., 2007, 62(1), 68-75
[10] Yao, J.K., Moss, H.B., Kirillova, G.P., Clin. Biochem., 1998, 31(3), 187-190
[11] Kushnir, M.M., Neilson, R., Roberts, W.L., Rockwood, A.L., Clin. Biochem., 2004,
37, 357-362
[12] Furuta, T., Mori, Ch., Suzuki, A., Shibasaki, H., Yokokawa, A., Kasuya, Y., J.
Chromatogr. B, 2004, 801, 165-171
Page 19 of 32
Wiley-VCH
ELECTROPHORESIS
123456789101112131415161718192021222324252627282930313233343536373839404142434445464748495051525354555657585960
peer
-005
9946
4, v
ersi
on 1
- 10
Jun
201
1
For Peer Review
21
[13] Gatti, R., Cappellin, E., Zecchin, B., Antonelli, G., Spinella, P., Mantero, F., De
Palo, E.F., J. Chromatogr. B, 2005, 824, 51-56
[14] Sharef, O.A., Feely, J., Kavanagh, P.V., Scott, K.R., Sharma S.C., Biomed.
Chromatogr., 2007, 21, 1201-1206
[15] Antignac, J.P., Monteau, F., Negriolli, J., Andre, F., Le Bizec, B.,
Chromatographia, 2004, 59, 13-22
[16] Barrett, Y.Ch., Akinsanya, B., Chang, S-Y., Vesterqvist, O., J. Chromatogr. B,
2005, 821, 159-165
[17] Jönsson, B.A.G., Malmberg, B., Amilon, A., Garde, A.H., Ørbæk, P., J.
Chromatogr. B, 2003, 784, 63-68
[18] Kataoka, H., Matsuura, E., Mitani, K., J. Pharm. Biomed. Anal., 2007, 44, 160-165
[19] AbuRuz, S., Millership, J., Heaney, L., McElnay, J., J. Chromatogr. B, 2003, 798,
193-201
[20] Wear, J.E., Owen, L.J., Duxbury, K., Keevil, B.G., J. Chromatogr. B, 2007, 858,
27-31
[21] Fenske, M., Chromatographia, 2000, 52, 810-814
[22] Rao, L.V., Petersen, J.R., Bissell, M.G., Okorodudu, A.O., Mohammad, A.A., J.
Chromatogr. B, 1999, 730, 123-128
[23] Abubaker, M.A., Petersen, J.R., Bissell, M.G., J. Chromatogr. B, 1995, 674, 31-38
[24] Rao, L.V., Petersen, J.R., Bissell, M.G., Okorodudu, A.O., Mohammad, A.A., Clin.
Chem., 1997, 43, 1801-1803
[25] Valbuena, G.A., Rao, L.V., Petersen, J.R., Okorodudu, A.O., Bissell, M.G.,
Mohammad, A.A., J. Chromatogr. A, 1997, 781, 467-474
[26] Terabe, S., Otsuka, K., Ichikawa, K., Tsuchiya, A., Ando, T., Anal. Chem., 1984,
56, 111-113
Page 20 of 32
Wiley-VCH
ELECTROPHORESIS
123456789101112131415161718192021222324252627282930313233343536373839404142434445464748495051525354555657585960
peer
-005
9946
4, v
ersi
on 1
- 10
Jun
201
1
For Peer Review
22
[27] Nishi, H., J Chromatogr. A, 1997, 780, 243-264
[28] Wiedmer, S.K., Siren, H., Riekkola, M-L., Electrophoresis, 1997, 18, 1861-1864
[29] Shen, H-J., Lin, Ch-H., Electrophoresis, 2006, 27, 1255-1362
[30] Noé,S., Böhler, J., Keller, E., Frahm, A.W., J. Pharm. And Biomed. Anal., 1998,
18, 911-918
[31] Boone, C.M., Waterval, J.C.M., Lingeman, H., Ensing, K., Underberg, W.J.M., J.
Pharm. And Biomed. Anal., 1999, 20, 831-863
[32] Appelblad, P., Irgum, K., J. Chromatogr. A, 2002, 955, 151-182
[33] Van Loco, J., Elskens, M., Croux, Ch., Beernaert, H., Accred. Qual. Assur., 2002,
7, 281-285
[34] Van Loco, J., in Caroli, S., The determination of chemical elements in food.
Application for atomic and mass spectrometry. Chapter 6, Method validation for
food analysis: concepts and use of statistical techniques, Wiley & Sons, Inc.,
Hoboken, New Jersey, 2007, pp. 138-143.
[35] Araujo, P., J. Chromatogr. B, 2009, 877, 2224-2234
Page 21 of 32
Wiley-VCH
ELECTROPHORESIS
123456789101112131415161718192021222324252627282930313233343536373839404142434445464748495051525354555657585960
peer
-005
9946
4, v
ersi
on 1
- 10
Jun
201
1

For Peer Review
23
Table 1. Analytical extraction efficiency test of cortisol after various extraction solvents.
Nominal
concentration
[ng/ml]
Measured [ng/ml]
(n=6)
(mean±SD)
Recovery [%] RSD[%]
LLE (ethyl acetate)
20
100
400
16.5 ± 0.4
86.7 ± 2.1
375.3 ± 7.6
82.5
86.7
93.8
2.4
2.4
2.0
LLE (dichloromethane)
20
100
400
18.1 ± 0.2
94.06 ± 2.1
396.1 ± 4.2
90.5
94.1
99.0
1.1
2.2
1.1
SPE (dichloromethane)
20
100
400
19.0 ± 0.1
98.9 ± 1.5
395.3 ± 6.6
95.1
98.9
98.8
0.8
1.5
1.7
SPE (methanol)
20
100
400
19.5 ± 0.8
104.9 ± 3.5
402.2 ± 3.8
97.5
104.9
100.5
4.3
3.3
0.9
SPE (acetonitrile)
20
100
400
18.6 ± 0.1
94.2 ± 1.5
395.0 ± 5.6
93.3
94.3
98.7
0.8
1.6
1.4
Page 22 of 32
Wiley-VCH
ELECTROPHORESIS
123456789101112131415161718192021222324252627282930313233343536373839404142434445464748495051525354555657585960
peer
-005
9946
4, v
ersi
on 1
- 10
Jun
201
1
For Peer Review
24
Table 2. The influence of the pH of running buffer on electrophoretic resolution.
Buffer composition Conclusion
sodium tetraborate (25 mM)
SDS (10 mM)
the concentration of SDS is below critical micellar
concentration; low resolution of peaks
sodium tetraborate (25 mM)
SDS (25 mM)
methanol 10 or 20%
adding the organic modifier to the buffer solution
resulted in an increase of migration time of cortisol and
IS and in concentration 20% resulted co-eluting both
substances; moreover the concentration of tetraborate is
to higher and caused voltage disorder
sodium tetraborate (10 mM)
SDS (25 mM)
the peaks to wide and non-symmetrical
sodium tetraborate (20 mM)
sodium dihydrophosphate (20 mM)
SDS (25 mM)
decrease of pH buffer caused reduction of
electroosmotic flow and lengthen of migration time of
analyzed substances
sodium dihydrophosphate (10 mM)
SDS (25 mM)
the acidic pH of buffer has not an influence for improve
of detectability and migration times of analyzed
substances were lengthen above 10 minutes.
sodium tetraborate (10 mM)
SDS (50 mM)
the best results were obtained using this buffer
Page 23 of 32
Wiley-VCH
ELECTROPHORESIS
123456789101112131415161718192021222324252627282930313233343536373839404142434445464748495051525354555657585960
peer
-005
9946
4, v
ersi
on 1
- 10
Jun
201
1
For Peer Review
25
Table 3. Summary of validation data for cortisol obtained with MEKC method.
Parameters
Linear range (ng/ml) 5 - 400
Slope ± SD 0.00185 ± 0.00005
Intercept ± SD 0.0253 ± 0.008
Correlation coefficient 0.9998
N 6
LOD (ng/ml) 2.0
LOQ (ng/ml) 5.0
Total separation time (min) 8.0
Cortisol migration time (min) 5.1
I.S. migration time (min) 5.6
Page 24 of 32
Wiley-VCH
ELECTROPHORESIS
123456789101112131415161718192021222324252627282930313233343536373839404142434445464748495051525354555657585960
peer
-005
9946
4, v
ersi
on 1
- 10
Jun
201
1
For Peer Review
26
Table 4. Assay validation results obtained from repeatability and reproducibility experiments
on analysis of cortisol by MEKC.
Nominal
concentration
[ng/ml]
Mean
concentration
[ng/ml] n=6
Precision, as
RSD [%]
Trueness, as
recovery [%]
Absolute recovery
[%]
REPEATABILITY
20 19.5 ± 0.8 4.3 97.5
100 104.9 ± 3.5 3.3 104.9
400 402.2 ± 3.8 0.9 100.5
103.7 ± 5.4
REPRODUCIBILITY
20 20.9 ± 2.3 10.8 104.5
100 103.5 ± 4.3 4.1 103.5
400 400.6 ± 4.8 1.2 100.1
Page 25 of 32
Wiley-VCH
ELECTROPHORESIS
123456789101112131415161718192021222324252627282930313233343536373839404142434445464748495051525354555657585960
peer
-005
9946
4, v
ersi
on 1
- 10
Jun
201
1
For Peer Review
27
Table 5. Results for processed urine sample freeze-thaw cycles during one month.
Urine cortisol concentration [ng/ml] n=6
Spiked Initial After freeze-thaw cycle
20 22.8 (±0.8) 21.7(±1.9)
100 104.5 (±1.5) 99.1 (±1.3)
200 207.3 (±3.9) 202.8 (±4.3)
Page 26 of 32
Wiley-VCH
ELECTROPHORESIS
123456789101112131415161718192021222324252627282930313233343536373839404142434445464748495051525354555657585960
peer
-005
9946
4, v
ersi
on 1
- 10
Jun
201
1
For Peer Review
28
Table 6. Urinary cortisol levels.
Number of
samples
Measured
concentration of
cortisol [ng/ml]
Number of samples
Measured
concentration of
cortisol [ng/ml]
1 111.2 16 64.7
2 58.8 17 225.2
3 98.8 18 151.7
4 132.2 19 93.9
5 299.8 20 112.3
6 126.9 21 245.2
7 103.1 22 78.2
8 135.5 23 207.4
9 75.5 24 208.5
10 126.3 25 202.5
11 256.6 26 213.3
12 87.4 27 339.3
13 249.0 28 120.9
14 162.5 29 272.3
15 105.2
Page 27 of 32
Wiley-VCH
ELECTROPHORESIS
123456789101112131415161718192021222324252627282930313233343536373839404142434445464748495051525354555657585960
peer
-005
9946
4, v
ersi
on 1
- 10
Jun
201
1
For Peer Review
29
Figure 1. Effect of pH value in buffer on electrophoretic times and shape of cortisol and
dexamethasone.
Page 28 of 32
Wiley-VCH
ELECTROPHORESIS
123456789101112131415161718192021222324252627282930313233343536373839404142434445464748495051525354555657585960
peer
-005
9946
4, v
ersi
on 1
- 10
Jun
201
1

For Peer Review
30
Figure 2. Representative electropherogram of a blank urine.
Page 29 of 32
Wiley-VCH
ELECTROPHORESIS
123456789101112131415161718192021222324252627282930313233343536373839404142434445464748495051525354555657585960
peer
-005
9946
4, v
ersi
on 1
- 10
Jun
201
1
For Peer Review
31
Figure 3. Representative electropherogram of a urine samples spiked with (1) cortisol 40
ng/ml and (2) dexamethasone (I.S.) 500 ng/ml.
Page 30 of 32
Wiley-VCH
ELECTROPHORESIS
123456789101112131415161718192021222324252627282930313233343536373839404142434445464748495051525354555657585960
peer
-005
9946
4, v
ersi
on 1
- 10
Jun
201
1
For Peer Review
32
Figure 4. Urine sample from volunteer nr 8.
Page 31 of 32
Wiley-VCH
ELECTROPHORESIS
123456789101112131415161718192021222324252627282930313233343536373839404142434445464748495051525354555657585960
peer
-005
9946
4, v
ersi
on 1
- 10
Jun
201
1

For Peer Review
33
Figure 5. Urine sample from volunteer nr 16.
Page 32 of 32
Wiley-VCH
ELECTROPHORESIS
123456789101112131415161718192021222324252627282930313233343536373839404142434445464748495051525354555657585960
peer
-005
9946
4, v
ersi
on 1
- 10
Jun
201
1
Copyright © 2022 FDOKUMEN