Methods for small area population forecasts - OSF
70
1 Methods for small area population forecasts: state-of-the-art and research needs Tom Wilson 1 Irina Grossman 2 Monica Alexander 3 Phil Rees 4 Jeromey Temple 5 Version 2. 4th August 2021. 1. Corresponding author. Address: Melbourne School of Population and Global Health, The University of Melbourne, 207 Bouverie St, Melbourne, Vic 3010, Australia Email: [email protected] ORCID: https://orcid.org/0000-0001-8812-7556 2. Melbourne School of Population and Global Health, The University of Melbourne, Australia ORCID: https://orcid.org/0000-0002-5761-6194 3. Departments of Statistical Science and Sociology, University of Toronto, Canada ORCID: https://orcid.org/0000-0002-8135-3435 4. School of Geography, University of Leeds, UK ORCID: https://orcid.org/0000-0002-4276-9091 5. Melbourne School of Population and Global Health, The University of Melbourne, Australia ORCID: https://orcid.org/0000-0002-2819-2863
-
Upload
khangminh22 -
Category
Documents
-
view
0 -
download
0
Transcript of Methods for small area population forecasts - OSF

1
Methods for small area population forecasts:
state-of-the-art and research needs
Tom Wilson1
Irina Grossman2
Monica Alexander3
Phil Rees4
Jeromey Temple5
Version 2. 4th August 2021.
1. Corresponding author. Address: Melbourne School of Population and Global Health, The
University of Melbourne, 207 Bouverie St, Melbourne, Vic 3010, Australia
Email: [email protected]
ORCID: https://orcid.org/0000-0001-8812-7556
2. Melbourne School of Population and Global Health, The University of Melbourne, Australia
ORCID: https://orcid.org/0000-0002-5761-6194
3. Departments of Statistical Science and Sociology, University of Toronto, Canada
ORCID: https://orcid.org/0000-0002-8135-3435
4. School of Geography, University of Leeds, UK
ORCID: https://orcid.org/0000-0002-4276-9091
5. Melbourne School of Population and Global Health, The University of Melbourne, Australia
ORCID: https://orcid.org/0000-0002-2819-2863

2
Abstract
Small area population forecasts are widely used by government and business for a variety of
planning, research and policy purposes, and often influence major investment decisions. Yet the
toolbox of small area population forecasting methods and techniques is modest relative to that
for national and large subnational regional forecasting. In this paper we assess the current state of
small area population forecasting, and suggest areas for further research. The paper provides a
review of the literature on small area population forecasting methods published over the period
2001-2020. The key themes covered by the review are: extrapolative and comparative methods,
simplified cohort-component methods, model averaging and combining, incorporating socio-
economic variables and spatial relationships, ‘downscaling’ and disaggregation approaches,
linking population with housing, estimating and projecting small area component input data,
microsimulation, machine learning, and forecast uncertainty. Several avenues for further
research are then suggested, including more work on model averaging and combining,
developing new forecasting methods for situations which current models cannot handle,
quantifying uncertainty, exploring methodologies such as machine learning and spatial statistics,
creating user-friendly tools for practitioners, and understanding more about how forecasts are
used.
Key words
Population forecasts; small area; literature review; research needs

3
1. Introduction
Small area population forecasts are used by government and business for many purposes,
including planning future service provision, infrastructure, housing, market analysis, policy
development, and research. For example, they inform decisions about whether to build a new
school or hospital, assist companies to determine where potential markets are expanding, provide
input data for other models, such as those projecting transport use, water demand, or numbers of
households, and in some countries directly influence the redrawing of electoral boundaries.
Decisions making use of small area forecasts can involve substantial investments and affect the
provision of essential services to local communities. In addition, in situations where the latest
population estimates are out of date, forecasts sometimes have to be used as interim population
estimates or nowcasts.
Despite these important uses, small area forecasts remain the poor cousin of forecasts at the
national and large subnational region scales, which have benefitted from much more research on
methods and data preparation (e.g., Booth, 2006; Mazzuco & Keilman, 2020). Unfortunately,
existing cohort-component projection models for countries and large subnational regions, and
accompanying fertility, mortality and migration forecasting methods (e.g., Li & Lee, 2005;
Raymer et al., 2006; Shang & Booth, 2020), are often unsuitable for small areas. Difficulties
include less detailed and poorer quality demographic data (due to geocoding inaccuracy,
imputation, data adjustment/suppression, among others), short time series of datasets due to
boundary changes, often erratic demographic trends, zero cell counts, and random noise in the
data which masks underlying patterns. In addition, the populations of small areas located in
growing urban areas are strongly influenced by changes in the dwelling stock, which are not
easily handled by standard cohort-component models. In practice, many small area forecasts are
produced using methods which have undergone little development over the last few decades. Not
surprisingly, given the challenges of data, methods, and the variability and randomness inherent
in small area populations, forecasts for small areas tend to suffer from considerably higher
population forecast errors than those for larger subnational regions and countries (e.g., Rayer,
2008; Tayman, 2011; Wilson & Rowe, 2011). Overall, errors tend to increase as population size
decreases, with errors rising rapidly once population size declines below about 10,000 (Wilson et
al., 2018).
Because of these challenges, and the importance of small area projections across the public and
private sectors, it is useful to undertake an assessment of the current state of small area
population forecast methodology, and offer some suggestions for research to extend and build on

4
current methods, and fill important gaps. Existing reviews of population forecasting methods
tend to focus mostly on the national scale (e.g., Alho, 2015; Booth, 2006), or national and
subnational regional scales (e.g., Rees et al., 2015; Wilson & Rees, 2005), or do include small
area forecasting but are in need of updating and extending (e.g., Bell, 1997; Rayer 2015; Wilson,
2011).
This paper presents a review of the literature on small area population forecasting methods,
covering items published over the 20 years 2001 to 2020 inclusive. Primarily we focus on the
academic literature, but also include published methodological reports by statistical offices
where they contribute novel methods. The scope of the review is limited to small area population
forecasting models and methods for preparing forecast assumptions, but not associated topics,
such as the geographical conversion of historical data to consistent boundaries prior to the
preparation of forecasts (e.g., Norman et al, 2003; Simpson, 2002; Vasan et al., 2018), or the
evaluation and quality assurance of forecasts (e.g., Rees et al., 2019; Wilson, 2017a). Nor do we
cover derived small area forecasts or those for population sub-groups, such as school enrollment,
ethnic group, or living arrangement and household type forecasts (e.g., Feng et al., 2020; GLA,
2018; Grip & Grip, 2020; Nawaz et al., 2020). These topics would benefit from separate
dedicated reviews. Later in the paper we identify research needs and make some suggestions for
research avenues which we believe are worth exploring to generate more accurate, informative,
and useful small area population forecasts.
There is no widely accepted definition of a ‘small area’ in the demographic literature (Rayer,
2015). Sometimes the term is used to describe geographies for which there is limited
demographic data available (however this might be defined); or a particular population threshold
might be specified. We use the term to refer to areas with populations under 100,000, although
this cut-off is to some extent arbitrary. We also include grid cells under 25 km2 or 0.05 × 0.05
degrees latitude and longitude in area. Examples of small areas include census tracts (US and
Canada), electoral wards (UK), and SA2 areas (Australia and New Zealand). Strictly, in
geographically large countries with concentrated population distributions ‘small areas’ can be
huge in area and might be more accurately described as geographical units containing small
populations. Population is defined as the usually resident population, to be consistent with
estimates and forecasts produced by national statistical offices, rather than de facto populations
(the number of people present in an area at a particular time irrespective of whether they are
usual residents or visitors).

5
We also use the term ‘forecasts’ throughout the paper but acknowledge that some small area
forecasts are labelled ‘projections’ by their creators who emphasise that their numbers are not
intended to be forecasts but simply the outcome of selected assumptions and models. Projections
are often defined as a calculation of future population based on chosen assumptions about the
future drivers of population change (which may or may not be plausible), whereas a forecast is
deemed the most likely future. However, for consistency and because most users tend to interpret
projections as forecasts, we primarily use the term ‘forecasts’ here.
Following this introduction, we briefly describe the approach taken in undertaking this review
(section 2). Section 3 sets out key themes of the surveyed literature in separate sub-sections
followed by a summary of the main findings, while section 4 outlines priority research areas and
suggests potential avenues for further investigation. An annotated bibliography of literature
included in the review is provided in the Supplementary Information accompanying the paper.

6
2. Literature search and selection
For this review, we searched for journal papers, book chapters, and reports which:
(i) contained details on forecasting methods and approaches
(ii) were for small areas, and
(iii) were published between 1st January 2001 and 31st December 2020.
We included literature which focused on forecasting the components which directly feed into
small area population forecasts, such as fertility, mortality and migration rates. We also included
methods for quantifying the uncertainty of small area population forecasts.
Our approach to searching the literature on small area population forecasting methods made use
of several information sources. First, we searched for papers on Google Scholar using Harzing’s
Publish or Perish (as it allows search results to be exported; Harzing, 2007), JSTOR, Scopus,
Web of Science, Springer, Emerald, Wiley, Gale, PubMed, and the arXiv preprint server. Search
terms used were: population projection, population forecast, population prediction; small area,
local area, grid square, gridded, spatial, sub-national population, sub-regional population, small
area population, ward-level population, county-level population, population project* (where *
refers to any other letters), population predict*, and population forecast* and additional terms
used to find articles on estimating the components of small area population projections included:
age-specific migration, age-specific mortality, age-specific fertility, fertility, age-profile,
estimating, and estimation.
Second, we followed up references in selected papers which appeared to focus on small area
population forecasts. Third, we added our own papers on small area forecasting which we have
collected over the years. We created an annotated bibliography and drafted a brief summary of
up to 100 words of the main points for each of the selected papers. Finally, we approached the
corresponding authors of these papers and asked them to check over our draft summaries and
correct them if necessary. We also asked if there were any other papers within the scope of the
review which we may have missed. A total of 51 authors were contacted and 20 summaries were
revised. Following consultations with the authors, a further 6 papers were added to the review
and summarised in the annotated bibliography. The final total number of papers included in the
review is 84.
7
3. Small area population forecasting methods, 2001-2020
The literature on small area population forecasting methods from the last two decades is
presented in the following ten sub-sections, categorised by type of forecasting method or
approach. Any categorisation such as this is to some extent subjective, and there is inevitably
research which can be categorised under more than one theme.
3.1. Extrapolative and comparative methods
Simple extrapolative models are generally applied to project population totals rather than age-
and sex-specific populations. Although atheoretical and based solely on past trends, their
strengths include minimal data requirements, simple and quick calculation, and accuracy which
is often comparable to, or better than, more detailed and complex methods (Smith et al. 2013:
chapter 8). Comparative (or ratio) methods create a small area projection through a relationship
with an independent projection for a larger geographical area (e.g., for a state, large region, or
country), and are also generally applied just to population totals. Many of these simple methods
date back many decades (Isserman, 1977; Openshaw & Van Der Knaap, 1983; Pearl & Reed,
1920; Pritchett, 1891; Schmitt & Crosetti, 1951; Smith, 1987; White, 1954) though they became
less popular in the later decades of the 20th century as computing power increased and more
complex models gained prominence. However, over the last decade or so, a number of studies
have re-examined the properties of existing simple extrapolative and comparative methods for
local and small area forecasts, and introduced some new variants.
To create grid square population forecasts across the world, Hachadoorian et al. (2011) tested
two simple methods, one which applied a projected share of national population (shift-share),
and the other a constant share of national population growth. The forecasts covered the period
1995-2025. Over the long run both methods were found to suffer problems, such as negative
populations and trend reversals. Xanthos et al. (2013) tested several share-of-population and
share-of-population-growth models over 10 year historical periods to small areas in a region of
Greece, finding that the lowest errors1 were obtained from the constant share-of-population
model.
1 We report relatively few quantitative error values in this paper. Unfortunately, there is inconsistency in error
measures used, variation in forecast horizons, and often no overall summary error measure reported (instead, a large
number of errors for different parts of the evaluation). We address this issue in the ‘research needs’ section later.

8
Rayer (2008) conducted a comprehensive evaluation of simple methods for forecasting the total
populations of 2,482 counties in the US. ‘Forecasts’ over historical periods were calculated for
multiple jump-off years and projection horizons. Among the five individual extrapolative and
comparative models tested, linear extrapolation proved marginally the most accurate, but the
constant share-of-population model did not perform particularly well. At 10 and 20 year horizons
mean errors did not vary greatly between methods; however, after 30 years the exponential
extrapolation gave by far the highest mean errors. The accuracy and characteristics of several
extrapolative and comparative methods were also analysed as part of a study by Wilson (2015).
Retrospective small area forecasts were produced for a 10 year horizon and compared to actual
population estimates in Australia, New Zealand, and England & Wales. Of the methods
evaluated, the best models were found to be a modified share-of-growth model (calculated as
shares of national base period growth using only positive shares, with negative shares set to
zero), and a constant share-of-population model. Methods susceptible to producing negative
populations or runaway growth in the long run were identified (linear, projected share-of-
population, constant share-of-growth, exponential, and constant growth rate difference).
Hauer et al. (2015) employed a housing-unit model to forecast the total populations of sub-
county areas of Georgia, USA, with the number of housing units being projected by a
Linear/Exponential model (linear if base period growth was positive; exponential if it was
negative) fitted to a 70 year base period of dwelling counts. The advantage of this composite
model is that negative populations and runaway growth are avoided. Linear/Exponential
extrapolation was also applied by Hauer et al. (2016) to forecast the populations of census block
groups in US counties expected to be severely impacted by sea level rises in coming decades.
These forecasts were then used in further work which modelled internal migration flows out of
coastal areas which may occur due to sea level rise (Hauer, 2017). Baker et al. (2008) projected
populations via the housing unit method, forecasting dwelling numbers using a logistic curve
because it mimics the growth in dwelling stock as new housing estates are developed. In their
application to urban census tract populations in New Mexico, USA, the authors concluded that
this approach worked well over a short-term forecast horizon.
Also included under the general heading of extrapolation are time series models. An example can
be found in Athukorala et al. (2010), who forecast the total populations of two local government
areas in Queensland, Australia, using Autoregressive Integrated Moving Average (ARIMA)
models. Walters and Cai (2008) evaluated the Holt-Winters (exponential smoothing), ARIMA,
and linear and exponential extrapolative models. They created several sets of retrospective
forecasts for US states and local areas in Virginia, USA. The authors conclude that both Holt-

9
Winters and ARIMA models are roughly comparable in accuracy to cohort-component models,
and that Holt-Winters is preferable to ARIMA because of its more intuitive nature. Nonetheless,
time series models are more complex and time-consuming to implement than simple
extrapolative or comparative models, and usually require more data (Tayman et al. 2007); they
are not commonly used to forecast small area populations.
3.2. Simplified cohort-component methods
The simplified version of the cohort-component model, the Hamilton-Perry model (Hamilton &
Perry, 1962), has experienced a revival for forecasting local and small area populations in recent
years (Baker et al., 2017; Smith et al., 2013 pp. 176-179). In this model, the population is still
projected by cohort, but not by demographic components. Instead, the population of a cohort at
the start of a projection interval is multiplied by a Cohort Change Ratio to obtain the aged-on
cohort population at the end of the interval. Young childhood populations can be forecast using
Child/Woman Ratios. The model yields age-specific population forecasts but does not require
fertility, mortality or migration input data, making it applicable in data-limited circumstances
which prevent the use of regular cohort-component models. The consequent limitation of this
model is that fertility, mortality and migration assumptions cannot be specified, and projected
demographic components of change are not produced (although Baker et al. (2017, chapter 13)
decompose cohort change into mortality and net migration components). Most published
applications have been in the USA where small area demographic component data is limited.
The Hamilton-Perry model has been implemented in various ways, and with some interesting
extensions. Swanson et al. (2010) used it to forecast the populations of census tracts and block
groups, adjusting cohort change ratios to match population estimates early in the forecast
horizon, and applying ceiling and floor limits to prevent growth becoming too high or too
negative. Baker et al. (2014) used it to project the populations of urban census tracts with spatial
weighting applied to preliminary forecasts. This was implemented by averaging preliminary
forecasts for each census tract with those of its neighbours as defined by rook and queen
contiguity matrices. The spatially-weighted forecasts were found to be more accurate than the
original unweighted forecasts. In related work, Inoue (2017) tested alternative ways of
smoothing small area cohort change ratios and child/woman ratios. In an application to small
areas of Japan, it was found that smoothing which combined both local ratios and ratios from the
larger prefecture in which it was located improved the quality of forecasts relative to not
applying smoothing.

10
Tayman and Swanson (2017) evaluated several ways of adjusting cohort change ratios and
child/woman ratios throughout the forecast horizon. One option averaged these ratios over two
10 year inter-censal intervals, while a second involved extrapolating the difference in ratios over
the two 10 year intervals of the base period. A third option modified local ratios over time to the
same extent as ratios calculated from independent forecasts for a larger region. When applied to
counties in Washington State and census tracts in New Mexico, the third option gave the most
accurate forecasts.
Studies have also assessed unconstrained versus constrained Hamilton-Perry forecasts. Baker et
al. (2020) evaluated the Hamilton-Perry model for census tracts across the US, with one set
constrained to linear extrapolations of total population, and another remaining unconstrained.
The constrained set proved more accurate. Similarly, Wilson (2016) tested several forms of
cohort-component model for local areas in Australia, including the standard Hamilton-Perry
model and a version constrained to total populations from an extrapolative model. The latter
proved more accurate. This constrained Hamilton-Perry model gave only slightly less accurate
forecasts by age (except at the highest ages) than versions of the cohort-component model
incorporating migration.
Hauer (2019) created population forecasts by age, sex and race for all counties of the US for
2020-2100 using the Hamilton-Perry model. He introduced one key variation: for county/race
populations which were declining he applied cohort change ratios, but for growing populations
he used cohort change differences (i.e., absolute numbers). This is similar to the
linear/exponential composite model noted earlier. Cohort change ratios and differences were
forecast using ARIMA(0,1,1) models, and all population forecasts were constrained to those
from the Shared Socioeconomic Pathways for the US as a whole. An evaluation of forecasts
from 2000 to 2015 revealed the composite cohort change ratio/difference approach to be slightly
more accurate than using cohort change ratios or differences alone.
Dockery et al. (2020) proposed a type of cohort model to project small Indigenous populations in
rural and remote regions by sex and five year age group. Although reference is not explicitly
made to the Hamilton-Perry model, their approach is effectively a Hamilton-Perry model in
which the population is projected using cohort change differences. The unique feature is that
cohort change is projected with a regression model which uses a range of demographic, social
and geographic variables. A regression model is also used to project the number of 0-4 year olds
based on population numbers in older childhood ages. The method was applied to produce five

11
year horizon projections of small area Indigenous populations by age and sex in regional and
remote parts of Australia.
3.3. Model averaging and combining
The benefits of model averaging and combining were highlighted in the statistics and forecasting
literature several decades ago (e.g., Bates & Granger, 1969; Clemen, 1989) but until quite
recently such approaches were uncommon in demographic forecasting (though see, for example,
Isserman, 1977, and Smith & Shahidullah, 1995 for explorations of some of these techniques).
Averaging and combining are often found to reduce errors. This is thought to be because they
draw on a wider amount of information than any one model, and because errors in different
directions from individual models offset one another to some extent (Goodwin, 2009).
For small area population forecasts, evaluations of averaged or composite models generally find
that they perform quite well. Rayer (2008) created retrospective total population forecasts for US
counties using 5 simple methods, and found that a mean of all five methods and a trimmed mean
based on the three remaining forecasts after excluding the highest and lowest forecasts, produced
mean errors comparable to the best individual methods, or better. For subcounty areas in Florida,
Rayer and Smith (2010) similarly found that averaged forecasts and trimmed means performed
well. Composite models, where different methods are applied to areas based on their population
size and growth rate, were found to reduce errors a little further. The Bureau of Economic and
Business Research at the University of Florida has employed a trimmed mean method to produce
its annual county population forecasts in Florida for some time (e.g., Rayer & Wang, 2020).
Averages of extrapolative and comparative models for forecasting small area population totals
were found to result in modest gains in accuracy in Australia, New Zealand, and England &
Wales (Wilson, 2015). The best averaged models mostly contained a constant share-of-
population model (share of national population) and at least one type of share-of-growth model
(national population growth), suggesting that a projection which takes an average of national and
local trends is beneficial. The best composite models, based on population size and growth rate
categories, also gave errors slightly better than the best individual models. Further assessment of
the averaged constant share-of-population / share-of-growth model was reported in Wilson
(2017b). It was applied at various geographical scales over several 10 year forecast horizons.
Median Absolute Percentage Errors (MedAPE) were low, and consistently lower than those from
linear extrapolation.

12
Reinhold and Thomsen (2015) evaluated several versions of cohort-component model applied to
districts in Lower Saxony, Germany. Retrospective forecasts were created for a 10 year horizon
and compared to population estimates. The models tested consisted of the cohort-component
with and without migration, and the cohort-component model constrained to total populations
from simple linear, no change, projected share-of-population, and constant share-of-population
models. The mean of all forecasts gave slightly lower errors than any individual method for both
total population and age-specific populations. A similar evaluation of several versions of cohort-
component model applied to local government areas in New South Wales, Australia, was
undertaken (Wilson, 2016). The cohort-component models tested included those with bi-regional
migration flows, net migration numbers, net migration rates, a composite model (using net
migration numbers for positive net migration and rates if negative), and the Hamilton-Perry
model. A second set of forecasts were produced where the cohort-component forecasts were
constrained to total populations from an averaged extrapolative model. The constrained forecasts
proved much more accurate than the unconstrained forecasts, and the bi-regional model
produced the most accurate age-specific forecasts by a small margin, followed by the composite
net migration model.
3.4. Incorporating socio-economic variables and spatial relationships
Researchers have argued that demography is an inherently spatial social science (e.g., Matthews
& Parker, 2013; Voss, 2007), but small area demography is especially so. Demographic trends
and patterns in small areas do not occur in isolation, but are geographically connected to other
areas – most obviously through migration and short-term mobility, but also by possessing
characteristics which are often similar or identical to nearby areas, such as social norms, culture,
politics, housing types, environment, laws and regulations, etc. As summarised by Tobler (1970:
p. 236) “everything is related to everything else, but near things are more related than distant
things.” In demography more generally, spatial modelling and analysis have grown in
importance over the last decade or two (e.g., Chi & Zhu, 2008; Gu et al, 2020; Matthews &
Parker, 2013). Yet only a few contributions to small area population forecasting incorporate
explicitly spatial relationships (other than migration flows) in their modelling.
Chi (2009) investigated whether forecasts of sub-county total populations could be improved by
incorporating variables correlated with population change in the modelling. Four regression
models were applied to forecast the populations of minor civil divisions in Wisconsin which
included explanatory variables related to an area’s demographic and socioeconomic
characteristics, transport accessibility, natural amenities, and land development characteristics.

13
Comparisons with four simple linear and exponential extrapolative models reveal the regression
approach does not outperform extrapolation. Chi and Voss (2011) then created and evaluated
regression models which incorporate variables from neighbouring areas. In their “spatio-
temporal regression forecasting approach” they selected the seven nearest neighbouring areas
and weighted variables according to inter-centroid distances. The neighbour variables included
lagged population growth rates and a selection of social, economic and environmental
characteristics. Although conceptually appealing, the regression models did not produce lower
errors than a simple extrapolative model when applied to minor civil divisions in Wisconsin,
over the 1990-2000 period. Chi et al. (2011) applied these regression models to census tracts in
the city of Milwaukee to assess whether they worked better in an urban setting. In this study,
Mean Absolute Percentage Errors were found to be slightly lower than those of several simple
extrapolative models. In later work, a geographically-weighted regression approach was
proposed and tested (Chi & Wang, 2017). When applied to minor civil divisions in Wisconsin,
the geographically-weighted regression model was found to be slightly less accurate than several
simple extrapolative forecasts.
Other researchers have applied spatial weighting to the results of population forecasts or to input
assumptions. Baker et al. (2014) created three sets of census tract forecasts using the Hamilton-
Perry model, two which used initial projections for each census tract averaged with those of its
neighbours. This approach yielded lower errors than not applying spatial averaging. Inoue
(2017), also using the Hamilton-Perry model, smoothed cohort change ratios and child/woman
ratios for small areas by incorporating ratios for the prefecture in which each small area was
located. This lowered errors relative to forecasts with no smoothing.
3.5. Housing-led population projections
At the small area scale, population size and composition are often closely associated with the
number and types of dwellings (Bell, 1997; Dittgen & Dutreuilh, 2005; Franzén & Karlsson,
2010; Myers, 1990). The housing-unit method has long been used by demographers to create
population estimates (Bryan, 2004; Swanson & Tayman, 2012) as well as forecasts (Bell, 1997;
Foss, 2002). The total population is calculated as the number of private dwelling units multiplied
by the proportion of dwellings occupied by usual residents multiplied by average household size,
plus the number of people living in non-private (institutional) dwellings. The method is
computationally simple and, with accurate estimates of the component terms, it provides accurate
population numbers. A limitation is that it only generates population totals (i.e., no age and sex
detail), although these totals can be produced for different dwelling types. In forecasting

14
applications, the accuracy of the housing unit model depends on the reliability of recent data and
assumptions made about each of the individual inputs to the model. In many urban areas,
planning policies and systems mean that the future number of private dwellings which will be
built over the next 5 or 10 years is known with a reasonable degree of certainty. Future change in
average household size and the proportion of dwellings occupied may be harder to estimate.
The housing-unit model regularly proves a useful tool for researchers, often in combination with
other models. As noted earlier, Baker et al. (2008) used it for census tract population forecasts,
employing a logistic curve to model the growth of dwellings, while Hauer et al. (2015) used it
for sub-county area forecasts, applying a Linear/Exponential model to forecast dwelling
numbers. The housing-unit model is also regularly used by government, academic, and private
sector demographers to produce local and small area population forecasts (e.g., Portland State
University Population Research Center, 2015; QGSO, 2018).
A mixed housing-unit/cohort-component approach was taken by Dittgen and Dutreuilh (2005) in
preparing population forecasts for Paris. Although details of the model are not provided, the
description suggests that they created a cohort-component model which separates out migration
affecting existing dwellings from the population moving into new dwellings. The number of new
dwellings is multiplied by a projected average household size, and then disaggregated using an
assumed age-sex profile. The additional population is then added to the population produced by
the cohort-component model. A similarly adapted cohort-component model, which handles
population in existing and new dwellings separately, is described by Hansen (2010).
An alternative is to create dwelling-led forecasts which combine forecasts of future dwelling
numbers with a headship rate or propensity household model together with a cohort-component
model. The dwelling input consists of future numbers of dwellings occupied on a usual residence
basis plus the number of persons living in institutional accommodation. However, average
household size is not an input assumption, but one of the model outputs. This allows changes in
population age structure to influence average household size. Marshall and Simpson (2009) and
Simpson (2017) describe how dwelling-led projections for local areas in the UK-based
POPGROUP software are produced in this way. Migration is adjusted in volume (but not age
pattern) so that population and household forecasts are consistent with assumed dwelling
numbers. The POPART local area population forecasting program takes a similar approach,
adjusting inward and outward migration flows in an iterative calculation scheme (and indirectly
adjusting numbers of births and deaths as well as populations-at-risk change) to match future
occupied private dwelling numbers (Wilson, 2014).

15
Franzén and Karlsson (2010) propose quite a different approach in which small area migration
rate age profiles for the cohort-component model are not based on noisy local data, but derived
from national data and the housing mix of a small area. The key assumption is that people living
in certain dwelling type/tenure categories share the same demographic characteristics throughout
the country, so that national data on internal migration by dwelling type can be used at the small
area scale. In an application to Sweden, the authors identified 33 housing categories using cluster
analysis, all with specific in- and out-migration age profiles. For small area forecasts, the authors
suggest weighting the housing-specific migration age profiles by the dwelling composition of
each small area.
3.6. ‘Downscaling’ and disaggregation approaches
Research on ‘downscaling’ (or disaggregating) national or large regional population forecasts to
small areas has emerged over recent years, primarily as part of the literature on the Shared
Socioeconomic Pathways (scenarios of macro-scale global social, economic and natural systems
change to facilitate studies of adaptation to climate change; O’Neill et al. 2014). In practice, the
methods often involve a mixture of national forecast disaggregation and small area forecasting,
but always with the application of top-down constraining. This stream of research appears to be
relatively distinct from other work in small area population forecasting, and is generally more
focused on ‘big picture’ global patterns of population with spatial detail for many decades into
the future, whereas most other small area forecasting studies are more geographically and
temporally limited in extent and have an applied planning and policy focus. Many of the
downscaling methods start with national-level population forecasts produced by the United
Nations Population Division, the International Institute for Applied Systems Analysis (IIASA),
or national statistical offices, and small area grid square population estimates produced as part of
the Gridded Population of the World datasets (https://sedac.ciesin.columbia.edu/). Given the ‘big
picture’ emphasis and huge amount of data involved in these studies, most use assumptions
which considerably simplify reality. Many models in the ‘downscaling’ literature have not
undergone comprehensive forecast accuracy assessments.
Some studies apply relatively simple methods. For example, Breidenbach et al. (2019) created
age-sex population forecasts for 1 km2 grid squares of Germany for the period 2015 to 2050.
They applied a cohort-component model for each grid square, assuming national mortality rates
for each area, area-specific fertility rates, zero internal migration, and net international migration
distributed according to the population distribution. Merkens et al. (2016) created small grid

16
square forecasts of coastal population totals across the world from 2010 to 2100. Their method
divided each country into 4 ‘zones’ (coastal-urban, coastal-rural, inland-urban, and inland-rural)
and assumed recent growth rate differences between zones would continue, with forecasts
constrained to independent national population and urbanisation forecasts. Grid square forecasts
were created by assuming the grid square population will grow at the same rate as the zonal
population.
Other studies have used more complex methods involving multiple models. McKee et al. (2015)
prepared small grid square population forecasts for the contiguous USA. First, they created
county forecasts by age and sex using a cohort-component model with net migration rates.
Second, constraining to US Census Bureau State and national forecasts was applied. And then
the county forecasts were disaggregated to grid squares according to a “potential development
coefficient” based on a set of variables which included land use, roads, urban accessibility, and
current population. Boke-Olén et al. (2017) took a similar approach to create gridded population
forecasts for Africa. National scale forecasts from IIASA were disaggregated using spatially
detailed data on roads, water bodies, country borders, and distance to urban centres. Chen et al.
(2020) applied various machine learning algorithms to forecast the populations of tiny 100m2
grid squares for China for the period 2015 to 2050.
Zoraghein and O’Neill (2020a, 2020b) also created small area population forecasts for the USA,
though for 1 km2 grid squares and for population totals only. Existing State population forecasts
were downscaled to grid squares using a gravity-type model, specified separately for urban and
rural areas. Forecast population growth was allocated to each grid square proportional to its
assumed ‘suitability for growth’ based on several socio-economic, land use and environmental
variables, while forecast population decrease was distributed according to the inverse of
suitability.
Some other studies involving disaggregation to small areas fall outside the climate-themed
literature. They take a variety of approaches. Stimson et al. (2012) describe the creation of a
large-scale urban model to forecast population, housing, employment and other socio-economic
variables for the region of South East Queensland, Australia. Small area population forecasts are
closely related to the future pattern of dwelling growth. Future dwelling growth for the region as
a whole is allocated to small grid squares using a model which mimics the land development
process and considers residential land availability, proximity to existing development, and the
accessibility of local areas to services and transport. In New Zealand, Cameron and Cochrane
(2017) also used a detailed land-use model, the Waikato Integrated Scenario Explorer (WISE), to

17
disaggregate population forecasts for larger regions created by a cohort-component model to
smaller area units. Several regression models were fitted to distribute population. An evaluation
over the recent past compared the forecasts with those of two simple models, finding the authors’
forecasts were competitive with one of the simple models and slightly less accurate than the
other.
Other approaches apply a variety of disaggregation techniques. Li and Corcoran (2011)
evaluated alternative dasymetric methods to distribute population forecasts for the region of
South East Queensland, to small areas based on their dwelling density category, with each
density category assigned a proportion of regional population growth. They concluded that a
method involving four density classes produced the best results. The classic shift-share method
was adapted by Alonso González et al. (2015) to disaggregate regional age-sex population
forecasts in Spain to small areas. Local area population growth is modelled as the function of
three effects: regional total population growth (regional effect), regional change by age group
(age effect), and local area age-specific growth (local effect). The data requirements are modest
and the calculations relatively simple.
Several studies involve the disaggregation of outputs of cohort-component models applied to
demographic data from higher geographies. In Kanaroglou et al. (2009), the authors develop a
model which combines a multiregional cohort-based demographic model and an aggregated
spatial multinomial logit model to forecast small area populations. Migration flows are estimated
by disaggregating migration data available at the municipal level by using migrant and
destination area characteristics (e.g., migrant’s age, number of schools, distance to city centre).
Jiang et al. (2007) present a Hidden-Markov model based small area population forecasting
method which incorporates a hierarchical framework, such that data from larger geographies can
be used to support small area forecasts. Compared to the cohort-component model, the proposed
method has lower data requirements, is suited to producing longer-term forecasts, and can output
prediction intervals. Jannuzzi (2005) couples a regional-level cohort-component method with a
system of differential equations, based on models of population dynamics used in ecology, to
disaggregate population forecasts to municipalities.
3.7. Small area microsimulation
In contrast to most small area population forecasting methods, microsimulation models, by
definition, operate at the scale of individuals rather than populations. Consequently, they require
considerably more input data and data preparation than macro-scale models, but possess several

18
beneficial features, including rich output detail across many population characteristics (van
Imhoff & Post, 1998). They also avoid the need for constraining between geographical scales
because all output is aggregated from the individual scale. Two broad categories of spatial
microsimulation model may be distinguished: dynamic models in which transitions between
demographic states are modelled explicitly, and static models in which base period data are re-
weighted to aggregate constraints from macro-scale population estimates and projections (Ballas,
Rossiter, et al. 2005; Tanton, 2014). Because they do not explicitly model demographic
processes “static spatial microsimulation models are best for ‘next day’ analyses” based on what-
if? policy scenarios (Tanton & Edwards, 2013 p. 4). A pedagogical example of small area
microsimulation is given in Lomax & Smith (2017).
Examples of dynamic spatial microsimulation models can be found in Ballas, Rossiter, et al.
(2005), Marois and Bélanger (2014, 2015), Wu and Birkin (2013), and Wu et al. (2011). We
briefly describe two models here. Ballas, Clarke, et al. (2005) created SMILE (Simulation Model
for the Irish Local Economy) to produce short-term population forecasts for small areas of
Ireland for the periods 1991-1996 and 1996-2002. In the model, mortality probabilities are based
on age, sex and location, while fertility probabilities are dependent on age, marital status and
location. Probabilities of internal migration are obtained by randomly sampling from census data
based on an individual’s age, sex and county. International migration is excluded due to data
limitations. The mean absolute percentage error for the total populations of small areas was 6.4%
for the 1991-1996 projections. Marois and Bélanger (2014, 2015) describe the development and
application of a microsimulation model for forecasting the populations of municipalities within
the metropolitan region of Montreal, Canada. A key feature is the use of conditional logistic
regression to allocate internal and international migrants to municipalities based on distance to
the city centre, current municipality size, municipality development potential, population
composition as well as geographic location. The model was applied to produce forecasts from
2011 to 2031. Validation over the 2006-11 period revealed a Mean Absolute Percentage Error
(MAPE) of 3.4% for municipality total populations.
An example of a static spatial microsimulation model for small area population forecasting is
described by Harding et al. (2011) and Vidyattama and Tanton (2010). The model SpatialMSM
forecasts population and household characteristics for Statistical Local Areas (SLAs) of
Australia (Harding et al. 2011). It takes independent macro-level forecasts of SLA populations
by age and sex from 2007 to 2027, disaggregates them by labour force status, and then re-
weights the base period small area micro-level dataset to achieve consistency with the
area/age/sex/labour force forecasts.

19
3.8. Machine learning
Machine learning methods have proved very successful in a range of fields, such as speech
recognition (Nassif et al., 2019), translation (Wu et al., 2016), computer vision (Voulodimos et
al., 2018), bioinformatics (Li et al., 2019), and in games such as chess (Silver et al., 2018).
However, some research suggests that these methods are often less accurate than traditional
statistical methods for forecasting work. Makridakis et al. (2018) set out to evaluate the accuracy
of forecasts produced by machine learning methods (including Long Short-Term Memory
(LSTM) models, Bayesian Neural Networks, and Regression Trees) against traditional statistical
methods (such as Exponential Smoothing, ARIMA, and an average of Simple Exponential
Smoothing, Holt, and Damped exponential smoothing). They found that traditional methods
were more accurate and had lower computational requirements than machine learning methods.
The authors suggest that the reasons why many articles claim superior machine learning
performance is that they do not include a comparison with a suitable benchmark method
(particularly a traditional statistical model).
Riiman et al. (2019) evaluated an artificial neural network method known as the Long Short-
Term Memory (LSTM) model for forecasting the total population of Alabama counties at 10
year horizons, and compared them with forecasts from a cohort-component model, which
produced a MAPE of 6.5% at 10 years. They produced machine learning forecasts using two
data types (annual population estimates and decennial census populations) and two training
regimes (training models on data from all counties and training a separate model for each
county), giving four forecasts in total. When models were trained on one county at a time, they
produced lower errors than when models were trained on data from all counties (6.3% MAPE
compared to 16.7% MAPE for annual population data, and 5.0% compared to 6.1% for decennial
census populations). Thus, the LSTM model produced a significantly better forecast than the
cohort-component model when a model was trained for each county and decennial data was
used. The Alabama counties had relatively long time series available to train the models
(decennial census data from 1910 to 2000, and mid-year population estimates from 1969 to
2000), a time series length not always available for small area populations.
Several papers have also applied machine learning methods to the demographic component
inputs of small area population forecasts. Weber (2020) used several machine learning methods
and data from 2005-2009 to predict net migration rates at the municipal level in Germany for
‘education migration’ (ages 18-24) and ‘family migration’ (ages 0-17 and 30-49) for the period

20
2011-2015. The author reported forecasting performance by correlating observed and predicted
values. Net migration rates for education migration achieved R2 >0.5 but R2 = 0.25 was the best
result for family migration. This suggests that machine learning methods with short time series
could not adequately support forecasts of migration.
Several studies have applied such methods in forecasting related to the Shared Socioeconomic
Pathways population scenarios. Chen et al. (2020) applied machine learning techniques to predict
residential land use, and subsequently to forecast small grid square populations from 2015 to
2020, with forecasting constraints taken from the population scenarios. The methods used
included two decision tree based ensemble methods, XGBoost (Georganos et al., 2018) and
random forest (Belgiu et al., 2016), and a neural network algorithm as implemented in Hu et al.
(2019). Striessnig et al. (2019) prepared county population forecasts by broad age group for the
USA consistent with various Shared Socioeconomic Pathway scenarios for the period 2000 to
2100. Instead of relying on the cohort-component model, they used regression trees to forecast
the share of a county’s population in each broad age group based on past demographic
characteristics. Census population data from 1980 to 2000 were used for model training. The age
group shares were then applied to separate county population totals and constrained to national
forecasts by age. Forecasts were compared against actual data during the 2000–2010 period,
revealing an R2 of about 0.9.
3.9. Estimating and projecting small area component input data
Another area of the small area population modelling literature focuses on estimating and
forecasting the separate components of population change: fertility, mortality and migration. As
is the case with small area estimation in general, one of the main challenges in obtaining
estimates of components of population change at the local level is dealing with small or zero
event counts, which make the underlying trends or patterns are unclear. Additionally, data on
components may come from multiple sources, each having their own measurement issues and
biases, that need to somehow be reconciled within the same estimation framework.
Because data in small areas is often sparse, many of the methods used for larger areas are
unreliable. Scherbov and Ediev (2011) demonstrated the difficulty of creating robust life table
statistics for small areas. They showed that traditional life table construction methods often give
unacceptably high estimation bias and standard errors for population sizes below 5,000. Several
approaches have been proposed to deal with this problem. Anson (2018) describes a multilevel
model which uses national mortality rates to support the estimation of subnational mortality rates

21
and applies it to 87 subnational units in Belgium to construct age-sex-specific mortality rates.
Congdon (2014) produced county-level life expectancy estimates in the US based on a structured
random effects model with a regression extension. This method allows for the consideration of
various area characteristics, such as the ethnic mix, population density, and socio-economic
indices, which enable stable life expectancy estimates to be formed with minimal amalgamation
of counties. Dyrting (2020) and Gonzaga and Schmertmann (2016) both describe estimation of
small area demographic rates based on TOPALS, a relational model developed by de Beer
(2012) which can be used to smooth and project various age-specific demographic rates. It
assumes that an age schedule can be represented as a combination of a standard age schedule and
spline-smoothed ratios of local to standard rates. Gonzaga and Schmertmann (2016) developed a
TOPALS-based method to estimate small area age-specific mortality rates for small areas with
incomplete death registrations in Brazil. Dyrting (2020) extended this method using a penalized-
splines approach, where the smoothness of the fit is controlled with a single parameter, and then
applied the method to estimate small area age-specific migration schedules in the Northern
Territory, Australia (Dyrting, 2020). Simpson and Snowling (2017) evaluated three methods for
preparing input data for small area cohort-component forecasts where input data was not
available (or affordable). Methods evaluated included a No Local Variation approach which uses
the same fertility, mortality, and migration inputs for all small areas within a wider region. The
Local Calibration option constrains the No Local Variation assumptions by using total recorded
births and deaths in each area, and estimates age-sex specific migration indirectly from two sets
of population estimates. The Local Direct comparison projection uses small area fertility,
mortality and migration age profiles of rates, directly estimated from available data. The authors
conclude that the Local Calibration option gives the most plausible forecasts.
Whilst there are several approaches to support the estimation of population components in small
areas, a large part of the recent literature has focused on developing Bayesian methods for
estimation and forecasting. Bayesian methods have gained traction in demographic estimation
since the United Nations Population Division began to utilize a Bayesian framework to produce
its regular national and global population forecasts (Raftery et al., 2012). These methods have
since been employed to estimate fertility, mortality, and migration at the global, regional,
national and subnational levels (e.g., Alexander et al., 2017; Alkema & New, 2014; Alkema et
al., 2011; Assunção et al., 2005; Azose & Raftery, 2015; Leknes & Løkken, 2020; Schmertmann
et al., 2013; Schmertmann & Hauer, 2019). Bryant and Zhang (2018) describe a Bayesian
statistical framework which uses multiple, often unreliable, data sources to estimate and forecast
entire demographic systems, including births, deaths, internal migration and international
migration) with age, sex, area and time details.

22
In brief, Bayesian methods allow population processes to be conceptualised in a statistical
framework which can combine both information from observed data and also prior beliefs about
likely patterns in demographic processes. These methods are particularly suited to modelling
demographic components, because they facilitate combining multiple data sources and dealing
with missing data, and allow prior information on likely patterns across age and time to be
incorporated. The use of statistical models allows patterns to be readily smoothed across time
and information to be shared across space, and automatically accounts for and estimates
uncertainty in forecasts.
Bayesian methods for small area demographic estimation first appeared in Peter Congdon’s work
on estimating local level life expectancies in the UK (Congdon, 2009). This approach of using
Bayesian multilevel models has been extended by others studying mortality and other
demographic processes. For example, Wakefield et al. (2019) use a spatio-temporal Bayesian
model to estimate child mortality at the subnational model in data sparse contexts. Alexander et
al. (2017) build on classical demographic model lifetable techniques to estimate small-area age
specific mortality schedules. Jonker et al. (2012) show that a Bayesian Random Effects approach
outperforms traditional life expectancy estimations. Traditional life expectancy estimations tend
to generate unacceptably large biases and standard errors for populations of fewer than 5,000
person years, conversely the Bayesian approach allows estimates to be produced down to 2,000
person years (Jonker et al., 2012). Bryant and Zhang show how these types of methods can be
employed to estimate small-area internal migration rates in both New Zealand and Iceland
(Bryant & Zhang, 2016; Zhang & Bryant, 2020). A model providing a fuller demographic
account for subnational regions of New Zealand is presented in Bryant and Graham (2013),
where estimates are created using multiple data sources, including census and administrative data
(e.g., tax system data, school enrollments, and electoral roll). In a different application of
Bayesian methods, Schmertmann and Hauer (2019) develop methods to estimate fertility rates
given population age structures. While not explicitly dealing with small populations, these
methods are potentially useful in the small population context because often only population
counts may be available.
3.10. Forecast uncertainty
Over the last three decades, the literature on quantifying population forecast uncertainty has
grown considerably in scope and complexity. Methods have become increasingly sophisticated,
probabilistic forecasts have been published for many case study countries, and several software

23
packages made publicly available (Keilman, 2018, 2020). A few statistical agencies have now
adopted probabilistic methods to prepare their official population forecasts (e.g., Statistics
Netherlands, 2020; Statistics New Zealand, 2020; UN, 2019). Some researchers have focused on
uncertainty for large subnational regions (e.g., Bertino et al., 2014; Rees & Turton, 1998;
Swanson & Tayman, 2014; Wilson & Bell, 2007; Wisniowski & Raymer, 2016) but very little
attention has been devoted to small area population forecasts, where errors tend to be highest and
the need for quantifying uncertainty the greatest. It is not due to a lack of interest from users. In a
recent survey, the majority of subnational population forecast users stated that they would like to
receive information about population forecast uncertainty (Wilson & Shalley, 2019). Among the
methods which quantify uncertainty, Tayman (2011) makes a broad distinction between
empirically-based prediction intervals based on analyses of historical forecast errors, and model-
based intervals generated by probabilistic and statistical models. Model-based intervals are quite
data-hungry and complex to produce but provide an almost unlimited set of prediction intervals;
empirically-based intervals provide less information but require less data and avoid complex
model estimation.
Few papers describe probabilistic methods for quantifying local and small area forecast
uncertainty. Bayesian methods for population forecasting estimate uncertainty as a natural by-
product of the estimation process (Bryant & Zhang, 2018; Bryant & Graham, 2013). Of the non-
Bayesian methods, one early contribution, due to Gullickson and Moen (2001), presented
probabilistic population forecasts for one county in Minnesota and the rest of the State. A cohort-
component model was run 1,000 times using fertility rates from a random walk with drift model,
Lee-Carter mortality forecasts, and migration rates obtained by sampling randomly from recent
net migration rates. Although relatively simple by today’s standards, this was an innovative
contribution at the time. A probabilistic cohort-component model was also created by Cameron
and Poot (2011) to produce forecasts of district populations in the Waikato region of New
Zealand. To keep the model relatively simple, they multiplied age-specific rates by factors drawn
randomly from separate distributions for fertility, mortality, and net migration. These factors
were maintained for all age-specific rates throughout the forecast horizon.
In contrast to this simulation approach, Rayer et al. (2009) created empirically-based prediction
intervals. To do so, they prepared retrospective forecasts of total population for 2,482 counties in
the US over many past decades using seven trend extrapolation methods. Final forecasts were
created from a trimmed mean of the five remaining forecasts after excluding the highest and
lowest for each area, and their errors were used to estimate 90th percentile predictive intervals for
use in later forecasts. The authors found that in most circumstances, the 90th percentile error from
24
one period proved quite accurate in predicting the 90% range of absolute percentage errors
obtained in a subsequent period. This empirical approach is applied by the Bureau of Economic
and Business Research at the University of Florida to create 75% prediction intervals for county
population forecasts in Florida (Rayer & Wang, 2020). The prediction intervals are allocated
according to population size and recent growth rate.
Similarly, Wilson et al. (2018) created empirical prediction intervals for total population
forecasts from an evaluation of 30 years’ worth of local area population forecasts in Australia.
80th percentile intervals were estimated from historical errors, smoothed across population size
categories, and then applied to contemporary local area population forecasts based on jump-off
year population sizes. Past error distributions were also used to estimate the ‘shelf life’ of a
population forecast to indicate far into the future the forecast could be regarded as still ‘suitable
for consumption’. It was defined in this case as the number of years into the forecast horizon the
80% prediction interval would remain within 10% absolute percentage error. Up to 10% error
was regarded as a reasonable quality forecast.
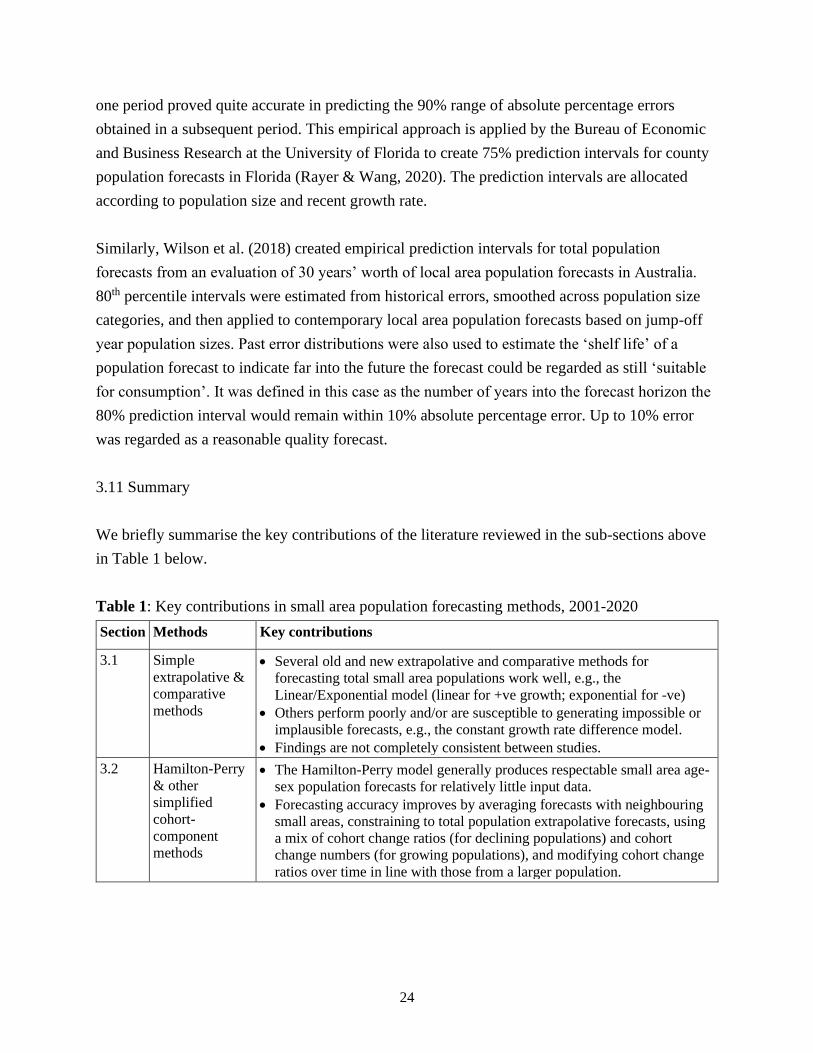
3.11 Summary
We briefly summarise the key contributions of the literature reviewed in the sub-sections above
in Table 1 below.
Table 1: Key contributions in small area population forecasting methods, 2001-2020
Section Methods Key contributions
3.1 Simple
extrapolative &
comparative
methods
• Several old and new extrapolative and comparative methods for
forecasting total small area populations work well, e.g., the
Linear/Exponential model (linear for +ve growth; exponential for -ve)
• Others perform poorly and/or are susceptible to generating impossible or
implausible forecasts, e.g., the constant growth rate difference model.
• Findings are not completely consistent between studies.
3.2 Hamilton-Perry
& other
simplified
cohort-
component
methods
• The Hamilton-Perry model generally produces respectable small area age-
sex population forecasts for relatively little input data.
• Forecasting accuracy improves by averaging forecasts with neighbouring
small areas, constraining to total population extrapolative forecasts, using
a mix of cohort change ratios (for declining populations) and cohort
change numbers (for growing populations), and modifying cohort change
ratios over time in line with those from a larger population.

25
3.3 Model
averaging &
composite
models
• Several studies show that averaged or composite models for small area
population forecasts generally achieve comparable or better forecast
accuracy than individual models.
• Cohort-component models constrained to extrapolative total population
forecasts tend to be yield more accurate small area forecasts than
unconstrained versions.
3.4 Models
incorporating
socio-economic
variables and
spatial
relationships
• Regression models for forecasting small area total populations from a set
of independent variables generally do not produce substantially more
accurate forecasts than simple extrapolative models.
• Two studies which applied spatial weighting to forecast assumptions or
results were found to improve accuracy.
3.5 Models linking
population &
housing
• The data-efficient housing-unit model continues to be used for small area
population forecasts by researchers and practitioners.
• Recent work illustrates how it can be connected to the cohort-component
model and a headship rate household model (or similar) to provide
internally consistent population and household forecasts.
• Other approaches link population (or migration) age-sex profiles to
housing types, though this work has yet to be fully developed.
3.6 ‘Downscaling’
models and
disaggregation
approaches
• Many studies have applied various ‘downscaling’ approaches to
disaggregate national and large regional population forecasts to small
areas, particularly small grid squares.
• Methods vary from simple extrapolation to complex models which
estimate small area development potential.
• Many use assumptions which considerably simplify reality.
• Many models have not undergone forecast accuracy assessments.
3.7 Small area
microsimulation • Over the last decade a few small area dynamic microsimulation models
have been created.
• They provide rich output detail but at the cost of considerable input data
requirements.
• Short-term forecast accuracy has been reported as reasonable.
3.8 Machine
learning
methods
• Machine learning methods are just beginning to be used in small area
demographic forecasting.
• The few examples to date present mixed results. Further evaluations are
required to determine the most appropriate machine learning methods for
small area forecasts and the circumstances in which they do better than
traditional methods.
3.9 Methods for
estimating and
projecting small
area component
input data
• Several papers describe how robust small area component rate
assumptions can be prepared by borrowing information from elsewhere.
• Relational models, indirect estimation approaches, and several Bayesian
methods have been shown to provide good estimates.
3.10 Methods for
quantifying
small area
forecast
uncertainty
• Only a few studies have created estimates of forecast uncertainty for small
area populations.
• Some are probabilistic in nature; others are empirically-based with
prediction intervals for total population based on past error distributions
(which have been shown to provide good estimates of forecast errors).
Source: authors’ assessment
26
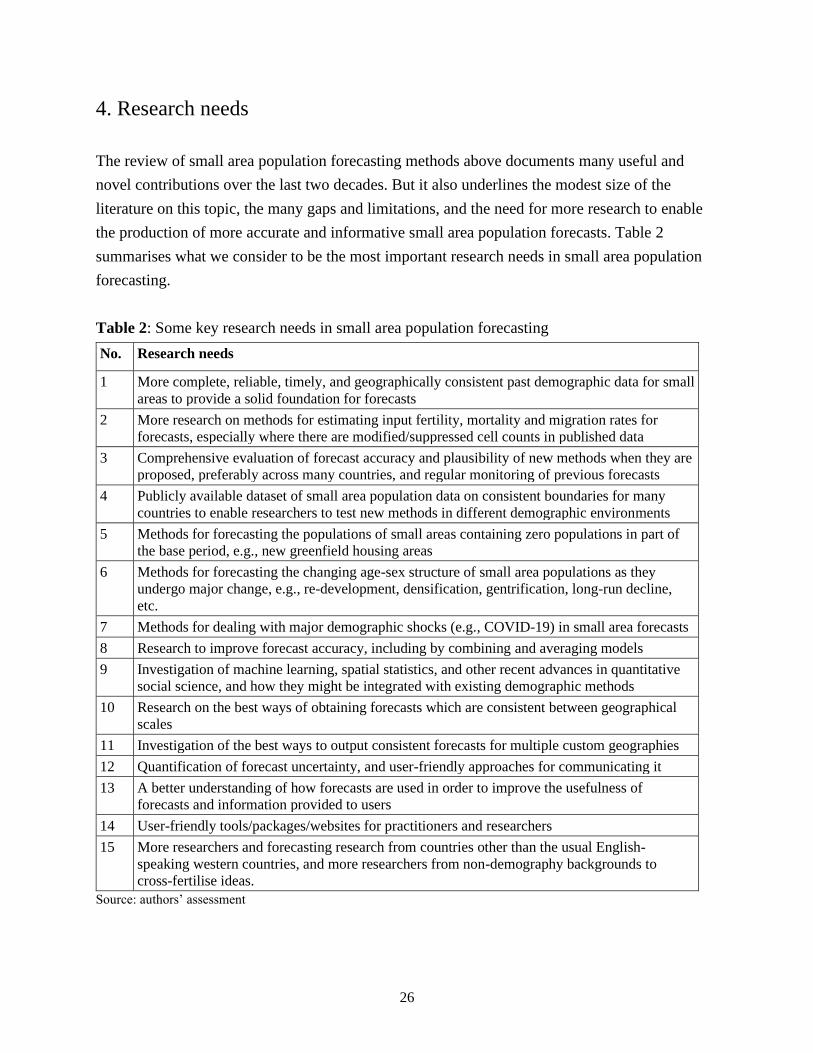
4. Research needs
The review of small area population forecasting methods above documents many useful and
novel contributions over the last two decades. But it also underlines the modest size of the
literature on this topic, the many gaps and limitations, and the need for more research to enable
the production of more accurate and informative small area population forecasts. Table 2
summarises what we consider to be the most important research needs in small area population
forecasting.
Table 2: Some key research needs in small area population forecasting
No. Research needs
1 More complete, reliable, timely, and geographically consistent past demographic data for small
areas to provide a solid foundation for forecasts
2 More research on methods for estimating input fertility, mortality and migration rates for
forecasts, especially where there are modified/suppressed cell counts in published data
3 Comprehensive evaluation of forecast accuracy and plausibility of new methods when they are
proposed, preferably across many countries, and regular monitoring of previous forecasts
4 Publicly available dataset of small area population data on consistent boundaries for many
countries to enable researchers to test new methods in different demographic environments
5 Methods for forecasting the populations of small areas containing zero populations in part of
the base period, e.g., new greenfield housing areas
6 Methods for forecasting the changing age-sex structure of small area populations as they
undergo major change, e.g., re-development, densification, gentrification, long-run decline,
etc.
7 Methods for dealing with major demographic shocks (e.g., COVID-19) in small area forecasts
8 Research to improve forecast accuracy, including by combining and averaging models
9 Investigation of machine learning, spatial statistics, and other recent advances in quantitative
social science, and how they might be integrated with existing demographic methods
10 Research on the best ways of obtaining forecasts which are consistent between geographical
scales
11 Investigation of the best ways to output consistent forecasts for multiple custom geographies
12 Quantification of forecast uncertainty, and user-friendly approaches for communicating it
13 A better understanding of how forecasts are used in order to improve the usefulness of
forecasts and information provided to users
14 User-friendly tools/packages/websites for practitioners and researchers
15 More researchers and forecasting research from countries other than the usual English-
speaking western countries, and more researchers from non-demography backgrounds to
cross-fertilise ideas.
Source: authors’ assessment

27
Small area population forecasts depend crucially on past demographic data being accurate,
complete, and up-to-date. Unfortunately, this is often not the case. Accuracy tends to be lower
for small areas than large subnational regions, some small area demographic data are unavailable
(often the most important component, migration), and population estimates and components are
regularly not published until 1-2 years after the reference date. Small area data also needs to be
based on a consistent set of geographical boundaries, preferably the current set, so that recorded
demographic change is real and not just an artefact of boundary change (Norman et al., 2003;
Rees et al., 2004). Although past demographic data was outside the scope of our review, a
prerequisite for improving small area population forecasting is to have accurate, complete and
timely past and current small area demographic data. Much of this will require efforts from
national statistical offices (perhaps including greater use of linked administrative datasets), but
researchers can also contribute methods for geographical data conversion and more up-to-date
estimation and nowcasting.
Where small area component data are available, a common challenge is dealing with sparse,
noisy, and/or inaccurate data. For forecasting purposes, it is best to forecast smooth underlying
rates, not noisy base period data. Our review notes several contributions to estimating and
smoothing small area rates, particularly through the application of Bayesian methods. The next
step is to refine methods and make user-friendly tools available. An additional challenge arises
when available data is perturbed or suppressed in some manner by data providers for
confidentiality reasons. More research is needed to devise strategies and methods to recover or
estimate data where this issue exists.
It would also be helpful if historical validation routinely occurred when new forecasting methods
are proposed. A key question to ask is: if a forecasting method was applied n years ago, how well
would it have forecast the population for the most recent year we have a population estimate for?
And would it have done better than existing methods? While many studies address these
questions, some of the forecasting methods covered in the review did not undergo any validation,
or were subject to only a very limited evaluation. This was particularly the case for some of the
downscaling methods and microsimulation models. Evaluations of new methods can reveal
important information about their forecast characteristics, typical forecast accuracy, and whether
they improve on existing methods. In addition to historical validation, there has been limited
evaluation of ‘real’ small area population forecasts produced by statistical offices and
researchers. This too can reveal important findings about methods that work well, and those that
do not. It would be helpful if all such evaluations used a consistent set of error measures to

28
enable comparisons to be made easily between different studies. Ideally, demographers would
agree on a recommended standard set of error measures to be applied in all forecast evaluations.
The historical validation of methods would be made much easier if there were publicly available
small area demographic datasets. Ideally, the datasets would include population estimates for
many commonly used spatial units (e.g., census tracts, wards, SA2 areas) and many countries so
that that forecasting methods could be evaluated in a variety of demographic environments.
Ideally, the datasets would span several decades of population data on a consistent set of
geographical boundaries, and include not just population estimates but also the demographic
components of change. Data for several countries might shed light on why different extrapolative
and comparative small area forecasting methods proved most accurate in different countries
(section 3.1). Small area demographic data covering a useful period of time is currently quite
difficult to obtain2. We therefore wish to invite researchers and statistical offices to share small
area population estimates (where permitted), and accompanying component data time series if
available, to be uploaded to the github page at https://demographic-datasets-network.github.io/.
Most small area forecasting methods require some base period data, either to extrapolate past
population numbers into the future, or to estimate recent fertility, mortality and migration rates or
patterns. But sometimes a small area starts the forecast horizon with a population of zero and no
demographic history. This is the case for small areas on a city fringe where construction will
begin on a new housing estate in the near future. The housing-unit model could be used to
forecast total population numbers, but any age-sex detail will need to be provided by additional
data or another model, such as the cohort-component model (along with fertility, mortality and
migration assumptions). The literature currently provides little guidance on how such forecasts
are best prepared (especially migration rate age profiles), so further research to enable good
quality forecasts to be produced for these types of areas would be helpful.
Similarly, many current methods are poorly suited to forecasting the populations of small areas
undergoing major changes which are likely to re-shape the area’s population size and age
structure, such as major housing redevelopment projects or the construction of large-scale
institutional accommodation. In addition, many existing modelling approaches cannot easily
incorporate major shocks to demographic trends, such as those caused by COVID-19 or the
closure of the local area’s main employer. Methods which are able to handle these sorts of
changes would likely improve the quality and plausibility of small area population forecasts. A
2 though large datasets containing grid square population counts do exist, such as the Gridded Population of the
World at https://sedac.ciesin.columbia.edu/ and the WorldPop project at https://www.worldpop.org/.

29
related challenge is how to deal with those small area populations, often in rural and remote
regions, experiencing sustained long-term decline. Should their populations be forecast to
decline for many decades ahead, possibly reaching zero at some point? It would be useful to
develop methods which forecast a plausible minimum population size based on theory and past
experience.
Forecast accuracy is one of the key concerns of demographers creating new forecasting methods,
and our review documents numerous efforts to improve forecast accuracy using a variety of
methods. While this is challenging at the small area scale, several studies show that averaging or
combining models often lowers forecast errors. Further research along these lines to investigate
model combinations not yet tested would seem sensible. In addition, further exploration of
machine learning methods, spatial statistics, and Bayesian methods, which are growing in
popularity in the social sciences, would be valuable to determine whether forecast accuracy
could be improved further. But it is important not to ‘throw the baby out with the bathwater’.
Our view is that these newer methods are best combined with proven existing demographic
models, to draw on the strength of both new and established methods.
One of the themes absent in the literature review is how best to produce forecasts which are
consistent between geographical scales (Rees, 1994). Small area population forecasts are often
produced as part of a wider set of forecasts at multiple geographical scales (e.g., small area,
State/province, and national). A common approach is to apply top-down constraining to the
projected subnational demographic components of change in which components for each area are
scaled by the same factor. Where components are not projected, an alternative is to adjust
population growth using the plus-minus technique for example (Smith et al. 2013). But
sometimes considerable amounts of constraining are required, effectively revising assumptions
by a substantial margin. An alternative is to apply a bottom-up method in which higher
geography forecasts are simply the sum of smaller area forecasts. Although a few methods for
ensuring forecast consistency exist (e.g., van Imhoff & Keilman, 1991; H. Li & Hyndman,
2021), research is needed to find optimal, and ideally simple, ways of creating assumptions and
forecasts which are consistent between geographical scales.
Another geography-related challenge is to investigate the best ways to output consistent forecasts
for multiple custom geographies. While geographical conversion is relatively straightforward for
historical data using various spatial interpolation methods (Comber & Zeng, 2019), the
equivalent for forecasts is more complex because population growth is unlikely to be uniform
across a small area and ancillary data for interpolation is required for future years. In addition,

30
the geographical conversion of internal migration projections is far from simple because some
inter-area flows become intra-area flows, and vice versa. One approach would be to create
forecasts for ultra-small areas which can be aggregated on a best-fit basis to most custom
geographies, but forecasting ultra-small area populations presents a huge challenge.
Also requiring further research is the quantification of forecast uncertainty (Tayman, 2011).
Estimates of uncertainty are provided for a few sets of small area forecasts, as the review shows,
but mostly uncertainty is not considered. Where measures of uncertainty are provided, they are
generally empirically-based intervals for total populations only. Much remains to be done to
provide users with comprehensive estimates of uncertainty for small population by age and sex
and for projected components. A challenge exists in adapting probabilistic methods to cope with
the more limited data environment for small areas, and to prevent the forecasting process from
becoming very complex and time-consuming. Also needed are user-friendly methods of
communicating uncertainty to non-technical users of forecasts (Wilson, 2018).
We hope at least some of the above suggestions for further research are realised in coming years,
but it is just as important to translate new research into practical tools. Doing so hugely increases
the value of the research. Recent years have seen the creation of many useful demography tools
and software packages for practitioners and researchers, some of which are available via the very
useful Applied Demography Toolbox website at https://applieddemogtoolbox.github.io/. The
development of additional user-friendly small area population forecasting tools and packages,
based on new research, would be most helpful.
Another issue which has received little attention is understanding how forecasts are used
(Diamond et al, 1990). If demographers know how forecasts are interpreted and used in planning
and decision-making, then it should be possible for information about the forecasts, including
their strengths and limitations, to be tailored to key user groups. And it might result in greater
attention being given to particular aspects of the forecasts when preparing input data and
assumptions, and validating outputs. Research on understanding more about how small area
population forecasts are used and interpreted could lead to improvements which enhance their
value to users.
Finally, it would be a positive development if more subnational population forecasting research
was undertaken in countries other than the usual English-speaking Western countries, and by
researchers from those countries. It is certainly the case that our review is dominated by research
from North America, the UK and Australia. It might also be beneficial if small area population

31
forecasting research involved more researchers from non-demography backgrounds to cross-
fertilise ideas from other disciplines.

32
5. Conclusions
In this paper we have reviewed the literature on small area population forecasting from the last
two decades, and suggested several areas suitable for further research. The scope of our review
was fairly tightly defined in terms of small area size, forecasting methods, and publication dates,
so we did not include related topics such as derived forecasts, quality assurance, and small area
population estimation. Even within the narrow scope of the review, there are inevitably some
papers we have missed. However, the limited scope of the review enabled us to cover small area
forecasting methods in some detail, and we hope this is of use to researchers and practitioners.
A key conclusion from this review is that there is a discrepancy between the importance of small
area population forecasting for planning purposes on the one hand, and the state of the small area
forecasting methods toolbox on the other. Small area population forecasts are widely used for
planning purposes and influence many substantial investment decisions. Although many
important methodological contributions have been made over the last 20 years, research funding
and progress lags behind that for national level, and large subnational level, population
forecasting. We hope that further research, particularly along the lines of the suggestions made in
Table 2, will lead to the development of better forecasting methods, and therefore more accurate
and useful small area population forecasts, in the future.

33
Declarations
Funding
This research was funded by the Australian Government through the through the Australian
Research Council’s Discovery Projects funding scheme (project DP200101480).
Conflicts of interest
None declared.
Availability of data and material
Not applicable
Code availability
Not applicable
Ethics approval
Ethics approval for this project was granted by the Melbourne School of Population and Global
Health (MSPGH) Human Ethics Advisory Group (HEAG), Reference Number: 2020-20575-
13335-2.
Acknowledgements
We are grateful to authors of papers included in our review for reading over our brief summaries
of their papers in the annotated bibliography and making corrections where necessary. Jack
Baker and Eddie Hunsinger kindly provided helpful comments on an earlier draft of the paper.
All errors and omissions, however, remain the authors’ responsibility.

34
References
Alexander, M., Zagheni, E., & Barbieri, M. (2017). A Flexible Bayesian Model for Estimating
Subnational Mortality. Demography, 54(6), 2025-2041. https://doi.org/10.1007/s13524-
017-0618-7
Alho, J. M. (2015). Population Forecasts. In J. D. Wright (Ed.), International Encyclopedia of
the Social & Behavioral Sciences (Second Edition) (pp. 593-596). Oxford: Elsevier.
Alkema, L., & New, J. R. (2014). Global estimation of child mortality using a Bayesian B-spline
bias-reduction model. The Annals of Applied Statistics, 8(4), 2122-2149.
https://doi.org/10.1214/14-AOAS768
Alkema, L., Raftery, A. E., Gerland, P., Clark, S. J., Pelletier, F., Buettner, T., & Heilig, G. K.
(2011). Probabilistic projections of the total fertility rate for all countries. Demography,
48(3), 815-839. https://doi.org/10.1007/s13524-011-0040-5
Alonso González, M. L., Fernández Vázquez, E., & Rubiera Morollón, F. (2015). A
methodological note for local demographic projections: A shift-share analysis to
disaggregate official aggregated estimations. Revista Electrónica de Comunicaciones y
Trabajos de Asepuma, 16(1), 43-50.
Anson, J. (2018). Estimating local mortality tables for small areas: An application using Belgian
sub-arrondissements. Quetelet Journal, 6(1), 73-97.
https://doi.org/10.14428/rqj2018.06.01.04
Assunção, R. M., Schmertmann, C. P., Potter, J. E., & Cavenaghi, S. M. (2005). Empirical Bayes
estimation of demographic schedules for small areas. Demography, 42(3), 537-558.
https://doi.org/doi.org/10.1353/dem.2005.0022
Athukorala, W., Neelawela, P., Wilson, C., Miller, E., Sahama, T., Grace, P., Hefferan, M.,
Dissanayake, P., & Manawadu, O. (2010). Forecasting Population Changes and Service
Requirements in the Regions: A Study of Two Regional Councils in Queensland,
Australia. Economic Analysis and Policy, 40(3), 327-349. https://doi.org/10.1016/S0313-
5926(10)50033-X
Azose, J. J., & Raftery, A. E. (2015). Bayesian Probabilistic Projection of International
Migration. Demography, 52(5), 1627-1650. https://doi.org/10.1007/s13524-015-0415-0
Baker, J., Alcántara, A., Ruan, X., Watkins, K., & Vasan, S. (2014). Spatial weighting improves
accuracy in small-area demographic forecasts of urban census tract populations. Journal
of Population Research, 31(4), 345-359. https://doi.org/10.1007/s12546-014-9137-1
Baker, J., Ruan, X., Alcantara, A., Jones, T., Watkins, K., McDaniel, M., Frey, M., Crouse, N.,
Rajbhandari, R., Morehouse, J., Sanchez, J., Inglis, M., Baros, S., Penman, S., Morrison,
S., Budge, T., & Stallcup, W. (2008). Density-dependence in urban housing unit growth:

35
An evaluation of the Pearl-Reed model for predicting housing unit stock at the census
tract level. Journal of Economic and Social Measurement, 33(2-3), 155-163.
https://doi.org/10.3233/JEM-2008-0301
Baker, J., Swanson, D. A., Tayman, J., & Tedrow, L. M. (2017). Cohort Change Ratios and their
Applications. Springer International Publishing.
Baker, J., Swanson, D., & Tayman, J. (2020). The Accuracy of Hamilton–Perry Population
Projections for Census Tracts in the United States. Population Research and Policy
Review, 1-14. https://doi.org/10.1007/s11113-020-09601-y
Ballas, D., Clarke, G. P., & Wiemers, E. (2005). Building a dynamic spatial microsimulation
model for Ireland. Population, Space and Place, 11(3), 157-172.
https://doi.org/10.1002/psp.359
Ballas, D., Rossiter, D., Thomas, B., Clarke, G., & Dorling, D. (2005). Geography Matters:
Simulating the Local Impacts of National Social Policies. Joseph Rowntree Foundation.
Bates, J. M., & Granger, C. W. (1969). The combination of forecasts. Journal of the Operational
Research Society, 20(4), 451-468. https://doi.org/10.1057/jors.1969.103
Belgiu, M., Drăguţ, L. J. (2016). Random forest in remote sensing: A review of applications and
future directions. ISPRS Journal of Photogrammetry and Remote Sensing, 114, 24-31.
https://doi.org/10.1016/j.isprsjprs.2016.01.011
Bell, M. (1997). Small Area Forecasting for Infrastructure Planning: Towards a Better Practice.
Department of Industry, Science and Tourism, Canberra.
Bertino, S., Casacchia, O., & Crisci, M. (2014). Stochastic population projections: an application
to the Rome Metropolitan Area. In M. Marsili & G. Capacci (Eds.) Proceedings of the
6th Eurostat/UNECE Work Session on Demographic Projections (pp. 216-229). National
Institute of Statistics, Rome, Italy.
Boke-Olén, N., Abdi, A. M., Hall, O., & Lehsten, V. (2017). High-resolution African population
projections from radiative forcing and socio-economic models, 2000 to 2100. Scientific
Data, 4(1), 1-9. https://doi.org/10.1038/sdata.2016.130
Booth, H. (2006). Demographic forecasting: 1980 to 2005 in review. International Journal of
Forecasting, 22(3), 547-581. https://doi.org/10.1016/j.ijforecast.2006.04.001
Breidenbach, P., Kaeding, M., & Schaffner, S. (2019). Population projection for Germany 2015–
2050 on grid level (RWI-GEO-GRID-POP-Forecast). Jahrbücher für Nationalökonomie
und Statistik, 239(4), 733-745. https://doi.org/10.1515/jbnst-2017-0149
Bryan, T. (2004). Chapter 20 Population estimates. In J. S. Siegel & D. A. Swanson (Eds.), The
Methods and Materials of Demography (2 ed., pp. 523-560): Elsevier Academic Press.

36
Bryant, J., & Zhang, J. L. (2016). Bayesian forecasting of demographic rates for small areas:
emigration rates by age, sex, and region in New Zealand, 2014-2038. Statistica Sinica 26,
1337-1363. https://doi.org/10.5705/ss.2014.200t
Bryant, J., & Zhang, J.L. (2018). Bayesian Demographic Estimation and Forecasting (1st ed.).
CRC Press. https://doi.org/10.1201/9780429452987
Bryant, J., R. , & Graham, P., J. (2013). Bayesian Demographic Accounts: Subnational
Population Estimation Using Multiple Data Sources. Bayesian Analysis, 8(3), 591-622.
https://doi.org/10.1214/13-BA820
Cameron, M. P., & Cochrane, W. (2017). Using land-use modelling to statistically downscale
population projections to small areas. Australasian Journal of Regional Studies, 23(2),
195.
Cameron, M. P., & Poot, J. (2011). Lessons from stochastic small-area population projections:
The case of Waikato subregions in New Zealand. Journal of Population Research, 28(2-
3), 245-265. https://doi.org/10.1007/s12546-011-9056-3
Chen, Y., Li, X., Huang, K., Luo, M., & Gao, M. (2020). High‐Resolution Gridded Population
Projections for China Under the Shared Socioeconomic Pathways. Earth's Future, 8(6),
e2020EF001491. https://doi.org/10.1029/2020EF001491
Chi, G. (2009). Can knowledge improve population forecasts at subcounty levels? Demography,
46(2), 405-427. https://doi.org/10.1353/dem.0.0059
Chi, G., & Voss, P. R. (2011). Small‐area population forecasting: Borrowing strength across
space and time. Population, Space and Place, 17(5), 505-520.
https://doi.org/10.1002/psp.617
Chi, G., & Wang, D. (2017). Small-area population forecasting: a geographically weighted
regression approach. In D. A. Swanson (Ed.), The Frontiers of Applied Demography (pp.
449-471). Springer. https://doi.org/10.1007/978-3-319-43329-5_21
Chi, G., & Zhu, J. (2008). Spatial Regression Models for Demographic Analysis. Population
Research and Policy Review, 27(1), 17-42. https://doi.org/10.1007/s11113-007-9051-8
Chi, G., Zhou, X., & Voss, P. R. (2011). Small-area population forecasting in an urban setting: a
spatial regression approach. Journal of Population Research, 28(2-3), 185-201.
https://doi.org/10.1007/s12546-011-9053-6
Clemen, R. T. (1989). Combining forecasts: A review and annotated bibliography. International
Journal of Forecasting, 5(4), 559-583. https://doi.org/10.1016/0169-2070(89)90012-5
Comber, A., & Zeng, W. (2019). Spatial interpolation using areal features: A review of methods
and opportunities using new forms of data with coded illustrations. Geography Compass
13(10), e12465. https://doi.org/10.1111/gec3.12465

37
Congdon, P. (2009). Life expectancies for small areas: A Bayesian random effects methodology.
International Statistical Review, 77(2), 222-240. https://doi.org/10.1111/j.1751-
5823.2009.00080.x
Congdon, P. (2014). Estimating life expectancies for US small areas: a regression framework.
Journal of Geographical Systems, 16(1), 1-18. https://doi.org/10.1007/s10109-013-0177-
4
de Beer, J. (2012). Smoothing and projecting age-specific probabilities of death by TOPALS.
Demographic Research, 27(20), 543-592. https://doi.org/10.4054/DemRes.2012.27.20
Diamond, I., Tesfaghiorghis, H., & Joshi, H. (1990). The uses and users of population
projections in Australia. Journal of the Australian Population Association, 7(2), 151-170.
https://doi.org/10.1007/BF03029362
Dittgen, A., & Dutreuilh, C. (2005). Housing and household size in local population dynamics.
Population (English Edition, 2002-), 60(3), 259-298. https://doi.org/10.2307/4148195
Dockery, A. M., Harris, M. N., Holyoak, N., & Singh, R. B. (2020). A methodology for
projecting sparse populations and its application to remote Indigenous communities.
Journal of Geographical Systems, 1-25. https://doi.org/10.1007/s10109-020-00329-z
Dyrting, S. (2020). Smoothing migration intensities with P-TOPALS. Demographic Research,
43, 1527-1570. https://doi.org/10.4054/DemRes.2020.43.55
Feng, Q., Wang, Z., Choi, S., & Zeng, Y. (2020). Forecast Households at the County Level: An
Application of the ProFamy Extended Cohort-Component Method in Six Counties of
Southern California, 2010 to 2040. Population Research and Policy Review, 39(2), 253-
281. https://doi.org/10.1007/s11113-019-09531-4
Foss, W. (2002). Small area population forecasting. The Appraisal Journal, 70(2), 163-172.
Franzén, M., & Karlsson, T. (2010). Using national data to obtain small area estimators for
population projections on sub-national level. Paper presented at the Conference of
European Statisticians, Lisbon, Portugal.
https://www.unece.org/fileadmin/DAM/stats/documents/ece/ces/ge.11/2010/sp.2.e.pdf
Georganos, S., Grippa, T., Vanhuysse, S., Lennert, M., Shimoni, M., Kalogirou, S., & Wolff, E.
(2018). Less is more: optimizing classification performance through feature selection in a
very-high-resolution remote sensing object-based urban application. GIScience & Remote
Sensing, 55(2), 221-242. https://doi.org/10.1080/15481603.2017.1408892
GLA. (2018). Projected Demand for School Places. London: Greater London Authority.
Retrieved from https://data.london.gov.uk/dataset/pan-london-school-place-demand
Gonzaga, M. R., & Schmertmann, C. P. (2016). Estimating age-and sex-specific mortality rates
for small areas with TOPALS regression: an application to Brazil in 2010. Revista

38
Brasileira de Estudos de População, 33(3), 629-652. https://doi.org/10.20947/S0102-
30982016c0009
Goodwin, P. (2009). New evidence on the value of combining forecasts. Foresight: The
International Journal of Applied Forecasting(12), 33-35.
Grip, R. S., & Grip, M. L. (2020). Using Multiple Methods to Provide Prediction Bands of K-12
Enrollment Projections. Population Research and Policy Review, 39(1), 1-22.
https://doi.org/10.1007/s11113-019-09533-2
Gu, H., Lao, X., & Shen, T. (2020). Research Progress on Spatial Demography. In X. Ye & H.
Lin (Eds.), Spatial Synthesis: Computational Social Science and Humanities (pp. 125-
145). Springer International Publishing.
Gullickson, A., & Moen, J. (2001). The use of stochastic methods in local area population
forecasts. Paper prepared for the annual meeting of the Population Association of
America, Washington DC.
Hachadoorian, L., Gaffin, S. R., & Engelman, R. (2011). Projecting a gridded population of the
world using ratio methods of trend extrapolation. In R. P. Cincotta, & L. J. Gorenflo
(Eds.) Human Population: Its Influences on Biological Diversity (pp. 13-25). Springer-
Verlag Berlin Heidelberg.
Hamilton, C. H., & Perry, J. (1962). A short method for projecting population by age from one
decennial census to another. Social Forces, 41(2), 163-170.
https://doi.org/10.2307/2573607
Hansen, H.S. (2010). Small-Area Population Projections - A Key Element in Knowledge Based
e-Governance. In K.N. Andersen, E. Francesconi, A. Grönlund, & T.M. van Engers
(Eds.), EGOVIS 2010. Lecture Notes in Computer Science: Vol. 6267. Electronic
Government and the Information Systems Perspective (pp. 32-46). Springer, Berlin,
Heidelberg. https://doi.org/10.1007/978-3-642-15172-9_4
Harding, A., Vidyattama, Y., & Tanton, R. (2011). Demographic change and the needs-based
planning of government services: Projecting small area populations using spatial
microsimulation. Journal of Population Research, 28(2-3), 203-224.
https://doi.org/10.1007/s12546-011-9061-6
Harzing, A. (2007). Publish or perish software [Computer software]. Retrieved from
https://harzing.com/resources/publish-or-perish
Hauer, M. E. (2017) Migration induced by sea-level rise could reshape the US population
landscape. Nature Climate Change, 7, 321-325. https://doi.org/10.1038/nclimate3271
Hauer, M. E. (2019). Population projections for US counties by age, sex, and race controlled to
shared socioeconomic pathway. Scientific Data, 6(1), 1-15.
https://doi.org/10.1038/sdata.2019.5

39
Hauer, M. E., Evans, J. M., & Alexander, C. R. (2015). Sea-level rise and sub-county population
projections in coastal Georgia. Population and Environment, 37(1), 44-62.
https://doi.org/10.1007/s11111-015-0233-8
Hauer, M. E., Evans, J. M., & Mishra, D. R. (2016). Millions projected to be at risk from sea-
level rise in the continental United States. Nature Climate Change, 6, 691-695.
https://doi.org/10.1038/nclimate2961
Hu, L., He, S., Han, Z., Xiao, H., Su, S., Weng, M., & Cai, Z. (2019). Monitoring housing rental
prices based on social media: An integrated approach of machine-learning algorithms and
hedonic modeling to inform equitable housing policies. Land Use Policy, 82, 657-673.
https://doi.org/10.1016/j.landusepol.2018.12.030
Inoue, T. (2017). A new method for estimating small area demographics and its application to
long-term population projection. In D. A. Swanson (Ed.), The Frontiers of Applied
Demography (pp. 473-489). Springer. https://doi.org/10.1007/978-3-319-43329-5_22
Isserman, A. M. (1977). The accuracy of population projections for subcounty areas. Journal of
the american Institute of Planners, 43(3), 247-259.
https://doi.org/10.1080/01944367708977786
Jiang, B., Jin, H., Liu, N., Quirk, M., and Searle, B. (2007). A HMM-based hierarchical
framework for long-term population projection of small areas. In M. A. Orgun and J.
Thornton (Eds.), AI 2007: Advances in Artificial Intelligence. AI 2007. Lecture Notes in
Computer Science, vol 4830 (pp. 694-698). Springer. https://doi.org/10.1007/978-3-540-
76928-6_77
Jonker, M. F., van Lenthe, F. J., Congdon, P. D., Donkers, B., Burdorf, A., & Mackenbach, J. P.
(2012). Comparison of Bayesian Random-Effects and Traditional Life Expectancy
Estimations in Small-Area Applications. American Journal of Epidemiology, 176(10),
929-937. https://doi.org/10.1093/aje/kws152
Kanaroglou, P. S., Maoh, H. F., Newbold, B., Scott, D. M., & Paez, A. (2009). A demographic
model for small area population projections: an application to the Census Metropolitan
Area of Hamilton in Ontario, Canada. Environment and Planning A: Economy and
Space, 41(4). 964-979. https://doi.org/10.1068/a40172
Keilman, N. (2018). Probabilistic demographic forecasts. Vienna Yearbook of Population
Research, 16, 25-36. https://doi.org/10.1553/populationyearbook2018s025
Keilman, N. (2020). Uncertainty in Population Forecasts for the Twenty-First Century. Annual
Review of Resource Economics, 12(1), 449-470. https://doi.org/10.1146/annurev-
resource-110319-114841
Leknes, S., & Løkken, S. A. (2020). Empirical Bayes estimation of local demographic rates. An
application using Norwegian registry data. Statistics Norway.

40
https://www.ssb.no/en/befolkning/artikler-og-publikasjoner/empirical-bayes-estimation-
of-local-demographic-rates
Li, H., & Hyndman, R. J. (2021). Assessing mortality inequality in the U.S.: What can be said
about the future? Insurance: Mathematics and Economics, 99, 152-162.
https://doi.org/https://doi.org/10.1016/j.insmatheco.2021.03.014
Li, N., & Lee, R. (2005). Coherent mortality forecasts for a group of populations: An extension
of the Lee-Carter method. Demography, 42(3), 575-594.
https://doi.org/10.1353/dem.2005.0021
Li, T., & Corcoran, J. (2011). Testing dasymetric techniques to spatially disaggregate the
regional population forecasts for South East Queensland. Journal of Spatial Science,
56(2), 203-221. https://doi.org/10.1080/14498596.2011.623343
Li, Y., Huang, C., Ding, L., Li, Z., Pan, Y., & Gao, X. (2019). Deep learning in bioinformatics:
Introduction, application, and perspective in the big data era. Methods, 166, 4-21.
https://doi.org/10.1016/j.ymeth.2019.04.008
Lomax, N., & Smith, A. (2017). Microsimulation for demography. Australian Population
Studies, 1(1), 73-85. https://doi.org/10.37970/aps.v1i1.14
Makridakis, S., Spiliotis, E., & Assimakopoulos, V. (2018). Statistical and Machine Learning
forecasting methods: Concerns and ways forward. PloS One, 13(3), e0194889.
https://doi.org/10.1371/journal.pone.0194889
Marois, G., & Bélanger, A. (2014). Microsimulation Model Projecting Small Area Populations
Using Contextual Variables: An Application to the Montreal Metropolitan Area, 2006-
2031. International Journal of Microsimulation, 7(1), 158-193.
https://doi.org/10.34196/ijm.00097
Marois, G., & Bélanger, A. (2015). Analyzing the impact of urban planning on population
distribution in the Montreal metropolitan area using a small-area microsimulation
projection model. Population and Environment, 37(2), 131-156.
https://doi.org/10.1007/s11111-015-0234-7
Marshall, A., & Simpson, L. (2009). Population sustainability in rural communities: The case of
two British national parks. Applied Spatial Analysis and Policy, 2(2), 107-127.
https://doi.org/10.1007/s12061-008-9017-1
Matthews, S. A., & Parker, D. M. (2013). Progress in spatial demography. Demographic
Research, 28, 271. https://doi.org/10.4054/DemRes.2013.28.10
Mazzuco, S., & Keilman, N. (Eds.) (2020). Developments in Demographic Forecasting:
Springer, Cham.
McKee, J. J., Rose, A. N., Bright, E. A., Huynh, T., & Bhaduri, B. L. (2015). Locally adaptive,
spatially explicit projection of US population for 2030 and 2050. Proceedings of the

41
National Academy of Sciences, 112(5), 1344-1349.
https://doi.org/10.1073/pnas.1405713112
Merkens, J. L., Reimann, L., Hinkel, J., & Vafeidis, A. T. (2016). Gridded population projections
for the coastal zone under the Shared Socioeconomic Pathways. Global and Planetary
Change, 145, 57-66. https://doi.org/10.1016/j.gloplacha.2016.08.009
Myers, D. (1990). Housing demography: Linking demographic structure and housing markets:
University of Wisconsin Press.
Nassif, A. B., Shahin, I., Attili, I., Azzeh, M., & Shaalan, K. (2019). Speech recognition using
deep neural networks: A systematic review. IEEE access, 7, 19143-19165.
https://doi.org/10.1109/ACCESS.2019.2896880
Nawaz, R., Rees, P., Clark, S., Mitchell, G., McDonald, A., Kalamandeen, M. Lambert, C., &
Henderson, R. (2019). Long-term projections of domestic water demand: a case study of
London and the Thames Valley. Journal of Water Resource Planning & Management,
2019, 145(11): 05019017. DOI: 10.1061/(ASCE)WR.1943-5452.0001088
Norman, P., Rees, P., & Boyle, P. (2003). Achieving data compatibility over space and time:
creating consistent geographical zones. International Journal of Population Geography
9(5), 365-386. https://doi.org/10.1002/ijpg.294
O’Neill, B., Kriegler, E., Riahi, K., Ebi, K., Hallegatte, S., Carter, T., Mathur, R., van Vuuren, D.
(2014). A new scenario framework for climate change research: the concept of shared
socioeconomic pathways. Climate Change 122, 387–400.
Openshaw, S., & Van Der Knaap, G. (1983). Small area population forecasting: some experience
with British models. Tijdschrift voor economische en sociale geografie, 74(4), 291-304.
https://doi.org/10.1111/j.1467-9663.1983.tb00976.x
Pearl, R., & Reed, L. J. (1920). On the rate of growth of the population of the United States since
1790 and its mathematical representation. Proceedings of the National Academy of
Sciences of the United States of America, 6(6), 275. https://doi.org/10.1073/pnas.6.6.275
Portland State University Population Research Center. (2015). Methods and Data for Developing
Coordinated Population Forecasts. Retrieved from
https://pdxscholar.library.pdx.edu/prc_pub/32/
Pritchett, H. S. (1891). A formula for predicting the population of the United States. Publications
of the American Statistical Association, 2(14), 278-286.
https://doi.org/10.1080/15225437.1891.10504009
QGSO. (2018). Queensland Government population projections, 2018 edition: Methodology and
assumptions. Queensland: Queensland Treasury Retrieved from
https://www.qgso.qld.gov.au/issues/2676/qld-government-population-projections-
methodology-assumptions-2018-edn.pdf

42
Raftery, A. E., Li, N., Ševčíková, H., Gerland, P., & Heilig, G. K. (2012). Bayesian probabilistic
population projections for all countries. Proceedings of the National Academy of
Sciences, 109(35), 13915-13921. https://doi.org/10.1073/pnas.1211452109
Rayer, S. (2008). Population Forecast Errors: A Primer for Planners. Journal of Planning
Education and Research, 27(4), 417-430. https://doi.org/10.1177/0739456x07313925
Rayer, S. (2015). Demographic Techniques: Small-area estimates and projections. In J. D Wright
(Ed.), International Encyclopedia of the Social & Behavioral Sciences (2nd ed., pp. 162-
169). Elsevier. https://doi.org/10.1016/B978-0-08-097086-8.31015-7
Rayer, S., & Smith, S. K. (2010). Factors affecting the accuracy of subcounty population
forecasts. Journal of Planning Education and Research, 30(2), 147-161.
https://doi.org/10.1177/0739456X10380056
Rayer, S., & Wang, Y. (2020). Projections of Florida Population by County, 2020–2045, with
Estimates for 2019. Bureau of Economic and Business Research, 53(186), 1 - 9.
Rayer, S., Smith, S. K., & Tayman, J. (2009). Empirical prediction intervals for county
population forecasts. Population Research and Policy Review, 28(6), 773.
https://doi.org/10.1007/s11113-009-9128-7
Raymer, J., Bonaguidi, A., & Valentini, A. (2006). Describing and projecting the age and spatial
structures of interregional migration in Italy. Population, Space and Place, 12(5), 371-
388. https://doi.org/10.1002/psp.414
Rees, P. (1994). Key issues in subnational projection models. University of Leeds, School of
Geography.
Rees, P., & Turton, I. (1998). Geocomputation: solving geographical problems with new
computing power. Environment and Planning A, 30, 1835-1838.
Rees, P., Clark, S., Wohland, P., & Kalamandeen, M. (2019). Evaluation of Sub-National
Population Projections: a Case Study for London and the Thames Valley. Applied Spatial
Analysis and Policy, 12(4), 797-829. https://doi.org/10.1007/s12061-018-9270-x
Rees, P., Norman, P., & Brown, D. (2004). A framework for progressively improving small area
population estimates. Journal of the Royal Statistical Society: Series A (Statistics in
Society), 167(1), 5-36. https://doi.org/10.1111/j.1467-985X.2004.00289.x
Rees, P., Wohland, R., Norman, P., & Lomax, N. (2015). Sub-national projection methods for
Scotland and Scottish areas: A review and recommendations. In A Consultancy for
National Records of Scotland, Edinburgh.
Reinhold, M., & Thomsen, S. L. (2015). Subnational population projections by age: An
evaluation of combined forecast techniques. Population Research and Policy Review,
34(4), 593-613. https://doi.org/10.1007/s11113-015-9362-0

43
Riiman, V., Wilson, A., Milewicz, R., & Pirkelbauer, P. (2019). Comparing Artificial Neural
Network and Cohort-Component Models for Population Forecasts. Population Review,
58(2), 100-116. https://doi.org/10.1353/prv.2019.0008
Scherbov, S., & Ediev, D. (2011). Significance of life table estimates for small populations:
Simulation-based study of standard errors. Demographic Research, 24(22), 527-550.
https://doi.org/10.4054/DemRes.2011.24.22
Schmertmann, C. P., & Hauer, M. E. (2019). Bayesian estimation of total fertility from a
population's age–sex structure. Statistical Modelling, 19(3), 225-247.
https://doi.org/10.1177/1471082X18801450
Schmertmann, C. P., Cavenaghi, S. M., Assunção, R. M., & Potter, J. E. (2013). Bayes plus
Brass: estimating total fertility for many small areas from sparse census data. Population
Studies, 67(3), 255-273. https://doi.org/10.1080/00324728.2013.795602
Schmitt, R. C., & Crosetti, A. H. (1951). Accuracy of the ratio method for forecasting city
population. Land Economics, 27(4), 346-348. https://doi.org/10.2307/3159671
Shang, H. L., & Booth, H. (2020). Synergy in fertility forecasting: improving forecast accuracy
through model averaging. Genus, 76(1), 1-23. https://doi.org/10.1186/s41118-020-00099-
y
Silver, D., Hubert, T., Schrittwieser, J., Antonoglou, I., Lai, M., Guez, A., . . . Hassabis, D.
(2018). A general reinforcement learning algorithm that masters chess, shogi, and Go
through self-play. Science, 362(6419), 1140-1144.
https://doi.org/10.1126/science.aar6404
Simpson, L. (2002). Geography conversion tables: a framework for conversion of data between
geographical units. International Journal of Population Geography, 8(1), 69-82.
https://doi.org/10.1002/ijpg.235
Simpson, L. (2017). Integrated local demographic forecasts constrained by the supply of housing
or jobs: Practice in the UK. In Swanson, D. A. (ed.) The Frontiers of Applied
Demography (pp. 329-350): Springer.
Simpson, L., & Snowling, H. (2011). Estimation of local demographic variation in a flexible
framework for population projections. Journal of Population Research, 28(2-3), 109-127.
https://doi.org/10.1007/s12546-011-9060-7
Smith, S. K. (1987). Tests of forecast accuracy and bias for county population projections.
Journal of the American Statistical Association, 82(400), 991-1003.
https://doi.org/10.1080/01621459.1987.10478528
Smith, S. K., & Shahidullah, M. (1995). An evaluation of population projection errors for census
tracts. Journal of the American Statistical Association, 90(429), 64-71.
https://doi.org/10.1080/01621459.1995.10476489

44
Smith, S. K., Tayman, J., & Swanson, D. A. (2013). A Practitioner’s Guide to State and Local
Population Projections. Springer.
Statistics Netherlands. (2020). Forecast: Population growth unabated in the next 50 years.
Retrieved from https://www.cbs.nl/en-gb/news/2020/51/forecast-population-growth-
unabated-in-the-next-50-years
Statistics New Zealand. (2020). National population projections: 2020(base)–2073. Retrieved
from https://www.stats.govt.nz/information-releases/national-population-projections-
2020base2073
Stimson, R., Bell, M., Corcoran, J., & Pullar, D. (2012). Using a large scale urban model to test
planning scenarios in the Brisbane‐South East Queensland region. Regional Science
Policy & Practice, 4(4), 373-392. https://doi.org/10.1111/j.1757-7802.2012.01082.x
Striessnig, E., Gao, J., O’Neill, B. C., & Jiang, L. (2019). Empirically based spatial projections
of US population age structure consistent with the shared socioeconomic pathways.
Environmental Research Letters, 14(11), 114038. https://doi.org/10.1088/1748-
9326/ab4a3a
Swanson, D. A., & Tayman, J. (2012). Housing Unit Method. In Subnational Population
Estimates (pp. 137-163). Springer.
Swanson, D. A., & Tayman, J. (2014). Measuring uncertainty in population forecasts: a new
approach. In M. Marsili & G. Capacci (Eds.) Proceedings of the 6th Eurostat/UNECE
Work Session on Demographic Projections (pp. 203-215). National Institute of Statistics,
Rome, Italy.
Swanson, D. A., Schlottmann, A., & Schmidt, B. (2010). Forecasting the population of census
tracts by age and sex: An example of the Hamilton–Perry method in action. Population
Research and Policy Review, 29(1), 47-63. https://doi.org/10.1007/s11113-009-9144-7
Tanton, R. (2014). A review of spatial microsimulation methods. International Journal of
Microsimulation, 7(1), 4-25.
Tanton, R., & Edwards, K. (2013). Spatial Microsimulation: A Reference Guide for Users (Vol.
6): Springer Science & Business Media.
Tayman, J. (2011). Assessing uncertainty in small area forecasts: State of the practice and
implementation strategy. Population Research and Policy Review, 30(5), 781-800.
https://doi.org/10.1007/s11113-011-9210-9
Tayman, J., & Swanson, D. A. (2017). Using modified cohort change and child-woman ratios in
the Hamilton–Perry forecasting method. Journal of Population Research, 34(3), 209-231.
https://doi.org/10.1007/s12546-017-9190-7
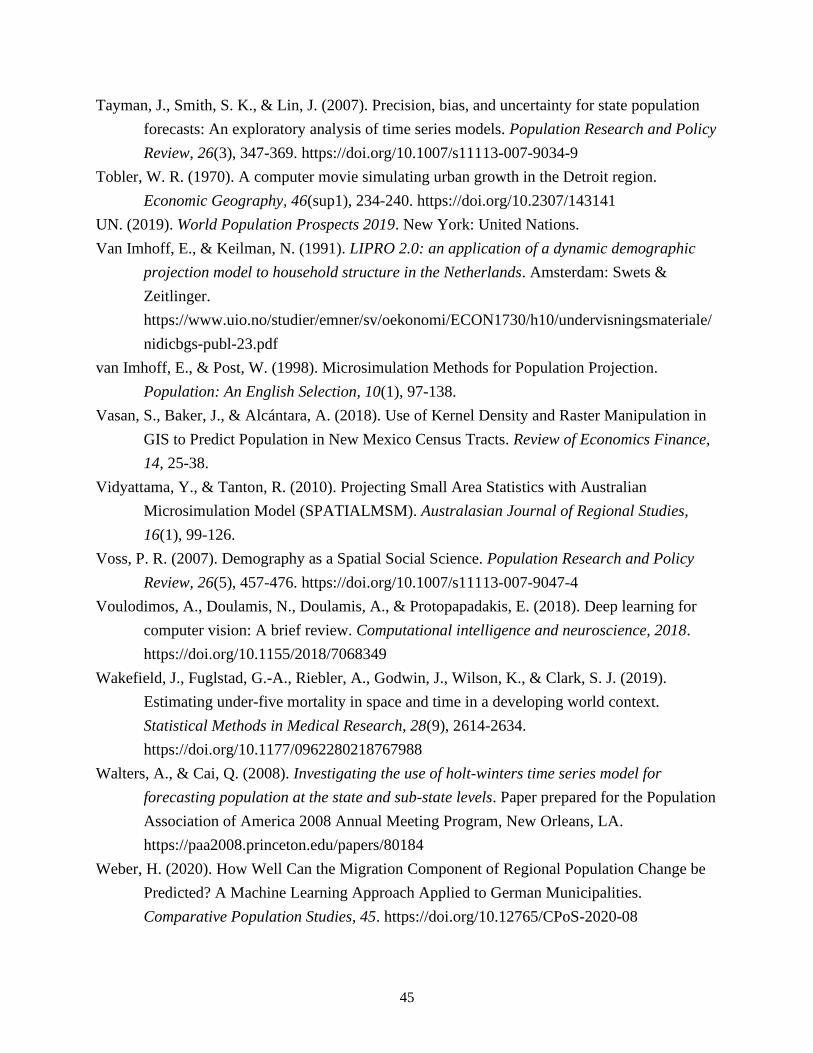
45
Tayman, J., Smith, S. K., & Lin, J. (2007). Precision, bias, and uncertainty for state population
forecasts: An exploratory analysis of time series models. Population Research and Policy
Review, 26(3), 347-369. https://doi.org/10.1007/s11113-007-9034-9
Tobler, W. R. (1970). A computer movie simulating urban growth in the Detroit region.
Economic Geography, 46(sup1), 234-240. https://doi.org/10.2307/143141
UN. (2019). World Population Prospects 2019. New York: United Nations.
Van Imhoff, E., & Keilman, N. (1991). LIPRO 2.0: an application of a dynamic demographic
projection model to household structure in the Netherlands. Amsterdam: Swets &
Zeitlinger.
https://www.uio.no/studier/emner/sv/oekonomi/ECON1730/h10/undervisningsmateriale/
nidicbgs-publ-23.pdf
van Imhoff, E., & Post, W. (1998). Microsimulation Methods for Population Projection.
Population: An English Selection, 10(1), 97-138.
Vasan, S., Baker, J., & Alcántara, A. (2018). Use of Kernel Density and Raster Manipulation in
GIS to Predict Population in New Mexico Census Tracts. Review of Economics Finance,
14, 25-38.
Vidyattama, Y., & Tanton, R. (2010). Projecting Small Area Statistics with Australian
Microsimulation Model (SPATIALMSM). Australasian Journal of Regional Studies,
16(1), 99-126.
Voss, P. R. (2007). Demography as a Spatial Social Science. Population Research and Policy
Review, 26(5), 457-476. https://doi.org/10.1007/s11113-007-9047-4
Voulodimos, A., Doulamis, N., Doulamis, A., & Protopapadakis, E. (2018). Deep learning for
computer vision: A brief review. Computational intelligence and neuroscience, 2018.
https://doi.org/10.1155/2018/7068349
Wakefield, J., Fuglstad, G.-A., Riebler, A., Godwin, J., Wilson, K., & Clark, S. J. (2019).
Estimating under-five mortality in space and time in a developing world context.
Statistical Methods in Medical Research, 28(9), 2614-2634.
https://doi.org/10.1177/0962280218767988
Walters, A., & Cai, Q. (2008). Investigating the use of holt-winters time series model for
forecasting population at the state and sub-state levels. Paper prepared for the Population
Association of America 2008 Annual Meeting Program, New Orleans, LA.
https://paa2008.princeton.edu/papers/80184
Weber, H. (2020). How Well Can the Migration Component of Regional Population Change be
Predicted? A Machine Learning Approach Applied to German Municipalities.
Comparative Population Studies, 45. https://doi.org/10.12765/CPoS-2020-08
46
White, H. R. (1954). Empirical study of the accuracy of selected methods of projecting state
populations. Journal of the American Statistical Association, 49(267), 480-498.
https://doi.org/10.1080/01621459.1954.10483516
Wilson, T. (2011). A review of sub-regional population projection methods. Queensland Centre
for Population Research, The University of Queensland.
Wilson, T. (2014). Simplifying Local Area Population and Household Projections with
POPART. In M. N. Hoque & L. B. Potter (Eds.), Emerging Techniques in Applied
Demography (pp. 25-38). Springer Netherlands. http://dx.doi.org/10.1007/978-94-017-
8990-5_3
Wilson, T. (2015). New evaluations of simple models for small area population forecasts.
Population, Space and Place, 21(4), 335-353. https://doi.org/10.1002/psp.1847
Wilson, T. (2016). Evaluation of alternative cohort-component models for local area population
forecasts. Population Research Policy Review, 35(2), 241-261.
https://doi.org/10.1007/s11113-015-9380-y
Wilson, T. (2017a). A checklist for reviewing draft population projections. Charles Darwin
University. https://researchers.cdu.edu.au/en/publications/a-checklist-for-reviewing-draft-
population-projections
Wilson, T. (2017b). Does averaging yield more accurate local and regional population forecasts?
Applied Spatial Analysis and Policy, 10(4), 497-513. https://doi.org/10.1007/s12061-016-
9194-2
Wilson, T. (2018). Communicating population forecast uncertainty using perishable food
terminology. Research Briefs, (RB03/2018), 1-15.
http://www.cdu.edu.au/sites/default/files/research-brief-2018-03_0.pdf
Wilson, T., & Bell, M. (2007). Probabilistic regional population forecasts: The example of
Queensland, Australia. Geographical Analysis, 39(1), 1-25.
https://doi.org/10.1111/j.1538-4632.2006.00693.x
Wilson, T., & Rees, P. (2005). Recent developments in population projection methodology: A
review. Population, Space and Place, 11(5), 337-360. https://doi.org/10.1002/psp.389
Wilson, T., & Rowe, F. (2011). The forecast accuracy of local government area population
projections: a case study of Queensland. The Australasian Journal of Regional Studies,
17(2), 204-243
Wilson, T., & Shalley, F. (2019). Subnational population forecasts: Do users want to know about
uncertainty? Demographic Research, 41, 367-392.
https://doi.org/10.4054/DemRes.2019.41.13

47
Wilson, T., Brokensha, H., Rowe, F., & Simpson, L. (2018). Insights from the evaluation of past
local area population forecasts. Population Research Policy Review, 37(1), 137-155.
https://doi.org/10.1007/s11113-017-9450-4
Wisniowski, A., & Raymer, J. (2016). Bayesian multiregional population forecasting: England.
Joint Eurostat/UNECE Work Session on Demographic Projections, Geneva, 18-20.
Wu, B. M., Birkin, M. H., & Rees, P. H. (2011). A Dynamic MSM With Agent Elements for
Spatial Demographic Forecasting. Social Science Computer Review, 29(1), 145-160.
https://doi.org/10.1177/0894439310370113
Wu, B., & Birkin, M. (2013). Moses: A Dynamic Spatial Microsimulation Model for
Demographic Planning. In R. Tanton & K. Edwards (Eds.), Spatial Microsimulation: A
Reference Guide for Users (pp. 171-193). Springer Netherlands.
Wu, Y., Schuster, M., Chen, Z., Le, Q., Macherey, W., Krikun, M.,Cao, Y., Gao, Q., Macherey,
K., Klingner, J., Shah, A., Johnson, M., Liu, X., Kaiser, Ł., Gouws, S., Kato, Y., Kudo,
T., Kazawa, H., Stevens, K., . . . Dean, J. (2016). Google's Neural Machine Translation
System: Bridging the Gap between Human and Machine Translation. arXiv preprint,
https://arxiv.org/abs/1609.08144.
Xanthos, G., Ladias, C. A., & Genitsaropoulos, C. (2013). A method for forecasting population
changes in alpine, semi-alpine and lowland communities of Epirus region in Greece.
Regional Science Inquiry Journal, 1, 173-179.
Zhang, J. L., & Bryant, J. (2020). Bayesian disaggregated forecasts: internal migration in
Iceland. In S. Mazzuco, & N. Keilman (Eds.), Developments in Demographic
Forecasting (pp. 193-215). Springer. https://doi.org/10.1007/978-3-030-42472-5_10
Zoraghein, H., & O’Neill, B. C. (2020b). US State-level Projections of the Spatial Distribution of
Population Consistent with Shared Socioeconomic Pathways. Sustainability, 12(8), 3374.
https://doi.org/10.3390/su12083374
Zoraghein, H., & O'Neill, B. C. (2020a). A spatial population downscaling model for integrated
human-environment analysis in the United States. Demographic Research, 43, 1563-
1606. https://doi.org/10.4054/DemRes.2020.43.54

48
Supplementary Information
Table A: Annotated bibliography of papers on small area population forecasting methods
Reference and URL Key points
Alexander, M., Zagheni, E., &
Barbieri, M. (2017). A Flexible
Bayesian Model for Estimating
Subnational Mortality. Demography,
54(6), 2025-2041.
https://doi.org/10.1007/s13524-017-
0618-7
A Bayesian modelling framework is presented to estimate
age-specific mortality rates at the subnational level. The
model incorporates principal components derived from
model mortality schedules into a time series framework,
allowing for pooling of information across space and time.
Alonso González, M. L., Fernández
Vázquez, E., & Rubiera Morollón, F.
(2015). A methodological note for
local demographic projections: A shift-
share analysis to disaggregate official
aggregated estimations. Revista
Electrónica de Comunicaciones y
Trabajos de Asepuma, 16(1), 43-50.
http://www.revistarecta.com/n16.html
An adapted shift-share method to disaggregate regional
age-sex-specific population forecasts to local areas is
proposed. Local area projected population growth is a
function of regional total population growth (regional
effect), regional change by age group (age effect), and local
area age-specific growth (local effect). The method is
relatively simple, has modest data requirements, and
ensures local forecasts sum to the regional projection.
Example forecasts for small areas within the Asturias
region of Spain are presented.
Anson, J. (2018). Estimating local
mortality tables for small areas: An
application using Belgian sub-
arrondissements. Revue
Quetelet/Quetelet Journal, 6(1), 73-97.
https://doi.org/10.14428/rqj2018.06.01.
04
A multilevel model for subnational mortality rates is
described, estimated on the basis of national rates and local
overall mortality (Standardised Mortality Ratios) and social
conditions (household structure, education, urban/rural, and
region). The estimation method is applied to 87 areas of
Belgium to construct age- and sex-specific mortality rates.
The authors find that these rates can be reliably estimated
on the basis of local social conditions thus enabling valid
life tables to be estimated for small area populations.
Assunção, R. M., Schmertmann, C. P.,
Potter, J. E., & Cavenaghi, S. M.
(2005). Empirical Bayes estimation of
demographic schedules for small areas.
Demography, 42(3), 537-558.
https://doi.org/doi.org/10.1353/dem.20
05.0022
Age-specific fertility rates are estimated for small areas in
Brazil. The authors devise an Empirical Bayes approach
which borrows information from nearby areas more than
distant areas and from age-specific rates which are strongly
correlated across areas. Almost all fertility age schedules
are found to be plausible and sensible.

49
Reference and URL Key points
Athukorala, W., Neelawela, P., Wilson,
C., Miller, E., Sahama, T., Grace, P.,
Hefferan, M., Dissanayake, P., &
Manawadu, O. (2010). Forecasting
Population Changes and Service
Requirements in the Regions: A Study
of Two Regional Councils in
Queensland, Australia. Economic
Analysis and Policy, 40(3), 327-349.
https://doi.org/10.1016/S0313-
5926(10)50033-X
ARIMA models are applied to forecast the total populations
of two council areas in Queensland, Australia. Population
data over a base period of 1946 to 2009 is used to forecast
out to 2025. Also presented are 95% prediction intervals
(which appear to be very narrow). Then forecasts are
prepared for sub-regions of each council “by using the
average population share of each sub-region”. The authors
describe their approach as “verifiable, transparent, and easy
to comprehend” and view it as “more theoretically sound
than the cohort-component method of population
forecasting”.
Baker, J., Ruan, X., Alcantara, A.,
Jones, T., Watkins, K., McDaniel, M.,
Frey, M., Crouse, N., Rajbhandari, R.,
Morehouse, J., Sanchez, J., Inglis, M.,
Baros, S., Penman, S., Morrison, S.,
Budge, T., & Stallcup, W. (2008).
Density-dependence in urban housing
unit growth: An evaluation of the
Pearl-Reed model for predicting
housing unit stock at the census tract
level. Journal of Economic and Social
Measurement, 33(2-3), 155-163.
https://doi.org/10.3233/JEM-2008-
0301
The authors are interested in the housing-unit model to
forecast small area populations, and in this paper they focus
on the dwelling component of the model. They apply the
Pearl-Reed logistic curve to forecast dwelling growth in
urban census tracts in Bernalillo County, New Mexico,
USA. The base period covers 1990-2000 and forecasts are
made out to 2007. It is concluded that “overall, the Pearl-
Reed model performed remarkably well in predicting
housing unit stocks at the census tract level in this study.”
Baker, J., Alcantara, A., Ruan, X.,
Watkins, K., & Vasan, S. (2013) A
comparative evaluation of error and
bias in census tract-level age/sex-
specific population estimates:
Component I (Net-Migration) vs
Component III (Hamilton–Perry).
Population Research and Policy
Review 32(6), 919-942.
https://doi.org/10.1007/s11113-013-
9295-4
Although labelled as population ‘estimates’, the authors
effectively created small area age-sex population forecasts
using two methods. They were: the Component I method
(cohort-component with net migration) and the Component
III method (Hamilton-Perry). Forecasts for census tracts in
selected New Mexico counties were produced for 2010
from a 2000 jump-off date with constraining to total 2010
county population estimates. Over the 10 year forecast
horizon, MedAPEs for census tract total populations were
28.4% for Component I and 26.1% for Component III.

50
Reference and URL Key points
Baker, J., Alcántara, A., Ruan, X.,
Watkins, K., & Vasan, S. (2014).
Spatial weighting improves accuracy in
small-area demographic forecasts of
urban census tract populations. Journal
of Population Research, 31(4), 345-
359.
https://doi.org/10.1007/s12546-014-
9137-1
The process for creating population forecasts by age and
sex for 221 urban census tracts in New Mexico, USA, is
described. The forecasts were created by a Hamilton-Perry
shortcut cohort model, which gave the first set of
projections, and then two types of spatial weighting were
applied to the initial forecasts to create two more sets. The
spatial weighting involved averaging initial projections for
each census tract with those of its neighbours – as defined
by rook and queen contiguity matrices. Forecasts were
prepared for 2000-2010 and then evaluated against 2010
Census data. The spatially-weighted forecasts proved more
accurate than those from the regular Hamilton-Perry model
across most age groups.
Baker, J., Swanson, D., & Tayman, J.
(2020). The Accuracy of Hamilton–
Perry Population Projections for
Census Tracts in the United States.
Population Research and Policy
Review, 1-14.
https://doi.org/10.1007/s11113-020-
09601-y
The paper reports an evaluation of the Hamilton-Perry
model applied to about 65,000 census tracts across the
USA. A base period of 1990-2000 is used to estimate
cohort change ratios and forecasts are produced out to 2010.
5 year age groups and intervals are used, with 0-4 and 5-9
populations forecast using child/adult ratios from the jump-
off year. Two sets of forecasts are produced: (i)
uncontrolled and (ii) controlled to total populations forecast
using linear extrapolation. The authors find that controlling
the forecasts “creates noticeable reductions in the MAPEs
in every age group for both males and females”.
Ballas, D., Clarke, G. P., & Wiemers,
E. (2005). Building a dynamic spatial
microsimulation model for Ireland.
Population, Space and Place, 11(3),
157-172.
https://doi.org/10.1002/psp.359
The authors describe the development of SMILE, a
dynamic small area microsimulation projection model for
Ireland. It is based on a geography of small area District
Electoral Divisions. Input data includes simulated small
area base period microdata, containing socio-economic
attributes for individuals in each small area, as well as
assumptions about fertility, mortality and internal
migration. The model was run to produce forecasts for1996
and 2002.
Boke-Olén, N., Abdi, A. M., Hall, O.,
& Lehsten, V. (2017). High-resolution
African population projections from
radiative forcing and socio-economic
models, 2000 to 2100. Scientific data,
4(1), 1-9.
https://doi.org/10.1038/sdata.2016.130
The authors describe the creation of a high-resolution
annual gridded population forecasts for the whole of Africa
for every year from 2000 to 2100. They used a geography
of 30 arc second grid squares (about 1 km2 at the equator).
Forecasts were created by disaggregating country-level
population projections from the Shared Socioeconomic
Pathways database at the International Institute for Applied
Systems Analysis (IIASA) in combination with land use
projections that follow the representative concentration
pathways. The disaggregation process used data on roads,
water bodies, country borders, and distance to urban
centres.

51
Reference and URL Key points
Breidenbach, P., Kaeding, M., &
Schaffner, S. (2019). Population
projection for Germany 2015–2050 on
grid level (RWI-GEO-GRID-POP-
Forecast). Jahrbücher für
Nationalökonomie und Statistik,
239(4), 733-745.
https://doi.org/10.1515/jbnst-2017-
0149
The paper reports how population forecasts by age and sex
for 1 km2 grid squares were prepared for Germany for the
period 2015 to 2050. A cohort-component model with net
migration numbers was used and applied to each grid
square. Mortality rates were derived from a Lee-Carter
model fitted at the national scale with national mortality
rates used for each small area. Net international migration
was distributed to grid squares according to the population
distribution and has a fixed age structure. Net internal
migration was set to zero. Fertility was assumed to rise a
little in the future. County-specific age-specific fertility
rates were applied to grid squares, with spatial fertility
differentials maintained over time.
Bryant, J., & Zhang, J. L. (2016).
Bayesian forecasting of demographic
rates for small areas: emigration rates
by age, sex, and region in New
Zealand, 2014-2038. 1337-1363.
https://doi.org/10.5705/ss.2014.200t
The authors develop a Bayesian hierarchical model to
estimate and forecast emigration rates by region in New
Zealand. The model deals with small sample sizes by taking
advantage of regularities in migration rates by age, sex,
time and region. The authors also develop an approach to
deal with missing data and changing geographic
boundaries.
Bryant, J., R. , & Graham, P., J.
(2013). Bayesian Demographic
Accounts: Subnational Population
Estimation Using Multiple Data
Sources. Bayesian Analysis, 8(3), 591-
622.
https://doi.org/10.1214/13-BA820
The authors provide a Bayesian framework which supports
the disaggregated estimation of the components of
population change, with detail on region, sex, age, and time.
They apply this approach to subnational regions of New
Zealand, with consideration to seven components of
population change: births, deaths, internal in and out
migration and external in- and out- migration. Multiple data
sources were used to develop their model, including both
census and administrative data (e.g. tax system data, school
enrolments, electoral roll). Estimates and forecasts for a
subset of model outputs are presented.
Cameron, M. P., & Cochrane, W.
(2017). Using land-use modelling to
statistically downscale population
projections to small areas. Australasian
Journal of Regional Studies, 23(2),
195.
https://www.anzrsai.org/assets/Uploads
/PublicationChapter/AJRS-23.2-pages-
195-to-216.pdf
The paper explains how population forecasts for area units
(populations generally between 1,500 and 3,000) were
prepared for the Waikato region of New Zealand. Forecasts
for larger regions (territorial authorities) created by cohort-
component models were distributed to area units via the
Waikato Integrated Scenario Explorer (WISE), a detailed
land-use projection model. Several regression models were
fitted to distribute non-residential population, with
residential populations based on the land use change model.
A short-term out-of-sample test forecast compared forecasts
with those of two simple models, finding the authors’
forecasts were competitive with one of the simple models
and had only marginally higher errors than the other.
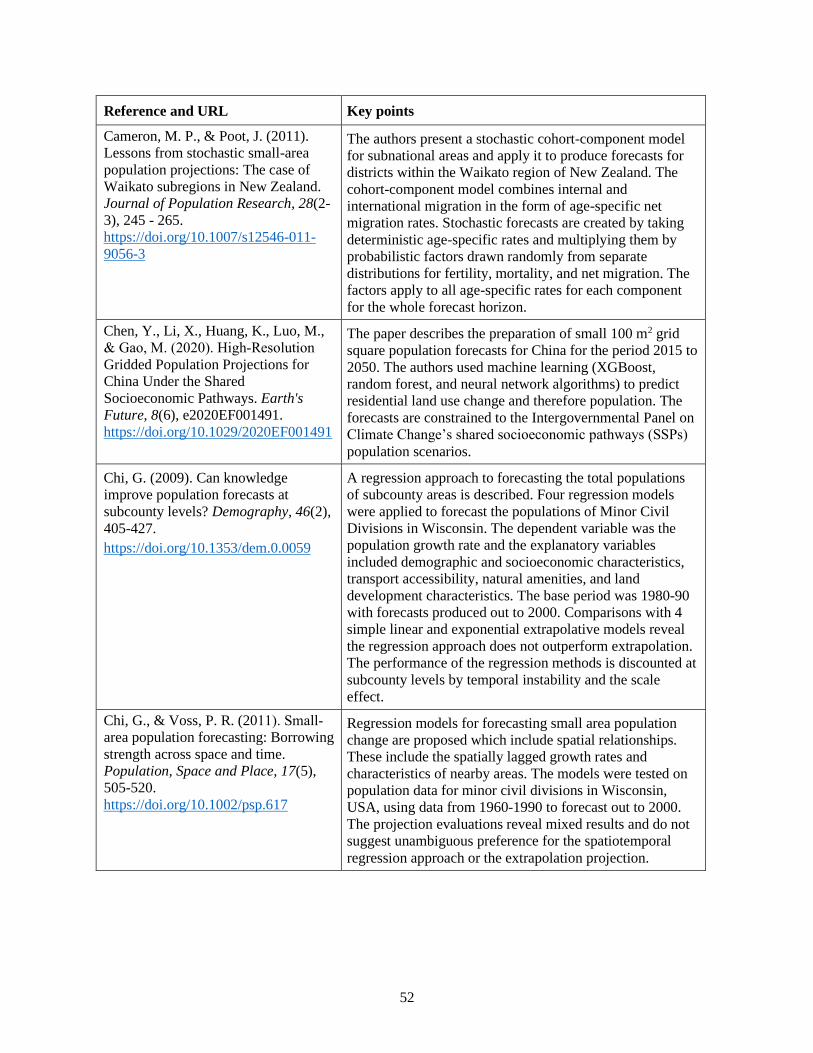
52
Reference and URL Key points
Cameron, M. P., & Poot, J. (2011).
Lessons from stochastic small-area
population projections: The case of
Waikato subregions in New Zealand.
Journal of Population Research, 28(2-
3), 245 - 265.
https://doi.org/10.1007/s12546-011-
9056-3
The authors present a stochastic cohort-component model
for subnational areas and apply it to produce forecasts for
districts within the Waikato region of New Zealand. The
cohort-component model combines internal and
international migration in the form of age-specific net
migration rates. Stochastic forecasts are created by taking
deterministic age-specific rates and multiplying them by
probabilistic factors drawn randomly from separate
distributions for fertility, mortality, and net migration. The
factors apply to all age-specific rates for each component
for the whole forecast horizon.
Chen, Y., Li, X., Huang, K., Luo, M.,
& Gao, M. (2020). High‐Resolution
Gridded Population Projections for
China Under the Shared
Socioeconomic Pathways. Earth's
Future, 8(6), e2020EF001491.
https://doi.org/10.1029/2020EF001491
The paper describes the preparation of small 100 m2 grid
square population forecasts for China for the period 2015 to
2050. The authors used machine learning (XGBoost,
random forest, and neural network algorithms) to predict
residential land use change and therefore population. The
forecasts are constrained to the Intergovernmental Panel on
Climate Change’s shared socioeconomic pathways (SSPs)
population scenarios.
Chi, G. (2009). Can knowledge
improve population forecasts at
subcounty levels? Demography, 46(2),
405-427.
https://doi.org/10.1353/dem.0.0059
A regression approach to forecasting the total populations
of subcounty areas is described. Four regression models
were applied to forecast the populations of Minor Civil
Divisions in Wisconsin. The dependent variable was the
population growth rate and the explanatory variables
included demographic and socioeconomic characteristics,
transport accessibility, natural amenities, and land
development characteristics. The base period was 1980-90
with forecasts produced out to 2000. Comparisons with 4
simple linear and exponential extrapolative models reveal
the regression approach does not outperform extrapolation.
The performance of the regression methods is discounted at
subcounty levels by temporal instability and the scale
effect.
Chi, G., & Voss, P. R. (2011). Small‐
area population forecasting: Borrowing
strength across space and time.
Population, Space and Place, 17(5),
505-520.
https://doi.org/10.1002/psp.617
Regression models for forecasting small area population
change are proposed which include spatial relationships.
These include the spatially lagged growth rates and
characteristics of nearby areas. The models were tested on
population data for minor civil divisions in Wisconsin,
USA, using data from 1960-1990 to forecast out to 2000.
The projection evaluations reveal mixed results and do not
suggest unambiguous preference for the spatiotemporal
regression approach or the extrapolation projection.

53
Reference and URL Key points
Chi, G., & Wang, D. (2017). Small-
area population forecasting: a
geographically weighted regression
approach. In D. A. Swanson (Ed.), The
frontiers of applied demography (pp.
449-471). Springer.
https://doi.org/10.1007/978-3-319-
43329-5_21
The authors propose a geographically-weighted regression
(GWR) model to forecast the total populations of small
areas. It was applied to forecast the populations of Minor
Civil Divisions in Wisconsin from 2000 to 2010 using a
base period of 1990-2000. There were 33 explanatory
variables; the dependent variable was population growth.
The GWR model was compared to 4 simple linear and
exponential forecasts. The GWR method provides a novel
estimation of the relationships between population change
and its driving factors, but it underperforms traditional
extrapolation forecasts.
Chi, G., Zhou, X., & Voss, P. R.
(2011). Small-area population
forecasting in an urban setting: a
spatial regression approach. Journal of
Population Research, 28(2-3), 185-
201.
https://doi.org/10.1007/s12546-011-
9053-6
The authors report tests of the 3 types of spatial regression
models of Chi & Voss (2011) to forecast the total
populations of census tracts in Milwaukee, Wisconsin. The
dependent variable was the population growth rate and
explanatory variables comprised a range of demographic,
socioeconomic, and local area characteristics. Forecasts
were produced for 1990-2000 using data from 1980-90.
Compared to 4 linear and exponential extrapolations, Mean
Absolute Percentage Errors were found to be slightly lower
for the 3 spatial regression models.
Congdon, P. (2009). Life expectancies
for small areas: A Bayesian random
effects methodology. International
Statistical Review, 77(2), 222-240.
https://doi.org/10.1111/j.1751-
5823.2009.00080.x
Congdon discusses the advantages of modelling age-
specific mortality rates in small areas using a Bayesian
random effects strategy. The model set up includes random
effects by age, sex and group and allows for correlation
between groups. The modelling strategy was applied to
wards in Eastern England.
Congdon, P. (2014). Estimating life
expectancies for US small areas: a
regression framework. Journal of
Geographical Systems, 16(1), 1-18.
https://doi.org/10.1007/s10109-013-
0177-4
Conventional analyses of small area life expectancies in the
US often require the amalgamation of counties, and do not
take correlations between adjacent ages or areas into
account. The author proposes a method based on a
structured random effects model, which incorporates these
age and area effects. A regression extension allows area
characteristics - such as the ethnic mix, urban-rural level
and socio-economic indices - to be considered. It requires
minimal amalgamation of counties, producing life
expectancy estimates for almost the entire set of counties.
This method was applied to data from US counties to
produce stable life expectancy estimates.

54
Reference and URL Key points
Dittgen, A., & Dutreuilh, C. (2005).
Housing and household size in local
population dynamics. Population
(English Edition, 2002-), 60(3), 259-
298.
https://doi.org/10.2307/4148195
The authors emphasise the relationship between local
populations and housing. Dwelling size influences
household size and age structure. Population forecasts were
prepared for Paris using a cohort-component model which
accounts for fertility, mortality and migration, but has an
additional component for the private household population.
“The population of the additional dwellings that become
available during each 5-year period are added at the end of
each period. To determine this population, the number of
dwellings in question is multiplied by an appropriate
average household size and the result is then broken down
using an appropriate age-sex structure”.
Dockery, A. M., Harris, M. N.,
Holyoak, N., & Singh, R. B. (2020). A
methodology for projecting sparse
populations and its application to
remote Indigenous communities.
Journal of Geographical Systems, 1-
25.
https://doi.org/10.1007/s10109-020-
00329-z
The authors propose a model that is effectively a version of
the Hamilton-Perry cohort change model in which the
population is projected by 5 year age groups and intervals
using cohort change numbers (not ratios). The aim is to be
able to cope with sparse data for very small populations.
Cohort change is projected with a regression model which
uses a range of demographic, social and geographic
variables. A regression model is also used to project the
number of 0-4 year olds, based on population numbers in
older childhood ages. The method was applied to produce
short-term projections of local Indigenous populations by
age and sex in regional and remote parts of Australia.
Dyrting, S. (2020). Smoothing
migration intensities with P-TOPALS.
Demographic Research, 43, 1527-
1570.
https://doi.org/10.4054/DemRes.2020.
43.55
The author introduces a P-TOPALS model framework to
estimate age-specific migration schedules. The framework
combines the classical TOPALS approach, which assumes
an age schedule can be represented as a combination of an
age standard and a spline. Dyrting extends this framework
to estimate the splines using a penalised-spline approach,
which controls the smoothness of the fit with a single
parameter. The method is illustrated on internal migration
rates in the Northern Territory, Australia, across a range of
different population sizes.
Foss, W. (2002). Small area population
forcasting. The Appraisal Journal,
70(2), 163.
[No URL]
The paper is an accessible guide to the housing-unit method
and several extrapolation methods for small area total
population forecasts. No new methods are introduced.
Example forecasts are presented.

55
Reference and URL Key points
Franzén, M., & Karlsson, T. (2010, 28-
30 April). Using national data to
obtain small area estimators for
population projections on sub-national
level [Paper presentation]. Conference
of European Statisticians, Lisbon,
Portugal.
https://www.unece.org/fileadmin/DAM
/stats/documents/ece/ces/ge.11/2010/sp
.2.e.pdf
The authors propose that migration age-specific input data
for small area cohort-component forecasts be created by
applying national-level data for specific dwelling types. The
assumption is that people living in certain dwelling
type/tenure categories share the same demographic
characteristics throughout the country. Data from the
Swedish population register and real estate register and
cluster analysis was used to identify suitable dwelling types
(33 groups in total). For small area forecasts, the authors
suggest weighting the age profiles by the population
composition of each area.
Gonzaga, M. R., & Schmertmann, C.
P. (2016). Estimating age-and sex-
specific mortality rates for small areas
with TOPALS regression: an
application to Brazil in 2010. Revista
Brasileira de Estudos de População,
33(3), 629-652.
https://doi.org/10.20947/S0102-
30982016c0009
In this paper the authors develop a method to estimate small
area age- and sex-specific mortality rates, based on the
TOPALS relational model. They applied this method to
data from small area in Brazil in 2010. This method may be
helpful for making undercount adjustments in small areas
with incomplete death registrations.
Gullickson, A., & Moen, J. (2001). The
use of stochastic methods in local area
population forecasts [Paper
presentation].The annual meeting of
the Population Association of America,
Washington DC.
[No URL]
The authors present probabilistic population forecasts for
one county in Minnesota and the rest of the State. The TFR
is forecast with a random walk with drift model; mortality
is forecast using a Lee-Carter model; net migration is
modelled by randomly sampling from recent crude net
migration rates. Probabilistic forecasts are created by
running a cohort-component model 1,000 times. The
authors applied the model to produce a probabilistic
forecast of trauma cases at a major hospital in Minneapolis.
Hachadoorian, L., Gaffin, S. R., &
Engelman, R. (2011). Projecting a
gridded population of the world using
ratio methods of trend extrapolation. In
R. P. Cincotta, & L. J. Gorenflo (Eds.)
Human Population: Its Influences on
Biological Diversity (pp. 13-25).
Springer-Verlag Berlin Heidelberg.
https://www.springer.com/gp/book/978
3642167065
The authors describe how population forecasts for small
grid squares of the World were prepared using 2 models:
(1) a projected share of national population (shift-share)
model, and (2) and a share of national growth model. Both
models produced some negative populations. A combined
model uses share-of-growth for most countries, and shift-
share for countries where population growth/decline
reverses direction between the base period and the
projection period. Jump-off year populations were obtained
from the Gridded Population of the World dataset and
forecasts were produced for the period 1995-2025. National
projections were those of the UN Population Division.
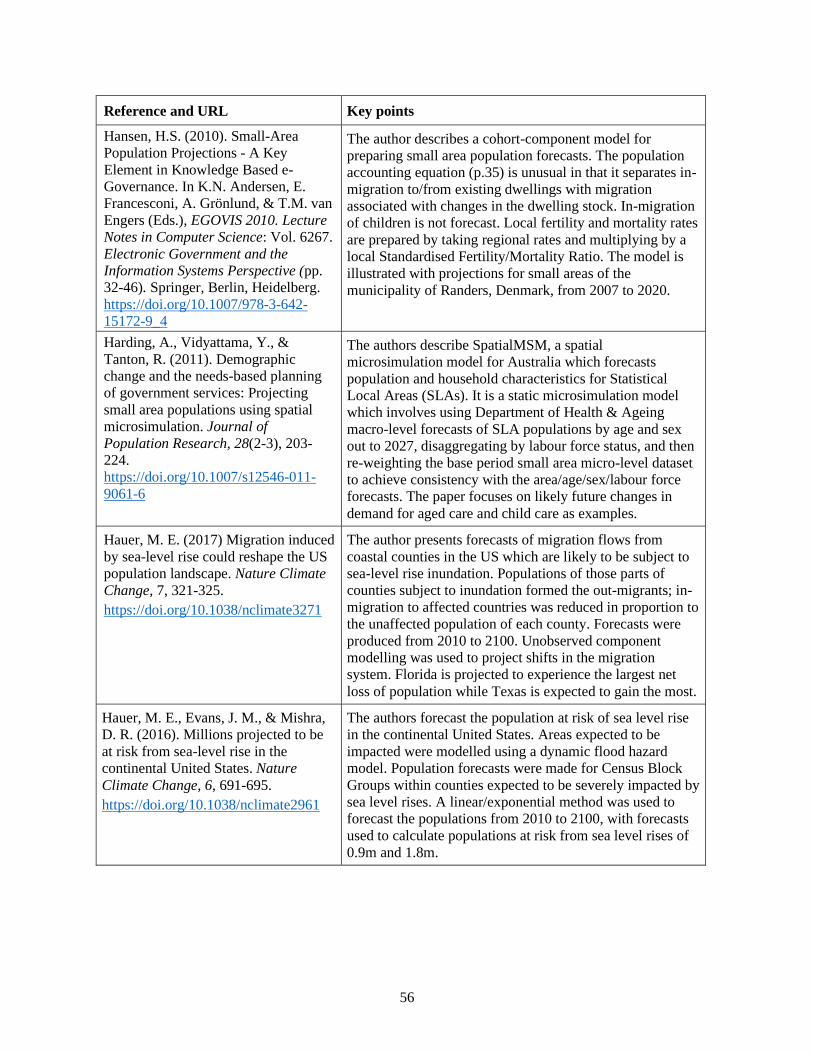
56
Reference and URL Key points
Hansen, H.S. (2010). Small-Area
Population Projections - A Key
Element in Knowledge Based e-
Governance. In K.N. Andersen, E.
Francesconi, A. Grönlund, & T.M. van
Engers (Eds.), EGOVIS 2010. Lecture
Notes in Computer Science: Vol. 6267.
Electronic Government and the
Information Systems Perspective (pp.
32-46). Springer, Berlin, Heidelberg.
https://doi.org/10.1007/978-3-642-
15172-9_4
The author describes a cohort-component model for
preparing small area population forecasts. The population
accounting equation (p.35) is unusual in that it separates in-
migration to/from existing dwellings with migration
associated with changes in the dwelling stock. In-migration
of children is not forecast. Local fertility and mortality rates
are prepared by taking regional rates and multiplying by a
local Standardised Fertility/Mortality Ratio. The model is
illustrated with projections for small areas of the
municipality of Randers, Denmark, from 2007 to 2020.
Harding, A., Vidyattama, Y., &
Tanton, R. (2011). Demographic
change and the needs-based planning
of government services: Projecting
small area populations using spatial
microsimulation. Journal of
Population Research, 28(2-3), 203-
224.
https://doi.org/10.1007/s12546-011-
9061-6
The authors describe SpatialMSM, a spatial
microsimulation model for Australia which forecasts
population and household characteristics for Statistical
Local Areas (SLAs). It is a static microsimulation model
which involves using Department of Health & Ageing
macro-level forecasts of SLA populations by age and sex
out to 2027, disaggregating by labour force status, and then
re-weighting the base period small area micro-level dataset
to achieve consistency with the area/age/sex/labour force
forecasts. The paper focuses on likely future changes in
demand for aged care and child care as examples.
Hauer, M. E. (2017) Migration induced
by sea-level rise could reshape the US
population landscape. Nature Climate
Change, 7, 321-325.
https://doi.org/10.1038/nclimate3271
The author presents forecasts of migration flows from
coastal counties in the US which are likely to be subject to
sea-level rise inundation. Populations of those parts of
counties subject to inundation formed the out-migrants; in-
migration to affected countries was reduced in proportion to
the unaffected population of each county. Forecasts were
produced from 2010 to 2100. Unobserved component
modelling was used to project shifts in the migration
system. Florida is projected to experience the largest net
loss of population while Texas is expected to gain the most.
Hauer, M. E., Evans, J. M., & Mishra,
D. R. (2016). Millions projected to be
at risk from sea-level rise in the
continental United States. Nature
Climate Change, 6, 691-695.
https://doi.org/10.1038/nclimate2961
The authors forecast the population at risk of sea level rise
in the continental United States. Areas expected to be
impacted were modelled using a dynamic flood hazard
model. Population forecasts were made for Census Block
Groups within counties expected to be severely impacted by
sea level rises. A linear/exponential method was used to
forecast the populations from 2010 to 2100, with forecasts
used to calculate populations at risk from sea level rises of
0.9m and 1.8m.

57
Reference and URL Key points
Hauer, M. E., Evans, J. M., &
Alexander, C. R. (2015). Sea-level rise
and sub-county population projections
in coastal Georgia. Population and
Environment, 37(1), 44-62.
https://doi.org/10.1007/s11111-015-
0233-8
The authors propose a housing-unit population forecasting
method for sub-county areas, and illustrate it with an
application to coastal regions of Georgia, USA. Population
forecasts were combined with separate forecasts of sea-
level rise inundation to estimate the likely impacts of
climate change. The number of dwelling units was forecast
with a linear model for growing areas and exponential
extrapolation for those declining. The models were fitted by
regression and prediction intervals are calculated.
Hauer, M. E. (2019). Population
projections for US counties by age,
sex, and race controlled to shared
socioeconomic pathway. Scientific
data, 6(1), 1-15.
https://doi.org/10.1038/sdata.2019.5
The author presents forecasts for all US counties by age,
sex and race for 2020-2100. The Hamilton-Perry model was
used for private household populations, with one key
variation: cohort change ratios were used for county by race
populations which are declining, while cohort change
differences (absolute numbers) were applied for growing
populations. Both of these were projected with an
ARIMA(0,1,1) model. Populations in group quarters
(institutional dwellings) were assumed to remain constant.
Forecasts were constrained to the Shared Socioeconomic
Pathway scenarios for the US.
Inoue, T. (2017). A new method for
estimating small area demographics
and its application to long-term
population projection. In D. A.
Swanson (Ed.), The frontiers of applied
demography (pp. 473-489). Springer.
https://doi.org/10.1007/978-3-319-
43329-5_22
Website: http://arcg.is/1GkdZTX
The author proposes a Hamilton-Perry method for small
area population forecasts in which the Cohort Change
Ratios and Child/Woman Ratios are smoothed by
incorporating information from higher geographies
(prefectures). A short-term historical test of this smoothing
method compared to some other approaches (no smoothing;
Empirical Bayes; use of prefecture ratios for all constituent
small areas) showed it to produce the lowest errors.
Population forecasts for 217,000 small areas in Japan from
2015 to 2060 were produced.
Jannuzzi P (2005) Population
projections for small areas: method and
applications for districts and local
population projections in Brazil. Paper
prepared for the IUSSP conference,
Tours, France.
https://iussp2005.princeton.edu/papers/
51422.
Portuguese version of the paper
published at:
https://doi.org/10.1590/S0102-
30982007000100008
The author proposes a coupling of the cohort-component
method at regional levels with a system of differential
equations, based on models of population dynamics used in
ecology, to disaggregate population forecasts to
municipalities. This method works best for projections with
5 and 10 year forecast horizons for regions with good
census data and vital statistics, but poor-quality small area
data. The method was then applied to small areas in Brazil.

58
Reference and URL Key points
Jiang, B., Jin, H., Liu, N., Quirk, M.,
and Searle, B. (2007). A HMM-based
hierarchical framework for long-term
population projection of small areas. In
M. A. Orgun and J. Thornton (Eds.),
AI 2007: Advances in Artificial
Intelligence. AI 2007. Lecture Notes in
Computer Science, vol 4830 (pp. 694-
698). Springer.
https://doi.org/10.1007/978-3-540-
76928-6_77
The authors present a small area population forecasting
method which is based on the Hidden-Markov model and
incorporates a hierarchical framework, such that data from
larger geographies are utilised. Compared to the cohort-
component model, the method has fewer data requirements,
is suited to produce longer-term projections, and can
produce prediction intervals and point intervals. The
method was applied to data from the suburbs of Canberra,
Australia, and outperformed both the cohort-component
model and a simple Hidden-Markov model in a 20-year
forecast.
Jonker, M. F., van Lenthe, F. J.,
Congdon, P. D., Donkers, B., Burdorf,
A., & Mackenbach, J. P. (2012).
Comparison of Bayesian Random-
Effects and Traditional Life
Expectancy Estimations in Small-Area
Applications. American Journal of
Epidemiology, 176(10), 929-937.
https://doi.org/10.1093/aje/kws152
Traditional life expectancy estimations tend to generate
unacceptably large biases and standard errors for small
areas with population fewer than 5,000 person years. In this
paper, Monte Carlo simulations were used to demonstrate
that a Bayesian Random-Effects approach outperforms the
traditional approach in small-area settings, allowing
estimates to be produced for populations down to 2,000
person-years. This improvement is enabled by the Bayesian
method's use of correlations between sexes, geographic
areas and age groups to support estimation of smaller areas
life expectancies.
Kanaroglou, P. S., Maoh, H. F.,
Newbold, B., Scott, D. M., & Paez, A.
(2009). A demographic model for
small area population projections: an
application to the Census Metropolitan
Area of Hamilton in Ontario, Canada.
Environment and Planning A:
Economy and Space, 41(4). 964-979.
https://doi.org/10.1068/a40172
The authors describe an approach which combines a
multiregional cohort-based demographic model at the
regional scale and an aggregate spatial multinomial logit
model for small areas. The latter distributes in-migrants to
regions to small areas based on migrant and destination area
characteristics, including migrant’s age, number of schools,
number of new dwellings, dwelling average rent, distance
to the city centre, and amount of recreational land. The
model was applied to municipalities and their census tracts
in the Hamilton metropolitan region, Canada.
Leknes, S., & Løkken, S. A. (2020).
Empirical Bayes estimation of local
demographic rates. An application
using Norwegian registry data.
Statistics Norway.
https://www.ssb.no/en/befolkning/artik
ler-og-publikasjoner/empirical-bayes-
estimation-of-local-demographic-rates
The authors describe an application of the hierarchical
Empirical Bayes estimation method for estimating small
area demographic rates using full-count Norwegian registry
data. The proposed method is low cost, and efficient, and
supports practitioners in dealing with issues relating to
noisy small area statistics by borrowing statistical strength
from larger area populations, which are used as priors. The
study demonstrates the beneficial properties of the method
in estimating reliable age-specific rates for fertility,
mortality, internal migration, and international migration at
the small area scale.

59
Reference and URL Key points
Li, T., & Corcoran, J. (2011). Testing
dasymetric techniques to spatially
disaggregate the regional population
forecasts for South East Queensland.
Journal of Spatial Science, 56(2), 203-
221.
https://doi.org/10.1080/14498596.2011
.623343
The paper describes how dasymetric methods can be used
to disaggregate regional population forecasts to small areas.
Several alternative dasymetric methods were tested on the
metropolitan region of South East Queensland, Australia.
Local population forecasts were distributed to Statistical
Local Areas based on their dwelling density category, with
each density category assigned a proportion of regional
population growth. A method involving 4 density classes
was found to produce the best results.
Lomax, N., & Smith, A. (2017).
Microsimulation for demography.
Australian Population Studies, 1(1),
73-85.
https://doi.org/10.37970/aps.v1i1.14
The authors describe the utility of microsimulation for
population forecasting. They demonstrate how static
microsimulation can be used to produce a synthetic
population of individuals with characteristics describing
age, sex, ethnicity, and location using an example from the
London borough of Tower Hamlets, at the Middle-layer
Super Output Area geographic level (average population
8,000 persons). This synthetic population is then used the
base population for a dynamic microsimulation which
projects the population into the future. Data inputs included
UK census data and R code is provided to support
microsimulations.
Marois, G., & Bélanger, A. (2014).
Microsimulation Model Projecting
Small Area Populations Using
Contextual Variables: An Application
to the Montreal Metropolitan Area,
2006-2031. International Journal of
Microsimulation, 7(1), 158-193.
https://doi.org/10.34196/ijm.00097
The authors present results from a dynamic
microsimulation model projecting the population for 79
municipalities in Montreal from 2006 to 2031. The core
innovation of the model is the modelling of location-
specific migration probabilities, with destination choice
modelled as a function of distance to the city, current
municipality size, municipality development potential,
population composition as well as its geographic location.
Conditional logistic regression was used to estimate the
mobility parameters including in the microsimulation
model. Model validation of the population forecasts over a
5 year horizon showed a mean absolute percentage error of
3.4%, but higher for smaller populations. Overall, the
authors conclude the population forecast errors are within
reasonable 10 year error bands
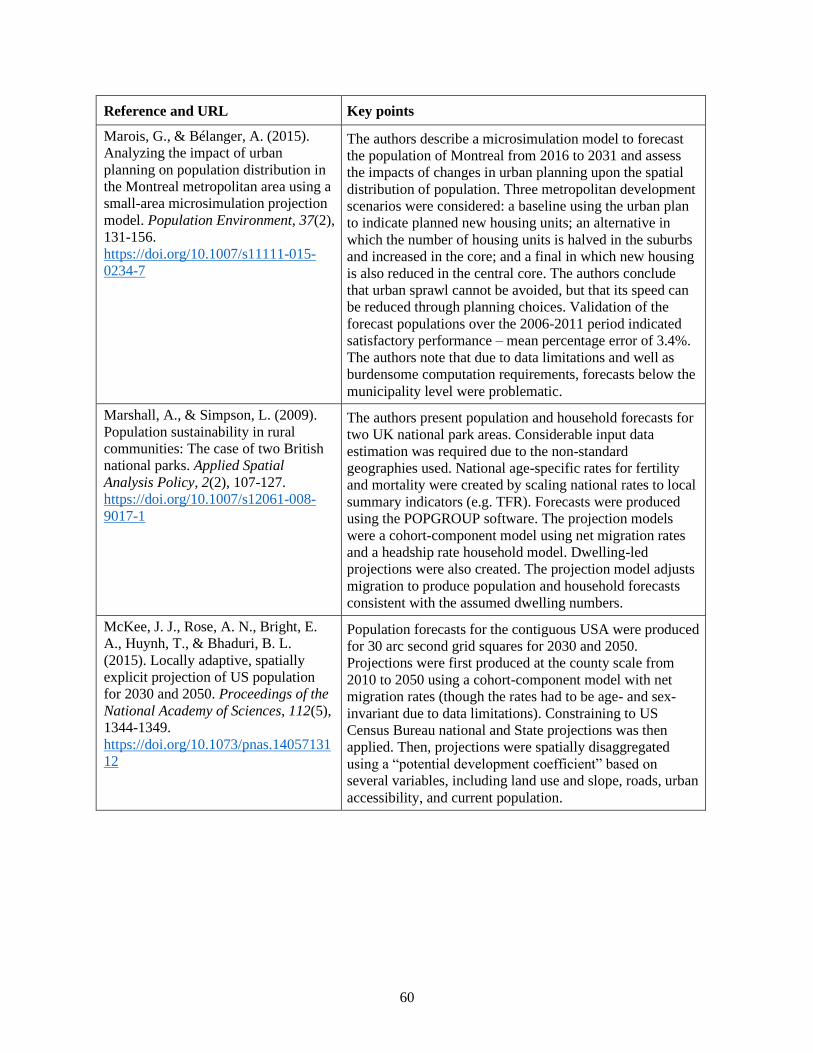
60
Reference and URL Key points
Marois, G., & Bélanger, A. (2015).
Analyzing the impact of urban
planning on population distribution in
the Montreal metropolitan area using a
small-area microsimulation projection
model. Population Environment, 37(2),
131-156.
https://doi.org/10.1007/s11111-015-
0234-7
The authors describe a microsimulation model to forecast
the population of Montreal from 2016 to 2031 and assess
the impacts of changes in urban planning upon the spatial
distribution of population. Three metropolitan development
scenarios were considered: a baseline using the urban plan
to indicate planned new housing units; an alternative in
which the number of housing units is halved in the suburbs
and increased in the core; and a final in which new housing
is also reduced in the central core. The authors conclude
that urban sprawl cannot be avoided, but that its speed can
be reduced through planning choices. Validation of the
forecast populations over the 2006-2011 period indicated
satisfactory performance – mean percentage error of 3.4%.
The authors note that due to data limitations and well as
burdensome computation requirements, forecasts below the
municipality level were problematic.
Marshall, A., & Simpson, L. (2009).
Population sustainability in rural
communities: The case of two British
national parks. Applied Spatial
Analysis Policy, 2(2), 107-127.
https://doi.org/10.1007/s12061-008-
9017-1
The authors present population and household forecasts for
two UK national park areas. Considerable input data
estimation was required due to the non-standard
geographies used. National age-specific rates for fertility
and mortality were created by scaling national rates to local
summary indicators (e.g. TFR). Forecasts were produced
using the POPGROUP software. The projection models
were a cohort-component model using net migration rates
and a headship rate household model. Dwelling-led
projections were also created. The projection model adjusts
migration to produce population and household forecasts
consistent with the assumed dwelling numbers.
McKee, J. J., Rose, A. N., Bright, E.
A., Huynh, T., & Bhaduri, B. L.
(2015). Locally adaptive, spatially
explicit projection of US population
for 2030 and 2050. Proceedings of the
National Academy of Sciences, 112(5),
1344-1349.
https://doi.org/10.1073/pnas.14057131
12
Population forecasts for the contiguous USA were produced
for 30 arc second grid squares for 2030 and 2050.
Projections were first produced at the county scale from
2010 to 2050 using a cohort-component model with net
migration rates (though the rates had to be age- and sex-
invariant due to data limitations). Constraining to US
Census Bureau national and State projections was then
applied. Then, projections were spatially disaggregated
using a “potential development coefficient” based on
several variables, including land use and slope, roads, urban
accessibility, and current population.
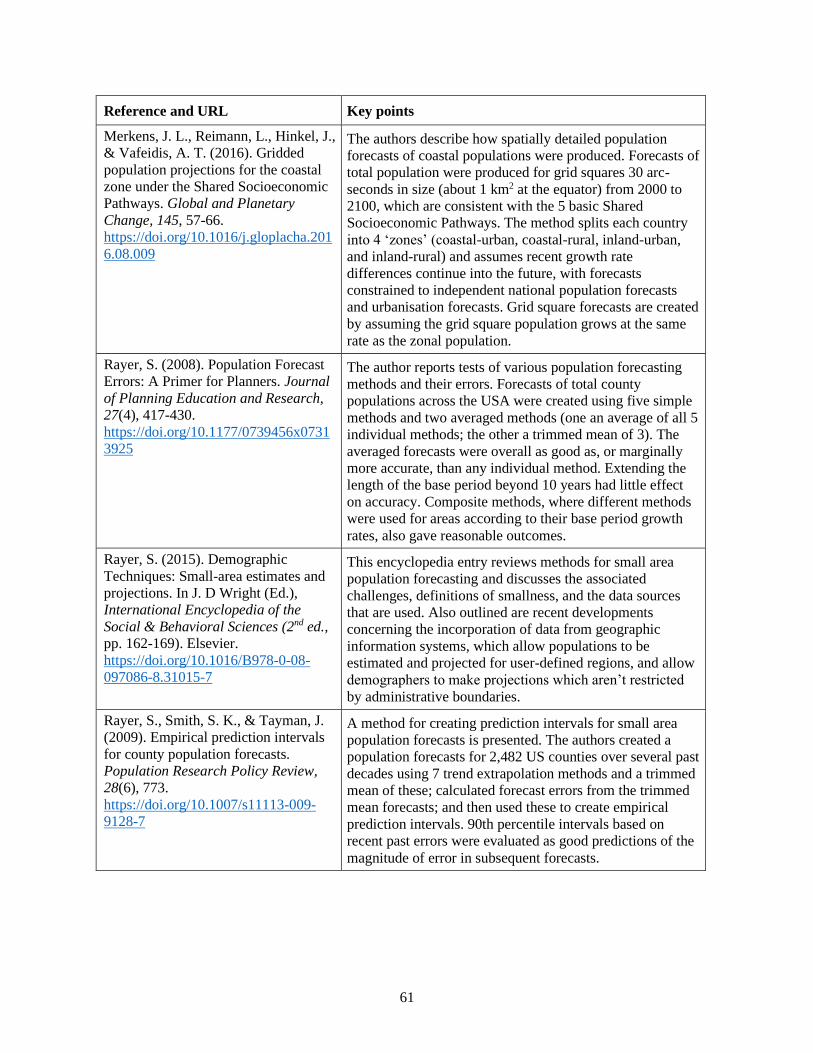
61
Reference and URL Key points
Merkens, J. L., Reimann, L., Hinkel, J.,
& Vafeidis, A. T. (2016). Gridded
population projections for the coastal
zone under the Shared Socioeconomic
Pathways. Global and Planetary
Change, 145, 57-66.
https://doi.org/10.1016/j.gloplacha.201
6.08.009
The authors describe how spatially detailed population
forecasts of coastal populations were produced. Forecasts of
total population were produced for grid squares 30 arc-
seconds in size (about 1 km2 at the equator) from 2000 to
2100, which are consistent with the 5 basic Shared
Socioeconomic Pathways. The method splits each country
into 4 ‘zones’ (coastal-urban, coastal-rural, inland-urban,
and inland-rural) and assumes recent growth rate
differences continue into the future, with forecasts
constrained to independent national population forecasts
and urbanisation forecasts. Grid square forecasts are created
by assuming the grid square population grows at the same
rate as the zonal population.
Rayer, S. (2008). Population Forecast
Errors: A Primer for Planners. Journal
of Planning Education and Research,
27(4), 417-430.
https://doi.org/10.1177/0739456x0731
3925
The author reports tests of various population forecasting
methods and their errors. Forecasts of total county
populations across the USA were created using five simple
methods and two averaged methods (one an average of all 5
individual methods; the other a trimmed mean of 3). The
averaged forecasts were overall as good as, or marginally
more accurate, than any individual method. Extending the
length of the base period beyond 10 years had little effect
on accuracy. Composite methods, where different methods
were used for areas according to their base period growth
rates, also gave reasonable outcomes.
Rayer, S. (2015). Demographic
Techniques: Small-area estimates and
projections. In J. D Wright (Ed.),
International Encyclopedia of the
Social & Behavioral Sciences (2nd ed.,
pp. 162-169). Elsevier.
https://doi.org/10.1016/B978-0-08-
097086-8.31015-7
This encyclopedia entry reviews methods for small area
population forecasting and discusses the associated
challenges, definitions of smallness, and the data sources
that are used. Also outlined are recent developments
concerning the incorporation of data from geographic
information systems, which allow populations to be
estimated and projected for user-defined regions, and allow
demographers to make projections which aren’t restricted
by administrative boundaries.
Rayer, S., Smith, S. K., & Tayman, J.
(2009). Empirical prediction intervals
for county population forecasts.
Population Research Policy Review,
28(6), 773.
https://doi.org/10.1007/s11113-009-
9128-7
A method for creating prediction intervals for small area
population forecasts is presented. The authors created a
population forecasts for 2,482 US counties over several past
decades using 7 trend extrapolation methods and a trimmed
mean of these; calculated forecast errors from the trimmed
mean forecasts; and then used these to create empirical
prediction intervals. 90th percentile intervals based on
recent past errors were evaluated as good predictions of the
magnitude of error in subsequent forecasts.

62
Reference and URL Key points
Rayer, S., & Smith, S. K. (2010).
Factors affecting the accuracy of
subcounty population forecasts.
Journal of Planning Education
Research, 30(2), 147-161.
https://doi.org/10.1177/0739456X1038
0056
The paper reports an analysis of subcounty population
forecast errors in Florida. The authors found that 10 years
of base period data is sufficient to gain maximum accuracy
using extrapolative methods. Forecast errors were large for
the smallest populations and those with high rates of
population change. Errors were lowest for areas which
experienced moderate base period population change, and
improvements in accuracy were achieved by using trimmed
means of several methods.
Reinhold, M., & Thomsen, S. L.
(2015). Subnational population
projections by age: An evaluation of
combined forecast techniques.
Population Research Policy Review,
34(4), 593-613.
https://doi.org/10.1007/s11113-015-
9362-0
The authors describe a forecasting approach which takes the
average of 7 sets of cohort-component projections. They
use the common cohort-component model as the reference
case and additionally consider six variants. These variants
are: cohort-component with migration, cohort-component
without migration, and the cohort-component model
constrained to total populations from linear, no change,
projected share-of-population, and constant share-of-
population models. Several sets of retrospective forecasts
were created for districts in the state of Lower Saxony,
Germany, for 10 year horizons. The averaged results proved
marginally more accurate than any of the individual
methods.
Riiman, V., Wilson, A., Milewicz, R.,
& Pirkelbauer, P. (2019). Comparing
Artificial Neural Network and Cohort-
Component Models for Population
Forecasts. Population Review, 58(2),
100-116.
https://doi.org/10.1353/prv.2019.0008
This paper compared total population forecasts created by
long short-term memory (LSTM) models with those
generated by a cohort component model, for counties in
Alabama, USA. Data used included decennial census data
and annual mid-year intercensal population data. Separate
forecasts were produced for these data types. Two training
regimes were tried: training models on data from all
counties and training separate models for each county. Data
until 2000 was used for training, with forecasts made to
2010. Single-country LSTM models trained with decennial
data performed better than the Cohort Component Model.
Other LSTM models and single-county model trained with
mid-year data produced comparable or worse forecasts,
depending on error measures used.

63
Reference and URL Key points
Scherbov, S., & Ediev, D. (2011).
Significance of life table estimates for
small populations: Simulation-based
study of standard errors. Demographic
Research, 24(22), 527-550.
https://doi.org/10.4054/DemRes.2011.
24.22
The authors present an analysis of bias, standard errors and
distribution of characteristics of lifetables for small
populations. Simulation methods are presented for the case
of both stationary (from N=1,000 to 1 million) and stable
populations (r = -2% to 2%) with 25,000 simulations
included to reduce the likelihood of statistical errors.
Findings and recommendations include: (1) estimation bias
and standard errors become too high for general use from a
population of 5,000 or lower – with the estimation of
confidence intervals and other statistical analyses not
plausible, (2) population age composition is critical to the
accuracy of estimating life expectancy in small populations,
(3) there are no advantages in the use of abridged over
unabridged lifetables, even with sparse age of death data,
and (4) the exact procedure used for open age intervals is
critical to life expectancy calculation in small populations.
Schmertmann, C. P., Cavenaghi, S. M.,
Assunção, R. M., & Potter, J. E.
(2013). Bayes plus Brass: estimating
total fertility for many small areas from
sparse census data. Population studies,
67(3), 255-273.
https://doi.org/10.1080/00324728.2013
.795602
The authors propose a new method for estimating small
area total fertility which tackles sparse data challenges, and
is automated and reproducible. This method uses Empirical
Bayes methods in order to smooth local age-specific rates
by borrowing strength from neighbouring areas. Then a
variant of Brass’s P/F parity correction procedure is
applied. The method was applied to data from over 5,000
municipalities in Brazil, using Brazilian Census data from
2000.
Schmertmann, C. P., & Hauer, M. E.
(2019). Bayesian estimation of total
fertility from a population's age–sex
structure. Statistical Modelling, 19(3),
225-247.
https://doi.org/10.1177/1471082X1880
1450
Good quality births data often do not exist, rendering
estimates of the Total Fertility Rates very difficult. The
authors explore the relationship between Total Fertility
Rates and the Child/Woman Ratio. They develop a
Bayesian approach to estimating TFR from age structures,
using demographic information from sources such as the
Human Fertility Database as prior inputs to the model. They
illustrate their model with an application to an Indigenous
population in Brazil and to counties in Georgia, USA.
Simpson, L. (2017). Integrated local
demographic forecasts constrained by
the supply of housing or jobs: Practice
in the UK. In D. A. Swanson (Ed.),
The frontiers of applied demography
(pp. 329-350). Springer.
https://doi.org/10.1007/978-3-319-
43329-5_16
Methods are presented for constraining a local area cohort-
component population forecast to assumed numbers of
dwellings or jobs. Consistency with either future dwelling
or job numbers is achieved by adjusting migration flows,
which in turn affects future births and deaths. The extent to
which the inward rather than outward migration flows are
adjusted, and local rather than overseas flows, is set by
user-defined weights. Example forecasts were produced by
the POPGROUP software, which incorporates the
adjustment mechanisms.

64
Reference and URL Key points
Simpson, L., & Snowling, H. (2011).
Estimation of local demographic
variation in a flexible framework for
population projections. Journal of
Population Research, 28(2-3), 109-
127.
https://doi.org/10.1007/s12546-011-
9060-7
Three ways of preparing input data for small area cohort-
component forecasts are assessed for situations where age-
specific fertility, mortality and migration data are
unavailable, or available but prohibitively expensive or
confidential. The No Local Variation option applies the
wider region’s fertility and mortality age profiles of rates
and the same pair of in- and out-migration age profiles to
all small areas. The Local Calibration option creates small
area assumptions from a short-run training projection which
constrains the No Local Variation assumptions using total
recorded births and deaths in each area, and estimates age-
sex specific migration from adjacent population estimates
by age and sex. The Local Direct comparison projection
uses small area fertility, mortality and migration age
profiles of rates, directly estimated from data available to
government. After empirical testing, the authors conclude
that the Local Calibration option provides the most
plausible forecasts.
Smith, S. K., Tayman, J., & Swanson,
D. A. (2013). A practitioner's guide to
state and local population projections.
Springer.
https://www.springer.com/gp/book/978
9400775503
This book provides a comprehensive guide to the
preparation of State/regional, local and small area
population forecasts. It includes a detailed account of
various types of cohort-component model, simple
extrapolative models, structural models, and
microsimulation models, as well as derived projections
(school enrolments, households, labour force, etc.). It
covers the preparation of fertility, mortality, and migration
assumptions, and lots of practical advice on evaluating
forecasts, special adjustments, forecast accuracy and
uncertainty, model selection, and documentation.
Stimson, R., Bell, M., Corcoran, J., &
Pullar, D. (2012). Using a large scale
urban model to test planning scenarios
in the Brisbane‐South East Queensland
region. Regional Science Policy &
Practice, 4(4), 373-392.
https://doi.org/10.1111/j.1757-
7802.2012.01082.x
The authors describe a large-scale urban model to forecast
population, dwellings, employment and other variables for
the South East Queensland region of Australia over the
period 2001 to 2026. Regional-level forecasts of dwellings
and population are disaggregated to small areas via a land
use development model of housing which considers (i)
residential land capacity, (ii) proximity to existing
development, and (iii) the accessibility of local areas to
services. The purpose of the model was to support
metropolitan regional planning and permit the assessment
of alternative planning scenarios.
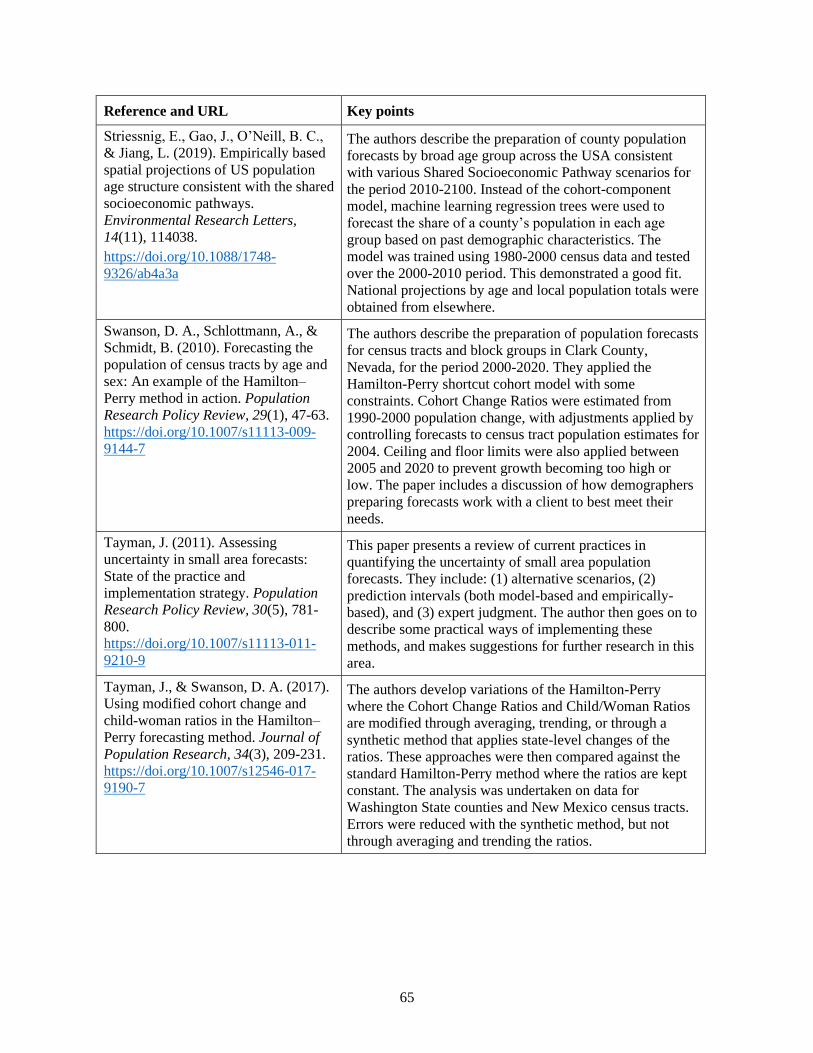
65
Reference and URL Key points
Striessnig, E., Gao, J., O’Neill, B. C.,
& Jiang, L. (2019). Empirically based
spatial projections of US population
age structure consistent with the shared
socioeconomic pathways.
Environmental Research Letters,
14(11), 114038.
https://doi.org/10.1088/1748-
9326/ab4a3a
The authors describe the preparation of county population
forecasts by broad age group across the USA consistent
with various Shared Socioeconomic Pathway scenarios for
the period 2010-2100. Instead of the cohort-component
model, machine learning regression trees were used to
forecast the share of a county’s population in each age
group based on past demographic characteristics. The
model was trained using 1980-2000 census data and tested
over the 2000-2010 period. This demonstrated a good fit.
National projections by age and local population totals were
obtained from elsewhere.
Swanson, D. A., Schlottmann, A., &
Schmidt, B. (2010). Forecasting the
population of census tracts by age and
sex: An example of the Hamilton–
Perry method in action. Population
Research Policy Review, 29(1), 47-63.
https://doi.org/10.1007/s11113-009-
9144-7
The authors describe the preparation of population forecasts
for census tracts and block groups in Clark County,
Nevada, for the period 2000-2020. They applied the
Hamilton-Perry shortcut cohort model with some
constraints. Cohort Change Ratios were estimated from
1990-2000 population change, with adjustments applied by
controlling forecasts to census tract population estimates for
2004. Ceiling and floor limits were also applied between
2005 and 2020 to prevent growth becoming too high or
low. The paper includes a discussion of how demographers
preparing forecasts work with a client to best meet their
needs.
Tayman, J. (2011). Assessing
uncertainty in small area forecasts:
State of the practice and
implementation strategy. Population
Research Policy Review, 30(5), 781-
800.
https://doi.org/10.1007/s11113-011-
9210-9
This paper presents a review of current practices in
quantifying the uncertainty of small area population
forecasts. They include: (1) alternative scenarios, (2)
prediction intervals (both model-based and empirically-
based), and (3) expert judgment. The author then goes on to
describe some practical ways of implementing these
methods, and makes suggestions for further research in this
area.
Tayman, J., & Swanson, D. A. (2017).
Using modified cohort change and
child-woman ratios in the Hamilton–
Perry forecasting method. Journal of
Population Research, 34(3), 209-231.
https://doi.org/10.1007/s12546-017-
9190-7
The authors develop variations of the Hamilton-Perry
where the Cohort Change Ratios and Child/Woman Ratios
are modified through averaging, trending, or through a
synthetic method that applies state-level changes of the
ratios. These approaches were then compared against the
standard Hamilton-Perry method where the ratios are kept
constant. The analysis was undertaken on data for
Washington State counties and New Mexico census tracts.
Errors were reduced with the synthetic method, but not
through averaging and trending the ratios.

66
Reference and URL Key points
Vasan, S., Baker, J., & Alcántara, A.
(2018). Use of Kernel Density and
Raster Manipulation in GIS to Predict
Population in New Mexico Census
Tracts. Review of Economics Finance,
14, 25-38.
http://www.bapress.ca/ref/ref-
article/1923-7529-2018-04-25-14.pdf
Boundary changes pose significant problems for small area
population estimates and forecasts. This paper presents a
method which uses kernel functions to disaggregate
population data from census block counts into tiny pixels in
GIS software. Population data can then be re-aggregated
back to any larger geography. This approach was used to
convert 1990 and 2000 census block counts in New Mexico
into data based on 2010 census boundaries. The converted
geography data was used to estimate 1990-2000 population
change, and then census block population forecasts were
created from 2000 to 2010. Evaluation against 2010 census
data showed a mean absolute percentage error of 142% for
census blocks and 30% for census tracts.
Vidyattama, Y., & Tanton, R. (2010).
Projecting Small Area Statistics with
Australian Microsimulation Model
(SPATIALMSM). Australasian
Journal of Regional Studies, 16(1), 99-
126.
https://www.anzrsai.org/assets/Uploads
/PublicationChapter/416-
Vidyattama.pdf
The authors describe the use of a spatial microsimulation
model to project small area socio-economic statistics.
Specifically, a static ageing spatial microsimulation is
presented for Australia at the Statistical Local Area (SLA)
level. The model reweights respondents from 2002/03 and
2003/04 Survey of Income and Housing to 2006 Census of
Population and Housing SLA benchmarks using iterative
constrained optimisation techniques.
Walters, A., & Cai, Q. (2008).
Investigating the use of holt-winters
time series model for forecasting
population at the state and sub-state
levels. Paper presented at the
Population Association of America
2008 Annual Meeting Program, New
Orleans, LA.
https://paa2008.princeton.edu/papers/8
0184
The paper describes the performance of the Holt-Winters
(exponential smoothing) model, ARIMA models, and
simple extrapolative models (linear and exponential) for
forecasting total populations. Retrospective forecasts were
created for US states, and counties and planning districts in
Virginia, USA. Differences in average errors were modest,
though Holt-Winters was most accurate overall for 5 year
forecast horizons and the exponential model for 10 year
horizons. The authors conclude that the “Holt-Winters
model provides both feasible and accurate population
forecasts at the state and sub-state levels.”
Weber, H. (2020). How Well Can the
Migration Component of Regional
Population Change be Predicted? A
Machine Learning Approach Applied
to German Municipalities.
Comparative Population Studies, 45.
https://doi.org/10.12765/CPoS-2020-
08
The authors present several models to predict within-
country and international migration at the municipal level in
Germany. The evaluation included regression, decision tree,
random forest, and neural network models. Data from 2005-
2009 were used to train the models and support the
prediction of net migration rates for the 2011-2015 period.
The data included socio-economic and demographic
indicators, and other characteristics (e.g. distance to
universities). The correlations of the predicted net migration
rate for ‘education migration’ (ages 18-24) with actual
migration data was R2 > 0.5 while for ‘family migration’
(ages 0-17 and 30-49) R2 = 0.25.

67
Reference and URL Key points
Wilson, T. (2011). A review of sub-
regional population projection
methods. Queensland Centre for
Population Research, The University
of Queensland.
https://www.researchgate.net/publicati
on/279535374_A_Review_of_Sub-
Regional_Population_Projection_Meth
ods
This report reviews many local and small area population
forecasting methods, including: trend extrapolation, time
series models, regression approaches, simple component
methods, economic base methods, the housing-unit model,
land use models, shortcut component methods, cohort-
component models, and microsimulation. It also considers
averaged methods, integrated methods which involve
several connected models, and the projection of migration
in cohort-component models. Methods are reviewed
according to several criteria relevant to state government
demographers selecting an optimum projection method.
Wilson, T. (2015). New evaluations of
simple models for small area
population forecasts. Population,
Space and Place, 21(4), 335-353.
https://doi.org/10.1002/psp.1847
The paper presents an evaluation of simple methods for
forecasting the total populations of small areas. The
selected methods consisted of 10 individual models,
averages of every combination of 2, 3, 4 and 5 models, and
composite approaches which use different models
depending on population size and recent growth rates.
Example small area population forecasts for Australia, New
Zealand, and England & Wales were evaluated. A small
proportion of averaged and composite models proved more
accurate than the best individual models, supporting other
research which has found that model combining improves
accuracy.
Wilson, T. (2014). Simplifying Local
Area Population and Household
Projections with POPART. In M. N.
Hoque & L. B. Potter (Eds.), Emerging
Techniques in Applied Demography
(pp. 25-38). Springer Netherlands.
http://dx.doi.org/10.1007/978-94-017-
8990-5_3
The chapter describes POPART, an Excel/VBA projection
program for individual local or small areas. It includes a bi-
regional cohort-component model (based on transition
population accounts) with 5 year age group and time
intervals, and a householder rate household model. It was
designed to simplify the projections process by only using
publicly available input data, providing a user-friendly
interface with pull-down menus and buttons, and simple
assumption-setting primarily using summary indicator
assumptions (e.g. the TFR). Example projections for the
local government area of Noosa, Australia, are shown.
Wilson, T. (2016). Evaluation of
alternative cohort-component models
for local area population forecasts.
Population Research Policy Review,
35(2), 241-261.
https://doi.org/10.1007/s11113-015-
9380-y
The author describes an evaluation of five types of cohort-
component model, which differ in the way they include
migration. Retrospective forecasts for 67 local government
areas of New South Wales, Australia, were produced for the
projection horizon 1991 to 2011, and the results compared
to actual population estimates. Two sets of forecasts were
prepared: (i) unconstrained forecasts and (ii) forecasts
constrained to population totals from an extrapolative
model. The constrained forecasts proved considerably more
accurate; the constrained bi-regional model gave the most
accurate age-specific forecasts (by a small margin).

68
Reference and URL Key points
Wilson, T. (2017b). Does averaging
yield more accurate local and regional
population forecasts? Applied Spatial
Analysis and Policy, 10(4), 497-513.
https://doi.org/10.1007/s12061-016-
9194-2
The paper reports an evaluation of the Constant Share of
Population – Variable Share of Growth (CSP-VSG)
averaged model for forecasting total populations. It was
applied to SA2, SA3 and SA4 geographies of Australia
(median populations about 9,000, 57,000 and 224,000,
respectively) over several 10 year forecast horizons.
Comparisons were made with published population
estimates and forecasts from a simple linear extrapolation.
The CSP-VSG model outperformed the linear model and
gave respectable levels of accuracy. Median Absolute
Percentage Errors were 6-8% for SA2s, 3-6% for SA3s and
2-4% for SA4s after 10 years.
Wilson, T., & Rowe, F. (2011). The
forecast accuracy of local government
area population projections: a case
study of Queensland. The Australasian
Journal of Regional Studies, 17(2),
204-243.
https://www.anzrsai.org/assets/Uploads
/PublicationChapter/464-
WilsonandRowe.pdf
The authors present an analysis of the accuracy of seven
past rounds of official local government area population
projections for Queensland, Australia. Error was found to
be positively associated with projection horizon length and
negatively associated with population size. Areas with large
Indigenous populations and areas with lots of mining
activity were particularly poorly forecast. Overall, the
projections were more accurate than forecasts obtained by
simple linear extrapolation.
Wilson, T., Brokensha, H., Rowe, F.,
& Simpson, L. (2018). Insights from
the evaluation of past local area
population forecasts. Population
Research Policy Review, 37(1), 137-
155.
https://doi.org/10.1007/s11113-017-
9450-4
The authors present an evaluation of local area projections
produced by State/Territory governments in Australia over
the last 30 years for forecast horizons of 5, 10, 15 and 20
years ahead. Forecast errors were found to be high for areas
with the smallest populations, especially those with
populations under 2,000. The concept of a forecast ‘shelf
life’ is introduced, defined as “how far into the future a
forecast is likely to remain within a certain error margin”.
Shelf lives are calculated from past errors as the number of
years ahead the error of 80% of local area forecasts
remained within 10% absolute percentage error. This varies
greatly by jump-off population size. Empirical prediction
intervals are also calculated and applied to recent forecast
examples.
Wu, B., & Birkin, M. (2013). Moses:
A Dynamic Spatial Microsimulation
Model for Demographic Planning. In
R. Tanton & K. Edwards (Eds.),
Spatial Microsimulation: A Reference
Guide for Users (pp. 171-193).
Springer Netherlands.
https://doi.org/10.1007/978-94-007-
4623-7_11
This book chapter discusses the benefits of microsimulation
methods for the modelling of detailed individual
characteristics, and the ability of dynamic microsimulation
models to update and project the characteristics of
populations of individuals. The authors introduce Moses, a
dynamic microsimulation model which allows for detailed
forecasts at the small area level. Moses simulates the UK
population over the period from 2001 to 2031. The
modelling approach is described and visualisations are
provided for projected changes in age-sex structure,
mortality, and student populations.

69
Reference and URL Key points
Wu, B. M., Birkin, M. H., & Rees, P.
H. (2010). A Dynamic MSM With
Agent Elements for Spatial
Demographic Forecasting. Social
Science Computer Review, 29(1), 145-
160.
https://doi.org/10.1177/089443931037
0113
In this paper the authors work to develop Moses, a dynamic
microsimulation model of the UK which simulates
populations at the individual level at a small area level, to
support policy and decision making. They demonstrate the
use of Moses in two experiments. First, they describe how
Moses can be used to model the migration of higher
education students, with consideration for the students’
education level. Second, the authors describe how their
method allows personal history to be used to support the
projection of mortality, enabling characteristics such as a
person's work history or previous places of residence to be
used to calculate their mortality/morbidity probabilities.
Xanthos, G., Ladias, C. A., &
Genitsaropoulos, C. (2013). A method
for forecasting population changes in
alpine, semi-alpine and lowland
communities of Epirus region in
Greece. Regional Science Inquiry
Journal, 1, 173-179.
http://www.rsijournal.eu/ARTICLES/J
une_2013/11.pdf
The authors report an evaluation of share of population and
share of population growth models, including the authors’
preferred shift-share model, to predict small area
populations in communities within the Epirus region in
Greece. The populations of communities proved difficult to
predict for all of these methods, with all MAPEs being
>20% for a 10 year forecast horizon (though the small area
population sizes are not stated).
Zhang, J. L., & Bryant, J. (2020).
Bayesian disaggregated forecasts:
internal migration in Iceland. In S.
Mazzuco, & N. Keilman (Eds.),
Developments in Demographic
Forecasting (pp. 193-215). Springer.
https://doi.org/10.1007/978-3-030-
42472-5_10
Estimates and forecasts of internal migration by age and sex
at the local level are important for local planning, but small
counts and erratic patterns can make using traditional
methods difficult. The authors present a Bayesian
modelling strategy for estimating age-sex patterns of
internal migration in Iceland. The model includes effects
for age, sex, time, region and various interaction effects.
Zoraghein, H., & O'Neill, B. C.
(2020a). A spatial population
downscaling model for integrated
human-environment analysis in the
United States. Demographic Research,
43, 1563-1606.
https://doi.org/10.4054/DemRes.2020.
43.54
The authors describe an evaluation of a model which
disaggregates US state populations to 1 km2 grid squares. A
gravity-type model was used for the downscaling, specified
individually for each state and for its rural/urban
population. Forecast population increase was allocated to
grid cells proportional to its modelled ‘suitability for
growth’ based on many variables (with decrease distributed
to the inverse of its suitability). An evaluation was
undertaken by ‘forecasting’ from 2000 to 2010 and
comparing forecasts with actual 2010 population estimates.
Lower errors were found for urban grid square projections
with larger populations.

70
Reference and URL Key points
Zoraghein, H., & O’Neill, B. C.
(2020b). US State-level Projections of
the Spatial Distribution of Population
Consistent with Shared Socioeconomic
Pathways. Sustainability, 12(8), 3374.
https://doi.org/10.3390/su12083374
The authors describe how small area population forecasts
for the contiguous US were prepared for the horizon 2010-
2100. A gravity-based model (as described in Zoraghein
and O’Neill 2020a) was used to distribute State population
forecasts consistent with three of the Shared Socioeconomic
Pathways to 1 km2 grid squares.