Proteome analysis ofSaccharomyces cerevisiae: A methodological outline

Metabolic homeostasis is maintained in myocardial hibernationby adaptive changes in the transcriptome and proteome
Manuel Mayra,⁎, Dalit Mayb, Oren Gordonb, Basetti Madhuc, Dan Gilond, Xiaoke Yina, QiuruXinga, Ignat Drozdove, Chrysanthi Ainalie, Sophia Tsokae, Qingbo Xua, John Griffithsc,Anton Horrevoetsf, and Eli Keshetb
aKing's British Heart Foundation Centre, King's College London, London, UK bMolecular Biology,The Hebrew University-Hadassah University Hospital, Jerusalem, Israel cCancer Research UK,Cambridge Research Institute, Cambridge, UK dCardiology Department, Hadassah-HebrewUniversity Medical Center, Israel eCentre for Bioinformatics - School of Physical Sciences andEngineering, King's College London, London, UK fMolecular Cell Biology and Immunology, VUUniversity Medical Center, Amsterdam, The Netherlands
AbstractA transgenic mouse model for conditional induction of long-term hibernation via myocardium-specific expression of a VEGF-sequestering soluble receptor allowed the dissection of thehibernation process into an initiation and a maintenance phase. The hypoxic initiation phase wascharacterized by peak levels of K(ATP) channel and glucose transporter 1 (GLUT1) expression.Glibenclamide, an inhibitor of K(ATP) channels, blocked GLUT1 induction. In the maintenancephase, tissue hypoxia and GLUT1 expression were reduced. Thus, we employed a combined “-omics” approach to resolve this cardioprotective adaptation process. Unguided bioinformaticsanalysis on the transcriptomic, proteomic and metabolomic datasets confirmed that anaerobicglycolysis was affected and that the observed enzymatic changes in cardiac metabolism weredirectly linked to hypoxia-inducible factor (HIF)-1 activation. Although metabolite concentrationswere kept relatively constant, the combination of the proteomic and transcriptomic datasetimproved the statistical confidence of the pathway analysis by 2 orders of magnitude. Importantly,proteomics revealed a reduced phosphorylation state of myosin light chain 2 and cardiac troponin Iwithin the contractile apparatus of hibernating hearts in the absence of changes in proteinabundance. Our study demonstrates how combining different “-omics” datasets aids in theidentification of key biological pathways: chronic hypoxia resulted in a pronounced adaptiveresponse at the transcript and the protein level to keep metabolite levels steady. This preservationof metabolic homeostasis is likely to contribute to the long-term survival of the hibernatingmyocardium.
Graphical Abstract
© 2011 Elsevier Ltd.⁎Corresponding author at: Cardiovascular Division, King's College London, 125 Coldharbour Lane, London SE5 9NU, UK. Fax: +4420 7848 5296. [email protected] document was posted here by permission of the publisher. At the time of deposit, it included all changes made during peerreview, copyediting, and publishing. The U.S. National Library of Medicine is responsible for all links within the document and forincorporating any publisher-supplied amendments or retractions issued subsequently. The published journal article, guaranteed to besuch by Elsevier, is available for free, on ScienceDirect.
Sponsored document fromJournal of Molecular and CellularCardiology
Published as: J Mol Cell Cardiol. 2011 June ; 50(6): 982–990.
Sponsored Docum
ent Sponsored D
ocument
Sponsored Docum
ent

Research Highlights—► The hibernation process was dissected into an initiation and amaintenance phase. ► Glibenclamide, an inhibitor of K(ATP) channels, blocked GLUT1induction. ► The maintenance phase was characterized by attenuated tissue hypoxia. ►Phosphorylation of myosin light chain 2 and cardiac troponin I was reduced. ► Combining ofproteomics and transcriptomics improved the bioinformatic pathway analysis.
AbbreviationsDIGE, difference in-gel electrophoresis; 2-DE, two-dimensional gel electrophoresis; 1H-NMR,proton nuclear magnetic resonance spectroscopy; LC-MS/MS, liquid chromatography tandemmass spectrometry
KeywordsHibernation; Hypoxia; Metabolomics; Myocardium; Proteomics
1 IntroductionHibernating myocardium as defined by Rahimtoola et al. [1] refers to resting LVdysfunction due to reduced coronary blood flow that can be partially or completely reversedby myocardial revascularization and/or by reducing myocardial oxygen demand. Thisendogenous mechanism of cell survival is a potent cardioprotective response that preservesmyocardial viability under hypoxia [1,2]. Unlike myocardial infarction, the hibernatingmyocardium does not undergo cell death, but can be salvaged and its function partially orfully restored upon reperfusion [3]. The adaptive mechanisms by which hibernatingmyocardium survives during chronic ischemia remain to be elucidated [2,4–6].
Recently, May et al. [7] established a bitransgenic system for conditional and reversible lossof vascular endothelial growth factor (VEGF) function in the heart. Inducible cardiacexpression of a soluble decoy receptor sequestered VEGF. As a result of the VEGFblockade, the myocardium was subject to a reversible microvascular deficit and experiencedchronic hypoxia, which recapitulates all the hallmarks of long-term myocardial hibernation.Cardiomyocytes showed reduced contraction, but remained viable and preserved theirpotential of full recovery. Importantly, this animal model resembled myocardial hibernationwithout accompanying cell death and inflammation, two confounding factors in models ofischemia that complicate comparisons with an -omics approach.
In the present study, we performed a proteomic and metabolomic analysis of hearts after6 weeks of VEGF blockade. We have previously demonstrated the usefulness of thiscombined approach to assess enzyme and corresponding metabolite changes inpreconditioned [8,9] as well as cardioprotected hearts [10]. The combination of proteomics
Mayr et al. Page 2
Published as: J Mol Cell Cardiol. 2011 June ; 50(6): 982–990.
Sponsored Docum
ent Sponsored D
ocument
Sponsored Docum
ent
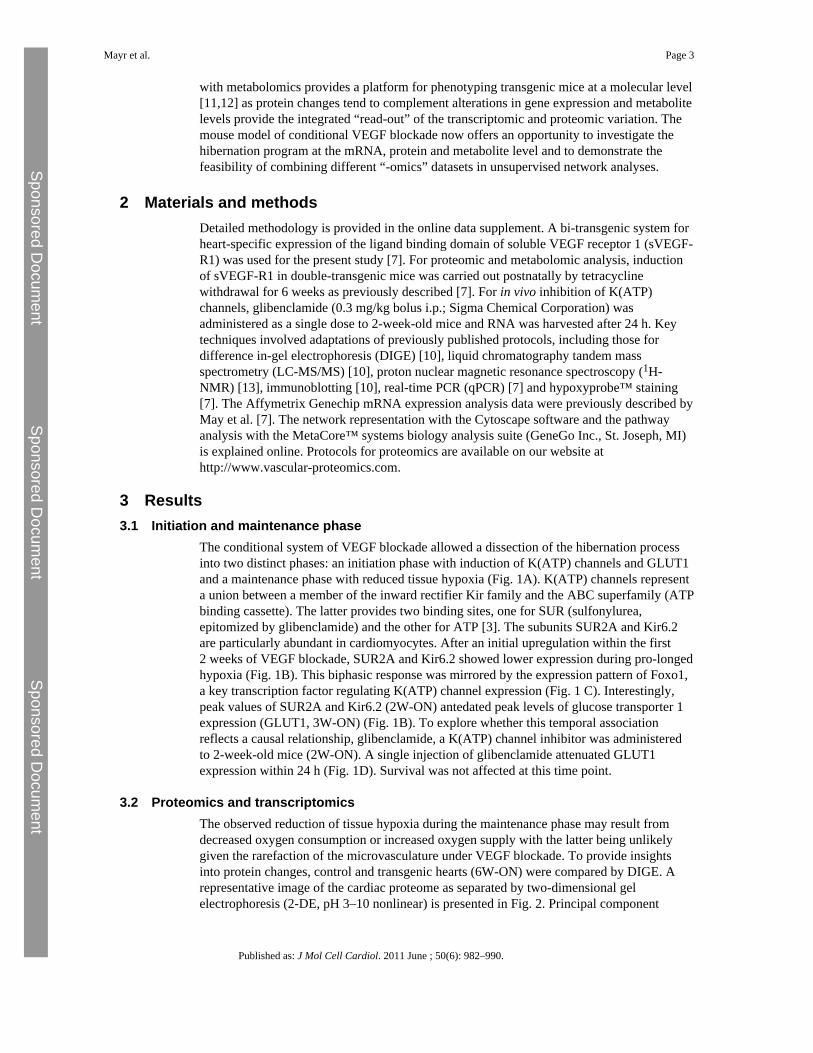
with metabolomics provides a platform for phenotyping transgenic mice at a molecular level[11,12] as protein changes tend to complement alterations in gene expression and metabolitelevels provide the integrated “read-out” of the transcriptomic and proteomic variation. Themouse model of conditional VEGF blockade now offers an opportunity to investigate thehibernation program at the mRNA, protein and metabolite level and to demonstrate thefeasibility of combining different “-omics” datasets in unsupervised network analyses.
2 Materials and methodsDetailed methodology is provided in the online data supplement. A bi-transgenic system forheart-specific expression of the ligand binding domain of soluble VEGF receptor 1 (sVEGF-R1) was used for the present study [7]. For proteomic and metabolomic analysis, inductionof sVEGF-R1 in double-transgenic mice was carried out postnatally by tetracyclinewithdrawal for 6 weeks as previously described [7]. For in vivo inhibition of K(ATP)channels, glibenclamide (0.3 mg/kg bolus i.p.; Sigma Chemical Corporation) wasadministered as a single dose to 2-week-old mice and RNA was harvested after 24 h. Keytechniques involved adaptations of previously published protocols, including those fordifference in-gel electrophoresis (DIGE) [10], liquid chromatography tandem massspectrometry (LC-MS/MS) [10], proton nuclear magnetic resonance spectroscopy (1H-NMR) [13], immunoblotting [10], real-time PCR (qPCR) [7] and hypoxyprobe™ staining[7]. The Affymetrix Genechip mRNA expression analysis data were previously described byMay et al. [7]. The network representation with the Cytoscape software and the pathwayanalysis with the MetaCore™ systems biology analysis suite (GeneGo Inc., St. Joseph, MI)is explained online. Protocols for proteomics are available on our website athttp://www.vascular-proteomics.com.
3 Results3.1 Initiation and maintenance phase
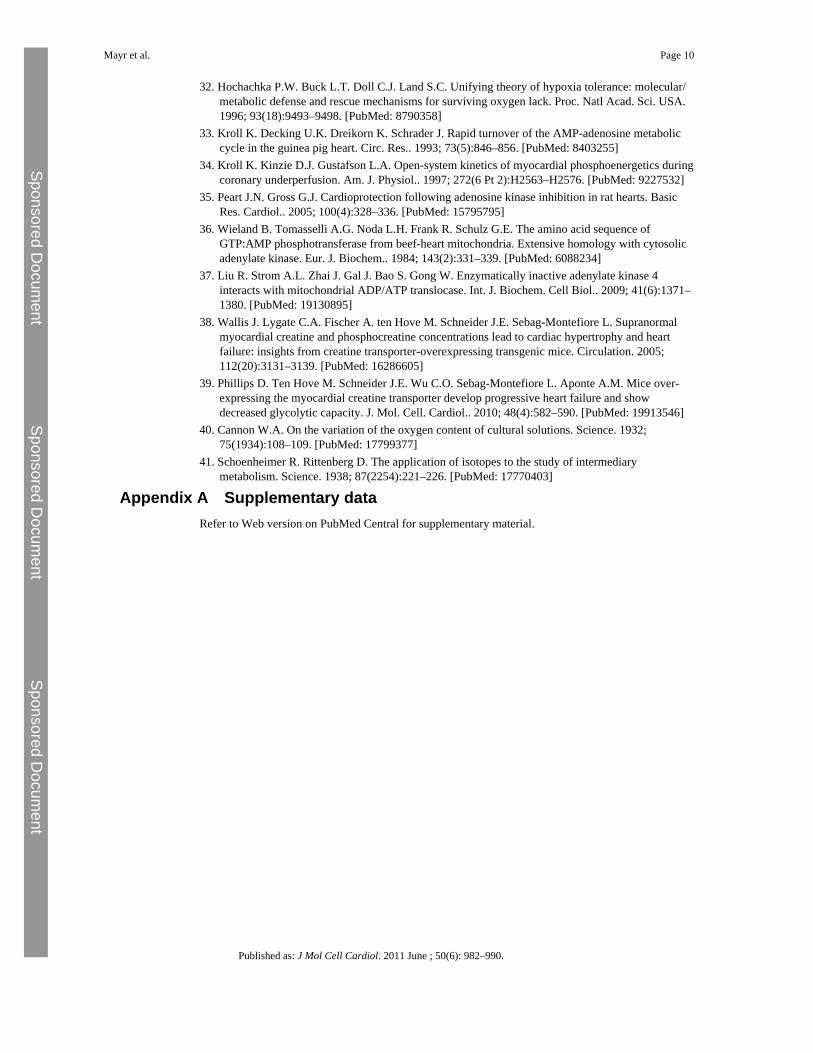
The conditional system of VEGF blockade allowed a dissection of the hibernation processinto two distinct phases: an initiation phase with induction of K(ATP) channels and GLUT1and a maintenance phase with reduced tissue hypoxia (Fig. 1A). K(ATP) channels representa union between a member of the inward rectifier Kir family and the ABC superfamily (ATPbinding cassette). The latter provides two binding sites, one for SUR (sulfonylurea,epitomized by glibenclamide) and the other for ATP [3]. The subunits SUR2A and Kir6.2are particularly abundant in cardiomyocytes. After an initial upregulation within the first2 weeks of VEGF blockade, SUR2A and Kir6.2 showed lower expression during pro-longedhypoxia (Fig. 1B). This biphasic response was mirrored by the expression pattern of Foxo1,a key transcription factor regulating K(ATP) channel expression (Fig. 1 C). Interestingly,peak values of SUR2A and Kir6.2 (2W-ON) antedated peak levels of glucose transporter 1expression (GLUT1, 3W-ON) (Fig. 1B). To explore whether this temporal associationreflects a causal relationship, glibenclamide, a K(ATP) channel inhibitor was administeredto 2-week-old mice (2W-ON). A single injection of glibenclamide attenuated GLUT1expression within 24 h (Fig. 1D). Survival was not affected at this time point.
3.2 Proteomics and transcriptomicsThe observed reduction of tissue hypoxia during the maintenance phase may result fromdecreased oxygen consumption or increased oxygen supply with the latter being unlikelygiven the rarefaction of the microvasculature under VEGF blockade. To provide insightsinto protein changes, control and transgenic hearts (6W-ON) were compared by DIGE. Arepresentative image of the cardiac proteome as separated by two-dimensional gelelectrophoresis (2-DE, pH 3–10 nonlinear) is presented in Fig. 2. Principal component
Mayr et al. Page 3
Published as: J Mol Cell Cardiol. 2011 June ; 50(6): 982–990.
Sponsored Docum
ent Sponsored D
ocument
Sponsored Docum
ent

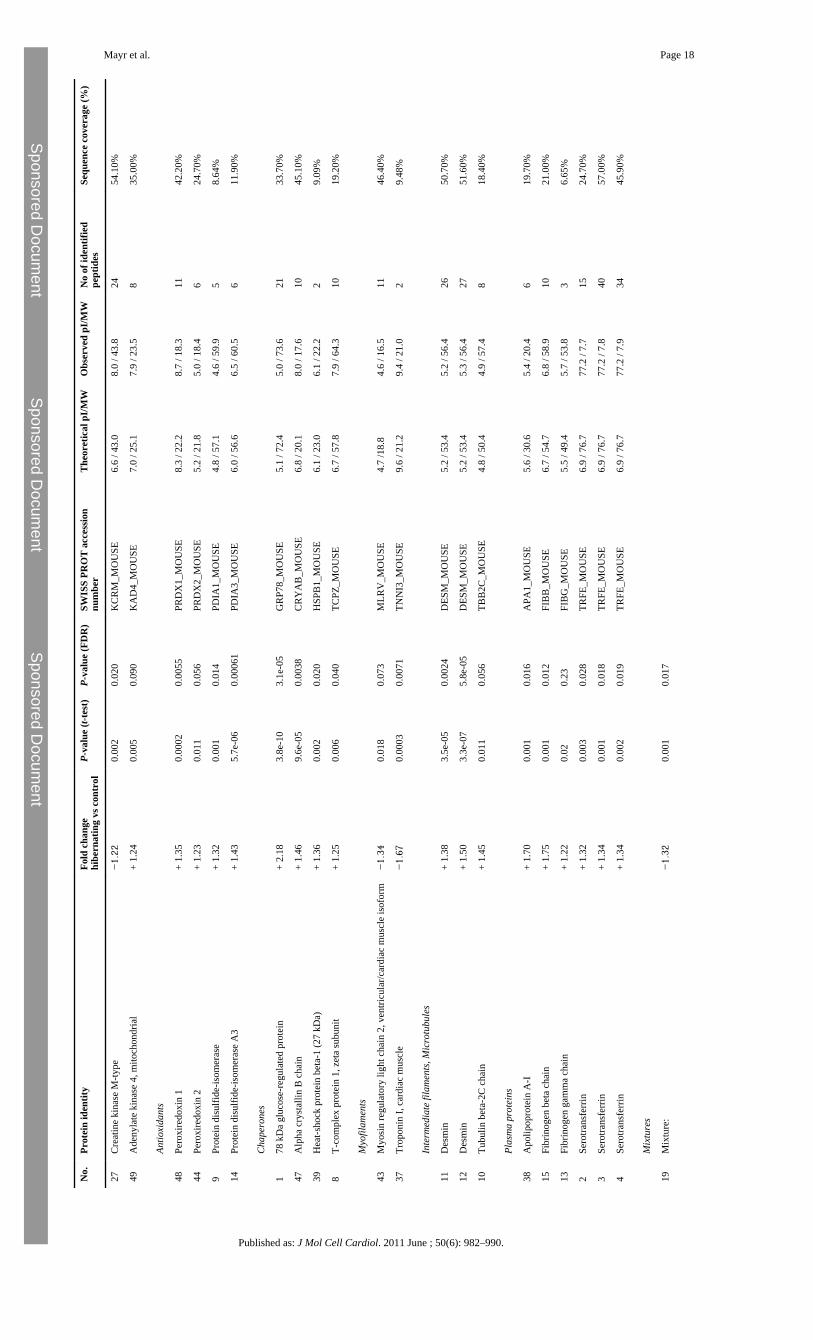
analysis (PCA) and hierarchical clustering were applied to the entire proteomic dataset (7gels per group) to identify the dominant trends and reveal differentially expressed proteins(Supplemental Figure 1). Examples illustrating the quantitative accuracy of the DIGEapproach are shown in Supplemental Figure 2. The protein spots were excised, subject to in-gel tryptic digestion, identified by LC-MS/MS analysis (Table 1 and Supplemental Table I)and mapped to our previously published microarray dataset [7] (Fig. 3). Overall, there was agood correlation between mRNA and protein fold induction (Pearson correlationcoefficient = 0.6395, p ≤ 0.0001), in particular for genes displaying a significant change inboth the transcriptomic and proteomic datasets (Supplemental Table II).
3.3 Changes in net expressionThe hibernating myocardium was characterized by increased expression of HIF target genes,reduced levels of mitochondrial enzymes involved in beta-oxidation and adaptive changes incardiac glucose and energy metabolism (Fig. 3) [7]. As part of the fetal reprogramming [14],gene expression of glucose transporter 1 (Glut1, + 3.4-fold, FDR 0.003), natriuretic peptideprecursor type A and B (Nppa and Nppb, + 3.4 and + 2.5-fold, FDR 0.009 and 0.057,respectively), myosin heavy polypeptide 7 (Myct1, + 8.0-fold, FDR 0.033) and pyruvatedehydrogenase kinase, isoenzyme 1 (Pdk1, + 2.3-fold, FDR 0.036) was induced. Theproteomic investigation confirmed a concordant upregulation of lactate dehydrogenase(Fig. 4A) and several glycolytic enzymes, among which fructose-biphosphate aldolase,glyceraldehyde-3-phosphate dehydrogenase, and pyruvate kinase are known HIF targetssensitive to hypoxia. Mitochondrial enzymes related to lipid metabolism, i.e., long-chainspecific acyl-CoA dehydrogenase, short chain specific 3-hydroxyacyl-CoA dehydrogenase,and delta3,5-delta2,4-dienoyl-CoA isomerase, were downregulated in the hibernatingmyocardium alongside creatine kinase and adenosine kinase, which contribute to energyhomeostasis.
3.4 Changes in post-translational modificationsFor two myofilament proteins there was discordant regulation at the mRNA and proteinlevel (Fig. 3). Myosin regulatory light chain 2 (MLC2) was resolved as a charge train withdifferent isoelectric points (pI) by 2-DE [15]. The differentially expressed spot (spot 43,Fig. 2) showed a shift towards a more acidic pI, indicative of phosphorylation. This wassubsequently confirmed by mobility shift detection of phosphorylated proteins (Phos-tag,Fig. 4B). Similarly, there were no significant differences in protein abundance of cardiactroponin I (TnI) as the observed change was due to decreased phosphorylation in hibernatinghearts (Fig. 4C). Other proteins that showed differential expression on 2-DE gels withoutcorresponding alterations in mRNA transcripts are known to be susceptible to oxidativestress, i.e., aldose reductase has a cysteine residue as regulator of its kinetic and inhibitionproperties; protein disulfide isomerases are redox-sensitive chaperones responsible for therearrangement of disulfide bonds; and peroxiredoxin 1 and 2 have redox-active cysteins astheir main anti-oxidative component. Oxidation of their cysteine residues makes theseproteins more acidic resulting in a charge shift on 2-DE gels without altering the netexpression of these cytosolic antioxidants [16,17] (Fig. 4D). In contrast, levels ofmitochondrial manganese SOD (SOD2) were reduced although cytosolic copper–zinc SOD(SOD1) was similar in control and hibernating hearts (Fig. 4D). Thus, besides changes in netexpression, hibernation was associated with alterations in post-translational modifications ofmyofilament and redox-sensitive proteins, which can be interrogated by using a proteomicsapproach.
3.5 Metabolomic analysisAmong the differentially expressed spots were proteins with established links to cardiacK(ATP) channels, including 3 glycolytic enzymes (pyruvate kinase, triose phosphate
Mayr et al. Page 4
Published as: J Mol Cell Cardiol. 2011 June ; 50(6): 982–990.
Sponsored Docum
ent Sponsored D
ocument
Sponsored Docum
ent

isomerase and GAPDH) known to be physically associated with cardiac K(ATP) channels[18,19] and contributors to cardiac energy shuttling, including creatine kinase, adenosinekinase and lactate dehydrogenase [20]. We therefore assessed cardiac metabolism after6 weeks of VEGF blockade by 1H-NMR spectroscopy. Representative spectra of cardiacmetabolite extracts are shown in Fig. 5. Quantitative data are provided in Table 2. Overall,the metabolite changes were not pronounced, but the observed reduction of glutamate,glutamine and total creatine in hibernating hearts by 1H-NMR spectroscopy corresponded toa decrease of mitochondrial glutamate dehydrogenase and creatine kinase in the proteomicdataset (Table 1). Consistent with previous reports in hypoxic rats [21], the observedmetabolic differences (lower glutamine levels, but higher aspartate to glutamateconcentration ratios) are indicative of a decreased flux through the malate-aspartate shuttleunder conditions of oxygen limitation. In addition, choline, taurine, and leucineconcentrations were lower in hibernating hearts. Perturbations of glucose concentrations andthe adenosine pool (ADP + ATP) failed to reach statistical significance.
3.6 Network analysisTo enable an unbiased analysis at the network level, interactions within the transcriptomicsdata [7] were first visualized using Cytoscape (Fig. 6A). This analysis revealed 2 majorclusters linked by transcription factor 4 and synphilin-1, a protein that is encoded by theSNCAIP gene and contains several protein–protein interaction domains, including an ATP/GTP-binding motif. The role of these genes in cardiac hibernation is currently unknown.The proteomic and metabolomic data were then combined with the transcriptomic data andanalyzed at the pathway level either independently, or in combination using the systemsbiology analysis suite MetaCore™. Results are presented in Supplemental Table III.Although the protein changes were not always consistent with the mRNA changes, proteinchanges were in the same pathway as transcriptomic changes and both datasets contributeddifferent focus molecules to the pathway analysis (Supplemental Figure 4). Consequently,the combination of the proteomic and transcriptomic dataset significantly improved thestatistical confidence of the pathway analysis, with HIF-hypoxia-Akt signaling andglycolysis being the most significant (Fig. 6B). In addition, the combined transcriptomic andproteomic data pointed towards the activation of hydroxyproline production, a pivotalcomponent of collagen synthesis, providing a direct link to cardiac remodeling. Adding themetabolite data did not increase the power of the analysis, as the corresponding metaboliteconcentrations, i.e., lactate, were kept relatively constant in the hibernating myocardium.“Cardiomyopathies” and “heart failure” were returned as the most prominent linked diseasesbased on the combined analysis using Metacore™.
4 DiscussionIn the present study, a combined transcriptomic, proteomic and metabolomic approach hasbeen conducted to provide a comprehensive analysis of molecular changes in a mouse modelof chronic myocardial hibernation. The different analyses explored different aspects ofcellular processes, i.e., microarrays interrogated the transcriptional signal whereasproteomics related to translational and post-translational mechanisms. Therefore, settinganalytical considerations aside, differences between the datasets were not only inevitable butalso critical in understanding the various aspects of cellular process mechanism andregulation. Interestingly, chronic hypoxia resulted in a pronounced myocardial response atthe transcript and the protein level but relatively minor changes in the metabolomeindicating that metabolic homeostasis is maintained by adaptive changes in the proteomeand the transcriptome.
Mayr et al. Page 5
Published as: J Mol Cell Cardiol. 2011 June ; 50(6): 982–990.
Sponsored Docum
ent Sponsored D
ocument
Sponsored Docum
ent

4.1 Integrated pathway analysis to combine “-omics” dataBiological systems are organized in scale-free networks [22]. The promise of systemsbiology is to characterize these networks and to finally predict their behavior. Despite thecomprehensive coverage obtained by whole-genome microarray analysis, additionalinformation can be gained by combining transcriptomic with proteomic data. Asdemonstrated in this study, proteomics contributed different focus molecules to the proteinassociation networks and the p-value of the top-ranking HIF signaling pathway improved by2 orders of magnitude in the combined analysis, even though HIF was not the top-rankingpathway in analysis based on the transcriptomic or the proteomic dataset separately.Moreover, proline metabolism and collagen metabolism, a key determinant for cardiacremodeling and cardiomyopathies, had the highest score in the proteomic dataset, but onlyranked 22 based on the transcriptomic data. Thus, the bias of proteomics towards highabundant components resulted in a re-arrangement of the top scoring pathways with the finaltop 3 (HIF signaling, glycolysis/glycogenesis, proline and collagen metabolism) being inagreement with the observed reversible fibrosis in this mouse model of hibernation. On theother hand, conventional inference statistics attaches utmost importance to the biggestchanges and the absence of a significant change, i.e., for glucose metabolites despite theinduction of glycolytic enzymes, does not add to the pathway analysis whereas all that hasbeen shown are differences in net concentrations at the time of measurement. An integratedassessment of enzymes and metabolites helps to highlight potential dynamic adaptations influx or turnover, but falls short of a metabolic control and flux analysis, which requires amore detailed treatment with respect to definition of control and regulation of metabolism[22–24]. Potential pitfalls include stability and turnover of mRNA, rates of protein synthesisand degradation (peptide chain initiation and elongation as well as activities of the ubiquitinproteasome system and autophagy [7]), and rates of metabolite turnover (e.g., ATP turnoverrates). Ultimately, a network of enzyme-catalyzed reactions and ion transport processes isthe platform for the interplay of energetic, electrical, Ca2+ handling and contractileprocesses in the heart [25,26]. Without a systems-wide perspective, network behavior can bemisinterpreted by relying on transcriptomic, proteomic or metabolomic readouts only.
4.2 Adaptive changes in glycolysis and myofilament phosphorylationThe hallmark of myocardial hibernation is the maintained viability of the dysfunctionalhypoxic myocardium. Metabolic activity is sustained by a shift from fatty acid metabolismto glycolysis resulting in an increased glucose uptake with a corresponding accumulation ofglycogen, a critical substrate for the ischemic heart [2]. HIF-1 represents a master switch inthe metabolic and functional adaptation to chronic anaerobic conditions by stimulatingglucose metabolism (through GLUT1) and angiogenesis (through VEGF). Upregulation ofboth HIF-target genes has previously been shown in the human hibernating myocardium[27]. While the recapitulation of known associations validates our approach, the transgenicmice allow us to study HIF-mediated metabolic adaptation without concomitant angiogeniceffects. In chronically hibernating myocardium of pigs, persistent regional downregulationof mitochondrial enzymes and upregulation of stress proteins was reported, but no inductionof glycolytic enzymes was observed after a 3- to 5-month period [6]. Our study confirms therepression of mitochondrial enzymes and upregulation of anti-oxidant and stress proteins.Compared to the former study in pigs [6], our transgenic mice were subject to shorterperiods of ischemia and we report the induction of an early cardioprotective programcharacterized by an upregulation of glycolytic enzymes and transient induction of K(ATP)channels. We also measured cardiac metabolites rather than enzymatic activity [6] anddemonstrated alterations in the phosphorylation state of myofilmant proteins. Importantly,basal phosphorylation of MLC2 plays a pivotal role in cardiac muscle contraction, andreduced phosphorylation may contribute to the self-protecting cessation of myocardialcontraction during hibernation [28]. A decrease in both TnI and MLC2 phosphorylation
Mayr et al. Page 6
Published as: J Mol Cell Cardiol. 2011 June ; 50(6): 982–990.
Sponsored Docum
ent Sponsored D
ocument
Sponsored Docum
ent

correlated with enhanced Ca2+-responsiveness in human failing hearts, whilephosphorylation of MLC1 and troponin T isoform expression was unaltered [29,30]. Thus,the cessation of contraction in hibernation is accompanied by a complex interplay betweenenzymatic changes and alterations in myofilament phosphorylation.
4.3 Adaptive changes in K(ATP) channels and energy metabolismK(ATP) channels are unique nucleotide sensors that adjust membrane potential in responseto intracellular metabolic oscillations. Kir6.2 and SUR2A are the pore-forming andregulatory subunits of the K(ATP) channel complex, respectively. Transition of the SURsubunit from the ATP to the ADP-liganded state promotes K+ permeation through Kir6.2and defines K(ATP) channel activity, which serves a cardioprotective role under ischemicinsult [31]. Our data extend these findings by implicating a temporary induction of thesemetabolic sensors in the cardiac adaptation to chronic hypoxia. Their subsequentsuppression may be required for the transition into the maintenance phase of hibernationwith reduced metabolic demand, which is supported by the reduction in GLUT1, a hypoxiamarker, after administration of glibenclamide. It has previously been proposed that theresponse of hypoxia tolerant systems to oxygen lack occurs in two phases. The first lines ofdefense against hypoxia include a balanced suppression of ATP-demand and ATP-supplypathways; this regulation stabilizes (adenylates) at new steady-state levels even while ATPturnover rates greatly decline [32]. Adenosine kinase contributes to energy homeostasis byrecovering AMP from adenosine and allows AMP to increase when ATP becomes depleted[33]. The downregulation of this salvage enzyme in hibernation may indicate loss of purinespossibly with increased extracellular concentration of adenosine. The hydrolysis of AMP toadenosine has been shown to benefit tissue survival during ischemia by improving the freeenergy of ATP hydrolysis [34]. Moreover, inhibition of adenosine kinase was protective in arat model of myocardial infarction [35]. Interestingly, a chain of adenylate kinase-catalyzedphosphotranfer reactions has been implicated in the communication of mitochondria-generated signals to K(ATP) channels [20]. Mitochondrial adenylate kinase 4, identified inthis study, contributes to the phosphorylation of AMP, but can only use GTP or ITP as asubstrate [36]. It has recently been demonstrated to interact with the mitochondrial innermembrane protein adenine nucleotide translocase, which might be important for itsprotective benefits under stress conditions [37]. On the other hand, creatine kinase is knownto act as a spatial and temporal energy buffer and regulator of pH. Over-expression of thecardiac creatine transporter, however, failed to protect transgenic mice from heart failuredespite achieving supraphysiological creatine levels [38]. In fact, the increase in the cardiaccreatine content was associated with decreased glycolytic activity [39]. Thus, a reducedcreatine pool might be an adaptive mechanism in response to chronic hypoxia [12].Although the concept of homeostasis reaches far back into the history of experimentalphysiology [40,41], this is, to our knowledge, the first time that the net effect of hibernationon oxygen balance has been experimentally shown.
4.4 Limitations of the studyNo technology can currently resolve the entire complexity of the mammalian proteome andmetabolome. While shot-gun proteomic analyses can mine deeper into the proteome, DIGEallows the reliable quantification of differences as low as 10% in protein expression andvisualizes the post-translational modifications of intact proteins as shift in isoelectric pointor molecular weight. Membrane proteins, however, are not well represented by thistechnique. Despite a pronounced change in the transcription of the K(ATP) channelcomponents, we were unable to detect K(ATP) channels on 2-DE gels. Furthermore, 1H-NMR, as employed in the present study, allows the quantification of the major stablemetabolites in cardiac tissue extracts. 31P-NMR would allow the detection of labile cardiac
Mayr et al. Page 7
Published as: J Mol Cell Cardiol. 2011 June ; 50(6): 982–990.
Sponsored Docum
ent Sponsored D
ocument
Sponsored Docum
ent

energetic metabolites, such as phosphocreatine, ATP, inorganic phosphate and intracellularpH, to better clarify the degree of hypoxia.
4.5 ConclusionsIn this study, we comprehensively analyze a conditional mouse model of myocardialhibernation by 3 independent “-omics” methodologies. We demonstrate how the integrationof corresponding mRNA, protein and metabolite changes by network analysis aids in theidentification of key biological pathways that underlie this important cardioprotectivephenomenon. The combination of different “-omics” approaches will be indispensable for anintegrated phenotyping of transgenic animals [12] and addressing the multiple facets ofcardiovascular diseases in a systems biology approach.
5 Funding sourcesThis work was funded by the European Vascular Genomics Network (LSHM-CT-2003-503254; Brussels, B) as part of the 6th European Framework Programme andgrants from the British Heart Foundation, and Oak Foundation. M.M. is supported by aSenior Research Fellowship of the British Heart Foundation.
6 DisclosuresThere are no conflicts of interests to disclose.
References1. Rahimtoola S.H. The hibernating myocardium. Am. Heart J.. 1989; 117(1):211–221. [PubMed:
2783527]2. Depre C. Vatner S.F. Mechanisms of cell survival in myocardial hibernation. Trends Cardiovasc.
Med.. 2005; 15(3):101–110. [PubMed: 16039970]3. Opie, L.H. 4th ed.. Lippincott Williams & Wilkins; Philadelphia: 2004. Heart physiology: from cell
to circulation.4. Heusch G. Schulz R. Rahimtoola S.H. Myocardial hibernation: a delicate balance. Am. J. Physiol.
Heart Circ. Physiol.. 2005; 288(3):H984–H999. [PubMed: 15563526]5. Heusch G. Schulz R. The biology of myocardial hibernation. Trends Cardiovasc. Med.. 2000; 10(3):
108–114. [PubMed: 11427997]6. Page B. Young R. Iyer V. Suzuki G. Lis M. Korotchkina L. Persistent regional downregulation in
mitochondrial enzymes and upregulation of stress proteins in swine with chronic hibernatingmyocardium. Circ. Res.. 2008; 102(1):103–112. [PubMed: 17967786]
7. May D. Gilon D. Djonov V. Itin A. Lazarus A. Gordon O. Transgenic system for conditionalinduction and rescue of chronic myocardial hibernation provides insights into genomic programs ofhibernation. Proc. Natl Acad. Sci. USA. 2008; 105(1):282–287. [PubMed: 18162550]
8. Mayr M. Metzler B. Chung Y.L. McGregor E. Mayr U. Troy H. Ischemic preconditioningexaggerates cardiac damage in PKC-delta null mice. Am. J. Physiol. Heart Circ. Physiol.. 2004;287(2):H946–H956. [PubMed: 15277209]
9. Mayr M. Chung Y.L. Mayr U. McGregor E. Troy H. Baier G. Loss of PKC-delta alters cardiacmetabolism. Am. J. Physiol. Heart Circ. Physiol.. 2004; 287(2):H937–H945. [PubMed: 15277208]
10. Mayr M. Liem D. Zhang J. Li X. Avliyakulov N.K. Yang J.I. Proteomic and metabolomic analysisof cardioprotection: interplay between protein kinase C epsilon and delta in regulating glucosemetabolism of murine hearts. J. Mol. Cell. Cardiol.. 2009; 46(2):268–277. [PubMed: 19027023]
11. Mayr M. Madhu B. Xu Q. Proteomics and metabolomics combined in cardiovascular research.Trends Cardiovasc. Med.. 2007; 17(2):43–48. [PubMed: 17292045]
12. Puntmann V.O. Mayr M. Phenotyping transgenic animals—an integrated readout ofpathophysiology by combining proteomics and metabolomics with cardiovascular imaging. J. Mol.Cell. Cardiol.. 2010; 48(4):571–573. [PubMed: 20025886]
Mayr et al. Page 8
Published as: J Mol Cell Cardiol. 2011 June ; 50(6): 982–990.
Sponsored Docum
ent Sponsored D
ocument
Sponsored Docum
ent

13. Mayr M. Siow R. Chung Y.L. Mayr U. Griffiths J.R. Xu Q. Proteomic and metabolomic analysisof vascular smooth muscle cells: role of PKCdelta. Circ. Res.. 2004; 94(10):e87–e96. [PubMed:15131007]
14. Taegtmeyer H. Sen S. Vela D. Return to the fetal gene program: a suggested metabolic link to geneexpression in the heart. Ann. NY Acad. Sci.. 2010; 1188:191–198. [PubMed: 20201903]
15. van der Velden J. Merkus D. Klarenbeek B.R. James A.T. Boontje N.M. Dekkers D.H. Alterationsin myofilament function contribute to left ventricular dysfunction in pigs early after myocardialinfarction. Circ. Res.. 2004; 95(11):e85–e95. [PubMed: 15528471]
16. Rabilloud T. Heller M. Gasnier F. Luche S. Rey C. Aebersold R. Proteomics analysis of cellularresponse to oxidative stress. Evidence for in vivo overoxidation of peroxiredoxins at their activesite. J. Biol. Chem.. 2002; 277(22):19396–19401. [PubMed: 11904290]
17. Mayr M. Chung Y.L. Mayr U. Yin X. Ly L. Troy H. Proteomic and metabolomic analyses ofatherosclerotic vessels from apolipoprotein E-deficient mice reveal alterations in inflammation,oxidative stress, and energy metabolism. Arterioscler. Thromb. Vasc. Biol.. 2005; 25(10):2135–2142. [PubMed: 16123314]
18. Dhar-Chowdhury P. Harrell M.D. Han S.Y. Jankowska D. Parachuru L. Morrissey A. Theglycolytic enzymes, glyceraldehyde-3-phosphate dehydrogenase, triose-phosphate isomerase, andpyruvate kinase are components of the K(ATP) channel macromolecular complex and regulate itsfunction. J. Biol. Chem.. 2005; 280(46):38464–38470. [PubMed: 16170200]
19. Jovanovic S. Du Q. Crawford R.M. Budas G.R. Stagljar I. Jovanovic A. Glyceraldehyde 3-phosphate dehydrogenase serves as an accessory protein of the cardiac sarcolemmal K(ATP)channel. EMBO Rep.. 2005; 6(9):848–852. [PubMed: 16082386]
20. Carrasco A.J. Dzeja P.P. Alekseev A.E. Pucar D. Zingman L.V. Abraham M.R. Adenylate kinasephosphotransfer communicates cellular energetic signals to ATP-sensitive potassium channels.Proc. Natl Acad. Sci. USA. 2001; 98(13):7623–7628. [PubMed: 11390963]
21. Rumsey W.L. Abbott B. Bertelsen D. Mallamaci M. Hagan K. Nelson D. Adaptation to hypoxiaalters energy metabolism in rat heart. Am. J. Physiol.. 1999; 276(1 Pt 2):H71–H80. [PubMed:9887019]
22. Fell, D. 1st ed.. Portland Press; London: 1996. Understanding the control of metabolism.23. Chance B. Williams G.R. The respiratory chain and oxidative phosphorylation. Adv. Enzymol.
Relat. Subj. Biochem.. 1956; 17:65–134. [PubMed: 13313307]24. Chance B. Williams G.R. Respiratory enzymes in oxidative phosphorylation. VI. The effects of
adenosine diphosphate on azide-treated mitochondria. J Biol Chem. 1956; 221(1):477–489.[PubMed: 13345836]
25. Balaban R.S. Cardiac energy metabolism homeostasis: role of cytosolic calcium. J. Mol. Cell.Cardiol.. 2002; 34(10):1259–1271. [PubMed: 12392982]
26. Cortassa S. O'Rourke B. Winslow R.L. Aon M.A. Control and regulation of mitochondrialenergetics in an integrated model of cardiomyocyte function. Biophys. J.. 2009; 96(6):2466–2478.[PubMed: 19289071]
27. Depre C. Kim S.J. John A.S. Huang Y. Rimoldi O.E. Pepper J.R. Program of cell survivalunderlying human and experimental hibernating myocardium. Circ. Res.. 2004; 95(4):433–440.[PubMed: 15242971]
28. Olsson M.C. Patel J.R. Fitzsimons D.P. Walker J.W. Moss R.L. Basal myosin light chainphosphorylation is a determinant of Ca2+ sensitivity of force and activation dependence of thekinetics of myocardial force development. Am. J. Physiol. Heart Circ. Physiol.. 2004;287(6):H2712–H2718. [PubMed: 15331360]
29. Schillinger W. Kogler H. Altered phosphorylation and Ca2+-sensitivity of myofilaments in humanheart failure. Cardiovasc. Res.. 2003; 57(1):5–7. [PubMed: 12504808]
30. van der Velden J. Papp Z. Zaremba R. Boontje N.M. de Jong J.W. Owen V.J. Increased Ca2+-sensitivity of the contractile apparatus in end-stage human heart failure results from alteredphosphorylation of contractile proteins. Cardiovasc. Res.. 2003; 57(1):37–47. [PubMed:12504812]
31. Kane G.C. Liu X.K. Yamada S. Olson T.M. Terzic A. Cardiac KATP channels in health anddisease. J. Mol. Cell. Cardiol.. 2005; 38(6):937–943. [PubMed: 15910878]
Mayr et al. Page 9
Published as: J Mol Cell Cardiol. 2011 June ; 50(6): 982–990.
Sponsored Docum
ent Sponsored D
ocument
Sponsored Docum
ent
32. Hochachka P.W. Buck L.T. Doll C.J. Land S.C. Unifying theory of hypoxia tolerance: molecular/metabolic defense and rescue mechanisms for surviving oxygen lack. Proc. Natl Acad. Sci. USA.1996; 93(18):9493–9498. [PubMed: 8790358]
33. Kroll K. Decking U.K. Dreikorn K. Schrader J. Rapid turnover of the AMP-adenosine metaboliccycle in the guinea pig heart. Circ. Res.. 1993; 73(5):846–856. [PubMed: 8403255]
34. Kroll K. Kinzie D.J. Gustafson L.A. Open-system kinetics of myocardial phosphoenergetics duringcoronary underperfusion. Am. J. Physiol.. 1997; 272(6 Pt 2):H2563–H2576. [PubMed: 9227532]
35. Peart J.N. Gross G.J. Cardioprotection following adenosine kinase inhibition in rat hearts. BasicRes. Cardiol.. 2005; 100(4):328–336. [PubMed: 15795795]
36. Wieland B. Tomasselli A.G. Noda L.H. Frank R. Schulz G.E. The amino acid sequence ofGTP:AMP phosphotransferase from beef-heart mitochondria. Extensive homology with cytosolicadenylate kinase. Eur. J. Biochem.. 1984; 143(2):331–339. [PubMed: 6088234]
37. Liu R. Strom A.L. Zhai J. Gal J. Bao S. Gong W. Enzymatically inactive adenylate kinase 4interacts with mitochondrial ADP/ATP translocase. Int. J. Biochem. Cell Biol.. 2009; 41(6):1371–1380. [PubMed: 19130895]
38. Wallis J. Lygate C.A. Fischer A. ten Hove M. Schneider J.E. Sebag-Montefiore L. Supranormalmyocardial creatine and phosphocreatine concentrations lead to cardiac hypertrophy and heartfailure: insights from creatine transporter-overexpressing transgenic mice. Circulation. 2005;112(20):3131–3139. [PubMed: 16286605]
39. Phillips D. Ten Hove M. Schneider J.E. Wu C.O. Sebag-Montefiore L. Aponte A.M. Mice over-expressing the myocardial creatine transporter develop progressive heart failure and showdecreased glycolytic capacity. J. Mol. Cell. Cardiol.. 2010; 48(4):582–590. [PubMed: 19913546]
40. Cannon W.A. On the variation of the oxygen content of cultural solutions. Science. 1932;75(1934):108–109. [PubMed: 17799377]
41. Schoenheimer R. Rittenberg D. The application of isotopes to the study of intermediarymetabolism. Science. 1938; 87(2254):221–226. [PubMed: 17770403]
Appendix A Supplementary dataRefer to Web version on PubMed Central for supplementary material.
Mayr et al. Page 10
Published as: J Mol Cell Cardiol. 2011 June ; 50(6): 982–990.
Sponsored Docum
ent Sponsored D
ocument
Sponsored Docum
ent
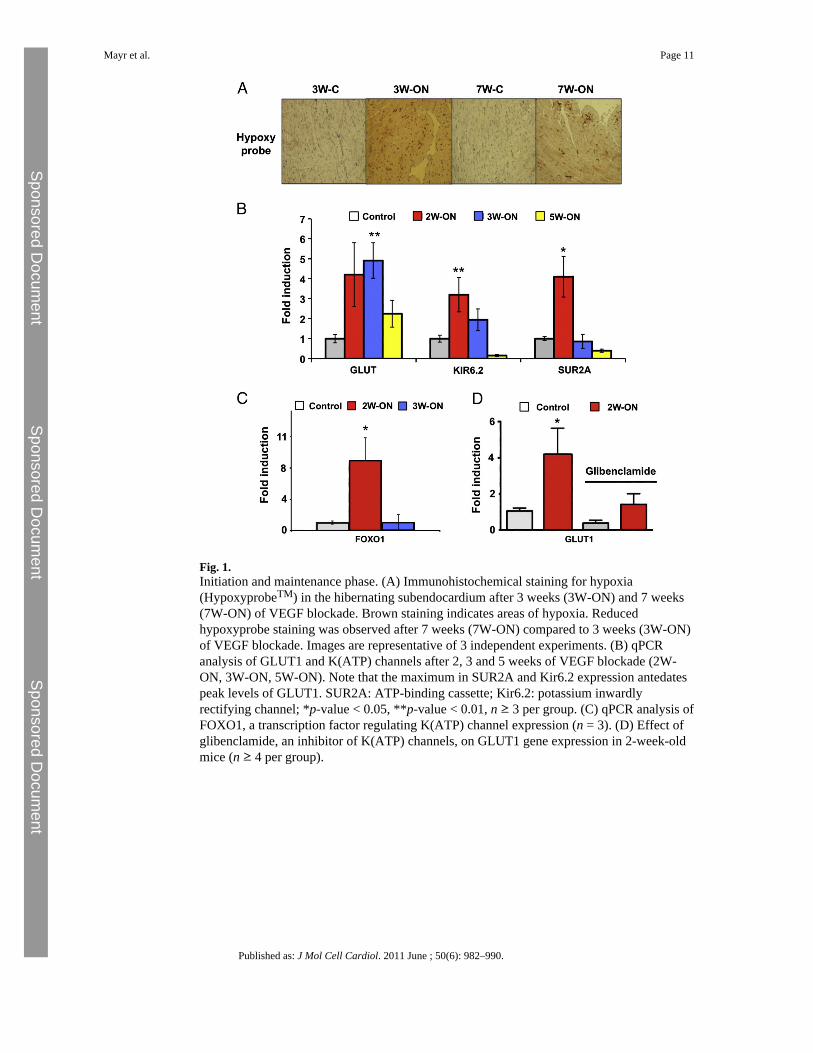
Fig. 1.Initiation and maintenance phase. (A) Immunohistochemical staining for hypoxia(HypoxyprobeTM) in the hibernating subendocardium after 3 weeks (3W-ON) and 7 weeks(7W-ON) of VEGF blockade. Brown staining indicates areas of hypoxia. Reducedhypoxyprobe staining was observed after 7 weeks (7W-ON) compared to 3 weeks (3W-ON)of VEGF blockade. Images are representative of 3 independent experiments. (B) qPCRanalysis of GLUT1 and K(ATP) channels after 2, 3 and 5 weeks of VEGF blockade (2W-ON, 3W-ON, 5W-ON). Note that the maximum in SUR2A and Kir6.2 expression antedatespeak levels of GLUT1. SUR2A: ATP-binding cassette; Kir6.2: potassium inwardlyrectifying channel; *p-value < 0.05, **p-value < 0.01, n ≥ 3 per group. (C) qPCR analysis ofFOXO1, a transcription factor regulating K(ATP) channel expression (n = 3). (D) Effect ofglibenclamide, an inhibitor of K(ATP) channels, on GLUT1 gene expression in 2-week-oldmice (n ≥ 4 per group).
Mayr et al. Page 11
Published as: J Mol Cell Cardiol. 2011 June ; 50(6): 982–990.
Sponsored Docum
ent Sponsored D
ocument
Sponsored Docum
ent
Fig. 2.Protein expression during the maintenance phase. Protein extracts from control andhibernating hearts after 6 weeks of VEGF blockade (6W-ON) were quantified using DIGE.Differentially expressed spots were numbered and identified by LC-MS/MS (Table 1).
Mayr et al. Page 12
Published as: J Mol Cell Cardiol. 2011 June ; 50(6): 982–990.
Sponsored Docum
ent Sponsored D
ocument
Sponsored Docum
ent
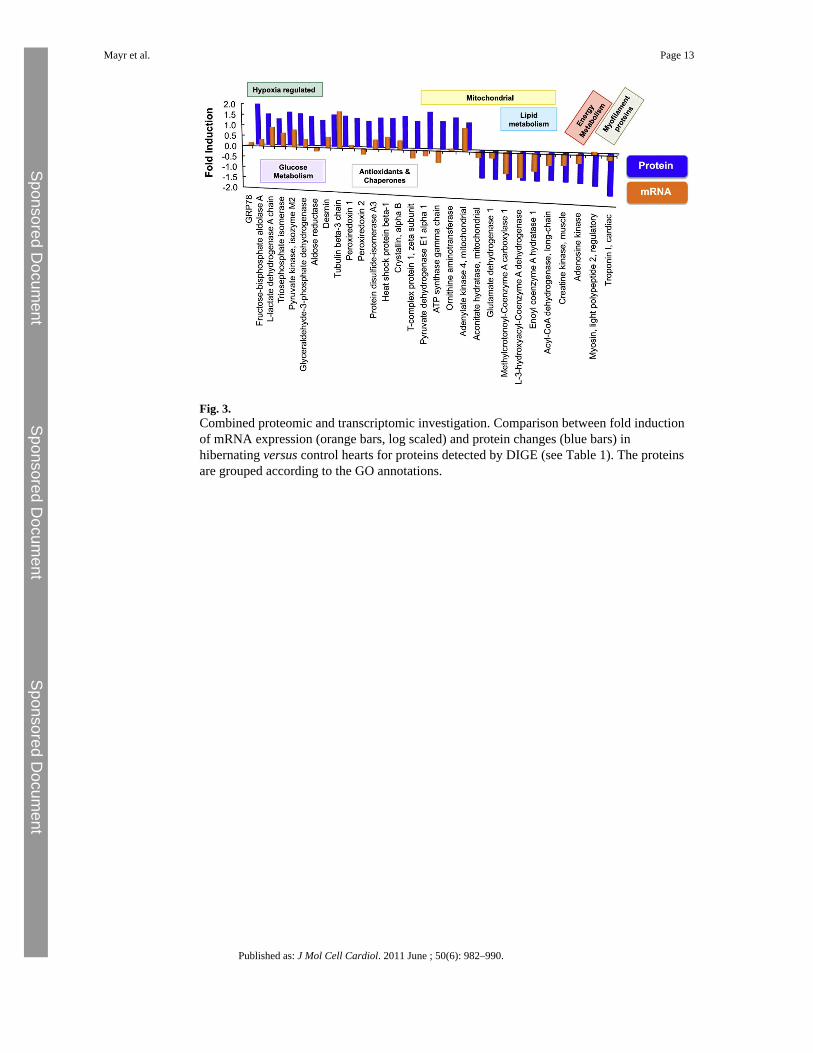
Fig. 3.Combined proteomic and transcriptomic investigation. Comparison between fold inductionof mRNA expression (orange bars, log scaled) and protein changes (blue bars) inhibernating versus control hearts for proteins detected by DIGE (see Table 1). The proteinsare grouped according to the GO annotations.
Mayr et al. Page 13
Published as: J Mol Cell Cardiol. 2011 June ; 50(6): 982–990.
Sponsored Docum
ent Sponsored D
ocument
Sponsored Docum
ent

Fig. 4.Protein expression and post-translational modifications. (A) Western blot analysis ofGLUT1, LDH and IGFBP2 in hibernating and control hearts (6W-ON). (B, C) Phosphate-affinity gel electrophoresis for mobility shift detection of phosphorylated proteins.Significant changes were detected in the phosphorylation (upper panel, bands marked withan arrow) of myosin regulatory light chain 2 (MLC2, B) and cardiac troponin I (TnI, C)without differences in protein abundance (lower panels). Quantitative data are shown inSupplemental Figure 3. (D) Western blot analysis of anti-oxidant proteins in hibernating andcontrol hearts. Densitometry data for SOD2 are provided in Supplemental Figure 3.
Mayr et al. Page 14
Published as: J Mol Cell Cardiol. 2011 June ; 50(6): 982–990.
Sponsored Docum
ent Sponsored D
ocument
Sponsored Docum
ent

Fig. 5.High-resolution 1H-NMR spectroscopy of cardiac tissue extracts. Representative spectra ofthe aliphatic region (− 0.05 to 4.2 ppm) from control (bottom) and hibernating hearts (top).Quantitative metabolite data are presented in Table 2.
Mayr et al. Page 15
Published as: J Mol Cell Cardiol. 2011 June ; 50(6): 982–990.
Sponsored Docum
ent Sponsored D
ocument
Sponsored Docum
ent

Fig. 6.Bioinformatic analysis. (A) An interaction matrix was constructed using Cytoscapesoftware. The nodes of the differentially expressed transcripts fall into 2 major clusterslinked by transcription factor 4 and SNCAIP. (B) For pathway analysis, the transcriptomic,proteomic and metabolomic datasets were combined using the MetaCore™ systems biologyanalysis suite. Collective bioinformatic interrogation of the 3 different -omic datasetsimproved the statistical significance (visualized as an increase in the -log (p-value)) andresulted in a rearrangement in the ranking of the top scoring pathways (Supplemental TableIII).
Mayr et al. Page 16
Published as: J Mol Cell Cardiol. 2011 June ; 50(6): 982–990.
Sponsored Docum
ent Sponsored D
ocument
Sponsored Docum
ent

Sponsored Docum
ent Sponsored D
ocument
Sponsored Docum
ent
Mayr et al. Page 17
Tabl
e 1
Diff
eren
tially
exp
ress
ed p
rote
ins i
dent
ifica
tions
by
tand
em m
ass s
pect
rom
etry
(LC
-MS/
MS)
No.
Prot
ein
iden
tity
Fold
cha
nge
hibe
rnat
ing
vs c
ontr
olP-
valu
e (t-
test
)P-
valu
e (F
DR
)SW
ISS
PRO
T a
cces
sion
num
ber
The
oret
ical
pI/
MW
Obs
erve
d pI
/MW
No
of id
entif
ied
pept
ides
Sequ
ence
cov
erag
e (%
)
Glu
cose
met
abol
ism
28Fr
ucto
se-b
isph
osph
ate
aldo
lase
A+
1.52
4.4e
-05
0.00
27A
LDO
A_M
OU
SE8.
4 / 3
9.2
8.7
/ 41.
622
52.5
0%
40Tr
iose
phos
phat
e is
omer
ase
+ 1.
430.
0001
0.00
38TP
IS_M
OU
SE7.
1 / 2
6.6
7.5
/ 22.
05
20.5
0%
41Tr
iose
phos
phat
e is
omer
ase
+ 1.
350.
0002
0.00
55TP
IS_M
OU
SE7.
1 / 2
6.6
7.9
/ 21.
816
58.2
0%
42Tr
iose
phos
phat
e is
omer
ase
+ 2.
131.
2e-0
73.
1e-5
TPIS
_MO
USE
7.1
/ 26.
68.
1 / 2
1.6
1251
.80%
31G
lyce
rald
ehyd
e-3-
phos
phat
e de
hydr
ogen
ase
+ 1.
411.
1e-0
50.
0010
G3P
_MO
USE
8.1
/ 47.
78.
6 / 3
5.7
928
.80%
16Py
ruva
te k
inas
e, is
ozym
e M
1/M
2+
1.23
0.04
00.
24K
PYM
_MO
USE
7.4
/ 57.
77.
9 / 6
0.3
2337
.70%
17Py
ruva
te k
inas
e, is
ozym
e M
1/M
2+
1.54
7.3e
-07
9.8e
-5K
PYM
_MO
USE
7.4
/ 57.
78.
1 / 6
0.0
1929
.90%
18Py
ruva
te k
inas
e, is
ozym
e M
1/M
2+
1.24
0.00
020.
0048
KPY
M_M
OU
SE7.
4 / 5
7.7
8.2
/ 60.
29
20.0
0%
24Py
ruva
te d
ehyd
roge
nase
E1
com
pone
nt a
lpha
subu
nit
+ 1.
660.
0008
0.01
4O
DPA
_MO
USE
8.5
/ 43.
27.
7 / 4
8.7
1530
.00%
29A
ldos
e re
duct
ase
+ 1.
240.
026
0.09
1A
LDR
_MO
USE
6.8
/ 35.
67.
8 / 3
6.0
1338
.60%
33L-
Lact
ate
dehy
drog
enas
e A
cha
in+
1.29
7.8e
-05
0.00
38LD
HA
_MO
USE
7.6
/ 29.
58.
2 / 3
3.3
1130
.10%
Lipi
d m
etab
olis
m
25A
cyl-C
oA d
ehyd
roge
nase
, lon
g-ch
ain
spec
ific
−1.29
0.01
30.
061
AC
AD
L_M
OU
SE8.
5 / 4
7.9
7.6
/ 45.
02
5.12
%
34D
elta
3,5-
delta
2,4-
dien
oyl-C
oA is
omer
ase,
mito
chon
dria
l−1.23
0.00
30.
028
ECH
1_M
OU
SE7.
6 / 3
6.1
7.1
/ 29.
34
10.1
0%
35H
ydro
xyac
yl-c
oenz
yme
A d
ehyd
roge
nase
, mito
chon
dria
l−1.22
0.00
20.
021
HC
DH
_MO
USE
8.8
/ 34.
58.
6 / 3
2.0
1222
.00%
Amin
o ac
id m
etab
olis
m
20G
luta
mat
e de
hydr
ogen
ase
1, m
itoch
ondr
ial
−1.23
0.02
20.
082
DH
E3_M
OU
SE8.
1 / 6
1.3
8.0
/ 56.
914
25.1
0%
7M
ethy
lcro
tono
yl-C
oA c
arbo
xyla
se a
lpha
cha
in, m
itoch
ondr
ial
−1.21
0.00
040.
008
MC
CA
_MO
USE
7.7
/ 79.
38.
0 / 7
4.1
1113
.80%
23O
rnith
ine
amin
otra
nsfe
rase
, mito
chon
dria
l+
1.42
9.8e
-08
3.1e
-5O
AT_
MO
USE
6.2
/ 48.
36.
6 / 4
8.3
24.
78%
TCA
cycl
e
5A
coni
tate
hyd
rata
se, m
itoch
ondr
ial
−1.20
0.02
10.
078
AC
ON
_MO
USE
8.1
/ 85.
48.
0 / 8
0.0
67.
95%
6A
coni
tate
hyd
rata
se, c
ytop
lasm
ic−1.29
0.03
40.
095
AC
OC
_MO
USE
7.2
/ 98.
18.
4 / 8
4.8
1314
.80%
36A
TP sy
ntha
se g
amm
a ch
ain,
mito
chon
dria
l+
1.27
0.02
10.
078
ATP
G_M
OU
SE9.
1 / 3
2.8
9.1
/27.
15
15.1
0%
Ener
gy m
etab
olis
m
22A
deno
sine
kin
ase
−1.25
0.02
90.
093
AD
K_M
OU
SE7.
2 / 3
1.1
6.4
/ 46.
02
3.88
%
Published as: J Mol Cell Cardiol. 2011 June ; 50(6): 982–990.
Sponsored Docum
ent Sponsored D
ocument
Sponsored Docum
ent
Mayr et al. Page 18
No.
Prot
ein
iden
tity
Fold
cha
nge
hibe
rnat
ing
vs c
ontr
olP-
valu
e (t-
test
)P-
valu
e (F
DR
)SW
ISS
PRO
T a
cces
sion
num
ber
The
oret
ical
pI/
MW
Obs
erve
d pI
/MW
No
of id
entif
ied
pept
ides
Sequ
ence
cov
erag
e (%
)
27C
reat
ine
kina
se M
-type
−1.22
0.00
20.
020
KC
RM
_MO
USE
6.6
/ 43.
08.
0 / 4
3.8
2454
.10%
49A
deny
late
kin
ase
4, m
itoch
ondr
ial
+ 1.
240.
005
0.09
0K
AD
4_M
OU
SE7.
0 / 2
5.1
7.9
/ 23.
58
35.0
0%
Antio
xida
nts
48Pe
roxi
redo
xin
1+
1.35
0.00
020.
0055
PRD
X1_
MO
USE
8.3
/ 22.
28.
7 / 1
8.3
1142
.20%
44Pe
roxi
redo
xin
2+
1.23
0.01
10.
056
PRD
X2_
MO
USE
5.2
/ 21.
85.
0 / 1
8.4
624
.70%
9Pr
otei
n di
sulfi
de-is
omer
ase
+ 1.
320.
001
0.01
4PD
IA1_
MO
USE
4.8
/ 57.
14.
6 / 5
9.9
58.
64%
14Pr
otei
n di
sulfi
de-is
omer
ase
A3
+ 1.
435.
7e-0
60.
0006
1PD
IA3_
MO
USE
6.0
/ 56.
66.
5 / 6
0.5
611
.90%
Cha
pero
nes
178
kD
a gl
ucos
e-re
gula
ted
prot
ein
+ 2.
183.
8e-1
03.
1e-0
5G
RP7
8_M
OU
SE5.
1 / 7
2.4
5.0
/ 73.
621
33.7
0%
47A
lpha
cry
stal
lin B
cha
in+
1.46
9.6e
-05
0.00
38C
RY
AB
_MO
USE
6.8
/ 20.
18.
0 / 1
7.6
1045
.10%
39H
eat-s
hock
pro
tein
bet
a-1
(27
kDa)
+ 1.
360.
002
0.02
0H
SPB
1_M
OU
SE6.
1 / 2
3.0
6.1
/ 22.
22
9.09
%
8T-
com
plex
pro
tein
1, z
eta
subu
nit
+ 1.
250.
006
0.04
0TC
PZ_M
OU
SE6.
7 / 5
7.8
7.9
/ 64.
310
19.2
0%
Myo
filam
ents
43M
yosi
n re
gula
tory
ligh
t cha
in 2
, ven
tricu
lar/c
ardi
ac m
uscl
e is
ofor
m−1.34
0.01
80.
073
MLR
V_M
OU
SE4.
7 /1
8.8
4.6
/ 16.
511
46.4
0%
37Tr
opon
in I,
car
diac
mus
cle
−1.67
0.00
030.
0071
TNN
I3_M
OU
SE9.
6 / 2
1.2
9.4
/ 21.
02
9.48
%
Inte
rmed
iate
fila
men
ts, M
icro
tubu
les
11D
esm
in+
1.38
3.5e
-05
0.00
24D
ESM
_MO
USE
5.2
/ 53.
45.
2 / 5
6.4
2650
.70%
12D
esm
in+
1.50
3.3e
-07
5.8e
-05
DES
M_M
OU
SE5.
2 / 5
3.4
5.3
/ 56.
427
51.6
0%
10Tu
bulin
bet
a-2C
cha
in+
1.45
0.01
10.
056
TBB
2C_M
OU
SE4.
8 / 5
0.4
4.9
/ 57.
48
18.4
0%
Plas
ma
prot
eins
38A
polip
opro
tein
A-I
+ 1.
700.
001
0.01
6A
PA1_
MO
USE
5.6
/ 30.
65.
4 / 2
0.4
619
.70%
15Fi
brin
ogen
bet
a ch
ain
+ 1.
750.
001
0.01
2FI
BB
_MO
USE
6.7
/ 54.
76.
8 / 5
8.9
1021
.00%
13Fi
brin
ogen
gam
ma
chai
n+
1.22
0.02
0.23
FIB
G_M
OU
SE5.
5 / 4
9.4
5.7
/ 53.
83
6.65
%
2Se
rotra
nsfe
rrin
+ 1.
320.
003
0.02
8TR
FE_M
OU
SE6.
9 / 7
6.7
77.2
/ 7.
715
24.7
0%
3Se
rotra
nsfe
rrin
+ 1.
340.
001
0.01
8TR
FE_M
OU
SE6.
9 / 7
6.7
77.2
/ 7.
840
57.0
0%
4Se
rotra
nsfe
rrin
+ 1.
340.
002
0.01
9TR
FE_M
OU
SE6.
9 / 7
6.7
77.2
/ 7.
934
45.9
0%
Mix
ture
s
19M
ixtu
re:
−1.32
0.00
10.
017
Published as: J Mol Cell Cardiol. 2011 June ; 50(6): 982–990.

Sponsored Docum
ent Sponsored D
ocument
Sponsored Docum
ent
Mayr et al. Page 19
No.
Prot
ein
iden
tity
Fold
cha
nge
hibe
rnat
ing
vs c
ontr
olP-
valu
e (t-
test
)P-
valu
e (F
DR
)SW
ISS
PRO
T a
cces
sion
num
ber
The
oret
ical
pI/
MW
Obs
erve
d pI
/MW
No
of id
entif
ied
pept
ides
Sequ
ence
cov
erag
e (%
)
Succ
inyl
-CoA
:3-k
etoa
cid-
coen
zym
e A
tran
sfer
ase
1, m
itoch
ondr
ial
SCO
T1_M
OU
SE8.
7 / 6
0.0
8.0
/ 58.
58
18.7
0%
Cyt
osol
am
inop
eptid
ase
AM
PL_M
OU
SE6.
7 / 5
6.0
8.0
/ 58.
55
13.3
0%
21M
ixtu
re:
−1.24
0.00
80.
046
Bet
a-en
olas
eEN
OB
_MO
USE
6.7
/ 47.
08.
1 / 5
0.3
714
.50%
Fum
arat
e hy
drat
ase,
mito
chon
dria
lFU
MH
_MO
USE
9.1
/ 54.
28.
1 / 5
0.3
35.
72%
26M
ixtu
re−1.23
0.00
90.
049
Cre
atin
e ki
nase
M-ty
peK
CR
M_M
OU
SE6.
6 / 4
3.0
7.8
/ 44.
222
50.9
0%
Acy
l-CoA
deh
ydro
gena
se, l
ong-
chai
n sp
ecifi
cA
CA
DL_
MO
USE
8.5
/ 47.
97.
8 / 4
4.2
1840
.90%
30M
ixtu
re:
+ 1.
360.
002
0.00
55
Gly
oxyl
ate
redu
ctas
e/hy
drox
ypyr
uvat
e re
duct
ase
GR
HPR
_MO
USE
7.6
/ 35.
38.
2 / 3
6.5
1023
.50%
Gly
cera
ldeh
yde-
3-ph
osph
ate
dehy
drog
enas
eG
3P_M
OU
SE8.
5 / 3
5.7
8.2
/ 36.
58
29.1
0%
32M
ixtu
re:
−1.32
0.00
080.
014
Four
and
a h
alf L
IM d
omai
ns p
rote
in 2
FHL2
_MO
USE
7.3
/ 32.
18.
0 / 3
3.5
L-La
ctat
e de
hydr
ogen
ase
A c
hain
LDH
A_M
OU
SE7.
6 / 2
9.5
8.0
/ 33.
56
15.1
0%
45M
ixtu
re:
+ 1.
330.
008
0.04
6
NA
DH
deh
ydro
gena
se [u
biqu
inon
e] 1
bet
a su
bcom
plex
subu
nit 1
0N
DU
BA
_MO
USE
8.4
/ 20.
98.
8 / 1
9.6
840
.30%
Cys
tein
e an
d gl
ycin
e-ric
h pr
otei
n 3
CSR
P3_M
OU
SE8.
9 / 2
0.8
8.8
/ 19.
63
24.7
0%
46M
ixtu
re:
+ 1.
300.
007
0.04
3
Cys
tein
e an
d gl
ycin
e-ric
h pr
otei
n 3
CSR
P3_M
OU
SE8.
9 / 2
0.8
8.6
/ 19.
36
39.2
0%
Glu
tath
ione
S-tr
ansf
eras
e P1
GST
P1_M
OU
SE8.
1 / 2
3.5
8.6
/ 19.
35
37.6
0%
pI d
enot
es is
oele
ctric
poi
nt; M
W, m
olec
ular
wei
ght.
Diff
eren
ce in
-gel
ele
ctro
phor
esis
resu
lts w
ere
repr
oduc
ed w
ith d
iffer
ent b
iolo
gica
l rep
licat
es u
sing
reve
rse-
labe
ling
(bio
logi
cal r
eplic
ates
n =
4 fo
r con
trol a
nd h
iber
natin
g he
arts
, with
tech
nica
l rep
licat
es n
= 7
). P-
valu
es fo
r diff
eren
ces b
etw
een
the
two
grou
ps w
ere
deriv
ed fr
omun
paire
d t-t
ests
usi
ng D
ecyd
er so
ftwar
e (v
6.5,
GE
heal
thca
re).
Cor
rect
ions
for m
ultip
le te
stin
g w
ere
perf
orm
ed b
y th
e B
enja
min
i–H
ochb
erg
equa
tion,
yie
ldin
g Fa
lse
Dis
cove
ry ra
tes (
FDR
). Th
e di
ffer
entia
lly e
xpre
ssed
pro
tein
s are
num
bere
d in
Fig
. 2.
Published as: J Mol Cell Cardiol. 2011 June ; 50(6): 982–990.

Sponsored Docum
ent Sponsored D
ocument
Sponsored Docum
ent
Mayr et al. Page 20
Table 2
Metabolite changes by 1H-NMR in cardiac tissue extracts.
Control (n = 3) Hibernating (n = 5) Fold change P (t-test)
Leucine 0.101 (± 0.005) 0.075 (± 0.005) 0.74 0.016
Isoleucine 0.414 (± 0.138) 0.374 (± 0.107) 0.90 0.828
Valine 0.105 (± 0.011) 0.086 (± 0.008) 0.82 0.214
Isovalerate 0.123 (± 0.034) 0.143 (± 0.048) 1.16 0.774
Beta-OH butyrate 0.145 (± 0.030) 0.126 (± 0.026) 0.87 0.654
Lactate 10.383 (± 0.784) 11.689 (± 0.648) 1.12 0.255
Alanine 1.680 (± 0.273) 1.719 (± 0.106) 1.02 0.878
Acetate 0.337 (± 0.053) 0.310 (± 0.090) 0.92 0.835
Glutamate 3.752 (± 0.258) 2.563 (± 0.126) 0.68 0.003
Succinate 1.234 (± 0.343) 1.087 (± 0.119) 0.88 0.638
Glutamine 2.873 (± 0.315) 2.000 (± 0.186) 0.69 0.042
Aspartate 0.266 (± 0.097) 0.346 (± 0.073) 1.30 0.534
Choline 0.077 (± 0.005) 0.051 (± 0.004) 0.66 0.006
Phosphocholine 0.173 (± 0.027) 0.129 (± 0.013) 0.75 0.145
Carnitine 0.546 (± 0.091) 0.562 (± 0.033) 1.03 0.845
Taurine 22.11 (± 1.937) 16.01 (± 0.936) 0.72 0.018
Glycine 0.572 (± 0.033) 0.704 (± 0.082) 1.23 0.282
Creatine 8.349 (± 0.937) 6.051 (± 0.461) 0.72 0.047
Glycolic acid 0.583 (± 0.026) 0.572 (± 0.055) 0.98 0.882
Glucose 0.218 (± 0.100) 0.309 (± 0.061) 1.42 0.438
Fumerate 0.085 (± 0.023) 0.073 (± 0.012) 0.86 0.622
Tyrosine 0.134 (± 0.068) 0.036 (± 0.004) 0.27 0.098
Phenylalanine 0.051 (± 0.005) 0.043 (± 0.003) 0.84 0.217
Adenosine pool 3.419 (± 0.357) 2.808 (± 0.244) 0.82 0.193
NAD + NADH 0.344 (± 0.093) 0.360 (± 0.047) 1.05 0.875
Formate 0.306 (± 0.015) 0.300 (± 0.039) 0.98 0.912
Data presented are given in μmol/g wet weight (mean ± SE), n = 3 for control and n = 5 for hibernating hearts. P-values for differences between thetwo groups were derived from unpaired t-tests (bold numbers highlight significant differences P < 0.05).
Published as: J Mol Cell Cardiol. 2011 June ; 50(6): 982–990.
Copyright © 2022 FDOKUMEN