Materials, Resources, and Energy - Repository Universitas ...
36
-
Upload
khangminh22 -
Category
Documents
-
view
0 -
download
0
Transcript of Materials, Resources, and Energy - Repository Universitas ...
AIP Conference Proceedings 1977, 010001 (2018); https://doi.org/10.1063/1.5042855 1977, 010001
© 2018 Author(s).
Preface: Human-Dedicated SustainableProduct and Process Design: Materials,Resources, and EnergyCite as: AIP Conference Proceedings 1977, 010001 (2018); https://doi.org/10.1063/1.5042855Published Online: 26 June 2018
ARTICLES YOU MAY BE INTERESTED IN
Sponsor: Human-Dedicated Sustainable Product and Process Design: Materials, Resources,and EnergyAIP Conference Proceedings 1977, 010002 (2018); https://doi.org/10.1063/1.5042856
Preface: The 3rd International Conference on Engineering, Technology and IndustrialApplication (ICETIA)AIP Conference Proceedings 1855, 010001 (2017); https://doi.org/10.1063/1.4985445
Spot welding of bimetallic white cast iron-nodular cast ironAIP Conference Proceedings 1977, 020001 (2018); https://doi.org/10.1063/1.5042857
Preface: Human-Dedicated Sustainable Product and Process Design: Materials, Resources, and Energy
Proceedings of the 4th International Conference on Engineering, Technology, and Industrial Application (ICETIA) 2017
International Conference on Engineering, Technology and Industrial Application (ICETIA) is an international conference organized annually by the Engineering Faculty of Universitas Muhammadiyah Surakarta (UMS), known as the biggest private university in Central Java, Indonesia. The 4th ICETIA has been successfully held on 13-14 December 2017 at Alila Hotel, Surakarta, Central Java, Indonesia, attracting more than 300 participants.
This year’s conference brought a theme of Human-Dedicated Sustainable Product and Process Design: Materials, Resources, and Energy. It provided an excellent atmosphere for academicians, researchers, industrial professionals and government bodies to share ideas and any breakthrough in terms of materials, resources and energy aiming at establishing sustainable industrial development.
The committee received more than 200 papers, 174 of which were selected and presented in the conference. In these proceedings, the papers are then organized by grouping them into five sub-themes namely: (i) Sustainable Industrial Process and System Optimization, (ii) Product Design, Material and Building Engineering, (iii) Sustainable Infrastructure and Built Environment, (iv) Preservation, Conservation and Water Management, (v) Green Energy and Computing. It is expected that materials presented in these proceedings contribute constructively to create sustainable products and processes beneficial to humans.
Surakarta, Indonesia
7 March 2018
Editorial Board
Dr. Hari Prasetyo (Chief) Dr. Nurul Hidayati Dr. Eko Setiawan Dr. Tri Widayatno
Human-Dedicated Sustainable Product and Process Design: Materials, Resources, and EnergyAIP Conf. Proc. 1977, 010001-1–010001-1; https://doi.org/10.1063/1.5042855
Published by AIP Publishing. 978-0-7354-1687-1/$30.00
010001-1


Time
07.30 - 08.30 Registration08.30 - 09.00 Opening Ceremony09.00 - 09.45 Plenary Lecture 109.45 - 10.00 Coffe Break10.00 - 10.45 Plenary Lecture 210.45 - 11.30 Plenary Lecture 311.30 - 12.30 Luncheon
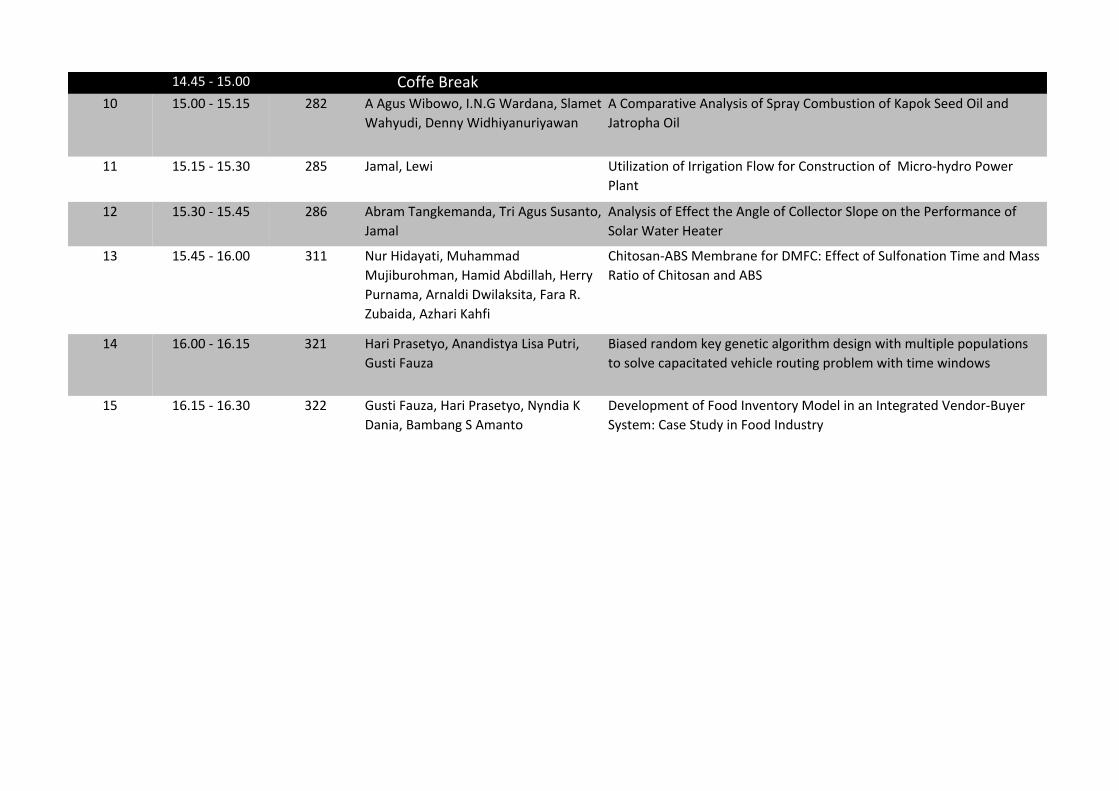
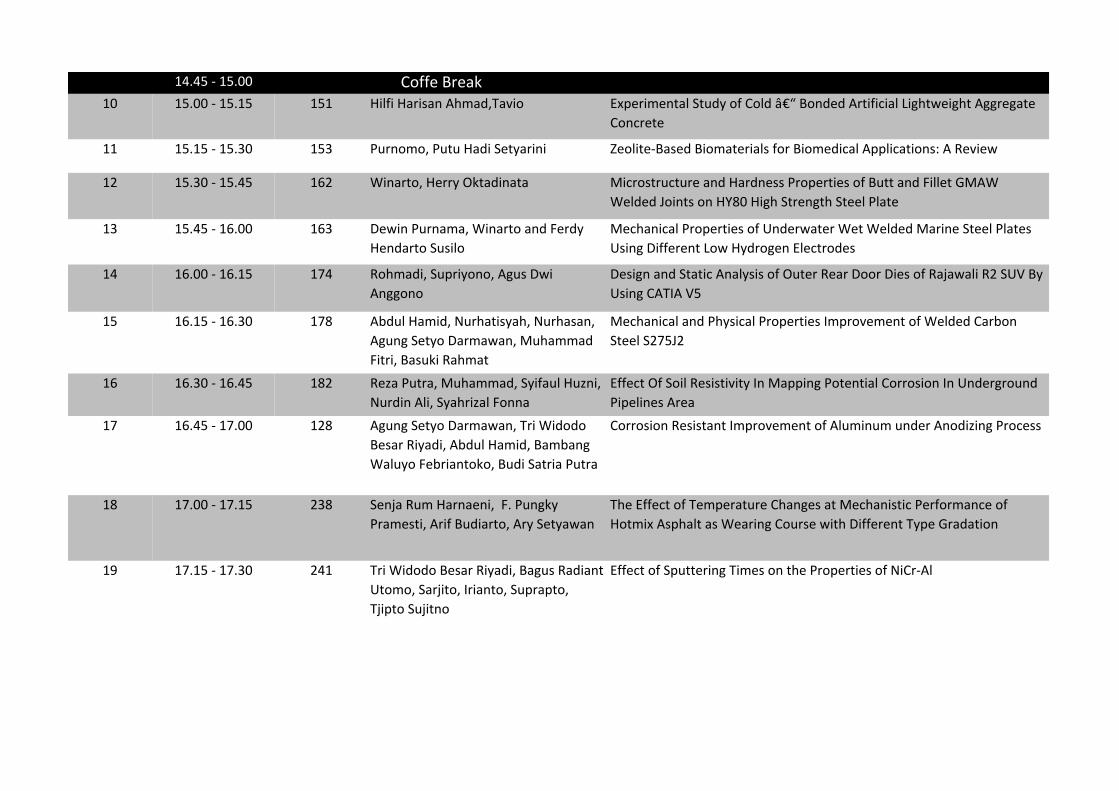
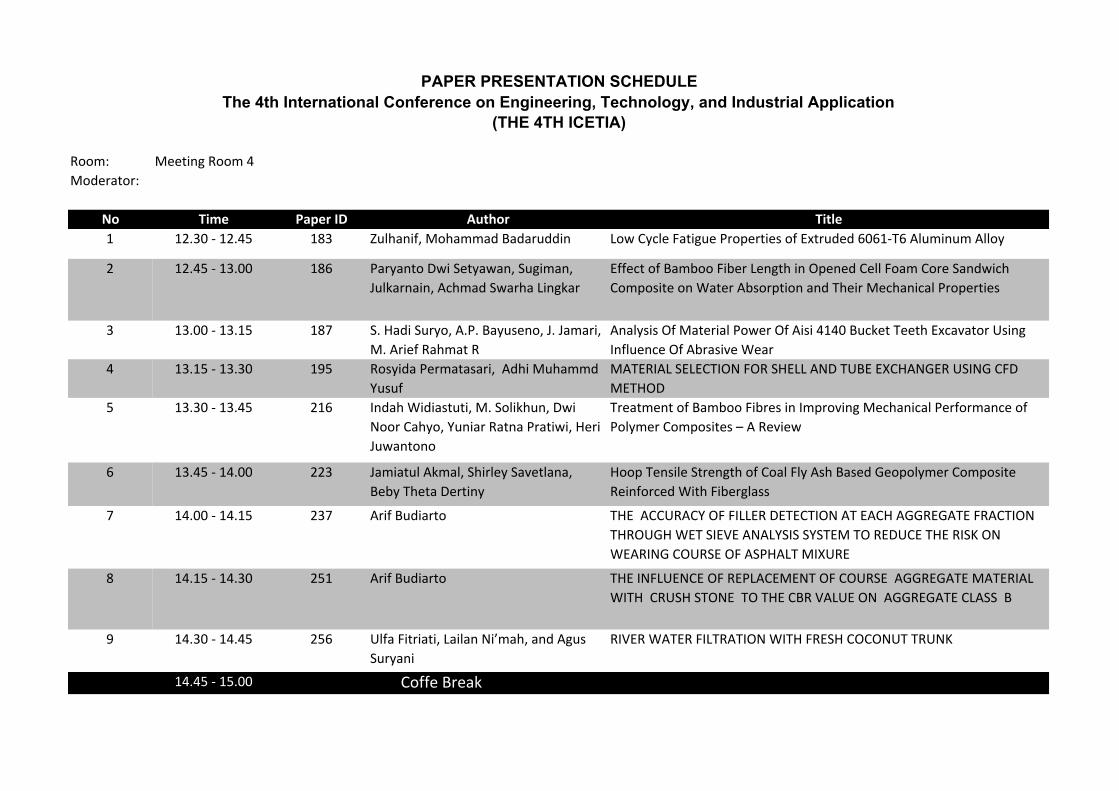
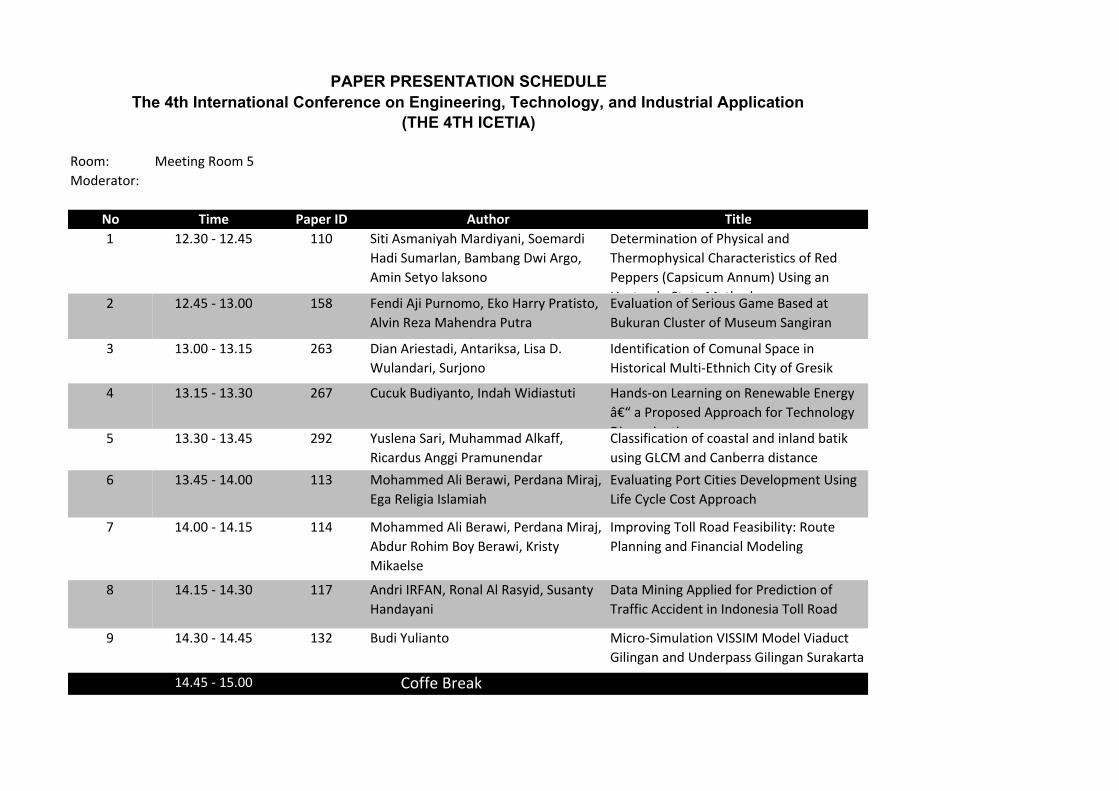
Oral Presentation - Parallel12.30 - 14.45 Session I14.45 - 15.00 Coffe Break
Oral Presentation - Parallel15.00 - 17.00 Session II17.00 - 17.30 Closing Ceremony
Program
Event Schedule
The 4th International Conference on Engineering, Technology, and Industrial Application (THE 4TH ICETIA)
Hotel Alila SoloWednesday, December 13, 2017
%;;9� !11?5:3�%;;9�
!;01=-?;=�
�� �� ������� ����� ����
�������� � !;4��,-1:-8��21:05��&@4-=5:5:3>54���A5
�:-B-?5
�9<8191:?-?5;:�;2�!;052510�$�#�!1?4;0�->�$;B1=�#<?595E1=�;2�&;8-=
$-:18�@:01=�$-=?5-8�&4-05:3��;:05?5;:�2;=��4-=35:3��-??1=D�&D>?19
�� ������� �� �������&'+�&�# �����������&�$'�
+�"�%�'%�
�<<85/-?5;:�;2���&D991?=5/-8��->/-010����=5031�!@8?581A18��:A1=?1=�B5?4
!;052510�&1<-=-?10����&;@=/1>��&��&��5:��1:?=-85E10�&;8-=�$;B1=�$8-:?
� ��������� �� �%���&�'+#�"(�%#�#��%��!���
!#������!�!
$ �&'���*�&'��(&��#"��#��� '�%"�'�)��%�"�*�� ���"�%�+
� �� ������� � �-:�!@35>505��#7?-=5:-��1=5D-:5��,15:-.
&���.018�%1459���-905��-?4@==;49-:
'41��:28@1:/1�;2��;:?-5:1=�!-?1=5-8��;:0@/?5A5?D�?;�&1-�*-?1=
�A-<;=-?5;:
���������� �� �==-0��4-:5�&-25?=-��"-585��@>:-��1B5�
;40D��5-:-
�C<1=591:?-8�&?@0D�;:�)��;==@3-?10�&;8-=��5=��1-?1=�B5?4�)-=5;@>�)�
�:381
� ��� ������� � �;7;�*-8@D;�����"�!-71=?54-=?4-�
�1==5�&@>-:?;
�:?1=9105-?1�<D=;8D>5>�;2�<-89�71=:18�>4188��1221/?�?19<1=-?@=1�-:0
/-?-8D>?�;:�<=;0@/?5;:�D5180
� ��������� � &@?;9; #@?81?�!;018�;2��;-C5-8�)-/@@9�'@.1�&;8-=��;881/?;=�;:��?4-:;8
�5>?588-?5;:
� �� ������� �� !;74-99-0��-495��E0454-==@05:�
&18AD�(2?;A5-��1<=5D-05��!@4-99-0
�@>-5:��95=��%504;��-:?;=;
&;8-=��=D1=�-:0�$4;?;A;8?-5/�2;=��5>4��;99;05?51>���->1�&?@0D����5>41=D
�;99@:5?D�-?��1:61=-:�&@=-.-D-
� ���������� � %;/459����-4D;:;��!@>85745:��50-D-?�
';9;45=;��75D-9-
'-=��1/;9<;>5?5;:�;A1=�$;=;@>� ;B��=-01��=;:�#=1
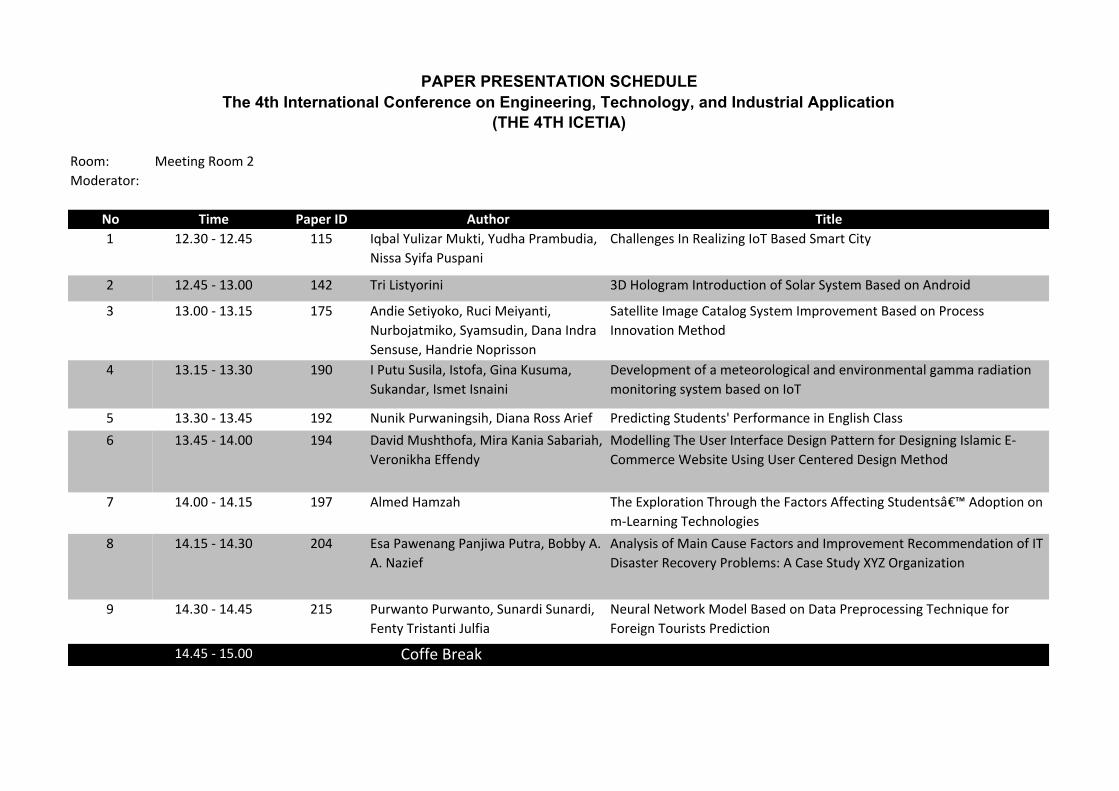
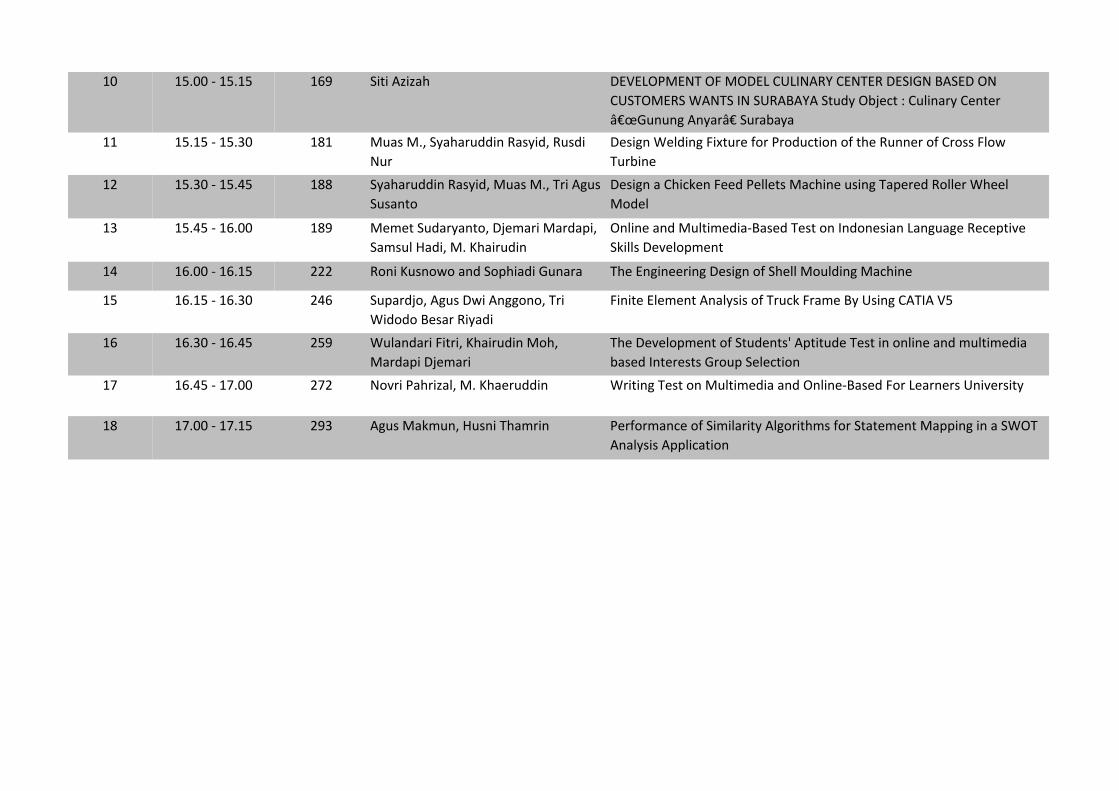
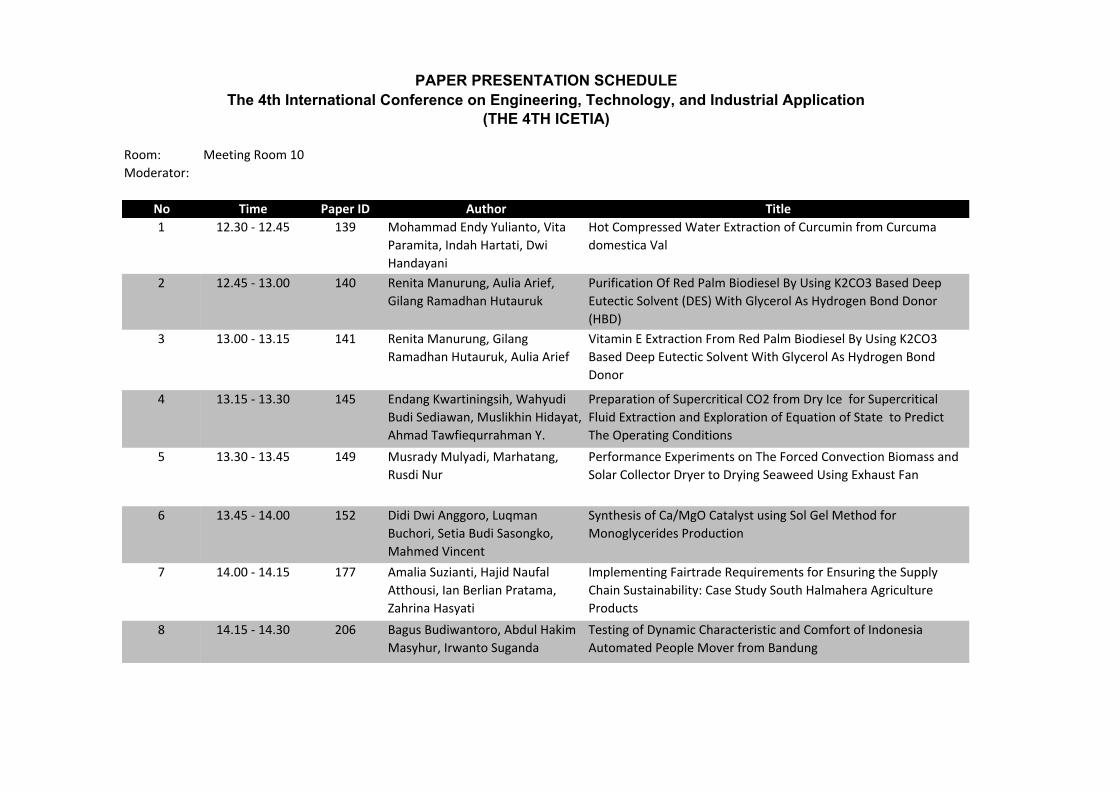
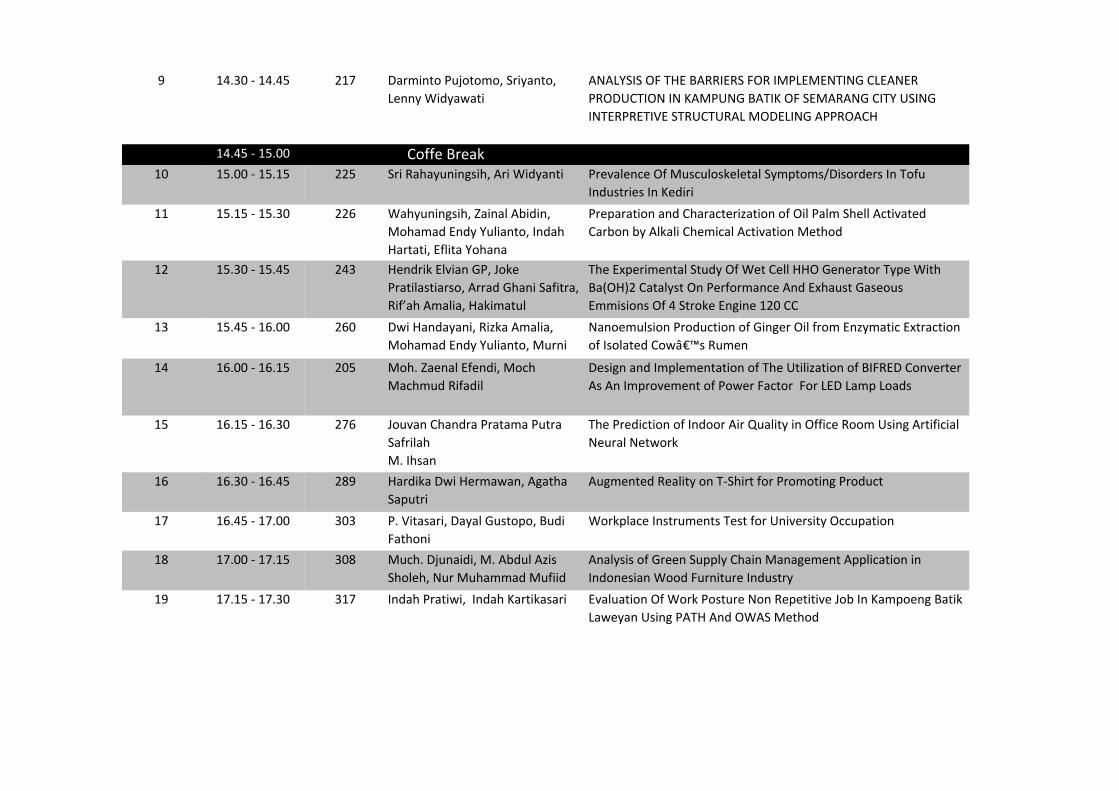
PAPER PRESENTATION SCHEDULEThe 4th International Conference on Engineering, Technology, and Industrial Application
(THE 4TH ICETIA)
��� ��� ���
� ������ � � ���3@>�*5.;B;����"���*-=0-:-��&8-91?
*-4D@05���1::D�*5045D-:@=5D-B-:
���;9<-=-?5A1��:-8D>5>�;2�&<=-D��;9.@>?5;:�;2��-<;7�&110�#58�-:0
�-?=;<4-�#58
� ��� ��� � �-9-8�� 1B5 (?585E-?5;:�;2��==53-?5;:��8;B�2;=��;:>?=@/?5;:�;2��!5/=;�4D0=;�$;B1=
$8-:?
������ �� �� �.=-9�'-:3719-:0-��'=5��3@>�&@>-:?;�
�-9-8
�:-8D>5>�;2��221/?�?41��:381�;2��;881/?;=�&8;<1�;:�?41�$1=2;=9-:/1�;2
&;8-=�*-?1=��1-?1=
� �� ������� � "@=��50-D-?5��!@4-99-0
!@65.@=;49-:���-950��.0588-4���1==D
$@=:-9-���=:-805��B58-7>5?-���-=-�%�
,@.-50-���E4-=5��-425
�45?;>-:���&�!19.=-:1�2;=��!�����221/?�;2�&@82;:-?5;:�'591�-:0�!->>
%-?5;�;2��45?;>-:�-:0���&
� ��������� � �-=5�$=->1?D;���:-:05>?D-� 5>-�$@?=5�
�@>?5��-@E-
�5->10�=-:0;9�71D�31:1?5/�-83;=5?49�01>53:�B5?4�9@8?5<81�<;<@8-?5;:>
?;�>;8A1�/-<-/5?-?10�A145/81�=;@?5:3�<=;.819�B5?4�?591�B5:0;B>
�� ������� � �@>?5��-@E-���-=5�$=->1?D;��"D:05-��
�-:5-���-9.-:3�&��9-:?;
�1A18;<91:?�;2��;;0��:A1:?;=D�!;018�5:�-:��:?13=-?10�)1:0;=��@D1=
&D>?19���->1�&?@0D�5:��;;0��:0@>?=D
�;221��=1-7
#::8� �00?492�#::8��
�:/0=,?:=�
�� �� ������� ����� ����
� ����������� ��� �<-,7�*@74E,=��@6?4��*@/3,�"=,8-@/4,�
4>>,�$D41,�"@>;,94
�3,770920>��9�#0,74E492��:%��,>0/�$8,=?��4?D
� ����������� �� %=4��4>?D:=494 ���:7:2=,8��9?=:/@.?4:9�:1�$:7,=�$D>?08��,>0/�:9��9/=:4/
����������� ��� �9/40�$0?4D:6:��#@.4��04D,9?4�
@=-:5,?846:��$D,8>@/49���,9,��9/=,
$09>@>0���,9/=40� :;=4>>:9
$,?0774?0��8,20��,?,7:2�$D>?08��8;=:A0809?��,>0/�:9�"=:.0>>
�99:A,?4:9��0?3:/
���������� ��� ��"@?@�$@>47,���>?:1,���49,��@>@8,�
$@6,9/,=���>80?��>9,494
�0A07:;809?�:1�,�80?0:=:7:24.,7�,9/�09A4=:9809?,7�2,88,�=,/4,?4:9
8:94?:=492�>D>?08�-,>0/�:9��:%
� ��������� ��� @946�"@=B,9492>43���4,9,�#:>>��=401 "=0/4.?492�$?@/09?>��"0=1:=8,9.0�49��9274>3��7,>>
� ���������� �� �,A4/��@>3?3:1,���4=,��,94,�$,-,=4,3�
'0=:9463,��1109/D
�:/077492�%30�&>0=��9?0=1,.0��0>429�",??0=9�1:=��0>429492��>7,84.���
�:880=.0�(0->4?0�&>492�&>0=��09?0=0/��0>429��0?3:/
� ����������� ��� �780/��,8E,3 %30��C;7:=,?4:9�%3=:@23�?30��,.?:=>��110.?492�$?@/09?>FHI��/:;?4:9�:9
8��0,=9492�%0.39:7:240>
� ���������� �� �>,�",B09,92�",954B,�"@?=,���:--D���
��� ,E401
�9,7D>4>�:1��,49��,@>0��,.?:=>�,9/��8;=:A0809?�#0.:8809/,?4:9�:1��%
�4>,>?0=�#0.:A0=D�"=:-708>�����,>0�$?@/D�)*+�!=2,94E,?4:9
� ��������� ��� "@=B,9?:�"@=B,9?:��$@9,=/4�$@9,=/4�
�09?D�%=4>?,9?4��@714,
0@=,7� 0?B:=6��:/07��,>0/�:9��,?,�"=0;=:.0>>492�%0.394<@0�1:=
�:=0429�%:@=4>?>�"=0/4.?4:9
�����������
PAPER PRESENTATION SCHEDULEThe 4th International Conference on Engineering, Technology, and Industrial Application
(THE 4TH ICETIA)
�:110��=0,6
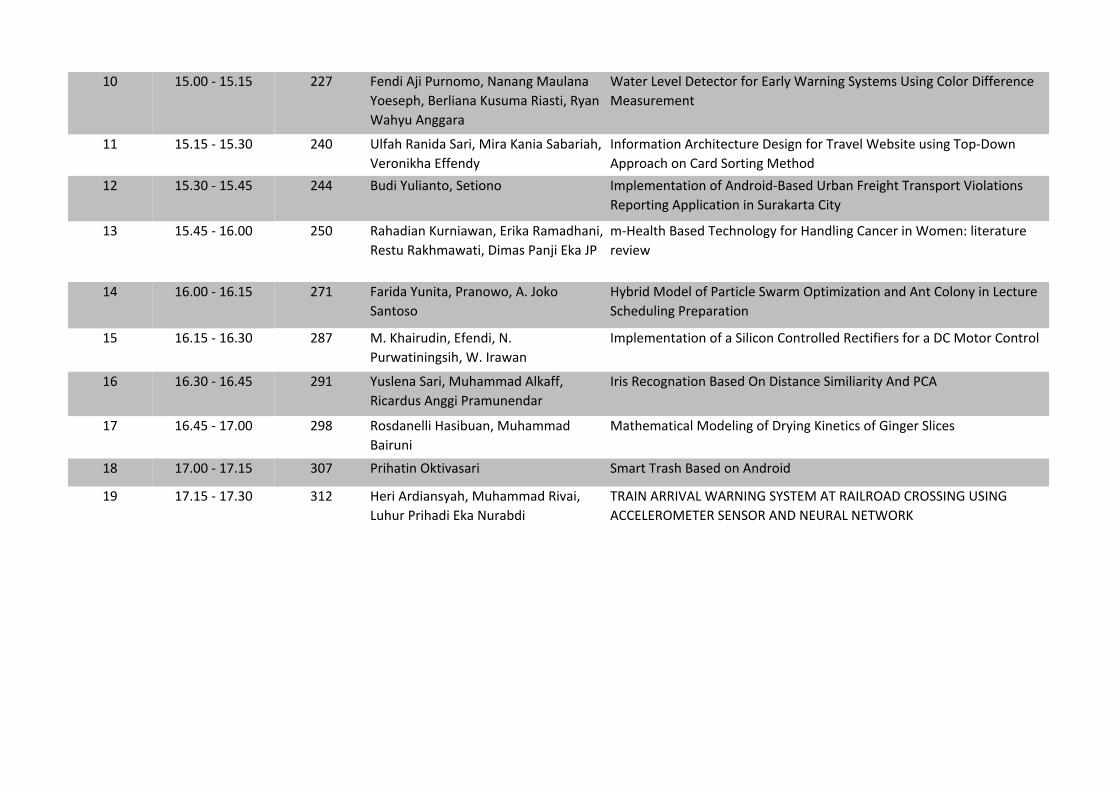
�� ������������� ��� �09/4��54�"@=9:8:�� ,9,92��,@7,9,
*:0>0;3���0=74,9,��@>@8,�#4,>?4��#D,9
(,3D@��922,=,
(,?0=��0A07��0?0.?:=�1:=��,=7D�(,=9492�$D>?08>�&>492��:7:=��4110=09.0
�0,>@=0809?
�� ������������ �� &71,3�#,94/,�$,=4���4=,��,94,�$,-,=4,3�
'0=:9463,��1109/D
�91:=8,?4:9��=.34?0.?@=0��0>429�1:=�%=,A07�(0->4?0�@>492�%:;��:B9
�;;=:,.3�:9��,=/�$:=?492��0?3:/
�� ����������� � �@/4�*@74,9?:��$0?4:9: �8;70809?,?4:9�:1��9/=:4/��,>0/�&=-,9��=0423?�%=,9>;:=?�'4:7,?4:9>
#0;:=?492��;;74.,?4:9�49�$@=,6,=?,��4?D
� ������������ ��� #,3,/4,9��@=94,B,9���=46,�#,8,/3,94�
#0>?@�#,638,B,?4���48,>�",954��6,��"
8��0,7?3��,>0/�%0.39:7:2D�1:=��,9/7492��,9.0=�49�(:809��74?0=,?@=0
=0A40B
� ������������� ��� �,=4/,�*@94?,��"=,9:B:������:6:
$,9?:>:
�D-=4/��:/07�:1�",=?4.70�$B,=8�!;?484E,?4:9�,9/��9?��:7:9D�49��0.?@=0
$.30/@7492�"=0;,=,?4:9
�� ������������ ��� ����3,4=@/49���109/4�� �
"@=B,?49492>43��(���=,B,9
�8;70809?,?4:9�:1�,�$474.:9��:9?=:770/�#0.?4140=>�1:=�,�����:?:=��:9?=:7
�� ����������� ��� *@>709,�$,=4���@3,88,/��76,11�
#4.,=/@>��9224�"=,8@909/,=
�=4>�#0.:29,?4:9��,>0/�!9��4>?,9.0�$48474,=4?D��9/�"��
�� ������������ ��� #:>/,90774��,>4-@,9���@3,88,/
�,4=@94
�,?308,?4.,7��:/07492�:1��=D492��490?4.>�:1��4920=�$74.0>
�� ������������� �� "=43,?49�!6?4A,>,=4 $8,=?�%=,>3��,>0/�:9��9/=:4/
�� ������������ �� �0=4��=/4,9>D,3���@3,88,/�#4A,4�
�@3@=�"=43,/4��6,� @=,-/4
%#�� ��##�'���(�# � ��$*$%����%�#���#!����#!$$� ��&$� �
������#!��%�#�$� $!#�� �� �&#��� �%(!#�
%;;9� !11?5:3�%;;9��
!;01=-?;=�
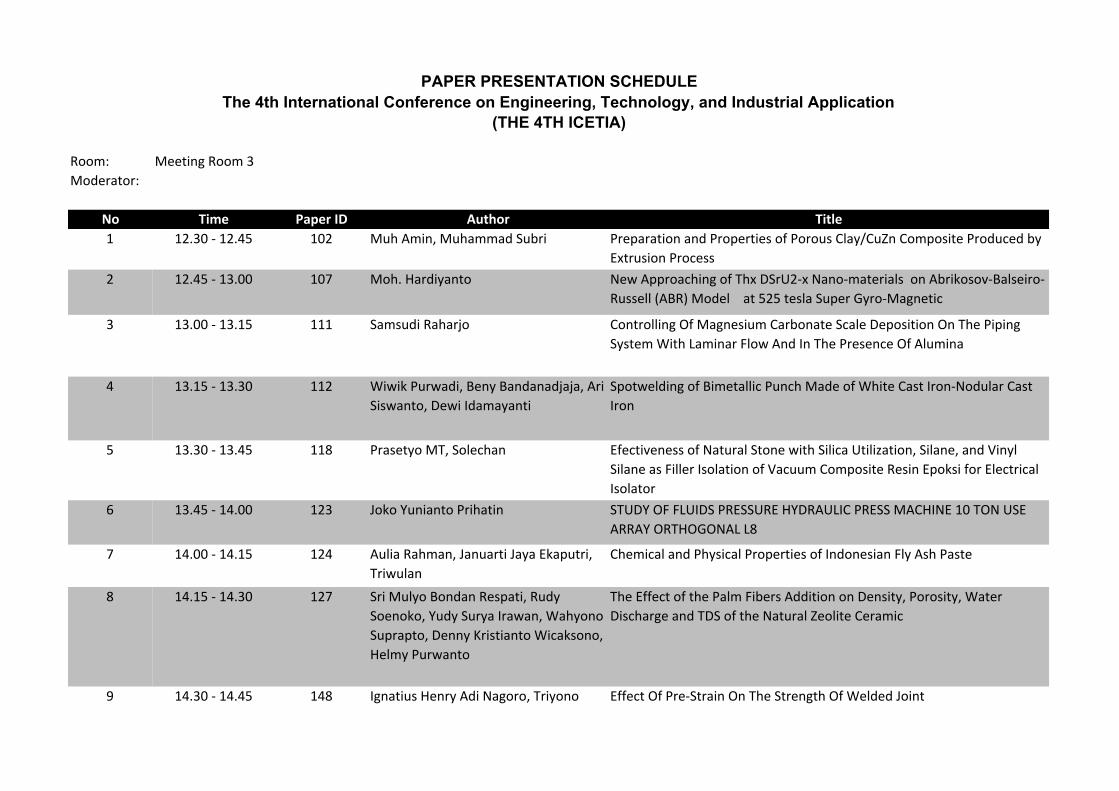
�� �� ������� ����� ����
�������� � !@4��95:��!@4-99-0�&@.=5 $=1<-=-?5;:�-:0�$=;<1=?51>�;2�$;=;@>��8-D��@,:��;9<;>5?1�$=;0@/10�.D
�C?=@>5;:�$=;/1>>
�� ������� �� !;4���-=05D-:?; "1B��<<=;-/45:3�;2�'4C��&=(�C�"-:;�9-?1=5-8>��;:��.=57;>;A��-8>15=;�
%@>>188����%��!;018����-?� �?1>8-�&@<1=��D=;�!-3:1?5/
� ��������� &-9>@05�%-4-=6; �;:?=;885:3�#2�!-3:1>5@9��-=.;:-?1�&/-81��1<;>5?5;:�#:�'41�$5<5:3
&D>?19�*5?4� -95:-=��8;B��:0��:�'41�$=1>1:/1�#2��8@95:-
� �� ������� *5B57�$@=B-05���1:D��-:0-:-06-6-���=5
&5>B-:?;���1B5��0-9-D-:?5
&<;?B1805:3�;2��591?-885/�$@:/4�!-01�;2�*45?1��->?��=;:�";0@8-=��->?
�=;:
���������� � $=->1?D;�!'��&;81/4-: �21/?5A1:1>>�;2�"-?@=-8�&?;:1�B5?4�&585/-�(?585E-?5;:��&58-:1��-:0�)5:D8
&58-:1�->��5881=��>;8-?5;:�;2�)-/@@9��;9<;>5?1�%1>5:��<;7>5�2;=��81/?=5/-8
�>;8-?;=
� ��� ������� � �;7;�+@:5-:?;�$=54-?5: &'(�+�#��� (��&�$%�&&(%���+�%�( ���$%�&&�!����"����'#"�(&�
�%%�+�#%'�#�#"� � �
� ��������� � �@85-�%-49-:���-:@-=?5��-D-��7-<@?=5�
'=5B@8-:
�4195/-8�-:0�$4D>5/-8�$=;<1=?51>�;2��:0;:1>5-:��8D��>4�$->?1
� �� ������� � &=5�!@8D;��;:0-:�%1><-?5��%@0D
&;1:;7;��+@0D�&@=D-��=-B-:��*-4D;:;
&@<=-<?;���1::D��=5>?5-:?;�*5/-7>;:;�
�189D�$@=B-:?;
'41��221/?�;2�?41�$-89��5.1=>��005?5;:�;:��1:>5?D��$;=;>5?D��*-?1=
�5>/4-=31�-:0�'�&�;2�?41�"-?@=-8�,1;85?1��1=-95/
� ���������� �� �3:-?5@>��1:=D��05�"-3;=;��'=5D;:; �221/?�#2�$=1�&?=-5:�#:�'41�&?=1:3?4�#2�*18010��;5:?
PAPER PRESENTATION SCHEDULEThe 4th International Conference on Engineering, Technology, and Industrial Application
(THE 4TH ICETIA)
��� ��� ���
� ������ � �5825��-=5>-:��49-0�'-A5; �C<1=591:?-8�&?@0D�;2��;80�FIH��;:010��=?525/5-8� 534?B1534?��33=13-?1
�;:/=1?1
� ��� ��� � $@=:;9;��$@?@��-05�&1?D-=5:5 ,1;85?1��->10��5;9-?1=5-8>�2;=��5;9105/-8��<<85/-?5;:>����%1A51B
������ �� � *5:-=?;���1==D�#7?-05:-?- !5/=;>?=@/?@=1�-:0��-=0:1>>�$=;<1=?51>�;2��@??�-:0��5881?��!�*
*18010��;5:?>�;:��+����534�&?=1:3?4�&?118�$8-?1
� �� ������� �� �1B5:�$@=:-9-��*5:-=?;�-:0��1=0D
�1:0-=?;�&@>58;
!1/4-:5/-8�$=;<1=?51>�;2�(:01=B-?1=�*1?�*18010�!-=5:1�&?118�$8-?1>
(>5:3��5221=1:?� ;B��D0=;31:��81/?=;01>
� ��������� �� %;49-05��&@<=5D;:;���3@>��B5
�:33;:;
�1>53:�-:0�&?-?5/��:-8D>5>�;2�#@?1=�%1-=��;;=��51>�;2�%-6-B-85�%�&()��D
(>5:3���'���)
�� ������� �� �.0@8��-950��"@=4-?5>D-4��"@=4->-:�
�3@:3�&1?D;��-=9-B-:��!@4-99-0
�5?=5���->@75�%-49-?
!1/4-:5/-8�-:0�$4D>5/-8�$=;<1=?51>��9<=;A191:?�;2�*18010��-=.;:
&?118�&� �
� ���������� � %1E-�$@?=-��!@4-99-0��&D52-@8��@E:5�
"@=05:��85��&D-4=5E-8��;::-
�221/?�#2�&;58�%1>5>?5A5?D��:�!-<<5:3�$;?1:?5-8��;==;>5;:��:�(:01=3=;@:0
$5<185:1>��=1-
� ��� ������� � �3@:3�&1?D;��-=9-B-:��'=5�*50;0;
�1>-=�%5D-05���.0@8��-950���-9.-:3
*-8@D;��1.=5-:?;7;���@05�&-?=5-�$@?=-
�;==;>5;:�%1>5>?-:?��9<=;A191:?�;2��8@95:@9�@:01=��:;05E5:3�$=;/1>>
� ��������� �� &1:6-�%@9��-=:-1:5������$@:37D
$=-91>?5���=52��@05-=?;���=D�&1?D-B-:
'41��221/?�;2�'19<1=-?@=1��4-:31>�-?�!1/4-:5>?5/�$1=2;=9-:/1�;2
�;?95C��><4-8?�->�*1-=5:3��;@=>1�B5?4��5221=1:?�'D<1��=-0-?5;:
� �� ������� � '=5�*50;0;��1>-=�%5D-05���-3@>�%-05-:?
(?;9;��&-=65?;���=5-:?;��&@<=-<?;�
'65<?;�&@65?:;
�221/?�;2�&<@??1=5:3�'591>�;:�?41�$=;<1=?51>�;2�"5�=��8
�;221��=1-7
$;;9� 11?5:3�$;;9��
;01=-?;=�
�� �� ������� ����� ����
� ���������� �� ,@84-:52�� ;4-99-0��-0-=@005: �;B��D/81��-?53@1�#=;<1=?51>�;2��C?=@010� � ��& ��8@95:@9��88;D
����������� �� #-=D-:?;��B5�%1?D-B-:��%@359-:�
�@87-=:-5:���/49-0�%B-=4-��5:37-=
�221/?�;2��-9.;;��5.1=��1:3?4�5:�"<1:10��188��;-9��;=1�%-:0B5/4
�;9<;>5?1�;:�)-?1=��.>;=<?5;:�-:0�&415=� 1/4-:5/-8�#=;<1=?51>
����������� ��� %���-05�%@=D;����#���-D@>1:;������-9-=5�
���=512�$-49-?�$
�:-8D>5>�"2� -?1=5-8�#;B1=�"2��5>5�������@/71?�&11?4��C/-A-?;=�'>5:3
�:28@1:/1�"2��.=->5A1�)1-=
� ���������� ��� $;>D50-�#1=9-?->-=5����045� @4-990
+@>@2
�&�$����%����&�"!��"$�%������!��&'����*���!��$�'%�!�����
�&�"�
� ���������� � �:0-4�)505->?@?5�� ��%;8574@:���B5
!;;=��-4D;��+@:5-=�$-?:-�#=-?5B5���1=5
�@B-:?;:;
&=1-?91:?�;2��-9.;;��5.=1>�5:��9<=;A5:3� 1/4-:5/-8�#1=2;=9-:/1�;2
#;8D91=��;9<;>5?1>�F���$1A51B
������������ �-95-?@8��79-8��%45=81D�%-A1?8-:-�
�1.D�&41?-��1=?5:D
�;;<�&1:>581�%?=1:3?4�;2��;-8��8D��>4��->10��1;<;8D91=��;9<;>5?1
$15:2;=/10�)5?4��5.1=38->>
� ������������� � �=52��@05-=?; &�������'$��+�"�������$���&��&�"!��&���������$���&���$��&�"!
&�$"'���)�&�%��(���!��+%�%�%+%&� �&"�$��'���&���$�%��"!
)��$�!���"'$%��"���%#���&� �*'$�
� ������������ �� �=52��@05-=?; &����!��'�!���"��$�#���� �!&�"���"'$%������$���&�� �&�$���
)�&����$'%��%&"!���&"�&�����$�(��'��"!�����$���&�����%%���
� ������������ � '82-��5?=5-?5���-58-:�!5G9-4��-:0��3@>
%@=D-:5
$�(�$�)�&�$����&$�&�"!�)�&���$�%���"�"!'&�&$'!�
�������������
(THE 4TH ICETIA)
�;221��=1-7
PAPER PRESENTATION SCHEDULEThe 4th International Conference on Engineering, Technology, and Industrial Application
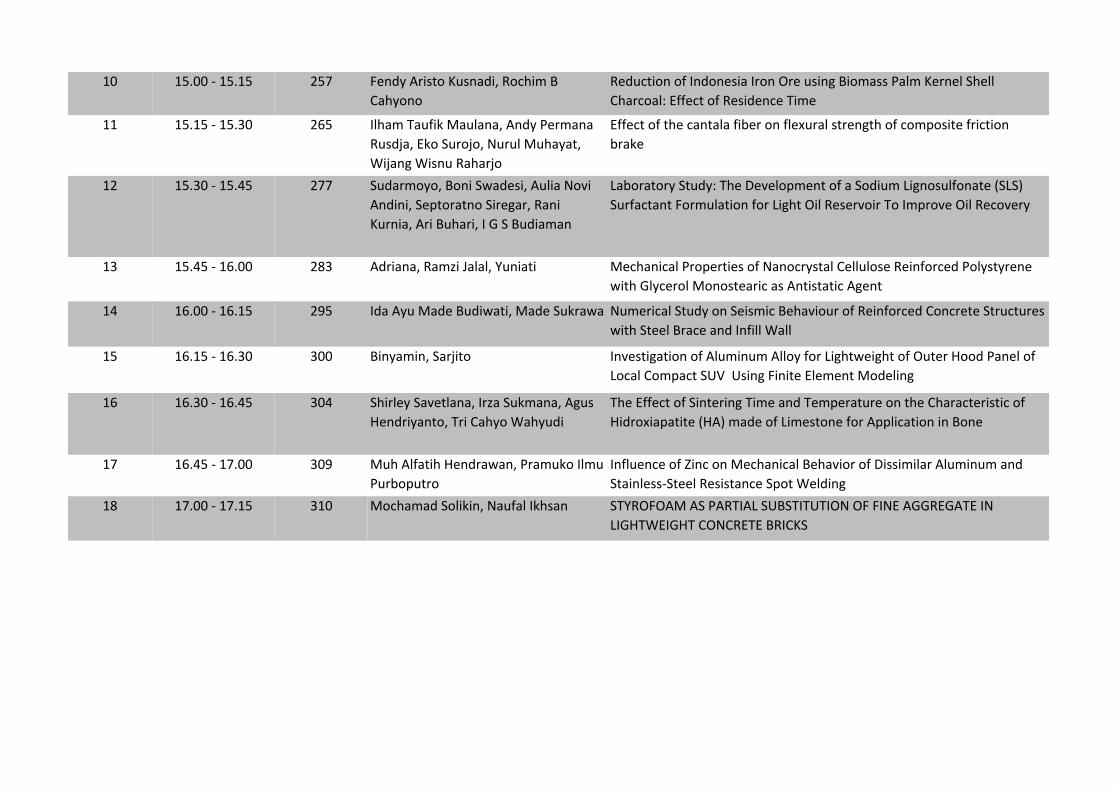
�� ������������� �� �1:0D��=5>?;��@>:-05��$;/459��
�-4D;:;
$10@/?5;:�;2��:0;:1>5-��=;:�"=1�@>5:3��5;9->>�#-89��1=:18�%4188
�4-=/;-8���221/?�;2�$1>501:/1�&591
�� ������������ � �84-9�&-@257� -@8-:-���:0D�#1=9-:-
$@>06-���7;�%@=;6;��!@=@8� @4-D-?�
)56-:3�)5>:@�$-4-=6;
�221/?�;2�?41�/-:?-8-�25.1=�;:�281C@=-8�>?=1:3?4�;2�/;9<;>5?1�2=5/?5;:
.=-71
� ������������ �� %@0-=9;D;���;:5�%B-01>5���@85-�!;A5
�:05:5��%1<?;=-?:;�%5=13-=��$-:5
�@=:5-���=5��@4-=5������%��@05-9-:
�-.;=-?;=D�%?@0D��&41��1A18;<91:?�;2�-�%;05@9��53:;>@82;:-?1��%�%�
%@=2-/?-:?��;=9@8-?5;:�2;=��534?�"58�$1>1=A;5=�&;��9<=;A1�"58�$1/;A1=D
� ��������� ��� � �0=5-:-��$-9E5��-8-8��+@:5-?5 1/4-:5/-8�#=;<1=?51>�;2�!-:;/=D>?-8��188@8;>1�$15:2;=/10�#;8D>?D=1:1
B5?4��8D/1=;8� ;:;>?1-=5/�->��:?5>?-?5/��31:?
�� � ������� ��� �� �0-��D@� -01��@05B-?5�� -01�%@7=-B- !@91=5/-8�%?@0D�;:�%15>95/��14-A5;@=�;2�$15:2;=/10��;:/=1?1�%?=@/?@=1>
B5?4�%?118��=-/1�-:0��:2588�)-88
�� � ������� �� �� �5:D-95:��%-=65?; �:A1>?53-?5;:�;2��8@95:@9��88;D�2;=��534?B1534?�;2�"@?1=��;;0�#-:18�;2
�;/-8��;9<-/?�%'(��'>5:3��5:5?1��8191:?� ;0185:3
� � ������ ��� �� %45=81D�%-A1?8-:-���=E-�%@79-:-���3@>
�1:0=5D-:?;��&=5��-4D;�)-4D@05
&41��221/?�;2�%5:?1=5:3�&591�-:0�&19<1=-?@=1�;:�?41��4-=-/?1=5>?5/�;2
�50=;C5-<-?5?1������9-01�;2��591>?;:1�2;=��<<85/-?5;:�5:��;:1
�� � ����������� �� @4��82-?54��1:0=-B-:��#=-9@7;��89@
#@=.;<@?=;
�:28@1:/1�;2�,5:/�;:� 1/4-:5/-8��14-A5;=�;2��5>>5958-=��8@95:@9�-:0
%?-5:81>>�%?118�$1>5>?-:/1�%<;?�)1805:3
�� ������������� �� ;/4-9-0�%;8575:��!-@2-8��74>-: %&+$"�"� ��%�#�$&����%'�%&�&'&�"!�"����!�����$���&���!
����&)����&��"!�$�&���$���%
&<<:� !22@6;4�&<<:�
!<12>.@<>�
�� �� ������� ����� ����
�������� � '6@6��?:.;6E.5�!.>16E.;6��'<2:.>16
�.16�'A:.>9.;���.:/.;4��C6��>4<�
�:6;�'2@E<�9.8?<;<
�2@2>:6;.@6<;�<3�$5E?60.9�.;1
(52>:<=5E?60.9��5.>.0@2>6?@60?�<3�&21
$2==2>?���.=?60A:��;;A:��)?6;4�.;
);[email protected]�'@.@2�!2@5<1 �� ������� � �2;16��76�$A>;<:<���8<��.>>E�$>.@6?@<�
�9B6;�&2F.�!.52;1>.�$A@>.
�B.9A.@6<;�<3�'2>6<A?��.:2��.?21�.@
�A8A>.;��9A?@2>�<3�!A?2A:�'.;46>.;
� ��������� �� �6.;��>[email protected]���;@.>68?.�� 6?.���
+A9.;1.>6��'A>7<;<
�12;@6360.@6<;�<3��<:A;.9�'=.02�6;
�6?@<>60.9�!A9@6��@5;605��6@E�<3��>2?68
� �� ������� �� �A0A8��A16E.;@<���;1.5�+616.?@A@6 �.;1?�<;� 2.>;6;4�<;�&2;2C./92��;2>4E
GLK�.�$><=<?21��==><.05�3<>�(205;<9<4E
�6??2:6;.@6<; ���������� � ,A?92;.�'.>6��!A5.::.1��98.33�
&60.>1A?��;446�$>.:A;2;1.>
�9.??6360.@6<;�<3�0<[email protected]�.;1�6;9.;1�/.@68
A?6;4�� �!�.;1��.;/2>>.�16?@.;02
� ��� ������� � !<5.::21��96��2>.C6��$2>1.;.�!6>.7�
�4.�&29646.��?9.:6.5
�B.9A.@6;4�$<>@��6@62?��2B29<=:2;@�)?6;4
632��E092��<?@��==><.05
� ��������� � !<5.::21��96��2>.C6��$2>1.;.�!6>.7�
�/1A>�&<56:��<E��2>.C6���>6?@E
!68.29?2
�:=><B6;4�(<99�&<.1��2.?6/696@E��&<A@2
$9.;;6;4�.;1��6;.;06.9�!<1296;4
� �� ������� � �;1>6��&��"��&<;.9��9�&.?E61��'A?.;@E
�.;1.E.;6
�.@.�!6;6;4��==9621�3<>�$>2160@6<;�<3
(>.3360��00612;@�6;��;1<;2?6.�(<99�&<.1
� ���������� � �A16�,A96.;@< !60><�'6:A9.@6<;�*�''�!�!<129�*6.1A0@
�696;4.;�.;1�);12>=.??��696;4.;�'A>.8.>@.
��� ��� ���
PAPER PRESENTATION SCHEDULEThe 4th International Conference on Engineering, Technology, and Industrial Application
(THE 4TH ICETIA)
�<332��>2.8
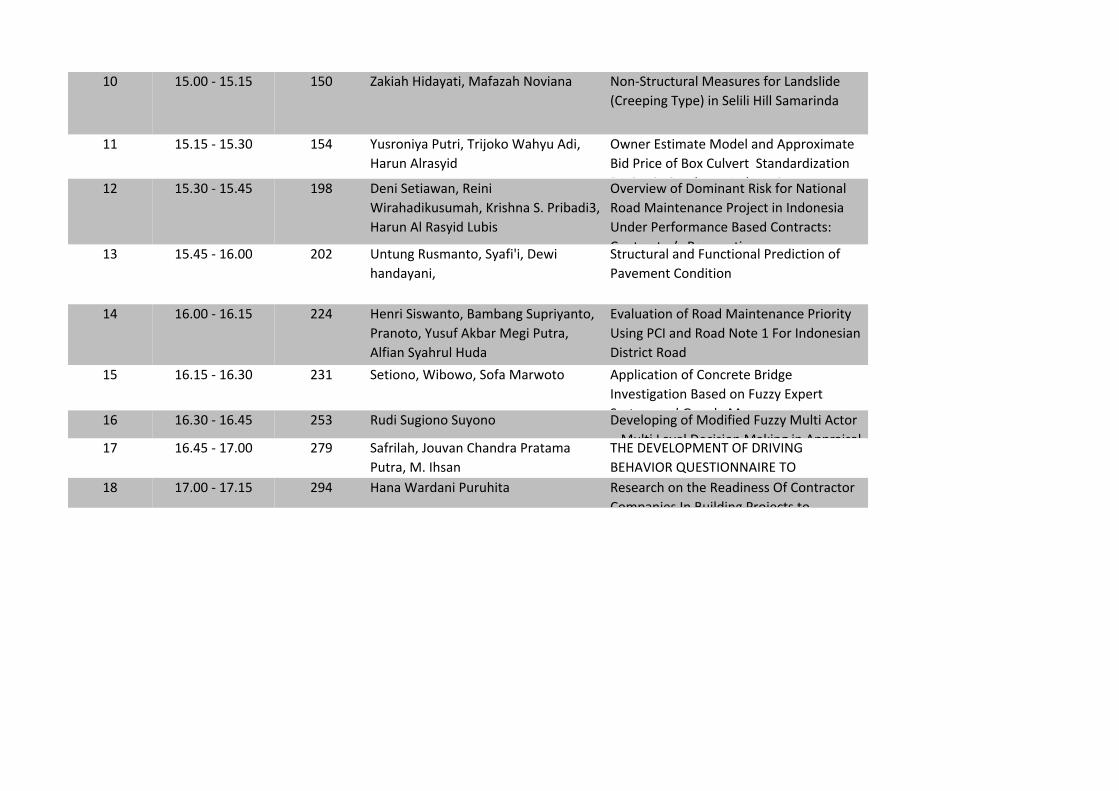
� ������ � � -.86.5��61.E.@6��!.3.F.5�"<B6.;. "<;�'@>A0@A>.9�!2.?A>2?�3<>� .;1?9612
��>22=6;4�(E=2��6;�'29696��699�'.:.>6;1.
� ��� ��� � ,A?><;6E.�$A@>6��(>67<8<�+.5EA��16�
�.>A;��9>.?E61
#C;2>��?@6:.@2�!<129�.;1��==><D6:.@2
�61�$>602�<3��<D��A9B2>@��'@.;1.>16F.@6<;
�2?64;�6;�'A>./.E.���;1<;2?6. ������ �� �� �2;6�'[email protected].;��&26;6
+6>.5.168A?A:.5���>6?5;.�'��$>6/.16��
�.>A;��9�&.?E61� A/6?
#B2>B62C�<3��<:6;.;@�&6?8�3<>�".@6<;.9
&<.1�!.6;@2;.;02�$><720@�6;��;1<;2?6.
);12>�$2>3<>:.;02��.?21��<;@>.0@?�
�<;@>.0@<>J?�$>2?=20@6B2� �� ������� � );@A;4�&A?:.;@<��'E.36�6���2C6
5.;1.E.;6�
'@>A0@A>.9�.;1��A;0@6<;.9�$>2160@6<;�<3
$.B2:2;@��<;16@6<;
� ��������� � �2;>6�'6?C.;@<���.:/.;4�'A=>6E.;@<�
$>.;<@<��,A?A3��8/.>�!246�$A@>.�
�936.;�'E.5>A9��A1.
�B.9A.@6<;�<3�&<.1�!.6;@2;.;02�$>6<>6@E
)?6;4�$���.;1�&<.1�"<@2���<>��;1<;2?6.;
�6?@>60@�&<.1
�� ������� � '2@6<;<��+6/<C<��'<3.�!.>C<@< �==960.@6<;�<3��<;0>2@2��>6142
�;B2?@64.@6<;��.?21�<;��AFFE��D=2>@
'E?@2:�.;1��<<492�!.=?� ���������� � &A16�'A46<;<�'AE<;< �2B29<=6;4�<3�!<163621��AFFE�!A9@6��0@<>
I�!A9@6� 2B29��206?6<;�!.86;4�6;��==>.6?.9� ��� ������� �� '.3>69.5���<AB.;��5.;1>.�$>.@.:.
$A@>.��!���5?.;
(�����*� #$!�"(�#���&�*�"�
����*�#&�%)�'(�#""��&��(#
��(�&!�"��&#��+�,���$���(,� ��������� �� �.;.�+.>1.;6�$A>A56@. &2?2.>05�<;�@52�&2.16;2??�#3��<;@>.0@<>
�<:=.;62?��;��A6916;4�$><720@?�@<
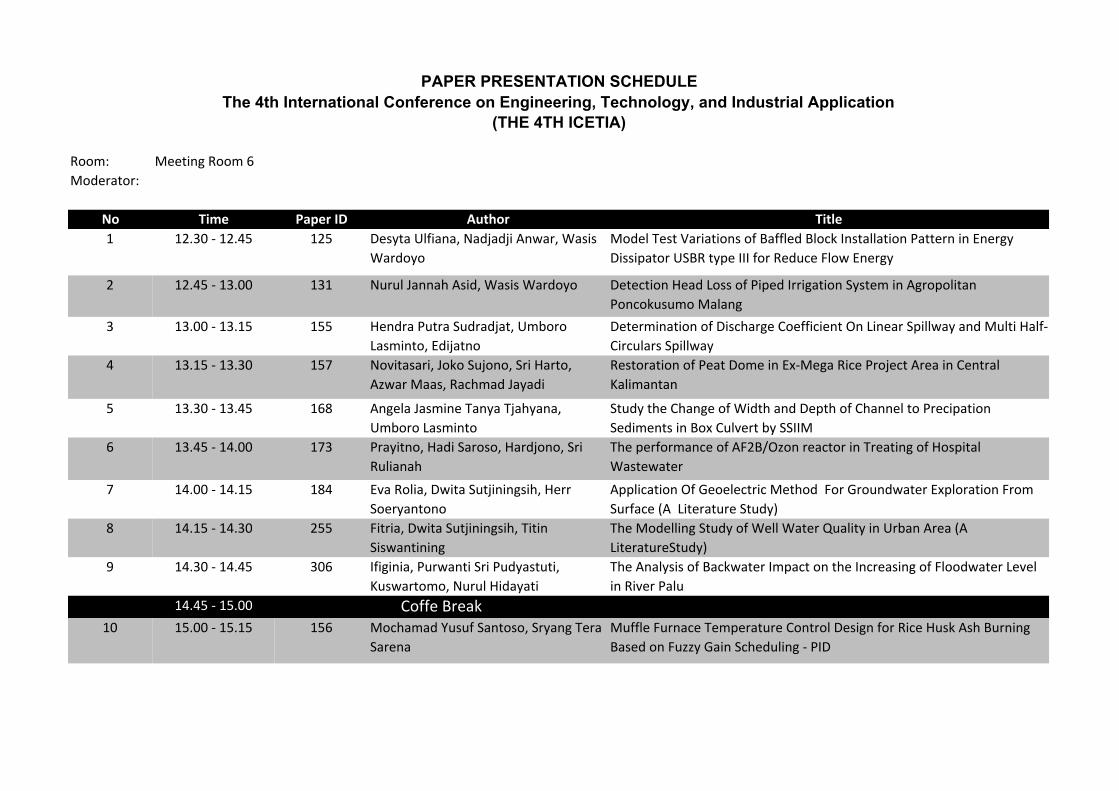
&;;9� !11?5:3�&;;9��
!;01=-?;=�
�� �� ������� ����� ����
�������� �1>D?-�)825-:-��"-06-065��:B-=��+->5>
+-=0;D;
!;018�(1>?�*-=5-?5;:>�;2��-22810��8;/7��:>?-88-?5;:�$-??1=:�5:��:1=3D
�5>>5<-?;=�)'�&�?D<1�����2;=�&10@/1��8;B��:1=3D
�� ������� � "@=@8��-::-4��>50��+->5>�+-=0;D; �1?1/?5;:��1-0� ;>>�;2�$5<10��==53-?5;:�'D>?19�5:��3=;<;85?-:
$;:/;7@>@9;�!-8-:3
� ��������� �1:0=-�$@?=-�'@0=-06-?��)9.;=;
->95:?;���056-?:;
�1?1=95:-?5;:�;2��5>/4-=31��;1225/51:?�#:� 5:1-=�'<588B-D�-:0�!@8?5��-82�
�5=/@8-=>�'<588B-D
� �� ������� � ";A5?->-=5���;7;�'@6;:;��'=5��-=?;�
�EB-=�!-->��&-/49-0��-D-05
&1>?;=-?5;:�;2�$1-?��;91�5:��C�!13-�&5/1�$=;61/?��=1-�5:��1:?=-8
�-859-:?-:
���������� �� �:318-��->95:1�(-:D-�(6-4D-:-�
)9.;=;� ->95:?;
'?@0D�?41��4-:31�;2�+50?4�-:0��1<?4�;2��4-::18�?;�$=1/5<-?5;:
'10591:?>�5:��;C��@8A1=?�.D�''��!
� ��� ������� �� $=-D5?:;���-05�'-=;>;���-=06;:;��'=5
&@85-:-4
(41�<1=2;=9-:/1�;2�����#E;:�=1-/?;=�5:�(=1-?5:3�;2��;><5?-8
+->?1B-?1=
� ��������� �� �A-�&;85-���B5?-�'@?65:5:3>54���1==
';1=D-:?;:;
�<<85/-?5;:�#2��1;181/?=5/�!1?4;0���;=��=;@:0B-?1=��C<8;=-?5;:��=;9
'@=2-/1����� 5?1=-?@=1�'?@0D�
� �� ������� �5?=5-���B5?-�'@?65:5:3>54��(5?5:
'5>B-:?5:5:3
(41�!;01885:3�'?@0D�;2�+188�+-?1=�%@-85?D�5:�)=.-:��=1-���
5?1=-?@=1'?@0D�
� ���������� ��� �2535:5-��$@=B-:?5�'=5�$@0D->?@?5�
�@>B-=?;9;��"@=@8��50-D-?5
(41��:-8D>5>�;2��-/7B-?1=��9<-/?�;:�?41��:/=1->5:3�;2��8;;0B-?1=� 1A18
5:�&5A1=�$-8@
��� ��� ���
� ������ � � !;/4-9-0�,@>@2�'-:?;>;��'=D-:3�(1=-
'-=1:-
!@2281��@=:-/1�(19<1=-?@=1��;:?=;8��1>53:�2;=�&5/1��@>7��>4��@=:5:3
�->10�;:��@EED��-5:�'/410@85:3���$��
PAPER PRESENTATION SCHEDULEThe 4th International Conference on Engineering, Technology, and Industrial Application
(THE 4TH ICETIA)
�;221��=1-7
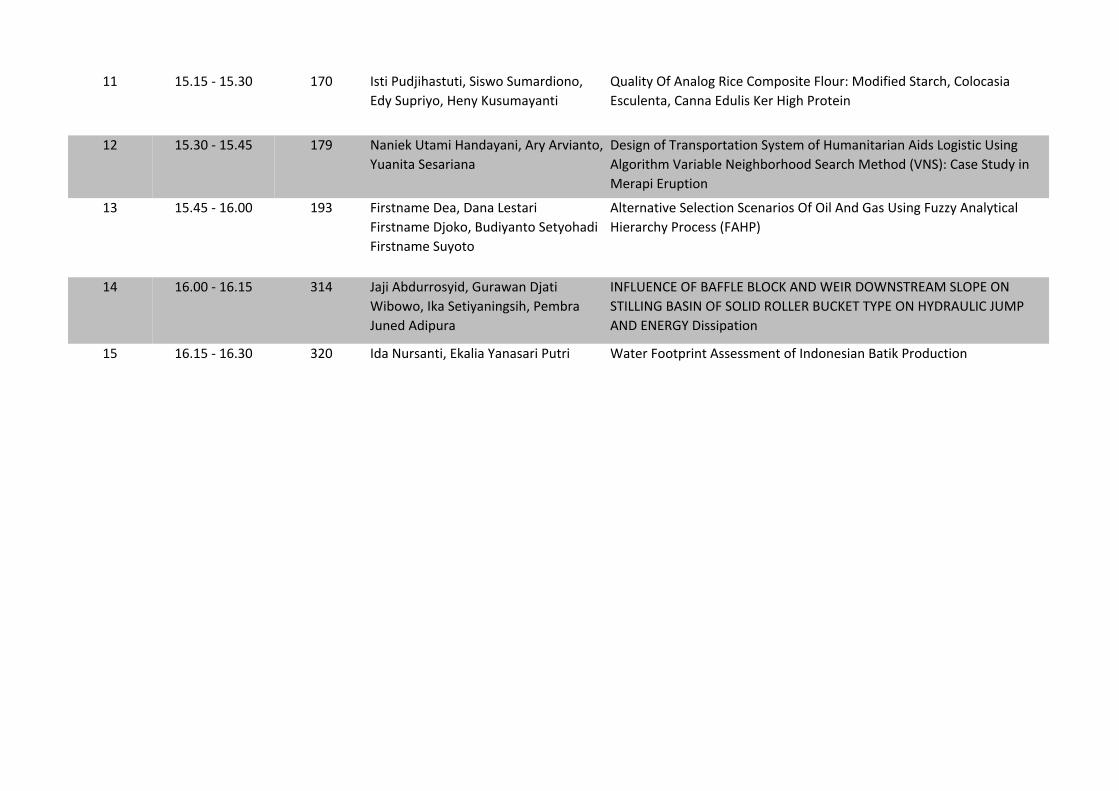
� ��� ��� �� �>?5�$@0654->?@?5��'5>B;�'@9-=05;:;�
�0D�'@<=5D;���1:D��@>@9-D-:?5
%@-85?D�#2��:-8;3�&5/1��;9<;>5?1��8;@=��!;052510�'?-=/4���;8;/->5-
�>/@81:?-���-::-��0@85>��1=��534�$=;?15:
������ �� �� "-:517�)?-95��-:0-D-:5���=D��=A5-:?;�
,@-:5?-�'1>-=5-:-
�1>53:�;2�(=-:><;=?-?5;:�'D>?19�;2��@9-:5?-=5-:��50>� ;35>?5/�)>5:3
�83;=5?49�*-=5-.81�"1534.;=4;;0�'1-=/4�!1?4;0��*"'����->1�'?@0D�5:
!1=-<5��=@<?5;:
� �� ������� �� �5=>?:-91��1-���-:-� 1>?-=5
�5=>?:-91��6;7;���@05D-:?;�'1?D;4-05
�5=>?:-91�'@D;?;
�8?1=:-?5A1�'181/?5;:�'/1:-=5;>�#2�#58��:0��->�)>5:3��@EED��:-8D?5/-8
�51=-=/4D�$=;/1>>�����$�
� ��������� �� �-65��.0@==;>D50���@=-B-:��6-?5
+5.;B;���7-�'1?5D-:5:3>54��$19.=-
�@:10��05<@=-
�"� )�"���#������ ��� #����"��+��&��#+"'(&��!�' #$��#"
'(� �"����'�"�#��'# ���&# �&��)���(�(,$��#"��,�&�) ����)!$
�"���"�&�,��5>>5<-?5;:
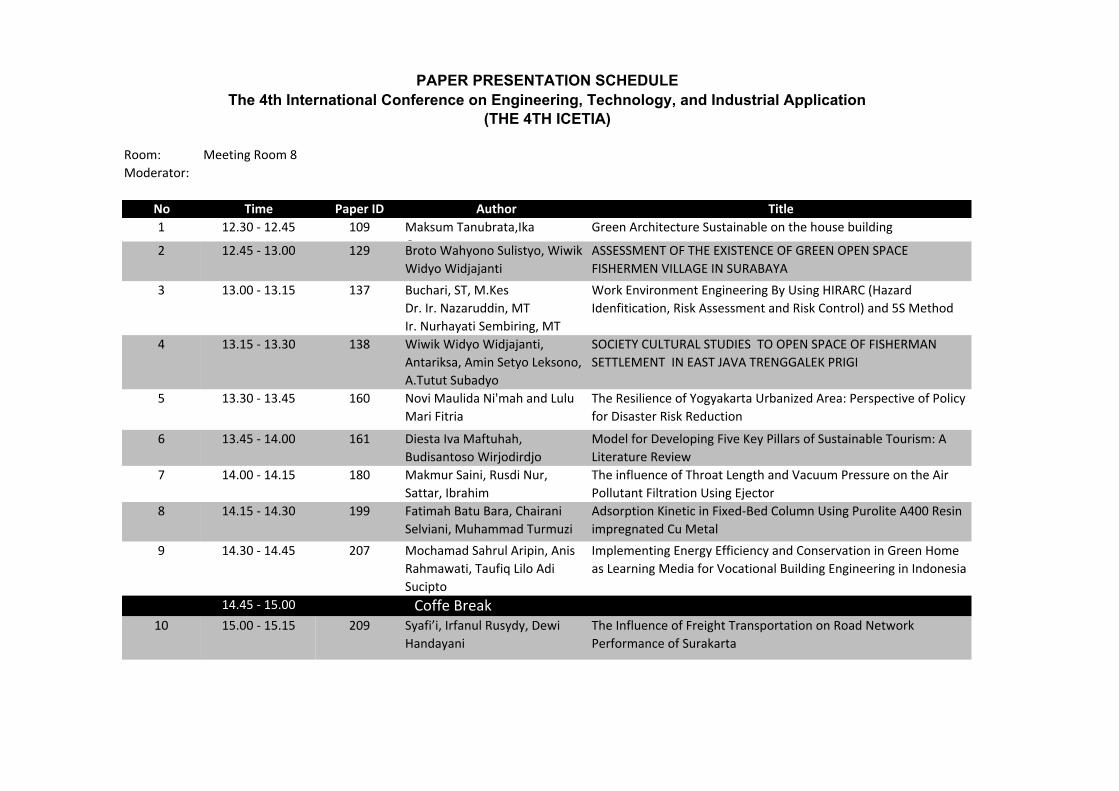
�� ������� �� �0-�"@=>-:?5���7-85-�,-:->-=5�$@?=5 +-?1=��;;?<=5:?��>>1>>91:?�;2��:0;:1>5-:��-?57�$=;0@/?5;:
$::8� 00?492�$::8��
:/0=,?:=�
�� �� ������� ����� ����
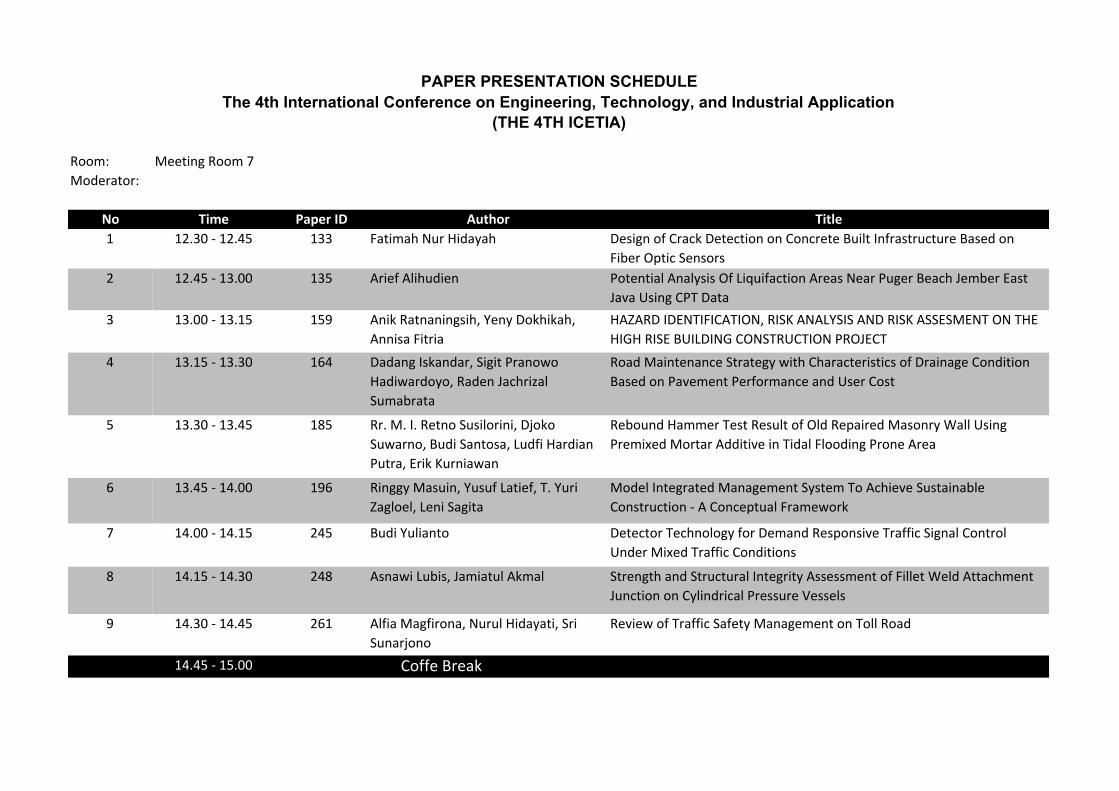
� ���������� � �,?48,3�!@=��4/,D,3 �0>429�:1��=,.6��0?0.?4:9�:9��:9.=0?0��@47?��91=,>?=@.?@=0��,>0/�:9
�4-0=�";?4.�%09>:=>
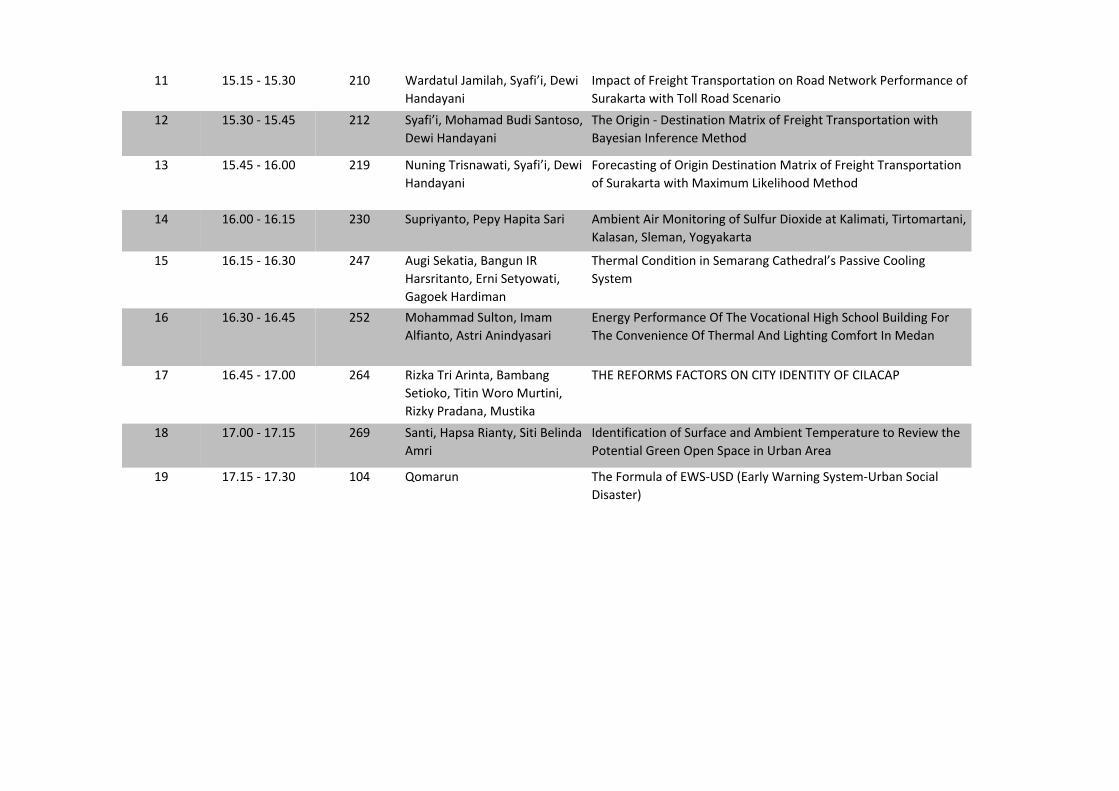
����������� �� �=401��743@/409 #:?09?4,7��9,7D>4>�"1��4<@41,.?4:9��=0,>�!0,=�#@20=��0,.3��08-0=��,>?
�,A,�'>492��#&��,?,
����������� ��� �946�$,?9,9492>43��*09D��:6346,3�
�994>,��4?=4,
��+�$�����!&�����&�"!��$�%���!��*%�%��!��$�%���%%�% �!&�"!�&��
�����$�%���'����!���"!%&$'�&�"!�#$"���&
� ���������� � � �,/,92��>6,9/,=��%424?�#=,9:B:
�,/4B,=/:D:��$,/09��,.3=4E,7
%@8,-=,?,
$:,/� ,49?09,9.0�%?=,?02D�B4?3��3,=,.?0=4>?4.>�:1��=,49,20��:9/4?4:9
�,>0/�:9�#,A0809?�#0=1:=8,9.0�,9/�'>0=��:>?
� ���������� ��� $=�� �����$0?9:�%@>47:=494���5:6:
%@B,=9:���@/4�%,9?:>,���@/14��,=/4,9
#@?=,���=46��@=94,B,9
$0-:@9/��,880=�&0>?�$0>@7?�:1�"7/�$0;,4=0/� ,>:9=D�),77�'>492
#=084C0/� :=?,=��//4?4A0�49�&4/,7��7::/492�#=:90��=0,
������������ �� $4922D� ,>@49��*@>@1��,?401��&��*@=4
+,27:07���094�%,24?,
:/07��9?02=,?0/� ,9,20809?�%D>?08�&:��.340A0�%@>?,49,-70
�:9>?=@.?4:9������:9.0;?@,7��=,80B:=6
� ������������� �� �@/4�*@74,9?: �0?0.?:=�&0.39:7:2D�1:=��08,9/�$0>;:9>4A0�&=,114.�%429,7��:9?=:7
'9/0=� 4C0/�&=,114.��:9/4?4:9>
� ������������ �� �>9,B4��@-4>���,84,?@7��68,7 %?=092?3�,9/�%?=@.?@=,7��9?02=4?D��>>0>>809?�:1��4770?�)07/��??,.3809?
�@9.?4:9�:9��D749/=4.,7�#=0>>@=0�(0>>07>
� ������������ � �714,� ,214=:9,��!@=@7��4/,D,?4��%=4
%@9,=5:9:
$0A40B�:1�&=,114.�%,10?D� ,9,20809?�:9�&:77�$:,/
�������������
PAPER PRESENTATION SCHEDULEThe 4th International Conference on Engineering, Technology, and Industrial Application
(THE 4TH ICETIA)
�:110��=0,6
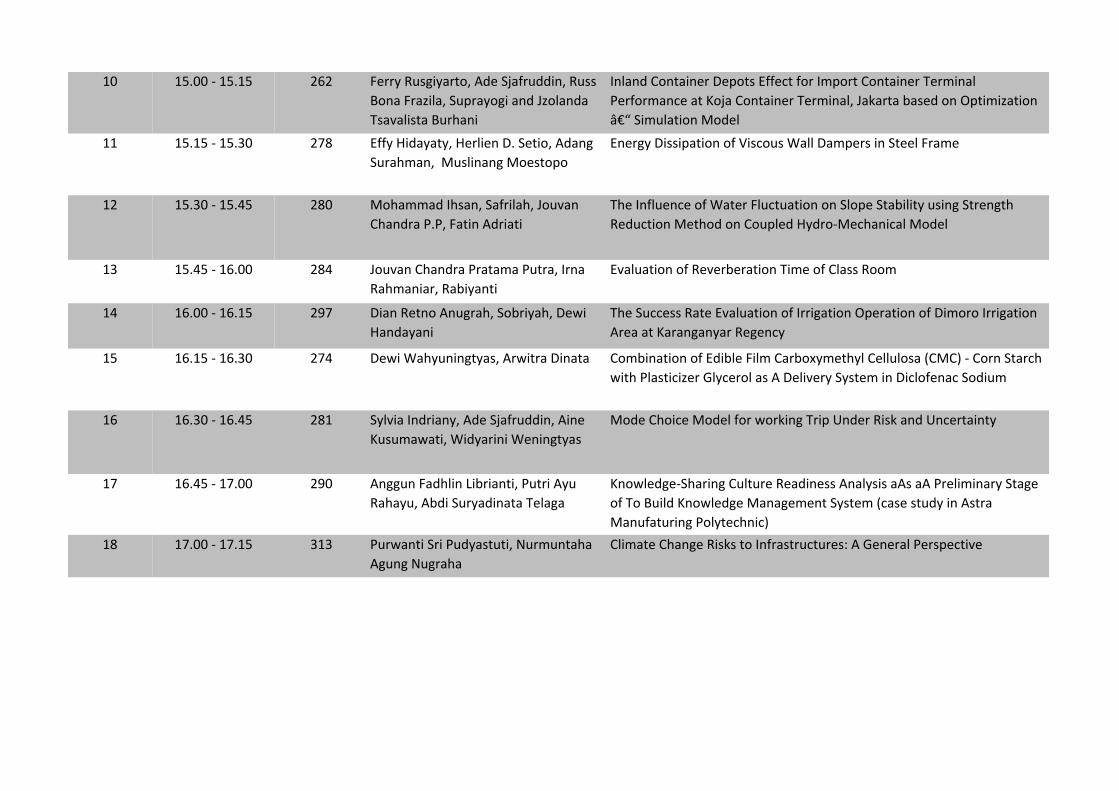
�� ������������� �0==D�$@>24D,=?:���/0�%5,1=@//49��$@>>
�:9,��=,E47,��%@;=,D:24�,9/��E:7,9/,
&>,A,74>?,��@=3,94
�97,9/��:9?,490=��0;:?>��110.?�1:=��8;:=?��:9?,490=�&0=849,7
#0=1:=8,9.0�,?��:5,��:9?,490=�&0=849,7���,6,=?,�-,>0/�:9�";?484E,?4:9
FIH�%48@7,?4:9� :/07
�� ������������ �� �11D��4/,D,?D���0=7409����%0?4:���/,92
%@=,38,9��� @>749,92� :0>?:;:
�90=2D��4>>4;,?4:9�:1�(4>.:@>�),77��,8;0=>�49�%?007��=,80
� ������������ �� :3,88,/��3>,9��%,1=47,3���:@A,9
�3,9/=,�#�#���,?49��/=4,?4
&30��[email protected]�:1�),?0=��7@.?@,?4:9�:9�%7:;0�%?,-474?D�@>492�%?=092?3
$0/@.?4:9� 0?3:/�:9��:@;70/��D/=:� 0.3,94.,7� :/07
� ��������� ��� �� �:@A,9��3,9/=,�#=,?,8,�#@?=,���=9,
$,38,94,=��$,-4D,9?4
�A,7@,?4:9�:1�$0A0=-0=,?4:9�&480�:1��7,>>�$::8
�� � ������� ��� �� �4,9�$0?9:��9@2=,3��%:-=4D,3���0B4
�,9/,D,94
&30�%@..0>>�$,?0��A,7@,?4:9�:1��==42,?4:9�";0=,?4:9�:1��48:=:��==42,?4:9
�=0,�,?��,=,92,9D,=�$0209.D
�� � ������� �� �� �0B4�),3D@9492?D,>���=B4?=,��49,?, �:8-49,?4:9�:1��/4-70��478��,=-:CD80?3D7��077@7:>,��� ������:=9�%?,=.3
B4?3�#7,>?4.4E0=��7D.0=:7�,>����074A0=D�%D>?08�49��4.7:109,.�%:/4@8
� � ������ ��� �� %D7A4,��9/=4,9D���/0�%5,1=@//49���490
�@>@8,B,?4��)4/D,=494�)09492?D,>
:/0��3:4.0� :/07�1:=�B:=6492�&=4;�'9/0=�$4>6�,9/�'9.0=?,49?D
�� � ����������� �� �922@9��,/3749��4-=4,9?4��#@?=4��D@
$,3,D@���-/4�%@=D,/49,?,�&07,2,
�9:B70/20�%3,=492��@7?@=0�$0,/490>>��9,7D>4>�,�>�,��#=074849,=D�%?,20
:1�&:��@47/��9:B70/20� ,9,20809?�%D>?08��.,>0�>?@/D�49��>?=,
,9@1,?@=492�#:7D?0.394.�
�� ������������� � #@=B,9?4�%=4�#@/D,>?@?4��!@=8@9?,3,
�2@92�!@2=,3,
�748,?0��3,920�$4>6>�?:��91=,>?=@.?@=0>�����090=,7�#0=>;0.?4A0
&<<:� !22A6;4�&<<:��
!<12?.A<?�
�� �� ������� ����� ����
�������� �� !.8@B:�(.;B/?.A.��8.
�B;.D.;
�?22;��?056A20AB?2�'[email protected];./92�<;�A52�5<B@2�/B6916;4
�� ������� � �?<A<�+.5F<;<�'B96@AF<��+6D68
+61F<�+617.7.;A6
�''�''!�"(�#��(����,�'(�"���#���&��"�#$�"�'$���
��'��&!�"�*� �����"�')&���-�
� ��������� �� �B05.?6��'(��!��2@
�?���?��".G.?B116;��!(
�?��"B?5.F.A6�'2:/6?6;4��!(
+<?8��;C6?<;:2;A��;46;22?6;4��F�)@6;4���&�&����.G.?1
�12;36A60.A6<;��&6@8��@@2@@:2;A�.;1�&6@8��<;A?<9��.;1� '�!2A5<1
� �� ������� �� +6D68�+61F<�+617.7.;A6�
�;A.?68@.���:6;�'2AF<� 28@<;<�
��(BABA�'B/.1F<
'#���(-��) ()&� �'()���'��(#�#$�"�'$����#����'��&!�"
'�(( �!�"(���"���'(���*��(&�"��� ���$&���
���������� �� "<C6�!.B961.�"6�:.5�.;1� B9B
!.?6��6A?6.
(52�&2@6962;02�<3�-<4F.8.?A.�)?/.;6G21��?2.��$2?@=20A6C2�<3�$<960F
3<?��6@.@A2?�&6@8�&21B0A6<;
� ��� ������� � �62@A.��C.�!.3AB5.5�
�B16@.;A<@<�+6?7<16?17<
!<129�3<?��2C29<=6;4��6C2��2F�$699.?@�<3�'[email protected];./92�(<B?6@:���
6A2?.AB?2�&2C62D
� ��������� �� !.8:B?�'.6;6��&B@16�"B?�
'.AA.?���/?.56:
(52�6;39B2;02�<3�(5?<.A� 2;4A5�.;1�*.0BB:�$?2@@B?2�<;�A52��6?
$<99BA.;A��69A?.A6<;�)@6;4��720A<?
� �� ������� �� �.A6:.5��.AB��.?.���5.6?.;6
'29C6.;6��!B5.::.1�(B?:BG6
�1@<?=A6<;��6;2A60�6;��6E21��21��<9B:;�)@6;4�$B?<96A2������&2@6;
6:=?24;.A21��B�!2A.9
� ���������� �� !<05.:.1�'.5?B9��?6=6;���;6@
&.5:.D.A6��(.B36>� 69<��16
'B06=A<
�:=92:2;A6;4��;2?4F��336062;0F�.;1��<;@2?C.A6<;�6;��?22;��<:2
.@� 2.?;6;4�!216.�3<?�*<0.A6<;.9��B6916;4��;46;22?6;4�6;��;1<;2@6.
��� ��� ���
� ������ � �� 'F.36H6���?3.;B9�&B@F1F���2D6
�.;1.F.;6
(52��;39B2;02�<3��?2645A�(?.;@=<?A.A6<;�<;�&<.1�"2AD<?8
$2?3<?:.;02�<3�'B?.8.?A.
PAPER PRESENTATION SCHEDULEThe 4th International Conference on Engineering, Technology, and Industrial Application
(THE 4TH ICETIA)
�<332��?2.8
� ��� ��� � +.?1.AB9��.:69.5��'F.36H6���2D6
�.;1.F.;6
�:=.0A�<3��?2645A�(?.;@=<?A.A6<;�<;�&<.1�"2AD<?8�$2?3<?:.;02�<3
'B?.8.?A.�D6A5�(<99�&<.1�'02;.?6<
������ �� 'F.36H6��!<5.:.1��B16�'.;A<@<�
�2D6��.;1.F.;6
(52�#?646;����2@A6;.A6<;�!.A?6E�<3��?2645A�(?.;@=<?A.A6<;�D6A5
�.F2@6.;��;32?2;02�!2A5<1
� �� ������� � "B;6;4�(?6@;.D.A6��'F.36H6���2D6
�.;1.F.;6
�<?20.@A6;4�<3�#?646;��2@A6;.A6<;�!.A?6E�<3��?2645A�(?.;@=<?A.A6<;
<3�'B?.8.?A.�D6A5�!.E6:B:� 682965<<1�!2A5<1
� ��������� �� 'B=?6F.;A<��$2=F��.=6A.�'.?6 �:/62;A��6?�!<;6A<?6;4�<3�'B93B?��6<E612�.A��.96:.A6��(6?A<:.?A.;6�
�.9.@.;��'92:.;��-<4F.8.?A.
�� ������� �� �B46�'28.A6.���.;4B;��&
�.?@?6A.;A<���?;6�'2AF<D.A6�
�.4<28��.?16:.;
(52?:.9��<;16A6<;�6;�'2:.?.;4��.A521?.9H@�$.@@6C2��<<96;4
'F@A2:
� ���������� !<5.::.1�'B9A<;���:.:
�936.;A<���@A?6��;6;1F.@.?6
�;2?4F�$2?3<?:.;02�#3�(52�*<0.A6<;.9��645�'05<<9��B6916;4��<?
(52��<;C2;62;02�#3�(52?:.9��;1� 645A6;4��<:3<?A��;�!21.;
� ��� ������� �� &6G8.�(?6��?6;A.���.:/.;4
'2A6<8<��(6A6;�+<?<�!B?A6;6�
&6G8F�$?.1.;.��!B@A68.
�B@B:.;6;4�+.?15.;6
(���&��#&!'����(#&'�#"���(-����"(�(-�#���� ���$
� ��������� �� '.;A6���.=@.�&6.;AF��'6A6��296;1.
�:?6
�12;A6360.A6<;�<3�'B?3.02�.;1��:/62;A�(2:=2?.AB?2�A<�&2C62D�A52
$<A2;A6.9��?22;�#=2;�'=.02�6;�)?/.;��?2.
� �� ������� �� %<:.?B; (52��<?:B9.�<3��+'�)'����.?9F�+.?;6;4�'F@A2:�)?/.;�'<06.9
�6@.@A2?�
$::8� �00>492�$::8��
�:/0<,>:<�
�� �� ������� ����� ����
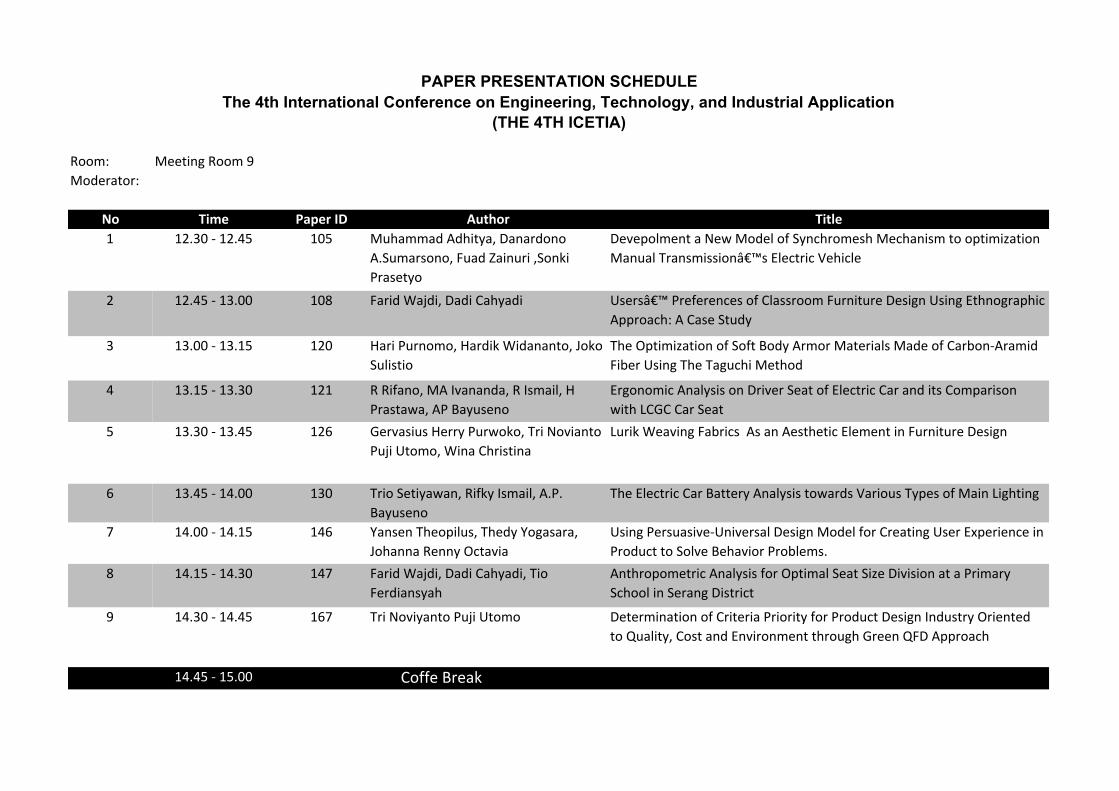
� ����������� ��� �?3,88,/��/34>C,���,9,</:9:
��%?8,<=:9:���?,/�+,49?<4��%:964
"<,=0>C:
�0@0;:7809>�,� 0A��:/07�:1�%C9.3<:80=3��0.3,94=8�>:�:;>484D,>4:9
�,9?,7�&<,9=84==4:9EHI=��70.><4.�(034.70
� ����������� ��� �,<4/�),5/4���,/4��,3C,/4 '=0<=EHI�"<010<09.0=�:1��7,==<::8��?<94>?<0��0=429�'=492��>39:2<,;34.
�;;<:,.3�����,=0�%>?/C
����������� ��� �,<4�"?<9:8:���,</46�)4/,9,9>:���:6:
%?74=>4:
&30�!;>484D,>4:9�:1�%:1>��:/C��<8:<��,>0<4,7=��,/0�:1��,<-:9��<,84/
�4-0<�'=492�&30�&,2?.34��0>3:/
���������� ��� $�$41,9:������@,9,9/,��$��=8,47���
"<,=>,A,���"��,C?=09:
�<2:9:84.��9,7C=4=�:9��<4@0<�%0,>�:1��70.><4.��,<�,9/�4>=��:8;,<4=:9
A4>3�������,<�%0,>
� ��������� ��� �0<@,=4?=��0<<C�"?<A:6:��&<4� :@4,9>:
"?54�'>:8:��)49,��3<4=>49,
�?<46�)0,@492��,-<4.=���=�,9��0=>30>4.��70809>�49��?<94>?<0��0=429
� ���������� �� &<4:�%0>4C,A,9��$416C��=8,47����"�
�,C?=09:
&30��70.><4.��,<��,>>0<C��9,7C=4=�>:A,</=�(,<4:?=�&C;0=�:1��,49��423>492
� ����������� �� *,9=09�&30:;47?=��&30/C�*:2,=,<,�
�:3,99,�$099C�!.>,@4,
'=492�"0<=?,=4@0�'94@0<=,7��0=429��:/07�1:<��<0,>492�'=0<��B;0<409.0�49
"<:/?.>�>:�%:7@0��03,@4:<�"<:-708=�
� ���������� �� �,<4/�),5/4���,/4��,3C,/4��&4:
�0</4,9=C,3
�9>3<:;:80><4.��9,7C=4=�1:<�!;>48,7�%0,>�%4D0��4@4=4:9�,>�,�"<48,<C
%.3::7�49�%0<,92��4=><4.>
� ��������� ��� &<4� :@4C,9>:�"?54�'>:8: �0>0<849,>4:9�:1��<4>0<4,�"<4:<4>C�1:<�"<:/?.>��0=429��9/?=><C�!<409>0/
>:�#?,74>C���:=>�,9/��9@4<:9809>�>3<:?23��<009�#����;;<:,.3
�����������
PAPER PRESENTATION SCHEDULEThe 4th International Conference on Engineering, Technology, and Industrial Application
(THE 4TH ICETIA)
�:110��<0,6
�� ������������� ��� %4>4��D4D,3 ��(��!"�� &�!���!�����'�� �$*��� &�$���%�� ���%���!
�'%&!��$%�)� &%�� �%'$���*��%>?/C�!-50.>����?749,<C��09>0<
EHG�?9?92��9C,<EH�%?<,-,C,
�� ������������ ��� �?,=�����%C,3,<?//49�$,=C4/��$?=/4
?<
�0=429�)07/492��4B>?<0�1:<�"<:/?.>4:9�:1�>30�$?990<�:1��<:==��7:A
&?<-490
�� ����������� ��� %C,3,<?//49�$,=C4/���?,=�����&<4��2?=
%?=,9>:
�0=429�,��34.609��00/�"0770>=��,.3490�?=492�&,;0<0/�$:770<�)3007
�:/07
� ������������ ��� �080>�%?/,<C,9>:���508,<4��,</,;4�
%,8=?7��,/4������3,4<?/49
!97490�,9/��?7>480/4,��,=0/�&0=>�:9��9/:90=4,9��,92?,20�$0.0;>4@0
%6477=��0@07:;809>
� ������������� ��� $:94��?=9:A:�,9/�%:;34,/4��?9,<, &30��924900<492��0=429�:1�%3077��:?7/492��,.3490
�� ������������ �� %?;,</5:���2?=��A4��922:9:��&<4
)4/:/:��0=,<�$4C,/4
�494>0��70809>��9,7C=4=�:1�&<?.6��<,80��C�'=492���&���(�
�� ����������� ��� )?7,9/,<4��4><4���3,4<?/49��:3�
�,</,;4��508,<4
&30��0@07:;809>�:1�%>?/09>=���;>4>?/0�&0=>�49�:97490�,9/�8?7>480/4,
-,=0/��9>0<0=>=��<:?;�%070.>4:9
�� ������������ ��� :@<4�",3<4D,7������3,0<?//49 )<4>492�&0=>�:9��?7>480/4,�,9/�!97490��,=0/��:<��0,<90<=�'94@0<=4>C
�� ������������� �� �2?=��,68?9���?=94�&3,8<49 "0<1:<8,9.0�:1�%4847,<4>C��72:<4>38=�1:<�%>,>0809>��,;;492�49�,�%)!&
�9,7C=4=��;;74.,>4:9
&<<:� !22A6;4�&<<:��
!<12?.A<?�
�� �� ������� ����� ����
�������� �� !<5.::.1��;1F�,B96.;A<��*6A.
$.?.:6A.���;1.5��.?A.A6���D6
�.;1.F.;6
�<A��<:=?2@@21�+.A2?��EA?.0A6<;�<3��B?0B:6;�3?<:��B?0B:.
1<:2@A60.�*.9
�� ������� �� &2;6A.�!.;B?B;4���B96.��?623�
�69.;4�&.:.15.;��BA.B?B8
$B?6360.A6<;�#3�&21�$.9:��6<162@29��F�)@6;4���#���.@21��22=
�BA20A60�'<9C2;A����'��+6A5��9F02?<9��@��F1?<42;��<;1��<;<?
�����
� ��������� � &2;6A.�!.;B?B;4���69.;4
&.:.15.;��BA.B?B8���B96.��?623
*6A.:6;����EA?.0A6<;��?<:�&21�$.9:��6<162@29��F�)@6;4���#�
�.@21��22=��BA20A60�'<9C2;A�+6A5��9F02?<9��@��F1?<42;��<;1
�<;<?
� �� ������� � �;1.;4��D.?A6;6;4@65��+.5FB16
�B16�'216.D.;��!B@96856;��61.F.A�
�5:.1�(.D362>B??.5:.;�,�
$?2=.?.A6<;�<3�'B=2?0?6A60.9��#�3?<:��?F��02��3<?�'B=2?0?6A60.9
�9B61��EA?.0A6<;�.;1��E=9<?.A6<;�<3��>B.A6<;�<3�'A.A2��A<�$?2160A
(52�#=2?.A6;4��<;16A6<;@
���������� �� !B@?.1F�!B9F.16��!.?5.A.;4�
&B@16�"B?
$2?3<?:.;02��E=2?6:2;A@�<;�(52��<?021��<;C20A6<;��6<:.@@�.;1
'<9.?��<9920A<?��?F2?�A<��?F6;4�'2.D221�)@6;4��E5.B@A��.;
� ��� ������� �616��D6��;44<?<�� B>:.;
�B05<?6��'2A6.��B16�'.@<;48<�
!.5:21�*6;02;A
'F;A52@6@�<3��.�!4#��.A.9F@A�B@6;4�'<9��29�!2A5<1�3<?
!<;<49F02?612@�$?<1B0A6<;
� ��������� �� �:.96.�'BG6.;A6���.761�".B3.9
�AA5<B@6���.;��2?96.;�$?.A.:.�
-.5?6;.��[email protected]
�:=92:2;A6;4��.6?A?.12�&2>B6?2:2;A@�3<?��;@B?6;4�A52�'B==9F
�5.6;�'[email protected];./696AF���.@2�'AB1F�'<BA5��.9:.52?.��4?60B9AB?2
$?<1B0A@
� �� ������� �� �.4B@��B16D.;A<?<���/1B9��.86:
!.@F5B?���?D.;A<�'B4.;1.
(2@A6;4�<3��F;.:60��5.?.0A2?6@A60�.;1��<:3<?A�<3��;1<;2@6.
�BA<:.A21�$2<=92�!<C2?�3?<:��.;1B;4
PAPER PRESENTATION SCHEDULEThe 4th International Conference on Engineering, Technology, and Industrial Application
(THE 4TH ICETIA)
� ���������� � �.?:6;A<�$B7<A<:<��'?6F.;A<�
2;;F�+61F.D.A6
�"� ,'�'�#��(�����&&��&'��#&��!$ �!�"(�"��� ��"�&
$&#�)�(�#"��"���!$)"����(���#��'�!�&�"����(,�)'�"�
�"(�&$&�(�*��'(&)�()&� �!#�� �"���$$&#���
��� ��� ���
� ������ � '?6�&.5.FB;6;4@65���?6�+61F.;A6 $?2C.92;02�#3�!B@0B9<@8292A.9�'F:=A<:@��6@<?12?@��;�(<3B
�;1B@A?62@��;��216?6
� ��� ��� � +.5FB;6;4@65��-.6;.9��/616;�
!<5.:.1��;1F�,B96.;A<���;1.5
�.?A.A6���396A.�,<5.;.
$?2=.?.A6<;�.;1��5.?.0A2?6G.A6<;�<3�#69�$.9:�'5299��0A6C.A21
�.?/<;�/F��98.96��52:60.9��0A6C.A6<;�!2A5<1
������ �� �� �2;1?68��9C6.;��$���<82
$?.A69.@A6.?@<���??.1��5.;6�'.36A?.�
&63J.5��:.96.���.86:.AB9
)/B16F.5
(52��E=2?6:2;A.9�'AB1F�#3�+2A��299���#��2;2?.A<?�(F=2�+6A5
�.�#����.A.9F@A�#;�$2?3<?:.;02��;1��E5.B@A��.@2<B@
�::6@6<;@�#3���'A?<82��;46;2�����
� �� ������� �� �D6��.;1.F.;6��&6G8.��:.96.�
!<5.:.1��;1F�,B96.;A<��!B?;6
".;<2:B9@6<;�$?<1B0A6<;�<3��6;42?�#69�3?<:��;GF:.A60��EA?.0A6<;
<3��@<9.A21��<DHKL@�&B:2;
� ��������� � !<5��-.2;.9��32;16��!<05
!.05:B1�&63.169
�2@64;�.;1��:=92:2;A.A6<;�<3�(52�)A696G.A6<;�<3����&����<;C2?A2?
�@��;��:=?<C2:2;A�<3�$<D2?��.0A<?���<?� ��� .:=� <.1@
�� ������� �� �<BC.;��5.;1?.�$?.A.:.�$BA?.
'.3?69.5
!���5@.;
(52�$?2160A6<;�<3��;1<<?��6?�%B.96AF�6;�#33602�&<<:�)@6;4��?A63606.9
"2B?.9�"2AD<?8
� ���������� �� �.?168.��D6��2?:.D.;���4.A5.
'.=BA?6
�B4:2;A21�&2.96AF�<;�(�'56?A�3<?�$?<:<A6;4�$?<1B0A
� ��� ������� ��� $��*6A.@.?6���.F.9��B@A<=<���B16
�.A5<;6
+<?8=9.02��;@A?B:2;A@�(2@A�3<?�);6C2?@6AF�#00B=.A6<;
� ��������� ��� !B05���7B;.616��!���/1B9��G6@
'5<925��"B?�!B5.::.1�!B3661
�;.9F@6@�<3��?22;�'B==9F��5.6;�!.;.42:2;A��==960.A6<;�6;
�;1<;2@6.;�+<<1��B?;6AB?2��;1B@A?F
� �� ������� �� �;1.5�$?.A6D6����;1.5��.?A68.@.?6 �C.9B.A6<;�#3�+<?8�$<@AB?2�"<;�&2=2A6A6C2��</��;��.:=<2;4��.A68
.D2F.;�)@6;4�$�(���;1�#+�'�!2A5<1
�<332��?2.8

Data mining applied for accident prediction model in Indonesia toll roadAndri Irfan, Ronal Al Rasyid, and Susanty Handayani
Citation: AIP Conference Proceedings 1977, 060001 (2018); doi: 10.1063/1.5043013View online: https://doi.org/10.1063/1.5043013View Table of Contents: http://aip.scitation.org/toc/apc/1977/1Published by the American Institute of Physics
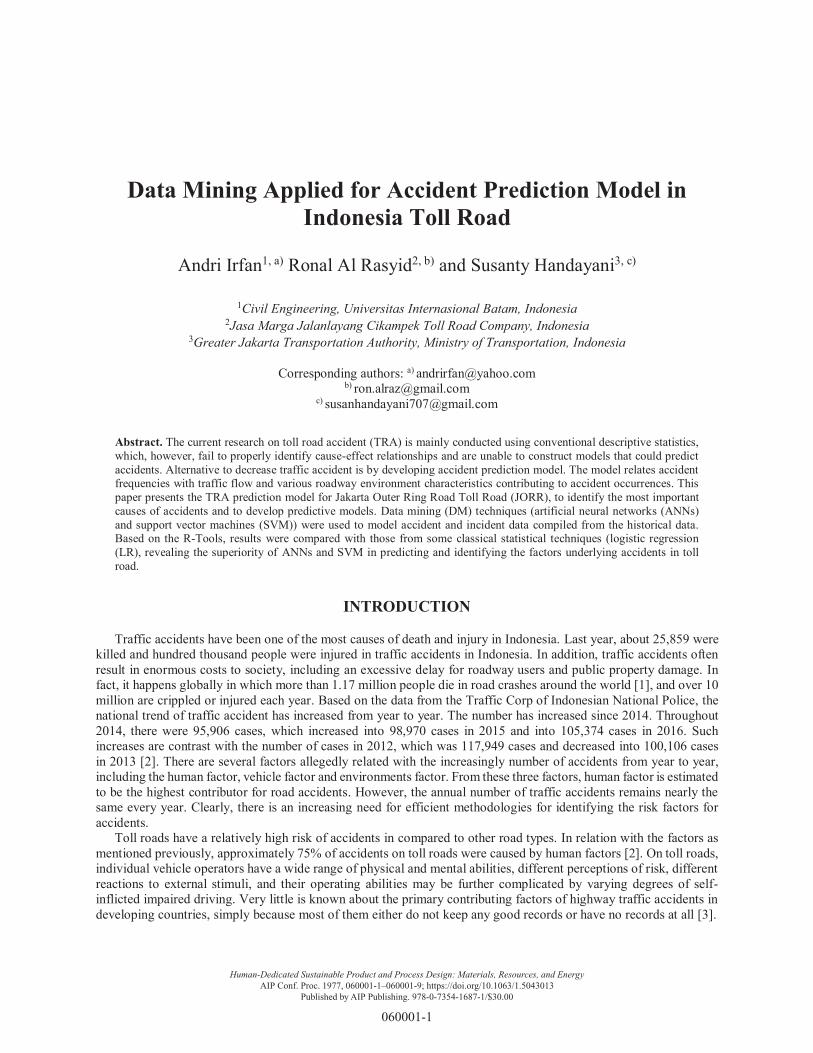
Data Mining Applied for Accident Prediction Model in Indonesia Toll Road
Andri Irfan1, a) Ronal Al Rasyid2, b) and Susanty Handayani3, c)
1Civil Engineering, Universitas Internasional Batam, Indonesia 2Jasa Marga Jalanlayang Cikampek Toll Road Company, Indonesia
3Greater Jakarta Transportation Authority, Ministry of Transportation, Indonesia
Corresponding authors: a) [email protected] b) [email protected]
Abstract. The current research on toll road accident (TRA) is mainly conducted using conventional descriptive statistics, which, however, fail to properly identify cause-effect relationships and are unable to construct models that could predict accidents. Alternative to decrease traffic accident is by developing accident prediction model. The model relates accident frequencies with traffic flow and various roadway environment characteristics contributing to accident occurrences. This paper presents the TRA prediction model for Jakarta Outer Ring Road Toll Road (JORR), to identify the most important causes of accidents and to develop predictive models. Data mining (DM) techniques (artificial neural networks (ANNs) and support vector machines (SVM)) were used to model accident and incident data compiled from the historical data. Based on the R-Tools, results were compared with those from some classical statistical techniques (logistic regression (LR), revealing the superiority of ANNs and SVM in predicting and identifying the factors underlying accidents in toll road.
INTRODUCTION
Traffic accidents have been one of the most causes of death and injury in Indonesia. Last year, about 25,859 were killed and hundred thousand people were injured in traffic accidents in Indonesia. In addition, traffic accidents often result in enormous costs to society, including an excessive delay for roadway users and public property damage. In fact, it happens globally in which more than 1.17 million people die in road crashes around the world [1], and over 10 million are crippled or injured each year. Based on the data from the Traffic Corp of Indonesian National Police, the national trend of traffic accident has increased from year to year. The number has increased since 2014. Throughout 2014, there were 95,906 cases, which increased into 98,970 cases in 2015 and into 105,374 cases in 2016. Such increases are contrast with the number of cases in 2012, which was 117,949 cases and decreased into 100,106 cases in 2013 [2]. There are several factors allegedly related with the increasingly number of accidents from year to year, including the human factor, vehicle factor and environments factor. From these three factors, human factor is estimated to be the highest contributor for road accidents. However, the annual number of traffic accidents remains nearly the same every year. Clearly, there is an increasing need for efficient methodologies for identifying the risk factors for accidents.
Toll roads have a relatively high risk of accidents in compared to other road types. In relation with the factors as mentioned previously, approximately 75% of accidents on toll roads were caused by human factors [2]. On toll roads, individual vehicle operators have a wide range of physical and mental abilities, different perceptions of risk, different reactions to external stimuli, and their operating abilities may be further complicated by varying degrees of self-inflicted impaired driving. Very little is known about the primary contributing factors of highway traffic accidents in developing countries, simply because most of them either do not keep any good records or have no records at all [3].
Human-Dedicated Sustainable Product and Process Design: Materials, Resources, and EnergyAIP Conf. Proc. 1977, 060001-1–060001-9; https://doi.org/10.1063/1.5043013
Published by AIP Publishing. 978-0-7354-1687-1/$30.00
060001-1
The fundamental effort required to improve the toll road safety level in Indonesia is by developing TRA prediction model. The function of this model is to provide estimation or prediction of traffic accident numbers which are free of impact bias from the regression-to-the-mean phenomenon. At the toll operator company level, understanding the relationship between the standards and the real accident number can be important to determine the effect of regulating one standard to the safety level of the road. Furthermore, it can serve as a guidance to a toll road improvement program, especially for developing countries, like Indonesia that are struggling to build roads in compliance with their toll road standard [4]. By identifying which elements of toll road standards contribute to the real number of accidents, the authority can effectively target highway expenditure to the improvement of deficient roads. At the same time, while the accident database system is being improved in operator level, the development of TRA prediction model can help the other operator with weak accident database. Thus, the final goal of the development of TRA prediction model is to improve the level of toll road traffic safety.
This paper presents TRA prediction model developed for JORR. The application of the developed model is expected to identify and rank the causes of the accident. Traditional statistical models used accident record to predict current road safety conditions, and their disadvantages highlight that the complete situation of the accident cannot be completely known [5]. Based on condition the accident rate is discrete and cannot be negative and unique, the TRA prediction model has been built by using a non-linear regression model with ANNs and SVM approach. The developed model utilizes large data owned by toll road operators through DM processing with r-miner. Due to the record of large amounts of data, it is necessary to produce a good and continuous pattern [6]. Approach to new techniques and the use of the latest technology is necessary, therefore the set of data that has been collected through the measurement of accidents can be utilized in a structured and scalable scheme to support the interpretation and prediction of accurate data [7]. The best model performance of DM results is used to develop TRA prediction model on toll road in Indonesia.
TOLL ROAD ACCIDENT PREDICTION
The occurrence of TRA can be caused by several causes, i.e. the user, the vehicle and the road geometry. Environmental and weather conditions also become the causes of accidents. Of the factors causing traffic accidents, infrastructure factor is the factor that can be directly engineered by toll road service providers in an effort to improve road safety through a quality improvement. This is different from other efforts related to human factors, where the role of the regulator is more directed to the rules, policy, and education, which will eventually return to the character of the perpetrator. Similarly, on the efforts to improve safety related to facilities, the regulator cannot provide direct action on the process of preparing the vehicle to be used. It is linked to the authority of the company as the producer of vehicles and the owners of vehicles as prospective users.
The TRA has many impacts. In addition to causing physical harm to the victims of accidents, it will also cause derivative effects, such as economic losses, social, and environmental damage. The consequences of an accident can be calculated based on the potential impacts, such as the estimation of medical costs, production losses, human losses, property damage, settlement costs and accident-induced congestion costs. Regulator has several possibilities to regulate the accident externalities, including efficient control of the insurance markets, upgrade the road network, and control of road users’ attitudes and behavior [8]. In order to reduce the accident rate, it is essential to know the possibility of an accident in the future. Some traffic accident prediction techniques have been continually developed. One of the most widely used methods is multivariate modeling. This model is the most common technique used in predicting building accidents. Accident prediction model currently constitutes the main tool for estimating the safety performance of road locations. Traditionally, the models are developed using the poisons-gamma hierarchy, which leads to the negative binomial regression model. The used regression model can be a linear regression model or non-linear regression model. The TRA is a chain of events which results in one or more road users causing damage or injury to oneself or others. While some recent studies present that the number of accidents on a given highway section during a certain period of time is probabilistic in nature and is a non-negative integer [9].
Statistical modeling is used to develop TRA prediction models in relation with the accident occurrence on road facilities to their various traffic and geometric characteristics. The model can be used to predict the accident potential of similar road facilities and also to conduct several safety studies, such as before-and- after studies to evaluate the effectiveness of safety improvement measures and those to identify and rank hazardous or accident-prone locations. Statistical models, moreover, are able to empirically link the accident situation and a mix of risk factors to explain these accidents, for example, road traffic and vehicle characteristics [10]. Furthermore, these statistical models are capable of incorporating a large number of variables and their interactions to explain changes in road accident involvement and severity. The development of statistical science encourages the development of other scientific
060001-2
prediction methods. Statistical methods were commonly utilized in most previous studies, such as linear regression model, logistic regression model, poisons model, negative binomial model, zero-inflated negative binomial model and generalized linear regression model methods. These methods are subject to strong assumptions and limitations in application. In contrast, ANN has been proven efficient and effective in many fields [9].
The various scientific approaches to learn about TRA have been scientifically proven to provide suggestions for the improvement of safety values and the resolution of other safety issues. There are two main engineering approaches for dealing with traffic safety problems, namely the reactive approach and the proactive approach. The reactive approach or retrofit approach entails the necessary improvements in the existing hazardous sites to reduce accident frequency and severity at these sites. Meanwhile, the proactive approach is an accident prevention approach that tries to prevent unsafe road conditions from occurring in the first place [11]. These various engineering approaches are expected to improve the quality of human life.
Artificial Intelligence
Interpretation and prediction data is one of the important things in a toll road safety management. Numerous sets of data or information will be meaningless without any interpretation and the precise and accurately prediction. In line with this issue, the development of a model that can provide a good approach to the process of prediction is required. DM is a widely used approach in the interpretation of data in various disciplines. Through an approach of artificial intelligence (AI), DM has a huge potential to assist the interpretation and prediction process [12]. The utilization of computer and the availability of data which can be utilized for increasing the traffic safety should be continually developed [13], including the utilization of AI to determine the character of the driver and the vehicle in relation with the safety level [14]. In accordance with the library research, the AI approach and DM techniques have not been developed to devise predictive modeling of TRA prediction model.
The artificial intelligence (AI) is the development of the computer ability in interpreting various algorithms language. Soft computing method is performed by imitating the processes that found in nature, such as brain and natural selection [15]. Soft computing techniques allow the processing of data with uncertainly, imprecise and ambiguous characteristics. In the early mid-1960s, a new branch of computer science began to attract the attention of many scientists. This new branch, known as AI, can be defined as the study of how to make computers support the quality of people better performance in working world. To achieve these objectives, the computer is developed by imitating human behavior. In 1970, the AI is more focused on the development of expert systems which is designed to support decision-making through computed opinions of experts. Subsequently, in the 1990s, there was a shift of AI development where various issues were studied directly from the data [16]. Until now, the AI continues to grow and includes several methods and solutions for many disciplines. The scientific approach to civil engineering is increasingly familiar with the utilization of AI, such as in the development of transportation science [17].
The development of the information technology industry is very fast as indicated by the rapid growth of scientific data collection. Large size databases are not a problem anymore due to the advantage of computer technology with a range of major applications and supporters. Currently, all data are collected and stored in the database that can be a very valuable knowledge to support making decision and optimization of an action. Classical statistics have limitations to do the data analysis on a large number of data or when there is a complex relationship between the data variables. To overcome such limitations, the development of computer-based data analysis tools with greater capabilities and automaticity is required [18]. This effort is commonly defined as knowledge discovery in databases (KDD). Wang [19] mentioned the development of this tool is increasingly recognized with the term KDD DM.
Data Mining
The Data Mining (DM) as the extraction of useful knowledge from raw data has been received a lot of attention from both the research community and industry. Indeed, many case studies suggest that companies are increasingly investigating the potential of DM technology to deliver competitive advantage. DM in R-Tools uses an object-oriented language, so r-miner can present a collection of important functions that can be applied to various problems. The r-miner is equipped with various functions, including fit, predict, mining, mgraph, metric and mmetric. Regression is one of the main tasks of DM. This task consists of mapping several inputs as independent variables to a given numeric output as the dependent variable [6]. Several regression approaches of DM are used including LR, ANNs, and SVM.
In the present research, DM was implemented in the R software (http://www.r-project.org/) under the r-miner library [6, 15, 17]. R is an open-source computational environment and high-level language that integrates powerful
060001-3
statistical and graphical features for databases. R adopts a very flexible and objective-oriented design. The r-miner library consists of several regression techniques, each of them has its own advantages. MR is relatively easy to interpret due to its additive nature while the ANNs and SVM require more computational resources but are capable of modeling more complex data.
METHODOLOGY
In this study, the purpose of the methodology was to provide a framework for the TRA prediction model. Key components of the model were introduced and their relevance to the model was discussed. The discussion focused on the accident involvement and severity models and their integration. Model form, error distribution, concerns, and uncertainty were also discussed. The purpose of the TRA prediction model is to predict the number of vehicle accident involvements on road sections and their resulted injury profiles. Developing a TRA prediction model involves several problems, the first was regarding with imbalance data. Imbalance data means within the data, there is a considerable difference between the observed sizes of one data set. The second problem involves data processing to create a training data set. The training data set has a set of multiple features that can affect the prediction result. The research aimed to solve these two problems and performed efficiently prediction processing using the DM algorithm. In this paper, a novel method to determine each step for classification model analysis of TRA prediction from large data is explained in detail.
Model Approach
One of the basic issues in safety management system is the development of TRA prediction models. Several accident prediction models have been proposed over the years, some of which are simple and others more complex. The success of safety management process in safety toll road depends on the TRA prediction which is executed by the system. To enhance the performance of safety toll road, successful prediction of TRA is considered importance. The researcher conducted the TRA prediction models based on SVM and ANN, which are empirical (data-driven) methods with the occurrence based on the non-linier programming. SVM and ANN are popular method approaches in DM. DM aims at the extraction of useful knowledge from raw data and has been received a lot of attention from both the research community and industry.
The DM in R-Project for statistical computing (R-tools) is an open-source computational environment and high-level language that integrates powerful statistical and graphical features for data. R-Tools adopt a very flexible and object-oriented design [6]. The tool can be easily extended by the creation of packages. TRA prediction model was developed from the r-miner library with the inclusion of several variables. This research developed DM methodology for TRA prediction without any restrictive assumption by considering data input showed in Table 1 as input variables. TRA prediction was devised by following several processes. The first was the cleaning and examination of data that might be used in the TRA prediction model. When the data were “cleaned”, the incorrect and irrelevant data were removed from the dataset. This process included correcting typos, ensuring the consistency of data formats and removing records with incomplete data.
Second, the examination of data. Initially, histograms or bar charts of the variables should be created to determine their frequency. Subsequently, the correlation between variables should be found. Knowing the distributions and correlations between variables would help the modeler to choose an appropriate form for the data, and to evaluate the model more effectively once it had been created. As the data were examined, the inconsistencies and inaccuracies might be found signifying that further cleaning of the data was required. Correlation refers to the relationship between two variables. A high correlation means that the two variables are closely related – as one variable changes, the other changes proportionally. If they are continuous variables, they form a line when plotted against each other. A very low correlation means that the two variables change randomly and are not associated. Most data fit somewhere between the two extremes. Correlation test is showed by matrix correlation.
Third, the selection of model type. After considering each model type that had been investigated previously (linier, dynamic, and artificial intelligence), the most appropriate type of model was selected. Creating the best TRA prediction model is usually an iterative process where the modeler may change various aspects of the model form to create the best model using the available data. The aspects of the model form that can be changed vary, ranging from model type to the software used to develop the model. In the case of TRA prediction model types, some factors that affect the model form include the base equation, the variables used in the model, and how those variables are grouped.
060001-4
The remaining data will be used to evaluate the model. From the library research, this research chose the log regression as a comparator and DM as a proposed model.
R Tools
The R is a unit of software that integrates multiple facilities with the manipulation, calculation, and reliable graphics performance. R is a free version of the language S of software (free) that is similar with S-PLUS and has been widely used by researchers and academics in scientific activities. The R environment is an open source and high-level matrix programming language, and broadly used for statistical and data analysis. The R community is very active, and the new packages are continuously being developed, hence, in this perspective, the R is an open tool for worldwide sharing of RDCT, 2009. One of such packages is the r-miner [6], which is available in http://www3.dsi.uminho.pt/pcortez/ rminer.html. The purpose of this package is to facilitate the usage of data mining algorithms in both classification and regression tasks. Considering that R uses an object-oriented language, the r-miner presents a series of important functions than can be applied on these objects, such as fit – create and adjust a given DM model using a dataset; predict – returns the predictions for new data; mining – a powerful function that trains and tests a model under several runs and a given validation method; mgraph, metric and mmetric – which return several mining graphs or metrics.
EXPERIMENT AND DISCUSSION
As the case study, the JORR Toll Road was selected. The road network in JORR has a complete characteristic. The outer ring road in metropolitan area is characterized by the presence of the urban and non-urban area that serves as the main transportation lines and this corridor is passed by all types of vehicles. JORR toll road connects the port city of Jakarta with other cities in the west, south and east region of Jakarta.
Toll Road Accident Data
The models were verified using the data from Jalan Lingkar Jakarta (JLJ) Toll Road Company and Indonesia Toll Road Authority. The dataset from the JORR toll road included 1,725 results derived from 45 toll road segments and 10 input parameters, which are referred to as the influential parameters in empirical studies of TRA. Those parameters were given an order code as input as presented in Table 1 below.
TABLE 1. Input Code No Code Measurement Description
Input 1 TRA Accident/1.000.000 vehicles km Number of accident Input 2 ADT Number Daily Traffic Average Input 3 TD Vehicles/km Traffic Density Input 4 V Km/hours Traffic Speed Input 5 L Number Number of lines Input 6 STA Station-segment Position of accident Input 7 IRI Meter/kilometer (m/km) International Roughness Index Input 8 G % Gradient Input 9 Ramp Number Number of Ramps Input 10 Skid Mm Skid resistance
Accident data were firstly recorded by the police and the JLJ officers. The day and location of each accident was also recorded in the data. In addition, the death in toll, the number of casualties, and the information about those related to each accident were also recorded in the data. The weather condition and shapes of lines were also provided in the data in the form of ID categories.
The TRA data were collected from the history of accident reports. Roughness and geometric data were collected every year using the NAASRA roughness meter and then compiled in the database program. The NAASRA roughness meter measures the relative movement between the axle and the vehicle body at a given speed. ADT data were obtained
060001-5
from the annual traffic data. The data chosen for this research were the data from 2010 until 2016. The statistics of the parameters used in this paper are presented in Table 2.
TABLE 2. Statistics of the database values TRA ADT TD V L STA IRI G Ramp Skid
Min 0.00 344,302 0.76 30.15 3 0 1.83 -0.80 0 0.33 Max 10.00 439,859 0.89 98.46 3 45 3.75 0.90 1 0.67
Average 1.59 398,406 0.80 67.65 3 - 2.86 0.20 0.25 0.54 Dev. 1.62 34,903 0.03 17.78 0 - 0.32 0.01 0.02 0.12
Toll Road Accident Prediction Model
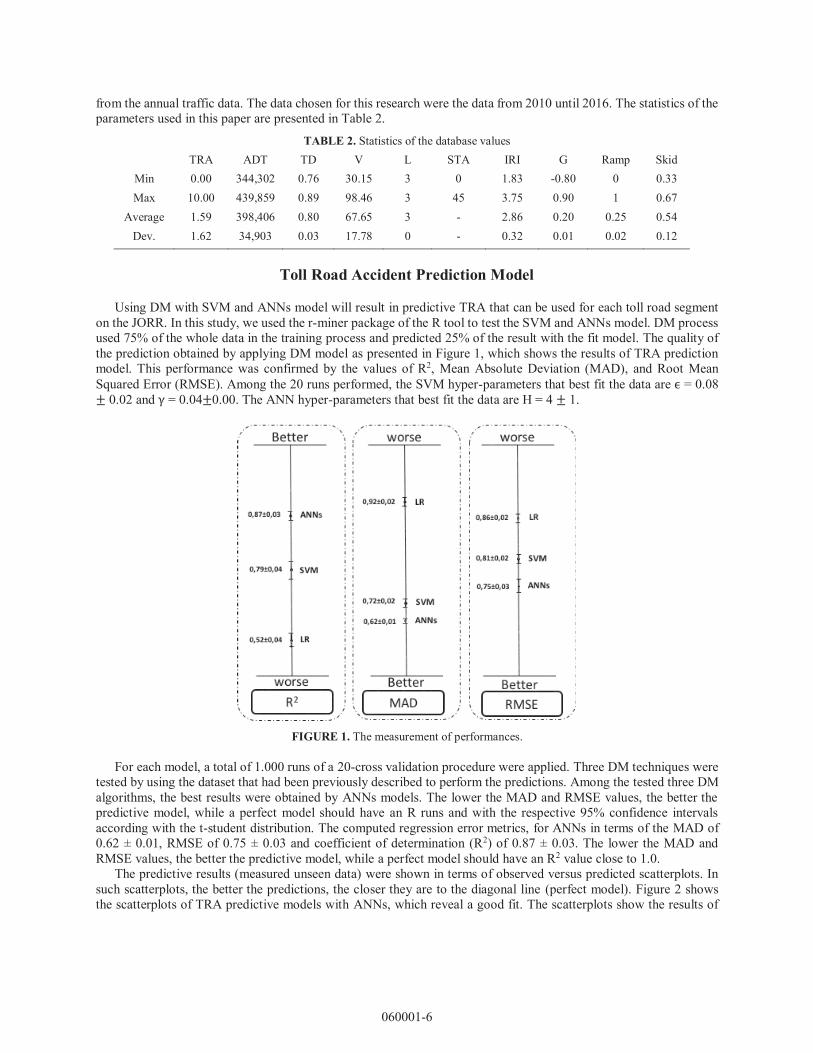
Using DM with SVM and ANNs model will result in predictive TRA that can be used for each toll road segment on the JORR. In this study, we used the r-miner package of the R tool to test the SVM and ANNs model. DM process used 75% of the whole data in the training process and predicted 25% of the result with the fit model. The quality of the prediction obtained by applying DM model as presented in Figure 1, which shows the results of TRA prediction model. This performance was confirmed by the values of R2, Mean Absolute Deviation (MAD), and Root Mean Squared Error (RMSE). Among the 20 runs performed, the SVM hyper-parameters that best fit the data are Ԗ = 0.08 േ 0.02 and ɀ = 0.04േ0.00. The ANN hyper-parameters that best fit the data are H = 4 േ 1.
FIGURE 1. The measurement of performances.
For each model, a total of 1.000 runs of a 20-cross validation procedure were applied. Three DM techniques were
tested by using the dataset that had been previously described to perform the predictions. Among the tested three DM algorithms, the best results were obtained by ANNs models. The lower the MAD and RMSE values, the better the predictive model, while a perfect model should have an R runs and with the respective 95% confidence intervals according with the t-student distribution. The computed regression error metrics, for ANNs in terms of the MAD of 0.62 ± 0.01, RMSE of 0.75 ± 0.03 and coefficient of determination (R2) of 0.87 ± 0.03. The lower the MAD and RMSE values, the better the predictive model, while a perfect model should have an R2 value close to 1.0.
The predictive results (measured unseen data) were shown in terms of observed versus predicted scatterplots. In such scatterplots, the better the predictions, the closer they are to the diagonal line (perfect model). Figure 2 shows the scatterplots of TRA predictive models with ANNs, which reveal a good fit. The scatterplots show the results of
060001-6
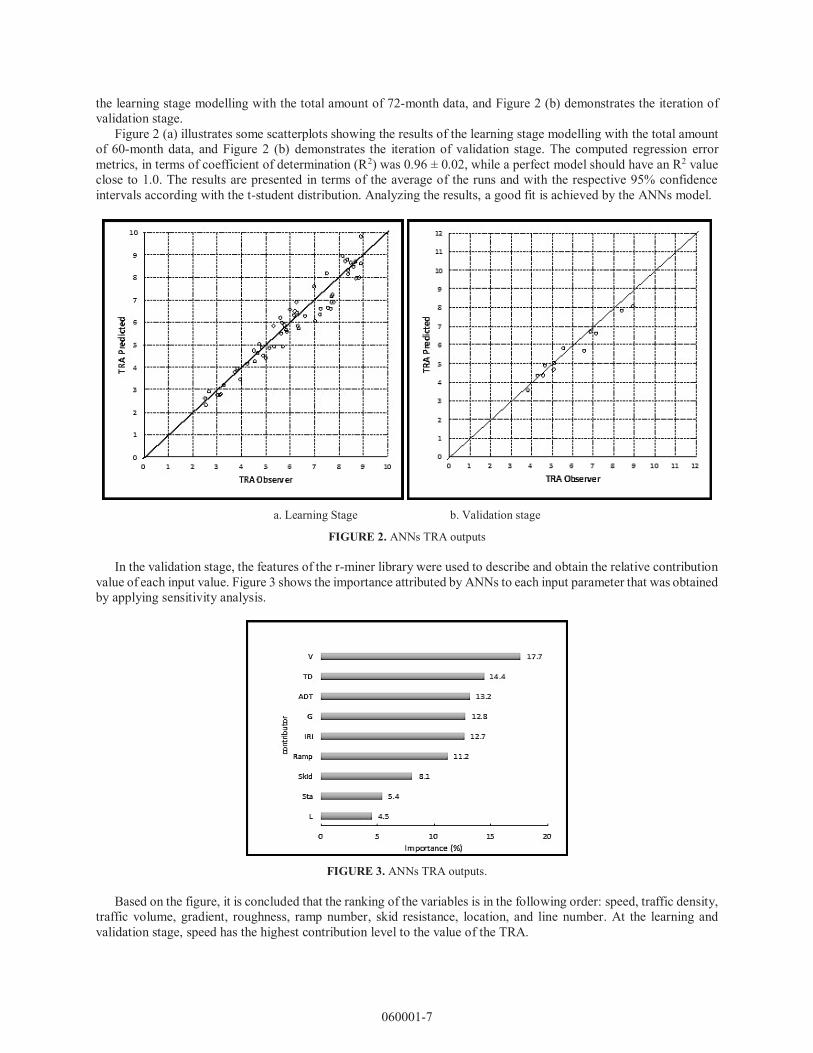
the learning stage modelling with the total amount of 72-month data, and Figure 2 (b) demonstrates the iteration of validation stage.
Figure 2 (a) illustrates some scatterplots showing the results of the learning stage modelling with the total amount of 60-month data, and Figure 2 (b) demonstrates the iteration of validation stage. The computed regression error metrics, in terms of coefficient of determination (R2) was 0.96 ± 0.02, while a perfect model should have an R2 value close to 1.0. The results are presented in terms of the average of the runs and with the respective 95% confidence intervals according with the t-student distribution. Analyzing the results, a good fit is achieved by the ANNs model.
a. Learning Stage b. Validation stage
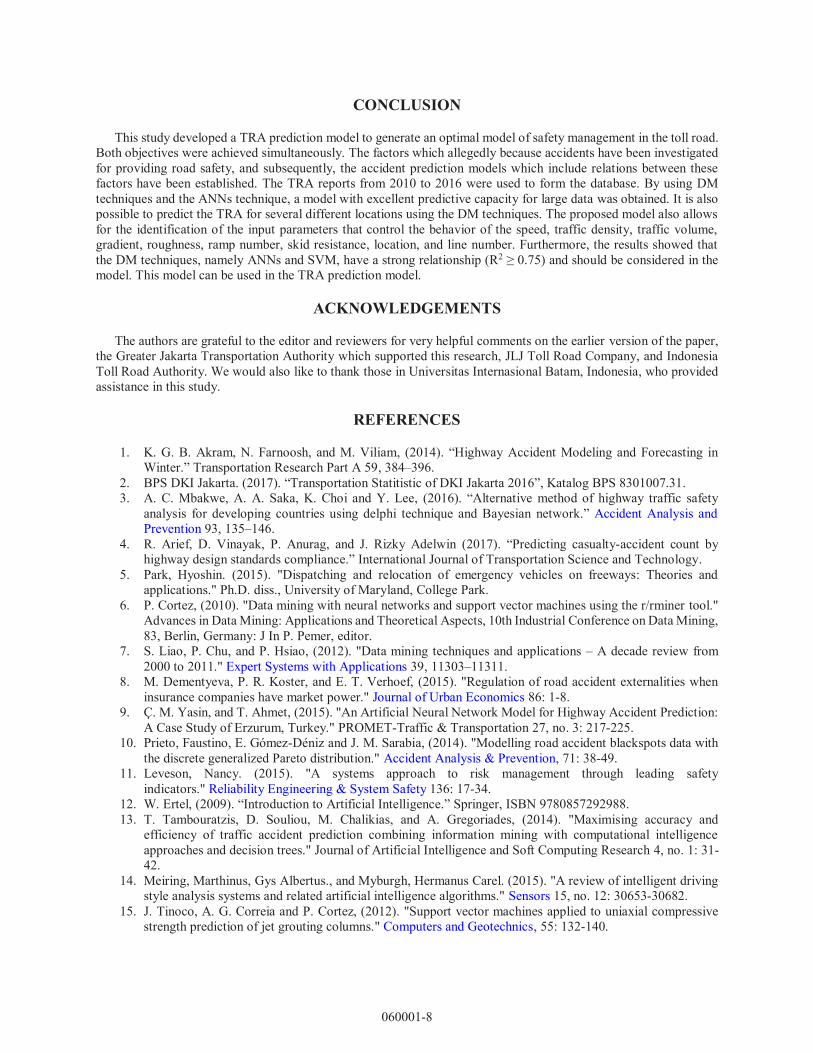
FIGURE 2. ANNs TRA outputs In the validation stage, the features of the r-miner library were used to describe and obtain the relative contribution
value of each input value. Figure 3 shows the importance attributed by ANNs to each input parameter that was obtained by applying sensitivity analysis.
FIGURE 3. ANNs TRA outputs.
Based on the figure, it is concluded that the ranking of the variables is in the following order: speed, traffic density,
traffic volume, gradient, roughness, ramp number, skid resistance, location, and line number. At the learning and validation stage, speed has the highest contribution level to the value of the TRA.
060001-7
CONCLUSION
This study developed a TRA prediction model to generate an optimal model of safety management in the toll road. Both objectives were achieved simultaneously. The factors which allegedly because accidents have been investigated for providing road safety, and subsequently, the accident prediction models which include relations between these factors have been established. The TRA reports from 2010 to 2016 were used to form the database. By using DM techniques and the ANNs technique, a model with excellent predictive capacity for large data was obtained. It is also possible to predict the TRA for several different locations using the DM techniques. The proposed model also allows for the identification of the input parameters that control the behavior of the speed, traffic density, traffic volume, gradient, roughness, ramp number, skid resistance, location, and line number. Furthermore, the results showed that the DM techniques, namely ANNs and SVM, have a strong relationship (R2 ≥ 0.75) and should be considered in the model. This model can be used in the TRA prediction model.
ACKNOWLEDGEMENTS
The authors are grateful to the editor and reviewers for very helpful comments on the earlier version of the paper, the Greater Jakarta Transportation Authority which supported this research, JLJ Toll Road Company, and Indonesia Toll Road Authority. We would also like to thank those in Universitas Internasional Batam, Indonesia, who provided assistance in this study.
REFERENCES
1. K. G. B. Akram, N. Farnoosh, and M. Viliam, (2014). “Highway Accident Modeling and Forecasting in Winter.” Transportation Research Part A 59, 384–396.
2. BPS DKI Jakarta. (2017). “Transportation Statitistic of DKI Jakarta 2016”, Katalog BPS 8301007.31. 3. A. C. Mbakwe, A. A. Saka, K. Choi and Y. Lee, (2016). “Alternative method of highway traffic safety
analysis for developing countries using delphi technique and Bayesian network.” Accident Analysis and Prevention 93, 135–146.
4. R. Arief, D. Vinayak, P. Anurag, and J. Rizky Adelwin (2017). “Predicting casualty-accident count by highway design standards compliance.” International Journal of Transportation Science and Technology.
5. Park, Hyoshin. (2015). "Dispatching and relocation of emergency vehicles on freeways: Theories and applications." Ph.D. diss., University of Maryland, College Park.
6. P. Cortez, (2010). "Data mining with neural networks and support vector machines using the r/rminer tool." Advances in Data Mining: Applications and Theoretical Aspects, 10th Industrial Conference on Data Mining, 83, Berlin, Germany: J In P. Pemer, editor.
7. S. Liao, P. Chu, and P. Hsiao, (2012). "Data mining techniques and applications – A decade review from 2000 to 2011." Expert Systems with Applications 39, 11303–11311.
8. M. Dementyeva, P. R. Koster, and E. T. Verhoef, (2015). "Regulation of road accident externalities when insurance companies have market power." Journal of Urban Economics 86: 1-8.
9. Ç. M. Yasin, and T. Ahmet, (2015). "An Artificial Neural Network Model for Highway Accident Prediction: A Case Study of Erzurum, Turkey." PROMET-Traffic & Transportation 27, no. 3: 217-225.
10. Prieto, Faustino, E. Gómez-Déniz and J. M. Sarabia, (2014). "Modelling road accident blackspots data with the discrete generalized Pareto distribution." Accident Analysis & Prevention, 71: 38-49.
11. Leveson, Nancy. (2015). "A systems approach to risk management through leading safety indicators." Reliability Engineering & System Safety 136: 17-34.
12. W. Ertel, (2009). “Introduction to Artificial Intelligence.” Springer, ISBN 9780857292988. 13. T. Tambouratzis, D. Souliou, M. Chalikias, and A. Gregoriades, (2014). "Maximising accuracy and
efficiency of traffic accident prediction combining information mining with computational intelligence approaches and decision trees." Journal of Artificial Intelligence and Soft Computing Research 4, no. 1: 31-42.
14. Meiring, Marthinus, Gys Albertus., and Myburgh, Hermanus Carel. (2015). "A review of intelligent driving style analysis systems and related artificial intelligence algorithms." Sensors 15, no. 12: 30653-30682.
15. J. Tinoco, A. G. Correia and P. Cortez, (2012). "Support vector machines applied to uniaxial compressive strength prediction of jet grouting columns." Computers and Geotechnics, 55: 132-140.
060001-8

16. S. Liao, P. Chu and P. Hsiao, (2012). "Data mining techniques and applications – A decade review from 2000 to 2011." Expert Systems with Applications 39: 11303–11311.
17. A. Rifai, S. P. Hadiwardoyo, A. G. Correia and P. Pereira, (2016). Genetic Algorithm Applied for Optimization of Pavement Maintenance under OverloadTraffic: Case Study Indonesia National Highway. Applied Mechanics and Materials ISSN: 1662-7482, Vol. 845, Trans Tech Publications, Switzerland,pp 369-378.
18. F. A. Rahman, et al. (2014). "Knowledge Discovery Database (KDD)-Data Mining Application in Transportation." Proceeding of the Electrical Engineering Computer Science and Informatics, 1(1), 116-119.
19. X. Z. Wang, (2012). Data mining and knowledge discovery for process monitoring and control. Springer Science & Business Media.
060001-9