Innovation Journalism, Attention Work and the Innovation Economy
Upload
khangminh22Category
view
4download
0
MATERIALSINNOVATIONJSR REPORT 2021For the year ended March 31, 2021
More detailed information is available on our website.https://www.jsr.co.jp/jsr_e/
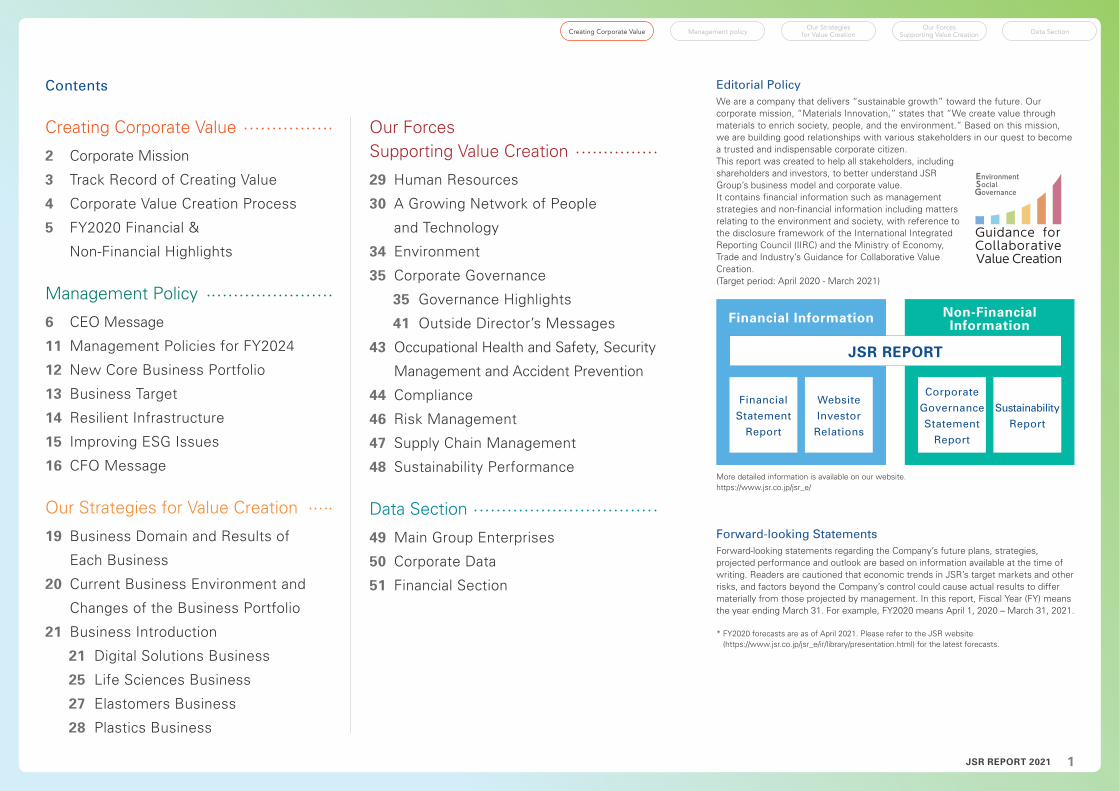
Editorial PolicyWe are a company that delivers “sustainable growth” toward the future. Our corporate mission, “Materials Innovation,” states that “We create value through materials to enrich society, people, and the environment.” Based on this mission, we are building good relationships with various stakeholders in our quest to become a trusted and indispensable corporate citizen.This report was created to help all stakeholders, including shareholders and investors, to better understand JSR Group’s business model and corporate value.It contains financial information such as management strategies and non-financial information including matters relating to the environment and society, with reference to the disclosure framework of the International Integrated Reporting Council (IIRC) and the Ministry of Economy, Trade and Industry’s Guidance for Collaborative Value Creation.(Target period: April 2020 - March 2021)
Forward-looking Statements Forward-looking statements regarding the Company’s future plans, strategies, projected performance and outlook are based on information available at the time of writing. Readers are cautioned that economic trends in JSR’s target markets and other risks, and factors beyond the Company’s control could cause actual results to differ materially from those projected by management. In this report, Fiscal Year (FY) means the year ending March 31. For example, FY2020 means April 1, 2020 – March 31, 2021. * FY2020 forecasts are as of April 2021. Please refer to the JSR website
(https://www.jsr.co.jp/jsr_e/ir/library/presentation.html) for the latest forecasts.
Corporate
Governance
Statement
Report
Non-Financial Information
Financial
Statement
Report
Financial Information
Website
Investor
Relations
Sustainability
Report
JSR REPORT
Contents
Creating Corporate Value
2 Corporate Mission
3 Track Record of Creating Value
4 Corporate Value Creation Process
5 FY2020 Financial &
Non-Financial Highlights
Management Policy
6 CEO Message
11 Management Policies for FY2024
12 New Core Business Portfolio
13 Business Target
14 Resilient Infrastructure
15 Improving ESG Issues
16 CFO Message
Our Strategies for Value Creation
19 Business Domain and Results of
Each Business
20 Current Business Environment and
Changes of the Business Portfolio
21 Business Introduction
21 Digital Solutions Business
25 Life Sciences Business
27 Elastomers Business
28 Plastics Business
Our Forces Supporting Value Creation
29 Human Resources
30 A Growing Network of People
and Technology
34 Environment
35 Corporate Governance
35 Governance Highlights
41 Outside Director’s Messages
43 Occupational Health and Safety, Security
Management and Accident Prevention
44 Compliance
46 Risk Management
47 Supply Chain Management
48 Sustainability Performance
Data Section
49 Main Group Enterprises
50 Corporate Data
51 Financial Section
Data SectionManagement policy Our Strategies for Value Creation
Our Forces Supporting Value CreationCreating Corporate Value
1JSR REPORT 2021

CORPORATE MISSION
We create value through materials to enrich society, people and the environment
MANAGEMENT POLICIES
Our efforts to realize the corporate mission of JSR Group are guided by a management policy consisting of two core components.
The first is a set of universal and unchanging “fundamental pillars of management” through which we work to achieve continuing growth.
The second is our “responsibilities to stakeholders,” which are an expression of our responsibilities as a good corporate citizen.
MATERIALS INNOVATION
Fundamental Pillars of Management
Continuous creation of businessesAs society evolves, so does the demand for specialized materials and advanced products. JSR continuously evolves to anticipate and respond to changing marketing needs and, in
doing so, achieve dynamic growth.
Enhancement of corporate cultureAs society evolves, so will our organization. JSR will build on its existing positive corporate culture to create an organization
and management style with the vitality to keep evolving.
Increase in corporate valueJSR will position itself to increase our overall corporate value by creating businesses through materials that focus on customer satisfaction and the fulfillment of employees.
Responsibility to Our Stakeholders
Responsibility to our customers /business partnersWhen interacting with our business partners and
customers, the JSR Group will:• Constantly evolve to meet the demand for new materials
• Always strive to increase customer satisfaction
• Act in good faith and maintain fair and equitable business relations
• Continue to be socially and environmentally conscious throughout the supply chain
Responsibility to our employeesAll employees should expect:• To be evaluated and rewarded based on fair standards
• Continuous opportunities to grow by challenging themselves
• Acceptance of the diversity of fellow colleagues and to be provided a place where all employees can work together as a team
Responsibility to societyAll members of the JSR Group will honor our responsibility
to both the local and global communities through:• Responsible and respectful business practices (Responsible Care)
that consider the environment and safety
• Support of environmental conservation by providing eco-friendly products
• Reduction of our environmental impact throughout the entire product life cycle
• Active contribution to conserving biodiversity throughout our business activities and the entire product life
Responsibility to shareholdersGroup will maintain its responsibility to shareholders by:• Aiming to increase corporate value by creating business
opportunities through materials
• Constantly enhancing management efficiencies
• Inspiring trust by being highly transparent and conducting sound corporate management practices
Data SectionManagement policy Our Strategies for Value Creation
Our Forces Supporting Value CreationCreating Corporate Value
2JSR REPORT 2021

Using the power of chemistry, JSR Group is continually exploring the possibilities of existing materials and
potential applications for new materials.
Our mission is to contribute to social good by supplying materials to serve future generations and
providing new value today for our customers and society.
1960s
1970s
1980s
1990s
2000s
2010s
2014
2017
2020s
1960sLaunching Synthetic Rubber Production in Japan
In 1957, JSR was established as a statutory company. In April 1960, JSR successfully launched styrene-butadiene rubber (SBR) production at its plant in Yokkaichi, Mie Prefecture. In the years that followed, the company introduced various other types of synthetic rubber and became the leading rubber manufacturer in Japan. In 1969, it became a private company.
1980sCreating New Businesses
In 1981, JSR entered into the electronic materials field, which allowed us to expand with the rapidly growing IT sector by supplying new materials. This supported diversification away from a business structure that heavily depended on the petrochemical product business. Parallel to this, we aimed at enhancing the added value of our petrochemical products.
2000sExpansion of Fine Chemicals Business
JSR significantly increased its presence in global markets through collaboration with leading manufacturers. The business structure was transformed by expanding the fine chemicals, mainly in materials for semiconductors and display panels.
2014Leading to Results
The JSR20i6* three-year mid-term business plan launched in 2014, following up on the results achieved from the JSR20i3*. During the JSR20i6*, we progressed in the globalization of our solution polymerization styrene-butadiene rubber (elastomers business) for fuel-efficient tires and our semiconductor and display materials businesses. We also established our life sciences business as a new pillar alongside our petrochemical products business and our fine chemicals business.
2017Strengthening Our Competitiveness for the Future
We launched a new three-year mid-term business plan, JSR20i9*, in April 2017. We firmly established our SSBR, semiconductor materials and life sciences businesses as our three pillars to drive earnings and promote profit expansion. We also focused on improving productivity and competitiveness through digitalization and innovation.
1990sBuilding a Global Production Structure
Amidst the trend toward borderless markets and rising competition from Asian emerging countries, JSR invested more heavily in its electronic materials business. New photoresist plants in Europe and North America created a three-region production structure. We also established production capacity for display materials in Japan, South Korea and Taiwan.In 1997, the company name was changed from “Japan Synthetic Rubber Corporation” to “JSR Corporation.”
2010sAiming for Sustainable Growth
We have embarked on a three-stage series of mid-term plans to realize our vision for 2020. The JSR20i3* three-year mid-term business plan, launched in 2011, aimed to extend earlier progress by differentiating the petrochemical products business and fine chemicals business while also nurturing and investing in the life sciences and environment and energy as strategic businesses.
1970sSurviving a Deep Slump
Crude oil prices soared as a result of two oil crises. Demand fell as the export competitiveness of synthetic rubber was eroded by the rapidly rising value of the yen. JSR responded by improving energy efficiency in the company’s plants and centralizing production. We also began to diversify the business portfolio.
2020sTowards Sustainable Growth
To deal with longer-term changes in the environment, we will build a resilient organization, strive for sustainable growth, and deliver value to all stakeholders.
SUSTAINABLE GROWTH
INITIAL PHASE
ACCELERATED DIVERSIFCATION
PHASE
ACTIVATION TOWARD GROWTH
BUSINESS ENHANCEMENT
PHASE
EXPLORATORY DIVERSIFICATION
PHASE
PROGRESS OF GLOBALIZATION
BUILDING A RESILIENT ORGANIZATION
* The “i” in ”JSR20i3” (twenty-thirteen), ”JSR20i6” (twenty-sixteen) and “JSR20i9” (twenty-nineteen) emphasizes the “Innovation” to realize Materials Innovation, which is the heart of our corporate mission.
Track Record of Creating Value
Data SectionManagement policy Our Strategies for Value Creation
Our Forces Supporting Value CreationCreating Corporate Value
3JSR REPORT 2021

OutputOur Strategies for Value Creation
LIFE SCIENCES BUSINESS P.25
Revenue 55.2 billion yenProviding advanced research products and services for the discovery and development of therapeutics.
DIGITAL SOLUTIONS BUSINESS P.21
Revenue 151.4 billion yenProviding cutting-edge semiconductor and display materials
ELASTOMERS BUSINESS P.27
Revenue 143.2 billion yenProviding solutions for automobile parts such as tires
PLASTICS BUSINESS P.28
Revenue 79.1 billion yenProviding high-performance ABS for automobile parts
The Value JSR Delivers to Society (OUTCOMES)
Polymer Technology
Precision Manufacturing
Technology
Create Sustainable Value through Materials
Meeting customer needs, providing
solutions, contributing to technological
innovation
Contributions to product safety by
considering everything from raw
materials to our finished products
Contributions to manufacturing
processes through efficient resource
use
Contributing through collaboration with
customer companies.
INNOVATION
MATERIALS
M&A
Open Innovation
Biochemistry
Business Activities Having a Greater Positive Impact
- De-risking and accelerating the discovery and development of new therapeutics
- Curbing semiconductor power consumption with nanotechnology
- Reducing LCD TV power consumption
- Contributing to greenhouse gas reductions in society
- Promoting mono-materialization
Minimizing Negative Impact
- The need for animal welfare
- Minimizing excess solvents
- Highly regulated materials
- CO2 emissions
- Plastic waste disposal
5 Foundations
Resilient Infrastructure P.14
Corporate Mission P.2
Contributions to customer companies
SDG Contributions
Contributing to quality of life and well-being
Realization of a smart (AI, IoT) society
Realization of a high-speed communications
The spread of 4K and 8K TVRealization of a
comfortable mobility
Contributing to a society of health and
longevityAccelerating the drug development timeline
From treatment to preventionPromoting personalized
medicine
Contributing to Global Environmental
ConservationEfficient energy use through improved tire performanceRealization of a recycling-oriented society through
mono-materialization
Contributions to society
Aiming to solve social issues through the value we deliver.
Protection of the Global Environment
Changes in Living Environment and
Technology
Increased Geopolitical Risk
Digitalization
The JSR Approach – Macro Trends
(Social Issues)
Corporate Value Creation Process
Sustainability
Globalization
Operational Excellence
Innovative Culture
Digitalization
Data SectionManagement policy Our Strategies for Value Creation
Our Forces Supporting Value CreationCreating Corporate Value
4JSR REPORT 2021

9,278
2018 20202019
472.0 446.6495.4
Billion yen
FY 2018 20202019
Billion yen
FY
275.1 262.0273.7
Financial Information
Financial Capital
Non-Financial Information
Human Capital and Intellectual Capital
* Since FY2017, JSR has prepared consolidated financial statements in accordance with International Financial Reporting Standards (IFRS) under the stipulations of Article 120, Paragraph 1 of the Corporate Accounting Regulations.
4.1% 2.34%
Number of Employees (Group consolidated basis)
(As of March 31, 2021)
(JSR Corporation, as of April 1, 2020)
(JSR Corporation, as of March 31, 2021)
〈Percentage of Women in Managerial Positions〉
〈Employment Rate of Individuals with Disabilities〉
* Whole JSR Group, including contract research expense of goods purchased.
JSR Corporation ......................................1(0)Manufacturing Partners of JSR or Group ...........................................2(1)Group Companies in Japan .....................1(2)Manufacturing Partners of Group Companies in Japan ....................1(2)
R&D Expenses
24.6Billion yen
6,141
Number of Patents Held Number of Workplace Accidents
Social and Relationship Capital
* Including JSR headquarters, main production and R&D sites and 22 Group companies.
* As of July 31, 2021
Japan*Japan*30 locations
Overseas 43 locations
Global Network
Natural Capital
* JSR Corporation, Group companies in Japan and other countries in total, Scope 1 + Scope 2.
* Only for JSR Corporation. 0.20 for Group companies in Japan and 0.56 for Group companies in other countries.
* Number of non-working accidents in brackets.
Greenhouse Gas (CO2) Emissions
Basic Unit of Energy Consumption
892kt-CO2
0.42kL/ ton
Revenue
Total Overseas Revenue
Operation Profit (Loss)Profit (Loss) Attributable to Owners of Parent
(61.6)Billion yen
[ (13.8) %]
(55.2)Billion yen
53.7Billion yen (15.1)%
Capital Expenditures ROE
FY2020 Financial & Non-Financial Highlights
Data SectionManagement policy Our Strategies for Value Creation
Our Forces Supporting Value CreationCreating Corporate Value
5JSR REPORT 2021

Looking Back at 2020Not long after I became CEO in June 2019, the COVID-19 pandemic broke out. For the past year or so we have been taking every precaution to protect our people, our customers, and our businesses. The crisis is by no means over, but we have learned to manage it and have the tools in place to fight it. I am very proud at how the people in our Group have acted with initiative and flexibility in their response to the situation. In last year’s message I talked about shifting out of crisis mode and transitioning into our new global situation. Our task now is to translate that into opportunity and embrace those opportunities for growth. So, I see the pandemic as a chance for us to take a fresh look at those things we can change, in our systems and management, so that we can thrive going forward.
We will grow sustainably by delivering innovation through materials.
Representative Director, CEO
Eric Johnson
Pursuing Sustainable GrowthAt heart, JSR Group is a technology company. Delivering leading-edge technology through innovation is the essence of our businesses. One may interpret our corporate mission of “Materials Innovation” as simply injecting innovation into the manufacturing of our materials, but it’s more than that. It goes on to encompass the notion of using materials as a vehicle for delivering innovation. Innovation has always been, and will always be, the source of our value. JSR Group’s purpose as a corporate citizen is to constantly hone our leading-edge technology to deliver, as effectively as possible, innovations that can enrich society.
I think we all sense that our world is under increasingly and accelerating disruptive pressures. COVID-19 is one of the latest instances, but we also
CEO Message
Data SectionManagement policy Our Strategies for Value Creation
Our Forces Supporting Value CreationCreating Corporate Value
6JSR REPORT 2021

earnings from a long-term perspective, the Digital Solutions and Life Sciences businesses clearly offered the greatest growth potential and technologies that aligned most closely with our core capabilities. At the same time, the Petrochemical businesses required major structural reforms to continue to grow over the long term.
The Elastomers Business is an essential part of the heritage of JSR Group, which was founded as Japan Synthetic Rubber Co., Ltd. I’ve been with JSR Group for more than 20 years, and have a special fondness for the Elastomers Business that has been the backbone of the company for so long. While we
have developed many outstanding products, such as SSBR, and achieved solid market positions, it was apparent that maintaining those positions going forward would require more than JSR Group’s resources alone. I am confident that the Elastomers Business can deliver greater value to society over the longer term in a context where it can enjoy abundant resources and opportunities for cross-pollination. We decided that ENEOS Corporation (ENEOS) was the best fit for the transfer. ENEOS has expanded broadly into related fields and has a strategic focus on materials. It offers an environment in which the Elastomers Business can continue to
Yokkaichi Plant
face geopolitical risks, climate change, technological breakthroughs–any of which can have a similar disruptive impact on society. For JSR Group to sustainably deliver value through innovation, to the fullest possible extent, we always have to have our finger on the pulse of social changes and to see challenges in the environment as potential opportunities. This demands an organization that is resilient. That is why “resilience” and “sustainability” are keywords in our new management policy. The strategic objective of the policy is for us to stay on the leading-edge of delivering high-quality, high-reliability, high-technical content solutions to society going forward.
The Spin-Off and Transfer of the Elastomers BusinessIn May, the board of directors made the decision to spin off the Elastomers Business, the area in which JSR Group got its start, and transfer its shares to another company. Over the years, JSR Group has taken many steps to diversify its business portfolio, but this is by far the biggest change the company has ever made.
Performance in the Elastomers Business has been under significant pressure in recent years, not only in terms of profitability, but also in the macroeconomic situation as well. Let me be clear, however: That was not the basis of the decision to transfer the business. Having re-examined where JSR Group should focus its resources to generate
Data SectionManagement policy Our Strategies for Value Creation
Our Forces Supporting Value CreationCreating Corporate Value
7JSR REPORT 2021

grow and flourish in tandem with other arms of the company. We are confident that this was the best possible decision for JSR Group and the Elastomers Business as well as for all the stakeholders involved, including the new owner, ENEOS.
New Management Policy for 2024In March 2021 we announced our new management policy. Before now, we had created fairly detailed three-year business plans, but the new policy extends to the fiscal year ending March 2025. Although its announcement was delayed because of the uncertainties of the COVID-19 pandemic, it does cover a five-year period. The policy differs from previous business plans in that it more clearly indicates our longer-term strategic direction. We have realized that a downside to having a detailed three-year business plan is that, if the underpinnings of the plan are suddenly disrupted, as we saw with COVID-19, the plan stops having value. So, the new management policy looks further ahead, and sets out guideposts to help us maintain our competitiveness by, as I mentioned above, creating a resilient organization and transforming our corporate culture. We will continue to check our progress each year, with metrics such as double-digit ROE and record high operating profit for the portfolio, but we will also monitor our progress in achieving our strategic goals. It is difficult to predict what the market will look like in 10 or 20 years, but if we can continue to move forward under the strategy
of being a world-leading technology company, I’m confident we will grow in the long run.
Digital Solutions and Life Sciences BusinessesGoing forward, the principal drivers of our growth will be the Digital Solutions and Life Sciences businesses. These are both areas where JSR Group boasts leading-edge technologies, and where the markets are growing rapidly. Therefore, we are targeting a growth rate above market by securing the appropriate resources and investing in these two businesses. At the same time, we will actively invest in next-generation research. In addition, we have gained valuable expertise through acquisitions and smooth post-merger integration, particularly in the Life Sciences Business. Building on this platform, we will continue to explore acquisitions that offer value, where the companies can build off each other. We believe these approaches will enable JSR Group to continue to grow as a global leader.
Life Sciences Business
Digital Solutions Business
(especially Semiconductor Materials)
Core Business
Business Portfolio
Data SectionManagement policy Our Strategies for Value Creation
Our Forces Supporting Value CreationCreating Corporate Value
8JSR REPORT 2021

will work to create engaging and attractive workplaces.Our planning will not be a run-of-the-mill tweaking
of the HR system, because I see this as a matter of survival for JSR Group–something that will enable us to secure the best people. All around the world, we are in competition for talented people. Unless we create an environment where all employees can reach their maximum potential, not only will current employees be unable to give their best performance, but we will not attract the best new talent. For this reason, we have to ensure that there are no obstacles getting in the way of people succeeding. We will not allow gender, race, nationality, personal identification or physical challenges stand as barriers to our employees’ ability to thrive. That’s the rationale for using employee engagement as a top-level strategic metric. It’s as important as our business strategies.
need a business model that considers the full range of risks, not only near-term risk, but also brand reputation, business continuity, and identifying business opportunities. A resilient organization is one that can flexibly rethink preconceived notions, and I believe that an organization that can do this, can create opportunities.
The Five Foundations also include actions to hone our innovation, the wellspring of JSR Group’s value, under the rubric of Innovative Culture. We see this expressed in our work on materials informatics and quantum technology through various collaborative efforts and open innovation. In addition to research on the advanced technologies themselves, we need to pursue research into ways of delivering these technologies to society.
Digitalization is another element of the Five Foundations, but it’s important to note that, for JSR Group, digitalization is a tool for business. It’s not the business itself. To be sure, digital transformation can completely change a business model. Our emphasis is on leveraging a set of digital capabilities to shift the way the organization goes about doing business.
The management policy also includes actions concerning human resources, with a focus on improving employee engagement — enabling all employees to reach their maximum potential and fostering a work environment that will draw the world’s best talent. This year, as a first step, we conducted a survey of employees across the Group to hear their concerns. Based on our findings, we
Five Foundations to Achieve Resilience and SustainabilityFor us to navigate the waves of disruptive change and achieve sustainable growth, we have to first identify the waves accurately. Responding effectively to change requires a lean organization and a flexible mindset, and that is the substance of the terms “resilience” and “sustainability” highlighted in the new management policy. Last year, the Group defined Five Foundations, a set of actions we need to take to establish the basis for such an organization. The five elements are Sustainability, Innovative Culture, Digitalization, Globalization and Operational Excellence. With an officer in charge of each element, we are making solid progress with the Foundations. Our next step will be to establish metrics to add further momentum to our actions.
Building the Five Foundations is not simply a matter of creating discrete initiatives based on a particular theme. We have to pursue actions strategically, always keeping the larger framework in mind. For example, JSR Group has accepted the challenge of reaching zero greenhouse gas emissions by 2050. Of course, this means addressing the risks of climate change and associated regulations, but the reality is we can’t reach the goal simply by extending our current initiatives. What is crucial is not just reducing greenhouse gas emissions but taking a strategic approach to the broader issue of climate change and ensuring JSR Group’s sustainability. We
Five Foundations
Sustainability
Globalization
Operational Excellence
Innovative Culture
Digitalization
Data SectionManagement policy Our Strategies for Value Creation
Our Forces Supporting Value CreationCreating Corporate Value
9JSR REPORT 2021

Sound GovernanceJSR Group believes that good governance is directly linked to corporate sustainability. We have been out in front of many other companies in Japan with the appointment of independent outside directors, reducing cross-shareholdings, and forming various committees to fortify governance.
We recently appointed a director from ValueAct Capital. We welcome the extensive knowledge this addition brings to JSR Group and we now have our second non-Japanese member of the board, as an outside director, further increasing our diversity. We will continue to take bold, strategic actions like this to enhance the governance of the Group.
Attitude Toward SafetyI have stated repeatedly that safety has to be the number one priority for everyone at JSR Group, including myself. I also believe safety is directly linked to achieving high quality and reliability in the manufacture and delivery of our products. Ensuring safety requires rules and investment, but it also demands a culture where anyone with concerns about safety feels free to speak up, and we hold each other accountable. JSR Group is committed to never compromising on safety in anything we do.
A Word to Our Shareholders and All Our StakeholdersShareholders trust us with their investments. Our responsibility is to honor that trust by carrying out
Representative Director, CEO
Eric Johnson
strategic management with integrity and a strong moral compass. JSR Group maintains a strong technological lead in both the Digital Solutions and Life Sciences businesses, where market growth is expected, but we are bound to face new waves of disruptive change. To weather such change and grow sustainably, and to flourish as an organization that can accurately read the shifting social landscape and respond appropriately, we will continually revisit the value we deliver and the way we deliver it, and continually embrace change.
Our challenge is to sustain JSR Group as an organization that fosters an environment in which every employee can thrive, provide high-level innovation to customers, and earn the trust of our business and collaboration partners. If any member of the JSR Group community suffers, we all suffer. In my dealings with all of our stakeholders, I never lose sight of the idea that “We are on your side.” That mindset of solidarity is what will enable our business to keep growing. It is by continuing to fulfill the aspirations of all stakeholders that we can ultimately provide satisfactory returns to our shareholders, and I am convinced you will be proud to have invested in JSR Group. I will continue to engage in dialogue with you as our long-term growth partners and look forward to your continued support.
Data SectionManagement policy Our Strategies for Value Creation
Our Forces Supporting Value CreationCreating Corporate Value
10JSR REPORT 2021

In recent years, the environment surrounding JSR Group
has grown more complex and more uncertain. To respond
to this environment and create value for all our stakeholders
through sustainable growth, we will create a resilient
organization that can embrace any change in the
operating environment.
The strengths of JSR Group lie in technology, which
is how we contribute to society. Our value as a Group is
creating new businesses through technology, contributing
to solving issues faced by customers and society, and
helping society flourish. To this end, the current management
policy focuses on strategies for the business areas most in
line with these strengths: the Digital Solutions Business,
especially the Semiconductor Materials Business segment,
and the Life Sciences Business. Through superlative
quality and robust customer support, we are aiming to
maximize the value of our business, continue to grow
sustainably, and become a truly global company. Seizing
upon changes in the environment as opportunities, we are
striving to build a more resilient organization capable of
generating business opportunities, achieving double-digit
ROE (Return on equity) across the Group, and surpassing
our record high of 60 billion yen for our two core
businesses.
Overview of the Management Policy
Business Target
More than 10%
Core Operating Profit
60 billion yen or more
Structure
• Innovation
• Digitalization
• Globalization
• ESG commitment
• Employee engagement
Business Portfolio
Digital Solutions Business(especially Semiconductor
Materials Business)
Life Sciences Business
ROE
Exceed Prior Peak
Resilient InfrastructureCore Business
Creating value for all stakeholders, aiming for sustainable growth
Building a resilient organization that can embrace any changes in
the operating environment
Vision
Management Policy for FY2024
Data SectionManagement policy Our Strategies for Value Creation
Our Forces Supporting Value CreationCreating Corporate Value
11JSR REPORT 2021

Display & Edge Computing
New Core Business Portfolio
The new management policy calls for JSR Group to shift
toward a business structure and management framework
characterized by resilience and sustainability over the longer
term. Over the next four years, we will use return on invested
capital (ROIC) as a metric to verify the cost of capital of each
business and concentrate resources on promising areas. We
are positioning the Digital Solutions Business, chiefly the
Semiconductor Materials, and Life Sciences Business
segments, which best align with our innovation capabilities,
as drivers of performance, considering the remarkable global
growth potential of these markets and their critical
importance in the industrial structure. We will leverage
technology to create new businesses in these areas and
contribute to solving social issues. The Digital Solutions
Business already boasts strong capital efficiency and we will
work to boost capital efficiency in the Life Sciences Business
while also pursuing growth centered on both segments.
We have undertaken structural reforms in all of our
businesses. The Elastomers Business in particular faced
competitive challenges, as intensifying global competition,
supply issues for raw materials, and contraction in the
Japanese market brought about drastic changes in the
operating environment. Having considered a range of
strategic alternatives that would ensure a more stable future
for both JSR Group and the Elastomers Business, we
decided to spin off the segment into a separate company
and transfer ownership of it to ENEOS Corporation. The
Elastomers Business is due to start operations as a wholly
owned subsidiary of ENEOS Corporation in April 2022.
Transfer of the Elastomers Business
Growth Driver
* Acquisition is included in revenue CAGR of Plastics and Life Sciences
* Circle size: Ave. Core Operating Profit in FY2017–FY2020
Current Business Portfolio
Overview of Business Strategies
Vertical axis: ROIC.
Horizontal axis: Revenue
growth rate. Circle sizes
represent core operating
profit. The preceding four
years are at left, the coming
four years are at right.
* Circle size: Core Operating Profit in FY2024
ROIC FY2024 (%)
Revenue CAGR FY2021–FY2024 (%)
35
15
30
10
25
5
20
0
0 15105 20
Semiconductor
Focus Businesses
Target Business Portfolio in FY2024
Size Total photoresist market*1: $2 Billion (Semiconductor $430 Billion) Size Total CDMO*2 market*3: $6 Billion (Biologics: $350 Billion)
Trend•Steady growth
•Technological innovation advancesTrend
•High growth
•Precision medicine fields expand
•High market share in advanced materials (e,g., ArF 30%, Alignment film 50%)
•Capability to support very complex biological drugs
•Realize a smart society (AI, IoT)
•Achieve miniaturization and high performance requiring less power
• Enhance efficiency of pharmaceutical development
• Realize personalized medicine tailored to each patient
•Concentration of resources on Semiconductor Materials Business
•Scale and fields expansion including M&A
•Business expansion through customer pipelines
•Creation of unique added value
*1 OMDIA Semiconductor Silicon Demand Forecast Tool Q3’20
*2 Contract Development and Manufacturing Organization
*3 JSR estimated
Digital Solutions BusinessRevenue: Double the market growth
Core Operating Profit Margin: Maintain strong margin (≥23%)
Life Sciences BusinessRevenue CAGR +20%
Core Operating Profit Margin: 20%
Social
Value
Strength
Strategy
Market
Avg. ROIC FY2017–FY2020 (%)
Revenue CAGR FY2017–FY2020 (%)
35
15
30
10
25
5
20
0
0-15 155-5 25
Display & Edge Computing
Structural Reform of Petrochemical
Businesses
Semiconductor
Life Sciences
Elastomers
Plastics
Life Sciences
Data SectionManagement policy Our Strategies for Value Creation
Our Forces Supporting Value CreationCreating Corporate Value
12JSR REPORT 2021

Business Target
Figures represent the total of Digital Solutions, Life Sciences, and
Next Generation businesses. We will increase revenue from 200
billion yen in FY2020 to 300 billion yen by FY2024, achieving a CAGR
of 10%. The core operating profit margin will grow from about
15% in FY2020 to around 20%. EBITDA will grow as well.
Digital Solutions and Life Sciences Businesses:
Revenue of more than 300 billion yen, record high
profit from the new business portfolio.
Target: Revenue, Core Operating Profit
Revenue (Billion yen)
CAGR
+10%
300 billion yen
100
400
300
0
200
EBITDA (Billion yen)
75.0 billion yen90
60
-30
30
0
Core Operating Profit (Billion yen)
20
0
80
60
-20
40
60.0 billion yen or more
Core Operating Profit Margin
15%
Core Operating Profit Margin
20%
Targeting double-digit ROE, we will work to enhance capital
productivity. Each division will pursue higher ROIC. The Digital
Solutions Business is already at target and will work to shore up gains.
The Life Sciences Business will realize profitability, transitioning
from the growth investment phase into a phase of generating ROIC.
We will achieve double-digit ROE
and maximize ROIC in each business area.
ROE (%) ROIC (%)
Target: Capital Return
more than +10% more than 25%
more than 12%
* Company-wide target * Life Sciences: Investment capital includes goodwill
3
12
9
0
6
30
20
-10
10
0
Life Sciences
Elastomers
Total (Digital Solutions+ Life Sciences)
Digital Solutions
Plastics
OthersDigital Solutions & Life Sciences
Targeted Profit
2019 2020 2021 2022 2023 2024(FY) 2019 2020 2021 2022 2023 2024(FY)2019 2020 2021 2022 2023 2024(FY)
2019 2020 2021 2022 2023 2024(FY)2019 2020 2021 2022 2023 2024(FY)
JSR Group’s Digital Solutions Business already enjoys
solid market share in advanced materials due to our
comprehensive technological capabilities, including our
strengths in development. Backed by advanced technological
capabilities cultivated over the years, the Life Sciences
Business has also earned the confidence of client industries
in the development of complex biopharmaceuticals. Over
the term of the management policy, we will concentrate
the bulk of resources on the Semiconductor Materials
Business segment of the Digital Solutions Business and
Life Sciences Business to promote the creation of
distinctive value. Our initiatives are aiming for top-line
growth above market in both core segments and a core
operating profit margin of 20% or more by FY2024.
Data SectionManagement policy Our Strategies for Value Creation
Our Forces Supporting Value CreationCreating Corporate Value
13JSR REPORT 2021

Innovative Culture is an indispensable foundation for JSR Group. It puts value on outcomes and encourages us to bring to bear our strengths in many fields, unhindered by preconceived notions.
Digitalization means more than rolling out new equipment and strengthening data analysis. It means the aggressive, far-reaching application of digital technology to all business fields to expand the possibilities of the Group.
We are bringing Operational Excellence to every aspect of our strategy to enable smooth execution. Enhancing work processes in each business feeds our competitive advantage.
As a global company making inroads around the world, JSR Group seeks to be highly responsive to geopolitical issues and social changes as we pursue the best possible measures.
Resilient Infrastructure
Corporate Mission
Materials Innovation
We will sustainably deliver innovation
5 Foundations
Improve social value
Improve value to employees
Profit
Improve customer value
Creating Value through the 5 Foundations
Returns through improvement
of corporate brand
• Promote open innovation opportunities
• Improving capability of researchers and engineers
• Update target-setting process• Reinforce progress
review system
• Enhance our business’ efficiency• Design and build a digital platform
• To establish the global infrastructure
• Enhance value for
all stakeholders
Sustainability
Globalization
Operational Excellence
Innovative Culture
Digitalization
Financial Value Non-financial Value
Amid growing complexities and uncertainties in the world,
converting the myriad changes in the operating environment
into opportunities requires JSR Group to further reinforce
the culture of innovation it has fostered over many years,
and better equip the Group to embrace change. To that
end, JSR Group has identified 5 Foundations that form
the basis of our culture. In addition to Sustainability,
the 5 Foundations framework includes an Innovative
Culture that ensures we remain a cutting-edge technology
company, Globalization that builds the awareness,
capabilities, and infrastructure we need to respond to
changes worldwide, Digitalization that draws on digital
transformation trends to help us work more efficiently
and, finally, Operational Excellence which integrates all the
other Foundations in transforming JSR Group’s operational
capabilities. By taking actions in each of the Foundations
we are striving to build a resilient management foundation
and continuously enhance corporate value.
Data SectionManagement policy Our Strategies for Value Creation
Our Forces Supporting Value CreationCreating Corporate Value
14JSR REPORT 2021

• Environmental Impact reduction • Diversity, Equity, and Inclusion• Work-style Innovation
• Reduce greenhouse gas emissions (TCFD initiatives)
• Promote Reuse/Recycle• Reduce waste
• Employee engagement improvement• Rebuild Corp HR system• Re-define HQ functions/roles
• Respond to climate change, environmental issues
• Employee engagement
Mid-term plan
focus
(Materiality)
Mid-term plan
activity
Set KPI target
and measures
Index
Environment P.34
Social P.29
Governance P.35
Corporate
Activity
• Independent Outside Directors
• A Diverse Board of Directors
• Nomination/Remuneration Advisory Committee
Improving ESG Issues
Society is calling for companies to grow while coexisting
with various stakeholders.
JSR’s environment, society, and governance (ESG)
initiatives focus on helping to improve the quality of life,
realizing a healthy and long-lived society, and preserving
the global environment by providing products and services
through our business activities. We also ensure sound
management through a governance framework that puts
value on compliance and risk management.
Envisioning a management foundation framed around
the environment, society, and governance, the management
policy sets out medium- and long-term issues to be
addressed in each of these areas. The plan puts particular
stress on reducing greenhouse gas emissions, in terms of
the environment, and on improving employee engagement,
in terms of society. Going forward, JSR Group will take
concrete actions aimed at achieving net zero greenhouse
gas emissions by 2050. Moreover, drawing on scenario
analyses based on the TCFD* recommendations announced
in October last year, we are working to build a resilient
corporate framework that can respond to all contingencies.
JSR Group seeks to grow alongside its employees,
embracing a range of values through measures that foster
diversity, equity, and inclusion, as well as work style innovation.
We are also taking steps to improve employee engagement,
analyzing the factors that affect engagement and reflecting
these findings in measures related to personnel systems,
working style reform, and diversity, as well as identifying
issues specific to each Group company and division.
* TCFD: The Task Force on Climate-related Financial Disclosures, established by the
Financial Stability Board (FSB). In June 2017, the TCFD presented recommendations
for the disclosure of the effects that climate change risk has on financial institutions,
companies, and governments in financial reports.
Management foundation: Advancement throughout the Group/Social/Environment/Governance
Group-wide ESG Targets Review of JSR Group Priority Issues (Materiality)
Based on points raised in discussions with experts in
2019, we are moving forward with the JSR Sustainability
Challenge to realign the Group in terms of our business
activities and management foundation. Having started on
the business activity side in 2019, in the last year we
reviewed our priority issues (Materiality) affecting our
management foundation. The steady implementation of
measures has given rise to a corporate environment that
empowers us to build virtuous cycles, leading us to achieve
robust growth that is responsive to the demands of society
in a rapidly changing world.
The Materiality we identified shaped our management
policy. Going forward, JSR Group will continue to work
together to pursue sustainable management.
The Sustainability Report 2021 contains a discussion of
JSR Group’s review of material topics.
Data SectionManagement policy Our Strategies for Value Creation
Our Forces Supporting Value CreationCreating Corporate Value
15JSR REPORT 2021

employees and more beneficial to society, as well as facilitating stronger business performance. Thus, we are confident that this decision will end up yielding results that meet the expectations of stakeholders.
FY2020 ResultsAs the year started, we projected that the COVID-19 pandemic would bring about a roughly 50 billion yen decrease in revenue across the Group. As it turned out, although the impact in the first half of the year was significant, it was smaller than expected in the second half. As a result, we were able to contain the overall COVID-19 impact on revenue to about 40 billion yen. Nevertheless, full-year revenue and profit were down year on year in FY2020.
Revenue and profit in the Digital Solutions Business were up year on year. The Semiconductor Materials Business saw higher revenue and profit on the back of steady sales, chiefly of advanced photoresists. In the Display Materials Business, revenue was down due to lower sales of color resists and other products, reflecting the withdrawal of some customers from production. Sales of alignment films remained brisk however, driving an increase in operating profit over the previous fiscal year.
The Life Sciences Business saw higher revenue from contracts for the development and manufacturing organization of biologics (CDMO) and for the research organization (CRO), but operating profit was down year on year as a result of temporary pandemic-related factors.
Building a Stable Financial Foundation and Increasing Corporate ValueJSR Group’s fundamental business strategy is to continue to deliver value to customers through innovation, based on products and services that are backed by superlative technological development capabilities. This is how we generate earnings, but it is also the way in which we believe the Group can grow together with customers and employees, ultimately thereby also meeting the expectations of our shareholders. I see my role as ensuring this strategy is carried out as smoothly and as effectively as possible from a financial standpoint, while also building a stable financial foundation for the Group.
JSR Group intends to be a resilient and sustainable organization as we move forward together with our customers, employees, society, shareholders, and other stakeholders. To accomplish this, as CFO, both I and the CEO have to be aligned strategically. We are both convinced that continually enhancing corporate value should be paramount, rather than simply pursuing short-term shareholder interests. We also carefully considered the transfer of the Elastomers Business, not only from a financial perspective, but also as a move that would truly benefit all of our stakeholders. Rather than having the division press forward with limited resources, we recognized that allowing the Elastomers Business to operate in an environment in which it could compete in Japan, and worldwide, with best-in-class technologies would be more rewarding for
Director, Managing Officer
Hideki Miyazaki
CFO Message
Data SectionManagement policy Our Strategies for Value Creation
Our Forces Supporting Value CreationCreating Corporate Value
16JSR REPORT 2021

away from Taiwan and South Korea and an accompanying concentration of manufacturing in mainland China. In light of this, we clarified our position of drastically reducing our footprint in Taiwan and South Korea, and sustaining high margins through a focus on China, where many of our major customers are located, thereby accumulating sufficient free cash flow to invest in growth areas.
Regarding our Petrochemicals businesses, we recognized that even farther-reaching structural reform was needed. In FY2020, we estimated the future cash flow expected to be generated by the Elastomers Business and performed a calculation to see if the current assets were proportionate. Then, with the help of a third party’s value calculation standard, we recorded an impairment loss of around 80 billion yen as a result for the year. Ultimately, we announced our decision to transfer the division to ENEOS Corporation on May 11, 2021.
Overall, in FY2020, although we put off announcing specifics, the new management policy itself was already in place, and I believe we were able to move forward with the first year under the direction set out by the policy.
Management PolicyWe have now released various numerical targets under the management policy leading up to FY2024, but what is most essential is to grow profits sustainably through the new business portfolio. Significant growth in the Digital Solutions and Life Sciences businesses will be the key to achieving this. The Digital Solutions Business is enjoying increasing demand. JSR Group recently ramped up our production capacity, and we believe this positions us to achieve a growth rate above market. We will boost sales of our mainstay photoresists to meet market expansion while maintaining high margins, and also target high growth in the advanced cleaning solutions business by leveraging the capacity of our US-based plant newly completed in FY2020. In the Display Materials Business, we intend to sustain profitability on the back of the structural reforms I mentioned above. As a new business, we are steadily expanding sales of infrared cut filters for smartphones and other mobile devices. Based on the above, we believe that the Digital Solutions Business will be able to increase sales revenue by about 7% while maintaining profit margins.
In the Life Sciences Business, our investments to date in the CRO and CDMO businesses are
Operating Profit (¥ millions)
FY2019 FY2020Digital Solutions Business 144,805 151,420
Core Operating Profit 30,917 34,568Life Sciences Business 50,496 55,197
Core Operating Profit 3,945 3,510Elastomers Business 178,794 143,186
Core Operating Profit (1,758) (11,420)Plastics Business 95,092 79,123
Core Operating Profit 6,237 4,430Other Businesses & Adjustment 2,779 17,682
Core Operating Profit (6,105) (5,125)
Revenue 471,967 446,609Core Operating Profit 33,236 25,963
In both the Elastomers and Plastics businesses, revenue and profit were down year on year. This reflected sluggish demand in the first half in the automotive and tire markets impacted by the pandemic, but demand began trending upward in the second half.
Given the uncertainties about the outlook prompted by COVID-19, we held off announcing the specifics of the new management policy originally planned for FY2020. At the time of our financial results briefing in April 2020, though, we did address our basic concept regarding the direction of the management policy, and in FY2020 carried out reforms in the various business areas in line with that concept. In terms of structural reforms, we had already taken decisive measures to reorganize the Display Materials Business at the end of the preceding year. The segment is currently generating relatively high returns, but from a market perspective, has seen an accelerating shift
Data SectionManagement policy Our Strategies for Value Creation
Our Forces Supporting Value CreationCreating Corporate Value
17JSR REPORT 2021

beginning to pay off in terms of earnings growth, as project orders climb steadily, by about 20% every year. The CDMO business in particular is focusing on markets that demand high technological capabilities. Many chemicals and materials companies have moved into life sciences fields in recent years and are expanding their CDMO and other contract businesses. In this environment, even if we strive to create blockbuster products, we recognize the significant risk of earnings volatility. To address this risk, we have set a clear policy of partnering closely with customers in a variety of fields to co-create products and conduct joint R&D, thereby ensuring earnings stability. This leads us to expect sustainable earnings going forward, and also positions us to
more effectively address the long-term trend of personalized medicine. Furthermore, an abundance of collaborative efforts with more customers across a wider range of fields will contribute to the stability of the business. In this way, we will achieve robust business growth and profitability at the same time.
Still, it is pointless to be so focused on pursuing immediate growth opportunities that it leads to over-investing and impedes our ability to respond to new trends down the road. Sensitive to longer-term trends, the new management policy calls us to demonstrate our technological prowess both in the semiconductor materials field that drives social change and in the life sciences field that concerns people’s health. Through these efforts, we aim to achieve the plan’s metrics of double-digit ROE and record high operating profit, surpassing the 60 billion yen record in FY2007.
Planned InvestmentsWe anticipate operating cash flow of approximately 200 billion yen over the five-year period of the new management policy. Moreover, while JSR Group has not taken much advantage of debt financing, we would like to explore this avenue more fully going forward while keeping an eye on the debt-to-equity ratio. Similarly, we would like to draw on the cash from the divestment of the Elastomers Business. Specifically, we are looking at about 100 billion yen in capital spending for the Semiconductor Materials and Life Sciences businesses, channeling other cash
into growth investments, including acquisitions, while enhancing our financial agility and flexibility. We are also seeking an overall return to shareholders of about 50% and are earmarking about 70 billion yen for various measures to achieve this.
To Our ShareholdersI believe that increasing corporate value is the best way to return profits to our shareholders. Going forward, we will continue to invest consistently in growth fields to achieve sustainable earnings growth and enhance corporate value. To meet shareholder expectations, we intend to maintain an overall return to shareholders of about 50% through a combination of dividends and share buybacks. Although JSR Group posted a large deficit in FY2020, this was due to temporary expenses associated with the structural reforms that have positioned us for improved future performance. In light of this and considering our commitment to stability in the dividend amount, we elected to pay an annual dividend of 60 yen per share.
I look forward to engaging in dialogue with our shareholders, so that I can convey the kinds of strategies JSR Group is pursuing and the steps we are taking to grow the business. I am confident that explaining where we stand will encourage investors to have faith in the long-term growth potential of JSR. As CFO, I will do everything in my power to shore up the sustainable growth of JSR Group, and I ask our shareholders for their continued support.
Aiming for double-digit
ROE by allocating
cash responsively
and flexibly.
Data SectionManagement policy Our Strategies for Value Creation
Our Forces Supporting Value CreationCreating Corporate Value
18JSR REPORT 2021

Digital Solutions BusinessSemiconductor Materials
Business
Digital Solutions BusinessDisplay Materials
BusinessLife Sciences Business Plastics BusinessElastomers Business
We provide a range of materials that support the shrinkage and integration of semiconductor devices, including lithography materials (photoresists, multilayer materials), CMP materials (for chemical and mechanical planarization), cleaning solutions, and advanced packaging materials used for device packaging.
We provide materials that go into color LCD panels used in smartphones, tablet devices, LCD TVs, and other electronics, such as alignment films and insulating films. We are also developing insulating films and planarizing layers for OLED panel materials.
JSR Group’s drug discovery and development services provide integrated support for the entire biopharmaceutical development process, from drug discovery to manufacturing. We are expanding our presence in the contract development and manufacturing organization of biologics (CDMO) and contract research organization (CRO) fields. We also provide materials developed in-house using polymer technology, such as diagnostic reagents and chromatography resins used to purify antibodies and drugs.
We focus primarily on ABS resins used for a wide range of purposes, including automobile parts, household appliances and building materials. In addition, we also offer unique products such as anti-squeaking materials used in automobile interior materials, non-coated high colorable materials used in exterior materials, and plating materials.
In addition to synthetic rubber used for tires and various rubber automotive parts, we are developing thermoplastic elastomers used in shoe soles and automobile sealants, which combine the characteristics of synthetic rubber and plastics, as well as latex used in the surface treatment of copy paper and emulsions used most notably in battery binders.
30.7 32.7 30.9 34.6
(FY)
60
40
20
2017 2018 2019 2020
0
-1.80.8
3.9 3.5
(FY) 2017 2018 2019 2020
6
3
-3
0
12
8
45.6
9.2
6.24.4
(FY) 2017 2018 2019 2020
0
-1.8
14.97.4
-11.4
2017 2018 2019 2020(FY)
30
15
-15
0
Operating Profit (Loss)(Billion yen) Operating Profit (Loss)(Billion yen) Operating Profit (Loss)(Billion yen) Operating Profit (Loss)(Billion yen)
* Totals for Digital Solutions Business segment
* Operating profit for each business segment is not disclosed.
2017 2018 2019 2020
26.4
43.950.5
55.2
(FY)
60
40
20
0
180
120
60
0
2017 2018 2019 2020
140.4
54.3
72.5
52.7
76.1
49.0
84.0
47.4
13.6 13.4 11.8 9.2
94.9
142.2 144.8 151.4
(FY)
53.8
105.495.1
79.1
120
80
40
2017 2018 2019 2020(FY)0
195.7 200.7178.8
143.2
(FY) 2017 2018 2019 2020
240
160
80
0
Revenue (Billion yen) Revenue (Billion yen) Revenue (Billion yen) Revenue (Billion yen)
Business Domain and Results of Each Business
Edge Computing/Others Display Materials Semiconductor Materials
Data SectionManagement policy Our Strategies for Value Creation
Our Forces Supporting Value CreationCreating Corporate Value
19JSR REPORT 2021

800,000
400,000
0
2020 20222021 2023 2024(FY)
600
300
0
2019 2021 20222020 2023 2024 2025(FY)
Opportunity gets stronger
Opportunity gets stronger
CAGR+7%
Semiconductor Market ($1 Million) Biopharmaceutical Market (Unit: Billion USD)
Device shrinkage Aging society
Social value as an essential
industry
Efficiency improvement of
drug development
Complexity of Structure and
Process
Personalized medicine
Changes in Business Portfolio (Size of circles show size of revenue)
FY1960 FY1980 FY1995 FY2005 FY2020
Elastomers Plastics/Fine Chemicals, Plastics (from FY1995) Fine Chemicals and Other Products (from FY1995), Digital Solutions, Life Sciences and others (from FY2019)
INITIAL PHASE (1957-1973)
EXPLORATORY DIVERSIFICATION PHASE (1974-1990)
ACCELERATED DIVERSIFICATION PHASE (1991-2001)
BUSINESS ENHANCEMENT PHASE (2002-2010)
ACTIVATION TOWARD GROWTH (2011-)
Issues Issues
* JSR estimated
60 billion at the highest
Maximum profit of over 60 billion yen
With Digital Solutions and Life Sciences businesses at the core, we aim to achieve sustainable growth and surpass the record-high profit set in FY2007.
Japan Synthetic Rubber Co., Ltd. is founded
Enter photoresist market
Chiba /Kashima Plant
operations begin
Selexis SA and Crown Bioscience
International becomes
consolidated subsidiaryOperating Profit
Yokkaichi Plant operations begin
Enter display
materials market
KBI Biopharma, Inc. (U.S.) and
MEDICAL & BIOLOGICAL
LABORATORIES CO., LTD.
become consolidated subsidiaries
1957 2000 2010 2020
Life Sciences Business
Digital Solutions Business
Digital Solutions Business
Digital Solutions Business & Life
Sciences Business Core of business
portfolio
Petrochemical Businesses*Petrochemical Businesses*Petrochemical Businesses*
* Petrochemical Businesses: Elastomers Business and Plastics Business
Current Business Environment and Changes of the Business Portfolio
JSR’s Semiconductor Materials Business delivers materials that are essential to the manufacture of semiconductors. Semiconductors are the basis for countless technologies, including electronic devices, data centers, and autonomous driving, and are an indispensable growth industry for a smart society that is pursuing digitalization through AI, IoT, and other technologies. Semiconductor technologies continue to evolve, with the miniaturization of semiconductors and chips, higher performance, and more complicated semiconductor structures. JSR Group is using its technological innovation to bring new materials and technologies to market. Meanwhile, the Life Sciences Business has grown to encompass a wide range of materials and services for the biopharmaceuticals market, including in-house materials development, contracted development and manufacturing, contract research organization, and diagnostic reagents. Technological innovation in the biopharmaceuticals market is being driven by factors such as the aging population, the trend toward personalized medicine, and demands for shorter, less costly drug development. The Group is growing this business by drawing on its proprietary technologies while leveraging synergies among Group companies.
JSR Group’s mission is to create new businesses through technology, contribute to solving issues faced by customers and society, and help society flourish. JSR started as a manufacturer of synthetic rubber, later moving into the plastics field, and further diversifying into the Digital Solutions Business in the 2000s. From 2010, the company actively invested in the Life Sciences Business, growing it into a third pillar of earnings. The management policy for FY2024 focuses on the Digital Solutions Business, primarily the Semiconductor Materials Business segment, and the Life Sciences Business, and aims to build the value of our business through superlative quality and robust customer support.
Current Business Environment
About Future Business
Data SectionManagement policy Our Strategies for Value Creation
Our Forces Supporting Value CreationCreating Corporate Value
20JSR REPORT 2021

By expanding market share of our mainstay products and expanding sales of new materials, we are targeting revenue growth above the medium-term input growth rate for silicon wafers, which is the core client industry for the Semiconductor Materials Business. We expect to see growth in our advanced ArF and EUV photoresists. JSR Group boasts a solid share in the ArF and multilayer materials market, but we are working to further expand market share. Our EUV photoresists already support mass production for 7 nm and 5 nm semiconductors. By boosting their contribution to the cutting-edge 3 nm generation semiconductor field, particularly in the core Taiwanese and South Korean markets, we intend to position these products as top runners in the field. We also expect significant growth in CMP materials, cleaning solutions, and packaging materials that address increasingly complex manufacturing processes.
Our Management Policy Aims
Double the sales growth of the market by keeping a
high market share in ArF and multilayer materials
sales expansion and start of full-scale demand of
EUV photoresists and expansion of cleaning
solutions, CMP slurry and packaging materials.
Management Policies
Business Introduction
160
80
0
2019 2021 20222020 2023 2024(FY)
Digital Solutions: Semiconductor Materials Business Projection
Revenue (Billion yen)
Packaging materials & Others
CAGR: +8%
Multilayer materials
CAGR: +5%
CMP slurry & Cleaning solutions
CAGR: +17%
Lithography Others
CAGR: +4%
Advanced photoresist
CAGR: +7%
Business Growth Above Market
JSR Group develop and provide cutting-edge materials that contribute to the evolution of semiconductors in a growing market driven by innovations in digital technology, such as with the development of IoT and 5G. In advanced lithography materials for the 10 nm node, we continue to maintain a large share of the global market. In addition, we are focused on product development and improvement of production technologies for EUV (extreme ultraviolet) photoresists, which are now being used for high volume manufacturing in 7 nm node devices. We continue to expand our product portfolio with peripheral materials including CMP materials, cleaning solutions, and advanced packaging materials.
Contribution to Solve Social Issues
In the Semiconductor Materials Business, demand for both memory and logic semiconductors has been firm since the First Quarter of FY2020. Sales of advanced photoresists were particularly strong, due in part to advanced device launches by major customers. In addition, smooth product launches were achieved of cleaning solutions and packaging materials for cutting-edge semiconductors destined for major customers, which contributed to revenue gains from the previous fiscal year. The sector secured higher core operating profit despite greater expenses incurred with expanded cleaning solutions sales. Since the Semiconductor Materials Business is deemed an essential business for
people’s livelihoods, global R&D, production, and other business activities continued without being impacted by the COVID-19 pandemic.
As a result, revenue in the Digital Solutions Business for the fiscal year under review was 151,420 million yen (up 4.6% year on year) and core operating profit was 34,568 million yen (up 11.8% year on year).
The Semiconductor Materials Business will continue its primary emphasis on cutting-edge processes, with a particular focus on EUV photoresists for 5 nm-generation-and-beyond semiconductors, working to maintain and build its share of the global market for lithography materials. JSR Group will strive to expand sales of packaging materials, broadening our lineup of materials to steadily capture 5G-related demand. We also aim to increase our share of the cleaning solutions market, led by operations at our US-based plant producing functional cleaning solutions for cutting-edge semiconductors, which started commercial production in the second half of FY2020.
Digital Solutions Business — Semiconductor Materials Business —
Advanced photoresist Lithography Others Multilayer materials CMP slurry & Cleaning solutions Packaging materials & Others
Operating Results for FY2020
Data SectionManagement policy Our Strategies for Value Creation
Our Forces Supporting Value CreationCreating Corporate Value
21JSR REPORT 2021

As the generation to follow 7 nm and 5 nm, 3 nm technology
is emerging at the leading edge of the technology
roadmap for logic semiconductors used in CPUs and other
key applications. In tandem with such device shrinkage,
transistor, packaging, and wiring technologies are also
undergoing innovation. As its strategic products in this
field, JSR Group is positioning ArF photoresists, the
current mainstream generation, and EUV photoresists, which
promise market growth for 3 nm-generation-and-beyond
semiconductors. Furthermore, we are putting together
comprehensive solutions by offering a lineup of products
used in conjunction with these photoresists, including
multilayer materials, CMP materials, cleaning solutions,
and packaging materials.
The Group’s Semiconductor Materials Business is
making inroads into markets worldwide, and counts all
semiconductor manufacturers as key customers. By region,
we are growing the business in markets in South Korea,
Taiwan, the U.S., and Japan, where leading semiconductor
manufacturers are located. Given further potential growth
of the Chinese market, we are expanding our presence
there as well. Our goal is to be a semiconductor materials
technology company bringing value to customers by
delivering advanced materials that are crucial for the
evolution of semiconductor technology. Aside from our
ability to expand globally, our competitive strengths
Strategies for Growth include R&D capabilities, stable supply capacity, and
advanced quality control, and we will continue to enhance
our comprehensive strengths.
To meet growing demand, we will invest in capacity
expansion in stages as needed. We are also looking at
potential acquisitions to scale production and expand the
product portfolio.
Semiconductor Materials Strategic Products
Digital Solutions Business — Semiconductor Materials Business —
More Moore: Enable Scaling with Transistor Technology
More than Moore: 3D Packaging
Metal interconnects: CMP & cleaning solutions
Beyond 3 nm device architecture
Photoresist Spin-on hard mask
Cu Non-cu metal interconnects
Gate Gate
Photoresist
Spin-on inorganic
Spin-on organic
Substrate
Gate
NMOS
PMOS
~3 nm Beyond 2 nm
FinFET
CMP slurry (Ru) Post etch cleaning solutions
GAA CFET
High sensitivity26mJ/cm2
3D integrated circuit
Low Dk/Df
Dielectric material
DielectricLow Dk/Df
Plating photoresist
Thick photoresist
Cu pillar(Plating photoresist)
Interlayer insulating film
Etch stop 2
Etch stop 1
Co, Cu, W300 600
8 16Titanium
Silica
TEOS Ru Selectivity
New functional cleaning solutions production facility in the U.S.
Data SectionManagement policy Our Strategies for Value Creation
Our Forces Supporting Value CreationCreating Corporate Value
22JSR REPORT 2021

80
40
0
(FY) 2019 2021 20222020 2023 2024
We expect continued growth in the LCD panel market.
The spread of 8K broadcasting technology and 5G devices
is fueling demand for new LCDs with high resolution, high
brightness, and lower power and energy consumption.
We will continue to offer customers solutions that fully
capitalize on our new development methods incorporating
digitalization technology.
We expect the Display Materials and Edge Computing
businesses to generate stable cash and find a broadening
range of target applications. The Display Materials Business
will move forward with strategically focused realignment
to maximize cash flow. We will also focus on materials for
new types of displays. Although relatively small in scale,
we are aggressively developing the Edge Computing
Business, as our NIR filters stand poised to become the de
facto standard in the field of camera modules for high-end
smartphones. Through these measures, we aim to grow
annual revenue by 4% through to FY2024.
The Display Materials Business saw expanded sales
volume to China of alignment films for wide-screen TV LCD
panels, a strategic focus of the business. The sector
posted lower revenue due to lower sales of color resists
and photosensitive spacers, reflecting the abandonment of
LCD production by some customers amid a growing
migration of LCD production from South Korea and Taiwan
to China. Despite this, core operating profit in the Display
Materials Business was up on the back of strong alignment
film sales. The Edge Computing Business suffered revenue
and profit declines due to lower sales of near-infrared (NIR)
cut-off filters.
As a result, revenue in the Digital Solutions Business
for the fiscal year under review was 151,420 million yen
Contribution to Solve Social Issues Our Management Policy Aims
Operating Results for FY2020
(up 4.6% year on year) and core operating profit was
34,568 million yen (up 11.8% year on year).
In the Display Materials Business, the Group will push
for greater sales, especially of its competitive alignment
films and insulating films for wide-screen TV LCD panels in
China, where continued growth in the LCD panel market is
anticipated, and implement steady structural reforms to
address changes in customer industries. The Group will
work to expand the Edge Computing Business by, for
example, further expanding sales of NIR cut-off filters
used chiefly in smartphone cameras.
Digital Solutions Business — Display Materials and Edge Computing businesses —
Digital Solutions: Display Materials and Edge Computing Projections
CAGR +4%
Revenue (Billion yen) Maximize cash flow in the LCD materials business
through strategically focused business realignment.
Capture growth in markets for new types of displays.
Capture new demand in the areas of high-speed
communication and sensing, boost sales, and create
new businesses. Actively develop NIR cut-off filters
for high-end smartphone cameras.
Management Policies
Data SectionManagement policy Our Strategies for Value Creation
Our Forces Supporting Value CreationCreating Corporate Value
23JSR REPORT 2021

The Display Materials Business has captured high market
shares, stemming from our strategic focus on alignment
films and insulating films that are crucial in determining the
performance of LCD panels. In particular, sales of 4K/8K
TVs, which are said currently to account for about 10% of
the market, are expected to increase, and 4K/8K TVs now
on the market use alignment films manufactured by JSR
Group, enabling us to secure top global market share.
Targeting continued growth potential for LCD panels in
the Chinese market, JSR Group will maintain its focus on
sales of competitive alignment films and insulating films
for wide-screen LCD panels while addressing structural
changes in customer industries. To this end, we transferred
business management functions from Japan to China,
the primary market, and put a system in place to enable
efficient information gathering and quick decision-making at
the frontline of that market. In addition, we established sales
offices in Beijing, Hefei, Chongqing, Fuzhou, Shenzhen,
Guangzhou, and Wuhan to reinforce sales and technical
services, while a technical center in Shanghai reinforces
our technical support capabilities. To further reinforce its
technical support capabilities, the technical center will
relocate to another district of Shanghai in 2022 and its
functions will be expanded. JSR Micro (Changshu) Co.,
Ltd., a joint venture manufacturing company established
to promote sales in the growing Chinese market, is
Strategies for Growth
Digital Solutions Business — Display Materials Business —
Revenue Composition
by Product (%) by Region (%)
Alignment films, Insulating films Color resists, etc. OLEDs & new products
China Taiwan Korea Japan & others
Projections
Strategically focused realignment across products and regions
Optimize cost structure
Establish a sustainable business structure to be a cash cow
with high ROIC.
Cost of structural reform recorded as non-core items
140
70
2019 2021 20222020 2023 2024
0
(FY)
Fixed costs
Strengthen strategically focused realignment across products and regions
Optimize cost structure
Establish cash cows, aim for gradual profit growth
* FY2019=100%
* Trend of direct fixed costs
(%)
100
50
20242020(FY)
0
100
50
(FY) 20242020
0
expanding production of display materials. For color resists
and other commodity products, in September 2020 we
announced that we would significantly curtail operations in
South Korea and Taiwan as part of structural reforms.
Structural reforms are still ongoing in FY2021, but
we expect to realize cost reductions starting in FY2022.
We will also pursue initiatives in growth areas such as
materials for low temperature solution packages, OLEDs,
and IoT applications. In the Display Materials Business, we
are strategically realigning the product portfolio and focus
markets, while paying attention not only to stable, long-term
cash generation through cost optimization but also to
gradual but steady profit growth.
The center is scheduled to start operation
in 2022.
Laboratory at the Shanghai
Technology Center.
Data SectionManagement policy Our Strategies for Value Creation
Our Forces Supporting Value CreationCreating Corporate Value
24JSR REPORT 2021

We deliver materials and support services for the entire biopharmaceutical process, from drug discovery through development and manufacturing. Our advanced framework can provide pharmaceutical companies, biotechnology companies, and academic and research institutions with services and products that help increase the efficacy of biologics and boost the probability of successful development, while shortening development periods, thereby helping to bring advanced healthcare to market sooner.
The CDMO business accounts for about half of the revenue in the Life Sciences Business. The remainder consists of revenue from the CRO business, MBL, which became a wholly owned subsidiary in 2020, and from materials developed in-house (diagnostic and research reagents and bioprocess materials). The core operating profit margin for FY2020 was 9.0%. We will work to improve the margin by clearly linking upfront investments to revenue gains. Moreover, the segment is still in its infancy, and has ample room to boost profitability through scale and further integration into the Group. We expect roughly 20% annual growth in revenue through FY2024, as well as increases in the core operating profit margin. The target by FY2024 is revenue of more than 100 billion yen and core operating profit margin of 20% or more. We will also reinforce technological development capabilities and other synergies across the Group.
Contribution to Solve Social Issues Our Management Policy Aims
In the Life Sciences Business, with our U.S. headquarters guiding strategies for the entire business segment, the Group has worked to expand revenue primarily in biomedical drug discovery and biologics contract development and manufacturing, in addition to business from materials developed in-house. Group company Crown Bioscience International (Crown) made solid progress in the contract research (CRO) services it provides. In the cell line development and contract development and manufacturing (CDMO) business, led by Group companies Selexis SA (Selexis) and KBI Biopharma, Inc. (KBI), respectively, Selexis posted solid revenue growth, while KBI’s revenue increased but profits were down due to COVID-19-related supply-chain interruptions and a one-time accounting adjustment recorded in the previous fiscal year. Revenues from diagnostic reagents, bioprocess materials, and other
Operating Results for FY2020
Achieve revenue of more than 100 billion yen and
core operating profit margin of 20% or more at a
growth rate above market.
In addition to pursuing strategies in each business,
strengthen the strategic synergies across the Life
Sciences group and aim for growth above and
beyond targets.
Management Policies
products also climbed. The diagnostic reagent business of Medical & Biological Laboratories Co., Ltd. (MBL), which became a wholly owned subsidiary in the fiscal year under review, grew steadily, contributing to overall higher revenue year on year.
As a result of the above, revenue in the Life Sciences Business for the fiscal year under review was 55,197 million yen (up 9.3% year on year) and core operating profit was 3,510 million yen (down 11.0% year on year).
In the Life Sciences Business, the Group will strive to further increase revenue and profitability by winning new contracts in the CDMO and CRO businesses. To boost revenue, KBI will leverage expanded capacity at its North Carolina, U.S. and Geneva, Switzerland facilities, where it invested in FY2020. Group unification will drive strong business expansion, through the combination of greater adoption of diagnostic reagents and bioprocess materials worldwide, enhancement to the diagnostic reagent business after MBL’s consolidation, and research activities at the JSR-Keio University Medical and Chemical Innovation Center (JKiC).
Life Sciences Business
25.0
12.5
0
24
12
(FY) 2019 2021 20222020 2023 2024
Life Sciences: Projections
20%
Core Operating Profit margin9%
Core Operating Profit (Billion Yen) (%)
Data SectionManagement policy Our Strategies for Value Creation
Our Forces Supporting Value CreationCreating Corporate Value
25JSR REPORT 2021

Life Sciences Business operations prior to the approval and launch of biologics are broadly divided into three stages: discovery, nonclinical trials, and clinical trials. By providing a wide range of materials and services at each stage of the process, we help deliver optimal medical care to people faster and cheaper. Specifically, we provide CRO and CDMO services, products related to in vitro diagnostics, and materials developed in-house. The Life Sciences Business is set apart by distinctive technology, stemming from a combination of JSR’s proprietary technology and technology gained through acquisitions. A rising volume of contracted projects will drive future growth in the CDMO business. In this market, which is attracting an increasing number of entrants, three characteristics set JSR Group’s CDMO business apart. First, in addition to standard antibodies, we excel in the development of next-generation, difficult-to-express biologics such as bispecific antibodies. We can offer analysis and manufacturing process development capabilities drawing on this strength. Next, although small in scale, we are engaged in the fine-tuned, flexible development of biologics with complex molecular designs related to high-value-added personalized and precision medicine. We also handle proprietary materials that draw on our advanced quality management capabilities and apply these to the manufacturing process. In the CDMO business, we have started construction of new plants in Geneva, Switzerland and North Carolina in the U.S. The Geneva plant will be the base of our CDMO operations in Europe, while the plant in North Carolina will carry out joint projects with U.S. customers. Like the CDMO business, distinctive technological capabilities are the source of our competitive strengths in the CRO business. Our in vitro drug efficacy testing services boast a broad
Strategies for Growth lineup of testing models, including the world’s largest number of PDX* models, primarily focused on immuno-oncology. In addition, we are contributing to more efficient discovery through our comprehensive new drug candidate discovery services, which bring together in vitro drug efficacy testing models and post in vivo/in vitro testing analytical services. Bioprocess materials, the Group’s proprietary high-value-added materials, are finding application in a growing number of projects. We expect profits to grow in this field, in line with projected increases in order volume due to an increase in projects in the pipeline and likelihood of commercializing Phase 3 projects. In the in vitro diagnostics business, we will ensure stable profits by stepping up subsidiary MBL’s expansion into the Chinese market and promoting our antibody contract research and contract companion diagnostic reagent research services.
* PDX: Patient derived xenograft. An immunodeficient mouse transplanted with human-
derived cancer tissue. This process is effective in screening anticancer drugs because
it allows evaluation in an environment closer to humans than conventional methods.
Business Domain
DiscoverySearch and creation of new substancesScreening of candidate substances
Clinical trials
Confirm drug safety and efficacy in humansPhase 1 - Phase 3
PreclinicalConfirm effectiveness, quality stability, and safety of candidate substances using cells and animals
Approval and launch
Faster and lower costPersonalized medicine
Aging society
Support processes from drug discovery through manufacturing of biologicsDevelopment of diagnostic reagent
technology to confirm efficacy in advance
CRO
Contract research for drug discovery
• Advanced screening & analysis services
• Increased drug discovery success
• Efficient drug development, faster and lower cost
CDMOContract development
and manufacturing of biologics
Purification media
Amsphere™A3IVD
Diagnostic and testing
120
60
0
2019 2021 20222020 2023 2024(FY)
Revenue (Billion yen)
CAGR +20%
* BPM: Bioprocess
Materials, i.e.,
AMSPHERE™A3
* IVDM: In Vitro
Diagnostic Materials
CDMO CRO BPM IVDM/MBL
Life Sciences Business
KBI’s new plant in the U.S.
Data SectionManagement policy Our Strategies for Value Creation
Our Forces Supporting Value CreationCreating Corporate Value
26JSR REPORT 2021

Sustainable development within industry, typified by the SDGs and a focus on reducing impact on the environment, will lead to further sophistication and diversification of customer and social needs. We see this trend as a major business opportunity for our Elastomers Business. We will respond to technological demands for low-wear, high-durability materials due to the widespread use of fuel-efficient tires for conventional vehicles and electric vehicles (EVs).
The COVID-19 pandemic’s impact on production of automobile tires, one of the segment’s main customer industries, was compounded by temporary production stoppages or reductions at tire-maker plants in Europe and elsewhere intended to curb the spread of COVID-19. Consequently, yearly production was down from the previous fiscal year, although production began to recover in the second half of the year.
Amid these circumstances, the sales volume of Solution Styrene-Butadiene Rubber (SSBR), positioned as a strategic product, remained at the same level as the previous fiscal year, despite a year-on-year decline in worldwide tire production. Nevertheless, the Elastomers Business recorded lower revenue compared to the previous fiscal year, as the segment’s overall sales volume was sluggish and sales prices slid because of a deterioration in raw-material market conditions. The segment posted a core operating loss for the full term as a result of revenue declines and narrower price spreads.
Contribution to Solve Social Issues
Operating Results for FY2020 and Outlook
In April 2022, we will separate the Elastomers Business to a successor company wholly owned by JSR, and plan to transfer the shares of the successor company to ENEOS Corporation (ENEOS).
Throughout its history, JSR Group has been proactive in responding to changing market and customer needs. After considering all strategic options, we made the difficult decision to move both JSR Group and the Elastomers Business, our foundational business, to a place where both entities can obtain the resources they need to build a stronger, more sustainable future.
As an industry leader, ENEOS has the scale, expertise, and management resources necessary to adequately support the long-term prospects of the Elastomers
Separation and Business Transfer
As a result of the above, revenue in the Elastomers Business for the fiscal year under review was down to 143,186 million yen (down 19.9% year on year), while the core operating loss was 11,420 million yen, compared with a loss of 1,758 million yen a year earlier.
In the Elastomers Business, the Group will push forward with sales expansion of SSBR for high-performance tires, whose demand is expected to grow over the long term. Commercial SSBR production began in FY2020 at JSR MOL Synthetic Rubber Ltd., a joint venture set up in Hungary, which completed a system enabling the Group to supply SSBR globally from three sites in Japan, Thailand, and Hungary. The Group will also work to expand sales of binders for rechargeable batteries, in view of the growth in electric vehicles.
Business. ENEOS also gave high ratings to the segment’s technological capabilities and manufacturing expertise. Moreover, ENEOS is looking to expand its presence in high-performance materials as part of a strategic revision of its business model, and Elastomers Business was a perfect fit for that strategy. Considering these factors, we are convinced that ENEOS offers an environment in which the Elastomers Business will continue to flourish.
Elastomers Business
Elastomers Business Transfer Process
Current Status
JSR Group
April 2022 (planned)
ENEOS Corporation
JSR wholly owned subsidiary
Japan Synthetic Rubber Spin-Off Preparation Co., Ltd.
1 Absorption-type Company Split* to a successor company
Becomes a wholly owned subsidiary of ENEOS
2 Transfer* of shares to ENEOS
Scope of Transfer
JSR Corporation Elastomers BusinessSome directly and indirectly related departments of Yokkaichi Plant, Chiba Plant (excluding Digital Solutions Business), and Kashima Plant; and some directly and indirectly related departments of Head Office
Elastomers-related Group companiesElastomix Co., Ltd. Group, JSR Trading Co., Ltd. Group, Kraton JSR Elastomers K.K., Japan Butyl Co., Ltd., JSR Elastomer Korea Co., Ltd. JSR Elastomer India Private Limited, JSR Elastomer America, Inc., JSR Elastomer Europe GmbH, JSR MOL Synthetic Rubber Ltd., JSR BST Elastomer Co., Ltd., elastomers sales and technology base of JSR (Shanghai) Co., Ltd.
* 1 and 2 will occur on the same day (April 1, 2022).
Digital Solutions
Plastics
Life Sciences
Others
Elastomers
Data SectionManagement policy Our Strategies for Value Creation
Our Forces Supporting Value CreationCreating Corporate Value
27JSR REPORT 2021

productivity innovations and higher quality levels in the
automobile industry, such as HUSHLLOY™ anti-squeak
material, VIVILLOY™ highly colorable materials for paint-less
applications, and PLATZON™ plating material.
Customer needs are diversifying, including the demand for
low in-vehicle noise in line with increasing use of electric
vehicles (EVs) as well as calls for mono-materialization and
solvent-free production to reduce environmental load and
costs. We will continue offering products that address
such diversifying customer needs, such as materials
yielding low-squeak noise or unpainted components that
reduce environmental impact.
Contribution to Solve Social Issues
The automotive industry, a major client industry for
plastics, is undergoing a major transformation. With the
advancement of electrification and autonomous driving,
manufacturers are demanding lighter and more
multifunctional vehicle chassis than ever before.
To contribute to the transformation of the automobile
industry through our Plastics Business, we are delivering
mono-materials that reduce environmental load.
For instance, frictional vibration on the surface of
joints between plastic parts is a major design
consideration, because it can be the cause of unpleasant
squeaking noises.
HUSHLLOY™ styrene thermoplastic has revolutionary
properties that prevent such squeaking. HUSHLLOY™ not
only offers anti-squeak measures to maintain a quiet
vehicle interior, which lasts for the lifetime of the product,
but also allows lower costs of anti-squeak materials.
Mono-materialization
The Plastics Business segment saw a drop in sales
volume and revenue from the previous fiscal year, due to
weaker demand resulting from the COVID-19 pandemic.
Core operating profit fell due to the segment’s sales
volume decline.
As a result of the above, revenue from the Plastics
Business was 79,123 million yen (down 16.8% year on
year) and core operating profit was 4,430 million yen
(down 29.0% year on year).
The Group will work to expand the Plastics Business
by enlarging sales, particularly in overseas markets, of
distinctive, differentiated products that address
Operating Results for FY2020 and Outlook
Based on proprietary polymer technology cultivated over
many years of global sales and supply of weather-resistant
materials (in the DIALAC® series) and composite plastic
alloys, we developed VIVILLOY™, a highly colorable material
for paint-less applications. This product features color depth
and vividness closely resembling paint for components
with intricate shapes. Bypassing the painting process
contributes to lower overall cost. Moreover, by using a
single, unpainted plastic, the material can be recycled,
which further lessens the environmental load in terms of
reducing the use of painting solvents.
Plastics Business
Data SectionManagement policy Our Strategies for Value Creation
Our Forces Supporting Value CreationCreating Corporate Value
28JSR REPORT 2021

C
C C
C
JSR Group drives its organization and personnel based upon the following measures:
Philosophy
Course of Action: 4C
JSR Group’s new management policy delineates JSR’s vision for employee sustainability as follows: “We respect the values of diversity, equity and inclusion, and strive for all employees to reach their maximum potential. We will evolve to meet changing employee needs and maximize employee engagement.”
The Group aims to be a resilient organization that can flexibly respond to various changes in the business environment. To that end, we believe it is important to recruit and promote diverse human resources, respect each employee’s values, ways of thinking, and ideas, accept and challenge one another, and explore and be ready to pursue all possibilities.
In addition to enhancing various HR systems, we are working to foster a corporate culture that values
Diversity, Equity and Inclusion
At JSR, the Company and its employees have been focusing on Work-style Innovation (WSI) activities since 2017, with the goal of boosting competitiveness and achieving sustainable growth.
The Company is promoting the active participation of diverse employees, making improvements to the working environment, various systems, and IT infrastructure to enable flexible working styles while valuing employee autonomy and striving to increase employee engagement and productivity. Each department is putting systems in
Work-style Innovation (WSI) Activities
We are taking steps to analyze the factors that affect employee engagement and reflect these in our HR systems, WSI activities, and diversity, equity and inclusion initiatives, while also identifying issues specific to each department and group companies. Through these efforts, we are striving to evolve into an organization that can maximize employee engagement, thereby boosting our competitiveness and building corporate value.
Actions to Increase Employee Engagement
Develop mechanisms and a corporate culture with a healthy balance of ‘Freedom’ and ‘Discipline,’ guided by the Course of Action’s 4Cs to enable managers and junior staff to grow together, help all employees accurately perceive and solve issues in order to foster a JSR that not only maintains its organizational capacity, but ensures its future growth.
Promote the globalization of JSR corporation employees while developing a globalized workforce within JSR Group as well as train and manage the Group’s human resources on a global level.
Generate synergies which take full advantage of the increasing range of diversity (in terms of nationality, culture, gender, values, etc.) throughout JSR Group’s vast human resource pool.
1 2
3
ChallengeAll employees of JSR Group should share a common, global focus and desire to succeed. Employees should feel confident to autonomously take on new challenges, learning from successes while viewing setbacks as opportunities to learn, grow and improve.
CommunicationAll employees should feel comfortable and confident maintaining open lines of bi-directional communication at all levels within JSR Group. Employees should strive for organizational transparency through direct conversations as the best means to share value and achieve common goals, especially in the face of growth and diversification.
CollaborationEmployees will work together in the spirit of cooperation valuing common corporate goals over internal or departmental barriers. Employees will also be encouraged to actively collaborate with external resources and not be bound to conventional ideas.
Cultivation All employees will cultivate an environment that supports bi-directional communication between managers and subordinates and provides opportunities to develop together as individuals and as members of productive, supportive teams.
employees’ individuality, making use of various working styles and managing each employee so that they can reach their potential and contribute to the performance and competitive strengths of the organization.
place to realize the ideal organization and encourage employees to work in a healthy and positive manner that balances work and lifestyle. We are leveraging the power of advanced digital technology to analyze our business processes and thoroughly revise approaches to work, implementing actions to enable diverse working styles while drastically increasing productivity.
Participant in the United Nations Global Compact
JSR Group became a participant in the United Nations Global Compact in April 2009. As such, we will more proactively fulfill our corporate social responsibilities with recognition that businesses operating on a global level must make a greater commitment to human rights, labor, the environment and anti-corruption, as expressed in The Ten Principles of the United Nations Global Compact.
Representative Director, CEO Eric Johnson
Human Resources
The Ten Principles of the United Nations Global Compact1. Businesses should support and respect the
protection of internationally proclaimed human rights; and
2. make sure that they are not complicit in human rights abuses.
3. Businesses should uphold the freedom of association and the effective recognition of the right to collective bargaining;
4. the elimination of all forms of forced and compulsory labor;
5. the effective abolition of child labor; and
6. the elimination of discrimination in respect of employment and occupation.
7. Businesses should support a precautionary approach to environmental challenges;
8. undertake initiatives to promote greater environmental responsibility; and
9. encourage the development and diffusion of environmentally friendly technologies.
10. Businesses should work against corruption in all its forms, including extortion and bribery.
Data SectionManagement policy Our Strategies for Value Creation
Our Forces Supporting Value CreationCreating Corporate Value
29JSR REPORT 2021

Consignment Research
Collaboration
連携
Collaboration
JSR-UTokyo Collaboration Hub, CURIE
JSR-Keio University Medical and Chemical Innovation Center
Universities Research
Research Institutes
External Projects Institutions
Yokkaichi Research Center
CVC Activities (Corporate Venture Capital)
Business Support Research Next Generation Technology Research
RD Technology and Digital Transformation Center
Tsukuba Research Laboratories
JSR Bioscience and informatics R&D Center
Performance Polymer Research Laboratories Display Solution Research LaboratoriesFine Electronic Materials Research Laboratories
Edge Computing Research Laboratories
Materials Informatics Initiative
Innovative Materials Laboratory
ConsortiaBusiness Division
Collaboration
Customer and Market Needs
Market Needs Technology Seeds
R&D Policy and Structure
Materials Innovation
JSR Group is promoting R&D activities to prepare for rapidly changing social needs, such as
changes stemming from digital transformation, growing pressure for a carbon-free society,
and increasing interest in personalized medicine and healthy longevity. There are two
primary missions in the research division: to conduct Business Support Research in fields
that are currently being developed and new or applied research in peripheral areas, and to
conduct Next-generation Technology Research such as seed research where future growth
is expected.
Our priority in Business Support Research is cooperating with the value chain within
JSR Group, from development to manufacturing, sales, and logistics. In addition to
promoting the integration of R&D activities with business operations, such as emphasizing
direct dialogue with customers so that researchers can delve into their needs, we are
building an ecosystem that can provide global and timely support for customers’ business
promotion by enhancing technical services in each country in which we operate.
Regarding Next-generation Technology Research, we are engaged in R&D that
anticipates the potential needs of the market. In June 2020, we reorganized related R&D
divisions into the RD Technology and Digital Transformation Center to accelerate the
transformation of our research approach. In addition to in-house research, we are
promoting open innovation such as joint research with universities and research institutes
in Japan and abroad, bringing in outside knowledge and technologies to overcome
problems and create groundbreaking innovation. Through academic collaboration and
drawing on the expertise the Group has cultivated over many years in its materials
business, we are exploring possibilities for developing businesses in new fields and
commercializing leading-edge research in areas that are new to us.
Materials informatics and the practical application of data-driven R&D methods have
been another focus of the Group. The new data infrastructure for this requires digitalization
and the construction of theoretical models, as well as new methods such as AI and
quantum computing. JSR Group is moving forward with development from both angles.
When the data infrastructure and new methods are ready for practical application, we are
confident that it will enable us to carry out many conventional laboratory experiments on
computers, leading to much shorter research and development periods.
A Growing Network of People and Technology
Core Business
Polymer technology
Analysis and evaluation technology
Precision manufacturing
technology
“Basis of JSR”
Next Generation Business
Digital Solutions
Petrochemical Businesses
Society’s diversifying needs
Pursuing the basic principles of sciences
Technology innovation
Life Sciences
Data SectionManagement policy Our Strategies for Value Creation
Our Forces Supporting Value CreationCreating Corporate Value
30JSR REPORT 2021

We will translate new research methods into future competitiveness.
Raising up Digital Transformation Professionals and Next-Generation Basic Technology
Engagement with Enthought
—Initiatives to train in-house data scientists and construct databases—
Materials Informatics InitiativeRD Technology and Digital Transformation Center
Yoshio Takimoto
Materials Informatics InitiativeRD Technology and Digital Transformation Center
Yu-ya Ohnishi
The Institute of Statistical Mathematics, Research Organization of Information and Systems
—Basic technology research activities for materials informatics and other data-driven materials research—
ISM is the only research institute in Japan that specializes in statistical mathematics. The JSR-ISM Smart Chemistry Lab we established with ISM is developing algorithms to enable new
materials development methods using data science. With the new algorithms, we aim to solve problems of materials development that conventional data science has not been able to address.
Please tell us about the main role of the Institute of Statistical Mathematics (ISM).Q
Until now, data has mainly been used to examine the causes of material defects by analyzing the data after the fact. Whereas the effective use of data science will not only improve the accuracy
of such post hoc analysis but also predict the results of experiments to some extent. This can reduce the number of experiments needed and can save a lot of time and money.
How is what you are doing different from the conventional use of data?Q
A
A We want to bring about R&D-driven corporate transformation, so we are working to acquire highly innovative technologies such as AI and quantum computing. The core technological elements of
materials development include collecting and systematically organizing data generated by experiments and calculations, and then analyzing and visualizing this data. JSR is striving to lay the groundwork for new research and development methods by seamlessly connecting the whole data flow digitally. Our partner, Enthought, is supporting our efforts to incorporate this digitalization into the Group’s businesses.
A Enthought, Inc. is a US-based company that supports corporate digital transformation. They are a group of experts in Python, the latest programming language, which has recently undergirded
advancements in AI technology, and in the development of Python-based services. But Enthought is not simply a provider of technology and services. They also analyze clients’ business processes and seek to provide experiences that have real value. In terms of specific actions, JSR is sending researchers to Enthought. They bring with them real issues their departments are facing and use these as case studies in learning the basics of Python programming and Agile development methodologies. Those researchers will come back equipped to identify areas where the application of digital technologies can uncover value and bring what they have learned to bear on projects that involve their entire departments.
What kind of company is Enthought?Q
A There are limits to the application of any technology or service. For example, when we started working with Enthought in 2017, AI wasn’t really on JSR’s radar yet. But through our engagement
with Enthought and various other opportunities, the Group now has a better idea of what AI can make possible for us. Looking ahead, we will expand the scope of collaboration, going after more efficient development and the development of more high-precision materials as we seek to create new value.
Do you sense that JSR Group has any expectations for digitalization?Q
What do digitalization and digital transformation mean to JSR, and what are you doing in these areas?
Q
To use a cooking analogy, the ISM’s endeavors can be said to be at the stage of making new cooking utensils. Even if we’re given ingredients that are hard to work with, which is data that
until now was impossible to process well, the new utensils make it possible to process the data with a high degree of accuracy. Highly accurate data processing for R&D is like really tasty cooking, but new tools have to be learned. JSR is actively cultivating a pool of researchers who regularly participate in ISM’s personnel development programs.
What role is this initiative playing in carrying forward the new R&D approach called Materials Informatics?
Q
A
A
Input
External data
Data lake
Machine learning
Simulation Experiment
Data SectionManagement policy Our Strategies for Value Creation
Our Forces Supporting Value CreationCreating Corporate Value
31JSR REPORT 2021

A view of IBM Q Network Hub @ Keio University
* This image is licensed.
JSR Group is making use of quantum computers and AI in new approaches across various fields including R&D.
Joint Research across Disciplines
IBM Quantum Network
—Targeting implementation of research through shared use of quantum computers—
A We are currently using simulations in materials development, and we can expect to extend that to a broader range of applications. Also, I think down the road we will be able to solve the
problem of massive power consumption, which is an issue in machine learning at the moment. This will allow us to do large-scale data processing at lower cost. We hope this will serve to replace much of the actual experimentation in JSR’s research and development flow, making it cheaper and faster to get results than through actual experiments. It will also be possible to study areas that were previously difficult because the experiments were dangerous or for other reasons.
Tell us about the future possibilities of quantum computing.Q
A IBM Quantum Network is a global community of members who want to make use of the quantum computers provided by IBM. As part of this community, JSR has been participating in
the IBM Q Network Hub @ Keio University, which was established in 2018. Here, we are carrying out joint research using the university’s quantum computer and developing new algorithms with numerous other member companies. Even though quantum computers are still under development, they are capable of computation that is simply impossible for conventional computers. JSR is able to draw on its strengths as a chemistry expert to raise questions about the kind of problems that should be solved using quantum computers.
What kind of initiative is the IBM Quantum Network?Q
A Quantum technology and the programs used are totally different from conventional thinking and approaches, so it takes time to train researchers with solid knowledge of quantum computing.
JSR is working to raise up what we call “quantum natives,” mostly young researchers who will be instrumental in applying this technology in the future.
Are you training professionals who can handle quantum computing?Q
IBM Research Frontiers Institute (RFI)
—Joint research for technology implementation in the AI field—
A In a nutshell, I think AI represents a break away from empirical materials development through collaboration between AI and chemists. Of course, materials development in the past hasn’t
been based solely on experimental methods – at times, what we would call “tacit knowledge” has inspired ideas and sudden shifts in thinking that have led to tremendous breakthroughs. These eureka moments depend on the individual and no one knows when they will happen. The ultimate hope is that AI will provide this mechanically. Looking ahead to such a future, our immediate goal is to develop an AI system that efficiently elicits good ideas from materials developers. We are implementing this kind of system within JSR and have already begun to see results.
What kind of changes can we expect from the practical application of AI?Q
A The Frontiers Institute is an open innovation AI-related research consortium centered on IBM Research labs. The research concept consists of three pillars: creating and collecting data,
reimagining computing with a view to AI utilization, and providing a new experience of data for users. We aim to bring about digital transformation by incorporating IBM’s deep knowledge of AI into our businesses in the chemical industry.
What does the IBM Research Frontiers Institute do?Q
A Good innovative technology can change the business environment in a blink of an eye, so I feel our first priority is to keep pursuing cutting-edge technology through projects like the Frontiers
Institute. When we put innovative technology into practice, we can become the first to benefit from it and I think it’s easier to secure a leading position in that field. On top of that, another crucial thing is the variety of human resources. It goes without saying that we need digital professionals, but I don’t feel that they alone can achieve transformation. I hope that people from a variety of backgrounds will be allocated to the organization and that out of the lively interaction between people working in seemingly different fields new technologies and business ideas will be born.
Will it be difficult to set JSR apart from other companies if this new technology becomes commonplace?
Q
Materials Informatics InitiativeRD Technology and Digital Transformation Center
Yu-ya Ohnishi
Materials Informatics InitiativeRD Technology and Digital Transformation Center
Yoshio Takimoto
Data SectionManagement policy Our Strategies for Value Creation
Our Forces Supporting Value CreationCreating Corporate Value
32JSR REPORT 2021

JSR BiRD
JSR will deliver new technologies to society through various collaborations.
Joint Research across Disciplines
JSR-UTokyo Collaboration Hub, CURIE
— A comprehensive collaboration between industry and academia transcending the boundaries between chemistry and physics—
A
A
A
JSR-UTokyo Collaboration Hub, CURIE, started out as part of our push for collaboration between industry and academia. It is a comprehensive collaboration hub established jointly by the
Department of Physics in the University of Tokyo’s Graduate School of Science, which is at the forefront of the physics field in Japan, and JSR, a chemical company. The fusion of academia and industry will enable JSR to bring new high-performance materials to society. Meanwhile, the Department of Physics will deepen its understanding of the functions of various materials that have become an essential part of society, uncover universal truths, and open up new fields of study. JSR is also offering a fellowship to support the research activities of excellent students.
Physics and chemistry are similar in that they both deal with substances. The difference is that when a substance causes a phenomenon, chemistry focuses on the phenomenon, whereas
physics focuses on why the phenomenon occurred. Through collaboration with the Department of Physics, which engages in cutting-edge physics research, we are aiming to develop new materials.
Going forward, I hope that the connection that has started with the Department of Physics will expand to other parts of academia. I also take pride in the fact that, through this collaboration,
both parties can take the results of their latest research and make an immediate positive impact on society. Down the road, we will continue to explore new possibilities through collaboration that transcends the barriers between companies and fields.
What are you hoping to achieve with this effort?Q
Why is it important to collaborate with the field of physics?Q
What’s next for this initiative going forward?Q
JSR Bioscience and informatics R&D Center (JSR BiRD)
—An open innovation hub in the field of life sciences—
A JSR has a strong technological advantage in synthesizing polymers, which we honed in the Elastomers and Digital Solutions businesses. I myself came to JSR with a background in the
pharmaceutical industry, and I was surprised to find such a high level of technology. One example is the technology needed to make uniform particle sizes. JSR has already commercialized in vitro diagnostic reagents and antibody refining materials using this technology, gaining a large customer base. Drawing on JSR’s advanced polymer technology, we should be able to expect to increase drug efficacy, for example, by making the coating on the surface of the drug more uniform. In addition, although the field of microbiomes is attracting attention as a new modality, many pharmaceutical manufacturers hesitate to enter this field due to the difficulties involved. We would like to tackle various issues, including unmet medical needs*, from a variety of angles through research into the superior technologies and new modalities I talked about earlier.
* Unmet medical needs: Medical needs for diseases for which a cure has not been found.
What are the greatest strengths of JSR’s Life Sciences Business?Q
A People with diverse backgrounds are already actively engaged in the Life Sciences Business. On top of this, JSR BiRD brings together top-notch researchers from both inside and outside the company
and gives them space to devote themselves fully to their everyday research. This kind of diversity makes it easier for innovation to happen, and we are aiming to provide value that is only possible through open innovation that is centered on a chemical company like JSR, rather than a pharmaceutical manufacturer.
What is the significance of encouraging open innovation at JSR BiRD?Q
A JSR BiRD is a research facility in the field of life sciences where we are conducting research focusing on the field of microorganisms that exist in the human body called bacterial flora
(microbiomes). Informatics researchers based at the facility are also working to strengthen their R&D capabilities by cultivating cutting-edge simulation and deep learning technologies. JSR BiRD also serves as an open innovation hub, setting aside dedicated space and creating a platform for innovation.
Can you describe what kind of facility JSR BiRD is?Q
Head of JSR Bioscience and informaticsR&D Center (JSR BiRD)
Hideo Hashimoto
JSR-UTokyo Collaboration Hub, CURIEGeneral Manager
Itti Rittaporn
Data SectionManagement policy Our Strategies for Value Creation
Our Forces Supporting Value CreationCreating Corporate Value
33JSR REPORT 2021

Input
JSR
Group
Output
Water consumption
Raw materials consumption
Energy consumption
Total product production
Waste generationAmount sent to final
off-site landfills
Greenhouse gas emissions
Wastewater production
Environmental Management System Promotion Framework
Board of Directors
Chair: Officer in Charge of Safety and Environment Affairs, and Quality Assurance
Staff: Environmental AffairsRole: Deal with matters relating to responsible care
(including chemical control), safety, and quality
1 Formulate, disseminate Group-wide policies and plans
2 Conduct Group-wide performance evaluations and identify priority issues
3 Consider internal and external information Disclosure
Environment, Safety and Quality Committee
Chairs: Head of each business establishmentStaff: Department in charge at each business establishmentRole: Deal with matters relating to responsible care
(including chemical control), safety, and quality
1 Formulate plans for the business establishment
2 Promote activities at the business establishment
3 Conduct performance evaluations and identify priority issues for the business establishment
Promotion committees of each business establishment(plants, laboratories, Group companies) Chair: General Manager of
head officeRole: Provide status reports to
head office/department in charge of each business establishment, deliberate on priority issues
Environment and Safety Supervisory Meeting
Sustainability Promotion Committee
Corp
orat
e Et
hics
Co
mm
ittee
Risk
Man
agem
ent
Com
mitt
ee
Sust
aina
bilit
y Pl
anni
ng
Com
mitt
ee
CEO Representative Director, President and COO
*TCFD: The Task Force on Climate-related Financial Disclosures, established by the
Financial Stability Board (FSB). In June 2017, the TCFD presented recommendations for
the disclosure of the effects that climate change risk has on financial institutions,
companies, and governments in financial reports.
Initiatives
Climate Change
Mitigation
We regard climate change as one of our most pressing issues, and are vigorously engaged in activities to reduce greenhouse gas emissions. To this end, we view the TCFD* Recommendations as contributing to the development of a sustainable society transitioning toward a low-carbon economy, and expressed our support for these recommendations in October 2020.
The management policy announced in March 2021 also commits us to actively take on the challenge of achieving “net zero” greenhouse gas emissions by 2050. We will work to deepen our understanding of the opportunities and risks inherent in our corporate activities, act accordingly, and proactively disclose our efforts.
Conserve Water
Aside from drinking water, water resources are used as a raw material and coolant in manufacturing processes. In addition to striving to recycle water resources in our processes, after use, we appropriately purify water before discharging it into rivers.
Waste Reduction
We are working to reduce our environmental impact, focusing on the 3Rs of waste management (reduce, reuse, recycle). We are also promoting a circular economy that efficiently uses resources throughout the product life cycle, from procurement of raw materials to manufacturing, and contributing value to customers and to related SDGs initiatives through our business activities.
Chemical Management
Globally, regulations of chemical substances are growing more stringent. From the perspective of ensuring product safety, we develop products in line with trends in chemical risk evaluations of each country from the design stage onward.
In addition, we are smoothly responding to legislation requiring existing substances to be registered along with safety data, in collaboration with local subsidiaries, according to the nature of the business.
As a company that deals in chemical substances, JSR Group recognizes that it has a duty to help bring about a sustainable global environment and society.
Consequently, JSR considers reducing the environmental impact of business activities and managing chemical substances to be top priorities and strives to properly manage waste and greenhouse gas emissions arising from energy consumption. Climate change in particular is expected to have a major impact on businesses due to the growing frequency of natural disasters and risks associated with future environmental regulations. For this reason, JSR has positioned the reduction of greenhouse gas emissions as a medium- to long-term management issue.
Philosophy
Environment
JSR Group strives to reduce its environmental impact in a comprehensive, efficient way by quantitatively ascertaining and closely analyzing the consumption of energy and resources in its business activities (input) as well as its product production, emissions into the environment, waste production, and other data (output).
JSR Group sets environmental targets based on its Environmental Safety Management Policy with the aim of integrating responsible care activities into corporate management. The Environmental Supervisory Department formulates initial targets, which are reviewed and approved by the Environment, Safety and Quality Committee chaired by the officer in charge of Safety and Environment Affairs, and Quality Assurance, and reported to the Sustainability Promotion Committee. The environmental affairs departments of each business play a central role in meeting established targets through responsible care activities in compliance with ISO 14001 environmental management system standards. JSR is also taking proactive responsible care measures such as the introduction of state-of-the-art equipment and technological development.
JSR Group is engaged in the following initiatives.
Reducing Environmental Impact: Material Balance
Approach to the Environment Various Initiatives
Please refer to our Sustainability Report 2021 for a detailed explanation and data.
https://www.jsr.co.jp/jsr_e/sustainability/
Data SectionManagement policy Our Strategies for Value Creation
Our Forces Supporting Value CreationCreating Corporate Value
34JSR REPORT 2021

JSR Group’s goal is to make steady progress in realizing its corporate mission (Materials Innovation: We create value through materials to enrich society, people and the environment). This shall be done through efficient and transparent business management, by sustaining sound and healthy business practices. The Group will also continuously strive to create new corporate value with the hope of becoming an attractive corporation that can earn the trust of and satisfy the interests of all our stakeholders. As a company with audit & supervisory board members, JSR principally monitors and oversees the execution of duties by directors and the management through its Board of Directors and Audit & Supervisory Board. The Company continuously has strengthened the function of management supervision, improved efficiency in decision making and business duties execution, and enhanced the transparency and soundness of its business management to raise corporate value over the medium to long term. To that end, it has implemented measures, such as introduction of an officer system, appointment of outside directors and audit & supervisory board members who are independent from the Company and have extensive business experience and expertise, establishment of the Remuneration Advisory Committee and the Nomination Advisory Committee each of which majority members are independent outside directors and the chair of which is a lead independent outside director respectively, and the introduction of three types of performance-based remuneration for directors other than outside directors covering the short, medium and long term.
Philosophy
Corporate Governance
Deliberation on the
management policy.
Formulation of a medium-
to long-term vision.
The Company, by enhancing its corporate governance, endeavors to realize its corporate mission, achieve its business plan, and increase corporate value over the medium to long term.
Streamline the Group’s
overall business
portfolio and optimize
its overall resource
allocation.
Implement crisis
management and
response(including Business Continuity
Plan (BCP) in light of the
COVID-19 pandemic).
Carry out business
and give back to
stakeholders based on
the pillars of resilience
and sustainability. Explore initiatives for
net-zero greenhouse gas
emissions by 2050.
Formulate business strategies.
Strengthen resilience.
Consider ESG measures needed to ensure
Group sustainability.
Main Agenda Items of the Board of Directors
Female directors 1person
Non-Japanese directors 2persons
Board Members with Diverse Skill SetsTo respond to the challenges of globalization, IT, digitalization, and other rapid changes in the business environment, the Company’s first non-Japanese CEO was appointed in FY2019. In June 2020, the Company’s first female director was appointed. A non-Japanese outside director was appointed in FY2021. We are working to further expand the diversity of the Board.
Governance Framework Drawing on Outside StrengthsThe three current audit & supervisory board members include an attorney and a certified public accountant with licensed tax accountant certification, both of whom are independent and possess advanced expertise and vast experience.
In addition, the Board of Directors includes outside directors in fields where JSR Group expects to grow.
Ratio of outside
directors 44%
Ratio of outside audit &
supervisory board members
66%
Governance Highlights
Performance-Linked Director RemunerationDirector remuneration in the Group is made up of several components: fixed basic remuneration, an annual bonus linked in part to the degree of achievement of Group-wide performance for the year, performance-linked stock remuneration (performance share unit) delivered post hoc, and remuneration in the form of restricted shares awarded as an incentive for sharing immediate value with shareholders. The proportion of each remuneration component, assuming basic remuneration at 100 (with standard performance-linked remuneration for 100% achievement of target) is as follows.
CEO
Basic Remuneration
100
Performance-Linked
Remuneration
500
President
Basic Remuneration
100
Performance-Linked
Remuneration
105
100
100
200
200100
30
approx.38
approx.38
Basic Remuneration Annual Bonus Performance Share Unit Restricted Stock Share
Concurrently serve as Executive Managing Officer / Managing Officer/ Senior Officer
Basic Remuneration
100
Performance-Linked
Remuneration
70100
25
approx.23
approx.23
Please also refer to the following for the basic policy and operation of corporate governance.
https://www.jsr.co.jp/jsr_e/company/governance.html
Data SectionManagement policy Our Strategies for Value Creation
Our Forces Supporting Value CreationCreating Corporate Value
35JSR REPORT 2021

Corporate Governance Structure Diagram
General Meeting of Shareholders
Remuneration Advisory Committee
Nomination Advisory Committee
Cooperation (Information Exchange)
(As of June 17, 2021)
Appointment/DismissalOversight/Supervision
Report
Accounting Audit
Internal Audits
Report
Report
Report
Appointment/DismissalOversight/Supervision
Report
Report
Audits
ReportAppointment/ Dismissal
Appointment/ Dismissal
Appointment/ Dismissal
Collaboration
Independent AuditorsAudit &
Supervisory Board
Corporate Audit Department
Executive Committee
Business Issues Committee
Officers Committee
Sustainability Planning Committee
Environment, Safety and Quality Committee
Risk Management Committee
Corporate Ethics CommitteeSustainability Promotion
Committee
Board of Directors
Representative Director, CEORepresentative Director,
President
Deliberation
Business Operation Units
9 directors inclusive of 4 independent outside directors
3 audit & supervisory board members inclusive of 2 independent outside members
24 Officers
1. Board of DirectorsThe Board of Director discusses and makes decisions on important business matters, including the direction of the Company’s business strategy, and also supervises directors’ and officers’ execution of their business duties. In addition, all three audit & supervisory board members including two independent outside audit & supervisory board members regularly attend the Board of Directors meetings to state their opinions.
Going forward, based on the findings of the Nomination Advisory Committee, the Company will ensure the diversity of knowledge, experience, and abilities required for the Board of Directors in light of current business strategies, and seek to maintain the optimal Board composition within a 12 member limit.
2. Executive CommitteeThe Executive Committee holds extensive discussions on items relating to fundamental management initiatives, management policies and management plans, along with important matters concerning the execution of business
Governanceactivities at each department. The committee thus gives direction in relation to these issues or receives reporting. This committee is comprised of the CEO, the president, officers with directorship status, and officers or General Managers appointed by the chair and responds to important business execution with the aim of expediting decision making and improving the efficiency of operations.
3. Business Issues CommitteeThe Business Issues Committee engages in broad-ranging debate about items related to fundamental management strategies and policies, basic policies behind specific projects, and changes to business strategies. It also shares information to ensure a common understanding of such matters and discusses the Company’s direction. Its findings are reflected in deliberations of the Board of Directors and the Executive Committee.
4. Officers CommitteeThis committee consists of the CEO, the president and all officers and aims to ensure members’ thorough understanding of business conditions and important business matters. This committee is chaired by the president and the standing audit & supervisory board member is also present.
5. Audit & Supervisory Board and audit & supervisory board members
The Audit & Supervisory Board, consisting of three audit & supervisory board members and holding meetings once monthly in principle as stipulated in the Regulations of the Audit & Supervisory Board, receives reports on important matters, holds discussions, and makes decisions.
6. Outline of Audit by audit & supervisory board members, Internal Audit, and Independent Auditors(1) Audit by audit & supervisory board membersThe details of audit by audit & supervisory board members are stated as in the above Audit & Supervisory Board and audit & supervisory board members.(2) Internal AuditJSR has established the Corporate Audit Department to improve the effectiveness of JSR Group’s internal control system. In accordance with the internal audit plan, the Corporate Audit Department regularly conducts internal audits such as compliance audits and business operation audits at its divisions and departments as well as its Group companies both in Japan and overseas and reports the audit results to the CEO, the president, related departments, and audit & supervisory board members.(3) Independent AuditorsThe audit & supervisory board members work closely with the independent auditors. The audit & supervisory board members interview the independent auditors about the audit plan and receive reports on the audit results. Furthermore, the audit & supervisory board members and independent auditors exchange information and opinions as necessary in the course of each fiscal year.
7. Sustainability Promotion CommitteeIn order to establish good relationships with various stakeholders and to become a company that is trustworthy and indispensable, JSR Group has established the Sustainability Promotion Committee with the purpose of shifting its focus from CSR (Corporate Social Responsibility) activities to Sustainability activities that contribute to all stakeholders by creating value through corporate activities. The Company has set up the following four committees under the Sustainability Promotion Committee: the Sustainability Planning Committee, the Environment, Safety and Quality Committee, the Risk Management Committee, and the Corporate Ethics Committee.
* For details, see the Corporate Governance Report:
https://www.jsr.co.jp/jsr_e/company/assets/pdf/
governance_e.pdf
Data SectionManagement policy Our Strategies for Value Creation
Our Forces Supporting Value CreationCreating Corporate Value
36JSR REPORT 2021

The Board of Directors of the Company has been conducting an evaluation in order to maximize corporate value of the Company by enhancing its effectiveness. The FY2020 effectiveness evaluation findings reached the conclusion that the JSR Board of Directors is functioning effectively. Effectiveness evaluations will continue to be performed moving forward.
Evaluation processThe Board of Directors has conducted a questionnaire survey targeting our company’s 9 directors (including three independent outside directors) as well as three audit & supervisory board members (including two independent outside auditors). The Board of Directors has evaluated and analyzed the results of the evaluation by setting up discussion sessions at the Board of Directors meetings several times to discuss the results of the questionnaire as well as the comments expressed in the questionnaire. To improve objectivity in the FY2020 evaluation process, The Board of Directors has hired a third party that has expertise in the fields of interviewing the Representative Director, CEO and the Representative Director, COO, analyzing and evaluating the results of the questionnaire as well as reporting those results to the Board of Directors.
ConclusionsThe Board of Directors has drawn the conclusion that “The Board of the Directors of the Company is functioning effectively.”
Concerning the Summary of Results of Evaluation of the Effectiveness of the Company’s Board of Directors
Reasons for Evaluation• Our company’s Board of Directors comprises inside and
outside directors as well as audit & supervisory board members. The board has the right composition in terms of diversity (e.g., nationality, gender, etc.). The Board of Directors is functioning as a meeting structure to encourage discussions on improving the medium- to long-term corporate value as well as the supervision of operations execution while the members of the board are making use of their experiences and knowledge, respectively.
• To run the Board of Directors, significant management challenges, risks, etc., are brought up for discussion in a timely manner, and sufficient information is provided to outside board members prior to board meetings so that they can participate in free and lively discussions that will take place during the board meetings.
• The Nomination Advisory Committee and the Remuneration Advisory Committee have an adequate composition, respectively, and the members of these committees adequately report the results of their discussions to the board after having sufficient discussions while ensuring independence and objectivity. By doing so, these two committees reinforce the supervisory functions of the Board of Directors.
• The Board of Directors considers that communicating with investors and shareholders is their significant role and responsibility. The board strives to reflect capital market expectations in the company’s operations as well as the performance of their duties and to maximize corporate value by having discussions on the status of their activities every quarter and talking directly with shareholders and investors.
Issues Requiring Improvement(1) To further promote digital transformation across the
entire JSR Group, we need a person who has expertise in the IT and digital fields. It is preferable to appoint someone who has management experience in the
relevant fields as outside director. It is also preferable for us to continue discussions on the composition of the board, for example changing its composition so that the board will have more outside directors (= a higher percentage of outside directors).
(2) To further deepen discussions in board meetings, we need to reinforce our support system for outside directors by giving them more opportunities for training, education, and provision of information on JSR Group’s businesses.
(3) It is desirable that the Remuneration Advisory Committee continuously review and revise the remuneration system from a global standpoint.
(4) Since the Board of Directors deeply realizes the importance of sustainability management, they need to further discuss specifically what types of activities they should promote to support the sustainability management.
Future ActivitiesKey management issues reconfirmed in the process of evaluating the effectiveness of the Board of Directors included: (1) establishing a resilient business structure and reinforcing the management framework to respond to changes in the business environment; (2) implementing growth strategies for the Group’s core Semiconductor Materials and Life Sciences businesses; (3) carrying out structural reforms in the Elastomers Business; (4) addressing challenges to achieving sustainable business growth, such as carbon neutrality; and (5) progress of ongoing investment in innovation including digital transformation. The Board also discussed changes in the external environment (environmental problems and geopolitical risks such as U.S.-China relations, etc.) that could impact these management issues going forward. While monitoring the progress of initiatives that have been put in place, we will also identify changes in roles and qualities demanded of the Board and continuously revise the Board’s composition and its topics of discussion.
Summary and Results of Board of Directors Effectiveness Evaluation for FY2020
Data SectionManagement policy Our Strategies for Value Creation
Our Forces Supporting Value CreationCreating Corporate Value
37JSR REPORT 2021

In order to maintain the competitive advantages of JSR Group as a global company, the Company has established principles on remuneration for directors and audit & supervisory board members which enable the Company to develop and recruit internationally competitive and diverse human resources capable of managing the businesses, and to provide short-, medium- and long-term incentives for its directors that are aligned with the benefit of its shareholders, and to encourage and motivate its management, while maintaining the transparency and accountability, to accomplish the management strategies and business strategies of the Company. The remuneration framework should:(1) attract, secure, and reward diverse and excellent
personnel regardless of nationality for the purpose of further enhancing and improving its competitive advantages and global management;
(2) encourage the management to demonstrate healthy entrepreneurial spirit by motivating them to achieve the objectives of business strategies aiming at continuous growth; and
(3) promote medium- to long-term improvement in corporate value by sharing the benefit between management and shareholders via the reinforcement of stock ownership during his/her term of office as director.
(1) Procedures for determining remuneration, etc. In relation to remuneration for the directors, the Board of Directors (referred to as “BOD” in this section) deliberates and determines the policies of remuneration for directors, remuneration framework, and amount of remuneration for individual directors. In order to ensure
(1) Remuneration Structure In the past, our company’s executive compensation
consisted of basic compensation as fixed compensation,
Remuneration Framework of the Company
Remuneration Governance
independence and objectivity during deliberation and decision making processes at the BOD mentioned previously and to enhance the monitoring function and accountability of the BOD, the Company established the Remuneration Advisory Committee as an advisory body for the BOD.
(2) Items for deliberation and reports by the Remuneration Advisory Committee The Remuneration Advisory Committee, upon an inquiry from the BOD, deliberates the remuneration of the eligible persons and related items as listed below and reports the result to the BOD, or provides the Audit & Supervisory Board with advice.
Persons eligible: Inside directors (including representative directors and executive directors), outside directors, audit & supervisory board members, officers, executive advisors, senior advisors, chairman emeritus and other important employees
Items for deliberation: Establishment of the remuneration policies, designing the remuneration framework, setting performance targets, reviewing rationale of incentive remunerations, appropriateness of the level and
composition of the remunerations, and determination of the amount of remuneration of each position based on the remuneration framework and others
(3) Composition of the Remuneration Advisory Committee and attributes of Chairperson
The Remuneration Advisory Committee consists of at least 3 committee members, and more than half of the members shall be independent outside directors, of which a chairperson shall be elected from independent outside directors by resolution of the BOD in order to ensure independence, objectivity, and accountability as well as effectiveness of the Remuneration Advisory Committee. In addition, a third party consultant, specialist in this field, and staff members for the Committee also attend the Remuneration Advisory Committee meetings as observers.
Remuneration Structure Time of Payment or Granting Summary of AGM Approval
Fixed Salary Basic Remuneration Monthly Payment
The maximum amount for directors is JPY 60 million per month (inclusive of JPY 10 million per month for outside directors). (74th AGM on June 18, 2019)The maximum amount of basic remuneration for audit & supervisory board members is JPY 10 million per month. (60th AGM on June 17, 2005)
Performance-Linked
Remuneration
Annual Bonus Payment at a fixed time every year The maximum annual amount for directors excluding outside directors is JPY 432 million (74th AGM on June 18, 2019)
Performance-linked Remuneration
In principle, units shall be granted in FY2021, and shares and money shall be provided in a lump sum after the end of the Performance Evaluation Period.
• Maximum amount of monetary compensation claims and total amount of money: Number of fixed share units 800,000 x share price at delivery for target period
• Maximum number of shares to be granted: 400,000 shares for target period (76th AGM June 17, 2021)
Remuneration for granting Restricted Stock Shares
Payment at a fixed time every year
• Up to 400 million yen per year and up to 400,000 shares per year• The lifting of the transfer restriction is a period of up to 3 ~ 30 years determined
in advance by the Board of Directors. In addition, if resignation, etc., occurs for justifiable reasons determined by the Board of Directors during the transfer restriction period. (76th AGM June 17, 2021)
[After revision] after June 17, 2021
Principles on Remuneration for Directors and Audit & Supervisory Board Members
Data SectionManagement policy Our Strategies for Value Creation
Our Forces Supporting Value CreationCreating Corporate Value
38JSR REPORT 2021

Amount of Remuneration for Directors and Audit & Supervisory Board Members (FY2020)
Classification
Director Audit & Supervisory Board Member
Number (people)
Amount (JPY million/
year)
Number (people)
Amount (JPY million/
year)
Basic Remuneration 9 289 4 50
(for outside directors or outside audit & supervisory board members)
(3) (43) (2) (22)
Annual Bonuses to Directors for the Fiscal Year under Consideration
6 182 – –
(for outside directors or outside audit & supervisory board members)
(–) (–) (–) (–)
Mid-term Performance-linked Bonuses
6 0 – –
(for outside directors or outside audit & supervisory board members)
(–) (–) (–) (–)
Restricted Stock Shares as Remuneration to Directors
6 124 – –
(for outside directors or outside audit & supervisory board members)
(–) (–) (–) (–)
(Notes)1. The numbers of the Directors and Audit & Supervisory Board Members and the
amount of remunerations thereto in the table above include one Director who retired during the fiscal year.
2. The above figures do not include the salaries for the employee portion of the Directors who concurrently serve as employees.
3. The above figures are rounded to JPY1 million.4. The amount of Restricted Stock Shares in the table above is calculated based on the
closing price of common stock of the Company on the Tokyo Stock Exchange on the business day immediately preceding the date of the resolution of the Board of Directors held on July 8, 2019, at ¥1,706 per share, and the closing price of common stock of the Company on the Tokyo Stock Exchange on the business day immediately preceding the date of the resolution of the Board of Directors held on July 13, 2020, at ¥2,110 per share.
annual bonuses that are linked to the level of company-wide performance in a single year, medium-term performance-linked bonuses that are linked to the level of company-wide performance in the medium-term, and compensation for the granting of restricted shares to promote the sharing of value with shareholders at an early stage. In FY2021, however, the medium- term performance-linked bonuses will be abolished and a performance-linked stock compensation plan (Performance share units:) will be introduced. With respect to medium-term performance-linked bonuses, except for bonuses for which the Performance Evaluation Period has already started, no money will be paid based on the provisions of the remuneration in the future. In addition, regarding remuneration for granting restricted shares, the period for lifting the restriction on transfer and the maximum amount and the maximum number of shares are revised. The purpose of these revisions of executive compensation is as follows. Remuneration for Outside Directors and Audit & Supervisory Board Members is only basic remuneration in light of their roles.
Reason for the Revision• The directors of the Company will be given an incentive
to steadily implement the Medium-Term Management Policy ending in FY2024 and business structure reforms, and to achieve sustainable enhancement of corporate value. At the same time, the directors will further share value with shareholders.
• In order to raise awareness among our company’s directors about creating value for all stakeholders in order to achieve sustainable growth from a longer-term perspective.
• Aiming to become a truly global company, we aim to create an appropriate level and structure of remuneration
to secure excellent management personnel regardless of nationality.
(2) Appropriateness of the remuneration level of the Company
When considering the above-mentioned remuneration structure and composition thereof, the Remuneration Advisory Committee verifies the appropriateness of the level of remuneration through an annual benchmarking study by using the remuneration database possessed by a third party consultant specialized in remuneration for executives and by comparing with the companies whose size, type, and line of business are similar to those of the Company. In addition, when determining the composition of performance-linked remuneration and other remuneration for the director who is responsible for overseeing and managing the Company’s international businesses, the Remuneration Advisory Committee verifies the appropriateness of the remuneration level for such director through another annual benchmarking study using a method similar to the one described above and using the survey data on remuneration prevailing in the region where such director is responsible for as well as considering each director’s job responsibilities and the magnitude of impact on management of the JSR Group.
(3) Remuneration composition for directors (excluding outside directors)
The Company has a policy to increase the portion of performance-linked remuneration for directors who assume heavier responsibilities for corporate management. Based on this policy, the Company determines the level of remuneration for directors depending on their responsibilities and title considering the latent risks involved in achieving performance targets while increasing the portion of performance-linked remuneration for senior directors.
Data SectionManagement policy Our Strategies for Value Creation
Our Forces Supporting Value CreationCreating Corporate Value
39JSR REPORT 2021

The Nomination Advisory Committee was established in FY2015. Currently, the Committee consists of four independent outside directors (one of whom is the chair), as well as the CEO and the President and COO. The Committee carries out objective and long-term examinations of appointments and dismissals of the CEO and President, the Board of Directors’ composition and elections, the Group’s management structure, and succession plans for vital management posts.
In FY2020, the CEO and President submit annual management activity reports to the Committee, which deliberates on the nomination and removal/dismissal of top management and makes recommendations to the Board of Directors.
Nomination Advisory CommitteeJSR established the Nomination Advisory Committee to ensure the transparency of the policy and procedures of appointing candidates for directors, audit & supervisory board members and officers with directorship status (including senior officers). A majority of Committee members are independent outside directors and the chair is also an independent outside director. The Committee deliberates the standard for the diversity in breadth of knowledge, experience, and capability necessary for the Board of Directors, criteria and procedures for the nomination, and candidates for future appointment as CEO, the president, directors, officers with directorship status (including senior officers), and audit & supervisory board members, and reports its findings to the Board of Directors.
In addition, the CEO and/or the president submit to the Committee an annual report on a broad range of strategic management activities. Based on the report, the Committee assesses the business result and performance of the CEO and/or the president and advises the Board of Directors whether or not improvement in management quality is necessary.
Dismissal of DirectorsThe Committee will deliberate and report to the Board of Directors in a timely fashion when the Committee judges there arises a reason that necessitates dismissal of directors including the CEO. In order to ensure transparency of the deliberation, the Committee takes necessary measures such as deliberation solely among outside independent directors for the agenda relating to appointment/reappointment or dismissal of CEO. Upon receipt of the aforementioned annual management activities report and based on the business result and performance evaluation of the CEO and/or the president as well as business circumstances and economic outlook, etc., the Committee annually deliberates and judges appropriateness of the appointment, dismissal of the CEO and/or the president and terms of office.
Criteria for Appointing Candidates for DirectorsWhen nominating candidates for directors, JSR makes it a rule to ensure an appropriate balance among diversity in breadth of knowledge, experience, and capability essential to the Board of Directors and the size thereof in order to make important management decisions and oversee the execution of duties in an appropriate and timely fashion. JSR appoints persons who are mentally and physically sound and have an exceptional personality and popularity, and high principles and ethical view. In light of these considerations, JSR appoints as candidates for inside directors persons who have extensive knowledge, experience, and high capability with a superior track record in such fields as business management (including international), R&D, manufacturing, manufacturing technology, human resources, and finance and accounting, etc. JSR appoints as candidates for outside directors persons who have independence, vast experience and extensive expertise of management of the major companies in various fields and of business management both in Japan and overseas as well as the capability to actively express opinions and raise issues on growth strategy and enhancement of governance from a broad perspective.
Criteria for Appointing Candidates for Audit & Supervisory Board MemberFrom the perspective of ensuring the transparency and soundness of business management through auditing the process of directors’ decision making and execution of duties in accordance with laws and regulations, such as the Companies Act, the articles of incorporation and internal rules, JSR appoints persons with vast experience and extensive and sophisticated expertise necessary for audit (including one person with sufficient knowledge of finance and accounting) among those who are mentally and physically sound and have an exceptional personality and popularity, and high principles and ethical view. Regarding candidates for outside audit & supervisory board members, in particular, JSR nominates persons who have independence and extensive experience and knowledge of laws and accounting.
JSR conducts introductory seminars and plant and laboratory tours and other opportunities for newly elected officers, given their potential as future director candidates, to deepen their understanding of the Company and its businesses. Moreover, when a Board of Directors meeting is held, JSR picks up key issues closely related to its businesses as Specific Themes for Review and Discussion and thereby provides an opportunity to exchange opinions on such themes. This opportunity helps directors and audit & supervisory board members not only deepen their understanding of the Company’s business challenges but also promotes communication between board members. Furthermore, JSR holds regular seminars by outside lecturers prior to the ordinary general meeting of shareholders to review the status of corporate governance in general and legal reforms.
Succession and Evaluation of the Group’s Management Structure (Initiatives by the Nomination Advisory Committee
Policy for Training Directors and Audit & Supervisory Board Members
Data SectionManagement policy Our Strategies for Value Creation
Our Forces Supporting Value CreationCreating Corporate Value
40JSR REPORT 2021

To promote constructive dialogue with shareholders and investors, officers responsible for the Finance Department and the Corporate Communications Department take charge of IR activities, and work together to facilitate dialogue. JSR holds an analyst meeting every quarter and a mid-term business plan briefing once every fiscal year. In such meetings, the CEO, the president or an officer in charge of IR, explain business performance, financial position, details and progress of the mid-term business plan to analysts. Every year, the CEO, the president or an officer in charge of IR holds interviews with major institutional investors in Japan and overseas to explain the details and progress of the mid-term business plan. JSR has been endeavoring to provide investors with Company information on its website, such as financial statements, information on mid-term business plans and progress thereof, and details of business performance of main businesses, as well as information on sustainability activities including efforts to conserve the environment and responsible care, and on R&D activities. Opinions and questions that JSR receives from investors through the above-mentioned discussions are fed back to management as IR activity reports. In discussions with shareholders, JSR has appropriately treated insider information (setting moratoriums from the start of a new fiscal year to the day of announcing business results, establishing regulations for preventing insider trading, and conducting employee education seminars).
Policy on Constructive Dialogue with ShareholdersWhen JSR’s Board of Directors meets to decide on announcing financial results, the explanation always starts with stock price movements during the period and differences from market consensus. I think this is quite distinctive compared to typical
Japanese companies and goes to show how seriously JSR takes communication with investors and other stakeholders. As people’s values and the structure of society are changing drastically amid the COVID-19 pandemic, the Group is also at a major crossroads in terms of business structural reform. To weather changes in the operating environment, I think the most pressing task we face now is to thoroughly discuss the future vision and growth strategy of the Semiconductor Materials Business segment in the Digital Solutions Business and the Life Sciences Business, which are positioned as the Group’s core businesses, and be accountable to each stakeholder.
Yuzuru Matsuda
JSR’s Board of Directors is marked by a high degree of diversity. It has appointed non-Japanese and female members, as well as an investor, as directors. Even during the pandemic, we took sufficient measures against infection and as far as possible held in-person
Board meetings, which facilitated lively and substantive discussions. The Remuneration Advisory Committee and Nomination Advisory Committee also exchange frank opinions based on proposals from company directors and other outside sources. Then we summarize the opinions of outside directors and report to the Board. Under this governance framework, we are moving ahead with the most sweeping structural reforms since JSR’s founding. To grow as a company that further contributes to society, the biggest challenge going forward is how to add and reallocate management resources to speed the enrichment and expansion of strategic business areas.
Shiro Sugata
JSR Group has worked to enhance its governance. The Board has a diverse makeup this year, with an outside director ratio of 44%, a female director ratio of 11% (including audit & supervisory board members the female director ratio is 25%), and a non-Japanese director ratio of 22%. The Group has also set up a Nomination
Advisory Committee and Remuneration Advisory Committee, chaired by outside directors. Still, no matter how solid governance is, it is meaningless unless it bears fruit in terms of corporate value. We can only claim that the Company’s governance has been effective after the quantitative and qualitative plans announced in FY2020 for the new management policy have been, in fact, achieved. The markets are interested in management that brings about sustainable growth in profit and market capitalization, rather than whether a company’s formal governance framework is sufficient. As an outside director, I want to bear in mind my oversight role, and draw on the strengths of our governance framework to closely supervise progress of the management policy.
Tadayuki Seki
Outside Director’s MessagesThe Committee systematically develops and selects candidates for the successor to the CEO and/or the president in an objective and transparent manner by providing the pool of candidates with necessary training and coaching to enhance skills and leadership and by actively participating in the selection process through interviews, etc.
Succession Plan
Data SectionManagement policy Our Strategies for Value Creation
Our Forces Supporting Value CreationCreating Corporate Value
41JSR REPORT 2021

Managing OfficerHayato HiranoSupervising Elastomers Business (Supervising) Director and President of Japan Synthetic Rubber Spin-Off Preparation Co., Ltd.President of Japan Butyl Co., Ltd.
Managing OfficerKatsuya InoueBusiness TransformationGeneral Manager of Business Transformation Dept.
Managing OfficerTadahiro SuharaSupervising Digital Solutions Business, Edge Computing BusinessRepresentative Director of JSR Micro Korea Co., Ltd.
Senior OfficerKazumasa YamawakiPlastics BusinessPresident of Techno UMG Co., Ltd.
Senior OfficerMakoto DoiLegal, Compliance, General Affairs, Secretarial OfficeGeneral Manager of Legal Dept.
Senior OfficerYoshikazu YamaguchiElectronic Materials BusinessGeneral Manager of Electronic Materials Div.President of Emulsion Technology Co., Ltd.
Senior OfficerKazushi AbeElastomers BusinessGeneral Manager of Elastomer Div.President of ELASTOMIX CO., LTD.Director and President of KRATON JSR ELASTOMERS K.KPresident of ELASTOMIX (FOSHAN) CO., LTD.Representative Director of JSR Elastomer Europe GmbH
Senior OfficerKoichi SaekiYokkaichi PlantYokkaichi Plant Manager, General Manager of Administration Dept. at Yokkaichi Plant
Senior OfficerSeiji TakahashiManufacturing and Technology, Procurement, Logistics
Senior OfficerKoichi HaraCorporate PlanningGeneral Manager of Corporate Planning Dept.
OfficerYasufumi FujiiGeneral Manager of Corporate Audit Dept.
Representative Director, CEO
Eric JohnsonNorth America Business President of JSR North America Holdings, Inc.
Representative Director, President, COO
Nobuo Kawahashi
OfficerMikio YamachikaManufacturing and Technology (deputy), Yokkaichi Plant (deputy)Yokkaichi Plant deputy Manager, General Manager of Digital Solutions Business DX Planning and Acceleration Dept.
OfficerTim LoweryLife Sciences BusinessGeneral Manager of Life Sciences Div.President of JSR Life Sciences, LLC
OfficerJunichi TakahashiProduct Safety & Quality Assurance, Safety and Environment AffairsGeneral Manager of Product Safety & Quality Assurance Dept.
OfficerKeisuke WakiyamaDisplay Solution Business, China BusinessGeneral Manager of Display Solution Business Div.Chairman of JSR (Shanghai) Co., LtdChairman of JSR Micro (Changshu) Co., Ltd.Chairman of JSR Display Technology (Shanghai) Co., Ltd.
OfficerIchiko TachibanaLegal Affairs (deputy), Compliance (deputy)General Manager of Compliance Dept.
OfficerToru KimuraResearch & Development (CTO), Emerging BusinessGeneral Manager of RD Technology ・ Digital Transformation CenterExecutive Officer of JSR Active Innovation Fund, LLC
OfficerYutaka YoshimotoOffice of President, Emerging Business (deputy)General Manager of Office of President
OfficerHiroaki TokuhisaResearch & Development (deputy CTO)General Manager of Research & DevelopmentGeneral Manager of Yokkaichi Research Center
OfficerKhashayar (Hash) PakbazDigital Transformation (CDO)General Manager of Global DX Acceleration Dept.
OfficerKenichi EmotoAccounting (deputy), Finance (deputy), Corporate Communications (deputy)General Manager of Accounting Dept.General Manager of Finance Dept.
* Excluding those who concurrently serve as directors
Director, Senior Officer
Mika NakayamaSustainability Promotion General Manager of Sustainability Promotion Dept.
Standing Audit & Supervisory Board Member
Tomoaki Iwabuchi
Outside Director
Yuzuru MatsudaOutside Director
Shiro SugataOutside Director
Tadayuki SekiOutside Director
David Robert Hale
Director, Executive Managing Officer
Koichi KawasakiHuman Resources, Diversity Development
Director, Managing Officer
Hideki MiyazakiAccounting, Finance, Corporate Communications, IT Strategy, Cyber Security Management, Business Process Renovation
Outside Audit & Supervisory Board Member
Hisako Kato
Outside Audit & Supervisory Board Member
Junko Kai
Directors and Audit & Supervisory Board Members (As of June 17, 2021) Officers (As of June 17, 2021)*
Data SectionManagement policy Our Strategies for Value Creation
Our Forces Supporting Value CreationCreating Corporate Value
42JSR REPORT 2021

Last year, JSR Group reframed its CSR activities as sustainability
activities and revised the organizational framework to better
contribute to all stakeholders. As the officer in charge of environmental
safety and quality, I continue to focus on raising the bar for
occupational health and safety and security management and
accident prevention.
We continue to carry out a variety of activities aimed at zero
accidents and disasters, including risk assessment activities, renewal
of safety certifications, establishment of safety audits, conducting
forums on safety and health, and providing education on safety
policies, smart safety, facility enhancement, and construction safety.
Through these efforts, we will provide a safe workplace not only
for employees of JSR Group but also of partner companies, as we
aim to be a chemical manufacturing company that excels in safety,
so that we can create value for all our stakeholders, including local
communities, customers, and shareholders.
Philosophy for Occupational Health and SafetyAt JSR Corporation, safety is our highest priority and the foundation of all of our activities.Accordingly, we will create safe worksites and strive to maintain physical and mental health, with the goal of ensuring workers happily take it for granted that they will return home safely at the end of each workday.
Courses of Action of the Philosophy for Occupational Health and Safety1. No matter the situation, we will act with safety foremost in mind.2. We will comply with established rules and never fail to act in
accordance with safety basics.3. We will maintain safety by identifying and eliminating both actual and
potential hazards.4. We will strive to create comfortable work environments and promote
physical and mental health.5. Through communication and ingenuity, we will aim to achieve 100%
employee participation in all safety activities.
Policy for Security Management(1) Extremely Safe Behavior
The Philosophy for Occupational Health and Safety has penetrated throughout the organization, the Courses of Action are established as applying to everyone, and safety competency is improving through independent safety activities.
(2) Enhanced Human Resources and Organizational StrengthHigh skill levels, organizational ability, and a healthy organizational culture are being maintained with the establishment and execution of the education and training programs needed for organizational management.
(3) Optimal Risk Management and Security MeasuresSecurity measures corresponding to risk importance are being efficiently and effectively implemented using new technologies.
As a chemical manufacturer, ensuring safe and stable plant operations
is always and everywhere our most important consideration.
Without this mindset, JSR Group would not have grown as a
company and could not survive.
Safety is the bedrock of our business continuity and an
investment in the growth of the Group. It is my duty to pursue safety
as a key management issue, as we seek to offer a sense of security
to the local community and continue to grow as an organization
where all JSR Group employees and employees of partner
companies feel contentment in their work.
Our goal is for JSR Group to be a sustainable company that
earns the trust of society.
As part of the top management team, I lead the development of
our safety infrastructure and fostering a culture of safety, and am
taking actions to improve the security capabilities that support
organizational safety and to develop people who excel in safety.
For example, I participate in safety audits at business
establishments, listen directly to reports on safety initiatives and
indicators, think together with employees on the ground about
issues, and help resolve them. After last year’s audit, we set up a
safety department at the Tsukuba Research Laboratories. I also
believe it is important to continue sending periodic messages
reminding employees that safety is the bedrock of our business.
Employee working styles have changed during the COVID-19
pandemic. What has not changed is ensuring on-site safety. With less
in-person contact, we need to shift our focus to other efficient and
effective safety and security activities, and I will continue to secure the
needed resources and strengthen the infrastructure for that purpose.
Our aim is zero accidents and disasters across the JSR Group.
Representative Director, President, COO
Nobuo Kawahashi
Officer in Charge of Safety
Junichi Takahashi
Message from the President
Message from the Officer in Charge of Safety
Please refer to our Sustainability Report 2021 for a detailed explanation and data.
https://www.jsr.co.jp/jsr_e/sustainability/
Occupational Health and Safety, Security Management and Accident Prevention
Our goal is that every person who works for JSR Group, our own employees and those of partner companies, can work safely and feel a sense of contentment. At the same time, as a responsible member of the local community, we continue to engage in business activities with a keen awareness of the environment and safety. Guided by the conviction that safety is the most important value for every person working in the manufacturing industry and is a major premise of our business activities, JSR formulated the Philosophy for Occupational Health and Safety and the Policy for Security Management, targeting zero accidents and disasters.
Philosophy
Data SectionManagement policy Our Strategies for Value Creation
Our Forces Supporting Value CreationCreating Corporate Value
43JSR REPORT 2021

For each report that comes in, the office of the Corporate Ethics Committee in the company concerned requests the relevant department to ascertain the facts. Based on the department’s findings, the office then discusses and decides on responses and follows up on the results. If the reporter desires feedback, the contact point that initially received the report contacts him or her with the results as well as any actions taken.
2 Hotline for Business PartnersIn its Procurement Department, JSR employs a Supplier’s Hotline, an external reporting channel for business partners, namely suppliers and services providers with whom domestic Group companies do regular business. It receives reports from business partners to quickly discover and resolve violations of the law as well as actual and possible violations of corporate ethics in business transactions. Hotline services are entrusted to the same outside organization employed for the employee hotlines. Efforts are being made to improve reliability by enforcing strict secrecy of reports and prohibiting any handling of reports that would be disadvantageous to those reporting.
(1) Corporate Ethics Awareness SurveyJSR Group has introduced a system of internal reporting channels called the “Corporate Ethics Hotline.” An internal hotline is connected to the Corporate Ethics Committee in JSR or the relevant Group company. An external hotline is set up to connect to two contact points. One is a designated independent attorney and the other is an independent and specialized outside organization capable of handling communication in Japanese, English, Chinese, Korean, Thai, and Indonesian. This system is designed to facilitate use even by overseas employees. Reports made to the external hotline are also simultaneously reported to full-time auditors so that independence from management is assured. We encourage our employees to use these hotlines through promotions via internal newsletters and other media, and strive to build trust in the hotlines by ensuring confidentiality and prohibiting unfair treatment of hotline users.
(2) Hotline (Internal Reporting Channels)1 Hotline for EmployeesJSR Group has introduced an internal reporting system called the Corporate Ethics Hotline. To ensure employee awareness of the system, information on accessing the hotline is posted at the top page of our intranet and our online in-house newsletter. At the same time, we strive to build trust in the system by ensuring confidentiality of report content and prohibiting unfair treatment of hotline users. We have designed a system to facilitate use by overseas employees as well, setting up two contact points with specialized outside organizations capable of handling communication in Japanese, English, Chinese, Korean, Thai, and Indonesian. Reports made to the external hotline are also simultaneously reported to full-time auditors so that independence from management is assured.
Internal Report Flow
Reporter
Hotlines (internal) (external)
Report
Report on internal report
Directives on fact-finding and corrective action
Feedback
Report on fact-finding, response measures
Report on fact-finding, response measures
JSR Corporate Ethics Committee Chair, Executive Director
Department or Group company relevant to report
JSR Group has been endeavoring, by building up and maintaining good relationships with all our stakeholders, to become a trustworthy and indispensable corporate citizen. We have been vigorously adhering to our Code of Conduct in order to fulfill “Our Responsibility to our Stakeholders,” an essential part of our Management Policies, as well as to ensure compliance with relevant laws and regulations during the course of our business.
Philosophy
Compliance
JSR Group is advancing corporate ethics activities in an integrated manner at all Group companies, both in Japan and overseas. To achieve this, we have formulated JSR Group Principles of Corporate Ethics as a concrete guideline for globally shared corporate ethics that reflect our Essential Elements. The principles serve as a Code of Conduct that all directors and employees (full-time, contract, part-time, and temporary employees as well as employees on short-term contracts) of JSR companies should comply with in order to develop our corporate activities while fulfilling the Management Policies spelled out in “Our Responsibility to our Stakeholders.” JSR Group shall never require directors and employees of Group companies to act in violation of this Code of Conduct. Additionally, JSR Group shall not disadvantage any director or employee who refuses to execute an order to perform an act that is in violation of the Code of Conduct because of that refusal.
* JSR Group’s Essential Elements: The Essential Elements consist of the Corporate
Mission, the Management Policies, and Course of Action: 4C action guidelines.
JSR Group Principles of Corporate Ethics
Corporate Ethics Activities
Please refer to our Sustainability Report 2021 for a detailed explanation and data.
https://www.jsr.co.jp/jsr_e/sustainability/
Data SectionManagement policy Our Strategies for Value Creation
Our Forces Supporting Value CreationCreating Corporate Value
44JSR REPORT 2021

Every JSR Group member defines legal compliance
regulations that form the basis of its legal compliance.
Each company then uses the regulations to solidify its
compliance through regular review and improvement as
well as legal training to increase awareness of laws and
regulations and instill commitment to compliance. JSR
Group establishes specific systems and executes other
priority approaches to ensure compliance with laws and
regulations that are particularly relevant to the execution
of business.
JSR Group recognizes the importance of protecting
personal information. We have therefore formulated a
Privacy Policy and Rules for Handling Personal Information
that sets out our approach to the acquisition, use, and
management of personal information based on the Act on
the Protection of Personal Information. We have also
established Rules for Handling Specific Personal
Information in response to the introduction of Japan’s
Individual Number system. Moreover, in accordance with
relevant laws and our privacy policy, we ensure the
appropriate handling of specific personal information in the
Company by defining precautions and security standards
necessary to ensure the proper use and protection of this
information at each stage of acquisition, storage, use,
provision, disclosure, correction, suspension of use, and
deletion. Furthermore, for Group companies that will
handle personal data covered by the EU’s General Data
Protection Regulation (GDPR), we are providing support
for the development and operation of a GDPR compliance
system to be applied to the acquisition, processing, and
transfer of covered personal data.
JSR Group has formulated a Policy for Bribery Prevention,
Rules on Complying with Anti-Corruption Laws, and
Standards for Gift-Giving and Entertaining that specify
necessary items for all executives and employees to
comply with the Japanese Unfair Competition Prevention
Act, the U.S. Foreign Corrupt Practices Act, the U.K.
Bribery Act and other anti-corruption laws. In addition, JSR
has also formulated Rules on Antimonopoly Law (Japan),
Rules on Complying with U.S. Antitrust Laws, Rules on
Complying with the EU’s Antitrust Laws, and Rules on
Complying with Korean Fair Trade Laws that specify items
necessary for complying with each country’s antimonopoly
(antitrust) laws.
Legal Compliance Measures Protection of Personal Information
Approach to Preventing Bribery and Unfair Competition
Information Security Policy
• JSR Group, by complying with laws and regulations and by observing other social norms relating to the handling of information, will protect information that belongs to JSR Group, its customers, business partners and other third parties.
• The JSR Group will strive to develop and actively use its information assets for the efficient execution of its business. The Group’s officers and employees will only use these information assets for the purposes of their work and within the scope of their authority.
• JSR Group will improve organizations and systems, provide education on information security, thoroughly disseminate this policy and related regulations, and implement measures to ensure information security.
• JSR Group will implement appropriate human, organizational, and technological measures and work to prevent unauthorized access to information assets from outside the Company, as well as leaks, falsification, loss, theft and destruction of information assets.
• If an information security-related problem occurs, JSR Group will promptly identify the cause and take measures to minimize damage and prevent recurrences.
• JSR Group will periodically assess and review its information security measures to respond appropriately to changes in external environments.
Data SectionManagement policy Our Strategies for Value Creation
Our Forces Supporting Value CreationCreating Corporate Value
45JSR REPORT 2021

Occurrence frequency Large
Large
Impact on m
anagement
Necessity and priority of measures
High
Conceptual diagram of risk map
JSR Group believes that preventing a major crisis from occurring and minimizing the impact of a crisis on business activities should one occur are important management roles. The Group has formulated Risk Management Policies and established a Risk Management Committee through which it actively pursues risk management activities.
Philosophy
Risk Management
JSR Group manages risk by largely classifying it into two types: risk related to business strategies and risk related to business operations.
For risk related to business strategies, we engage in risk management through deliberations and decisions made in important meetings, such as those of the Board of Directors, Executive Committee, and Business Issues Committee.
For risk related to business operations, we establish Risk Management Policies and engage in risk management centered on the Risk Management Committee.
The risk management system is incorporated into the internal control system. The status of the internal control system’s execution is reported to the Board of Directors. JSR has a Corporate Audit Department that continuously verifies and evaluates the preservation and operation of internal control for the entire JSR Group as required by the Companies Act and Financial Instruments and Exchange Act. It also ensures that risk in existing business does not exceed permissible levels. The department additionally maintains and strengthens internal control levels for the
Risk Management System
JSR Group believes that preventing a major crisis from occurring and minimizing the impact of crises on business activities are important management roles. The Group has formulated Risk Management Policies and established a Risk Management Committee, chaired by the officer in charge of the Corporate Planning, which is primarily responsible for setting risk management policy.
The Risk Management Committee promotes ongoing improvement of response policies and action plans in response to actual and potential crises.
Since FY2009, JSR Group has fulfilled Group-wide annual risk management procedures using its unique risk management system under the initiative of the Risk Management Committee. For each division of JSR Group companies in and outside of Japan, we identify and evaluate all potential risks, and formulate measures to control such risks.
Utilizing a risk map that represents level of business impact and frequency of occurrence, we identify risks that could have a significant impact on business continuity and organize the risks into JSR Group Risk Factors. By monitoring and regularly reviewing risks that senior management has personally ascertained, we are building and maintaining a system for prevention and crisis preparedness.
JSR has formulated BCM procedures that summarize the BCM/BCP* systems in place for both normal circumstances and emergency situations. These procedures define the BCM organization and the actual BCP which includes stipulations on target recovery times, and BCP activation and cancellation standards. They also define the organizational structure that takes effect during activations of the BCP and corresponding priority businesses and operations.
* BCM: Business Continuity Management/BCP: Business Continuity Plan
A BCP defines activities that need to be conducted before the occurrence of an
emergency situation that may threaten the survival of a company (large-scale natural
disaster, explosion/fire, terrorist attack, etc.), judgment criteria and action guidelines
that enable business continuity in the event of such emergencies, and other matters
necessary for ensuring the continuity and early restoration of important businesses.
BCM is a management system that has been developed to operate and continuously
improve the BCP through a PDCA (plan-do-check-act) cycle.
Risk Management Committee
Identifying Risks and Selecting Important Risks
Crisis Management Training
entire Group and conducts internal audits to ensure the appropriate and efficient execution of operations.
* For details on risks, please refer to Business Risks on page 6 of the Financial Section.
Please refer to our Sustainability Report 2021 for a detailed explanation and data.
https://www.jsr.co.jp/jsr_e/sustainability/
Data SectionManagement policy Our Strategies for Value Creation
Our Forces Supporting Value CreationCreating Corporate Value
46JSR REPORT 2021

Supply Chain Management
CSR/sustainable procurement
JSR Group is in a unique position as a chemicals manufacturer to support society by delivering materials to various industries through its supply chain management. We consistently deliver products of proven quality to customers. The recent globalization of supply chains has seen the emergence of numerous problems, such as forced labor, child labor, environmental destruction, global warming, and corporate misconduct. Corporate activities have more of an impact on society than ever. In December 2018, we formulated the JSR Group CSR/Sustainable Procurement Policy, described below.
Key Points of CSR/Sustainable Procurement Policy
• Fair Corporate Activity In the processes of producing products and services, companies must engage in business activities that are based on fair, transparent, and free competition.
• Human Rights and Labor Companies must act in accordance with the laws of each country and international standards, respect basic human rights, and give attention to the following items to ensure that their business activities do not violate human rights, either directly or indirectly
Supply Chain Management
We believe that an important role of JSR Group is to offer innovative materials and excellent products that meet customer needs and contribute to the making of a better society. We are able to respond to social issues through our business partners and supply chain management.
Philosophy• Environmental Conservation
Companies have a responsibility to comply with the laws and standards of each country concerning environmental conservation, to specify and manage factors that impact on the environment by building a management system, and to work toward preserving the environment in their processes of producing products and services.
• Health and Safety Companies must comply with the laws and standards of each country concerning occupational health and safety and establish management systems and mechanisms to prevent workplace accidents, promote the health and safety of employees, and create comfortable workplace environments.
• Information Security Companies must properly manage and protect the information they obtain through business activities, take protective measures against threats to their computer networks, and manage the confidential information of customers and third parties in a manner that prevents leaks.
Assessment of business partners
We assess candidates for new business partners based on certain criteria concerning the status of their financial affairs and level of quality management. We conduct an onsite audit prior to the start of business as well, to verify items concerning safety, the environment, and quality. We also regularly check whether business partners with whom we have an ongoing business relationship meet the same criteria we expect. In particular, with regard to vital raw materials that are difficult to procure in an emergency due to issues of availability or scarcity, we strive to secure stable availability for our customers by conducting regular supplier audits and onsite confirmation of items pertaining to supply continuity and providing proposals and guidance for quality reliability.
Initiatives concerning conflict minerals
Our policy is to never permit the use of conflict minerals, directly or indirectly. We continuously verify that we use no conflict minerals with our business partners’ cooperation. In FY2015, we conducted an investigation concerning the use of conflict minerals and confirmed that none of the targeted suppliers used them. Since then, we have investigated the use of conflict minerals when acquiring new raw materials or using a new supplier, and have maintained a system that guarantees we do not use such minerals.
Education and training of employees in charge of procurement
We recognize that educating and training on measures having to do with CSR/sustainable procurement and conflict minerals for purchasing department personnel is crucial in guaranteeing sound supply chain management. We support and encourage procurement staff to acquire Japan Management Association-accredited Certified Procurement Professional certification (CPP; certifying that a person has acquired specialized knowledge in the purchasing and procurement field) to further deepen their knowledge of procurement.
Participation in initiatives concerning CSR/sustainable procurement
JSR participates in Global Compact Network Japan’s Supply Chain Working Group. We utilize knowledge obtained through dialogues with stakeholders to strengthen our CSR/sustainable procurement activities. For example, we apply this knowledge when formulating JSR Group CSR/Sustainable Procurement Policy and reflect it in questionnaire items used when surveying business partners.
Please refer to our Sustainability Report 2021 for a detailed explanation and data.
https://www.jsr.co.jp/jsr_e/sustainability/
Data SectionManagement policy Our Strategies for Value Creation
Our Forces Supporting Value CreationCreating Corporate Value
47JSR REPORT 2021

Sustainability Performance
Inclusion in ESG indexes, socially responsible investment (SRI) indexes and investment universes (Current as of June 24, 2021)
FTSE Blossom Japan Index
We were selected as an investment
brand of the “FTSE Blossom Japan
Index” for being a Japanese company
with excellent consideration for ESG
(Environment, Social, and Governance).
FTSE4Good
For 16 consecutive years since 2004 we have been selected by FTSE Russell as a constituent of the FTSE4Good Index Series.
* The inclusion of JSR Corporation in MSCI indexes, as well as the use of the MSCI logo, trademark, service mark and index name, does not constitute support, endorsement or promotion of MSCI or any MSCI-affiliated company by JSR Corporation. MSCI indexes are the sole property of MSCI. MSCI and all MSCI index names and logos are the trademark or service mark of MSCI and its affiliated companies.
MSCI Japan Empowering Women Index (WIN)
We were selected by MSCI as an investment brand of the “MSCI Japan Empowering Women Index (WIN)” for being a company with excellent gender diversity.
MSCI ESG Leaders Indexes
We are included in the MSCI ESG Leaders Indexes as a company with outstanding ESG (environment, social, governance) performance.
JSR Group is highly regarded for its sustainability activities
and other non-financial initiatives, as reflected by its
inclusion in international socially responsible investment
indexes and investment universes. Also, JSR Group has
been selected for inclusion in the FTSE Blossom Japan
Index and MSCI Japan Empowering Women Index (WIN),
S&P/JPX Carbon Efficient Index, which are ESG indexes
selected by Government Pension Investment Fund (GPIF).
JSR Group has continually been ranked in the Global
Compact 100 since FY2013.
Evaluation by Outside Organization
SOMPO Sustainability Index
In recognition of our standing as a company with a high ESG (Environment, Social, and Governance) evaluation, we were reconfirmed by Sompo Asset Management Co., Ltd. as a brand to be included in the SOMPO Sustainability Index.
Sompo Sustainability Index
2021
S&P/JPX Carbon Efficient Index
We were selected for inclusion in the S&P/ JPX Carbon Efficient Index by the S&P Dow Jones Index.
Data SectionManagement policy Our Strategies for Value Creation
Our Forces Supporting Value CreationCreating Corporate Value
48JSR REPORT 2021

Head OfficeJSR CorporationShiodome Sumitomo Bldg. 1-9-2, Higashi-Shimbashi, Minato-ku, Tokyo 105-8640 Japan
Branch OfficeNagoya BranchDai Nagoya Building 15F 3-28-12 Meieki, Nakamura-ku, Nagoya-shi, Aichi 450-6415 Japan
Taiwan Branch17F-C1, No.8, Zihciang S. Rd., Jhubei City, Hsinchu County 302, Taiwan, R.O.C.
PlantsYokkaichi Plant100, Kawajiricho, Yokkaichi-shi, Mie 510-8552 Japan
Chiba Plant5, Chigusakaigan, Ichihara-shi, Chiba 299-0108 Japan
Kashima Plant34-1, Towada, Kamisu-shi, Ibaraki 314-0102 Japan
LaboratoriesYokkaichi Research Center100, Kawajiricho, Yokkaichi-shi, Mie 510-8552 Japan
Tsukuba Research Laboratories25, Miyukigaoka, Tsukuba-shi, Ibaraki 305-0841 Japan
JSR-Keio University Medical and Chemical Innovation Center35, Shinanomachi, Shinjuku-ku, Tokyo 160-8582 Japan
JSR Bioscience and informatics R&D Center3-103-9 Tonomachi, Kawasaki-ku, Kawasaki, Kanagawa 210-0821
JAPANDigital Solutions Business
D-MEC Ltd.3D model generation, analysis by CAE and sales of solid modeling system and optically hardened resins
JSR Micro Kyushu Co., Ltd.Production of semiconductor materials and display materials
JAPAN FINE COATINGS Co., Ltd.Sales and manufacture of coating materials for fiber-optic cables reinforced by ultraviolet or electron radiation and for other apparatus
Life Sciences Business
JSR Life Sciences CorporationManufacture of life sciences-related materials
MEDICAL & BIOLOGICAL LABORATORIES CO., LTD.R&D, manufacture and sales of diagnostic and research reagents and companion diagnostics development service
LEXI Co., Ltd.Development, sales, and services of software and devices for supporting surgical operations
Rapithela CorporationDigital design and fabrication support service for prosthetics and orthotics
MBL Venture Capital Co., Ltd.Investment in biotechnology-related ventures and business consulting
G&G Science Co., Ltd.R&D of genetic testing agents
Elastomers Business
ELASTOMIX CO., LTD.Compounding of crude rubber and sales of compounded products
Japan Butyl Co., Ltd.Production and sales of butyl rubber
KRATON JSR ELASTOMERS K.K.Production, purchase, and sales of thermoplastic rubber
Emulsion Technology Co., Ltd.Compounding and sales of crude latex
Plastics Business
Techno-UMG Co., Ltd.Production, sales and R&D of ABS resin
JAPAN COLORING CO., LTD.Coloring and sales of synthetic resins
Other Businesses
JSR Trading Co., Ltd.Export, purchase and sale of various chemicals and distribution materials. Purchase and wholesale of various equipment
JEY-TRANS CO., LTD.Freight forwarding, warehousing, delivery management
JSR Logistics & Customer Center Co., Ltd.Customer service agent and logistics management
JSR Business Services Co., Ltd.Human resources, payroll calculation, welfare, general affairs
JN System Partners Co., Ltd.Computer system design, programming, operation and maintenance
Goko Trading Co., Ltd.Export, import, purchase and sale of various chemicals and distribution materials. Purchase and wholesale of various equipment
JSR Active Innovation Fund, LLCInvestment for start-ups and support for developing investees’ businesses
OverseasDigital Solutions Business
JSR Micro N.V.Production and sales of semiconductor materials and life sciences-related materials
JSR Micro, Inc.Production and sales of semiconductor materials
JSR Micro Korea Co., Ltd.Design, development, production and sales of display materials
JSR Electronic Materials Korea Co., Ltd.Sales agency of products such as semiconductor materials
JSR Micro (Changshu) Co., Ltd.Production of display materials
JSR Micro Taiwan Co., Ltd.Design, development, production and sales of display materials
EUV Resist Manufacturing & Qualification Center N.V.Production of EUV photoresists for semiconductors
JSR (Shanghai) Co., Ltd.Sales agency of products such as synthetic rubbers, semiconductor materials, LCD materials and performance chemicals
JSR North America Holdings, Inc.Management and oversight of JSR Micro, Inc. and JSR Life Sciences, LLC's global operations
Life Sciences Business
JSR Micro N.V.Production and sales of semiconductor materials and life sciences-related materials
MBL Beijing Biotech Co., Ltd.Manufacture of in vitro diagnostic raw material platforms and provider of complete project solutions for in vitro diagnostic industry
MBL International CorporationDevelopment, manufacturing and sales of solutions-based products for both life science research and clinical diagnostics
MBL Hangzhou Biotech Co., Ltd.Manufacture of clinical diagnostics materials, antibodies and intermediates
MBL Shenzhen Biotech Co., Ltd.Development, manufacture, and sale of diagnostic reagents and their raw materials
KBI Biopharma, Inc.Microbial and mammalian, clinical and commercial biopharmaceutical contract development and manufacturing services
KBI Biopharma, SAContract development and manufacturing of biopharmaceuticals
Selexis SACell-line development services
Crown Bioscience InternationalEfficacy testing services for candidates of drugs against oncology, inflammation, cardiovascular and metabolic disease and development of antibodies for those diseases
JSR North America Holdings, Inc.Management and oversight of JSR Micro, Inc. and JSR Life Sciences, LLC's global operations
JSR Life Sciences, LLCJSR Life Sciences global business headquarters and distribution of life sciences products in the US market
KBI Biopharma Boulder, LLCDrug development and commercial manufacturing (microbial) services
KBI Biopharma BVBAWholly owned KBI subsidiary, focused on delivering analytical and formulation services
Elastomers Business
ELASTOMIX (THAILAND) CO., LTD.Compounding of crude rubber and sales of compounding products
PT.ELASTOMIX INDONESIACompounding of crude rubber and sales of compounding products
ELASTOMIX (FOSHAN) CO., LTD.Compounding of crude rubber and sales of compounded products
ELASTOMIX MEXICO, S.A. de C.V.Compounding of crude rubber and sales of compounding products
Tianjin Kuo Cheng Rubber Industry Co., Ltd.Compounding of crude rubber and sales of compounding products
JSR BST Elastomer Co., Ltd.Sales and manufacturing of Solution Polymerization Styrene- Butadiene Rubber.
JSR MOL Synthetic Rubber, Ltd.Sales and manufacturing of solution polymerization styrenebutadiene rubber
JSR Elastomer Korea Co., Ltd.Sales agency of products such as synthetic rubbers
JSR Elastomer Europe GmbHSales agency of products such as synthetic rubbers
JSR Elastomer Europe Belgium B.V.Sales agency of products such as synthetic rubbers
JSR Elastomer India Private LimitedSales agent for synthetic rubbers and other elastomer products
JSR Elastomer America, Inc.Sales of synthetic rubber
JSR (Shanghai) Co., Ltd.Sales agency of products such as synthetic rubbers, semiconductor materials, LCD materials and performance chemicals
Plastics Business
Techno-UMG Hong Kong Co., Ltd.Sales and technical services of synthetic resin in Hong Kong and neighboring regions
Techno-UMG Asia Co., Ltd.Sales and technical services of synthetic resin in ASEAN region
Techno-UMG Europe GmbHSales and technical services of synthetic resin in Europe
Techno-UMG Shanghai Co., Ltd.Sales and technical services of synthetic resin in China
Techno-UMG Guangzhou Co., Ltd.Sales and technical services of synthetic resin in Guangzhou and neighboring regions
Techno-UMG America, IncSales of plastics, technical services related to plastics in North America
Other Businesses
JSR Trading Vietnam Co., Ltd.Export, import and sales of synthetic rubber and steel container, materials and market development
JSR Trading (Shanghai) Co., Ltd.Export and import, purchase and sales of the following: various chemicals, machinery, equipment, distribution materials
JSR Trading Bangkok Co., Ltd.Export, purchase and sale of various chemicals and distribution materials. Purchase and wholesale of various equipment
JSRT Mexico S.A. de C.V.Sales of synthetic rubber, steel box, materials and market development
Main Group Enterprises (As of July 31, 2021)
Data SectionManagement policy Our Strategies for Value Creation
Our Forces Supporting Value CreationCreating Corporate Value
49JSR REPORT 2021

JSR Corporation
JSR Corporation EstablishedDecember 10, 1957
Capital (Common Stock)23,370 million yen
Employees9,278
Closing dateJSR books are closed on March 31 each year.
Shareholders Information
Stock ListingTokyo Stock Exchange
Number of Shares Issued226,126,145 shares
Number of Shareholders12,752
Composition of Shareholders
By Type of Shareholder
Major Shareholders
By Number of Shares Held
Ordinary General Meeting of ShareholdersThe annual General Meeting of Shareholders is held in Juneeach year. The 2020 annual General Meeting was held on June 17, 2021.
Transfer Agent and RegisterSUMITOMO MITSUI TRUST BANK, LIMITED
Independent AuditorsKPMG AZSA LLC
Common Stock Price Range (Yen/share: Tokyo Stock Exchange)
Name of Shareholder% of shares held/voting
rights
Number of shares held (thousands)
The Master Trust Bank of Japan, Ltd. (trust account) 9.41 20,216
STATE STREET BANK AND TRUST COMPANY 505010 8.76 18,836
Custody Bank of Japan, Ltd. (trust account) 5.81 12,479
GOLDMAN SACHS & CO. REG 4.71 10,116
MSCO CUSTOMER SECURITIES 3.12 6,696
Bridgestone Corporation 3.04 6,525
Nippon Life Insurance Company 1.73 3,717
Morgan Stanley MUFG Securities Co., Ltd. 1.72 3,692
Meiji Yasuda Life Insurance Company 1.69 3,631
Custody Bank of Japan, Ltd. (trust account 7) 1.61 3,461
Shareholder Shares held (thousands)
Individuals and others 11,839 12,600
Foreign corporations and individuals 606 101,319
Other domestic corporations 197 13,094
Financial institutions 109 87,890
Treasury stock 1 11,223
Total 12,752 226,126
1st Q 2nd Q 3rd Q 4th Q
FY2009High 1,687 1,960 1,959 1,974Low 1,162 1,561 1,545 1,714
FY2010High 1,999 1,666 1,543 1,875Low 1,436 1,201 1,341 1,183
FY2011High 1,724 1,655 1,582 1,790Low 1,413 1,221 1,218 1,408
FY2012High 1,695 1,455 1,644 1,994Low 1,255 1,274 1,224 1,670
FY2013High 2,360 2,073 2,049 2,085Low 1,748 1,713 1,663 1,694
FY2014High 1,933 1,975 2,229 2,205Low 1,622 1,681 1,711 1,893
FY2015High 2,296 2,227 2,054 1,903Low 1,998 1,626 1,688 1,455
FY2016High 1,682 1,635 1,872 2,115Low 1,292 1,287 1,437 1,835
FY2017High 2,082 2,177 2,320 2,758Low 1,794 1,871 2,035 2,215
FY2018High 2,425 2,229 2,177 1,909Low 1,803 1,824 1,530 1,526
FY2019High 1,914 1,836 2,165 2,196Low 1,475 1,621 1,699 1,452
FY2020High 2,127 2,557 2,959 3,600Low 1,840 2,004 2,346 2,809
’20/9 ’21/3
4,000
3,000
2,000
1,000
0’17/9 ’18/9 ’19/3 ’19/9 ’20/3’17/3 ’18/3
(Yen)
Individuals/others5.86%
Other domestic corporations6.09%
Financial institutions40.90%
Foreign corporations and individuals47.15%
1 trading unit or more2.89%
50 trading units or more4.07%
Less than 1 trading unit0.02%
500 trading units or more2.73%
1,000 trading units or more90.29%
* The Company holds 11,223,335 shares of treasury stock, which are not included in
the table above.
Corporate Data (As of March 31, 2021)
Data SectionManagement policy Our Strategies for Value Creation
Our Forces Supporting Value CreationCreating Corporate Value
50JSR REPORT 2021

CONTENTS
1 TEN-YEAR SUMMARY
3 MANAGEMENT’S DISCUSSION AND ANALYSIS
3 ANALYSIS OF OPERATING RESULTS
5 ANALYSIS OF FINANCIAL POSITION
6 BASIC POLICY ON PROFIT ALLOCATION AND DIVIDENDS FOR
THE FISCAL YEAR ENDED MARCH 31, 2021 AND THE FISCAL YEAR ENDING MARCH 31, 2022
6 RISK INFORMATION
8 CONSOLIDATED FINANCIAL STATEMENTS
9 CONSOLIDATED STATEMENT OF FINANCIAL POSITION
10 CONSOLIDATED STATEMENT OF PROFIT OR LOSS
11 CONSOLIDATED STATEMENT OF COMPREHENSIVE INCOME
12 CONSOLIDATED STATEMENT OF CHANGES IN EQUITY
13 CONSOLIDATED STATEMENT OF CASH FLOWS
14 NOTES ON CONSOLIDATED FINANCIAL STATEMENTS
71 INDEPENDENT AUDITOR’S REPORT
FINANCIAL SECTION 2021

Revenue/Profit (Loss) attributable to owners of parent
Operating Profit (loss)/Operating Profit (loss) Margin
Total Assets/ROA
RevenueProfit attributable to owners of parent
0 0
-600
-300
-60
-30
30
60
300
600
(FY)
(¥ billions)
2018 20202017 2019
446.6
△55.2
Operating profitOperating profit margin
0 0
-80
-40
-20
-10
10
20
40
80
(FY)
(¥ billions)
2018 20202017 2019
△61.6
△13.8
(%)
Total assetsROA
0 0
-80
-40
-12
-6
6
12
40
80
(FY)
(¥ billions)
2018 20202017 2019
672.8
△8.2
(%)
TEN-YEAR SUMMARY
Millions of yen
JGAAP For the year: FY2011 FY2012 FY2013 FY2014 FY2015 FY2016
Results for the year
Net sales ¥ 349,947 ¥ 371,487 ¥ 394,309 ¥ 404,073 ¥ 386,709 ¥ 390,599
Costs and expenses (313,982) (336,281) (358,247) (366,005) (352,301) (358,228)
Operating profit 35,964 35,206 36,062 38,068 34,408 32,370
Interest and dividends income 634 809 916 1,390 1,380 1,369
Interest expenses (147) (126) (142) (345) (527) (699)
Profit before income taxes 41,245 42,847 36,956 41,069 27,367 38,327
Profit attributable to owners of parent 26,407 30,278 25,173 29,919 24,069 30,078
Capital expenditures 19,728 27,608 21,499 35,157 24,276 31,785
Depreciation 17,784 19,145 18,096 17,407 18,508 14,676
Year-end financial position
Total assets 430,693 482,935 501,320 534,592 516,360 576,016
Long-term loans payable 500 6,626 11,069 20,387 22,249 38,381
Total liabilities 148,335 167,202 164,060 169,918 154,006 199,302
Equity 280,955 308,641 331,284 358,303 353,145 361,394
Current ratio (times) 2.3 2.3 2.5 2.5 2.7 2.5
Return on assets (%) 6.4 6.6 5.1 5.8 4.6 5.5
Return on equity (%) 9.7 10.3 7.9 8.7 6.8 8.4
Equity ratio (%) 65.2 63.9 66.1 67.0 68.4 62.7
Per share of common stock (Yen and U.S. Dollars)
Profit attributable to owners of parent ¥ 109.46 ¥ 126.13 ¥ 106.10 ¥ 128.19 ¥ 105.87 ¥ 134.43
Cash dividends 32.00 34.00 38.00 40.00 50.00 50.00
Equity 1,164.63 1,299.77 1,409.06 1,557.08 1,565.45 1,624.14
(Notes) 1. Amounts in U.S. dollars are translated from yen, provided for convenience only, at the exchange rate of 1.00 U.S. dollar = 110.71 Japanese yen; the prevailing rate on March 31, 2021.
2. The Group has adopted International Financial Reporting Standards (IFRS) as from the fiscal year ended March 2018. 3. ROA = Under Japanese GAAP, return on total assets. Under IFRS, return on equity attributable to owners of parent. 4. ROE = Under Japanese GAAP, return on equity. Under IFRS, return on equity attributable to owners of parent.
1JSR Corporation Annual Report 2021

Equity/ROE R&D Expenses/Capital Expenditures Shareholder Return/Dividend Payout Ratio
EquityROE
0 0
-80
-40
-16
-8
8
16
40
80
(FY)
(¥ billions)
2018 20202017 2019
370.7
△15.1
(%)
R&D expensesCapital expenditures
30
0
15
45
60
(FY)
(¥ billions)
2018 20202017 2019
446.6
△55.2
Dividend Share buybackDividend payout ratio
20 50
0
10
0
25
75
100
30
40
(FY)
(¥ billions) (%)
2018 20202017 2019
12.9
Thousands of U.S. dollars
IFRS For the year: FY2016 FY2017 FY2018 FY2019 FY2020 FY2020
Results for the year
Revenue ¥ 388,455 ¥ 421,930 ¥ 495,354 ¥ 471,967 ¥ 446,609 $ 4,034,041
Costs, other income and expenses (352,512) (378,360) (450,093) (439,083) (508,242) (4,590,752)
Operating profit (loss) 35,943 43,569 45,261 32,884 (61,633) (556,711)
Finance income 3,045 3,659 2,499 1,929 947 8,552
Finance costs (694) (1,022) (1,352) (2,184) (1,743) (15,748)
Profit (loss) before tax 38,294 46,206 46,408 32,629 (62,430) (563,906)
Profit (loss) attributable to owners of parent 30,243 33,230 31,116 22,604 (55,155) (495,923)
Capital expenditures 31,377 42,408 35,981 45,880 53,669 414,416
Depreciation 14,793 16,973 21,790 26,343 29,477 266,254
Year-end financial position
Total assets 578,484 647,699 691,435 677,713 672,773 6,076,891
Borrowings (non-current liabilities) 38,381 53,456 50,777 52,684 81,406 735,304
Total liabilities 202,120 236,084 251,075 240,301 302,036 1,203,383
Total equity attributable to owners of parent 361,889 393,499 401,998 396,793 333,995 3,016,846
Current ratio (times) 2.5 2.3 1.97 2.05 1.95 1.95
Return on assets (%) 5.5 5.4 4.7 3.3 (8.2) (8.2)
Return on equity (%) 8.5 8.8 7.8 5.7 (15.1) (15.1)
Equity ratio (%) 62.6 60.8 58.1 58.5 49.6 49.6
Per share of common stock (Yen and U.S. Dollars)
Profit attributable to owners of parent ¥ 135.17 ¥ 149.32 ¥ 140.62 ¥ 104.38 ¥ (256.73) $ (2.32)
Cash dividends 50.00 50.00 60.00 60.00 60.00 0.54
Equity attributable to owners of parent 1,626.36 1,767.81 1,823.69 1,848.01 1,554.17 14.04
Millions of yen
TEN-YEAR SUMMARY
2JSR Corporation Annual Report 2021

MANAGEMENT’S DISCUSSION AND ANALYSIS
Analysis of Operating Results
Overview of FY ended March 2021 (April 1, 2020 to March 31, 2021)
In FY ended March 2021 (April 1, 2020 to March 31, 2021), there were signs of a slowdown in the global economic recovery due to the spread of COVID-19, intensifying trade friction between the U.S. and China, the rise of protectionism, and other factors. As for trends among the Group’s main customer industries, demand grew in the semiconductor market from 5G mobile communications systems (5G), computers, and data centers, and both memory and logic semiconductors performed well. The flat-panel display market was strong due to the promotion of telework and stay-at-home demand. Global automobile production for the full year fell from the previous year because of COVID-19 lockdowns and other restrictions, although production did recover in the second half of the year. Global automobile tire production over the full term was also down, due to the impact of falling automobile production and other factors, but a clear recovery trend was seen in the second half of the year. As for the exchange rate, the yen appreciated against the dollar year-on-year.
Amid these circumstances, JSR Group strived to expand business in growth fields as well as take steps such as cutting business costs to mitigate the risk of declining sales due to economic stagnation and weak demand. In the Elastomers Business, the Group focused on lowering manufacturing costs and other measures to guard against the risk of declining sales due to sluggish demand. The Group has been promoting the streamlining of raw materials and logistics and other cost-cutting measures, the optimization of sales prices, and the retooling of personnel structures with the implementation of an early retirement incentive program. Additionally, the Group has reorganized operations in the Display Materials Business by downsizing operations in South Korea and Taiwan and shifting operations to China, and in the Elastomers Business, the Group has implemented structural reforms throughout the organization, including adjustments to business and product segments. A one-time expense pertaining to these business structural reforms was recorded in FY ended March 2021.
In addition, JSR Group issued 35,000 million yen in straight bonds in May 2020 to secure funds for future investments in growth areas such as semiconductors and life sciences, and to diversify fund procurement to improve the stability of the Group’s financial base. The Group took definitive steps regarding business expansion in growth areas, such as making Medical & Biological Laboratories Co., Ltd. (MBL) a wholly owned subsidiary to bolster competitiveness in the therapeutic discovery support field and in the development of new companion diagnostics, as well as commencing commercial production operations at a new U.S. facility of functional
cleaning solutions intended for cutting-edge semiconductors. As a result, the Group reported revenue of 446,609 million
yen (down 5.4% year-on-year), an increase compared to the forecast at the time the Second Quarter results were announced, but a decrease compared to the previous fiscal year. Core operating profit was 25,963 million yen, up from the forecast at the time the Second Quarter results were announced, but down year-on-year. Although the Digital Solutions Business grew, the Group’s business was affected by revenue declines in the Elastomers Business and Plastics Business, which were hit by the effects of COVID-19. The Group posted an operating loss of 61,633 million yen, versus an operating profit of 32,884 million yen in the previous fiscal year, due to the recording of restructuring expenses. Loss attributable to owners of parent was 55,155 million yen, compared with profit attributable to owners of parent of 22,604 million yen in the previous fiscal year.
Business Segment Overview
The JSR Group’s business is classified into four reportable segments: Digital Solutions, Life Sciences, Elastomers, and Plastics. The reportable segments are positioned as shown below.
Digital Solutions Business SegmentThe Digital Solutions Business segment experienced both increased revenue and profit compared to the previous fiscal year.
In the Semiconductor Materials Business, demand for both memory and logic semiconductors has been firm since the First Quarter of FY 2020. Sales of advanced photoresists were particularly strong, due in part to advanced device launches by major customers. In addition, smooth product launches were achieved of cleaning solutions and packaging materials for cutting-edge semiconductors destined for major customers, which contributed to revenue gains from the previous fiscal year. The sector secured higher core operating profit despite
Core Operating Profit (¥ millions)
FY2019 FY2020Digital Solutions Business 144,805 151,420
Core Operating Profit 30,917 34,568Life Sciences Business 50,496 55,197
Core Operating Profit 3,945 3,510Elastomers Business 178,794 143,186
Core Operating Profit (1,758) (11,420)Plastics Business 95,092 79,123
Core Operating Profit 6,237 4,430Other Businesses & Adjustment 2,779 17,682
Core Operating Profit (6,105) (5,125)
Revenue 471,967 446,609Core Operating Profit 33,236 25,963
3JSR Corporation Annual Report 2021

greater expenses incurred with expanded cleaning solutions sales. Since the Semiconductor Materials Business is deemed an essential business for people’s livelihoods, global R&D, production, and other business activities continued without being impacted by the COVID-19 pandemic.
The Display Materials Business saw expanded sales volume to China of alignment films for wide-screen TV LCD panels, a focus point of the business. The sector posted lower revenue on lower sales of color resist and photosensitive spacers caused by some customers abandoning LCD production, amid the shift of LCD production from South Korea and Taiwan to China. Despite this, the Display Materials Business boosted its core operating profit on the back of strong alignment film sales.
The Edge Computing Business suffered revenue and profit declines because of a sales decrease in near-infrared (NIR) filters.
Consequently, the Digital Solutions Business segment posted a core operating profit of 34,568 million yen (up 11.8% year-on-year) on revenue of 151,420 million yen (up 4.6% year-on-year).
Life Sciences Business SegmentIn the Life Sciences Business, with the U.S. headquarters guiding strategies for the entire business segment, the Group has worked to expand revenue primarily in the biomedical drug discovery business and the biomedical drug contract development and manufacturing business, in addition to JSR materials. Favorable progress was achieved by Contract Research Organization (CRO) business provided by Group company Crown Bioscience International (Crown). In the biologics Contract Development and Manufacturing Organization (CDMO) business, led by Group companies Selexis SA (Selexis) and KBI Biopharma, Inc. (KBI), Selexis posted solid revenue growth, while KBI achieved higher revenue on lower profit due to COVID-19-related supply-chain interruptions and a one-time accounting adjustment recorded in the previous fiscal year. Revenue from diagnostic reagent materials, bioprocess materials, and other products also climbed. The diagnostic reagent business of Medical & Biological Laboratories Co., Ltd. (MBL), which became a wholly owned subsidiary in the current fiscal year, grew steadily, contributing to overall higher revenue from the previous fiscal year.
As a result, the Life Sciences Business segment posted a core operating profit of 3,510 million yen (down 11.0% year-on-year) on revenue of 55,197 million yen (up 9.3% year-on-year)
Elastomers Business SegmentThe COVID-19 pandemic’s impact on production of automobile tires, one of the segment’s main customer industries, was compounded by temporary production stoppages or reductions
at tire-maker plants in Europe and elsewhere intended to curb the spread of COVID-19. Consequently, yearly production was down from the previous fiscal year, although production began to recover in the second half of the year.
Amid these circumstances, the sales volume of Solution Styrene-Butadiene Rubber (SSBR), positioned as a strategic product, remained at the same level as the previous fiscal year, despite a year-on-year decline in worldwide tire production. Nevertheless, the Elastomers Business recorded lower revenue compared to the previous fiscal year, as the segment’s overall sales volume was sluggish and sales prices slid because of a deterioration in raw-material market conditions. The segment posted a core operating loss for the full term as a result of revenue declines and narrower price spreads.
Consequently, the Elastomers Business segment’s core operating loss expanded from 1,758 million yen to 11,420 million yen on revenue of 143,186 million yen (down 19.9% year-on-year).
Plastics Business SegmentThe Plastics Business segment saw a drop in sales volume and revenue from the previous fiscal year, due to weaker demand resulting from the COVID-19 pandemic. Core operating profit fell due to the segment’s sales volume decline.
As a result, the Plastics Business segment posted a core operating profit of 4,430 million yen (down 29.0% year-on-year) on revenue of 79,123 million yen (down 16.8% year-on-year).
Business Outlook
The business landscape is anticipated to improve in FY 2021, given the upward adjustment of the global economic growth rate and other factors, despite the rocky international situation caused by the re-emergence of COVID-19 infections and ongoing confrontations between the two major powers, the United States and China. While the economy is expected to pick up on the back of additional support measures and vaccine roll-outs in major countries, the complication of various risks, such as countries imposing stringent restrictions on economic activities to control the pandemic, means future prospects remain uncertain and geopolitical fluctuations must continue to be addressed. The semiconductor market, driven by digital infrastructure demand, is expected to see robust growth as an essential industry, and continued growth is predicted for display production as well. The solid demand forecasts over the medium-to-long-term for the life sciences field remain unchanged. As with automobile production, the recovery trend in automobile tire production is predicted to continue, although the industry’s prospects are not clear. The semiconductor market, driven by digital infrastructure demand, is expected to see robust growth as an essential industry, and continued growth is predicted for display production as well.
MANAGEMENT’S DISCUSSION AND ANALYSIS
4JSR Corporation Annual Report 2021

The solid demand forecasts over the medium-to-long-term for the life sciences field remain unchanged.
For the FY ending March 2022, JSR forecasts revenue of 468,000 million yen (up 4.8 percent year-on-year), core operating profit of 53,000 million yen (up 104.1 percent year-on-year), operating profit of 53,000 million yen (compared to an operating loss of 61,600 million yen in the previous fiscal year), and profit for the year attributable to owners of parent of
32,000 million yen (compared to a loss of 55,200 million yen in the previous fiscal year). The forecast assumes an exchange rate of 106 yen per U.S. dollar. Actual business performance may vary substantially due to future developments in social conditions and economic conditions. JSR will promptly disclose revisions to the earnings forecast, should they become necessary.
Analysis of Financial Position
Overview of Financial Position for FY ended March 2021
Total assets as of March 31, 2021 amounted to 672,773 million yen, down 4,941 million yen from a year earlier.
Current assets totaled 329,279 million yen, up 25,804 million yen, due to an increase in cash and cash equivalents resulting from the issue of bonds.
Non-current assets totaled 343,494 million yen, down 30,744 million yen, due to the recording of impairment losses for property, plant, and equipment.
Total liabilities amounted to 302,036 million yen, up 61,735 million yen, due to an increase in bonds and borrowings resulting from the issue of bonds.
In terms of equity, total equity attributable to owners of parent amounted to 333,995 million yen, down 62,798 million yen from a year earlier, due to the recording of net loss attributable to owners of parent. Total equity, including noncontrolling interests, amounted to 370,736 million yen, down 66,675 million yen.
Overview of Cash Flows for FY ended March 2021
Cash and cash equivalents (“funds”) as of March 31, 2021 stood at 85,377 million yen, up 23,445 million yen from a year earlier.
Net cash provided by operating activities amounted to 70,403 million yen, up 16,175 million yen from the previous year. The main factors included impairment loss of 79,575 million yen, loss before tax of 62,430 million yen, and depreciation expenses and depreciation charges of 29,477 million yen.
Net cash used in investing activities totaled 52,687 million yen, up 17,095 million yen from the previous year. The main item was 55,205 million yen in payments for purchase of property, plant and equipment.
Net cash provided by financing activities totaled 4,297 million yen, up 29,561 million yen from the previous year. The main items were 34,836 million yen in proceeds from the issue of bonds, 12,887 million yen in dividends paid, and 11,717 million yen in payments for acquisition of shares of subsidiaries not involving a change in the scope of consolidation.
The Group formulates a funding plan based on the annual business plan and controls liquidity risk in consideration of an
appropriate balance of direct and indirect funding, as well as short-term and long-term funding.
Financing and Capital Liquidity
The Group’s need for capital includes working capital such as raw material costs; overhead costs; selling, general and administrative expenses; capital investment, business investment including M&As; and repayment of interest-bearing debt related to manufacturing and sales. The Group meets such needs for capital mainly from operating cash flows and by borrowing from financial institutions.
The Group formulates a financial plan based on the annual business plan, and manages liquidity risks by ensuring an appropriate balance between direct and indirect financing and between short-term and long-term financing to prepare for these risks, while considering business expansion and enhancement of the financial position. The Group registered for the issuance of up to 50 billion yen in corporate bonds. In the current fiscal year under review, we will issue a total of 35 billion yen in unsecured corporate bonds to further diversify our methods for raising capital.
We are also introducing a cash management system for the purpose of efficient use of capital, and are seeking to centralize capital procurement and management within the Group.
Significant Accounting Policies
The Group’s consolidated financial statements are prepared in accordance with IFRS. In preparing these statements, we make accounting estimates based on reasonable criteria for necessary matters.
The significant accounting policies, accounting estimates, and assumptions used in the estimates adopted in the Group’s consolidated financial statements are described in “V. Financial Information, 1. Consolidated Financial Statements, etc., A. Consolidated Financial Statements Note 4 ‘Significant Accounting Policies’ and Note 6 ‘Significant Accounting Estimates and Assumptions for Estimates” in the securities report published in Japanese.
MANAGEMENT’S DISCUSSION AND ANALYSIS
5JSR Corporation Annual Report 2021

MANAGEMENT’S DISCUSSION AND ANALYSIS
Basic Policy on Profit Allocation and Dividends for the Fiscal Year ended March 31, 2021 and the Fiscal Year ending March 31, 2022
With respect to profit appropriation, the Company regards business growth over the long term as its top priority. To generate sustainable long-term growth, JSR strives to increase its competitiveness by developing new businesses through the reinforcement of research and development activities.
The Company determines returns to shareholders by taking into account business performance and medium-term and long-term demand for funds, while giving consideration to a balance between returning profits to shareholders and retaining earnings necessary for future business advancement.
Over the period of the management policy up to the FY ending March 2025, we intend to maintain an overall return ratio of about 50%, taking into consideration business continuity and stability and the flexible buyback of shares. The Company’s policy is to pay an interim and year-end dividend. The decision-making bodies that determine dividend payments is the General Meeting of Shareholders for year-end dividends and the Board of Directors for interim dividends.
Based on this policy, the interim dividend for the fiscal year under consideration was set at 30 yen per share. As previously announced, the year-end dividend was also set at 30 yen per share, yielding a combined annual dividend of 60 yen per share.
Moreover, the Articles of Incorporation stipulate that the Company may distribute dividends pursuant to Paragraph 5, Article 454 of the Companies Act; a resolution to distribute an interim dividend for the FY ended March 2021 was made by the Board of Directors on October 27, 2020.
Risk Information
JSR Group believes that preventing a major crisis from occurring and minimizing the impacts on business activities should such a crisis occur is an important management role. Risks related to business strategy are managed by means of deliberation and resolution at important meetings such as the Board of Directors. JSR Group is exposed to the following risks that may impact on operating results, financial position, cash flows, and other aspects of its business performance.
To manage risks associated with business operations, the Group has formulated Risk Management Policies and established a Risk Management Committee. Since the FY ended March 2010, we have operated our own risk management system, and under the direction of the Risk Management Committee, regularly identify risks in all departments in Japan and overseas, including Group companies. We have identified risks using a risk map which shows degree of impact on management and frequency of occurrence. Risks that may significantly impact business continuity are positioned as JSR
Group Significant Risks, of which management is directly cognizant. By monitoring risks and regularly reviewing them, the Group is working to construct and maintain a system for prevention and crisis preparedness.
Forward-looking statements are based on the Group’s judgments as of March 31, 2021, and the Group’s business and other risks are not limited to the following matters.
(1) Changes in Demand due to Economic TrendsMajor industries in which JSR Group’s products are sold, such as automobiles and electronics, may be influenced by the economic climate in countries or regions. An economic slowdown could reduce demand in these industries and adversely affect JSR Group’s operating results.
(2) Fluctuation in Prices for Crude Oil, Naphtha and Other Major Raw Materials
Fluctuations in prices for crude oil and naphtha, or changes in market conditions for other major raw materials, could change procurement prices of raw materials or market conditions for products and adversely affect JSR Group’s operating results, especially in the Elastomers Business and Plastics Business.
(3) Development of New ProductsLarge, unforeseen changes in the industry or market could prevent the timely development of new products and adversely affect JSR Group’s operating results.
(4) R&D Involving Next-Stage Growth BusinessesJSR Group actively invests in R&D to create next-stage growth businesses. However, there is no guarantee that all R&D activities will yield worthwhile results. Depending on R&D results, there could be an adverse effect on JSR Group’s operating results.
(5) Protection of Intellectual PropertyDisputes over intellectual property with other companies could arise or infringements on JSR’s intellectual property by other companies could occur.
(6) Product Quality Assurance and Product LiabilityDamage or injury caused by a product manufactured by JSR Group could adversely affect JSR Group’s operating results.
(7) Procurement of Raw MaterialsAn interruption in the supply of raw materials due to an accident at a raw materials manufacturer or a supply stoppage due to quality issues or bankruptcy could hinder production activities and adversely affect JSR Group’s operating results.
6JSR Corporation Annual Report 2021

(8) Natural Disasters and AccidentsConstraints on economic activity caused by prolonged COVID-19 infections or a major natural disaster or accident at a manufacturing facility that damages the manufacturing facility or disrupts production could adversely affect JSR Group’s operating results.
(9) Environmental IssuesIn the event that a spill of any type of chemical occurs or that environmental regulations become more stringent, the Group’s business activities could be constrained, the Group may have to pay compensation and other costs, or the Group may have to make new substantial capital expenditures. Any of these events could adversely affect JSR Group’s operating results.
(10) Laws and RegulationsIn the countries where it operates, JSR Group is subject to various laws and regulations involving business and investment permits, import and export activities, trade, labor relations, intellectual property, taxes, foreign exchange, and other matters. In the event that a law or regulation is violated, or a law or regulation becomes stricter or is significantly altered, there could be limitations to the Group’s business activities or additional compliance costs. Any of these events could adversely affect JSR Group’s operating results.
(11) Fluctuation in Exchange RatesJSR Group is susceptible to the effects of exchange rate fluctuations. Operating results of consolidated subsidiaries and equity-method affiliates located in other countries are converted into Japanese yen amounts for the purposes of preparing consolidated financial statements. Accordingly, yen appreciation could adversely affect JSR Group’s operating results.
(12) Overseas OperationsOverseas operations are exposed to a number of risks that include, but are not limited to, an unfavorable political environment or economic trends; labor disputes and other problems due to differences in labor laws and other working conditions; difficulty in recruiting and retaining employees; an adverse impact on business activities due to inadequate social infrastructure; and the impact of wars, terrorism, and other social instability. Any of these events could adversely affect JSR Group’s operating results.
(13) LitigationJSR Group may be sued or be involved in other litigation concerning a dispute with a supplier, customer, or other external party. The outcome of significant litigation could adversely affect JSR Group’s operating results.
MANAGEMENT’S DISCUSSION AND ANALYSIS
7JSR Corporation Annual Report 2021

8JSR Corporation Annual Report 2021
CONSOLIDATED FINANCIAL STATEMENTS
Financial Section
1. Preparation Policy of the Consolidated Financial Statements
The consolidated financial statements of the Company are prepared in accordance with International Financial Reporting Standards (hereinafter “IFRS”) pursuant to the provisions of Article 93 of the Regulation on Terminology, Forms and Preparation Methods of Consolidated Financial Statements (Ministry of Finance Order No. 28 of 1976; hereinafter the “Regulation on Consolidated Financial Statements”).
2. Audit Certification
In accordance with the provisions of Article 193-2, paragraph 1 of the Financial Instruments and Exchange Act of Japan, the consolidated financial statements for the fiscal year ended March 31, 2021 were audited by KPMG AZSA LLC.
3. Special Efforts to Ensure the Appropriateness of Consolidated Financial Statements, etc., and Development of a System for Fair Preparation of Consolidated Financial Statements, etc., in Accordance with IFRS
(1) The Company has implemented special efforts to ensure the appropriateness of consolidated financial statements, etc., Specifically, the Company has become a member of the Financial Accounting Standards Foundation and obtains information including the latest accounting standards in order to develop a system that enables it to properly understand the contents of accounting standards, etc., or respond appropriately to changes in accounting standards, etc. In addition, the Company’s staff members have attended seminars, lectures and other events held by the Accounting Standards Board of Japan.
(2) For the adoption of IFRS, the Company keeps up with the latest accounting standards by obtaining press releases and standards published by the International Accounting Standards Board as needed. To prepare appropriate consolidated financial statements under IFRS, the Company has developed accounting policies, etc., of the Group in accordance with IFRS and performs accounting procedures based on these policies.

9JSR Corporation Annual Report 2021
JSR Corporation and Consolidated SubsidiariesYears ended March 31, 2020 and 2021
CONSOLIDATED STATEMENT OF FINANCIAL POSITION
Millions of yen Thousands of U.S. dollars
Note As of March 31, 2020 As of March 31, 2021 As of March 31, 2021
Assets
Current assets
Cash and cash equivalents 9 ¥ 61,931 ¥ 85,377 $ 771,173
Trade and other receivables 10, 35 110,506 125,292 1,131,712
Inventories 12 112,840 104,862 947,180
Other financial assets 11, 35 4,064 1,933 17,461
Other current assets 14 11,487 11,815 106,718
Subtotal 300,829 329,279 2,974,245
Assets associated with disposal group classified as held for sale 13 2,646 — —
Total current assets 303,475 329,279 2,974,245
Non-current assets
Property, plant and equipment 15, 16, 18 215,664 170,428 1,539,406
Goodwill 17, 18 58,283 58,633 529,611
Other intangible assets 17, 18 15,891 15,014 135,615
Investments accounted for using equity method 19 25,385 21,015 189,820
Retirement benefit asset 23 2,560 4,905 44,303
Other financial assets 11, 35 44,656 49,751 449,383
Other non-current assets 14 2,469 3,598 32,499
Deferred tax assets 20 9,331 20,150 182,009
Total non-current assets 374,238 343,494 3,102,645
Total assets 677,713 672,773 6,076,891
Liabilities and equity
Liabilities
Current liabilities
Trade and other payables 22, 35 92,839 100,797 910,460
Contract liabilities 8,489 9,368 84,614
Borrowings 21, 35 30,043 37,872 342,080
Income taxes payable 1,757 4,866 43,957
Provisions 24 — 1,837 16,594
Other financial liabilities 21, 35 3,138 3,874 34,990
Other current liabilities 25 9,486 10,196 92,097
Subtotal 145,752 168,810 1,524,790
Liabilities associated with disposal group classified as held for sale 13 2,646 — —
Total current liabilities 148,398 168,810 1,524,790
Non-current liabilities
Contract liabilities — 7,861 71,002
Bonds and borrowings 21, 35 52,684 81,406 735,304
Retirement benefit liability 23 16,216 16,434 174,458
Other financial liabilities 21, 35 16,198 19,314 46,392
Other non-current liabilities 25 3,667 5,136 148,438
Deferred tax liabilities 20 3,139 3,077 27,790
Total non-current liabilities 91,903 133,227 1,203,383
Total liabilities 240,301 302,036 2,728,174
Equity
Equity attributable to owners of parent
Share capital 26 23,370 23,370 211,095
Capital surplus 26 18,242 11,562 104,438
Retained earnings 26 369,102 302,916 2,736,120
Treasury shares 26 (19,547) (19,202) (173,442)
Other components of equity 26 5,626 15,348 138,634
Total equity attributable to owners of parent 396,793 333,995 3,016,846
Non-controlling interests 40,619 36,741 331,871
Total equity 437,412 370,736 3,348,717
Total liabilities and equity ¥677,713 ¥672,773 $6,076,891
See accompanying notes.

10JSR Corporation Annual Report 2021
JSR Corporation and Consolidated SubsidiariesYears ended March 31, 2020 and 2021
CONSOLIDATED STATEMENT OF PROFIT OR LOSS
Millions of yen Thousands of U.S. dollars
Note Fiscal year ended March 31, 2020
Fiscal year ended March 31, 2021
Fiscal year ended March 31, 2021
Continuing operations
Revenue 7, 28 ¥ 471,967 ¥ 446,609 $ 4,034,041
Cost of sales (331,228) (313,200) (2,829,015)
Gross profit 140,739 133,408 1,205,026
Selling, general and administrative expenses 29 (104,343) (105,117) (949,481)
Other operating income 30 1,304 1,790 16,172
Other operating expenses 18, 30 (4,879) (87,584) (791,108)
Share of profit (loss) of investments accounted for using equity method 64 (4,132) (37,319)
Operating profit (loss) 7 32,884 (61,633) (556,711)
Finance income 7, 31 1,929 947 8,552
Finance costs 7, 31 (2,184) (1,743) (15,748)
Profit (loss) before tax 7 32,629 (62,430) (563,906)
Income tax expenses 20 (6,859) 7,900 71,357
Profit (loss) from continuing operations 25,770 (54,530) (492,549)
Discontinued operations
Profit from discontinued operations 13 252 — —
Profit (loss) for the period ¥ 26,022 ¥ (54,530) $ (492,549)
Profit (loss) attributable to:
Owners of parent 22,604 (55,155) (498,197)
Non-controlling interests 3,418 625 5,648
Total ¥ 26,022 ¥ (54,530) $ (492,549)
Yen U.S. dollars
Note Fiscal year ended March 31, 2020
Fiscal year ended March 31, 2021
Fiscal year ended March 31, 2021
Earnings (loss) per share
Basic earnings (loss) per share ¥104.38 ¥(256.73) $(2.32)
Continuing operations 33 103.22 (256.73) (2.32)
Discontinued operations 33 1.16 — —
Diluted earnings (loss) per share 104.19 (256.73) (2.32)
Continuing operations 33 103.03 (256.73) (2.32)
Discontinued operations 33 1.16 — —
See accompanying notes.

11JSR Corporation Annual Report 2021
JSR Corporation and Consolidated SubsidiariesYears ended March 31, 2020 and 2021
CONSOLIDATED STATEMENT OF COMPREHENSIVE INCOME
Millions of yen Thousands of U.S. dollars
Note Fiscal year ended March 31, 2020
Fiscal year ended March 31, 2021
Fiscal year ended March 31, 2021
Profit (loss) ¥26,022 ¥(54,530) $(492,549)
Other comprehensive income
Items that will not be reclassified to profit or loss
Net change in financial assets measured at fair value through other comprehensive income 32 (1,377) 5,101 46,076
Remeasurements of defined benefit plans 32 661 1,438 12,986
Share of other comprehensive income of investments accounted for using equity method 32 (31) 68 615
Items that may be reclassified to profit or loss
Net change in fair value of cash flow hedges 32 (124) 28 251
Exchange differences on translation of foreign operations 32 (4,111) 6,167 55,709
Share of other comprehensive income of investments accounted for using equity method 32 (904) 65 585
Total other comprehensive income, net of tax (5,886) 12,867 116,222
Total comprehensive income 20,136 (41,663) (376,327)
Comprehensive income attributable to:
Owners of parent 17,486 (43,458) (392,542)
Non-controlling interests 2,650 1,795 16,214
Total ¥20,136 ¥(41,663) $(376,327)
See accompanying notes.

12JSR Corporation Annual Report 2021
JSR Corporation and Consolidated SubsidiariesYears ended March 31, 2020 and 2021
CONSOLIDATED STATEMENT OF CHANGES IN EQUITY
Fiscal year ended March 31, 2020 Millions of yen
Note
Equity attributable to owners of parentNon-
controlling interests
TotalequityShare
capitalCapital surplus
Retained earnings
Treasury shares
Other components
of equityTotal
Balance at April 1, 2019 ¥23,370 ¥18,436 ¥351,476 ¥(10,042) ¥18,758 ¥401,998 ¥38,361 ¥440,360
Effect of changes in accounting policies 133 133 133
Restated balance at April 1, 2019 23,370 18,436 351,609 (10,042) 18,758 402,131 38,361 440,493
Profit 22,604 22,604 3,418 26,022
Other comprehensive income (5,118) (5,118) (768) (5,886)
Total comprehensive income — — 22,604 — (5,118) 17,486 2,650 20,136
Share-based remuneration transactions (174) 292 (47) 71 71
Dividends 27 (13,054) (13,054) (1,453) (14,507)
Changes in treasury shares (31) (9,798) (9,829) (9,829)
Transfer from other components of equity to retained earnings 7,968 (7,968) — —
Changes by sale of shares of subsidiaries — (361) (361)
Changes in equity due to capital increase of subsidiary — 1,422 1,422
Other movements 10 (24) (13) (13)
Total transactions with owners, etc. — (194) (5,110) (9,506) (8,014) (22,825) (392) (23,217)
Balance at March 31, 2020 ¥23,370 ¥18,242 ¥369,102 ¥(19,547) ¥ 5,626 ¥396,793 ¥40,619 ¥437,412
Fiscal year ended March 31, 2021 Millions of yen
Note
Equity attributable to owners of parentNon-
controlling interests
TotalequityShare
capitalCapital surplus
Retained earnings
Treasury shares
Other components
of equityTotal
Balance at April 1, 2020 ¥23,370 ¥18,242 ¥369,102 ¥(19,547) ¥ 5,626 ¥396,793 ¥40,619 ¥437,412
Profit (loss) (55,155) (55,155) 625 (54,530)
Other comprehensive income 11,697 11,697 1,170 12,867
Total comprehensive income — — (55,155) — 11,697 (43,458) 1,795 (41,663)
Share-based remuneration transactions (6) 266 (9) 251 251
Dividends 27 (12,888) (12,888) (479) (13,368)
Changes in treasury shares (18) 80 62 62
Transfer from other components of equity to retained earnings 2,399 (2,399) — —
Changes in non-controling interests (6,656) (27) (6,682) (5,198) (11,881)
Other movements (541) 460 (82) 5 (77)
Total transactions with owners, etc. — (6,679) (11,031) 346 (1,975) (19,339) (5,673) (25,012)
Balance at March 31, 2021 ¥23,370 ¥11,562 ¥302,916 ¥(19,202) ¥15,348 ¥333,995 ¥36,741 ¥370,736
Fiscal year ended March 31, 2021 Thousands of U.S. dollars
Note
Equity attributable to owners of parentNon-
controlling interests
TotalequityShare
capitalCapital surplus
Retained earnings
Treasury shares
Other components
of equityTotal
Balance at April 1, 2020 $211,095 $164,768 $3,333,957 $(176,564) $ 50,816 $3,584,073 $366,897 $3,950,970
Profit (loss) (498,197) (498,197) 5,648 (492,549)
Other comprehensive income 105,655 105,655 10,566 116,222
Total comprehensive income — — (498,197) — 105,655 (392,542) 16,214 (376,327)
Share-based remuneration transactions (53) 2,400 (80) 2,267 2,267
Dividends 27 (116,416) (116,416) (4,328) (120,744)
Changes in treasury shares (160) 722 562 (1) 561
Transfer from other components of equity to retained earnings 21,665 (21,665) — —
Changes in non-controling interests (60,117) (243) (60,360) (46,954) (107,315)
Other movements (4,889) 4,151 (738) 43 (695)
Total transactions with owners, etc. (60,330) (99,640) 3,122 (17,837) (174,685) (51,240) (225,926)
Balance at March 31, 2021 $211,095 $104,438 $2,736,120 $(173,442) $138,634 $3,016,846 $331,871 $3,348,717
See accompanying notes.

13JSR Corporation Annual Report 2021
JSR Corporation and Consolidated SubsidiariesYears ended March 31, 2020 and 2021
CONSOLIDATED STATEMENT OF CASH FLOWS
Millions of yen Thousands of U.S. dollars
Note Fiscal year ended March 31, 2020
Fiscal year ended March 31, 2021
Fiscal year ended March 31, 2021
Cash flows from operating activities
Profit (loss) before tax ¥ 32,629 ¥(62,430) $(563,906)
Loss before tax from discontinued operations 13 (3,208) — 0
Depreciation and amortization 26,359 29,477 266,254
Interest and dividend income (1,369) (903) (8,153)
Interest expenses 1,825 1,743 15,744
Share of loss (profit) of investments accounted for using equity method (64) 4,132 37,319
Impairment loss 18 1,801 79,575 718,771
Decrease (increase) in trade and other receivables 23,317 (13,009) (117,502)
Decrease (increase) in inventories 1,446 9,807 88,586
Increase (decrease) in trade and other payables (27,721) 11,772 106,336
Other 11,912 15,001 135,501
Dividends received 1,591 1,076 9,720
Interest received 216 201 1,812
Interest paid (1,732) (1,605) (14,496)
Income taxes refund — 958 8,653
Income taxes paid (12,773) (5,393) (48,712)
Net cash provided by (used in) operating activities 54,228 70,403 635,927
Cash flows from investing activities
Net decrease (increase) in time deposits 1,036 2,145 19,371
Purchase of property, plant and equipment (43,951) (55,205) (498,647)
Proceeds from sale of property, plant and equipment 913 284 2,565
Purchase of investments (4,426) (1,606) (14,510)
Proceeds from sale of investments 15,449 2,016 18,210
Payments for sale of shares of subsidiaries resulting in change in scope of consolidation (749) — —
Proceeds from sales of shares of subsidiaries resulting in change in scope of consolidation — 498 4,503
Purchase of shares in associates (1,928) — —
Payments for loans receivable (1,441) (567) (5,123)
Collection of loans receivable 309 627 5,666
Other (804) (878) (7,934)
Net cash provided by (used in) investing activities (35,592) (52,687) (475,897)
Cash flows from financing activities
Net increase (decrease) in short-term borrowings 21 2,547 (2,424) (21,892)
Repayments of long-term borrowings 21 (7,839) (11,428) (103,224)
Proceeds from long-term borrowings 21 5,846 11,320 102,252
Proceeds from issuance of bonds — 34,836 314,656
Payments for purchase of treasury shares (10,002) (3) (27)
Dividends paid 27 (13,052) (12,887) (116,404)
Dividends paid to non-controlling interests (1,453) (464) (4,190)
Capital contribution from non-controlling interests 1,422 — —
Purchase of shares of subsidiaries not resulting in change in scope of consolidation — (11,717) (105,836)
Repayments of lease liabilities 21 (3,025) (3,264) (29,479)
Other 292 327 2,957
Net cash provided by (used in) financing activities (25,264) 4,297 38,812
Effect of exchange rate changes on cash and cash equivalents (1,049) 1,432 12,931
Net increase (decrease) in cash and cash equivalents (7,677) 23,445 211,773
Cash and cash equivalents at beginning of period 70,785 61,931 559,401
Cash and cash equivalents included in assets associated with disposal groups classified as held for sale 13 (1,176) — —
Cash and cash equivalents at end of period 9 ¥ 61,931 ¥ 85,377 $ 771,173
See accompanying notes.

14JSR Corporation Annual Report 2021
JSR Corporation and Consolidated SubsidiariesYears ended March 31, 2020 and 2021
NOTES OF CONSOLIDATED FINANCIAL STATEMENTS
(1) Reporting Entity
JSR Corporation (the “Company”) is incorporated in Japan. The consolidated financial statements comprise the financial statements of the Company and its subsidiaries (collectively, the “Group”) together with the Group’s attributable share of the results of associates and joint ventures. The Group is primarily
(2) Basis of Preparation
1) Compliance with Accounting Standards
The Group meets the requirements of a “specified company” set forth in Article 1-2 of the “Ordinance on Consolidated Financial Statements.” Accordingly, the Group prepares consolidated financial statements in accordance with IFRS pursuant to the provisions of Article 93 of the said Ordinance.
2) Basis for Measurement
The Group’s consolidated financial statements, with the exception of assets pertaining to post-employment benefit plans, financial instruments measured at fair value, etc., stated on “(4) Significant Accounting Policies,” are prepared on a historical cost model.
3) Presentation Currency and Units
The Group’s consolidated financial statements are presented in Japanese yen, the currency of the primary economic
engaged in the Digital Solutions Business, the Life Sciences Business, the Elastomers Business and the Plastics Business as well as businesses related to these. The products of these businesses are wide ranging. See the note “(7) Segment Information” for further details.
environment in which the Company performs business activities (the “functional currency”), with amounts rounded to the nearest million yen. The translation of the amounts in Japanese yen into US dollars is included solely for the convenience of readers outside Japan, using the prevailing exchange rate on March 31, 2021, which was ¥110.71 to $1.00. The amounts translated should not be construed as representations that the amounts in Japanese yen have been, could have been, or could in the future be, converted into US dollars at this or any other rates of exchange.
4) Authorization of Consolidated Financial Statements
The consolidated financial statements have been authorized by Nobuo Kawahashi, the Company’s representative director and president and COO, and Hideki Miyazaki, the Company’s CFO, on June 17, 2021.
(3) Explanation of New Standards and Interpretations Not Applied
The major new or revised standards and interpretations published prior to the date of authorization of the consolidated
(4) Significant Accounting Policies
The significant accounting policies that have been applied to the consolidated financial statements are as follows and are
1) Basis of Consolidation
(i) Subsidiaries
Subsidiaries refer to all entities controlled by the Group. The Group is deemed to have control over an entity if it has exposure or rights to variable returns from its involvement in the entity and has the ability to use its power over an entity to affect such returns. The financial statements of subsidiaries are included in the Group’s consolidated financial statements from the date the Company gains control until the date it loses control of the subsidiary. In cases where the accounting policies applied by a subsidiary are different from those applied by the Group,
identical to those applied to all periods stated in the consolidated financial statements.
adjustments are made to the subsidiary’s financial statements, if necessary. All intergroup balances of payables and receivables, internal transactions and unrealized gains or losses arising from transactions within the Group are eliminated in preparing the consolidated financial statements. When the Company retains control when there has been partial disposal of ownership interest in a subsidiary, the partial disposal is accounted for as an equity transaction. Any difference between the amount by which the non-controlling interests are adjusted and the fair value of the consideration paid or received is recognized directly in equity attributable to Owners of the parent company.
financial statements have no significant impact.

15JSR Corporation Annual Report 2021
NOTES OF CONSOLIDATED FINANCIAL STATEMENTS
If the Company loses control over the subsidiary, gains or losses derived from such loss are recognized as profit or loss. When the fiscal year-end of a subsidiary is different from the end of the reporting period of the Group, the Company uses financial statements of the subsidiary based on the provisional accounting as of the end of the reporting period of the Group.(ii) Associates
Associates are entities over which the Group has significant influence but does not have control over the financial and operating policies. The equity method is applied to all associates from the date on which the Group acquires significant influence to the date on which it loses the significant influence. Goodwill recognized on acquisition (less accumulated impairment losses) is included in investments in associates. In cases where the accounting policies applied by an associate are different from those applied by the Group, adjustments are made to the associate’s financial statements, if necessary.(iii) Joint Ventures
A joint venture is an entity jointly controlled by two or more parties including the Group under the contractually agreed sharing of control over economic activities of the joint venture, which exists only when decisions for strategic financial and operating decisions related to relevant activities require unanimous consent of the parties sharing control. Joint ventures of the Group are accounted for using the equity method. In cases where the accounting policies applied by a joint venture are different from those applied by the Group, adjustments are made to the joint venture’s financial statements, if necessary.
2) Business Combinations
The Group takes in account business combinations using the acquisition method. The aggregate of the consideration paid for a business combination measured at fair value on the acquisition date and the amount of non-controlling interests in the acquired entity are taken as the acquisition costs based on the acquisition method. Non-controlling interests are measured at equivalent amount for the fair price of the acquired entity’s identifiable net assets and liabilities in proportion to the share of the non-controlling interest. Ancillary costs incurred relating to business combination such as brokerage fees, attorney’s fees, due diligence costs, other professional fees, consulting fees, as well as other acquisition-related costs are recognized as expenses in the periods in which such costs are incurred.
If the initial accounting for the business combination has not been completed by the closing date of the reporting period in which the business combination took place, such incomplete items are measured at provisional amounts based on the best estimate. If the new information obtained during the measurement period, which lasts for a year from the acquisition date, affects the measurement of the amount recognized on the acquisition date, the provisional amount recognized on the acquisition date is retrospectively revised. In the event that the aggregate amount of fair value of the consideration paid in relation to the business combination, the amount of non-controlling interests in the acquired entity, and the fair value of equity interests on the control commencement date in the acquired entity previously held by the acquiring entity exceeds the net value of identifiable assets and liabilities at the acquisition date, the excess amount is recognized as goodwill. If, on the other hand, such aggregate amount does not exceed the net value of identifiable assets and liabilities at the acquisition date, the difference is recognized in profit or loss. Additional acquisitions of non-controlling interests after the controlling acquisition are accounted for as capital transactions and are not recognized as goodwill from the original transaction.
3) Foreign Currency Translation
(i) Functional Currency and Presentation Currency
The Group’s consolidated financial statements are presented in Japanese yen, which is the Company’s functional currency. The Group’s foreign operations generally use the local currency as their functional currency, but if any currency other than the local currency is primarily used in the economic environment in which the entity operates, such currency is used as the entity’s functional currency.(ii) Foreign Currency Transactions
Foreign currency transactions, meaning transactions conducted in a currency other than the respective entity’s functional currency, are translated into the functional currency either by using the exchange rates prevailing at the date of the transaction or using an average rate when there are no material fluctuations in exchange rates. Monetary assets and liabilities denominated in foreign currencies are translated into the functional currency at the exchange rates prevailing at the reporting date, and exchange differences are recognized in profit or loss in principle.(iii) Foreign Operations
The assets and liabilities (including goodwill arising from acquisitions and adjustments of fair value) of foreign operations that use a currency other than Japanese yen as their functional

16JSR Corporation Annual Report 2021
NOTES OF CONSOLIDATED FINANCIAL STATEMENTS
currency are translated into Japanese yen at the exchange rates prevailing at the reporting date. The revenues and expenses of foreign operations are translated into Japanese yen at the average rates of exchange over the reporting period, unless there are material fluctuations in exchange rates. Exchange differences arising from such translations in foreign operations’ financial statements are recognized in other comprehensive income, and are included and accounted for in other components of equity.
4) Cash and Cash Equivalents
Cash and cash equivalents comprise cash in hand, deposits that can be withdrawn as needed, and short-term investments that are easily converted into cash with minimal risk of changes in value.
5) Inventories
Inventories are measured at the lower of cost or net realizable value. Cost of inventories is calculated based on the weighted-average cost formula. Net realizable value is the estimated selling price of inventories in the ordinary course of business, less the estimated costs of completion and estimated selling expenses. Inventories and work in process manufactured by the Company include the amounts of manufacturing overhead appropriately allocated based on the ordinary operating rate.
6) Property, Plant and Equipment (Excluding Right-of-use Assets)
The cost model has been adopted, and all property, plant and equipment are measured at cost less any accumulated depreciation and accumulated impairment losses. Cost includes costs directly attributable to the acquisition of the assets, and the present value of the estimated costs of removal of the assets and site restoration. Furthermore, borrowing costs that satisfy certain conditions directly attributable to the acquisition, construction, etc., of the assets are recognized as part of the cost of the assets. Depreciation expenses are recognized using the straight-line method over the estimated useful life of each asset to depreciate the cost less the residual value of the asset. The estimated useful lives, residual values, and depreciation methods are reviewed at the end of the reporting period. In the event of the modification in estimates, impacts therefrom are recognized in the accounting period in which the estimates were modified and in the future accounting periods.
The estimated useful lives of major assets are as follows: • Buildings and structures: 10 to 50 years • Machinery, equipment, and vehicles: 5 to 25 years • Tools, furniture, and fixtures: 3 to 10 years
7) Intangible Assets
(i) R&D Expenses
Research-related expenditures are recognized as expenses when they are incurred. Development-related expenditures are capitalized as intangible assets only when all of the following conditions are satisfied: the amount for such expenditures can be reliably measured; the products or the processes to be developed therefrom are technically and commercially viable; there is a high probability of generating future economic benefits; and the Group intends to complete the development and use the process or the products therefrom as well as sufficient resources to make them feasible. All other expenditures are recognized as expenses when they are incurred.(ii) Goodwill
The measurement of goodwill at initial recognition is stated in “2) Business combinations.” The Group does not amortize goodwill, but tests for impairment every fiscal year. Impairment of goodwill is stated in “8) Impairment of non-financial assets.” Impairment losses of goodwill are recognized as profit or loss and not reversed subsequently. After the initial recognition, goodwill is presented at cost less accumulated impairment losses.(iii) Intangible Assets Acquired as a Result of a Business
Combination
Cost of intangible assets acquired as a result of a business combination is measured at fair value on the acquisition date. Intangible assets acquired as a result of a business combination are accounted after initial recognition at cost less any accumulated amortization and accumulated impairment losses, which are amortized using the straight-line method over the estimated useful life of each asset. The estimated useful life of major assets is as follows: • Technology-based intangible assets: 5 years(iv) Intangible Assets Acquired Individually
Other intangible assets acquired individually inclusive of software, etc., are accounted at cost less any accumulated amortization and accumulated impairment losses, which are amortized using the straight-line method over the estimated useful life of each asset. The estimated useful life of a major asset is as follows: • Software: 5 years
8) Impairment of Non-financial Assets
The Group assesses its non-financial assets, excluding inventories and deferred tax assets at the end of each reporting period to identify any indications of a potential inability to recover the carrying amount due to changes in such assets or circumstances. If any such indication exists, impairment testing is conducted.

17JSR Corporation Annual Report 2021
NOTES OF CONSOLIDATED FINANCIAL STATEMENTS
If the carrying amount of an asset exceeds its recoverable amount, the difference is recognized as impairment loss. The recoverable amount of an asset is the higher of the fair value less costs of disposal and the value in use. In calculating the value in use, the estimated future cash flows from the asset are discounted to the present value using a discount rate that reflects the time value of money and the inherent risks of the asset. For the purposes of determining impairment, assets are grouped into an individual asset or the smallest asset group (cash-generating unit) generating cash inflows that are largely independent of the cash flows of other assets. Goodwill is tested for impairment once a year periodically, regardless of whether any indications of impairment exist, and the cost at the time of acquisition less any accumulated impairment losses is recognized as the carrying amount. In the case of property, plant and equipment and intangible assets, excluding goodwill, for which impairment losses have been recognized in prior years, an assessment is conducted at the end of each reporting period to determine if there are any possibilities of reversal of such impairment losses.
9) Financial Instruments
(9.1) Financial Assets(i) Initial Recognition and Measurement
The Group initially recognizes financial assets on the date when it becomes a party to the contract on the financial instruments concerned. Financial assets bought or sold by ordinary methods are initially recognized on the transaction date. Financial assets are subsequently classified into those measured at amortized cost or those measured at fair value. Financial assets measured at fair value through profit or loss are initially measured at fair value. Financial assets measured at fair value through other comprehensive income and financial assets measured at amortized cost are initially measured at fair value plus transaction costs that are directly attributable to the acquisition of the financial asset. Additionally, trade receivables that do not include significant financing components are initially measured at the transaction price. (a) Financial assets measured at amortized cost
Financial assets are classified as those measured at amortized cost only when both of the following conditions are satisfied; the asset is held within a business model whose objective is to hold assets in order to collect contractual cash flows; and the contractual terms of the financial asset give rise on specified dates to cash flows that are solely payments of principal and interest on the principal amount outstanding.
(b) Financial assets measured at fair valueFinancial assets are classified as those measured at fair value if they fail to meet either of the two requirements given above.
Of these assets, financial assets that generate, on specified dates, cash flows that are solely payments of principal and interest on the principal amount outstanding and are held within a business model whose objective is achieved both by collecting contractual cash flows and by selling the assets are classified as debt financial assets measured at fair value through other comprehensive income. Moreover, for certain equity financial assets, the Group has made an irrevocable election to present subsequent changes in fair value in other comprehensive income and to classify these assets as equity financial assets measured at fair value through other comprehensive income. Financial assets such as derivative assets, other than the above assets, are classified as financial assets measured at fair value through profit or loss.
(ii) Subsequent Measurement
After initial recognition, financial assets are measured according to their classification as follows: (a) Financial assets measured at amortized cost
Measured at amortized cost using the effective interest method
(b) Financial assets measured at fair valueMeasured at fair value on the reporting date Any changes in the fair value of financial assets are recognized in profit or loss or in other comprehensive income according to their respective classification of the financial asset. Dividends received from designated equity instruments measured at fair value through other comprehensive income are recognized in profit or loss. If the fair value of the equity instrument depreciates materially or if the equity instrument is disposed of, any accumulated other comprehensive income or loss is reclassified to retained earnings.
(iii) Derecognition
Financial assets are derecognized when the contractual rights to the cash flows from the investment expire or when the contractual rights to the cash flows from the investment are assigned and substantially all the risks and rewards of the Group’s ownership of such financial assets are transferred.
(9.2) Financial Liabilities (i) Initial Recognition and Measurement
The Group initially recognizes financial liabilities on the contract date. Financial liabilities are initially measured at fair value less transaction costs that are directly attributable to the acquisition of the financial liability.

18JSR Corporation Annual Report 2021
NOTES OF CONSOLIDATED FINANCIAL STATEMENTS
(ii) Subsequent Measurement
After initial recognition, financial liabilities are measured according to their classification as follows: (a) Financial liabilities measured at amortized cost
Measured at amortized cost using the effective interest method
(b) Financial liabilities measured at fair value through profit or lossFinancial liabilities measured at fair value through profit or loss, which include those designated financial liabilities measured at fair value through profit or loss, are measured at fair value.
(iii) Derecognition
Financial liabilities are derecognized when contractual obligations are discharged, cancelled, or expired.
(9.3) Offsetting Financial InstrumentsFinancial assets and liabilities are offset if and only if: there is a legally enforceable right to set off the recognized amount of financial assets against the recognized amount of financial liabilities; there is the intent either to settle on a net basis or to realize assets and settle liabilities simultaneously.
10) Impairment of Financial Assets
The Group estimates expected credit losses as of the reporting date for financial assets measured at amortized cost. If the credit risk has not increased materially from initial recognition, the 12-month expected credit loss is recognized as a loss allowance. In the case of trade receivables that do not include significant financial components, however, the loss allowance is always measured at lifetime expected credit loss. If the credit risk has increased materially from initial recognition, the lifetime expected credit loss is recognized as a loss allowance. Judgment as to whether or not a material increase in credit risk has occurred from the initial recognition is based on the degree of changes in default risk. When the Group judges whether or not there are material changes in default risk, it reviews the information on the past due status as well as the following factors: • External credit grades of the financial asset • Internal credit grades • Results of operations of the borrower • Financial assistance from the parent company, etc., of
the borrower Expected credit losses are measured as weighted average of the present value of the difference between all contractual cash flows that are due to the entity in accordance with the contract and all cash flows that the entity expects to receive, weighted by respective risks of default occurring. The Group
treats any financial asset as a credit-impaired financial asset in cases where the financial asset is considered to have defaulted, including cases where the financial asset is significantly past due even after enforcement activities for the performance of obligations are taken and where the debtor files legal proceedings for bankruptcy, corporate reorganization, civil rehabilitation or special liquidation. The Group presents the financial assets measured at amortized cost at the net amount that the loss allowance is deducted from the carrying amount in the consolidated statement of financial position and recognizes the loss as profit or loss. When the Group has no reasonable expectations of recovering all or part of a financial asset, the carrying amount of the asset is directly written off by that amount.
11) Derivatives and Hedge Accounting
Derivatives are initially recognized at fair value at the date on which the derivative contract is entered into and are subsequently remeasured at their fair value at the end of each reporting period after initial recognition. The method of recognizing the resulting gain or loss depends on whether or not the derivative is designated as a hedging instrument, and if so, the nature of the item being hedged. The Group designates certain derivatives as hedging instruments of cash flow hedges (hedges of a particular risk associated with a recognized asset or liability, or a highly probable forecast transaction), and certain foreign currency borrowings as hedging instruments of net investment in foreign operations. The Group documents, at the start of the transaction, the relationship between hedging instruments and hedged items as well as the objectives and strategies for managing risk regarding the execution of their hedging transactions. Furthermore, the Group documents at the start of the hedge, and on a continuing basis, assessments of whether or not the derivatives used in the hedging transaction are effective in offsetting changes in the hedged items’ cash flow. Hedge effectiveness is assessed on a continuing basis, and a hedge is deemed effective when it satisfies all of the following conditions: an economic relationship exists between hedged items and hedging instruments; the effect of credit risk is not such that it materially dominates value changes arising from the economic relationship; and the hedge ratio of the hedging relationship is equivalent to the ratio arising from the volume of hedging instruments and hedged items that are actually being hedged. The effective portions of change in the fair values of derivatives designated as hedging instruments of cash flow hedges and satisfying the conditions thereof are recognized in

19JSR Corporation Annual Report 2021
NOTES OF CONSOLIDATED FINANCIAL STATEMENTS
other comprehensive income. Gains or losses arising from ineffective portions are recognized immediately as profit or loss. Accumulated gains or losses recognized through other comprehensive income are reclassified to profit or loss in the period when the cash flow originating from the hedged items has an effect on profit or loss. When hedge accounting conditions are no longer satisfied due to forfeit, sale, etc., of hedging instruments, hedge accounting will no longer be applied prospectively. When hedged future cash flow is expected to occur again, the accumulated gains or losses recognized in other comprehensive income will continue to be recognized as other components of equity. In cases where forecast transactions are no longer expected to occur, the accumulated gains or losses recognized in other comprehensive income are reclassified immediately to profit or loss. With regard to certain foreign currency borrowings that are retained for the purpose of hedging exposure to exchange rate fluctuation risks for net investments in foreign operations, the portion of foreign exchange differences deemed effective as a hedge is recognized in other comprehensive income as hedges of net investment in foreign operations. Of exchange differences in the hedging instruments, any ineffective portion of the hedge or any portion of the hedge not subject to the assessment of hedge effectiveness is recognized in profit or loss. Through net investment hedges, the cumulative amount of gain or loss recognized in other comprehensive income is reclassified to profit or loss on the disposal of foreign operations.
12) Leases
At inception of a contract, the Group assesses whether the contract is, or contains, a lease based on whether the contract conveys the right to control the use of an identified asset for a period of time in exchange for consideration. The Group elects not to recognize right-of-use assets and lease liabilities for short-term leases within 12 months and leases of low-value assets. Apart from short-term leases or leases of low-value assets, the group records right-of-use assets and lease liabilities in the consolidated statement of profit or loss at the lease commencement date when a contract is, or contains a lease. The lease payments associated with short-term leases and leases of low-value assets are recognized as an expense on a straight-line basis over the lease term. Right-of-use assets are measured under the cost model and are stated at cost less accumulated depreciation and accumulated impairment losses. The cost of right-of-use assets is initially measured based on the initial measurement amount of the lease liability adjusted for any initial direct costs incurred or any lease payments made at
or before the commencement date, plus any costs to restore the underlying asset or the site at which it is located and other related costs required in the lease contract. Right-of-use assets are depreciated over the lease term on a straight-line basis. Right-of-use assets are recorded in property, plant and equipment on the current Consolidated Statement of Financial Position. Lease liability is measured at the present value of unpaid lease payments at the calculated interest rate of the lease or when the calculated interest rate cannot be easily calculated, discounted by the incremental borrowing rate. Generally, the Group uses the incremental borrowing rate as the discount rate. Lease payments are apportioned between finance costs and repayments of lease liability under the effective interest rate method. Finance costs are recognized in the consolidated statement of profit or loss.
13) Employee Benefits
(i) Short-term Employee Benefits
Short-term employee benefits are recognized as an expense in the period in which the employee renders the related service without discounting. Bonus payments are recognized as liabilities in the amount estimated to be paid based on the applicable bonus payment system when there is a legal or constructive obligation to pay and the obligation can be estimated reliably.(ii) Long-Term Employee Benefits
The Group has adopted defined contribution plans and defined benefit plans as post-employment benefit plans for employees. Liabilities (assets) recognized in connection to defined benefit pension plans are calculated at the present value of defined benefit obligations under such plans at the end of the reporting period less the fair value of the plan assets. An independent specialist calculates the defined benefit obligations for each reporting period using the projected unit credit method. Any amount recognized as assets from this calculation is limited to the present value of any future economic benefit available in the form of refunds from the plans or reductions in future contributions to the plans when there is a possibility for the assets to generate these to the Group. Calculations of the present value of economic benefits take into consideration the minimum funding requirement. The present value of defined benefit obligations is calculated by discounting the estimated future cash flows in reference to market yields on high-quality corporate bonds that pay benefits and with maturities similar to the estimated timing of payment of the obligations. Changes due to remeasurements of net defined benefit liabilities (assets) that were recognized in other comprehensive income in the period they occurred are immediately reclassified from other comprehensive income to retained earnings.

20JSR Corporation Annual Report 2021
NOTES OF CONSOLIDATED FINANCIAL STATEMENTS
Defined contribution plans are post-employment benefit plans under which an employer pays fixed contributions to an independent entity and has no legal or constructive obligation to pay further contributions. Contribution obligations under the defined contribution plans are recognized as an expense in the period in which the employee renders the related service.(iii) Termination benefits
The Group pays termination benefits when the Group ends an employee's employment before the normal retirement date, or when the employee accepts an offer of benefits in exchange for the termination of employment. The group recognise a liability and expense for termination benefits at the earlier of the following dates: (a) when the group cannot withdraw the offer of those benefits; and (b) when the group recognises costs for a restructuring that involves the payment of termination benefits.
14) Non-current Assets Held for Sale and Discontinued Operations
A non-current asset or disposal group is classified as held for sale if its carrying amount will be recovered principally through a sale transaction rather than through continued use. The conditions for classifying an asset or disposal group as held for sale are that it must be available for immediate sale in its present condition and the sale must be highly probable. The classification is also limited to when management of the Group is committed to executing the sale plan and the sale is generally expected to complete within one year. After classification as held for sale, an asset or disposal group is measured at the lower of the carrying amount and the fair value less costs to sell, and is not depreciated or amortized. A discontinued operation includes a component of the Group that either has been disposed of or is classified as held for sale, represents a line of business or geographical area of the Group, and is recognized when there is a plan to dispose of that line of business or geographical area.
15) Provisions
Provisions are recognized if the Group has a present legal or constructive obligation as a result of a past event that can be estimated reliably and it is probable that an outflow of resources will be required to settle the obligation. When the time value of money is significant, the estimated future cash flow is discounted by the present value using a before-tax discount rate that reflects the time value of money and inherent risks of the liability. Transfer-backs of the discounted amount over time are recognized as finance costs.
16) Share Capital
The issue price of equity instruments issued by the Company is recognized in share capital and capital surplus, and direct issue costs (net of tax effects) are deducted from capital surplus. On the purchase of treasury shares, costs net of tax effects including direct transaction costs are recognized as an equity deduction. On the sale of treasury shares, including disposal of treasury shares with the exercise of stock options, the balance of disposals is recognized as capital surplus. Common shares are classified to equity.
17) Share-based Remuneration Plans
(i) Stock Options
The Group operated an equity-settled share-based remuneration plan where the Group received services from directors, executive officers, and employees as well as paid equity instruments (options) as consideration thereof until June 2018. The fair value on the date the option was granted under the plan is recognized as an expense over the option’s vesting period and the same amount is recorded as an increase in equity. The plan was terminated in June 2018 (however, of share acquisition rights as share-based stock options that were already granted to directors, etc., those share acquisition rights which have not been exercised will be continued).(ii) Restricted Share-based Remuneration Plan
The Company has adopted the restricted share-based remuneration plan for its directors and others as a performance-linked remuneration plan and applied the accounting treatment for equity-settled share-based plans under this plan. Fair value of the share-based remuneration is determined using the fair value of ordinary shares on the grant date. The fair value is recognized as an expense over the share’s vesting period, and the same amount is recorded as an increase in equity.
18) Revenue Recognition
The Group recognizes revenue by applying the following five steps, apart from interest and dividend income accounted for in accordance with IFRS 9 — Financial Instruments. Step 1: Identify the contract with a customer. Step 2: Identify the performance obligations in the contract. Step 3: Determine the transaction price. Step 4: Allocate the transaction price to performance
obligations. Step 5: Recognize revenue when (or as) the Group satisfies
a performance obligation.

21JSR Corporation Annual Report 2021
NOTES OF CONSOLIDATED FINANCIAL STATEMENTS
In case of sales contracts with customers for products and merchandise, the Group recognizes the sale as revenue when the products and merchandise are delivered to the customer, considering that control of the products and merchandise is transferred to the customer and the performance obligation is fulfilled. For rendering of services, the Group recognizes revenue over time with fulfillment of performance obligation based on the contract between the Group and the customer.
19) Government Grants
Government grants are recognized when there is reasonable assurance that the Group will comply with the conditions attached to the grant and that the grant will be received. Government grants are recognized in profit or loss on a systematic basis over the period the associated costs, which the grant is intended to compensate, are recognized as expenses. For government grants associated with acquiring assets, the amounts of the grants are deducted directly when calculating the carrying amounts of the assets. Grants are recognized in profit or loss over the useful lives of the depreciated assets as changes in depreciation expense.
20) Finance Income and Finance Cost
Finance income comprises interest received, dividends received, etc. Interest received is recognized when it incurred using the effective interest method. Dividends received are recognized when the Group’s rights to receive dividends have been established; there is a high probability that the economic benefits associated with the dividends will flow into the Group; the amounts can be measured reliably. Finance cost comprises interest paid, etc. With respect to an asset that necessarily takes a substantial period of time to get ready for its intended use or sale, borrowing costs that are directly attributable to the acquisition, construction or manufacture of the asset form part of the cost of that asset. All other borrowing costs are recognized as an expense in the period in which they are incurred.
21) Income Taxes
Income taxes comprise current taxes and deferred taxes. They are recognized in profit or loss, with the exception of income taxes associated with items recognized in other comprehensive income or items that are directly recognized in equity.(i) Current Taxes
The Group recognizes current taxes based on taxable profits for the reporting period. Current tax amounts are calculated using the tax rates that are in force or substantially in force on the final day of the reporting period. Income taxes receivable and payable are measured at the estimated refund from or payment to the tax authorities.
(ii) Deferred Taxes
The Group recognizes deferred taxes using the asset and liability approach for temporary differences between the amounts of assets and liabilities for accounting purposes and their tax bases. In principle, deferred tax liabilities are all recognized in taxable temporary differences, and deferred tax assets are recognized only to the extent it is probable that there will be taxable profits against which deductible temporary differences, tax losses, etc., may be utilized. Deferred tax assets and liabilities, however, are not recognized for the following temporary differences: • Taxable temporary differences arising from initial
recognition of goodwill; • Temporary differences arising from initial recognition of
assets or liabilities in transactions (excluding business combinations) that do not affect taxable profits (tax losses) in profit or loss for accounting purposes; and
• Taxable temporary differences pertaining to investments in subsidiaries and associates where the timing of the reversal of the temporary differences can be controlled by the Group and it is probable that the temporary differences will not reverse in the foreseeable future.
Deferred tax assets pertaining to deductible temporary differences associated with investments in subsidiaries and associates are recognized only to the extent that the temporary difference will reverse in the foreseeable future and that it is probable that there will be adequate taxable profits against which benefits from the temporary difference can be utilized. Deferred tax assets and liabilities are calculated at the tax rates expected to apply to the period when the associated deferred tax assets will be realized or the period when the deferred tax liabilities will be settled, based on the tax rates that are in force or substantially in force at the end of the reporting period. Deferred tax assets and liabilities are offset when there is a legally enforceable right to set off current tax assets against current tax liabilities and when the deferred tax assets and liabilities are associated with the income taxes levied on the same taxable entity, or the equivalent or different taxable entity intended to be settled on a net basis, by the same tax authority.
22) Earnings per Share
Basic quarterly earnings per share are calculated by dividing profit for the quarter attributable to ordinary shareholders by the weighted-average number of common stock outstanding during the reporting period. Diluted quarterly earnings per share are calculated through adjustments for the effect of all potentially dilutive common stock.

22JSR Corporation Annual Report 2021
NOTES OF CONSOLIDATED FINANCIAL STATEMENTS
(5) Changes in Presentation
(Consolidated statements of financial position)“Contract liabilities” included in “Other current liabilities” in the previous fiscal year have been reclassified as a separate item in the current fiscal year, because the amounts have become significant.
The amounts of “Contract liabilities” were ¥8,489 million in the previous fiscal year.
(6) Significant Accounting Estimates and Judgments Involving Estimates
In the preparation of consolidated financial statements, management is required to make judgments, estimates, and assumptions. The estimates and the underlying assumptions are reviewed on an ongoing basis, and the effects of the review are recognized in the period in which the review was conducted and in future periods. Actual results may differ from these estimates. Estimates and judgments that have significant effects on amounts recognized in the Group’s consolidated financial statements are as follows. These assumptions have been determined based on management’s best estimates and judgments. However, the assumptions may be affected by results of uncertain changes in economic conditions in the future and amendment or promulgation of related laws and regulations, and if a review is necessary, this may have significant effects on amounts recognized in consolidated financial statements in the following fiscal years.
1) Impairment of Non-Financial Assets
In the calculation of recoverable amount in impairment test, certain assumptions have been made for future cash flows, discount rate reflecting risks inherent to the asset, long-term growth rate and others. Details of the method for calculating recoverable amount, etc., are provided in the note “(18) Impairment of Non-Financial Assets.”
2) Recoverability of Deferred Tax Assets
For the recognition of deferred tax assets, the amount is determined, assuming the probability that there will be taxable profits, by estimating the timing when taxable profits that can be obtained in the future are available and the amount of these profits based on the business plan. The relevant content and amount of deferred tax assets are provided in the note “(20) Income Taxes.”
(7) Segment Information
1) Overview of Reportable Segments
JSR Group’s reportable segments are based on its business segments for which separate financial information is available and which the Board of Directors determines the basis that are subject to regular reviews for decisions on the allocation of managerial resources and the evaluation of business results. The Group has established divisions by product at its head office. Each division formulates comprehensive domestic and overseas strategies for its products and conducts business activities according to the strategies. Core Group companies also take the initiative in working out comprehensive domestic and overseas strategies and conduct business activities according to the strategies. Thus, JSR Group’s businesses consist of business segments by product based on divisions and core Group companies. JSR Group has four reportable segments: Digital Solutions Business, which is engaged mainly in the manufacture and sale
of semiconductor materials, display materials, and products related to edge computing; and Life Sciences Business; Elastomers Business, which is engaged mainly in the manufacture and sale of general-purpose synthetic rubber products for automobile tires, functional special synthetic rubber for automobile components, thermoplastic elastomers for modifying plastics, and synthetic rubber latex for coated paper; Plastics Business, which is engaged mainly in the manufacture and sale of ABS and other resins for automobiles, office equipment, and amusement applications. The Digital Solutions Business is a reportable segment comprising multiple segments based on the nature of the products and services, the nature of production processes, and similarity in markets and other economic characteristics. The accounting methods for reportable segments are the same as the methods adopted for the preparation of consolidated financial statements.

23JSR Corporation Annual Report 2021
NOTES OF CONSOLIDATED FINANCIAL STATEMENTS
Main Products in Each Business Segment
Business segments Main products
Digital Solutions Business
<Semiconductor Materials> Lithography materials (photoresists, multilayer materials); CMP materials; mounting materials; etc. <Display Materials> Materials for color LCDs; functional coating materials; etc. <Edge Computing Materials> Heat-resistant transparent resins and functional films; photo fabrication and photo molding systems; etc.
Life Sciences BusinessDiagnostic and research reagents and similar materials; bio-process materials; drug discovery and development services, etc.
Elastomers Business
Synthetic rubbers, such as styrene-butadiene rubber, poly-butadiene rubber, ethylene and propylene rubber and compounded products; thermoplastic elastomers and compounded products; latex for paper processing; general industrial-use latex; acrylic emulsions; high-functional dispersants; industrial particles; materials for heat insulation paints; materials for batteries; butadiene monomers; etc.
Plastics Business Synthetic resins including ABS resins, AES resins, AS resins, and ASA resins
2) Segment Revenues, Profits or Losses, Assets and Other Material Items
The following information pertains to the Group’s reportable segments.
Fiscal year ended March 31, 2020 (April 1, 2019 to March 31, 2020)
Millions of yen
The Reportable Segment
Other[Note 1] Total
Adjustment[Note 2]
Amount Recorded in the
Consolidated Financial
StatementsDigital
Solutions Life Sciences Elastomers Plastics
Revenue from external customers ¥144,805 ¥ 50,496 ¥178,794 ¥95,092 ¥ 2,779 ¥471,967 ¥ 0 ¥471,967
Segment profit (loss) (core operating profit) [Note 3] 30,917 3,945 (1,758) 6,237 (250) 39,091 (5,855) 32,236
Segment assets 145,736 129,485 260,488 69,035 11,485 616,230 58,837 675,068
Other items
Depreciation and amortization 6,627 5,420 9,925 2,372 221 24,565 1,778 26,343
Impairment losses — 60 1,454 — — 1,514 — 1,514
Capital expenditures 18,341 8,613 15,560 2,891 — 45,405 475 45,880
Note 1: The Other segment is a business segment not contained in the reportable segments. It includes the purchase and sale of chemicals and other businesses.Note 2: The segment profit (loss) downward adjustment of ¥(5,855) million contains company-wide profits and losses not allocated to the reportable segments. The adjustment amounts in
the segment assets line are corporate assets not allocated to any reportable segment. Corporate assets mainly include investment of surplus funds (deposits, cash equivalents, securities (debt instruments)) and long-term investment funds (securities (equity instruments)) owned by the parent company.
Note 3: The Segment profit (loss) is presented as core operating profit after deducting non-recurring profit (loss) arising from business restructuring and other non-recurring factors from operating profit.
JSR has classified the lithium-ion capacitor business as discontinued operations from the previous fiscal year, and segment information presents only amounts for continuing operations excluding the lithium-ion capacitor business. JSR lost control over JM Energy Corporation (*) on April 1, 2020, and JM
Energy Corporation (*) became an equity method affiliate of JSR. The profit or loss using the equity method from JM Energy Corporation (*) in the fiscal year is included in the other segment. (*) JM Energy changed company name to “Musashi Energy Solutions Co., Ltd.” on November 1, 2020.

24JSR Corporation Annual Report 2021
NOTES OF CONSOLIDATED FINANCIAL STATEMENTS
Fiscal year ended March 31, 2021 (April 1, 2020 to March 31, 2021)
Millions of yen
The Reportable Segment
Other[Note 1] Total
Adjustment[Note 2]
Amount Recorded in the
Consolidated Financial
StatementsDigital
Solutions Life Sciences Elastomers Plastics
Revenue from external customers ¥151,420 ¥ 55,197 ¥143,186 ¥79,123 ¥17,682 ¥446,609 ¥ 0 ¥446,609
Segment profit (loss)(core operating profit) [Note 3] 34,568 3,510 (11,420) 4,430 1,108 32,196 (6,233) 25,963
Segment assets 164,777 158,393 183,747 76,569 10,778 594,263 78,509 672,773
Other items
Depreciation and amortization 7,525 6,236 11,169 2,631 238 27,800 1,677 29,477
Impairment losses 1,408 940 77,227 — — 79,575 — 79,575
Capital expenditures 13,542 18,566 16,593 3,511 479 52,691 979 53,669
Note 1: The Other segment is a business segment not contained in the reportable segments. It includes the purchase and sale of chemicals and other businesses.Note 2: The Segment profit (loss) downward adjustment of ¥(6,233) million contains company-wide profits and losses not allocated to the reportable segments. The adjustment amount in
the segment assets line is corporate assets not allocated to any reportable segment. Corporate assets mainly include investment of surplus funds (deposits, cash equivalents, and securities (debt instruments)) and long-term investment funds (securities (equity instruments)) by the parent company.
Note 3: The Segment profit (loss) has been changed from “Operating profit (loss)” to “Core operating profit” from the current fiscal year. “Core operating profit” is presented as a profit (loss) after deducting non-recurring profit (loss) arising from business restructuring and other non-recurring factors from operating profit. The Company is undertaking business restructuring to achieve medium-to-long-term growth and increase corporate value. The change was made in response to the restructuring of the Display Solutions Business during the current fiscal year, because it was deemed to be useful for the management of each segment and for users of consolidated financial statements to determine the Company’s recurring segment profit or loss.
Fiscal year ended March 31, 2021 (April 1, 2020 to March 31, 2021)
Thousands of U.S. dollars
The Reportable Segment
Other[Note 1] Total
Adjustment[Note 2]
Amount Recorded in the
Consolidated Financial
StatementsDigital
Solutions Life Sciences Elastomers Plastics
Revenue from external customers $1,367,721 $ 498,570 $1,293,342 $714,689 $159,719 $4,034,041 $ 0 $4,034,041
Segment profit (loss)(core operating profit) [Note 3] 312,237 31,703 (103,150) 40,016 10,011 290,817 (56,302) 234,515
Segment assets 1,488,364 1,430,706 1,659,715 691,614 97,349 5,367,749 709,142 6,076,891
Other items
Depreciation and amortization 67,971 56,324 100,889 23,769 2,153 251,107 15,147 266,254
Impairment losses 12,722 8,491 697,558 — — 718,771 — 718,771
Capital expenditures 122,322 167,703 149,874 31,713 — 475,937 8,838 484,775
Note 1: The Other segment is a business segment not contained in the reportable segments. It includes the purchase and sale of chemicals and other businesses.Note 2: The Segment profit (loss) downward adjustment of $(56,032) thousand contains company-wide profits and losses not allocated to the reportable segments. The adjustment
amount in the segment assets line are corporate assets not allocated to any reportable segment. Corporate assets mainly include investment of surplus funds (deposits, cash equivalents, and securities (debt instruments)) and long-term investment funds (securities (equity instruments)) by the parent company.
Note 3: The Segment profit (loss) has been changed from “Operating profit (loss)” to “Core operating profit” from the current fiscal year. “Core operating profit” is presented as a profit (loss) after deducting non-recurring profit (loss) arising from business restructuring and other non-recurring factors from operating profit. The Company is undertaking business restructuring to achieve medium-to-long-term growth and increase corporate value. The change was made in response to the restructuring of the Display Solutions Business during the current fiscal year, because it was deemed to be useful for the management of each segment and for users of consolidated financial statements to determine the Company’s recurring segment profit or loss.
Adjustments to reconcile segment profit to quarterly profit (loss) before tax are as follows:
Millions of yen Thousands of U.S. dollars
Fiscal year ended March 31, 2020 (April 1, 2019 to March 31, 2020)
Fiscal year ended March 31, 2021(April 1, 2020 to March 31, 2021)
Fiscal year ended March 31, 2021(April 1, 2020 to March 31, 2021)
Segment profit ¥33,236 ¥ 25,963 $ 234,515
Loss from sales of shares of subsidiaries and affiliated companies (352) — —
Business restructuring expenses — (87,436) (789,778)
Special retirement benefits — (160) (1,448)
Operating profit (loss) 32,884 (61,633) (556,711)
Finance income 1,929 947 8,552
Finance costs (2,184) (1,743) (15,748)
Profit before tax (loss) 32,629 (62,430) (563,906)
(*) Business restructuring expenses consisted of other operating expenses of ¥84,021 million ($758,928 thousand) and Share of loss of investments accounted for using equity method of ¥3,415 million ($30,851 thousand). Please refer to “Note 30. Other Operating Income and Expenses” for details on the business restructuring expenses.

25JSR Corporation Annual Report 2021
NOTES OF CONSOLIDATED FINANCIAL STATEMENTS
3) Information on Products and Services
Information on products and services is stated on “1) Overview of reportable segments.”
4) Information by Region
The following is a breakdown of revenue and non-current assets by region.
Revenue from External CustomersMillions of yen Thousands of U.S. dollars
Fiscal year endedMarch 31, 2020
Fiscal year endedMarch 31, 2021
Fiscal year endedMarch 31, 2021
Japan ¥198,238 ¥184,637 $1,667,758
China 67,022 73,317 662,240
U.S. 60,403 59,616 538,489
Other regions 146,304 129,039 1,165,554
Total ¥471,967 ¥446,609 $4,034,041
Note: Revenue is divided into countries or regions based on the locations of customers.
Property, Plant and EquipmentMillions of yen Thousands of U.S. dollars
As of March 31, 2020
As of March 31, 2021
As of March 31, 2021
Japan ¥111,160 ¥ 92,718 $ 837,482
U.S. 23,769 40,319 364,189
Other regions 80,735 37,391 337,735
Total ¥215,664 ¥170,428 $1,539,406
Note: We confine items presented to property, plant and equipment considering cost of the preparation.The presentation of amounts for some regions has been omitted for the fiscal year ended March 31, 2021 because the amounts have become materially insignificant. Figures for the fiscal year ended March 31, 2020 have been reclassified.
5) Information on Major Customers
Information on major customers is omitted, since no single external customer accounts for more than 10 percent of the Group’s revenue in terms of revenue through transactions with a single external customer.
(8) Business Combination and Acquisition of Non-controlling Interest
1) Business Combination
Fiscal year ended March 31, 2019 (April 1, 2019 to March 31,
2020)
Not Applicable
Fiscal year ended March 31, 2021 (April 1, 2020 to March 31,
2021)
Not Applicable
2) Acquisition of Non-controlling Interest
Fiscal year ended March 31, 2020 (April 1, 2019 to March 31,
2020)
Not Applicable
Fiscal year ended March 31, 2021 (April 1, 2020 to March 31,
2021)
From October 28, 2020 to January 15, 2021, to improve the enterprise value, the Group additionally acquired 40.18% of the shares in MEDICAL & BIOLOGICAL LABORATORIES CO., LTD. from non-controlling-interest shareholders, and as a result, the voting rights ratio increased to 100% from 50.82%. As the consideration for additional acquisition, cash of ¥11,415 million ($103,104 thousand) was paid to the non-controlling-interest shareholders, and the group accounted for ¥6,398 million ($57,792 thousand) as the decreasing capital surplus,which is the difference between the consideration for the additional acquisition and ¥5,016 million ($45,312 thousand), which is the total amount of Non-controlling interest reduced because of the additional acquisition and the exchange differences on translation of foreign operations.

26JSR Corporation Annual Report 2021
NOTES OF CONSOLIDATED FINANCIAL STATEMENTS
(9) Cash and Cash Equivalents
Cash and cash equivalents comprise cash, short-term deposits (not later than three months) and short-term investments (e.g., securities redeemable not later than three months from the date of acquisition). Cash and cash equivalents on the indicated dates consisted of the following items. The total amount of cash and cash equivalents corresponds to cash and cash equivalents at the end of the period in the consolidated statement of cash flows.
Millions of yen Thousands of U.S. dollars
As of March 31, 2020
As of March 31, 2021
As of March 31, 2021
Cash and cash equivalents
Cash and deposit ¥48,931 ¥73,372 $662,740
Short-term investment 13,001 12,005 108,434
Total ¥61,931 ¥85,377 $771,173
(10) Trade and Other Receivables
Trade and other receivables are classified as financial assets measured at amortized cost. Trade and other receivables include the following items.
Millions of yen Thousands of U.S. dollars
As of March 31, 2020
As of March 31, 2021
As of March 31, 2021
Trade receivables
Notes and account receivable-trade ¥ 97,758 ¥108,615 $ 981,081
Other receivables
Account receivables-other 12,430 16,410 148,223
Other 317 267 2,408
Total ¥110,506 ¥125,292 $1,131,712
(11) Other Financial Assets
1) Breakdown of Other Financial Assets
The breakdown of other financial assets is as follows:
Millions of yen Thousands of U.S. dollars
As of March 31, 2020
As of March 31, 2021
As of March 31, 2021
Derivative asset ¥ 3 ¥ 1 $ 7
Investments (equity financial assets) 39,955 46,186 417,176
Term deposits 3,297 1,412 12,753
Other 5,466 4,086 36,909
Total 48,721 51,684 466,845
Current assets 4,064 1,933 17,461
Non-current assets 44,656 49,751 449,383
Total ¥48,721 ¥51,684 $466,845
Derivative assets are classified as financial assets measured at fair value through profit or loss. Investments (equity financial assets) are classified as financial assets measured at fair value through other comprehensive income, or those through profit or loss. Time deposits are classified as financial assets measured at amortized cost.
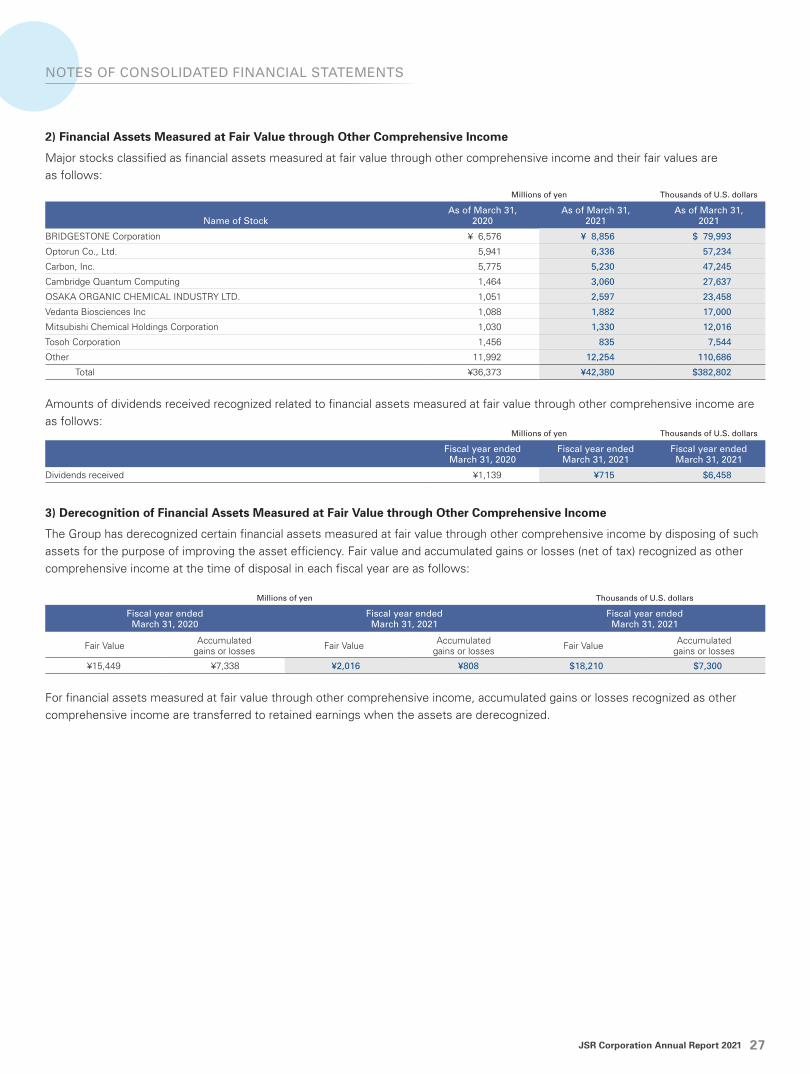
27JSR Corporation Annual Report 2021
NOTES OF CONSOLIDATED FINANCIAL STATEMENTS
2) Financial Assets Measured at Fair Value through Other Comprehensive Income
Major stocks classified as financial assets measured at fair value through other comprehensive income and their fair values are as follows:
Millions of yen Thousands of U.S. dollars
Name of StockAs of March 31,
2020As of March 31,
2021As of March 31,
2021
BRIDGESTONE Corporation ¥ 6,576 ¥ 8,856 $ 79,993
Optorun Co., Ltd. 5,941 6,336 57,234
Carbon, Inc. 5,775 5,230 47,245
Cambridge Quantum Computing 1,464 3,060 27,637
OSAKA ORGANIC CHEMICAL INDUSTRY LTD. 1,051 2,597 23,458
Vedanta Biosciences Inc 1,088 1,882 17,000
Mitsubishi Chemical Holdings Corporation 1,030 1,330 12,016
Tosoh Corporation 1,456 835 7,544
Other 11,992 12,254 110,686
Total ¥36,373 ¥42,380 $382,802
Amounts of dividends received recognized related to financial assets measured at fair value through other comprehensive income are as follows:
Millions of yen Thousands of U.S. dollars
Fiscal year ended March 31, 2020
Fiscal year ended March 31, 2021
Fiscal year ended March 31, 2021
Dividends received ¥1,139 ¥715 $6,458
3) Derecognition of Financial Assets Measured at Fair Value through Other Comprehensive Income
The Group has derecognized certain financial assets measured at fair value through other comprehensive income by disposing of such assets for the purpose of improving the asset efficiency. Fair value and accumulated gains or losses (net of tax) recognized as other comprehensive income at the time of disposal in each fiscal year are as follows:
Millions of yen Thousands of U.S. dollars
Fiscal year ended March 31, 2020
Fiscal year ended March 31, 2021
Fiscal year ended March 31, 2021
Fair Value Accumulated gains or losses Fair Value Accumulated
gains or losses Fair Value Accumulated gains or losses
¥15,449 ¥7,338 ¥2,016 ¥808 $18,210 $7,300
For financial assets measured at fair value through other comprehensive income, accumulated gains or losses recognized as other comprehensive income are transferred to retained earnings when the assets are derecognized.

28JSR Corporation Annual Report 2021
NOTES OF CONSOLIDATED FINANCIAL STATEMENTS
(13) Notes on Disposal Groups Classified as Held for Sale and Discontinued Operations
The Group classifies as discontinued operations business segments that have been disposed of or are classified as held for sale.
1) Disposal Groups Classified as Held for Sale
Fiscal year ended March 31, 2020 (April 1, 2019 to March 31,
2020)
As part of JSR’s business portfolio management efforts, JSR entered into an agreement with Musashi Seimitsu Industry Co.,
Ltd. (Musashi Seimitsu Industry), for the transfer of 80% of the shares of JM Energy Corporation (JM Energy)(*), a consolidated subsidiary of JSR, in January, 2020. As a result, JSR lost control of JM Energy(*) in, April 2020 so from the previous fiscal year, the assets and liabilities of JM energy(*) were classified as disposal groups classified as held for sale, and, as of April 1, 2020, the stock transfer was carried out as scheduled.
The following are the assets and liabilities related to disposal groups classified as held for sale.
Millions of yen Thousands of U.S. dollars
Fiscal year ended March 31, 2020
Fiscal year ended March 31, 2021
Fiscal year ended March 31, 2021
Assets associated with disposal groups classified as held for sale
Cash and cash equivalents ¥1,176 ¥— $—
Trade and other receivables 216 — —
Inventories 1,207 — —
Other current assets 47 — —
Property, plant and equipment 0 — —
Total assets ¥2,646 ¥— $—
Liabilities associated with disposal groups classified as held for sale
Trade and other payables 659 — —
Income taxes payable 222 — —
Other current liabilities 1,016 — —
Retirement benefit liability 254 — —
Deferred tax liabilities 496 — —
Total liabilities ¥2,646 ¥— $—
(*) JM Energy changed its company name to Musashi Energy Solutions Co., Ltd. on November 1, 2020.
(12) Inventories
Inventories consist of the following items.
Millions of yen Thousands of U.S. dollars
As of March 31, 2020
As of March 31, 2021
As of March 31, 2021
Finished goods and merchandise ¥ 73,823 ¥ 61,394 $554,545
Work in process 3,613 3,156 28,510
Raw materials and supplies 35,404 40,312 364,126
Total ¥112,840 ¥104,862 $947,180
The amount of valuation losses on inventories recognized as expenses was ¥497 million as of March 31, 2020 and ¥662 million ($5,980 thousand) as of March 31, 2021. The write-off amount is included in “cost of sales” in the consolidated statement of profit or loss. The amount included in cost of sales was ¥308,487 million as of March 31, 2020 and ¥287,563 million ($2,597,440 thousand) as of March 31, 2021.

29JSR Corporation Annual Report 2021
NOTES OF CONSOLIDATED FINANCIAL STATEMENTS
(14) Other Assets
The breakdown of other assets is as shown below.
Millions of yen Thousands of U.S. dollars
As of March 31, 2020
As of March 31, 2021
As of March 31, 2021
Other current assets
Excise tax receivable ¥ 5,837 ¥ 4,276 $ 38,622
Income taxes receivable 1,569 2,044 18,458
Prepaid expenses 1,921 3,509 31,693
Other 2,160 1,987 17,945
Total ¥11,487 ¥11,815 $106,718
Other non-current assets
Long-term prepaid expenses 195 41 373
Other 2,274 3,557 32,126
Total ¥ 2,469 ¥ 3,598 $ 32,499
2) Discontinued Operations
As described in “1) Disposal Groups Classified as Held for Sale”, JSR has classified the lithium-ion capacitor business as discontinued operations from the previous fiscal year because JSR lost control over JM Energy Corporation (*). Because JSR transferred 80% of shares to JM Energy Corporation on April 1, 2020, JM Energy Corporation became an equity method affiliate of JSR, and the profit or loss using the equity method from JM Energy Corporation (*) in the fiscal year ended March 31, 2021 is included in the “Other” segment in “Note 7: Segment information”.
(i) Profit or Loss from Discontinued Operations
The following are the profit or loss from discontinued operations.
Millions of yen Thousands of U.S. dollars
Fiscal year ended March 31, 2020
Fiscal year ended March 31, 2021
Fiscal year ended March 31, 2021
Revenue ¥ 590 ¥— $—
Cost of sales and expenses (3,798) — —
Loss before tax from discontinued operations (3,208) — —
Income tax expenses 3,460 — —
Profit from discontinued operations ¥ 252 — —
There is no profit or loss recognized by disposing of the assets or disposal groups that make up the discontinued business. Please refer to the consolidated statement of profit or loss for basic and diluted earnings per share for discontinued operations.
(ii) Cash Flows Arising from Discontinued Operations
The following are cash flows from discontinued operations.
Millions of yen Thousands of U.S. dollars
Fiscal year ended March 31, 2020
Fiscal year ended March 31, 2021
Fiscal year ended March 31, 2021
Cash flows from operating activities ¥(1,278) ¥ — $ —
Cash flows from investing activities (517) (1,176) (10,627)
Cash flows from financing activities 2,858 — —
Total ¥ 1,062 ¥(1,176) $(10,627)
Note: Cash flows from investing activities in the current fiscal year are due to expenditures (cash and cash equivalents of the disposed subsidiary) due to the sale of shares of the subsidiary accompanying a change in the scope of consolidation.

30JSR Corporation Annual Report 2021
NOTES OF CONSOLIDATED FINANCIAL STATEMENTS
(15) Property, Plant and Equipment
Changes in carrying amounts and the balance of acquisition costs and accumulated depreciation of property, plant and equipment are as follows. For information on impairment losses, see “(18) Impairment of Non-financial Assets.”
Changes in Carrying AmountsMillions of yen
Buildings and structures
Machinery and vehicles
Tools, fixtures and fittings Land
Construction in progress Other Total
April 1, 2019 ¥ 47,295 ¥ 69,697 ¥11,029 ¥17,240 ¥ 38,173 ¥ 23 ¥183,457
Adjustment due to adoption of IFRS 16 11,965 227 12 1,607 — — 13,810
April 1, 2019 ¥ 59,260 ¥ 69,924 ¥11,041 ¥18,847 ¥ 38,173 ¥ 23 ¥197,268
Acquisition 4,587 5,458 813 1,997 35,753 143 48,750
Depreciation (6,585) (12,559) (4,196) (253) — — (23,593)
Impairment loss (104) (1,563) (93) (1) (37) — (1,797)
Sales and disposals (424) (788) (72) (12) (159) — (1,454)
Transfer 4,772 11,978 4,604 (0) (21,337) (18) —
Exchange differences of foreign operations (816) (1,342) (96) (31) (1,300) 0 (3,584)
Other (210) 656 (3) (271) (95) (1) 75
March 31, 2020 ¥ 60,481 ¥ 71,763 ¥11,999 ¥20,275 ¥ 50,999 ¥ 147 ¥215,664
Acquisition 8,644 2,670 1,310 44 39,670 96 52,434
Depreciation (7,322) (14,349) (4,731) (243) — (29) (26,675)
Impairment loss (17,655) (52,226) (2,241) — (988) — (73,110)
Sales and disposals (102) (298) (89) 0 (221) 1 (709)
Transfer 21,585 40,648 3,790 291 (66,177) (137) —
Exchange differences of foreign operations 2,043 3,276 195 64 1,839 (9) 7,408
Other 625 (290) (111) (1,081) (3,780) 52 (4,585)
March 31, 2021 ¥ 68,299 ¥ 51,194 ¥10,122 ¥19,350 ¥ 21,342 ¥ 120 ¥170,428
Thousands of U.S. dollars
Buildings and structures
Machinery and vehicles
Tools, fixtures and fittings Land
Construction in progress Other Total
March 31, 2020 $ 546,301 $ 648,209 $108,383 $183,140 $ 460,653 $ 1,324 $1,948,010
Acquisition 78,076 24,118 11,836 395 358,321 870 473,615
Depreciation (66,141) (129,610) (42,737) (2,191) — (261) (240,941)
Impairment loss (159,471) (471,736) (20,244) — (8,922) — (660,374)
Sales and disposals (922) (2,690) (806) 0 (1,992) 6 (6,404)
Transfer 194,968 367,158 34,238 2,628 (597,751) (1,241) —
Exchange differences of foreign operations 18,456 29,588 1,764 580 16,607 (81) 66,915
Other 5,650 (2,619) (1,003) (9,767) (34,143) 467 (41,415)
March 31, 2021 $ 616,917 $ 462,418 $ 91,430 $174,784 $ 192,772 $ 1,085 $1,539,406
Acquisition CostMillions of yen
Buildings and structures
Machinery and vehicles
Tools, fixtures and fittings Land
Construction in progress Other Total
March 31, 2020 ¥162,022 ¥364,873 ¥68,381 ¥21,779 ¥50,999 ¥147 ¥668,201
March 31, 2021 ¥194,226 ¥409,383 ¥70,942 ¥21,176 ¥21,342 ¥199 ¥717,267
Thousands of U.S. dollars
Buildings and structures
Machinery and vehicles
Tools, fixtures and fittings Land
Construction in progress Other Total
March 31, 2021 $1,754,367 $3,697,793 $640,788 $191,271 $192,772 $1,800 $6,478,792

31JSR Corporation Annual Report 2021
NOTES OF CONSOLIDATED FINANCIAL STATEMENTS
Accumulated Depreciation and ImpairmentMillions of yen
Buildings and structures
Machinery and vehicles
Tools, fixtures and fittings Land
Construction in progress Other Total
March 31, 2020 ¥101,541 ¥293,110 ¥56,382 ¥1,504 ¥— ¥ — ¥452,536
March 31, 2021 ¥125,927 ¥358,188 ¥60,819 ¥1,825 ¥ 0 ¥79 ¥546,839
Thousands of U.S. dollars
Buildings and structures
Machinery and vehicles
Tools, fixtures and fittings Land
Construction in progress Other Total
March 31, 2021 $1,137,449 $3,235,375 $549,358 $16,487 $0 $715 $4,939,386
(Notes) 1. Depreciation expenses of property, plant and equipment are recorded as “inventories” in the consolidated statement of financial position, or “cost of sales”, “selling, general and administrative expenses” and “profit from discontinued operations” in the consolidated statement of profit or loss.
2. Impairment loss is recorded as “other operating expenses” and “Profit from discontinued operations” in the consolidated statement of profit or loss. 3. “Other” in the changes of carrying amounts includes transfer to/from “inventories” in the consolidated statement of financial position, or “cost of sales” and “selling, general
and administrative expenses” in the consolidated statement of profit or loss. 4. Amounts of property, plant and equipment pledged as collateral for liabilities are stated in “(21) Borrowings and bonds (including Other financial liabilities).” 5. Right-of-use asset included in carrying amounts of property, plant and equipment is stated in “(16) Lease.”
(16) Lease
The Group leases Offices, Production equipment, Company cars, Land and Other assets as the lessee. Certain lease contracts include an extension option. No significant restrictions are imposed by lease contracts, such as restrictions regarding additional borrowings or leases.
1) Right-of-Use Asset
Net increase in right-of-use asset, depreciation and carrying amount in the fiscal year ended March 31, 2020 are as follows:
Fiscal year ended March 31, 2020 (April 1, 2019 to March 31, 2020)
Millions of yen
Buildings and structures
Machinery and vehicles
Tools, fixtures and fittings Land Total
Carrying amount ¥12,710 ¥3,944 ¥ 33 ¥2,278 ¥18,965
Depreciation (2,734) (704) (37) (253) (3,728)
(Note) Increase amount of right-of-use asset is ¥7,718 million.
Fiscal year ended March 31, 2021 (from April 1, 2020 to March 31, 2021)
Millions of yen
Buildings and structures
Machinery and vehicles
Tools, fixtures and fittings Land Total
Carrying amount ¥17,000 ¥ 943 ¥ 29 ¥1,056 ¥19,028
Depreciation (3,154) (425) (22) (243) (3,844)
(Note) Increase amount of right-of-use asset is ¥8,165 million.
Thousands of U.S. dollars
Buildings and structures
Machinery and vehicles
Tools, fixtures and fittings Land Total
Carrying amount ¥153,552 ¥ 8,519 ¥ 261 ¥ 9,539 ¥171,872
Depreciation (28,491) (3,839) (195) (2,191) (34,717)
(Note) Increase amount of right-of-use asset is $73,754 thousand.

32JSR Corporation Annual Report 2021
NOTES OF CONSOLIDATED FINANCIAL STATEMENTS
2) Finance Costs Related to Lease
Finance costs related to leases in the fiscal year ended March 31, 2020 are as follows:
Fiscal year ended March 31 ,2020 (from April 1, 2019 to March 31, 2020)
Millions of yen
Finance costs related to leases ¥ 615
Expenses relating to short-term leases 340
Expenditures relating to leases of low-value assets 672
Variable lease payments 67
The amount of cash outflow related to leases ¥3,899
Fiscal year ended March 31, 2021 (from April 1, 2020 to March 31, 2021)
Millions of yen Thousands of U.S. dollars
Finance costs related to leases ¥ 537 $ 4,852
Expenses relating to short-term leases 246 2,223
Expenditures relating to leases of low-value assets 570 5,147
Variable lease payments 40 357
The amount of cash outflow related to leases ¥3,264 $29,479
For the information on Maturity analysis for lease liabilities, see “(35) Financial Instruments, 2) Financial Risks, (iii) Liquidity Risks.”
(17) Goodwill and Other Intangible Assets
Changes in carrying amounts and the balance of acquisition costs and accumulated amortization of goodwill and other intangible assets are as follows. For information of impairment losses, see “(18) Impairment of Non-financial Assets.”
Changes in Carrying AmountsMillions of yen
Goodwill
Other intangible asset
Software Other Total
April 1, 2019 ¥59,066 ¥ 4,137 ¥10,068 ¥14,205
Acquisition — 4,134 306 4,440
Amortization — (1,144) (1,621) (2,765)
Impairment loss — (3) — (3)
Sales and disposals — (116) (267) (382)
Transfer to other property, plant and equipment — (214) 214 —
Exchange differences of foreign operations (784) (34) (194) (228)
Other — 461 165 626
March 31, 2020 ¥58,283 ¥ 7,220 ¥ 8,671 ¥15,891
Acquisition — 8,259 309 8,567
Amortization — (1,334) (1,468) (2,802)
Impairment loss (688) (3,908) (1,869) (5,777)
Sales and disposals — (4) (201) (205)
Transfer to other property, plant and equipment — (480) 480 —
Exchange differences of foreign operations 1,039 59 283 343
Other — (1,056) 53 (1,003)
March 31, 2021 ¥58,633 ¥ 8,755 ¥ 6,258 ¥15,014

33JSR Corporation Annual Report 2021
NOTES OF CONSOLIDATED FINANCIAL STATEMENTS
Thousands of U.S. dollars
Goodwill
Other intangible asset
Software Other Total
March 31, 2020 $526,446 $ 65,213 $ 78,323 $143,536
Acquisition — 74,597 2,790 77,386
Amortization — (12,050) (13,264) (25,313)
Impairment loss (6,217) (35,299) (16,880) (52,180)
Sales and disposals — (37) (1,812) (1,850)
Transfer to other property, plant and equipment — (4,339) 4,339 —
Exchange differences of foreign operations 9,383 535 2,561 3,096
Other — (9,536) 475 (9,061)
March 31, 2021 $529,611 $ 79,085 $ 56,530 $135,615
Acquisition CostMillions of yen
Goodwill
Other intangible asset
Software Other Total
March 31, 2020 ¥58,283 ¥24,919 ¥26,708 ¥51,627
March 31, 2021 ¥58,633 ¥30,999 ¥27,615 ¥58,614
Thousands of U.S. dollars
Goodwill
Other intangible asset
Software Other Total
March 31, 2021 $529,611 $280,000 $249,438 $529,439
Accumulated Amortization and ImpairmentMillions of yen
Goodwill
Other intangible asset
Software Other Total
March 31, 2020 ¥— ¥17,699 ¥18,037 ¥35,736
March 31, 2021 ¥— ¥22,243 ¥21,357 ¥43,600
Thousands of U.S. dollars
Goodwill
Other intangible asset
Software Other Total
March 31, 2021 $— $200,915 $192,909 $393,824
(Notes) 1. Amortization expenses of other intangible assets are recorded as “cost of sales”, “selling, general and administrative expenses” and “profit (loss) from discontinued operations” in the consolidated statement of profit or loss.
2. “Other operating expenses” in the consolidated statement of profit or loss include the impairment loss. 3. “Other” changes in the carrying amount include the transfer amount to “Cost of sales”, “Selling, general and administrative expenses” in the consolidated statement of profit or
loss.

34JSR Corporation Annual Report 2021
NOTES OF CONSOLIDATED FINANCIAL STATEMENTS
(18) Impairment on Non-Financial Assets
1) Impairment Losses on Property, Plant and Equipment and Intangible Assets Other Than Goodwill
Impairment losses in the fiscal years ended March 31, 2019 and 2020 are as follows:
Millions of yen Thousands of U.S. dollars
Fiscal year ended March 31, 2020
Fiscal year ended March 31, 2021
Fiscal year ended March 31, 2021
Property, plant and equipment
Buildings and structures ¥ 92 ¥17,655 $159,471
Machinery and vehicles 1,355 52,226 471,736
Tools, fixtures and fittings 63 2,241 20,244
Construction in progress — 988 8,922
Subtotal 1,510 73,110 660,374
Goodwill and other intangible asset
Goodwill — 688 6,217
Software 3 3,908 35,299
Other — 1,869 16,880
Subtotal 3 6,465 58,397
Total ¥1,514 ¥79,575 $718,771
The Company had commenced and partially implemented business restructuring, including unlimited structure reforms in the Elastomers Business in the current fiscal year. As part of the business restructuring program, the Company reduced the carrying amount to the recoverable amount for assets of some operations of the Elastomers Business, the Display Solutions Business and the Life Sciences Business for which the investment amount became unlikely to be recovered. The reduction amount of ¥79,575 million ($718,771 thousand) the each of it ¥77,227 million ($697,558 thousand), ¥1,408 million ($12,722 thousand), ¥940 million ($8,491 thousand) was recorded as impairment loss under “Other operating expenses.” Regarding the Elastomers business, the Group changed the cash-generating unit for impairment accounting from the production line to the entire Elastomers business as the Group has reviewed our strategic approach while working on profit improvement measures and business restructuring. The
recoverable amount in the Elastomers business is measured by the fair value less cost of disposal, and the fair value is calculated based on the enterprise values obtained from the potential buyers as part of its business structure reforms. The fair value hierarchy is classified as Level 3. Adopting the enterprise values obtained from the potential buyers as the basis of the fair value by comparing them with a discounted present value of future cash flows of the Elastomers business calculated by an external valuation expert. Future cash flows are calculated based on a five-year business plan, and the terminal value is calculated in consideration of the terminal growth rate and the EBITDA multiples of similar transactions. The recoverable amount in the Display solutions business and part of the Life Sciences business is measured by the value in use.

35JSR Corporation Annual Report 2021
NOTES OF CONSOLIDATED FINANCIAL STATEMENTS
2) Impairment Test on Goodwill
The goodwill listed in the consolidated statement of financial position is mainly the goodwill related to drug discovery and development service that happened in the 2018 acquisition of Crown Bioscience International, and the carrying amount of goodwill allocated to cash-generating units (or groups of cash-generating units) is as follows:
Millions of yen Thousands of U.S. dollars
SegmentCash-generating units
(groups of cash-generating units)As of March 31,
2020As of March 31,
2021As of March 31,
2021
Plastics business Plastics ¥ 2,598 ¥ 2,598 $ 23,471
Life Sciences business
In-vitro Diagnostics and Research Reagents 3,641 3,641 32,889
Contract Development and Manufacturing for Biomedicine 5,124 5,213 47,086
Contract of the Services for Development and Generation of Cell-lines 9,184 9,528 86,064
Drug Discovery and Development Services 36,904 36,823 332,605
Other 830 830 7,498
Total ¥58,283 ¥58,633 $529,612
Of the above goodwill, major goodwill was tested for impairment as follows. The recoverable amount was measured as the higher of the value in use or the fair value less costs of disposal. The value in use was calculated by reflecting the external information such as past experience and market growth rate which cash-generating units belong to and internal information such as equipment capacity, and it was discounting the estimated amount of cash flows to the present value based on the plan approved by management. A terminal growth rate used for impairment tests of major goodwill, pre-tax discount rate and term to estimate cash flows are as below.
Measured at the Value in Use
Cash-generating units(groups of cash-generating units)
Terminal growth rate
Pre-tax discount rate
Term to estimate cash flows
Plastics 0.0% 10.3% 5 years
In-vitro Diagnostics and Research Reagents 1.0% 10.0% 5 years
Contract Development and Manufacturing for Biomedicine 2.0% 13.0% 5 years
Contract of the Services for Development and Generation of Cell-lines 2.0% 10.8% 5 years
Drug Discovery and Development Services 2.0% 14.8% 5 years
As a result of the above calculation, the recoverable amounts well exceed the carrying amount of each cash-generating unit. As for those cash-generating units, the Group considers that the carrying amount will not exceed the recoverable amount even if there is a change in the key assumptions used in the estimation of the recoverable amounts within a reasonable range.
(19) Investments Accounted for Using the Equity Method
1) Investments in Associates
There are no investments in significant associates.
The carrying amount of investments in associates that are not individually significant is as follows:
Millions of yen Thousands of U.S. dollars
As of March 31, 2020
As of March 31, 2021
As of March 31, 2021
Carrying amount ¥5,955 ¥5,061 $45,716

36JSR Corporation Annual Report 2021
NOTES OF CONSOLIDATED FINANCIAL STATEMENTS
The Group’s share of comprehensive income of associates that are not individually significant is as follows:
Millions of yen Thousands of U.S. dollars
Fiscal year ended March 31, 2020
Fiscal year ended March 31, 2021
Fiscal year ended March 31, 2021
Share of profit (loss) ¥287 ¥(640) $(5,777)
Share of other comprehensive income (88) (22) (198)
Share of total comprehensive income ¥199 ¥(661) $(5,975)
2) Investments in Joint Ventures
There are no investments in significant joint ventures.
Carrying amount of investments in joint ventures that are not individually significant is as follows:
Millions of yen Thousands of U.S. dollars
As of March 31, 2020
As of March 31, 2021
As of March 31, 2021
Carrying amount ¥19,429 ¥15,954 $144,103
The Group’s share of comprehensive income of joint ventures that are not individually significant is as follows:
Millions of yen Thousands of U.S. dollars
Fiscal year ended March 31, 2020
Fiscal year ended March 31, 2021
Fiscal year ended March 31, 2021
Share of profit (loss) ¥ (223) ¥(3,492) $(31,543)
Share of other comprehensive income (847) 155 1,398
Share of total comprehensive income ¥(1,070) ¥(3,337) $(30,144)
(20) Income Taxes
1) Deferred Tax Assets and Liabilities
(i) Deferred Tax Assets and Liabilities Recognized
The breakdown of deferred tax assets and liabilities by major causes for occurrence in each fiscal year is as follows:
Fiscal year ended March 31, 2019 (April 1, 2019 to March 31, 2020)
Millions of yen
April 1, 2019
Recognizedthrough profit
(loss)
Recognized through other
comprehensive income Other March 31, 2020
Deferred Tax Assets
Inventories ¥ 1,133 ¥ (33) ¥ — ¥ — ¥ 1,100
Accrued bonuses 1,710 198 — — 1,908
Non-current assets 1,956 (632) — — 1,324
Retirement benefit liability 4,780 (133) (292) — 4,355
Unused tax losses 425 276 — — 701
Other 3,562 2,094 507 (300) 5,863
Total ¥ 13,566 ¥1,770 ¥ 215 ¥ (300) ¥15,252
Deferred Tax Liabilities
Non-current assets (1,625) 73 — — (1,551)
Financial asset measured at fair value through other comprehensive income (8,763) — 657 3,176 (4,931)
Other (1,992) (586) — — (2,578)
Total ¥(12,380) ¥ (512) ¥ 657 ¥3,176 ¥ (9,060)

37JSR Corporation Annual Report 2021
NOTES OF CONSOLIDATED FINANCIAL STATEMENTS
Fiscal year ended March 31, 2020 (April 1, 2020 to March 31, 2021)
Millions of yen
April 1, 2020
Recognizedthrough profit
(loss)
Recognized through other
comprehensive income Other March 31, 2021
Deferred Tax Assets
Inventories ¥ 1,100 ¥ 22 ¥ — ¥ — ¥ 1,122
Accrued bonuses 1,908 (41) — — 1,867
Non-current assets 1,324 24,405 — — 25,729
Retirement benefit liability 4,355 75 (711) — 3,719
Unused tax losses 701 (426) — 69 344
Other 5,863 829 (185) (422) 6,086
Total ¥15,252 ¥ 24,864 ¥ (895) ¥(353) ¥ 38,868
Deferred Tax Liabilities
Non-current assets (1,551) 37 — — (1,514)
Financial asset measured at fair value through other comprehensive income (4,931) — (2,241) 377 (6,794)
Retained earnings (1,619) (11,440) — — (13,059)
Other (959) 532 — — (427)
Total ¥ (9,060) ¥(10,871) ¥(2,241) ¥ 377 ¥(21,794)
Fiscal year ended March 31, 2020 (April 1, 2020 to March 31, 2021)
Thousands of U.S. dollars
April 1, 2020
Recognizedthrough profit
(loss)
Recognized through other
comprehensive income Other March 31, 2021
Deferred Tax Assets
Inventories $ 9,937 $ 201 $ — $ — $ 10,138
Accrued bonuses 17,233 (369) — — 16,864
Non-current assets 11,962 220,441 — — 232,403
Retirement benefit liability 39,337 675 (6,419) — 33,592
Unused tax losses 6,333 (3,850) — 623 3,106
Other 52,961 7,487 (1,667) (3,808) 54,974
Total $137,764 $224,584 $ (8,086) $(3,185) $ 351,077
Deferred Tax Liabilities
Non-current assets (14,013) 336 — — (13,676)
Financial asset measured at fair value through other comprehensive income (44,536) — (20,239) 3,405 (61,370)
Retained earnings (14,625) (103,333) — — (117,958)
Other (8,659) 4,807 — — (3,853)
Total $ (81,833) $ (98,191) $(20,239) $ 3,405 $(196,857)
(ii) Temporary Differences, etc., for which Deferred Tax Assets Have Not Been Recognized
The Group assesses the recoverability of deferred tax assets in each period and recognizes deferred tax assets taking into account significant uncertainty on the recoverability of its deferred tax assets.
Tax losses carried forward and deductible temporary differences for which deferred tax assets have not been recognized are as follows:
Millions of yen Thousands of U.S. dollars
As of March 31, 2020
As of March 31, 2021
As of March 31, 2021
Unused tax losses ¥ 9,881 ¥11,471 $103,617
Deductible temporary differences 2,531 1,874 16,924
Total ¥12,412 ¥13,345 $120,541

38JSR Corporation Annual Report 2021
NOTES OF CONSOLIDATED FINANCIAL STATEMENTS
Expiration schedule of tax losses carried forward for which no deferred tax asset is recognized is as follows:
Millions of yen Thousands of U.S. dollars
As of March 31, 2020
As of March 31, 2021
As of March 31, 2021
Not later than one year ¥ 276 ¥ — $ 0
Later than one year and not later than five years 2,015 2,259 20,406
Later than five years 7,590 9,212 83,211
Total ¥9,881 ¥11,471 $103,617
The amount of taxable temporary differences pertaining to investments in subsidiaries, etc., for which deferred tax liabilities have not been recognized was ¥34,309 million as of March 31, 2020 and ¥22,963 million ($207,417 thousand) as of March 31, 2021. For these temporary differences, deferred tax
liabilities have not been recognized because the Group can control the timing of the reversal of the temporary differences and it is probable that the temporary differences will not reverse in the foreseeable future.
2) Income Tax Expense
The breakdown of income tax expense is as follows:
Millions of yen Thousands of U.S. dollars
Fiscal year ended March 31, 2020
Fiscal year ended March 31, 2021
Fiscal year ended March 31, 2021
Current tax expenses ¥ 4,656 ¥ 6,093 $ 55,036
Deferred tax expenses (1,257) (13,993) (126,394)
Total ¥ 3,399 ¥ (7,900) $ (71,357)
Continuing operations 6,859 (7,900) (71,357)
Discontinued operations (3,460) — —
Deferred tax expenses include tax losses of ¥720 million and ¥218 million ($1,973 thousand), which had not been recognized, in the previous fiscal year and the current fiscal year, respectively. Also, the amounts of benefits arising from
temporary differences in past periods are included in the previous fiscal year and the current fiscal year, which were ¥164 million and ¥90 million ($812 thousand), respectively.
Differences between statutory income tax rates and average effective tax rates can be explained by the following factors.
%
Fiscal year endedMarch 31, 2020
Fiscal year endedMarch 31, 2021
Statutory income tax rate 30.6 30.6
Retained earnings 0.6 (18.0)
Tax credit on experiment and research expenses (2.9) 1.3
Differences in tax rates applied to foreign operations (3.8) (0.7)
Special deduction for reconstruction district (0.3) 0.3
Share of loss (profit) of entities accounted for using the equity method (0.1) (2.0)
Other (3.1) 1.2
Average effective tax rate 21.0 12.7

39JSR Corporation Annual Report 2021
NOTES OF CONSOLIDATED FINANCIAL STATEMENTS
(21) Borrowings and Bonds (Including Other Financial Liabilities)
1) Financial Liabilities
Borrowings and bonds (including Other financial liabilities) consisted of the following:
Millions of yenThousands of U.S. dollars %
As of March 31, 2020
As of March 31, 2021
As of March 31, 2021
Average interest rates Payment Due
Current borrowings ¥ 23,559 ¥ 22,333 $ 201,724 0.69% —
Current portion of non-current borrowings 6,483 15,539 140,356 1.52% —
Non-current borrowings 52,684 46,537 420,350 2.01% 2022-27
Bonds payable — 34,869 314,955 0.28% 2025-30
Current lease liabilities 3,094 3,330 30,076 — —
Non-current lease liabilities 15,672 19,043 172,008 — 2022-44
Derivative liabilities 111 815 7,364 — —
Other 460 — — — —
Total ¥102,063 ¥142,465 $1,286,832 — —
Current liabilities 33,181 41,745 377,070 — —
Non-current liabilities 68,882 100,720 909,762 — —
Total ¥102,063 ¥142,465 $1,286,832 — —
Borrowings and bonds are classified as financial liabilities measured at cost. Derivative liabilities are classified as financial liabilities measured at fair value through profit or loss. No restrictive financial covenants have been attached to the Group’s borrowings.
Payment schedules of non-current borrowings and bonds payable are as follows:
Millions of yen
Later than one year andnot later than
two years
Later than two years andnot later than three years
Later than three years andnot later than
four years
Later than four years andnot later than
five yearsLater thanfive years Total
Non-current borrowings ¥8,248 ¥13,392 ¥15,276 ¥ 8,238 ¥ 1,384 ¥46,537
Bonds Payable — — — 13,000 22,000 35,000
Thousands of U.S. dollars
Later than one year andnot later than
two years
Later than two years andnot later than three years
Later than three years andnot later than
four years
Later than four years andnot later than
five yearsLater thanfive years Total
Non-current borrowings $74,501 $120,962 $137,978 $ 74,409 $ 12,500 $420,350
Bonds Payable — — — 117,424 198,717 316,141
2) Pledged Assets
The Company and its consolidated subsidiaries have pledged collateral under standard customary terms in standard borrowing contracts.
Pledged assets are as follows:
Millions of yen Thousands of U.S. dollars
As of March 31, 2020
As of March 31, 2021
As of March 31, 2021
Cash and cash equivalents ¥ 7 ¥ 7 $ 63
Property, plant and equipment 14,040 12,814 11,574
Total ¥14,047 ¥12,821 $11,580

40JSR Corporation Annual Report 2021
NOTES OF CONSOLIDATED FINANCIAL STATEMENTS
Corresponding liabilities are as follows:
Millions of yen Thousands of U.S. dollars
As of March 31, 2020
As of March 31, 2021
As of March 31, 2021
Current borrowings and current portion of non-current borrowings ¥29 ¥ 2 $ 14
Other current liabilities 2 — —
Non-current portion of non-current borrowings 2 31 280
Total ¥33 ¥33 $294
3) Reconciliation of Liabilities Arising from Financing Activities
Fiscal year ended March 31, 2020 (April 1, 2019 to March 31, 2020)
Millions of yen
Non-cash items
As of March 31,
2019
Adjustment due to
adoption of IFRS 16
As of April 1,
2019 Cash flow LeaseExchange
differences
Transfer between
non-current and current Other
As of March 31,
2020
Borrowings (non-current) ¥50,777 ¥ — ¥50,777 ¥ 5,568 ¥ — ¥(1,476) ¥(2,184) ¥— ¥ 52,684
Borrowings (current) 33,519 — 33,519 (5,014) — (648) 2,184 1 30,043
Lease liabilities 1,731 13,678 15,408 (3,025) 6,721 (339) — — 18,766
Total ¥86,027 ¥13,678 ¥99,704 ¥(2,470) ¥6,721 ¥(2,464) ¥ — ¥ 1 ¥101,492
Fiscal year ended March 31, 2021 (April 1, 2020 to March 31, 2021)
Millions of yen
Non-cash items
As of April 1,
2020 Cash flow LeaseExchange
differences
Transfer between
non-current and current Other
As of March 31,
2021
Borrowings (non-current) ¥ 52,684 ¥ 10,896 ¥ — ¥2,166 ¥(19,208) ¥ — ¥ 46,537
Bonds Payable — 34,836 — — — 33 34,869
Borrowings (current) 30,043 (13,427) — 1,715 19,208 333 37,872
Lease liabilities 18,766 (3,264) 6,000 871 — — 22,373
Total ¥101,492 ¥ 29,041 ¥6,000 ¥4,752 ¥ — ¥366 ¥141,650
Thousands of U.S. dollars
Non-cash items
As of April 1,
2020 Cash flow LeaseExchange
differences
Transfer between
non-current and current Other
As of March 31,
2021
Borrowings (non-current) $475,872 $ 98,416 $ — $19,563 $(173,502) $ — $ 420,350
Bonds Payable — 314,656 — — — 299 314,955
Borrowings (current) 271,362 (121,281) — 15,492 173,502 3,005 342,080
Lease liabilities 169,507 (29,479) 54,191 7,864 — — 202,084
Total $916,742 $ 262,313 $54,191 $42,919 $ — $3,303 $1,279,468

41JSR Corporation Annual Report 2021
NOTES OF CONSOLIDATED FINANCIAL STATEMENTS
(22) Trade and Other Payables
Trade and other payables are classified as financial liabilities measured at amortized cost. The breakdown is shown below.
Millions of yen Thousands of U.S. dollars
As of March 31, 2020
As of March 31, 2021
As of March 31, 2021
Trade Payable
Notes and accounts payable-trade ¥61,156 ¥ 73,751 $666,166
Other Payable
Accounts payable-other, and accrued expenses 31,178 26,521 239,553
Other 504 525 4,741
Total ¥92,839 ¥100,797 $910,460
(23) Employee Benefits
1) Outline of Post-Employment Benefit Plans
The Company and certain consolidated subsidiaries have adopted funded and unfunded defined benefit plans and defined contribution plans, and virtually all employees of these companies are covered by these plans. In Japan, defined benefit plans under the Defined-benefit Corporate Pension Act, defined benefit corporate pension plans and lump-sum retirement benefit plans have been operational. The amount of these benefits is calculated based on certain points, etc., given in accordance with service years and contribution. These pension plans are exposed to general investment risk, interest rate risk, inflation risk and others. Funded defined benefit plans have been operated by a corporate pension fund that is legally separated from the Group
in accordance with laws and regulations including Defined-Benefit Corporate Pension Act. The board of the corporate pension fund and the pension-managing trustee are required by laws and regulations to act in the best interests of plan participants, and are responsible for managing plan assets based on predetermined policies. The management of plan assets is conducted based on basic asset allocation aimed to ensure stable revenue in the medium to long term within the limits of tolerable risks, in order to ensure the payment of pension benefits, etc., at present and in the future. The basic asset allocation is periodically reviewed in order to respond to changes in the market environment and the funding position from initial assumptions made.
2) Defined Benefit Plans
(i) Reconciliation of Defined Benefit Plan Obligations and Plan Assets
The relationship between defined benefit plan obligations and plan assets, and net defined benefit liabilities and assets recorded in the consolidated statement of financial position is as follows:
Millions of yen Thousands of U.S. dollars
As of March 31, 2020
As of March 31, 2021
As of March 31, 2021
Present value of funded retirement benefit obligation ¥ 38,349 ¥ 38,495 $ 347,712
Fair value of plan assets (37,472) (40,114) (362,334)
Subtotal 877 (1,619) (14,622)
Present value of unfunded retirement benefit obligation 12,779 13,148 118,757
Total Net liability (asset) for retirement benefit ¥ 13,656 ¥ 11,529 $ 104,135
Amounts on consolidated statement of financial position
Retirement benefit liability 16,216 16,434 148,438
Retirement benefit asset (2,560) (4,905) (44,303)
Total Net liability (asset) for retirement benefit ¥ 13,656 ¥ 11,529 $ 104,135

42JSR Corporation Annual Report 2021
NOTES OF CONSOLIDATED FINANCIAL STATEMENTS
(ii) Reconciliation of Present Value of Defined Benefit Plan Obligations
Increase or decrease in the present value of defined benefit plan obligations is as follows:
Millions of yen Thousands of U.S. dollars
Fiscal year ended March 31, 2020
Fiscal year ended March 31, 2021
Fiscal year ended March 31, 2021
Balance of present value of retirement benefit obligation at the beginning of the fiscal year ¥52,139 ¥51,128 $461,817
Service cost 2,409 2,462 22,238
Interest expense 158 215 1,940
Remeasurement
Actuarial gains (losses) arising from changes in demographic assumptions (207) 53 475
Actuarial gains (losses) arising from changes in financial assumptions (827) 44 398
Benefits paid (2,333) (2,402) (21,700)
Other (212) 144 1,302
Balance of present value of retirement benefit obligation at the end of the fiscal year ¥51,128 ¥51,643 $466,469
The weighted average duration of defined benefit plan obligations was 13.7 years in the fiscal year ended March 31, 2020 and 13.3 years in the fiscal year ended March 31, 2021.
(iii) Reconciliation of Fair Value of Plan Assets
Increase or decrease in the fair value of plan assets is as follows:
Millions of yen Thousands of U.S. dollars
Fiscal year ended March 31, 2020
Fiscal year ended March 31, 2021
Fiscal year ended March 31, 2021
Balance of fair value of plan assets at the beginning of the fiscal year ¥37,772 ¥37,472 $338,468
Interest revenue 117 312 2,817
Remeasurement
Return on plan assets (84) 2,436 22,005
Contributions paid by the employer 1,677 1,519 13,717
Benefits paid (1,816) (1,703) (15,380)
Other (194) 78 708
Balance of fair value of plan assets at the end of the fiscal year ¥37,472 ¥40,114 $362,334
Contributions to defined benefit plans are determined by performing an actuarial review periodically so that balanced budgets can be maintained in the future. In the actuarial review, the Group reviews assumptions related to the determination of contributions (such as expected rate of interest, expected
mortality rate and expected withdrawal rate) and verifies the appropriateness of contributions determined. The Group will make contributions of ¥1,990 million ($17,973 thousand) in the fiscal year ending March 31, 2022.
(iv) Items of Plan Assets
Plan assets consisted of the following items.
Millions of yen
As of March 31, 2020 As of March 31, 2021
Assets for which active market
prices are available
Assets for which active market prices are not
available Total
Assets for which active market
prices are available
Assets for which active market prices are not
available Total
Cash and cash equivalents ¥ 3,861 ¥ — ¥ 3,861 ¥ 4,546 ¥ — ¥ 4,546
Equity instruments
Domestic equity securities 1,149 — 1,149 1,482 — 1,482
Foreign equity securities 3,316 — 3,316 4,005 — 4,005
Debt instruments
Domestic bonds 9,197 — 9,197 9,669 — 9,669
Foreign bonds 10,657 — 10,657 10,632 — 10,632
General accounts of life insurance — 660 660 — 688 688
Alternative investments* — 8,632 8,632 — 9,090 9,090
Total ¥28,180 ¥9,292 ¥37,472 ¥30,335 ¥9,779 ¥40,114
*Alternative investments include hedge funds.

43JSR Corporation Annual Report 2021
NOTES OF CONSOLIDATED FINANCIAL STATEMENTS
Thousands of U.S. dollars
As of March 31, 2021
Assets for which active market
prices are available
Assets for which active market prices are not
available Total
Cash and cash equivalents $ 41,064 $ — $ 41,064
Equity instruments
Domestic equity securities 13,390 — 13,390
Foreign equity securities 36,175 — 36,175
Debt instruments
Domestic bonds 87,340 — 87,340
Foreign bonds 96,037 — 96,037
General accounts of life insurance — 6,218 6,218
Alternative investments* — 82,110 82,110
Total $274,006 $88,328 $362,334
*Alternative investments include hedge funds.
(v) Main Component Used for Actuarial Assumption
%
As of March 31, 2020
As of March 31, 2021
Discount rates (weighted average) 0.51 0.50
(vi) Sensitivity Analysis
In the fiscal year ended March 31, 2021, a 0.5% increase (decrease) in the discount rate used in actuarial calculation would have resulted in a decrease (increase) in the present value of defined benefit plan obligations by ¥2,751 million ($24,849 thousand). This provisional calculation assumes that variables other than the assumptions used in the calculation are
constant. In reality, since individual assumptions are affected by changes in economic indicators and conditions at the same time, the assumptions are expected to change independently or in a correlated fashion, and the actual effects of such changes on defined benefit plan obligations may differ from the expected effects.
3) Defined Contribution Plans
The amount recognized as expenses in relation to defined contribution plans was ¥1,273 million in the fiscal year ended March 31, 2020 and ¥1,427 million ($12,893 thousand) in the fiscal year ended March 31, 2021.
4) Employee Benefits Expense
The total amount of employee benefits expense included in “cost of sales” and “selling, general and administrative expenses” in the consolidated statement of profit or loss in the fiscal year ended March 31, 2020 and the fiscal year ended March 31, 2021 was ¥3,724 million and ¥3,792 million ($34,254 thousand), respectively.

44JSR Corporation Annual Report 2021
NOTES OF CONSOLIDATED FINANCIAL STATEMENTS
(25) Other Liabilities
Other liabilities include the following items.
Millions of yen Thousands of U.S. dollars
As of March 31, 2020
As of March 31, 2021
As of March 31, 2021
Other current liabilities
Unearned revenue ¥ 52 ¥ 55 $ 501
Accrued bonuses 5,188 5,254 47,461
Accrued consumption taxes 860 1,019 9,205
Other 3,386 3,867 34,930
Total 9,486 10,196 92,097
Other non-current assets
Provision for environmental measures 804 787 7,111
Other 2,864 4,349 39,281
Total ¥3,667 ¥ 5,136 $46,392
(Note) “Contract liabilities” included in “Other current liabilities” in the previous fiscal year have been reclassified as a separate item in the current fiscal year, because the amount has become significant. The change is reflected in the above-mentioned previous fiscal year.
(24) Provisions
Increase or decrease in provisions are the following:
Millions of yen Thousands of U.S. dollars
Provision for loss on business restructuring
Provision for loss on business restructuring
As of April 1, 2020 ¥ — $ —
Increase 1,837 16,594
As of March 31, 2021 ¥1,837 $16,594
Provision for Loss on Business RestructuringTo provide for losses due to business restructuring that are expected to arise for the future, the estimated loss is reported.
The payment period is within one year from the end of the fiscal year.
Provisions on consolidated statement of financial position consisted of the following:
Millions of yen Thousands of U.S. dollars
As of March 31, 2021
As of March 31, 2021
Current liabilities ¥1,837 $16,594
Total ¥1,837 $16,594

45JSR Corporation Annual Report 2021
NOTES OF CONSOLIDATED FINANCIAL STATEMENTS
(26) Equity and Other Equity Items
1) Share Capital and Capital Surplus
Capital surplus consists of legal capital surplus and other capital surplus. The Companies Act of Japan (hereinafter the “Companies Act”) stipulates that at least half of the payment or contribution at the share issue shall be credited to share capital, and the remaining amount may be recorded as legal capital surplus included in capital surplus. In addition, under the Companies Act, legal capital surplus may be credited to share capital by resolution of the general meeting of shareholders.
Increase or decrease in the number of authorized shares and the number of issued shares are as follows:
Number of shares authorized Number of shares issued
As of April 1, 2019 696,061,000 226,126,145
Increase/Decrease — —
As of March 31, 2020 696,061,000 226,126,145
Increase/Decrease — —
As of March 31, 2021 696,061,000 226,126,145
(Note) All shares issued by the Company are ordinary shares with no rights limitations and without par value and restricted shares. Issued shares are fully paid.
2) Treasury Shares
The Companies Act stipulates that entities may determine the number of shares to be acquired, the total amount of acquisition price, etc., and acquire treasury shares by resolution of the general meeting of shareholders, to the extent of the distributable amount. Moreover, in the case of acquisition
through market transactions or a takeover bid, treasury shares may be acquired by resolution of the Board of Directors within the requirements prescribed in the Companies Act in accordance with the provisions of the Articles of Incorporation.
Increase or decrease in the number of treasury shares is as follows:
Number of shares
As of April 1, 2019 5,694,949
Increase/Decrease 5,717,359
As of March 31, 2020 11,412,308
Increase/Decrease (188,973)
As of March 31, 2021 11,223,335
(Note) Increase or decrease during the period is mainly due to the disposal of treasury stock as the restricted share-based remuneration.
3) Retained Earnings
Retained earnings consist of legal retained earnings and other retained earnings. The Companies Act stipulates that one-tenth of the amount paid as dividends of surplus shall be reserved as legal capital surplus or legal retained earnings until the sum of legal capital surplus included in capital surplus and legal retained earnings
included in retained earnings reaches one quarter of share capital. Accumulated legal retained earnings may be appropriated to cover a deficit. It is specified that legal retained earnings may be reversed by resolution of the general meeting of shareholders.

46JSR Corporation Annual Report 2021
NOTES OF CONSOLIDATED FINANCIAL STATEMENTS
4) Other Components of Equity
Fiscal year ended March 31, 2020 (April 1, 2019 to March 31, 2020)
Millions of yen
Net change in financial assets
measured at fair value
through other comprehensive
income
Net change in fair value on cash flow
hedges
Exchange differences
on translation of foreign operations
Remeasure-ments of
defined benefit plans
Restricted shares Other Total
As of April 1, 2019 ¥19,508 ¥ 30 ¥ (293) ¥ — ¥(26) ¥(460) ¥18,758
Other comprehensive income (1,320) (63) (4,364) 630 — — (5,118)
Total comprehensive income (1,320) (63) (4,364) 630 — — (5,118)
Share-based remuneration plan — — — — (47) — (47)
Transfer from other components of equity to retained earnings (7,338) — — (630) — — (7,968)
Total transactions with owners, etc. (7,338) — — (630) (47) — (8,014)
As of March 31, 2020 ¥10,849 ¥(34) ¥(4,657) ¥ — ¥(73) ¥(460) ¥ 5,626
Fiscal year ended March 31, 2021 (April 1, 2020 to March 31, 2021)
Millions of yen
Net change in financial assets
measured at fair value
through other comprehensive
income
Net change in fair value on cash flow
hedges
Exchange differences
on translation of foreign operations
Remeasure-ments of
defined benefit plans
Restricted shares Other Total
As of April 1, 2020 ¥10,849 ¥(34) ¥(4,657) ¥ — ¥(73) ¥(460) ¥ 5,626
Other comprehensive income 5,055 14 5,038 1,590 — — 11,697
Total comprehensive income 5,055 14 5,038 1,590 — — 11,697
Share-based remuneration plan — — — — (9) — (9)
Transfer from other components of equity to retained earnings (808) — — (1,590) — — (2,399)
Changes in non-controlling interests — — (27) — — — (27)
Other movements — — — — — 460 460
Total transactions with owners, etc. (808) — (27) (1,590) (9) 460 (1,975)
As of March 31, 2021 ¥15,096 ¥(20) ¥ 354 ¥ — ¥(82) ¥ — ¥15,348
Fiscal year ended March 31, 2021 (April 1, 2020 to March 31, 2021)
Thousands of U.S. dollars
Net change in financial assets
measured at fair value
through other comprehensive
income
Net change in fair value on cash flow
hedges
Exchange differences
on translation of foreign operations
Remeasure-ments of
defined benefit plans
Restricted shares Other Total
As of April 1, 2020 $ 97,996 $(305) $(42,065) $ — $(659) $(4,151) $ 50,816
Other comprehensive income 45,656 128 45,506 14,365 — — 105,655
Total comprehensive income 45,656 128 45,506 14,365 — — 105,655
Share-based remuneration plan — — — — (80) — (80)
Transfer from other components of equity to retained earnings (7,300) — — (14,365) — — (21,665)
Changes in non-controlling interests — — (243) — — — (243)
Other movements — — — — — 4,151 4,151
Total transactions with owners, etc. (7,300) — (243) (14,365) (80) — (17,837)
As of March 31, 2021 $136,352 $(177) $ 3,199 $ — $(739) $ — $138,634

47JSR Corporation Annual Report 2021
NOTES OF CONSOLIDATED FINANCIAL STATEMENTS
(a) Net Change in Financial Assets Measured at Fair Value through Other Comprehensive Income
It represents valuation differences on fair value of equity instruments measured at fair value through other comprehensive income.
(b) Net Change in Fair Value of Cash Flow HedgesIt represents change in profit or loss on valuation of derivatives as hedging instruments that were recorded in the statement of comprehensive income on and before the date of cessation of hedge accounting.
(c) Exchange Differences on Translation of Foreign Operations
They represent translation differences on foreign operations’ financial statements.
(d) Remeasurements of Defined Benefit Liabilities (Assets)Remeasurements of defined benefit liabilities (assets) are changes in actuarial differences, return on plan assets (excluding the amount included in interest revenue) and the effect of the asset ceiling (excluding the amount included in interest revenue). Actuarial differences are adjustments based on actual results related to defined benefit plan obligations (differences between actuarial assumptions at the beginning of the period and actual results) and the effect of changes in actuarial assumptions. These items are recognized in other
comprehensive income when they arise, and are immediately transferred from other components of equity to retained earnings.
(e) Restricted SharesUnder the restricted share-based remuneration plan, monetary remuneration to be used as contributed properties for restricted shares is provided. The amount equivalent to fair value of remuneration determined at the initial recognition is recorded in share capital, and recognized as the amount debited to other components of equity. Over the vesting period, other components of equity recognized as the debited amount are deducted at the time when remuneration cost is recognized.Details of the restricted share-based remuneration plan are provided in the note “(35) Share-based remuneration.”
(f) The Company has entered into an agreement with non- controlling shareholders that the Company purchases all interests held by the non-controlling shareholders under certain terms and conditions. With regard to the obligations to purchase these interests, the present value of the purchase amount had been recognized as financial liabilities, and the same amount had been reduced from other components of equity in the previous fiscal year. The carrying amount of financial liabilities at the time of extinguishment was transferred to capital surplus because the obligations to purchase these interests expired in the current fiscal year.

48JSR Corporation Annual Report 2021
NOTES OF CONSOLIDATED FINANCIAL STATEMENTS
(27) Dividends
The amounts of dividends paid are as follows:
Fiscal year ended March 31, 2020 (April 1, 2019 to March 31, 2020)
ResolutionClass of shares
Total amount of dividends
Dividends per share Record date
Effective date of dividends
Source of dividends
Ordinary General Meeting of Shareholders on June 18, 2019 Ordinary Shares ¥6,613 million ¥30 March 31,
2019June 19,
2019 Retained Earnings
Board of Directors Meeting on October 28, 2019 Ordinary Shares ¥6,441 million ¥30 September 30,
2019November 27,
2019 Retained Earnings
Fiscal year ended March 31, 2021 (April 1, 2020 to March 31, 2021)
ResolutionClass of shares
Total amount of dividends
Dividends per share Record date
Effective date of dividends
Source of dividends
Ordinary General Meeting of Shareholders on June 17, 2020 Ordinary Shares ¥6,441 million
($58,183 thousand) ¥30 ($0.27) March 31, 2020
June 18, 2020 Retained Earnings
Board of Directors Meeting on October 27, 2020 Ordinary Shares ¥6,447 million
($58,233 thousand) ¥30 ($0.27) September 30, 2020
November 27, 2020 Retained Earnings
Dividends of which record dates belong to the current fiscal year and of which effective dates of dividends fall after the end of the current fiscal year are as follows:
Fiscal year ended March 31, 2020 (April 1, 2019 to March 31, 2020)
ResolutionClass of shares
Total amount of dividends
Dividends per share Record date
Effective date of dividends
Source of dividends
Ordinary General Meeting of Shareholders on June 17, 2020 Ordinary Shares ¥6,441 million ¥30 March 31,
2020June 18,
2020 Retained Earnings
Fiscal year ended March 31, 2021 (April 1, 2020 to March 31, 2021)
ResolutionClass of shares
Total amount of dividends
Dividends per share Record date
Effective date of dividends
Source of dividends
Ordinary General Meeting of Shareholders on June 17, 2021 Ordinary Shares ¥6,447 million
($58,234 thousand) ¥30 ($0.27) March 31, 2021
June 18, 2021 Retained Earnings

49JSR Corporation Annual Report 2021
NOTES OF CONSOLIDATED FINANCIAL STATEMENTS
(28) Revenue
1) Disaggregation of Revenue
Regarding the revenue arising from contracts with the Group’s customers, the breakdown of revenue into domestic and overseas and its relation to the reportable segments are as follows:
Fiscal year ended March 31, 2020 (April 1, 2019 to March 31, 2020)
Millions of yen
Domestic Overseas Total
The Reportable Segments
Digital Solutions ¥ 27,853 ¥116,953 ¥144,805
Semiconductor Materials 16,899 67,095 83,994
Display Materials 5,350 43,638 48,988
Edge Computing Materials 5,604 6,220 11,823
Life Sciences 9,912 40,584 50,496
Elastomers 103,219 75,575 178,794
Plastics 55,969 39,124 95,092
Other 1,286 1,493 2,779
Total ¥198,238 ¥273,729 ¥471,967
Adjustment 0 — 0
Amount Recorded in the Consolidated Financial Statements ¥198,238 ¥273,729 ¥471,967
Fiscal year ended March 31, 2021 (April 1, 2020 to March 31, 2021)
Millions of yen
Domestic Overseas Total
The Reportable Segments
Digital Solutions ¥ 28,152 ¥123,268 ¥151,420
Semiconductor Materials 19,269 75,585 94,855
Display Materials 4,919 42,436 47,354
Edge Computing Materials 3,964 5,247 9,211
Life Sciences 12,369 42,828 55,197
Elastomers 84,967 58,219 143,186
Plastics 47,817 31,306 79,123
Other 11,333 6,350 17,682
Total ¥184,637 ¥261,971 ¥446,609
Adjustment 0 — 0
Amount Recorded in the Consolidated Financial Statements ¥184,637 ¥261,971 ¥446,609
Fiscal year ended March 31, 2021 (April 1, 2020 to March 31, 2021)
Thousands of U.S. dollars
Domestic Overseas Total
The Reportable Segments
Digital Solutions $ 254,286 $1,113,435 $1,367,721
Semiconductor Materials 174,053 682,734 856,787
Display Materials 44,428 383,306 427,734
Edge Computing Materials 35,805 47,395 83,200
Life Sciences 111,723 386,848 498,570
Elastomers 767,469 525,872 1,293,342
Plastics 431,917 282,772 714,689
Other 102,362 57,356 159,719
Total $1,667,757 $2,366,283 $4,034,040
Adjustment 1 — 1
Amount Recorded in the Consolidated Financial Statements $1,667,758 $2,366,283 $4,034,041

50JSR Corporation Annual Report 2021
NOTES OF CONSOLIDATED FINANCIAL STATEMENTS
(1) Digital Solutions BusinessIn Digital Solutions business, the Group manufactures and sells semiconductor materials, display materials, and products related to edge computing, etc. For the sales contracts on products and merchandise, the Group recognizes revenue upon delivery because the control of the products and merchandise is considered to be transferred to the customer and the performance obligation is satisfied by delivery.
(2) Life Sciences Business(i) Manufacturing and sale of in-vitro diagnostics and research
reagents, related materials, and bioprocess materials
For the sales contracts on products and merchandise, the Group recognizes revenue upon delivery because the control of the products and merchandise is considered to be transferred to the customer and the performance obligation is satisfied by delivery.
(ii) Contract development and manufacturing for bioprocess, etc.
The Group renders services in the contract research and manufacturing businesses related to bioprocess, etc. For rendering of services, the Group recognizes revenue at over time with fulfillment of performance obligation based on the contract between the Group and the customer.
(3) Elastomers BusinessIn Elastomers business, the Group manufactures and sells general-purpose synthetic rubber products for automobile tires, functional special synthetic rubber for automobile components, thermoplastic elastomers for modifying plastics, synthetic rubber latex for coated paper, etc. For the sales contracts on products and merchandise, the Group recognizes revenue upon delivery because the control of the products and merchandise is considered to be transferred to the customer and the performance obligation is satisfied by delivery.
(4) Plastics BusinessIn Plastics business, the Group manufactures and sells ABS and other resins for automobiles, office equipment, and amusement applications, etc. For the sales contracts on products and merchandise, the Group recognizes revenue upon delivery because the control of the products and merchandise is considered to be transferred to the customer and the performance obligation is satisfied by delivery.
2) Liabilities Arising from Contracts with the Customers
The Group recognizes unearned revenue arising from contracts with the customers as contract liabilities. The Group recognized almost all balances of contract liabilities at the beginning of the current fiscal year as revenue in that year, and there is no importance for the amounts carried over from the next fiscal year. In addition, in the current fiscal year, there is no significant amount of revenue arisen from the performance obligations which were satisfied in the past periods. The major changes in the contract liabilities in the current fiscal year are that unearned revenue from the customers temporarily increased in the Life Sciences Business.
3) Transaction Price Allocated to the Remaining Performance Obligations
The Group applies the practical expedient and omits information on the remaining performance obligations because there are no significant transactions with initial expected contractual terms exceeding one year. There are no significant amounts of consideration from contracts with customers that are not included in transaction prices. The consideration does not include a significant financing component, since the consideration for transaction prices is mainly collected within one year from the time of delivery of products and merchandise to customers or the agreement based on the contract such as milestone achievement.
4) Assets Recognized from the Costs of Obtaining or Fulfilling Contracts with Customers
There is no significance in the amount of assets recognized from the costs incurred to obtain or fulfill a contract with a customer in the current fiscal year. The Group applies the practical expedient of recognizing the incremental costs of obtaining a contract as an expense when incurred if the amortization period of the asset that the Group otherwise would have recognized is one year or less.

51JSR Corporation Annual Report 2021
NOTES OF CONSOLIDATED FINANCIAL STATEMENTS
(29) Selling, General and Administrative Expenses
1) Major items in selling, general and administrative expenses are as follows:
Millions of yen Thousands of U.S. dollars
Fiscal year ended March 31, 2020
Fiscal year ended March 31, 2021
Fiscal year ended March 31, 2021
Transportation and warehousing expenses ¥ 12,151 ¥ 11,242 $101,543
Salaries and allowances 23,651 25,475 230,104
Retirement benefit expenses 1,280 1,108 10,007
Experiment and research expenses 24,066 23,406 211,420
Depreciation 5,798 7,052 63,700
Supplies expenses 3,772 3,049 27,539
Business consignment expenses 3,544 3,745 33,830
Other 30,081 30,040 271,339
Total ¥104,343 ¥105,117 $949,481
2) Amount of research and development expense included in general and administrative expenses and manufacturing costs
Millions of yen Thousands of U.S. dollars
Fiscal year ended March 31, 2020
Fiscal year ended March 31, 2021
Fiscal year ended March 31, 2021
Research and development expense ¥25,233 ¥24,436 $220,716
(30) Other Operating Income and Expenses
Other operating income consisted of as follows:
Millions of yen Thousands of U.S. dollars
Fiscal year ended March 31, 2020
Fiscal year ended March 31, 2021
Fiscal year ended March 31, 2021
Gain on sales of non-current assets ¥ 7 ¥ 135 $ 1,221
Rent income 84 103 933
Other 1,213 1,552 14,019
Total ¥1,304 ¥1,790 $16,172
Other operating expenses consisted of as follows:
Millions of yen Thousands of U.S. dollars
Fiscal year ended March 31, 2020
Fiscal year ended March 31, 2021
Fiscal year ended March 31, 2021
Loss on abandonment of non-current assets ¥ 657 ¥ 278 $ 2,512
Loss on sales of non-current assets 61 84 760
Impairment loss 1,514 — —
Business Restructuring expenses* -— 84,021 758,928
Other 2,646 3,200 28,908
Total ¥4,879 ¥87,584 $791,108
* Business Restructuring expenses mainly consisted of costs related to structural reforms in the Elastomers Business of ¥81,563 million ($736,725 thousand) and costs related to structural reforms in the Display Solutions Business of ¥2,458 million ($22,203 thousand). The main contents are impairment losses on non-current assets of ¥79,575 million ($718,771 thousand) and special retirement benefits.

52JSR Corporation Annual Report 2021
NOTES OF CONSOLIDATED FINANCIAL STATEMENTS
(31) Financial Income and Costs
Financial income consisted of the following:
Millions of yen Thousands of U.S. dollars
Fiscal year ended March 31, 2020
Fiscal year ended March 31, 2021
Fiscal year ended March 31, 2021
Interest income
Financial assets measured at amortized cost ¥ 230 ¥188 $1,695
Dividend income
Equity financial assets measured at fair value through other comprehensive income 1,139 715 6,458
Foreign exchange gains 559 35 314
Other — 10 86
Total ¥1,929 ¥947 $8,552
Financial costs consisted of the following:
Millions of yen Thousands of U.S. dollars
Fiscal year ended March 31, 2020
Fiscal year ended March 31, 2021
Fiscal year ended March 31, 2021
Interest expenses
Financial liabilities measured at amortized cost ¥1,210 ¥1,206 $10,892
Lease liabilities 615 537 4,852
Other* 359 0 4
Total ¥2,184 ¥1,743 $15,748
*“Other” in the previous fiscal year is mainly profit or loss on shares of subsidiaries.
(32) Other Comprehensive Income
Changes in items of other comprehensive income are shown below: Amount incurred and reclassification for profit or loss in items of other comprehensive income, and effects of income tax are shown below:
Fiscal year ended March 31, 2020 (April 1, 2019 to March 31, 2020)
Millions of yen
Amount incurred Reclassification Before tax Income tax Net of tax
Other comprehensive income that will not be reclassified to profit or loss
Net change in financial assets measured at fair value through other comprehensive income ¥(2,034) ¥ — ¥(2,034) ¥657 ¥(1,377)
Remeasurements of defined benefit plans 952 — 952 (292) 661
Share of other comprehensive income of investments accounted for using the equity method (31) — (31) — (31)
Total ¥(1,113) ¥ — ¥(1,113) ¥366 ¥ (747)
Items that may be reclassified to profit or loss
Cash flow hedges (103) (22) (124) — (124)
Exchange differences on translation of foreign operations (4,068) (43) (4,111) — (4,111)
Share of other comprehensive income of investments accounted for using the equity method (904) — (904) — (904)
Total ¥(5,075) ¥(64) ¥(5,139) ¥ — ¥(5,139)
Total ¥(6,187) ¥(64) ¥(6,252) ¥366 ¥(5,886)

53JSR Corporation Annual Report 2021
NOTES OF CONSOLIDATED FINANCIAL STATEMENTS
Fiscal year ended March 31, 2021 (April 1, 2020 to March 31, 2021)
Millions of yen
Amount incurred Reclassification Before tax Income tax Net of tax
Other comprehensive income that will not be reclassified to profit or loss
Net change in financial assets measured at fair value through other comprehensive income ¥ 7,342 ¥— ¥ 7,342 ¥(2,241) ¥ 5,101
Remeasurements of defined benefit plans 2,072 — 2,072 (635) 1,438
Share of other comprehensive income of investments accounted for using equity method 68 — 68 — 68
Total ¥ 9,482 ¥— ¥ 9,482 ¥(2,875) ¥ 6,607
Items that may be reclassified to profit or loss
Cash flow hedges (10) 37 28 — 28
Exchange differences on translation of foreign operations 6,167 — 6,167 — 6,167
Share of other comprehensive income of investments accounted for using the equity method 65 — 65 — 65
Total ¥ 6,223 ¥37 ¥ 6,260 ¥ — ¥ 6,260
Total ¥15,705 ¥37 ¥15,742 ¥(2,875) ¥12,867
Fiscal year ended March 31, 2021 (April 1, 2020 to March 31, 2021)
Thousands of U.S. dollars
Amount incurred Reclassification Before tax Income tax Net of tax
Other comprehensive income that will not be reclassified to profit or loss
Net change in financial assets measured at fair value through other comprehensive income $ 66,315 $ — $ 66,315 $(20,239) $ 46,076
Remeasurements of defined benefit plans 18,717 — 18,717 (5,731) 12,986
Share of other comprehensive income of investments accounted for using the equity method 615 — 615 — 615
Total $ 85,647 $ — $ 85,647 $(25,970) $ 59,677
Items that may be reclassified to profit or loss
Cash flow hedges (88) 339 251 — 251
Exchange differences on translation of foreign operations 55,709 — 55,709 — 55,709
Share of other comprehensive income of investments accounted for using the equity method 585 — 585 — 585
Total $ 56,206 $339 $ 56,545 $ — $ 56,545
Total $141,853 $339 $142,192 $(25,970) $116,222

54JSR Corporation Annual Report 2021
NOTES OF CONSOLIDATED FINANCIAL STATEMENTS
(33) Earnings per Share
Fiscal year ended March 31, 2020
Fiscal year ended March 31, 2021
Fiscal year ended March 31, 2021
1) Basic earnings (loss) per share ¥104.38 ¥(256.73) $(2.32)
Continuing operations ¥103.22 ¥(256.73) $(2.32)
Discontinued operations ¥1.16 ¥— $—
(Basis of calculation)
Profit (loss) attributable to owners of parent ¥22,604 million ¥(55,155) million $(498,197) thousand
Continuing operations ¥22,352 million ¥(55,155) million $(498,197) thousand
Discontinued operations ¥252 million — —
Average shares outstanding during the year (1,000 shares) 216,545 214,838 214,838
2) Diluted earnings (loss) per share ¥104.19 ¥(256.73) $(2.32)
Continuing operations ¥103.03 ¥(256.73) $(2.32)
Discontinued operations ¥1.16 ¥— $—
(Basis of calculation)
Increase in common stock due to stock options (1,000 shares) 405 — —
Average diluted shares outstanding during the year (1,000 shares) 216,950 214,838 214,838
(Note) Dilutive potential ordinary shares are 331 thousand shares in the current fiscal year.These are excluded from the calculation of the Diluted loss per share because these have reverse dilution effect.
(34) Share-based Remuneration
1) Stock Options
(i) Overview of Share-based Remuneration Plan
The Group operated an equity-settled share-based remuneration plan where it received services from directors, executive officers, and employees and paid equity instruments (options) as consideration thereof until June 2017. The fair value on the date the option was granted under the plan is recognized as an expense over the option’s vesting
period and the same amount is recorded as an increase of equity. The plan was terminated in June 2017 (however, share acquisition rights already granted as share-based stock options to directors, etc., that have not been exercised will be continued).
(ii) Number and Weighted Average Exercise Prices of Stock Options
Shares Yen Shares Yen U.S. dollars
Fiscal year ended March 31, 2020 Fiscal year ended March 31, 2021
Number of sharesWeighted average
exercise price Number of sharesWeighted average
exercise priceWeighted average
exercise price
Outstanding at the beginning 480,200 ¥ 1 361,000 ¥ 1 $0.01
Granted — — — — —
Exercised (119,200) 1 (48,400) 1 0.01
Forfeited — — — — —
Expired — — — — —
Outstanding at the end 361,000 1 312,600 1 0.01
Exercisable at the end 229,100 1 312,600 1 0.01
The weighted average share price as of the exercise date of stock options exercised during the period was ¥1,697 and ¥2,445 ($22.09) in the fiscal years ended March 31, 2020 and 2021, respectively. In the fiscal years ended March 31, 2020 and 2021, the exercise price of unexercised stock options was ¥1 each.
The weighted average remaining contract terms in the fiscal years ended March 31, 2020 and 2021 were 10.5 years and 10.2 years, respectively, for the unexercised balance at the end of the fiscal year, and 10.0 years and 10.2 years, respectively, for the exercisable balance at the end of the fiscal year.

55JSR Corporation Annual Report 2021
NOTES OF CONSOLIDATED FINANCIAL STATEMENTS
2) Restricted Share-based Remuneration Plan
The Group employs the restricted share-based remuneration plan in order to further promote sharing of values with shareholders and establish a remuneration structure that contributes to sustained improvement in corporate value in the medium to long term. Under this plan, to grant restricted shares to directors, excluding outside directors, and executive officers (hereinafter “Eligible Directors, etc.”), the Company is to provide the Eligible Directors, etc., with claims for monetary remuneration in principle in each period and have them contribute these claims in kind as contributed properties to the Company. Accordingly, the Company is to issue or dispose of ordinary shares of the Company to the Eligible Directors, etc., and make them hold the shares. The Company enters into an agreement with Eligible Directors, etc., for allotment of restricted shares, and Eligible Directors, etc., cannot transfer, pledge or dispose of in any other way shares granted under the allotment agreement at will during a given period of time stipulated in the agreement (hereinafter the “Transfer Restriction Period”) (hereinafter, the “Transfer Restriction”). The Transfer Restriction is lifted for all shares held by Eligible Directors, etc., when the Transfer Restriction Period expires, on the condition that the Eligible Directors, etc., continued to hold a position of directors, executive officers, audit & supervisory board members,
employees, or any other equivalent position of the Company or its subsidiaries during the Transfer Restriction Period. On the other hand, under this structure, shares for which the Transfer Restriction has not been lifted at the time when the Transfer Restriction Period expires are acquired by the Company without any payment in principle.
Details of restricted shares granted during the period are as follows:
Fiscal year ended March 31, 2021(from April 1, 2020 to March 31, 2021)
Number of restricted shares granted 155,100 shares
Fair value on the grant date ¥2,110 per share ($19.06 per share)
Calculation method for fair value measurement
Calculated on the basis of closing price of ordinary shares of the Company at the Tokyo Stock Exchange on the business day proceeding the date when the Board of Directors adopted a resolution.
Transfer Restriction Period 3 years
3) Share-based Remuneration Expense
The amount of share-based remuneration expense included in “selling, general and administrative expenses” in the consolidated statement of profit or loss was ¥245 million in the fiscal year ended March 31, 2020 and ¥318 million ($2,876 thousand) in the fiscal year ended March 31, 2021.
(35) Financial Instruments
1) Capital Management Policy
The Group considers it vitally important to improve corporate performance on a long-term basis and achieve improvement in corporate value in the medium to long term by strengthening its research and development activities from a long-term viewpoint and enhancing competitiveness through development of new businesses. For capital efficiency, the Group monitors ROE on a timely basis.
2) Financial Risks
The Group is exposed to financial risks related to operating activities (market risk, credit risk and liquidity risk), and conducts risk management based on a certain policy to avoid or mitigate effects of the risks. For fund management, approval of the Company’s Board of Directors is received in principle at the beginning of each period. Transactions and risk management during the period are principally conducted based on internal management regulations. The Group uses derivatives to avert
risks described below, and as its policy, does not perform any speculative transaction.
(i) Market Risks
(a) Exchange Rate RisksThe Group operates business globally and sells products manufactured by the Company and each subsidiary and others abroad. Thus, the Group is exposed to the risk that profit or loss, cash flows, etc., are affected by fluctuations in exchange rates. To avoid exchange rate risks, the Group mainly utilizes foreign exchange forward contracts as derivative transactions for trade receivables and payables denominated in foreign currencies. The Company’s responsible department manages risks in accordance with the derivative transaction management regulations that specify authority for transactions, maximum amount, etc., and reports monthly trading results to responsible directors.

56JSR Corporation Annual Report 2021
NOTES OF CONSOLIDATED FINANCIAL STATEMENTS
Details of currency derivatives are as follows:
Derivative Transactions to which Hedge Accounting Is Not Applied
Millions of yen
As of March 31, 2020 As of March 31, 2021
Contracted Amount
Later than one year Fair value
Contracted Amount
Later than one year Fair value
Forward exchange contracts
Purchase ¥ 585 ¥— ¥ 4 ¥ 651 ¥— ¥ 16
Sell 6,670 — (49) 8,584 — (462)
Total ¥7,255 ¥— ¥(44) ¥9,235 ¥— ¥(447)
Thousands of U.S. dollars
As of March 31, 2021
Contracted Amount
Later than one year Fair value
Forward exchange contracts
Purchase $ 5,878 $— $ 142
Sell 77,538 — (4,176)
Total $83,416 $— $(4,035)
Millions of yen
As of March 31, 2020 As of March 31, 2021
Assumed principal
Later than one year Fair value
Contracted Amount
Later than one year Fair value
Currency swap
U.S. dollars ¥— ¥— ¥— ¥ 6,975 ¥4,982 ¥(228)
EUR — — — 6,620 — (33)
Total ¥— ¥— ¥— ¥13,595 ¥4,982 ¥(262)
Thousands of U.S. dollars
As of March 31, 2021
Assumed principal
Later than one year Fair value
Currency swap
U.S. dollars $ 63,000 $45,000 $(2,064)
EUR 59,794 — (300)
Total $122,794 $45,000 $(2,363)
Although the Group does not apply hedge accounting to these derivative transactions, it considers that the transactions effectively offset effects of exchange fluctuations.
Exposure to Exchange Rate RisksThe Group’s exposure of Japanese yen, Korean won and Thai baht as functional currencies against the US dollar, the major foreign currency, is as follows. These amounts are after deduction of amounts of exchange rate risks hedged through derivative transactions, etc.
Millions of yen Thousands of U.S. dollars
Functional CurrencyAs of March 31,
2020As of March 31,
2021As of March 31,
2021
Japanese yen ¥4,613 ¥1,954 $17,646
Korean won 3,472 780 7,042
Thai baht 3,831 7,379 39,156

57JSR Corporation Annual Report 2021
NOTES OF CONSOLIDATED FINANCIAL STATEMENTS
Foreign Exchange Sensitivity AnalysisWith regard to foreign currency receivables and payables held by the Group at the end of each fiscal year, effects of 1% depreciation of the US dollar against each functional currency on profit before tax in the consolidated statement of profit or loss are as follows. If each currency moves inversely, this will have effects opposite to and at the same amount as the table below. The calculation is based on the assumption that currencies other than the currency used do not fluctuate.
Millions of yen Thousands of U.S. dollars
Functional CurrencyAs of March 31,
2020As of March 31,
2021As of March 31,
2021
Japanese yen (weak U.S. dollar) ¥(46) ¥(20) $(176)
Korean won (weak U.S. dollar) (35) (8) (70)
Thai baht (weak U.S. dollar) (38) (74) (392)
The Group hedges against the risk of exchange rate fluctuations regarding net investment in foreign operations by using foreign currency borrowings. The Group designates it as hedges of net investment.
(b) Equity Price RisksEquity instruments held by the Group are principally shares of companies with which the Group has business relationships. These shares were acquired to expand businesses mutually and enhance the transaction relationships, and the Group does not hold the shares for the purpose of short-term trading. Equity instruments include listed shares and unlisted shares. The Group periodically monitors market value, financial conditions of the issuers (business partners), etc., and reviews the ownership in light of the relationships with the business partners. If the share price increases (decreases) by 5% with other changing factors remaining constant, other components of equity (net of related tax effects) will increase (decrease) by ¥1,252 million ($11,312 thousand) for the fiscal year ended March 31, 2021 (fiscal year ended March 31, 2020: ¥1,001 million) due to the change in fair value.
(c) Interest Rate RisksThe Group is exposed to interest rate fluctuation risks because it receives variable-rate loans from financial institutions. For variable-rate, long-term borrowings involving interest rate fluctuation risks, the Group mitigates the risks by fixing cash flows using interest rate swap transactions, and applies cash flow hedges. Exposure to interest rate fluctuation risks for the Group is limited, and effects of interest rate fluctuations are insignificant.
(ii) Credit Risks
The Group’s trade and other receivables, other financial assets, etc., are exposed to credit risks of customers. The Group establishes terms of collection and credit limit for transaction partners. In addition, the Group confirms the credit status periodically by obtaining the latest credit report on transaction partners from external organizations where necessary and analyzing the report as well as past results of collection and other factors. If it is considered that there is any change or abnormality in the credit status as a result of the confirmation, measures for protection of receivables are taken appropriately, including change in the credit limit, modification of the terms of collection or obtaining transaction credit insurance. In the execution of derivative transactions, the Group conducts transactions only with financial institutions with high credit ratings in principle to mitigate credit risks. The Group classifies receivables, etc., based on the nature of the credit risk to calculate loss allowance. In terms of trade receivables that do not include significant financial components, the loss allowance is always determined as the same amount as lifetime expected credit loss (simplified approach). The amount of expected credit loss is calculated by classifying receivables, etc., according to the nature of the credit risk of the counterparty and multiplying the receivables amount by the allowance rate set according to the classification. This allowance rate is set in view of the probability of future occurrence of credit loss based on external credit reports. In terms of other receivables, etc., the loss allowance is measured as the same amount as the 12-month expected credit loss in principle. The amount of expected credit loss is calculated by multiplying the gross carrying amount by the allowance rate established as stated above, in accordance with the general approach.

58JSR Corporation Annual Report 2021
NOTES OF CONSOLIDATED FINANCIAL STATEMENTS
Of other receivables, etc., in terms of assets for which the credit risk has significantly increased from the initial recognition, including the case where the receivable is past due for payment, and credit-impaired financial assets, the loss allowance is recognized at the same amount as lifetime expected credit loss. In doing so, the amount of expected credit loss is determined as the difference between the present value, which is calculated
by discounting future estimated cash flows using the original effective interest rate for the asset, and the gross carrying amount. The gross carrying amount and loss allowance of financial assets for which loss allowance is recognized are as shown below. Time deposits are excluded from the table below as those are considered to be not exposed to credit risks.
Millions of yen
Gross carrying amount
Trade and other receivables Other financial assets
Measured at 12-month expected
credit losses
Measured at lifetime expected
credit losses
Measured bysimplifiedapproach
Measured at 12-month expected
credit losses
Measured at lifetime expected
credit losses
As of March 31, 2020 ¥12,748 ¥ 0 ¥ 98,547 ¥3,879 ¥130
As of March 31, 2021 ¥16,676 ¥— ¥109,332 ¥3,802 ¥168
Thousands of U.S. dollars
As of March 31, 2021 $150,631 $— $987,533 $34,341 $1,519
* Financial assets for which loss allowance is measured at the amount equivalent to lifetime expected credit loss are principally credit-impaired financial assets.* Credit risk rating: For financial assets for which loss allowance is measured at 12-month expected credit loss, the credit risk rating for expected credit loss (assets to which the simplified approach is
applied also correspond to this) is relatively high compared to financial assets for which loss allowance is measured at the amount equivalent to lifetime expected credit loss, and the credit rating of financial assets falling in the same category is basically the same.
Millions of yen
Loss Allowance
Trade and other receivables Other financial assets
Measured at 12-month expected
credit losses
Measured at lifetime expected
credit losses
Measured bysimplifiedapproach
Measured at 12-month expected
credit losses
Measured at lifetime expected
credit losses
As of April 1, 2019 ¥— ¥ 0 ¥ 618 ¥ 1 ¥ 309
Increase — — 676 — 47
Decrease (Utilization) — — (28) — (225)
Decrease (Reversal) — — (545) (1) 0
Other — — 68 — (1)
As of March 31, 2020 ¥— ¥ 0 ¥ 789 ¥ 0 ¥ 130
Increase — — 299 2 40
Decrease (Utilization) — (0) (188) — —
Decrease (Reversal) — — (116) (1) —
Other — — (67) (1) 1
As of March 31, 2021 ¥— ¥— ¥ 717 ¥ 0 ¥ 168
Thousands of U.S. dollars
Loss Allowance
Trade and other receivables Other financial assets
Measured at 12-month expected
credit losses
Measured at lifetime expected
credit losses
Measured bysimplifiedapproach
Measured at 12-month expected
credit losses
Measured at lifetime expected
credit losses
As of March 31, 2020 $— $ 0 $ 7,123 $ 0 $1,173
Increase — — 2,700 — 360
Decrease (Utilization) — (0) (1,699) — —
Decrease (Reversal) — 0 (1,046) (5) (18)
Other — 0 (604) (10) 4
As of March 31, 2021 $— $ 0 $ 6,474 $ 1 $1,519
*There is no significant change in gross carrying amount that could affect a change in loss allowance.

59JSR Corporation Annual Report 2021
NOTES OF CONSOLIDATED FINANCIAL STATEMENTS
The maximum exposure for credit risk of financial assets is the carrying amount presented in the consolidated statement of financial position.
With regard to debt guarantees, the maximum exposure for credit risk is as follows:
Millions of yen Thousands of U.S. dollars
As of March 31, 2020
As of March 31, 2021
As of March 31, 2021
Guarantee Obligation ¥3,140 ¥— $—
*Loss allowance related to losses that could arise due to performance of a debt guarantee contract has not been recorded.
(iii) Liquidity Risks
Liquidity risks are the risks that the Group cannot execute a payment on the due date. Funds of the Group as a whole are in a position of net cash where funds held exceed borrowings. The Group formulates a financial plan based on the annual business
plan, and then manages liquidity risks by ensuring an appropriate balance between direct and indirect financing and between short-term and long-term financing to prepare for these risks.
The balance of financial liabilities of the Group by maturity is as follows:
Millions of yen
As of March 31, 2020Carrying amount
Not later than one year 1-2 years 2-3 years 3-4 years 4-5 years
Later than 5 years
Contractual cash flows
Total
Trade and other receivables ¥ 92,839 ¥ 92,839 ¥ — ¥ — ¥ — ¥ — ¥ — ¥ 92,839
Borrowings 82,726 30,210 13,816 8,186 12,109 19,527 379 84,226
Derivative liabilities 111 44 — — — — 66 111
Lease liabilities 18,766 3,425 3,313 1,965 1,824 1,609 8,332 20,468
Total ¥194,442 ¥126,518 ¥17,129 ¥10,151 ¥13,933 ¥21,136 ¥8,777 ¥197,644
Millions of yen
As of March 31, 2021Carrying amount
Not later than one year 1-2 years 2-3 years 3-4 years 4-5 years
Later than 5 years
Contractual cash flows
Total
Trade and other receivables ¥100,797 ¥100,797 ¥ — ¥ — ¥ — ¥ — ¥ — ¥100,797
Borrowings 84,409 38,067 8,954 13,705 15,033 8,272 1,389 85,421
Bonds payable 34,869 97 97 97 97 13,097 22,336 35,820
Derivative liabilities 815 544 — — — — 271 815
Lease liabilities 22,373 3,800 2,612 2,344 2,122 2,044 11,508 24,430
Total ¥243,263 ¥143,305 ¥11,662 ¥16,146 ¥17,252 ¥23,413 ¥35,504 ¥247,283
Thousands of U.S. dollars
As of March 31, 2021Carrying amount
Not later than one year 1-2 years 2-3 years 3-4 years 4-5 years
Later than 5 years
Contractual cash flows
Total
Trade and other receivables $ 910,460 $ 910,460 $ — $ — $ — $ — $ — $ 910,460
Borrowings 762,433 343,844 80,878 123,792 135,787 74,718 12,546 771,574
Bonds payable 314,955 874 874 874 874 118,298 201,749 323,544
Derivative liabilities 7,364 4,914 — — — — 2,450 7,364
Lease liabilities 202,084 34,327 23,590 21,174 19,165 18,466 103,948 220,669
Total $2,197,295 $1,294,419 $105,342 $145,840 $155,827 $211,482 $320,692 $2,233,611

60JSR Corporation Annual Report 2021
NOTES OF CONSOLIDATED FINANCIAL STATEMENTS
3) Fair Value of Financial Instruments
The Group classifies financial instruments into the following three levels in the fair value hierarchy according to the observability of inputs used for fair value measurement in markets: Level 1: Unadjusted quoted prices in active markets for identical assets or liabilities Level 2: Directly or indirectly observable inputs that are not included in Level 1 Level 3: Fair value that is determined using a valuation technique including unobservable inputs
Carrying amount and fair value of financial instruments measured at amortized cost are as follows:
Millions of yen Thousands of U.S. dollars
As of March 31, 2020 As of March 31, 2021 As of March 31, 2021
Carrying Amount Fair Value Carrying Amount Fair Value Carrying Amount Fair Value
Long-term loans payable ¥59,167 ¥58,412 ¥62,076 ¥60,874 $560,706 $549,850
Bonds payable — — 34,869 35,474 314,955 320,427
The above figures include balances to be collected within one year or to be repaid and redeemed within one year. Financial instruments for which the carrying amount is reasonably approximate to the fair value are not included in the table above. The fair value of long-term borrowings is calculated by discounting the total amount of principal and interest using the
interest rate at which a similar new loan is assumed to be made. Borrowings are classified as Level 3 in the fair value hierarchy. The fair value of bonds payable is calculated by discounting future cash flows using the current market interest rate. Bonds payable are classified as Level 2 in the fair value hierarchy.
Assets and liabilities measured at fair value by the Group are as follows:
Millions of yen
As of March 31, 2020 Level 1 Level 2 Level 3 Total
<Financial Assets>
Financial assets measured at fair value through profit or loss
Investments (equity financial assets) ¥ — ¥ — ¥ 3,582 ¥ 3,582
Derivatives — 3 — 3
Financial assets measured at fair value through other comprehensive income
Investments (equity financial assets) 20,013 — 16,360 36,373
Financial assets defined as hedging instruments
Derivatives — — — —
Total ¥20,013 ¥ 3 ¥19,942 ¥39,958
<Financial Liabilities>
Financial liabilities measured at fair value through profit or loss
Derivatives — 44 — 44
Financial liabilities measured at fair value through other comprehensive income
Financial liabilities defined as hedging instruments
Derivatives — 66 — 66
Total ¥ — ¥111 ¥ — ¥ 111

61JSR Corporation Annual Report 2021
NOTES OF CONSOLIDATED FINANCIAL STATEMENTS
Millions of yen
As of March 31, 2021 Level 1 Level 2 Level 3 Total
<Financial Assets>
Financial assets measured at fair value through profit or loss
Investments (equity financial assets) ¥ — ¥ — ¥ 3,805 ¥ 3,805
Derivatives — 1 — 1
Financial assets measured at fair value through other comprehensive income
Investments (equity financial assets) 25,141 — 17,239 42,380
Financial assets defined as hedging instruments
Derivatives — — — —
Total ¥25,141 ¥ 1 ¥21,044 ¥46,186
<Financial Liabilities>
Financial liabilities measured at fair value through profit or loss
Derivatives — 544 — 544
Financial liabilities measured at fair value through other comprehensive income
Financial liabilities defined as hedging instruments
Derivatives — 271 — 271
Total ¥ — ¥815 ¥ — ¥ 815
Thousands of U.S. dollars
As of March 31, 2021 Level 1 Level 2 Level 3 Total
<Financial Assets>
Financial assets measured at fair value through profit or loss
Investments (equity financial assets) $ — $ — $ 34,370 $ 34,370
Derivatives — 7 — 7
Financial assets measured at fair value through other comprehensive income
Investments (equity financial assets) 227,091 — 155,715 382,806
Financial assets defined as hedging instruments
Derivatives — — — —
Total $227,091 $ 7 $190,084 $417,183
<Financial Liabilities>
Financial liabilities measured at fair value through profit or loss
Derivatives — 4,914 — 4,914
Financial liabilities measured at fair value through other comprehensive income
Financial liabilities defined as hedging instruments
Derivatives — 2,450 — 2,450
Total $ — $7,364 $ — $ 7,364
(Note) Other than the above assets and liabilities, the Company has entered into an agreement with non-controlling shareholders that the Company purchases all interests held by the non-controlling shareholders under certain terms and conditions in the previous fiscal year. With regard to the obligations to purchase these interests, ¥460 million that is the present value of the purchase amount has been recognized as financial liabilities. These are classified as Level 3 in the fair value hierarchy. There is no recognition as financial liabilities because the obligations to purchase these interests expired in the current fiscal year.
Transfer between levels in the fair value hierarchy is recognized on the day when the event or change in circumstances that caused the transfer occurred. In each fiscal year, there was no significant transfer between Level 1 and Level 2 in the fair value hierarchy.

62JSR Corporation Annual Report 2021
NOTES OF CONSOLIDATED FINANCIAL STATEMENTS
Changes in financial instruments classified as Level 3 are as follows:
Millions of yen Thousands of U.S. dollars
Fiscal year ended March 31, 2020
(from April 1, 2019 to March 31, 2020)
Fiscal year ended March 31, 2021
(from April 1, 2020 to March 31, 2021)
Fiscal year ended March 31, 2021
(from April 1, 2020 to March 31, 2021)
Balance at the beginning ¥17,219 ¥19,942 $180,126
Total gains and losses 355 446 4,029
Profit or loss (271) (32) (286)
Other comprehensive income (Note) 625 478 4,315
Purchase 4,171 1,644 14,847
Selling (56) — —
Other (1,747) (934) (8,432)
Balance at the end ¥19,942 ¥21,098 $190,570
(Note) Gains and losses included in other comprehensive income relate to financial assets measured at fair value through other comprehensive income as at the reporting date. These gains and losses are included in “net change in financial assets measured at fair value through other comprehensive income” in the consolidated statement of comprehensive income.
Financial assets and liabilities classified as Level 2 are derivative transactions related to foreign exchange forward contracts, interest rate swaps, etc. Fair value of foreign exchange forward contracts, interest rate swaps, etc., is calculated based on observable market data such as the interest rate presented by financial institutions with which the Group has transactions and others.
Financial assets classified as Level 3 are mainly unlisted shares. With regard to valuation of unlisted shares, principally, the fair value is measured taking into account future profitability or cash flows of the investees comprehensively. The results are reviewed and approved by a person with appropriate authority. For financial instruments classified as Level 3, an increase or decrease in fair value if unobservable inputs are changed to reasonably possible alternative assumptions is not significant.
4) Hedge Accounting
Effects of hedging instruments designated as hedge on the Group’s consolidated statement of financial position are as follows:
Millions of yen
Notional principal of hedging instruments
Carrying amount of hedging instruments Item on the consolidated statement of financial positionAs of March 31, 2020 Asset Liability
Cash flow hedges
Interest rate risk
Interest rate swap ¥4,516 ¥— ¥ 66 Other financial liabilities
Hedging instruments of net investment in foreign operations
Exchange rate risk
Borrowings in U.S. dollars 11,862($109 million)
— 11,862 Borrowings
Millions of yen
Notional principal of hedging instruments
Carrying amount of hedging instruments Item on the consolidated statement of financial positionAs of March 31, 2021 Asset Liability
Cash flow hedges
Interest rate risk
Interest rate swap ¥2,048 ¥— ¥ 38 Other financial liabilities
Hedging instruments of net investment in foreign operations
Exchange rate risk
Borrowings in U.S. dollars 8,691($79 million)
— 8,691 Borrowings

63JSR Corporation Annual Report 2021
NOTES OF CONSOLIDATED FINANCIAL STATEMENTS
Thousands of U.S. dollars
Notional principal of hedging instruments
Carrying amount of hedging instruments Item on the consolidated statement of financial positionAs of March 31, 2021 Asset Liability
Cash flow hedges
Interest rate risk
Interest rate swap $18,500 $— $ 347 Other financial liabilities
Hedging instruments of net investment in foreign operations
Exchange rate risk
Borrowings in U.S. dollars 78,500 — 78,500 Borrowings
There are no cash flow hedge reserves arising from hedge relationship for which the hedge accounting was discontinued, and no ineffective portion of hedges recognized in profit or loss.
Effects of hedging instruments designated as cash flow hedges and hedges of net investment on the Group’s profit or loss and other comprehensive income are as follows:
Millions of yen
Fiscal year ended March 31, 2020 (April 1, 2019 to March 31, 2020)
Hedging gains (losses) recognized as other
comprehensive income (Note)
Transfer from other components of equity to profit or loss as reclassification adjustments
(Note)Item of transfer to profit or loss as reclassification adjustments
Cash flow hedges
Interest rate risk
Interest rate swap ¥(124) ¥(22) Financial costs
Hedging instruments of net investment in foreign operations
Exchange rate risk
Borrowings in U.S. dollars (67) — —
(Note) Before tax effect
Millions of yen
Fiscal year ended March 31, 2021 (April 1, 2020 to March 31, 2021)
Hedging gains (losses) recognized as other
comprehensive income (Note)
Transfer from other components of equity to profit or loss as reclassification adjustments
(Note)Item of transfer to profit or loss as reclassification adjustments
Cash flow hedges
Interest rate risk
Interest rate swap ¥ 28 ¥(37) Financial costs
Hedging instruments of net investment in foreign operations
Exchange rate risk
Borrowings in U.S. dollars 517 — —
(Note) Before tax effect
Thousands of U.S. dollars
Fiscal year ended March 31, 2021 (April 1, 2020 to March 31, 2021)
Hedging gains (losses) recognized as other
comprehensive income (Note)
Transfer from other components of equity to profit or loss as reclassification adjustments
(Note)Item of transfer to profit or loss as reclassification adjustments
Cash flow hedges
Interest rate risk
Interest rate swap $ 251 $(338) Financial costs
Hedging instruments of net investment in foreign operations
Exchange rate risk
Borrowings in U.S. dollars 4,670 — —
(Note) Before tax effect

64JSR Corporation Annual Report 2021
NOTES OF CONSOLIDATED FINANCIAL STATEMENTS
(36) Subsidiaries
The number of consolidated subsidiaries as of March 31, 2021 was 64 (61 as of March 31, 2020).
Changes in the consolidated subsidiaries in the current fiscal year are as follows: The number of companies consolidated by acquisition,
establishment, etc.: 5 The number of subsidiaries excluded by liquidation,
sales, etc.: 2
The condensed financial information for consolidated subsidiaries for which the Group has recognized significant non-controlling interests are as follows. The condensed financial information shows the amount before elimination of transactions within the Group.
Techno-UMG Co., Ltd.
(1) Proportion of non-controlling interests and the cumulative amount of non-controlling interests
Millions of yenThousands of U.S. dollars
As of March 31, 2021
As of March 31, 2021
Proportion of share of non-controlling interests 49% 49%
The cumulative amount of non-controlling interests ¥20,268 $183,070
(2) Profit or loss allocated to non-controlling interests and dividends paid for non-controlling interests
Millions of yenThousands of U.S. dollars
Fiscal year ended March 31, 2021
Fiscal year ended March 31, 2021
Profit or loss allocated to non-controlling interests ¥1,475 $13,325
Dividends paid for non-controlling interests 423 3,820
(3) The condensed financial information1) Condensed Statement of Financial Position
Millions of yenThousands of U.S. dollars
As of March 31, 2021
As of March 31, 2021
Current assets ¥43,266 $390,805
Non-current assets 23,928 216,129
Total assets 67,194 606,933
Current liabilities 20,628 186,323
Non-current liabilities 853 7,708
Total current liabilities ¥21,481 $194,031
Total equity ¥45,712 $412,902
Total liabilities and equity ¥67,194 $606,933
2) Condensed Statements of Profit or Loss and Comprehensive
Income
Millions of yenThousands of U.S. dollars
Fiscal year ended March 31, 2021
Fiscal year ended March 31, 2021
Revenue ¥66,346 $599,278
Profit (loss) 3,109 28,084
Comprehensive income 3,249 29,345
3) Condensed Statement of Cash Flows
Millions of yenThousands of U.S. dollars
Fiscal year ended March 31, 2021
Fiscal year ended March 31, 2021
Cash flows from operating activities ¥10,073 $ 90,984
Cash flows from investing activities (2,815) (25,425)
Cash flows from financing activities (863) (7,796)
Net increase (decrease) in cash and cash equivalents 6,395 57,763
Cash and cash equivalents at the end of the period 10,376 93,722

65JSR Corporation Annual Report 2021
NOTES OF CONSOLIDATED FINANCIAL STATEMENTS
1) Transactions with Joint Venture
Fiscal year ended March 31, 2020 (April 1, 2019 to March 31, 2020)
Millions of yen
Attribute Name of the company Contents of transactions Transaction amountBalance at the end of the current fiscal year
Joint venture KRATON JSR ELASTOMERS K. K.
Manufacturing consignment of elastomer products ¥8,863 ¥3,229
Supply of raw material gas 4,141 1,506
(Notes) 1. Transactions with joint venture have been determined through price negotiations in light of market prices and others. In addition, the receivables and payables are settled in cash and consistent with the terms of third party settlements.
2. There is no outstanding balance of collateral or guarantee. Loss allowance has not been made for the receivables.
Fiscal year ended March 31, 2021 (April 1, 2020 to March 31, 2021)
Millions of yen
Attribute Name of the company Contents of transactions Transaction amountBalance at the end of the current fiscal year
Joint venture KRATON JSR ELASTOMERS K. K.
Manufacturing consignment of elastomer products ¥6,109 ¥2,869
Supply of raw material gas 2,095 1,019
(Notes) 1. Transactions with joint venture have been determined through price negotiations in light of market prices and others. In addition, the receivables and payables are settled in cash and consistent with the terms of third party settlements.
2. There is no outstanding balance of collateral or guarantee. Loss allowance has not been made for the receivables.
Fiscal year ended March 31, 2021 (April 1, 2020 to March 31, 2021)
Thousands of U.S. dollars
Attribute Name of the company Contents of transactions Transaction amountBalance at the end of the current fiscal year
Joint venture KRATON JSR ELASTOMERS K. K.
Manufacturing consignment of elastomer products $55,181 $25,916
Supply of raw material gas 18,927 9,207
(Notes) 1. Transactions with joint venture have been determined through price negotiations in light of market prices and others. In addition, the receivables and payables are settled in cash and consistent with the terms of third party settlements.
2. There is no outstanding balance of collateral or guarantee. Loss allowance has not been established for the receivables.
2) Key Management Personnel CompensationMillions of yen Thousands of U.S. dollars
Fiscal year ended March 31, 2020 (April 1, 2019 to March 31, 2020)
Fiscal year ended March 31, 2021 (April 1, 2020 to March 31, 2021)
Fiscal year ended March 31, 2021 (April 1, 2020 to March 31, 2021)
Basic compensation ¥361 ¥339 $3,062
Bonuses 134 149 1,347
Share-based remuneration 99 124 1,124
Total ¥595 ¥613 $5,533
(38) Commitments
Commitments related to expenditures taking place after the last day of the fiscal year are as follows:
Millions of yen Thousands of U.S. dollars
As of March 31, 2020
As of March 31, 2021
As of March 31, 2021
Acquisition of property, plant and equipment ¥5,152 ¥16,672 $150,593
(37) Related Parties

66JSR Corporation Annual Report 2021
NOTES OF CONSOLIDATED FINANCIAL STATEMENTS
(39) Subsequent Events
The Separation of the Company’s Elastomer Business and Transfer of Stock to ENEOS
The Board of Directors meeting of JSR Corporation held on May 11, 2021 (hereinafter referred to as “JSR” or “Splitting Company”) resolved to separate JSR’s Elastomers business into a new standalone company named “Japan Synthetic Rubber Spin-off Preparation Co., Ltd.” by an absorption-type company split (hereinafter referred to as “Japan Synthetic Rubber” or “Successor Company”). Additionally, JSR resolved to transfer all stocks of Japan Synthetic Rubber to ENEOS Corporation and entered into the stock transfer agreement with ENEOS Corporation as described below. The completion of the Company Separation and the stock transfer are subject to the necessary clearances, permits and approvals under domestic and international competition laws and other laws and regulations. The Group will classify the Elastomer Business as discontinued operations from the fiscal year ending March 31, 2022. The Group will present profit or loss from discontinued operations separately from continuing operations.
I. Purpose of the Transaction JSR was established in December 1957 through the “Act on Special Measures for Synthetic Rubber Manufacturing Business,” which was enacted to support the domestic production of synthetic rubber in Japan (former name: Japan Synthetic Rubber Co., Ltd.). In 1969, JSR became a private company and expanded its petrochemical business from synthetic rubber to emulsions and synthetic resins. Subsequently, JSR expanded its business to include semiconductor materials, display materials, optical materials, and other areas, leveraging JSR’s unique polymer technology. In recent years, as the business environment has become increasingly complex and uncertain, JSR has positioned its
digital solutions and life sciences businesses, where the global market offers strong growth potential and where JSR can better leverage its strengths in technological innovation, as growth drivers for JSR over the medium- to long-term. To generate value to all stakeholders, JSR is building a strong organization that can respond to changes in the business environment and achieve sustainable growth. As the number one synthetic rubber company in Japan, JSR’s Elastomers business has earned international trust with its advanced technological capabilities, especially in the field of high-value-added synthetic rubbers such as solution polymerized butadiene styrene rubber (SSBR). However, the business environment has become increasingly challenging due to intensifying global competition. To address these challenges, JSR launched a strategic review of its business portfolio while taking measures to improve profitability and implement structural business reforms. Following the conclusion of this strategic review, JSR resolved to separate the Elastomers business and transfer this business to a new base where it can grow further. JSR has determined that the best way to ensure the sustainable development of the Elastomers business is to transfer the business to ENEOS Corporation, a subsidiary of ENEOS Holdings, Japan‘s largest integrated energy, resources, and materials company. ENEOS Corporation is engaged in the manufacture and sale of petrochemical products globally, has advanced technological capabilities, greater business scale, and is actively working to strengthen its lineup of high-value-added products. Consequently, JSR has resolved to make the Elastomers business a separate company and transfer the shares of that company to ENEOS Corporation, a subsidiary of ENEOS Holdings, Inc.
II. Outline of the Company Separation1. Summary of the Company Separation(1) Schedule
Date of the Board of Directors to approve stock transfer May 11, 2021
Establishment of the Successor Company May 12, 2021
Board of Directors meeting to approve agreement of the absorption-type split May 11, 2021
Date of conclusion of the absorption-type split agreement May 18, 2021
Ordinary General Shareholders’ Meeting to approve the absorption-type split agreement June 17, 2021
Effective date of the absorption-type company split April 1, 2022 (plan)

67JSR Corporation Annual Report 2021
NOTES OF CONSOLIDATED FINANCIAL STATEMENTS
(2) Method This is an absorption-type company split in which JSR is the Splitting Company and Japan Synthetic Rubber is the Successor Company.
(3) Details of Allocation to the Splitting Company Upon the absorption-type split, the Successor Company will issue and allocate one share of common stock to the Splitting Company.
(4) Treatment of stock acquisition rights and bonds with stock acquisition rights in connection with the absorption-type split There will be no change in the handling of JSR’s stock acquisition rights as a result of the absorption-type split.
(5) Capital to be increased or decreased as a result of the Company Separation There will be no increase or decrease in the capital of JSR as a result of this absorption-type split.
(6) Rights and obligations to be ceded by the Successor Company As of the effective date of the absorption-type split, the Successor Company will cede to the assets, liabilities, contractual status, rights and obligations, etc., related to JSR’s Elastomers business as stipulated in the absorption-type split agreement.
(7) Prospect of fulfillment of obligations JSR has determined that there are no concerns with the prospects for the fulfillment of obligations to be borne by the Successor Company on and after the effective date of the absorption-type split.
2. Outline of the Parties related to the Company Separation
(1) Name Japan Synthetic Rubber Spin-off Preparation Co., Ltd.
(2) Address 1-9-2 Higashi Shimbashi, Minato-ku, Tokyo
(3) Representative Representative Director and President Hayato Hirano
(4) Business Outline Sales and manufacturing of synthetic rubbers and high performance materials.
(5) Capital 1 million yen
(6) Date of establishment May 12, 2021
(7) Number of shares issued 1,000 shares
(8) Shareholder JSR Corporation 100.00%
(9) Relationship between the Splitting Company and Successor Company
1. CapitalAt the time of Japan Synthetic Rubber’s establishment, JSR held 100% of the stocks of the Successor Company, but plans to transfer all such stocks to ENEOS Corporation on April 1, 2022.
2. Personnel Hayato Hirano, Managing Officer of the Splitting Company will concurrently serve as Representative Director.
3. BusinessNot applicable.
4. Status of related parties On the effective date of the absorption-type split, Japan Synthetic Rubber would be a consolidated subsidiary of JSR and fall under the category of a related party; however, it is scheduled to transfer all of its stocks in the Successor Company to ENEOS Corporation on April 1, 2022, and will no longer be a related party.

68JSR Corporation Annual Report 2021
NOTES OF CONSOLIDATED FINANCIAL STATEMENTS
3. Overview of the business unit to be separated (1) Business of the division to be separated Part of the Elastomer product manufacturing and sales business operated by JSR. Subsidiaries and affiliates, related to the Elastomer business such as ELASTOMIX CO., LTD. and JSR Trading Co., Ltd. will also be included in the scope of this absorption-type company split.
(2) Operating results of the division to be separated (Fiscal year ended March 31, 2021)
• Revenue ¥143,186 million ($1,293,342 thousand)
(3) Items and amounts of assets of the division to be separated (As of March 31, 2021)
• Current Assets ¥96,449 million ($871,188 thousand)• Non-current Assets ¥87,298 million ($788,528 thousand)• Total ¥183,747 million ($1,659,715 thousand)(Note) The above amounts are for the entire elastomer business as of March 31,
2021, and differ from the actual amounts to be separated.
4. Status after the Company Separation Please refer to “2. Outline of the Parties related to the Company Separation” above for the name, head office location, title and name of representative, business, capital and fiscal year-end, net assets and total assets of the Splitting Company and the Successor Company after the absorption-type split.
III. Outline of the Stock Transfer 1. Reason for the change As described in “I. Purpose of the Transaction” above.
2. Method of transfer After the Elastomer business is transferred to Japan Synthetic Rubber through an absorption-type split, the Company will transfer all of its Japan Synthetic Rubber stocks to ENEOS Corporation.
3. Overview of the Subsidiary to be transferred As described in the “Successor Company” section of “2. Outline of the Parties related to the Company Separation” above.
4. Outline of Transferee
( 1 ) Name ENEOS Corporation
( 2 ) Address 1-1-2 Otemachi, Chiyoda-ku, Tokyo 100-8162, Japan
( 3 ) Representative Representative Director Tsutomu Sugimori Representative Director, President Katsuyuki Ota
( 4 ) Business Outline Refining and marketing of petroleum products (such as gasoline, kerosene, and lubricating oil), import and sale of gas and coal, manufacture and sale of petrochemical products and supply of electricity and hydrogen
( 5 ) Capital 30 billion yen
( 6 ) Date of Establishment May 10, 1888
( 7 ) Consolidated Net Assets (As of March 31, 2021) 760,808 (Million yen)
( 8 ) Consolidated Total Assets (As of March 31, 2021) 3,368,039 (Million yen)
( 9 ) Major Shareholders and Shareholding Ratio (As of March 30, 2021) ENEOS Holdings, Inc. 100%
(10) Relationship between our Company and the Company
1. CapitalNot applicable.
2. Personnel Not applicable.
3. BusinessThere is a business relationship between JSR and ENEOS regarding the purchase and sale of petrochemical-related materials. In addition, JSR has business relationships with subsidiaries and other group companies of ENEOS regarding sales and purchase of petrochemical products and related materials.
4. Status of related parties Not applicable.

69JSR Corporation Annual Report 2021
NOTES OF CONSOLIDATED FINANCIAL STATEMENTS
5. Number of shares to be transferred, enterprise value, and status of shares held before and after the transfer
(1) Shares held before the change 1,001 shares (Percentage of voting rights held: 100.00%) (plan)
(2) Number of shares to be transferred 1,001 shares (Percentage of voting rights held: 100.00%) (plan)
(3) Enterprise value 115 billion yen
(4) Number of shares held after the change 0 shares (Percentage of voting rights held: 0.00%)
(Note) JSR and ENEOS have agreed on an enterprise value of 115 billion yen ($1,038,750 thousand) for the Elastomers business, and the final stock transfer price will be determined after adjustments are made in consideration of the cash and deposits, interest-bearing debt, various other liabilities and assets, and working capital of the Elastomers business as of the completion of the absorption-type split.
6. Schedule
Date of resolution by the Board of Directors May 11, 2021
Date of conclusion of stock purchase agreement May 11, 2021
Execution date of share transfer April 1, 2022 (plan)
Change in the Equity Method AffiliatesThe Board of Directors decided at a meeting held on May 11, 2021 to transfer all shares held of Kumho Polychem Co., Ltd. (located in Seoul, Republic of Korea, hereinafter referred to as “KPC“), an equity method affiliate, to Kumho Petrochemical Co.,
Ltd. (located in Seoul, Republic of Korea, hereinafter referred to as “KKPC”). The Group will classify KPC as held for sale from the fiscal year ending March 31, 2022.
1. Reasons for the share transfer and dissolution of the joint venture
KPC was established in 1985 as a joint venture between JSR and KKPC and has been mainly engaged in the manufacture and sale of ethylene propylene rubber. Since its establishment, KPC‘s products have been recognized as indispensable products for the automotive industry. In light of the current business environment, JSR is reviewing its strategies in each of its
businesses. In order for this business to continue to grow, transformation is necessary in several ways including consideration of the investment of management resources at an appropriate scale. Therefore, we have reached an agreement with KKPC to dissolve the joint venture agreement with KPC, judging that enabling rapid decision-making under KKPC’s sole control will lead to increased corporate value.

70JSR Corporation Annual Report 2021
NOTES OF CONSOLIDATED FINANCIAL STATEMENTS
2. Profile of joint venture
(1) Name Kumho Polychem Co., Ltd.
(2) Location 8F, East Wing, Signature Tower #100, Cheonggyecheon-ro, Jung-gu, Seoul 100-230, Korea
(3) Representative Chairman Chan Koo Park, Vice President Takeshi Sugimoto
(4) Description of business Production and sales of Ethylene Propylene Rubber
(5) Capital WON 21,500,000,000
(6) Date of establishment June 5, 1985
(7) Major shareholders and percentage of shares held
JSR Corporation 50%, Kumho Petrochemical 50%
(8) Relationship
1. CapitalJSR’s equity interest in KPC is 50%.
2. Personnel An employee of JSR serves as the Executive Vice President of KPC. In addition, one director and two employees of the Company serve as directors and auditors of KPC.
3. Business JSR purchases products from this company.
(9) Operating results and financial position for the three most recent fiscal years
(Unit Million WON)Fiscal year ended December 31, 2018
(January 1, 2018 to December 31, 2018)Fiscal year ended December 31, 2019
(January 1, 2019 to December 31, 2019)Fiscal year ended December 31, 2020
(January 1, 2020 to December 31, 2020)
Total Assets 480,523 429,172 405,905
Net Assets 318,614 308,730 304,688
Revenue 476,796 390,670 328,029
Operating Profit (2,751) (8,155) (2,993)
Profit (5,073) (9,176) (5,483)
3. Profile of joint venture partner
(1) Name Kumho Petrochemical Co., Ltd. (KKPC)
(2) Location 10th-14th Floor, Signature Tower East Wing, 100 Cheonggyecheon-ro, Jung-gu, Seoul, Republic of Korea
(3) Representative CEO Chan-Koo Park, Dong-Joon Moon
(4) Description of business Production of synthetic rubbers, plastics, functional chemicals, etc. KKPC group provides services in construction, logistics, financial-related matters.
(5) Capital 167,456 million WON
(6) Date of establishment December 28, 1970
4. Details of the share transfer
(1) Number of shares held prior to transfer 2,150,000 shares (Percentage of voting rights: 50%)
(2) Number of shares transferred 2,150,000 shares
(3) Number of shares held after transfer 0 shares (Percentage of voting rights: 0%)
(4) Date of share transfer July 1, 2021 (plan)

71JSR Corporation Annual Report 2021
INDEPENDENT AUDITOR’S REPORT
To the Board of Directors of JSR Corporation:
Opinion
We have audited the accompanying consolidated financial statements of JSR Corporation (“the Company”) and its consolidated subsidiaries (collectively referred to as “the Group”), which comprise the consolidated statement of financial position as at March 31, 2021, the consolidated statements of profit or loss, comprehensive income, changes in equity and cash flows for the year then ended, and notes, comprising significant accounting policies and other explanatory information.
In our opinion, the accompanying consolidated financial statements present fairly, in all material respects, the consolidated financial position of the Group as at March 31, 2021, and its consolidated financial performance and its consolidated cash flows for the year then ended in accordance with International Financial Reporting Standards (IFRS).
Basis for Opinion
We conducted our audit in accordance with auditing standards generally accepted in Japan. Our responsibilities under those standards are further described in the Auditor’s Responsibilities for the Audit of the Consolidated Financial Statements section of our report. We are independent of the Group in accordance with the ethical requirements that are relevant to our audit of the consolidated financial statements in Japan, and we have fulfilled our other ethical responsibilities in accordance with these requirements. We believe that the audit evidence we have obtained is sufficient and appropriate to provide a basis for our opinion.
Emphasis of matter
We draw attention to Note 39 “Subsequent Events” of the consolidated financial statements.
The Board of Directors meeting of the Company held on May 11, 2021 resolved to separate its Elastomers business into a new standalone company named “Japan Synthetic Rubber Spin-off Preparation Co., Ltd.” by an absorption-type company split. Additionally, the Company resolved to transfer all stocks of Japan Synthetic Rubber Spin-off Preparation Co., Ltd. to ENEOS Corporation and conclude the stock transfer agreement with ENEOS Corporation.
Our opinion is not modified in respect of this matter.
Key Audit Matters
Key audit matters are those matters that, in our professional judgment, were of most significance in our audit of the consolidated financial statements of the current period. These matters were addressed in the context of our audit of the consolidated financial statements as a whole, and in forming our opinion thereon, and we do not provide a separate opinion on these matters.
Appropriateness of the impairment loss on non-financial assets used in the Elastomers business
The key audit matter
As described in Note 18, “Impairment on Non-Financial Assets” of the consolidated financial statements, the Group recognized an impairment loss of ¥77,227 million on non-financial assets used in the Elastomers business in the consolidated statement of profit or loss.
Non-financial assets need to be tested for impairment whenever there is an impairment indicator. In the impairment testing, when the recoverable amount of non-financial assets is less than the carrying amount, the carrying amount is reduced to the recoverable amount, and the resulting decrease in the carrying amount is recognized as an impairment loss. The recoverable amount is the higher of either the value in use or fair value less cost of disposal.

72JSR Corporation Annual Report 2021
INDEPENDENT AUDITOR’S REPORT
In the current fiscal year, since the Company had commenced and partially implemented business structure reforms related to the Elastomers business, an impairment indicator was identified for the entire business, and therefore the Company performed an impairment test. In the impairment testing, the Company used the fair value less cost of disposal as the recoverable amount because as part of its business structure reforms the Company obtained the enterprise values of the entire Elastomers business from potential buyers through a fair bidding process.
The impairment loss was calculated based on the fair value less cost of disposal and the carrying amounts of non-financial assets used in the Elastomers business. The Company assessed the appropriateness of using the enterprise values obtained from potential buyers as a basis for the fair value by comparing them with a discounted present value of future cash flows of the Elastomers business calculated by an external valuation expert. The future cash flows were based on the five-year business plan developed by management and the terminal value was measured considering EBITDA multiples of similar transactions from the market participants’ perspectives in addition to a terminal growth rate. Since the discounted present value of future cash flows is based on the premise that the assets will be used for a long period, the cash flows after the periods covered by the five-year business plan had a significant effect on the discounted present value. Therefore, the measurement of the terminal value was important in estimating the discounted present value of future cash flows. The terminal growth rate and the EBITDA multiples of similar transactions used in the measurement of the terminal value included assumptions involving uncertainty, which required management judgement. In addition, selecting appropriate models and input data for estimating the discount rate required a high degree of expertise in valuation.
Moreover, the carrying amounts of non-financial assets used in the Elastomers business may not be properly aggregated by management because the Elastomers business is spread over a number of subsidiaries of the Company.
We, therefore, determined that our assessment of the appropriateness of the impairment loss on non-financial assets used in the Elastomers business was one of the most significant matters in our audit of the consolidated financial statements for the current fiscal year, and accordingly, a key audit matter.
How the matter was addressed in our audit
The primary procedures we performed to assess the appropriateness of the impairment loss on non-financial assets used in the Elastomers business included the following:
(1) Internal control testing
We tested the design and operating effectiveness of certain of the Company’s internal controls relevant to the impairment testing on non-financial assets. In this assessment, we focused our testing on the following controls:
• Controls designed to prevent and/or detect the use of unreasonable assumptions in assessing the appropriateness of the fair value less cost of disposal; and
• Controls to ensure that the carrying amounts of non-financial assets used in the Elastomers business are properly aggregated.
(2) Assessment of the reasonableness of the fair value less cost of disposal
We performed the following procedures by involving a valuation specialist within our domestic network firms in assisting our assessment of the reasonableness of key assumptions and the discount rate adopted in calculating the terminal value included in the discounted present value of future cash flows:
• Evaluated the reasonableness of the terminal growth rate and the EBITDA multiples of similar transactions the Company adopted by inspecting the results of the evaluation by the external valuation expert and inquiring of the external expert about the rationales, and then comparing them with relevant data published by external organizations;
• Assessed the appropriateness of the model used to estimate the discount rate based on subject matters relevant to valuation and the requirements of accounting standards;
• Assessed the reasonableness of input data used to calculate the discount rate through comparison with relevant data published by external organizations; and
• After considering the results of our assessment of the reasonableness of key assumptions and the discount rate, analyzed the sensitivity of the discounted present value of future cash flows to changes in input data used to calculate the terminal growth rate and the discount rate.

73JSR Corporation Annual Report 2021
NOTES OF CONSOLIDATED FINANCIAL STATEMENTS
Furthermore, we assessed the consistency of the fair value with the consideration for the stock transfer agreement related to the Elastomers business entered into on May 11, 2021.
(3) Assessment of the appropriateness of the carrying amounts
We examined whether the carrying amounts of non-current assets used in the Elastomers business were properly aggregated by confirming the consistency with the carrying amount reaggregated from data we independently retrieved from the accounting system.
Appropriateness of management’s judgment as to whether an impairment loss should be recognized on goodwill allocated to the drug discovery and development services business
The key audit matter
As described in Note 18, “Impairment on Non-Financial Assets” of the consolidated financial statement, the Group recognized goodwill of ¥36,823 million allocated to the drug discovery and development services business, which represented 5% of total assets in the consolidated financial statements. The goodwill arose when the Company acquired control of Crown Bioscience International.
Goodwill is required to be tested for impairment at least annually or more frequently whenever it is determined that there is an impairment indicator. In the impairment testing, when the recoverable amount of a group of cash-generating units is less than the carrying amount, the carrying amount is reduced to the recoverable amount, and the resulting decrease in the carrying amount is recognized as an impairment loss. The recoverable amount is the higher of either the value in use or fair value less costs of disposal.
In the annual impairment testing, no impairment loss was recognized in the current fiscal year as the value in use of the drug discovery and development services business exceeded the carrying amount.
The value in use was discounted to the present value of an estimated amount of future cash flows based on the five-year business plan approved by management. The five-year revenue projection based on the business plan involved a high degree of uncertainty as the revenue is affected by the future growth potential of the CRO business in which the drug discovery and development services business operates and the capacity of the equipment used in the business. Accordingly, management’s judgment thereon had a significant effect on the estimated future cash flows.
In addition, selecting appropriate models and input data for estimating the discount rate requires a high degree of expertise in valuation.
We, therefore, determined that our assessment of the appropriateness of management’s judgment as to whether an impairment loss should be recognized on goodwill allocated to the drug discovery and development services business was one of the most significant matters in our audit of the consolidated financial statements for the current fiscal year, and accordingly, a key audit matter.
How the matter was addressed in our audit
The primary procedures we performed to assess whether management’s judgment with respect to the recognition of an impairment loss on goodwill allocated to the drug discovery and development services business was appropriate included the following:
(1) Internal control testing
We tested the design and operating effectiveness of certain of the Company’s internal controls relevant to measuring the value in use used in the impairment testing on goodwill. In this assessment, we focused our testing on controls to prevent and/or detect the use of unreasonable assumptions to estimate the value in use.
(2) Assessment of the reasonableness of the estimated value in use
In order to assess the reasonableness of key assumptions adopted by management in preparing the business plan, which was used as the basis for estimating future cash flows, we inquired of management and the personnel responsible for the drug discovery and development services business about the basis on which those assumptions were developed. In addition, we:
• Compared the five-year revenue included in the business plan with available external data related to the market growth rate and examined the consistency of the capacity of the equipment which is currently held and/or is expected to be invested in the future with the projected revenue; and
• Compared management’s estimate of future cash flows with those independently estimated by incorporating the effect of specific uncertainty into the business plan and assessed any impact on management’s judgment as to whether an impairment loss should be recognized.

74JSR Corporation Annual Report 2021
NOTES OF CONSOLIDATED FINANCIAL STATEMENTS
Furthermore, we performed the following procedures by involving a valuation specialist within our domestic network firms in assisting our evaluation of the discount rate:
• assessment of the appropriateness of the model used to estimate the discount rate based on subject matters relevant to valuation and the requirements of accounting standards; and
• assessment of the reasonableness of input data through comparison with relevant data published by external organizations.
Responsibilities of Management and Corporate Auditors and the Board of Corporate Auditors for the Consolidated Financial Statements
Management is responsible for the preparation and fair presentation of the consolidated financial statements in accordance with IFRS, and for such internal control as management determines is necessary to enable the preparation of consolidated financial statements that are free from material misstatement, whether due to fraud or error.
In preparing the consolidated financial statements, management is responsible for assessing the Group’s ability to continue as a going concern, disclosing, as applicable, matters related to going concern in accordance with IFRS and using the going concern basis of accounting unless management either intends to liquidate the Group or to cease operations, or has no realistic alternative but to do so.
Corporate auditors and the board of corporate auditors are responsible for overseeing the directors’ performance of their duties with regard to the design, implementation and maintenance of the Group’s financial reporting process.
Auditor’s Responsibilities for the Audit of the Consolidated Financial Statements
Our objectives are to obtain reasonable assurance about whether the consolidated financial statements as a whole are free from material misstatement, whether due to fraud or error, and to issue an auditor’s report that includes our opinion. Reasonable assurance is a high level of assurance, but is not a guarantee that an audit conducted in accordance with auditing standards generally accepted in Japan will always detect a material misstatement when it exists. Misstatements can arise from fraud or error and are considered material if, individually or in the aggregate, they could reasonably be expected to influence the economic decisions of users taken on the basis of these consolidated financial statements.
As part of our audit in accordance with auditing standards generally accepted in Japan, we exercise professional judgment and maintain professional skepticism throughout the audit. We also:
• Identify and assess the risks of material misstatement of the consolidated financial statements, whether due to fraud or error, design and perform audit procedures responsive to those risks, and obtain audit evidence that is sufficient and appropriate to provide a basis for our opinion. The risk of not detecting a material misstatement resulting from fraud is higher than for one resulting from error, as fraud may involve collusion, forgery, intentional omissions, misrepresentations, or the override of internal control.
• Obtain an understanding of internal control relevant to the audit in order to design audit procedures that are appropriate in the circumstances, while the objective of the audit is not to express an opinion on the effectiveness of the Group’s internal control.
• Evaluate the appropriateness of accounting policies used and the reasonableness of accounting estimates and related disclosures made by management.
• Conclude on the appropriateness of management’s use of the going concern basis of accounting and based on the audit evidence obtained, whether a material uncertainty exists related to events or conditions that may cast significant doubt on the Group’s ability to continue as a going concern. If we conclude that a material uncertainty exists, we are required to draw attention in our auditor’s report to the related disclosures in the consolidated financial statements or, if such disclosures are inadequate, to modify our opinion. Our conclusions are based on the audit evidence obtained up to the date of our auditor’s report. However, future events or conditions may cause the Group to cease to continue as a going concern.
• Evaluate whether the presentation and disclosures in the consolidated financial statements are in accordance with IFRS, the overall presentation, structure and content of the consolidated financial statements, including the disclosures, and whether the consolidated financial statements represent the underlying transactions and events in a manner that achieves fair presentation.
• Obtain sufficient appropriate audit evidence regarding the financial information of the entities or business activities within the Group to express an opinion on the consolidated financial statements. We are responsible for the direction, supervision and performance of the group audit. We remain solely responsible for our audit opinion.

75JSR Corporation Annual Report 2021
NOTES OF CONSOLIDATED FINANCIAL STATEMENTS
We communicate with corporate auditors and the board of corporate auditors regarding, among other matters, the planned scope and timing of the audit, significant audit findings, including any significant deficiencies in internal control that we identify during our audit.
We also provide corporate auditors and the board of corporate auditors with a statement that we have complied with relevant ethical requirements regarding independence, and communicate with them all relationships and other matters that may reasonably be thought to bear on our independence, and where applicable, related safeguards.
From the matters communicated with corporate auditors and the board of corporate auditors, we determine those matters that were of most significance in the audit of the consolidated financial statements of the current period and are therefore the key audit matters. We describe these matters in our auditor’s report unless law or regulation precludes public disclosure about the matter or when, in extremely rare circumstances, we determine that a matter should not be communicated in our report because the adverse consequences of doing so would reasonably be expected to outweigh the public interest benefits of such communication.
Convenience Translation
The U.S. dollar amounts in the accompanying consolidated financial statements with respect to the year ended March 31, 2021 are presented solely for convenience. Our audit also included the translation of yen amounts into U.S. dollar amounts and, in our opinion, such translation has been made on the basis described in Note 2 to the consolidated financial statements.
Interest required to be disclosed by the Certified Public Accountants Act of Japan
We do not have any interest in the Group which is required to be disclosed pursuant to the provisions of the Certified Public Accountants Act of Japan.
Tomoyoshi InoueDesignated Engagement PartnerCertified Public Accountant
Iwao HiranoDesignated Engagement PartnerCertified Public Accountant
Yukihiro KaseDesignated Engagement PartnerCertified Public Accountant
KPMG AZSA LLCTokyo Office, JapanJuly 9, 2021
Notes to the Reader of Independent Auditor’s Report:
This is a copy of the Independent Auditor’s Report and the original copies are kept separately by the Company and KPMG AZSA LLC.
Copyright © 2022 FDOKUMEN