Materials and methods contd. - NUCLEUS information resources
23
Assessment of Natural Radionuclides in Soil samples and Estimation of Radiation Doses around the proposed Phosphate Mining area in Oshosun, Ogun-State.Nigeria. A.B Ogunremi, A.O Mustapha, V Makinde and O.A Idowu .
-
Upload
khangminh22 -
Category
Documents
-
view
0 -
download
0
Transcript of Materials and methods contd. - NUCLEUS information resources

Assessment of Natural Radionuclides in Soil samples and
Estimation of Radiation Doses around the proposed
Phosphate Mining area in Oshosun, Ogun-State.Nigeria.
A.B Ogunremi, A.O Mustapha, V Makinde and O.A Idowu
.

OUTLINE OF PRESENTATION
• Introduction
• Problem Statement
• Aims and Objective
• Materials and Methods
• Results and Discussion
• Conclusion
• References

INTRODUCTION
PHOSPHATE MINING
Phosphate rock refers to mineral assemblage that occurs naturally with anexceptionally high concentration of phosphate minerals (RMRDC, 2010).
It is the major resource mined to produce phosphate fertilizers which are keyfactor in sustaining the world's agricultural output.
It may be derived from a number of sources, but the most common is the one that contains high concentration of phosphates in nodular or compact masses
During mining, different wastes like heavy metals, overburden, toxins and acids are significantly released into the environment causing air and water pollution (Ledin et al.,1996).
Radioactive substances that enter rivers, lakes, seas and oceans are absorbed by aqueous plants and animals both directly from the water and from the preceding link in the food chain

STATEMENT OF PROBLEM
There are possibilities that phosphate mining might commence in Oshosun
soon
Pollution of the environmental matrix like soil through the use of chemicals
and heavy machines during mining can never be ruled out and monitoring the
radiological and environmental consequence after commencement of operation
is always difficult.
Therefore, there is need to carry out baseline assessment of the area before
mining activities began.
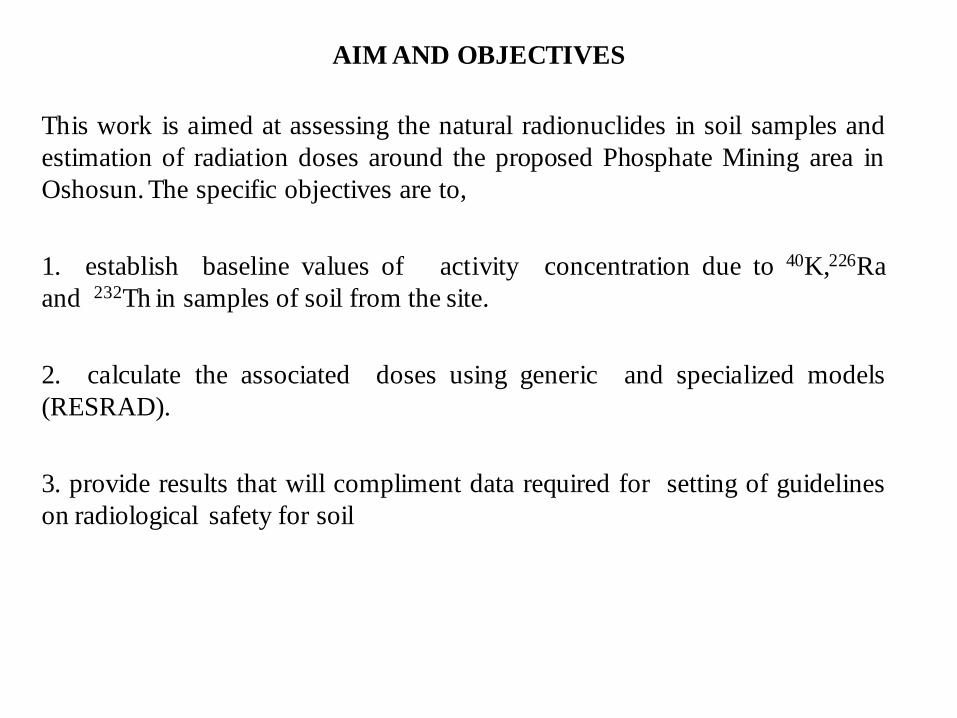
AIM AND OBJECTIVES
This work is aimed at assessing the natural radionuclides in soil samples and
estimation of radiation doses around the proposed Phosphate Mining area in
Oshosun. The specific objectives are to,
1. establish baseline values of activity concentration due to 40K,226Ra
and 232Th in samples of soil from the site.
2. calculate the associated doses using generic and specialized models
(RESRAD).
3. provide results that will compliment data required for setting of guidelines
on radiological safety for soil

LOCATION OF THE STUDY AREA
Oshosun is located in Ifo local government area of Ogun State.
The town Oshosun is between Latitudes 6° 49' to 6° 55'N and
Longitudes 3° 14' to 3° 19'E. It occupies an area of about
521km2.
Oshosun area is underlain by the Ilaro formation found in the
Benin (Dahomey basin) (Enikanselu, 2008).
The Ilaro formation is made up of both marine and continental,
massive yellowish consolidated sandstone.

MATERIALS AND METHODS
Sample collection and Spectra set-up
▪ Soil samples collection and preparation
Fig1. Block diagram of ORTEC Digibase of Sodium Iodide Detector

MATERIALS AND METHODS CONTD.Counting with Sodium Iodide Detector
After the calibration of the detector, each sealed sample was placed on the
detector for counting.
The counting time was set at 10,800s (3hrs) as was considered adequate and to
reduce error in measurement.
Individual radionuclides identified by their gamma energies
To maintain reproducible counting geometry, almost equal volume of samples
and standards were used by careful placing of sample on detector during
counting
Background counting obtained by filling clean plastic container with distilled water
MATERIALS AND METHODS CONTD.
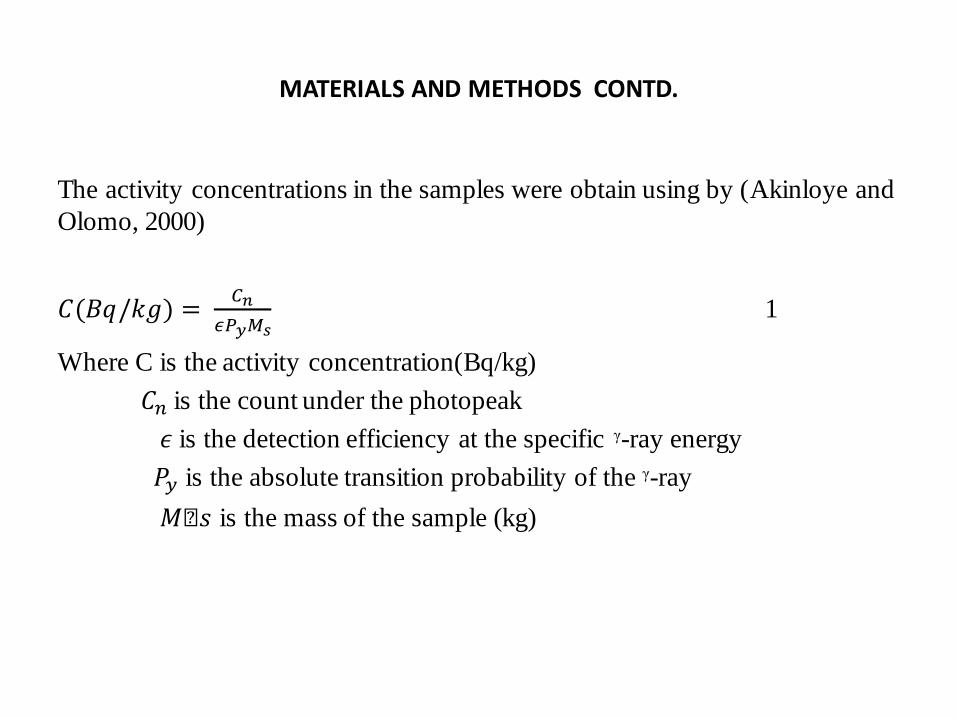
The activity concentrations in the samples were obtain using by (Akinloye and
Olomo, 2000)
𝐶(𝐵𝑞/𝑘𝑔) =𝐶𝑛
𝜖𝑃𝑦𝑀𝑠1
Where C is the activity concentration(Bq/kg)
𝐶𝑛 is the count under the photopeak
𝜖 is the detection efficiency at the specific ᵞ-ray energy
𝑃𝑦 is the absolute transition probability of the ᵞ-ray
𝑀𝑠 is the mass of the sample (kg)

MATERIALS AND METHODS CONTD.
Absorbed dose Calculation
Gamma radiation levels of the site and its environs was obtained by
D (nGy/h) = 0.427CRa+0.662CTh+.0.043CK 2
Annual Effective Dose (AED)
AED was determined by the equations below.
AED (Outdoor) (μ Sv⁄y) = D (nGy⁄h) × 8760hr × 0.7 Sv⁄Gy × 0.2 × 10⁻³ 3

MATERIALS AND METHODS CONT’D
DOSES CALCULATION USING RESRAD
RESRAD helps to determine how humans may be affected by radioactivewaste or other types of contaminants buried in the soil as well as radiationdoses and excess lifetime cancer risk to exposed on-site receptor.
OPERATION OF RESRAD
RESRAD program allows the user to specify many features of a site and toselect the exposure pathways that will be important.
The value of any parameter in the model can be changed by using popupwindows accessed through the “Modify Data” button on the far left of theRESRAD screen.
After clicking on “Modify Data,” a series of 12 buttons will appear in a newpanel. Each of these 12 buttons will, when clicked, launch a popup data entrywindow in which you can modify the associated parameters.

MATERIALS AND METHODS CONT’D
DOSES CALCULATION USING RESRAD
RESRAD helps to determine how humans may be affected by radioactive waste orother types of contaminants buried in the soil as well as radiation doses and excesslifetime cancer risk to exposed on-site receptor.
OPERATION OF RESRAD
RESRAD program allows the user to specify many features of a site and to select theexposure pathways that will be important.
The value of any parameter in the model can be changed by using popup windowsaccessed through the “Modify Data” button on the far left of the RESRAD screen.
After clicking on “Modify Data,” a series of 12 buttons will appear in a new panel.Each of these 12 buttons will, when clicked, launch a popup data entry window inwhich you can modify the associated parameters.

Activity Concentration(Bq/kg)Absorbed
dose(nGy/hr)
Effective dose
(mSv/yr)Location 40K 226Ra 232Th
Balogun 130.61±41.18 59.22±41.72 19.89±41.62 44.82 0.05
Abebi 233.61±15.70 65.60±32.91 290.25±32.81 215.36 0.26
Osoba 1 177.16±16.89 48.23±25.23 1.81±45.18 30.76 0.04
Asaagun 289.07±18.49 48.59±36.38 161.85±35.28 132.26 0.16
Oke Pata C.H.S 16.72±28.41 71.98±33.79 0±33.69 33.95 0.04
Near Asegun Well 211.82±16.60 60.64±32.63 160.04±32.53 133.52 0.16
Baamu 1 461.39±13.64 72.69±34.31 484.66±34.21 345.56 0.42
Leerin 1 26.62±26.69 103.17±25.28 158.24±25.18 144.35 0.18
Railway Crossing 27.61±24.34 48.94±50.15 73.24±50.05 68.00 0.08
Olomu 538.64±20.32 28.03±70.24 42.50±70.14 61.08 0.07
Opposite Adeoye 137.54±23.25 54.61±45.72 0±45.62 30.97 0.04
Adeoye 185.08±22.07 58.16±39.84 0±39.74 34.59 0.04
Kelemu 442.58±13.25 76.94± 33.56 330.94± 33.46 253.89 0.31
Orisun Imisi 170.22±24.21 41.85± 55.86 0±55.76 26.43 0.03
Farm Land 257.38±21.32 37.25± 64.28 32.55± 64.18 47.60 0.06
K.K Fabulus 325.71±20.56 85.10± 27.51 382.48±27.41 283.91 0.35
Strong Tower 390.09±20.90 75.17± 34.81 496.41± 34.71 350.83 0.43
Ogo-mi-da Rd 371.27±14.80 57.45± 31.28 309.24± 31.18 228.8 0.28
Near King's palace 387.11±16.24 50.01± 43.15 0±43.05 39.25 0.05
Maternity 181.12±29.17 40.44± 53.34 25.32± 53.24 41.53 0.05
Community Centre 421.78±19.00 43.27± 46.08 206.16±45.98 162.1 0.2
Agbegise 245.49±27.05 54.61± 37.38 386.10± 37.28 268.67 0.33
Agbegise Square 845.66±19.00 60.64± 32.12 0±32.02 63.28 0.08
African Chu Sch 171.21±22.34 76.94± 40.14 252.27± 40.04 195.06 0.24
Osoro 102.88±21.10 52.13± 44.92 0±44.82 28.38 0.03
Oke Pata H.Centre 91.98±22.18 42.92±40.99 25.32± 40.89 38.96 0.05
Ebiti 1 158.34±25.68 48.94±43.44 26.22±43.34 45.05 0.06
Ebiti 2 143.48±25.56 64.54±40.20 52.44± 40.10 67.48 0.08
Seleru 127.64±24.91 55.32± 33.61 190.79± 33.51 146.12 0.18
Baamu 2 132.59±27.24 42.21± 52.67 59.68± 52.57 61.07 0.07
Leerin 2 204.89±25.32 77.65± 27.52 182.65±27.42 154.74 0.19
Range 16.72- 845.66 28.03-103.17 1.81-496
Table 4.0 Activity Concentration, Absorbed and Effective Doses due to 40K, 226 Ra and 232Th in the Soil Samples from Oshosun.
Mean 245.40± 6.3 58.17 ± 11.60 140.36 ±11.6 121.88 0.15

RESULT CONTD.
Figure 2: Frequency distribution of activity concentration due to 40 K insoil sample from Oshosun
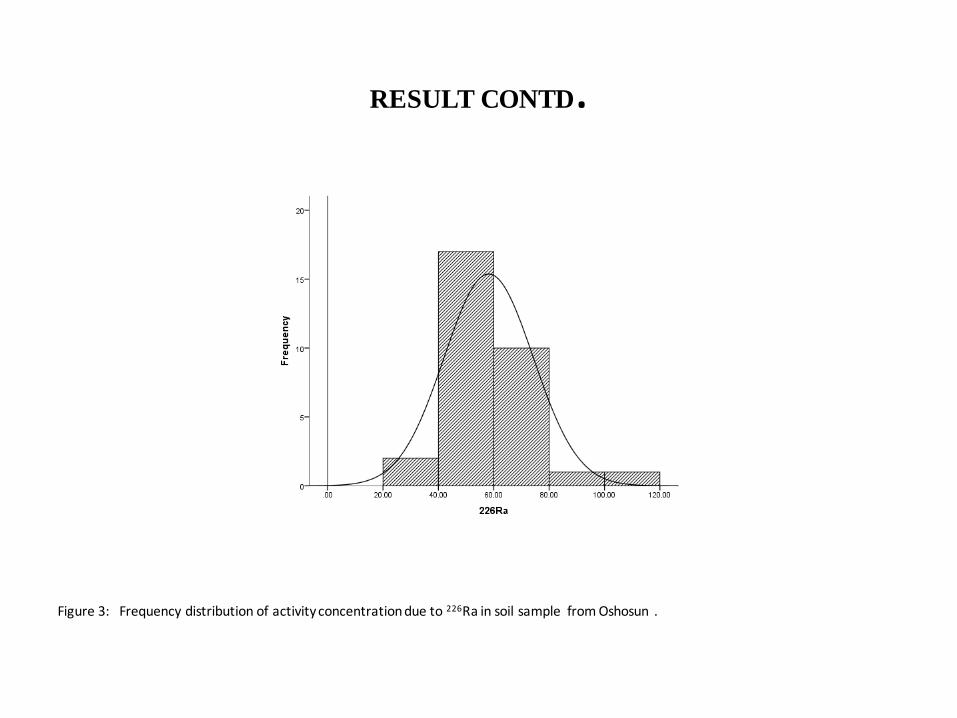
RESULT CONTD.
Figure 3: Frequency distribution of activity concentration due to 226Ra in soil sample from Oshosun .

RESULT CONTD.
Figure 4: Frequency distribution of activity concentration due to 232Th in soil sample from Oshosun .

RESULT CONTD.
Table 2: Effective Dose from RESRAD analysis of soil samples
Eff.Dose(10-2
rem/y)
S/N Ground Inhalation Plant Meat Milk Soil Total
1 0.220 0.002 0.245 0.106 0.045 0.003 0.621
2 0.537 0.021 0.817 0.199 0.091 0.023 1.688
3 0.276 0.000 0.290 0.143 0.059 0.001 0.769
4 0.539 0.011 0.710 0.239 0.104 0.013 1.616
5 0.040 0.000 0.034 0.014 0.006 0.001 0.095
6 0.425 0.011 0.586 0.177 0.078 0.013 1.290
7 0.993 0.035 1.475 0.389 0.175 0.038 3.105
8 0.156 0.012 0.292 0.027 0.016 0.013 0.516
9 0.095 0.005 0.160 0.025 0.013 0.006 0.304
10 0.837 0.002 0.926 0.436 0.183 0.004 2.388
11 0.218 0.003 0.225 0.111 0.047 0.009 0.613
12 0.289 0.003 0.301 0.149 0.063 0.011 0.816
13 0.875 0.024 1.213 0.369 0.163 0.026 2.670
14 0.264 0.000 0.276 0.138 0.057 0.008 0.743
15 0.413 0.003 0.463 0.209 0.088 0.003 1.179
16 0.732 0.028 1.105 0.276 0.126 0.030 2.297
17 0.894 0.036 1.379 0.332 0.152 0.038 2.831
18 0.751 0.022 1.065 0.310 0.138 0.024 2.310
19 0.589 0.000 0.622 0.313 0.130 0.001 1.655
20 0.295 0.002 0.331 0.147 0.062 0.003 0.840
21 0.763 0.015 0.989 0.348 0.150 0.017 2.282
22 0.608 0.028 0.979 0.211 0.099 0.029 1.954
23 1.278 0.000 1.355 0.683 0.284 0.002 3.602
24 0.422 0.018 0.662 0.147 0.068 0.02 1.337
25 0.165 0.000 0.169 0.083 0.035 0.009 0.461
26 0.162 0.002 0.189 0.075 0.032 0.003 0.463
27 0.263 0.002 0.297 0.129 0.055 0.003 0.749
28 0.259 0.004 0.315 0.118 0.051 0.005 0.752
29 0.316 0.014 0.497 0.109 0.051 0.015 1.002
30 0.245 0.005 0.306 0.107 0.047 0.005 0.715
31 0.431 0.013 0.610 0.172 0.077 0.015 1.318
Mean 0.463 0.010 0.609 0.203 0.089 0.013 1.386

RESULT CONTD.
ELCR x10-4
S/N Ground Inhalation Plant Meat Milk Soil Total
1 1.10 0.00 1.24 0.34 0.15 0.01 2.84
2 11.49 0.03 9.84 0.82 0.55 0.10 22.81
3 0.52 0.00 0.92 0.44 0.18 0.00 2.06
4 6.80 0.01 6.26 0.84 0.47 0.05 14.43
5 0.08 0.00 0.09 0.04 0.18 0.00 0.39
6 6.55 0.01 5.83 0.65 0.39 0.05 13.49
7 19.32 0.04 16.77 1.54 0.98 0.16 38.81
8 6.05 0.01 4.89 0.20 0.20 0.05 11.40
9 2.84 0.01 2.34 0.13 0.11 0.02 5.45
10 2.92 0.00 3.89 1.36 0.59 0.02 8.77
11 0.36 0.00 0.68 0.34 0.14 0.00 1.52
12 0.48 0.00 0.91 0.45 0.19 0.00 2.03
13 13.53 0.03 12.07 1.36 0.80 0.11 27.90
14 0.43 0.01 0.83 0.42 0.17 0.00 1.86
15 1.87 0.03 2.23 0.66 0.30 0.01 5.09
16 15.18 0.03 13.05 1.12 0.74 0.13 30.25
17 19.61 0.04 16.78 1.37 0.92 0.16 38.89
18 12.53 0.03 11.07 1.17 0.71 0.10 25.60
19 0.96 0.00 1.88 0.95 0.39 0.00 4.19
20 1.41 0.00 1.64 0.47 0.21 0.01 3.74
21 8.78 0.02 8.23 1.21 0.65 0.07 18.95
22 15.11 0.03 12.77 0.93 0.66 0.13 29.62
23 2.08 0.00 4.10 2.07 0.86 0.06 9.18
24 9.92 0.02 8.40 0.63 0.44 0.08 19.50
25 0.28 0.00 0.51 0.25 0.11 0.00 1.14
26 1.19 0.00 1.21 0.25 0.12 0.01 2.78
27 1.39 0.00 1.56 0.41 0.19 0.01 3.56
28 2.35 0.01 2.28 0.40 0.20 0.02 5.25
29 7.49 0.02 6.34 0.47 0.33 0.06 14.72
30 2.58 0.01 2.44 0.38 0.20 0.02 5.62
31 7.39 0.02 6.48 0.66 0.40 0.06 15.00
Mean 12.48

CONCLUSION
The study showed a highly non-uniform distribution of primordial
radionuclides in the samples
The effective dose for six exposure
pathways was considered using RESRAD model and their mean values are
lower than the regulatory dose limit (25 mrem/yr) adopted by Nuclear
Regulatory Council.
CONCLUSION CONTD.
There was no baseline information for radionuclide concentrations in this
region before now.
This study has made a significant contribution for setting up reference levels
for naturally occuring radionuclides in soil samples for this area.

SELECTED REFERENCES
[1] RMRDC, 2010. Federal Ministry of Science and Technology, Abuja Non – Metallic Mineral Endowments In Nigeria. Raw Materials Research And Development Council, 1-113.[2] Khater, A. E., Higgy, R.H., and Pimpl,M. 2001. Radiological Impact of Natural Radioactivity In abu-Tartor Phosphate Deposits, Egypt.Journal of Environmental Radioactivity., 55(3),255-267
[3] UNSCEAR, 1993. Sources and Effect of Ionizing Radiation . Report to the General Assembly, United Nation Scientific Committee on Atomic Radiation, United Nations, New York.
[4] Osoro, M. K.,Rathone, I.V.S., Mangala, M.I and Mustapha, A.O. 2011. Radioactivity in Surface Soils around the Proposed Sites for Titanium Mining Project in Kenya. Journal of Environmental Protection. 2, 460-464.
[5] Obisesan E.F. 2004. A Study of the Radioactivity and Geochemistry of Phosphate Deposits in Ogun-State, South- Western Nigeria. Unpublished M.Sc Dissertation, Dept. of Geology, Obafemi Awolowo University Ile-Ife, Nigeria.

SELECTED REFERENCES
[6] Otwoma, D., Patel, J.P., Bartilol, S. and Mustapha, A.O. 2012. Radioactivity and Dose Assessment of Rock and Soil Samples from HomaMountain, Homa Bay Country,Kenya Xi Radiation Physics and Protection Conference 25-28 November 2012, Nasr City-Cairo, Egypt.
[7] Al-Hamidawi, A.A.A. 2015. NORM in Instant Nodules (Indomie) Sold in Iraq. J Environ Anal Chem, 2;4.
[8] Jibril, N.N and Abiodun T.H 2012. Effects of Food Diet Preparation Techniques on Radionuclide Intake and Its Implications for Individual Ingestion Effective Dose in Abeokuta, Southwestern Nigeria World Journal of Nuclear Science and Technology Vol.2 No.3 , Article ID:21257, 106 -113.
[9] Akinloye M.K and Olomo J.B 2000. The measurement of the natural radioactivity in some tubers cultivated in farmlands within the ObafemiAwolowo University, Ile-Ife, Nigeria. Niger J, phy 12:60-63.

THANKS YOU ALL FOR
LISTENING