master plan for delhi
124
Prepared by the Delhi Development Authority Under the Delhi Development Act,1957 ( CHAPTERS - ELEVEN TO SIXTEEN ) PART - III Volume Two MASTER PLAN FOR DELHI MASTER PLAN FOR DELHI
-
Upload
khangminh22 -
Category
Documents
-
view
0 -
download
0
Transcript of master plan for delhi

Prepared by the Delhi Development Authority
Under the Delhi Development Act,1957
( CHAPTERS - ELEVEN TO SIXTEEN )
PART - III
Volume Two
MASTER PLAN FOR DELHI MASTER PLAN FOR DELHI

1. Chapter Eleven Education, Health & Recreation.
2. Chapter Twelve Traffic & Transportation.
3. Chapter Thirteen Public Utilities & Services.
4. Chapter Fourteen Rural Delhi.
5. Chapter Fifteen Financial Implications of the plan.
6. Chapter Sixteen Planning Administration.
PART - III
Volume Two
MASTER PLAN FOR DELHI MASTER PLAN FOR DELHI

It is only in recent years that community facilities for a residential area have been considered as an essential part of housing. In equating community facilities ith the intensity of development, a variable scale of size of facilities is essential. The proportion of land allocated to circulation such as streets and pathways must be balanced with the requirements of schools, parks, health clinics, libraries, community buildings and shopping.
Density plays an important part in the reservation of land for community facilities. A high density area of 200 persons per acre obviously cannot have the same size for schools and playgrounds as a low density area of 60 persons per acre. For example, 200 persons per acre of gross residential density means 5 acre per 1000 population; therefore, standards such as 2 acres per 1000 for parks and an equal amount for schools cannot be provided would be nothing left for housing.
In addition to variations in standards due to density, the present mode of living of the urban dwellers which is conditioned by differing customs, casters and kinship requires other factors to be taken into consideration. For example, in a mohalla, life goes on around the courtyard, andplay is often conducted on the roof tops. Not more than one-fourth of an acre probably would be required if this pattern were to be duplicated on the ground floor. In the extensions of the city, with gross residential density of 75 persons per acre, there is a danger of providing too much open space, as a result of which the community may takes on an appearance of a soulless desert.
Considering all these factors, especially those relating to density, the requirement and proposed standards as regards educational and community facilities have been prepared and presented in this chapter. The optimum has been set for each size of facility required in a residential area according to the different densities. The standards have been tested in a series of proto- type designs. The intent of this plan is to earmark adequate lands for various community facilities, which are expected to attain a somewhat optimum standard by 1981. However, it will not be necessary in the first stage to build to a maximum each of the buildings , such as schools, hospitals, and the like, It appears that the community will have to sustain itself in a somewhat overcrowded manner by building only part of the floor space.
A) EDUCATIONAL FACILITIES :
Of all the basic needs of a community, the most pressing and immediate is the provision of educational facilities. The present schools of all types are extremely overcrowded, and according to an estimate, approximately 1.56 lakhs of 6 to 17 age – groups are not on the rolls. Besides, a large number of schools are functioning virtually in open air either under a tree or tent, thanks to the mild climate of the city. The magnitude, if viewed in the context of illiteracy, calls for
CHAPTER ELEVEN
EDUCATION, HEALTH AND RECREATION
INTRODUCTION :immediate action. Statistics compiled from various sources reveal the percentage of illiteracy as high as 43 percent in old Delhi, though in New Delhi, the extent of illiteracy, which is 12 percent, is not acute alarm.* An emergency programme of education is, therefore imperative.
I. EVALUATION OF THE EXISTING EDUCATIONAL STRUCTURE AND FACILITIES :
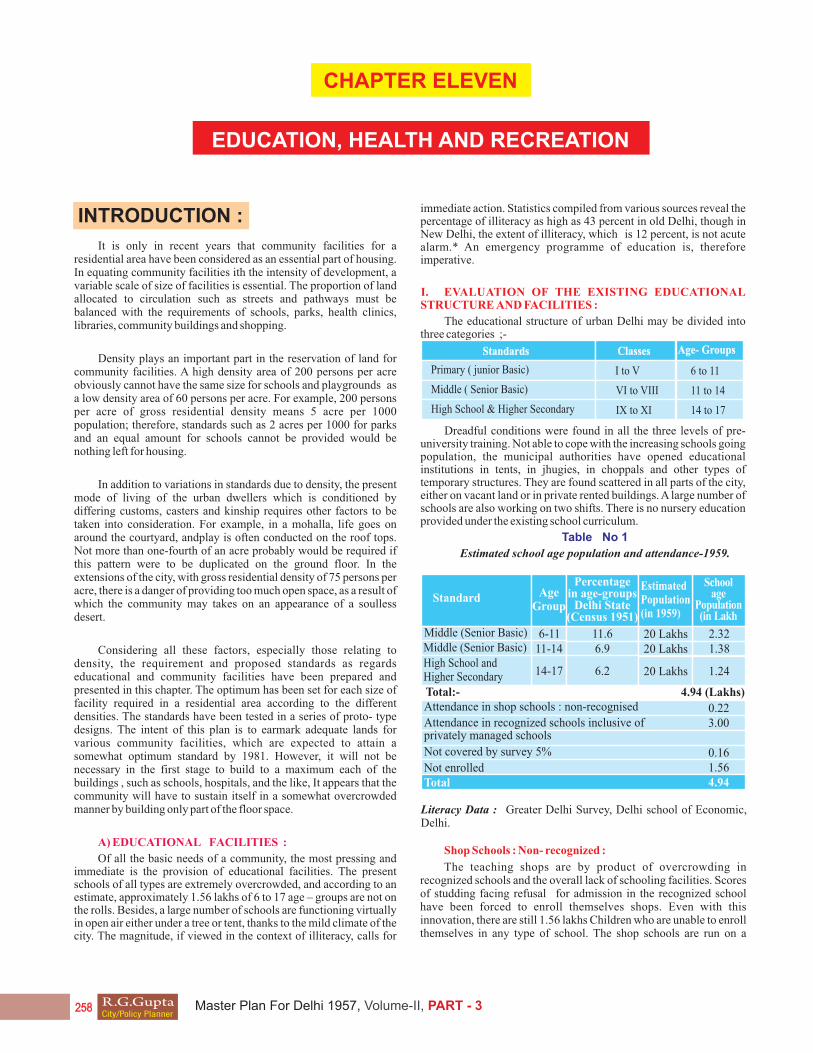
The educational structure of urban Delhi may be divided into three categories ;-
Dreadful conditions were found in all the three levels of pre- university training. Not able to cope with the increasing schools going population, the municipal authorities have opened educational institutions in tents, in jhugies, in choppals and other types of temporary structures. They are found scattered in all parts of the city, either on vacant land or in private rented buildings. A large number of schools are also working on two shifts. There is no nursery education provided under the existing school curriculum.
Table No 1
Estimated school age population and attendance-1959.
Standards Classes Age- Groups
Primary ( junior Basic)
Middle ( Senior Basic)
High School & Higher Secondary
I to V
VI to VIII
IX to XI
6 to 11
11 to 14
14 to 17
Literacy Data : Greater Delhi Survey, Delhi school of Economic, Delhi.
Age Group
Standard
Middle (Senior Basic)Middle (Senior Basic) 6-11 11.6 2.32
1.386.911-14
Percentagein age-groups
Delhi State(Census 1951)
20 Lakhs20 Lakhs
Estimated Population(in 1959)
School age
Population(in Lakh
High School and Higher Secondary
4.94 (Lakhs)
0.223.00
0.161.564.94
20 Lakhs6.214-17
Total:-Attendance in shop schools : non-recognised
Not covered by survey 5%
Not enrolledTotal
Attendance in recognized schools inclusive of privately managed schools
1.24
Shop Schools : Non- recognized :
The teaching shops are by product of overcrowding in recognized schools and the overall lack of schooling facilities. Scores of studding facing refusal for admission in the recognized school have been forced to enroll themselves shops. Even with this innovation, there are still 1.56 lakhs Children who are unable to enroll themselves in any type of school. The shop schools are run on a
R.G.GuptaCity/Policy Planner
Master Plan For Delhi 1957, Volume-II, PART - 3

A staff of 9,515teachers is employed in the recognized schools, and the average teacher- student ratio-is 1 ;31. The ratio in New Delhi is no better than in old Delhi, where it is 1;29. The survey revealed that of the 437 schools, 20 percent have no provision for running water supply, about 56 percent have no sewerage facilities, and 35 percent have no electricity. Only 32 schools provide transport facilities in the form of school buses. There are about 104 special buses which serve 4,800 students or 1.6 percent of the schools- going population. This is partly because more buses are not available, and partly for the reason that most schools are highly localized. The 1.6 percent represents the students attending public schools and other linguistic schools.
By every standard, the existing schools are acutely congested.
commercial basis by individuals or groups, and are in desirable in any educational system. Their curriculum hardly provides a basic education. Teachers do not have the necessary qualifications, though with a rigorous schedule of studies, their students manage to get through some of the examinations like Punjab Matric. Most of the schools are housed in residential and/or commercial houses. Only eleven are operating in tents. Some of the schools are only coaching classes.
A total of 480 such institutions was surveyed. Approximately 50,700 students are enrolled in these school, with a teaching staff of 2, 280. Of the total shop schools, 313 or 65 percent are academic institutions, coaching roughly 39,500 or 78 percent of the total number of students shop schools. The remaining 11,200 students attend commercial, vocational and other types of shop schools. Of these 39,500 students, 5,600 or 14 percent are in the nursery schools stage, approximately 12,800 or 33 percent are in primary school stage, about 2,500 or 6 percent are in middle school stage, and 6,600 or 17 percent are in the high school stage. The remaining 11,900 or 30 percent are enrolled for courses of F.A. ; B.A.;Rattan,prabhkar etc. Approximately 1,950 teachers are employed in academic schools, giving a teacher – student ratio of 1:20 which is incidentally, higher than that in recognized schools.
Of the total academic schools, 88 are in the New Delhi Planning Division, accounting for 25 percent of the students. 59 schools are in the city Extension Division with 10,149 or 26 percent of the students, and 55 schools are in the old city Division with 7,488 or 19 percent of the students. The rest are distributed in other planning Divisions. Only 49 schools are housed in structures which are in bad condition.
Recognized Schools :
437 recognized schools with an enrolement of 300,090 students came under the purview of the comprehensive survey of schools. A little more than 185,000 or 62 percent of the total students were found to be studying in primary schools; over 77,000 students or 26 percent
of the total were middle schools classes , and roughly 37,000 or 12 percent of the total were in higher secondary classes. The recognized schools together cover a total plot area of 375 acres, which gives an average of 0.86 acre per school, if the double shift school, are not treated as two school. The total open area is about 248 acres, which works out to about 0.57 acre per school. In the old city Division, 147 schools which account for 32 percent of the total number of students, have only 48 cres of plot area, which is 12.8 percent of the total area under schools. Out of the 48 acres of plot area of schools in old Delhi Division, there are 23 acres under open spaces. The average area of 0.33 acre per school inclusive of 0.16 acre of open space can well give us an indication of overcrowding that persists in schools of old Delhi Division.
The lack of school buildings to accommodate the increasing number of school going children has forced quite a few schools to operate on a double shift basis. Of the total recongied schools, 218 have got students attending double shifts, and function as two schools. Over 65 percent of the students attending recognized schools are on a double shift system. The first shift starts early in the morning . There is generally littels time between the two shifts, and no cleaning of the building is possible before the shifts begins. Students participation in sports and other extra- curricular activities is virtually absent. This coverts schools into soulless factories, where no real teaching is possible.
Of the remaining 219 schools not having any shift system, 29 percent are housed in temporary structures, while 11 percent of the 218 schools, having the double shift system, are in temporary structures. Together they cover about 67 acres. In Urban Delhi, twenty five percent of the schools are in structures which were assessed to be in bad condition. Many others were functioning in dark and dingy buildings usually situated by the side of open drains. Such environment cannot provide the necessary atmosphere for imparting proper education. A summary of the number of students in recognized schools is presented in table 2 below :-
Table No. 2
Enrolment in recognized school of Urban Delhi by standard and shifts.
Standards Schools without shift system
No. of Students No. of Students% % %
Schools with shift system Total
No. of Students
Primary ( Junior Basic) 62,344 1,22,877
1,22,877
47,770
24,904
33.7 66.3 100.00
100.00
100.00
100.00
38.5 61.5
33.1 66.9
34.8 65.2
12,316
1,04,539
29,879Middle ( Senior Basic)
High School & Higher Secondary
Total
1,85,221
77,649
37,220
3,00,090
The overall need of 90 percent of the school is additional space. Very few schools have libraries, auditorium, staff rooms and office accommodation. It as revealed by the surveys that 40 percent have no staff rooms, 67 percent have no libraries, 86 percent have no laboratories. About 77 percent of the surveyed schools are in need of open space. Only 12 percent want to shift from their present localities. Approximately half of the schools would like to increase their enrolment, if additional accommodation is made available to them.
Applying overall standards (as suggested by the Director of Education) of 2 acres for a junior basic school for 450 to 500 students, roughly 460 junior basicschool and almost 363 middle and higher secondary schools would be required for the student population of 4.94 lakhs as stated in Table 1. Land requirement would amount to
R.G.GuptaCity/Policy Planner
Master Plan For Delhi 1957, Volume-II, PART - 3
Standards Grades Age
Group% of
PopulationSchool Load
% of Enrolment Expected
Number of School AgeChildren
School
No. Aprox. Sizes
Basic Primary I - VIII6 - 11
11-14 (60%)
11-14 (40%)14-17
3 - 6 5.6
12.56.8
1875612
9595
1781581
388731
9575
408975
6.86.5
840 90 10
2362/4
1191/1
756 75
600
1100IX - XI
Nursery and Lower & Pre - Primary Upper
Lower & Upper
Higher Secondary
approximately 2,735 acres, which is over six times the present land covered by these educational institutions. Of course, this provide for 22,000 students now in shop schools, and 1.56 lakhs of children of school- going age, 6-17 years, who are not enrolled anywhere presently But is not realistic to assume that the entire school-attend schools, as there are many in the upper age groups who for several reason may not like to enroll themselves, or may not afford the education. Revised standards have been prepared taking in view the fact that basic education must be provided to all, and higher education to a little less percentage of student age-group population.
2). STANDARDS AND PROPOSED PLAN FOR EDUCATION:
The scarcity of land and buildings as well as teaching staff makes the problem of providing an adequate education to all a different task. The task is even more difficult with the realization that basic education is a must for everyone. This has been emphasized and indicated in a recent policy decision of the Delhi Administration to make the basic primary education from grade I to grade VIII compulsory. Even the social scientists who have been studying the relationship of literacy to economic development, have indicated the need for parallel advances in the level of education of a country to affect transformation of an overall economic.
The existing have back- log of schools, a large number of students without the necessary facilities, and the inadequate
conditions in which the present/schools are situated, give a gloomy picture. The problem has to be further viewed in the perspective of rising population, which alone will require a minimum of 40 new schools every year. To sum up, the matter requires emergent action.
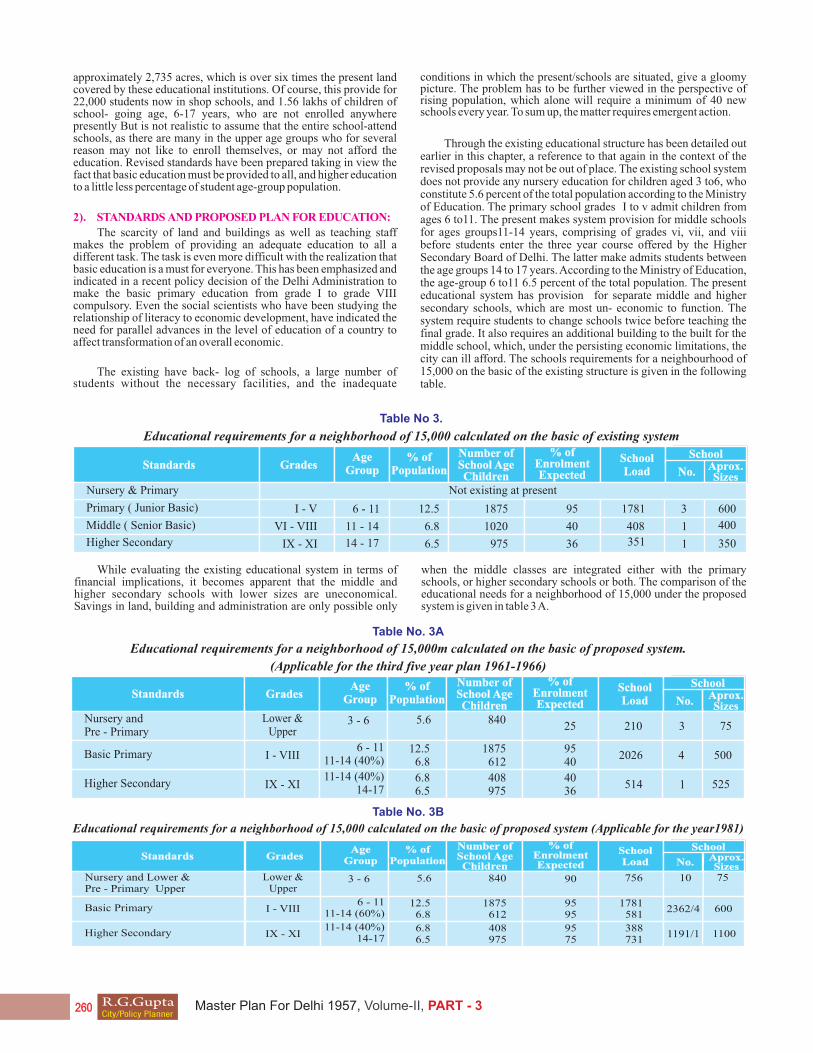
Through the existing educational structure has been detailed out earlier in this chapter, a reference to that again in the context of the revised proposals may not be out of place. The existing school system does not provide any nursery education for children aged 3 to6, who constitute 5.6 percent of the total population according to the Ministry of Education. The primary school grades I to v admit children from ages 6 to11. The present makes system provision for middle schools for ages groups11-14 years, comprising of grades vi, vii, and viii before students enter the three year course offered by the Higher Secondary Board of Delhi. The latter make admits students between the age groups 14 to 17 years. According to the Ministry of Education, the age-group 6 to11 6.5 percent of the total population. The present educational system has provision for separate middle and higher secondary schools, which are most un- economic to function. The system require students to change schools twice before teaching the final grade. It also requires an additional building to the built for the middle school, which, under the persisting economic limitations, the city can ill afford. The schools requirements for a neighbourhood of 15,000 on the basic of the existing structure is given in the following table.
Table No 3.
Educational requirements for a neighborhood of 15,000 calculated on the basic of existing system
While evaluating the existing educational system in terms of financial implications, it becomes apparent that the middle and higher secondary schools with lower sizes are uneconomical. Savings in land, building and administration are only possible only
Standards Grades Age
Group% of
PopulationSchool Load
% of Enrolment Expected
Number of School AgeChildren
School
No. Aprox. Sizes
Primary ( Junior Basic) I - V 6 - 11 12.5 1875 95 3
1
1
1781
408
600
400
350351
40
36
1020
975
6.8
6.5
11 - 14
14 - 17
VI - VIII
IX - XI
Nursery & Primary Not existing at present
Middle ( Senior Basic)
Higher Secondary
when the middle classes are integrated either with the primary schools, or higher secondary schools or both. The comparison of the educational needs for a neighborhood of 15,000 under the proposed system is given in table 3 A.
Table No. 3A
Educational requirements for a neighborhood of 15,000m calculated on the basic of proposed system.
(Applicable for the third five year plan 1961-1966)
Table No. 3B
Educational requirements for a neighborhood of 15,000 calculated on the basic of proposed system (Applicable for the year1981)
Standards Grades Age
Group% of
PopulationSchool Load
% of Enrolment Expected
Number of School AgeChildren
School
No. Aprox. Sizes
Basic Primary I - VIII6 - 11
11-14 (40%)
11-14 (40%)14-17
3 - 6 5.6
12.56.8
1875612
9540
2026
5144036
408975
6.86.5
84025 3
4
1
210 75
500
525IX - XI
Nursery and Pre - Primary
Lower & Upper
Higher Secondary
R.G.GuptaCity/Policy Planner
Master Plan For Delhi 1957, Volume-II, PART - 3

Pre-primary schools :
Kinder-garten and nursery school will play on important part in the early stages of development of the community, where working mothers require all-day or part-time children's centers. There might be located in the housing blocks, or in crèche attached to factories or adjacent to work areas. There are advantages to the factory crèches, where a mother can occasionally visit the young child during her working hours : also, the cost of construction and maintenance of the crèche becomes a factory charge and saves the expanse to the housing agency. However this disorientation to the child and confusion imposed by the journey to the distant and noisy industrial centre argues for the home-oriented nursery, which might well be combined with after-school facilities in the in the neighbourhood centers, for slightly older children of working mothers.
As seen in Table 3A and 3B, in a neighborhood of 15,000, there are 840 nursery school age-children. Though an enrolment of 90 percent would be most desirable, yet this cannot be achieved before 1981. However, for an education plan for 1981, reservations for 10 nursery school in a neighborhood of 15,000, each with 75 children and two class room would have to be made for that years. But considering the overwhelming deficiency in primary educational facilities and in certain other basic community facilities, it is not proposed to invest substantially in nursery schools, because this is primarily social education and not academic. So provision for only 25 percent enrolment is proposed, and on the basis of this, three nursery schools in a residential planning area have been recommended. It must be reitreated that earmarking land for the requirements of 1981 should be made now to avoid complications at a later date. Even with this low quantum of three nursery schools, children will not have to traverse more than one-fourth of a mile. The land area to be reserved will vary between 0.2 acre and 1 acre per school depending upon the densities. This is given in table 4, which gives the spaces standards for educational facilities.
Primary schools
As referred to earlier, the plan proposes the adoption of a new scheme for basic primary education, which will cover eight grades from I to VIII as against five in the existing scheme. he children of the age groups 11 to 14 years will be distributed on the basis of 60 percent attendance in the basic primary schools, and 40 percent in higher secondary schools. Under the new scheme, the later would be expanded to include vi to viii classes also. In a neighbourhood of 15,000, there would be 1, 875 children of the age-group 11 to 14 years( only 60 percent of the latter are accounted for here) . in 1981, it is expected that enrolement in basic primary schools will be 95 percent, since it has been declared compulsory, and reservation will have to be made to be for a total of 2,362 students. In the third five year plan period, the enrolment in the grades vi to viii is not expected to be higher than 40 percent, while it is expected to be 95 percent for those enrolled for I to grades. The total number of students to receive education would be roughly 2026.
But considering the need for four schools in 1981 due provision for all of them should be made now. The enrolment in each school at present would be 500 students which should gradually reach to 600 students by 1981. These basic primary school could later be expanded to accommodate the 1981 enrolment without getting congested. Each school will roughly contain 16 classes rooms with two classes per grade. The school could operate as a co-educational institution, or
separate schools could be set5 aside for boys and girls. The land provided for each school will vary between 4 acres and 1.5 acres, with a gross density range from 25 to 200 persons per acre. This is also given in Table 4 on space standards for educational institutions.
HIGHER SECONDARY SCHOOLS :
Since it is uneconomical to run higher secondary schools only for three grades Ix to xI, it is proposed under the new scheme to include 40 percent of the students of the age groups 11 to 14 years, attending VI to VIII grades in the higher secondary schools. The rest 60 percent were assumed to be enrolling themselves in the basic primary schools as referred to earlier. In a neighborhood of 15,000 there would be 408( 40% have been accounted here) children of the age group 11 to 14 years, and 975 of the 14 to 17 age groups. In 1981, 95 percent enrolment has been assumed for these attending Ix to xi grades. Calculated on the basic of the above enrolment, roughly 1120 students need to be provided higher secondary schools, only one higher secondary school is proposed for one neighbourhood. In the third plan period, the enrolment for vi to viii grades is not likely to exceed36 percent, and on the basis of that the total number to receive education would be 514 students .
It has been given in table 3A. it is recommended that one higher secondary school or smaller building size be provided with scope for further expansion. Expansion of the school size would be very necessary, as the enrolment would go on increasing with the passage of time.
As present, co-educational schools are not favored. Hence, in two residential neighbourhoods, it is recommended to have too higher secondary schools, one for boys and the other for girls. Alternatively, the higher secondary school in each residential planning area will have common play- grounds for boys and girls, but separate classes and administrative buildings. This type of school ill reduce the distance which students will have to walk to about a mile. An example of this type is in Vinay Nagar. At a later stage, this type of school may be converted into a co-educational one, if circumstance permit.
Some of the higher secondary schools could be located on the edge of the district park network, which would permit expansion in the future. Also, it would permit one out o four or five higher secondary school to provide superior facilities for mass education inan audio- visual programmes, supervised by classroom attendants. All te children of the school district could be exposed to the very best teachers under controlled conditions; literally, 1,000 students could attend such educational programmes. This device is now being experimented with in the western countries, particularly in America. Delhi with its severe consideration to this proposal, whereby central higher secondary school would become the distribution centre for four or five. Since there are roughly 14 to 16 schools per district, 3 or 4 of these higher secondary schools could be equipped for this mass educational programme.
It has been stated at several place that the standards of educational requirements have been worked out, Keeping in view the various densities. The standards are given in table 4, and arethe ultimate requirement of a neighborhood.
R.G.GuptaCity/Policy Planner
Master Plan For Delhi 1957, Volume-II, PART - 3
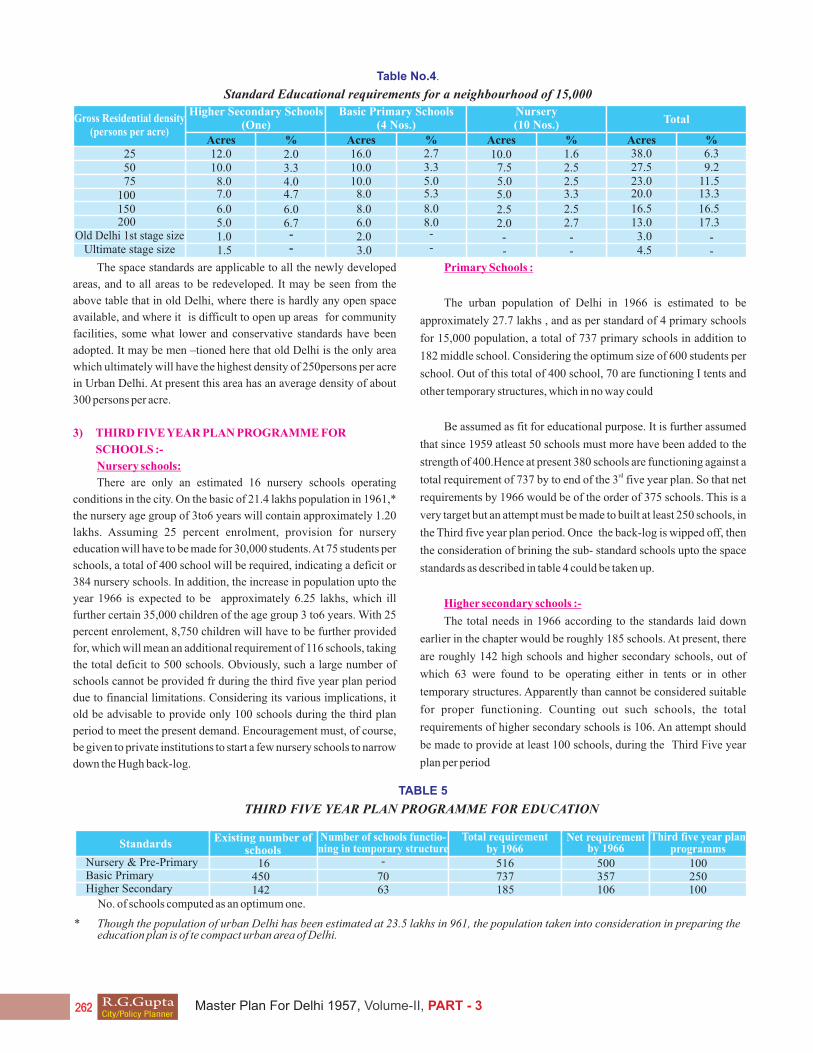
Table No.4.
Standard Educational requirements for a neighbourhood of 15,000
The space standards are applicable to all the newly developed
areas, and to all areas to be redeveloped. It may be seen from the
above table that in old Delhi, where there is hardly any open space
available, and where it is difficult to open up areas for community
facilities, some what lower and conservative standards have been
adopted. It may be men –tioned here that old Delhi is the only area
which ultimately will have the highest density of 250persons per acre
in Urban Delhi. At present this area has an average density of about
300 persons per acre.
3) THIRD FIVE YEAR PLAN PROGRAMME FOR
SCHOOLS :-
Nursery schools:
There are only an estimated 16 nursery schools operating
conditions in the city. On the basic of 21.4 lakhs population in 1961,*
the nursery age group of 3to6 years will contain approximately 1.20
lakhs. Assuming 25 percent enrolment, provision for nursery
education will have to be made for 30,000 students. At 75 students per
schools, a total of 400 school will be required, indicating a deficit or
384 nursery schools. In addition, the increase in population upto the
year 1966 is expected to be approximately 6.25 lakhs, which ill
further certain 35,000 children of the age group 3 to6 years. With 25
percent enrolement, 8,750 children will have to be further provided
for, which will mean an additional requirement of 116 schools, taking
the total deficit to 500 schools. Obviously, such a large number of
schools cannot be provided fr during the third five year plan period
due to financial limitations. Considering its various implications, it
old be advisable to provide only 100 schools during the third plan
period to meet the present demand. Encouragement must, of course,
be given to private institutions to start a few nursery schools to narrow
down the Hugh back-log.
Gross Residential density (persons per acre)
Higher Secondary Schools (One)
Acres Acres% % Acres % %
Basic Primary Schools (4 Nos.)
Nursery(10 Nos.) Total
Acres25
6.05.01.01.5
7.08.0
10.012.0
8.06.02.03.0
8.010.010.016.0
2.52.0--
5.0
7.55.0
10.0
6.06.7--
4.74.03.32.0
8.08.0--
5.35.03.32.7
2.5 16.52.7 17.3- -- -
3.3 13.32.5 11.52.5 9.21.6 6.3
16.513.03.04.5
20.023.027.538.0
5075
100150200
Ultimate stage sizeOld Delhi 1st stage size
Primary Schools :
The urban population of Delhi in 1966 is estimated to be
approximately 27.7 lakhs , and as per standard of 4 primary schools
for 15,000 population, a total of 737 primary schools in addition to
182 middle school. Considering the optimum size of 600 students per
school. Out of this total of 400 school, 70 are functioning I tents and
other temporary structures, which in no way could
Be assumed as fit for educational purpose. It is further assumed
that since 1959 atleast 50 schools must more have been added to the
strength of 400.Hence at present 380 schools are functioning against a rdtotal requirement of 737 by to end of the 3 five year plan. So that net
requirements by 1966 would be of the order of 375 schools. This is a
very target but an attempt must be made to built at least 250 schools, in
the Third five year plan period. Once the back-log is wipped off, then
the consideration of brining the sub- standard schools upto the space
standards as described in table 4 could be taken up.
Higher secondary schools :-
The total needs in 1966 according to the standards laid down
earlier in the chapter would be roughly 185 schools. At present, there
are roughly 142 high schools and higher secondary schools, out of
which 63 were found to be operating either in tents or in other
temporary structures. Apparently than cannot be considered suitable
for proper functioning. Counting out such schools, the total
requirements of higher secondary schools is 106. An attempt should
be made to provide at least 100 schools, during the Third Five year
plan per period
TABLE 5
THIRD FIVE YEAR PLAN PROGRAMME FOR EDUCATION
Standards
Nursery & Pre-PrimaryBasic PrimaryHigher Secondary
16 -
70516737185
500357106
100
100250
63450142
Existing number of schools
Number of schools functio-ning in temporary structure
Total requirement by 1966
Net requirement by 1966
Third five year plan programms
No. of schools computed as an optimum one.
* Though the population of urban Delhi has been estimated at 23.5 lakhs in 961, the population taken into consideration in preparing the education plan is of te compact urban area of Delhi.
R.G.GuptaCity/Policy Planner
Master Plan For Delhi 1957, Volume-II, PART - 3

3.) UNIVERSITY EDUCATION :
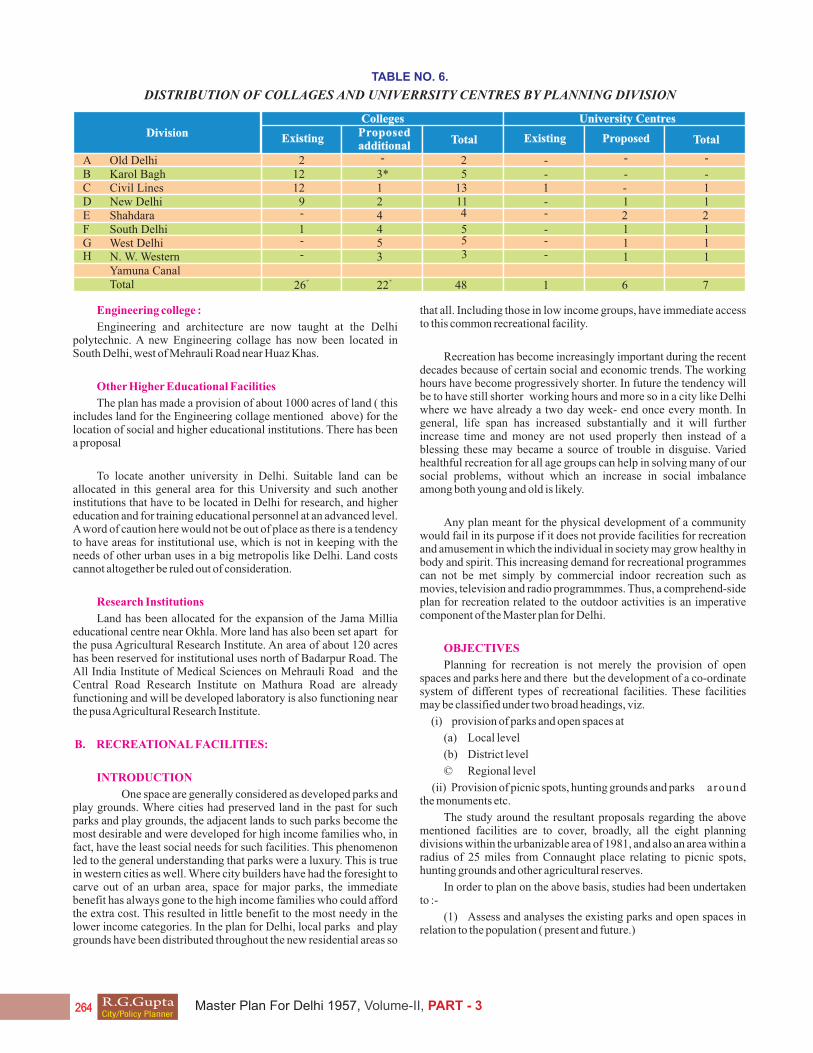
Higher University education is assuming increasing importance in every society, and Delhi9 is no exception. If the enrolment in various collage and the university of Delhi is seen through the years 1947 to the present ay, it would reveal that within a span of 13 years, the number of students has risen from 2560 to 14,282 in 1960. This reveals a phenomenal increase of 457 percent, decidedly a very high growth rate. The 1960 figure incidentally does not include approximately 1,400 enrolled for evening in various collages, from only 8 collages in 1947, the present number is 26 collages. In order to complete the education plan on the basis of the Master plan for Delhi, the existing educational facilities have been studied in relation to the expected requirements.
Delhi University is situated in the north of Delhi, in the Civil Lines are, and onstitutes the only concentrated higher education centre for Delhi. The number f collages and autonomous and semi-autonomous institutions located in the university campus is ten with a total enrolement of 6,810 students. * The University of Delhi has directly on its rolls 1882 students. Only the (under –graduate classes are held in the constituent collages, and all the post-graduate) and law classes are directly conducted by the University of Delhi, though the students can enroll themslaves in any of the collages. A large number of students coming to the university campus is
From south and west Delhi. Due to lack of facilities in these areas, they are forced to travel as much as 12 miles each way by bus everyday. Besides the university campus and constitutent collages, there are 16 collages, which are scattered all over Urban Delhi, though affiliated with the University of Delhi. They are as follows :
Delhi collage
Khalsa collage
D.A.V.collage
Dayal singh collage
Deshbandhu collage
Pramilla collage for women
Lady Irwin collage
Indraprastha collage
Lady sri Ram collage*
Maulana Azad Medical collage*
Delhi polytechnic*
Indian school of International studies
Sanatan Dharma collage
JankiDevi Mahaa Vidyalaya
Collage of Nursing*
The vast increase in the number of students has resulted in overcrowding in he various collages of the university campus. Due to the shortage of collages in other areas, students have to traverse long distances. A large number of students are denied admission because the number of seats in the educational institution is limited. All this
calls for a break- off point.
Proposals :
The plan recommends the expansion of the existing university campus ( to have a total area of about 385 acres) which will include a part of Kingsway Road and cavalry lines, permitting substantial expansion of the present the plan has also considered the one-sided location of the campus overcrowded campus<for higher education, and its implications in view of the all-sided grothy of the city. The need for earmarking land for additional was madein the interin prepared four years ago. The Interim General plan had suggested the development of a university Centre with several collages in the south of Delhi, near to crossing of Ring Road and kitchner Road, and this proposal has been retained in the Master plan, and approximately 170 acres have been earmarked for the purpose
The decentralization of the higher education campus ahs already started with the establishment Recently an opinion has been expressed of several University campus. Their locations were not based upon any overall plan, but chosen an and hoc basic. Recently an opinion has been expressed that smaller-sized collages should be established near the residential areas, and this proposals, in fact, is in accord with the scheme for decentralization of higher educational institutions. Considering several factors, it has been suggested to have one collage for 150,000 population.
The age-group of 17 to 2 years, which can go in for university education constitutes roughly 7.8 percent of the total population, or about 11,700 ina discrit o 150,000 population. However, the enolement there is not likely to form more than 10 percent of the total, which would make the number of collage- going students 1,170.
Land measuring about 15 acres has been proposed for each collage, which ill suffice for the teaching buildings, staff quarters and playgrounds, with land left over for further expansion. It is proposed that only a few of these collages would have hostel and dormitory facilities, as most of the students served by the collage would come from the surrounding residential areas. In addition to the existing (1960) 26 collages, sites for 22 new collages have been marked in the plan, making a total of 48 collages, which will serve the union Territory of Delhi of over 50 laks in 1981.
The University officials have proposed that four every four or five collages, a university centre should be also provided. This would mean a centre for almost every planning division. Such a university centre would contain comprehensive library facilities and research laboratories ; and in addition, it would serve as a general campus of r evening cultural activities for the entire planning division. The plan has provided such university centers with as much as 30 to 40 acres each. It is not intended that all the collages should be built at once, but it is suggested that in some cases, the university centre should come first and the collages could be built later. Six new campus have been suggested, two of which are located in shahdara planning division alone. The sites are given in the table below. With such a large number of collages and campus, it will be possible to make substantial adjustments in the development plan within the 1,400 that have been allocated for university education.
* Source :Registrar: Delhi University; Delhi. The collages in and ground the campus are St,, Stephens collage, Hindu collage, Ramjas collage Sri Ram collage. Of commerce, kirori Mal collage, Hansraj collage, Mirranda House, Delhi school of social work, central institute of Education and the Delhi school of Economics. These are Professional Colleges
*Two more collages are proposed on the Anand parbat in addition to one collage and one school existing at present.
+There are 4 existing professional collages and one Engineering collage is proposed.
R.G.GuptaCity/Policy Planner
Master Plan For Delhi 1957, Volume-II, PART - 3
Engineering college :
Engineering and architecture are now taught at the Delhi polytechnic. A new Engineering collage has now been located in South Delhi, west of Mehrauli Road near Huaz Khas.
Other Higher Educational Facilities
The plan has made a provision of about 1000 acres of land ( this includes land for the Engineering collage mentioned above) for the location of social and higher educational institutions. There has been a proposal
To locate another university in Delhi. Suitable land can be allocated in this general area for this University and such another institutions that have to be located in Delhi for research, and higher education and for training educational personnel at an advanced level. A word of caution here would not be out of place as there is a tendency to have areas for institutional use, which is not in keeping with the needs of other urban uses in a big metropolis like Delhi. Land costs cannot altogether be ruled out of consideration.
Research Institutions
Land has been allocated for the expansion of the Jama Millia educational centre near Okhla. More land has also been set apart for the pusa Agricultural Research Institute. An area of about 120 acres has been reserved for institutional uses north of Badarpur Road. The All India Institute of Medical Sciences on Mehrauli Road and the Central Road Research Institute on Mathura Road are already functioning and will be developed laboratory is also functioning near the pusa Agricultural Research Institute.
B. RECREATIONAL FACILITIES:
INTRODUCTION
One space are generally considered as developed parks and play grounds. Where cities had preserved land in the past for such parks and play grounds, the adjacent lands to such parks become the most desirable and were developed for high income families who, in fact, have the least social needs for such facilities. This phenomenon led to the general understanding that parks were a luxury. This is true in western cities as well. Where city builders have had the foresight to carve out of an urban area, space for major parks, the immediate benefit has always gone to the high income families who could afford the extra cost. This resulted in little benefit to the most needy in the lower income categories. In the plan for Delhi, local parks and play grounds have been distributed throughout the new residential areas so
TABLE NO. 6.
DISTRIBUTION OF COLLAGES AND UNIVERRSITY CENTRES BY PLANNING DIVISION
Division
Old Delhi3*124453
+22
2
1
1212
9
+26
-
--
2
5
51311
48
4
53
-
-
-1-
1
-
--
-
1
-11
7
2
11
-
1
--1
6
2
11
-ABCDEFGH
Karol BaghCivil LinesNew DelhiShahdaraSouth DelhiWest DelhiN. W. WesternYamuna CanalTotal
Colleges
Existing ExistingTotal TotalProposed additional
University Centres
Proposed
that all. Including those in low income groups, have immediate access to this common recreational facility.
Recreation has become increasingly important during the recent decades because of certain social and economic trends. The working hours have become progressively shorter. In future the tendency will be to have still shorter working hours and more so in a city like Delhi where we have already a two day week- end once every month. In general, life span has increased substantially and it will further increase time and money are not used properly then instead of a blessing these may became a source of trouble in disguise. Varied healthful recreation for all age groups can help in solving many of our social problems, without which an increase in social imbalance among both young and old is likely.
Any plan meant for the physical development of a community would fail in its purpose if it does not provide facilities for recreation and amusement in which the individual in society may grow healthy in body and spirit. This increasing demand for recreational programmes can not be met simply by commercial indoor recreation such as movies, television and radio programmmes. Thus, a comprehend-side plan for recreation related to the outdoor activities is an imperative component of the Master plan for Delhi.
OBJECTIVES
Planning for recreation is not merely the provision of open spaces and parks here and there but the development of a co-ordinate system of different types of recreational facilities. These facilities may be classified under two broad headings, viz.
(i) provision of parks and open spaces at
(a) Local level
(b) District level
© Regional level
(ii) Provision of picnic spots, hunting grounds and parks around the monuments etc.
The study around the resultant proposals regarding the above mentioned facilities are to cover, broadly, all the eight planning divisions within the urbanizable area of 1981, and also an area within a radius of 25 miles from Connaught place relating to picnic spots, hunting grounds and other agricultural reserves.
In order to plan on the above basis, studies had been undertaken to :-
(1) Assess and analyses the existing parks and open spaces in relation to the population ( present and future.)
R.G.GuptaCity/Policy Planner
Master Plan For Delhi 1957, Volume-II, PART - 3
(11) select suitable areas for future development as recreational spots.
I. ANALYSIS OF EXISTING OPEN SPACES AND PROPOSED STANDARDS
a. Neighbourhood open spaces
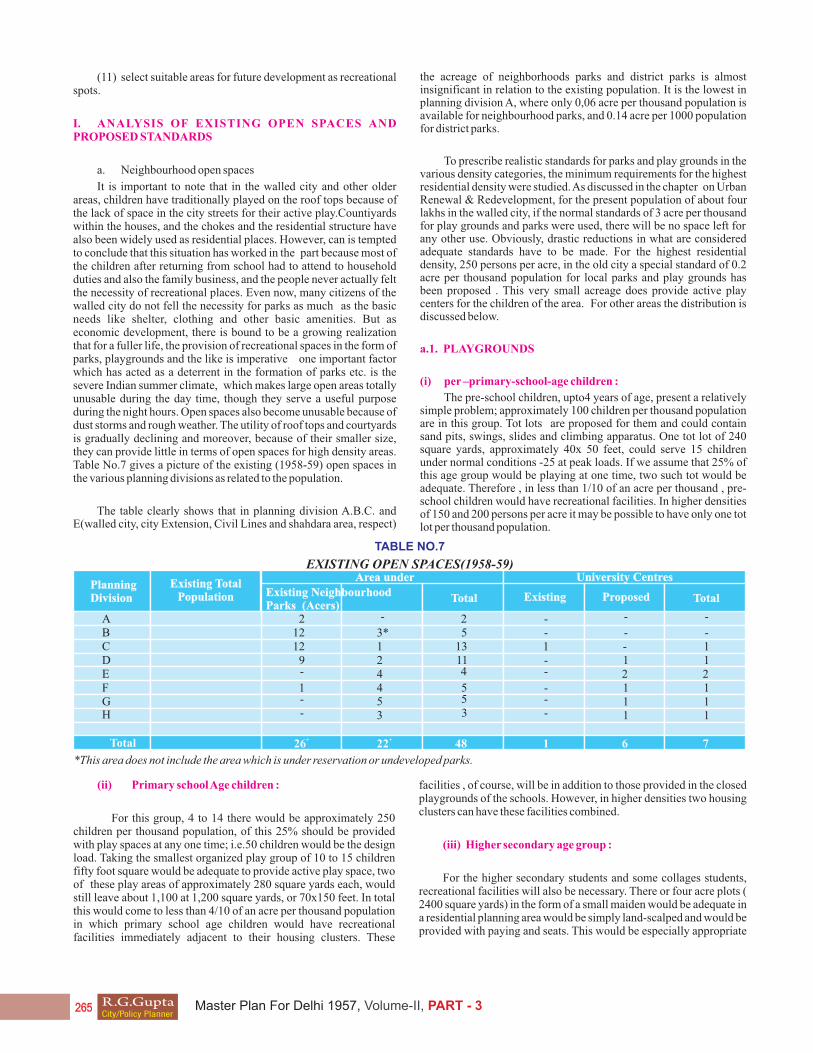
It is important to note that in the walled city and other older areas, children have traditionally played on the roof tops because of the lack of space in the city streets for their active play.Countiyards within the houses, and the chokes and the residential structure have also been widely used as residential places. However, can is tempted to conclude that this situation has worked in the part because most of the children after returning from school had to attend to household duties and also the family business, and the people never actually felt the necessity of recreational places. Even now, many citizens of the walled city do not fell the necessity for parks as much as the basic needs like shelter, clothing and other basic amenities. But as economic development, there is bound to be a growing realization that for a fuller life, the provision of recreational spaces in the form of parks, playgrounds and the like is imperative one important factor which has acted as a deterrent in the formation of parks etc. is the severe Indian summer climate, which makes large open areas totally unusable during the day time, though they serve a useful purpose during the night hours. Open spaces also become unusable because of dust storms and rough weather. The utility of roof tops and courtyards is gradually declining and moreover, because of their smaller size, they can provide little in terms of open spaces for high density areas. Table No.7 gives a picture of the existing (1958-59) open spaces in the various planning divisions as related to the population.
The table clearly shows that in planning division A.B.C. and E(walled city, city Extension, Civil Lines and shahdara area, respect)
the acreage of neighborhoods parks and district parks is almost insignificant in relation to the existing population. It is the lowest in planning division A, where only 0,06 acre per thousand population is available for neighbourhood parks, and 0.14 acre per 1000 population for district parks.
To prescribe realistic standards for parks and play grounds in the various density categories, the minimum requirements for the highest residential density were studied. As discussed in the chapter on Urban Renewal & Redevelopment, for the present population of about four lakhs in the walled city, if the normal standards of 3 acre per thousand for play grounds and parks were used, there will be no space left for any other use. Obviously, drastic reductions in what are considered adequate standards have to be made. For the highest residential density, 250 persons per acre, in the old city a special standard of 0.2 acre per thousand population for local parks and play grounds has been proposed . This very small acreage does provide active play centers for the children of the area. For other areas the distribution is discussed below.
a.1. PLAYGROUNDS
(i) per –primary-school-age children :
The pre-school children, upto4 years of age, present a relatively simple problem; approximately 100 children per thousand population are in this group. Tot lots are proposed for them and could contain sand pits, swings, slides and climbing apparatus. One tot lot of 240 square yards, approximately 40x 50 feet, could serve 15 children under normal conditions -25 at peak loads. If we assume that 25% of this age group would be playing at one time, two such tot would be adequate. Therefore , in less than 1/10 of an acre per thousand , pre-school children would have recreational facilities. In higher densities of 150 and 200 persons per acre it may be possible to have only one tot lot per thousand population.
TABLE NO.7
EXISTING OPEN SPACES(1958-59)
3*124453
+22
2
1
1212
9
+26
-
--
2
5
51311
48
4
53
-
-
-1-
1
-
--
-
1
-11
7
2
11
-
1
--1
6
2
11
-ABCDEFGH
Total
Area under
Existing NeighbourhoodParks (Acers)
PlanningDivision ExistingTotal Total
University Centres
ProposedExisting Total
Population
*This area does not include the area which is under reservation or undeveloped parks.
(ii) Primary school Age children :
For this group, 4 to 14 there would be approximately 250 children per thousand population, of this 25% should be provided with play spaces at any one time; i.e.50 children would be the design load. Taking the smallest organized play group of 10 to 15 children fifty foot square would be adequate to provide active play space, two of these play areas of approximately 280 square yards each, would still leave about 1,100 at 1,200 square yards, or 70x150 feet. In total this would come to less than 4/10 of an acre per thousand population in which primary school age children would have recreational facilities immediately adjacent to their housing clusters. These
facilities , of course, will be in addition to those provided in the closed playgrounds of the schools. However, in higher densities two housing clusters can have these facilities combined.
(iii) Higher secondary age group :
For the higher secondary students and some collages students, recreational facilities will also be necessary. There or four acre plots ( 2400 square yards) in the form of a small maiden would be adequate in a residential planning area would be simply land-scalped and would be provided with paying and seats. This would be especially appropriate
R.G.GuptaCity/Policy Planner
Master Plan For Delhi 1957, Volume-II, PART - 3
near religious buildings, temples and mosques.
It is seen from the above analysis that the providing about 0.66 acre per thousand population, playgrounds facilities can be provided to all levels of children and teen agers. In the most dense part of the walled city, at 250 persons per acre gross residential density, only about0.18 acre of play grounds per thousand has been proposed, which will mean providing playgrounds for the pre-school and primary school children only. The children of 15 years and above will have to go to the district parks which will be no more than to one mile for every residential planning area.
A.2. LOCAL PARKS IN RESIDENTIAL AREAS:
At present there is no correlation between the developed recreational facilities in the form of parks and playgrounds and school facilities. Recognition of the need for organized sports is now evidenced by the springing up of small cricket, foot- ball and hockey fields in vacant area all over the city. The importance of these has also been stressed in the chapter on Housing and Neigbourhood, wherein it is stated that for the climate conditions that exist in Delhi, small plays area and parks properly landscaped and surrounded by tall buildings can provide cool and pleasant areas of recreation. The
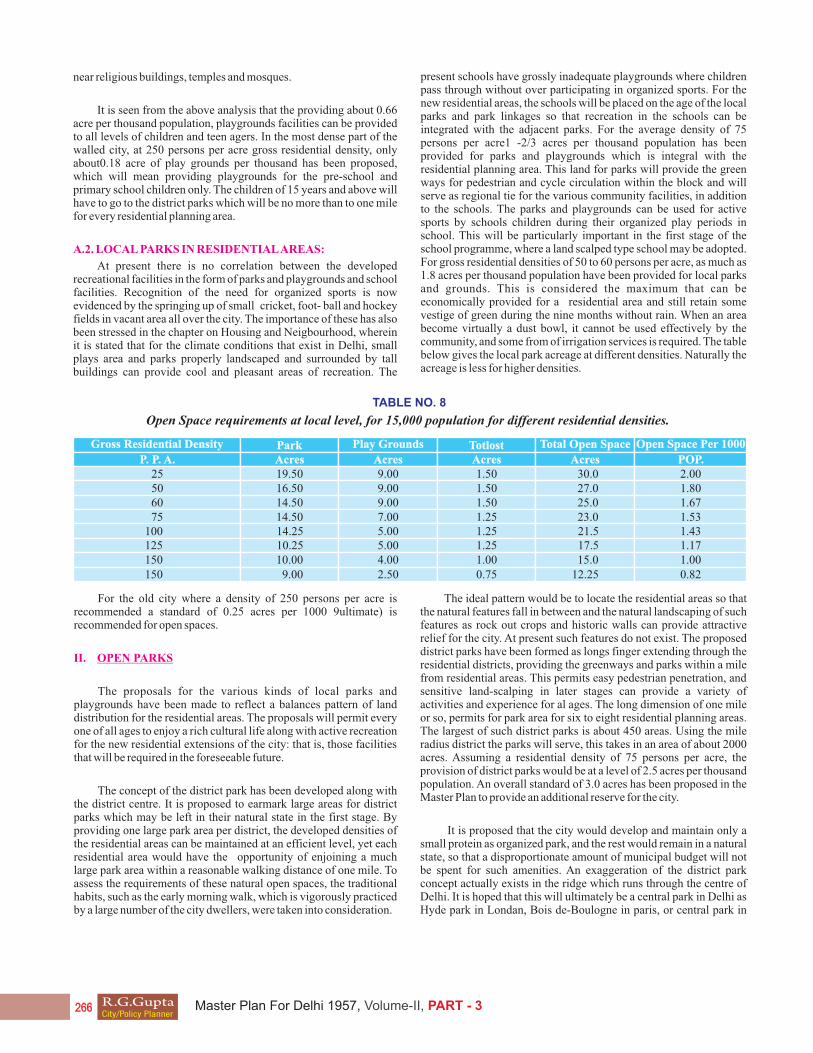
present schools have grossly inadequate playgrounds where children pass through without over participating in organized sports. For the new residential areas, the schools will be placed on the age of the local parks and park linkages so that recreation in the schools can be integrated with the adjacent parks. For the average density of 75 persons per acre1 -2/3 acres per thousand population has been provided for parks and playgrounds which is integral with the residential planning area. This land for parks will provide the green ways for pedestrian and cycle circulation within the block and will serve as regional tie for the various community facilities, in addition to the schools. The parks and playgrounds can be used for active sports by schools children during their organized play periods in school. This will be particularly important in the first stage of the school programme, where a land scalped type school may be adopted. For gross residential densities of 50 to 60 persons per acre, as much as 1.8 acres per thousand population have been provided for local parks and grounds. This is considered the maximum that can be economically provided for a residential area and still retain some vestige of green during the nine months without rain. When an area become virtually a dust bowl, it cannot be used effectively by the community, and some from of irrigation services is required. The table below gives the local park acreage at different densities. Naturally the acreage is less for higher densities.
TABLE NO. 8
Open Space requirements at local level, for 15,000 population for different residential densities.
Park Play Grounds Totlost Total Open Space Open Space Per 1000Gross Residential Density
P. P. A. Acres POP.Acres AcresAcres25506075
100125150150
9.009.009.007.005.005.004.002.50
1.501.501.501.251.251.251.000.75
2.001.801.671.531.431.171.000.82
19.5016.5014.5014.5014.2510.2510.009.00
30.027.025.023.021.517.515.0
12.25
For the old city where a density of 250 persons per acre is recommended a standard of 0.25 acres per 1000 9ultimate) is recommended for open spaces.
II. OPEN PARKS
The proposals for the various kinds of local parks and playgrounds have been made to reflect a balances pattern of land distribution for the residential areas. The proposals will permit every one of all ages to enjoy a rich cultural life along with active recreation for the new residential extensions of the city: that is, those facilities that will be required in the foreseeable future.
The concept of the district park has been developed along with the district centre. It is proposed to earmark large areas for district parks which may be left in their natural state in the first stage. By providing one large park area per district, the developed densities of the residential areas can be maintained at an efficient level, yet each residential area would have the opportunity of enjoining a much large park area within a reasonable walking distance of one mile. To assess the requirements of these natural open spaces, the traditional habits, such as the early morning walk, which is vigorously practiced by a large number of the city dwellers, were taken into consideration.
The ideal pattern would be to locate the residential areas so that the natural features fall in between and the natural landscaping of such features as rock out crops and historic walls can provide attractive relief for the city. At present such features do not exist. The proposed district parks have been formed as longs finger extending through the residential districts, providing the greenways and parks within a mile from residential areas. This permits easy pedestrian penetration, and sensitive land-scalping in later stages can provide a variety of activities and experience for al ages. The long dimension of one mile or so, permits for park area for six to eight residential planning areas. The largest of such district parks is about 450 areas. Using the mile radius district the parks will serve, this takes in an area of about 2000 acres. Assuming a residential density of 75 persons per acre, the provision of district parks would be at a level of 2.5 acres per thousand population. An overall standard of 3.0 acres has been proposed in the Master Plan to provide an additional reserve for the city.
It is proposed that the city would develop and maintain only a small protein as organized park, and the rest would remain in a natural state, so that a disproportionate amount of municipal budget will not be spent for such amenities. An exaggeration of the district park concept actually exists in the ridge which runs through the centre of Delhi. It is hoped that this will ultimately be a central park in Delhi as Hyde park in Londan, Bois de-Boulogne in paris, or central park in
R.G.GuptaCity/Policy Planner
Master Plan For Delhi 1957, Volume-II, PART - 3

New York, which new park facilities area deed as more and active recreation centres are required. This means the planners and city administrators should carefully consider this open area, looking ahead about 25 to 50 years, when more resources would be available for development. Table No.9 below gives the district park standard in the various planning divisions. The total area under district parks recreation about 890 acres and in Regional parks within the urban area about 8,2000 acres.
In summary, the land requirements for open spaces have been ser on a variable scale for local parks from 0.80 acres to 2.0 acres per 1000 population and for the district parks 3.0 acres per thousand population.
A brief description of the district park net work by planning divisions as proposed for the city is presented below.
Planning Division A- The old city
There are six major parks proposed for this area, three of which already exist*; in the parade grounds in form of the Red Fort and Jama Masjid, the Raj Ghat and Queens Gardens. There are three additional parks proposed the river front south for the Yamuna Bridge. Qadam Sharif around the graveyard area, and the Id-gah it is proposed that all areas receive major improvement in the third five year plan period. It is in this area of the old city that the greatest population is concentrated and the greatest need for parks exists.
Planning Division –B-Karol Bagh
In this division there are four parks proposed, of which 2 already exist in Almal Khan and Anand parbat. The Ajmal Khan park is really too small to be considered as a district park. But the lack of open space in the area makes it important to high- light this park even though it is only about 24 acres. The Anand Parbat hill will be the major source for park lands. The ridge area east of pusa Road should be developed as a district park for this division. The other one is near Naraina village.
Planning Division c- Civil Lines
Six parks are proposed, of which two already exist in a semi-developed state; the ridge area and the coronation pillar. Over 90 acres are proposed for immediate development in each of these parks. The third existing park is roshanar a garden of about 75 acres. The fourth is outside Kashmeri Gate, extending upto Mori Gate, of about 115 acres. In addition, the river front Timar pur, police Grounds, the Mail Road-G.T.Raod Junction, the area north of pratap Bagh and near Model Town are proposed.
Planning Division D-The New Delhi Area
As described earlier, New Delhi has the largest number of existing parks in the whole city. However, the total acreage is not large than in the other areas. There exist over sixteen parks@, of 2which only six are over 50 acres. However, due to the particular charm of such places(as Lodi Gardens) they also actually function as a district p[ark. People come here from all over Delhi to enjoy the natural setting around some of the finest pre-Moghul tombs in Delhi. The largest park proposed in the area includes the zoological garden; however, it is proposed to develop only 60 acres in the third five year plan period in the zoological garden. Not until west Delhi, South Delhi, and shahdara have adequate recreational areas, need there be any major improvement in New Delhi other ten the zoological
gardens, the Buddha Memorial park and perhaps the Olympic stadium in the River Front Development area.
Planning Division E-Shahdara
This area is totally lacking in parks today. The largest park proposed in this area is along the river Yamuna, which is pleasant area in the evenings. Parks are distributed both north and south of the G.T.Road so that there is no need of crossing the road for recreational activities.
Planning Division F-South Delhi
In this division there are four major parks- siri, Hauz Khas, also near Kalkaji and Tughlakaba. The first two parks have great future potentialities -400 acres and 300 acres respectively. However, it is proposed that only a small portion of this should be developed, until the population has increased sufficiently.
Planning Division-G West Delhi
In this division there are six major parks proposed, which are tied together along the Najaf Garh Nalla. This ,division at present, does not have any major parks. It is proposed that parks and lands both east and west of the Ring Road, Ramesh Nagar, Hari Nagar, and Rajouri Garden should all be developed in the third five year plan.
Planning Division H-North Western Area
The parks proposed should utilize the existing orchards, which should be cleared of their under –growth, leaving the tress for shade.
Staging: The limited resources available for urban amenities has made the first stage of development quite obvious; i.e., reserve the total land requirements, but restrict development. The parks and play grounds developed for all levels of recreation are an integral part of the Residential planning Area. The size of these local parks range from 10 to 20 acres, excluding play grounds. However, they represent a relatively small portion of the total park lands has been placed in the district parks which are much larger, varying between 50 to 400 acres. These district parks at present serve as open space, separating groups of residential planning areas. There is one district park designed for each planning district, with its focus upon the district centre. The plan envisages that in the first stage, the district parks would remain undeveloped and kept as reserve – to minimize the initial expenditure. With the availability of large funds developed for organized intensive recreation.
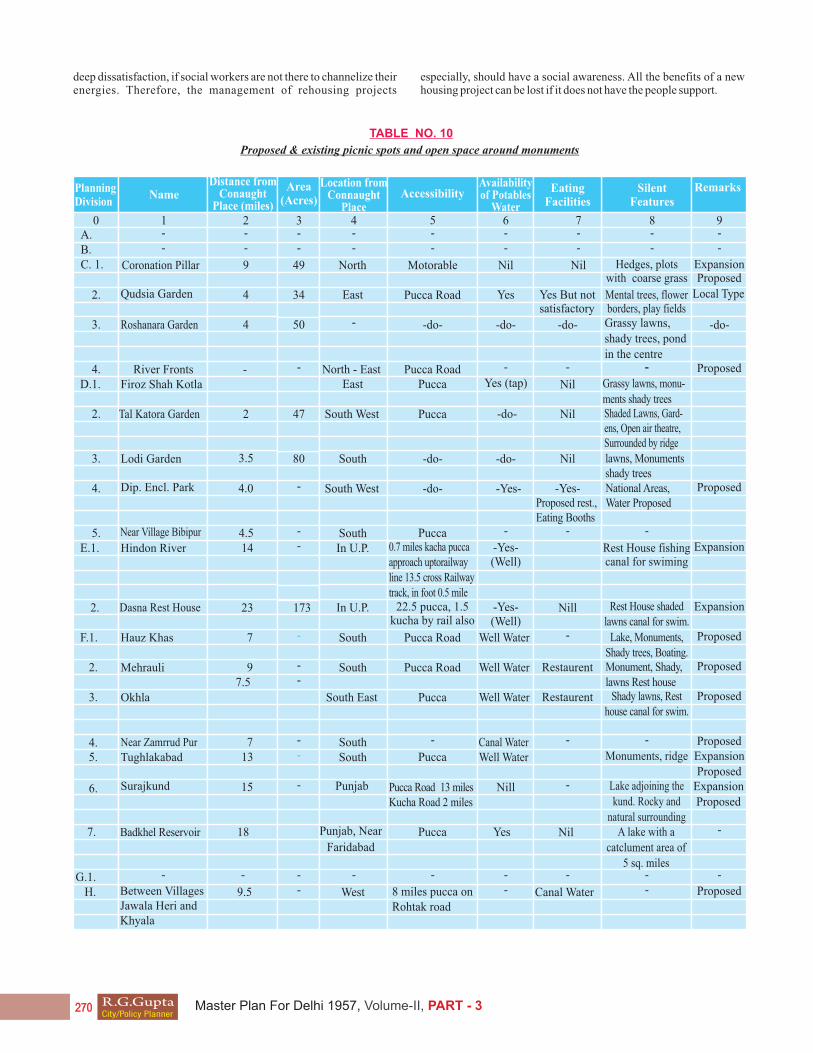
III. PICNIC SPOTS AND OPEN SPACE AROUND MONUMENTS (WITHIN 25 MILES FROM CONNAUGHT PLACE)
In preparing this plan for recreation study of the existing and potential picnic spots in and around Delhi was also undertaken . The study revealed that the existing picnic spots are inadequate to meet the growing demands of the people for such places. To meet the increasing demand additional picnic spots are proposed in the Master plan for Delhi, and the expansion of the existing picnic spots has also been suggested wherever possible.
The table annexed will show an analytical picture of the picnic spots proposed to be developed within a radius of 25 miles of Connaught place. It may be noted that the picnic spots as proposed are within accessible distance.
* Table 11.a.b.c. gives a list of existing major parks –public, semi-public and private in the Delhi Metropolitan Area.
R.G.GuptaCity/Policy Planner
Master Plan For Delhi 1957, Volume-II, PART - 3

IV HUNTING AND FISHING SPOTS
Najafgarh Jhil and Okhla which are hunting spots in Delhi are used for duck shooting and fishing respectively, and should be more fully developed.
V. REGIONAL PARKS +
The Master Plan proposes five regional parks in the metropolitan region of Delhi. These parks will cover an area of about52,000 acres. A general description of all these five parks is given below :-
V. PARK NO.1
Extending from the proposed university centre at Ring Road insouth Delhi, to suraj Kund and even beyond, it covers an area of about 20,000 acres. The general and topographical features of tgis park are detailed below.
1) Rocky land with varying contours
11) Spots of natural beauty such as suraj Kuna.
111) Monuments such as at Mehrauli –Quab Minar.
This proposed park will be partly in the urban area.
PARK NO. 2
It is about 19,000 acres in area. It extends along the Najaf Grah Nalah up to Najaf Garh Jhil. In addition to the general features this park will also have sites for duck shooting at Najaf Garh Jhil. This is beyond the urbanizable limits.
PARK NO. 3
It covers partly horse shoe lake north of Delhi at G.T.Road and extends upto river Yamuna. It will also have water features. The area of this park is about 5,000 acres. This park would be accessible both from G.T.Road and the proposed National bypass. This is also beyond the urbanizable limits.
PARK NO.4
This park, or river Hindon south of G.T.Road is about 1,700 acres in area. This park shall also have water features and fishing facilities in addition to the general features. This is in U.P.
PARK NO.5
The fifth regional park which is proposed to be near Ghaziabad in U.P. around Dasna rest house, extends on both sides of the Ganges Canal upto Delhi- Meerut Raod in the north and upto Ghaziabad Rupar road in the south. The total area of this park is about 6,5000 acres. The existing features in thispark are a canal, and many orchards. It also includes the general features mentioned below.
Feature is be included in the proposed regional parks.
1) Picnic Areas
2) Swimming pools
3) Greasey Lawns and Terraces
4) Shady Trees
5) Weekend Cottages
6) Boating Facility ( wherever possible)
7) Horse Tracks
8) Children areas
9) Games Areas
10) Eating Places
VI. AGRICULTURAL RESERVE
In the immediate vicinity of the metropolis (e.g. in the area around the compact urban limits upto 1981). , a firm control is necessary to prevent the overspill iof urban areas and the encroachment of other forms of constructional development. Such control must also extend along the main highways radiating from Delhi in order to prevent a broad background in the form of an arc around the metropolis with extensions along the main highways.
This inner rural zone, in the form of agricultural green belt, will serva as a buffer zone between the urban and rural Delhi. About one lakh acres of land has been proposed to be covered by such agricultural belts.
These agricultural by such belts shall be put to intensive cultivation tom produce the best possible crops. But those parts which are closer to the inhabited areas may be used for vegetable gardening, poultry farms, and allotment gardening.
Allotment gardens shall be a new feature fot the Delhi resident and shall consist of plots allotted to the interested residents who do not have sufficient open spaces along with their residential areas. These plots shall be used for flower and vegetable gardening.
Existing nurseries can also be shidfted to these belts where they can have scope for future expansion alongside the new nurseries.
C. HOSPITALS AND HEALTH CENTRES
Hospitals :
Calculated on the basic of one general hospital for every 125,000 people, sites for hospitals have been earmarked, and are indicated on the Land Use pln. It is proposed that the size of a hospital should be roughly 500 beds, and 15 acres should be reserved for one hospital. It is also proposed that at least one hosp[[ital in every planning Division should have 25 acres so that it can offer some specialized services not available in the other hospitals. Twenty new sites have been proposed in the various planning divisions, and land has also been allocated for the expansion of Lady Hardinge, Willingdonb, Irwin and Safdarjung Hospitals. Below is given the distribution of the existing and proposed hospitals, in different planning divisions. Three more infectious Diseases Hospitals are proposed, one south of Mehrauli beyond the urbanizable limits of 1981, a second in the west and a third in the north.
*List of existing picnic spots is given in table 10.+ some of the regional parts proposed here in are outside the territory of Delhi. Naturally, the Government of U.P. and Punjab will consider the matter while planning for their areas and fix precise locations.
The existing major hospitals not listed are: two Railway Hospitals, eight other Hospitals, are (Dr.Sen ,Ganga Ram, Lahore Hospital, society and Mrs, Girdhari Lal), two T.B. Hospital, one Infectious Diseases Hospital in Civil Lines and one Mental Hospital in shahdara.
R.G.GuptaCity/Policy Planner
Master Plan For Delhi 1957, Volume-II, PART - 3

TABLE NO.9
Planning Division
Old City 1
13
2
7
-
--
--
11
2
20
6
54
11
24
4
27
6
54
1Karol BaghCivil Lines
New DelhiShahdaraSouth DelhiWest DelhiWest Yamuna CanalTotal
General HospitalsExisting Proposed Total
Health Centre:
The location of health centre is not indicated on the Land use plan, since these are neighbourhood facilities and land should therefore be provided for these, while preparing the detailed layouts. The standard is to have one health centre of about 1 acre serving 22,000 to 25,000 with a 15 bed hospital and enough area of staff quarters.
Other Community Facilities :
Sites for police stations, Fire Stations, Electricity sub-Stations- post and Telegraph offices, Telephone Exchanges, will be earmarked while preparing detailed plans.
D MULTI –PURPOSE COMMUNITY CENTRE
One of the major problems in designing a new community or in redeveloping an old one is provide a framework within which the whole fabric of social activities can be inter-woven in such a way that the anonymity of city life does not establish itself firmly. The more opportunity is given to people for social inter-change during their leisure and recreational hours, the easier it is for the community to function . Through this type of inter-mixture of people, every resident finds recognition for himself in the area, and an awareness for the betterment of the society automatically develop. It is only through such intercourse of ideas that the citizens are made to realize their role in society, and this is exactly what is needed in eliciting peoples co- operation in the successful implementation of any plan.
Prior to the advent of what are now referred to as community centers, the only places for people to meet were dharamshalas, congregational places or chowks. Dharamshalas were a dormitory type of construction, essentially to provide temporary shelter to the passers-by or visitors, and were, in fact, never places where people could collect for recreational purpose. Similarly the congregational centers were for other specific purposes. The social interchange was limited in scope considerably, in as much as scattered playgrounds and parks were, and are even now. The only places to serve as common meeting grounds.
The residential neighbourhoods as proposed in the plan have now been designed keeping in view the fact that a local park is essential not only for healthy living, but also to weed out the anonymity of the city life.
Designing for changes in the existing mohallas and for they urban renewal area of the old city and in other decaying areas, makes it even more essential that a social centre be a part of every new residential area to aid in the process of integration. An additional
factor which makes a case for the creation of such centers is the inadequate space in residential structures which forces social activities to occur- side the homes. A goo deal a day-to-day activity in Delhi take place just outside the houses. The plan proposes that social centre be provided near the house which would permit families to use them at their convenience. The women –folk and children could also make use of them, whenever the former find time free from their house-hold duties.
There are many type of social centre possible. It is recommended to construct a multi-purpose community centre, which could serve all age-group in their multi-farious activities. The centre should, in addition to providing a means of organizing the community for social action, help in integrating the in-migrants with the other residents of the city.
In the rapidly growing city of Delhi, at present, in-migrants come a strangers and settle in their own caste groups or kin- groups in colonies segregated from the rest of the community. For them, the need for social centers is even greater. It generally takes a generally takes a generation before they get themselves identified with the other inhabitants of the city. Their rural way of life is still very strong. They are always inclined towards returning to their villages, and their life in the city is one of a temporary character. Provision of such centers will bring a sense of belonging to the community.
It is suggested that community buildings should have water pools, a courtside for outdoor as well as halls for meetings, for reading and for organizing functions. A small room where newspaper, magazines and books an activity. Several different types should be tried out in such a way that they do not add heavily to the expenses. The plan has provided for sufficient land ultimately for one community building for every residential planning area of 15,000 population. The programme should, however, be started with one per 30,000.
The physical play proposed for the future Delhi will affect the physical shape of the city. Social planner have to aid the physical planners in persuading the people to accept the plan as their own. This can be done through purpose community centres.
An attempt should be made to design such services beautifully and the idea of civic design should be given considerable thought. However, if it cannot be achieved, Acton should be taken through community organizations to persuade people to plant tress, and thus landscaping can take place at virtually no cost. The people should be made to realize through these community centers that he city is theirs and they should preserve it.
The social organization should begin in the initial stages of planning's. It is here that the social workers have to play the most important role in eliciting the people participation. They can help people in understanding the plan, and they can also help people in accepting it as their own. They can do so only if sufficient community centers are provided for, which can serve as the focal points for such activities.
In the implementation stages of planning, there is bound to be displacement, and this should receive careful attention of the authorities and people. The little enthusiasm that might be generated during the resettlement process can easily be turned into
R.G.GuptaCity/Policy Planner
Master Plan For Delhi 1957, Volume-II, PART - 3
deep dissatisfaction, if social workers are not there to channelize their energies. Therefore, the management of rehousing projects
especially, should have a social awareness. All the benefits of a new housing project can be lost if it does not have the people support.
TABLE NO. 10
Proposed & existing picnic spots and open space around monuments
PlanningDivision
A. - - - - - - - - -- - - - - - - - -B.
C. 1.
2.
3.
4.
2.
3.
4.
5.
D.1.
E.1.
F.1.
2.
2.
3.
4.5.
6.
7.
G.1.H.
Area(Acres)
Accessibility Eating Facilities
Silent Features
RemarksName
Distance from Conaught
Place (miles)
Availabilityof Potables
Water
Location fromConnaught
Place1 2 30 4 5 6 7 8 9
Coronation Pillar
Qudsia Garden
Firoz Shah Kotla
Tal Katora Garden
Lodi Garden
Dip. Encl. Park
Hindon River
Dasna Rest House
Hauz Khas
Mehrauli
Okhla
Near Zamrrud PurTughlakabad
Surajkund
Between VillagesJawala Heri and Khyala
Badkhel Reservoir
Near Village Bibipur
River Fronts
Roshanara Garden
9
4
2
3.5
4.0
4.514
23
7
9
713
15
18
9.5
7.5
173
-
--
-
-
--
-
- - --
- - --
--- -
- -
-
-
-Canal Water
-
-
- - -
- -
4
49
34
47
80
50 -do-
Pucca
Pucca0.7 miles kacha pucca approach uptorailway line 13.5 cross Railwaytrack, in foot 0.5 mile
-do- -do- -do--
- - -
North
East
EastNorth - East
South West
South West
South
South
South
South
SouthSouth
West
Punjab
Punjab, Near
Faridabad
South East
In U.P.
In U.P.
Pucca Road
Pucca Road
Pucca Road
Pucca Road
Pucca
Pucca
Pucca
8 miles pucca on Rohtak road
Pucca Road 13 milesKucha Road 2 miles
Grassy lawns,
shady trees, pond
in the centre
Grassy lawns, monu-
ments shady treesShaded Lawns, Gard-ens, Open air theatre, Surrounded by ridge
lawns, Monumentsshady treesNational Areas, Water ProposedProposed rest.,
Eating Booths
Motorable Nil
Yes
-do-
-do-
-do- -Yes- -Yes-
-Yes-
-Yes-
Yes
Nill
Nill
Nil
Canal Water
Rest House fishingcanal for swiming
Rest House shaded lawns canal for swim.
Shady lawns, Rest house canal for swim.
Lake, Monuments,Shady trees, Boating. Monument, Shady, lawns Rest house
22.5 pucca, 1.5 kucha by rail also
(Well)
(Well)
Well Water
Well Water
Well Water
Well Water
Restaurent
Restaurent
-do-
Yes (tap)
Yes But not satisfactory
Nil
Nil
Nil
Nil
Local Type
Hedges, plots with coarse grass
Mental trees, flower borders, play fields
Expansion Proposed
Proposed
Expansion
Expansion
Expansion
Expansion
Proposed
Proposed
Proposed
Proposed
Proposed
Proposed
Proposed
Monuments, ridge
Lake adjoining the
kund. Rocky and
natural surroundingA lake with a
catclument area of
5 sq. miles
Proposed
Pucca
R.G.GuptaCity/Policy Planner
Master Plan For Delhi 1957, Volume-II, PART - 3
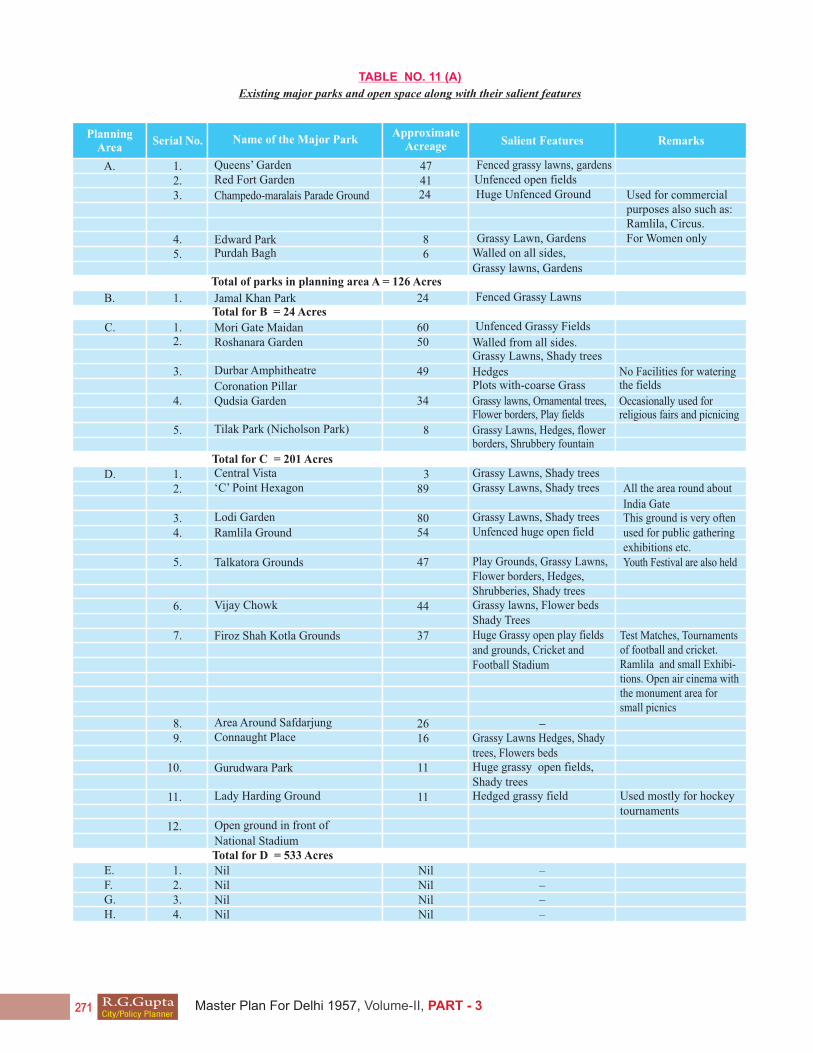
TABLE NO. 11 (A)
Existing major parks and open space along with their salient features
Planning Area
Serial No. Name of the Major ParkApproximate
Acreage Salient Features Remarks
A.
B.
C.
D.
F.G.H.
1.2.3.
4.5.
1.
1.2.
3.
4.
5.
1.2.
3.4.
5.
6.
7.
8.9.
10.
11.
12.
NilNilNil
E. 1. Nil NilNilNilNil
––––
2.3.4.
474124
86
24
6050
49
34
89
8054
47
44
37
2616
11
11
–
8
3
Fenced grassy lawns, gardens
For Women only
Unfenced open fieldsHuge Unfenced Ground
Grassy Lawn, GardensWalled on all sides, Grassy lawns, Gardens
Used for commercial purposes also such as: Ramlila, Circus.
Queens’ Garden
Total of parks in planning area A = 126 Acres
Total for B = 24 Acres
Total for C = 201 Acres
Total for D = 533 Acres
Red Fort Garden
Edward ParkPurdah Bagh
Jamal Khan Park
Mori Gate MaidanRoshanara Garden
Durbar Amphitheatre
Coronation PillarQudsia Garden
Tilak Park (Nicholson Park)
Central Vista‘C’ Point Hexagon
Lodi Garden
Ramlila Ground
Talkatora Grounds
Vijay Chowk
Firoz Shah Kotla Grounds
Area Around Safdarjung Connaught Place
Gurudwara Park
Lady Harding Ground
Open ground in front of
National Stadium
Fenced Grassy Lawns
Unfenced Grassy Fields
Walled from all sides. Grassy Lawns, Shady trees
Grassy Lawns, Hedges, flower borders, Shrubbery fountain
Grassy Lawns, Shady treesGrassy Lawns, Shady trees
Grassy Lawns, Shady trees
Play Grounds, Grassy Lawns, Flower borders, Hedges, Shrubberies, Shady trees
Unfenced huge open field
Grassy lawns, Flower bedsShady TreesHuge Grassy open play fieldsand grounds, Cricket andFootball Stadium
Test Matches, Tournaments of football and cricket.Ramlila and small Exhibi-tions. Open air cinema withthe monument area for small picnics
All the area round about
India Gate
Youth Festival are also held
This ground is very oftenused for public gathering exhibitions etc.
Hedges Plots with-coarse Grass
Grassy lawns, Ornamental trees, Flower borders, Play fields
No Facilities for watering the fields
Occasionally used for religious fairs and picnicing
Champedo-maralais Parade Ground
Grassy Lawns Hedges, Shady trees, Flowers beds
Hedged grassy field Used mostly for hockey tournaments
Huge grassy open fields, Shady trees
R.G.GuptaCity/Policy Planner
Master Plan For Delhi 1957, Volume-II, PART - 3

Planning Area Serial No. Name of the Major Park Acreage Salient Features Remarks
A.B.C.
D.
E.F.G.H.
1.1.1.2.
1.
1.
2.3.4.5.
– –
Roshanara Club
Golf CourseRace CourseDelhi Gymkhana ClubNational Swiming Club
Chelmsford Club
Police GroundTotal for C = 63 Acres
Total for D = 300 AcresNilNilNilNil
NilNilNilNil
2538
178713410
7
– –––
––––
TABLE NO. 11 (B)
Existing major parks and open spaces (Semi-Public Park)
TABLE NO. 11 (C)
Existing major parks and open spaces Private)
Planning Area
Serial No. Name of the Major ParkApproximate
Acreage Salient Features Remarks
A.
B.C.
D.
1.
1.1.2.3.
1.2.3.
University playgroundsUniversity groundsCollege playground Kashmere Gate
27
101214
2462220
Railway Stadium
Total for A = 27 Acres
Total for C = 36 Acres
Total for D = 288 Acres
Zoological GardenExhibition Ground National Stadium
–
E. 1. Nil NilE. 1. Nil NilE. 1. Nil NilE. 1. Nil Nil
R.G.GuptaCity/Policy Planner
Master Plan For Delhi 1957, Volume-II, PART - 3
CHAPTER - TWELVE
TRAFFIC AND TRANSPORTATION
SUMMARY STATEMENT
This chapter on Traffic and Transport aspects of the Master plan for Delhi Region deals with the problems and recommends solutions for both transport and terminal improvement planning, such as aerodromes, railways, major roads and highways system, terminals, mass transit by rail and bus etc. to serve the entire Delhi Metropolitan Area. Since the major portion of the total intra-urban trips are performed on bicycles, espeespecially for journey-to-work, emphasis has been laid on the necessity of providing a network of arterial bicycle tracks.
The solution of urban traffic congestion and dangers, traffic delays and accidents and parking difficulties, lies not only in the ingenuity of the traffic solutions themselves. Basically, good traffic solutions, at not excessive cost, depend on the proper physical inter- relationship of functions; on the principle and practice of relative self-containment, so as to minimize the length and number of journeys necessary, especially at peak hours. This brings about economy of capital and operational expenditure, and individual economy of fares. As a corollary where through traffic is necessary it must by-pass congested areas, it must not be mingled with slow-moving local traffic; and that through must pass between, and not through local districts and neighbourhoods.
In the Master plan for Delhi Metropolitan Area, in the overall pattern of future land use, attempts to minimize the length and number of trips have been made by proper relationship of various land uses, and intergraded neighbourhood development aimed at bringing homes, schools and shopping centres closely together. To diffuse the traffic load in the congested core area streets, it is recommended that the centres of employment be deconcentrated. This include the establishment of industrial districts on the outskirts with house nearby and moving certain new Government offices to outlying points away from central secretariat.
Recommendations are made for the provision of ring road loap streets to carry vehicles around congested core areas in cases where the origin and destination of persons is outside such core areas.
Another important principle is that within the traffic soultuions themselves, both regional road as well as rail traffic and transport must be coordinated, and the type and portion should be allocated to each for which it is best fitted. The failure to do this, as at present, will necessarily result I throwing the heavy load of regional bus traffic on streets and land in the central core of Delhi Urban area, bu excessive multiplication of such vehicles. In commuting for peak hour travel from surrounding towns into Delhi and vice versa, the employ larger units. At other than peak hours the bus, requiring less pay-load for economical operation, is best suited.
In addition to specific improvements, there are other recommendations designed to be helpful in approaching the manifold problems of traffic and transportation in urban Delhi. One of these suggests the setting up of a department of traffic in the Delhi
Administration to carry out a continuing programme in establishing and applying standards for off-street parking areas within building lines, locating and designing adequate intersections, widening of roads where more generous right-of-way are available or obtainable, pavement and street lighting improvements, basic traffic regulations and controls etc.
Another recommendation deals with the proposed establishment of a Terminal Development Authority with power to achieve the financing, construction and leasing terminals for buses, trucks, off-street parking an loading areas and modernized markets such as the fresh fruit and vegetable wholesale areas. Such as agency would be public owned and vested with necessary attributes of government, such as the power of eminent domain, but would have a goal of economic self- support for its projects in order not to burden tax budgets.
This chapter also discusses the procedures for a requirements study to permit detailed functional and economic planning for such terminals, off-street parking as a, etc. These are selected illustrative example of typical design standards for bicycle and vehicular parking in office building developments; suggested cross-sections of proposed arterial roads and arterial cycle tracks.
I. IMPORTANCE OF REGIONAL TRANSPORT PLANNING
It is necessary to relies that from a transport stand-point, Delhi consrtitutes a centre of international importance, and is also a metropolitan regional centre for a considerable portion of northwest India and an urbanized area requiring intra-omunity movement of both persons and goods.
Delhi as a National and international centres
The long distance travel to and form Delhi is primarily by air and rail. The movement in each direction of persons per day from points beyond 100 miles in 1958 was approximately 400 by air and 30,000 by rail, of which as unknown portion(estimated at 8,000) of the latter were through passengers in transit. In thaw peak period of 1958, 75 hotels reported arrivals of 900 guests per day, of which 500were accommodated in the larger first-class hotels. The arrivals were up 40% in the three-year period. There are some 3,000 students in collages who are non-residents of Delhi. Great numbers of visitors come for oultural festivals, patriotic and religious observances and are housed with relative and in other private accommodations.
Adequate and properly located facilities for the rapidly growing air traffic and for the mass transportation by rail are necessary. The rate of growth of air traffic can only be forecast by an analogy. At Tokyo Airport the number of international air passengers doubled in the four years 1953-57 and it seems likely that similar or even greater gains in international air traffic may be experienced at Delhi.
Delhi as a Regional centre of Northwest India:
In 1957 the daily passenger movement in each direction by road
R.G.GuptaCity/Policy Planner
Master Plan For Delhi 1957, Volume-II, PART - 3

and rail (about evenly divided) from within 50-75 mile radius reached the magnitude of approximately 37,000 persons. Within a 50 mile radius of Delhi there are 5.5
Million people and 8 population centres of more than 20,000 each. A substantial part of the rail travel starting or ending at the more important towns within a 50 mile is to and from Delhi.
The regional train service between Delhi and the surrounding territory is limited to 22 trains daily in each directions with an aggregate seating capacity of about 1,3,000. This is segmented at the larger stations be stops made by long-distance express and mail trains. Generally the train running time is not much less then the road time by bus and in some instance (notably to the west6 and north) is considerably more.
Apparently as a result of certain decisions of the Railway Board in 1950, based on local topography and terminal limitations, the railways have been slow to embark on an aggressive programme to serve suburban centres(Rohtak, panipat, Meerut, Hapur, Aligarh, Palwal, Rewari) , and to a large extent have left the task to road transport.
The lack of passenger transport facilities between Delhi and its surrounding region poses a substantial problem both as to transport equipment and terminals. It has been calculated that in 1957 at least, 7,000 passengers a day in each direction by rail alone were not provided with adequate transport and that if the sububs were to be serviced adequately, there would be a substantial additional traffic. While Bombay is not directly comparable with Delhi because of its unique geographical situation9island peninsula surrounded on three sides by water), with greater Bombay population 30% higher than of
Category
National
Aircraft Movement
1956 - 57 1956 - 57 1956 - 571957-58 1957-58 1957-581958-59 1958-59 1958-59
Passangers Freight (Mds.*)
(a) Safdarjang
Total
Grand Total
International (Palam)
(b) Palam
14
22
28
8
6
8
8 6 67 77 84 44
11
15
23
31
13
24
30
147
315
382
168
136
326
403
190
109
485
569
376
86
135
179
49
69
124
155
55
31 35
94
148
183
54
Source : Aerodrome Office - Palam and Safdarjang. *Maund = 80lbs.
TABLE - I
AVERAGE DAILY AIR TRAFFIC AT DELHI
Delhi State, it is worth noting that the railroads alone handle some half million people from suburbs in each direction to and from Bombay each day against approximately 37,000 by road and rail at Delhi.
It is difficult to forecast the future rate of growth of passenger movement into and out of Delhi. In the seven from 1946(prior to partiotion) to 1953, the monthly average number of tickets sold at Delhi Main station increases only 20% against a substantaiaaly larger increase in population . From 1954 to 1957 the total broad gauge rail passengers showed an increase of 24% in three years. The increase of inter-city bus movements and passengers is known to have been rapid in recent years but comparative statistics are not available.
In addition to the passenger traffic, the daily, goods traffic to and from Delhi amounts to approximately 4, 50,000 maunds in both directions. More than half of the traffic arrives by road and most of the outbound shipments are by road. A small amount is carried in parcels by the airlines. The total goods movements will increase substantially in the next 20 years, at least doubling the 1957 volume, with the greater growth in the road sector than in the rail.
Local Delhi Traffic
The heaviest volume of passenger and vehicular traffic is that handled within urban Delhi itself. About 11,60,000 passenger trips per day are made locally, including 3,77,000in public transport(railways, tramways, buses, and four-seater motor-cycle rickshaws), 2,60,000 in hired vehicles such as taxicabs, two-seater scooter rickshaws), tongas and cycle rickshaws, with approximately 5,23,000 more in private transport in autos, motor-cycles, scooters and bicycles. The latter alone are estimated at nearly 4,00,000 trips.
TABLE - II
AVERAGE DAILY ROAD PASSENGER TRAFFIC TO DELHI
States
Within Delhi State
Punjab
U.P.
Total
7,305 37.0 27
25
12
64
40
255
436
731
34.0
29.0
100.00
42.0
39.0
19.0
100.00
5.0
35.0
60.0
100.00
186
219
204
609
31.0
36.0
33.0
100.00
6,641
5,698
19,644
Passengers
Number Percentage Number Number NumberPercentage Percentage Percentage
Companies Buses in use Trips
Source : Regional Passengers Road Transport Study - 1957 (Town Planning Organisation)
R.G.GuptaCity/Policy Planner
Master Plan For Delhi 1957, Volume-II, PART - 3
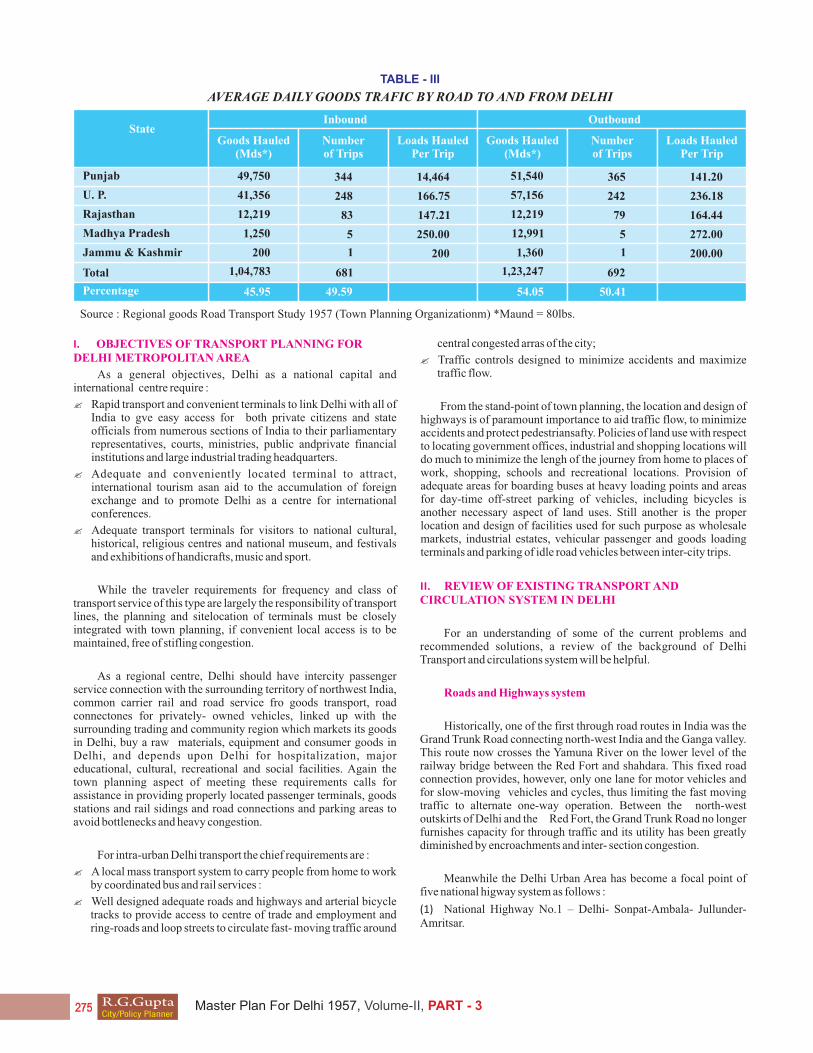
TABLE - III
AVERAGE DAILY GOODS TRAFIC BY ROAD TO AND FROM DELHI
Source : Regional goods Road Transport Study 1957 (Town Planning Organizationm) *Maund = 80lbs.
State
Punjab 344
248
83
5
1
681
49.59
14,464
166.75
147.21
250.00
200
49,750
41,356
12,219
1,250
200
1,04,783
45.95
365
242
79
5
1
692
50.41
141.20
236.18
164.44
272.00
200.00
51,540
57,156
12,219
12,991
1,360
1,23,247
54.05
U. P.
Rajasthan
Madhya Pradesh
Jammu & Kashmir
Percentage
Total
Goods Hauled(Mds*)
Goods Hauled(Mds*)
Loads HauledPer Trip
Loads HauledPer Trip
Number of Trips
Number of Trips
Inbound Outbound
I. OBJECTIVES OF TRANSPORT PLANNING FOR DELHI METROPOLITAN AREA
As a general objectives, Delhi as a national capital and international centre require :
Rapid transport and convenient terminals to link Delhi with all of India to gve easy access for both private citizens and state officials from numerous sections of India to their parliamentary representatives, courts, ministries, public andprivate financial institutions and large industrial trading headquarters.
Adequate and conveniently located terminal to attract, international tourism asan aid to the accumulation of foreign exchange and to promote Delhi as a centre for international conferences.
Adequate transport terminals for visitors to national cultural, historical, religious centres and national museum, and festivals and exhibitions of handicrafts, music and sport.
While the traveler requirements for frequency and class of transport service of this type are largely the responsibility of transport lines, the planning and sitelocation of terminals must be closely integrated with town planning, if convenient local access is to be maintained, free of stifling congestion.
As a regional centre, Delhi should have intercity passenger service connection with the surrounding territory of northwest India, common carrier rail and road service fro goods transport, road connectones for privately- owned vehicles, linked up with the surrounding trading and community region which markets its goods in Delhi, buy a raw materials, equipment and consumer goods in Delhi, and depends upon Delhi for hospitalization, major educational, cultural, recreational and social facilities. Again the town planning aspect of meeting these requirements calls for assistance in providing properly located passenger terminals, goods stations and rail sidings and road connections and parking areas to avoid bottlenecks and heavy congestion.
For intra-urban Delhi transport the chief requirements are :
A local mass transport system to carry people from home to work by coordinated bus and rail services :
Well designed adequate roads and highways and arterial bicycle tracks to provide access to centre of trade and employment and ring-roads and loop streets to circulate fast- moving traffic around
central congested arras of the city;
Traffic controls designed to minimize accidents and maximize traffic flow.
From the stand-point of town planning, the location and design of highways is of paramount importance to aid traffic flow, to minimize accidents and protect pedestriansafty. Policies of land use with respect to locating government offices, industrial and shopping locations will do much to minimize the lengh of the journey from home to places of work, shopping, schools and recreational locations. Provision of adequate areas for boarding buses at heavy loading points and areas for day-time off-street parking of vehicles, including bicycles is another necessary aspect of land uses. Still another is the proper location and design of facilities used for such purpose as wholesale markets, industrial estates, vehicular passenger and goods loading terminals and parking of idle road vehicles between inter-city trips.
II. REVIEW OF EXISTING TRANSPORT AND CIRCULATION SYSTEM IN DELHI
For an understanding of some of the current problems and recommended solutions, a review of the background of Delhi Transport and circulations system will be helpful.
Roads and Highways system
Historically, one of the first through road routes in India was the Grand Trunk Road connecting north-west India and the Ganga valley. This route now crosses the Yamuna River on the lower level of the railway bridge between the Red Fort and shahdara. This fixed road connection provides, however, only one lane for motor vehicles and for slow-moving vehicles and cycles, thus limiting the fast moving traffic to alternate one-way operation. Between the north-west outskirts of Delhi and the Red Fort, the Grand Trunk Road no longer furnishes capacity for through traffic and its utility has been greatly diminished by encroachments and inter- section congestion.
Meanwhile the Delhi Urban Area has become a focal point of five national higway system as follows :
(1) National Highway No.1 – Delhi- Sonpat-Ambala- Jullunder- Amritsar.
R.G.GuptaCity/Policy Planner
Master Plan For Delhi 1957, Volume-II, PART - 3
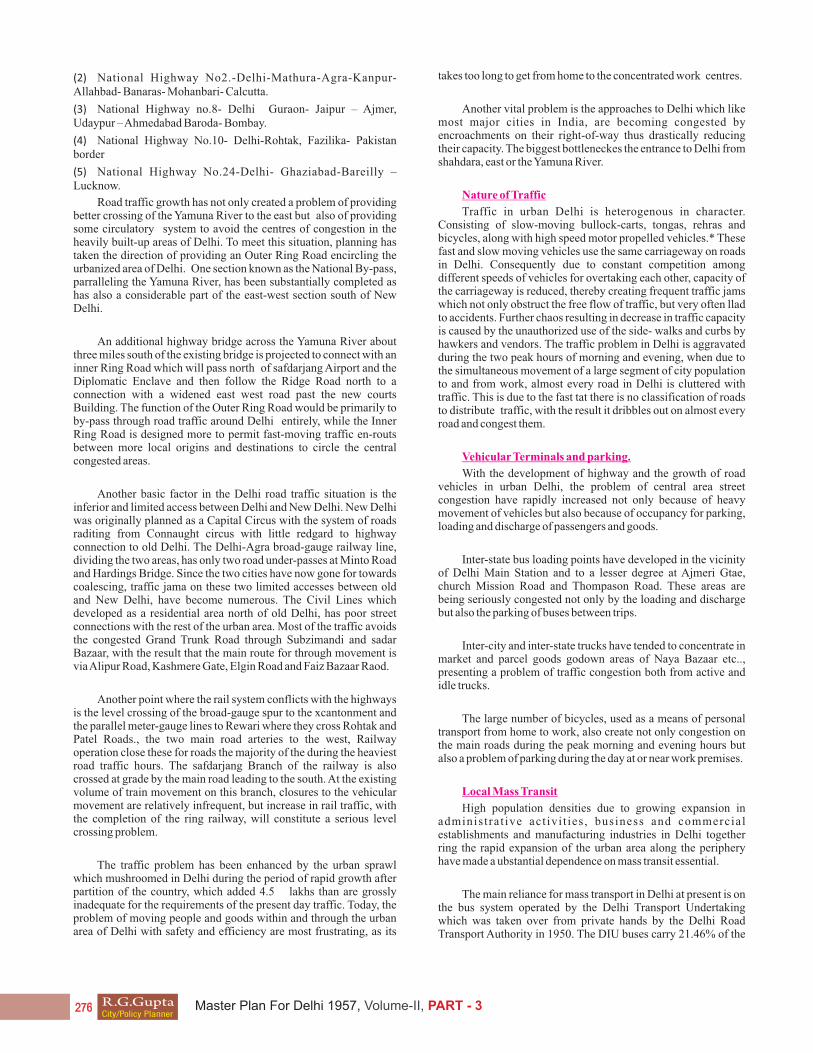
(2) National Highway No2.-Delhi-Mathura-Agra-Kanpur- Allahbad- Banaras- Mohanbari- Calcutta.
(3) National Highway no.8- Delhi Guraon- Jaipur – Ajmer, Udaypur – Ahmedabad Baroda- Bombay.
(4) National Highway No.10- Delhi-Rohtak, Fazilika- Pakistan border
(5) National Highway No.24-Delhi- Ghaziabad-Bareilly – Lucknow.
Road traffic growth has not only created a problem of providing better crossing of the Yamuna River to the east but also of providing some circulatory system to avoid the centres of congestion in the heavily built-up areas of Delhi. To meet this situation, planning has taken the direction of providing an Outer Ring Road encircling the urbanized area of Delhi. One section known as the National By-pass, parralleling the Yamuna River, has been substantially completed as has also a considerable part of the east-west section south of New Delhi.
An additional highway bridge across the Yamuna River about three miles south of the existing bridge is projected to connect with an inner Ring Road which will pass north of safdarjang Airport and the Diplomatic Enclave and then follow the Ridge Road north to a connection with a widened east west road past the new courts Building. The function of the Outer Ring Road would be primarily to by-pass through road traffic around Delhi entirely, while the Inner Ring Road is designed more to permit fast-moving traffic en-routs between more local origins and destinations to circle the central congested areas.
Another basic factor in the Delhi road traffic situation is the inferior and limited access between Delhi and New Delhi. New Delhi was originally planned as a Capital Circus with the system of roads raditing from Connaught circus with little redgard to highway connection to old Delhi. The Delhi-Agra broad-gauge railway line, dividing the two areas, has only two road under-passes at Minto Road and Hardings Bridge. Since the two cities have now gone for towards coalescing, traffic jama on these two limited accesses between old and New Delhi, have become numerous. The Civil Lines which developed as a residential area north of old Delhi, has poor street connections with the rest of the urban area. Most of the traffic avoids the congested Grand Trunk Road through Subzimandi and sadar Bazaar, with the result that the main route for through movement is via Alipur Road, Kashmere Gate, Elgin Road and Faiz Bazaar Raod.
Another point where the rail system conflicts with the highways is the level crossing of the broad-gauge spur to the xcantonment and the parallel meter-gauge lines to Rewari where they cross Rohtak and Patel Roads., the two main road arteries to the west, Railway operation close these for roads the majority of the during the heaviest road traffic hours. The safdarjang Branch of the railway is also crossed at grade by the main road leading to the south. At the existing volume of train movement on this branch, closures to the vehicular movement are relatively infrequent, but increase in rail traffic, with the completion of the ring railway, will constitute a serious level crossing problem.
The traffic problem has been enhanced by the urban sprawl which mushroomed in Delhi during the period of rapid growth after partition of the country, which added 4.5 lakhs than are grossly inadequate for the requirements of the present day traffic. Today, the problem of moving people and goods within and through the urban area of Delhi with safety and efficiency are most frustrating, as its
takes too long to get from home to the concentrated work centres.
Another vital problem is the approaches to Delhi which like most major cities in India, are becoming congested by encroachments on their right-of-way thus drastically reducing their capacity. The biggest bottleneckes the entrance to Delhi from shahdara, east or the Yamuna River.
Nature of Traffic
Traffic in urban Delhi is heterogenous in character. Consisting of slow-moving bullock-carts, tongas, rehras and bicycles, along with high speed motor propelled vehicles.* These fast and slow moving vehicles use the same carriageway on roads in Delhi. Consequently due to constant competition among different speeds of vehicles for overtaking each other, capacity of the carriageway is reduced, thereby creating frequent traffic jams which not only obstruct the free flow of traffic, but very often llad to accidents. Further chaos resulting in decrease in traffic capacity is caused by the unauthorized use of the side- walks and curbs by hawkers and vendors. The traffic problem in Delhi is aggravated during the two peak hours of morning and evening, when due to the simultaneous movement of a large segment of city population to and from work, almost every road in Delhi is cluttered with traffic. This is due to the fast tat there is no classification of roads to distribute traffic, with the result it dribbles out on almost every road and congest them.
Vehicular Terminals and parking.
With the development of highway and the growth of road vehicles in urban Delhi, the problem of central area street congestion have rapidly increased not only because of heavy movement of vehicles but also because of occupancy for parking, loading and discharge of passengers and goods.
Inter-state bus loading points have developed in the vicinity of Delhi Main Station and to a lesser degree at Ajmeri Gtae, church Mission Road and Thompason Road. These areas are being seriously congested not only by the loading and discharge but also the parking of buses between trips.
Inter-city and inter-state trucks have tended to concentrate in market and parcel goods godown areas of Naya Bazaar etc.., presenting a problem of traffic congestion both from active and idle trucks.
The large number of bicycles, used as a means of personal transport from home to work, also create not only congestion on the main roads during the peak morning and evening hours but also a problem of parking during the day at or near work premises.
Local Mass Transit
High population densities due to growing expansion in adminis trat ive act ivi t ies , business and commercial establishments and manufacturing industries in Delhi together ring the rapid expansion of the urban area along the periphery have made a ubstantial dependence on mass transit essential.
The main reliance for mass transport in Delhi at present is on the bus system operated by the Delhi Transport Undertaking which was taken over from private hands by the Delhi Road Transport Authority in 1950. The DIU buses carry 21.46% of the
R.G.GuptaCity/Policy Planner
Master Plan For Delhi 1957, Volume-II, PART - 3
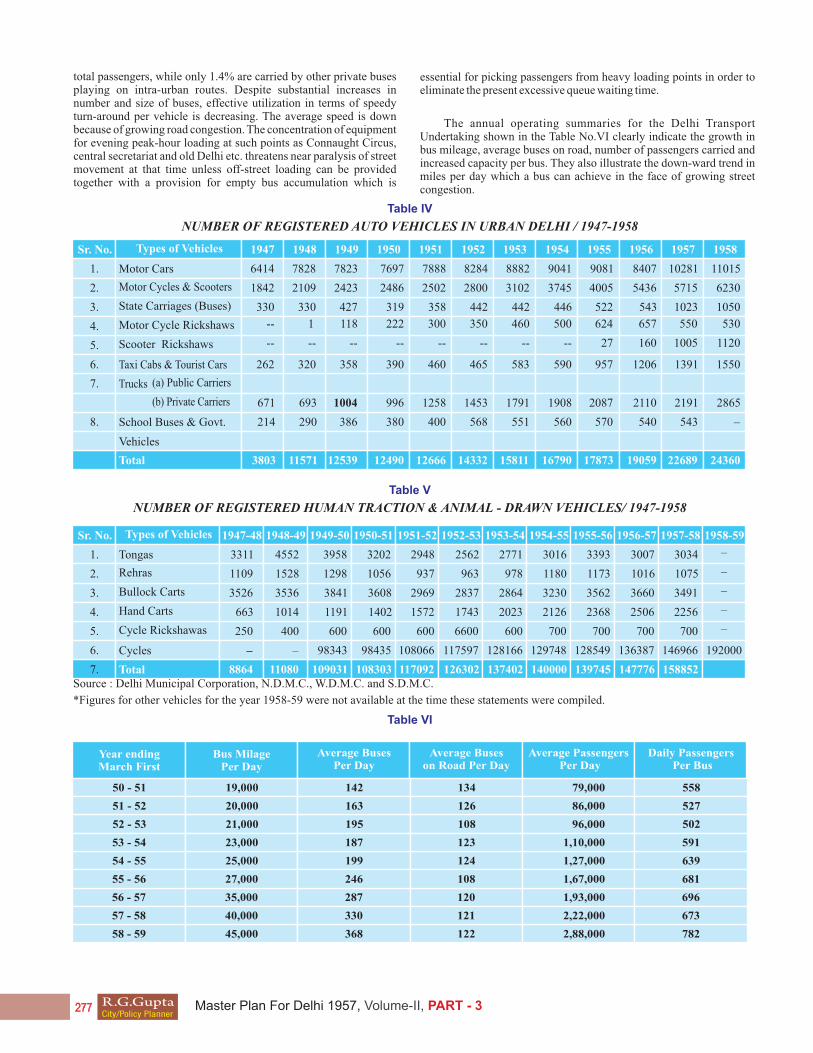
Year ending March First
50 - 51
51 - 52
52 - 53
53 - 54
54 - 55
55 - 56
56 - 57
57 - 58
58 - 59
19,000
20,000
21,000
23,000
25,000
27,000
35,000
40,000
45,000
142
163
195
187
199
246
287
330
368
134
126
108
123
124
108
120
121
122
558
527
502
591
639
681
696
673
782
79,000
86,000
96,000
1,10,000
1,27,000
1,67,000
1,93,000
2,22,000
2,88,000
Bus Milage Per Day
Average BusesPer Day
Average Buseson Road Per Day
Average Passengers Per Day
Daily Passengers Per Bus
total passengers, while only 1.4% are carried by other private buses playing on intra-urban routes. Despite substantial increases in number and size of buses, effective utilization in terms of speedy turn-around per vehicle is decreasing. The average speed is down because of growing road congestion. The concentration of equipment for evening peak-hour loading at such points as Connaught Circus, central secretariat and old Delhi etc. threatens near paralysis of street movement at that time unless off-street loading can be provided together with a provision for empty bus accumulation which is
Table V
NUMBER OF REGISTERED HUMAN TRACTION & ANIMAL - DRAWN VEHICLES/ 1947-1958
Source : Delhi Municipal Corporation, N.D.M.C., W.D.M.C. and S.D.M.C.
*Figures for other vehicles for the year 1958-59 were not available at the time these statements were compiled.
Sr. No.
1. Tongas
Rehras
Bullock Carts
Hand Carts
Cycle Rickshawas
Cycles
Total
2.
3.
4.
5.
6.
7.
Types of Vehicles 1947-48
3311
1109
3526
663
250
–
8864
4552
1528
3536
1014
400
11080
–
3958
1298
3841
1191
600
109031
98343
3202
1056
3608
1402
600
108303
98435
2948
937
2969
1572
600
117092
108066
2562
963
2837
1743
6600
126302
117597
2771
978
2864
2023
600
137402
128166
3016
1180
3230
2126
700
140000
129748
3393
1173
3562
2368
700
139745
128549
3007
1016
3660
2506
700
147776
136387
3034
1075
3491
2256
700
158852
146966
–
–
–
–
–
192000
1948-49 1949-50 1950-51 1951-52 1952-53 1953-54 1954-55 1955-56 1956-57 1957-58 1958-59
Sr. No.
1. Motor Cars 6414
1842
330
262
671
214
3803
--
--
12539
7823
2423
427
358
1004
386
118
--
12666
7888
2502
358
460
1258
400
300
--
14332
8284
2800
442
465
1453
568
350
--
15811
8882
3102
442
583
1791
551
460
--
16790
9041
3745
446
590
1908
560
500
--
17873
9081
4005
522
957
2087
570
624
27
24360
11015
6230
1050
1550
2865
–
530
1120
22689
10281
5715
1023
1391
2191
543
550
1005
19059
8407
5436
543
1206
2110
540
657
160
12490
7697
2486
319
390
996
380
222
--
7828
2109
330
320
693
290
11571
1
--
Motor Cycles & Scooters
State Carriages (Buses)
Motor Cycle Rickshaws
Scooter Rickshaws
Taxi Cabs & Tourist Cars
Trucks
2.
3.
4.
5.
6.
7.
8.
Total
School Buses & Govt.
Vehicles
Types of Vehicles 1947 1948 1949 1950 1951 1952 1953 1954 1955 1956 1957 1958
(a) Public Carriers
(b) Private Carriers
essential for picking passengers from heavy loading points in order to eliminate the present excessive queue waiting time.
The annual operating summaries for the Delhi Transport Undertaking shown in the Table No.VI clearly indicate the growth in bus mileage, average buses on road, number of passengers carried and increased capacity per bus. They also illustrate the down-ward trend in miles per day which a bus can achieve in the face of growing street congestion.
Table IV
NUMBER OF REGISTERED AUTO VEHICLES IN URBAN DELHI / 1947-1958
Table VI
R.G.GuptaCity/Policy Planner
Master Plan For Delhi 1957, Volume-II, PART - 3

Comparison of bus passengers with the Delhi urban population indicates a steady upward rise in the number of passenger carried by mass transporation system. In 1950-51 nearly 5.5% of the urban population was carried daily by mass transportation system which rose to approximately 12% by 1957. The trips per had annum which approximated to 20 in 1951 has risen by 1958 to 45. According to the estimates of the operating officials of the DTU they are likely to continue to advance. If the bus riding habit in Delhi reaches 100 trips per annum per head and the Delhi urban population reaches 3.31 million by 1971, the mass transport system in that year would be called upon to handle about four times the number of passengers handled in 1958 or nearly 900,000 people per day.
The DTU has anticipated a substantial increase in bus traffic by programming a three year expansion of the number of effective buses on the road by 60%. The newer buses well generally have increased capacity. The seating capacity is thus expected to increase by approximately 1005 over 1957 by 1961. The problem must still be faced of moving these buses by routes which will be of convenience to the passengers and yet avoid impossible congestion. There is an obsolete tramway in old Delhi which runs approximately five miles from Jama Masjid through Chandni Chok and Naya Bazaar to Subzimandi. The tremways have an average speed of only three miles per hour and the volume of passengers carried has steadily declined
every year now amounting to about 15,000 per day. The equipment is worn out and has been maintained only by cannibalizing parts from old buses. The terms have almost reached a stage of being scrapped. But in anticipation of such an action an alternats system of public transport for the inhabitants of the old city must be brought out.
Railways
Delhi has always been an important passenger terminus and junction point between the Ganges Valley and north-west India. The historic main line of traffic passes from Lucknow on the east to the north-west through Delhi with Delhi Main Station as the principle terminal. Delhi Main also become the inter-change point between the meter-gauge railways serving the west and the broad0gauge system. When the capital of India was constructed at New Delhi, slightly to the south, additional station facilities were located at New Delhi and the broad-gague line from Agra was brought upto T junction far enough to reach New Delhi station.
Concentration of both broad-gauge and narrow-gague traffic at the T junction has resulted in bottleneck of train operations and a heavy concentration of both goods and passengers at Delhi Main has over-taxed the station capacity. Certain broad-gauge
D.T.U. Local Mass Transit Trend
50,000
45,000
40,000
35,000
30,000
25,000
20,000
15,00051-5250-51 52-53 53-54 54-55 55-56 56-57 57-58 58-59
Year
51-52
400
350
300
250
200
150
100
5050-51 52-53 53-54 54-55 55-56 56-57 57-58 58-59
Source : Delhi Transport Undertaking
R.G.GuptaCity/Policy Planner
Master Plan For Delhi 1957, Volume-II, PART - 3

marshalling yards and goods delivery yards were located in the vicinity of the New Delhi Station, but goods facilities at Delhi Main become so cramped that a great deal of broad-gague marshalling had to be transferred to Ghaziabad on the east side of the Yamuna River with goods trains operating to Delhi, in hours when passenger traffic is minimized.
From time to time efforts were made to by-pass the heavily congested rail lines through T junction by ring railway line. With the construction of the single track sfdarjang branch, a scheme was developed for a southerly by-pass to connect with the broad-gague line from Agra to the Cantonment spur and then to the line to Ambala but this had never yet been carried through. More recent railway planning in Delhi by Northern Railways calls for the removal of the Agra line marshalling yards at New Delhi to Tuglakabad and the construction of a new rail bridge over the Yamuna river to provide a cut-off connection to the main Lucknow line at Sahibabad(just west of Ghaziabad). This scheme would provide for inter-change of goods traffic between the southern broad-gauge line from Agra o the Lucknow line and the lines serving the north-west(Ambala and beyond). It will also permit delivery of more broad-gauge line goods and passengers at New Delhi Station, thereby reliving the pressure on Delhi Main Station. The present plans do not solve the problems of reducing the handling of meter-gauge passenger traffic from the west across the Tjunction at sadar cabin into Delhi Main but to provide the basis for such a solution if further steps are taken.
Aerodromes
The first aerodrome development in Delhi was at wellington (new called safdarjng), which is limited to a 3500-feet runway, entirely inadequate for modern types of planes. It is at present used only by Indian Airline smaller aircraft and private planes of the Delhi Flying Club. Apart from its inadequacy for handling larger aircraft, it is situated in the midst of built-up area of south Delhi. Consequently there is a serious obstruction to the steady flow of traffic on Qutab-Mehrauli Road, since this road crosses the flight funnel of safdarjang Aerodrome.
International flights with larger planes have been transferred to the palam Aerodrome, an Indian Air Force installation in the Cantonment Area, south-west of New Delhi, The problem of providing a permanent civil aerodrome with adequate runways to cater to jet- aircraft must be faced either at the palam location or some acceptable alternative.
I. SOURCE OF PLANNING INFORMATION
As a preliminary to making recommendations, a considerable number of field trips were made to receive first-hand impressions of the existing circulations and transport conditions in urban Delhi. All known sources of factual information bearing on the transport situation in the Delhi area were consulted and numerous surveys both published and unpublished were analyses. With the both cooperation of Northern Railway Authorities, records of passenger and goods movements between Delhi and surrounding region were assembled and analysed. Similar data were assembled for road movements by actual surveys conducted.
Detailed unpublished statistics of Delhi Transport Undertaking were secured, as well as their regularly published reports.
Origin and Destination Survey :
By far the most extensive independent survey undertaken was that of the origin and Destination of all vehicular traffic entering and leaving Delhi. Interview teams set up stations at nine points along an outer corden about six miles from Connaught circus and at 22 stations around an inner cordon at one to two miles out, covering all principal means of ingress and egress to the Delhi urban area. Approximately 33,000 interviews were obtained in September and October 1957 from drivers of vehicles, covering origin and destination, occupation and general income class and purposes of trip, and the record of type of vehicle, hour, direction, etc. and other pertinent objective data were obtained data were entered in the interview sheets. All road vehicles with the exception of buses were counted and a random sample interviewed. The sampling covered five percent of bicycle and ten percent of other vehicles. The results were coded and punched on tabulation cards and sorted by Hollerith machine into significant summaries.
As tabulations were received they were analysed to shed light on the volume of traffic flow at peak morning and evening hours, off peak day light hours and night hours. The data were broken down between fast-miving(private motor cars, trucks, auto-rickshaws and auto=cycle) , slow moving(tonas, bullock-carts, rehras, cycle-rickshaws and hand-carts) and bicycle traffic. Origins and destinations were grouped into relatively small sectors within the inner cordon and between the inner and outer cordons and larger sectors outside the outer cordon. It was thus possible todetermine with some exactness not only the points of heaviest traffic flow by peak hours in each direction but also the extent to which by pass routes such as the outer Ring Road. Inner Ring Road and Inner Loop streets might facilitate traffic flow between know origins and destinations.
There is no attempt in this report to present statistical tabulations of all the material in the origin and destination survey, partly because of the voluminous nature of the statistical tables and partly because a separates report on origin- Destination survey of Traffic in Urban Delhi has been complied. However, the principal conclusion bearing in the following section.
Main Findings :
The total daily September-October, 1957 movements of traffic in each direction approximated 250,000 vehicular trips divided roughly into 50,000 fast-moving, 15,000 slow-moving and the balance bicyle-185,000.
The above figures include a small proportion of buses(omitted in the origin and destination survey) and represent about 1,700 trips in each direction of the Delhi Transport Undertaking buses, about 200 private inter-city bus trips, and approximately 600 trips in each direction by inter- state buses.
Approximately 2,40,000 vehicles in each direction moved through the inner cordon stations located about a mile t two miles from Connaught circus. The traffic moving through the outer cordon stations, roughly six miles from Connaught circus, approximated 43,000 vehicles in each direction, of which about 9,000 had origin and destination outside of the inner cordon and the balance of 34,000 vehicles were destined to and from the central points within the inner cordon. These latter, of course, were also checked at the inner cordon stations.
Thus, is the seen that the traffic volume falls off very rapidly as the distance increase from a mile or two to through the inner cordon, of
R.G.GuptaCity/Policy Planner
Master Plan For Delhi 1957, Volume-II, PART - 3
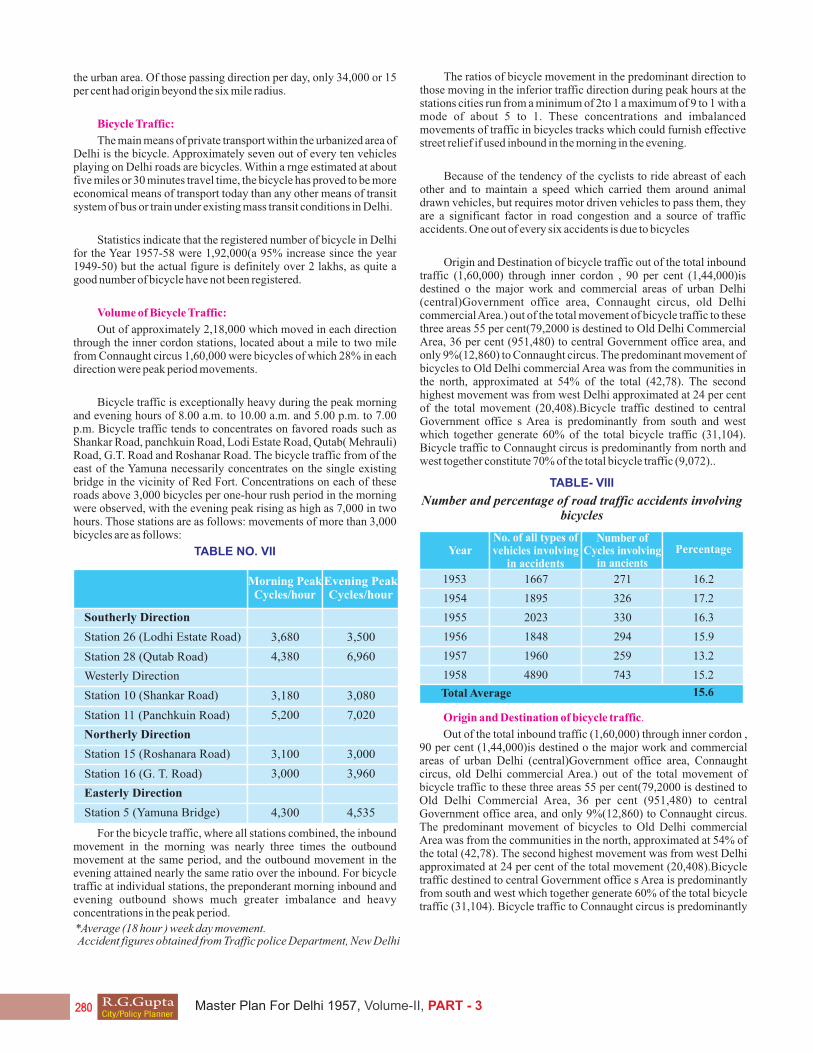
the urban area. Of those passing direction per day, only 34,000 or 15 per cent had origin beyond the six mile radius.
Bicycle Traffic:
The main means of private transport within the urbanized area of Delhi is the bicycle. Approximately seven out of every ten vehicles playing on Delhi roads are bicycles. Within a rnge estimated at about five miles or 30 minutes travel time, the bicycle has proved to be more economical means of transport today than any other means of transit system of bus or train under existing mass transit conditions in Delhi.
Statistics indicate that the registered number of bicycle in Delhi for the Year 1957-58 were 1,92,000(a 95% increase since the year 1949-50) but the actual figure is definitely over 2 lakhs, as quite a good number of bicycle have not been registered.
Volume of Bicycle Traffic:
Out of approximately 2,18,000 which moved in each direction through the inner cordon stations, located about a mile to two mile from Connaught circus 1,60,000 were bicycles of which 28% in each direction were peak period movements.
Bicycle traffic is exceptionally heavy during the peak morning and evening hours of 8.00 a.m. to 10.00 a.m. and 5.00 p.m. to 7.00 p.m. Bicycle traffic tends to concentrates on favored roads such as Shankar Road, panchkuin Road, Lodi Estate Road, Qutab( Mehrauli) Road, G.T. Road and Roshanar Road. The bicycle traffic from of the east of the Yamuna necessarily concentrates on the single existing bridge in the vicinity of Red Fort. Concentrations on each of these roads above 3,000 bicycles per one-hour rush period in the morning were observed, with the evening peak rising as high as 7,000 in two hours. Those stations are as follows: movements of more than 3,000 bicycles are as follows:
TABLE NO. VII
For the bicycle traffic, where all stations combined, the inbound movement in the morning was nearly three times the outbound movement at the same period, and the outbound movement in the evening attained nearly the same ratio over the inbound. For bicycle traffic at individual stations, the preponderant morning inbound and evening outbound shows much greater imbalance and heavy concentrations in the peak period.
The ratios of bicycle movement in the predominant direction to those moving in the inferior traffic direction during peak hours at the stations cities run from a minimum of 2to 1 a maximum of 9 to 1 with a mode of about 5 to 1. These concentrations and imbalanced movements of traffic in bicycles tracks which could furnish effective street relief if used inbound in the morning in the evening.
Because of the tendency of the cyclists to ride abreast of each other and to maintain a speed which carried them around animal drawn vehicles, but requires motor driven vehicles to pass them, they are a significant factor in road congestion and a source of traffic accidents. One out of every six accidents is due to bicycles
Origin and Destination of bicycle traffic out of the total inbound traffic (1,60,000) through inner cordon , 90 per cent (1,44,000)is destined o the major work and commercial areas of urban Delhi (central)Government office area, Connaught circus, old Delhi commercial Area.) out of the total movement of bicycle traffic to these three areas 55 per cent(79,2000 is destined to Old Delhi Commercial Area, 36 per cent (951,480) to central Government office area, and only 9%(12,860) to Connaught circus. The predominant movement of bicycles to Old Delhi commercial Area was from the communities in the north, approximated at 54% of the total (42,78). The second highest movement was from west Delhi approximated at 24 per cent of the total movement (20,408).Bicycle traffic destined to central Government office s Area is predominantly from south and west which together generate 60% of the total bicycle traffic (31,104). Bicycle traffic to Connaught circus is predominantly from north and west together constitute 70% of the total bicycle traffic (9,072)..
Morning PeakCycles/hour
3,680
3,180
3,500
3,080
4,535
6,960
7,020
3,960
4,380
5,200
Southerly Direction
Westerly Direction
Station 26 (Lodhi Estate Road)
Station 10 (Shankar Road)
Station 5 (Yamuna Bridge)
Station 28 (Qutab Road)
Station 11 (Panchkuin Road)
Station 16 (G. T. Road)
Evening PeakCycles/hour
Northerly Direction
Easterly Direction
3,000Station 15 (Roshanara Road) 3,100
4,300
3,000
*Average (18 hour ) week day movement. Accident figures obtained from Traffic police Department, New Delhi
Year
1953 1667
1895
2023
1848
1960
4890
271
326
330
294
259
743
16.2
17.2
16.3
15.9
13.2
15.2
15.6
1954
1955
1956
1957
1958
Total Average
PercentageNumber of
Cycles involving in ancients
No. of all types of vehicles involving
in accidents
TABLE- VIII
Number and percentage of road traffic accidents involving bicycles
Origin and Destination of bicycle traffic.
Out of the total inbound traffic (1,60,000) through inner cordon , 90 per cent (1,44,000)is destined o the major work and commercial areas of urban Delhi (central)Government office area, Connaught circus, old Delhi commercial Area.) out of the total movement of bicycle traffic to these three areas 55 per cent(79,2000 is destined to Old Delhi Commercial Area, 36 per cent (951,480) to central Government office area, and only 9%(12,860) to Connaught circus. The predominant movement of bicycles to Old Delhi commercial Area was from the communities in the north, approximated at 54% of the total (42,78). The second highest movement was from west Delhi approximated at 24 per cent of the total movement (20,408).Bicycle traffic destined to central Government office s Area is predominantly from south and west which together generate 60% of the total bicycle traffic (31,104). Bicycle traffic to Connaught circus is predominantly
R.G.GuptaCity/Policy Planner
Master Plan For Delhi 1957, Volume-II, PART - 3
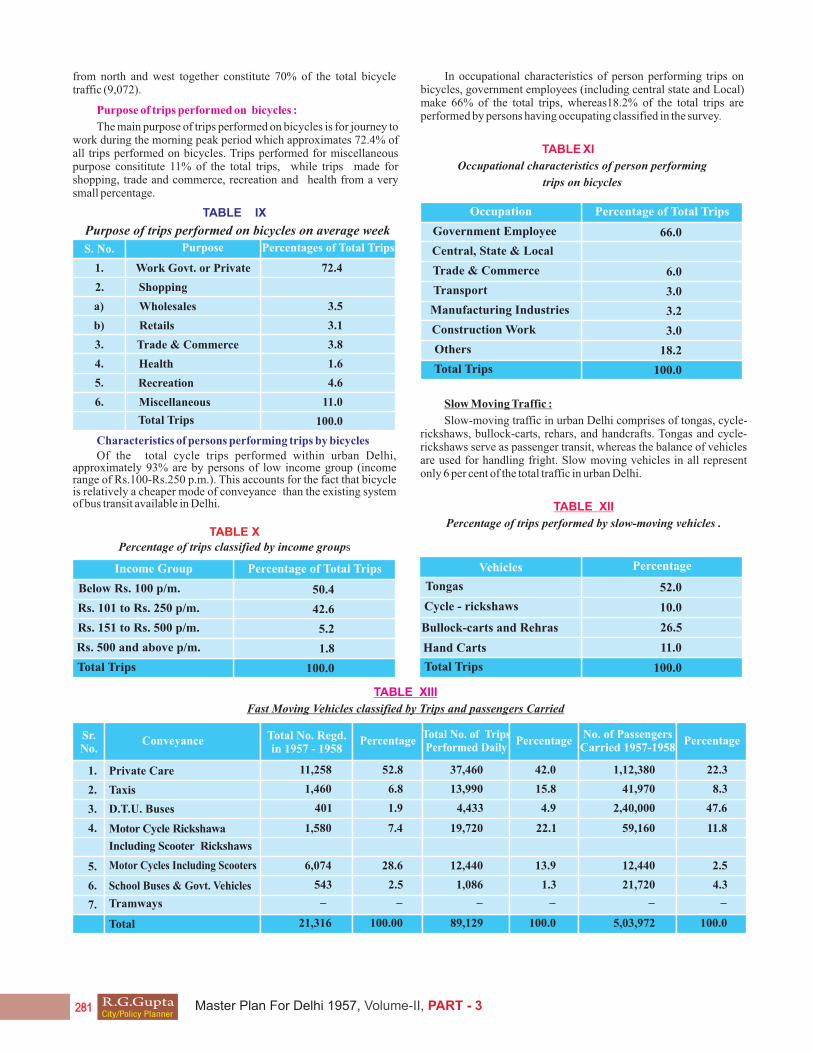
PurposeS. No.
1. Work Govt. or Private 72.4
3.5
3.1
3.8
1.6
4.6
11.0
100.0
Shopping
Wholesales
Retails
Trade & Commerce
Health
Recreation
Miscellaneous
Total Trips
2.
3.
4.
5.
6.
a)
b)
Percentages of Total Trips
Occupation
Government Employee 66.0
6.0
3.0
3.0
100.0
3.2
18.2
Central, State & Local
Trade & Commerce
Transport
Construction Work
Total Trips
Manufacturing Industries
Others
Percentage of Total Trips
Vehicles
Tongas 52.0
10.0
26.5
11.0
100.0
Cycle - rickshaws
Bullock-carts and Rehras
Hand Carts
Total Trips
Percentage
from north and west together constitute 70% of the total bicycle traffic (9,072).
Purpose of trips performed on bicycles :
The main purpose of trips performed on bicycles is for journey to work during the morning peak period which approximates 72.4% of all trips performed on bicycles. Trips performed for miscellaneous purpose consititute 11% of the total trips, while trips made for shopping, trade and commerce, recreation and health from a very small percentage.
TABLE IX
Purpose of trips performed on bicycles on average week
Characteristics of persons performing trips by bicycles
Of the total cycle trips performed within urban Delhi, approximately 93% are by persons of low income group (income range of Rs.100-Rs.250 p.m.). This accounts for the fact that bicycle is relatively a cheaper mode of conveyance than the existing system of bus transit available in Delhi.
TABLE X Percentage of trips classified by income groups
Income Group
Below Rs. 100 p/m. 50.4
42.6
5.2
1.8
100.0
Rs. 101 to Rs. 250 p/m.
Rs. 151 to Rs. 500 p/m.
Rs. 500 and above p/m.
Total Trips
Percentage of Total Trips
In occupational characteristics of person performing trips on bicycles, government employees (including central state and Local) make 66% of the total trips, whereas18.2% of the total trips are performed by persons having occupating classified in the survey.
TABLE XI
Occupational characteristics of person performing
trips on bicycles
Slow Moving Traffic :
Slow-moving traffic in urban Delhi comprises of tongas, cycle-rickshaws, bullock-carts, rehars, and handcrafts. Tongas and cycle-rickshaws serve as passenger transit, whereas the balance of vehicles are used for handling fright. Slow moving vehicles in all represent only 6 per cent of the total traffic in urban Delhi.
TABLE XII
Percentage of trips performed by slow-moving vehicles .
TABLE XIII
Fast Moving Vehicles classified by Trips and passengers Carried
Sr. No.
Private Care1.
2.
3.
4.
5.
6.
7.
11,258
1,460
401
1,580
6,074
543
21,316
–
37,460
13,990
4,433
19,720
12,440
1,086
89,129
–
1,12,380
41,970
2,40,000
59,160
12,440
21,720
5,03,972
–
42.0
15.8
4.9
22.1
13.9
1.3
100.0
–
52.8
6.8
1.9
7.4
28.6
2.5
100.00
–
Taxis
D.T.U. Buses
Tramways
Total
Motor Cycles Including Scooters
School Buses & Govt. Vehicles
Motor Cycle Rickshawa
Including Scooter Rickshaws
Conveyance Total No. Regd. in 1957 - 1958
Total No. of Trips Performed Daily
No. of PassengersCarried 1957-1958
Percentage Percentage
22.3
8.3
47.6
11.8
2.5
4.3
100.0
–
Percentage
R.G.GuptaCity/Policy Planner
Master Plan For Delhi 1957, Volume-II, PART - 3

DestinationCentral Govt. OfficesConcentration Area
Connaught Circus Old Delhi Commercial AreaDirection
PercentageNumber
North
Old City
East
West
South
Total
ORIGIN
Southeast
Number Percentage Number Percentage
610
1,260
30
810
950
410
4,070
15
31
1
20
23
10
100
15
31
2
31
12
9
100
42
20
4
16
9
9
100
1,310
2,640
530
2,570
1,020
740
8,430
5,430
2,600
530
2,120
1,270
1,150
13,100
Total
Number Percentage
29
25
3
22
12
9
100
7,350
6,500
710
5,500
3,240
2,300
25,600
Of the total slow moving vehicular trips, over 600 percent are performed by passenger vehicles(Tongas, and cycle-rickshwas), while the remaining trips are performed by fright carries. Tongas alone make over 505 of the total trips performed by slow-moving vehicles in Delhi.
In general slow-moving traffic has its principal origin and destination within the commercial centres of Delhi as might be expected.
Tonga Traffic:
Principal origin and destination of tonga traffic is in the old Delhi area in the north; about 73 per cent of the total (5590 out of 7440) per day. The night time tonga traffic is relatively small, only 10 per cent of the total. Only 12 per cent or 930 tongas move at the morning peak hour at the pul Mithal (near Tis Hazari), Dufferine Bridge and G.T. Road ( near subzimandi).
Due to the narrow street system and lack of adequate passenger transit service in the congested localities of old Delhi, tongas and cycle-rickshaws today constitute an indispensable mode of conveyance for the people residing in these areas. The slow moving vehicles compete with the only public transit system(tramways) in the old city area. Because of the acute street congestion, the terms have a travelling speed of approximately 3 miles per hour. Hence, serious consideration should be given for providing an alternate passenger transit system to serve this area, prior to either scrapping the tramways or prohibiting tonga and cycle-rickshaw traffic.
Bullock-carts and Rehras (Freight vehicles)
Analysis of table indicates that bullock carts and rehars exceeded 300per day inbound only at Deshbandhu Road, Roshanara Road, G.T. Road(near subzimandi). Pulmithai general impression, bullock cart and rehra movement at night does not predominate ( only 7 per cent or 260 out of 3,770) but the off-peak day time movement is heaviest. Bullock carts and rehears are a factor in the peak hour morning traffic to the extent of 100 more only at G.T. Road(near subzimandi)and Dufferine Bridge, north of the Delhi main Railway line. The movement during the day time. Bullock-carts and rehars show relatively heavy movements (150to 200) during the morning and evening peak hours at the Yamuna Bridge. By far, the largest volume of bullock carts and rehears from outer origin zones came from across the river, 600 per day out of a total of 1030. The next heaviest movement(240 per day) is recorded from the western origin
TABLE XIV
Inbound Fast vehicles Traffic to the major work and Commercial centres
zones along New Rohtak Road. The bullock-cart and rehra traffic was not heavy during the morning or evening peak traffic hours not during the night, the majority moving in the off-peak daylight hours.
Fast Moving Traffic :
Approximately fifty per cent (6,00,000 passengers) of the intra-urban passenger movements depend on the fast modes of conveyance such as private cars, Taxis, DTU buses, Motor Cycle including scooters, Tramcars as well as Railways. As for the tramcars which ply only in certain parts of the old city area, excepting one or two, all have been discarded because of their obsolescence, and their plying on the already congested areas adds only a nuisance value to the confusion of mixed traffic. Each tramcar hardly maintains a speed of 3 miles per hour and the volume of passenger carried has steadily declined every year, now amounting to about 15,000 per day. The loss of revenue to the tune of Rs. 30,000on an average per month is estimated as the repairs charges for the vehicles including their depreciation value.
Regarding the railways, their utility for local traffic is very negligible. The movement on the railways I small, because the stations are not generally located close to final destinations of most of the travelers.
The mass transport is largely furnished by the Delhi Transport Undertaking of the Delhi Municipal Corporation. The DTUU buses carry 21.46% (2,40,000 persons) of the total passengers, while hardly 1.4%(16,000) persons of them are transported by the other private cars account for only 10% (1,12,0000) of the total.
Table xiii gives the total number of fast moving vehicles registered within the Union territory of Delhi as well as the approximate number of their daily trips vis-à-vis passengers carried by them.
Volume :
The total inbound fats moving traffic entrain the inner cordon, amounts to 44,030 vehicles, while the total outbound vehicles were 46,320. Both, the morning peak and the evening peak for the total inbound vehicles indicate 6030 to 6060 vehicles respectively. The total outbound traffic during the morning and evening peak hours was 6020 and 6900 respectively.
The stations which have a concentration or fast moving during the peak hours the ratios of a minimum of 2;1 to the maximum 5: 1
R.G.GuptaCity/Policy Planner
Master Plan For Delhi 1957, Volume-II, PART - 3
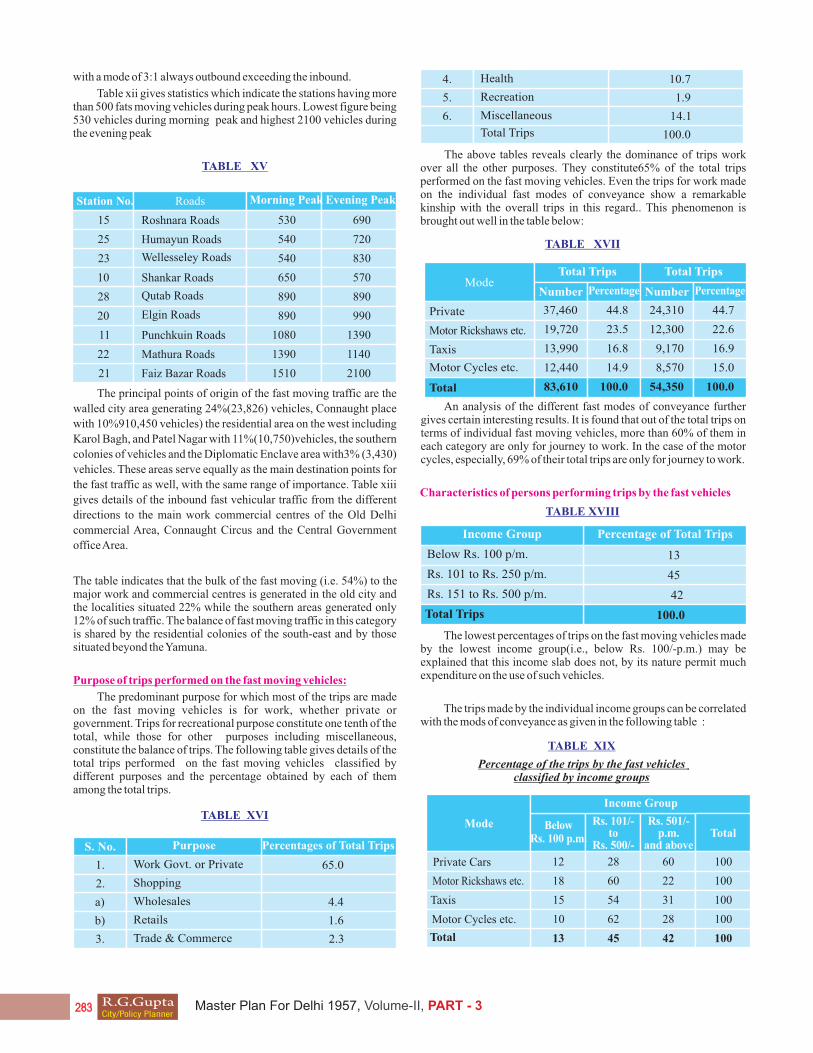
10.7
1.9
14.1
100.0
Health
Recreation
Miscellaneous
Total Trips
4.
5.
6.
PurposeS. No.
1. 65.0
4.4
1.6
2.3
Work Govt. or Private
Shopping
Wholesales
Retails
Trade & Commerce
2.
3.
a)
b)
Percentages of Total Trips
Station No.
15
25
23
10
28
20
11
22
21
530
540
540
650
890
890
1080
1390
1510
690
720
830
570
890
990
1390
1140
2100
Roads
Roshnara Roads
Humayun Roads
Wellesseley Roads
Shankar Roads
Qutab Roads
Elgin Roads
Punchkuin Roads
Mathura Roads
Faiz Bazar Roads
Morning Peak Evening Peak
TABLE XVI
TABLE XVII
TABLE XVIII
The above tables reveals clearly the dominance of trips work over all the other purposes. They constitute65% of the total trips performed on the fast moving vehicles. Even the trips for work made on the individual fast modes of conveyance show a remarkable kinship with the overall trips in this regard.. This phenomenon is brought out well in the table below:
Mode
Private 37,460
19,720
13,990
12,440
83,610
24,310
12,300
9,170
8,570
54,350
44.8
23.5
16.8
14.9
100.0
44.7
22.6
16.9
15.0
100.0
Taxis
Motor Cycles etc.
Total
Motor Rickshaws etc.
Total Trips
Number NumberPercentage Percentage
Total Trips
An analysis of the different fast modes of conveyance further gives certain interesting results. It is found that out of the total trips on terms of individual fast moving vehicles, more than 60% of them in each category are only for journey to work. In the case of the motor cycles, especially, 69% of their total trips are only for journey to work.
Characteristics of persons performing trips by the fast vehicles
Income Group
Below Rs. 100 p/m. 13
45
42
100.0
Rs. 101 to Rs. 250 p/m.
Rs. 151 to Rs. 500 p/m.
Total Trips
Percentage of Total Trips
The lowest percentages of trips on the fast moving vehicles made by the lowest income group(i.e., below Rs. 100/-p.m.) may be explained that this income slab does not, by its nature permit much expenditure on the use of such vehicles.
The trips made by the individual income groups can be correlated with the mods of conveyance as given in the following table :
with a mode of 3:1 always outbound exceeding the inbound.
Table xii gives statistics which indicate the stations having more than 500 fats moving vehicles during peak hours. Lowest figure being 530 vehicles during morning peak and highest 2100 vehicles during the evening peak
TABLE XV
The principal points of origin of the fast moving traffic are the
walled city area generating 24%(23,826) vehicles, Connaught place
with 10%910,450 vehicles) the residential area on the west including
Karol Bagh, and Patel Nagar with 11%(10,750)vehicles, the southern
colonies of vehicles and the Diplomatic Enclave area with3% (3,430)
vehicles. These areas serve equally as the main destination points for
the fast traffic as well, with the same range of importance. Table xiii
gives details of the inbound fast vehicular traffic from the different
directions to the main work commercial centres of the Old Delhi
commercial Area, Connaught Circus and the Central Government
office Area.
The table indicates that the bulk of the fast moving (i.e. 54%) to the major work and commercial centres is generated in the old city and the localities situated 22% while the southern areas generated only 12% of such traffic. The balance of fast moving traffic in this category is shared by the residential colonies of the south-east and by those situated beyond the Yamuna.
Purpose of trips performed on the fast moving vehicles:
The predominant purpose for which most of the trips are made on the fast moving vehicles is for work, whether private or government. Trips for recreational purpose constitute one tenth of the total, while those for other purposes including miscellaneous, constitute the balance of trips. The following table gives details of the total trips performed on the fast moving vehicles classified by different purposes and the percentage obtained by each of them among the total trips.
TABLE XIX
Percentage of the trips by the fast vehicles classified by income groups
Income Group
Rs. 501/-p.m.
and above
Rs. 101/-to
Rs. 500/-
Below Rs. 100 p.m.
Mode
Private Cars
Motor Rickshaws etc.
Taxis
Motor Cycles etc.
Total
12 28
60
54
62
45
60
22
31
28
42
100
100
100
100
100
18
15
10
13
Total
R.G.GuptaCity/Policy Planner
Master Plan For Delhi 1957, Volume-II, PART - 3

TABLE XX
The preponderant use of private cars is found to be made by people having an income of more than Rs..500/-p.m. Motor Richshwas and Motor Cycles including scooters are largely used by the persons in the middle income groups, -who also share more than fifty per cent of trips on taxis.
Occupational characteristics of persons performing trips on the fast vehicles.
More than fifty per cent of the trips on the fast moving vehicles are made by persons in the central, state and Local Government employment. Trade and commerce together with fast vehicles, while a very negligible percentage relates to construction work.
The following table classified the occupational characteristics of persons in terms ofpercentage of trips made by them on the moving vehicles.
Occupation
Government Employee 51.60
14.70
8.18
1.16
100.0
4.04
20.32
Central, State & Local
Trade & Commerce
Transport
Construction Work
Total Trips
Manufacturing Industries
Others
Percentage of Total Trips
V. PROPOSALS AND PROJECTS FOR TRANSPORT
MOVEMENT
The proposals include both specific projects recommended as part of the capital improvement programme, as well improvement in transportation service by integrating rail and inter-state bus service to Delhi, and improved ring bus service between communities outside of Delhi but it in the Delhi regional influence. It also include proposals for improving road connections between communities in the jsurrounding region of Delhi to decrease the spoke system of traffic movement.Proposals and projects are discussed in terms of long distance traffic, regional traffic between Delhi and a 50 miles radius, and local traffic and circulation within Delhi itself. To a certain extent these areas will overlap in use of roads, terminals, and carrier facilities.
International Civil Airport Recommendation
Recommendations, for a International Civil Airport, containing five alternate sites have already been made and transmitted to the Government in November, 1997, through a Technical committee set up by the Ministry of communications, Government of India.
Of the five possible sites (palam, pasaunda, Tilapat, Sahibabad,Bahadurgarh) it is recommended that the international Aerodrome for civil aviation at Delhi be continued at palam. While the comparatively smaller number of commercial flights both at palam and safdarjang Aerodromes could be handled on a single runway, the common use with Indian Air Force planes and the prospect that jet planes will be operating on international commercial
routes in the near future, points to the need for early completion of a runway 12,000 feet in length, parallel and south of present 7,500 feet east west runway. This would permit the use of the existing runway by the Air Force and the new runway by the Civil Aviation. The existing aerodrome acreage of 1,185acres at palam should be approximately doubled. It would be entirely feasible to continue joint Air Force and civilian operations, under common tower operated and controlled as is now by the Air Force, but re-located from its present position to a point nearer the centre of the field where visibility of operations on the runway and hangar terminal facilities and housing on the Air Force station side could continue to used by the Air Force with the new parallel runway and expanded terminal civilian operations, completely segregated, from the Air Force Station, on the south and the east. The new civilian runway would have a capacity both in length and load bearing sufficient to take large international planes of the foreseeable future. Based on the a capacity of 30 to 40 movement(landing and take offs) per hour under favorable visibility conditions. Such a capacity as estimated would be more than ample for civil operation for many years to come. Single runway airports in the New York Metropolitan Area, for example handle over 400 movements per day. The commercial flifgfhts at palam today average 20 and at safdarjang 14 per day plus another 64 private th epobable future club. No projections are available as to the probable future growth of air traffic, but the plans for increasing direct international service to Delhi involve comparatively few flights-approximately 125 movements per day in ten year period.
The Air Force usage of palam at present is substantiated more than the civil, roughly estimated at their times. Hence It is possible that in the near future the capacity of the Air Force runway and ancillary facilities will be reached before that of the dual civil air strip. Hence within a reasonable time it is anticipated that the Air Force station will transfer to an outlying site further away from Delhi, consistent with its role in national defense, and palam could then be converted exclusively to a civil aerodrome.
The cost of expanding palam Aerodrome with additional acreage of 1185 acres and a new parallel runway would be very much less- it is estimated at 2.88 crores of which 1.5 is for land acquisition and the balance for runway construction etc. whereas the estimates for present palam installations and their projected expansion at passunda site would cost approximately 10 crores or more than three times as much.
A compared to an alternate site at pasaunda for civil Aerodrome to serve Delhi, palam has several advantages, among which may be enumerated:
1. Better accessibility to urban centre (approximately 25 minutes travel time)
2. Present availability of utilities
3. Less interference with existing agricultural production and palam and land usage.
4. A substantially lower capital investment cost.
5. Asubsantially leaser time to construction, the expansion of palam could be accomplished much more rapidly than creating a new aerodrome at pasaunda.
However, if the Government of India feels the necessity of setting up a separate civil aerodrome at some site other than palam: pasaunda in U.P. Is recommended as a good alternate site for the purpose (Refer Land Use Plan).
R.G.GuptaCity/Policy Planner
Master Plan For Delhi 1957, Volume-II, PART - 3
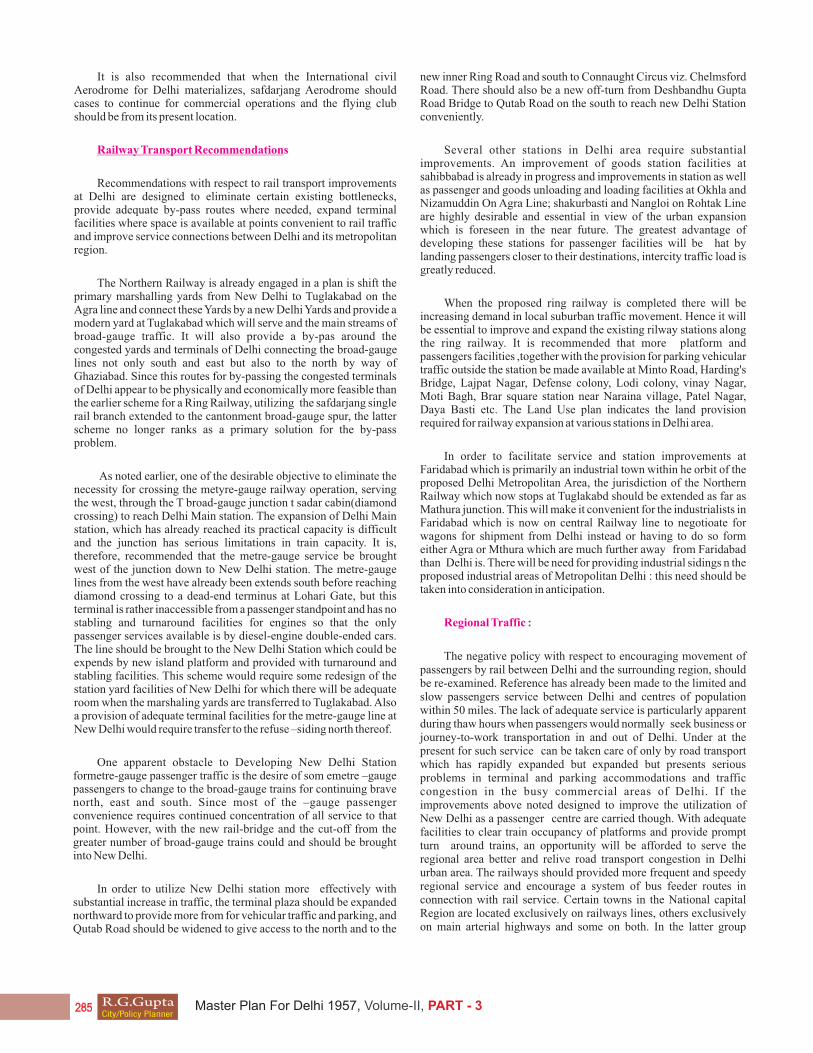
It is also recommended that when the International civil Aerodrome for Delhi materializes, safdarjang Aerodrome should cases to continue for commercial operations and the flying club should be from its present location.
Railway Transport Recommendations
Recommendations with respect to rail transport improvements at Delhi are designed to eliminate certain existing bottlenecks, provide adequate by-pass routes where needed, expand terminal facilities where space is available at points convenient to rail traffic and improve service connections between Delhi and its metropolitan region.
The Northern Railway is already engaged in a plan is shift the primary marshalling yards from New Delhi to Tuglakabad on the Agra line and connect these Yards by a new Delhi Yards and provide a modern yard at Tuglakabad which will serve and the main streams of broad-gauge traffic. It will also provide a by-pas around the congested yards and terminals of Delhi connecting the broad-gauge lines not only south and east but also to the north by way of Ghaziabad. Since this routes for by-passing the congested terminals of Delhi appear to be physically and economically more feasible than the earlier scheme for a Ring Railway, utilizing the safdarjang single rail branch extended to the cantonment broad-gauge spur, the latter scheme no longer ranks as a primary solution for the by-pass problem.
As noted earlier, one of the desirable objective to eliminate the necessity for crossing the metyre-gauge railway operation, serving the west, through the T broad-gauge junction t sadar cabin(diamond crossing) to reach Delhi Main station. The expansion of Delhi Main station, which has already reached its practical capacity is difficult and the junction has serious limitations in train capacity. It is, therefore, recommended that the metre-gauge service be brought west of the junction down to New Delhi station. The metre-gauge lines from the west have already been extends south before reaching diamond crossing to a dead-end terminus at Lohari Gate, but this terminal is rather inaccessible from a passenger standpoint and has no stabling and turnaround facilities for engines so that the only passenger services available is by diesel-engine double-ended cars. The line should be brought to the New Delhi Station which could be expends by new island platform and provided with turnaround and stabling facilities. This scheme would require some redesign of the station yard facilities of New Delhi for which there will be adequate room when the marshaling yards are transferred to Tuglakabad. Also a provision of adequate terminal facilities for the metre-gauge line at New Delhi would require transfer to the refuse –siding north thereof.
One apparent obstacle to Developing New Delhi Station formetre-gauge passenger traffic is the desire of som emetre –gauge passengers to change to the broad-gauge trains for continuing brave north, east and south. Since most of the –gauge passenger convenience requires continued concentration of all service to that point. However, with the new rail-bridge and the cut-off from the greater number of broad-gauge trains could and should be brought into New Delhi.
In order to utilize New Delhi station more effectively with substantial increase in traffic, the terminal plaza should be expanded northward to provide more from for vehicular traffic and parking, and Qutab Road should be widened to give access to the north and to the
new inner Ring Road and south to Connaught Circus viz. Chelmsford Road. There should also be a new off-turn from Deshbandhu Gupta Road Bridge to Qutab Road on the south to reach new Delhi Station conveniently.
Several other stations in Delhi area require substantial improvements. An improvement of goods station facilities at sahibbabad is already in progress and improvements in station as well as passenger and goods unloading and loading facilities at Okhla and Nizamuddin On Agra Line; shakurbasti and Nangloi on Rohtak Line are highly desirable and essential in view of the urban expansion which is foreseen in the near future. The greatest advantage of developing these stations for passenger facilities will be hat by landing passengers closer to their destinations, intercity traffic load is greatly reduced.
When the proposed ring railway is completed there will be increasing demand in local suburban traffic movement. Hence it will be essential to improve and expand the existing rilway stations along the ring railway. It is recommended that more platform and passengers facilities ,together with the provision for parking vehicular traffic outside the station be made available at Minto Road, Harding's Bridge, Lajpat Nagar, Defense colony, Lodi colony, vinay Nagar, Moti Bagh, Brar square station near Naraina village, Patel Nagar, Daya Basti etc. The Land Use plan indicates the land provision required for railway expansion at various stations in Delhi area.
In order to facilitate service and station improvements at Faridabad which is primarily an industrial town within he orbit of the proposed Delhi Metropolitan Area, the jurisdiction of the Northern Railway which now stops at Tuglakabd should be extended as far as Mathura junction. This will make it convenient for the industrialists in Faridabad which is now on central Railway line to negotioate for wagons for shipment from Delhi instead or having to do so form either Agra or Mthura which are much further away from Faridabad than Delhi is. There will be need for providing industrial sidings n the proposed industrial areas of Metropolitan Delhi : this need should be taken into consideration in anticipation.
Regional Traffic :
The negative policy with respect to encouraging movement of passengers by rail between Delhi and the surrounding region, should be re-examined. Reference has already been made to the limited and slow passengers service between Delhi and centres of population within 50 miles. The lack of adequate service is particularly apparent during thaw hours when passengers would normally seek business or journey-to-work transportation in and out of Delhi. Under at the present for such service can be taken care of only by road transport which has rapidly expanded but expanded but presents serious problems in terminal and parking accommodations and traffic congestion in the busy commercial areas of Delhi. If the improvements above noted designed to improve the utilization of New Delhi as a passenger centre are carried though. With adequate facilities to clear train occupancy of platforms and provide prompt turn around trains, an opportunity will be afforded to serve the regional area better and relive road transport congestion in Delhi urban area. The railways should provided more frequent and speedy regional service and encourage a system of bus feeder routes in connection with rail service. Certain towns in the National capital Region are located exclusively on railways lines, others exclusively on main arterial highways and some on both. In the latter group
R.G.GuptaCity/Policy Planner
Master Plan For Delhi 1957, Volume-II, PART - 3

duplicate services are frequently now being rendered as far as carrying passengers into Delhi. It may be advisable to have both railway and bus services into Delhi but there is need for co-ordination as to scheduling. Ordinarily the morning and evening peak traffic to and from Delhi requires mass transportation, which the railways are better able to handle in terms of volume, which buses are better able to handle the off-peak traffic since they employ smaller units and can offer more different schedules.
In some cases where towns are served only by highways transport reaching Delhi and have or could have good bus service to a nearby railway station, where good train service is available to Delhi, some of the bus traffic to Delhi, particularly in peak-hours might be carried to the railway station by short-haul feeder buses.
Specific examples –palwal which is 36 miles south on the Mathura broad-gauge railway line has bus connections to Nuh and potentially to sohna. Neither of these latter communities are on the railway line but instead on the Mehrauli Road. Short feeder bus service to palwal railway station will give Nuh and sohna rail service. Another example is Khurja which is 52 miles south-east on the railway line leading to Aligarh and Tundla. Khurja has good bus connections to Bulandshahr about 10 miles away, which is not on the railway but is on the highway and its direct interstate bus service to Delhi: coordination of bus services from Bulandshar to Khurja with the train service From Khurja to Delhi ill provide good mass transit service to Bulandshar in the morning and evening peak hours without requiring an excessive number of interstate bus trips to Delhi.
Another slightly different example is Rohtak 44 miles west on the broad-gauge line to Jind which has good bus connections to Hissar and Bhiwani on the metre-gauge line. The passenger traffic to Delhi from Hissar and Bhiwani should be coordinated by feeder bus with railway service form Rohtak and make it possible to out down railway service on the metre-gauge line and give better frequency via Rohtak.
This question of coordinating passenger transport operation within the National capital Regio should be given utmost consideration, so that efficient and convenient services are offered to the public. The question of ownership( whether nationalized or not, belonging to a single agency or to various operators) is not so important as long as integrated and disciplined services with high safety standards are secured. Coordinating bus and railway service will require joint team work between the Northern Railway and various inter-state bus lines with the object of eliminating uneconomic duplication and improving the service available to the passenger.
An important aspect of this type f improvement is that it would require little, if any, capital expenditure and might actually reduce capital and maintenance costs, while providing better passenger service. This type of improvement will also result in improving communication by direct movement between outlying towns and reducing the necessity of moving such large volumes of people into Delhi. This type of improvement is particularly valuable to the development of the region on decentralized or cluster basis rather than a spoke basis.
While electrification of the Delhi terminal area is not for seen in the near future because of high costivolved in terms of foreign
exchange and lack of adequate power supply, serious consideration should be given to anticipating the future electrification of the Delhi terminal area as far as Ghaziabad, Meerut, Faridabad,, and Sonepat, in a manner similar to that in which Bombay and Calcutta terminal zones are electrified. Until such time the problem of more passenger platform at Delhi Main could be alleviated by use of more quick turning diesel rail care to out down platform occupancy time.
Regional Highway Network proposals :
Practically all the towns lying within the National Capital Region are situated along the five national highways which converge at Delhi. The remaining few, though not situated along the main highways are linked to them by means of either branch or feeder roads. This situation, facilities easy access to Delhi from these outlying towns.
However, due to lack of adequate road linkage between the towns, particularly those situated towards the east and west of Yamuna river, inter-communication between the towns is invariably through Delhi by way of the existing road-cum-rail bridge across the Yamuna.
The bridge which is today inadequate, because of the one way operation for fast moving traffic, will be grossly inadequate to cope with the traffic in the future. This fact emphasizes the necessity of augmenting east-west access between towns lying on either side of the river. Boat bridges, which function only during dry weather are now in existence between sonpat-Bhagapat and palwal-Jewar. It is therefore, recommended that in order to relive the pressure on the Yamuna Bridge and the congested Delhi areas, periphereral all weather communications should be provided by converting the boat bridges into concrete structures. A bridge at Bhagwat will give connection to sonpat- Meerut. While the bridge at jewer will link plawal to khurja and Aligarh.
Similarly, in order to encourage peripheral movement of traffic between the towns lying within Delhi Metropolitan Area a perimeter road connecting Ghaziabad, Faridabad, Gurgaon, Bahadurggarh and Narela should be developed. Additional links between Ghaziabad in the east and other satellite towns to the west of the Yamuna will be available with the completion of the proposed road bridge across the Yamuna near Humayan Tomb ion the south, and the Barrage- cum- road at wazirabad in the north. These links will augment the limited east-west access now confined to only one road-cum-rail bridge.
By pass routes for satellite towns
The function of a by-pass is to provide an attractive alternate route for traffic which has no valid reason to pass through busy roads of a built up area, thereby alleviating conditions which on existing routes contribute to danger, congestion and delay.
Although, at present, the road traffic conditions mat not justify the need for constructing by -pass roads to satellite towns(Ghaziabad, Faridabad, Ballabgarh, Gurgaon Bahadurgarh) lying on the periphery of the Delhi Metropolitan Area, yet since they are situated along the National Highways right-of-ways should be earmarked for constructing the by-pass road, instead of later resorting to costly land acquisition programme, when these towns expand.
R.G.GuptaCity/Policy Planner
Master Plan For Delhi 1957, Volume-II, PART - 3
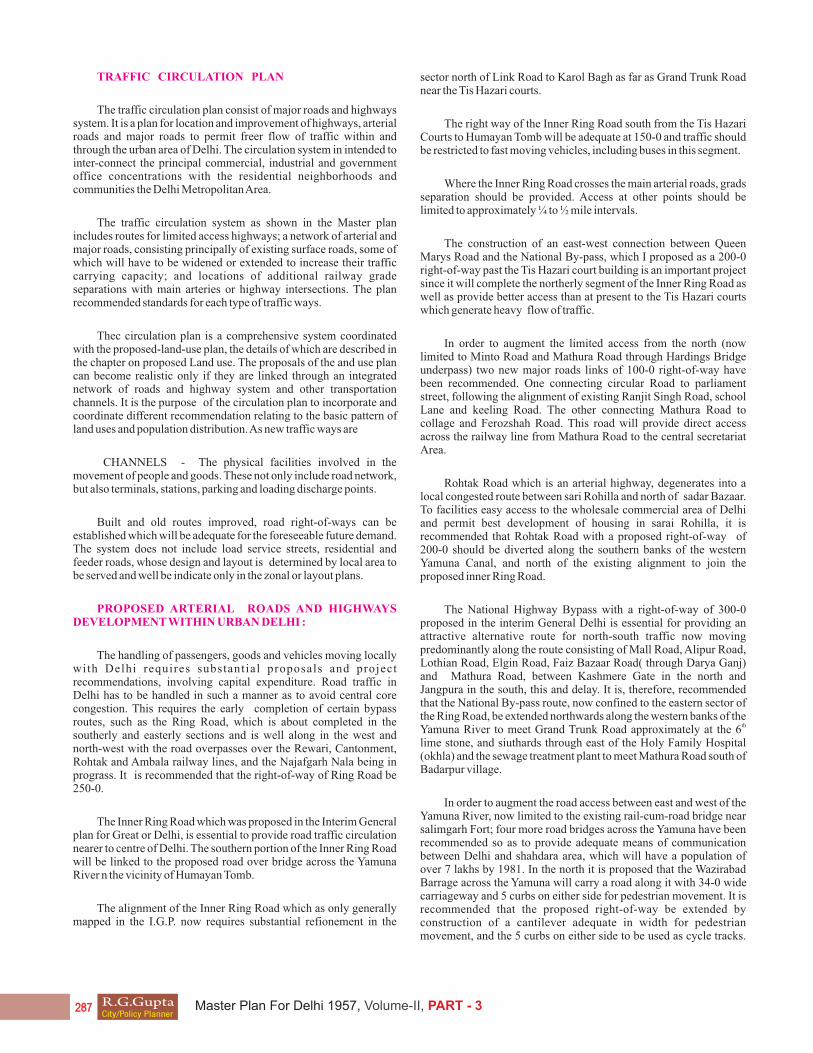
TRAFFIC CIRCULATION PLAN
The traffic circulation plan consist of major roads and highways system. It is a plan for location and improvement of highways, arterial roads and major roads to permit freer flow of traffic within and through the urban area of Delhi. The circulation system in intended to inter-connect the principal commercial, industrial and government office concentrations with the residential neighborhoods and communities the Delhi Metropolitan Area.
The traffic circulation system as shown in the Master plan includes routes for limited access highways; a network of arterial and major roads, consisting principally of existing surface roads, some of which will have to be widened or extended to increase their traffic carrying capacity; and locations of additional railway grade separations with main arteries or highway intersections. The plan recommended standards for each type of traffic ways.
Thec circulation plan is a comprehensive system coordinated with the proposed-land-use plan, the details of which are described in the chapter on proposed Land use. The proposals of the and use plan can become realistic only if they are linked through an integrated network of roads and highway system and other transportation channels. It is the purpose of the circulation plan to incorporate and coordinate different recommendation relating to the basic pattern of land uses and population distribution. As new traffic ways are
CHANNELS - The physical facilities involved in the movement of people and goods. These not only include road network, but also terminals, stations, parking and loading discharge points.
Built and old routes improved, road right-of-ways can be established which will be adequate for the foreseeable future demand. The system does not include load service streets, residential and feeder roads, whose design and layout is determined by local area to be served and well be indicate only in the zonal or layout plans.
PROPOSED ARTERIAL ROADS AND HIGHWAYS DEVELOPMENT WITHIN URBAN DELHI :
The handling of passengers, goods and vehicles moving locally with Delhi requires substantial proposals and project recommendations, involving capital expenditure. Road traffic in Delhi has to be handled in such a manner as to avoid central core congestion. This requires the early completion of certain bypass routes, such as the Ring Road, which is about completed in the southerly and easterly sections and is well along in the west and north-west with the road overpasses over the Rewari, Cantonment, Rohtak and Ambala railway lines, and the Najafgarh Nala being in prograss. It is recommended that the right-of-way of Ring Road be 250-0.
The Inner Ring Road which was proposed in the Interim General plan for Great or Delhi, is essential to provide road traffic circulation nearer to centre of Delhi. The southern portion of the Inner Ring Road will be linked to the proposed road over bridge across the Yamuna River n the vicinity of Humayan Tomb.
The alignment of the Inner Ring Road which as only generally mapped in the I.G.P. now requires substantial refionement in the
sector north of Link Road to Karol Bagh as far as Grand Trunk Road near the Tis Hazari courts.
The right way of the Inner Ring Road south from the Tis Hazari Courts to Humayan Tomb will be adequate at 150-0 and traffic should be restricted to fast moving vehicles, including buses in this segment.
Where the Inner Ring Road crosses the main arterial roads, grads separation should be provided. Access at other points should be limited to approximately ¼ to ½ mile intervals.
The construction of an east-west connection between Queen Marys Road and the National By-pass, which I proposed as a 200-0 right-of-way past the Tis Hazari court building is an important project since it will complete the northerly segment of the Inner Ring Road as well as provide better access than at present to the Tis Hazari courts which generate heavy flow of traffic.
In order to augment the limited access from the north (now limited to Minto Road and Mathura Road through Hardings Bridge underpass) two new major roads links of 100-0 right-of-way have been recommended. One connecting circular Road to parliament street, following the alignment of existing Ranjit Singh Road, school Lane and keeling Road. The other connecting Mathura Road to collage and Ferozshah Road. This road will provide direct access across the railway line from Mathura Road to the central secretariat Area.
Rohtak Road which is an arterial highway, degenerates into a local congested route between sari Rohilla and north of sadar Bazaar. To facilities easy access to the wholesale commercial area of Delhi and permit best development of housing in sarai Rohilla, it is recommended that Rohtak Road with a proposed right-of-way of 200-0 should be diverted along the southern banks of the western Yamuna Canal, and north of the existing alignment to join the proposed inner Ring Road.
The National Highway Bypass with a right-of-way of 300-0 proposed in the interim General Delhi is essential for providing an attractive alternative route for north-south traffic now moving predominantly along the route consisting of Mall Road, Alipur Road, Lothian Road, Elgin Road, Faiz Bazaar Road( through Darya Ganj) and Mathura Road, between Kashmere Gate in the north and Jangpura in the south, this and delay. It is, therefore, recommended that the National By-pass route, now confined to the eastern sector of the Ring Road, be extended northwards along the western banks of the
thYamuna River to meet Grand Trunk Road approximately at the 6 lime stone, and siuthards through east of the Holy Family Hospital (okhla) and the sewage treatment plant to meet Mathura Road south of Badarpur village.
In order to augment the road access between east and west of the Yamuna River, now limited to the existing rail-cum-road bridge near salimgarh Fort; four more road bridges across the Yamuna have been recommended so as to provide adequate means of communication between Delhi and shahdara area, which will have a population of over 7 lakhs by 1981. In the north it is proposed that the Wazirabad Barrage across the Yamuna will carry a road along it with 34-0 wide carriageway and 5 curbs on either side for pedestrian movement. It is recommended that the proposed right-of-way be extended by construction of a cantilever adequate in width for pedestrian movement, and the 5 curbs on either side to be used as cycle tracks.
R.G.GuptaCity/Policy Planner
Master Plan For Delhi 1957, Volume-II, PART - 3
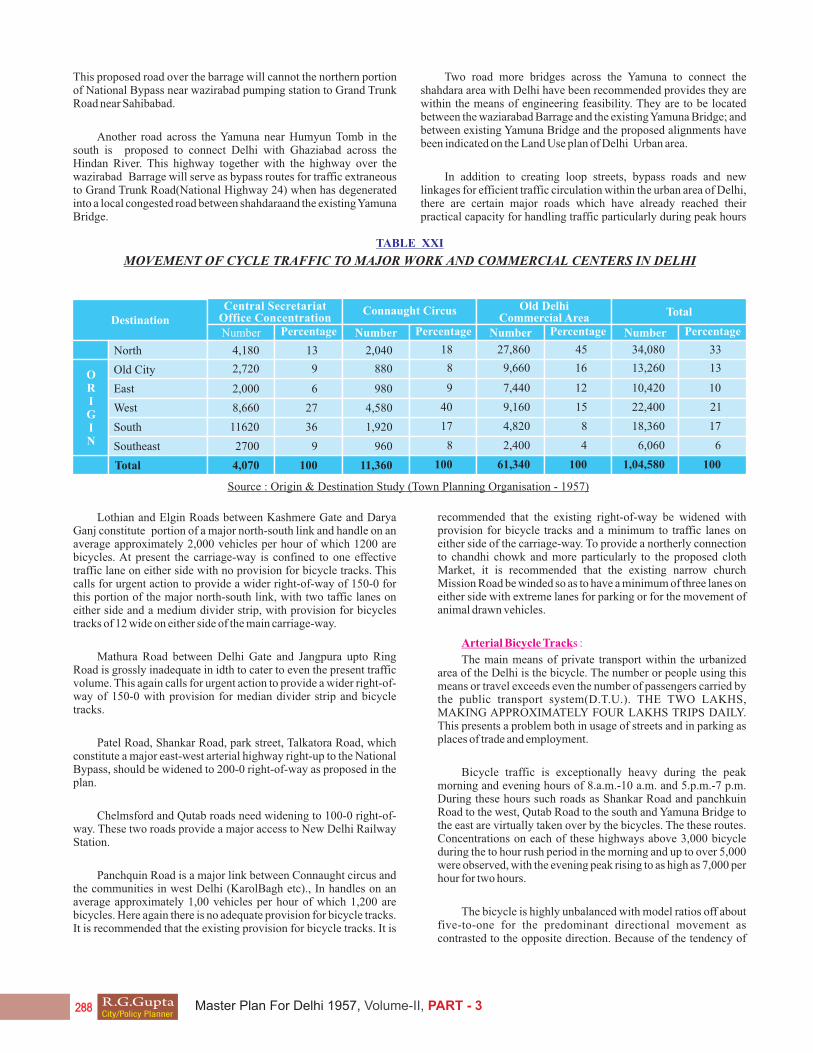
TABLE XXI
MOVEMENT OF CYCLE TRAFFIC TO MAJOR WORK AND COMMERCIAL CENTERS IN DELHI
Central SecretariatOffice Concentration
Connaught Circus Old Delhi Commercial Area Total
DestinationPercentageNumber
North
Old City
East
West
South
Total
ORIGIN Southeast
Number Percentage Number Percentage Number Percentage
4,180
2,720
2,000
8,660
11620
2700
4,070
13
9
6
27
36
9
100
18
8
9
40
17
8
100
45
16
12
15
8
4
100
33
13
10
21
17
6
100
2,040
880
980
4,580
1,920
960
11,360
27,860
9,660
7,440
9,160
4,820
2,400
61,340
34,080
13,260
10,420
22,400
18,360
6,060
1,04,580
Source : Origin & Destination Study (Town Planning Organisation - 1957)
Lothian and Elgin Roads between Kashmere Gate and Darya Ganj constitute portion of a major north-south link and handle on an average approximately 2,000 vehicles per hour of which 1200 are bicycles. At present the carriage-way is confined to one effective traffic lane on either side with no provision for bicycle tracks. This calls for urgent action to provide a wider right-of-way of 150-0 for this portion of the major north-south link, with two taffic lanes on either side and a medium divider strip, with provision for bicycles tracks of 12 wide on either side of the main carriage-way.
Mathura Road between Delhi Gate and Jangpura upto Ring Road is grossly inadequate in idth to cater to even the present traffic volume. This again calls for urgent action to provide a wider right-of-way of 150-0 with provision for median divider strip and bicycle tracks.
Patel Road, Shankar Road, park street, Talkatora Road, which constitute a major east-west arterial highway right-up to the National Bypass, should be widened to 200-0 right-of-way as proposed in the plan.
Chelmsford and Qutab roads need widening to 100-0 right-of-way. These two roads provide a major access to New Delhi Railway Station.
Panchquin Road is a major link between Connaught circus and the communities in west Delhi (KarolBagh etc)., In handles on an average approximately 1,00 vehicles per hour of which 1,200 are bicycles. Here again there is no adequate provision for bicycle tracks. It is recommended that the existing provision for bicycle tracks. It is
recommended that the existing right-of-way be widened with provision for bicycle tracks and a minimum to traffic lanes on either side of the carriage-way. To provide a northerly connection to chandhi chowk and more particularly to the proposed cloth Market, it is recommended that the existing narrow church Mission Road be winded so as to have a minimum of three lanes on either side with extreme lanes for parking or for the movement of animal drawn vehicles.
Arterial Bicycle Tracks :
The main means of private transport within the urbanized area of the Delhi is the bicycle. The number or people using this means or travel exceeds even the number of passengers carried by the public transport system(D.T.U.). THE TWO LAKHS, MAKING APPROXIMATELY FOUR LAKHS TRIPS DAILY. This presents a problem both in usage of streets and in parking as places of trade and employment.
Bicycle traffic is exceptionally heavy during the peak morning and evening hours of 8.a.m.-10 a.m. and 5.p.m.-7 p.m. During these hours such roads as Shankar Road and panchkuin Road to the west, Qutab Road to the south and Yamuna Bridge to the east are virtually taken over by the bicycles. The these routes. Concentrations on each of these highways above 3,000 bicycle during the to hour rush period in the morning and up to over 5,000 were observed, with the evening peak rising to as high as 7,000 per hour for two hours.
The bicycle is highly unbalanced with model ratios off about five-to-one for the predominant directional movement as contrasted to the opposite direction. Because of the tendency of
This proposed road over the barrage will cannot the northern portion of National Bypass near wazirabad pumping station to Grand Trunk Road near Sahibabad.
Another road across the Yamuna near Humyun Tomb in the south is proposed to connect Delhi with Ghaziabad across the Hindan River. This highway together with the highway over the wazirabad Barrage will serve as bypass routes for traffic extraneous to Grand Trunk Road(National Highway 24) when has degenerated into a local congested road between shahdaraand the existing Yamuna Bridge.
Two road more bridges across the Yamuna to connect the shahdara area with Delhi have been recommended provides they are within the means of engineering feasibility. They are to be located between the waziarabad Barrage and the existing Yamuna Bridge; and between existing Yamuna Bridge and the proposed alignments have been indicated on the Land Use plan of Delhi Urban area.
In addition to creating loop streets, bypass roads and new linkages for efficient traffic circulation within the urban area of Delhi, there are certain major roads which have already reached their practical capacity for handling traffic particularly during peak hours
R.G.GuptaCity/Policy Planner
Master Plan For Delhi 1957, Volume-II, PART - 3
cyclists to travel abreast of each other for company and to maintain a sped which carries them around animal-drawn vehicles, but requires metre-driven vehicles to pass them, they are significant factor in road congestion and a fruitful source of traffic accidents.
Experience in other with a large number of bicycles( Holland, Scandinavia, etc.,) suggests that specially designed arterial bicycle tracks apart form the vehicular carriage-way and pedestrian side walks would be useful in the Delhi Urban area. In Rotterdam and Amsterdam estimates have been made of one registered bicycle for every 2 to 3 people, which is even higher than the Delhi urban area, the latter bring more in the magnitude of one bicycle t every 8to 9 people.
With this view in mind it is proposed that arterial bicycle tracks be provided at existing bottlenecks west, south, and east entirely separate from the carriage-way.
The preponderant flow of bicycle traffic to Government offices at central secretariat and its environs is from vinay Nagar, Lodi colony, and Sewa Nagar, in the south, and Karol Bagh, Rajendra Nagar, Patel Nagar in the west. These two areas together generate 63% of the total bicycle traffic to central secretariat and its environs.
It is therefore recommended to construct arterial bicycle tracks from the south and west leading to the secretariat. The route in the southerly direction is along the eastern bank of Kushak Nala starting from Mehrauli raod, under the safdarjang railway line to King George Avenue leading to secretariat.
The second southerly route starts from sewa Nagar proceeding north along Avenue Iv in Lodi colony to Lodi estate road No.2, the January Marg, Hastings Road leading to secretariat.
The route in the westerly directions runs parallel to Patel Road, Shankar Road, thence through an underpass across the upper Ridge Road to Talkatora Raod and Secretariat.
The second westerly route leading to Connaught circus is along pusa Road, Link Road and panchkuin Road with a branch off along Ibbetaon Road, Market Road, Gole Market and Queen Mary Avenue to secretariat.
To the east, highest priority should be given to the scheme for canti- levering pedestrian and bicycle tracks(6-0 cantilever) at the road level of the Yamuna Bridge for handling bicycle traffic from residential areas to east of the river. Bicycle traffic from Yamuna Bridge going towards chandhi chowk, Connaught place, and secretariat should be channeled along the route following Eligin Road, new easterly link to walled city, the proposed inner lop between Minto and Harding Bridges to parliament street, and Connaught place via better bicycles tracks than existing to-day, since it carries quite a large volume of bicycle traffic.
The new arterial bicycle tracks, particularly the one to the south should have ea minimum right-of-way of 25-0 including five 3-0 wide bicycle lands and marginal strips for tire repairs tec. These tracks should be well lighted and paved. According to estimates based on experience in some European countries each lane such could handle about 1,000 bicycle per hour during the peak period.
Obviously it would be impossible to provide many arterial bicycle tracks. Hence they would be limited to main routes to avoid certain major bottlenecks and inter-sections. In new Delhi area many of the ordinary roads have ample right-of-way for local bicycle paths, separated from the carriage-way. One sahjahan Road for example, the well paved bicycle paths are used by about 90% of the cyclists. Whereas in other instances the marginal bicycle paths are virtually unused, either because of lack of smooth pavement or lack of curb to permit crossing at road intersections.
In addition to providing arterial tracks for movement, there is a parking problem for bicycle during working hours at centres of trade of employment. In large of buildings, whether government or commercial, adequate space within the buildings line should be provide for parking bicycles. Investigation of selected Government offices in the central secretariat area indicates a range of 60-70% of all employees come to work on bicycles. Few work centres even in the Government office area, provide adequate space within the building lines for parking of bicycles. In authorizing new buildings, standards should be set up to require adequate bicycle together with order vehicular parking within building lines. It is estimated that the requirements per lakh sq. feet of carpet space or per 2,000 employees would be approximately 54,000 sq.ft. of bicycle and automotive parking, of which a weighted acreage of about 60% is for bicycles alone.
Examination of traffic bottlenecks associated with railway level crossing.
The interference to road traffic by the long and frequent closure of railway level crossing gates at Rohtak road, Patel Road, Link Road between New and old Rohtaks Road, and approach road to okhla industrial Estate, call for high priority action to provide grade separations.
A Patel Road level crossing, records indicate the gate closure for an aggregate of seven hours per day, with closure of 20 to 30 minutes per hour between 7.00 a.m.and 10.a.m.; and the same between 6.00p.m. and 8.00p.m. At this level crossing the land slopes away from the railway embankment both east and west. A road underpass will be entirely feasible without steep grades.
At Rohtak Road level crossing, the records of gats closure indicate serious interference to vehicular traffic. Over a twenty-four hour period the gates remain closed for intervals aggregating nearly 9 hours: more particularly at certain hours such as 11.00 a.m. -12 noon and 4.00 p.m. -6.00 p.m. The gates are closed for 40-50 minutes out of every hour. This happens largely due to the shunting operations on to broad-gauge line in order to serve Delhi cloth Mills.
There are three distinct railway operations on four separate tracks across Rohatk Road at grade. The road is the main highway on the west and serves the Najafgarh Industrial Area.
The land west of the level crossing is lower than the railway tracks and slopes south and west. However, the land to the east rises and parallels a rocky hill on the south side, where rok crushers are in operation. Since it is impractical for Rohtak Road to underpass the railway tracks, the most feasible and economic solution for eliminating the level crossing would be an overpass. On the easterly and earth fill would be minimized by shifting Rohtak road slightly to the south to follow the contour of hill side which rises within a few
R.G.GuptaCity/Policy Planner
Master Plan For Delhi 1957, Volume-II, PART - 3
feet to a contour of 750 or about 10 feet higher than the existing road level. To the west it would be necessary to carry the viaduct over four railway tracks. The present intersection between Najafgarh Road and New Rohtak Road would have to be abandoned and a connection made at the existing roundabout where the old Rohtak Road branches off and under-passes the east-west railway line.
The link road between old and New Roahtak Roads past sarai Rohilla Station crosses one broad and two meter-gauge tracks, each set with level crossing gates. The broad gauged track to the north is on an embankment. To eliminate this level crossing problem, road overpass seems to be the only solution. Possibly, the broad-gauge embankment could be lowered slightly all the way to Daya Basti station and cantonment line crossing over Roahtak Road, in order to ease the overpass road grades at both points.
While no traffic counts were available for the level crossing of approach road from Mathura Raod to Okhla Industrial Estate, observations indicate that since this being the only access to the Estate from Mathura Road at present, a heavy volume of traffic passes across the level crossing. To eliminate the level crossing, a road overpass is therefore recommended.
Rod Intersection Improvements.
The principal factor militating against the free flow of traffic in Delhi urban is the congestion and delay due to inadequate or faulty layout of road intersections. Majority of the traffi9c accidents in Delhi occur at road intersections. A proper design of road intersections is therefore a matter of prime importance in relation to both traffic and safety.
At every intersections at grade and more so0 at those which are heavily trafficked, traffic needs to be channelized. Channelisation of intersection at grade is the separation of regulation of conflicting traffic movements into deficits paths or channels of travel. This is done by the use of pavementmarkings, raised islands or other suitable means to pedestrians. Through there are many such road intersections in the Delhi urban area that need improvement for better and efficient channelization of traffic, prototype design of intersections at Minto road and Connaught place; Queen Road and Kauriya pul Raod, Ajmere Gate and Mathura Road and Wellesley Road, indicating the regulated flow of traffic and turing movements have been illustrated.
ROAD TRANSPORT TERMINALS
Apart from the railway terminal expansion previously discussed, there is a pressing need for an adequate system of terminals to accommodate road transport. These are :-
1) Interstate bus terminals and between trips idle parking areas.
2) Areas for goods forwarding, assembly, and loading and unloading parcels, handled by for-hire road carriers in mixed loads; separate parking areas for road transport convenient to but outside of the densely congested section where goods road carriers can park between trips. These idle parking areas should be equipped with servicing facilities for fuel and light running repairs and accommodation and amenities for driver personal. They should have a telephone communication centre houses offering fuel truck loads so that trucks can be ordered in only when consignments are available for immediate loading.
3) Completely modernized wholesale fresh fruit and vegetables markets for receipt and distribution of commodities by truck, both long distance and local delivery from nearby railway yards. Such markets would have to have not only receiving and distribution platforms but storage structure for temporary carryover of produce and display and sale in wholesale lots. Some public cold storage warehousing is needed but might be located more economically at the nearby railway yards,, depending upo the preponderance of inbound movements for such produce as between rail and road.
Interstate passenger Bus Terminals
A survey of the passenger road transport requirements conducted in August 1958 by the Town planning Organization indicated that there are approximately 70 bus lines operating roughly 600 trips per day in and out of Delhi. The preponderance of these operates from and to the east and north. The existing terminal points which are for the most part located in the vicinity of Delhi Main station and to a lesser extent at church Mission Road, Ajmeri Gate and Thompson Road are entirely inadequate, incapable of expansion and a serious factor in street congestion. There are absolutely no facilities for passenger waiting rooms, loading and unloading platform, toilets and other passenger amenities.
Four sites of about 10 acres each for handling loading and discharge of passengers, luggage and paroels, have been recommended and are located convenient to the main interstates bus routes. The sites are as follows;-
1) Outside Kashmere Gate adjoining Bela Road between city wall and the proposed arterial link connecting National Bypass.
2) South of Idgah near jhandwalan;
3) North of central Road Research Institute on Mathura Road;
4) Near shahdara Railway station, between Railway line and G.T.Road.
5) It is recommended that all the proposed terminals, with the exception of the one outside the Kashmere Gate, will have idle parking when the buses are not engaged in active operation, within thye bterminal area whereas the terminal outside Kashmere Gate will have its idle parking for buses, east of the sanitary drain between the National Bypass and the western Bund of the Yamuna River. This site would be developed also for parking and servicing goods trucks and would constitute a productive use of idle land which is now available in abundance inthat area.
Goods parcels Terminal :
Terminal area for loading and discharging goods parcels are also recommended. At present the godowns of the forwarding and booking agencies are scattered throughout, the densely congested areas including Naya Bazaar, G.B. Road, Queens Road and Lahori Gate. There are over 100booking agents estimated to handle approximately 150 loads of 30,000 maunds per day outbound through the godowns. These loads represent an important portion of approximately 500 total road trips in each direction made by road transport units each day. The balance of the trips represent solid leads of steel, grains, timber, fruits and vegetables, etc., which move directly to and from markets of consignees or shipper places of business rather than through the booking agent premises.
R.G.GuptaCity/Policy Planner
Master Plan For Delhi 1957, Volume-II, PART - 3
Not only ate the present godowns inadequate and obsolete but there is practically no room for truck loading and unloading and idle parking expect on the streets. Substantially all of the trucks require space to park between trips and congest the near by highway and roads, risking summons for illegal parking, time lost for appearance in court and expense of paying fines.
Suitable sites for the offices and godowns of the booking and forwarding agents are recommended, one in the Motia Khan area south of Idgah Road with a minimum of 10 acres, but convenient to road access which should be developed to a well-planed goods terminal area. Another site of about 50 acres is proposed in the Shahdara Area, west of the proposed airport road and north of the proposed National Highway (N0.24) bypass, both for goods terminal and idle parking for trucks between trips.
Apart from the sites proposed for goods terminals, there sites of about 10 acres each for parking trucks between trips, servicing of vehicles and accommodations for drivers, with a telephone centre communication with the booking agents should be provided. These sites are as follows :1) Near Azadpur police station on Grand Truck Road to Ambala :11) Between Ring Road and Lawrence Road, and north of Rohatk Road in the vicinity of Nangal power station: 111) near okhla Industrial Estate on Mathura Road. This last idle parking area of trucks will be more effective , when the proposed wholesale market in the south of Delhi develops.
Wholesale Fresh Fruit and vegetables Markets :
The present wholesale fresh fruit and vegetables markets in Delhi is located immediately adjacent to the Grand Trunk Road in subzimandi. It consist of two enclosures, one devoted to fruits and the other to vegetables. It was constructed in 1942 and observations indicate that it is poorly designed to perform its present day function and many of thr interior platforms and storage areas which are inaccessible to road transport are wasted. The whole market is entirely inadequate and obsolete. Road vehicle access is available only to the perimeter of each enclosure with the result that trucking operations have spilled over the adjoining open plaza and constitute major impediment to effective circulation the Grand Trunk Road in this vicinity.
The problem of the wholesale fresh fruit and vegetables market in Delhi is closely related to both the roads and railway transport programme. As mentioned earlier under Railway Transport recommendations, facilities of delivery of rail receipts of fresh fruit and vegetables has been provided as New Delhi Railway Station, accessible from Qutab Road. Here suitable platform space for auction sales an direct redistribution to outlying regional points should be provided. In this connection it is recommended that the wholesale fruit and vegetable trading area be provided at the existing subzimandi . The subzimandi as it exists is inefficient in so far the handing of fruit and ve4getable are concerned. Hence it order to make efficient use of the and occupied be this market, it will have to be redeveloped into a modernized wholesale market.
This will facilities the organization for receipt, auctioning and early morning disposal 0of the daily supply which is so essential for organized trading of this nature in any large metropolitan markets, the world over . in this connection, it should be emphasized that trading operations at this modernized market, should be confined to auctioning sales from small stalls to retailers and consumer and consumers should be handled elsewhere at numerous trading centres,
of which there are at kleast seven (phool,Mandi, Ajmal Khan, Road in Karol Bagh, INA colony, Sewa Nagar, Bhopla, shahdar, Motinagar etc.,) Auctioning and wholesaling of fruit and vegetable not meant for Delhi Consumptions should be operated at the railway siding.
Two more wholesale markets for fruit and vegetables have been proposed. One near Daya Basti Railway Station of about Ten acres in area and the other near okhla Railway station measuring about twenty acres in area.
The neighbourhood semi-wholesale markets should also be developed as direct receipt points for truck loads of the more durable vegetables (e.g. potatoes, onions, cabbage, cauliflower etc) which the semi—wholesalers can handle and temporarily store in relatively large quantities. In these semi-wholesale markets, neighborhoods distributors, buying in substantial quantity at present in subzimandi, can resell in small lots to local retailers.
Because of the peculiar nature of fruit and vegetable handling and trading and its bearing on two significant problized deliveries versus continued deliveries to a central to a central wholesale trading area and the question of the best location for such a central wholesale trading area, a detailed report was made by the Town planning organization, in February 1959to throw light on these problems. The survey found that substantially al of the fruit and about 80% of the vegetables are old at wholesale in one central wholesale market (subzimandi). About 20% of the vegetables go direct t phool Mandi market in Old Delhi. Scattered but small receipts of seasonal vegetables in small volume move directly from local fields to area retail markets lying on the rural-urban fringe of Greater Delhi, which however, are supplied primarily from subzimandi. The subzimandi wholesale market is the main price-making centre for the centre region and most of the supplies are shipped into that area market supplying the retailers by rehires. Most of these move early I the morning or in the afternoon and only 20% during the peak hour of other highway traffic. Hence the traffic problem created in the fruit and vegetable distribution is due more to the poor functional design and utilization of the subzimandi market than to the highway movement between that market and the neighbourhood trading centres.
Since most of the cold storage operations related to fruits or potatoes, which are in the main brought in by railway transport, it is more logical to provide cold storage areas adjacent to the rail terminal. It may be necessary also to provide at the rail terminal, platforms for certain suctioning of commodities received and sold in carloads which are reshipped immediately to the surrounding markets. However, it is anticipated that most of the selling for local Delhi area consumption would continue to take place at the modernized wholesale market.
Local passenger Mass Transit Services :
The problem of handling people locally within the Delhi urbanized area falls mainly on the common carrier bus system or upon private transport, principally by bicycle. Only about 20% of local travel now uses the bus system. If the number of available buses expands, the bus riding habit is expected to continue to increase substantially and the Delhi Road Transport Undertaking is proposing to double the available seat capacity.
R.G.GuptaCity/Policy Planner
Master Plan For Delhi 1957, Volume-II, PART - 3

TABLE XXII
Inter-urban passenger Movement classified by
made of conveyance.**
ModesNo. of Passengers
Trips HandledPercentageSr.
No.
1.
2.
3.
4.
5.
6.
7.
8.
9.
10.
11.
12.
Total
Bicycles 4,00,000 36.0
21.0
12.6
10.1
4.4
4.0
3.8
3.8
1.5
1.4
1.0
0.4
100.0
2,40,000
1,36,000
1,10,500
11,31,400
60,000
45,000
42,400
42,000
14,000
15,000
12,000
6,000
D.T.U. Buses
Tongas
Private Cars
Taxis
Scooter Rickshaws
4 Seater Motor Rickshaws
Cycle Rickshaws
Tramways
Private Buses
Motor Cycles and Scooters
Railways
**Source - Origin and Destination survey of Traffic in Urban Delhi-1957
Data obtained from Delhi Transport Undertaking for
year 1957.
However, as pointed out earlier, the street congestion and the concentration of loading at certain points during the peak journey to-work hours presents a number of problems which are beyond the mere expansion of carrier equipment. The utilization of buses in term of average bus miles per day has shown a tendency to decrease with growing street congestion and the introduction of larger capacity buses is somewhat inhibited by maneuvering limitations.
The important elements which are matters of public planning and somewhat the control of the Delhi Transport Undertaking itself are the provision of adequate highways which will permit by-passing the extreme centres of congestion by peripheral routes designed to connect housing centres with work centres and the provision off- street loading areas in which accumulations of bus passengers can be safety accomplished without peril to the passengers and without hindrance to the flow of vehicular traffic. It is obvious that the Ring Road and Loop system designed to circulate fast-moving traffic around the central congested areas will offer an opportunity to eliminate some of the worst congested centre delays and slow- downs in bus transportation, and make possible utilization of the larger and more efficient bus types. Thus, one of the primary benefits of the Ring Roads will be to improve the common carrier bus services.
To improve the rush hour loading situation and to provide accumulation points for empy bus equipment off street parking and loading areas are need at selected points. Since these are most needed at points of heaviest employment density and consequently areas of highest land values and will be utilized for only a limited number of hours each, day, the economic feasibility aspect suggests that they be combined with other terminal and land usage projects which will absorb part of the cost. Specific projects are recommended under the heading Road Transport Terminals. The present most concentrated areas of rush hour passenger embarkation are in the vicinity of the secretariat and Connaught circus but undoubtedly others will develop.
Within the Delhi in Road Transport Undertaking administration itself, steps can be taken strengthen the usefulness of the common carrier transport system booth immediately and also in anticipation of the improved highway circulation and off- street loading area development.
One of these is to set up a department of planning and scheduling to make a continuous study of how to fit bus scheduling to passenger demand and to avoid where possible unduly congested of inadequate highways. Such studies as are carried on in this field today are the responsibility of the Traffic Manger in charge of operations with the aid of inspectors who make periodic observations of passenger loading, queue accumulations and physical limitations such s inadequate bus turning radii, etc. However, this is done as an incident to the work administrative official who is heavily engaged in handling day-to-day operations, including personnel relations and discipline and requires more continuous study and attention than can he give it. It should be the continuous responsibility of a competent executive with time and personnel relations and discipline and requires more continuous study and attention than he can give it. It should be the continuous responsibility of a competent executive with time and personnel adequate to do a real planning job. In Bombay the publicly-owned and operated Bombay Electric supply and Tramways company (BEST), which handles 900,000 passengers per day, has such a department of planning and scheduling, and conducts regular surveys of bus passenger waiting time, setting up of shuttle services between heavy density points, and planning of empty bus accumulations areas during rush hours. A similar department in the Delhi Transport Undertaking would be of great value not only under present conditions but even more as the Ring Road and Loop system take form.
There is also a special problem in Old Delhi of replacement for the obsolete tramway system which now operates 'two routes aggregating approximately five miles from Jama Masjid through chandani chowk and Naya Bazaar to subzimandi. The tram car are old and worn out should be retired. They maintain an average speed of about three miles per hour and the volume of passengers has steadily declined each year. It is impractical because of the narrow streets and sharp curves to replace these trams with standard buses. There is need for-east-west common carrier transportation in this area among other things to feed the north-south bus routes at each end. It is recommended that consideration be given to replacing he tramways with narrow and manoeubeable vehicles. It is possible that motor-cycle rickshaw routes could be established as a means of local services to the people of the ea and as a feeder to north-south bus lines. The motor cycle rickshaws which has rapidly grown in recent years are steadily on decline. Today they operate on routes paralleling DTU buses and compete for both road and curb space. But they will have a lesser public value as the bus service expands. Hence, the motorcycle rickshaws could perform a valuable function where bus operation is impossible, since they occupy very little street space and have a much smaller turning radius.
Off-street Local (DTU) Bus Loading Areas:
The peak hour queue waiting time at heavy passenger loading points will not only require more seat capacity(more and larger buses as programme) but also off- street accumulation and loading points from which to pick up passengers in empty extra bus schedules. In the evening rush hours as Many as of the buses were already loaded to capacity when they arrived at the loading stands. Delays to vehicular traffic and danger to passengers were obvious.
R.G.GuptaCity/Policy Planner
Master Plan For Delhi 1957, Volume-II, PART - 3
To help alleviate the situation, a shuttle bus service to Karol Bagh was instituted, following the precedent in Bombay where empty buses are accumulated empty equipment in the side streets near Flora Fountain for a peak hour shuttle service is of less than two miles to the opera House station, the problem in New Delhi is more difficult. There are no side streets at Connaught circus in which empty buses to a accumulated in quantity and a short shuttle service to a dense housing area is not feasible the same degree.
However some areas in the south east portion of Connaught place Extension may be found out for such a use, in addition to the land adjoining the Minto Bridge Railway station. These should be developed as loading points for passengers and also serve as places for accumulating extra rush hour bus requirements for Connaught circus area. Such terminals would do much to provide a safe loading point for bus passengers, adequate to move the heavy passenger load high-priced properties and their utilization solely as a peak period bus passenger loading point could scarcely be self- supporting. These properties should be developed as multipurpose use, including the off-street local bus loading, a shopping centres and multi-storey offices building, together with some vehicular parking provision. Subject to a more detailed economic feasibility study, it is quite possible that the revenue from all of these sources would be adequate to provide a basis for its development as a self-supporting project.
To handle peak hour loads at central secretariat, Old Delhi Main Station, Red Fort and Kashmere Gate similar off-street loading stations and accumulation areas area recommended. High density residential areas such as viney Nagar in the south and Karol Bagh in the west should be provided with off street loading points for handling morning peak hour traffic. The bus service can also be speeded up by establishing fewer, but better curb spaces in heavy loading areas and by strict policing to keep these stations clear of interference at peak hours.
Future Mass Transit prospects :
Today the principal reliance of public transport in Delhi is on DTU buses. The movement on the railway is small, because the stations are not generally located close to final destinations of most of the travelers. The heavy density passenger loading points in Delhi are diffused rather tan concentrated on a limited area as in the case of Bombay for example. The main line of concentrated passenger movement today is north-south between New Delhi station, Connaught place and central secretariat. To provide mass rapid transit at this line would require an electrified subway type of operation integrated with railways. But the ability to achieve such a solution is undoubtedly limited by heavy capital expenditure, present lack of adequate of electrical power, and problems of protection from seepage on account of the high water table in Delhi. However, such a programme should be explored for the future when a substantial increase in traffic ill/justify an expenditure of Rs. 4 crore per mile; but it is obviously no short range project.
Utilizing the circular Railway, which is today completed only up to Moti Bagh, as a local mass transit system for local passenger movement has a limited value under the present conditions, since it would not reach the existing heavy density destination points in Urban Delhi, However, with the future proposals, in the Master plan for Delhi Region for deconcentrating government and industrial employment centres and further expansion of urban limits the scheme for completing the circular railway should be pushed onward as then it will perform a valuable function of providing possible
perimeter connection for local passengers between new government centres, housing colonies and industries when they develop within the next/ twenty year period.
The circular Railway apart from providing connections between local employment centres and residential areas, will also be of great utility for regional passenger traffic that comes to local Delhi : since the four main lines e.g., Ambala Line, Lucknow line, Agra Line, cantonment line, and the proposed railway line across Yamuna River are connected t the circular Railway.
It is recommended that until electrification of railways in the Delhi Area, diesel-engine doubled-ended cars should be employed as means of mass transit, in order to out down the engine turnaround time.
It is not physically possible to provide an unified system of local mass transit system in Urban Delhi. Hence rail transit together with local bus service could furnish the type of mass transit which is necessary for meeting the requirements of the future increase in passengers.
NEED FOR A DEPARTMENT OF TRAFFIC ;
Aside from constructing new major circulations and terminal facilities as recommended, the traffic problems of Delhi Urban Area require a continuous attack on a large number of miscellaneous items of inter-section traffic control, law enforcement, traffic education, pedestrian control, traffic signs and signals, street lighting and other matters. Substantially all large urban areas throughout the world of a size similar to Delhi have found it necessary to establish a department of traffic under an experienced traffic engineer with an adequate staff familiar with the modern technique in planning effective road circulation, pedestrian control, accident prevention and traffic education and enforcement.
The situation in Delhi is somewhat complicated by the fact that there is diffusion of responsibility in at least three jurisdictions. The control of police and their law enforcement is in the hands of the chief commissioner of the Delhi Administration. While the decisions as to street widening, intersection design, signals, street lighting, etc., in New Delhi are under the New Delhi Municipal committee, those areas outside of New Delhi, the Municipal corporation holds the responsibility.
At present the regulations of funicular traffic and the control of pedestrians at important intersections is handled by the traffic police. However, there is no programme under single responsible department, of either New Delhi, Municipal committee or the Municipal corporation of Delhi, charged with the duty of taking constructive steps to adept the road system inter-sections,, cycle paths. Traffic signals etc. to the requirements of the present day traffic and pedestrian movement. Because of the divided responsibility between New Delhi and the remaining area and the lodgment of police control in the Union Government Administration, a considerable degree of effective liason may be necessary to achieve a unified attack on these problems. Moreover the top level responsibilities may be divided, the most effective attack on these problems could be carried on by a single staff under a trained traffic engineer in making studies and recommended as to traffic improvements and regulations, with enforcement continuing to be lodged in the police and law enforcement officers.
R.G.GuptaCity/Policy Planner
Master Plan For Delhi 1957, Volume-II, PART - 3

An illustration of the kind of problems which a Traffic Department would be expected to handle would be recommendations for carriageways widening; redesign of substitution of traffic signals for roundabout of les than minimum efficiency; provision of physical channels for facilitating traffic movements at important intersections, together with such items as pedestrian crossings; designation of local parking or no parking areas; recommendations as to improved street lighting and determination of the most pressing priorities for such improvements on the basis of continuing quantitative observation of vehicular and pedestrian traffic.
STAGGERING OF WORK HOURS:
Another important phase, for improving traffic conditions in urban Delhi, is the staggering of work hours so as to distribute peak hour traffic lead over a longer period, thus reducing the peak hour congestion. Analysis of the peak hour traffic in Delhi indicate that out of more than 11.5 lakh. Intra-ur5bantrips per day, 50 to 60 per cent of the travel is concentrated, from Monday through Friday, in two morning peak and two evening peak hours.
While the device of staggering work hours does not reduce the number of journeys nor the amount of fares, it relives rush-hour traffic. A great deal of strain of journey to –work, is due to the fact that thousand of workers hurry to their employment centres, simultaneously. If the cataract of workers arriving at conventional time can be regulated into an even flow over an extended period, many of the difficulties of traffic and transportation will be eliminated. Less crowding within buses and less wafting and queuing will consequently a reduction in travel time.
BUDGETING AND FINANCING OF CAPITAL IMPROVEMENTS :
In general, the several categories of recommendations for improvements carry different responsibilities for financing and budgeting. The aerodromes railways and National Highways fail generally into the finance budgets of the Union Government. It is probable that some of the main highway improvements within the Delhi area may also be shared by the Union Government. This would apply among other things to the railways share in separation of road and rail level crossing, the improvements of portions of the National Highways which are integrated into the Ring Road and Loop system, and street improvements essential to a functioning of Delhi as a national capital.
Road transport terminals such as the interstate bus terminal, forwarding and booking agencies goods assembly area, the road transport parking an dservicing area between the National By-pass and the Yamuna River Bund, the modernized road terminal- wholesale fruit and vegetable market all offer possibility of self-supporting financing based on charges. However, to provide a financing and administrative agency capable of providing flexible land usage and business like arrangements for revenue from lessees and user fees, the device a public statutory corporation offers distinct possibilities. Creation of a Terminal Development Authority of this type, administered by unpaid commissioners experienced in the management of corporate as well as government affairs, has many precedents throughout the world. Apart from basic policy decisions made by the commissioner a day-to-day administration should be in the hands of a professionally experienced general manager and staff qualified to plan and excute self-supporting projects. The Authority should be vested with such rights as exemption from taxation and the power to make appropriate contracts in its own name, to retain its
revenue and to pledge them and the accumulated reserves to the servicing of revenue bonds, bank loans and similar financial instruments without impairment of these contracts by some higher authority. Control in the public interest of the action of the Terminal Development Authority Commissioner could be preserved by veto of their acts of removal for cause by government officers appointing them, but the establishing of a credit base for self- supporting financing would not be impaired once contracts had been made unless fraud or maifeasance is involved.
This type of administrative and financing of projects of a terminal development character which offers opportunity for self-support from user revenues would almost automatically force well-planned and well-conceived ventures not only from a functional standpoint but also from an economic feasibility standpoint and would avoid throwing additional burdens upon the tax resources of the Union or Municipal Corporation.
Apart from the numerous precedents for such Authority type of financing and administration found throughout the world, the operation of the Delhi Road Transport Undertaking and the Bombay B.E.S.T. are relevant Indian examples. The severance of such terminal projects, which require long term commitments if they are to be handled on a business like basis from the impact of reversals in policies and major personnel shifts arising out of political charges is of paramount importance if the goal of economic feasibility and self- support is to be achieved.
DETAILED TRANSPORT PLANNING PROCEDURES :
Although this chapter attempts to be as specific as possible in recommending the functional character of the transport improvement phases of Delhi planning and offers certain standards of design and suggestions as to the approach to economic feasibility, it cannot possibly lay down exact specifications, cost estimates and prognostications of economic feasibility for each project.
It is, therefore, appropriate to review the steps intended to translate general transport planning into specify project planning. An illustration, to make the point, would be the proposed intercity bus terminal. A site of approximately5 acres is suggested in the vicinity of Kashmere Gate and some general estimates presented as to the number of bus movements which might be expected to utilizes such a terminal. In order t0o plan intelligently the exact development of such a terminal in terms of required number of loading spaces (related to hourly demand) space for passenger queues, waiting room accommodations, passenger amenities (toilets, parcel lockers, eating establishments) and space for express consumer services such as small shops, bus company booking offices, etc., a much more precise requirements study is needed. This would have to assemble data upon which to calculate design planning, which would insure the best approximation of space requirements and location to prevent bottlenecks in bus and pedestrian flow and to provide the maximum of revenue contributing income. Based on such a requirements study there would then have to be prepared an architectural engineering design and capital and operating revenue would be sufficient to carry the annual service of the capital costs, preparatory to financing on a self-supporting basis. Then a final determination can be made as to executing the project, either by self-supporting financing or with some cushion support from tax sources.
The above example illustrates the procedure which has to be followed on any major terminal improvement, whether it be the intercity bus terminal project or the various other terminals which would normally be classed add potentially self-supporting.
R.G.GuptaCity/Policy Planner
Master Plan For Delhi 1957, Volume-II, PART - 3
In the case old projects which either for economic or policy reasons cannot be directly supported from user revenues and these include the Ring Roads, arterial bicycle paths and radial highways, the main difference from the above procedure would be in the economic feasibility sector. Here the decision to go forward must be based not upon anticipated direct user revenue but rather calculations as to savings in time vehicles mileage, accident prevention, all tangible but indirect benefits which are reflected in lowered costs of transport, reduction in injury and loss of life, increased ratable o enhance tax resources. The procedures for making these evaluations which have been established by the U.S. Bureau of public Roads and comparable agencies in the United Kingdom are in wide use among highway traffic engineers. A substantial literature in developing and applying economic feasibility to projected highway improvements and calculating the resultant benefits exist in the professional reports not only in the two countries mentioned but also in western continental countries, such as France, Germany and Scandinavia, and to some extent in Japan. The General Road Research Institute in Delhi would be familiar with these sources.
INTER-RELATION OF HOUSING, INDUSTRIAL AND GOVERNMENT SITE LOCATION, AS THEY AFFECT TRANSPORT :
It is obvious that the journey to work is a major element in generating daily travel, particularly during peak hours. To the extent that living quarters of employees are widely separated or diffused from places of employment, the amount of travel is increased. To the extent that housing can be combined in reasonable proximity to places of employment the time and cost of transporting people is minimized.
Since housing is to a large extent provided as an incident to Government and other employments., much of the development of housing, even during the days of the British Raj, was planned by the Government to accommodate civil servants, railway employees and others. Also, small industry has been to a substantial degree on a house hold basis and large industries often provided accommodations for employees within their compounds. Even new housing, such as
that of the Delhi Road Transport Undertaking for its employees, for example is, being located close to main bus depots and priorities given to drivers on the first shift to obviate the necessity of utilizing buses to bring drivers to work. While such a policy has advantages in tuing together employee housing and places of employment geographically, it is debatable whether such policy can or should be of prime consideration in planning future transport uses. Certain countervailing disadvantages arise, as exemplified by the objection to utilizing land immediately adjacent to the rail lines for strips railway employee housing. Much small industry will gravitate from household units to industrial estate designed to provide better access to electrical, goods transport, and raw material sources. It would be unfortunate to insist too rigidly on locating housing either for the government, industrial or either employees immediately adjacent to places of employment. Attempts to establish a primary norm for all land use planning based on this principal neglects the very human desire for flexibility of choice in a home related to family needs for rearing children, access to land for garden cultivation and recreation, choice of schooling opportunities and social association with relatives and friends. Since a significant portion of vehicular travel(25% on week-days but nearly 100on week- ends and holidays) takes place for other than journey- to-work, too attention to proximity for this journey-to-work segment alone may actually increase the circulation requirements to achieve other purposes. However, it is obvious that where major places of employment are set up by relocation of government or industry units, efforts should be made to earmark land in the vicinity for adequate housing.
Another site planning principle related to traffic is the decentralization of employment centre from certain areas such as the central vista. Such Government functions as are not immediately related to the day-to-day policy-making should not be crowded into the area immediately east of the secretariat, merely because it is government centre. These matters are discussed at greater length in other chapters of this report and need not be handled in detail here.
Apart from the problem of minimizing, to the extent possible, unnecessary concentration of large employment centers, it is important that the internal circulation system of industrial estates and large area.
R.G.GuptaCity/Policy Planner
Master Plan For Delhi 1957, Volume-II, PART - 3

CHAPTER THIRTEEN
PUBLIC UTILITIES AND SERVICES
INTRODUCTION :Adequate water and power, drainage and sewerage facilities are
the basic needs of urban life. Their standards, of course, very according to climate, economic and other conditions. But in India, of the towns having a population of one lakhs and above, only about 50% have a fully protected water supply. Most of them lack hinter grated sewerage facilities and where any sewerage system exists, the the disposal is not always up to the highest standards. With rapid urban growth, additional problems of waste disposal are created. The demand for power will also continue to rise with increased industrialization.
The doubling of the population of Delhi during the decade 1941-51 has over-burdened all the services to a braking point. Water supply, a major component of public utilities, has been particularly affected. Even with substantial increase in water supply, the crisis continued unabated and many new areas that have sprung up after independence could not be provided with piped water. Though the supply of water was increased to some extent from time to time, the sewerage system did not expand part passu with the result about 50% of the raw sewage overflowed into the river Yamuna at various places- polluting the only drinking water source. Shortage of power for domestic and industrial requirements is equally serious, adding up to the current deficit of 40,000 kw.
It is, therefore, necessary that attention should be given to these problems and the declining standard of services should be raised through planned development. In this pursuit, sources of power and water will have to be augmented on a comprehensive basis. This chapter deals with the whole problem of public utilities and presents plan for their development. It is divided into The following five parts:
Part I water supply
Part II Sewerage
Part III Water Disposal
Part Iv Electricity
Part v Gas
Gas is being suggested as a new utility in Delhi. The section of Gas analyses the economics of Gas and soft coke in the context of the present domestic fuel pattern and presents a case for substitution of expensive commercial fuels by soft coke and gas: the two bye-products of the carbonization of coal.
It may be seen later, that augmentation of services has been proposed for a figure of 5 million while the Delhi Urban population by 1981 as distributed in the population chapter is only 4.6 million. This extra cushion of 4 lkahs of people is to meet any contingency that may arise in future due to unforeseen additional demand in various physical sectors.
PART I- WATER SUPPLY
EXISTING SOURCE AND DISTRIBUTION
Filtered water supply for Delhi was first started in 1890 with its
in 1890 with its source from the infiltration galleries, laid on the bed of river Yamuna behind the old Secretariat. Then the total supply was only 1.73 million gallons per day. In 1912 the Government of India wanted to set up its new capital in New Delhi and an increase in water supply became essential. Later in 1925, a new water works was installed near Wazirabad village and the intake works were shifted from near the Old Secretariat. To meet the growing demands, an additional intake was provided during the war years and the capacity was increased to 28 million gallons per day. The augmentation of the source has since been taken up and the total water out put now is about 90 MGD. Due to post per day capacity. As it is situated on the down stream side of the city, this source undergoes pollution threatening public health.
At present raw water from the Wazirabad intakes is treated at the filtration plants located near Chandrawal. The head works at Wazirabad suffer from two major setbacks (a) reduction of flow in the river during the three summer months (b) change in the direction of~~the river course during floods from the right to the left bank. However, the change in direction of the river course has been rectified by the construction of a barrage on the down stream of the Wazirabad intakes. But the problem of reduction in flow of water during summer will still remain and the Punjab G-overnment have been obliging the Delhi Municipal Corporation by releasing about 130 qusecs of water from their irrigational net work, as the average summer flow in the river is only 50 qusecs. Water for irrigation to Punjab & U.P. is diverted from the Tajewala Dam to the Eastern and Western Yamuna canals and no surplus water is released into the river Yamuna for Delhi's water supply. As such the water that is avail able near Wazirabad is due to regeneration between Tajewala and Wazirabad.
The water after treatment is distributed to various parts of the city through storage reservoirs, all located on the ridge. The presence of the ridge gives the necessary "hydrostatic pressure without any need for elevated reservoirs. Today the total storage is about 25 million gallons which is about a third of the total daily supply. The total water supply is inadequate for the present population. The average per capita ̂ supply in the areas served is only 40 gallons per day which, of course, conceals great differentials in the levels of supply in various localities. Out of the, present population, only about 15 lakhs of people get continuous water supply. Four lakhs of people living in new colonies such as Rajendra Nagar, Patel Nagar, Lajpat Nagar and Defence Colony etc. have only intermittent water supply. At the same time, with the housing construction activity in South and West Delhi, new colonies are "being added to the city, adding to the current deficit of protected water. Besides, there are many slums in the city where scarcity of water has become an old cry. It is thus clear that unless urgent steps are taken to augment the source and distribution of water supply many more areas will- fall inside the net of substandard development.
STANDARD FOR WATER SUPPLY METROPOLITAN AREAS
A comparative study of the water supply position in ten major Indian cities was made by this organisation to evaluate the economics
R.G.GuptaCity/Policy Planner
Master Plan For Delhi 1957, Volume-II, PART - 3
and operation of the various systems in practice. The survey indicated that cities like Kanpur, Hyderabad, Lucknow and Calcutta have a per capita supply varying from 30 to 40 gallons per day. Bombay city has a greater per capita supply of 48 gallons per day; the sources are from four clear water lakes namely Tansa, Vaiiarna, Vehar and Tulsi situated at distances varying from 20 to 70 miles from the city. Bombay's higher consumption of water has to be attributed to the additional demand of water for its industries. Calcutta has a supply of only 32 gallons per capita though it has a huge source of river water supply of only 14.5 gallons per capita and Banaras 45 gallons.
Most of the cities have their sources of supply from rivers and lakes, while tube wells form a secondary source of supply. Except for Calcutta, Bombay and Bangalore the rest of the cities have their sources within 10 miles of the city. Only Delhi, Kanpur, Varnasi and Luc know have 24 hours water supply; Agra has 18 hours of supply; the rest of the cities have less than 10 hours supply. Table No. 1 presents the summary of total supply, source, quantum of supply, hours of distribution, demand for water for domestic and non-domestic uses and the average per capita water supply per day in all the ten major cities surveyed.
Of the cities surveyed the percentage storage of clear water for distribution, varies from 6% to 41% but on an average most of the cities have storage capacities varying from 20% to 35%. In all the cities domestic requirement forms the major part of the total water supplied. The consumption of water in industry is highest in the case of Bombay; Delhi runs second, Calcutta third and Kanpur fourth.
A study was conducted on the requirements of water in Delhi for various uses: domestic, industrial and public, and it was found that a per capita^upply of 60 gallons per head per day would be an ideal goal but it may not be feasible to attain this even by 1981 in the context of the available sources of water and finances. It was considered that a supply of 50 gallons per capita per day with fulfil the minimum requirements of the city and with this rate of supply the existing deficiencies^eould be covered. A supply of 50gallons per day per head an increase over the existing level of supply. On the other hand, for obvious reason, the per capita water supply will tend to increase in metropolitan Delhi due to better cleanliness and use of modern equipment in households in the years to come. In Delhi itself the per capita water supply has nearly doubled during the last two decades.
The general law of investment dictates that the service standard of an area will depend upon its ability to sustain it financially. Towns of smaller sizes do not need the same level of service that a bigger city will need. For example in big cities the use of water for industries, public uses etc. are more as compared to the requirements of a small town though there may not be much of difference in domestic requirements. Also among towns there can be different standard of services depending upon their size. Some of the non-essential uses in semi urban areas could be satisfied from non protected sources, (such as wells, ponds etc.) say, for washing clothes and utensils and house washing etc. which in a big city have /to be met only from piped water supply.
The Delhi Metropolitan area comprises the Delhi urban area and the ring towns. Ring towns as compared to the central city are smaller in size and designed for a population varying from 25,000 to 5 lakhs. These ring towns will have different levels of services according to their size and economic potential. While the standard of water supply in the central city may be called "Class 'A'", the ring towns will have
1"Class B' " and "Class 'C'" standards.
Class 'A' standard will have full fledged water treatment plants with storage capacity of nearly 1/3 of the total supply. The elevation of the storage reservoirs should be such that it is able to create a terminal pressure head of at least 35 feet in any part of the distribution system. The duration of supply must be 24 hours. Whenever restrictions have to be imposed at least 18 hours of supply should be ensured. In any case their must be continuous water supply between 4 A.M. and 10 P.M. A per capita water supply of 50 gallons should be ensured for all uses in total.
rClass 'B standard will also have full fledged water treatment but local sources such as ground water, fnfiltration galleries or wells if suitable should be exploited. The storage capacity should be 1/3 the daily demand. The storage reservoirs should be such that they are able to create a pressure head of 30 feet of water in the distribution mains. The supply may be about 18 hours in a day and continuous supply ensured between 4 A.M. and 10 P.M. A per capita water supply of 45 gallons per day should be provided for all uses. Major industries must meet their water requirements from bore or small size tube wells.
For Class 'C standard either a tube well source or infiltration wells are recommended which will avoid mechanical treatment. Storage reservoirs should be 1/3 of the total supply and a terminal pressure head of 25' should be ensured. The supply should be on a minimum for 12 hours and continuous water supply should be ensured between 5 A.M. to 11 A.M. and 4 P.M. to 10 P.M. in domestic areas. Major industries should meet their water requirements from here or tube wells. Road washing, water for horticulture etc. should be met from local wells or ponds, A per capita water supply of 35 gallons should be ensured.
Commensurate with the sizes and requirements it is recommended that Ghaziabad, Faridabad, Ballabhgarh may have
Tclass 'B standard of water supply while G-urgaon, Bahadurgarh Narela and Loni may have Class 'C standard.
SUGGESTED SOURCE FOR AUGMENTATION OF URBAN WATER SUPPLY
Delhi has so far been banking on the solitary source of the river Yamuna for its water supply. But as stated earlier, the capacity of this source is being fully utilised and steps have to be taken even to stabilise the present supply throughout the year. Reliance on only one source makes the position rather precarious whenever there is a break down, and in the absence of an alternate supply all the taps in the city have to keep dry. If the requirements are met from more than one source, whenever there is a crisis, the supply could be diverted from one to the other. In Delhi since the demand has surpassed considerably the available capacity of the current source, one has to look for some bulk external sources for augmentation of the system both for the present and for the future requirements. The suggested sources for augmentation are the following:
(a) The Bhakhra Reservoir
(b) The Ramganga Reservoir
(c) Ground Water from Punjab
(d) Ground Water from U.P.
(e) Ground Water from Delhi.
R.G.GuptaCity/Policy Planner
Master Plan For Delhi 1957, Volume-II, PART - 3

Tab
le N
o. 1
Tab
le s
how
ing
part
icu
lars
of
exis
tin
g w
ater
su
pply
in
var
iou
s In
dian
cit
ies
R.G.GuptaCity/Policy Planner
Master Plan For Delhi 1957, Volume-II, PART - 3

(a) Bhakhra Reservoir:
After the completion of the Beas Sutlej link project, the storage capacity of the Bhakhra Reservoir will be augmented. The Government of India have been considering a proposal to construct a separate channel to Delhi of 200 cusecs capacity connecting Moonak from where the supply from. Bhakra could be picked up. An alternative proposal will be to divert the supply from Bhakhra into a link canal connecting Moonak.or any other nearest point with river Yamuna near Karnal and pick it up near Wazirabad for Delhi’s water supply. This will not involve much of additional expense as the Punjab Government have already embarked on a similar proposal for the irrigation of the Gurgaon area instead of the previous proposal (known popularly as Gurgaon Canal Scheme) to route the canal through Delhi from Moonak. The new scheme envisages releasing water from the main canal near Karnal and picking up the water at Okhla through the Agra canal. In the revised proposal the new canal for irrigation of Gurgaon District will take off from mile No. 15 of the Agra canal. In this event, the capacity of the main canal connecting the Yamuna at Karnal could he suitably designed so as to carry an additional discharge of about 200 qusecs for Delhi.
(b) Ramganga Reservoir:
The next big source to be earmarked for Delhi is the Ramganga reservoir proposed to be implemented during the Third Five Year Plan. This project envisages the construction of a reservoir on the Ram Ganga which will augment water supply in the Lower Ganga Canal. The Upper Ganga Canal which at present feeds of the Lower Ganga Canal would then have surplus water which can be diverted to the Hindun for water supply to Delhi. It is suggested that about 200 qusecs of water may be reserved now from this source for Delhi. In case water from Ramganga Reservoir does not come-forth the quantity should be made good by tapping additional water from Bhakra Reservoir.
(c) Ground Water from Punjab;
A secondary but a reliable source of water supply is the ground water from the Sonepath area in Punjab. One tube well in this area is likely to give a discharge of about 1 to ½ qusecs. It is suggested that stabilisation of water supply at Wazirabad intakes during summer months could Toe ensured from this source. It is suggested that about 120 tube..wells may be sunk exclusively for stabilising and augmenting the Wazirabad source. The water from these 120 tube wells during other months oould be utilised for local irrigation. It is suggested that water from these tube wells, may be put into the Yamuna near Sonepat through a carrier drain and picked up at Wazirabad intakes without any need for constructing a separate channel from Sonepat to Wazirabad. But in such a case these tube wells may have, to be maintained by the Punjab irrigation department and Delhi may have to pay its share for capital, operational and maintenance costs.
(d) Ground Water from U.P.
Another copious supply of ground water is found in the Loni area in U.P. It has been estimated that about 40 cusecs or 20 MOD may be tapped by sinking about 30 tube wells. Since this source is very near to Shahdara, it will prove to be a more economical one and Shahdara has to be developed to.contain about 8 lakhs of people by 1981. This source could meet about 50$ of the requirements of 1981
of Shahdara and the rest could be met from the Ramganga reservoir source.
(e) Ground Water from South Delhi
The geological survey of India has reported that about 25 square miles of area in South Delhi consisting of about 13 villages bear potable ground water, suitable for this area. With this source it would be possible to rep]ace the Okhla source which undergoes considerable pollution. With the above source, in addition to the areas currently served by the Okhla plant, an additional population of about 75,000 could be served in South Delhi. Possibly, the colonies which are fast developing in South Delhi could be provided with piped water supply.
PROGRAMME OF AUGUMENTATION
The possible sources that could be augmented in future have been indicated abovebut the periods in which they could be tapped will vary. Hence the phasing of the augmentation programme should be such that it fulfils the city demands adequately from time to time. While the requirements of water for later years can be met from bulk sources which will mature only after some years, Delhi, in the meantime, continues to be confronted with water scarcity even for the present population. This situation has to be overcome. So the total programme has been divided into two stages; the first stage will consist of providing water supply to the population till 1966, the end of the Third Five Year Plan and the 2nd stage consisting of a comprehensive programme for augmentation of the sources for the requirements till 1981.
First Stage:
The projected urban population by the end of the Third Five Year Plan will be around 25 lakhs. During the first stage, it is proposed to provide water at the rate of 45 gallons per capita per day only as it will be difficult to per capita per day in the immediate near future. At this rate, by 1966, a total supply of about 112.5 MGD or about 225 qusecs of water will be required. Even with the release of water from Punjab irrigation system the supply at Wazirabad during summer cannot be more than 60 MGD. Besides stabilisation the total supply at Wazirabad should reach about 95 MGD. Incidentally, the current source at Okhla will be abandoned and replaced by an alternative source. Thus, for the requirement by 1966, augmentation should be done upto another 52.5 MGD or 105 qusecs. Since the bulk external sources will mature only by the beginning of the fourth Five Year Plan, the immediate requirements are proposed to be met only from local or nearby sources. The sources and the quantities of supply that should be made available are indicated below
(a) Tube wells in Sonepat area 70 cusecs
b) Tube wells in South Delhi 15 cusecs
c) Tube wells in U.P. (Loni Area)
(1st instalment). 20 cusecs
Total 105 cusecs
or 52.5 MGD
After stabilisation and augmentation of the Wazirabad source to 95 MGD, the developed areas in West and a portion in South Delhi could be provided with piped water supply on a satisfactory basis. With the ground water source from South Delhi the existing Okhla source could be replaced. Since a total of about 7.5 MGD of water would be available from this source as against the present supply of 3
R.G.GuptaCity/Policy Planner
Master Plan For Delhi 1957, Volume-II, PART - 3
MGD the rest could be diverted to serve the colonies that are being developed now in South Delhi.
As a 1st instalment the ground water of about 7.5 MGD proposed to be tapped from the Loni area in U.P. will provide water supply for a population of about 2.0 lakhs of people in Shahdara which will be the population there roughly by 1966.As stated earlier in this report augmentation of water supply is to be made for a population of about 5 million,' At the rate of 50 gallons of water per capita per day about 250 iu ill ion gallons or 500 cusecs of water will be required by 1981. This quantum is nearly four times the present supply. The sources proposed to be tapped during this-stage together with their output are given below:
(1) Loni Tube Wells (2nd instalment) 20 cusecs
(2) Bhakra Source 200 cusecs
(3) Ramganga source (from 200 . 50 cusecs
cusecsto be reserved)
Total: 270 cusecs
To this if we add the total supply of what would be available by 1966 after the execution of the first stage of the programme, the total supply by 1981 could be raised to 495 cusecs. The Loni tube well source and the Ramganga source totalling up to 90 cusecs or 45 MGD will be sufficient to provide water to Shahdara upto 1981 when its population will be about 8 lakhs. The loni tube well scheme - second instalment of a capacity 20 cusecs may be completed during the fourth Five Year Plan. Thus a total supply of 40 cusecs or 20 MGD will be available by 1971, which can serve a population of about 4 lakhs and Shahdara's population by 1971 may not exceed this figure. During the Fourth Five Year Plan the works connected with the augmentation of water supply to Shahdara from Ram Ganga source up to 50 cusecs or 25 MGD may also be taken up so that the demand after 1971 could be met adequately. As regards the Bhakra source it is suggested that it may be tapped in two instalments: about 100 cusecs during the Fourth Five Year Plan period and another 100 cusecs during the Fifth Five Year Plan period. This will be sufficient to serve the population increases during these periods.
Thus there will be a balance of about 150 cusecs of water or 75 MGD (that could serve about 15 lakhs of people) on the quantity proposed to be reserved from the Eamganga reservoir source. Since the estimate cf urban population is only an intelligent guess which is likely to be supersided by unprecedented factors that may arise in future, it is just possible that the quantity proposed for augmentation by 1981 may fall short of actual requirements. With better living standards in the year to come Delhi's total water requirements may outwit any earnest estimates. The Master Plan covers the Metropolitan area which consists of the ring town also apart from the urban area and requirements of water to the satellite townships such as Ghaziabad and Faridabad could be met with from the reserves made from the Eamganga source. Sc, unless water is reserved ahead to cover all unforeseen and future requirements, there will be a reversal to the same problem, at present Delhi is faced with.
The Joint Committee on Washington Metropolitan problems which reported on the water supply in the Washington Metropolitan area in 1958 has given estimates of water requirements till the year 2100, nearly 140 years hence from now. So though the Master Plan is designed to control urban development till the period 1981, it has to even taken into account the problems that may have to be faced immediately after the end of the plan period also. areas to a trunk
sewer laid at that level to connect a treatment plant in the north itself instead of pumping the sewage accross the high ridge to the plant at Okhla in the south. Sewage may he carried over a distance of more tl.an 12 miles with pumping at two stages. Besides this, even the .Western Extension Area Karol Bagh and Andha Mughal have also to pump their sewage across the ridge to the trunk sewer in New Delhi. At present sewage is pumped from west and north Delhi extensions on the other side of the ridge to the New Delhi trunk sewers from three placess namely Andha Moghal, Subzi-mandi and University area. Added to these deficiencies are the sub-pumping stations in seven places in the New Delhi area at low lying locations preventing efficient gravitation into the trunk sewer which obviously is not deep enough. All these seven pumping stations pump the sewage to the trunk sewer which connects the main pumping station at Eilokri to which all the main sewers, gravitate. The sewage is pumped from this main sewage pumping station into a high level gravitation duct connecting the Okhla sewage treatment plant.
While the integrated sewerage system suffers from several inefficiencies and inadequacies, the sewage treatment has also not attained the desired level of purification. The plant at Okhla is of a total capacity of about 36 MGD of which 24 MGD is fully treated while the rest of the sewage only gets primary treatment. The effluent from the primary treatment plant has been allowed to flow into sewage lagoons. Since the lagoons are not operated satisfactorily the plant site has become a breeding ground for flies. Recently works on the construction of a 30 MGD additional plant has commenced with sludge digestion works and this will also provide only primary treatment.. The effluent from the plant mostly gets.
Table No.2
Zone No. Population Qty. of water Remarks
in millions required in MGD at
45 gallon per capita
1. (Old 1.5 67.5 from Wazira- Water supply exist
& New Delhi bad source but inadequately in Old Delhi & New
Delhi extensions.
2. (West Delhi) 0.3 13.5 Only 1 lakh people
get intermittent
supply - rent nill).
3. (South Delhi) 0.1 4.5 from Okhla Only about 0.75 lakh get from Okhla water poll.
4. (North West Nol - No protected
Delhi) water supply exist
5. (Shahdara) 0.1 4.5 -do-
2.0 20.0
It may be seen from the above table that the demand for water for the urban population of about 20 lakhs is 90.00 MGE (at 45 gallons per head per day) while the : actual supply is only about 60 MGD leaving a deficit of about 30 MGD i.e. roughly about 1/3 of the urban population have no water in terms of quantum. During the first stage of augmentation, the demands in all the zones could be met and the following will be pattern of distribution of water by 1966.The sources from which the requirements have to be met are also shown in this table no. 3
R.G.GuptaCity/Policy Planner
Master Plan For Delhi 1957, Volume-II, PART - 3

Table No.3
S. No. Population in millions Qty. of water required in MGD at 45 Sources
gallons per capita
1. 1.60 72.00 To be meet from Wazirabad First stage
augmentation 95 MGD Capacity
2. 0.45 20.25 -do-
3. 0.18 8.1 0.6 MGD from Wazirabad
7.5 MGD from Tube Wells in south Delhi
4. 0.05 2.25 To be meet from Wazirabad
Total 2.50 112.50 Total of all Sources 112.5 MGD
S. No. Population in millions Qty. of water required in MGD at 45 Sources
gallons per capita
1. 1.70 85.00 75 MGD from Wazirabad source the
rest 13 MGD from Bhakhra Source.
2. 1.45 75.00 Wazirabad source 20.25 MGD; rest
52.25 MGD from bhakhra Source.
3. 0.65 32.50 7.5 MGD from South Delhi Tube Wells;
0.6 MGD from Bhakhra Source
4. 0.40 20.00 2.25 MGD from Wazirabad and the rest
17.75 MGD from Bhakra source.
5. 0.80 40.00 20 MGD from U. P. tube wells and the
rest from Ram Ganga Source
5Total 5.00 112.50 Total of all Sources 112.5 MGD
The estimated quantity of water that will be available has been equated above to the requirement of water in various zones. Except for the tube well source in South Delhi the other sources are well known for their potentiality. After trial bores If the area suggested for tube well sinking in South Delhi did not yield the entire quantity of 7.5 MGD of water, it is suggested the remainder may be made good by sinking a few additional tube wells in the Sonepat area and by augmenting the Wazirabad source.
The estimated quantity of water that will be available has been equated above to the requirement of water in various zones. Except for the tube well source in South Delhi the other sources are well known for their potentiality. After trial bores if the area suggested for tube well sinking in South Delhi did not yield the entire quantity of 7.5 MGD of water, it is suggested the remainder may be made good by sinking a few additional tube wells in the Sonepat area and by augmenting the Wazirabad source.
The tube well water from South Delhi may be pumped to a
reservoir located at the highest level (nearly 850.O0 R.L.) on the ridge and distributed to South Delhi. In this connection some minor works have to be carried out for connecting the existing distribution system with 1 the new source. New distribution lines may have to be laid connecting the colonies that have been developed and are to be developed. With the augment at ion of the Wazirabad source, the colonies that have to be developed in West Delhi could be provided with piped water supply adequately. The water that will be tapped from Loni tube wells in the first installment could provide a satisfactory supply of water to Shahdara which had hitherto no water supply.
During the II stage the per capita supply is proposed to be stepped upto 5^ gallons per day which is the target to be aimed at. The estimated population in each zone and the requirements of water by 191 are indicated in the Table below. The sources from which water will be made available to each zone are also shown.
TABLE NO: 4.
It will be seen from the above table that the required likely in each zone will be met from the various proposed for augmentation.
HEAD WORK & STORAGE:
The precise location of head works and storage reservoirs could be selected only after a detailed survey. However, a broad outline on which the locations may be chosen are given below:
R.G.GuptaCity/Policy Planner
Master Plan For Delhi 1957, Volume-II, PART - 3

The tube well sources suggested need no treatment & they are expected to be qualitatively palatable supplies it would need chlorination. The locations of the storage reservoirs in South Delhi may be on the highest ridge and in Shahdara they may have to be only on elevated tanks. For Shahdara there may be two composite storages, one on the north of Grant Trunk Road and the other on the south.
For the Bhakhra source, if the proposal to construct a channel from Moonak is agreed upon, the head works may be located to the South of Rohtak road near mile stone No. 8 and the carrier drain extended up to this point. The water required for zones 1,2,3 and 4 may be stored on the ridge suitably. Possibly for zones 1 and 2, water, could be stored on the central ridge and for zone 4 on the ridge at Anand Par bat. For Zone No. 3 the storage reservoir may be on the Southern Ridge. On the other hand if the water from Bhakhra has to be put at Karnal and picked up at Wazirabad, then the Wazirabad head works have to be suitably expanded, including the trunk mains connecting the new storage reservoirs. This may be determined after a detailed survey of different alignments of pumping mains and the most economic pattern chosen.
REDESIGN OF THE EXISTING SYSTEM
A key note in the design of distribution system is equitable supply of water to various localities. In case of Delhi there has been great differential in the levels of supply to various localities; areas like New Delhi having a very high level of supply of 50 to 60 gallons per capita per day (for all uses) while the other areas like Old Delhi, Paharganj etc. having a meagre supply of 25 to 30 gallons per capita. An effort should hence be made to equalise the levels of supply in the existing distribution system. This is not to mean, to pull down the supplies of well served areas but to elevate the service standard in areas inadequately served.
Most of the areas where either the flow is less or the pressure is inadequate, the distribution system has to be either duplicated or the sizes of mains enlarged to carry the increased flow. Most of the areas not have an inventory of the size of mains and their discharges. A survey should be made of the sizes, discharges and pressure heads in the existing system at various points. With this data the existing system could be redesigned to carry the increased flow. Most of the localities which are situated at higher levels do not have adequate pressure at 1st floor, not to mention of the barsati floor where water seldom reaches in summer. In such areas the pressure should be raised by providing booster pumping stations. Thus the redesign of the existing system should be done immediately otherwise at a later date when the augmentation of the supply takes place the new areas will be given adequate supplies and in the older parts the services levels will still be inadequate.
WATER SUPPLY FOR RING TOWNS
Since the Master Plan envisages development, it is essential that an integrated programme for public utilities is presented for the entire Metropolitan area. As the ring towns have to support a substantial working force that otherwise might come to Delhi, any lack of utility resources, chiefly water and power supply may make the whole plan lopsided and might continue to subscribe to migratory tendencies towards urban Delhi. It is thus essential that the requirements of protected water for the growth anticipated in the ring towns are provided for so that the physical development may be carried on the desired lines.
Except Gurgaon and Ballabgarh, the rest of the ring towns namely Ghaziabad, Faridabad-Ballabgarh, Narela and Loni are potential for potable ground water supplies. Since the ring towns of Gurgaon and Ballabgarh are not to be developed very intensively as the rest, the water supply may continue from the existing sources pre-dominantly from open wells. But a mention may be made here that evening supplies have to be met from open wells, they may be protected and the water distributed through a central storage tank so that adequate pressure might be ensured. At present both these towns do not have protected water supply. As regards the other three major ring towns and Loni water supply might be met from tube wells. Ghaziabad and Loni are well known for their copious ground water. A survey of the existing tube wells in both the towns and their environs indicated the yield per tube well to be of the order of 20 to 25 thousand gallons per hour. Even the existing water supply at Ghaziabad and Faridabad townships is through tube wells which have very satisfactory yields. As regards Faridabad, it is suggested that tube wells for future water supply might be sunk in between Mathura Road and Agra Canal, South of the Faridabad old township as this area is expected to bear large surplus in view of the sub-soil water seepage from Agra Canal. Further the quality of water may also prove to be satisfactory. In case of Narela Township, though the Geological Survey of India after their preliminary survey have indicated some pateh of land as suitable for tube well sinking, it is felt that it may not yield large supplies as to serve the population of about 70,000 to be reached by 1981 - An economic source of water supply to Narela will be from the potential areas in Sonepat which have adequate ground water supplied. A pumping main of suitable capacity may be made to connect a series of tube wells in the Sonepat area and a central reservoir at Narela. While locating the reservoir, the mound west of the Narela Township, may be kept in mind as it may avoid staging. In the case of both Ghaziabad and Faridabad-Ballabgarh, though the ground water supplies are available in plenty at present, it may not be economical to have too many tube wells at a later period when it will be required to serve a considerably large population. Since about 150 cusecs of water from the Ram Ganga source will remain as surplus even after meeting all the requirement for the Delhi urban area, Ghaziabad and Faridabad Townships may go in for centralised surface water supplies after necessary treatment. The water required for Faridabad may be picked up from the Agra Canal which should get additional supplies through the Hindun cut and for Ghaziabad from river Hindun itself.
It is beyond the scope of this chapter to delineate with any precision the pattern on which the tribution has to be done in the above three major ring towns for which a detailed engineering survey is essential so such assignments could be under taken only by the joncerned local bodies. Further Faridabad and Ghaziabad fall outside the territorial jurisdiction of Delhi and only the respective state Governments will be in a position to do it. So what has been aimed at now is to indicate the requirements of water for bulk supply incidental to the growth suggested in these townships and also the possible sources from which they could be met. A statement showing the population of the ring towns by 1981 and the estimated demand for protected water and the sources from which they may be met is given below :
R.G.GuptaCity/Policy Planner
Master Plan For Delhi 1957, Volume-II, PART - 3

TABLE NO:- 5
The proposals for Delhi Urban water supply may be seen in Plan No....
PART II
SEWERAGE & SEWAGE DISPOSAL:
The incidence of refugee migration and the fast urban growth has over loaded the city's sewerage system. While the city's total water output more than trebled during the last two decades, the city's sewerage system has never ' undergone a revision in its capacity with the result that more than half the total sewage inflow finds its way at several points into the river Yamuna; the only drinking water source at present. It is seen that the existing sewerage system was designed about three decades ago for the then population of about 6.5 lakhs. Today the same system has to carry a load of nearly thrice as much as its designed Capacity; of course with many overflows.
The limitation set on the intake capacity of the existing sewers which have not been redesigned has made it impossible to extend the trunk sewerage system to the extensions of the city, where housing construction has taken place rather at a .feverish rate. Most of them have only dry latrines with the liquid waste and sullage over-flowing into the surface drains, which is a major source of river pollution. In old Delhi, where most of the city's slums are concentrated, the situation is indeed chronic. With the combined dry drains for storm water and sullage, and about 50$ of the houses on dry latrines the sanitary conditions there are deplorable. Still density continued to rise due to pressure on land shortage. A more detailed appraisal of the deficiencies of the present system will high flight the urgent need for a comprehensive redesign of the existing system and a planned development of sewerage & sewage disposal works for the new areas to be urbanised.
The present sewerage system principally serves the New Delhi area, Civil Lines, the South Delhi Government colonies and the Western Extension Area known as Karol Bagh Old Delhi is only
S. No. Name of Ring Road Population 1981 Rate of per capita Total supply per Suggested Sources Existing Sources in lakhs supply per day day in million gallons by 1981
1. Ghaziabad 4.1 45 18.50 Up to 5 MGD from 4 Tube wells connec-
tube wells; rest 13.5 ted to a distribution
MGD from Ram system
Ganga Sources.
2. Faridabad-
Ballabgarh 2.93 45 13.20 Up to 3 MGD from 7 tube wells connec-
tube wells; the rest ted to a distribution
10.2 MGD from system
Ram Ganga Canal
3. Narela 0.71 35 0.70 Tube wells from Open wells
Sonepat.
4. Loni 0.23 35 0.70 Local Tube wells -do-
5. Gurgoan 0.40 35 1.4 Open Protected -do- walls 6. Bahadurgarh 0.30 35 1.05 -do- -do-
The proposal for Delhi Urban water supply may be seen in Plan no......
partly served. The rest of the colonies hat have come up in South, North and West Delhi and Sahdara on the other side of the river which together comprise about 40% of the present urban core have to go without any sewerage facilities. The liquid waste and sullage gravitate into the storm water drains which find their way into the surface drains finally flowing into the river. The two principal surface drains which contribute to constant river pollution are the Najafgarh drain passing through the west and North Delhi and the Barapulla Nallah towards the south. All the new extensions, including unauthorised colonies, connect these nallas which are the only major natural drainage courses in the city. Besides this contamination, there are regular sewage overflows, terminating at the river from the existing system due to excessive loading during peak hours. There are more than thirteen such overflows in between Wazirabad and Okhla along the river.
Besides this nuisance of continuing river pollution, the extension of the trunk sewerage system to north Delhi connecting the trunk sewers in New Delhi has been done in a manner which is not conducive to economic operation. All the trunk sewers in New Delhi to which the sewers from north Delhi gravitate are connected to the Okhla treatment plant which is the only plant in operation at present in this sector. With the ridge which is about 70 feet high, physically separating New Delhi and areas to the north of it such as Subzi mandi, University area, etc, it would be only proper to gravitate the sewage from, the northern primary treatment and irrigated on the lands south of the plant. This has contaminated the sub-soil water of the villages nearby which has been a source of their drinking water supply. Also, the effluent that is allowed to be diluted in the river is not cent percent rid of organic impurities. Above all, while the capacity of the treatment plant (both secondary and primary) is only 36 MGD, the total sewage produced in urban Delhi is about 80 MGD. Naturally about 4 million gallons of sewage could not but find its way into the river every day.
R.G.GuptaCity/Policy Planner
Master Plan For Delhi 1957, Volume-II, PART - 3

While the existing system both in bulk carriage and treatment suffers from great deficiencies, the urban population is rising at a very fast rate at the rate of about 6 lakhs of people every five year period. This means provision of adequate sewerage facilities for a land coverage of about ten thousand acres and treatment of sewage to the extent of about 25 MGD. Thus the need for timely improvement of the existing system and provision of adequate sewerage and sewage disposal works for the new areas to be urbanised is very vital for preserving urban health otherwise it is obvious many more areas will fall under the clutches of sub-standard development.
TOPOGRA PHY AND SEWERAGE BLOCKING
For any sewerage plan, it is essential to divide the city (including ,further extensions) into blocks so that each block is self-contained and effectively served. Proper delineation of the sewerage blocks should be able to improve the bulk carriage of the existing system as to operate it on economic lines. This is most called for in the context of complicated net work of trunk sewers and multiple pumping involved in the existing system. To be Najafgarh road slopes from east to vest and the area I south of it slopes from south east to north-west, that is, iron the Cantonment side towards Najafgarh road. The area to the east of the river (Shahdara) will he another block. The presence of the Grand Trunk Road and the railway line parallel to it divides this block almost equally. There is a gentle slope from east to west towards the river along the Grand Trunk Road, to the south of the rail track the land slopes in a north south direction towards the Hindun cut..
Thus tho entire urbanisablc area till1981according to geography is divisible under four sewerage blocks.
The population estimates for individual blocks have been arrived at and are arrived at and are presented in the Table below.A brief description of the boundaries of each block is also indicated. The delineation of the blocks may be seen in Plan no.
TABLE NO: 6.
Block No. DESCRIPTION OF THE BLOCK Population
in Million
1. Area bounded by the ridge on the 2.176
north and west, the river on the east
and the urbanisable limit at the south.
2. Area bounded by the urbanisable 0.751
limit in the north, the ridge at the
south, the river on the east and
the West-tern Yamuna Canal on
the west
3 Area bounded by the Western 1.273
Yamuna canal and the ridge on
the east, the urbanisable limits on
the other sides.
4. Area bounded by the river on 0.80
the west and the urbanisable limits
on the other sides-Shahdara.
TOTAL: 5.00
After having delineated the sewerage block boundaries, the next task is to choose the locations of the treatment plants as each block
will contain an independent plant connected to a net work of trunk sewers. In block No. 1 the existing treatment plant at Okhla is situated at a proper place in conformity with the natural topography. Also, it is on the fringe of the proposed limit of urbanisation. In block No. 2, a treatment plant, recently constructed near the Coronation Pillar is also at the edge of the urbanisable limit. This treatment plant gives only . primary' treatment to the sullage water that over-flows into Najafgarh drain from the developed areas near by which have no sewerage facilities at present. A main pumping station . recently constructed at the tail end of the Najafgarh drain near the Yamuna collects the sullage water and pumps it to the treatment plant near the Coronation Pillar. As such it does not connect any sewers in this block and the existing sewers in this block connect the trunk sewers in New Delhi. Another treatment plant is under construction at West Delhi (block No.3) near Kqshopur village. This treatment plant is also situated in the proper place, adjoining the urbanisable limit. Block No. 4 - Shahdara, as stated earlier, has no sewerage system at present. The topography of this block is such that the trunk sewers could be conveniently gravitated towards the diversion channel at Shahdara South. Hence it is proposed to locate the plant south of the diversion channel near a point about a mile east of the junction of Patparganj road and the diversion channel. The sewage from the proposed industrial area south of the diversion channel can also be gravitated to this point.
The capacity of the treatment plants by 1981 in the four blocks will be as follows. These have been worked out at the rate of 40 gallons of sewage per head per day since-80$ of the water supplied will, more or less be converted into sewage.
TABLE NO 7
The capacity of the treatment plants has to be increased from time to time according to the physical development envisaged in each block. As such it is not possible to indicate here the capacity of each plant for various periods. The urban population by 1966, the end of the III Five Year Plan, is estimated at about 2.5 million. From the physical development envisaged during this period the following will be the population per day capacity. As it is situated on the down stream side of the city, this source undergoes pollution threatening public health.
At present raw water from the Wazirabad intakes is treated at the filtration plants located near Chandrawal. The head works at Wazirabad suffer from two major setbacks (a) reduction of flow in the river during the three summer months (b) change in the direction of~~~the river course during floods from the right to the left bank. However, the change in direction of the river course has been rectified by the construction of a barrage on the down stream of the Wazirabad intakes. But the problem of reduction in flow of water during summer will still remain and the Punjab Government have been obliging the Delhi Municipal Corporation by releasing about i^O cusecs of water from their irrigations! net work, as the average summer flow in the river is only 50 cusecs. Water for irrigation to Punjab & U.P. is diverted from the Tajewala Dam to the Eastern and Western Yamuna canals and no surplus water is released into the river Yamuna for Delhi's water supply. As such the water that is avail able near Wazirabad is due to
Block No. Location of Population Capacity by treatment plant 1981 in MGD
1. South Delhi 2.176 87.072. North Delhi 0.751 30.043. West Delhi 1.273 50.324. Shahdara 0.80 32.00 Total 5.00 200.00
R.G.GuptaCity/Policy Planner
Master Plan For Delhi 1957, Volume-II, PART - 3
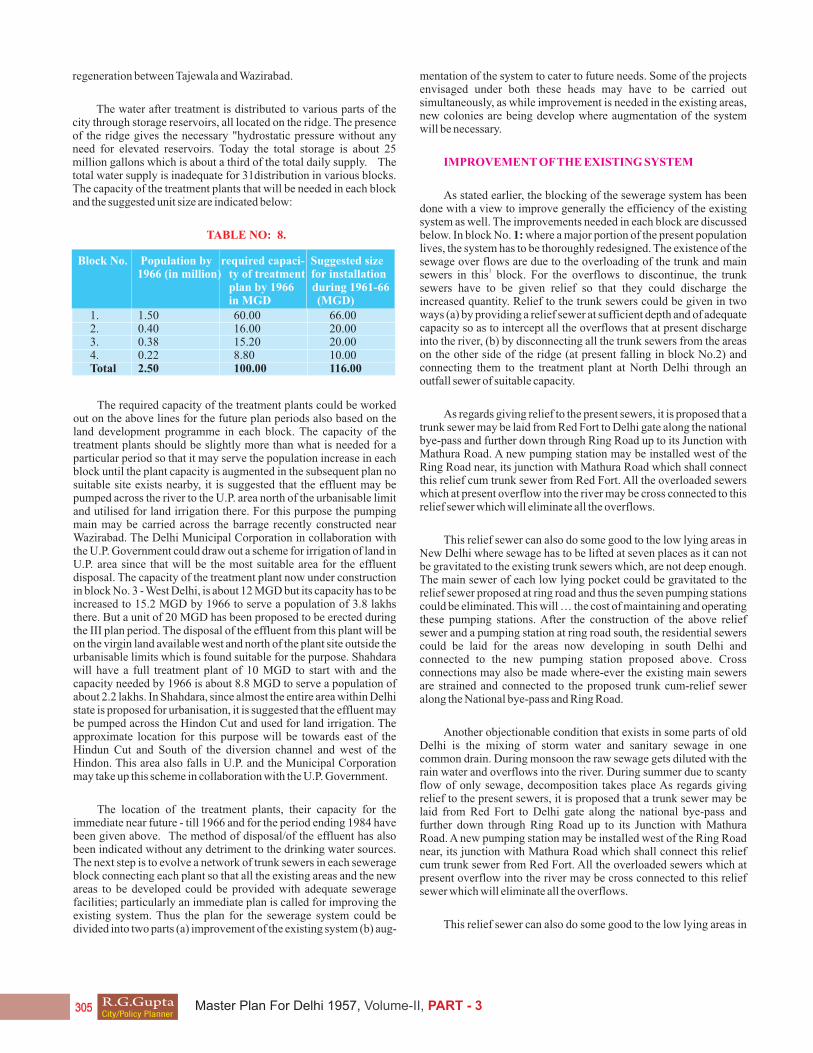
regeneration between Tajewala and Wazirabad.
The water after treatment is distributed to various parts of the city through storage reservoirs, all located on the ridge. The presence of the ridge gives the necessary "hydrostatic pressure without any need for elevated reservoirs. Today the total storage is about 25 million gallons which is about a third of the total daily supply. The total water supply is inadequate for 31distribution in various blocks. The capacity of the treatment plants that will be needed in each block and the suggested unit size are indicated below:
TABLE NO: 8.
The required capacity of the treatment plants could be worked out on the above lines for the future plan periods also based on the land development programme in each block. The capacity of the treatment plants should be slightly more than what is needed for a particular period so that it may serve the population increase in each block until the plant capacity is augmented in the subsequent plan no suitable site exists nearby, it is suggested that the effluent may be pumped across the river to the U.P. area north of the urbanisable limit and utilised for land irrigation there. For this purpose the pumping main may be carried across the barrage recently constructed near Wazirabad. The Delhi Municipal Corporation in collaboration with the U.P. Government could draw out a scheme for irrigation of land in U.P. area since that will be the most suitable area for the effluent disposal. The capacity of the treatment plant now under construction in block No. 3 - West Delhi, is about 12 MGD but its capacity has to be increased to 15.2 MGD by 1966 to serve a population of 3.8 lakhs there. But a unit of 20 MGD has been proposed to be erected during the III plan period. The disposal of the effluent from this plant will be on the virgin land available west and north of the plant site outside the urbanisable limits which is found suitable for the purpose. Shahdara will have a full treatment plant of 10 MGD to start with and the capacity needed by 1966 is about 8.8 MGD to serve a population of about 2.2 lakhs. In Shahdara, since almost the entire area within Delhi state is proposed for urbanisation, it is suggested that the effluent may be pumped across the Hindon Cut and used for land irrigation. The approximate location for this purpose will be towards east of the Hindun Cut and South of the diversion channel and west of the Hindon. This area also falls in U.P. and the Municipal Corporation may take up this scheme in collaboration with the U.P. Government.
The location of the treatment plants, their capacity for the immediate near future - till 1966 and for the period ending 1984 have been given above. The method of disposal/of the effluent has also been indicated without any detriment to the drinking water sources. The next step is to evolve a network of trunk sewers in each sewerage block connecting each plant so that all the existing areas and the new areas to be developed could be provided with adequate sewerage facilities; particularly an immediate plan is called for improving the existing system. Thus the plan for the sewerage system could be divided into two parts (a) improvement of the existing system (b) aug-
Block No. Population by required capaci- Suggested size 1966 (in million) ty of treatment for installation plan by 1966 during 1961-66 in MGD (MGD)
1. 1.50 60.00 66.002. 0.40 16.00 20.003. 0.38 15.20 20.004. 0.22 8.80 10.00Total 2.50 100.00 116.00
mentation of the system to cater to future needs. Some of the projects envisaged under both these heads may have to be carried out simultaneously, as while improvement is needed in the existing areas, new colonies are being develop where augmentation of the system will be necessary.
IMPROVEMENT OF THE EXISTING SYSTEM
As stated earlier, the blocking of the sewerage system has been done with a view to improve generally the efficiency of the existing system as well. The improvements needed in each block are discussed below. In block No. 1: where a major portion of the present population lives, the system has to be thoroughly redesigned. The existence of the sewage over flows are due to the overloading of the trunk and main
1sewers in this block. For the overflows to discontinue, the trunk sewers have to be given relief so that they could discharge the increased quantity. Relief to the trunk sewers could be given in two ways (a) by providing a relief sewer at sufficient depth and of adequate capacity so as to intercept all the overflows that at present discharge into the river, (b) by disconnecting all the trunk sewers from the areas on the other side of the ridge (at present falling in block No.2) and connecting them to the treatment plant at North Delhi through an outfall sewer of suitable capacity.
As regards giving relief to the present sewers, it is proposed that a trunk sewer may be laid from Red Fort to Delhi gate along the national bye-pass and further down through Ring Road up to its Junction with Mathura Road. A new pumping station may be installed west of the Ring Road near, its junction with Mathura Road which shall connect this relief cum trunk sewer from Red Fort. All the overloaded sewers which at present overflow into the river may be cross connected to this relief sewer which will eliminate all the overflows.
This relief sewer can also do some good to the low lying areas in New Delhi where sewage has to be lifted at seven places as it can not be gravitated to the existing trunk sewers which, are not deep enough. The main sewer of each low lying pocket could be gravitated to the relief sewer proposed at ring road and thus the seven pumping stations could be eliminated. This will … the cost of maintaining and operating these pumping stations. After the construction of the above relief sewer and a pumping station at ring road south, the residential sewers could be laid for the areas now developing in south Delhi and connected to the new pumping station proposed above. Cross connections may also be made where-ever the existing main sewers are strained and connected to the proposed trunk cum-relief sewer along the National bye-pass and Ring Road.
Another objectionable condition that exists in some parts of old Delhi is the mixing of storm water and sanitary sewage in one common drain. During monsoon the raw sewage gets diluted with the rain water and overflows into the river. During summer due to scanty flow of only sewage, decomposition takes place As regards giving relief to the present sewers, it is proposed that a trunk sewer may be laid from Red Fort to Delhi gate along the national bye-pass and further down through Ring Road up to its Junction with Mathura Road. A new pumping station may be installed west of the Ring Road near, its junction with Mathura Road which shall connect this relief cum trunk sewer from Red Fort. All the overloaded sewers which at present overflow into the river may be cross connected to this relief sewer which will eliminate all the overflows.
This relief sewer can also do some good to the low lying areas in
R.G.GuptaCity/Policy Planner
Master Plan For Delhi 1957, Volume-II, PART - 3
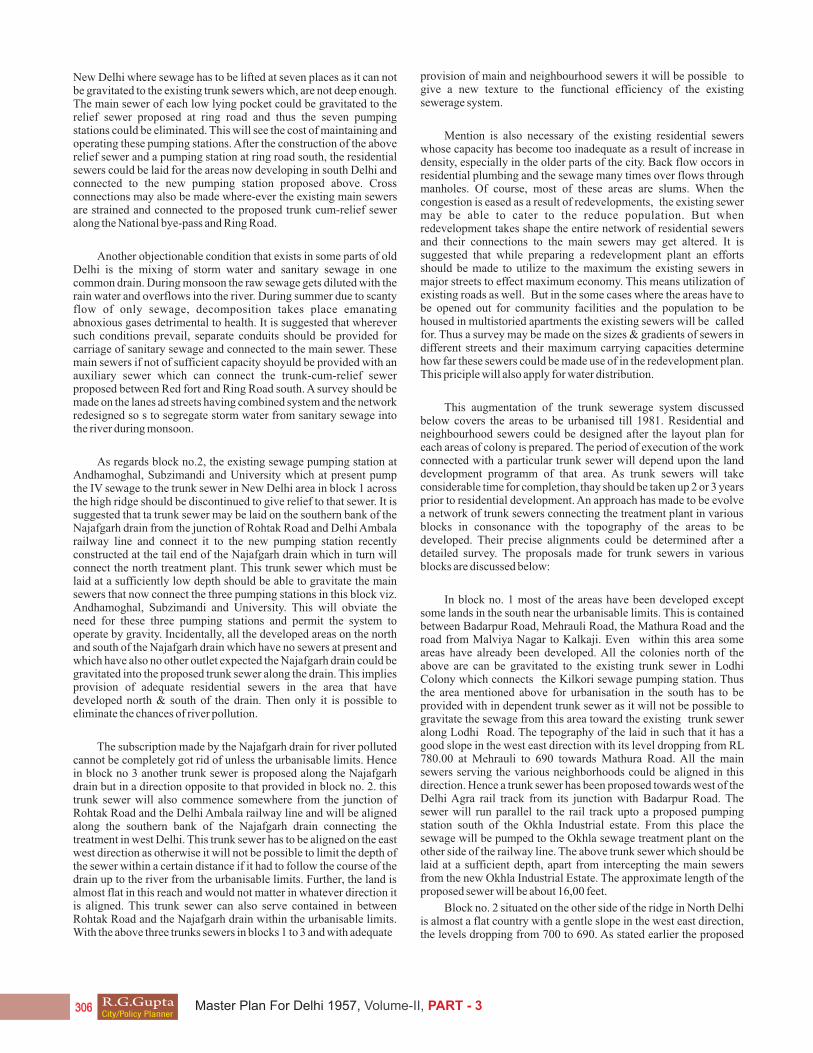
New Delhi where sewage has to be lifted at seven places as it can not be gravitated to the existing trunk sewers which, are not deep enough. The main sewer of each low lying pocket could be gravitated to the relief sewer proposed at ring road and thus the seven pumping stations could be eliminated. This will see the cost of maintaining and operating these pumping stations. After the construction of the above relief sewer and a pumping station at ring road south, the residential sewers could be laid for the areas now developing in south Delhi and connected to the new pumping station proposed above. Cross connections may also be made where-ever the existing main sewers are strained and connected to the proposed trunk cum-relief sewer along the National bye-pass and Ring Road.
Another objectionable condition that exists in some parts of old Delhi is the mixing of storm water and sanitary sewage in one common drain. During monsoon the raw sewage gets diluted with the rain water and overflows into the river. During summer due to scanty flow of only sewage, decomposition takes place emanating abnoxious gases detrimental to health. It is suggested that wherever such conditions prevail, separate conduits should be provided for carriage of sanitary sewage and connected to the main sewer. These main sewers if not of sufficient capacity shoyuld be provided with an auxiliary sewer which can connect the trunk-cum-relief sewer proposed between Red fort and Ring Road south. A survey should be made on the lanes ad streets having combined system and the network redesigned so s to segregate storm water from sanitary sewage into the river during monsoon.
As regards block no.2, the existing sewage pumping station at Andhamoghal, Subzimandi and University which at present pump the IV sewage to the trunk sewer in New Delhi area in block 1 across the high ridge should be discontinued to give relief to that sewer. It is suggested that ta trunk sewer may be laid on the southern bank of the Najafgarh drain from the junction of Rohtak Road and Delhi Ambala railway line and connect it to the new pumping station recently constructed at the tail end of the Najafgarh drain which in turn will connect the north treatment plant. This trunk sewer which must be laid at a sufficiently low depth should be able to gravitate the main sewers that now connect the three pumping stations in this block viz. Andhamoghal, Subzimandi and University. This will obviate the need for these three pumping stations and permit the system to operate by gravity. Incidentally, all the developed areas on the north and south of the Najafgarh drain which have no sewers at present and which have also no other outlet expected the Najafgarh drain could be gravitated into the proposed trunk sewer along the drain. This implies provision of adequate residential sewers in the area that have developed north & south of the drain. Then only it is possible to eliminate the chances of river pollution.
The subscription made by the Najafgarh drain for river polluted cannot be completely got rid of unless the urbanisable limits. Hence in block no 3 another trunk sewer is proposed along the Najafgarh drain but in a direction opposite to that provided in block no. 2. this trunk sewer will also commence somewhere from the junction of Rohtak Road and the Delhi Ambala railway line and will be aligned along the southern bank of the Najafgarh drain connecting the treatment in west Delhi. This trunk sewer has to be aligned on the east west direction as otherwise it will not be possible to limit the depth of the sewer within a certain distance if it had to follow the course of the drain up to the river from the urbanisable limits. Further, the land is almost flat in this reach and would not matter in whatever direction it is aligned. This trunk sewer can also serve contained in between Rohtak Road and the Najafgarh drain within the urbanisable limits. With the above three trunks sewers in blocks 1 to 3 and with adequate
provision of main and neighbourhood sewers it will be possible to give a new texture to the functional efficiency of the existing sewerage system.
Mention is also necessary of the existing residential sewers whose capacity has become too inadequate as a result of increase in density, especially in the older parts of the city. Back flow occors in residential plumbing and the sewage many times over flows through manholes. Of course, most of these areas are slums. When the congestion is eased as a result of redevelopments, the existing sewer may be able to cater to the reduce population. But when redevelopment takes shape the entire network of residential sewers and their connections to the main sewers may get altered. It is suggested that while preparing a redevelopment plant an efforts should be made to utilize to the maximum the existing sewers in major streets to effect maximum economy. This means utilization of existing roads as well. But in the some cases where the areas have to be opened out for community facilities and the population to be housed in multistoried apartments the existing sewers will be called for. Thus a survey may be made on the sizes & gradients of sewers in different streets and their maximum carrying capacities determine how far these sewers could be made use of in the redevelopment plan. This priciple will also apply for water distribution.
This augmentation of the trunk sewerage system discussed below covers the areas to be urbanised till 1981. Residential and neighbourhood sewers could be designed after the layout plan for each areas of colony is prepared. The period of execution of the work connected with a particular trunk sewer will depend upon the land development programm of that area. As trunk sewers will take considerable time for completion, thay should be taken up 2 or 3 years prior to residential development. An approach has made to be evolve a network of trunk sewers connecting the treatment plant in various blocks in consonance with the topography of the areas to be developed. Their precise alignments could be determined after a detailed survey. The proposals made for trunk sewers in various blocks are discussed below:
In block no. 1 most of the areas have been developed except some lands in the south near the urbanisable limits. This is contained between Badarpur Road, Mehrauli Road, the Mathura Road and the road from Malviya Nagar to Kalkaji. Even within this area some areas have already been developed. All the colonies north of the above are can be gravitated to the existing trunk sewer in Lodhi Colony which connects the Kilkori sewage pumping station. Thus the area mentioned above for urbanisation in the south has to be provided with in dependent trunk sewer as it will not be possible to gravitate the sewage from this area toward the existing trunk sewer along Lodhi Road. The tepography of the laid in such that it has a good slope in the west east direction with its level dropping from RL 780.00 at Mehrauli to 690 towards Mathura Road. All the main sewers serving the various neighborhoods could be aligned in this direction. Hence a trunk sewer has been proposed towards west of the Delhi Agra rail track from its junction with Badarpur Road. The sewer will run parallel to the rail track upto a proposed pumping station south of the Okhla Industrial estate. From this place the sewage will be pumped to the Okhla sewage treatment plant on the other side of the railway line. The above trunk sewer which should be laid at a sufficient depth, apart from intercepting the main sewers from the new Okhla Industrial Estate. The approximate length of the proposed sewer will be about 16,00 feet.
Block no. 2 situated on the other side of the ridge in North Delhi is almost a flat country with a gentle slope in the west east direction, the levels dropping from 700 to 690. As stated earlier the proposed
R.G.GuptaCity/Policy Planner
Master Plan For Delhi 1957, Volume-II, PART - 3

trunk sewer along Najargarh drain will cater to the developed area of this block. The undeveloped areas mostly lie in between Western Yamuna canal and Grand Trunk Road and some areas East of the Grand Trunk Road. To cater to the areas to be urbanised in future, a trunk sewer is proposed beginning from the eastern side of the Western Yamuna Canal bund along the Ring Road upto its junction with the Grand Trunk Road and further towards the east connecting the north treatment plant. Since arrangements exist for locating an additional pumping unit in the treatement plant, It is not necessary to have a separate place for a pumping station. The invert i.e. about 27 feet of fall is available. The total length of the sewer is about 13,000 ft. This sewer will be able to command to entire area to its north and the areas in the south which will not be commanded by the trunk sewer proposed along Najafgarh drain. Thus, these two trunk sewers will be able to cater to the needs of the entire blocks.
In block no. 3 as mentioned earlier a trunk sewer in nearing completion along the Najafgarh Road. In addition to this her trunk sewer has been proposed along Najafgarh drain as a part of the improvement programme. These two sewers will serve the areas in between Rohtak Road and Najafgarh Road and some areas south of the Najafgarh Road. For the areas of the north of the Rohtak Road, a trunk sewer has been proposed along Rohtak Road, commencing from mile stone no. 4 upto about mile stone no 9 where a sewage pumping station is proposed. The sewage will be lifted at this pump house and put into a high level gravitation duct connecting the west plant. The invert level of the inlet chamber of the west plant is at RL 668.00, while the G. L. near the proposed pump house on Rohtak Road is about 701.00 Thus a total fall of about 33 feet is available which should be sufficient for gravitation purposes. The trunk sewer along Rohtak Road should be laid sufficiently at a lower depth as to received the main sewers from the areas north of Rohtak Road which is quite flat. The total length of the purpose trunk sewer will be about 25000 free from its origin. The ground is almost flat its entire route i.e. at 701.00 The total length of the high level gravitations duct connecting the proposed pump connecting the proposed pump house and the west plant is about 13,000 feet.
To serve the areas south of Najafgarh road and the Cantonment area which hs no sewerage system at present it is proposed to lay a trunk sewer from cantonment and along the cantonment road as to connect the west plant after crossing the Najafgarh road. The internal sewers of the cantonment area should collect at a central pumping station and the sewage pumped to the head of the trunk sewer which will commence from the south of the railway line from Delhi to Rewari. This trunk sewer will also serve the areas on its west. the total length of this sewer is about 18000 feet and there is a total fall of about 8 ft. along its reach. Thus the four trunk sewers proposed will be able to serve adequately the entire block.
In block no. 4 the presence of the grand trunk road and the railway line creates a physical barrier. For the purpose of gravitating sewage, this block could be sub-divided into two sub-blocks, the one to the north of the rail track and the other to the south. It is proposed to collect the sewage of the Northern area by a pumping station proposed to the east of the eastern Yamuna Canal and north of the Grand Trunk road to which a proposed trunk sewer along G.T. Road will connect. The trunk sewer will commence from mile stone no. 6 and terminate at the above proposed pumping station. This sewer will be laid sufficiently at a lower depth as to connect the main sewer from the northern area. The urbanisable limit in this block also extends to the U. P. area and it is possible to make use of the above trunk sewer to serve the U. P. area as well, as it may not be economical to have separate sewerage works for the U. P. areas. The Delhi Municipal Corporation
in collaboration with the U. P. Government may make provision for carrying the sewage of their areas Possibly the sewage from the U. P. area could be collected at a sub-pumping station and pumped to the head of the trunk sewer proposed along the Grand Trunk Road. The G. L. at the begining of the sewer is 670.30 and near the pump house is 670.00 i.e. almost flat. The sewage is proposed to be pumped across the railway line to the head of the trunk sewer proposed in Shahdara South. The trunk sewer for Shahdara south will commence from Silampur village south of the rail track and will run also Patparganj Road. After crossing the diversion canal it will turn east and will connect the proposed treatement plant a mile away. The G. L. at the beginning of the sewer is 674.13 and at the end is 660.48 having a total fall of about 14 ft. The capacity of the trunk sewer at the initial reaches should be sufficient to carry the sewage from Shahdara North.
As regards the Industrial Area south of the proposed railway line in Shahdara south, it has been proposed to have a separate trunk sewer connecting the proposed treatment plant. The industrial waste should be pre treated before being allowed into public sewers. The G. L. of the proposed trunk sewer at Shahdara South at its beginning is 663.12, which is almost flat. Both the trunk sewer viz. rom industrial area and from the residential areas will be collected at a common pump house and pumped to the treatment plant for purification. The pump house will from a part of the treatment plant.
Thus the sewer proposed both for residential and industrial sectors will be sufficient to cater to the need of the entire block which also includes some areas of U. P. for which provision should exist in the integrated sewerage system.
PUBLIC CONVENIENCES
In cities like Madras and bombay adequate provision of Public Conveniences exist which avoids nuisance by public, such as passing urine and answering calls of nature at lanes, streets and open drains. In addition to this, community latrines are also provided whereever low income group people live who do not have a lavatory attached to their dwellings.
In Delhi community latrines and urinals exist apologetically at some places, being inadequate and ill maintained. Provision of additional Public Conveniences has to be restricted in the built up parts due to alck of suitable place. To utilize the space available along major roads effectively it is suggested that underground Public conveniences may be provided in some important traffic islands. In some big junctions nearer to commercial centres and offices, these public conveniences may also provided bathing facilities on payment of a token fee. Such an arrangement functions very successfully at Madras. they also could be maintained better and would conceal the abominable appearance that most of the Public Conveniences constructed over ground in Delhi present today. A survey should be made of the location of th existing public conveniences and a plan drawn out for provision of public conveniences at traffic islands and junctions at suitable intervals. I areas where commercial and offices centres are concentrated and in places where public congregate for recreational purposes or for tourism underground public conveniences should be provide on adequate basis so that the open spaces available may not be misused by the public. Also community latrines should be built on a liberal scale wherever low income group people live and their cooperation sought for maintaining them well.
The proposal for sewerage and sewage disposal works may be seen in Plan No. .....
R.G.GuptaCity/Policy Planner
Master Plan For Delhi 1957, Volume-II, PART - 3
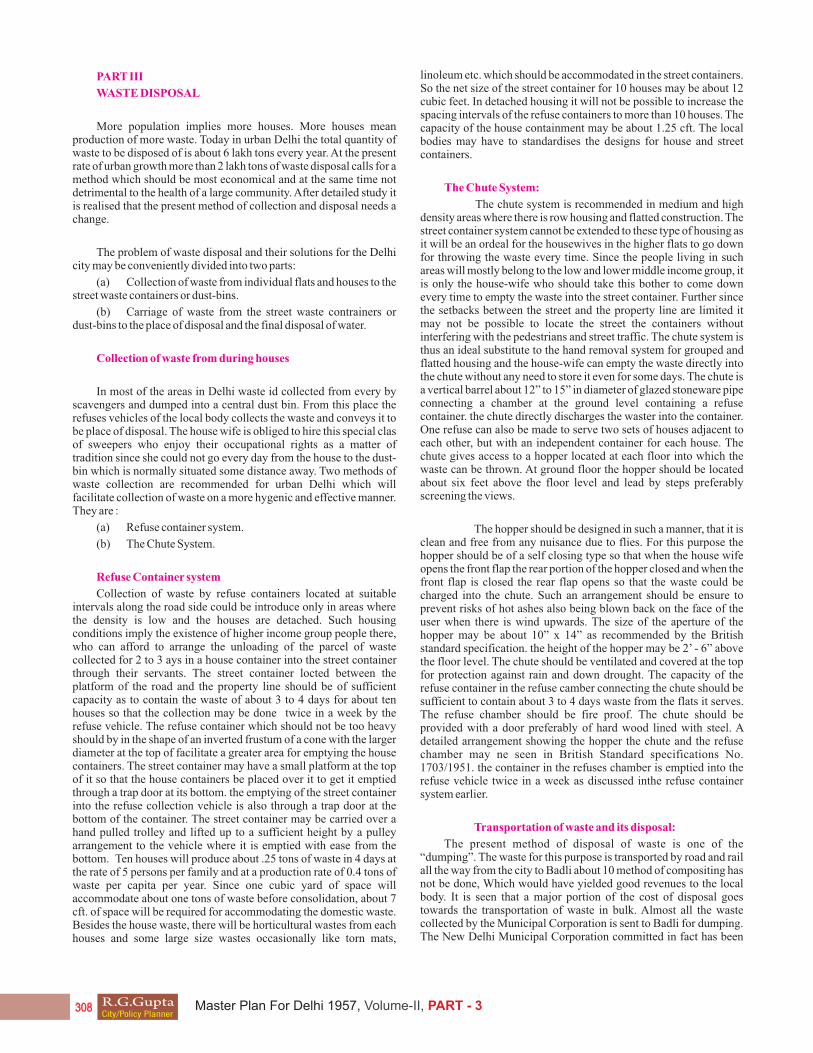
PART III
WASTE DISPOSAL
More population implies more houses. More houses mean production of more waste. Today in urban Delhi the total quantity of waste to be disposed of is about 6 lakh tons every year. At the present rate of urban growth more than 2 lakh tons of waste disposal calls for a method which should be most economical and at the same time not detrimental to the health of a large community. After detailed study it is realised that the present method of collection and disposal needs a change.
The problem of waste disposal and their solutions for the Delhi city may be conveniently divided into two parts:
(a) Collection of waste from individual flats and houses to the street waste containers or dust-bins.
(b) Carriage of waste from the street waste contrainers or dust-bins to the place of disposal and the final disposal of water.
Collection of waste from during houses
In most of the areas in Delhi waste id collected from every by scavengers and dumped into a central dust bin. From this place the refuses vehicles of the local body collects the waste and conveys it to be place of disposal. The house wife is obliged to hire this special clas of sweepers who enjoy their occupational rights as a matter of tradition since she could not go every day from the house to the dust-bin which is normally situated some distance away. Two methods of waste collection are recommended for urban Delhi which will facilitate collection of waste on a more hygenic and effective manner. They are :
(a) Refuse container system.
(b) The Chute System.
Refuse Container system
Collection of waste by refuse containers located at suitable intervals along the road side could be introduce only in areas where the density is low and the houses are detached. Such housing conditions imply the existence of higher income group people there, who can afford to arrange the unloading of the parcel of waste collected for 2 to 3 ays in a house container into the street container through their servants. The street container locted between the platform of the road and the property line should be of sufficient capacity as to contain the waste of about 3 to 4 days for about ten houses so that the collection may be done twice in a week by the refuse vehicle. The refuse container which should not be too heavy should by in the shape of an inverted frustum of a cone with the larger diameter at the top of facilitate a greater area for emptying the house containers. The street container may have a small platform at the top of it so that the house containers be placed over it to get it emptied through a trap door at its bottom. the emptying of the street container into the refuse collection vehicle is also through a trap door at the bottom of the container. The street container may be carried over a hand pulled trolley and lifted up to a sufficient height by a pulley arrangement to the vehicle where it is emptied with ease from the bottom. Ten houses will produce about .25 tons of waste in 4 days at the rate of 5 persons per family and at a production rate of 0.4 tons of waste per capita per year. Since one cubic yard of space will accommodate about one tons of waste before consolidation, about 7 cft. of space will be required for accommodating the domestic waste. Besides the house waste, there will be horticultural wastes from each houses and some large size wastes occasionally like torn mats,
linoleum etc. which should be accommodated in the street containers. So the net size of the street container for 10 houses may be about 12 cubic feet. In detached housing it will not be possible to increase the spacing intervals of the refuse containers to more than 10 houses. The capacity of the house containment may be about 1.25 cft. The local bodies may have to standardises the designs for house and street containers.
The Chute System:
The chute system is recommended in medium and high density areas where there is row housing and flatted construction. The street container system cannot be extended to these type of housing as it will be an ordeal for the housewives in the higher flats to go down for throwing the waste every time. Since the people living in such areas will mostly belong to the low and lower middle income group, it is only the house-wife who should take this bother to come down every time to empty the waste into the street container. Further since the setbacks between the street and the property line are limited it may not be possible to locate the street the containers without interfering with the pedestrians and street traffic. The chute system is thus an ideal substitute to the hand removal system for grouped and flatted housing and the house-wife can empty the waste directly into the chute without any need to store it even for some days. The chute is a vertical barrel about 12” to 15” in diameter of glazed stoneware pipe connecting a chamber at the ground level containing a refuse container. the chute directly discharges the waster into the container. One refuse can also be made to serve two sets of houses adjacent to each other, but with an independent container for each house. The chute gives access to a hopper located at each floor into which the waste can be thrown. At ground floor the hopper should be located about six feet above the floor level and lead by steps preferably screening the views.
The hopper should be designed in such a manner, that it is clean and free from any nuisance due to flies. For this purpose the hopper should be of a self closing type so that when the house wife opens the front flap the rear portion of the hopper closed and when the front flap is closed the rear flap opens so that the waste could be charged into the chute. Such an arrangement should be ensure to prevent risks of hot ashes also being blown back on the face of the user when there is wind upwards. The size of the aperture of the hopper may be about 10” x 14” as recommended by the British standard specification. the height of the hopper may be 2’ - 6” above the floor level. The chute should be ventilated and covered at the top for protection against rain and down drought. The capacity of the refuse container in the refuse camber connecting the chute should be sufficient to contain about 3 to 4 days waste from the flats it serves. The refuse chamber should be fire proof. The chute should be provided with a door preferably of hard wood lined with steel. A detailed arrangement showing the hopper the chute and the refuse chamber may ne seen in British Standard specifications No. 1703/1951. the container in the refuses chamber is emptied into the refuse vehicle twice in a week as discussed inthe refuse container system earlier.
Transportation of waste and its disposal:
The present method of disposal of waste is one of the “dumping”. The waste for this purpose is transported by road and rail all the way from the city to Badli about 10 method of compositing has not be done, Which would have yielded good revenues to the local body. It is seen that a major portion of the cost of disposal goes towards the transportation of waste in bulk. Almost all the waste collected by the Municipal Corporation is sent to Badli for dumping. The New Delhi Municipal Corporation committed in fact has been
R.G.GuptaCity/Policy Planner
Master Plan For Delhi 1957, Volume-II, PART - 3
adopting comparatively a cheaper method of disposal - filling up low lying lands through it is not to the desired standard. The total quantity of waste disposed of every year and the cost to the two local bodies are given in the table below.
It may be seen from the above table that the disposal cost per ton of waste for NDMC is about 1.66 while for the MCD it is about Rs. 3.68. This excessive cost of disposal for the MCD it is about Rs. 3.68. The excessive cost of disposal for the MCD is mainly due to the cost of
bulk transportation of waste is collected in trucks from different streets and unloaded at the goods yard at the New Delhi and Subzimandi Stations. Again it is loaded into the wagons and transported to Badli where it is unloaded at the yard there. The unloaded waste from the Badli yard is carried and dumped at the site. Thus more than 50% of the cost of disposal, is incurred over mass transportation of waste from the city to the Badli dumping ground.
Suggested method for waste disposal
There are several method for disposal of waste. The most popular among them are: sea disposal, pulverisation, incineration, destruction of bacterial agency, compositing and sanitary filling is to be recommended the place should be coastal town or it should have many low lying areas for reclamation. Other method like pulverisation and incineration will involve a heavy capital outlay for installing the required machinery. Of course, composting is the most economic process, if the other two methods of disposal cannot be adopted.
In Delhi, a simple and economic method of disposal of waste would be that of “Sanitary filling”. It has been estimated that more than 3,000 acres of land even with in the urbanisable area is available for reclamation. Most of this land lies within the built up city. These sites if reclamated after sanitary filling could be used even for building purposes and most of them could prove to be ideal places for recreation, especially in the congested localities where such facilities are badly lacking.
Sanitary filling is a simple process of filling low laying pockets with waste in between layers of earth. The soil layer is of course thinner as compare to the waster layer and the local soil itself could be made use of for this purpose. By biological action, the gets
S. No.Name of the Local Body
Population in Lakhs
Cost of disposalper capita in rupees
Cost of disposalper tonsin rupees
per capita garbage
conbuted in tons
Total cost of disposal of waste
per year in lakhs of rupees
Garbage collected& disposed per annum in tons
1. MCD 17.75 468,000 17.26 0.96 3.68 0.27
2. NDMC 2.25 90,000 1.5 0.66 1.66 0.40
Total 20.00 558,000 18.76
decomposed and after some time it becomes consolidated and hard. An experimental fill made in Delhi at so quick tven thick rage have decayed and got consolidated with the soil within a year. Further, this process can be employed very near to the living environs without any nuisance only if it is done properly. Thus sanitary filling has several advantages. On the one hand, it could convert many unusable lands which get water logged and are a source of breeding flies and mosquitoes as usable urban land, whose value especially in the developed areas is very high. Besides, the cost of waste disposal could be reduced to the minimum; the place of disposal being very near to the place of collection. In the succeeding paragraphs a programme has been given for reclaiming valuable urban lands that are at present lying waste.
Disposal of waste by sanitary filling has been suggested to cover about 70% of the low lying areas within the urbanisable limits. The areas available for reclamation are so large that filling could be continued even after 1981. But the program for filling hs been worked out only till 1981 for the present. The study conducted on the existing system of waste collection and disposal has indicated that the per capita waster contributed per annum in the MCD area is about 0.27 tons. While for the N.D.M.C. area it is about 0.4 tons. The higher figure for the NDMC is to be attributed to the horticultural waste from the lawns and gardens in that area which is considerable as compared to the other parts of the city. This excluded waster from housing construction and dry industrial waste. For the purpose of working out the space requirements for sanitary filling an average figure of 0.4 tons per capita has been taken which includes waste from industries and constructional waste as well. Thus the total quantity of waste to be disposed of, over a period of 20 years works out to about 28 million tons - or say 30 million tons. It has been found that a volume of one cubic yard can accommodate about 1.8 tones of consolidated waste. At this rate the volume needed for filling will be about 16.66 million cubic yards. The suggested sites for filling and the volumes available are indicated in the table below:
Table No. 10
S. No.Area in lakh
Sq. Yds. Depth of filling
in yardsVolume in lakhs
Cubic yds. Location of site for sanitary filling
1 South of Indraprastha Estate (along Ring Road) 38.43 2.00 76.86
2 South of Moti Bagh at the Ring Road 12.39 2.00 24.78
3 Ramjas Hill 1.86 2.33 4.33
4 East of Kirti Nagar 4.03 2.00 8.06
5 North of Model Town 8.05 1.67 13.44
6 Lodhi road Area 1.86 1.67 3.10
R.G.GuptaCity/Policy Planner
Master Plan For Delhi 1957, Volume-II, PART - 3
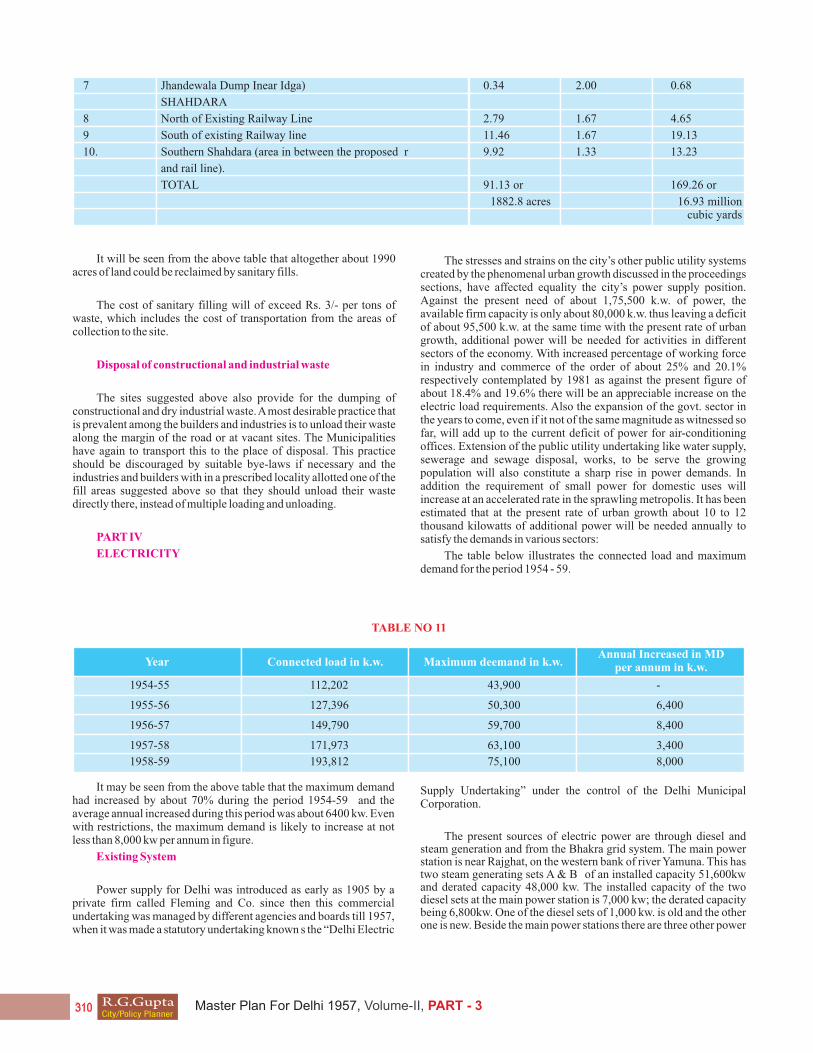
7 Jhandewala Dump Inear Idga) 0.34 2.00 0.68
SHAHDARA
8 North of Existing Railway Line 2.79 1.67 4.65
9 South of existing Railway line 11.46 1.67 19.13
10. Southern Shahdara (area in between the proposed r 9.92 1.33 13.23
and rail line).
TOTAL 91.13 or 169.26 or
1882.8 acres 16.93 million cubic yards
It will be seen from the above table that altogether about 1990 acres of land could be reclaimed by sanitary fills.
The cost of sanitary filling will of exceed Rs. 3/- per tons of waste, which includes the cost of transportation from the areas of collection to the site.
Disposal of constructional and industrial waste
The sites suggested above also provide for the dumping of constructional and dry industrial waste. A most desirable practice that is prevalent among the builders and industries is to unload their waste along the margin of the road or at vacant sites. The Municipalities have again to transport this to the place of disposal. This practice should be discouraged by suitable bye-laws if necessary and the industries and builders with in a prescribed locality allotted one of the fill areas suggested above so that they should unload their waste directly there, instead of multiple loading and unloading.
PART IV
ELECTRICITY
The stresses and strains on the city’s other public utility systems created by the phenomenal urban growth discussed in the proceedings sections, have affected equality the city’s power supply position. Against the present need of about 1,75,500 k.w. of power, the available firm capacity is only about 80,000 k.w. thus leaving a deficit of about 95,500 k.w. at the same time with the present rate of urban growth, additional power will be needed for activities in different sectors of the economy. With increased percentage of working force in industry and commerce of the order of about 25% and 20.1% respectively contemplated by 1981 as against the present figure of about 18.4% and 19.6% there will be an appreciable increase on the electric load requirements. Also the expansion of the govt. sector in the years to come, even if it not of the same magnitude as witnessed so far, will add up to the current deficit of power for air-conditioning offices. Extension of the public utility undertaking like water supply, sewerage and sewage disposal, works, to be serve the growing population will also constitute a sharp rise in power demands. In addition the requirement of small power for domestic uses will increase at an accelerated rate in the sprawling metropolis. It has been estimated that at the present rate of urban growth about 10 to 12 thousand kilowatts of additional power will be needed annually to satisfy the demands in various sectors:
The table below illustrates the connected load and maximum demand for the period 1954 - 59.
TABLE NO 11
Year Connected load in k.w. Maximum deemand in k.w.Annual Increased in MD
per annum in k.w.
1954-55 112,202 43,900 -
1955-56 127,396 50,300 6,400
1956-57 149,790 59,700 8,400
1957-58 171,973 63,100 3,400
1958-59 193,812 75,100 8,000
It may be seen from the above table that the maximum demand had increased by about 70% during the period 1954-59 and the average annual increased during this period was about 6400 kw. Even with restrictions, the maximum demand is likely to increase at not less than 8,000 kw per annum in figure.
Existing System
Power supply for Delhi was introduced as early as 1905 by a private firm called Fleming and Co. since then this commercial undertaking was managed by different agencies and boards till 1957, when it was made a statutory undertaking known s the “Delhi Electric
Supply Undertaking” under the control of the Delhi Municipal Corporation.
The present sources of electric power are through diesel and steam generation and from the Bhakra grid system. The main power station is near Rajghat, on the western bank of river Yamuna. This has two steam generating sets A & B of an installed capacity 51,600kw and derated capacity 48,000 kw. The installed capacity of the two diesel sets at the main power station is 7,000 kw; the derated capacity being 6,800kw. One of the diesel sets of 1,000 kw. is old and the other one is new. Beside the main power stations there are three other power
R.G.GuptaCity/Policy Planner
Master Plan For Delhi 1957, Volume-II, PART - 3
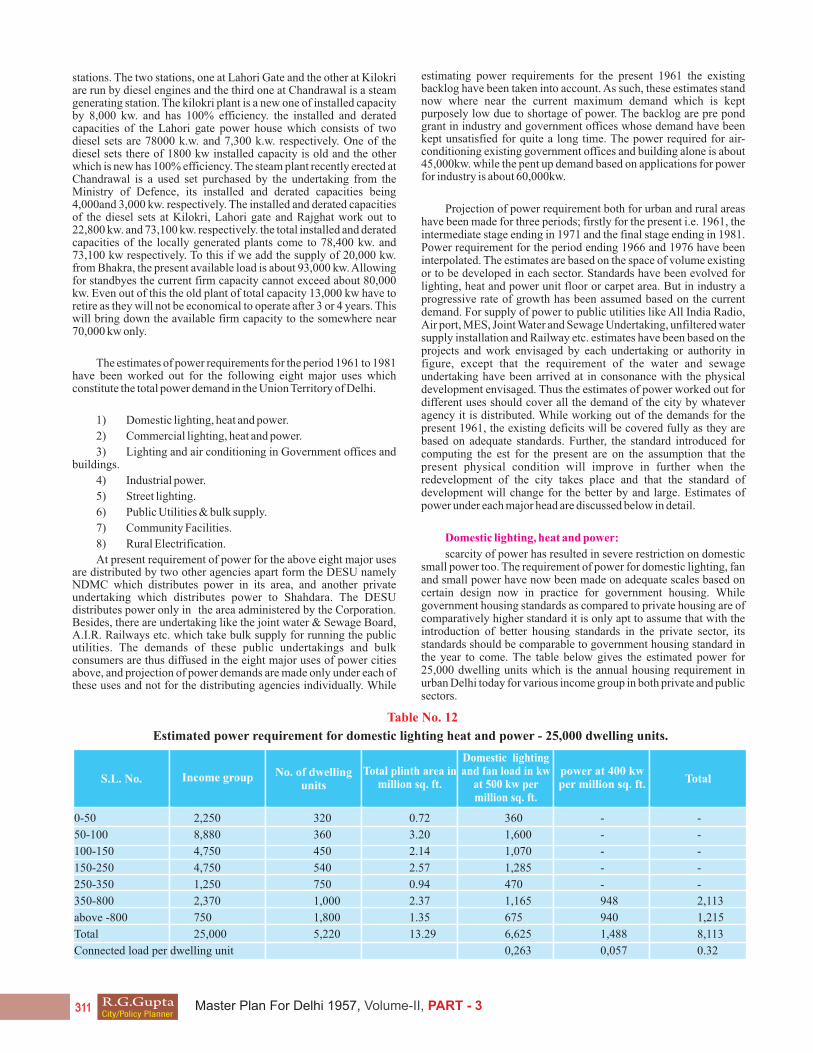
stations. The two stations, one at Lahori Gate and the other at Kilokri are run by diesel engines and the third one at Chandrawal is a steam generating station. The kilokri plant is a new one of installed capacity by 8,000 kw. and has 100% efficiency. the installed and derated capacities of the Lahori gate power house which consists of two diesel sets are 78000 k.w. and 7,300 k.w. respectively. One of the diesel sets there of 1800 kw installed capacity is old and the other which is new has 100% efficiency. The steam plant recently erected at Chandrawal is a used set purchased by the undertaking from the Ministry of Defence, its installed and derated capacities being 4,000and 3,000 kw. respectively. The installed and derated capacities of the diesel sets at Kilokri, Lahori gate and Rajghat work out to 22,800 kw. and 73,100 kw. respectively. the total installed and derated capacities of the locally generated plants come to 78,400 kw. and 73,100 kw respectively. To this if we add the supply of 20,000 kw. from Bhakra, the present available load is about 93,000 kw. Allowing for standbyes the current firm capacity cannot exceed about 80,000 kw. Even out of this the old plant of total capacity 13,000 kw have to retire as they will not be economical to operate after 3 or 4 years. This will bring down the available firm capacity to the somewhere near 70,000 kw only.
The estimates of power requirements for the period 1961 to 1981 have been worked out for the following eight major uses which constitute the total power demand in the Union Territory of Delhi.
1) Domestic lighting, heat and power.
2) Commercial lighting, heat and power.
3) Lighting and air conditioning in Government offices and buildings.
4) Industrial power.
5) Street lighting.
6) Public Utilities & bulk supply.
7) Community Facilities.
8) Rural Electrification.
At present requirement of power for the above eight major uses are distributed by two other agencies apart form the DESU namely NDMC which distributes power in its area, and another private undertaking which distributes power to Shahdara. The DESU distributes power only in the area administered by the Corporation. Besides, there are undertaking like the joint water & Sewage Board, A.I.R. Railways etc. which take bulk supply for running the public utilities. The demands of these public undertakings and bulk consumers are thus diffused in the eight major uses of power cities above, and projection of power demands are made only under each of these uses and not for the distributing agencies individually. While
estimating power requirements for the present 1961 the existing backlog have been taken into account. As such, these estimates stand now where near the current maximum demand which is kept purposely low due to shortage of power. The backlog are pre pond grant in industry and government offices whose demand have been kept unsatisfied for quite a long time. The power required for air-conditioning existing government offices and building alone is about 45,000kw. while the pent up demand based on applications for power for industry is about 60,000kw.
Projection of power requirement both for urban and rural areas have been made for three periods; firstly for the present i.e. 1961, the intermediate stage ending in 1971 and the final stage ending in 1981. Power requirement for the period ending 1966 and 1976 have been interpolated. The estimates are based on the space of volume existing or to be developed in each sector. Standards have been evolved for lighting, heat and power unit floor or carpet area. But in industry a progressive rate of growth has been assumed based on the current demand. For supply of power to public utilities like All India Radio, Air port, MES, Joint Water and Sewage Undertaking, unfiltered water supply installation and Railway etc. estimates have been based on the projects and work envisaged by each undertaking or authority in figure, except that the requirement of the water and sewage undertaking have been arrived at in consonance with the physical development envisaged. Thus the estimates of power worked out for different uses should cover all the demand of the city by whatever agency it is distributed. While working out of the demands for the present 1961, the existing deficits will be covered fully as they are based on adequate standards. Further, the standard introduced for computing the est for the present are on the assumption that the present physical condition will improve in further when the redevelopment of the city takes place and that the standard of development will change for the better by and large. Estimates of power under each major head are discussed below in detail.
Domestic lighting, heat and power:
scarcity of power has resulted in severe restriction on domestic small power too. The requirement of power for domestic lighting, fan and small power have now been made on adequate scales based on certain design now in practice for government housing. While government housing standards as compared to private housing are of comparatively higher standard it is only apt to assume that with the introduction of better housing standards in the private sector, its standards should be comparable to government housing standard in the year to come. The table below gives the estimated power for 25,000 dwelling units which is the annual housing requirement in urban Delhi today for various income group in both private and public sectors.
Table No. 12
Estimated power requirement for domestic lighting heat and power - 25,000 dwelling units.
S.L. No. Income group No. of dwelling units
Total plinth area inmillion sq. ft.
Domestic lighting and fan load in kw
at 500 kw per million sq. ft.
power at 400 kw per million sq. ft. Total
0-50 2,250 320 0.72 360 - -
50-100 8,880 360 3.20 1,600 - -
100-150 4,750 450 2.14 1,070 - -
150-250 4,750 540 2.57 1,285 - -
250-350 1,250 750 0.94 470 - -
350-800 2,370 1,000 2.37 1,165 948 2,113
above -800 750 1,800 1.35 675 940 1,215
Total 25,000 5,220 13.29 6,625 1,488 8,113
Connected load per dwelling unit 0,263 0,057 0.32
R.G.GuptaCity/Policy Planner
Master Plan For Delhi 1957, Volume-II, PART - 3

The income group breakdown as given inn the table above is based on the survey conducted by the Delhi School of Economics for urban Delhi. It may be seen from the above table that the total annual requirement og power for domestic lighting and fan alone above is about 6625 kw. while the requirement for small power for income groups above Rs. 350/- is 1488 kw. bringing the total requirement to 8113 kw. This gives a connected load of 0.263 kw. for lighting and fan and 0.057 kw. for small power per dwelling units on an average. The average requirement of domestic power per dwelling unit thus works
out to 0.32kw. It has been assumed that power connections will be needed only for income group above Rs. 350/-
While working out the requirements of power for the urban households the above scale of power has been used.
The table below shown the estimated power requirement in the domestic sector during the period 1961-1981
Table N. 13
It may be seen from the above table that by 1961, the total number of
dwelling units in urban Delhi will be about 4.756 lakhs and the total
connected load required will be 1,54,120kw. of which 127,000 k.w.
will be required for lighting and fans and the remaining 27,120 kw.
will be required for heat and remaining 27,120 kw. will be required
for heat and power. By 1971 the number of dwelling units will be
about 7,35,600/-. The estimated power for the above number of
houses works out of 2,38,300 kw. of connected load of which
1,96,200 will be required for lighting and fans and 42,100 kw. will be
required for heat and power connections. By 1981 the number of
dwelling units in urban Delhi will also increase to 10.67 lakhs which
will need about 3,43,500 of connected load. Of this 2,81,800 will be
required for lighting and fan and the remaining 61,500 kw for heat
and power. The number of dwelling units have been worked out at an
average rate of 4.5 persons per house hold. It may be seen from the
above table that during the period 1961 -1981 the requirement of
power in the domestic sector would have more than doubled.
Period No of units in
lakhs
Total average connected
load for lighting per D. unit kw
Total connected load for
lighting in k.w.
Average connected load for heat &
power per d. unit in K.w.
Total connected load for heat & power per D.
unit in Kw.
Total connected load for
lighting heat & power in kw
1961 4.756 0.263 1,27,000 0.057 27,120 1,54,120
1971 7.356 0.263 1,96,000 0.057 42,100 2,38,300
1981 10.67 0.263 1,81,000 0.057 61,500 3,43,300
Year Working force in
Million
Rate of floorspace in sq. ft. per
worker
Total floor space in million
sq. ft.
Light and fan load in kw at 1000kw
per million sq . ft.
Heat and power at 1000 kw per million
sq. ft.
Total connected load in kw
1961 0.245 200 49.00 49,000 49,000 98000
1971 0.355 200 71.00 49,000 71,000 1,42,000
1981 0.59 200 1,18.00 1,18,000 1,18,000 2,36,000
2. Commercial Power:
The requirement of power for business and commercial establishments, finance, liberal art and professional sectors are based on the space requirements for the period 1961-81. Requirements of power for light & fans, heat and power have been based on the existing standard of illumination, heating and cooling which are found satisfactory. A connected load of 1000 kw. for light and fans and 1000 kw for heat and power per million sq. ft. of floor area has been considered adequate. The light and fan load adopted for the commercial sector is higher than what has been adopted for the domestic sector since the commercial area will require a higher intensity of lighting. While working out the standard for lighting and fans, the storage space, and the space which will not required intense illumunation have been taken into account. Heat and power requirements have been worked out at 1000 kw. per million sq. ft. The figure only represented the average since only about 1/6 to 1/10th of the floor space will require air conditioning and all the establishments may not go in for power connections. The estimated requirements of power for the period 1961 - 81 in the commerce and business sectors are given in the table below:
Table No. 14
Estimated connected load for fans, lighting and power in commerce and finance, profession and liberal arts sectors by 1981.
It may ben seen from the above table that by 1961, the working force in the commerce and business sectors would be about 2,45,000 persons and at a space requirement of 200 sq. ft. per worker about 49 million sq. ft. of floor space will be needed. The light, fan, heat and power load for the above space worked out to 98,000 kw. which is shared equally by lights and fans, heat and power connections. By 1971 the working force will rise to 3,55,000 workers and the total space needed will be about 71 million sq. ft. Requirement of power for the above space will be about 1,42,000 kw of connected load shared equally by lighting and power connections. By the end of 1981
the working force in the business and commerce sectors would have reached a figure 5,90,000 workers which will need a total space of 118 million sq. ft. The total connected load for the above space will be 2,36,000 kw which will be shared equally by the light and fan heat and power connections. It may be seen from the above table that the requirement of power during the period 1961-81 would have risen from 98,000 kw. to 2,36,000 kw. of connected load i.e. it would have more than doubled.
3. Lighting, Fan and Air conditioning, Loads in Government
R.G.GuptaCity/Policy Planner
Master Plan For Delhi 1957, Volume-II, PART - 3
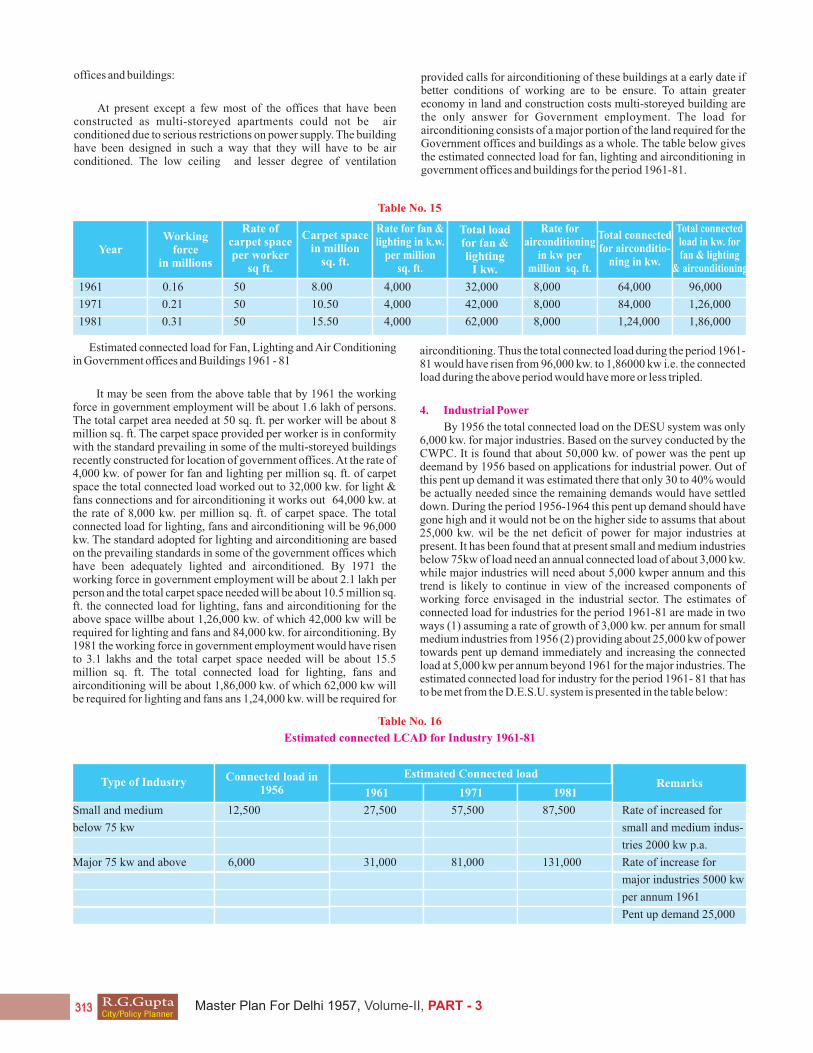
offices and buildings:
At present except a few most of the offices that have been constructed as multi-storeyed apartments could not be air conditioned due to serious restrictions on power supply. The building have been designed in such a way that they will have to be air conditioned. The low ceiling and lesser degree of ventilation
provided calls for airconditioning of these buildings at a early date if better conditions of working are to be ensure. To attain greater economy in land and construction costs multi-storeyed building are the only answer for Government employment. The load for airconditioning consists of a major portion of the land required for the Government offices and buildings as a whole. The table below gives the estimated connected load for fan, lighting and airconditioning in government offices and buildings for the period 1961-81.
Table No. 15
YearWorking
force in millions
Carpet space in million
sq. ft.
Total connected load in kw. for fan & lighting
& airconditioning
Total connected for airconditio-
ning in kw.
Total loadfor fan & lighting
I kw.
Rate for airconditioning
in kw per million sq. ft.
Rate for fan & lighting in k.w.
per million sq. ft.
Rate of carpet spaceper worker
sq ft.
1961 0.16 50 8.00 4,000 32,000 8,000 64,000 96,000
1971 0.21 50 10.50 4,000 42,000 8,000 84,000 1,26,000
1981 0.31 50 15.50 4,000 62,000 8,000 1,24,000 1,86,000
Estimated connected load for Fan, Lighting and Air Conditioning in Government offices and Buildings 1961 - 81
It may be seen from the above table that by 1961 the working force in government employment will be about 1.6 lakh of persons. The total carpet area needed at 50 sq. ft. per worker will be about 8 million sq. ft. The carpet space provided per worker is in conformity with the standard prevailing in some of the multi-storeyed buildings recently constructed for location of government offices. At the rate of 4,000 kw. of power for fan and lighting per million sq. ft. of carpet space the total connected load worked out to 32,000 kw. for light & fans connections and for airconditioning it works out 64,000 kw. at the rate of 8,000 kw. per million sq. ft. of carpet space. The total connected load for lighting, fans and airconditioning will be 96,000 kw. The standard adopted for lighting and airconditioning are based on the prevailing standards in some of the government offices which have been adequately lighted and airconditioned. By 1971 the working force in government employment will be about 2.1 lakh per person and the total carpet space needed will be about 10.5 million sq. ft. the connected load for lighting, fans and airconditioning for the above space willbe about 1,26,000 kw. of which 42,000 kw will be required for lighting and fans and 84,000 kw. for airconditioning. By 1981 the working force in government employment would have risen to 3.1 lakhs and the total carpet space needed will be about 15.5 million sq. ft. The total connected load for lighting, fans and airconditioning will be about 1,86,000 kw. of which 62,000 kw will be required for lighting and fans ans 1,24,000 kw. will be required for
airconditioning. Thus the total connected load during the period 1961-81 would have risen from 96,000 kw. to 1,86000 kw i.e. the connected load during the above period would have more or less tripled.
4. Industrial Power
By 1956 the total connected load on the DESU system was only 6,000 kw. for major industries. Based on the survey conducted by the CWPC. It is found that about 50,000 kw. of power was the pent up deemand by 1956 based on applications for industrial power. Out of this pent up demand it was estimated there that only 30 to 40% would be actually needed since the remaining demands would have settled down. During the period 1956-1964 this pent up demand should have gone high and it would not be on the higher side to assums that about 25,000 kw. wil be the net deficit of power for major industries at present. It has been found that at present small and medium industries below 75kw of load need an annual connected load of about 3,000 kw. while major industries will need about 5,000 kwper annum and this trend is likely to continue in view of the increased components of working force envisaged in the industrial sector. The estimates of connected load for industries for the period 1961-81 are made in two ways (1) assuming a rate of growth of 3,000 kw. per annum for small medium industries from 1956 (2) providing about 25,000 kw of power towards pent up demand immediately and increasing the connected load at 5,000 kw per annum beyond 1961 for the major industries. The estimated connected load for industry for the period 1961- 81 that has to be met from the D.E.S.U. system is presented in the table below:
Table No. 16
Estimated connected LCAD for Industry 1961-81
Type of Industry Connected load in 1956
Estimated Connected loadRemarks
1961 1971 1981
Small and medium 12,500 27,500 57,500 87,500 Rate of increased for
below 75 kw small and medium indus-
tries 2000 kw p.a.
Major 75 kw and above 6,000 31,000 81,000 131,000 Rate of increase for
major industries 5000 kw
per annum 1961
Pent up demand 25,000
R.G.GuptaCity/Policy Planner
Master Plan For Delhi 1957, Volume-II, PART - 3
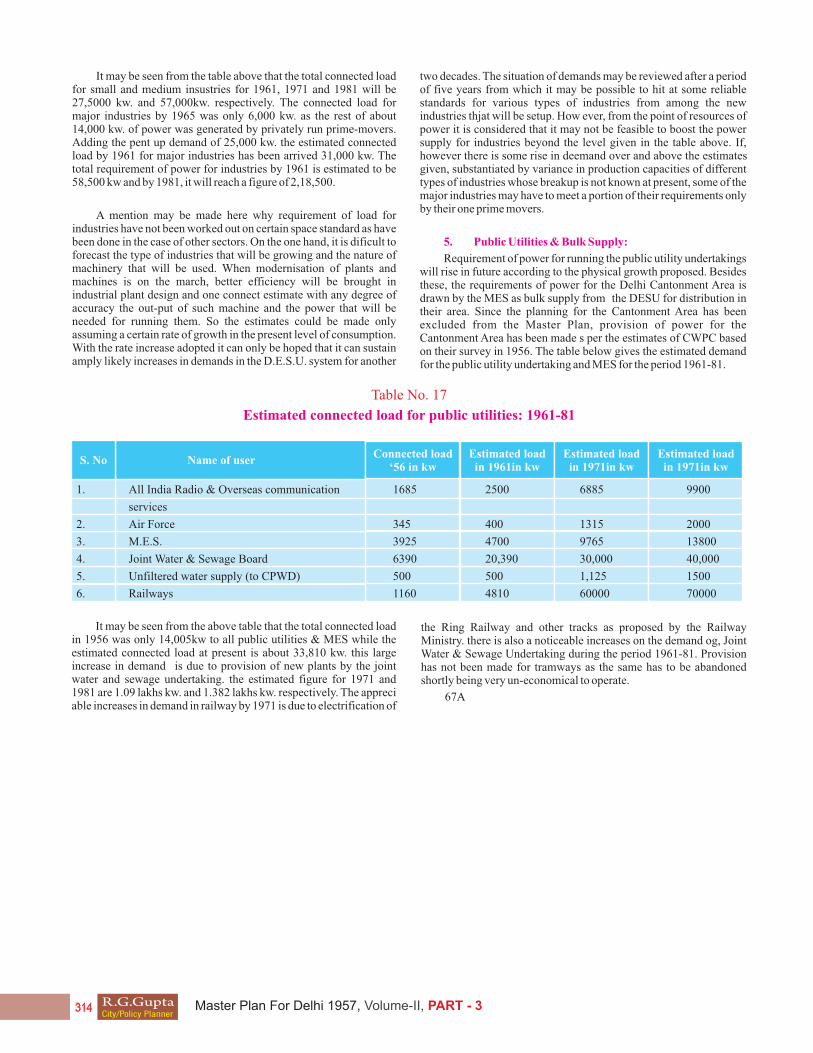
It may be seen from the table above that the total connected load for small and medium insustries for 1961, 1971 and 1981 will be 27,5000 kw. and 57,000kw. respectively. The connected load for major industries by 1965 was only 6,000 kw. as the rest of about 14,000 kw. of power was generated by privately run prime-movers. Adding the pent up demand of 25,000 kw. the estimated connected load by 1961 for major industries has been arrived 31,000 kw. The total requirement of power for industries by 1961 is estimated to be 58,500 kw and by 1981, it will reach a figure of 2,18,500.
A mention may be made here why requirement of load for industries have not been worked out on certain space standard as have been done in the case of other sectors. On the one hand, it is dificult to forecast the type of industries that will be growing and the nature of machinery that will be used. When modernisation of plants and machines is on the march, better efficiency will be brought in industrial plant design and one connect estimate with any degree of accuracy the out-put of such machine and the power that will be needed for running them. So the estimates could be made only assuming a certain rate of growth in the present level of consumption. With the rate increase adopted it can only be hoped that it can sustain amply likely increases in demands in the D.E.S.U. system for another
two decades. The situation of demands may be reviewed after a period of five years from which it may be possible to hit at some reliable standards for various types of industries from among the new industries thjat will be setup. How ever, from the point of resources of power it is considered that it may not be feasible to boost the power supply for industries beyond the level given in the table above. If, however there is some rise in deemand over and above the estimates given, substantiated by variance in production capacities of different types of industries whose breakup is not known at present, some of the major industries may have to meet a portion of their requirements only by their one prime movers.
5. Public Utilities & Bulk Supply:
Requirement of power for running the public utility undertakings will rise in future according to the physical growth proposed. Besides these, the requirements of power for the Delhi Cantonment Area is drawn by the MES as bulk supply from the DESU for distribution in their area. Since the planning for the Cantonment Area has been excluded from the Master Plan, provision of power for the Cantonment Area has been made s per the estimates of CWPC based on their survey in 1956. The table below gives the estimated demand for the public utility undertaking and MES for the period 1961-81.
Table No. 17
Estimated connected load for public utilities: 1961-81
It may be seen from the above table that the total connected load in 1956 was only 14,005kw to all public utilities & MES while the estimated connected load at present is about 33,810 kw. this large increase in demand is due to provision of new plants by the joint water and sewage undertaking. the estimated figure for 1971 and 1981 are 1.09 lakhs kw. and 1.382 lakhs kw. respectively. The appreci able increases in demand in railway by 1971 is due to electrification of
Connected load ‘56 in kw
Estimated load in 1961in kw
Estimated load in 1971in kw
Estimated load in 1971in kw
S. No Name of user
1. All India Radio & Overseas communication 1685 2500 6885 9900
services
2. Air Force 345 400 1315 2000
3. M.E.S. 3925 4700 9765 13800
4. Joint Water & Sewage Board 6390 20,390 30,000 40,000
5. Unfiltered water supply (to CPWD) 500 500 1,125 1500
6. Railways 1160 4810 60000 70000
the Ring Railway and other tracks as proposed by the Railway Ministry. there is also a noticeable increases on the demand og, Joint Water & Sewage Undertaking during the period 1961-81. Provision has not been made for tramways as the same has to be abandoned shortly being very un-economical to operate.
67A
R.G.GuptaCity/Policy Planner
Master Plan For Delhi 1957, Volume-II, PART - 3
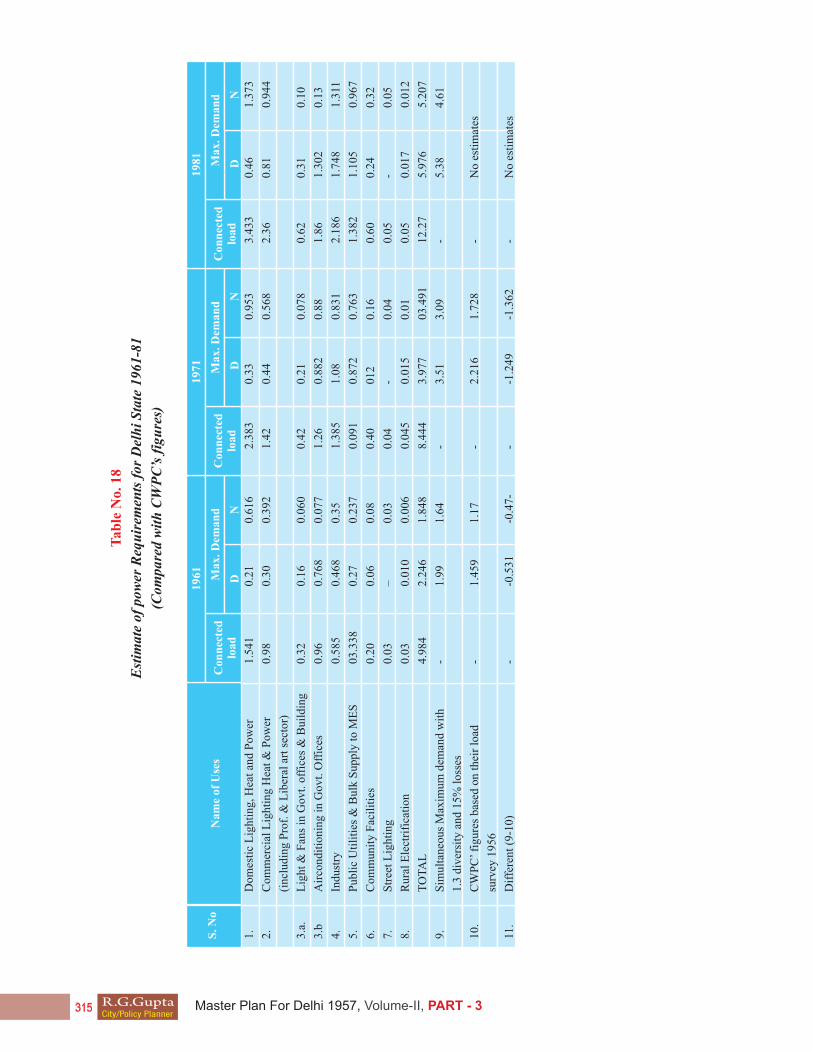
Tab
le N
o. 1
8
Est
imat
e of
pow
er R
equ
irem
ents
for
Del
hi
Sta
te 1
961-
81
(Com
pare
d w
ith
CW
PC
’s f
igu
res)
S. N
oN
ame
of U
ses
1961 M
ax. D
eman
dM
ax. D
eman
dM
ax. D
eman
d
DN
DN
DN
Con
nec
ted
load
Con
nec
ted
load
Con
nec
ted
load
1971
1981
1.
Dom
esti
c L
ight
ing,
Hea
t an
d P
ower
1.54
1 0.
21
0.61
6 2.
383
0.3
3 0.
953
3.43
3 0.
46
1.37
3
2.
Com
mer
cial
Lig
htin
g H
eat
& P
ower
0.98
0.
30
0.39
2 1.
42
0.44
0.
568
2.36
0.
81
0.94
4
(i
nclu
ding
Pro
f. &
Lib
eral
art
sec
tor)
3.a.
L
ight
& F
ans
in G
ovt.
off
ices
& B
uild
ing
0.32
0.
16
0.06
0 0.
42
0.21
0.
078
0.62
0.
31
0.10
3.b
Air
cond
itio
ning
in
Gov
t. O
ffic
es
0.
96
0.76
8 0.
077
1.26
0.
882
0.88
1.
86
1.30
2 0.
13
4.
Indu
stry
0.
585
0.46
8 0.
35
1.38
5 1.
08
0.83
1 2.
186
1.74
8 1.
311
5.
Pub
lic
Uti
liti
es &
Bul
k S
uppl
y to
ME
S
03.3
38
0.27
0.
237
0.09
1 0.
872
0.76
3 1.
382
1.10
5 0.
967
6.
Com
mun
ity
Fac
ilit
ies
0.20
0.
06
0.08
0.
40
012
0.16
0.
60
0.24
0.
32
7.
Str
eet
Lig
htin
g
0.03
–
0.03
0.
04
- 0.
04
0.05
-
0.05
8.
Rur
al E
lect
rifi
cati
on
0.03
0.
010
0.00
6 0.
045
0.01
5 0.
01
0.05
0.
017
0.01
2
T
OT
AL
4.
984
2.24
6 1.
848
8.44
4 3.
977
03.4
91
12.2
7 5.
976
5.20
7
9.
Sim
ulta
neou
s M
axim
um d
eman
d w
ith
-
1.99
1.
64
- 3.
51
3.09
-
5.38
4.
61
1.
3 di
vers
ity
and
15%
los
ses
10.
CW
PC
’ fi
gure
s ba
sed
on t
heir
loa
d
- 1.
459
1.17
-
2.21
6 1.
728
- N
o es
tim
ates
su
rvey
195
6
11.
Dif
fere
nt (
9-10
)
-
-0.5
31
-0.4
7-
- -1
.249
-1
.362
-
No
esti
mat
es
R.G.GuptaCity/Policy Planner
Master Plan For Delhi 1957, Volume-II, PART - 3
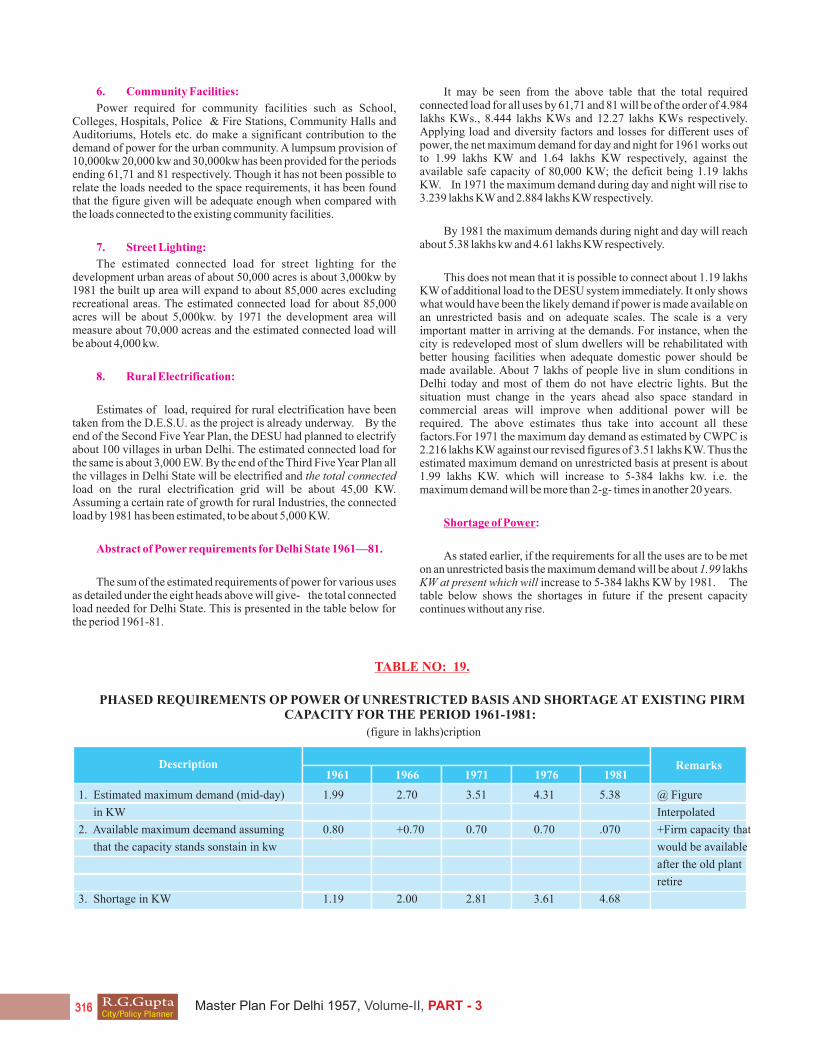
6. Community Facilities:
Power required for community facilities such as School, Colleges, Hospitals, Police & Fire Stations, Community Halls and Auditoriums, Hotels etc. do make a significant contribution to the demand of power for the urban community. A lumpsum provision of 10,000kw 20,000 kw and 30,000kw has been provided for the periods ending 61,71 and 81 respectively. Though it has not been possible to relate the loads needed to the space requirements, it has been found that the figure given will be adequate enough when compared with the loads connected to the existing community facilities.
7. Street Lighting:
The estimated connected load for street lighting for the development urban areas of about 50,000 acres is about 3,000kw by 1981 the built up area will expand to about 85,000 acres excluding recreational areas. The estimated connected load for about 85,000 acres will be about 5,000kw. by 1971 the development area will measure about 70,000 acreas and the estimated connected load will be about 4,000 kw.
8. Rural Electrification:
Estimates of load, required for rural electrification have been taken from the D.E.S.U. as the project is already underway. By the end of the Second Five Year Plan, the DESU had planned to electrify about 100 villages in urban Delhi. The estimated connected load for the same is about 3,000 EW. By the end of the Third Five Year Plan all the villages in Delhi State will be electrified and the total connected load on the rural electrification grid will be about 45,00 KW. Assuming a certain rate of growth for rural Industries, the connected load by 1981 has been estimated, to be about 5,000 KW.
Abstract of Power requirements for Delhi State 1961—81.
The sum of the estimated requirements of power for various uses as detailed under the eight heads above will give- the total connected load needed for Delhi State. This is presented in the table below for the period 1961-81.
It may be seen from the above table that the total required connected load for all uses by 61,71 and 81 will be of the order of 4.984 lakhs KWs., 8.444 lakhs KWs and 12.27 lakhs KWs respectively. Applying load and diversity factors and losses for different uses of power, the net maximum demand for day and night for 1961 works out to 1.99 lakhs KW and 1.64 lakhs KW respectively, against the available safe capacity of 80,000 KW; the deficit being 1.19 lakhs KW. In 1971 the maximum demand during day and night will rise to 3.239 lakhs KW and 2.884 lakhs KW respectively.
By 1981 the maximum demands during night and day will reach about 5.38 lakhs kw and 4.61 lakhs KW respectively.
This does not mean that it is possible to connect about 1.19 lakhs KW of additional load to the DESU system immediately. It only shows what would have been the likely demand if power is made available on an unrestricted basis and on adequate scales. The scale is a very important matter in arriving at the demands. For instance, when the city is redeveloped most of slum dwellers will be rehabilitated with better housing facilities when adequate domestic power should be made available. About 7 lakhs of people live in slum conditions in Delhi today and most of them do not have electric lights. But the situation must change in the years ahead also space standard in commercial areas will improve when additional power will be required. The above estimates thus take into account all these factors.For 1971 the maximum day demand as estimated by CWPC is 2.216 lakhs KW against our revised figures of 3.51 lakhs KW. Thus the estimated maximum demand on unrestricted basis at present is about 1.99 lakhs KW. which will increase to 5-384 lakhs kw. i.e. the maximum demand will be more than 2-g- times in another 20 years.
Shortage of Power:
As stated earlier, if the requirements for all the uses are to be met on an unrestricted basis the maximum demand will be about 1.99 lakhs KW at present which will increase to 5-384 lakhs KW by 1981. The table below shows the shortages in future if the present capacity continues without any rise.
TABLE NO: 19.
PHASED REQUIREMENTS OP POWER Of UNRESTRICTED BASIS AND SHORTAGE AT EXISTING PIRM CAPACITY FOR THE PERIOD 1961-1981:
(figure in lakhs)cription
Description1961 1966 1971 1976 1981
Remarks
1. Estimated maximum demand (mid-day) 1.99 2.70 3.51 4.31 5.38 @ Figure
in KW Interpolated
2. Available maximum deemand assuming 0.80 +0.70 0.70 0.70 .070 +Firm capacity that
that the capacity stands sonstain in kw would be available
after the old plant
retire
3. Shortage in KW 1.19 2.00 2.81 3.61 4.68
R.G.GuptaCity/Policy Planner
Master Plan For Delhi 1957, Volume-II, PART - 3

It may be seen from the above table that/with the available firm capacity of only 80,000 KW there is a shortage of about 1.19 lakhs KW of power under various uses at present. After some of the old diesel plants are discounted within another 5 years the firm capacity of the power plants will decline to 70,000 KW. Thus the shortages beyond 1956 will include about 10,000 KW over and the above the anticipated increases. The shortages by 1966, 1971 and 1981 are estimated at 2.00, 2.81, 3.61 & 4.68 lakhs KW respectively. This is precisely the quantity of additional power that will be needed for the future periods, Programme of augmentation of power 1961-81.
The shortages or in other words, the quantity of power to be augmented has been presented in Table No. 19. The next question is how to meet these requirements during various periods so that the demand could be made to match with the power output. There can be only two sources of power (a) local generation (b) the Bhakhra Nangal grid. As regards local generation, there is already a proposal to erect a power plant along the ring road south of the existing power
house.
The other source is an external on i.e, the Bhakhra Nangal power supplied through its^rid at Delhi. In addition to the present supply of 20,000 KW of power, the Punjab Government have already agreed to release about 40,000 KW of power towards the end of March 1961 from the Bhakhra Nangal Grid system for Delhi. After the completion of the left bank power station at Bhakhra it is considered that about 60,000 KW of further supply could be made available from this source i.e. totally about 1,20,000 KW of power should be obtained from the Bhakhra Nangal Grid system. The remaining quantity of power is thus to be locally generated i.e. 3,48,000 KW of power by 1981. Adding to this the existing firm capacity which will deplete to 70,000 KW by 1966 the total available capacity by 1981 will be about 5,38,000 KW while the estimated maximum demand is also the same. The table below gives the programme of augmentation of power from the two .sources Bhakhra Nangal and localgeneration. The quantity of power that should be made available during the four phases of the plan period (1961—81) is also shown.
TABLE NO: 20.
PROGRAMME OF AUGMENTATION OF POWER FOR THE PERIOD 1961-81.
AUGMENTATION
It may be seen from the above table that the requirements of power during different phases of the plan period tally with the proposed augmentation process.It may be stated here that if the quantities proposed to be drawn from the Bhakhra Nangal source do not come forth in full measure either totally or during a particular phase, the same .should be made good by increasing the capacity of the proposed local plant suitably. It is not known whether it would be possible to generate about 3,48,000 KW of additional power locally either by steam or diesel. 73.
PART V - GAS
INTRODUCTION:
In India, the use of gas as a domestic fuel is not very popular except in two cities - Bombay and Calcutta even where it is used only on a very restricted basis. It is seldom realised that gas, apart from being a most efficient and clean fuel, is also very economical as compared to other conventional fuels like charcoal, kerosene, firewood etc. In Delhi, the energy found from conventional fuels constitutes more than half of the total domestic energy consumed. This section analyses the economics of gas and soft coke in the
Description1961 1966 1971 1976
Remarks
1. Hydro-electric power from Bhakhra in KW *40000 100000 100000 100000 *Including 2000 kw for present
supply
2. Thermal Power from the proposed power 150000 180000 260000 348000 + Figure show total power from
station south of the central power house in KW each source at the end of each
period
190000 280000 360000 448000
3 Existing Capacity in KW +80000 70000 70000 70000
Total Capacity after augmentation in KW 270000 350000 430000 538000
Estimated demand at the endof each
of each period KW 270000 351000 431000 538000
context of the present domestic fuel pattern and presents a plea for substitution of expensive commercial fuels by gas and soft coke; the two bye-rproducts of carbonisation of coal.
The use of gas as fuel for domestic lighting and cooking has been in vogue in western countries for a long time. It was a popular fuel when electricity was unknown to the world. Later, the invention of electricity replaced gas for street and residential lighting; still gas continued to be the major source of energy for domestic cooking being cheaper than electricity. It was found to be even cheaper than the conventional fuels like wood, kerosene and charcoal since their efficiencies were very low as compared to gas. The use of conventional fuels had other disadvantages too. Besides being less efficient they also require coniderable space for bulk storage during the monsoons. The remainder of heat energy in the conventional stoves after cooking cannot be stored. These handicaps are eliminated, in a gas burner which needs only a small space for cooking with the facility to light or put out the burner as desired without any loss of energy. Apart from, these economic consideration, a neat and tidy kitchen and in a city which uses gas for domestic purposes the atmosphere is clean.
The type of gases supplied and their economy vary from country
R.G.GuptaCity/Policy Planner
Master Plan For Delhi 1957, Volume-II, PART - 3
to country. The relative merits and economy, depend largely on the source of supply, the use it is put "to etc . It is obvious that in a country where natural gas is present in plenty, the manufactured gas has only a secondary place both from the point of view of production and economy. On the other hand when natural gas is absent and when gas has to be manufactured, there are various other factors which govern the choice of a particular gas. For example, in a country with vast, reserves of non-coaking coal as in India, coal gas could be supplied through a grid connecting towns and cities for domestic and industrial uses. This will be far cheaper than transporting coal to different places for carbonisation. Cities which are nearer to oil refineries can use petroleum gas, a bye-product obtained while refining the oil.
In India, natural gas is still in an exploratory stage and the possibilities of exploiting it on a. commercial scale are yet to be seen and for the present we could think of only manufactured gas. The coal fields in this country are concentrated in the Bihar-West Bengal region and the cost of gas transmission across vast stretches of rural land to connect the cities and towns will be prohibitive unless the rural areas are also fully developed to create a substantial demand for domestic and industrial uses.
In the context of the present underdeveloped economy such a programme may be considered ambitious but the indirect benefits in the agricultural sector apart from the economy of gas as a fuel ' are so striking and complementary to each other that we may have to switch over to a coal based energisation programme ultimately.
In the rural areas today, the domestic fuels are fire wood and cowdung. The extraction of firewood by felling the trees create imbalances which disturbs the natural equilibrium required. The use of dung for cooking which has the least burning efficiency (about 11$), is most expensive and deprives the land of a manure which is highly nutritive. It has been estimated that * 200 million tons of wet dung ia I being burnt every year as fuel in rural areas. This corres-ponds to about 35 million tons of coal. Three hundred million tons of dung is equivalent to about 45 lakhs tons of ammonium sulphate and 22.5 lakh tons of phosphatic fertilisers. The Sindri Fertilisers is expected to supply about 75,000 tons of Nitrogen per year. Hence, the amount of dung burnt per year is about 12 times the produce of Sindri. The magnitude of loss involved indirectly in the agricultural economy is manifest. The amount of nitrogen burnt as fuel, if properly utilised as manure, will produce about 8 to 10 million tons of food grains per year. It is also estimated that about 500 million eft. of wood cut from the forests is being "burnt every year as domestic fuel. This is equivalent to about 5 million tons of coal. In addition to this, about 27 million tons of coal equivalent of wood is estimated to be cut in areas other than regular forests. The loss of forest wealth at this fast rate may ultimately destroy the desired natural balance.
The use of dung or firewood is outside the sphere of monetised economy and substitution of these fuels by commercial fuels will need additonal expenditure which has to be met from the additonal produce which the land will yeild when it fertility. This as source already, will take considerable time to implement and I'could be done on a phased long-term programme.
Now what is the position in the urban area? The useof cowdung in urban areas as compared to the rural sectoris less and cannot be avoided as it cannot be put into any''other better use. But it is hoped that with better milksupply schemes, cattle will be practically eliminated fromurban areas and the problem will get' automatically solved.But the use of firewood and- charcoal which obviously come
from the villages by felling trees, could be avoided. Especially in D e l h i S t a t e w h e r e t h e d e s e r t i s p e n e t r a t i n ggradually the green woods have to .be- carefully preservedand measures taken for afforestation of the ridges. Pruther,firewood, next to dung, is the most inefficient fuel amongvegetable fuels, apart from, creating smokes and problemsfor s to rage e tc . In mos t o f the c i t i es in Ind ia fue l slike soft coke, charcoal, electricity and kerosene are inpredominant use. Among these fuels electrici ty is thecostliest while soft coke is the cheapest. Kerosene andc h a r c o a l a r e , h o w e v e r , c o s t l i e r t h a n s o f t c o k e . .
SOFT COKE:
In India soft coke is transported to cities after carbonising hard coal in the mines. During the process of carbonisation, coal gas is allowed to: mescape and is never utilised. Soft coke being ligbter than coal occupies greater space which increases the cost of transportation. It has been estimated that at wenty ton rail wagon will accommodate 20 tons of hard coal but only 12 tons of soft coke. Hence, the cost of transportation of soft coke is nearly twice that of hard coal for equal weights. It is obvious that instead of transportating soft coke, coalitself could be transported at a cheaper cost and carbonn in the city itself so that both tbe bye-products viz. coa gas and soft coke could be utilised to the optimum; Evide soft coke andgas are cheaper than any of the other concern fuels. A coal carbonisation plant of suitable capacity could produce the desired amount of soft coke and gas for domestic and industrial uses. This will bring in great r eduction in1 the overall cost of fuels consumed in a city.
Again, in most of the cities kerosene is used as a major fuel for cooking purposes. Substitution of kerosene which at present is imported in large quantities by gas will effect savings in foreign exchange and will open an era for an industry which is independent of foreign fuels. Hence, a beginning should be made in the urban areas in the direction of substituting the presently used uneconomical fuels by gas and soft coke. It is seen that in most of the towns like Delhi and Bombay, fuels other than soft coke form about 50% of the total energy consumed as fuel for domestic uses. In Bombay, Kerosene and charcoal are the two major fuels used and constitute about 75$ of the total -energy consumed in the domestic sector.
The optimum utilisation of gas and other bye-products during the process of coal carbonisation will lower the prices of gas and soft coke further below the current prices. The lower income groups which mostly use soft coke will switch over to gas, as their economic conditions improve, in which case the production of gas must be higher and soft coke lower. This can best be achieved by changing the method of carbonisation to what is known as "Lurgi process" where a major portion of coal is gasefied. This process may be used ultimately when every one takes to gas. But during the change over the production of gas and soft coke could be adjusted by controlling the temperature of the production of soft coke is more, and during high temperature carbonisation, soft coke is less and gas is more.
It is also true that even at a stage when every f one takes to gas, soft coke will not he completely indispensable in the city as-some quantity will he required for use in industries and even for domestic uses as some of the food preparations have to be done only in soft coke. But this will be far too low as compared to the present level of consumption of soft coke. In the beginning the gas scheme should only try to achieve replacing the expensive commercial fuels by gas and soft coke and eventually mostly by gas as discussed above.
R.G.GuptaCity/Policy Planner
Master Plan For Delhi 1957, Volume-II, PART - 3

EXISTING GAS SUPPLIES:
Town Gas is supplied only in two Indian cities Calcutta and Bombay. In Bombay, besides town gas sewage and bottled gases are also being supplied. In Bombay, Town gas is produced by carbonisation of coal. The system extends over an area of about 80 square miles. Soft coke which is one of the bye-products while carbonising coal is used as a domestic fuel. A portion of the soft coke is also used for generation of producer gas for neating the retorts and production of water gas for meeting the peak hour demands.
The gas plant at Bombay is nearly a century old. Its total productive capacity now is about 5 million cubic feet per day. This obviously does not represent the city's likely demand if gas is made available on an unrestricted basis since during the last ten years, the company which is running the plant could not augment the supply by more than 12% due to financial limitations.
Town gas in Bombay is sold at Rs. 4 per 1000 eft. while the production cost is only Rs. 3 per 1000 eft. The calorific value of the gas is about 430 BTU eft. The cost of coal at Bombay is about Rs.53/- per ton. Recently the supply of sewage gas has also been undertaken on a pilot basis in some of the areas in Bombay and there seems to be a good demand for.'this gas since about 1000 eft. of gas of calorific value 650 BTU per eft. costs only Rs 4/-. Since no capital outlay is involved, except that/which is needed for laying the gas mains connecting the sewage treatment plants, the Bombay Municipal Corporation is about to sell this gas at competitive rates as compared to town gas.
In Bombay bottled gas known as "Burshanes" is supplied by the Burmah-Shell. Gas from the oil refineries is liquifiet and supplied in cylinders. Calcutta too derives its Town gas by carbonising coal. The capacity of the plant is about 5 million eft. per day. In addition to the coal plant there is also a carburetted water gas plant with about a million eft. per day capacity, which only acts as a stand by to keep a firm capacity of 5 MCD. The gas distribution system extends to about 90% area of the old city of Calcutta and 50% of the added area under Calcutta Corporation and Howrah Municipality. Gas apart from domestic purposes is also used in industries and for running public utilities and community facilities. A portion of 'the demand of street lighting is also met from gas. The following is the percentage of energy consumed through gas in various sectors
a) Industrial 44%
b) Domestic 32%
c) Public Utilities and 10%
Community Facilities
d) Street Lighting 14%
Inspite of heavy demand on the gas system the number If consumers has not increased appreciably. During the last 10 years the number of consumers has increased from labout 5,800 to 7,400. Gas of calorifio value 450 BTU per eft. is sold at Es. 4.69 per thousand eft. The cost of coal per ton at the plant site is about 34/-. The gas system lie run by a private undertaking.
GAS FOR DELHI:
In Delhi soft coke forms about 50%.of the total energy consumed for domestic uses. The other fuels, like kerosens, electricity, charcoal, firewood and dung cakes form the rest of the 50% Except dung and electricity, the rest of the fuels are transported
from outside. The table below shows the percentage distribution of the total energy consumed through different fuels in Delhi.
Table No 1*
S. No. Fuel Percentage of Energy
consumed
1. Soft Coke 49.7
2. Kerosene 10.0
3. Electricity 9.7
4. Charcoal 17.2
5. Firewood 7.9
6. Dung Cakes 3.1
7. Town Gas -
8. Rest 2.4
Total 100.00
Fuel Efficiency(Percent)
Effective Price (nps per thousand kilo calories)
Soft Coke 30 4.00
Kerosene 50 9.50
Charcoal 30 11.50
Wood 18 12.00
Electricity 75 16.00
Dung 10 23.00
*Source: Survey of N.C.A.E.R on Domestic Fules
The efficiency of different fuels together with their effective prices per thousand kilo calories of energy at Delhi market rate is tabulated below:
TABLE NO. II
It may be seen from the above table that the effective price of soft coke is the lowest compared to other fuels. Effective price is the rate paid by the consumer for the total quantum of heat actually utilised. The effective price of a fuel is inversely proportional to the efficiency of a fuel and directly proportional to its cost per unit energy. The effi-ciency of a dung burning Chulla where most of the heat energy escapes has only an efficiency .of 10% which boosts up the effective price as high as 23 nps per kilo calories which is four times as much as the effective prices of soft coke. Charcoal and fire wood whose effective prices work out to about 12 nPs per kilo calorie are about three times as expensive as soft coke. Keorsene is about 2-1/2 times costlier than soft coke.
The efficiency of the gas burner varies from 60 to 70% and even at the Bombay Gas Company rates i.e. at the rate of Rs. 4/- per thousand cubic feet of gas of calorific value 450 BTU the effective price of gas works out to be only about 5 nPs per thousand kilo calories.
Ms is, however, slightly costlier than soft coke whose effective price conies to about 4 nPs per thousand kilo calories of energy. The operational inefficiency of soft coke such as nuisance of smoke, requirement of additional space for storing, time consumed in lighting, etc., if taken into consideration, may off-set the little advantage it gives in cost and gas will be definitely preferred as the most clean and handy fuel in many households especially in the middle and higher income
R.G.GuptaCity/Policy Planner
Master Plan For Delhi 1957, Volume-II, PART - 3

groups. Obviously, the entire requirements of domestic energy for cooking purposes cannot be replaced by gas since soft coke is required for certain uses such as making of chapathies, etc. If we deduct the amount of energy required through the use of soft coke even at present scales and replace the rest of the energy now supplied by other primary and secondary fuels such as kerosene, wood, charcoal, cowdung, electricity, etc. by gas, there would be an appreciable saving in the expenditure of each household on domestic
Percentage of Energy consumed
Fule
1. Soft Coke 14.4
2. Kerosene 2.9
3. Electricity 2.8
4. Charcoal 5.0
5. Firewood 2.3
6. Dung Cakes 0.9
7. Town Gas Nil
8. Rest 0.7
Total 29.00
It may be seen from the above table that out of the total energy consumed, 50% of the energy is met through soft coke and the rest from other primary and secondary fuels. Even granting that the requirements of soft coke in each household may continue at the present rates the rest of the fuels could be substituted by gas with advantage. It has been estimated that the average monthly expenditure per household in Greater Delhi on fuels for cooking purposes is of the order of about Rs. 11/- of which soft coke thus works out to Rs. 7/- per household. The monthly expenditure on fuels for different income groups is given in table No. 4.
The net energy consumed by fuels than soft cake is about 14 thousand kilo calories per capita per month.
fuels. To start with we may only replace the commercial fuels, other than soft coke by gas, which will benefit the middle and higher income groups a lot. As the economic conditions of the lower income groups people improve, they would like to switch over to gas.
Based on the survey conducted by the National Council of Applied Economics Research, the following is the net amount of average per capita energy consumed. To arrive at the gross energy &he respective co-efficients of the fuels must be applied.
TABLE NO; III.
TABLE NO IV
Statement showing this monthly expenditure on soft coke and other fuels for cooking purpose
for different income groups in Delhi urban area
S. No. Name of Fuel1-100 101-200 201-350 351-600 601-1000 Above1000 Average
house hold
Income Group
1. Soft Coke 1.97 3.41 4.48 6.20 8.66 8.66 4.00
(68 lbs) (118 lbs) (155 lbs) (214 lbs) (299 lbs) (300 lbs) (138 lbs)
2. Other fuels like charcoal 1.78 2.62 5.39 10.28 20.00 37.67 7.00
firewood, dung cakes
kerosene electricity etc.
TOTAL 3.75 6.03 9.87 16.48 28.78 46.35 11.00
(Cost of soft cokes at Rs. 68/- ton or 2.9 nps per pound)
(*Source : survey of N.C.A.E.R. on domestic fuels
The gross amount of heat energy required if gas is used will be about 22 thousand kilo calories per capita . per month. Gas at the rate of 3.5 nPs per thousand kilo calories of net energy will work out to 77 nps per capita-Taking the average size of household ROW in Delhi to W 4.6
persons, the cost of substitution of fuels other than soft coke by gas on an average for each household comes to Rs. 3.54. Adding to this the cost of soft coke i.e. Rs. 4/-, the total cost of fuels for each household comes . to Rs. 7.54 per month as against the present expenditure of Rs 11/- per household, thus effecting a savings of about Rs. 3.5 per household on an average. Taking the urban population in 1966 as about 25 lakhs, there will be about 5.44 lakhs of households. At the savings rat e. of Rs. 3 5 per household, there will be a total savings of about Rs. 1904 lakhs on domestic fuels per month or about Rs. 228 lakhs per year which an be profitably utilised for other economic purposes.
The savings given above are on the assumptionthat the present rate of soft coke consumption will-continue. . This is not altogether correct as a considerable amount of energy that is used for cooking purposes from soft coke could still be substituted by gas, especially in the higher income groups which may like to go in for gas being a more convenient and cleaner fuel than soft coke in spite of its being slightly costlier. But we cannot assume the same rate of substitution immediately in the lower income groups. It is also not possible to replace the fuels other than soft coke immediately by gas as it will take some time for the people to get used to this new fuel. As a pilot project we can safely assume that a coal plant could be erected which may replace about 50$ of the energy now met from fuels other than soft coke.
ENERGY REQUIREMENTS;
As stated already, the gross amount of heat that is be replaced by gas in place of fuels other than soft coke, 1 will be about 22 thousand
R.G.GuptaCity/Policy Planner
Master Plan For Delhi 1957, Volume-II, PART - 3
kilo calories per capita per tons Taking the population in 1966 to be about 25 lakhs we may require a total of about 550 thousand lakh kilo calories of energy per month. Assuming that on a pilot basis we may erect a plant which may yield about 50 % of the above requirements, this comes to about 275 thousand lakh kilo calories per capita which is equivalent to about 238.5 million cubic feet of gas per month or 8 million cubic feet of gas per day. The capacity of the plant may be doubled towards the end of the Fourth Five Year Plan by which time the urban population may be about 31 lakhs and the total requirements of gas for replacing the fuels other than soft coke may be about 682 million eft. per month.
CAPACITY OP PILOT TOWN GAS PLANT: .
The pilot town gas plant will carbonise coal at medium temperature. One ton of coal will yield about 7300 eft. of gas. net after deducting the energy required for heating ovens. To derive a supply of 8 million eft. per day, a total of about 1100 tons of coal may have to be carbonised everyday. This will yield about 660 tons of soft coke per day. The total requirements of soft coke by 1966 may be of the order of about 1087 tons per day (at the rate of 4.5 lbs per day per household), Assuming that the plant will be commissioned by the end of 1963, it can meet about 70% of the requirements of soft coke then and only the remaining 3% need be transported from mines. By the end of the Fourth Five Year Plan when the capacity of the plant is doubled, it will yield about 1320 tons of soft coke. The requirements of soft coke for the then population of about 31.25 lakhs will be about 1350 tons.
It may thus be seen that when the second stage plant is? completed the entire requirement of soft coke can be met locally at the plant site which may otherwise have to be transported from mines. It may also be noted that the cost of transportation of 2200 tons of coal per day will not be more than the cost of transporting 1350 tons of soft coke since, in the volume occupied by every ton of coal only 3/5 tons of soft coke can be accommodated. Thus the savings effected in the transportation cost should go a long way in reducing the prices of both soft coke and gas. It may be still lower than the rates assumed earlier in this draft.
Beyond the Fourth Five Year Plan the existing rate of consumption of soft coke will decline, as the people in the lower income group will also begin to use gas in the wake of economic prosperity. In such a case even without increasing the capacity of the plant, the gas production could be increased in two ways (a) by gasifying coal more intensely as to give the required quantity of gas (b) by adding a producer plant to heat the ovens. The producer plant could be charged with undersized and powder coals which will be of no use in the gas ovens. A producer could be erected even earlier if the gas output had to be increased as a result of higher demand. BYE-
PRODUCTS:
Apart from soft coke, there are also other by a products derived from the carborisation of coal such as petrol, fuel oil and pitch. These are valuable materials which can be consumed for economic activity in the city, itself. For example petrol and fuel oil can be used in automobiles and industries. Pitch can be made use of for road making. One ton of coal, when carbonised, will
yield about 0.4 gallons of petrol, 4.1 gallons of fuel oil and 300 lbs pitch. In the 1st stage it is recommended that only| a broad
1 distillation plant be erected which will fractionalisj petrol, fuel oil
and pitch. At a later stage, when this industry is fully developed the other finer fractions such as Benzol, Phenol, cresote etc. may be realised by erecting a full fledged gas refinery.
COAL:
At present coal is transported to Delhi from Bihar coal mines at a distance of about 800 miles. But since non-cooking coal is available in plenty at SINGROLI, a new coal field proposed to be opened during the III Five Year Plan, Delhi might meet its demand from this coal field which will be much nearer as compared to the Bihar coal belt. Singroli is about 170 miles from Mirzapur rail head on the Eastern Railway. The total distance of Singroli from Delhi will be only about 500 miles. The cost of coal at Delhi now is about Rs. 45 per ton. If coal is transported from Singroli it will cost only Rs. 35 per ton. This reduction in price will go a long way in lowering the price of both soft coke and gas. Arrangements should be made now to reserve the required quantity of coal from this new coal field for Delhi.
LOCATION OF PLANT AND OWNERSHIP:
In the west, gas and power plants are usually combined to effect maximum economy and efficiency in the operation of both the utilities. Such combination has many advantages. Location of the power and gas plants adjacent to each other will facilitate, during off peak hours, the use of excess steam from the power plant as process steam for gas making and similarly the use of gas during off peak hours for power generation. Since coal is needed in both the industries, it will be helpful from the operational point of view to locate, the gas plant in Delhi adjacent to the power plant at Rajghat. The presence of adequate railway sidings near Raj ghat for delivery of coal will be another added advantage. Also the coal dust, or under sized coal which could not be used in the gas plant can be made use of in the power plant. Henee it is obvious that both these undertakings should function under the control of one authority.
DISTRIBUTION OF SOFT COKE:
To have an effective control on the prices of gas and soft coke, soft coke from the plant should be distributed on a whole sale basis to the dealers in the city who at present transport it directly from the mines. When coal is transported from Singroli Coal Fields as discussed earlier, its cost will be about 25$ cheaper than the present price. This will constitute a reduction in the cost of soft coke also. At present market rates soft coke is slightly cheaper than gas (at Bombay market rates) But to give an impetus for the use of more and more of gas with elimination of soft coke gradually, the pricing policy should be such as to maintain the effective prices of soft coke and gas at least on the same level at the start. At a later date gas could-be made even cheaper than soft coke with more intense gasification of coal. For this purpose it is most essential that the whole sale distribution of soft coke must rest with the same undertaking which distributes gas.
The capital cost of the first stage plant of a capacity of 1100 ton per day together*'with a broad distillation plant, coal handling and sorting machinery, and gas distribution system is estimated at about te. 3.5 crores. This estimate, is very tentative and subject to revision when detailed designs and plans are made both for generation and distribution systems.
As regards the generation cost which covers the operational cost
R.G.GuptaCity/Policy Planner
Master Plan For Delhi 1957, Volume-II, PART - 3

of production of gas and debt services cost on the capital outlay, it is estimated at Rs. 5/- for every 1000 eft. of gas produced. The loan on capital outlay is proposed to be paid over a period of 50 years, which is quite a long period. But it may be seen that the life of a gas plant is nearly one hundred years. The gas plant in Bombay is more that a century old and still it is being operated. This is why the generation cost at Bombay is only Rs. 3/-. After the 50th year, there will not be any liability on the debt service charges and the generation cost will become less. In such a case the undertaking could think of reducing the price of gas to some extent and begin to create a reserve fund for investment for further expansion. The reduction in gas price should not be appreciable as it will become discriminatory. It may also be noted that generation cost has been worked out at existing market rates of coal which will become 25% less when coal from Singroli is used.
The total quantity of gas that will be produced from the first stage plant is about 8 million eft. per day i.e. the generation cost is about Rs. 40,000 per day or Rs. 146 lakhs per year.
REVENUES
Revenues will accrue as a result of sale of gas, soft coke and other bye-products. Initially the price of gas may be fixed at Rs. 4- per 1000 cubic feet. A progressive rebate may be given for people who use gas over a certain limit. The estimated revenue through sale of gas is about Rs. 32,00/- per day.
As regards soft coke the current retail price is I about Rs. 68 per ton but the price actually paid by the whole saler is about Rs. 6f per ton. If soft coke could be sold at Rs. 55 per ton at the plant site on a wholesale basis, it would be enough to create the necessary incentive for the wholesalers turn for bulk supplies locally. The sale of about 660 tons of soft coke at Rs. 55 per ton will yield an income of about 'Rs. 36,300 per day. But about Rs.15 per ton will be eaten away towards the cost of coke handling and sales organisation, leaving a net profit of only about Rs. 26,400 per day. The sales realisation from bye-products such as fuel oil, pitch and petrol after deducting the cost of refining and sales organisation, will be about Rs. 3 for every ton of coal carbonised i.e. the net revenue through sales of bye-products will be about Rs. 2,000 per day. Thus the total revenue through sale of gas, soft coke and other bye-products amounts to Rs. 60,400 per day or Rs. 220.46 lakhs per year, against an annual expenditure of Rs. 146 lakhs per year, leaving a net surplus of Rs. 74.46 lakhs per year.
In addition to a net annual income of Rs. 74.46 lakhs in the public sector, there will be an annual savings of about Rs. 220 lakhs in the private sector initially by the use of gas in place of other expensive fuels. To sum up, the income and savings that will generate per annum after introducing gas in Delhi will be of the order of about Rs. 294.46 lakhs.
Besides these, there are many other economics which could not be shown here in terms of money. for example, the elimination of Kerosene will curtail the import of foreign oil and bring in savings on foreign exchange. Reduced use of charcoal and fire wood in urban Delhi would strengthen the forest wealth in the rural areas which required for maintaining the desired balance of nature. Another added advantage is the improvement on the environmental health, facilitated by a clean and smokeless atmosphere.
SEWAGE GAS:
At present the available sewage gas from the sewage treatment plants has not been put into any effective use. Sewage gas as compared to Town gas is richer and its calorific value is about 650 BTU per eft. and can be used: conveniently as a domestic fuel or in industries. In the case of Okhla the gas could be supplied to the industrial estates. Since, there is no cost incurred in generation, the capital outlay involved is just what is needed for laying the dis-tribution system. Of course, in view of the fact that these plants are situated on the out skirts of the existing town it would be practical only to think of conveying gas to the areas nearer to them. After the west plant is commissioned, the total output of sewage gas in all the three treatment plants is estimated at about 18 lakhs eft. per day of which about 3 lakhs eft. of gas will be needed for running the treatment plants. Thus, about 15 lakhs eft. of gas is immediately available for supply. Even if it is sold at Rs. 4 per eft. i.e. at the same rate as town gas the total revenue will be about Rs.21l9 lakhs deducting the operational and maintenance costs, the net profit is estimated at a minimum of Rs. 10 lakhs per annum. When the total capacity of the plants is increased to 200 MGD by 1981, the total out put of gas will be about 40 lakhs eft. per day. The net profit after meeting theoperational and maintenance costs will be about Rs. 27 lakhs per annum. Since the running of treatment plants by gas at present is costlier than electricity's, it is recommended that the existing gas engines may discontinue eventually electricity only. Sewage gas dan also be used in place of petrol for running automobiles. Before the II world war it was in popular use in Germany and was found to be much cheaper I than petrol. The Kanpur Municipality has already finalised a scheme for the use of sewage gas on its automobiles. The annual income by such a substitution has been estimated to be about Rs. 3.65 lakhs. In line with this, the Bombay Corporation too has launched a scheme for the use of sewage gas in their vehicles. About 200 eft. of unwashed gas is equivallent to one gallon of petrol. The vehicles could be converted with ease for using gas in place of petrol by turning a valve operated on the dash board, while the petrol tanks and the car battery can be kept in intact. It has been experienced in Germany that the life of an engine using gas is nearly double as compared to the one which uses petrol.
It has been ascertained from the Delhi Municipal Corporation that about 15,500 gallons of petrol costing Rs. 45,000 is consumed every month for running the lorries, trucks, ambulances etc. If sewage gas is used in the vehciles, it will bring in a saving of about Rs. 5.4 lakhs per annum. The total quantity of gas required for replacing petrol is about one lakh eft. per day O-fchw bodies like the NDMC. MBS and CPWD could also use sewage gas for running the automobiles. This will bring in considerable savings in running their vehicles, as 200 eft of sewage gas which is equivalent to one gallon of petrol will cost only 80 nPs. while petrol is sold at Rs. 3/-per gallon.
R.G.GuptaCity/Policy Planner
Master Plan For Delhi 1957, Volume-II, PART - 3

CHAPTER - FOUTREEN
RURAL DELHI
THE PLANNING FRAME WORK FOR RURAL DELHI One of the first takes in planning any area is to divide it into
suitable units capable of separate detailed planning. For the urban area, the planning sectors and units, described in the chapter on Land planning of the Draft Master plan, constitutes such planning areas. The planning areas for the rural sector of Delhi are sort forth here.
In the Territory of Delhi, there are 262 villages according to 1961 census; 9 of these, are already surrounded by urban development,2 having reached different degree of urbanization. Another 46 villages are expected to lose their rural character by 1981 as they come within the belt-ear-marked for compact urban development. For planning purpose, these villages will come under the urban planning sectors and units. The remaining 207 villages, lying in the rural areas beyond the compact urban limits will come under the Rural planning areas.
These 207 rural settlement are of different sizes, but consist mostly of small and medium –size villages with a population of less tan 2000 persons. Individually these are too small to support the essential public utilities, services and amenities, that area proposed to be provided to the rural population. Therefore, they be have to grouped into suitable units, so that services can be provided at reasonable cost in the rural areas as well.
For such grouping, physical, social and economic factors have been considered. The groups suggested are such that they will promote and stimulate the existing relationships between the various rural settlements, rather than upset this pattern.
Physically, the Delhi countryside may be divided into four tracts, viz. the riverian tract or Khadar, the low lying tract or dabar, the hilly tract or kohi and the level tract or Bangar. In the delimitation of planning areas these physical division have been broadly retained as a frame-work and identified as community of interest areas within them, based on socio-economic considerations. Such community of interest areas are areas in which people can live, work and play in harmony. With suitable modifications, they may be adopted as planning areas for the countryside. The method adopted in delimiting the community of interest areas, was to recoggnise the important centres of rural activity and to determine their spheres of influence. In rural areas, community life usually comes to be centered around a few villages, which naturally enjoy a higher scale of social provision. People of the surrounding villages usually visit these centres, motivated by certain common interests like the necessity to sell and purchase, the need for better education and health facilities and better
1recreation facilities. As a result of rural surveys in Delhi (1958) , such centres have been recognized in Rural Delhi. These are :
1) Narela 2) Najafgarh 3) Mehrauli 4) Shahdar
5) Bawana, 6) Azadpur, 7) Badarpur, 8) Nangoli Jat
9) Ujwa 10)palam.
From the rural studies, it has become clear that these centres have a relatively greater growth potential than the other villages in
1. Conducted by the Town planning organisaton.
Rural Delhi. All of them are fitted by tradition or present function to be key ccentres for the surrounding area. Some are service centres of a high rank, some possess urban status, while some are market
Centres; but all possess actual or potential importance as territorial centes. From the point of view of location also, they are found to be situated at Fairley spaced intervals. It is , therefore , proposed that these centes and the services areas around them may be adopted, with certain modifications, as District centres and rural planning Districts respectively. Of the ten centres, mentioned above, four namely, Azadpur, Badarpur, Mehrauli, and shahdara, lie within the compact urban limits proposed up to 1981.
This necessitates certain modifications. The proposals with these modifications are described below :
1.) UJWA PLANNING DISTRICT :
The service are around Ujwea will constitute this planning district- ujwa will be the proposed District centre.
2.) NAJAFGARH PLANNING DISTRICT :
The service area around Najafgarh, together with a group of village around Kangan Heri, found to be oriented towards Gurgaon, will constitute this planning District, Najafgarh will be the proposed District centre.
3) PALAM PLANNING DISTRICT :
The service area around palam beyond the compact urban limits, constitutes this planning District. Palam village will be the proposed District centre.
4) NANGLOI JAT PLANNING DISTRICT :
The service area around Nangloi jat, together with a group of villages around Tikri Kalan, oriented towards Bahadurgarh, will constitute this planning District. The proposed District centre will be Nangloi jat.
5) BAWANA PLANNING DISTRICT :
The service area around Bawana will constitute this planning District. Bawana will be the proposed District centre.
6) NARELA PLANNING DISTRICT :
The service area around Narela, together with a group of village around Burari, oriented towards Azadpur, will constitute this District Narela, which is proposed as a satellite township, is located in the northern corner of the district. Alipore, which is more centrally situated in this planning District is, therefore, proposed as the District centre.
5) SHAHDARA PLANNING DISTRICT:
This is not a contiguous planning area, but consists of three clusters of villages, separated by strips or urban development. They are proposed as such in this scheme. A central village is proposed for each cluster, where certain facilities will be provided. The central villages proposed are Mutafabad, Dilupura and Molar Band.
2.These planing districtshave been named after Shahdara and Mehrauli, even though they are not included in them, because of the proximity of the villages of them.
R.G.GuptaCity/Policy Planner
Master Plan For Delhi 1957, Volume-II, PART - 3
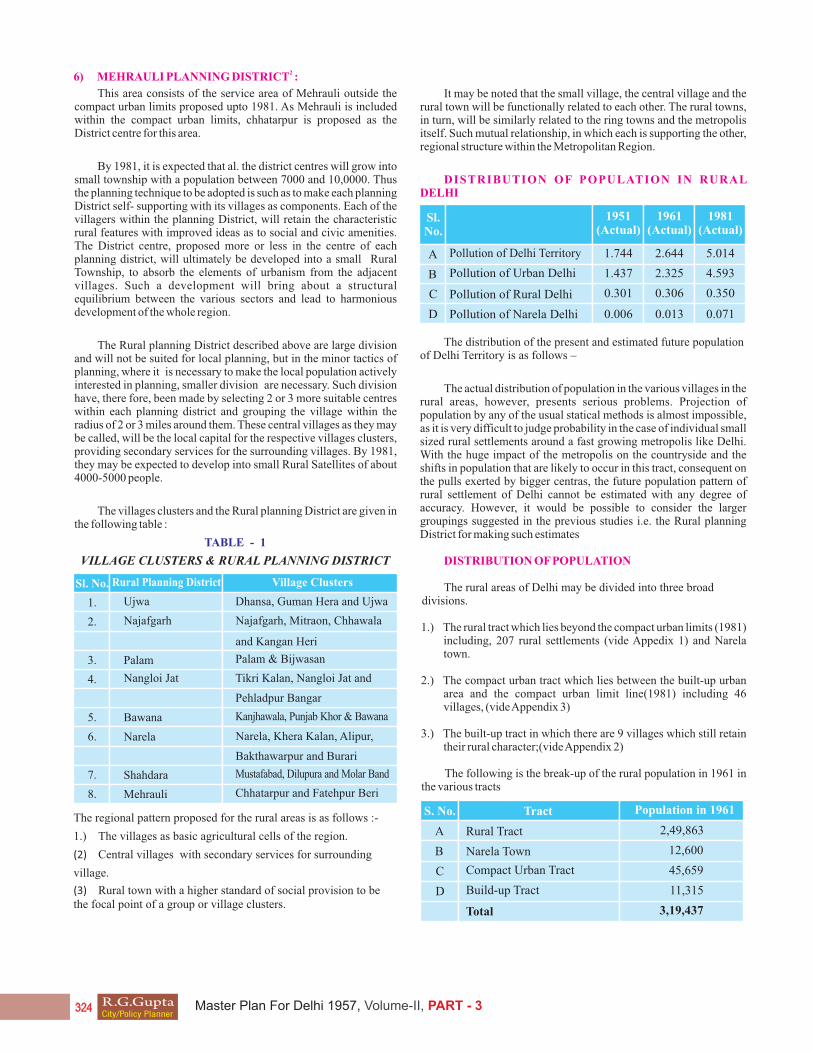
26) MEHRAULI PLANNING DISTRICT :
This area consists of the service area of Mehrauli outside the compact urban limits proposed upto 1981. As Mehrauli is included within the compact urban limits, chhatarpur is proposed as the District centre for this area.
By 1981, it is expected that al. the district centres will grow into small township with a population between 7000 and 10,0000. Thus the planning technique to be adopted is such as to make each planning District self- supporting with its villages as components. Each of the villagers within the planning District, will retain the characteristic rural features with improved ideas as to social and civic amenities. The District centre, proposed more or less in the centre of each planning district, will ultimately be developed into a small Rural Township, to absorb the elements of urbanism from the adjacent villages. Such a development will bring about a structural equilibrium between the various sectors and lead to harmonious development of the whole region.
The Rural planning District described above are large division and will not be suited for local planning, but in the minor tactics of planning, where it is necessary to make the local population actively interested in planning, smaller division are necessary. Such division have, there fore, been made by selecting 2 or 3 more suitable centres within each planning district and grouping the village within the radius of 2 or 3 miles around them. These central villages as they may be called, will be the local capital for the respective villages clusters, providing secondary services for the surrounding villages. By 1981, they may be expected to develop into small Rural Satellites of about 4000-5000 people.
The villages clusters and the Rural planning District are given in the following table :
TABLE - 1
VILLAGE CLUSTERS & RURAL PLANNING DISTRICT
The regional pattern proposed for the rural areas is as follows :-
1.) The villages as basic agricultural cells of the region.
(2) Central villages with secondary services for surrounding
village.
(3) Rural town with a higher standard of social provision to be the focal point of a group or village clusters.
Sl. No.
1. Ujwa Dhansa, Guman Hera and Ujwa
Najafgarh, Mitraon, Chhawala
and Kangan Heri
Najafgarh
Palam & Bijwasan
Chhatarpur and Fatehpur Beri
Mustafabad, Dilupura and Molar Band
Tikri Kalan, Nangloi Jat and
Pehladpur Bangar
Narela, Khera Kalan, Alipur,
Bakthawarpur and Burari
Kanjhawala, Punjab Khor & Bawana
Palam
Nangloi Jat
Bawana
Narela
Shahdara
Mehrauli
2.
3.
5.
7.
4.
6.
8.
Rural Planning District Village Clusters
It may be noted that the small village, the central village and the rural town will be functionally related to each other. The rural towns, in turn, will be similarly related to the ring towns and the metropolis itself. Such mutual relationship, in which each is supporting the other, regional structure within the Metropolitan Region.
DISTRIBUTION OF POPULATION IN RURAL DELHI
The distribution of the present and estimated future population of Delhi Territory is as follows –
The actual distribution of population in the various villages in the rural areas, however, presents serious problems. Projection of population by any of the usual statical methods is almost impossible, as it is very difficult to judge probability in the case of individual small sized rural settlements around a fast growing metropolis like Delhi. With the huge impact of the metropolis on the countryside and the shifts in population that are likely to occur in this tract, consequent on the pulls exerted by bigger centras, the future population pattern of rural settlement of Delhi cannot be estimated with any degree of accuracy. However, it would be possible to consider the larger groupings suggested in the previous studies i.e. the Rural planning District for making such estimates
DISTRIBUTION OF POPULATION
The rural areas of Delhi may be divided into three broad divisions.
1.) The rural tract which lies beyond the compact urban limits (1981) including, 207 rural settlements (vide Appedix 1) and Narela town.
2.) The compact urban tract which lies between the built-up urban area and the compact urban limit line(1981) including 46 villages, (vide Appendix 3)
3.) The built-up tract in which there are 9 villages which still retain their rural character;(vide Appendix 2)
The following is the break-up of the rural population in 1961 in the various tracts
1951 (Actual)
Sl.No.
1961 (Actual)
1981 (Actual)
Pollution of Delhi Territory 1.744
1.437
0.301
0.006
2.644
2.325
0.306
0.013
5.014
4.593
0.350
0.071
Pollution of Urban Delhi
Pollution of Rural Delhi
Pollution of Narela Delhi
A
B
C
D
S. No.
A
B
C
D
Total
Rural Tract
Narela Town
Compact Urban Tract
2,49,863
12,600
45,659
11,315
3,19,437
Build-up Tract
Tract Population in 1961
R.G.GuptaCity/Policy Planner
Master Plan For Delhi 1957, Volume-II, PART - 3
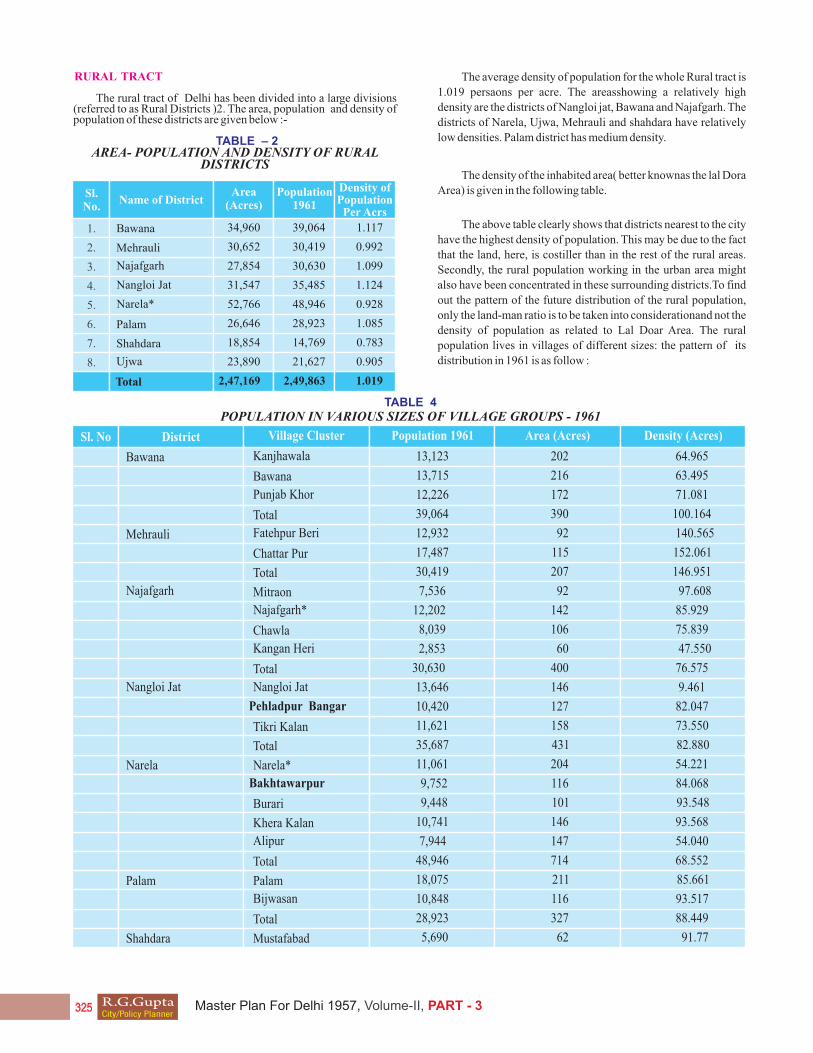
RURAL TRACT
The rural tract of Delhi has been divided into a large divisions (referred to as Rural Districts )2. The area, population and density of population of these districts are given below :-
TABLE – 2AREA- POPULATION AND DENSITY OF RURAL
DISTRICTS
The average density of population for the whole Rural tract is
1.019 persaons per acre. The areasshowing a relatively high
density are the districts of Nangloi jat, Bawana and Najafgarh. The
districts of Narela, Ujwa, Mehrauli and shahdara have relatively
low densities. Palam district has medium density.
The density of the inhabited area( better knownas the lal Dora
Area) is given in the following table.
The above table clearly shows that districts nearest to the city
have the highest density of population. This may be due to the fact
that the land, here, is costiller than in the rest of the rural areas.
Secondly, the rural population working in the urban area might
also have been concentrated in these surrounding districts.To find
out the pattern of the future distribution of the rural population,
only the land-man ratio is to be taken into considerationand not the
density of population as related to Lal Doar Area. The rural
population lives in villages of different sizes: the pattern of its
distribution in 1961 is as follow :
Sl. No
Pehladpur Bangar
Bawana
Mehrauli
Najafgarh
Nangloi Jat
Narela
Palam
Shahdara
Kanjhawala 13,123
13,715
12,226
39,064
12,932
17,487
30,419
7,536
12,202
8,039
2,853
30,630
13,646
10,420
11,621
35,687
11,061
9,752
9,448
10,741
7,944
48,946
18,075
10,848
28,923
5,690
202
216
172
390
92
115
207
92
142
106
60
400
146
127
158
431
204
116
101
146
147
714
211
116
327
62
64.965
63.495
71.081
100.164
140.565
152.061
146.951
97.608
85.929
75.839
47.550
76.575
9.461
82.047
73.550
82.880
54.221
84.068
93.548
93.568
54.040
68.552
85.661
93.517
88.449
91.77
Fatehpur Beri
Najafgarh*
Kangan Heri
Nangloi Jat
Tikri Kalan
Narela*
Burari
Alipur
Palam
Total
Chattar Pur
Mitraon
Chawla
Total
Total
Bakhtawarpur
Khera Kalan
Total
Bijwasan
Mustafabad
Bawana
Punjab Khor
Total
Total
District Village Cluster Population 1961 Area (Acres) Density (Acres)
Sl.No.
1.
3.
5.
7.
2.
4.
6.
8.
Name of District
Bawana 34,960
30,652
27,854
31,547
52,766
26,646
18,854
23,890
2,47,169
39,064
30,419
30,630
35,485
48,946
28,923
14,769
21,627
2,49,863
1.117
0.992
1.099
1.124
0.928
1.085
0.783
0.905
1.019
Mehrauli
Najafgarh
Nangloi Jat
Narela*
Palam
Shahdara
Ujwa
Total
Area(Acres)
Population1961
Density of PopulationPer Acrs
TABLE 4 POPULATION IN VARIOUS SIZES OF VILLAGE GROUPS - 1961
R.G.GuptaCity/Policy Planner
Master Plan For Delhi 1957, Volume-II, PART - 3

Village with Population
No. of Villagesin the Group
Populationin the Group
Percentage of population
in the group
Under 500 33 10,764
60,161
80,788
91,299
6,851
82
57
33
01
4.31
24.08
32.33
36.54
2.74
500 - 1000
1001 - 2000
2001 - 5000
Above 5000
Year Rural Population Percentage (+) Inc. (-) Dec.
1921 1,84,032
1,88,804
2,22,253
3,06,938
3,00,007
1931
1941
1951
1961
1.7
2.6
17.7
39.9
2.22
Name of the District 1921-31
Bawana (-) 4.74
(+) 10.35
(+) 4.87
(-) 2.61
(+) 2.08
(+) 12.21
(+) 2.20
(+) 4.05
(+) 21.67
(+) 31.35
(+)22.36
(+) 16.53
(+) 24.48
(+) 22.36
(+) 11.98
(+) 19.71
(+) 14.87
(+) 15.19
(-) 5.21
(+) 22.73
(-) 1.93
(-) 30.25
(+) 74.38
(+) 25.62
(+) 26.26
(+) 58.99
(-) 34.19
(+) 33.3
(-) 26.43
(-) 48.94
(+) 14.723
(+) 37.55
Mehrauli
Najafgarh
Nangloi Jat
Narela*
Palam
Shahdara
Ujwa
1931-41 1941-51 1951-61
Percentage Increase or Decrease
From tis table it is clear that the rural population of the state did ot indicate marked change upto 1931. It began to rise rather sharply, after 1931; in the decade 1941-51, the rural population of Delhi territory jumped by almost 40%. This increase is partly due to an increase in the natural growth rate and partly due to immigration of refugees from west Pakistan. Since there is only small scope in the agricultural base of the state to support this growth of population, it may be presumed that a portion of the rural population makes its livelihood in urban Delhi.
Taking the rural tract alone, the population trends for three decades, in the different Rural District are presented in the table below:-
GROWTH OF POPULATION:The population in rural Delhi since 1921 is presented in the
following table : TABLE 5PERCENTAGE INCREASE IN POPULATION (1921-1961)
This table brings out clearly that there has been a sharp increase in rural population since 1931. Najafgarah and Narela have registered a drop in their population during 1941-51.This is largely due to the emigration of Muslim from this area though inNajafgarh District, the drainage problem which become acute during this period, consequent on the silting up of nalas, might have also contributed to this decrease in some measure. The maximum addition has been in the districts around the urban area viz. shahdara and palam.
Another characteristics feature of the growth of the rural population in Delhi is the increasing tendency on the part of the people to gravitate towards bigger village and towns. This is evident from the following fugures.
TABLE 7
PERCENTAGE OF POPULATION LIVING IN VILLAGES OF DIFFERENT SIZES
1. Spurce : T.P.O. Memo. On population of Delhi and its regions.
*Exculding Narela town.
Village with Population
Under 500
1921
27.63
26.20
34.13
12.04
-
24.94
31.47
31.10
6.31
4.18
17.45
27.91
30.97
14.59
9.08
12.39
25.47
33.31
21.22
7.61
4.31
24.08
32.33
36.54
2.74
1931 1941 1951 1961
500 - 1000
1001-2000
2001-5000
Above 5000
This table reveals that the percentage population living in villages of 1000 of 5000 people has been gradually increasing, the rate of increase being more pronounced in the case of villages with a population between 2001-5000. As against this increase, the proportion of population in villages of less than 1000 people has been progressively decreasing. In 1961, this proportion is very low in the cases of villages with a population of under 500 and above 5000. In the latter, it is primarily due to the exclusion of Narela from this group.
Ujwa
14,769
21,627
6,244
6,480
8,903
5,394
3,685
188
370
144
123
103
46
80
78.558
58.451
43.361
52.681
86.436
117.261
46.063Dilupura
Guman Hera
Total
Total
Molar Band
Ujwa
Dhansa
The above table clearly shows that districts nearest to the city have the highest density of population. This may be due to the fact that the land, here, is costiller than in the rest of the rural areas. Secondly, the rural population working in the urban area might also have been concentrated in these surrounding districts.
To find out the pattern of the future distribution of the rural population, only the land-man ratio is to be taken into considerationand not the density of population as related to Lal Doar Area.
The rural population lives in villages of different sizes: the pattern of its distribution in 1961 is as follow :
TABLE 6
POPULATION IN VARIOUS SIZES OF VILLAGE
GROUPS-1961
TABLE 6TREND OF POPULATION IN DIFFERENT RURAL
DISTRICTS (1921-61)
R.G.GuptaCity/Policy Planner
Master Plan For Delhi 1957, Volume-II, PART - 3
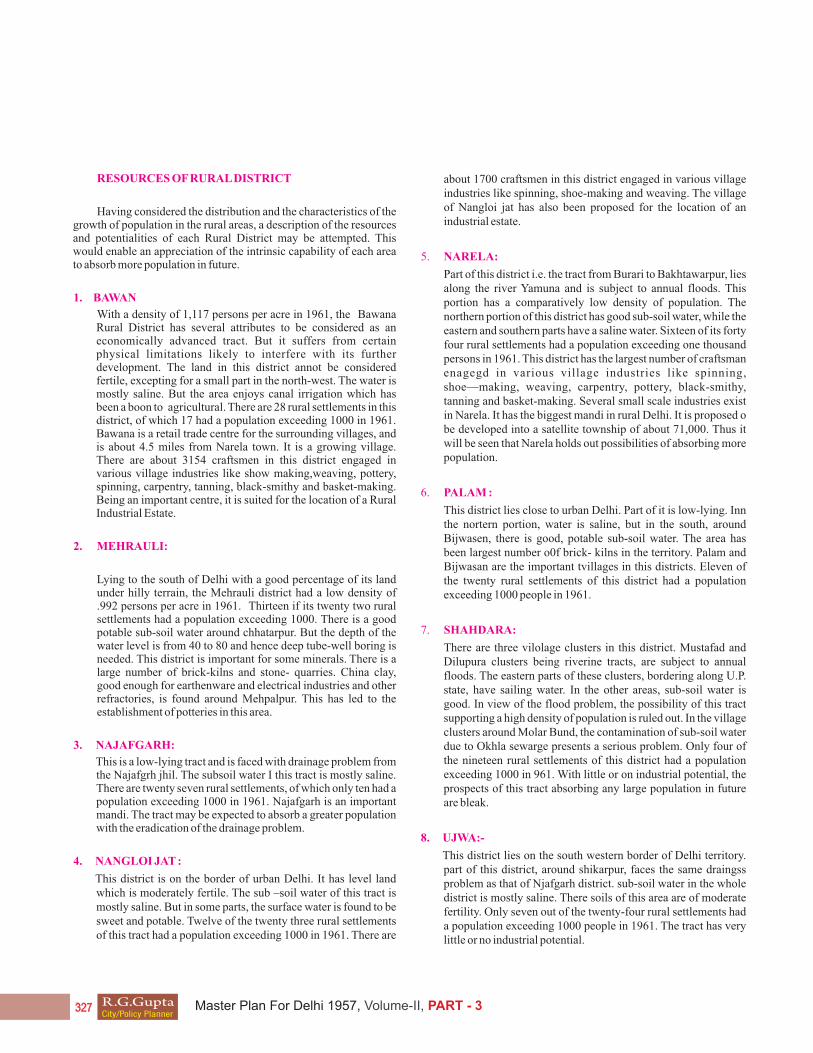
RESOURCES OF RURAL DISTRICT
Having considered the distribution and the characteristics of the growth of population in the rural areas, a description of the resources and potentialities of each Rural District may be attempted. This would enable an appreciation of the intrinsic capability of each area to absorb more population in future.
1. BAWAN
With a density of 1,117 persons per acre in 1961, the Bawana Rural District has several attributes to be considered as an economically advanced tract. But it suffers from certain physical limitations likely to interfere with its further development. The land in this district annot be considered fertile, excepting for a small part in the north-west. The water is mostly saline. But the area enjoys canal irrigation which has been a boon to agricultural. There are 28 rural settlements in this district, of which 17 had a population exceeding 1000 in 1961. Bawana is a retail trade centre for the surrounding villages, and is about 4.5 miles from Narela town. It is a growing village. There are about 3154 craftsmen in this district engaged in various village industries like show making,weaving, pottery, spinning, carpentry, tanning, black-smithy and basket-making. Being an important centre, it is suited for the location of a Rural Industrial Estate.
2. MEHRAULI:
Lying to the south of Delhi with a good percentage of its land under hilly terrain, the Mehrauli district had a low density of .992 persons per acre in 1961. Thirteen if its twenty two rural settlements had a population exceeding 1000. There is a good potable sub-soil water around chhatarpur. But the depth of the water level is from 40 to 80 and hence deep tube-well boring is needed. This district is important for some minerals. There is a large number of brick-kilns and stone- quarries. China clay, good enough for earthenware and electrical industries and other refractories, is found around Mehpalpur. This has led to the establishment of potteries in this area.
3. NAJAFGARH:
This is a low-lying tract and is faced with drainage problem from the Najafgrh jhil. The subsoil water I this tract is mostly saline. There are twenty seven rural settlements, of which only ten had a population exceeding 1000 in 1961. Najafgarh is an important mandi. The tract may be expected to absorb a greater population with the eradication of the drainage problem.
4. NANGLOI JAT :
This district is on the border of urban Delhi. It has level land which is moderately fertile. The sub –soil water of this tract is mostly saline. But in some parts, the surface water is found to be sweet and potable. Twelve of the twenty three rural settlements of this tract had a population exceeding 1000 in 1961. There are
about 1700 craftsmen in this district engaged in various village industries like spinning, shoe-making and weaving. The village of Nangloi jat has also been proposed for the location of an industrial estate.
5. NARELA:
Part of this district i.e. the tract from Burari to Bakhtawarpur, lies along the river Yamuna and is subject to annual floods. This portion has a comparatively low density of population. The northern portion of this district has good sub-soil water, while the eastern and southern parts have a saline water. Sixteen of its forty four rural settlements had a population exceeding one thousand persons in 1961. This district has the largest number of craftsman enagegd in various village industries like spinning, shoe—making, weaving, carpentry, pottery, black-smithy, tanning and basket-making. Several small scale industries exist in Narela. It has the biggest mandi in rural Delhi. It is proposed o be developed into a satellite township of about 71,000. Thus it will be seen that Narela holds out possibilities of absorbing more population.
6. PALAM :
This district lies close to urban Delhi. Part of it is low-lying. Inn the nortern portion, water is saline, but in the south, around Bijwasen, there is good, potable sub-soil water. The area has been largest number o0f brick- kilns in the territory. Palam and Bijwasan are the important tvillages in this districts. Eleven of the twenty rural settlements of this district had a population exceeding 1000 people in 1961.
7. SHAHDARA:
There are three vilolage clusters in this district. Mustafad and Dilupura clusters being riverine tracts, are subject to annual floods. The eastern parts of these clusters, bordering along U.P. state, have sailing water. In the other areas, sub-soil water is good. In view of the flood problem, the possibility of this tract supporting a high density of population is ruled out. In the village clusters around Molar Bund, the contamination of sub-soil water due to Okhla sewarge presents a serious problem. Only four of the nineteen rural settlements of this district had a population exceeding 1000 in 961. With little or on industrial potential, the prospects of this tract absorbing any large population in future are bleak.
8. UJWA:-
This district lies on the south western border of Delhi territory. part of this district, around shikarpur, faces the same draingss problem as that of Njafgarh district. sub-soil water in the whole district is mostly saline. There soils of this area are of moderate fertility. Only seven out of the twenty-four rural settlements had a population exceeding 1000 people in 1961. The tract has very little or no industrial potential.
R.G.GuptaCity/Policy Planner
Master Plan For Delhi 1957, Volume-II, PART - 3

FUTURE POPULATION DISTRIBUTION :
As a firststep in attempting to distribute population on some rational basis, the physical and economic resources index. In doing this both physical and economic factors have been taken into account. For the physical index, the following factors were considered.
(i) Toporgraphy and nature of the trac
(ii) Sub-soil water conditions
(iii) Productivity of soil
(iv) Location and proximity to bigger development and
(v) Geology and mineral resources. For constructing the Economic index 2, the factors taken into account and the specific points considered were.
1. POPULATION
(a) Density of population
(b) Number of settlements exceeding 1000 people.
II. LAND AND AGRICULTURAL
(a) Cultivated Area.
(b) Irrigated area.
III OCCUPTIONS OTHER THAN AGRICULTURAL
(a) Dairying- Milk production.
(b) Village industries –No. of craftsman.
IV ROAD AND ACCESSIBILITY
(a) Mileage of pucca roads.
(b) Bus facilities.
V. SERVICES
(a) Schools;
(b) Health and Medical Services.
Each Rural District was graded against the particular item, and points were assigned in the same order. No attempt was made to apply weighting since it is practically impossible to assess numerically the economic and social value of, say, availability of bus services as against a high percentage of cultivated area in a particular tract. The two indices were considered separtately and than added together o got the resource index. This had to be done because, whereas quantitative information was available for economic data(making grading easier in this acse), only qualitative description was available in the case of physical data. The results are given below :
TABLE 8.
PHYSICAL & ECONOMIC INDEX
Narela*
Palam
Shahdara
Ujwa
10
11
10
8
75
45
22
35
85
56
32
43
Name of the District
Bawana
Mehrauli
Najafgarh
Nangloi Jat
9
9
7
12
78
42
49
67
87
51
56
79
Physical Index Points
EconomicIndex Points
Resources Index Points
The resource index of a district may be considered as an indicator of its relative potentiality( in terms of physical and economic resources) to absorb more population. If the population is to be distributed on this basis, te results will be as follows :
TABLE 9
DENSITY OF POPULATION ON THE BASIS OF PHYSICAL ECONOMIC INDEX
District
62,265
36,505
40,075
56,560
60,830
40,075
22,925
30,765
30,50,000
1.78
1.19
1.44
1.79
1.15
1.50
1.22
1.29
1.42
Bawana
Mehrauli
Najafgarh
Nangloi Jat
Narela*
Palam
Shahdara
Ujwa
Total
Population1981
Density of Population(Persons per acres)
Resources indexing, is not the decisive factor. The future distribution pattern is a conscious and planned effort in which the planner choice must play an important role. In making future estimates of population, therefore, an attempt has been made to bring about a better distribution of population in the rural areas, so that development does not get concentrated at one or two points only, but is more less even and harmonious and related to a future diversified pattern of rural economy, in which not only agricultural, but other possibilities like mixed farming, small-scale and cottage industries etc. , will take their proper place. Accounthas been taken of the effect of the various proposals by expert bodies like te central water and power commission, intended to eliminate some of the existing natural bottlenecks to progress, which might ultimately render a particular tract favorable for supporting a higher density of population. By such deliberate and planned distribution of population, the declining trend in the depressed areas may be arrested and growth promoted where ever possibilities exist. For instance, the great possibilities of Narela district to absorb a bigger population have been noted. In view of the growth of the sateliite township of Narela( which is being designed to accommodate a population upto 71,000), the potentialities for small-scale industries in and around Narela, and the relatively prosperous nature of this tract, which is free from major problem, a density upto 1.65 persons per acre may be suggested for this district. I Najafgarh district, higher densities may be expected to prevail, wit the implementation of the proposals to solve the drainage problem. In border districts like Nangloi jat, palam etc. coming within the Green Belt higher densities are not favored and it would be preferable to restrict the density upto 1.58 persons per acre. In Bawana district, though a higher density is indicated in the calculations based on Resource Index points, such high densities are not considered desirable in view of certain physical limitations of this' tract, already described. In shahdara District, excepting Mustafabad tract, the others parts cannot support even medium densities, in view of the serious problem like floods, contamination of underground water supply etc. facing these parts. Considerations such as these suggest te following optimum densities for the various Rural Districts :
1. Details regarding the method of assigning points etc. are indicated appendix 4& 5.
2. Excluding Narela town.
R.G.GuptaCity/Policy Planner
Master Plan For Delhi 1957, Volume-II, PART - 3

TABLE 10
OPTIMUM DENSITY SUGGESTED
Rural DistrictApproximate (Optimum Density)Suggested (Persons per acres)
Bawana 1.57
1.04
1.62
1.58
1.65
1.50
0.85
1.05
Mehrauli
Najafgarh
Nangloi Jat
Narela*
Palam
Shahdara
Ujwa
Rural District Population 1981Percentage of
Total Populations
Bawana 15.71
9.14
12.86
14.29
24.86
11.43
4.57
7.14
100.00
55,000
32,000
45,000
50,000
87,000
40,000
16,000
25,000
3,50,000
Mehrauli
Najafgarh
Nangloi Jat
Narela*
Palam
Shahdara
Ujwa
Total
On the basis of these assumptions, the estimates of population for Rual Districts for 1981 will be as follows :
TABLE 11 1981 POPULATION ON THE BASIS OF
PROPOSED DENSITY
It may be noted that the estimates which are presented here should not be taken as the last word on the subject. They are based on more or less plausible assumptions as to future population trends in rural Delhi and have been arrived at after careful study. It may reasonably be supposed that the central village proposed for each village cluster will, in course of time, grow into small Rural satellities of about 4000-5000 people. The district centres like Nangloi jat, Bawana, palaam, Ujwa etc. May become small rural towns with of about 7000-10,000.
RURAL LAND USE
The land use plan is based on the classification of land by use capabilities. In the rural area, the existing land may be broadly classified as follows :-
1. Cultivated land
2. Pasture
3 . Oorchard
4. Abadi (Village settlement)
5. Uncultivated land.
The area under each, for the entire rural Delhi is given below :-
Category
Cultivated
61,795
35,730
101,668
1,527
1,609
3,848
91,098
2,97,275
20.79
12.01
34.17
0.52
0.55
1.30
30.66
100.00
Good
Medium
Poor
Pasture
Orchard
Abadi
Uncultivated
Total
Area in Acres Percentage
Source : Revenue Authorities – Delhi Territory.
The detailed break up of the land classification is furnished in Appendix 6.
Proposals on rural land use have been made with a lew to preventing haphazard development in the rural area and preserving the rural land for its essential uses.
Control of urban sprawl –The Agricultural Belt .
An essential part of the planning of any area is the control of development to prevent building in undesirable places. In the immediate vicinity of the metropolis (e.g. in the area around the compact urban limits upto 1981), a firm control is particularly necessary to prevent the overspill of urban areas and the encroachment of other forms of constructional development. such control must also extend along the main high-ways radiating from Deli in order to prevent ribbon development. The plan, therefore, provides for abroad background in the form of an are around the metropolis with extensions along the main highways, in which stringent control will be exercised over development proposals. This inner rural zone, which may be called the Agricultural Belt, will be subject to special aesthetic treatment and protecton of its rural character from promiscuous urbanization. The entire belt is recommended for intensive agricultural use, more especially for city oriented farming activities. These shall be a new feature for Delhi residents, and shall consist of some plots allocated to interested residents in the city who may build country houses in them and undertake fruit, vegetable and flower gardening. Thus, the advantages of the countryside could be enjoyed by the city dweller within a reasonable distance from the city. the agricultural belt may also include nurseries and demonstration agricultural farms. Other activities of a non-rural character, excepting those already indicated in the draft plan, will be strictly excluded from this area. The agricultural belt recommended in the plan is one mile around the compact urban limit line (1981) excepting the regional parks.
These proposals visualize a degree of control and the use of land in rurel areas as a well. In the absence of restrictions, people will be tempted to build in the rural areas in an indiscriminate way which would not only spoil the rural character of the region but would also lead to haphazard and sub-standard urban sprawl outside the urbanizable area, thereby defeating the whole objective of compact and organnsed urban development.
In order to preserve the agricultural areas certain restrictions on the size of farm houses should be imposed. They are as follows :
TABLE 12
LAND CLASSIFICATION
R.G.GuptaCity/Policy Planner
Master Plan For Delhi 1957, Volume-II, PART - 3

N.B . 1) Set- back for a dwelling house should be 50 ft. from any boundary line of the property;
2) Where the property abuts on urban road the dwelling house building should be set-back from the centre line of that road by 200 ft. where the property abuts a village road the building set-back from the centre line of that road should be 100 ft.
3) No dwelling unit should be built within 2 furlongs of the right of way of any national highway.
Farm Houses :
These measures will save the rural area from undesirable development and will also elements the chances of urban dwellers to encroach upon the country-side on the pretext of farming.
Recreational areas :
The plan also provides for three regional parks in the Delhi rural area and two outside the Union Territory of Delhi. The three parks located in the Delhi rural area are as follows :
I. Park in southern Delhi extending from the proposed University campus at Ring Road, with an area of about 20,000 acres. The general features of this park will include roacky lands with great variations in contour, spots of scenic beauty as in Suraj Kund and Mehrauli and the great historic monuments in Mehrauli and Tughlakabad.
II. Park existing along the Najafgarh Nalan upto the Najafgarh Jhil with an area of about 19,000 acres. This park will have botanical gardens and facilities for duck- shooting.
III. Park to the north of Delhi extending upto river Yamuna with an area of about 5,000 acres.
It is recommended that the land required for these Regional parks may be acquired and maintained by a suitable constituted for this purpose.
Conservation Area:
In the land use plan the areas suitable for forests and pasturas are also indicated. It has been realized on all hands that th existence of vegetation cover is essential to prevent erosion and floods, to ensure an adequate supply of fire wood and small timber to the rural and urban population, to provide grazing and fodder resources for the cattle and, in general to improve the climate conditions and to raise the sub-soil water level. It is necessary that all waste lands in general, and those that are threatened with erosion in particular, should be taken up for afforstation. In the south of Delhi, there is an area of about 19,500 acres of broken waste land, forming part of the Arrival hill slopes, where at many places deep gullies have appeared. Some of these gullies are threatening to invade the adjoining fertile land. Suitable soil conservation and afforestation measures must be taken to check this menace. In the second instance,, there are about 30,000 acres of waste land, 2 mostly in the form of Shamlat grazing grounds along the banks of the river Yamuna, which require protection by vegetation cover to prevent them from being eroded by river action. In both these cases, determined effort is necessary to bring the affected areas under vegertation cover. The forest conservation department under the Delhi Administration is tackling area of 60,0000 acres in Delhi territory under forests and pastures. Considering the urban character of the Union territory of Delhi, it is felt that this programme is adequate and should be purshed vigorously. Details of the areas to be brought under the afforestation programme are given in Appendix 7.
Industrial Use :
Regarding the location of industries, the possible sites for such development have been indicated in the roads shopping and industries plan. The broad policy is to encourage such development in selected places, without harming agriculture and the well being of rural communities, or spoiling the beauty of the countryside. This will be in keeping with the basis concept of rural development in which is envisaged a group of village with its natural industrial and urban centre in the rural town, and these rural towns to have a similar relationship to the bigger towns in the metropolitan region. The development of rural trades and crafts in small villages and light to medium industries in rural towns, which will be related to the bigger industries located in Delhi and in the other ring town is strongly recommended. In such an organization, it is hoped that the small centres will experience a co- operative interest in the bigger ones and these will develop a genuninely supporting, instead of an exploitational relationship towards the industries located in the smaller towns and the countryside. The rural towns proposed for the location of light to medium industries are Nangloi jat, Bawana, palam and Najfagarh.
In the plan showing agricultural belt, urban village and afforstation 23 urban villages have been indicated where it is proposed to rehabilitate the slumdwellers, who will be displaced from the city. It is proposed to reserve an area of about 100 acres in each site, which would be enough to accommodate about 3,000 to 4,000 people. The area can be enlarged, if necessary, but not indiscriminately.
Commercial Use :
The plan seeks to provide 17 local shopping centes for each cluster of villages, 6 district shopping centres for bigger village groups and 3 mandis in more central locations, All these are indicated in the roads, shopping and industries plan.
Schools and collages :
Rural Delhi is at present deficient in educational facilities, both at the school and collage level. Based on a projection of the school going population of different age-groups upto 1981, the school requirements for the rural population has been computed as follows :-
Rural Tract. Narela.
Junior Bsic Units (classes I TO V) 274 55
Senior Basic Units (Classes VI TO VIII) 264 53
Higher Secondary Units (Classes IX to XI) 192 39
These are proposed to be located in the rural areas, taking the size of the village and the needs into account. It is also proposed to establish two collages in the rural towns of Narela and Najafgarh.
Other Community Facilities :
In the education, community centres and health facilities plans, adequate provision has been made for health and medical services as well as community centres in the villages. Based on the standard that one primary health centre will be required for every 20,000 people in the rural area, the number of primary health centres required upto 1981 has been assessed as 18. Each village cluste will have at least one primary health centre, located in the central village.
The plan also provides for integrated community centres consisting of a library, a reading room, an auditorium, a play field, a primary school, an adult literacy centre, a women and children welfare centre, a youth club and a primary health unit. These will be located in each of the 25centralvillages, proposed in the plan.
Size of Farm
1 to 3 Acres 250 Sq. Ft. Single Story 20 Ft.
Single Story 20 Ft.
Single Story 20 Ft.
1200 Sq. Ft.
1500 Sq. Ft.
3 to 5 Acres
Above 5 Acres
Maximum Coverage of the Dwelling Unit
Maximum Height of the Dwelling Unit
1. Source : Delhi Administration: second Five Year plan Report.
2. Source : Delhi Administration.
R.G.GuptaCity/Policy Planner
Master Plan For Delhi 1957, Volume-II, PART - 3

Roads :
One of the sailent features if the plan is he provision of a net-work of village roads connecting villages or groups of villages with each other and with the nearest road or main highway.
Such roads have been laid out so that all the required benefits, namely, schools, health centrtes and places of amusement are brought within a reasonable radius of the villages. The total road mileage proposed is about 134. The width recommended for these roads is so(22 paved way with a side strip of 14 on either side to afford drainage facility) . Almost all of them are proposed to be aligned along the existing kutcha roads which are already under public possession. The extra land that may have to be acquired will be of the order of 356,00 acres.
Housing and redevelopment of the village site
Most of the existing villages in Rural Delhi are overcrowded without adequate open spaces and roads. During the course of Rural surveys (1958) it has been observed that the houses are built irregularly without proper pathways, sanitation and drainage. They are, by and large, ill-built, and poorly ventilated. They are mostly haddled together in some spots in the village, presenting slum ir very near slum conditions. Cwin to the paucity of time and personnel, it was not possible to undertake a survey of housing conditions in rural Delhi and to indicate in more or less precise terms, the extent of the present inadequacy. Never the less, there is a pressing need to improve the housing conditions in Rural Delhi.
Such improvement of the village. A determined effort must be made to bring about some order in the present chaotic pattern of village layout, and to regulate building activity in future. Unless this is done immediately, the need will soon arise of clearing a vast rural slum in the immediate background of the Metropolis.
PLAN FOR EDUCATIONAL FACILITIES IN RURAL DELHI
This plan takes into account the increase in the number of school children, consequent on the growth of population and proposes provision of school at appropriate places.
In Rural Delhi, there are at present 274 schools in 250 villages. Out of these, 179 are junior basis, 58 are senior basic and 37 are high and higher secondly schools. The total number of students attending these schools is 42,662. Schools upto the senior basic standard are administered by the Municipal corporation schools are under the control of the Delhi Administration.
The existing number of schools, correlated to the population of the area, gives one junior basic unit ( classes I to v) for every 1525, one senior basic unit ( classes vi to viii) for every 4400, and one higher secondary unit ( classes Ix to xi) for every 11,300 people. Taking into account the number of school- going children of the various age-groups and relating this to the existing provision, it is noticed that tere at present a deficiency of more than 50% at the junior basic level, 53% at thesenior basic level and 81% at the higher secondary level. Although compulsory education up the higher secondary stage is not the immediate national objective, the figures still emphasise the need for an over-all raising of the standards of the existing provision. The position is also quite unsatisfactory from the point of view of physical location of the schools. The average distance separating higher secondly schools is about 5.5 miles. In many cases this means an actual distance ( i.e. distance along existing road) of 6 to 10 miles.
Similarly many senior basic schools are so located that the actual distance between them is 4 to 6 miles. Any plan seeking to ameelioate these conditions should out this distance between the home and the school and aim at providing school facilities within a reasonable distance from any village, preferably within walking distance. Such an attempt has been made in the proposals for the rural areas, outline in this report.
The Plan :Basic, The plan is based on the number of school –going children in the age-group 6-11, 11-14, and 14-17. These age groups correspond to junior basic standard (classes I to v), senior basic standard( classes ix to vu to viii) and higher secondly standard( classes ix to xi) respectively. The number of children in the three age groups is given below:-
TABLE 13
ESTIMATES OF SCHOOL GOING CHILDREN – 1981.
Tract.
Rural Tract.**
Narela
3,50,000
71,000
40,495
8,215
23,800
4,828
23,030 87,325
4,672 17,715
Population 1981
6 -11 11-14 14-17
Children of the School Going Age (Years) Total Numbers of School Going Children
Coverage :
100% provision for education at all levels is the ultimate goal of the plan. Since it is not possible to achieve this immediately, a progressive increasein coverage is assumed till this state iis realized in 1981.
The size of the classes envisaged in junior basic, senior basic and higher secondary schools is 30, 30 and 40students respectively. This gives an average enrolment of a junior basic unit( classes i to v) as 150, of a senior basic unit( classes vi to viii) as 90 and of a higher secondary unit ( classes ix to xi), as 120. On the basic of these assumptions, the additional units required in the various categories have been worked out and the figures ae given below:
TABLE 14
NUMBER OF ADDITIONAL SCHOOL TO BE PROVIDED
Details of the Proposals
New Construction
Upgrading
a) Junior Basic Units
b) Senior Basic Units
c) Higher Secondary Units
d) Colleges
a) Junior Basic to Senior
Basic Schools
b) Senior Basic to Higher
Secondary Schools
Additional units to be provided
-
-
-
169
155
1
Rural Tract.
-
-
1
1
14
37
Narela
R.G.GuptaCity/Policy Planner
Master Plan For Delhi 1957, Volume-II, PART - 3

When this programme is given effect to, the number of schools( interms of school buildings) at the end of the plan period(1981) would be as follows:-
TABLE 15
NUMBER OF ADDITIONAL SCHOOL BUILDING- 1981
Types of Schools
10
72
192
274
2
55
14
39
a) Junior Basic Schools
(Classes I to V)
b) Senior Basic Schools
(Classes I to VIII)
c) Higher Secondary Schools
(Classes I to XI)
Total
Additional units to be provided
Rural Tract. Narela
In the picture that emerges in 1981, each medium sized rural settlement (with a population of about 2000 people) will have a full fledged higher secondary school. The entire school-going population will get full facilities for education upto the higher secondary stage. This, in turn, may create an increased demand for higher education.
PROGRAMME FOR HEALTH AND MEDICAL SERVICES IN RURAL DELHI
1. INTRODUCTION :
Provision for adequate health and medical facilities an important aspect of rural development. In physical planning, the task is to provide such services at spaced intervals, so as to bring them 2it6hin easy reach of the people inan area. In rural areas, two factors which pose problem to the planner are the sparsely populated character of the countryside and the long distance between rural settlement. The planner has, therefore, to balance the claims and needs of the respective areas on the one hand and the economic aspect on the other, before deciding on the quantum and location of such provision., such an attempt has been made in the proposals outlined here.
2. A REVIEW EXISTING HEALTH AND MEDICAL SEVICES IN RURAL DELHI.
The following table shows the exiting health and medical facilities in Rural Delhi.
Types of Unit
6
7
4
7
10
34
42
28
-
-
-
70
Primary Health Centres
Dispensaries
Mobile Medical Dispensaries
Maternity & Child Welfare
Centres
Sub-Centres
Total
Number Number of Beds
In the picture that emerges in 1981, each medium sized rural settlement ( with a population of about 2000 people) will have a full fledged higher secondary school. The entire school-going population will get full facilities for education upto the higher secondary stage. This, in turn, may create an increased demand for higher education.
PROGRAMME FOR HEALTH AND MEDICAL SERVICES IN RURAL DELHI
1. INTRODUCTION :
Provision for adequate health and medical facilities an important aspect of rural development. In physical planning, the task is to provide such services at spaced intervals, so as to bring them 2it6hin easy reach of the people inan area. In rural areas, two factors which pose problem to the planner are the sparsely populated character of the countryside and the long distance between rural settlement. The planner has, therefore, to balance the claims and needs of the respective areas on the one hand and the economic aspect on the other, before deciding on the quantum and location of such provision., such an attempt has been made in the proposals outlined here.
2. A REVIEW EXISTING HEALTH AND MEDICAL SEVICES IN RURAL DELHI.
The following table shows the exiting health and medical facilities in Rural Delhi.
TABLE 16
EXISTING HEALTH AND MEDICAL FACILITIES
IN RURAL DELHI
TABLE 16
EXISTING HEALTH AND MEDICAL FACILITIES IN RURAL DELHI
Area
Urban 18.29
4.13
22.42
98
17
115
0.19
0.24
0.20
2.42
0.17
2.00
4428
70
4498
Rural
Total
Source: Town Planning Organization
Total No. of People (Lakhs) 1951
No. of People Per Dispensary and H.C.
(Lakhs)
No. of Dispensaries Including H.C. Total No. of Beds.
No. of beds per Thousand
From the above table, it will be seen that :
1) The number of persons per dispensary in the rural area is higher as compared to the number of persons per dispensary in the urban areas; and
2) The number of beds per thousand of population is only 0.17 for the rural area as compared to 2.42 for urban Delhi. This is very low, as compared to even the all India ratio of 0.39 beds per thousand.
R.G.GuptaCity/Policy Planner
Master Plan For Delhi 1957, Volume-II, PART - 3
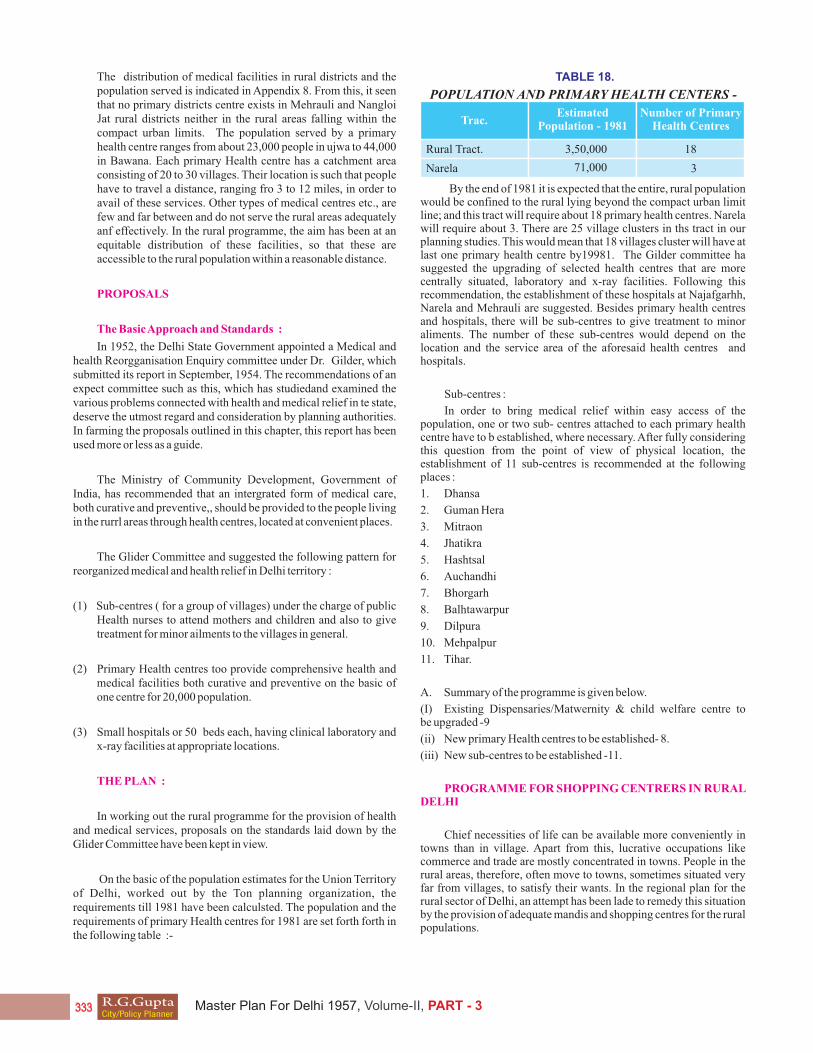
The distribution of medical facilities in rural districts and the population served is indicated in Appendix 8. From this, it seen that no primary districts centre exists in Mehrauli and Nangloi Jat rural districts neither in the rural areas falling within the compact urban limits. The population served by a primary health centre ranges from about 23,000 people in ujwa to 44,000 in Bawana. Each primary Health centre has a catchment area consisting of 20 to 30 villages. Their location is such that people have to travel a distance, ranging fro 3 to 12 miles, in order to avail of these services. Other types of medical centres etc., are few and far between and do not serve the rural areas adequately anf effectively. In the rural programme, the aim has been at an equitable distribution of these facilities, so that these are accessible to the rural population within a reasonable distance.
PROPOSALS
The Basic Approach and Standards :
In 1952, the Delhi State Government appointed a Medical and health Reorgganisation Enquiry committee under Dr. Gilder, which submitted its report in September, 1954. The recommendations of an expect committee such as this, which has studiedand examined the various problems connected with health and medical relief in te state, deserve the utmost regard and consideration by planning authorities. In farming the proposals outlined in this chapter, this report has been used more or less as a guide.
The Ministry of Community Development, Government of India, has recommended that an intergrated form of medical care, both curative and preventive,, should be provided to the people living in the rurrl areas through health centres, located at convenient places.
The Glider Committee and suggested the following pattern for reorganized medical and health relief in Delhi territory :
(1) Sub-centres ( for a group of villages) under the charge of public Health nurses to attend mothers and children and also to give treatment for minor ailments to the villages in general.
(2) Primary Health centres too provide comprehensive health and medical facilities both curative and preventive on the basic of one centre for 20,000 population.
(3) Small hospitals or 50 beds each, having clinical laboratory and x-ray facilities at appropriate locations.
THE PLAN :
In working out the rural programme for the provision of health and medical services, proposals on the standards laid down by the Glider Committee have been kept in view.
On the basic of the population estimates for the Union Territory of Delhi, worked out by the Ton planning organization, the requirements till 1981 have been calculsted. The population and the requirements of primary Health centres for 1981 are set forth forth in the following table :-
TABLE 18.
POPULATION AND PRIMARY HEALTH CENTERS -
Trac.
Rural Tract.
Narela
3,50,000
71,000
18
3
EstimatedPopulation - 1981
Number of PrimaryHealth Centres
By the end of 1981 it is expected that the entire, rural population would be confined to the rural lying beyond the compact urban limit line; and this tract will require about 18 primary health centres. Narela will require about 3. There are 25 village clusters in ths tract in our planning studies. This would mean that 18 villages cluster will have at last one primary health centre by19981. The Gilder committee ha suggested the upgrading of selected health centres that are more centrally situated, laboratory and x-ray facilities. Following this recommendation, the establishment of these hospitals at Najafgarhh, Narela and Mehrauli are suggested. Besides primary health centres and hospitals, there will be sub-centres to give treatment to minor aliments. The number of these sub-centres would depend on the location and the service area of the aforesaid health centres and hospitals.
Sub-centres :
In order to bring medical relief within easy access of the population, one or two sub- centres attached to each primary health centre have to b established, where necessary. After fully considering this question from the point of view of physical location, the establishment of 11 sub-centres is recommended at the following places :
1. Dhansa
2. Guman Hera
3. Mitraon
4. Jhatikra
5. Hashtsal
6. Auchandhi
7. Bhorgarh
8. Balhtawarpur
9. Dilpura
10. Mehpalpur
11. Tihar.
A. Summary of the programme is given below.
(I) Existing Dispensaries/Matwernity & child welfare centre to be upgraded -9
(ii) New primary Health centres to be established- 8.
(iii) New sub-centres to be established -11.
PROGRAMME FOR SHOPPING CENTRERS IN RURAL DELHI
Chief necessities of life can be available more conveniently in towns than in village. Apart from this, lucrative occupations like commerce and trade are mostly concentrated in towns. People in the rural areas, therefore, often move to towns, sometimes situated very far from villages, to satisfy their wants. In the regional plan for the rural sector of Delhi, an attempt has been lade to remedy this situation by the provision of adequate mandis and shopping centres for the rural populations.
R.G.GuptaCity/Policy Planner
Master Plan For Delhi 1957, Volume-II, PART - 3
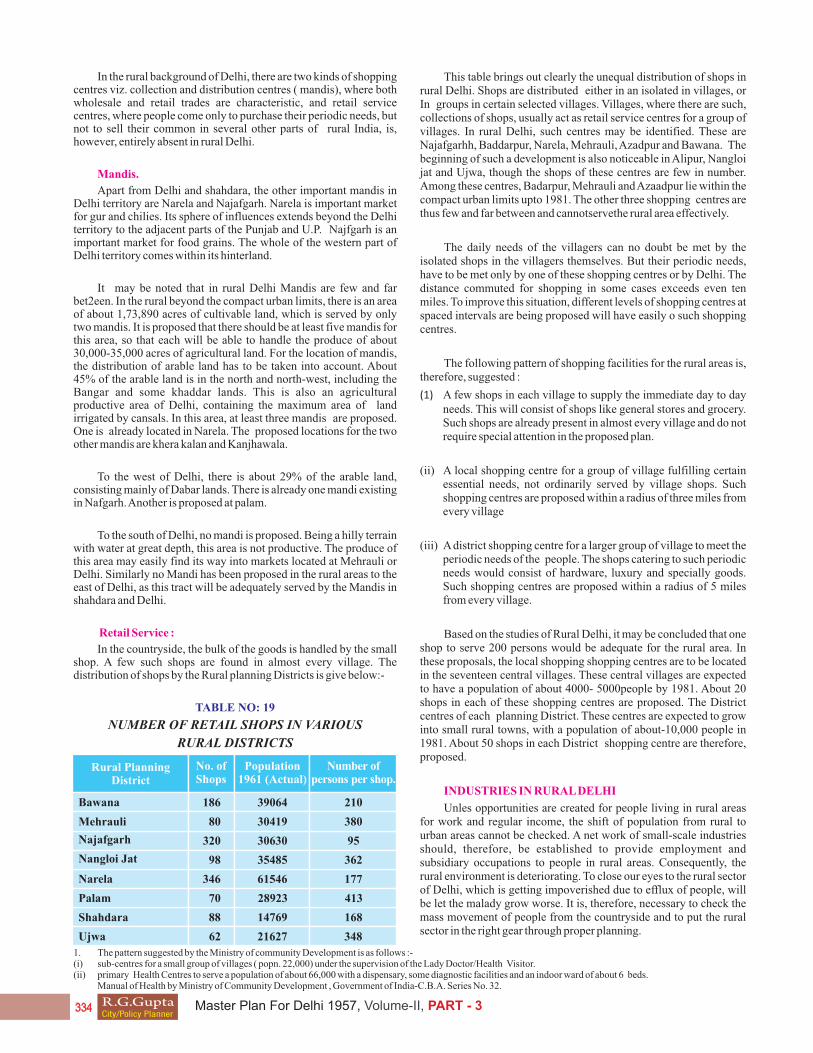
1. The pattern suggested by the Ministry of community Development is as follows :-(i) sub-centres for a small group of villages ( popn. 22,000) under the supervision of the Lady Doctor/Health Visitor.(ii) primary Health Centres to serve a population of about 66,000 with a dispensary, some diagnostic facilities and an indoor ward of about 6 beds.
Manual of Health by Ministry of Community Development , Government of India-C.B.A. Series No. 32.
In the rural background of Delhi, there are two kinds of shopping centres viz. collection and distribution centres ( mandis), where both wholesale and retail trades are characteristic, and retail service centres, where people come only to purchase their periodic needs, but not to sell their common in several other parts of rural India, is, however, entirely absent in rural Delhi.
Mandis.
Apart from Delhi and shahdara, the other important mandis in Delhi territory are Narela and Najafgarh. Narela is important market for gur and chilies. Its sphere of influences extends beyond the Delhi territory to the adjacent parts of the Punjab and U.P. Najfgarh is an important market for food grains. The whole of the western part of Delhi territory comes within its hinterland.
It may be noted that in rural Delhi Mandis are few and far bet2een. In the rural beyond the compact urban limits, there is an area of about 1,73,890 acres of cultivable land, which is served by only two mandis. It is proposed that there should be at least five mandis for this area, so that each will be able to handle the produce of about 30,000-35,000 acres of agricultural land. For the location of mandis, the distribution of arable land has to be taken into account. About 45% of the arable land is in the north and north-west, including the Bangar and some khaddar lands. This is also an agricultural productive area of Delhi, containing the maximum area of land irrigated by cansals. In this area, at least three mandis are proposed. One is already located in Narela. The proposed locations for the two other mandis are khera kalan and Kanjhawala.
To the west of Delhi, there is about 29% of the arable land, consisting mainly of Dabar lands. There is already one mandi existing in Nafgarh. Another is proposed at palam.
To the south of Delhi, no mandi is proposed. Being a hilly terrain with water at great depth, this area is not productive. The produce of this area may easily find its way into markets located at Mehrauli or Delhi. Similarly no Mandi has been proposed in the rural areas to the east of Delhi, as this tract will be adequately served by the Mandis in shahdara and Delhi.
Retail Service :
In the countryside, the bulk of the goods is handled by the small shop. A few such shops are found in almost every village. The distribution of shops by the Rural planning Districts is give below:-
TABLE NO: 19
NUMBER OF RETAIL SHOPS IN VARIOUS
RURAL DISTRICTS
Rural Planning District
Bawana 186
80
320
98
346
70
88
62
39064
30419
30630
35485
61546
28923
14769
21627
210
380
95
362
177
413
168
348
Mehrauli
Najafgarh
Nangloi Jat
Narela
Palam
Shahdara
Ujwa
No. ofShops
Population1961 (Actual)
Number of persons per shop.
This table brings out clearly the unequal distribution of shops in rural Delhi. Shops are distributed either in an isolated in villages, or In groups in certain selected villages. Villages, where there are such, collections of shops, usually act as retail service centres for a group of villages. In rural Delhi, such centres may be identified. These are Najafgarhh, Baddarpur, Narela, Mehrauli, Azadpur and Bawana. The beginning of such a development is also noticeable in Alipur, Nangloi jat and Ujwa, though the shops of these centres are few in number. Among these centres, Badarpur, Mehrauli and Azaadpur lie within the compact urban limits upto 1981. The other three shopping centres are thus few and far between and cannotservethe rural area effectively.
The daily needs of the villagers can no doubt be met by the isolated shops in the villagers themselves. But their periodic needs, have to be met only by one of these shopping centres or by Delhi. The distance commuted for shopping in some cases exceeds even ten miles. To improve this situation, different levels of shopping centres at spaced intervals are being proposed will have easily o such shopping centres.
The following pattern of shopping facilities for the rural areas is, therefore, suggested :
(1) A few shops in each village to supply the immediate day to day needs. This will consist of shops like general stores and grocery. Such shops are already present in almost every village and do not require special attention in the proposed plan.
(ii) A local shopping centre for a group of village fulfilling certain essential needs, not ordinarily served by village shops. Such shopping centres are proposed within a radius of three miles from every village
(iii) A district shopping centre for a larger group of village to meet the periodic needs of the people. The shops catering to such periodic needs would consist of hardware, luxury and specially goods. Such shopping centres are proposed within a radius of 5 miles from every village.
Based on the studies of Rural Delhi, it may be concluded that one shop to serve 200 persons would be adequate for the rural area. In these proposals, the local shopping shopping centres are to be located in the seventeen central villages. These central villages are expected to have a population of about 4000- 5000people by 1981. About 20 shops in each of these shopping centres are proposed. The District centres of each planning District. These centres are expected to grow into small rural towns, with a population of about-10,000 people in 1981. About 50 shops in each District shopping centre are therefore, proposed.
INDUSTRIES IN RURAL DELHI
Unles opportunities are created for people living in rural areas for work and regular income, the shift of population from rural to urban areas cannot be checked. A net work of small-scale industries should, therefore, be established to provide employment and subsidiary occupations to people in rural areas. Consequently, the rural environment is deteriorating. To close our eyes to the rural sector of Delhi, which is getting impoverished due to efflux of people, will be let the malady grow worse. It is, therefore, necessary to check the mass movement of people from the countryside and to put the rural sector in the right gear through proper planning.
R.G.GuptaCity/Policy Planner
Master Plan For Delhi 1957, Volume-II, PART - 3

Agricultural hardly provides regular employment in rural Delhi. A survey conducted by the small scale industries Department in Alipore pilot project area( a comparatively prosperous agricultural tract in Delhi Territory reveals that an agricultural labourer usually remains fully employed for about 170 days inhe year. Inother parts of rural Delhi, the position is much worse in view of the several problems confronting agricultural. Ruggedness of land in Kohi chak, floods in the shahdara tract and the problem of drainage in the Najfgarh tract, do not make it possible to grow crops labourer. It can, thus, be will imagined that agricultural alone cannot achieve an all round development in the villages in rural Delhi. For a balanced development, cottage and other small scale industries must be given a due place in the rural economy.
One may envisage different types of industries to grow in rural Delhi. For the purpose of this study, it has been found conveninent to distinguish three board categories mentioned below. This classification has been adopted simply because it is convenient, and closely related to the problem of location. Te categories are:
(1) Village industries depending on local raw-materials;
(2) Other industries which might be attracted to the rural area on account of cheapness of land and labour and industries that might be shifted from the urban core on account of their abnoxious character or other reasons, during the stages of planned development: and
(3) Rural trades and crafts, depending on local talent.
(1) VILLAGE INDUSTRIES DEPENDING ON LOCAL
RAWMATERIALS :
Rural Delhi, by itself, has very limited industrial potential. Still a few village industries, based on local raw materials, the agricultural, animal, forest and mineral resources of the rural sector should be examined. This would enable the selection of possible industries in this area and the pin pointing of the sites for their development.
(1) Agricultural Resources :
The main crops grown in the Delhi territory, their area and production are given in the following table :
TABLE. 20
AREA AND YIELD OF IMPORTANT CROPS IN
RURAL DELHI 1960
Name of the Corps.
Food Corps:
Wheat
Gram
Barley
Bajra
Maize
Jawar
Rice
Sugar Cane
Oil Seeds
Commercial Crops:
Cotton
Fodder
69,941
35,566
9,677
53,695
3,244
32,835
2,964
10,226
707
1,278
4,537
17,859
886
495
10470
682
4261
915
8276
134
-
-
Area (Acres) Production Mt. Ton
It is clear from the above table that the only crop which appears to have some industrial possibilities, is sugar cane. The yields of other commercial crops such as oil-seed and cotton are in limited quantities and are being mostly used for the personal consumption of individual growers.
The following table gives the area under sugar-cane in the various rural districts :-
TABLE . 21
AREA UNDER SUGAR CANEIN VARIOUS DISTRICTS
Sl. No. District Area under sugar - cane in 1958 (acres)
1
2
3
4
5
Bawana
Mehrauli
Najafgarh
Nangloi Jat
Narela
2615
162
876
1241
2729
6
7
8
Source : Revenue Department
Palam
Shahdara
Ujwa
9404
490
424
767
From the above table, it will be seen that the two district which figure prominently with a large acreage under this crop are Narela and Bawana. It may, therefore, be desirable to a locate a few units for the processing of sugar in these areas. At present most of the sugarcane is being utilished for making gur.In view of the great demand which exists for khandsari sugar both in the rural area and in urban Delhi, the small scale industries Department, which made a detailed study of the Alipur project area, has rated this industry as A. This industry is, therefore, recommended for the rural districts of Narela and Bawana; Kanjhawala and Alipur are recommended as possible locations for this industry. Besides being located in the midest of a sugar-cane growing-area, the two villages are also central villages in our scheme of rural development and their location would only be in keeping with their importance. They have alredy good communication facilities with the surrounding villages, which are expected to grow further with te implementation of the road development programme. This will facilities the assembling of produce from the surrounding village.
(ii) Animal Resources :
Among animal products of some significance in rural Delhi, milk products and hides and skins deserve particular mention.
(a) Milk and milk products :
It is estimated that out of 7000 maunds of milk consumed in Delhi every day, about 1500 maunds areContributed by the rural areas of Delhi, about 4000 maunds are imported from the rural areas of the adjoining districts of U.P. and the Punjab, and the remaining 1500 maunds are contributed by the Delhi Urban area itself.
The following table shows the production of milk in the various rural districts:
R.G.GuptaCity/Policy Planner
Master Plan For Delhi 1957, Volume-II, PART - 3

TABLE 22
PRODUCTION OF MILK IN VARIOUS RURAL DISTRICTS:
In the rural area, the peasants generally keep milch cattle. Mixed farming will, therefore, have great possibilities in rural Delhi, if sufficient encouragement is given to cattle owners. The Delhi Milk supply scheme, tries to help the rural areas by providing an efficient marketing organization.
1. Survey of Milk production in Jama development centre Report by the Jamia Institute of Agricultural Economic and Rural sociology.
2. This relates to the total production of milk in te Rural Districts beyond the compact urban limit line only. Besides this, milk is also supplied by other village lying within the compact urban limit line.
It is hoped that it will indirectly help in augementing milk production in rural areas. According to the scheme milk location and chilling centres are located in Rural areas. The establishment of such centres in central village proposed in these studies would be desirable. It is understood that the capacity of a chilling plant is 200 maunds. On tis basic, the location of 5 centres at Alipur, Bawana, Najafagrh and Chhattarpur is recommended, taking the areas of milk production into accounts.
(B) Hides & Skin :
The other important animal product is hides and skins obtained from dead animals. The report on the small scale industries in the Alpur project area points out that nearly 1_2 of the raw hides and skins are sold to traders at Delhi, while the remaining are taned within the area. Again, of the tanned hides, nearly are sold to local shoe-makers, while the remaining are exported to Delhi. The report also points out that valu-able product from the carcasses of animal like bone,, mat, blood, horns, hooves and tallow are being wasted and no productive ues is being made of them. It is thus clear that there are possibilities for small-scale industries on these lines in rural Delhi. The establishment of such industries in the rural industrial estates is recommended.
(iii) Forest Resources :
There are no extensive forest areas in Delhi Territory. So there is very little scope for industries based on local forest products. But there are grasses likeMunj and dub the major raw materials for
making been, growing in abundance on the banks of river Yamuna. Baan- making has already developed as a cottage industry at palla. There are possibilities of increasing production of been in this centre.
1. It is understood that three such centres have already been located at Alipur, Bawana and Najafgarh.
(iv) Mineral resources:
Among the mineral resources in Delhi Territory are the Quartzite rocks which provide road metal and good quality china clay. These are found over a large area, west and south-west of Mehrauli. The important deposits of china clay are located in Kosumpur, Mehalpur and Msudpur. This clay is suitable for pottery industry. Mehlipur would be a suitable location for the expansion of this industry. It may be noted that there already are some manufacturing units around this place.
Among other extractive industries, mention may be made of brick manufacture and stone-quarrying operations in rural Delhi.
The following table shows the number of brick kilns and stone quarries in the rural areas:
TABLE 23
NUMBER OF BRICK KILNS AND STONE QUARRIES IN VARIOUS RURAL DISTRICTS – 1958
Source : T. P. O. Rural Survey
Name of the DistrictNo. of Brick
KlinsNo. of Stone
Quarries
Bawana -
29
-
-
-
-
4
-
8
16
8
7
16
37
4
9
Mehrauli
Najafgarh
Nangloi Jat
Narela*
Palam
Shahdara
Ujwa
In view of the large – scale building activity going on in and around Delhi, the coming of these extractive industries into the country side cannot be avoided. However, since such extractive industries are harmful to agricultural and the beauty of the countryside, suitable measures should be taken to minimize their destructive effeerts. Those who derive benefit from the working of land for minerals, should restore that land for agricultural or afforestation or other purposes( as maybe directed period of time after the land has been worked out.
(1) Other industries :
The second group of industries that have to be considered are those which might be attraced to the rural areas on account of cheapness of land and labour and those that might be pushed out of the urban area for various reasons.
The draft Master plan envisages a redistribution of industry within the Delhi Metropolitan area by 1981. If this redistribution I carried out, the estimated overall size of the total working force in
Source : T. P. O. Rural Survey
Rural DistrictProduction of Milk - 1958
(Maunds)
Bawana
Mehrauli
Najafgarh
Nangloi Jat
Narela
Palam
Shahdara
Ujwa
Total 13312
183
291
168
109
228
139
105
108
R.G.GuptaCity/Policy Planner
Master Plan For Delhi 1957, Volume-II, PART - 3
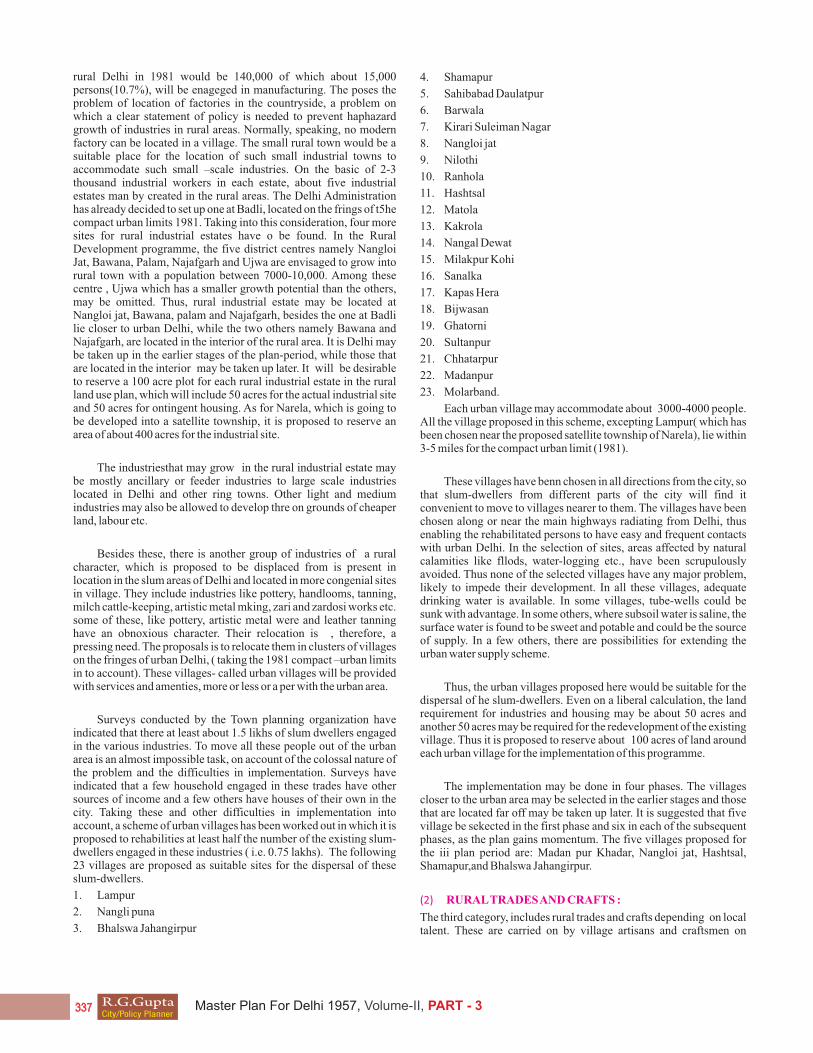
rural Delhi in 1981 would be 140,000 of which about 15,000 persons(10.7%), will be enageged in manufacturing. The poses the problem of location of factories in the countryside, a problem on which a clear statement of policy is needed to prevent haphazard growth of industries in rural areas. Normally, speaking, no modern factory can be located in a village. The small rural town would be a suitable place for the location of such small industrial towns to accommodate such small –scale industries. On the basic of 2-3 thousand industrial workers in each estate, about five industrial estates man by created in the rural areas. The Delhi Administration has already decided to set up one at Badli, located on the frings of t5he compact urban limits 1981. Taking into this consideration, four more sites for rural industrial estates have o be found. In the Rural Development programme, the five district centres namely Nangloi Jat, Bawana, Palam, Najafgarh and Ujwa are envisaged to grow into rural town with a population between 7000-10,000. Among these centre , Ujwa which has a smaller growth potential than the others, may be omitted. Thus, rural industrial estate may be located at Nangloi jat, Bawana, palam and Najafgarh, besides the one at Badli lie closer to urban Delhi, while the two others namely Bawana and Najafgarh, are located in the interior of the rural area. It is Delhi may be taken up in the earlier stages of the plan-period, while those that are located in the interior may be taken up later. It will be desirable to reserve a 100 acre plot for each rural industrial estate in the rural land use plan, which will include 50 acres for the actual industrial site and 50 acres for ontingent housing. As for Narela, which is going to be developed into a satellite township, it is proposed to reserve an area of about 400 acres for the industrial site.
The industriesthat may grow in the rural industrial estate may be mostly ancillary or feeder industries to large scale industries located in Delhi and other ring towns. Other light and medium industries may also be allowed to develop thre on grounds of cheaper land, labour etc.
Besides these, there is another group of industries of a rural character, which is proposed to be displaced from is present in location in the slum areas of Delhi and located in more congenial sites in village. They include industries like pottery, handlooms, tanning, milch cattle-keeping, artistic metal mking, zari and zardosi works etc. some of these, like pottery, artistic metal were and leather tanning have an obnoxious character. Their relocation is , therefore, a pressing need. The proposals is to relocate them in clusters of villages on the fringes of urban Delhi, ( taking the 1981 compact –urban limits in to account). These villages- called urban villages will be provided with services and amenties, more or less or a per with the urban area.
Surveys conducted by the Town planning organization have indicated that there at least about 1.5 likhs of slum dwellers engaged in the various industries. To move all these people out of the urban area is an almost impossible task, on account of the colossal nature of the problem and the difficulties in implementation. Surveys have indicated that a few household engaged in these trades have other sources of income and a few others have houses of their own in the city. Taking these and other difficulties in implementation into account, a scheme of urban villages has been worked out in which it is proposed to rehabilities at least half the number of the existing slum- dwellers engaged in these industries ( i.e. 0.75 lakhs). The following 23 villages are proposed as suitable sites for the dispersal of these slum-dwellers.
1. Lampur
2. Nangli puna
3. Bhalswa Jahangirpur
4. Shamapur
5. Sahibabad Daulatpur
6. Barwala
7. Kirari Suleiman Nagar
8. Nangloi jat
9. Nilothi
10. Ranhola
11. Hashtsal
12. Matola
13. Kakrola
14. Nangal Dewat
15. Milakpur Kohi
16. Sanalka
17. Kapas Hera
18. Bijwasan
19. Ghatorni
20. Sultanpur
21. Chhatarpur
22. Madanpur
23. Molarband.
Each urban village may accommodate about 3000-4000 people. All the village proposed in this scheme, excepting Lampur( which has been chosen near the proposed satellite township of Narela), lie within 3-5 miles for the compact urban limit (1981).
These villages have benn chosen in all directions from the city, so that slum-dwellers from different parts of the city will find it convenient to move to villages nearer to them. The villages have been chosen along or near the main highways radiating from Delhi, thus enabling the rehabilitated persons to have easy and frequent contacts with urban Delhi. In the selection of sites, areas affected by natural calamities like fllods, water-logging etc., have been scrupulously avoided. Thus none of the selected villages have any major problem, likely to impede their development. In all these villages, adequate drinking water is available. In some villages, tube-wells could be sunk with advantage. In some others, where subsoil water is saline, the surface water is found to be sweet and potable and could be the source of supply. In a few others, there are possibilities for extending the urban water supply scheme.
Thus, the urban villages proposed here would be suitable for the dispersal of he slum-dwellers. Even on a liberal calculation, the land requirement for industries and housing may be about 50 acres and another 50 acres may be required for the redevelopment of the existing village. Thus it is proposed to reserve about 100 acres of land around each urban village for the implementation of this programme.
The implementation may be done in four phases. The villages closer to the urban area may be selected in the earlier stages and those that are located far off may be taken up later. It is suggested that five village be sekected in the first phase and six in each of the subsequent phases, as the plan gains momentum. The five villages proposed for the iii plan period are: Madan pur Khadar, Nangloi jat, Hashtsal, Shamapur,and Bhalswa Jahangirpur.
(2) RURAL TRADES AND CRAFTS :
The third category, includes rural trades and crafts depending on local talent. These are carried on by village artisans and craftsmen on
R.G.GuptaCity/Policy Planner
Master Plan For Delhi 1957, Volume-II, PART - 3
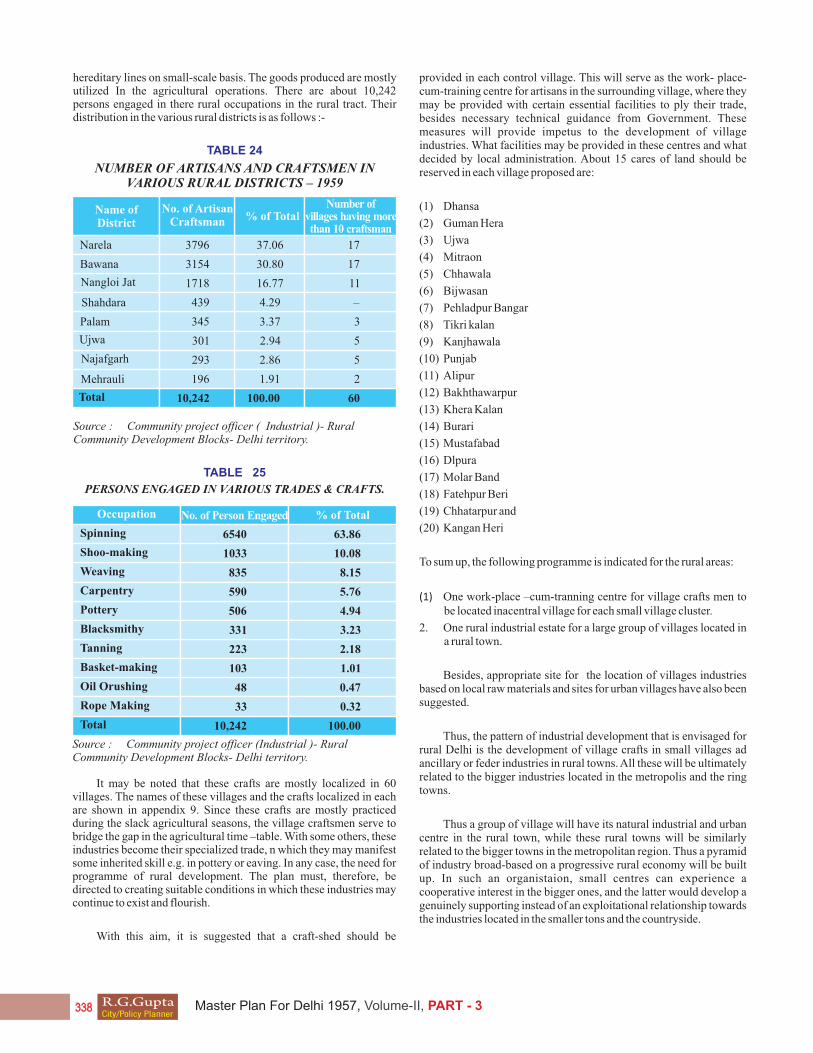
Name of District
Bawana
37.06
30.80
16.77
4.29
3.37
2.94
2.86
100.00
1.91
3796
3154
1718
439
345
301
293
10,242
196
17
17
11
–
3
5
5
60
2Mehrauli
Najafgarh
Total
Nangloi Jat
Narela
Palam
Shahdara
Ujwa
% of TotalNo. of Artisan
Craftsman
Number of villages having more than 10 craftsman
hereditary lines on small-scale basis. The goods produced are mostly utilized In the agricultural operations. There are about 10,242 persons engaged in there rural occupations in the rural tract. Their distribution in the various rural districts is as follows :-
TABLE 24
NUMBER OF ARTISANS AND CRAFTSMEN IN VARIOUS RURAL DISTRICTS – 1959
Source : Community project officer ( Industrial )- Rural Community Development Blocks- Delhi territory.
TABLE 25
PERSONS ENGAGED IN VARIOUS TRADES & CRAFTS.
Source : Community project officer (Industrial )- Rural Community Development Blocks- Delhi territory.
Occupation
Spinning 6540
1033
835
590
506
331
223
103
48
33
10,242
63.86
10.08
8.15
5.76
4.94
3.23
2.18
1.01
0.47
0.32
100.00
Weaving
Pottery
Tanning
Oil Orushing
Total
Shoo-making
Carpentry
Blacksmithy
Basket-making
Rope Making
% of TotalNo. of Person Engaged
It may be noted that these crafts are mostly localized in 60 villages. The names of these villages and the crafts localized in each are shown in appendix 9. Since these crafts are mostly practiced during the slack agricultural seasons, the village craftsmen serve to bridge the gap in the agricultural time –table. With some others, these industries become their specialized trade, n which they may manifest some inherited skill e.g. in pottery or eaving. In any case, the need for programme of rural development. The plan must, therefore, be directed to creating suitable conditions in which these industries may continue to exist and flourish.
With this aim, it is suggested that a craft-shed should be
provided in each control village. This will serve as the work- place-cum-training centre for artisans in the surrounding village, where they may be provided with certain essential facilities to ply their trade, besides necessary technical guidance from Government. These measures will provide impetus to the development of village industries. What facilities may be provided in these centres and what decided by local administration. About 15 cares of land should be reserved in each village proposed are:
(1) Dhansa
(2) Guman Hera
(3) Ujwa
(4) Mitraon
(5) Chhawala
(6) Bijwasan
(7) Pehladpur Bangar
(8) Tikri kalan
(9) Kanjhawala
(10) Punjab
(11) Alipur
(12) Bakhthawarpur
(13) Khera Kalan
(14) Burari
(15) Mustafabad
(16) Dlpura
(17) Molar Band
(18) Fatehpur Beri
(19) Chhatarpur and
(20) Kangan Heri
To sum up, the following programme is indicated for the rural areas:
(1) One work-place –cum-tranning centre for village crafts men to be located inacentral village for each small village cluster.
2. One rural industrial estate for a large group of villages located in a rural town.
Besides, appropriate site for the location of villages industries based on local raw materials and sites for urban villages have also been suggested.
Thus, the pattern of industrial development that is envisaged for rural Delhi is the development of village crafts in small villages ad ancillary or feder industries in rural towns. All these will be ultimately related to the bigger industries located in the metropolis and the ring towns.
Thus a group of village will have its natural industrial and urban centre in the rural town, while these rural towns will be similarly related to the bigger towns in the metropolitan region. Thus a pyramid of industry broad-based on a progressive rural economy will be built up. In such an organistaion, small centres can experience a cooperative interest in the bigger ones, and the latter would develop a genuinely supporting instead of an exploitational relationship towards the industries located in the smaller tons and the countryside.
R.G.GuptaCity/Policy Planner
Master Plan For Delhi 1957, Volume-II, PART - 3
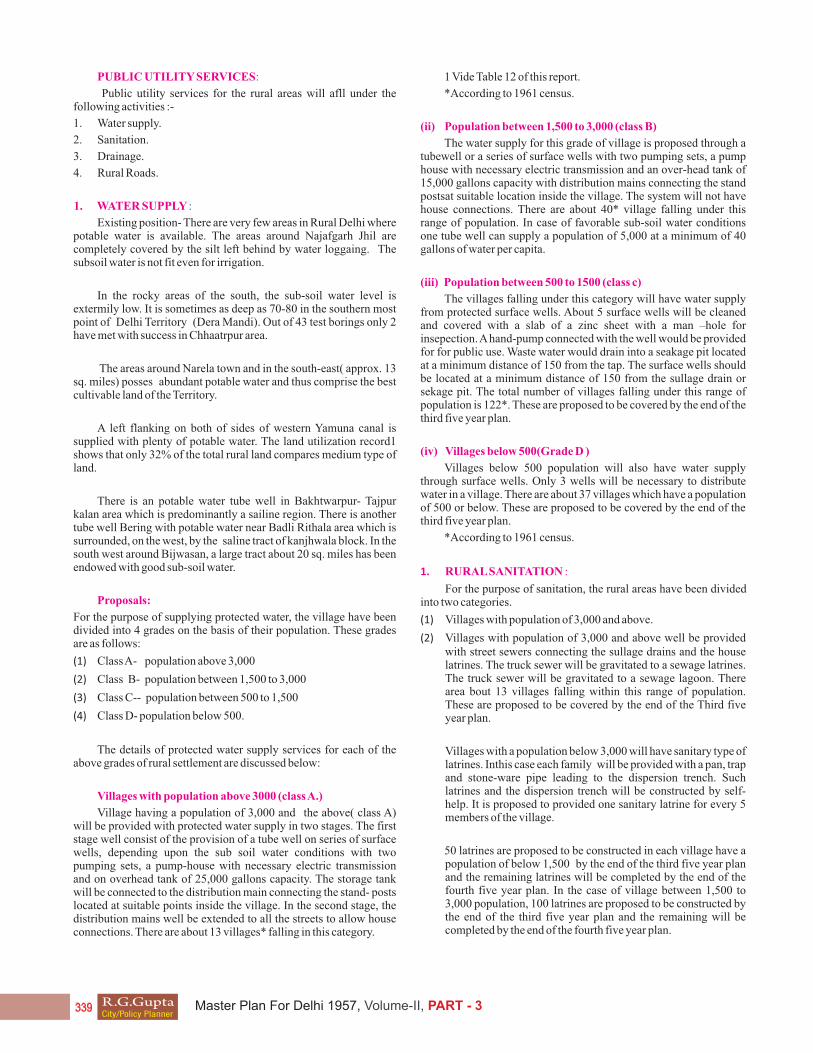
PUBLIC UTILITY SERVICES:
Public utility services for the rural areas will afll under the following activities :-
1. Water supply.
2. Sanitation.
3. Drainage.
4. Rural Roads.
1. WATER SUPPLY :
Existing position- There are very few areas in Rural Delhi where potable water is available. The areas around Najafgarh Jhil are completely covered by the silt left behind by water loggaing. The subsoil water is not fit even for irrigation.
In the rocky areas of the south, the sub-soil water level is extermily low. It is sometimes as deep as 70-80 in the southern most point of Delhi Territory (Dera Mandi). Out of 43 test borings only 2 have met with success in Chhaatrpur area.
The areas around Narela town and in the south-east( approx. 13 sq. miles) posses abundant potable water and thus comprise the best cultivable land of the Territory.
A left flanking on both of sides of western Yamuna canal is supplied with plenty of potable water. The land utilization record1 shows that only 32% of the total rural land compares medium type of land.
There is an potable water tube well in Bakhtwarpur- Tajpur kalan area which is predominantly a sailine region. There is another tube well Bering with potable water near Badli Rithala area which is surrounded, on the west, by the saline tract of kanjhwala block. In the south west around Bijwasan, a large tract about 20 sq. miles has been endowed with good sub-soil water.
Proposals:
For the purpose of supplying protected water, the village have been divided into 4 grades on the basis of their population. These grades are as follows:
(1) Class A- population above 3,000
(2) Class B- population between 1,500 to 3,000
(3) Class C-- population between 500 to 1,500
(4) Class D- population below 500.
The details of protected water supply services for each of the above grades of rural settlement are discussed below:
Villages with population above 3000 (class A.)
Village having a population of 3,000 and the above( class A) will be provided with protected water supply in two stages. The first stage well consist of the provision of a tube well on series of surface wells, depending upon the sub soil water conditions with two pumping sets, a pump-house with necessary electric transmission and on overhead tank of 25,000 gallons capacity. The storage tank will be connected to the distribution main connecting the stand- posts located at suitable points inside the village. In the second stage, the distribution mains well be extended to all the streets to allow house connections. There are about 13 villages* falling in this category.
1 Vide Table 12 of this report.
*According to 1961 census.
(ii) Population between 1,500 to 3,000 (class B)
The water supply for this grade of village is proposed through a tubewell or a series of surface wells with two pumping sets, a pump house with necessary electric transmission and an over-head tank of 15,000 gallons capacity with distribution mains connecting the stand postsat suitable location inside the village. The system will not have house connections. There are about 40* village falling under this range of population. In case of favorable sub-soil water conditions one tube well can supply a population of 5,000 at a minimum of 40 gallons of water per capita.
(iii) Population between 500 to 1500 (class c)
The villages falling under this category will have water supply from protected surface wells. About 5 surface wells will be cleaned and covered with a slab of a zinc sheet with a man –hole for insepection. A hand-pump connected with the well would be provided for for public use. Waste water would drain into a seakage pit located at a minimum distance of 150 from the tap. The surface wells should be located at a minimum distance of 150 from the sullage drain or sekage pit. The total number of villages falling under this range of population is 122*. These are proposed to be covered by the end of the third five year plan.
(iv) Villages below 500(Grade D )
Villages below 500 population will also have water supply through surface wells. Only 3 wells will be necessary to distribute water in a village. There are about 37 villages which have a population of 500 or below. These are proposed to be covered by the end of the third five year plan.
*According to 1961 census.
1. RURAL SANITATION :
For the purpose of sanitation, the rural areas have been divided into two categories.
(1) Villages with population of 3,000 and above.
(2) Villages with population of 3,000 and above well be provided with street sewers connecting the sullage drains and the house latrines. The truck sewer will be gravitated to a sewage latrines. The truck sewer will be gravitated to a sewage lagoon. There area bout 13 villages falling within this range of population. These are proposed to be covered by the end of the Third five year plan.
Villages with a population below 3,000 will have sanitary type of latrines. Inthis case each family will be provided with a pan, trap and stone-ware pipe leading to the dispersion trench. Such latrines and the dispersion trench will be constructed by self-help. It is proposed to provided one sanitary latrine for every 5 members of the village.
50 latrines are proposed to be constructed in each village have a population of below 1,500 by the end of the third five year plan and the remaining latrines will be completed by the end of the fourth five year plan. In the case of village between 1,500 to 3,000 population, 100 latrines are proposed to be constructed by the end of the third five year plan and the remaining will be completed by the end of the fourth five year plan.
R.G.GuptaCity/Policy Planner
Master Plan For Delhi 1957, Volume-II, PART - 3
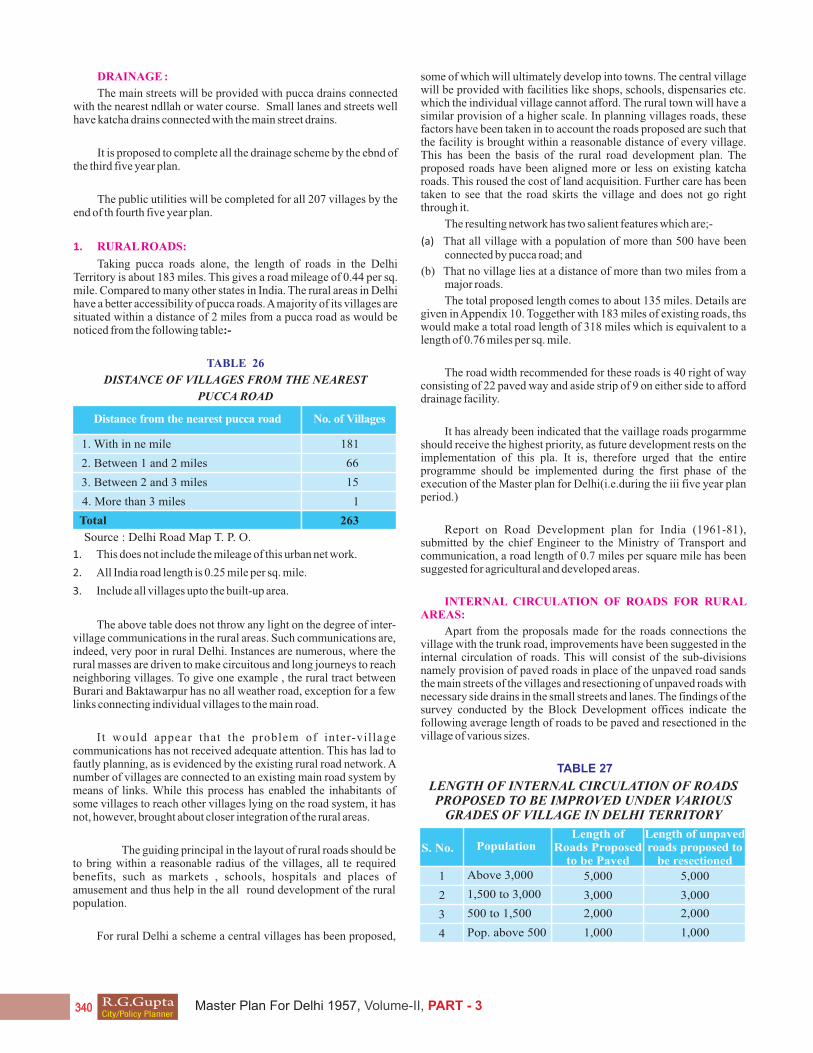
DRAINAGE :
The main streets will be provided with pucca drains connected with the nearest ndllah or water course. Small lanes and streets well have katcha drains connected with the main street drains.
It is proposed to complete all the drainage scheme by the ebnd of the third five year plan.
The public utilities will be completed for all 207 villages by the end of th fourth five year plan.
1. RURAL ROADS:
Taking pucca roads alone, the length of roads in the Delhi Territory is about 183 miles. This gives a road mileage of 0.44 per sq. mile. Compared to many other states in India. The rural areas in Delhi have a better accessibility of pucca roads. A majority of its villages are situated within a distance of 2 miles from a pucca road as would be noticed from the following table:-
TABLE 26
DISTANCE OF VILLAGES FROM THE NEAREST
PUCCA ROAD
Source : Delhi Road Map T. P. O.
Distance from the nearest pucca road No. of Villages
1. With in ne mile
2. Between 1 and 2 miles
3. Between 2 and 3 miles
4. More than 3 miles
Total
181
66
15
1
263
1. This does not include the mileage of this urban net work.
2. All India road length is 0.25 mile per sq. mile.
3. Include all villages upto the built-up area.
The above table does not throw any light on the degree of inter- village communications in the rural areas. Such communications are, indeed, very poor in rural Delhi. Instances are numerous, where the rural masses are driven to make circuitous and long journeys to reach neighboring villages. To give one example , the rural tract between Burari and Baktawarpur has no all weather road, exception for a few links connecting individual villages to the main road.
It would appear that the problem of inter-vil lage communications has not received adequate attention. This has lad to fautly planning, as is evidenced by the existing rural road network. A number of villages are connected to an existing main road system by means of links. While this process has enabled the inhabitants of some villages to reach other villages lying on the road system, it has not, however, brought about closer integration of the rural areas.
The guiding principal in the layout of rural roads should be to bring within a reasonable radius of the villages, all te required benefits, such as markets , schools, hospitals and places of amusement and thus help in the all round development of the rural population.
For rural Delhi a scheme a central villages has been proposed,
some of which will ultimately develop into towns. The central village will be provided with facilities like shops, schools, dispensaries etc. which the individual village cannot afford. The rural town will have a similar provision of a higher scale. In planning villages roads, these factors have been taken in to account the roads proposed are such that the facility is brought within a reasonable distance of every village. This has been the basis of the rural road development plan. The proposed roads have been aligned more or less on existing katcha roads. This roused the cost of land acquisition. Further care has been taken to see that the road skirts the village and does not go right through it.
The resulting network has two salient features which are;-
(a) That all village with a population of more than 500 have been connected by pucca road; and
(b) That no village lies at a distance of more than two miles from a major roads.
The total proposed length comes to about 135 miles. Details are given in Appendix 10. Toggether with 183 miles of existing roads, ths would make a total road length of 318 miles which is equivalent to a length of 0.76 miles per sq. mile.
The road width recommended for these roads is 40 right of way consisting of 22 paved way and aside strip of 9 on either side to afford drainage facility.
It has already been indicated that the vaillage roads progarmme should receive the highest priority, as future development rests on the implementation of this pla. It is, therefore urged that the entire programme should be implemented during the first phase of the execution of the Master plan for Delhi(i.e.during the iii five year plan period.)
Report on Road Development plan for India (1961-81), submitted by the chief Engineer to the Ministry of Transport and communication, a road length of 0.7 miles per square mile has been suggested for agricultural and developed areas.
INTERNAL CIRCULATION OF ROADS FOR RURAL AREAS:
Apart from the proposals made for the roads connections the village with the trunk road, improvements have been suggested in the internal circulation of roads. This will consist of the sub-divisions namely provision of paved roads in place of the unpaved road sands the main streets of the villages and resectioning of unpaved roads with necessary side drains in the small streets and lanes. The findings of the survey conducted by the Block Development offices indicate the following average length of roads to be paved and resectioned in the village of various sizes.
TABLE 27
LENGTH OF INTERNAL CIRCULATION OF ROADS PROPOSED TO BE IMPROVED UNDER VARIOUS
GRADES OF VILLAGE IN DELHI TERRITORY
S. No.
1 Above 3,000 5,000
3,000
2,000
1,000
5,000
3,000
2,000
1,000
1,500 to 3,000
500 to 1,500
Pop. above 500
2
3
4
PopulationLength of
Roads Proposedto be Paved
Length of unpavedroads proposed to
be resectioned
R.G.GuptaCity/Policy Planner
Master Plan For Delhi 1957, Volume-II, PART - 3
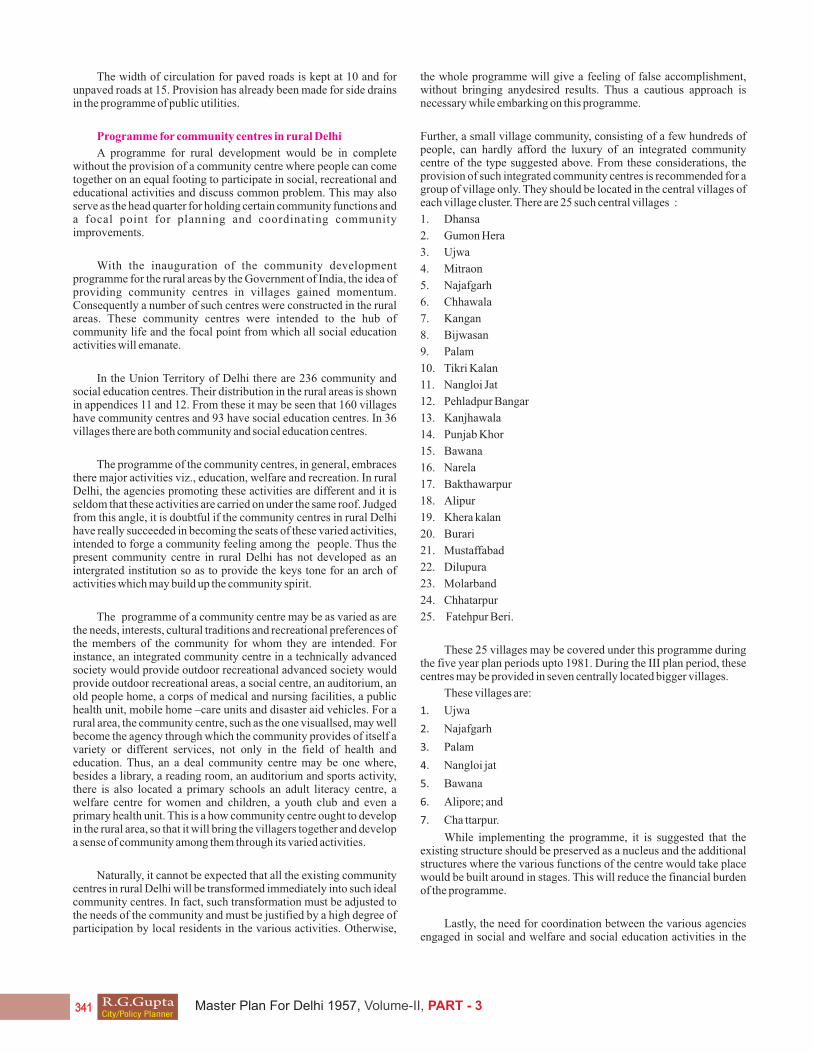
The width of circulation for paved roads is kept at 10 and for unpaved roads at 15. Provision has already been made for side drains in the programme of public utilities.
Programme for community centres in rural Delhi
A programme for rural development would be in complete without the provision of a community centre where people can come together on an equal footing to participate in social, recreational and educational activities and discuss common problem. This may also serve as the head quarter for holding certain community functions and a focal point for planning and coordinating community improvements.
With the inauguration of the community development programme for the rural areas by the Government of India, the idea of providing community centres in villages gained momentum. Consequently a number of such centres were constructed in the rural areas. These community centres were intended to the hub of community life and the focal point from which all social education activities will emanate.
In the Union Territory of Delhi there are 236 community and social education centres. Their distribution in the rural areas is shown in appendices 11 and 12. From these it may be seen that 160 villages have community centres and 93 have social education centres. In 36 villages there are both community and social education centres.
The programme of the community centres, in general, embraces there major activities viz., education, welfare and recreation. In rural Delhi, the agencies promoting these activities are different and it is seldom that these activities are carried on under the same roof. Judged from this angle, it is doubtful if the community centres in rural Delhi have really succeeded in becoming the seats of these varied activities, intended to forge a community feeling among the people. Thus the present community centre in rural Delhi has not developed as an intergrated institution so as to provide the keys tone for an arch of activities which may build up the community spirit.
The programme of a community centre may be as varied as are the needs, interests, cultural traditions and recreational preferences of the members of the community for whom they are intended. For instance, an integrated community centre in a technically advanced society would provide outdoor recreational advanced society would provide outdoor recreational areas, a social centre, an auditorium, an old people home, a corps of medical and nursing facilities, a public health unit, mobile home –care units and disaster aid vehicles. For a rural area, the community centre, such as the one visuallsed, may well become the agency through which the community provides of itself a variety or different services, not only in the field of health and education. Thus, an a deal community centre may be one where, besides a library, a reading room, an auditorium and sports activity, there is also located a primary schools an adult literacy centre, a welfare centre for women and children, a youth club and even a primary health unit. This is a how community centre ought to develop in the rural area, so that it will bring the villagers together and develop a sense of community among them through its varied activities.
Naturally, it cannot be expected that all the existing community centres in rural Delhi will be transformed immediately into such ideal community centres. In fact, such transformation must be adjusted to the needs of the community and must be justified by a high degree of participation by local residents in the various activities. Otherwise,
the whole programme will give a feeling of false accomplishment, without bringing anydesired results. Thus a cautious approach is necessary while embarking on this programme.
Further, a small village community, consisting of a few hundreds of people, can hardly afford the luxury of an integrated community centre of the type suggested above. From these considerations, the provision of such integrated community centres is recommended for a group of village only. They should be located in the central villages of each village cluster. There are 25 such central villages :
1. Dhansa
2. Gumon Hera
3. Ujwa
4. Mitraon
5. Najafgarh
6. Chhawala
7. Kangan
8. Bijwasan
9. Palam
10. Tikri Kalan
11. Nangloi Jat
12. Pehladpur Bangar
13. Kanjhawala
14. Punjab Khor
15. Bawana
16. Narela
17. Bakthawarpur
18. Alipur
19. Khera kalan
20. Burari
21. Mustaffabad
22. Dilupura
23. Molarband
24. Chhatarpur
25. Fatehpur Beri.
These 25 villages may be covered under this programme during the five year plan periods upto 1981. During the III plan period, these centres may be provided in seven centrally located bigger villages.
These villages are:
1. Ujwa
2. Najafgarh
3. Palam
4. Nangloi jat
5. Bawana
6. Alipore; and
7. Cha ttarpur.
While implementing the programme, it is suggested that the existing structure should be preserved as a nucleus and the additional structures where the various functions of the centre would take place would be built around in stages. This will reduce the financial burden of the programme.
Lastly, the need for coordination between the various agencies engaged in social and welfare and social education activities in the
R.G.GuptaCity/Policy Planner
Master Plan For Delhi 1957, Volume-II, PART - 3
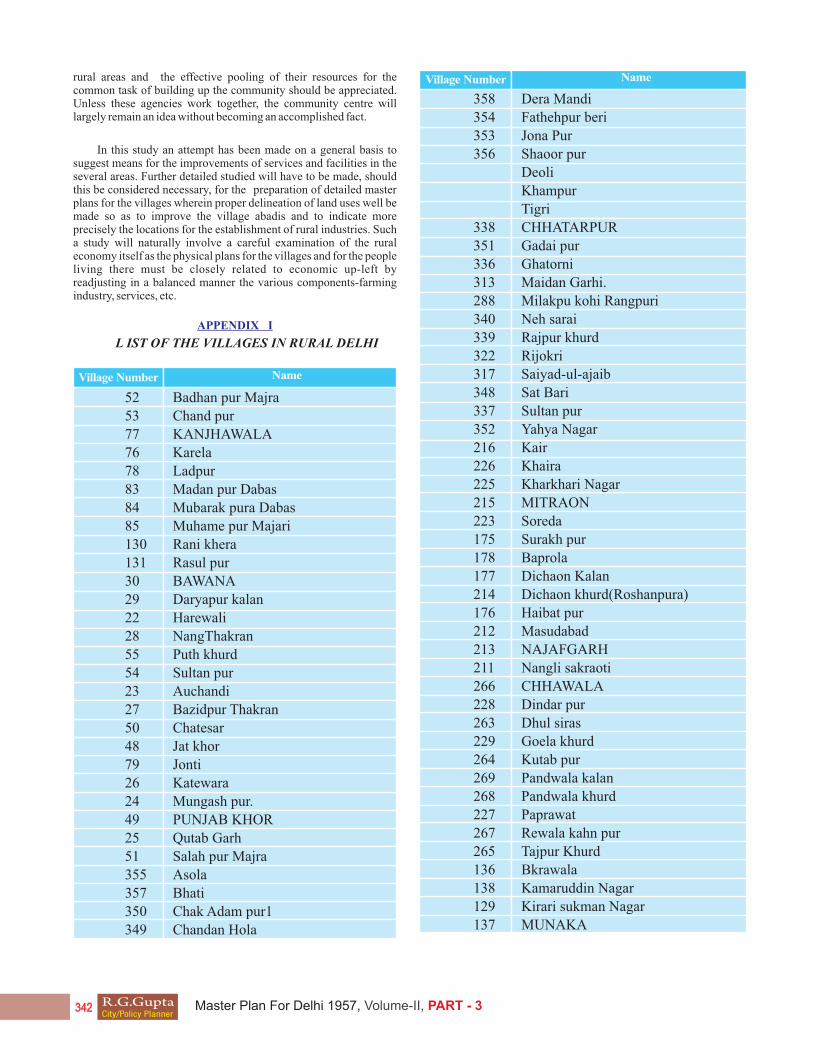
rural areas and the effective pooling of their resources for the common task of building up the community should be appreciated. Unless these agencies work together, the community centre will largely remain an idea without becoming an accomplished fact.
In this study an attempt has been made on a general basis to suggest means for the improvements of services and facilities in the several areas. Further detailed studied will have to be made, should this be considered necessary, for the preparation of detailed master plans for the villages wherein proper delineation of land uses well be made so as to improve the village abadis and to indicate more precisely the locations for the establishment of rural industries. Such a study will naturally involve a careful examination of the rural economy itself as the physical plans for the villages and for the people living there must be closely related to economic up-left by readjusting in a balanced manner the various components-farming industry, services, etc.
APPENDIX I
L IST OF THE VILLAGES IN RURAL DELHI
Village Number Name
52 Badhan pur Majra
53 Chand pur
77 KANJHAWALA
76 Karela
78 Ladpur
83 Madan pur Dabas
84 Mubarak pura Dabas
85 Muhame pur Majari
130 Rani khera
131 Rasul pur
30 BAWANA
29 Daryapur kalan
22 Harewali
28 NangThakran
55 Puth khurd
54 Sultan pur
23 Auchandi
27 Bazidpur Thakran
50 Chatesar
48 Jat khor
79 Jonti
26 Katewara
24 Mungash pur.
49 PUNJAB KHOR
25 Qutab Garh
51 Salah pur Majra
355 Asola
357 Bhati
350 Chak Adam pur1
349 Chandan Hola
Village Number Name
358 Dera Mandi
354 Fathehpur beri
353 Jona Pur
356 Shaoor pur
Deoli
Khampur
Tigri
338 CHHATARPUR
351 Gadai pur
336 Ghatorni
313 Maidan Garhi.
288 Milakpu kohi Rangpuri
340 Neh sarai
339 Rajpur khurd
322 Rijokri
317 Saiyad-ul-ajaib
348 Sat Bari
337 Sultan pur
352 Yahya Nagar
216 Kair
226 Khaira
225 Kharkhari Nagar
215 MITRAON
223 Soreda
175 Surakh pur
178 Baprola
177 Dichaon Kalan
214 Dichaon khurd(Roshanpura)
176 Haibat pur
212 Masudabad
213 NAJAFGARH
211 Nangli sakraoti
266 CHHAWALA
228 Dindar pur
263 Dhul siras
229 Goela khurd
264 Kutab pur
269 Pandwala kalan
268 Pandwala khurd
227 Paprawat
267 Rewala kahn pur
265 Tajpur Khurd
136 Bkrawala
138 Kamaruddin Nagar
129 Kirari sukman Nagar
137 MUNAKA
R.G.GuptaCity/Policy Planner
Master Plan For Delhi 1957, Volume-II, PART - 3

Village Number Name
139 NANGLOI JAT
169 Nilithi
171 Ranhola
128 Sultan pur Mazra
172 Tilang pur
56 Barwala
87 Begam pur
75 Bansali
74 PEHLADPUR BANGAR
86 Puth kalan
88 Rithila
73 Sahidabad Daulatpur
2 Bankar
18 Bhorgarh
21 Ghoga
32 Holiambi kalan
19 Kureni
1 Lampur
4 Mumurpur
3 NARELA
20 Razapur kalan
31 Sanoth
17 Shampur Garhi
5 Sighola
6 Singhu
16 Tikri khurd
33 ALIPORE
34 Bankoli
44 Budhpur Bijapur
41 Garhi khasro
60 Kadipur
15 Khampur
59 Mukhmelpur
59 Nangli poona
49 Zindpur
47 Holambi khurd
46 Iradat Nagra/ Naya Bans
57 KHERA KALAN
45 Khera khurd
61 Libaspur
70 Shamapur
58 Siraspur
10 Akbarpur Mazra
37 Arzari Sungar pur
12 BAKHTAWARPUR
36A Fatehpur jat
Village Number Name
14 Hamidpur
35 Hiranki
9 Jhangola
8 Kulakpur
36 Muhamad Ramzanpur
7 Palla
13 Tajpur kalan
39 Tehri Daulatpur
11 Tigipur
285 Bamncil
286 Bharthal
325 BIJWASAN
324 Kapas Hera
287 Nangal Dewat
226 Salehpur
323 Samalka
231 Ambar Hai
259 Bagrola
207 Bindapur
205 Dabri
180 Bashtsal
230 Lohar Heri
210 Kakrola
209 Motola
208 Mirzapur
234 Nasirpur
181 Niwada Mazra Hashtsal
233 PALAM
262 Pochampur
179 Razapur khurd
204 Sagarpur
260 Sanpur
261 Shahabad Muhamadpur
232 Toganpur
100 Baqiahad
101 Biharipur
106 Jiwanpur johripur
104 Karawal Nagar
107 Mandoli
103 MUSTAFABAD
108 Saboli
99 Sadatpur Gujran
98 Sadatpur Masalmanan
244 Jhagola
239 Chak chilla
241 Chilla soreda Bangar
R.G.GuptaCity/Policy Planner
Master Plan For Delhi 1957, Volume-II, PART - 3

Village Number Name
240 Chilla soreda khadar
198 DILUPURA
196 Gharoli
243 Joga Bai
199 Khichripur
197 Kondli
200 Kotla
233 Nangloi Razapur
219 Bakargarh
275 DHANSA
335 Galibpur
274 Isapur
273 Kazipur
275 Sarangpur
278 Daryapur khurd
221 Jafarpur kalan
222 Khera Dabar
224 Kharkhari jatmal.
277 Milakpur zer ajafgarh
218 Mundhela kalan
217 Mundhela khurd
220 Shamas pur khalsa
272 UJWA
282 Asalatpur khavad
283 Daulatpur
334 Deorala
280 GUMAN HERA
281 Hasanpur
279 Jhuljhuli
270 Khar khari Rond
333 Rawata
271 Sherpur Dehir
331 Shikarpur
332 Zain pur
38 Badarpur
69 Bhalswajahangirpur
62 BURARI
40 Ibrahampur
66 JAGATPUR
95 Jharoda Mazra
67 Kamalpur
68 Mukandpur
64 Pur1
65 Sabapur
63 Salimpur Mazara Burari
97 Wazirabad
Village Number Name
328 Badusara
33 Behloipur Dheri/jhatikra
282 KANGAN HERI
329 Nank Heri
327 Ragho pur
309 Aali
347 Jaitpur
345 Mithepur
346 MOLARR BAND
344 Tajpal
308 Madan pur khadar
80 Garhi Randhala
132 Gheora
135 Jafarpur/Hiran kunda
174 Jhoroda kalan
134 Nilwal
81 Nizampur/ Rashidpur
82 Soada
133 TIKRI KALAN
APPENDIX 2
L IST OF THE VILLAGES INCLUDED IN THE BUILT UP ZONE
APPENDIX 2
L IST OF THE VILLAGES INCLUDED IN THE URBANISABLE ZONE (1981)
Hauz Khas
Shahpur
Chiragj Delhi
Hauz Rani
Munirka*
Jawala Heri
Wazir Pur
3
4
5
6
7
8
9
B
B
B
B
Urban Sector
B 1 Sadhera Khurd
Bharola2
Serial Number Name of the Village
Urban Sector
Serial Number Name of the Village
A. - Nil
B. - Nil
C. 1 Papal Thala (91)
D. - Nil
E. 2 Garhi Mendhu (105)
3 Mirpur(115)
4 Ghonda patti Gujarn Khadar(117)
R.G.GuptaCity/Policy Planner
Master Plan For Delhi 1957, Volume-II, PART - 3
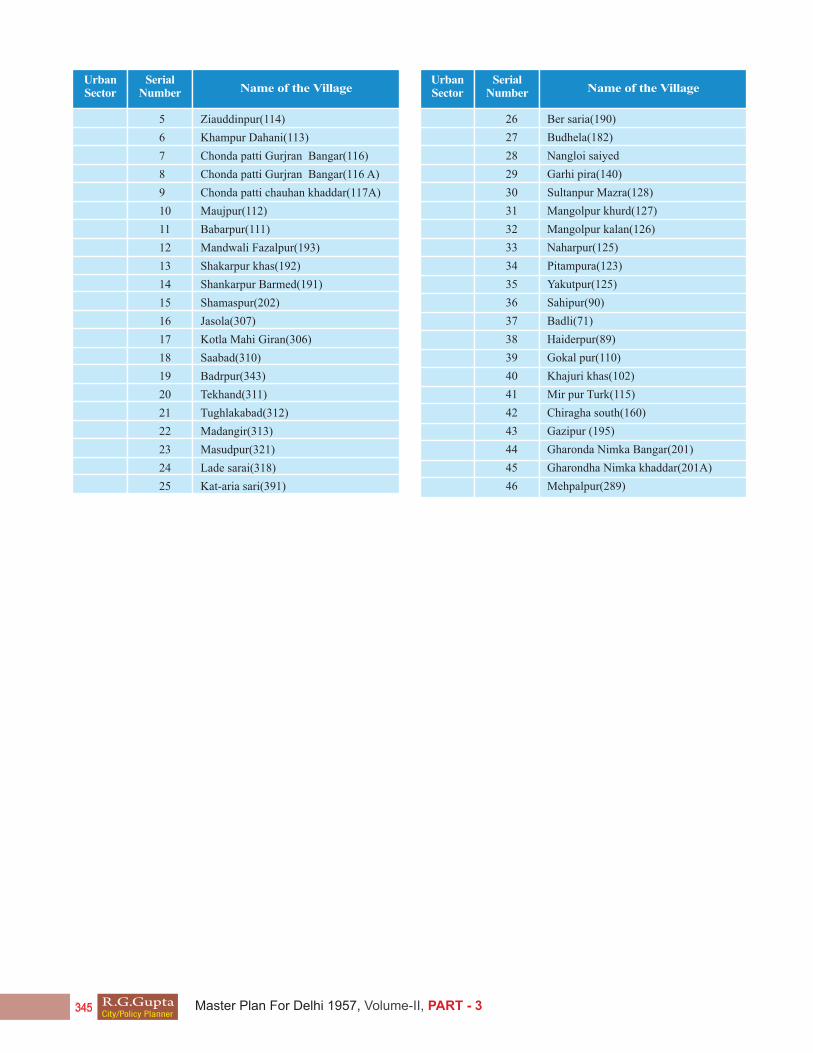
Urban Sector
Serial Number Name of the Village
Urban Sector
Serial Number Name of the Village
5 Ziauddinpur(114)
6 Khampur Dahani(113)
7 Chonda patti Gurjran Bangar(116)
8 Chonda patti Gurjran Bangar(116 A)
9 Chonda patti chauhan khaddar(117A)
10 Maujpur(112)
11 Babarpur(111)
12 Mandwali Fazalpur(193)
13 Shakarpur khas(192)
14 Shankarpur Barmed(191)
15 Shamaspur(202)
16 Jasola(307)
17 Kotla Mahi Giran(306)
18 Saabad(310)
19 Badrpur(343)
20 Tekhand(311)
21 Tughlakabad(312)
22 Madangir(313)
23 Masudpur(321)
24 Lade sarai(318)
25 Kat-aria sari(391)
26 Ber saria(190)
27 Budhela(182)
28 Nangloi saiyed
29 Garhi pira(140)
30 Sultanpur Mazra(128)
31 Mangolpur khurd(127)
32 Mangolpur kalan(126)
33 Naharpur(125)
34 Pitampura(123)
35 Yakutpur(125)
36 Sahipur(90)
37 Badli(71)
38 Haiderpur(89)
39 Gokal pur(110)
40 Khajuri khas(102)
41 Mir pur Turk(115)
42 Chiragha south(160)
43 Gazipur (195)
44 Gharonda Nimka Bangar(201)
45 Gharondha Nimka khaddar(201A)
46 Mehpalpur(289)
R.G.GuptaCity/Policy Planner
Master Plan For Delhi 1957, Volume-II, PART - 3

D
istr
ict
Top
o
P
ts.
S
ub–
soil
Pts
. S
oil
Pro
duct
ivit
y
Pts
.
L
ocat
ion
& P
roxi
mit
y
P
ts.
M
iner
als
Pts
.
Tot
al
Fea
ture
s
wat
er c
ondi
tion
to
bigg
er d
evel
opm
ent
P
ts.
BA
WA
NA
L
eval
Lan
d 3
Sal
ine
1
Mos
tly
poor
1
Nea
rnes
s to
Nar
ela(
ring
tow
n)
3 P
oor
1
9
ME
HR
AU
LI
Mos
tly
hill
y la
nd
1 D
eep
tube
wel
l
1 M
ostl
y po
or
1 N
earn
ess
to D
elhi
3
Ric
h
3 9
bo
ring
nee
ded
NA
JAF
GA
RH
M
oste
ly l
ow l
ying
1
Sai
lne
1
Par
tly
med
ium
2
Mor
e th
an 1
5 m
iles
fro
m D
elhi
2
Poo
r
1 7
drsi
ngs
prob
lem
s
pa
rtly
poo
r
NA
NG
LO
I JA
T
Lev
el l
and
3 M
ostl
y sa
line
but
2
G
ood
fert
ile
land
3
Nea
rnes
s to
Del
hi
3 P
oor
1
12
su
rfac
e w
ater
is
fo
und
to b
e po
tabl
e
NA
RE
LA
L
evel
lan
d pa
rt
2 P
artl
y sa
line
22
P
artl
y m
ediu
m
2 N
eran
ess
to N
erla
3
Poo
r
1 10
area
flo
odab
le
pa
rtly
goo
d
part
ly p
oor
PAL
AM
Par
tly
low
lyi
ng,
2 P
artl
y sa
line
2
Par
tly
poor
2
Nea
rnes
s to
Del
hi
3 M
ediu
m
2
11
part
ly l
evel
part
ly g
ood
pa
rtly
med
ium
SH
AH
DA
RA
L
evel
lan
d bu
t
1 P
artl
y sa
line
2
Med
ium
to
high
3
Nea
rnes
s to
Del
hi
3 P
oor
1
10
floo
dabl
e
pa
rtly
goo
d
UJW
A
P
artl
y lo
w
2 S
alin
e
1 M
ostl
y m
ediu
m
3 O
n th
e bo
rder
s of
1
Poo
r
1 8
lyin
g le
vel
to h
igh
Del
hi t
erri
tory
AP
PE
ND
IX
4
DIS
TR
IBU
TIO
N O
F P
OP
UL
AT
ION
TA
BL
E -
PH
YS
ICA
L I
ND
EX
PO
INT
S F
OR
RU
RA
L D
IST
RIC
TS
R.G.GuptaCity/Policy Planner
Master Plan For Delhi 1957, Volume-II, PART - 3

APPENDIX 7
RURAL LAND USE PROGRAMME FOR SOIL
CONSERVATION AND AFFORESTATION
I. Afforestation and soil conservation in the Aravalli hills south of Delhi:
The village where afforestation work has been taken up during the second five year plan period are as follows:-
Maidan Garhi
Tuglakabad
Dera Mandi
Yahya Nagar.
During the third plan period, the work will be contin used in the above areas, and in addition to that in the following village:
Rajokri
Masudpur
Deoli
Mehrauli
Asola
Tekhand
Bhati.
II. Afforestation along the banks of the Yamuna to bind the soil are:
Chirag south
Mukhmelpur Marginal bund
During the Third five year plan period, the work will be continued in the above areas and in addition to that in the following villages:
Chirag North
Bela Estate
Burari
Bhalswa
Jhangirpur
Kedipur
Jhangola
Daryapur
Bakthawarpur.
III. Afforrestation along road sides, railway tracks and irrigation channels, waste lands, etc., The following village have been taken up during te second Five year plan period :
Mitraon
Sultanpur Dabas,
Roads along with rural Najafgarh drain. During the Third plan period, the work will be continued in the above areas and in addition to that in the following villages:
Jaunti
Nizampur Rashik
Bawana,
Kanjhawala
Dhul Siras
Jhatikra
Jhatikra
Jhaorda kalan
Dichaon kalan
Isapur
Holambi kalan
Puth khurd
Puth kalan
IV. In addition to the above programmes, the development of Northern and southern Ridge also will be taken up.
APPENDIX 8
TABLE SHOWING EXISTING HEALTH & MEDICAL FACILITIES IN RURAL DELHI
Name of the District Population Existing No. of Disbansaries Maternity and infant Sub-centres Total
1958-59 primary Health centres welfare centres
BAWANA 44,398 1 1 1 1 4
MEHARULI 25,797 Nil Nil Nil Nil 0
NAJAFGARH 32,745 1 - - - 1
NANGLOI JAT 38,198 Nil 1 2 2 5
NARELA 66,126 2 1 2 3 8
PALAM 27,901 1 1 - - 2
SHAHDARA 19,043 - 1 - - 1
UJWA 22,586 1 - - - 1
Rural areas falling 1,81,000 - 2 2 4 8
within the compact
urban limit line
Total :.. 4,58,000 6 7 7 10 30
* Beside there are four mobile medical dispensaries also
R.G.GuptaCity/Policy Planner
Master Plan For Delhi 1957, Volume-II, PART - 3
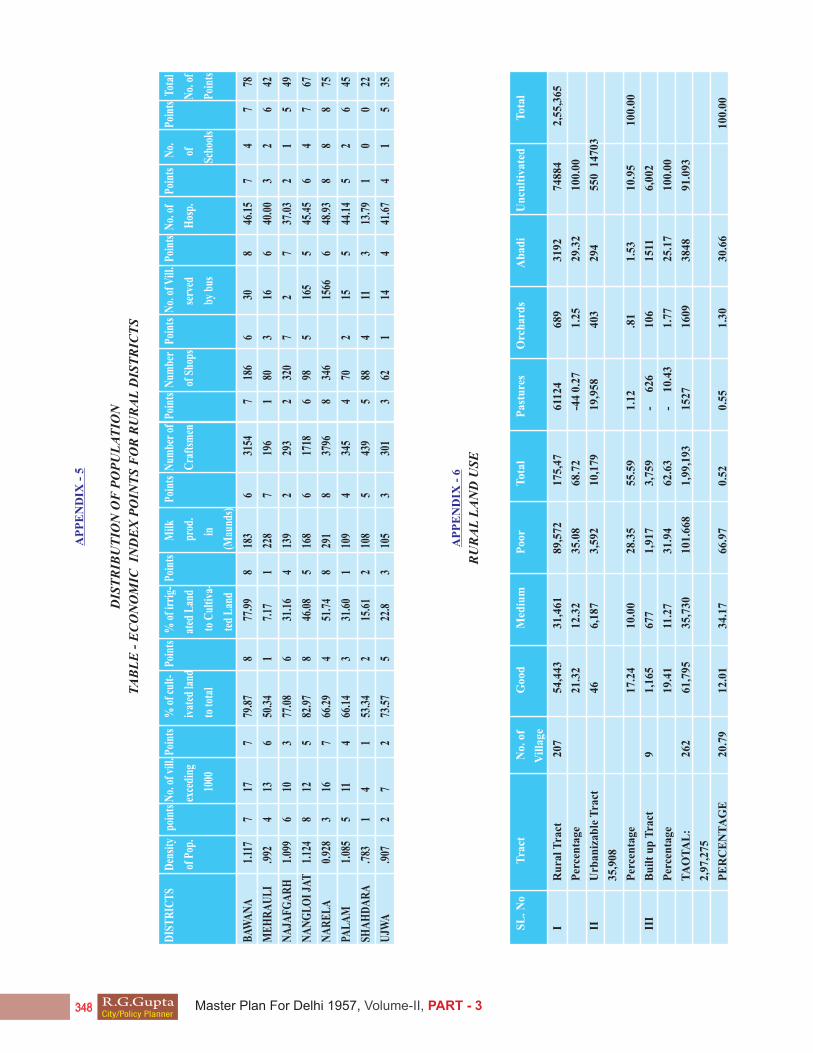
AP
PE
ND
IX -
5
DIS
TR
IBU
TIO
N O
F P
OP
UL
AT
ION
TA
BL
E -
EC
ON
OM
IC I
ND
EX
PO
INT
S F
OR
RU
RA
L D
IST
RIC
TS
AP
PE
ND
IX -
6
RU
RA
L L
AN
D U
SE
R.G.GuptaCity/Policy Planner
Master Plan For Delhi 1957, Volume-II, PART - 3
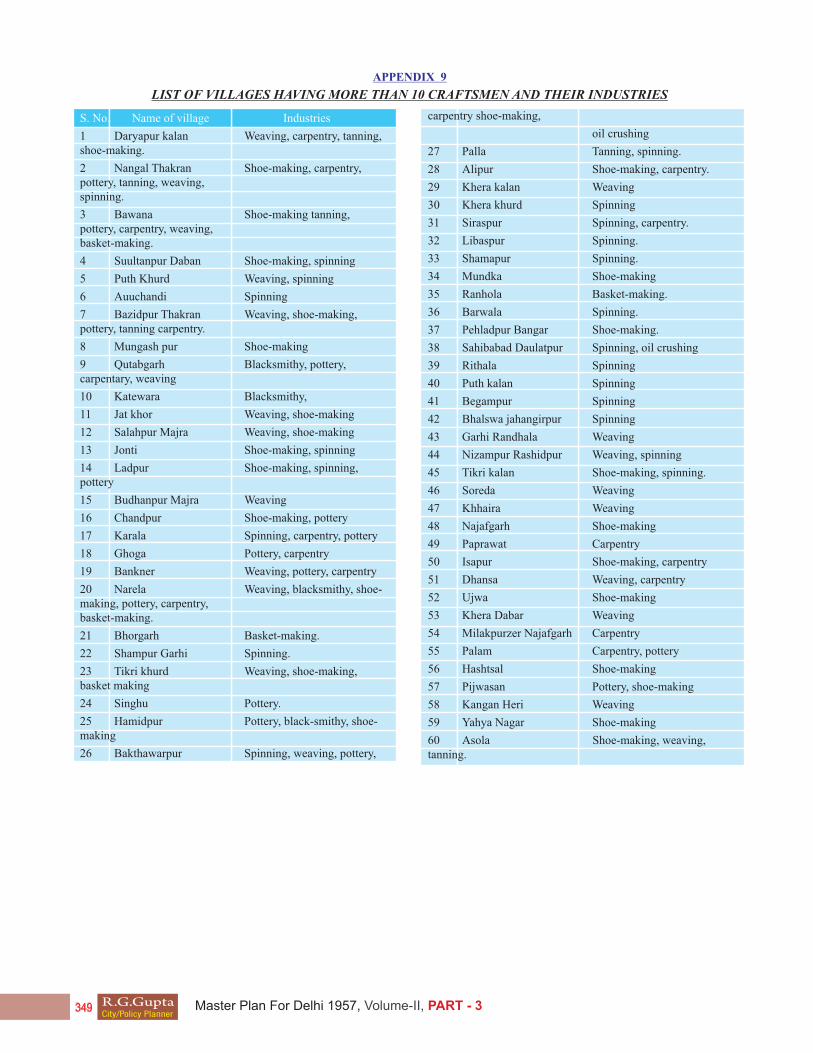
S. No. Name of village Industries
1 Daryapur kalan Weaving, carpentry, tanning, shoe-making.
2 Nangal Thakran Shoe-making, carpentry, pottery, tanning, weaving, spinning.
3 Bawana Shoe-making tanning, pottery, carpentry, weaving, basket-making.
4 Suultanpur Daban Shoe-making, spinning
5 Puth Khurd Weaving, spinning
6 Auuchandi Spinning
7 Bazidpur Thakran Weaving, shoe-making, pottery, tanning carpentry.
8 Mungash pur Shoe-making
9 Qutabgarh Blacksmithy, pottery, carpentary, weaving
10 Katewara Blacksmithy,
11 Jat khor Weaving, shoe-making
12 Salahpur Majra Weaving, shoe-making
13 Jonti Shoe-making, spinning
14 Ladpur Shoe-making, spinning, pottery
15 Budhanpur Majra Weaving
16 Chandpur Shoe-making, pottery
17 Karala Spinning, carpentry, pottery
18 Ghoga Pottery, carpentry
19 Bankner Weaving, pottery, carpentry
20 Narela Weaving, blacksmithy, shoe- making, pottery, carpentry, basket-making.
21 Bhorgarh Basket-making.
22 Shampur Garhi Spinning.
23 Tikri khurd Weaving, shoe-making, basket making
24 Singhu Pottery.
25 Hamidpur Pottery, black-smithy, shoe- making
26 Bakthawarpur Spinning, weaving, pottery,
carpentry shoe-making,
oil crushing
27 Palla Tanning, spinning.
28 Alipur Shoe-making, carpentry.
29 Khera kalan Weaving
30 Khera khurd Spinning
31 Siraspur Spinning, carpentry.
32 Libaspur Spinning.
33 Shamapur Spinning.
34 Mundka Shoe-making
35 Ranhola Basket-making.
36 Barwala Spinning.
37 Pehladpur Bangar Shoe-making.
38 Sahibabad Daulatpur Spinning, oil crushing
39 Rithala Spinning
40 Puth kalan Spinning
41 Begampur Spinning
42 Bhalswa jahangirpur Spinning
43 Garhi Randhala Weaving
44 Nizampur Rashidpur Weaving, spinning
45 Tikri kalan Shoe-making, spinning.
46 Soreda Weaving
47 Khhaira Weaving
48 Najafgarh Shoe-making
49 Paprawat Carpentry
50 Isapur Shoe-making, carpentry
51 Dhansa Weaving, carpentry
52 Ujwa Shoe-making
53 Khera Dabar Weaving
54 Milakpurzer Najafgarh Carpentry
55 Palam Carpentry, pottery
56 Hashtsal Shoe-making
57 Pijwasan Pottery, shoe-making
58 Kangan Heri Weaving
59 Yahya Nagar Shoe-making
60 Asola Shoe-making, weaving, tanning.
APPENDIX 9
LIST OF VILLAGES HAVING MORE THAN 10 CRAFTSMEN AND THEIR INDUSTRIES
R.G.GuptaCity/Policy Planner
Master Plan For Delhi 1957, Volume-II, PART - 3

Sl. ROAD DESCRIPTION Milage
No. FROM
1 ” Kharikhari Road to pandwali kalan 1.50
2 ” Kharikhari jat to jafarpur. 2.00
3 ” Kharia to kharkhari Nahar 1.00
4 ” Issapur to khazipur 0.75
5 ” Isapur to Saroda 0.50
6 ” Mitraon to kharia 1.50
7 ” Kharia to paprawat 1.00
8 ” Paprawat 1.00
9 ” Dindarpur to Masudpur 1.00
10 ” Kakrola to Nangloi sakrati 2.00
11 ” Nangil Sakraot to Dichan kalan 0.75
12 ” Dichan kalan to Habitpur 1.50
13 ” Habitpur to Najafgarh 1.00
14 ” Materla to Miwada Mazara 1.25
15 ” Hashtsal to Budhela 1.00
16 ,, 0.75
17 ” Budhela to Nagli jat 0.75
18 ” Bakarwala to Mundka 0.50
19 ” Dichan to jafarpur 1.50
20 ” Dichan to Nilwal 2.75
21 ” Nilwala to Tikri kalan 1.00
22 ” Kamarudin to Nangloi Syyed 1.75
23 ” Nangloi siaden to Gahi pira 1.75
24 ” Nangloi jat to Sulman Nagar 1.25
25 ” Suleman Nagar to Mubarkupur 1.00
26 ” Suleman Nagar to puth kalan 1.75
27 ” Manglopur to Rithala 1.50
28 ” Mubarakpur Dabas to Madanpur 1.25
29 ” Madanpur Dabas to kasolpur 1.00
30 ” Madanpur Majri to Madanpur Dabas 1.00
31 ” Gheora to Saodra 1.50
32 ” Saodra to Nizampur 1.25
33 ” Mangolpur kalan to Maharpur 2.00
34 ” Dera Mandi to Eathepur Beri 0.75
35 ” Asola to Shoor pur 1.50
36 ” Jonapur to sadipur 1.50
37 ” Shadipur to sultanpur 1.00
38 ” Neb sarai to HauzRani 1.50
39 ” Badarpur to Molar Band 0.75
40 ” Molar Band to jaitpur 0.75
41 ” Sadabad to Madanpur khaddar 1.00
42 ” Road to jasola 1.00
43 ” Masudpur to Mohammadpur Munirka 1.00
44 ” Kabas Hera to Rajokri 0.50
45 ” Nangil Dewat 2.25
46 ” Bharthal to Mohammadpur 1.75
47 ” Bijwasan to Bharthal 1.75
48 ” Bharthal to pochanpur 1.50
49 ” Pochanpur to Ambar Hai 1.75
50 ” Mohamedpur to Bagrola 1.50
51 ” Bagrola to palam 1.25
52 ” Dhul Sira to Bamnoli 1.00
53 ” Badusora to kangan Hori 1.25
54 ” Kangan Heri to khampur 1.00
55 ” Shikarpur to Guman Hera 1.00
56 ” Rawata to Guman Hera 1.50
57 ” Road form Guman Hera 0.50
58 ” Guman Hera to Hasanpur 1.00
59 ” Hasanpur to khar khari 0.50
60 ” Kharkhari to Ujwa 2.25
61 ” Jhul jhuli to Galibpur 1.50
62 ” Pandwal kalan to khari khari Nagar 0.50
63 ” Rajpur to Haidarpur 1.25
64 ” Haidarpur to papal Thala 1.75
65 ” Papal Thaja to Burari 3.50
66 ” Jagatpur to Burari 2.50
67 ” Burari to sabapur 2.00
68 ” Burari to ibrahampur 1.75
69 ” Irbahimpur to Garhi khasro 1.50
70 ” Hiranki to Bakhtawarpur 1.50
71 ” Hiranki to Fathepur 1.00
72 ” Fatehpur to Akbarpur Majra 1.25
73 ” Tigipur to Sangarpur 1.25
74 ” Sangarpur to Thangola 0.75
75 ” Hiranki to Tehri Daulatpur 1.00
76 ” Biharipur to karawal Nagar 1.25
77 ” Biharipur 0.50
78 ” Sadatpur to kusi khas 0.50
79 ” Sadatpur to Garhi Mandhu 0.75
80 ” Garahimandur to Gondhpali 1.00
81 ” Masjid Moth to Mauspur 1.50
82 ” Gondhi to shahdara 1.25
83 ” Gopalpur to Mandoli 1.25
84 ” Mandoli 0.25
85 ” Shahdara to karkar Doman 1.25
86 ” Karkar Doman to khurji khas 1.50
Sl. ROAD DESCRIPTION Milage
No. FROM
APPENDIX 10
PROPOSED RURAL ROADS
R.G.GuptaCity/Policy Planner
Master Plan For Delhi 1957, Volume-II, PART - 3

Sl. ROAD DESCRIPTION Milage
No. FROM
87 ” Gharoli to kondld 0.50
88 ” Ghazipur 0.25
89 ” Ghazipur to khichripur 0.75
90 ” Khirchipur to kondil 1.00
91 ” Kondil to Dilpura 0.75
92 ” Santpur to Bangar 1.50
93 ” Bazidpur to Daryapur kalan 0.75
94 ” Auchandi to Harewali 1.00
95 ” Qutabgarh to katwara 0.50
96 ” Qutab Garh 0.50
97 ” Radat Nagar to khera khurd 1.00
98 ” Khera khurd to Holembi 1.00
99 ” Holembi 0.50
100 ” Khera kalan to Radat Nagar 1.75
101 ” Siraspur 1.00
102 ” Khera kalan to siraspur 1.25
103 ” Mangolpur to kadipur 1.00
104 ” Kadipur to Mukhmelpur 1.50
105 ” Mukhmelpur 1.25
106 ” Shahpur- Garhi to Bhorgarh 1.00
107 ” Bhorgarh to Raza pur kalan 0.50
108 ” Bhorgarh to kureni 1.00
109 ” Singhola to Tikri khurd 0.75
110 ” Singhu to Mamoorpur 1.75
111. ” Lampur to Narela 1.50
TOTAL : MILES: 134.75
APPENDIX 11
LIST OF VILLAGES HAVING COMMUNITY CENTRES
S. No. VILLAGES
1 Bawana
2 Puth khurd
3 Jonti
4 Asola
5 Fatehpur Beri(2)
6 Mehpal pur
7 Kair
8 Dichaon khurd
9 Dhul Siras
10 Badusra
11 Begampur
12 Mundka
13 Jharoda kalan
14 Narela
15 Khampur
S. No. VILLAGES
16 Khera khurd(2)
17 Tigipur
18 Bijwasan
19 Bindapur
20 Harewali
21 Auchandi
22 Punjab khor
23 Chandan Hola
24 Jonapur
25 Neb Sarai
26 Mitraon
27 Chhawala (2)
28 Pandwala kalan(2)
29 Behlolpur kalan(2)
30 Pehaaladpur Bangar
61 Mandawli Fazilpur
62 Madanpur khaddar
63 Mohrauli
64 Badli(2)
65 Joga Bai
66 Jiwanpur johri pur
67 Mandoli(3)
68 Khichri pur
69 Galibpur
70 Daryapur
71 Manddhela
72 Ujwa
73 Milkapur Ghaoni
74 Ghari jaria Maria
75 Jawala Heri
76 Okhla
31 Nangloi jat
32 Singhela
33 Mkhmel pur
34 Bakthawarpur
35 Burari
36 Samalka
37 Nangloi jat
38 Bazidpur Thakran
39 Dera Mandi
40 Gadaipur
41 Baprola
42 Dindar pur
43 Rewla khampur
44 Puth kalan
45 Nilothi
R.G.GuptaCity/Policy Planner
Master Plan For Delhi 1957, Volume-II, PART - 3

S. No. VILLAGES
S. No. VILLAGES
S. No. VILLAGES
46 Alipur
47 Nangli poona
48 Mohammadpur Ranmjanpur
49 Baghrola
50 Gokal pur
51 Khajoori kahs(2)
52 Gharoli(3)
53 Dhansa(2)
54 Kazipur
55 Khari khari jatmal
56 Shamas pur khalsa
57 Shikarpur
58 Toda pur
59 Ghondil
60 Basant Nagar
77 Khampur(2)
78 Adhchini
79 Mangolpur kalan
80 Karawal Nagar
81 Chilla soreda Bangar
82 Asli(2)
83 Isapur(2)
84 Jaffrpur kalan(2)
85 Mundhela khurd
86 Hasan pur (2)
87 Jhilmiila Tahanpur
88 Kilokri
89 Mauj pur
90 Tughlakbad
91 Deoli
92 Asalatpur khaddar
93 Khizrabad.
Source: Delhi Administration
APPENDIX 12
LIST OF VILLAGES HAVING SOCIAL EDUCATION CENTRES
R.G.GuptaCity/Policy Planner
Master Plan For Delhi 1957, Volume-II, PART - 3

R.G.GuptaCity/Policy Planner
Master Plan For Delhi 1957, Volume-II, PART - 3

CHAPTER - FIFTEEN
FINANCIAL ASPECTS
The financial implications of any plan raise very important and pertinent questions. Not infrequently, the impression exists that a Master plan is a costly proposition and beyond people capacity . such an impression is, largely, a result of an inadequate appreciation of the purpose of such a plan and of the planning function. he fundamental question of cost, therefore must be dealt with explicitly and in the right prespective.
In the present chapter, the financial aspects of the Delhi Master plan are presented. In doing so the methodology of fiscal planning and capital budgeting have been utilized to the extent possible. The first section deals with the functions and use-fullness of fiscal planning. In the second section are given the physical targets of the Master plan up to the year 1981 and the likely capital expenditure involved in achieving them. In the following section is a presented a programme of development for the period a programme of development for the period 1961-66,which synchronises with the National Third Five Year period, with its financial implications.
I
At the outset, it has to be borne in mind that every metropolis, or for that matter any urban area, is a growing organism. As chapter no.3 preceding demonstrates, the population of Delhi has tripled during the last 20 years. And as the other chapters show, the city present today a bewildering variety of problems. Its enormous potential as a major urban centre; the haphazard growth within the city and on the sprawling outskirts; its housing deficit and backlogs in services and facilities- all these pose difficult challenges. In view of these problems and the enormous increase in its population, there is bound to be a corresponding increase in the community physical needs, irrespective of whether there is planning or no planning.
These growing needs have to be met, sooner at later. This is inevitable because urban living requires certain facilities ad amenities just as it means the denial of some benefits characteristic of rural living. Of course in a planless regime, the development is effected with inconveni9nt time lags and on an ad hoc basis, the approach being one of organizing a fire fighting serve as and when fires occur. When improvement are made In a piecemeal and uncoordinated manner by many public authorities, the community never gets to know or appraise the totally of the costs incurred, nor do the public authorities responsible for incurring them. Viewed in this light, the costs of unplanned development, though inevitable, are diffused and obscure.
For example, the citizens of Delhi might not be aware that the capacity of their city water supply system has been augmented almost every year during the last two decades at great cost. During the decade 1950-60 the erstwhile joit water and Sewage Board incurred a loan liability of about Rs. 10 crores for capital improvements in the water supply and sewarge system .These figures exclude Rs. 1.5 crores of capital expenditure incurred by the erstwhile Delhi Municipal committee and the New Delhi Municipal committee in the internal water distribution and sewers during the years 1948-58. The pity is that in spite of water-supply and sewerage being under the same Board, while water-supply increased substantially the sewarge system did not expand pari passu. The result was that sewarge
overflowed into the river Yamuna.
Similarly, the erstwhile Delhi Electricty Board went on expanding the power supply system of Delhi ina make-shift manner, incurring laons worth Rs. 7.6 crores during the last 20 years. The capital expenditure on roads incurred by a single pblic authority, the Delhi Municipal Committee, during 1948-49 and 1957-58 amounted o about Rs. 51 lakhs. It is tobe recalled that besides this local body, the responsibility inregard to the provision and maintenance of roads rests with other public authorities.
Examples of such ad hoc developed could be multiplied. it must be emphasized also that the above services constitute only a small fraction of the total services required by the metropolitan area. And if all the expenditure incurred during the last decade by all concerned public authorities, ranging from the Ministry of works, Housing & supply to the village panchayats, are added up, the total would run into a figure which must now appear incredibly high.
These example high- lightthe basic points that that (a)expenditures for development are inherent in growth itself, and (b) that without a plan these expenditures will be untimely and wasteful. The method of planning channelizes, by and large, these hitherto hidden costs and brings them into bold relief. To this extent, planning does not involve extra liabilities; it only imparts to the community an awareness of the financial magnitudes of development. The purpose of planning is to foresee requirements, and to provide them at the right time. The proper focus for cost, therefore, is the differences between the cost of development according to plan as against the cost of unplanned development.
It is universal experience that when metropolitan development is not planned, the process of growth is inefficient. Congestion, traffic hazards and bottlenecks, fuctional imbalance, uncontrolled sprawl, blight and slums, characterse development. Here again Delhi furnishes an apt example. In the wake of parti-tion, the city began to sprawl in whichever direction it found elbow-room. Colonies sprang up like mushroom. In the absence of a comprehensive plan or planning, they developed without utilities and essential community facilities. Where the needed services could not be provided, preconditions for slum for began to appear. Where services were made available, their operation turned out to be uneconomical. Squatting and unauthorized constructions became the order of the day. With slums and blight, began the physical deterioration of the contiguous areas. In all this anarchic growth, of the community basic problems could be solved. Huge backlogs accumulated.
To evolve order out of this planless past is beset with financial problems. In the first instance, the provision of a school in an already built up area, or widening an existing narrow street, or making available a park where none exists today raises the question of compensation for land and property. The amounts required today are much greater than, say, 12 years ago simply because land values have gone up by many times during this period. Incidentally, the 34,000 acres of land now notified for acquisition by the Government would have cost much less a few years ago.
R.G.GuptaCity/Policy Planner
Master Plan For Delhi 1957, Volume-II, PART - 3

Land value apart, the very process of demolishing the existing structures involves additional costs. One thousand unauthorized structures are reported to have been demolilsed by the corporation authorities between July, 1958 and Apirl 1958. To the total less of property due to these demolitions must be added the cosyyt of their replacement in the new locations, the administrative costs, and the cost of rehabilitation and of litigation etc. Besides direct financial losses, there are the indirect losses arising out of the disruption of the economic base of the individuals affected. All these are, in a way, the penalities of unplanned development.
As against the waste in a city without a plan, conscious direction of uban growth is bound to be more economical. A plan provides for the optimum utilization of resources, and their rational allocation. Planning also prevents various indirect economic and social costs inherent in unplanned development. The fact of the matter is, therefore, that planning saves, rather than creates, costs for the community. This is not to deny that there would be additional costs when the plan aims at providing higher standards of services. But the costs of loer standards in the past cannot be compared with the higher level of services contemplated under the plan.
The Master plan for Delhi, unlike other Indian city development plans, is a spectrum of co-ordinated projects within a breackroundof regionalism. This comprehensive approach has culminated in a desirable and workable patternof urban development. The plan sets limits for urbanization for the next two decades, with dispersal of a certain population to the surrounding towships. The object is not only to accommodate the additional population in te years to come but also to create a stable economic base for metropolitan activities. This is reflected in the proposed use of land in various sectors of economic. For which services and amenities have to be provided. The plan is not merely to create new extensions. It aims also to remove disorganized congestion and blight in the older parts of the city through an integrated approach of clearance, conservation and rehabilitation. This challenging task of reconstruction of slums, wherein about 455 of the present population lives, poses serious social and economic problems which could be talked only on along range basic. Besides slum eradication, the plan provides for basic urban facilities, such as schools, hospitals, open spaces etc. in the existing areas where such facilities are deficient. The plan on transportation provides a net-work of roads and highways and other traffic amenties and is comprehensive. So too plan on public utilities. It calls for augmentation of water and power sources and provision of adequate sewerage facilities in the old and new areas as well. A new utility-gas supply has also been proposed. A unique aspect of the plan is the overall integrated development of the rural areas, which is vital for healthy metropolitan growth.
In this part the physical targets for the next 20 years period with their tentative costs are presented. The estimates of cost are based on the current wage and price levels and may vary from time to time. It will also be appreciated that cost estimation is not only an arducus exercise but suffers from many a limitation and when it relates to such a long period, the estimates can not be anything but tentative.
Physical Targets and Cots 1961-81
The targets listed below are necessary for achieving the desired physical growth. As regards the metropolitan area facilities within the U.P. and the Punjab it is hoped that the respective state Governments will prepare similar programmes for implementation so that balanced metropolitan development is attained. The physical targets may be conceived under the following eight major heads :-
(1) Acquisition and development of land.
(2) Housing.
(3) Community facilities.
(4) Slum improvements and redevelopment.
(5) Public utilities and services.
(6) Transportation.
(7) Recreation.
(8) Rural development.
(9) Civic design.
(10) Government offices.
I Acquisition of Land & Development
In order to contain the likely population of about 4.6 million by 1981, the following additional areas are proposed to be developed under various uses :
Residential 30,000 acres
Commercial 1, 900 acres
Industrial 4,800
Government 500 acres
Recreational 25,00 acres
The cost of acquisition and development of the above land is estimated at about Rs. 200.00 crores. The cost excludes the acquisition of those lands already under Government possession. For instance most of the land disposal envisages that land under item 4&5 are owned by Government. The progrramme of land disposal envisages that land released to parties other than the public Authorities would be given only on a lease hold basic. Obviously, the programme would generate considerable revenue from premium and ground rent. While the premium would meet the cost of acquisition and development of land, the additional premium and recurring ground rent should be a net income.
II Housing :
At present there is a backlog of about 1.45 lakhs of dwelling units in the Delhi Urban Area in various income groups. The additional dwelling units required for the increase I population in the next 20 years ill be about 6 lakhs. Thus the total number of units required for the period 1961-81 would be about 7.45 lakhs. Their distribution under various categories is estimated as follows:
Government Housing 1,50,000 Dwelling units
Squatters and low 1,10,000 ,, ,,
Income group housing 4,85,000 ,, ,,
Total 7,45,000 ,, ,,
The estimated cost of public housing is about Rs. 195.00 crores while that of private housing, about Rs. 450 crores.These dwelling units are the minimum required in the Delhi Urban Area for another two decades and have to be provided to prevent further physical deterioration. The Government housing and low income group housing do not carry a prospect of revenue and have to be subsidized. But the houses that would come up in the private sector would yield revenues to public authorities by way of taxes on property, wealth and income . Being a basic pre-requisite for urban livilg, housing deserves a high priority. A positive approach to the slum problem , it will be appreciated, is make to provision of adequate dwelling units. The volume of housing construction contemplated in the private sector, is physically and financially, of a huge magnitude. To make it feasible, government may ave to grant liberally loans for house building and set up or encourage building- material industries, e.g., bricks, tiles, lime, cement etc.
R.G.GuptaCity/Policy Planner
Master Plan For Delhi 1957, Volume-II, PART - 3

III Community facilities :
The requirements of basic community facilities such as schools, hospitals and other community facilities etc. have been estimated for the anticipated population increase keeping in view the spae standards recommended in the plan. These estimates also include the current backlogs which in themslaves are formidable. These basic civic amenities, if not provided adequately from time to time would make their deficits frightening after some years. The following are the total requirements of major urban community facilities for the period 1961-81.
Sl. No. Name of facility Additional Backlog Total
needed
1 Nursery schools 720 - 720
2 Primary schools 720 438 1158
3 Higher secondary 180 59 239
schools
4 District Centres 15 - 15
5 Community Mall 160 - 160
6 Health Centre 110 190* 219
7 Hospital beds 9000 4700 13900
8 Collages 25 - 25
(*Existing dispensaries to be upgraded as health centres)
Besides these, local shopping facilities, police station, post offices, fire stations ect. Should also be provided adequately. These amenities will be distributed in different areas according to the density pattern and the nature of land use. Some of them, for example schools and collages, may be provided by the private sector. But a major share of the programme will have to be implemented only by the public authorities. The estimated cost of comm. Unity facilities comes to about Rs. 45 crores. The maintenance of these facilities would not be a net liability because some revenue may accure from some of them, as for example, through fees from schools, collages and hospitals and commercial revenue from district centres and local shops etc.
IV. Slum Improvement & Redevelopment:
By its very nature, the problem of redevelopment of the old and congested parts of the city is rendered highly conjectural. The success of this project wherein the human element is involved, would depend toa large extent on the reaction of the public to be rehoused and their active cooperation to move out of blighted areas. AS such, it is not possible to indicate at thisstage precisely as to which of the areas would be definitely tackled. If adequate funds are made available, the administrative capacity becomes larger and the cooperation of the public is obtained in large measure, the projects enlisted below could be more or less implemented over the next 20 years. They are : Kotla Mubarkpur. Sui Walan, Kucha pati Ram, Motia Khan, Sarai, Rohilla, Quadam Sharif, Shadipur Khampur, Ajmeri Gate, scheme, Malka Ganj, Sohan Ganj, Arya pura, Andha Moghal, Rahat Ganjand Kashmeri Gate, Manak pura, Then Singh Nagar, Bapu Nagar. More than two lakhs of families noe live in these areas and if every family has to be properly housed, the magnitude of the problem can be easily imagined. In view of the above, not all areas could be redeveloped, some-mmay only be improved. The estimated cost of slum improvement and redevelopment is about 40 crores of rupees.
V. Public utilities :
Among essential projects, public utilities deserve a higher
priority. Roads may not be laid according to specifications, houses may not be built according to architectural standards, but provision of protected water and power becomes a vital necessity for urban living. In the Master plan, an overall assessment of public utility services has been taken into account.
For the period 1961-81, about 160 million gallons of water is proposed to be augmented from various sources and distributed to various areas. This additional supply together with the present supply of 90 million gallons would be able to supply adequately a population of about 4.6 million by 1981 proposals have been made o provide simultaneously trunk sewers and sewage disposal works so as to cover all new areas to be developed so that river pollution is prevented. The proposed trunk sewerage net work is made top cover area of about 37,200 acres which is the total developable land within the urban is able limits. The capacity of the sewage purification plants is proposed to be increased by about 148 million gallons per day over the next 20 year period. Electric power which is also in short supply has to be augmented appreciably. Including backlogs, about 4.58 lakhs kw. Of electric load would be needs at the end of the next decades in different sectors- residential, commercial and industrial.
Gas is being recommended for Delhi for the first time, in view of its economy and other obvious advantages. Needless to state that the utilities-water, power and gas supplies – generate a handsome revenue which, esides meeting their operating expenses, would leave a surplus. The estimated cost of the public utility services is about 90.00 crores.
VI. Transportation:
In the Master plan are embodied many proposals for augming traffic facilities, such as provision of rodas and high-ways, terminals, road and rail bridges, over passes and underpasses, ring railways etc. Details of the 20 year transport programme is as gives in the chapter on Transportation. These proposals aim to eliminate traffic hazards and bottlenecks in the present city to create a smooth circulation pattern. In the new areas, it is obvious,the standards proposed would be more than satisfactory. A salient feature of the transporation plan is the provision of about six roads and rail bridge across the Yamuna to provide enough accessibility to theaeaon the other side of the river to be developed as a part of the Metropolitan Area. The ring railway proposed would greatly augment the transport facilities. The outer and inner ring, roads, major arterial and sub-arterial roads etc. , when completed, would alleviate the present traffic congestion. Proposals have been made for location of inter-state bus and truck terminals at various places in the urban area.
Intersection and station improvement etc. have also been provided. The programme includes a very important proposal, viz., augmenting the D.T.U. fleet by more than three times its present capacity. Evidently, the D.T.U. is a revenue earning utility. Besides, the augmentation of transporation facilities on such a big scale should gives riise to considerable public revenues. The estimated cost of transportation including augmentation of the D.T.U. fleet works out to about Rs. 50,000 crores.
VII. Government offices :
Government employment in future is expected to increase and the plan provides will be located in different parts of the city keeping in view the distance from the place of residence to the work centres. The total plinth area required ( in all floors) for this purpose would be about 320,00 lakh sq. feet for both Central Government and Delhi Administration offices. The estimated cost of construction of these
R.G.GuptaCity/Policy Planner
Master Plan For Delhi 1957, Volume-II, PART - 3
Government offices works about to Rs. 30 crores. The cost includes provision of services and air conditioning.
VIII. Recreation :
Recreational facilities provided to neighbourhood and district levels apart, the pan provides for regional recreation also. While it is different to rule out such a facility in a metropolitan complex, its importance's become all the greater in the case of Delhi as it is the National Capital and an International centre attracting many tourists. If funds permit, it has been proposed to develop 25,000 acres of land for recreational use wherein both active and passive recreational facilities would be provided. In the active recreational areas facilities such as open air theaters, libraries, museums, swimming pools, terraced gardens, landscaped vistas and botanical gardens would be provided. In the passive recreational areas, afforstation programmes should be carried out to keep away the approaching desert and to create the desired ecological balance.
IX. Rural Development :
Development of the rural areas of Delhi State has hitherto been overlooked. In the Master plan , a unique aspect, however, is their overall development so that the rural resident do not feel neglected as compared with their urban counterparts. The basi amenities provided include community facilities such as health centres, schools, collages etc. , public utilities and roads in all the villages.
Since the increment in the rural population during the period 1961-81 is negligible the facilities provided for the Third Five Year plan will be more or less be sufficient upto 1981. Thus the additional sum provide during later periods. The units required for various facilities are taken from the chapter on rural planning.
Besides these facilities, rural industrial centre would also b set up in some major village centres to strange than the rural economic base. In work in out the total services requirements, care has been taken to reckon the areas that will be urbanized in future and its effect on the total rural population.
The centre programme is estimated at Rs. Crores. It must be admitted that the maintance of the rural services and facilities entirely out of rural resources would not be possible. A portion of the urban resources may, therefore, have to be diverted to meet the apital and the operational costs. It is obvious that there are many other advantages of preserving the ruralsector which ould help a great deal the functioning of the urban areas.
The abstract estimate of capital cost under the various heads of development for the period 1961-81 are given below:
1. Land Development 200,00
2 Housing 195.00
3. Community Facilities 45.00
4. Slum Improve and Redevelopment 40.00
5. Public Utilities 90.00
6. Transportation 50.00
7. Recreation 10.00
8. Rural Development 5.00
8. Government offices 30.00
Total 665.00
Add 105 administration charges 66.50
Grand Total 731.50
Say 732.00
The estimated cost of capital outlay in the public sector, thus, works out to about Rs. 781 crores. The above outley will not be a net liability as each of the project has a revenue counterpart. Some are of capital nature and some are recurring. For instance, the land acquisition and development programmes alone would raise about 321 crores as capital receipts and recurring revenues for the 20 year period, besides the recurring revenue of Rs. 4 crores after 1981. The public utility services, such as water, power and gas are estimated to yield a total surplus as Rs. 110 crores during the plan –period and a recurring annual revenue of Rs. 30 creres beyond the plan period. Besides this revenue, there would be revenues from public owned buildings, community facilities and transport services. A huge amount of public revenue will accrue from taxes, rents, prices and fees. An approximate estimate is that more than 705 of the capital cost would be realized by way of capital receipts and surplus recurring revenues. These figures are very tentative and based on present levels of public revenues though the rate of growth of public revenues is bound to increase in future.
III
As may be seen in the section preceding, he Delhi Master plan contains many projects and programmes. Not all the programmes carry the same priority. Somme are to be tackled without much delay while others can be taken up later. Since the pattern of future resources is now unknown, it is not possible at this stage to indicate which of the project would go into different phases. The physical targets for the first 5 years, which synchornise with the National III Five Year plan, have been set out keeping in view the immediate needs of the community and to arrest further deteriorated of the already deplorable state on the one side, and current resources on the other. While rating the priorities, for thispeiod, the projects which have less to do with the basic functions of urban living, e.g., civic design, ornamentation, recreational luxuries, etc. have bbeen given a lower priority. The standards for community facilities and other standards are very modest and are the minimum to be achieved. The resources or means of the metropolis should increase in the years ahed and with the national development plan, individual income will rise. The local bodies then will have more resources to go in for better standards of development.
The programme listed below for the first phase, 1961-66, are limited to highly essential projects which require urgent attention. The major heads of development are similar to those ggiven in the preceding part. The capital costs of these projects are aso discussed under each head.
1. Acquisition of Land and Development :
As started in part II the overall plan for development of the Delhi Urban Area provides 1,10,000 acres of land under different uses to hold a population of about 46 lakhs. The present urban area is about 43,000 acres. Thus 67,000 acres of land would be developed additionally during the period 1961-81. Of this 9,200 acres are to be developed durng the first five plan period. This would suffice for the additional population growth. The land to be developed under various uses would be as follows;
1. Residential 6,000 acres
2. Extensive industries 1,200 acres
3. Commercial 565 acres
4. Recreational 1,400 acres
(active & passive)
Besides this, about 90 acres of land in the congested area would be cleared and utilized for construction of flatted factories which will accommodate about 15,000 workers. A part of the 90 acres is ow
R.G.GuptaCity/Policy Planner
Master Plan For Delhi 1957, Volume-II, PART - 3
vacant. These factories will help intensive use of land wherein the congested small scale industries could be properly organized. This project is thus tied up with the slu improvement and redevelopment programme which is discussed below. The area of about 1,200 acres proposed to be developed for extensive industrial uses would accommodate about 30,000 workers.
The area of about6,000 acres earmarked for residential use will be developed by different agencies as follows: D.D.A. -4,000 acres; cooperative societies -850 acres and Union Government -1,200 acres. Of the land t be developed by D.D.A., about 600 acres of virgin land ill be handed over to cooperative will have to return the developed land to the Delhi Administrative for allotment to its members who will then entre into lease agreement with the chief commissioner. As regards the land allocated to local bodies, it will be used for low income group housing, industries, flatted factories and for parks. The estimated cost of land acquisition and development will be about 17.22 crores.
2 . Housing :
There is an acute shortage of housing, the current deficit being estimated at 1.45 lakh units, while the total requirements for the 20 year plan is 7.47 lakh units. Because of the lack of a sufficient number of developed plots less then half of the number of units needed annually during the past five years have been constructed, since only limited investment in housing may be made during the first pahse the situation would improve a great deal of only the current defect does not increase. The backlogs could be gradually cleared in subsequent phases. The present programme will meet completely the housing requirements in varios income groups of the additional population during the period.
For the entire period of the plan about 1,25,000 dwelling units are p[roposed to be constructed by different agencies as follows :
1. Government 25,000 dwelling units
2. Low income group housing 25,000 dwelling units
3. Private housing 75,000 dwelling units
The estimated cost of public housing will be 33.10 crores. Besides, the private sector is expected to invest about 50.00 crores of rupees on housing.
III. Community Facilities .*
Deficits exist in great measure in community facilities also. The plan approach to this defict is similar to housing, that is, arresting further deterioration and providing for the requirements of the plan period only. During the first phase, it is proposed to construct about 100 nursery schools, 145 primary schools, 37 high schools, 5 collages, 35 health centres, hospitals for 2550 beds, 35 community halls for and 4 fire station. Besides there, police stations and post offices should also be provided by the respective authorities. The nursery and primary schools, health centres, community centres, libraries, and fire stations will be constructed by the local bodies. About 255 of the/hospital beds will be provided by local bodies, while 755 of the /beds will be provided by the Delhi Administration. Besides hospitals the Delhi Administration will also provided higher secondary schools, and police stations. Collages will be built by the Delhi University out of the funds received from Central Government. Post office will be provided by the Ministry of Transport and communications. The current backlogs have already been citied in part II. The estimated cost of community facilities is about 7.91 crores.
(* in the built up parts of the city it will not be possible to find space immediately for the construction of schools buildings. The majority of them will therefore, continue in rented buildings. The expenditure on account of this will be met out of revenue budget of the various anthorities and has not been included here.
IV. Slum Improvement :
During the first phase, keeping in view available means and administrative capacity, only slum improvements are suggested, although clearance is the ultimate answer. The slum improvements suggested in the older parts of the city. Include opening areas for provision of roads and community facilities. The widening of existing roads etc. The pogramme also included construction of transit campus for the relocation of people who will be removed from the areas opened out. The positive programme for slum clearance is to provide an ample number of houses for low income groups, so that the time would be ripe in the later phase to take up slum clearance vigorously. AS discussed under Housing , a beginning will be made in this programme by constructing about 25,000 dwelling units in the low income groups.
V. Public Utilities :
The programme of improvements and augmentation of the public utilities and services may be divided in to four major sub-heads; water supply, sewarge and sewage disposal, electricity, and gas supply. Gas is proposed for introduction in Delhi as a new utility during this phase.
The augmentation programmes under water supply, sewerage and electricity include installation of generation or treatment plants and provision of bulk services. Augmentation of sources of power and water and capacities of the treatment plants will not only meet the additional requirements during this period but will bring in overall improvements in the existing areas as well, where conditions are far from satisfactory. The improvements programme for the above three services includes the redesigning of the existing so as to serve the present areas adequately.
(a) Water :
As discussed in part II, the ultimate quantity of water required for the Delhi Urban area will be about 250 million gallons at the rate of 50 gallons per capita, per day. In the first phase, it is proposed to step up the present supply of 90 million gallons per day to about 130 million gallons per day by1966 so as to provide a supply of about 40 gallons in the areas served. The programme would also supply through feeder mains all the developed areas which are presently unserved. The largest of 45 gallons of water per capita is an interim measure only, while the final targets is 50 gallons per capita. The city water supply will be augmented from the Bhakra Reservior and tube wells in U.P.
Besides securing the required quantity of water, the programme will improve the quality of water too. While the solution for the problem of river pollution is inter-linked with the general improvement of the existing sewer5age system, it ahs been proposed under the current programme to replace the present polluted under the current programme to replace the present polluted water source at Okhla by an alternate source from south Delhi. Thus, the programme, when implemented, will free the community remoter borne diseases.
(b) Sewerage and sewage Disposal :
Sewarge and sewage disposal will have to be drastically improved and expanded. The programme under this head includes not only provision of trunk sewers and treatment plants to serve the additional population during the period: but also, an improvement of the existing overloaded system. This is proposed to be done by providing a number of relief sewere. It is also proposed to improve the efficiency of the existing trunk sewer network by providing auxiliary and dee sewers wherever required. The programme also includes
R.G.GuptaCity/Policy Planner
Master Plan For Delhi 1957, Volume-II, PART - 3

providing auxiliary and deep sewers. It is also proposed to improve the efficiency of the existing trunk and sewer network by providing auxiliary and deep sewers wherever required. The pogramme also includes an adequate network of trunk sewers where none exist now. A salient feature is to provide sewerage and an independent treatment plant for the whole of shahdara, and area which is presently unsewered.
Electricity :
Power supply, which is chronically short, is proposed to be augmented under the current programme. The power required by 1981 for Delhi State will be about 5.38 lakh kws. The current deficit is about 40,000 kws. Thus, a total of about 5.38 lakh kws of poer will be required.
The programme envisage construction of a new power south house of the existing one aRajghat, or a capacity of 1.2 lakh kws. In addition, it is proposed to draw about 1 lakh kws. As bulk supply from the Bharka Nangal bydro- electric grid system. The programme also provides for the transmission and distribution of power in bulk to various new areas. A striking aspect of the programme is electrification of all the/villages in rural Delhi and provision of adequate power for rural industries. Only about 70 villages have been electrified so far.
The new utility, gas supply, has been proposed mainly on economic considerations. In the context of the present fuel pattern, gas and soft coke will be far cheaper than any other commercial fuel. The programme aims to replace the expensive commercial fusel by gas and soft coke, the two bye-products of coal carbonization. At present soft coke is transported to Delhi from the Bihar coal Mines after carbonizing hard coal, allowing the gas to escape. Soft coke, being a lighter material, occupiesnearlly twice as much of space as required froo hard coal. The programme envisages transportation of hard coal to Delhi with less of transportation cost carbonizing hard coal here, so thatboth the bye-products –coal gas and soft coke are utilized to the optimum. During the Third Five Year plan it is proposed that a coal gas plant of about 1100 tens capacity be erected. This will yield about 8 million cft. Of gas which could feed a population of about 4 lakhs and yield about 700 tens of soft coke. The amount of soft coke produced would satisfy about 70% of the present requirements. Provision has also been made for the/gas distribution system to cover initially the city core. As the demand for this new fuel increase, the/capacity of the/plant will be augmented. The saving expected in the domestic sector as a result of use of gas is estimated at Rs.2.28 crores per year besides bringing in considerable income for the public utility undertaking .This has been discussed in detail under Revenues. The estimated cost of the public utility services during the five year period will be about 36.83 crores.
Transportation :
They transportation programme includes many projects: construction of roads and highways, express cycle tracks, railway tracks, rail and road bridges, terminals, inter-section improvements, and augmentation of the D.T.U. flect. Besides the provision of adequate roads for the areas to be developed during the period, provision is made for many arterial and sub –arterial ways to eliminate existing traffic hazards and bottlenecks.
Salient among the road development projects are : the construction of a national by pass from Indraprashta collage to wazirabad Barrage, extension of Mall Road to connect National Highway by pass, a by-pass to Connaught circus connecting Circular
Road and parliament street. The other roads proposed in the different parts of the city are indicated below :
North East :
Extension of National Highway No.10 south of the western Yamuna Canal : link road connecting Ring Road with the proposed extension of National Highways No.10 ; link road connecting G.T. Road to Karnal with the above trunk road along Najafgarh Nala.
South :
Major arterial road east of the 1100 acre development linking Ring Road and the extension of the Chirag Delhi Road ; major road linking Ring Road and the chirag Delhi Road;a sub-arterial raod west of okhla Industrial Estate linking Badarpur Road and chirag Road ; link road connecting well esely Road and Lodi Road.
East :
Approach road connecting the proposed Yamuna bridge near Humayan Tomb and Lodi Road ; link road between Mathura Raod near purana Quila and National Highways by- pass : major road connecting G.T. Road(Ghaziabad) to the proposed by-pass to National Highways No.24; major road connecting G.T.Road to Ghaziabad and the proposed road along the western Yamuna canal marginal bund.
West :
Link Road connecting Shankar Road and Ring Road near Naraina village south of pusa Institute: road linking patel Road with Ring Road to the west of pusa Institute; a major road north of Indrapuri colony; a major road parallel to cantonment railway line connecting Jail Road and Patel Road.
The road programme also includes the construction of bridges and under passes wherever required. As regards cycle tracks, the programme includes construction of an express cycle track along Kushak Nala, which will divert the bulk of the cycle traffic moving towards the central Secretariat. A most important proposal among bridges is the construction of a road and rail bridge across the Yamuna near Humayun Tomb to increase the accessibility of the area on the east side of te river where major development is proposed.
Among the programme of railway facilities, the most important one are the construction of a link between Tughlakabad and Ghaziabad across river Yamuna, and the construction of a Ring Railways. These facilities will greatly augment the transport facilities. As regards terminals, inter-state bus and truck terminals have been proposed. Besides these, the programme also include inter-section improvements which will improve the traffic efficiency at all junctions.
The programme includes a substantial increase in the bus fleet of the D.T.U. to meet current shortage and future needs. The estimated cost of the entire transportation programme during this period will be 10.457 crores of rupees.
VIII. Government Offices:
The programme envisages replacement of the existing single storyed barracks, which have outlived their life by providing at suitable places multi-stroyed offce buildings. This will facilities more intensive use of land. The total poolinth area( in all floors0 proposed
R.G.GuptaCity/Policy Planner
Master Plan For Delhi 1957, Volume-II, PART - 3

to be provided is about 60 lakh sq.ft. This area takes care of the additional requirements during the plan period. The estimated cost of constructing these offices, including, cost of services and air-conditioning, will be Rs. 6.00 crores.
IX. Rural Development ;
An important aspect of the capital improvement programme in this phase is the development of the rural areas within the Union
Territory. The plan makes provision for basic amenities, like protected water supply, sanitation and drainage, schools and health facilities, which now are either non- existent or inadequately provided. An important feature of the rural development programme is the provision of approach roads which will improve accessibility to main roads and communication between village.
The abstract estimate of capital cost to be incurred by the various agencies during tis period may be seen in the table below :
Sl. No. Major Heads of Development Total Distribution among various agencies
Local Bodies Union Govt. Delhi Admn.
1 Acquisition of land development 42.57 17.95 4.86 19.76
2 Housing 33.10 8.75 24.35 -
3 Community Facilities 6.39 3.38 0.51 2.50
4 Acquisition of properties for opening out 2.50 2.50 - -
roads and provision of community and transit
camps (Lump sum)
5 Public Utilities 36.83 36.83 - -
6 Transportation 10.46 4.44 5.63 0.39
7 Government offices 6.00 - - -
8 Rural Development 3.18 3.18 6.00 -
141.03 77.03 41.35 22.65
Add contingencies & Departmental charges at 8% 11.28 6.16 3.13 1.81
Grand Total 152.31 83.19 44.66 24.46
ABSTRACT OF CAPITAL COST TO BE INCCURRED BY DIFFERENT AGENCIES
As may be seen in the table above, the total capital cost of the development programme during this five year periods will be about Rs. 152.31 crores of which Rs. 83.19 crores will be for the local bodies , Rs. 44.66 crores for the Union Government and Rs. 24.46 for the Delhi Administration.
Operational and Maintenance Costs:
The estimates of the capital outlays given above under the various heads of development would give rise to met by the three implementing agencies. Besides, three would be the debt services charges. For good financial planning and budgeting all these have to be reckoned to assess carefully whether the community would be able to maintain the services within its means. The projects giving rise to these costs are broadly classified and the tentative cost of operation and maintenance for the Third Five Year plan collectively and the annual recurring expenditure thereafter are shown below :
Total M & O Annual recurr-
cost for the Five -ing O & M
Year plan period costs after 1966
1. Public owned buildings Rs. 2.48 crores Rs. 0.83 crores
2. Community facilities Rs. 3.69 ,, Rs.1.40 ,,
3. Public utilities Rs.11. 83 ,, Rs. 4.22 ,,
4. Transportation Rs. 0.93 ,, Rs. 0.29 ,,
5. Government offices Rs. 0.41 ,, Rs. 0.15 ,,
Total : Rs.19.35 crores Rs. 6.89 crores
The distribution of the operational and maintenance costs as between the implementing agencies for the Five Year plan period and annually thereafter will be:
Total M & O Annual recurr-
cost for the Five -ing O & M
Year plan period costs after 1966
1. Local Bodies Rs. 13.23 crores Rs. 4.68 crores
2. Union Government Rs. 2.82 ,, Rs. 0.92 ,,
3. Delhi Administration Rs. 3.30 ,, Rs. 1.29 ,,
Total : Rs. 19.35 crores Rs. 6.89 crores
It may be seen that of the implementing agencies, the local bodies have naturally to maintain a major part of the services. As regards Union Government, it has to maintain only Government offices and government employees quarters and the national highways. The Delhi Administration will have to bear the costs of Higher Secondary schools and a part of the hospital facilities.
As discussed earlier, the total capital cost to be met by the three agencies works out to Rs. 152.31 crores. To this should be added Rs. 19.35 crores as operational and maintenance costs be Rs. 171.66 crores. Against this outlay, capital receipts of that this amount will be met out of leans at 41 % interest payable over a period of 30 years.
Revenues ;
As are result of land development about Rs. 30.37 crores would accrue as capital receipts during the plan period. Since no ground rent
R.G.GuptaCity/Policy Planner
Master Plan For Delhi 1957, Volume-II, PART - 3
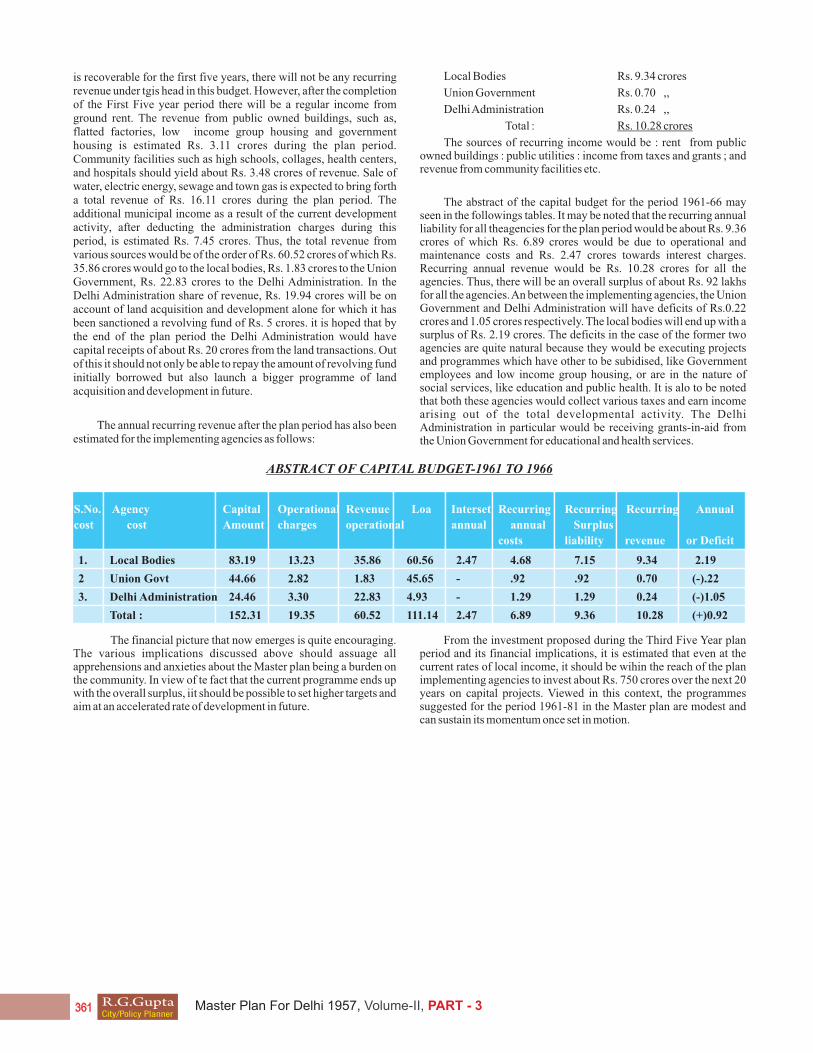
is recoverable for the first five years, there will not be any recurring revenue under tgis head in this budget. However, after the completion of the First Five year period there will be a regular income from ground rent. The revenue from public owned buildings, such as, flatted factories, low income group housing and government housing is estimated Rs. 3.11 crores during the plan period. Community facilities such as high schools, collages, health centers, and hospitals should yield about Rs. 3.48 crores of revenue. Sale of water, electric energy, sewage and town gas is expected to bring forth a total revenue of Rs. 16.11 crores during the plan period. The additional municipal income as a result of the current development activity, after deducting the administration charges during this period, is estimated Rs. 7.45 crores. Thus, the total revenue from various sources would be of the order of Rs. 60.52 crores of which Rs. 35.86 crores would go to the local bodies, Rs. 1.83 crores to the Union Government, Rs. 22.83 crores to the Delhi Administration. In the Delhi Administration share of revenue, Rs. 19.94 crores will be on account of land acquisition and development alone for which it has been sanctioned a revolving fund of Rs. 5 crores. it is hoped that by the end of the plan period the Delhi Administration would have capital receipts of about Rs. 20 crores from the land transactions. Out of this it should not only be able to repay the amount of revolving fund initially borrowed but also launch a bigger programme of land acquisition and development in future.
The annual recurring revenue after the plan period has also been estimated for the implementing agencies as follows:
Local Bodies Rs. 9.34 crores
Union Government Rs. 0.70 ,,
Delhi Administration Rs. 0.24 ,,
Total : Rs. 10.28 crores
The sources of recurring income would be : rent from public owned buildings : public utilities : income from taxes and grants ; and revenue from community facilities etc.
The abstract of the capital budget for the period 1961-66 may seen in the followings tables. It may be noted that the recurring annual liability for all theagencies for the plan period would be about Rs. 9.36 crores of which Rs. 6.89 crores would be due to operational and maintenance costs and Rs. 2.47 crores towards interest charges. Recurring annual revenue would be Rs. 10.28 crores for all the agencies. Thus, there will be an overall surplus of about Rs. 92 lakhs for all the agencies. An between the implementing agencies, the Union Government and Delhi Administration will have deficits of Rs.0.22 crores and 1.05 crores respectively. The local bodies will end up with a surplus of Rs. 2.19 crores. The deficits in the case of the former two agencies are quite natural because they would be executing projects and programmes which have other to be subidised, like Government employees and low income group housing, or are in the nature of social services, like education and public health. It is alo to be noted that both these agencies would collect various taxes and earn income arising out of the total developmental activity. The Delhi Administration in particular would be receiving grants-in-aid from the Union Government for educational and health services.
ABSTRACT OF CAPITAL BUDGET-1961 TO 1966
S.No. Agency Capital Operational Revenue Loa Interset Recurring Recurring Recurring Annual
cost cost Amount charges operational annual annual Surplus
costs liability revenue or Deficit
1. Local Bodies 83.19 13.23 35.86 60.56 2.47 4.68 7.15 9.34 2.19
2 Union Govt 44.66 2.82 1.83 45.65 - .92 .92 0.70 (-).22
3. Delhi Administration 24.46 3.30 22.83 4.93 - 1.29 1.29 0.24 (-)1.05
Total : 152.31 19.35 60.52 111.14 2.47 6.89 9.36 10.28 (+)0.92
The financial picture that now emerges is quite encouraging. The various implications discussed above should assuage all apprehensions and anxieties about the Master plan being a burden on the community. In view of te fact that the current programme ends up with the overall surplus, iit should be possible to set higher targets and aim at an accelerated rate of development in future.
From the investment proposed during the Third Five Year plan period and its financial implications, it is estimated that even at the current rates of local income, it should be wihin the reach of the plan implementing agencies to invest about Rs. 750 crores over the next 20 years on capital projects. Viewed in this context, the programmes suggested for the period 1961-81 in the Master plan are modest and can sustain its momentum once set in motion.
R.G.GuptaCity/Policy Planner
Master Plan For Delhi 1957, Volume-II, PART - 3

APPENDIX
TABLE NO 1
FROM 1961-1981 FOR THE DELHI MASTER PLAN
ABSTRACT OF THE ESTIMATED COST OF DELHI MASTER PLAN-1961-81
Sl.. No. Major Heads of Development Estimated REMARKS
capital costs
1. Land Acquisition and Development 200.00 Will not include cost of commercial & industrial building.
2. Housing 195.00 Private Housing amounting to rs. 447.60 crores is not included in this programme.
3. Community facilities 45.00
4. Slum improvements and redevelopment 40.00
5. Public utilities 90.00
6. Transportation 50.00 Cost of rail works, new airport not included.
7. Recreatich 10.00 Includes both active and passive recreations.
8. Rural development 5.00
9. Government offices 30.00
Administration Charges 665.00
66.50
GRAND TOTAL : 731. 50 OR 732.00
R.G.GuptaCity/Policy Planner
Master Plan For Delhi 1957, Volume-II, PART - 3
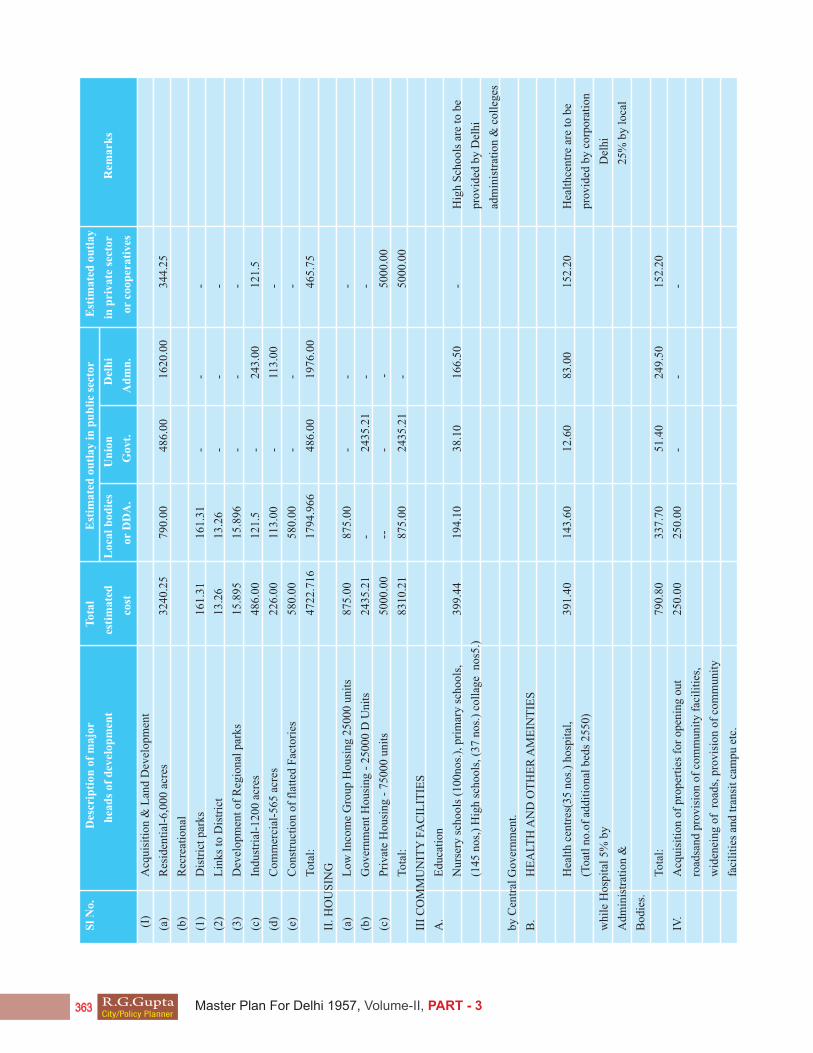
Sl
No.
Des
crip
tion
of
maj
or
T
otal
Est
imat
ed o
utl
ay i
n p
ub
lic
sect
or
Est
imat
ed o
utl
ay
h
ead
s of
dev
elop
men
t
e
stim
ated
L
ocal
bod
ies
Un
ion
D
elh
i
in
pri
vate
sec
tor
Rem
ark
s
co
st
or
DD
A.
G
ovt.
Ad
mn
.
o
r co
oper
ativ
es
(I)
Acq
uisi
tion
& L
and
Dev
elop
men
t
(a)
Res
iden
tial
-6,0
00 a
cres
3240
.25
790.
00
486.
00
1620
.00
344.
25
(b)
Rec
reat
iona
l
(1)
Dis
tric
t pa
rks
16
1.31
16
1.31
-
- -
(2)
Lin
ks t
o D
istr
ict
13
.26
13.2
6 -
- -
(3)
Dev
elop
men
t of
Reg
iona
l pa
rks
15.8
95
15.8
96
- -
-
(c)
Indu
stri
al-1
200
acre
s
486.
00
121.
5 -
243.
00
121.
5
(d)
Com
mer
cial
-565
acr
es
22
6.00
11
3.00
-
113.
00
-
(e)
Con
stru
ctio
n of
fla
tted
Fac
tori
es
580.
00
580.
00
- -
-
T
otal
:
4722
.716
17
94.9
66
486.
00
1976
.00
465.
75
II. H
OU
SIN
G
(a)
Low
Inc
ome
Gro
up H
ousi
ng 2
5000
uni
ts
875.
00
875.
00
- -
-
(b)
Gov
ernm
ent
Hou
sing
- 2
5000
D U
nits
24
35.2
1 -
2435
.21
- -
(c)
Pri
vate
Hou
sing
- 7
5000
uni
ts
50
00.0
0 - -
-
- 50
00.0
0
T
otal
:
8310
.21
875.
00
2435
.21
- 50
00.0
0
III
CO
MM
UN
ITY
FA
CIL
ITIE
S
A.
Edu
cati
on
N
urse
ry s
choo
ls (
100n
os.)
, pri
mar
y sc
hool
s,
399.
44
194.
10
38.1
0 16
6.50
-
Hig
h S
choo
ls a
re t
o be
(1
45 n
os,)
Hig
h sc
hool
s, (
37 n
os.)
col
lage
nos
5.)
pr
ovid
ed b
y D
elhi
adm
inis
trat
ion
& c
olle
ges
by C
entr
al G
over
nmen
t.
B.
HE
AL
TH
AN
D O
TH
ER
AM
EIN
TIE
S
H
ealt
h ce
ntre
s(35
nos
.) h
ospi
tal,
39
1.40
14
3.60
12
.60
83.0
0 15
2.20
H
ealt
hcen
tre
are
to b
e
(T
oatl
no.
of a
ddit
iona
l be
ds 2
550)
prov
ided
by
corp
orat
ion
whi
le H
ospi
tal
5% b
y
D
elhi
Adm
inis
trat
ion
&
25
% b
y lo
cal
Bod
ies.
T
otal
:
790.
80
337.
70
51.4
0 24
9.50
15
2.20
IV.
Acq
uisi
tion
of
prop
erti
es f
or o
peni
ng o
ut
250.
00
250.
00
- -
-
ro
adsa
nd p
rovi
sion
of
com
mun
ity
faci
liti
es,
w
iden
eing
of
roa
ds, p
rovi
sion
of
com
muni
ty
fa
cili
ties
and
tra
nsit
cam
pu e
tc.
R.G.GuptaCity/Policy Planner
Master Plan For Delhi 1957, Volume-II, PART - 3
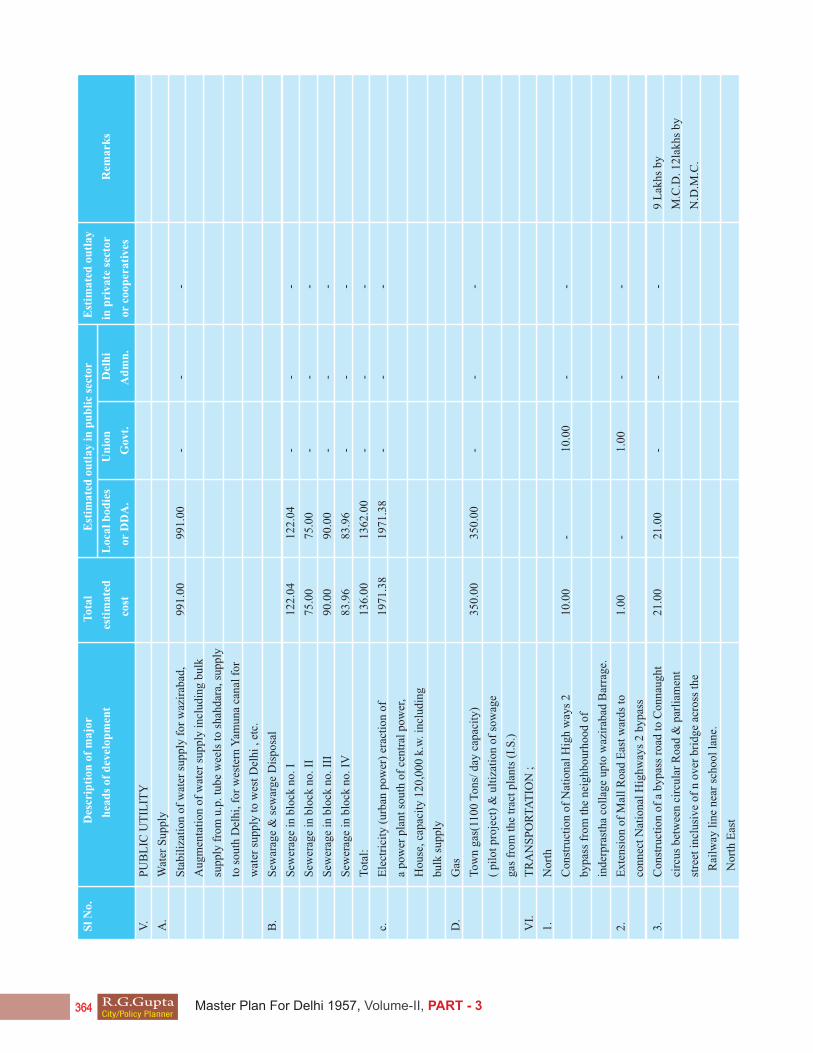
V.
PU
BL
IC U
TIL
ITY
A.
Wat
er S
uppl
y
S
tabi
liza
tion
of
wat
er s
uppl
y fo
r w
azir
abad
, 99
1.00
99
1.00
-
- -
A
ugm
enta
tion
of
wat
er s
uppl
y in
clud
ing
bulk
su
pply
fro
m u
.p. t
ube
wee
ls t
o sh
ahda
ra, su
pply
to
sou
th D
elhi
, for
wes
tern
Yam
una
cana
l fo
r
w
ater
sup
ply
to w
est
Del
hi ,
etc.
B.
Sew
arag
e &
sew
arge
Dis
posa
l
S
ewer
age
in b
lock
no.
I
12
2.04
12
2.04
-
- -
S
ewer
age
in b
lock
no.
II
75
.00
75.0
0 -
- -
S
ewer
age
in b
lock
no.
III
90.0
0 90
.00
- -
-
S
ewer
age
in b
lock
no.
IV
83.9
6 83
.96
- -
-
T
otal
:
136.
00
1362
.00
- -
-
c.
Ele
ctri
city
(ur
ban
pow
er)
erac
tion
of
19
71.3
8 19
71.3
8 -
- -
a
pow
er p
lant
sou
th o
f ce
ntra
l po
wer
,
H
ouse
, cap
acit
y 12
0,00
0 k.
w. i
nclu
ding
bu
lk s
uppl
y
D.
Gas
T
own
gas(
1100
Ton
s/ d
ay c
apac
ity)
35
0.00
35
0.00
-
- -
(
pilo
t pr
ojec
t) &
ult
izat
ion
of s
owag
e
ga
s fr
om t
he t
ract
pla
nts
(I.S
.)
VI.
T
RA
NS
PO
RT
AT
ION
;
1.
Nor
th
C
onst
ruct
ion
of N
atio
nal
Hig
h w
ays
2
10.0
0 -
10.0
0 -
-
by
pass
fro
m t
he n
eigh
bour
hood
of
in
derp
rast
ha c
olla
ge u
pto
waz
irab
ad B
arra
ge.
2.
Ext
ensi
on o
f M
all
Roa
d E
ast
war
ds t
o
1.00
-
1.00
-
-
co
nnec
t N
atio
nal
Hig
hway
s 2
bypa
ss
3.
Con
stru
ctio
n of
a b
ypas
s ro
ad t
o C
onna
ught
21
.00
21.0
0 -
- -
9 L
akhs
by
ci
rcus
bet
wee
n ci
rcul
ar R
oad
& p
arli
amen
t
M
.C.D
. 12l
akhs
by
st
reet
inc
lusi
ve o
f n
over
bri
dge
acro
ss t
he
N
.D.M
.C.
R
ailw
ay l
ine
near
sch
ool
lane
.
N
orth
Eas
t
Sl
No.
Des
crip
tion
of
maj
or
T
otal
Est
imat
ed o
utl
ay i
n p
ub
lic
sect
or
Est
imat
ed o
utl
ay
h
ead
s of
dev
elop
men
t
est
imat
ed
Loc
al b
odie
s
U
nio
n
Del
hi
i
n p
riva
te s
ecto
r
R
emar
ks
co
st
or
DD
A.
Gov
t.
A
dm
n.
or
coo
per
ativ
es
R.G.GuptaCity/Policy Planner
Master Plan For Delhi 1957, Volume-II, PART - 3

Sl
No.
Des
crip
tion
of
maj
or
T
otal
Est
imat
ed o
utl
ay i
n p
ub
lic
sect
or
Est
imat
ed o
utl
ay
h
ead
s of
dev
elop
men
t
e
stim
ated
L
ocal
bod
ies
Un
ion
D
elh
i
in
pri
vate
sec
tor
Rem
ark
s
co
st
or
DD
A.
Gov
t.
A
dm
n.
or
coo
per
ativ
es
1.
Con
stru
ctio
n of
a p
orti
on o
f ex
tens
ion
15
.00
8.00
7.
00
- -
Uni
on G
ovt.
7 L
akhs
to
nat
iona
l hi
ghw
ay 1
0 w
hich
is
prop
osed
to
M.C
.D. =
8 L
akhs
ru
n so
uth
of w
este
rn Y
amun
a ca
nal,
inc
lusi
ve
of
the
bri
dge
over
Roh
tak
Roa
d.
2.
Con
stru
ctio
n of
a R
oad
link
ing
Rin
g R
oad
4.00
-
4.00
-
-
w
ith
prop
osed
ext
ensi
on o
f N
atio
nal
H
ighw
ay 1
0 &
run
ning
nor
th w
est
o
f w
azir
apur
.
3.
Con
stru
ctio
n of
a r
oad
alon
g N
ajaf
Gar
h
4.00
-
4.00
-
-
N
ala
& l
inki
ng G
. T. K
arna
l R
oad
wit
h th
e
ro
ad p
ropo
sed
in i
tem
No.
2
4.
Wid
enin
g of
pam
bari
Roa
d be
twee
n
1.00
1.
00
- -
-
G
. T. K
arna
l R
aod
& M
all
Roa
d
S
outh
.
1.
Con
stru
ctio
n of
a m
ajor
roa
d ea
st o
f 11
00
3.00
-
- 3.
00
-
a
cre,
lin
king
Rin
g R
oad
to t
he p
ropo
sed
ex
tens
ion
of c
hirg
ea D
elhi
Roa
d.
2.
Con
stru
ctio
n of
a r
oad
link
con
nect
ing
2.00
-
2.00
-
-
qu
tab-
Meh
raul
i R
oad&
pas
sing
sou
th
of
Hau
z K
has
Tan
k
3.
Con
stru
ctio
n of
a m
ajor
roa
d li
nkin
g R
ing
5.00
-
- 5.
00
-
R
oad
to t
he c
hria
ge D
elhi
Roa
d &
pas
sing
a
djac
ent
to M
asji
d M
oth
4.
Con
stru
ctio
n of
sub
art
eria
l ro
ad a
long
wes
t 15
.00
- -
15.0
0 -
of
Okh
la I
ndus
tria
l E
stat
e li
nkin
g B
adar
pur
R
oad
to c
hira
g R
oad
& D
lhi
Roa
d
5 C
onst
rict
ion
of a
lin
k be
twee
n
0.5
0.5
- -
-
w
elle
sely
Roa
d &
Lod
hi R
oad
E
ast
C
onst
ruct
ion
of a
ppro
ach
road
to
he
15.0
0 -
15.0
0 -
-
pr
opos
ed Y
amun
a B
ridg
e ne
ar H
amay
un
T
omb
conn
ecti
ng L
odhi
Rd.
2.
Con
stru
ctio
n of
a p
erm
anen
t li
nk b
etw
een
15.0
0 -
15.0
0 -
-
R.G.GuptaCity/Policy Planner
Master Plan For Delhi 1957, Volume-II, PART - 3
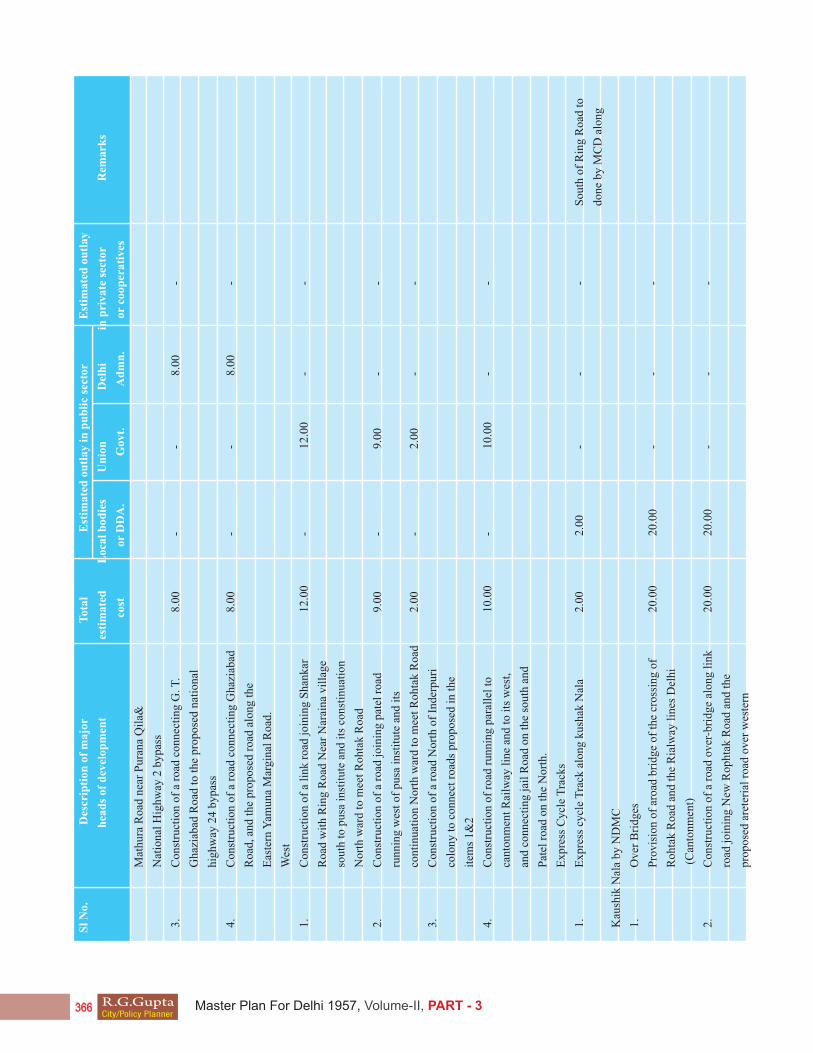
Sl
No.
Des
crip
tion
of
maj
or
T
otal
Est
imat
ed o
utl
ay i
n p
ub
lic
sect
or
Est
imat
ed o
utl
ay
hea
ds
of d
evel
opm
ent
est
imat
ed
Loc
al b
odie
s
U
nio
n
Del
hi
i
n p
riva
te s
ecto
r
R
emar
ks
co
st
or
DD
A.
Gov
t.
A
dm
n.
or
coo
per
ativ
es
M
athu
ra R
oad
near
Pur
ana
Qil
a&
N
atio
nal
Hig
hway
2 b
ypas
s
3.
Con
stru
ctio
n of
a r
oad
conn
ecti
ng G
. T.
8.00
-
- 8.
00
-
G
hazi
abad
Roa
d to
the
pro
pose
d na
tion
al
hi
ghw
ay 2
4 by
pass
4.
Con
stru
ctio
n of
a r
oad
conn
ecti
ng G
hazi
abad
8.
00
- -
8.0
0 -
R
oad,
and
the
pro
pose
d ro
ad a
long
the
E
aste
rn Y
amun
a M
argi
nal
Roa
d.
W
est
1.
Con
stru
ctio
n of
a l
ink
road
joi
ning
Sha
nkar
12
.00
- 12
.00
- -
R
oad
wit
h R
ing
Roa
d N
ear
Nar
aina
vil
lage
so
uth
to p
usa
inst
itut
e an
d it
s co
nsti
nuat
ion
N
orth
war
d to
mee
t R
ohta
k R
oad
2.
Con
stru
ctio
n of
a r
oad
join
ing
pate
l ro
ad
9.00
-
9.00
-
-
ru
nnin
g w
est
of p
usa
inst
itut
e an
d it
s
co
ntin
uati
on N
orth
war
d to
mee
t R
ohta
k R
oad
2.00
-
2.00
-
-
3.
Con
stru
ctio
n of
a r
oad
Nor
th o
f In
derp
uri
co
lony
to
conn
ect
road
s pr
opos
ed i
n th
e
it
ems
1&2
4.
Con
stru
ctio
n of
roa
d ru
nnin
g pa
rall
el t
o
10.0
0 -
10.0
0 -
-
ca
nton
men
t R
ailw
ay l
ine
and
to i
ts w
est,
an
d co
nnec
ting
jai
l R
oad
on t
he s
outh
and
P
atel
roa
d on
the
Nor
th.
E
xpre
ss C
ycle
Tra
cks
1.
Exp
ress
cyc
le T
rack
alo
ng k
usha
k N
ala
2.00
2.
00
- -
- S
outh
of
Rin
g R
oad
to
done
by
MC
D a
long
Kau
shik
Nal
a by
ND
MC
1.
Ove
r B
ridg
es
P
rovi
sion
of
aroa
d br
idge
of
the
cros
sing
of
20
.00
20.0
0 -
- -
R
ohta
k R
oad
and
the
Ria
lway
lin
es D
elhi
(
Can
tonm
ent)
2.
Con
stru
ctio
n of
a r
oad
over
-bri
dge
alon
g li
nk
20.0
0 20
.00
- -
-
ro
ad j
oini
ng N
ew R
opht
ak R
oad
and
the
pr
opos
ed a
rete
rial
roa
d ov
er w
este
rn
R.G.GuptaCity/Policy Planner
Master Plan For Delhi 1957, Volume-II, PART - 3
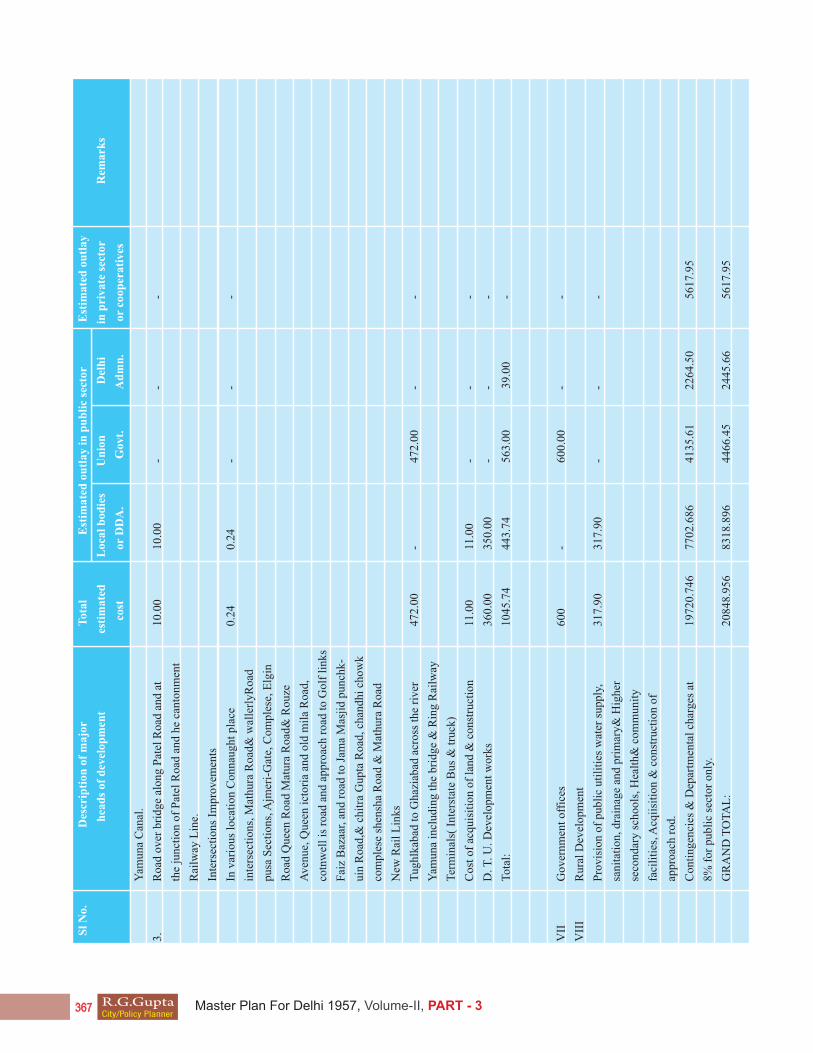
Sl
No.
Des
crip
tion
of
maj
or
T
otal
Est
imat
ed o
utl
ay i
n p
ub
lic
sect
or
Est
imat
ed o
utl
ay
h
ead
s of
dev
elop
men
t
e
stim
ated
L
ocal
bod
ies
Un
ion
D
elh
i
in
pri
vate
sec
tor
Rem
ark
s
co
st
or
DD
A.
Gov
t.
A
dm
n.
or
coo
per
ativ
es
Y
amun
a C
anal
.
3.
Roa
d ov
er b
ridg
e al
ong
Pat
el R
oad
and
at
10.0
0 10
.00
- -
-
th
e ju
ncti
on o
f P
atel
Roa
d an
d he
can
tonm
ent
R
ailw
ay L
ine.
In
ters
ecti
ons
Impr
ovem
ents
In
var
ious
loc
atio
n C
onna
ught
pla
ce
0.24
0.
24
- -
-
in
ters
ecti
ons,
Mat
hura
Roa
d& w
alle
rlyR
oad
pu
sa S
ecti
ons,
Ajm
eri-
Gat
e, C
ompl
ese,
Elg
in
R
oad
Que
en R
oad
Mat
ura
Roa
d& R
ouze
A
venu
e, Q
ueen
ict
oria
and
old
mil
a R
oad,
co
tnw
ell
is r
oad
and
appr
oach
roa
d to
Gol
f li
nks
F
aiz
Baz
aar,
and
roa
d to
Jam
a M
asji
d pu
nch
k-
ui
n R
oad,
& c
hitr
a G
upta
Roa
d, c
hand
hi c
how
k
co
mpl
ese
shen
sha
Roa
d &
Mat
hura
Roa
d
N
ew R
ail
Lin
ks
T
ughl
kaba
d to
Gha
ziab
ad a
cros
s th
e ri
ver
47
2.00
-
472.
00
- -
Y
amun
a in
clud
ing
the
brid
ge &
Rin
g R
ailw
ay
T
erm
inal
s( I
nter
stat
e B
us &
tru
ck)
C
ost
of a
cqui
siti
on o
f la
nd &
con
stru
ctio
n
11.0
0 11
.00
- -
-
D
. T. U
. Dev
elop
men
t w
orks
36
0.00
35
0.00
-
- -
T
otal
:
1045
.74
44
3.74
56
3.00
3
9.00
-
VII
G
over
nmen
t of
fice
s
600
- 60
0.00
-
-
VII
I
Rur
al D
evel
opm
ent
P
rovi
sion
of
publ
ic u
tili
ties
wat
er s
uppl
y,
317.
90
317.
90
- -
-
sa
nita
tion
, dra
inag
e an
d pr
imar
y& H
ighe
r
se
cond
ary
scho
ols,
Hea
lth&
com
mun
ity
fa
cili
ties
, Acq
iisi
tion
& c
onst
ruct
ion
of
ap
proa
ch r
od.
C
onti
ngen
cies
& D
epar
tmen
tal
char
ges
at
1972
0.74
6 77
02.6
86
4135
.61
2264
.50
5617
.95
8%
for
pub
lic
sect
or o
nly.
G
RA
ND
TO
TA
L:
20
848.
956
8318
.896
44
66.4
5 24
45.6
6 56
17.9
5
R.G.GuptaCity/Policy Planner
Master Plan For Delhi 1957, Volume-II, PART - 3

Table 3.
Estimates of operational and maintenaces costs of Master plan programme included for the period 1961-1966.
Table 4
Estimated Revenue from Master Plan Programmes for the period 1961-1966.
Sl. No. Description Total maintenance and Distribution M&O costs among various Agencies
operational cost for Local Bodies Union Delhi
1961-66 or D.D.A. Government Administration.
I PUBLIC OWNED BUILDINGS
(a) Low increase group housing 56.880 56.880 - -
(b) Government Housing 190.926 - 190.926 -
Sub-total 247.806 56.880 190.926 -
II COMMUNITY FACILITIES
(a) Educator 293.990 - - 293.990
(b) Health 58.250 26.000 - 32.250
(c) Other Amenities 17.247 17.247 - -
Sub-total 369.487 43.247 - 326.240
III PUBLIC UTILITY
(a) Water Supply 164.00 164.00 - -
(b) Seweage 123.470 123.470 - -
(c) Town and Sewage Gas 717.500 717.500 - -
Sub-total 1183.97 1183.97 - -
iV TRANSPORTATION 92.50 39.25 49.80 3.45
V GOVERNMENT OFFICES 41.25 - 41.25 -
TOTAL: 1935.013 1323.347 281.976 329.690
Sl. No. Description Revenue for the Distribution of revenue among different agencies
Period 1961-66 Local Bodies Union Delhi
of D.D.A. Government Administration.
I. LAND ACQUISITION & DEVELOPMENT
a) Residential 1665.45 227.45 - 1638.00
b) Industrial 719.99 476.99 - 243.00
c) Commercial 452.00 399.00 - 113.00
Sub total: 3037.44 1043.44 - 1994.00
II. RENT FROM PUBLIC OWNED BUILDINGS
a) Flatted factories 116.00 116.00 - -
b) Squatters and slum dwellers housing 65.63 65.63 - -
c) Government housing 129.60 - 129.60 -
Sub total: 311.23 181.63 129.60 -
III. COMMUNITY FACILITIES
a) High schools 220.50 - - 54.00+166.50
b) Collages 53.80 - 15.00+38.80
c) Health centres 3.90 3.90 - -
d) Hospitals 70.02 1.75 - 5.27+63.00
SUB-TOTAL: 348.22 5.65 53.80 288.77
R.G.GuptaCity/Policy Planner
Master Plan For Delhi 1957, Volume-II, PART - 3
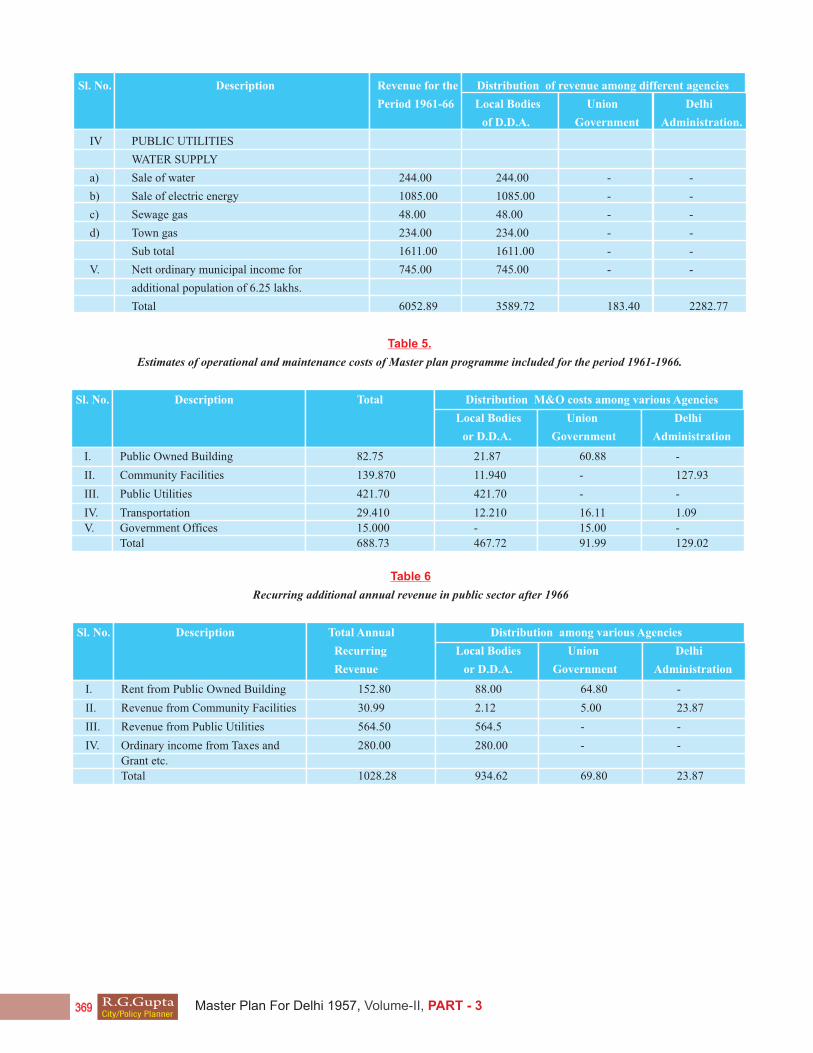
Sl. No. Description Revenue for the Distribution of revenue among different agencies
Period 1961-66 Local Bodies Union Delhi
of D.D.A. Government Administration.
IV PUBLIC UTILITIES
WATER SUPPLY
a) Sale of water 244.00 244.00 - -
b) Sale of electric energy 1085.00 1085.00 - -
c) Sewage gas 48.00 48.00 - -
d) Town gas 234.00 234.00 - -
Sub total 1611.00 1611.00 - -
V. Nett ordinary municipal income for 745.00 745.00 - -
additional population of 6.25 lakhs.
Total 6052.89 3589.72 183.40 2282.77
Table 5.
Estimates of operational and maintenance costs of Master plan programme included for the period 1961-1966.
Sl. No. Description Total Distribution M&O costs among various Agencies
Local Bodies Union Delhi
or D.D.A. Government Administration
I. Public Owned Building 82.75 21.87 60.88 -
II. Community Facilities 139.870 11.940 - 127.93
III. Public Utilities 421.70 421.70 - -
IV. Transportation 29.410 12.210 16.11 1.09
V. Government Offices 15.000 - 15.00 -
Total 688.73 467.72 91.99 129.02
Table 6
Recurring additional annual revenue in public sector after 1966
Sl. No. Description Total Annual Distribution among various Agencies
Recurring Local Bodies Union Delhi
Revenue or D.D.A. Government Administration
I. Rent from Public Owned Building 152.80 88.00 64.80 -
II. Revenue from Community Facilities 30.99 2.12 5.00 23.87
III. Revenue from Public Utilities 564.50 564.5 - -
IV. Ordinary income from Taxes and 280.00 280.00 - -
Grant etc.
Total 1028.28 934.62 69.80 23.87
R.G.GuptaCity/Policy Planner
Master Plan For Delhi 1957, Volume-II, PART - 3

Development goals do not conceive themselves. Neither do they carry their own approval; nor will they implement themselves. On the contrary, these are the central tasks of planning administration, for which explicit provision must be made in plane themselves.
In the present chapter, such explicit provision is attempted. The first section describes some of the administrative characteristics of planning. The second traces these characteristics to certain minimal orgenisational, procedural and legal requirement: and a third section examines at length the fundamental problem of planning jurisdiction. The last section sets forth the policies and decisions which are to regulate the adthe administration of this Master plan.
Administrative characteristics of planning :
The role of administration is remarked in the Third Five Year plan, where concerning the national plan, it is declared :
The task is large its administrative implications are vast and call for the highest standards …. . Effective implementation requires the maximum mobilization of resources, adaptation to changing needs, coordination and concentration of resources ….., ability to anticipate difficulties and problems, readiness to seize upon favourable opportunities for growth and above all, men of skill and knowledge , and organizations attuned to the objectives of the plan. So also with the plan for the nation capital.
That these are some of the administration implications of the national plan and of the Delhi Master plan, alike, is attributable fundamentally, to certain characteristics of the planning process, and of plans.
As a technique of governmental action, planning may be said to involve, first, a series of stages of administrative activity, carried on primarily by different agencies. Where no plans have existed before, planning must mean at the outset their (1) preparation by professional and technical staff. As a second step (2) sanctioning by the appropriate governments authority is required. When plans have been brought legally into effect, their (3) implementation by, or under the supervision of action agencies may go forward.
But whereas in this sequence, there are initially three distinct stages in planning, ones some plans are in effect, the satges tend to merge into a single process. Some plans are being made, while others are being implemented, the process of implantation creates new conditions which entail the preparation of new plans: and unexpected conditions inevitably arise which call for the revision of outstanding plans : and plans sanctioned must be resanctioned each year, I effect through work programme and budgetary allotments, until they are satisfactorily completed or absorbed in fresh plans.
Planning, thus, does not signify a single stage of activity, the preparation of plans. It also signifies sanctioning, and also again implementation. Planning is a continuous process. This is not merely to say that plan- preparation is a repetitive task, which indeed it is.
CHAPTER - SIXTEEN
PLANNING ADMINISTRATION
Nor is it to say that plan- sanctioning and implementation are repetitive, which they are too. It is rather t reveal that planning is a continuum, a seamless process of preparation, sanctioning, and implementation.
Planning also has certain characteristics as actual activity itself, irrespective of the relationship of its stages in time. To major extent, plan-preparation entails activity which, broadly, may be characterized as research. The facts that bear on the development of the planning area must be chosen and complied. Future needs and resources must be estimated. Development objectives, as related to estimates of needs and resources, must be conceived. on the other hand, the activities of plan-sanctioning partakes more of the nature of legislation than of primary research. Savnctioning entails the review and, ultimately, the authoritative choice of objectives. It involves the activities of deliberation, the testing of policy already proposed.
It is essential at this point to the clear concerning the application to planning of the doctrine of the separation of powers. Inherently, the sanctioning of a plan is a quasi-legislative at: for thereby public policy is made. But in the practical interdependence of the legislative and administration must perform a kay role in shaping and advising government concerning the implications of plan proposals. Moreover, plans must be interpreted, and the point is reached in the devolution of plans when approval is given by administrative officers. Both as pertains to master plan and subordinate plans, there is a major administrative component in the activity of sanctioning.
Plan-implementation, finally, involves activities that translate into action, that execute, rather than conceive, formulate, or approve. Implementation is uniquely administrative-so much so that it often is mistaken for the whole of planning administration. It involves all of the acte action by public authorites which are required to yield in definitive from the result which the sanctioned plan contemplates. In parts of some plans, regulatory measures may be entailied. In others, implementation may require direct governmental development. Most however, plans require both regulatory and developmental activities: and master plan for met5ropolitan areas require a full range of governmental functions for their effectuation.
Plans, therefore, also possess certain basic administrative characteristics. First, it is essential to appreciate that metropolitan physical planning, like other planning, involves plans, not a plan. Here the point is not that single plan must be prepared repetitively, but rather that multiple plans are required. Plans may be distinguished by order: master plans : subordinate or precise plans, and many grades of the latter.
The effect, scope, and authority of these types of plans is also differentiated. Whatever the combination required in a given setting, the master plan is master: it is the broadest, longest, and highest of the hierarchy of plans. Broadest in the sense that its scope over developmental factors is greatest, it is longest in its-time –period; and highest in that it controls and binds all other plans pertaining to
R.G.GuptaCity/Policy Planner
Master Plan For Delhi 1957, Volume-II, PART - 3
the same factors. Precise plans are within a wide range, relatively short- termed, limited, and detailed.
But perhaps the most vital feature of a plan pertains to its substantive character. A plan is a programme. This characteristic is related to the stages of planning, the continuity of the planning process, and of the hierarchy of plans just stated. To be capable of implementation, a plan has to be a programme; it cannot be a map or blueprint, or a sketch of a completed installation or described condition. It is the intervening activities which comprise the essential substance of a plan, the things that have to occur between the statement of a plan goal and the concrete result. Implicitly, therefore, a plan may be said to incorporate the activity which is required for its implementation. Before a plan can become a reality, what was implicit must be made explicit. That, it may be seen, is the task of planning administration.
Administrative Requirements of planning
The importance of these fundamental administrative characteristics is immensely practical. They give rise to certain institutional requirements. These requirements may, in turn, be shown in their organizational, procedural, and legal aspects within the stages of the planning process.
Plan-preparation:
One such organizational requirement, immediately apparent, is that plan-preparation demands many planning agencies. The task of preparing the essential plans for the development of a Moreover, at appropriate levels among action agencies, some organizations must have the exclusive job of preparing plans. Yet more important, some central authority must exist to integrate specific plans and prepare an overall or master plan for the area in which development is to be controlled. This pattern, utilized by the nation for its Five Year las, is also required for metropolitan planning.
This institutional result is related primarily to the characteristics of plans. The Master plan, it will be recalled, is only one of the plans needed for planned development. The Master plan has essential sccpoe and function. Its preparation involves skills and perspectives not normally available or required for the preparation of precise plans, especially the most limited of these. On the other hand, the proper preparation of precise plans is more efficiently done elsewhere in the governmental structure. Plan – making by action agencies at various levels is apt to be done by persons more expert in the techniques of the agency programme; it is done in closer awareness of the needs and requirements of the persons affected; and it tends to be practical, insofar as it is heavily influenced by the problems of implementation.
Another consideration here pertinent is that if the master plan is properly prepared and kept up to date in the face of the events that require its continuous revision, the overall plan-making agency may be fully occupied with the complex question of general policy. In the process of control, it should be quite unnecessary for the master plan- making to prepare precise plans, although it mat do so in some circumstances in default of other agencies or as a master of efficient work division. The master plan is controlling, and embraces the key factors of development.
In view of the fact that plans are programmes, it is altogether probable that no single plan- making agency could, in any event, sever the plan-making needs of a metropolitan area. Such an agency
would have to duplicate the skills, knowledge, and experience of the rest of the administrative structure, an arrangement neither feasible nor desirable.
These organizational needs are correlative to certain procedural requirements for effective plan preparation. The operation of many plan –making agencies for sectors and functions in the same metropolitan area would call for constant and systematic communication among them. With even as few as four of these agencies, many primary communication combinations may emerge. But, ordinarily, acores of action units an separate authorities function in the metropolitan area: so the combination are increased, progressively. Such conditions make it clear that not only mmust such communications among units at the same level take place: but in order for the overall or master-plan making agency to be informed, it must be included within this network and be connected to other exclusively plan- making agencies.
At this point, it must be recalled that the planning process is a continuum, and that implementation also effects plan-making, aside form the division of lavour in plan-making itself. Further, it must be appreciated that subordinate plans must be flitted into the master plan. If the facts of perspective concerning the levels of plan- making are accurate, and the complexities of communication so great, then an action agency may not know if its plans conform to the master plan. For that matter, the master plan may be so general on a particular point as to permit several reasonable agency will require procedure for securing information by investigation and inspection.
The master of the central registration of information moves the issue of procedure only one step, however, if the master plan is to be master, if plan –making by many agencies is to be coordinated, then the overall agency must be empowered to bring partial and short-range plans into concert, both insofar as these plans may form components of the master plan itself and also as they extend and specify it. Obviously, this must be done in the preparation, stage, before plans are sanctioned.
Legally, these considerations require that many agencies be empowered to participate in plan –making. The enabling specification must also ensure that powers to appropriate to the kind of planning in which each agency should be competent to participate. Noe matter how many subordinate plan-making agencies, this implies a single master plan-making authority.
Accurate provision would also have to be made for the definition of the master and the principal precise plans, and for the status and application of each class of plans. A great many procedures for the communication, review, and revision of precise plans by the overall plan-making agency would have to be written into legislation and rules and regulations. In main effect, this means that the overall agency must be equipped with large investigative, interpretative, and directive powers.
Plan-Sanctioning
It should be evident why not one, but overall, authorities are required for the sanctioning of plans. Not only are a great many plans required for metropolitan planning, which by itself might indicate a rational for metropolitan planning, which by itself might might indicate a rational distribution of work, but the order of plans is such that sanctioning must be correlated with governmental perspective and with responsibility. In effect, better sanctioning is performed when done by various governmental levels.
R.G.GuptaCity/Policy Planner
Master Plan For Delhi 1957, Volume-II, PART - 3
Since a plan must be a programme, it cannot be reasonably approved except insofar as it can be evaluated. This would mean that local bodies within a metropolitan area should not approve plans for the entire area, if for no other reason than because the plan could not be well-sanctioned, i.e. appraised and tested. Obversely, many subordinate polans whose effect is restricted within a single locality should not be sanctioned at the metropolitan level, for neither would they be well-sanctioned several sanctioning authorities are required; but the right agency must approve the right plan.
Whilst on this ground there is an organizational relationship between plan-making and sanctioning, it is not a 1 to 1 ratio. The expertise required for review is not the same as that needed for preparation, while the perspective needed for sanctioning is wider. Since the extent that the sanctioning level is higher than the into harmony before they are approved.
Other considerations require fewer sanctioning authorities. Then it is necessary to delegate sanctioning power, the number of delegates should be kept to be a minimum. A sanctioning authority must also stand in a certain relation to the implementing agencies. Since approval of a plan is a mendate to execute it, the approving authority must hierarchically be situated so as to be able to enforce its will.
The review of a plan is, in the proper sense of the term, a political assessment of the effective consent for its goals, and the methods of their achievement. Although representative and electoral processes are the ultimate channels of political attitudes, advisory bodies of private and officials nominees are valuable adjuncts.
While several sanctioning authorities are needed, one overall authority must exist to sanction the master plan. That authority, it is now clear, must have jurisdiction in the entire area included in the plan. Evidently as well, it must be competent over the subjects of development covered. The overall sanctioning authority must be able constitutionally and organizationally to mandate compliance by those public and private parties who may be called upon for implemenation.
Procedurally, plan-sanctioning also has certain minimal requirements. Processes must exist to ensure that appropriate draft plans are referred to affected agencies for their advice. This applies most emphatically to the master plan. Public notice needs also be given, and hearings conducted to evaluate objectives and to measure consent. Procedures for debate and revision are required. The procedural requirements of due process, as it were, must be satisfied. And inasmuch as plan-sanctioning is a repetitive activity, and plans are programme, provision must be made t the appropriate level of government for the re-sanctioning of plans through the implementation process, and for amendment.
These organizational and procedural requirements must be reflected legally. This implies at least that the sanctioning authorities must be empowered top perform the sanctioning function. The lagal effect of approving a plan must be spelled-out.
The jurisdiction of the several sanctioning authorities must be fixed, and distinguished. Due process, it may be noted, is legal process.
PLAN- Implementation
The multiplicity of governmental agencies required in the preparation and sanctioning stages of planning continues through the implementing than sanctioning authorities. And in the practical definition of an organizational unit, there are more implementing than preparing agencies. This latter ratio is a simple consequence of the normal balance between the managerial and executive components of administration: there is more productive work to be done than supervision required.
But in implementation, organizational re;lationship are perhaps even more important. For, as pointed out in the passage from the Third Five Year plan, implementation requires the maximum mobilization of resources, their coordination and concentration, anticipation of problems, adaptation to changing circumstances, and so on. Implementation is on the ground, so to speak, where schedules, quantities, skills, and the other stuff of development meet.
This multiplicity of implementing agencies would, alone, demand an overall coordinating organizations. But the more important factor has to do not with number of units so much as with the interdependence of their activities. Even in a single municipal organization, lapses must be prevented : roads must not be widened until utility poles can be moved; bus waiting shelters should not e built long before streets can be widened; ditches ought not be dug before pipes can be procured; or houses constructed before basic amenities can be supplied, et cetera. Since the development of a metropolitan area involves implementation by many units, functioning with different perspectives on different governmental levels, an overall agency to oversee this entire development process is indispensable.
Part of the force of this requirement derives from the conditions that produce different kinds of plans. The master plan, as remarked earlier is not and cannot be detailed; it must e general and long-range. Therefore, it must be interpreted from an overall point of view, and cannot be turned over to implementing agencies, as if the stages of the planning process were insulated.
In this connection, the key to right form is supplied by the sanctioning function. Since functioning constitutes direction to carry out a plan, implementation is, in this sense, performed on behalf of the sanctioning authority. Coordination of that implementation is in behalf of the same authority. The overall coordinating agency performs essentially a reporting and intelligence role. It does not/speak of its own right, but for its principal. This theoretical point has many important results, among them that directions must come from the sanctioning authority: and disagreements between the coordinating and implementing agencies may finally be resolved by the sanctioning authority.
The relation of the plan-preparing function and the implementing function to plan sanctioning are, therefore, somewhat different. The dependency of implementation is greater, quite aside from the consideration that it occurs later. Plan-preparation may be done in greater freedom, for the directive power of the state is still withheld. The ordinary organizational concepts of staff are more appropriate to the role of the overall agency in the preparation stage: while those of agency pertain more accurately to implementation. That the same unit may usually best perform both coordinating roles is a repose to the continuity of the planning process. Plan-preparation and implementation, alike, benefit from this combination of roles.
R.G.GuptaCity/Policy Planner
Master Plan For Delhi 1957, Volume-II, PART - 3

One combination which is not inherently beneficial, however, is the merger of the planning and development roles. This is because of the lack of real interdependence between the activity involved. Direct development does not entail the point of view or the professional skills required for overall planning, and vice versa. Any combination is likely to be formal only, with functionally separate planning and development wings in the organization which unites them. The reasons for having a development agency part from regular action agencies probably have to do more with weaknesses of those agencies than with the inherent strength of the planning-development combination.
The procedural requirements for effective plan-implementation are yet more extensive and exacting than for preparation. As there as more agencies involved, the ordinary problems of communication are greater. Further, for given projects, implementation is the end of the cycle; and the correction of mistake or misunderstanding at that point is often prohibitively costly. On behalf of the sanctioning authority, the overall coordinating agency must receive, through systematic processes, information indicating the status of projects and disclosing the policies of implementation. The force of this requirement is, of course, related to the type of the plan involved and to the effectiveness of the intermediate coordinating agencies.
The legal consequence of this condition is that every agency must be amply empowered to fulfil its implementation role. In somewhat more specific terms, this means that the relevant statutory instruments must establish the formal relationship of the overall coordinating agency to the sanctioning authority as suggested above. The overall agency must be given powers to ensure that it is informed concerning plan progress and problems. While it is normally clear that the sanctioning authority has power to interpret and to mandate compliance with its approved plan, no doubt about it should be left in law. The entire network of laws through which developments plans are implemented must be harmonized.
Finally, certain general institutional requirements must be remarked. All of the aspects and phases of planning administration are important but if one particular phase may be more vital than another, it is what may be termed the middle phase. Between the conception of plans and their realization lie a vast number of managerial activities. These have to do with such things as ensuring that the master plan is in fact worked out into conforming subordinate plans ; with the systematic coordination of inter- governmental plan- making; with the promulgation of standards of development; it the adequate staffing of planning agencies; with the constructive solution of individual cases through legal process- all of the critical supporting actions without which master plans are by themselves worthless. Tall plans are easily made; but the middle levels of planning may be the most difficult to scale.
The importance of the administrative characteristics of planning, and plans, may now be clear. The fact is that they have practical institutional consequences. As such, they obtain in setting other than Delhi, and supply some of the essential standards of design for planning administration.
The problem of a metropolitan jurisdictions
It is evident from the preceding discussion, that one of the key institutional requirements for effective planning in any intergovernmental setting is an adequate jurisdiction for on overall sanctioning authority. Since plan- preparation and implementation are, as it were dependent variables, the reach of the sanctioning authority is crucial.
This question, it should be disclosed, has posed a basic dilemma for the Delhi Master plan. The sides of that dilemma are represented by what may be called functional requirements on the one hand, and the claims of national policy, on the other. So basic and persistent has been this conflict that it ought to be discussed in extenso.
The overwhelming force of the preceding technical chapter is to show that within the Metropolitan Area, a balanced development of the central city, and its surrounding municipalities, and their rural interstices must be secured. Repeatedly, the functional analyses have proved that throughout the Area, the land use; the distribution of population; the patterns of habitation, employment, building, and circulation must be systematically controlled and directed for orderly and healthy growth. It has been revealed that failure to regulate these factors has already resulted in much damage to the capital potential development. That the vital utilities of water, sewerage, electricity, and transport must be supplied in accordance with a long-range works programme has also been demonstrated. Undeveloped land must in certain amenities must be provided according to a scheme of phased improvement.
However, the area in which these interdependent requirements must be met extends beyond the boundaries of the Union Territory of Delhi. Parts ofit its, as has been indicated in earlier chapters, within the stages of Uttar Pradesh and Punjab. Whilst the primary outlying jurisdictions are the two stages, the areas involved contain many subordinate jurisdictions, in all, partsof several districts, a number of tehsils and municipalities, and numerous villages are included. As may be expected, there is a great range of structural variation among these units; their resources, fiscal and administrative, also differ widely. The effect which the activities of individual units may have on the development of their areas is quite unequal.
To appreciate how directly and forcefully these facts bear on the issue of jurisdiction, one must revert to the administrative characteristics and institutional requirements of planning, set out above. As has been urged, only a master plan can embrace the key, long-range features of development: an overall agency, alone,, is able to prepare a master plan. But under the existing governmental organization, there is no overall plan-making agency, and no government has authority to prepare a master plan for the entire Metropolitan Area.
The real infirmity of this condition, however, is the absence of any authority to sanction such a plan. The Delhi Development Authority has no competence outside the Union Territory; nor does Delhi Administration; nor certainly do the local bodies. An overall plan for coordinated development could not be brought into force. There could be no overall supervision of implementation of plans that could not be sanctioned, or even prepared, on an overall basis.
The difficulty vividly is underlined by the contract between existing institutions within the Territory, and what may be done outside it. Within Delhi, an overall plan-making agency now prepares a master plan to supply a framework for the Union Territory only; however, as shown, there are numerous local bodies in the outlying areas. In Delhi the bulk supply of water, electricity, transit, and the main sewerage trunks are unified; but these integreating services do not now go beyond the Territorial borders. The problems of communication, coordination and so an, implicit in these facts are formidable.
R.G.GuptaCity/Policy Planner
Master Plan For Delhi 1957, Volume-II, PART - 3

The absence of any metropolitan institutions for planning raises, then, the question of informal cooperation. May not the many jurisdictions collaborate without a formal framework? Is the lack of power or machinery so serious as it may appear? Theoretically, of course, there is no reason why a metropolitan jurisdiction is essential. But some tentative theoretical considerations deserve mention.
The theoretical case seems supported by the recent action of Uttar Pradesh in the Ghaziabad Area. There the state Government, under the U.P.(Regulation of Building operations) Act, 1958 have designated Ghaziabad and its environs a regulated area, and have prepared a master plan. The master plan conforms in most respects to the proposals of the Delhi Development Authority. As constructive as is this action, it must be seen in the total context. Punjab has just started making plans for their sector of he Metropolitan Area. Further, it must be noted that the real test has not yet been reached in U.P. As previously shown, the problems of plan-making initially are mild indeed, in comparison with those of implementation.
However, to qualify its general adequacy, is not to depreciate this constructive development. The situation, however, falls short of requirements. The practical record of relations between improvement trusts and local bodies in India, the evidence from the other great cities of the world, point to the need of some deliberate provision.
The theoretical obstacles to intergovernmental coordination pertain to perspective and responsibility. Limited jurisdiction imposes limited perspective . citizens and officials concerned with problems which constitutionally or statutorily have been restricted to given area must be preoccupied with those matters, rather than those held in common with neighbors. One jurisdicition is not responsible for the welfare of another.
That this is true is not necessarily to be deplored. What it does mean, however, is that while limited inter-governmental cooperation may be achieved on specific developmental projects of immediate and obvious mutual benefit: overall continuous, and general collaboration is rather difficult to achieve.
Technical and functional needs are, however, not all. The fact is that considerations of national and constitutional significance require that present boundaries of states should not be disturbed. It may be appreciated that this general need has a special urgency with respect to the states around the nation capital. The force of the requirement to work within the existing jurisdictional framework is very great, indeed.
Several means may be used to combine jurisdiction, practically, if not formally, For example, one unit may exercise powers within the area of another, under certain circumstances. Many urban units in other countries have been so empowered. It is also possible primary units to federate, leaving their boundaries still unchanged, but creating a special agency to render a common service. This device, too has had extensive application in metropolitan areas abroad, Even more numerous are the various forms of association which may be joined for coordinated policies. The man thing is that whatever the device, coordination must be achieved, in the first instance, in the making of plans for the entire Metropolitan area and, ultimately, in the National Capital Region. Perhaps, the best and the most feasible arrangement would be a planning agency for the whole area created, by agreement obviously, under a statute.
Each participating planning body appoints one or more of its representatives on a joint planning commission. Whose formation is provided for in enabling-legislation. The joint commission is a planning body that has authority to create development schemes for the entire planning area.
There exists, then, theoretically a way in which the dilemma of jurisdiction may be avoided. The problem is not put aside. All of the institutional requirements of effective planning remain in force, as they must. Functional and financial means are involved, whereby an overall sanctioning jurisdiction practically may be approached.
This, indeed, is the course that Government have felt obliged to choose in this Master plan. Indirectly, fiscally, and by functional links, the technical claims for a metropolitan planning jurisdiction are sought to be satisfied. An approach toward a metropolitan jurisdiction is made. The proposal on this fundamental question forms the first plan policy set out in the next section.
Plan Policies and Decisions
In the light of the foregoing discussion of the characteristics and institutional requirements of planning and of the fundamental problem or jurisdiction, certain policies and decisions may now be elaborated for the administration of the Delhi Master plan. It will be seen that these policies and decisions are of two scopes: those that apply to the Metropolitan Area, and those that are restricted to the Territorial sector of that area.
A. Delhi Metropolitan Area
(1) An official planning area to be known as the Delhi Metropolitan Area and defined as indicated in the Report may be established.
(2) With jurisdiction throughout this Area, an officials joint planning agency, to be known as the Metropolitan planning council, may be created by statute.
(3) On this agency may sit representatives of the Government India, the States of Uttar Pradesh and Punjab, and the Union Territory of Delhi. The council may be served by a part- time secretary, to be appointed from the Delhi planning and Development Authority. It may engage its own staff,, and/or call upon the planning wings of the member bodies for professional or other personnel. The budget of the council may be assessed among member bodies by a formula to be fixed by the Government of India.
(4) It shall be the function of the Metropolitan planning council to advise member bodies concerning the planned development of the Metropolitan Area. To this end, the council shall be empowered to review, prior to sanctioning, ther master plan and or principal precise subdivisions, which affect the development of the Metropolitan Area. Similarly, the council may be empowered to receive re[orts and information, and to conduct investigations concerning plan –making and plan- implementation throughout the Area.
In all of its activities, the purpose of the council shall to be harmonize the policies and activities of member bodies in the best interests of the development of the entire Area.
(5) The Metropolitan planning Council shall be particularly
R.G.GuptaCity/Policy Planner
Master Plan For Delhi 1957, Volume-II, PART - 3
concerned to encourage the exploitation of devices of bilateral amd multi-lateral cooperation among member bodies, thagencies, and political sub-divisions. For this purpose, if may establish technical committess of the member planning wings: it may prepare and distribute model codes, standards, designs, ordinances, bye-laws; or do other thing which may be useful in promoting a unified approach to the planning of the Area.
As may be seen, it is envisaged that the Metropolitan planning Council will become the clearing house and centre of advice for dealing with the interstate aspects of the development of the Metropolitan Area. The council will be concerned with the preparation of coordinated major plans, and with the coordination of their implementation. The council, thus, may not only serve as a means to enable and ensure mutual consultation.
More important in supplying a position stimulus to planned development will be the role of the centre, in, through, and outside the council. The centre function in this regard must be carefully and imaginatively devised powers and the jurisdiction which it possesses, the Government of India become practically, if not formally, the overall sanctioning authority for the development of the Delhi Metropolitan Area.
Yet another prong of the attack on the problem of orderly development must come through cooperation outside the ambit of the Metropolitan planning council, as such. Although encouraged, and perhaps led; by the council, the local bodies themselves must make all possible use of the contract-for-services, administrative agreements, and other collaborative devices. Again, it mat be expected that local voluntarism may require a certain supplementation from the centre and the states.
Together, these measures may constitute intitial steps toward a metropolitan jurisdiction for planning in the capital of India. AS should be noted, the approach builds on the admirable initiatibe and example of Uttar Pradesh in the Ghaziabad sector. If all of the steps indicated here are taken vigorously, and in a progressive spirit, they may prove equal to the issue. If not, then alternatives may be considered.
Finally, it may be noted that many detailed and supporting measures will be wanted to carry forward the policies and decisions here stated. These measures should be taken with all deliberate speed.
B. Union Territory of Delhi
Within the Union Territory of Delhi, a further set of plan policies and decisions may obtain. These are elaborated below under heads that parallel the institutional requirements set out in section II preceding.
Plan- Preparation
In general, plan- preparation within the Union Territory shall be conducted as a shared, coordinated function. For the purposes of sharing, many plan –making agencies shall operate: for the purposes of coordination their formal and operational relationship shall be according to the pattern below;
(1) A plan-making agency, acting in behalf of the Union Government, shall exist with jurisdiction throughout the Territory. That agency may be the present Delhi Development
Authority, with an appropriate descriptive change in its designation to, the Delhi planning and Development Authority. The composition of the Authority, its internal organization and procedure, may remain as presently provided by law save for the addition of one planning member, to e appointed by the central Government.
(2) Broadly speaking, the Delhi planning and Development Authority shall be responsible for promoting and securing the development of the Territory according to plan. Specifically, the Authority shall be empowered to prepare and maintain a master plan and to ensure that all subordinate, precise plans prepared by other agencies whose activities affect the development of the Territory conform to that master plan..
(3) The above role and relationship will entail certain modifications in outstanding planning law in the Territory. The Delhi Development Authority is presently empowered by the Delhi Development Act, 1957 to prepare a master plan and zonal development plans. The maintenance of the master plan is, however, left to the rules providing for its amendment.
An overall plan cannot effectively be maintained by periodic amendment only, however. It is kept up to date through interpretations and directions which are reflected in precise plans. In their present form, atatutory provisions might be misunderstood as suggesting that the master plan is self-interpreting or self-fulfilling: and that once prepared, it can be left for a number of years until its amendment is called for.
Such, of course, is not the case: and the lacuna should be removed. This may be done appropriate provision empowering the Delhi planning and Development Authority to receive and to revise and amend where necessary the plans of other agencies when those plans fail to conform to the provision and intent of the master plan.
In both law and practice, this requires that the Authority be enabled to know the content of the plans of action- agencies. At the very least, this would entail that certain projects submitted by the local authorities and Union ministries and departments for inclusion in the national five year plans for the Territory be referred first to the Authority. Capital budgets and, in the absence of this budgetary device, capital projects included in revenue budgets should similarly be so referred for review and, where necessary, revision.
Also, the regulatory instruments of all action agencies affecting development should be liable to review, and hence must first be made available to the Delhi planning and Development Authority. Such instruments include development permissions, license, building permits, building and related codes, sub-division regulations, zoning regulations, and so an. A full inventory of such devices need not be given here, for the principle should be clear that the Authority must be informed concerning the plans madeby other agencies which may effect the development of the Territory, and must on behalf of the sanctioning authority be able to bring those plans into concert with the master plan.
To ensure that the master plan making agency has the information essential to its task, it shall be given a general power to call for the records, documents and materials of all other agencies operating in the Territory. Similarly, a general power to interpret the master plan for other agencies shall be provided in enabling statute.
R.G.GuptaCity/Policy Planner
Master Plan For Delhi 1957, Volume-II, PART - 3
On the other hand, the action agencies must be empowered to fulfil their plan- making roles where competence is now lacking. This requires a through and careful search of existing authority and its supplementation where gaps or absences are present. That investigation should be undertaken as soon as possible.
Central to the sharing and coordination of plan- preparation,, is a proper specification of the master and others plans shown to be required for planned development. In this respect, outstanding law will also require certain adjustments.
The general basis for the division of authority and responsibility in plan-making has been set out in section It. But it may be elaborated here that the master plan is the overall programmme, during the plan period, for the development of the Territory and consisting of the texts, maps, or other materials describing such programme sanctioned by the Government of India. The master plan shall state goals as to future population, the character and composition of the economic base of the Territory, its housing, industry, and commerce. The master plan shall specify in general terms the amount and type of amenities to be provided; the required standards of population density, light, air, openspacesthe means of transportation and communication and their inter-relation with various land uses. The master plan shall indicate the principal tasks, and their phasing, to be discharged by public authorities disclose the costs and financial resources proposed for these tasks: and set the broad conditions under which private development can be carried out in order to produce a satisfactory level of physical development and government services.
Qualified by these criteria, the master plan may deal with
(1) The location, character, extent, and development of streets or roads, rights of way, viaducts, bridges, waterways and waterfront developments, parkways, thoroughfares, parking , facilities, playing fields, schools, playgrounds,public buildings, forests, reservations, parks,, airports, and other public ways, grounds, buildings, places and spaces.
The location, character, extent, and development of utilities and terminals for water, light ,power, sanitation, transport transportation, transit, communication, heat, and other amenities;
(2) The acceptance, widening, removal, extension, relocation, narrowing, vacation the location, , abandonment, or change of use of any of the foregoing ways, grounds, places, spaces, buildings, properties, of facilities;
(3) The character, location, extent, and development of community centres, towns,industrial, estates, neighborhoods, housing developments and related facilities;
(4) The location, character, extent, and development of forests, agricultural areas, and open-development areas for purpose of conservation, food and water supply, sanitary and drainage facilities, or the protection or regulation of urban development;
(5) Land classification and utilization;
(6) The regulation of the height, area, bulk, location, and uses or buildings, the distribution of population and the uses of land for trade, industry, habitation, recreation, agricultural, forestry, soil
and water conservation and other purposes;
(7) Slum clearance and urban redevelopment; and
(8) Other matters affecting the development of the Territory.
In contrast to the master plan, all others plans pertaining to the development of the Territory may be termed, generically, precise plans. Such plans may be prepared by all action agencies and, as and when necessary, by the Authority, itself. Precise plans are to be distinguished from the master plan has been sanctioned. They must conform to the master plan ; they are detailed, not general in content; they apply to specific areas or limited functions.
It shall be the general policy of planning administration in the Territory fir the Delhi planning and Development Authority to concentrate its plan- making activities on preparation and maintenance of the master plan, leaving to the local authorities and Unionministries and departments the task of preparing precise plans. However, the Authority must be able to act in default of such agencies in respect of the preparation of essential precise plans. Above all, the Authority must amply be empowered with both primary and secondary p[powers to review, revise and amend precise plans in accordance with the master plan. It falls to the Authority, on behalf of Government, to ensure the coordination of plan- preparation.
Plan-Sanctioning
The forgoing policies and decision with respect to plan – preparation are correlative to certain provision indicated for plan-sanctioning. Only the Delhi Master plan and its amendement need be sanctioned by the Government of India, with the attendant provision for reference, notice, hearings, etc., now satisfactorily provided by statute and rule. Inasmuch as the concept and instrument of the zonal development plan would no longer be required, the sanctioning of precise plans may after approval by the Authority be left to processes specified by the precise plan-making agencies concerned.
It is general intent in this connection that the sanctioning or plans follow the level of government involved in plan-preparation, with the provide that precise plans be liable as necessary to review and revision by the Authority before sanctioning. It is also intended that sanctioning of all plans shall render any developmental activity contrary to them illegal, anshalLconstitute a positive authorization and mandate to implementing agencies, public or private, to carry out the programe of the plan. Neither provision is adequately explicit in existing law.
Plan-implementation
As the act of sanctioning imparts to a plan the status of policy and multiple agencies are required in the execution of development, certain decisions concerning plan- implementation may be now set out.
A central overseeing agency for plan-implementation, acting in behalf of the Government of India, shall exist with jurisdiction throughout the Territory. That agency may be the Delhi planning and Development Authority.
The Authority shall be empowered to require all agencies whose activities affect the development of the Territory to furnish periodic or special; reports concerning their developmental and regulatory activities, and other such kinds of reports of information and deem
R.G.GuptaCity/Policy Planner
Master Plan For Delhi 1957, Volume-II, PART - 3

necessary to aid in coordinating implementation and ensuring that implementation conform to the master plan.
The Authority shall be authorized to issue instructions construing and questions of general application as to the meaning or interpretation of that plan. In addition, implementing agencies may be empowered to refer voluntarily to the Authority question arising out of controversies or involving special problem of implementation.
Powers of entry, inspection, and investigation shall be granted to the Delhi planning and Development Authority to enable it to determine the status of plan-implementation.
The Authority shall recommended to the Government of India appropriate measures, whether by the demolition of buildings, the interruption of building operations, the revocation of planning permits, substitution, the withdrawal of assistance, or other steps, to ensure the development of the Territory according to the master plan. Each of the policies and decisions above will require statutory and other substantiation, for no provision exists in outstanding planning
law for any supervision of plan-implementation. Throughout its activities in this connection, the Delhi planning and Development Authority functions as an agent of the sanctioning authority, the Government of India. Accordingly, it must be provided that the Authority may receive instructions from Government of the time concerning any matter of its operation. It is the Government of India which ensures that its plans are not frustrated, and is to this end aided by its staff agency, the Delhi planning and Development Authority.
Finally, it may be provided that the present developmental powers of the Delhi Development Authority may be carried over to the planning and Development Authority. It is intended that this power be used sparingly, however, as the task of direct development should be borne by the implementing agencies, and especially to the Delhi Municipal corporation. Only when the need cannot be met otherwise, will the Authority engage in developmental activity.
As has been indicated in the above plan polices and decisions, many revisions will have to be made in the present law and practice of planning administration. Moreover, many collateral administrative matters deserve study, study that will no doubt lead to improvements.
R.G.GuptaCity/Policy Planner
Master Plan For Delhi 1957, Volume-II, PART - 3