Integrated Water Master Plan - Surprise, AZ
194
City of Surprise, Arizona Water Resource Management Department 16000 N. Civic Center Plaza Surprise, AZ 85374 Integrated Water Master Plan Water Resources Update June 2015 Report Prepared By: ARCADIS-US, Inc. 410 North 44 th Street Suite 1000 Phoenix, AZ 85008 04957020.003
-
Upload
khangminh22 -
Category
Documents
-
view
1 -
download
0
Transcript of Integrated Water Master Plan - Surprise, AZ

City of Surprise, Arizona Water Resource Management Department 16000 N. Civic Center Plaza Surprise, AZ 85374
Integrated Water Master Plan
Water Resources Update
June 2015
Report Prepared By:
ARCADIS-US, Inc. 410 North 44th Street Suite 1000 Phoenix, AZ 85008
04957020.003

Executive Summary
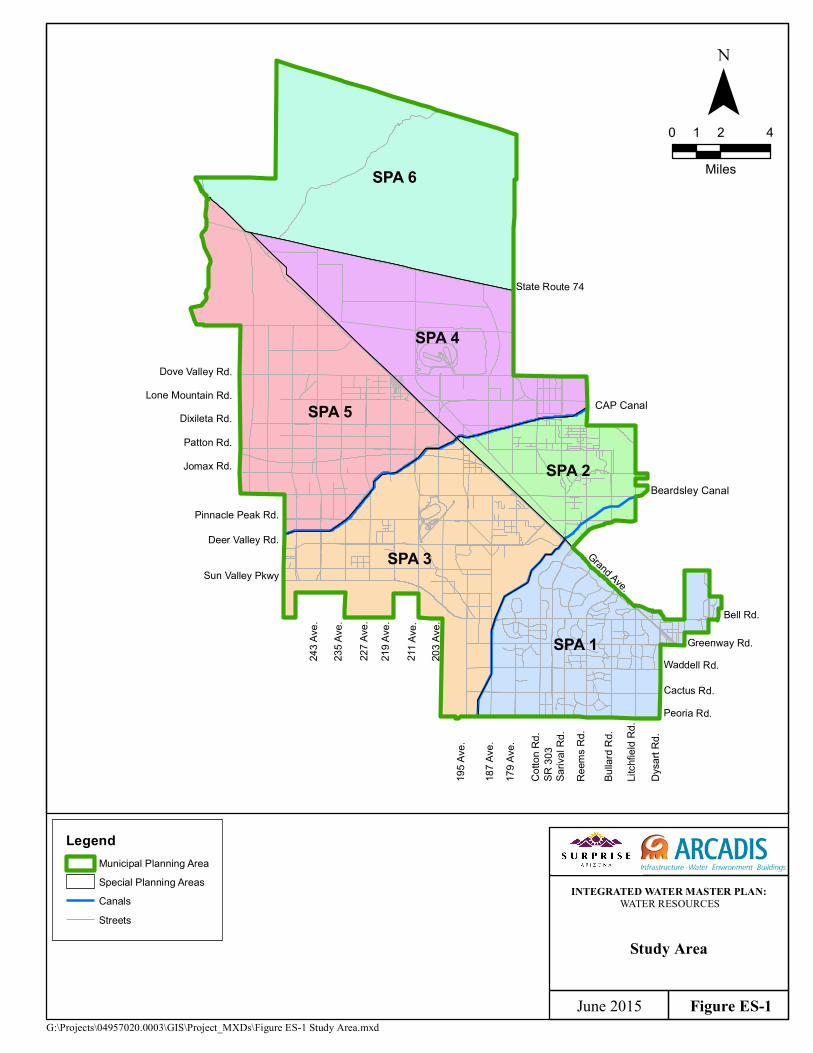
Introduction The City of Surprise (City) is expecting to grow to a population over 400,000 by 2030 within the planning area shown on Figure ES-1. To prepare for this growth, the City prepared an Integrated Water Master Plan with Water Resources and Water Infrastructure components in November 2008. The project considered a municipal planning area (MPA) of 299 square miles broken up into six special planning areas (SPAs): SPA 1 through SPA 6.
The purpose of the Integrated Water Master Plan is to provide a long-term guidance document for the orderly improvement and growth of the City’s water supply portfolio and drinking water, wastewater, reclaimed water, and groundwater recharge infrastructure. The purpose of the Water Resources update is to identify the projected water demands as the City continues to grow and to develop a water supply strategy that will meet the demands in a cost-effective and sustainable manner. To support future Water Infrastructure updates, the Water Resources update also includes projections of wastewater flows, reclaimed water availability, and reclaimed water demands.
The 2008 Integrated Water Master Plan project was completed under the guidance of two City committees: a Technical Committee composed of management staff from the City Public Works, Information Technology, and Planning Departments; and a Steering Committee composed of the Deputy City Manager and the Assistant City Managers overseeing public works, planning, and development agreement activities. The Water Resources update was completed under the guidance of City Public Works and Water Resource Management staff and the City Council’s Committee on Water Resource Planning.
Existing Water Supply Portfolio The current provisions of the City’s Designation of Assured Water Supply recognized that the City’s projected and committed demands for 2020 are 16,718 acre-feet (AF). The Designation considers all water currently pumped from City wells to come from physically available groundwater, and acknowledges the City’s demonstration that an average of 16,718 acre-feet per year (AFY) is physically available and can be withdrawn within its service area over 100 years.
City of Surprise, Arizona Integrated Water Master Plan: Water Resources Update 04957020.0003
ES-1
243 A
ve.
235 A
ve.
Sun Valley Pkwy
211 A
ve.
227 A
ve.
203 A
ve.
Patton Rd.
Grand Ave.
SR 30
3
Cactus Rd.
Reem
s Rd.
Waddell Rd.Greenway Rd.
Pinnacle Peak Rd.
Lone Mountain Rd.Dove Valley Rd.
State Route 74
Peoria Rd.
Sariv
al Rd
.
Cotto
n Rd.
Jomax Rd.
Dysa
rt Rd.
219 A
ve. Bell Rd.
187 A
ve.
179 A
ve.
Litch
field
Rd.
Deer Valley Rd.
Dixileta Rd.
Bulla
rd Rd
.
195 A
ve.
CAP Canal
Beardsley Canal
SPA 6
SPA 5
SPA 3
SPA 4
SPA 1
SPA 2
Figure ES-1
Study Area
G:\Projects\04957020.0003\GIS\Project_MXDs\Figure ES-1 Study Area.mxdJune 2015
¯0 2 41
Miles
INTEGRATED WATER MASTER PLAN: WATER RESOURCES
LegendMunicipal Planning AreaSpecial Planning AreasCanalsStreets
Executive Summary
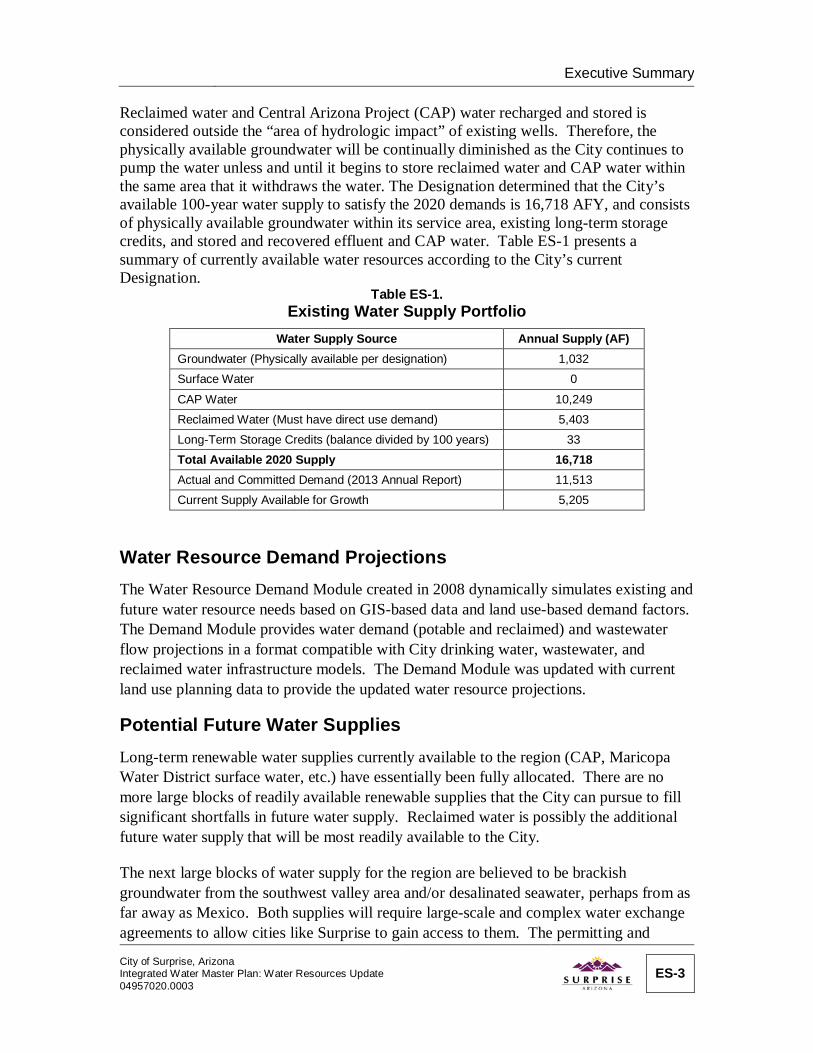
Reclaimed water and Central Arizona Project (CAP) water recharged and stored is considered outside the “area of hydrologic impact” of existing wells. Therefore, the physically available groundwater will be continually diminished as the City continues to pump the water unless and until it begins to store reclaimed water and CAP water within the same area that it withdraws the water. The Designation determined that the City’s available 100-year water supply to satisfy the 2020 demands is 16,718 AFY, and consists of physically available groundwater within its service area, existing long-term storage credits, and stored and recovered effluent and CAP water. Table ES-1 presents a summary of currently available water resources according to the City’s current Designation.
Table ES-1. Existing Water Supply Portfolio
Water Supply Source Annual Supply (AF) Groundwater (Physically available per designation) 1,032 Surface Water 0
CAP Water 10,249 Reclaimed Water (Must have direct use demand) 5,403 Long-Term Storage Credits (balance divided by 100 years) 33 Total Available 2020 Supply 16,718 Actual and Committed Demand (2013 Annual Report) 11,513 Current Supply Available for Growth 5,205
Water Resource Demand Projections The Water Resource Demand Module created in 2008 dynamically simulates existing and future water resource needs based on GIS-based data and land use-based demand factors. The Demand Module provides water demand (potable and reclaimed) and wastewater flow projections in a format compatible with City drinking water, wastewater, and reclaimed water infrastructure models. The Demand Module was updated with current land use planning data to provide the updated water resource projections.
Potential Future Water Supplies Long-term renewable water supplies currently available to the region (CAP, Maricopa Water District surface water, etc.) have essentially been fully allocated. There are no more large blocks of readily available renewable supplies that the City can pursue to fill significant shortfalls in future water supply. Reclaimed water is possibly the additional future water supply that will be most readily available to the City.
The next large blocks of water supply for the region are believed to be brackish groundwater from the southwest valley area and/or desalinated seawater, perhaps from as far away as Mexico. Both supplies will require large-scale and complex water exchange agreements to allow cities like Surprise to gain access to them. The permitting and
City of Surprise, Arizona Integrated Water Master Plan: Water Resources Update 04957020.0003
ES-3
Executive Summary
institutional process to develop new renewable water supplies will also be too challenging, lengthy, and expensive for a single entity like Surprise to achieve on its own. Likely, a regional water agency like the Central Arizona Water Conservation District (CAWCD) or the Bureau of Reclamation will implement the new supplies with the coordination of, and for the benefit of, all communities in the region.
Reclaimed Water Management Strategy Reclaimed water will be a critical component of the City’s water resources portfolio and could account for a significant share of the total water supply at build-out. A number of changes have occurred since completion of the 2008 Integrated Water Master Plan, including the national economic downturn which has led to significant reductions in local development and growth, and City budget limitations. In spite of the changes, the City has continued to expand the reclaimed water program.
The City’s current direction and policy (as specified in the Reclaimed Water Policy adopted by the City Council on May 19, 2015) is to recharge all reclaimed water and to recover the water within the area of hydrologic impact of the recharge facilities, and to direct serve large reuse customers close to the recharge conveyance pipelines that wish to be connected. The City will reconsider reclaimed water management alternatives in the future based on additional investigations to determine feasible recharge locations, future groundwater treatment requirements, and potential to exchange reclaimed water for other supply sources.
Recommended Water Demand/Supply Balance Strategy The most important guidance developed in the 2008 Integrated Water Master Plan was the desire to become sustainable, i.e., to manage development that can be supported by available water supplies. The sustainability objective will require that the City manage future development densities and plan for a target build-out population between 500,000 and 700,000. In addition, future landscaping guidelines must be implemented and enforced. Although it was considered within the margin of error of the planning assumptions, the evaluations predicted that demands would exceed supply some time before build-out.
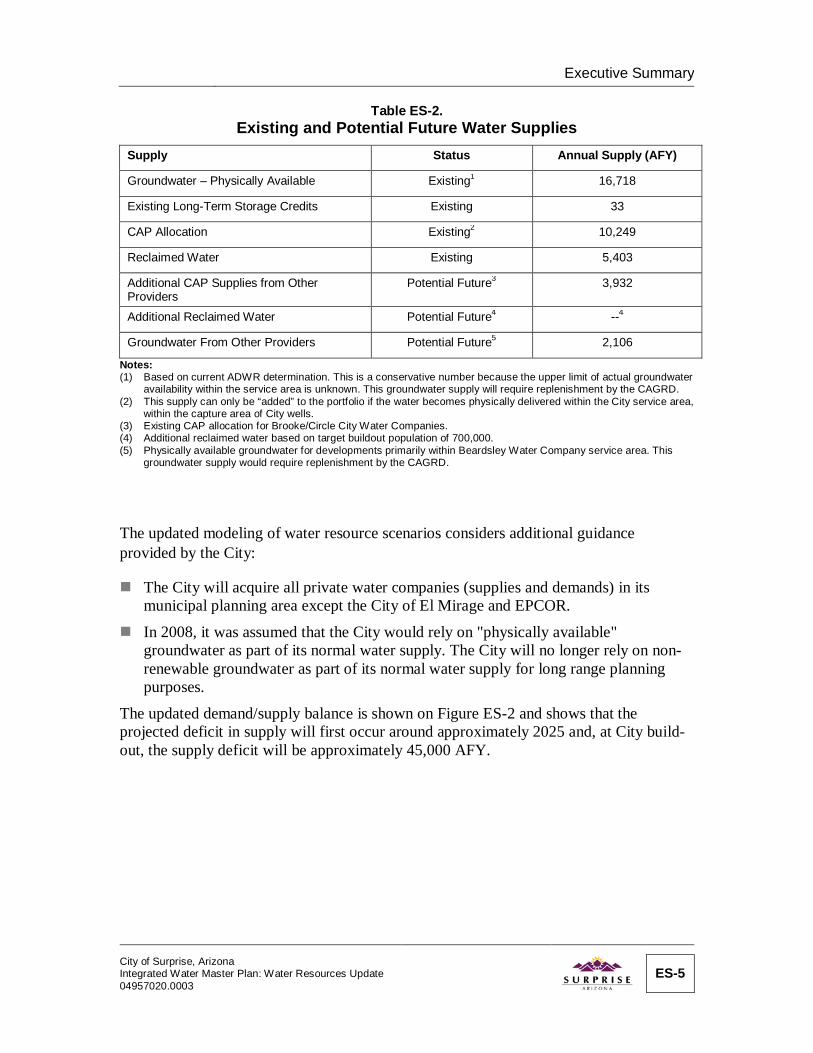
The updated Demand Module was used to compare projected water demands with available water supplies. Table ES-2 summarizes the water supplies included in the City’s current Designation of Assured Water Supply and other existing supplies that are considered available to the City to meet water demands at build-out.
ES-4
Executive Summary
Table ES-2. Existing and Potential Future Water Supplies
Supply Status Annual Supply (AFY)
Groundwater – Physically Available Existing1 16,718
Existing Long-Term Storage Credits Existing 33
CAP Allocation Existing2 10,249
Reclaimed Water Existing 5,403
Additional CAP Supplies from Other Providers
Potential Future3 3,932
Additional Reclaimed Water Potential Future4 --4
Groundwater From Other Providers Potential Future5 2,106
Notes: (1) Based on current ADWR determination. This is a conservative number because the upper limit of actual groundwater
availability within the service area is unknown. This groundwater supply will require replenishment by the CAGRD. (2) This supply can only be “added” to the portfolio if the water becomes physically delivered within the City service area,
within the capture area of City wells. (3) Existing CAP allocation for Brooke/Circle City Water Companies. (4) Additional reclaimed water based on target buildout population of 700,000. (5) Physically available groundwater for developments primarily within Beardsley Water Company service area. This
groundwater supply would require replenishment by the CAGRD.
The updated modeling of water resource scenarios considers additional guidance provided by the City:
The City will acquire all private water companies (supplies and demands) in its municipal planning area except the City of El Mirage and EPCOR.
In 2008, it was assumed that the City would rely on "physically available" groundwater as part of its normal water supply. The City will no longer rely on non-renewable groundwater as part of its normal water supply for long range planning purposes.
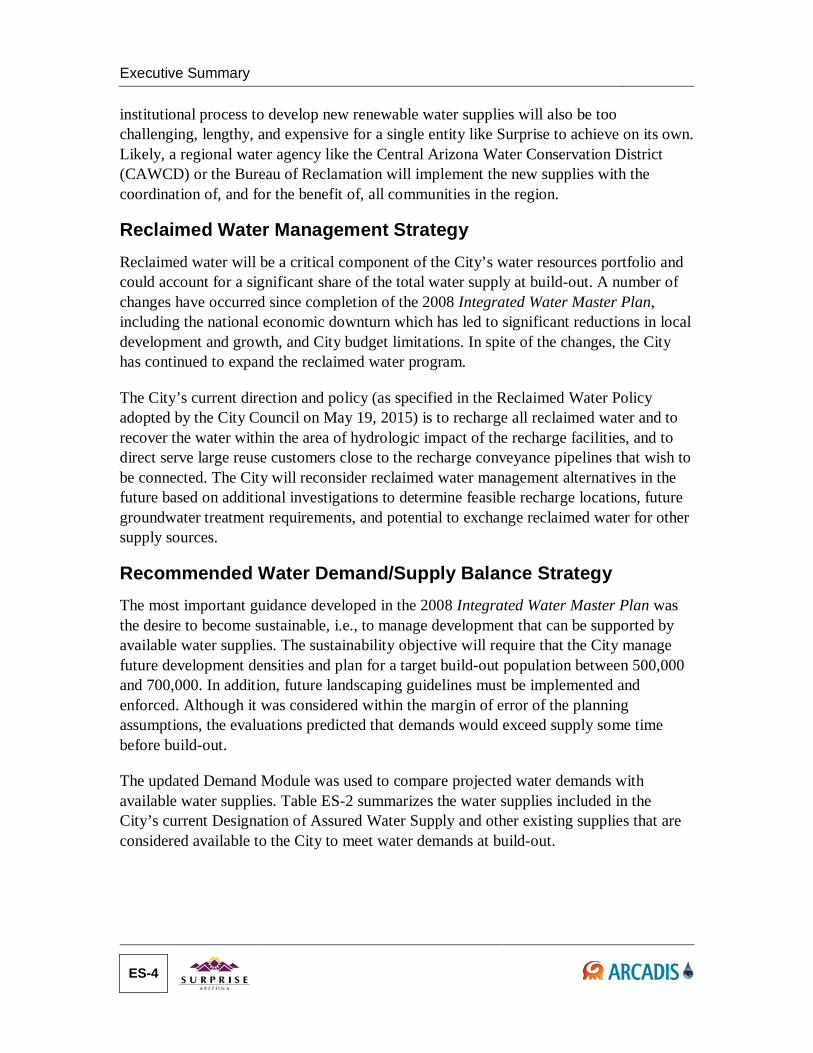
The updated demand/supply balance is shown on Figure ES-2 and shows that the projected deficit in supply will first occur around approximately 2025 and, at City build-out, the supply deficit will be approximately 45,000 AFY.
City of Surprise, Arizona Integrated Water Master Plan: Water Resources Update 04957020.0003
ES-5

0
50,000
100,000
150,000
200,000
250,000
2013 2023 2033 2043 2053 2063
Acr
e-Fe
et p
er Y
ear
Total Irrigation Demand
Total Outdoor Demand
Total Indoor Demand
Total Available Supply
0
50,000
100,000
150,000
200,000
250,000
2013 2023 2033 2043 2053 2063
Acr
e-Fe
et p
er Y
ear
Additional Reclaimed Water
Additional CAP Supplies from Other Providers
CAP Allocation
Reclaimed Water
Total Water Demand
11% 32% 52% 70% 87% 100% Year
Land Coverage
11% 32% 52% 70% 87% 100% Year
Land Coverage
Figure ES-2 June 2015 Updated Supply/Demand Comparison – Do not Rely on Ground-water, Do not Acquire Service Areas of EPCOR and El Mirage
CITY OF SURPRISE, ARIZONA INTEGRATED WATER MASTER PLAN: WATER RESOURCES

Executive Summary Recommended Water Resource Management Strategy The water resources management strategy deals with the water supplies that are actually available to the City. The recommendations (summarized on Figure ES-3) are organized chronologically into three time horizons:
Near-Term Recommendations should be addressed immediately to effectively manage supplies that are currently available, including groundwater, CAP water, Maricopa Water District (MWD) water, and reclaimed water.
Mid-Term Recommendations can be addressed over the next few years to potentially acquire other supplies that may also be currently available, including private water company CAP allotments, and CAP Non-Indian Agriculture Water (Round 2).
Long-Term Recommendations are those that would achieve true water supply sustainability; they would position the City for its share of next available renewable water supplies.
Near-Term Water Resource Management Recommendations
The water resource management recommendations related to groundwater supplies that should be addressed as soon as possible are listed below:
Establish area of hydrologic impact. Identify institutional approvals and infrastructure necessary that will enable recovering water from underground storage within the area of hydrologic impact of all City recharge facilities. Begin locating new recharge facilities and recovery wells such that all future withdrawals will be deemed to be within the mutual areas of hydrologic impact.
Conduct groundwater recharge and quality studies. Complete comprehensive hydrogeologic investigations of the entire City planning area to establish optimal recharge facility and recovery well locations and to define the types and extent of groundwater treatment needed for future potable supplies.
Implement groundwater management. Continue recharging all CAP water that is not used directly and develop the recharge element of the reclaimed water program. Implement institutional arrangements and infrastructure that will enable replenishment and augmentation of the City’s groundwater, whenever needed, to occur within the areas of mutual hydrologic impact.
Compare costs of groundwater treatment vs. surface water treatment. Update the long range plan for potable water infrastructure that compares the costs for groundwater production, treatment, disinfection, and distribution against the cost of constructing and operating a surface water filtration plant for direct use of the City’s CAP supply.
City of Surprise, Arizona Integrated Water Master Plan: Water Resources Update 04957020.0003
ES-7
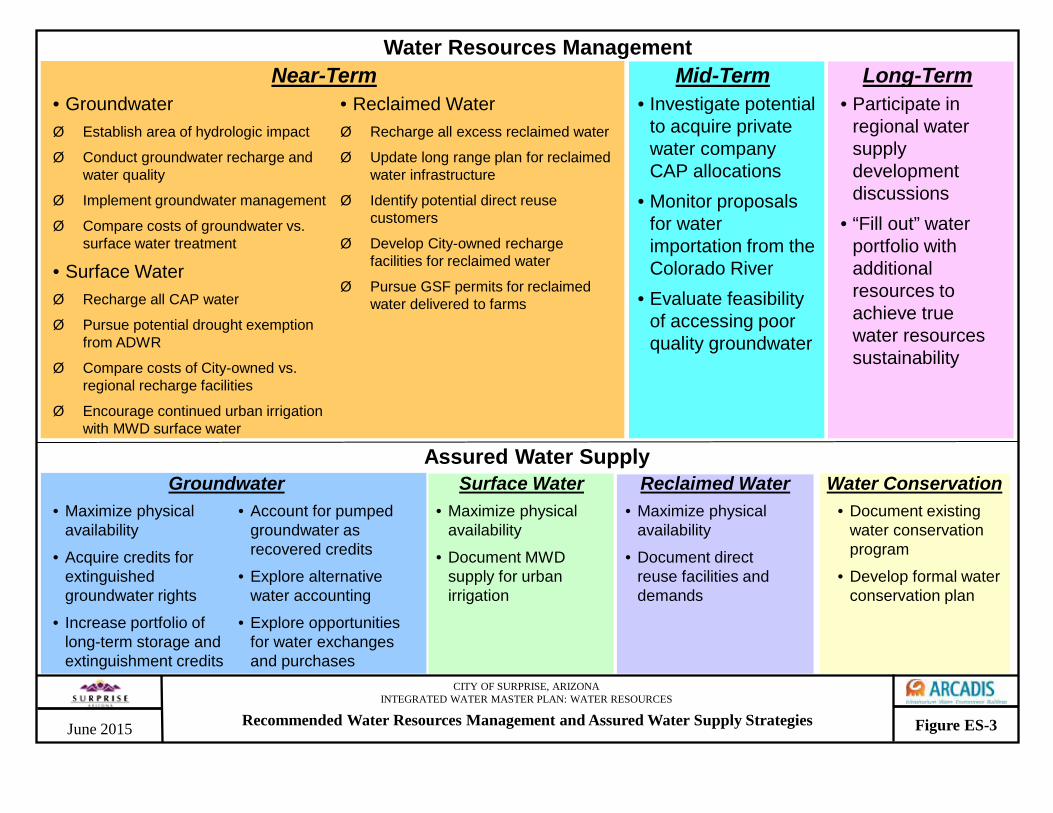
Recommended Water Resources Management and Assured Water Supply Strategies Figure ES-3
CITY OF SURPRISE, ARIZONA INTEGRATED WATER MASTER PLAN: WATER RESOURCES
Water Resources Management
• Groundwater Ø Establish area of hydrologic impact
Ø Conduct groundwater recharge and water quality
Ø Implement groundwater management
Ø Compare costs of groundwater vs. surface water treatment
• Surface Water Ø Recharge all CAP water
Ø Pursue potential drought exemption from ADWR
Ø Compare costs of City-owned vs. regional recharge facilities
Ø Encourage continued urban irrigation with MWD surface water
• Reclaimed Water Ø Recharge all excess reclaimed water
Ø Update long range plan for reclaimed water infrastructure
Ø Identify potential direct reuse customers
Ø Develop City-owned recharge facilities for reclaimed water
Ø Pursue GSF permits for reclaimed water delivered to farms
• Investigate potential to acquire private water company CAP allocations
• Monitor proposals for water importation from the Colorado River
• Evaluate feasibility of accessing poor quality groundwater
• Participate in regional water supply development discussions
• “Fill out” water portfolio with additional resources to achieve true water resources sustainability
Near-Term Mid-Term Long-Term
Assured Water Supply
• Maximize physical availability
• Acquire credits for extinguished groundwater rights
• Increase portfolio of long-term storage and extinguishment credits
• Maximize physical availability
• Document MWD supply for urban irrigation
• Maximize physical availability
• Document direct reuse facilities and demands
• Document existing water conservation program
• Develop formal water conservation plan
Groundwater Surface Water Reclaimed Water Water Conservation
June 2015
• Account for pumped groundwater as recovered credits
• Explore alternative water accounting
• Explore opportunities for water exchanges and purchases
Executive Summary The water resource management recommendations related to surface water supplies that should be addressed as soon as possible are listed below:
Recharge all CAP water allocations. Fund storing 100 percent of the City’s CAP allocations since it is the least expensive source of long-term storage credits other than reclaimed wastewater.
Pursue a potential drought exemption from ADWR. Inquire with ADWR regarding a drought exemption that would, during a declared drought, allow use of some pumped groundwater as groundwater exempt from replenishment obligations, and preserve that much additional CAP and reclaimed water as stored water for future uses.
Compare costs of City-owned vs. regional recharge facilities. Update the long range plan for potable water infrastructure that compares the feasibility of long-term recharge of CAP water at regional recharge facilities versus City-owned facilities.
Encourage continued urban irrigation with MWD water. Encourage the delivery of MWD surface water to MWD member lands for exterior water use (urban irrigation), thereby reducing the demand on the City to provide potable and/or reclaimed water to these lands.
The water resource management recommendations related to reclaimed water supplies that should be addressed as soon as possible are listed below:
Recharge all excess reclaimed water. Expand the reclaimed water recharge program and continue recharging all reclaimed water that is not used directly.
Update reclaimed water recharge conveyance infrastructure. To accommodate the current direction and policy regarding reclaimed water management, update long range plans for the reclaimed water infrastructure.
Identify potential to serve additional reuses. Investigate the potential to serve large reuse customers along the recharge conveyance pipelines.
Develop City-owned recharge capacity for reclaimed water. Update the locations and sizing for recharge of all excess reclaimed water. Locate facilities in areas where City wells can physically access the stored water so that the stored water is deemed to be increasing, or reducing the depletion of, physically available groundwater.
Pursue Groundwater Savings Facilities permits for reclaimed water deliveries to farms. Permit the deliveries to farms so that the City will accrue long-term storage credits for the water delivered.
Mid-Term Water Resource Management Recommendations
Investigate potential to acquire private water company allocations. Investigate the potential to acquire the CAP allocation currently assigned to Circle City Water Company either through a temporary assignment of the water to the City, or through a permanent acquisition. Circle City does not appear to have plans to put this water to direct use in the immediate future.
City of Surprise, Arizona Integrated Water Master Plan: Water Resources Update 04957020.0003
ES-9
Executive Summary
Monitor proposals for water importation from the Colorado River. Carefully assess
the viability of each proposal with primary emphasis on obtaining clearance for wheeling through the CAP system.
Evaluate feasibility of accessing poor quality groundwater. Monitor ADWR evaluation of the Phoenix AMA waterlogged area for re-designation as a poor quality groundwater area. Assess feasibility of accessing this water either physically via treatment and conveyance, or by exchange for other water supplies through partnerships with other parties of interest (Goodyear, Buckeye, CAWCD, CAGRD).
Long-Term Water Resource Management Recommendations
A portion of the City’s existing water supply portfolio is mined groundwater that requires replenishment, or storage of water in advance to avoid creating a need for replenishment. As such, the City should attempt to “fill out” its water portfolio with additional resources developed as part of regional supply efforts in order to achieve true water resources sustainability. This will eliminate groundwater “mining,” provide a water supply buffer in case water demands exceed projections, and provide additional water supplies that could enhance future development opportunities.
The City should establish a high profile presence in discussions that could generate a regional water supply augmentation program. The City should actively participate in the regional discussions to express expectations to participate in newly developed supplies, secure a “place at the table”, be seen and be heard, and influence policies and decisions.
Recommended Assured Water Supply Strategy The assured water supply strategy (also summarized on Figure ES-3) deals with the regulatory framework and reporting requirements associated with Arizona’s water laws.
Assured Water Supply Recommendations - Groundwater
Maximize groundwater physical availability. Make all efforts to maximize the City’s groundwater’s physical availability by completing the following activities:
• Develop a well development plan with an emphasis on locating wells near underground storage facilities.
• Demonstrate financial capability to construct new needed infrastructure in the water capital improvement plan and executed annexation and development agreements.
• Develop a pumping plan for existing and potential wells in the service and planning areas.
• Develop underground storage within the area of hydrologic impact of current and future wells.
ES-10
Executive Summary
• Develop a strategy for requiring any groundwater replenishment to occur within the City’s area of hydrologic impact.
Acquire credits for extinguished groundwater rights. Require that the groundwater rights in and near the City’s water service and planning areas be extinguished and the credits conveyed, but not pledged, to the City’s account at ADWR.
Increase portfolio of long-term storage and extinguishment credits. Investigate the potential to increase the portfolio of long-term storage and extinguishment credits through purchase in the market, once 100 percent of available CAP and reclaimed water are fully utilized and/or stored, for the purposes of increasing future assured water supplies and as “insurance” in the case of unplanned pumping of groundwater that would otherwise require replenishment.
Account for pumped groundwater as recovered credits. Continue to account for pumped groundwater as recovered credits (either CAP or reclaimed water) to eliminate potential replenishment obligations.
Explore alternative water accounting. Investigate the potential to deliver water as “water delivered to other rights”, where appropriate, to avoid impacts to the designation of assured water supply, and to avoid the requirement to use the stored water credits to offset potential replenishment obligations.
Continue exploring opportunities for water exchanges and purchases. Other entities may have physical water delivery constraints, long-term storage credits, Type 1 irrigation rights, etc., and may propose water exchanges, sale of credits, etc. Carefully investigate the feasibility of each opportunity and approve such proposals where the water portfolio can benefit at a reasonable economic cost.
Assured Water Supply Recommendations – Surface Water
Maximize surface water physical availability. Maximize physical availability of CAP water by permitting and operating annual and long-term underground storage and recovery facilities, and permitting all existing and new wells as recovery wells, within the area of mutual hydrologic impact. Also investigate the potential to develop a contractual relationship with MWD for annual storage and recovery of MWD surface water to be delivered by the City as potable water to urbanized MWD member lands.
Document MWD supply for urban irrigation. Investigate the potential to develop a contractual relationship with MWD for urban irrigation deliveries to MWD member lands. Also work with MWD to document that the member lands will have exterior irrigation water supplied by the MWD.
Assured Water Supply Recommendations - Reclaimed Water
Maximize reclaimed water physical availability. Maximize physical availability by permitting and operating annual and long-term underground storage and recovery facilities and all existing and future recovery wells, within the area of mutual hydrologic impact.
City of Surprise, Arizona Integrated Water Master Plan: Water Resources Update 04957020.0003
ES-11

Executive Summary
Document direct reuse facilities and demands. Document all direct delivery
opportunities, facilities and infrastructure, and projected demands for reclaimed water. Also clearly document planned infrastructure construction that will supply projected future demands.
Assured Water Supply Recommendations - Water Conservation
Document the existing water conservation program. Document the elements of the City’s current water conservation program for inclusion in future designation applications.
Develop a formal water conservation plan. Develop a water conservation plan that identifies measures that are currently in place and those that will be implemented in the future, and provides a projection of the expected water savings.
ES-12
Contents
List of Abbreviations vi
Executive Summary ES-1
1. Introduction 1-1
1.1. Background ................................................................................................................... 1-1 1.2. Project Purpose and Scope .......................................................................................... 1-1 1.3. City Technical and Policy Guidance ............................................................................. 1-2 1.4. Study Area .................................................................................................................... 1-2
2. Regulatory Framework 2-1
2.1. Groundwater Management Act ..................................................................................... 2-1 2.1.1. Assured Water Supply Designation .............................................................. 2-2 2.1.2. Groundwater Rights ...................................................................................... 2-4 2.1.3. Service Area Rights ....................................................................................... 2-5 2.1.4. Third Management Plan ................................................................................ 2-5 2.1.5. Fourth Management Plan .............................................................................. 2-5
2.2. Central Arizona Groundwater Replenishment District .................................................. 2-6 2.2.1. Background ................................................................................................... 2-6 2.2.2. Current Issues ............................................................................................... 2-7 2.2.3. Contract Requirements ................................................................................. 2-8 2.2.4. Membership ................................................................................................... 2-8 2.2.5. Benefits.......................................................................................................... 2-8 2.2.6. Liabilities ........................................................................................................ 2-9
2.3. Underground Storage and Savings .............................................................................. 2-9 2.3.1. Recharge ....................................................................................................... 2-9 2.3.2. Storage ........................................................................................................ 2-10 2.3.3. Exchanges ................................................................................................... 2-11
2.4. Central Arizona Project Subcontract ........................................................................... 2-11 2.5. Maricopa Water District Agreements .......................................................................... 2-11 2.6. City Ordinances, Rules, and Policies .......................................................................... 2-12 2.7. Arizona Well Spacing and Well Impact Rules ............................................................. 2-12 2.8. Water Reuse Regulations ........................................................................................... 2-13
2.8.1. Aquifer Protection Permit ............................................................................ 2-13 2.8.2. National Pollutant Discharge Elimination System Permit ............................ 2-14 2.8.3. ADEQ Reuse Regulations ........................................................................... 2-15
City of Surprise, Arizona Integrated Water Master Plan: Water Resources Update 04957020.0003
i
Table of Contents
2.8.4. Underground Storage and Recovery of Reclaimed Water .......................... 2-18 2.8.5. Clean Water Act Section 404 ...................................................................... 2-20 2.8.6. 208 Water Quality Management Plan ......................................................... 2-20
3. Existing Water Supply Portfolio 3-1
3.1. Existing Designation of Assured Water Supply ............................................................ 3-1 3.2. Surface Water ............................................................................................................... 3-2 3.3. Groundwater ................................................................................................................. 3-3
3.3.1. Assured Water Supply ................................................................................... 3-3 3.3.2. Central Arizona Groundwater Replenishment District .................................. 3-3 3.3.3. Drought Exemption Groundwater .................................................................. 3-4
3.4. Reclaimed Water .......................................................................................................... 3-4
4. Water Resources Infrastructure 4-1
4.1. Water and Sewer Service Providers ............................................................................. 4-1 4.2. Existing and Planned Water Infrastructure ................................................................... 4-4
4.2.1. Groundwater Production Wells ..................................................................... 4-4 4.2.2. Water Supply Facilities .................................................................................. 4-4 4.2.3. Water Reclamation Facilities ......................................................................... 4-7 4.2.4. Recharge Facilities ........................................................................................ 4-9
4.3. Water Quality ................................................................................................................ 4-9 4.3.1. Surface Water ............................................................................................... 4-9 4.3.2. Groundwater ................................................................................................ 4-10 4.3.3. Reclaimed Water ......................................................................................... 4-10
5. Water Resource Demand Projections 5-1
5.1. General Overview ......................................................................................................... 5-1 5.2. General Plan Land Use Categories .............................................................................. 5-1 5.3. Water Resource Demand Module................................................................................. 5-6 5.4. Demand Factor Data Sources ...................................................................................... 5-7 5.5. Water Demand Factors ................................................................................................. 5-7
5.5.1. Historical Water Production and Use ............................................................ 5-8 5.5.2. Calculated Land Use Based-Demand Factors .............................................. 5-9 5.5.3. Water Demand Factors for Surrounding Communities ............................... 5-12 5.5.4. City Design Guidelines ................................................................................ 5-13
5.6. Wastewater Flow Factors ........................................................................................... 5-13 5.6.1. Historical Wastewater Flows and Reclaimed Water Production ................. 5-13 5.6.2. Historical Wastewater Flow Monitoring ....................................................... 5-14 5.6.3. Wastewater Flow Factor Methodology ........................................................ 5-14
5.7. Reclaimed Water Demand Factors ............................................................................. 5-15 5.7.1. Residential/Commercial Outdoor Demand Factors .................................... 5-15 5.7.2. Landscape Demand Factors ....................................................................... 5-15
5.8. Updated Water Resource Projections ........................................................................ 5-16 5.8.1. Basis for Updated Water Resource Projections .......................................... 5-16 5.8.2. Updated Projections .................................................................................... 5-16
ii
Table of Contents 6. Potential Future Water Supply Opportunities 6-1
6.1. Groundwater ................................................................................................................. 6-1 6.1.1. Physical Availability ....................................................................................... 6-1 6.1.2. Groundwater Allowance Account .................................................................. 6-3 6.1.3. Local Poor Quality Groundwater ................................................................... 6-4
6.2. Surface Water ............................................................................................................... 6-6 6.2.1. Maricopa Water District ................................................................................. 6-6 6.2.2. Central Arizona Project Water ....................................................................... 6-7
6.2.2.1. Current CAP Allocations ........................................................... 6-7 6.2.2.2. Additional CAP Supplies .......................................................... 6-7 6.2.2.3. Indian Leases ........................................................................... 6-7
6.2.3. Imported Water Supplies ............................................................................... 6-8 6.3. Water Stored Outside the AMA..................................................................................... 6-9
6.3.1. Storage Potential ........................................................................................... 6-9 6.3.2. Groundwater Importation............................................................................... 6-9
6.4. Water Obtained from Private Water Company Acquisitions ....................................... 6-10 6.5. Reclaimed Water ........................................................................................................ 6-11
6.5.1. Reclaimed Water Availability ....................................................................... 6-11 6.5.2. Components of Reclaimed Water ............................................................... 6-12
6.6. Long Term Vision for Future Water Supplies .............................................................. 6-13
7. Reclaimed Water Management 7-1
7.1. Reclaimed Water Availability and Demand ................................................................... 7-1 7.2. Water Reuse Opportunities ........................................................................................... 7-3
7.2.1. Groundwater Recharge ................................................................................. 7-3 7.2.1.1. City-Owned Recharge Facilities ............................................... 7-3 7.2.1.2. Regional Recharge Facilities .................................................... 7-9
7.2.2. Direct Use of Reclaimed Water ................................................................... 7-13 7.2.3. Discharge to Waterways ............................................................................. 7-14 7.2.4. Water Exchange Options ............................................................................ 7-15
7.3. Evaluation of Reclaimed Water Program Alternatives ................................................ 7-18 7.4. Current City Reclaimed Water Direction ..................................................................... 7-19
8. Evaluation of Water Resource Scenarios 8-1
8.1. Water Resource Modeling Methodology ....................................................................... 8-1 8.2. Guidance from 2008 Evaluations .................................................................................. 8-2
8.2.1. Guidance from Evaluation of a Baseline Scenario ........................................ 8-2 8.2.2. Guidance from Evaluation of Alternate Scenarios ........................................ 8-2 8.2.3. Summary of Guidance from 2008 Evaluations ............................................. 8-3
8.3. Updated Water Demands and Supplies ....................................................................... 8-4 8.4. Modeling of Updated Water Resource Scenarios ........................................................ 8-5
8.4.1. Impacts of Wastewater Flow to Water Demand Ratio .................................. 8-5 8.4.2. Other Potential Impacts to Projected Demand/Supply Balances .................. 8-6 8.4.3. Impacts of Acquiring El Mirage and EPCOR Service Areas ......................... 8-6 8.4.4. Recommendation for Acquisition of Additional Water Supplies .................... 8-7
9. Water Resource Management and Assured Water Supply Strategy 9-1
9.1. Basis for Water Resources Master Plan ....................................................................... 9-1 City of Surprise, Arizona Integrated Water Master Plan: Water Resources Update 04957020.0003
iii
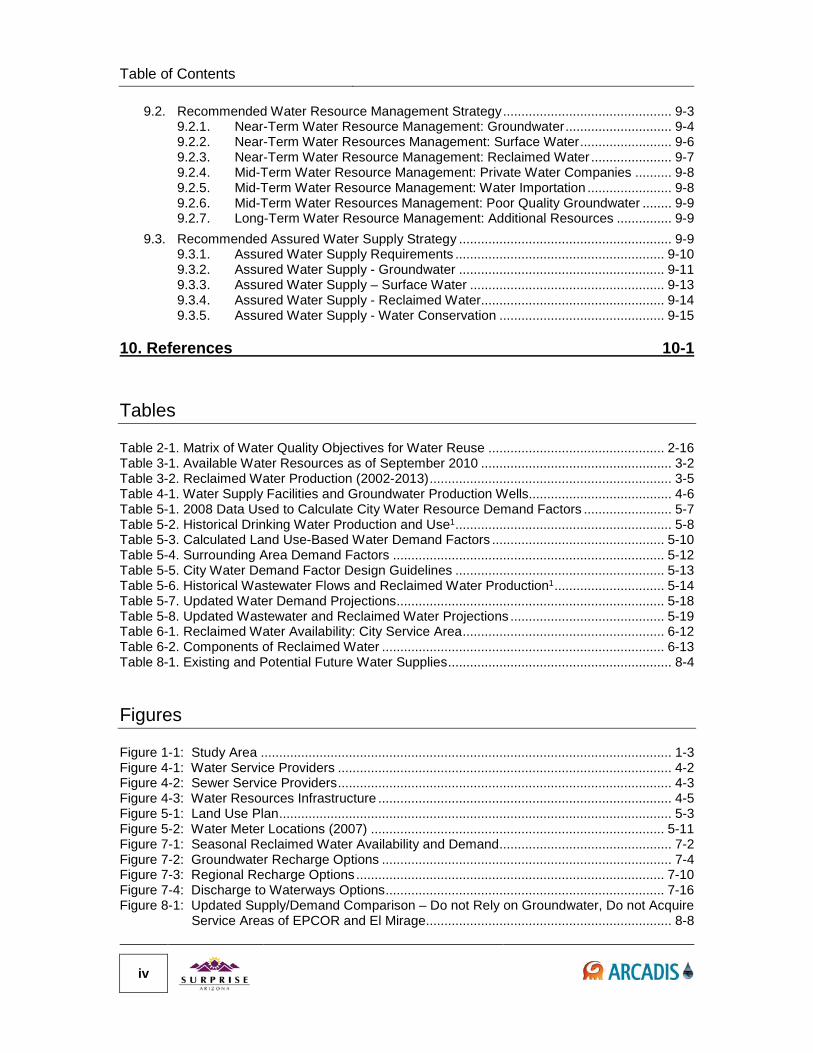
Table of Contents
9.2. Recommended Water Resource Management Strategy .............................................. 9-3
9.2.1. Near-Term Water Resource Management: Groundwater ............................. 9-4 9.2.2. Near-Term Water Resources Management: Surface Water ......................... 9-6 9.2.3. Near-Term Water Resource Management: Reclaimed Water ...................... 9-7 9.2.4. Mid-Term Water Resource Management: Private Water Companies .......... 9-8 9.2.5. Mid-Term Water Resource Management: Water Importation ....................... 9-8 9.2.6. Mid-Term Water Resources Management: Poor Quality Groundwater ........ 9-9 9.2.7. Long-Term Water Resource Management: Additional Resources ............... 9-9
9.3. Recommended Assured Water Supply Strategy .......................................................... 9-9 9.3.1. Assured Water Supply Requirements ......................................................... 9-10 9.3.2. Assured Water Supply - Groundwater ........................................................ 9-11 9.3.3. Assured Water Supply – Surface Water ..................................................... 9-13 9.3.4. Assured Water Supply - Reclaimed Water.................................................. 9-14 9.3.5. Assured Water Supply - Water Conservation ............................................. 9-15
10. References 10-1
Tables
Table 2-1. Matrix of Water Quality Objectives for Water Reuse ................................................ 2-16 Table 3-1. Available Water Resources as of September 2010 .................................................... 3-2 Table 3-2. Reclaimed Water Production (2002-2013) .................................................................. 3-5 Table 4-1. Water Supply Facilities and Groundwater Production Wells....................................... 4-6 Table 5-1. 2008 Data Used to Calculate City Water Resource Demand Factors ........................ 5-7 Table 5-2. Historical Drinking Water Production and Use1 ........................................................... 5-8 Table 5-3. Calculated Land Use-Based Water Demand Factors ............................................... 5-10 Table 5-4. Surrounding Area Demand Factors .......................................................................... 5-12 Table 5-5. City Water Demand Factor Design Guidelines ......................................................... 5-13 Table 5-6. Historical Wastewater Flows and Reclaimed Water Production1 .............................. 5-14 Table 5-7. Updated Water Demand Projections ......................................................................... 5-18 Table 5-8. Updated Wastewater and Reclaimed Water Projections .......................................... 5-19 Table 6-1. Reclaimed Water Availability: City Service Area ....................................................... 6-12 Table 6-2. Components of Reclaimed Water ............................................................................. 6-13 Table 8-1. Existing and Potential Future Water Supplies ............................................................. 8-4
Figures
Figure 1-1: Study Area ................................................................................................................ 1-3 Figure 4-1: Water Service Providers ........................................................................................... 4-2 Figure 4-2: Sewer Service Providers ........................................................................................... 4-3 Figure 4-3: Water Resources Infrastructure ................................................................................ 4-5 Figure 5-1: Land Use Plan ........................................................................................................... 5-3 Figure 5-2: Water Meter Locations (2007) ................................................................................ 5-11 Figure 7-1: Seasonal Reclaimed Water Availability and Demand ............................................... 7-2 Figure 7-2: Groundwater Recharge Options ............................................................................... 7-4 Figure 7-3: Regional Recharge Options .................................................................................... 7-10 Figure 7-4: Discharge to Waterways Options ............................................................................ 7-16 Figure 8-1: Updated Supply/Demand Comparison – Do not Rely on Groundwater, Do not Acquire
Service Areas of EPCOR and El Mirage................................................................... 8-8
iv
Table of Contents Figure 8-2: Updated Supply/Demand Comparison – Do Not Rely on Groundwater, Acquire
Service Areas of EPCOR and El Mirage................................................................... 8-9
Appendices
A. Water Resource Demand Module B. High Level Recharge Technology Cost Evaluation C. Potential Future Water Supply Opportunities D. Water Resource Model
City of Surprise, Arizona Integrated Water Master Plan: Water Resources Update 04957020.0003
v
Table of Contents
List of Abbreviations
A.R.S. Arizona Revised Statutes AAC Arizona Administrative Code AACE Association for the Advancement of Cost Engineering AAWC Arizona American Water Company ADEQ Arizona Department of Environmental Quality ADWR Arizona Department of Water Resources AF acre-feet AFY acre-feet per year AMA active management area AMWUA Arizona Municipal Water Users Association AOC Approval of Construction APP Aquifer Protection Permit ASR aquifer storage and recovery ASU Arizona State University ATC Approval to Construct AWS assured water supply AZPDES Arizona Pollutant Discharge Elimination System BADCT best available demonstrated control technology
BOD5 biological oxygen demand CAGRD Central Arizona Groundwater Replenishment District CAP Central Arizona Project CAWCD Central Arizona Water Conservation District CCR Consumer Cost Index CFU colony forming units City City of Surprise COG Council of Governments CPP continuing planning process CWA Clean Water Act du/acre dwelling units per acre ENR Engineering News Record FHSD Fountain Hills Sanitary District GIS geographical information systems gpad gallons per acre per day gpcd gallons per capita per day gpd gallons per day gpd/du gallons per day per dwelling unit gpm gallons per minute HOA Homeowner's Association M&I municipal and industrial
vi

Table of Contents MAG Maricopa Association of Governments MCESD Maricopa County Environmental Services Department MCL maximum contaminant level µg/L micrograms per liter mg/L milligrams per liter mgd million gallons per day MPA municipal planning area MWD Maricopa Water District NPDES National Pollutant Discharge Elimination System NTU nephlometric turbidity units O&M operation and maintenance SBR squencing batch reactor SPA special planning area SR State Route SROG sub-regional operating group SRP Salt River Project TAZ Traffic Analysis Zone TBD to be developed TDS total dissolved solids THM trihalomethane TMP Third Management Plan TOC total organic carbon TSS total suspended solids TTHM total trihalomethane UIC underground injection USACE United States Army Corps of Engineers USBR United States Bureau of Reclamation USDW underground sources of drinking water USEPA United States Environmental Protection Agency USF underground storage facility WQMP Water Quality Management Plan WRF water reclamation facility WS water storage WSF water supply facility
City of Surprise, Arizona Integrated Water Master Plan: Water Resources Update 04957020.0003
vii

THIS PAGE INTENTIONALLY LEFT BLANK
1. Introduction
1.1. Background The City of Surprise (City) Water Resource Management Department is responsible for management of the City’s drinking water, wastewater, reclaimed water, and recharge systems and the associated long range master planning documents.
The City is expecting to grow to a population of over 400,000 by 2030 (Maricopa Association of Governments, 2007). To prepare for this growth and additional growth as the City approaches build-out, the City prepared an Integrated Water Master Plan with Water Resources and Water Infrastructure components in November 2008. The project considered a municipal planning area (MPA) of 299 square miles broken up into six special planning areas (SPAs): SPA 1 through SPA 6.
In November 2013, the City retained ARCADIS US, Inc., in association with Replenishment Services, LLC, to update the Water Resources component.
1.2. Project Purpose and Scope The purpose of the Integrated Water Master Plan is to provide a long-term guidance document for the orderly improvement and growth of the City’s water supply portfolio and drinking water, wastewater, reclaimed water, and groundwater recharge infrastructure.
The purpose of the Water Resources component is to identify the projected water demands as the City continues to grow and to develop a water supply strategy that will meet the demands in a cost-effective and sustainable manner. To support the Water Infrastructure component, the Water Resources component also includes projections of wastewater flows, reclaimed water availability, and reclaimed water demands in an integrated fashion.
The purpose of the Water Infrastructure component is to support the findings and general approaches outlined in the Water Resources component by developing comprehensive plans and infrastructure improvements that allow the City to implement water infrastructure improvements and expansions in a legal, cost-effective, and sustainable manner.
City of Surprise, Arizona Integrated Water Master Plan: Water Resources Update 04957020.0003
1-1
Section 1 Introduction
The scope of the Water Resources update project generally includes the following:
Identify the water resources demand projections (water, wastewater and reclaimed water) to reflect current planning and land use information.
Identify the City’s water supply portfolio based on the modification to the Designation of Assured Water Supply issued by the Arizona Department of Water Resources in September, 2010; and to determine the surface water, groundwater and reclaimed water supplies, allocations, and credits currently available to the City.
Identify the water demand versus supply projections to identify the supply gap at build-out that the City should use in planning future water supply acquisitions.
Identify the identification and assessment of potential future water supply opportunities to identify new water supply acquisitions that the City should focus on.
Identify the water resource management and assured water supply strategy by identifying specific actions that the City can take now to begin solidifying future water resources.
1.3. City Technical and Policy Guidance The 2008 Integrated Water Master Plan project was completed under the guidance of two City committees: the Technical Committee composed of management staff from the City Public Works, Information Technology, and Planning Departments; and the Steering Committee composed of the Deputy City Manager and the Assistant City Managers overseeing public works, planning, and development agreement activities. The Technical Committee provided information and data to the consultant team, reviewed the consultant team’s technical work, and provided water, wastewater, and reclaimed water technical advice and guidance. The Steering Committee provided policy direction and oversight. The two committees gave valuable input and guidance on technical memoranda developed during the project and participated in all project workshops where results of the technical work were presented.
The Water Resources component update was completed under the guidance of City Public Works and Water Resources Management staff and the City Council’s Committee on Water Resource Planning. City staff provided information and data required for the update evaluations and the Water Planning Subcommittee provided policy direction and oversight.
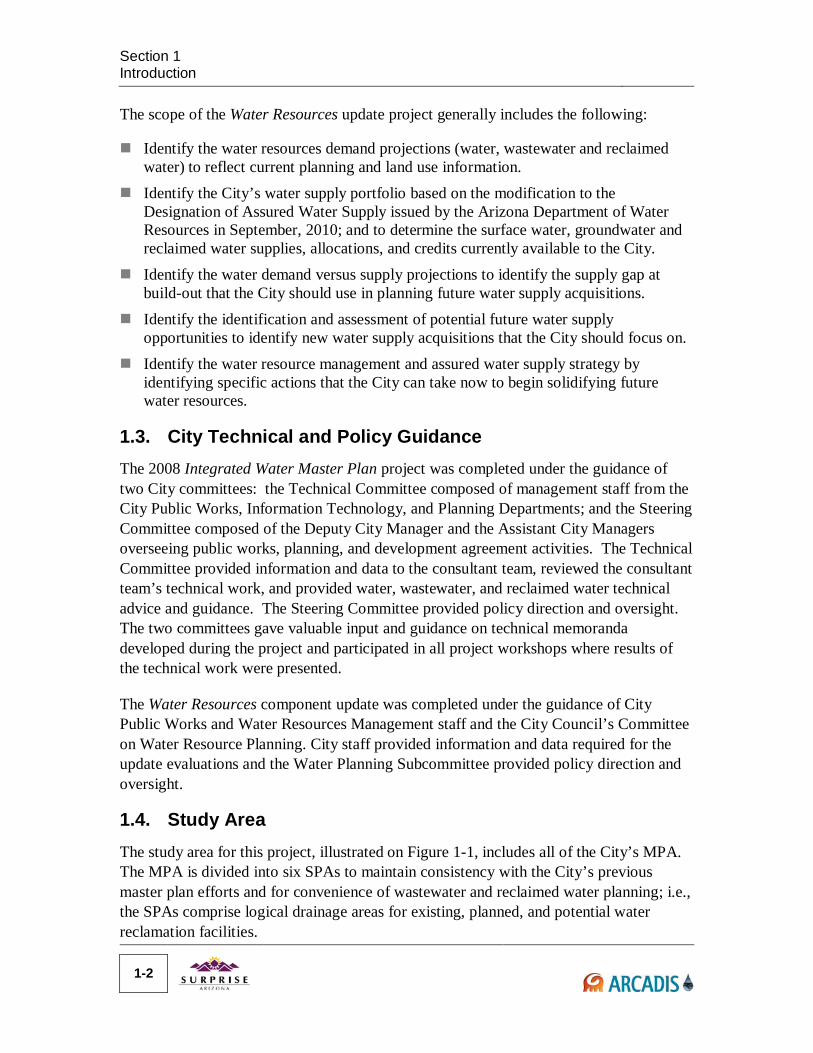
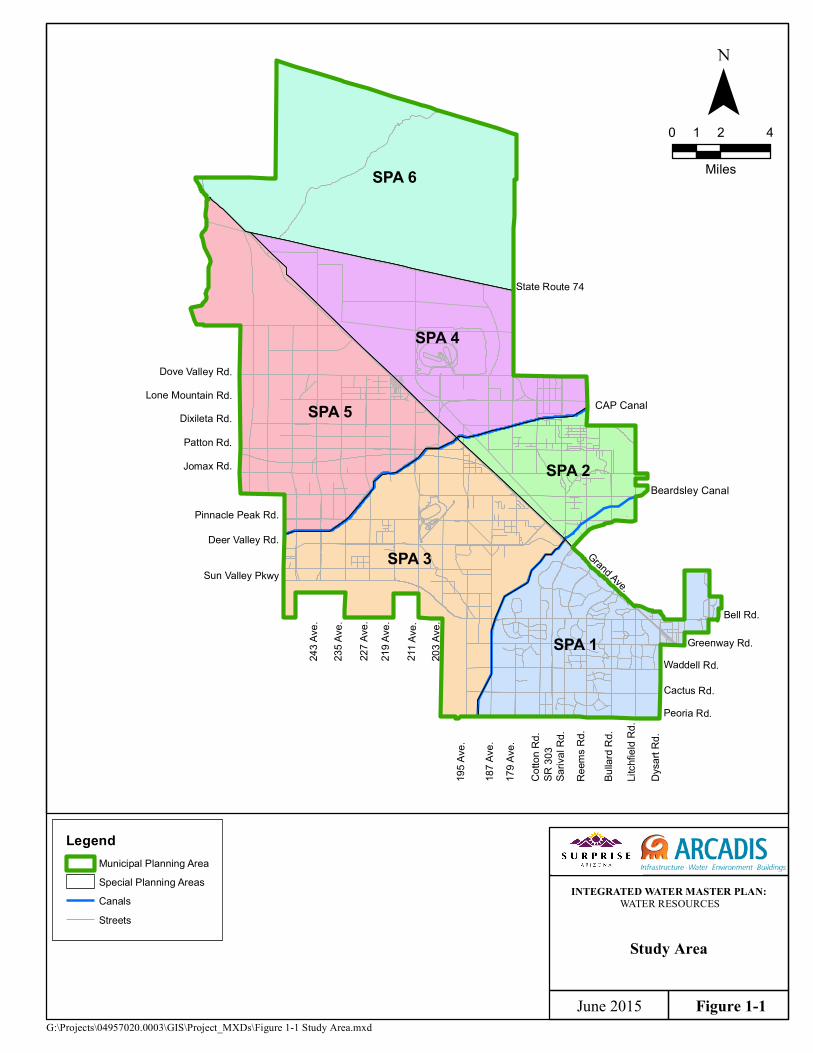
1.4. Study Area The study area for this project, illustrated on Figure 1-1, includes all of the City’s MPA. The MPA is divided into six SPAs to maintain consistency with the City’s previous master plan efforts and for convenience of wastewater and reclaimed water planning; i.e., the SPAs comprise logical drainage areas for existing, planned, and potential water reclamation facilities.
1-2
243 A
ve.
235 A
ve.
Sun Valley Pkwy
211 A
ve.
227 A
ve.
203 A
ve.
Patton Rd.
Grand Ave.
SR 30
3
Cactus Rd.
Reem
s Rd.
Waddell Rd.Greenway Rd.
Pinnacle Peak Rd.
Lone Mountain Rd.Dove Valley Rd.
State Route 74
Peoria Rd.
Sariv
al Rd
.
Cotto
n Rd.
Jomax Rd.
Dysa
rt Rd.
219 A
ve. Bell Rd.
187 A
ve.
179 A
ve.
Litch
field
Rd.
Deer Valley Rd.
Dixileta Rd.
Bulla
rd Rd
.
195 A
ve.
CAP Canal
Beardsley Canal
SPA 6
SPA 5
SPA 3
SPA 4
SPA 1
SPA 2
Figure 1-1
Study Area
G:\Projects\04957020.0003\GIS\Project_MXDs\Figure 1-1 Study Area.mxdJune 2015
¯0 2 41
Miles
INTEGRATED WATER MASTER PLAN: WATER RESOURCES
LegendMunicipal Planning AreaSpecial Planning AreasCanalsStreets

THIS PAGE INTENTIONALLY LEFT BLANK
2. Regulatory Framework
Multiple state and federal laws, contracts, agreements, and City policies govern water resource development and delivery. The water resource planning regulatory framework within which the City operates is summarized in this section.
2.1. Groundwater Management Act Arizona Revised Statute (A.R.S.) Title 45 governs the allocation and use of water resources in Arizona. Title 45 is subdivided into 16 chapters; each chapter subdivided again into articles, which contain the specific statutes. While Chapter 2 is titled “Groundwater Code,” additional provisions within Title 45 (such as Chapter 3.1, Underground Water Storage, Savings and Replenishment) could potentially impact the City’s water supplies. Following is a summary of the key provisions in the Groundwater Code. While the Code is a very detailed and comprehensive law, the following focuses on the portions of the Code most relevant to the City’s water resources planning efforts.
Chapter 2, Article 6 relates to “Groundwater Rights and Uses within Service Areas.” This article provides authority to the City to withdraw and transport groundwater within its service area for the benefit its landowners and residents. The article also contains specific provisions against expansions of the service area specifically to include a well field or to withdraw and distribute groundwater for irrigation purposes (agricultural). Along with a few other related provisions, the article also requires that the City retain an updated map of its water service area.
Chapter 2, Article 7 relates to groundwater withdrawal permits. These are permits that have a limited term and are typically used for special purposes, such as a hydrologic testing permit for well drilling. Groundwater rights are typically not time restricted, where permits have an expiration date.
Chapter 2, Article 8 relates to the transportation of groundwater. The key provision of this article allows the City to transport groundwater within a sub-basin within its service area without payment of damages to other groundwater users.
Chapter 2, Article 8.1 addresses the transportation of groundwater from the Butler Valley and Harquahala Irrigation Non-Expansion Area. With specific requirements, this article would allow the City to import groundwater from these two areas if it chose to pursue such a strategy for future water supplies.
Chapter 2, Article 9 addresses the management of groundwater supplies. This article provides for the Arizona Department of Water Resources (ADWR) to develop management plans for active management areas (AMAs), including the Phoenix AMA, within which the City of Surprise resides. This article provides authorization for the specific conservation program options the City may choose to operate within,
City of Surprise, Arizona Integrated Water Master Plan: Water Resources Update 04957020.0003
2-1
Section 2 Regulatory Framework
specific provisions that relate to assured water supply (AWS) certificates and designations and the adoption of administrative rules needed to carry out the provisions of the statutes, and the requirements for planning by the replenishment district and water conservation and water district plans. ADWR must adopt a series of management plans for each AMA designed to achieve the AMA's management goal. The management goal for the Phoenix AMA is safe-yield (A.R.S. § 45-562). Safe-yield is a long-term balance between the annual amount of groundwater withdrawn in the AMA and the annual amount of natural and artificial recharge in the AMA (A.R.S. § 45-561). Each management plan must include a continuing mandatory conservation program for all persons withdrawing groundwater in the AMA (A.R.S. § 45-563).
Chapter 2, Article 10 relates to wells (discussed further in Section 2.7).
Chapter 2, Article 11 relates to the financial provisions of the ADWR and the fees it may charge in its role administering the provisions of the Groundwater Code.
Chapter 2, Article 12 relates to the enforcement authority of the ADWR. Chapter 2, Article 15 relates to obtaining a Certificate of Groundwater Oversupply.
Chapter 3.1 addresses underground water storage, savings and replenishment (the relevant statutes that apply to the City are discussed in Section 2.3).
Chapter 4 addresses water exchanges.
The remaining chapters may, from time to time, affect various uses and management of water resources, but are very specific as to their application and tangential to the water resources planning and management functions.
2.1.1. Assured Water Supply Designation When the Groundwater Code was being developed, the State Groundwater Water Study Commission recommended that the State prohibit urban development in areas where no AWS (100 year supply) is available. The Groundwater Management Act codified this recommendation. In an AMA, a person proposing to sell subdivided or unsubdivided land must obtain a certificate of AWS from the director of ADWR prior to any sale. Alternatively, the director of ADWR designates service areas of cities, towns, and private water companies where assured water supplies exist. As a result, developers within designated service areas are not required to obtain their own certificates of AWS.
The director of ADWR has adopted rules to implement the AWS provisions. These rules are located under the Arizona Administrative Code (AAC) Title 12, Natural Resources, Number 15, Arizona Department of Water Resources, Article 7, Assured and Adequate Water Supply (A.A.C. R12-15-701 through R12-15-730). Under the rules, groundwater in the Phoenix AMA is "physically available" only if it is pumped from a depth that does not exceed 1,000 feet below land surface (A.A.C. R12-15-716.B.2). Central Arizona Project (CAP) water is physically available if the provider has a long-term subcontract for CAP water. Other CAP water is physically available only if the provider
2-2
Section 2
Regulatory Framework demonstrates a back-up supply of water. Surface water other than CAP water (such as water from the Agua Fria River) is physically available under a formula provided in the rules. If a proposed source of water for an AWS is water to be recovered from an underground storage project, the volume of water legally available is represented by stored water credits existing on the date of the application for designation of an AWS. If the applicant wants to use credits for stored water that do not exist at the date of the application, ADWR will consider the physical availability of the water to be stored and the presence of an existing storage project in determining whether to include the proposed credits.
The AWS rules limit the amount of groundwater a municipal provider may withdraw "consistent with the management goal" of the AMA. The volume of groundwater the provider may withdraw is calculated pursuant to rule A.A.C. R12-15-722 (A and B). The amount of groundwater use allowed can be increased through several mechanisms. The first increase to the allowed groundwater use is by an incidental recharge baseline factor of 4 percent of water use. The amount of groundwater use allowed may also be increased by the amount of credits obtained for the extinguishment of grandfathered water rights (extinguishment or assured water supply credits).
The Groundwater Management Act provides a mechanism for a designated provider to increase the amount of groundwater it may withdraw pursuant to the assured water supply rules. Under A.R.S. § 45-576.01, ADWR may find that a water provider's additional use of groundwater is consistent with the management goal if the provider is a member service area of the Central Arizona Groundwater Replenishment District (CAGRD) and ADWR has approved CAGRD's plan of operation. As long as the groundwater is physically available, the municipal provider may pump more groundwater than the assured water supply rules allow. However, as a member of CAGRD, the provider must pay CAGRD for the cost of recharging a like amount of water. CAGRD is discussed in more detail in Section 2.2.
Currently, the assured water supply rules state that the Director shall review a designation at least every 15 years following issuance of the designation to determine whether the City’s designation should be modified or revoked (A.A.C. R12-15-715.C). The Director may revoke the City’s designation if, after notification and initiating a review:
The City has less water than the amount required for a 100-year supply for the City’s current demand, committed demand, and projected demand for the next two calendar years;
The City fails to construct adequate delivery, storage, and treatment works in a timely manner; or
Arizona Department of Environmental Quality (ADEQ) or another governmental entity with equivalent jurisdiction has determined, after notice and an opportunity for
City of Surprise, Arizona Integrated Water Master Plan: Water Resources Update 04957020.0003
2-3
Section 2 Regulatory Framework
a hearing, that the designated provider is in significant noncompliance with A.A.C. 18, Chapter 4 and is not taking action to resolve the noncompliance.
The City of Surprise submitted an application for Modification of Designation of Assured Water Supply (DAWS) on December 16, 2008. ADWR issued the City its redesignation on September 29, 2010, requiring that the City submit the next application for modification by December 31, 2018 or when current and committed demands exceed 16,718 acre-feet per year (AFY), whichever occurs first. The September 29, 2010 DAWS is further described in Section 3.
2.1.2. Groundwater Rights The Groundwater Code created several different classes of groundwater rights within AMAs. With the exception of service area rights, no additional groundwater rights can be created within AMAs. There are provisions for other types of temporary groundwater withdrawals under permit systems.
Groundwater Rights were established during a period of qualification that preceded the passage of the Groundwater Management Act of 1980. This was a five year period from 1975 to 1980. Groundwater must have been used, or a substantial capital investment needs to have been made with the intent of using groundwater, during this period. These uses were grandfathered in, hence the term “grandfathered groundwater rights.”
Other than service area rights, which are discussed below, there are three basic classes of groundwater rights. The use of groundwater for commercial agriculture resulted in the establishment of Irrigation Grandfathered Groundwater Rights. These rights are appurtenant, or attached, to the land where the rights were established. With very few exceptions (substitution of lands damaged by floods, for example) these rights cannot be moved from the land where they were established.
If the land is to be converted to some other type of non-irrigation use, such as a dairy, golf course, residential subdivision, or industry, and the land is not located within a specified distance of an existing potable water provider, the irrigation right can be converted to a Type 1 non-irrigation right. This process is referred to as “retirement” since the irrigation use is retired to a non-irrigation use. This process is irreversible, meaning that once an irrigation right has been converted to a Type 1 non-irrigation right, it cannot be changed back for use on irrigated agriculture.
If groundwater was used for a non-irrigation use during 1975 to 1980, a Type 2 Grandfathered Groundwater Right was created. This right is unique in that it can be leased or sold to other water users anywhere within the AMA. With respect to a lease, the entire right or only a portion of it may be leased.
2-4
Section 2
Regulatory Framework 2.1.3. Service Area Rights Service area rights are unique in that they have the ability to be expanded, and they are the only groundwater right that can still be created (as such, these are not truly “grandfathered” groundwater rights) within an AMA. There are specific methods for expanding/extending existing service area rights, and for establishing new or “satellite” service areas.
2.1.4. Third Management Plan To achieve the management goal for each AMA, water management requirements are established in each of the five management periods. The Third Management Plan addressed the ADWR’s long term water management strategy, with particular emphasis on the third management period (2000- 2010).
The Plan is organized into 12 chapters that address water supply, demands, and management issues for the Phoenix AMA for all sectors of water use. It includes water conservation requirements for agricultural, municipal, and industrial groundwater uses; a water quality assessment and management program; an augmentation and recharge program; conservation and assistance programs; and other management programs.
Most of the requirements of the Plan are focused on water conservation. The primary goal of the municipal conservation program is to assist in moving the AMA toward safe yield by reducing per capita water consumptions, and encouraging the use of the best available water conservation practices, and maximizing the efficient use of all water supplies including the direct use of reclaimed water.
The Plan defines a “large provider” as those that serve water demands exceeding 250 AFY. The City’s water demands exceeded this level after the Third Management Plan was published. Thus, ADWR considers the City as being “in transition” to becoming a large provider. The distinction of being a large provider is that the focus is on meeting the water conservation requirements. In addition, the provider must manage its distribution system such that lost and unaccounted for water does not exceed 10 percent. Water that can be excluded from this provision includes water used for well purging, line flushing, estimated water use for construction (such as dust control), or fire services.
2.1.5. Fourth Management Plan While technically expired, the Third Management Plan is still in effect while ADWR continues the promulgation of the Fourth Management Plan. The Fourth Management Plan for the Phoenix AMA has not yet been released in draft form, but it is expected that there will be very little change to the conservation elements of the plan. ADWR staff does not currently have an estimated date for publication of the draft.
City of Surprise, Arizona Integrated Water Master Plan: Water Resources Update 04957020.0003
2-5
Section 2 Regulatory Framework
2.2. Central Arizona Groundwater Replenishment District 2.2.1. Background The genesis of the CAGRD is found in the ADWR Draft AWS Rules dated November 1988. The ADWR had proposed to significantly reduce the amount of groundwater that could be withdrawn for assured water supply purposes. For undeveloped (desert) lands, ADWR had proposed that 0.5 AFY of groundwater would be the maximum amount of water that could be used, which equates roughly to a 1 dwelling unit per acre density. For agricultural lands, this allocation of water was doubled to 1 AFY, or roughly two dwelling units per acre. After the year 2000, restrictions became more stringent. Additionally, the depth-to-water criteria were changed from 1,200 feet below ground surface to 1,000 feet in the Phoenix AMA. While this was a proposed rule package, it was also immediately adopted by ADWR as a statement of policy that implemented the new criteria as additional guidelines.
There was broad opposition to the proposed rules, especially from smaller cities and counties that did not have CAP subcontracts, agricultural interests, and the development community and the related industries (e.g., banking and housing construction). Many of the opposition arguments to the proposed rules felt that those cities that did not have to obtain an assured water supply designation until 2000 would have an advantage. Further, it was difficult to supplement water supplies since the CAP water was allocated, reclaimed water supplies were not necessarily under water provider’s control, and water farms were not viable because of costs and transportation issues. Others felt the density limitations were arbitrary and went beyond the authority of ADWR, that it imposed severe limitations many years prior to the requirement to achieve safe yield, and that the rules would have an immediate and potentially devastating effect on the economy of the State.
The ADWR amended its Statement of Policy on March 15, 1989. The ADWR would continue under the 1982 guidelines, but the rule-making process would continue. This resulted in several years of negotiations regarding the use of replenishment as a means of achieving consistency with the management goal.
There are two predecessors to the CAGRD: one for the Tucson AMA and a second for the Phoenix AMA. The Phoenix Groundwater Replenishment District was not formed; however, the legislation is still in place in an amended form.
In early 1992, ADWR issued a concept paper that explored three ways to address the consistency with the management goal requirement in the assured water supply process. The paper supported the replenishment model. Later that year, ADWR also issued proposed rules limiting the total groundwater amount that could be relied upon by those applying for an assured water supply, pressuring the water community to adopt groundwater replenishment district legislation.
2-6

Section 2
Regulatory Framework Since the Phoenix Groundwater Replenishment District did not form, a new bill was submitted and adopted in 1993 (Senate Bill 1425) that created the current CAGRD. At the time, one of the motivations was to encourage the full utilization of CAP water. Many believe the use of the Central Arizona Water Conservation District (CAWCD) to “house” the CAGRD was an advantage since the institution was already in place with an existing elected board and access to a water supply. Eventually, in 1995, ADWR adopted the assured water supply rules that drove the formation of the CAGRD.
2.2.2. Current Issues There are a host of issues being evaluated regarding the CAGRD. One of the issues is that the CAGRD only has to replenish withdrawals within the AMA, as opposed to being within the vicinity of where the water was extracted. There are those who believe this will encourage groundwater pumping from areas adjacent to their well fields, while the replenishment of the withdrawn water will occur elsewhere within the AMA.
Another issue of concern is that home buyers who purchase a resale home in areas that are not served by a designated provider will not be aware that they will be paying a tax to replenish the groundwater that has been delivered to them. Secondary to this concern is that the cost of replenishment has continued to escalate dramatically as CAGRD attempts to secure renewable water supplies in a very restricted and competitive market – in fact, in a market that is placing the CAGRD in direct competition with individual water providers who are trying to secure their own independent water supplies so that they can avoid paying the CAGRD and be “water independent.”
Rapid enrollment has also been of concern. In the last real estate development rush, many more lands were enrolled than anticipated within the CAGRD’s 10 year plan of operation. This has created an obligation for the CAGRD to obtain water supplies adequate to replenish water to meet this obligation; however, since much of the enrolled land has not developed, the CAGRD does not have sufficient revenue to acquire and develop the water supplies needed to support the level of the replenishment obligation. The majority of CAGRD’s revenues are realized only after its members actually pump excess groundwater, against which CAGRD can collect assessments.
As a partial resolution of the need to secure future water supplies, the CAGRD sought and received authorization to charge annual membership fees. This has allowed the CAGRD better ability to bond for future water acquisition in concert with elevated fees for replenishment activities.
In member service areas, developers must pay an activation fee to the CAGRD even if they somehow were able to provide a 100 year supply of water needed to support their project. There is no statutory exemption to provide relief if the developer is able to secure a 100 year supply (such as long term storage credits) from having to pay this fee.
City of Surprise, Arizona Integrated Water Master Plan: Water Resources Update 04957020.0003
2-7
Section 2 Regulatory Framework
The Arizona Municipal Water Users Association (AMWUA), has recently openly expressed concerns about the CAGRD. AMWUA states, “There is concern that CAGRD membership could outstrip water supplies for replenishment. There is also concern about what will happen if groundwater is no longer physically available.” Other concerns have been expressed regarding the apparent conflict facing the board of the CAWCD regarding operation of the CAP and the CAGRD, both of which are governed by the CAWCD board.
The CAGRD submitted a draft operating plan for the period 2015 through 2024 (the 2015 Plan of Operation) as rquired by A.R.S. 45-576.02.C.2. The draft plan indicates that CAGRD has reduced its estimate of future replenishment obligations in the 2005 Plan of Operation from 227,000 AFY to 133,000 AFY.
The draft plan states the CAGRD will seek to acquire approximately 50,370 AFY of additional water supplies over the next 20 years, and an additional 26,100 AF of annual entitlement over the subsequent 80 years. CAGRD states it currently holds rights to 36,530 AF of annual long-term supplies.
2.2.3. Contract Requirements Water providers have different forms of agreements with the CAGRD. Some have to replenish a portion of the water they use based upon a “grow in” formula that gradually escalates their obligation over time. Others have a set amount of groundwater they must replenish consistently through the term of their agreement. Still others have a cap on their replenishment agreement set to the limit of their assured water supply designation, meaning that they must renew a contract with the CAGRD upon modification of their designation. The City's CAGRD contract is a “grow in” that is at the maximum of 10/15, or 67 percent. The schedule in the contract does not, however, continue past 2014.
2.2.4. Membership According to the CAGRD draft 2015 Plan of Operation, the CAGRD currently has approximately 23 member service areas (water providers) and 1,090 member land subdivisions, with existing actual obligations currently calculated by CAGRD at nearly 35,000 AFY, and projected long-term replenishment obligations of up to 133,000 AFY. The number of member land subdivisions as of March 16, 2015 is listed at 1,106 according to the CAGRD web site, which represents an increase of 16 subdivisions from the draft 2015 Plan of Operation.
2.2.5. Benefits The primary benefit of membership in the CAGRD is that obtaining a modification to a designation of assured water supply is easier as the membership within the CAGRD automatically addresses the consistency with management goal requirement.
2-8
Section 2
Regulatory Framework 2.2.6. Liabilities Typically, the cost of using groundwater that must be replenished (defined as “excess groundwater” in the CAGRD rules) is very expensive as compared to the full cost of CAP water (currently $157/AF for CAP municipal and industrial (M&I) subcontract water. The only way to not pay ANY replenishment obligation to the CAGRD for member service areas is to account for groundwater as 100 percent recovered credits derived from water stored underground from permitted recovery wells. Even if a water provider has enough stored water credits to offset 100 percent of its groundwater use, if a well is not permitted as a recovery well, then the water extracted from that well is counted by ADWR as groundwater and may trigger the requirement to be replenished. The use of funds for replenishment takes away revenue that the water provider could use to secure additional credits, which would reduce the obligation to replenish by the CAGRD.
Since 2011, the CAGRD has established Annual Membership Dues (AMDs) for member lands and member service areas. Authorization for charging AMDs for member service areas is provided in A.R.S. 48-3779.D.2. The basis for determining AMDs for member service areas is quite complex. CAGRD uses the “Schedule AWS” in the member service areas annual water delivery and use reports to ADWR to project future demand. CAGRD staff may request additional information regarding the basis of demand projections and will consider renewable supplies not otherwise included in the member’s DAWS. CAGRD will also calculate the reliance on the CAGRD in the member’s current Designation Order.
For those members of the CAGRD where AMDs apply, the AMDs will be announced during each primary update rate-setting process. Primary AMD rate schedules will be for three years, and for updated AMD rate schedules.
2.3. Water Recharge, Underground Storage and Exchanges Title 45, Chapter 3.1 entitled “Underground Water Storage, Savings and Replenishment” governs the planning, design, operations and administration of groundwater recharge, and storage and recovery of surface water and reclaimed water. Article 1 covers the general provisions.
2.3.1. Recharge Within the ADWR, “recharge” is used to describe the addition of water to the aquifer without intent to establish storage credits to recapture the water through recovery wells. This may happen on rare occasions, but as water resources economics become more focused and relevant, it is likely that very few situations will occur where this is done. Recharge is more likely to be performed to satisfy a requirement to replenish water previously extracted from the aquifer as legally defined groundwater.
City of Surprise, Arizona Integrated Water Master Plan: Water Resources Update 04957020.0003
2-9
Section 2 Regulatory Framework
Except as provided for in the statutes governing the replenishment of groundwater, underground storage with the resulting storage credits then conveyed for “recovery” purposes to prevent water from being classified as groundwater will be the more likely method of operation.
The proper legal terminology used for what is typically thought of as recharge is “nonrecoverable water.” This is addressed under Article 3 of Chapter 3.1, A.R.S. §45-833.01.
2.3.2. Storage There are two permits involved in underground storage projects; they are the underground storage facility permit governed by Chapter 3.1, Article 2 of the A.R.S., and the water storage permit governed by Chapter 3.1, Article 3 of the A.R.S.
Underground storage facility permits regulate the “how” of underground storage. There are two types of physical facilities that are permitted:
Constructed – just as it says, a constructed facility would be a facility that is actually built such as spreading basins, injection wells, or vadose zone wells.
Managed – these are facilities where water is discharged into a natural stream and water is allowed to infiltrate through natural processes.
There is a third type of “facility” that is known as a “groundwater savings facility.” This is really more of a water exchange, and has also been called in-lieu or indirect underground storage. This typically is accomplished through the delivery of a renewable water supply (such as CAP water) to a user of groundwater (typically an irrigation district) that has access to a CAP canal but is unable to use CAP water directly because of institutional, financial, or other ADWR deemed appropriate reasons.
In this case, the renewable water is delivered to the irrigation district who agrees to reduce groundwater pumping gallon for gallon for the water being delivered. The entity providing the renewable water gets credits to the amount of water delivered minus transportation losses, and a 5 percent cut to the aquifer. This type of project is used to acquire credits quickly and inexpensively, and the user of the water (the irrigation district) also contributes to the cost of the water since they are saving energy by not pumping groundwater.
Water storage permits (and recovery well permits) are addressed under A.R.S. Title 45, Chapter 3.1, Article 3. The water storage permit is the permit that is issued to the entity that wishes to accrue the credits. In other words, this is the permit that regulates the “how much to whom” aspect of underground storage activities.
2-10
Section 2
Regulatory Framework Recovery well permits are required if stored water credits are to be withdrawn from a well. An existing well can be permitted as a recovery well, subject to approval of an application to ADWR that demonstrates that other wells in the vicinity will not be harmed by the recovery of stored water from the well. Water may be recovered from any well located within the same AMA subject to the conditions issued pursuant to the permit. The water recovered from the well retains the identity of the water when it was stored. In other words, if CAP water was stored, it is accounted for as recovered CAP water for the purposes of annual reporting to the ADWR.
2.3.3. Exchanges Water exchanges are covered under A.R.S Title 45, Chapter 4. A.R.S. § 45-1001 defines a water exchange as “a trade between one or more persons, or between one or more persons and one or more Indian communities, of any water for any other water, if each party has a right or claim to use the water it gives in trade.” A.R.S. Title 45, Article 2 addresses the enrollment of water exchange contracts, which is specific to contracts and amendments that pre-date 1994 and 1995, respectively. A.R.S. Title 45, Article 3 addresses applications, fees and permits for water exchanges.
2.4. Central Arizona Project Subcontract In order for a water provider to obtain and use CAP water, it must have a valid executed agreement with the CAWCD. The CAWCD administers and manages the CAP under its contract with the United States Bureau of Reclamation (USBR) for the State of Arizona.
The City of Surprise apparently did not acquire an initial allocation of CAP water during the initial contracting period. However, as a result of urbanizing lands within the McMicken Irrigation District, the City has acquired a substantial allocation of CAP water. In addition, the City acquired additional CAP water through the Arizona Water Settlements Act, known as Indian Settlement Water. The timeline and allocation amounts are discussed in detail in Section 3.
2.5. Maricopa Water District Agreements The Maricopa Water District (MWD), formally the Maricopa Water Conservation and Drainage District, has storage rights within the reservoir behind the New Waddell Dam. This storage was created with the construction of the original Waddell Dam that was replaced and the reservoir enlarged as part of the Central Arizona Project construction. The increased space is used to store CAP water on a seasonal basis. As a condition of construction, an agreement between the MWD and the United States Bureau of Reclamation quantified and protected the storage rights of the MWD.
Currently, the City does not have any formal agreements with MWD. As MWD lands urbanize, the City could approach MWD and ask to enter into an agreement with the
City of Surprise, Arizona Integrated Water Master Plan: Water Resources Update 04957020.0003
2-11
Section 2 Regulatory Framework
MWD to secure the ability to take the water appurtenant to the lands served by the City within MWD’s service area and treat it (or have it treated) to potable standards for delivery to those lands. MWD and the City will both become agents of the land owner in this way, but the rights to the water still remain with the owner of the land to which the water rights are appurtenant.
The City could also elect to have MWD continue to directly serve lands water for urban irrigation as an untreated water provider. The advantage of this option is that the surface water component of the MWD supply does not count against the City’s Designation of Assured Water Supply, nor does it incur an obligation for replenishment for the portion of MWD water that is groundwater. The disadvantage is that the potable water demands for these lands would still have to be met with water treated by the City and supplied from MWD, or satisfied with other water supplies acquired and managed by the City.
2.6. City Ordinances, Rules, and Policies The City does not have any specific rules or ordinances related to water resources; however, several City documents provide guidance on the design of water, wastewater, and reclaimed water infrastructure. Please refer to the following documents for the most current guidelines and policies:
General Plan
Integrated Water Master Plan: Water Resources and Water Infrastructure Water Guidelines and Standards
Engineering Development Standards
In the event that there is a conflict between any of these documents and individual development agreements, the development agreements will prevail.
2.7. Arizona Well Spacing and Well Impact Rules The ADWR new well spacing rules for non-exempt wells drilled in AMAs became effective on August 7, 2006 (Arizona Administrative Code, R12-15-1301 through R12-15-1308). According to ADWR, “The rules are designed to prevent unreasonably increasing damage to surrounding land or other water users from the concentration of wells. The well spacing criteria address three types of unreasonably increasing damage: (1) additional drawdown of water levels at neighboring wells of record; (2) additional regional land subsidence; and (3) migration of contaminated groundwater to a well of record.” The following discussion provides a general summary of the well spacing requirements as they apply for most new service area production wells. New production well(s), may not cause more than 10 feet of additional drawdown after the first five years of operation on one or more wells of record in existence as of the date
2-12
Section 2
Regulatory Framework of receipt of the application to construct new well(s). The owner of the new production well will generally have the following options to address this issue: Attain a written consent form from the owners of effected well(s) of record
consenting to the withdrawals from the proposed well; Reduce the planned pumping rate for the proposed well to reduce the drawdown
impact on the well(s) of record; and Move the proposed location of the new well further away from potentially effected
well(s) of record. If the proposed well is also planned to be permitted as a recovery well, the owner may submit a hydrological study to ADWR that demonstrates that the new well will be located within the area impact of an underground storage facility, and that the owner will account for all of the water recovered from the well as water stored at the facility. The owner of new well(s) that will be located in an area of known land subsidence may be required to submit a hydrological study or geophysical study to demonstrate the impact of the withdrawals from the proposed well or wells. In other words, the owner will be required to demonstrate that the new production well(s), at its proposed pumping rate and location, will not significantly contribute to additional land subsidence in the area. The owner of new production well(s) that will be located in close proximity to a area of known groundwater contamination may be required to submit a hydrologic study to demonstrate that the new production well at its proposed pumping rate and location will not result in degradation of the quality of the water withdrawn form a well of record so that the water will no longer be useable for the purpose for which it is currently being used without additional treatment.
2.8. Water Reuse Regulations The following describes the institutional and regulatory environment that relates to water reuse planning and reuse infrastructure design, construction and operation.
2.8.1. Aquifer Protection Permit The Environmental Quality Act of 1986 provided for replacement of the former State Groundwater Quality Protection permit program with the Aquifer Protection Permit (APP) Program. In December 2000, modifications to the APP Rules were made final and codified in Arizona Administrative Code (AAC) Title 18, Chapter 9, Articles 1 through 3. Under the revised Rules, regulated facilities will be issued either an individual or a general permit. Facilities requiring APPs include: drywells, industrial facilities, mining facilities, wastewater facilities, and solid waste disposal facilities.
City of Surprise, Arizona Integrated Water Master Plan: Water Resources Update 04957020.0003
2-13
Section 2 Regulatory Framework
For wastewater treatment facilities, the APP Program requires facilities to obtain an individual APP and to use best available demonstrated control technology (BADCT) to achieve the greatest degree of discharge reduction determined for a facility. ADEQ will incorporate treated wastewater discharge limitations and associated monitoring specified in the Rules into the individual permit to ensure compliance with the BADCT requirements. The applicant must prove the technical adequacy of the facility to meet treatment objectives; demonstrate financial capability to construct, operate, and close the facility; and develop a contingency plan that includes an emergency response plan. Each of the City’s water reclamation facilities (WRFs) requires an APP.
In January 2001, ADEQ promulgated a new unified permitting approach for wastewater treatment, collection, reuse, and recharge systems. The APP program Rules were expanded to include all categories of discharge, and the previously existing sewerage rules were repealed and placed in the APP Rules. The rules for the direct use of reclaimed water, which also include a new permit program, were also updated at the same time as the APP Rules. The new APP Rules also eliminated the Approval to Construct (ATC) and Approval of Construction (AOC) processes, modified definitions of BADCT for water reclamation facilities (WRFs), and incorporated guidelines and requirements of ADEQ’s Engineering Bulletin Nos. 11 and 12. Although the formal ATC and AOC processes have been eliminated from ADEQ, within Maricopa County, the Maricopa County (MCESD) will continue to review construction plans and specifications and will inspect facilities without notice to ensure that construction generally conforms to the design as part of the APP review and approval process.
2.8.2. Arizona Pollutant Discharge Elimination System Permit Federal regulatory restrictions apply to discharges from WRFs to watercourses in Arizona. The National Pollutant Discharge Elimination System (NPDES) permit program establishes discharge quality requirements enforced through monitoring and reporting. The United States Environmental Protection Agency (USEPA) relies on both Federal Clean Water Act mandates and State Surface Water Quality Standards in developing plant-specific discharge standards for NPDES permits. USEPA is responsible for regulating the NPDES permit program unless it has approved a state NPDES program. In the past, many NPDES permits were researched and drafted by the ADEQ and issued by USEPA.
In June 2002, Articles 9 and 10 were added to AAC, Chapter 9, which codified the new Arizona Pollutant Discharge Elimination System (AZPDES). On December 5, 2002, Arizona received approval from the USEPA to operate the NPDES Permit program on the state level. Arizona now administers any permit authorized or issued under the NPDES program, including expired permits that USEPA has continued in effect.
2-14
Section 2
Regulatory Framework For any City water reuse opportunities resulting in discharge to or recharge in a waterway, an AZPDES permit will be necessary.
2.8.3. ADEQ Reuse Regulations The AAC, Title 18, Chapter 11, Article 3 details the reclaimed water use and quality standards that became effective January 2001. Theregulations identify beneficial means of reuse and identify the minimum reclaimed water quality requirements for each. Reclaimed water can be used for landscape irrigation, including irrigation of golf courses, parks, highway landscapes, cemeteries, greenbelts, common areas, and large turf areas. If adequately treated, reclaimed water can be used safely to irrigate school grounds, playgrounds, and residential lawns. Reclaimed water can be used to create artificial lakes, lagoons, ponds, and other recreational and landscape water features.
Classes of Reclaimed Water
The Rules establish five classes of reclaimed water: Classes A+, A, B+, B, and C. The classes are expressed as a combination of minimum treatment requirements and a set of numeric reclaimed water quality criteria. For reuse applications where there is a relatively high risk of human exposure to the reclaimed water, Class A reclaimed water is required. Where the potential risk to public health is lower, Class B and Class C reclaimed water are acceptable.
Table 2-1 summarizes the current numeric criteria, required treatment levels, and allowable uses for Classes A+, A, B+, and B reclaimed water. Class C is not included in the table because none of its acceptable uses are anticipated in Surprise.
The two “+” categories of reclaimed water include nitrogen removal requirements to produce reclaimed water with a total nitrogen concentration of less than 10 milligrams per liter (mg/L). These two categories minimize the risk of nitrate contamination of groundwater that may lie below reuse application sites. The Rules do not require the “+” categories of reclaimed water for reuse; however, the current APP regulations require nitrogen removal to 10 mg/L total nitrogen for groundwater recharge.
City of Surprise, Arizona Integrated Water Master Plan: Water Resources Update 04957020.0003
2-15
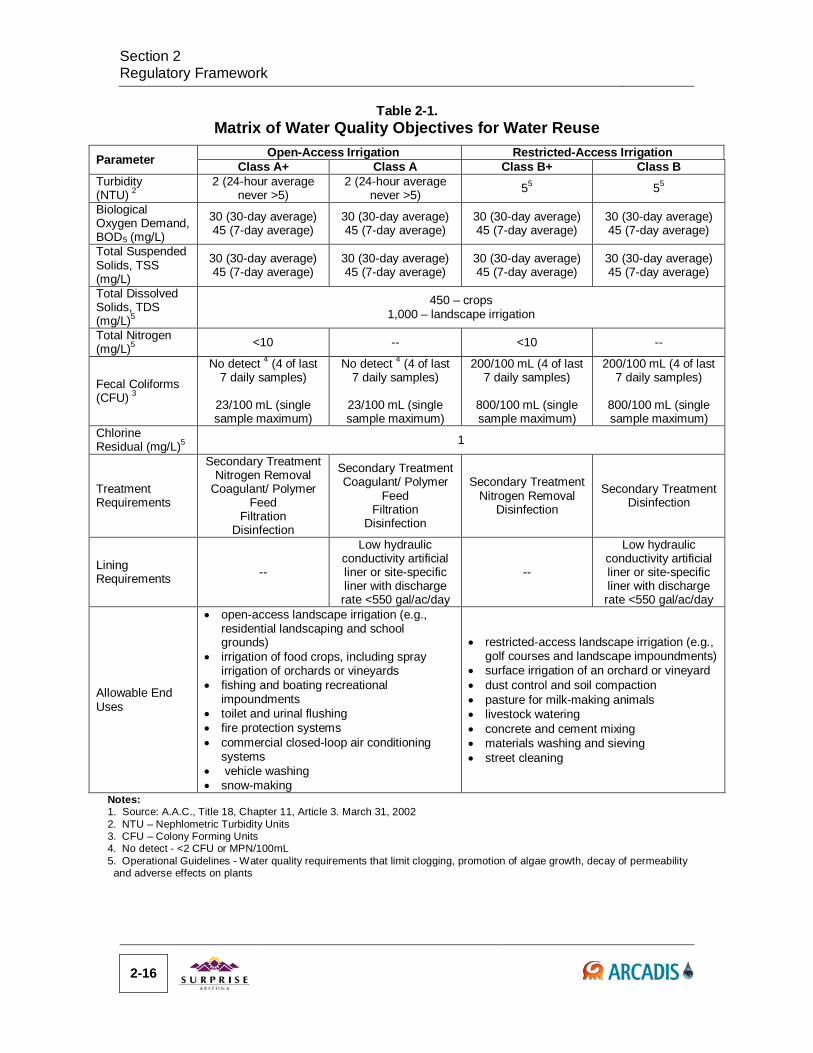
Section 2 Regulatory Framework
Table 2-1.
Matrix of Water Quality Objectives for Water Reuse
Parameter Open-Access Irrigation Restricted-Access Irrigation Class A+ Class A Class B+ Class B
Turbidity (NTU) 2
2 (24-hour average never >5)
2 (24-hour average never >5) 55 55
Biological Oxygen Demand, BOD5 (mg/L)
30 (30-day average) 45 (7-day average)
30 (30-day average) 45 (7-day average)
30 (30-day average) 45 (7-day average)
30 (30-day average) 45 (7-day average)
Total Suspended Solids, TSS (mg/L)
30 (30-day average) 45 (7-day average)
30 (30-day average) 45 (7-day average)
30 (30-day average) 45 (7-day average)
30 (30-day average) 45 (7-day average)
Total Dissolved Solids, TDS (mg/L)5
450 – crops 1,000 – landscape irrigation
Total Nitrogen (mg/L)5 <10 -- <10 --
Fecal Coliforms (CFU) 3
No detect 4 (4 of last 7 daily samples)
23/100 mL (single sample maximum)
No detect 4 (4 of last 7 daily samples)
23/100 mL (single sample maximum)
200/100 mL (4 of last 7 daily samples)
800/100 mL (single sample maximum)
200/100 mL (4 of last 7 daily samples)
800/100 mL (single sample maximum)
Chlorine Residual (mg/L)5 1
Treatment Requirements
Secondary Treatment Nitrogen Removal
Coagulant/ Polymer Feed
Filtration Disinfection
Secondary Treatment Coagulant/ Polymer
Feed Filtration
Disinfection
Secondary Treatment Nitrogen Removal
Disinfection
Secondary Treatment Disinfection
Lining Requirements --
Low hydraulic conductivity artificial liner or site-specific liner with discharge rate <550 gal/ac/day
--
Low hydraulic conductivity artificial liner or site-specific liner with discharge rate <550 gal/ac/day
Allowable End Uses
• open-access landscape irrigation (e.g., residential landscaping and school grounds)
• irrigation of food crops, including spray irrigation of orchards or vineyards
• fishing and boating recreational impoundments
• toilet and urinal flushing • fire protection systems • commercial closed-loop air conditioning
systems • vehicle washing • snow-making
• restricted-access landscape irrigation (e.g., golf courses and landscape impoundments)
• surface irrigation of an orchard or vineyard • dust control and soil compaction • pasture for milk-making animals • livestock watering • concrete and cement mixing • materials washing and sieving • street cleaning
Notes: 1. Source: A.A.C., Title 18, Chapter 11, Article 3. March 31, 2002 2. NTU – Nephlometric Turbidity Units 3. CFU – Colony Forming Units 4. No detect - <2 CFU or MPN/100mL 5. Operational Guidelines - Water quality requirements that limit clogging, promotion of algae growth, decay of permeability
and adverse effects on plants
2-16
Section 2
Regulatory Framework Class A+ reclaimed water has undergone secondary treatment, filtration, nitrogen
removal treatment, and high-level disinfection. A water reclamation facility producing Class A+ water must have chemical addition facilities such that it has the capability of adding coagulants or polymers if they are necessary to achieve consistent compliance with the Class A+ reclaimed water quality criteria. The chemical addition facilities may remain idle if the turbidity criteria for filtered effluent prior to disinfection can be met without chemical addition. Impoundments storing Class A+ reclaimed water are not required to be lined.
Class A reclaimed water is a Class A+ reclaimed water without the nitrogen removal requirement. Impoundments storing Class A reclaimed water are required to be lined. Classes A+ and A reclaimed water may be safely used for any listed reuse application.
Class B+ reclaimed water has undergone secondary treatment, nitrogen removal treatment, and disinfection. Impoundments storing Class B+ reclaimed water are not required to be lined.
Class B reclaimed water is a Class B+ reclaimed water without the nitrogen removal requirement. Impoundments storing Class B reclaimed water must be lined.
Class C reclaimed water has been treated in wastewater stabilization ponds or in a lagoon system. Class C reclaimed water is acceptable for irrigation of pasture for non-milking animals, livestock watering, sod farm irrigation, silviculture, and irrigation of fiber, seed, forage, and other nonfood crops.
Reclaimed water generated from the City’s existing and planned WRFs will meet Class A+ reclaimed water standards.
Reclaimed Water Permitting
AAC Title 18, Chapter 9, Article 7 presents permit monitoring requirements for the use of reclaimed water. These regulations place the burden of assuring reclaimed water quality at the place where wastewater is treated. Monitoring and reporting requirements are conditions within an individual APP for the WRF.
The Rule provides permitting options for a person to act as a reclaimed water agent for multiple end users. The reclaimed water agent can operate under a Type 3 general or individual reclaimed water permit that would allow end users to receive reclaimed water from the reclaimed water agent for appropriate reuse applications without having to notify the ADEQ to obtain permit coverage. Type 2 and Type 3 general permits for end users require the applicant to receive a written verification from ADEQ before operating. A person holding a Type 3 reclaimed water permit for a reclaimed water agent is required to maintain a contractual agreement with each end user, stipulating end user responsibilities for signage, impoundment liner, and nitrogen management requirements.
City of Surprise, Arizona Integrated Water Master Plan: Water Resources Update 04957020.0003
2-17
Section 2 Regulatory Framework
The permits generally require the following:
Records and Reporting: The permittee must maintain records for five years on the direct reuse site, the volume of water applied monthly, the total nitrogen concentration of the water applied (except for A+ and B+ water), and the acreage and type of vegetation on which the reclaimed water is applied. The permittee must also submit annual reports to ADEQ identifying the volume of reclaimed water received, the type of reclaimed water application, the irrigation use, and acres irrigated.
Nitrogen Management: Unless the reclaimed water supplied is Classe A+ or B+, the permittee must ensure that storage impoundments are lined and that the application rates are based on one of the following: ADWR allotments, a water balance that considers consumptive use of the water, or an alternative method approved by ADEQ.
List of Impoundments: The permittee must provide a list of impoundments and liner characteristics.
Signage: The permittee must provide signage at the reuse site in accordance with guidelines contained in the regulations for the particular type of site and class of reclaimed water.
The City’s WRFs will produce Class A+ water, thereby allowing maximum flexibility with respect to direct use of reclaimed water. Producing Class A+ water also ensures that the water delivered meets the highest standards adopted in rule for human safety. Reuse permits will be necessary for all direct use of reclaimed water.
2.8.4. Underground Storage and Recovery of Reclaimed Water The statutes and rules governing underground storage and savings in general were discussed in Section 2.3. The discussion below points out water storage credits and permits as they relate to recharge and recovery of reclaimed water.
Stored Water Credits
Under the Underground Water Storage, Savings, and Replenishment Program, stored water credits may be accrued through direct underground storage or groundwater savings resulting from the use of reclaimed water (until 2025). Direct storage must be conducted in an underground storage facility permitted by the State and may either be constructed (designed and constructed to cause recharge for underground storage) or managed (utilizing the channel of a natural stream; i.e., river discharge). Groundwater savings must occur at a permitted groundwater savings facility that replaces an existing groundwater use on a gallon-for-gallon basis.
Stored water may either be used on an annual basis or credited to a long-term storage account. If the stored water belongs to a groundwater replenishment district, a conservation district, or a water district, it may be credited to that district’s master replenishment account. If stored water is recovered on an annual basis, it may be recovered
2-18

Section 2
Regulatory Framework any time during the calendar year in which it is stored. Excess water at the end of the calendar year may be credited to the storer’s long-term storage account.
Long-term storage accounts are divided into subaccounts, which correspond to active management areas, irrigation non-expansion areas, groundwater basins, groundwater sub-basins, and type of water. The appropriate subaccount is credited with one hundred percent of all recoverable water stored or saved. An exception to this is reclaimed water stored at a managed underground storage facility which does not add value to a national park, national monument, or state park, in which case only fifty percent of the recoverable water stored will be credited to the storer’s subaccount. Long-term storage credits may be: (1) pumped from a permitted recovery well meeting ADWR requirements, (2) assigned to another party, or (3) used for proof of assured or adequate water supply unless the credits result from reclaimed water storage at a managed underground storage facility.
The reclaimed water provider can recover the groundwater (pursuant to its long-term storage credits) anywhere within its service area. The recovered water is administered as reclaimed water by ADWR when recovered within the area of hydrogeologic influence and is not counted in the calculation of gallons per capita per day (gpcd) municipal conservation requirements. Reclaimed water recovered outside the area of hydrogeologic influence is included in the gpcd calculation. Recovery of long-term storage credits resulting from the storage of reclaimed water is not subject to the typical five percent “cut-to-the-aquifer” associated with storage of other renewable water resources.
The Underground Water Storage, Savings, and Replenishment Program provides the City an opportunity to receive storage credits for either direct underground storage of reclaimed water or groundwater savings due to the use of reclaimed water. The provisions of this Program offer a significant incentive to participate in regional recharge projects, to construct City-owned recharge facilities, to provide reclaimed water for exchanges, or to replace groundwater sources with reclaimed water for use in water features. The major advantage to the reclaimed water provider is a conversion of its non-potable reclaimed water resource to potable groundwater on a one-for-one basis.
The City’s current policy and practices are to recharge and store 100 percent of its reclaimed water. All of the City’s existing reclaimed water recharge facilities are permitted as underground storage facilities and the City holds all appropriate water storage permits.
Water Storage Permits
When stored water is recovered, it must be used in a manner that is consistent with the water use prior to storage. Reclaimed water that has been treated at a WRF can be used in any portion of the service area after recovery. In order to accrue credits for recharged
City of Surprise, Arizona Integrated Water Master Plan: Water Resources Update 04957020.0003
2-19
Section 2 Regulatory Framework
water, the City will obtain and maintain water storage permits for recharge of all reclaimed water.
Water Exchanges The 1980 Groundwater Management Act provides for a tool to manage groundwater resources through water exchanges. Water exchanges involve the exchange of one water supply for another, either to avoid the costs of physically moving water or to match water supplies of varying qualities with appropriate uses. Utilizing canals for water exchanges involving reclaimed water is currently only permitted if the canal water is only used for non-potable applications.
2.8.5. Clean Water Act Section 404 Section 404 of the Clean Water Act (CWA) establishes a permitting program to regulate excavation in waters of the United States. The program is jointly administered by USEPA and the Army Corps of Engineers with advisory input from U.S. Fish & Wildlife, National Marine Fisheries Services, and State Agencies, such as ADEQ, ADWR, and Arizona Game and Fish. If substantial areas of affected waterways are disturbed by excavation activities, biological evaluations, archaeological surveys, and other activities relevant to the affected area could be required. The 404 permit is issued by the United States Army Corps of Engineers (USACE), and certification is required by the State. If the City decides to pursue a recharge opportunity that intercepts on infringes in on a United States waterway, 404 permitting process will be triggered, and a USACE 404 permit may be required.
2.8.6. 208 Water Quality Management Plan Area-wide Waste Treatment Management Planning is authorized by the CWA, Section 208. It requires regional planning agencies to develop comprehensive Water Quality Management Plans (WQMPs). These plans identify existing and proposed wastewater treatment facilities to meet the anticipated municipal and industrial waste treatment needs of an area over a 20-year period and provide general planning guidance for non-point source, sludge, storm water, and other activities. The WQMPs assure the State’s water quality standards will be consistently maintained and provide control over the discharge or placement of dredged or fill material. The 208 WQMPs also provide the foundation for activity to be conducted pursuant to best management practices, which can be terminated or modified.
Under Section 208 in Arizona, the six Councils of Governments have been designated as planning agencies. As such, the COGs have been given this responsibility for developing the WQMPs. The original area-wide 208 WQMP for Maricopa County was prepared and adopted by the Maricopa Association of Governments (MAG) in 1979 and was updated in 1993 and 2002. Both USEPA Region IX and ADEQ review the plan and monitor implementation, and local governments implement the plan.
2-20
Section 2
Regulatory Framework The Area-wide Plans are incorporated into the State Water Quality Management Plans through the State Continuing Planning Process (CPP), as required under Section 303.e.(1) of the CWA. When construction projects, State Revolving Fund loans, or certain types of permit applications are submitted to ADEQ, the proposal must be reviewed for plan consistency. The CPP covers WQMP approval and amendment processes along with a discussion of permits and programs required to maintain consistency with the WQMP. The appendix section containing the WQMP requirements is continually used to help implement new amendments to the plan. The CPP represents an ongoing effort to develop and implement consistent and effective water quality management programs throughout the State.
The purpose of the 208 Consistency Review process, as required by Section 303, et. al., of the CWA, is to assure the proposed facility or usage will be consistent with the existing Certified Regional WQMP. Consistency Reviews are required for all the following types of projects:
AZPDES permits (new and renewals) New wastewater treatment facilities discharging over 3,000 gallons per day
Modifications to existing facilities, including, but not limited to:
• Change in design capacity
• Increase in the quantity of pollutants discharged
• Change in method of effluent disposal
• Change in the amount of effluent processed
• New subdivisions with conventional or alternative on-site treatment and flows over 3,000 gallons per day.
A facility that is not consistent with the 208 WQMP will be required to develop an amendment to the current 208 Regional Plan in their area, and the amendment must be approved by a public process. Inclusion of plans in the 208 WQMP is a prerequisite to obtain an AZPDES permit.
City of Surprise, Arizona Integrated Water Master Plan: Water Resources Update 04957020.0003
2-21

THIS PAGE INTENTIONALLY LEFT BLANK
3. Existing Water Supply Portfolio
This section discusses the City’s existing water resources that have been recognized by the ADWR. The discussion includes how these resources were secured by the City in terms of its physical and service capacity volumes, and how they are accounted for by the ADWR.
3.1. Existing Designation of Assured Water Supply The current provisions of the City’s Designation of Assured Water Supply are contained within the Decision and Order number AWS 2010-012, signed by the ADWR Director on September 29, 2010. The Designation recognized that the City’s projected and committed demands for 2020 are 16,718 acre-feet AFY, and that Surprise had demonstrated that after withdrawing 1,671,800 AF, or an average of 16,718 AFY over 100 years, of groundwater and stored water recovered outside the area of hydrologic impact, the depth to static water level within Surprise’s service area is not expected to exceed 1,000 feet below land surface.
Essentially, the Designation considers all water currently pumped from City wells to come from physically available groundwater. Effluent and CAP water recharge (underground storage) is considered outside the area of hydrologic impact, meaning that while the water pumped from the City’s existing wells can be counted as recovered effluent and CAP water, ADWR maintains there is no physical connection between the water being stored and the water being recovered. Therefore, the physically available groundwater will be diminished as the City continues to withdraw the water through its wells unless and until the City begins to store its effluent and CAP water within the same area the City withdraws water from its wells. The Designation determined that the City’s available 100-year water supply to satisfy the 2020 demands is 16,718 AFY. The available supply consists of physically available groundwater within the City’s service area, existing long-term storage credits, and effluent and CAP water stored and recovered “outside the area of hydrologic impact”.
It should be noted that two City wells were constructed within the designated area of hydrologic impact of an existing City recharge site, but the wells were not acknowledged in the Designation that was drafted and issued around the same time as the wells were constructed.
Table 3-1 presents a summary of currently available water resources according to ADWR’s Designated Provider Tracking Sheet for the City of Surprise.
City of Surprise, Arizona Integrated Water Master Plan: Water Resources Update 04957020.0003
3-1
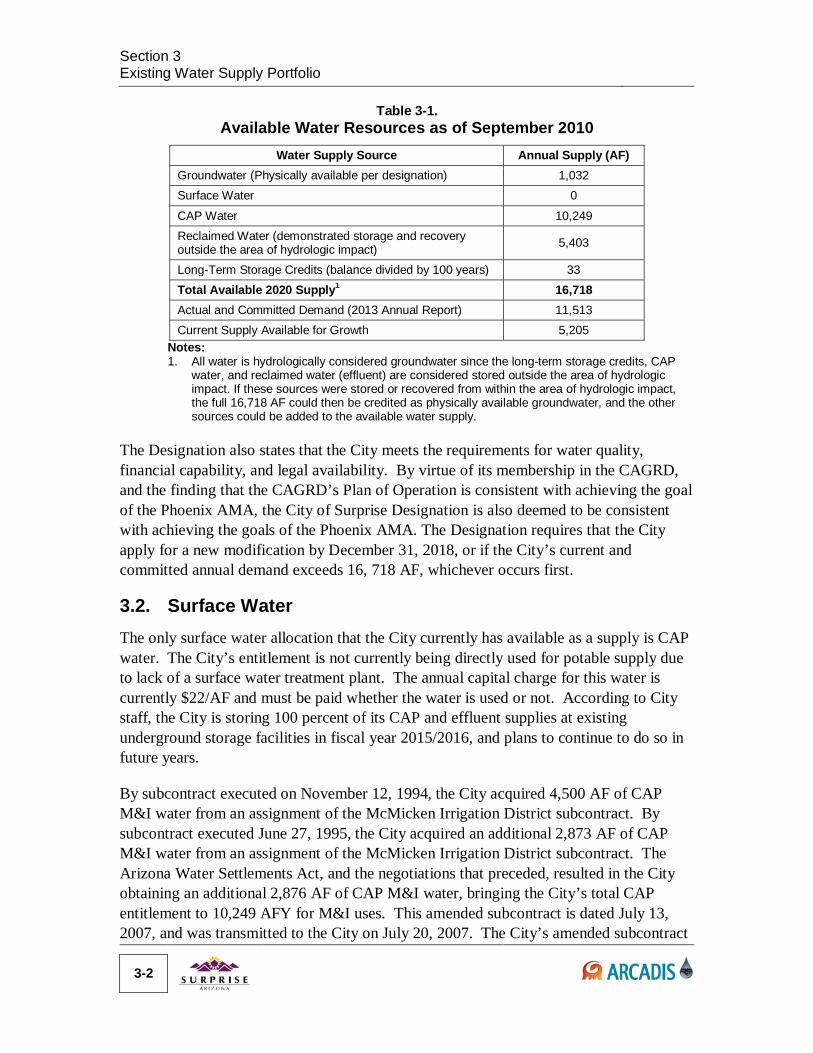
Section 3 Existing Water Supply Portfolio
Table 3-1.
Available Water Resources as of September 2010 Water Supply Source Annual Supply (AF)
Groundwater (Physically available per designation) 1,032 Surface Water 0
CAP Water 10,249 Reclaimed Water (demonstrated storage and recovery outside the area of hydrologic impact) 5,403
Long-Term Storage Credits (balance divided by 100 years) 33 Total Available 2020 Supply1 16,718 Actual and Committed Demand (2013 Annual Report) 11,513 Current Supply Available for Growth 5,205
Notes: 1. All water is hydrologically considered groundwater since the long-term storage credits, CAP
water, and reclaimed water (effluent) are considered stored outside the area of hydrologic impact. If these sources were stored or recovered from within the area of hydrologic impact, the full 16,718 AF could then be credited as physically available groundwater, and the other sources could be added to the available water supply.
The Designation also states that the City meets the requirements for water quality, financial capability, and legal availability. By virtue of its membership in the CAGRD, and the finding that the CAGRD’s Plan of Operation is consistent with achieving the goal of the Phoenix AMA, the City of Surprise Designation is also deemed to be consistent with achieving the goals of the Phoenix AMA. The Designation requires that the City apply for a new modification by December 31, 2018, or if the City’s current and committed annual demand exceeds 16, 718 AF, whichever occurs first.
3.2. Surface Water The only surface water allocation that the City currently has available as a supply is CAP water. The City’s entitlement is not currently being directly used for potable supply due to lack of a surface water treatment plant. The annual capital charge for this water is currently $22/AF and must be paid whether the water is used or not. According to City staff, the City is storing 100 percent of its CAP and effluent supplies at existing underground storage facilities in fiscal year 2015/2016, and plans to continue to do so in future years.
By subcontract executed on November 12, 1994, the City acquired 4,500 AF of CAP M&I water from an assignment of the McMicken Irrigation District subcontract. By subcontract executed June 27, 1995, the City acquired an additional 2,873 AF of CAP M&I water from an assignment of the McMicken Irrigation District subcontract. The Arizona Water Settlements Act, and the negotiations that preceded, resulted in the City obtaining an additional 2,876 AF of CAP M&I water, bringing the City’s total CAP entitlement to 10,249 AFY for M&I uses. This amended subcontract is dated July 13, 2007, and was transmitted to the City on July 20, 2007. The City’s amended subcontract
3-2
Section 3
Existing Water Supply Portfolio was ratified, confirmed and validated by the Maricopa County Superior Court January 22nd, 2009 (Case No. CV2008-023634).
3.3. Groundwater 3.3.1. Assured Water Supply Once a Designation of Assured Water Supply has been issued by ADWR, an initial allowance of groundwater may be credited to a water provider’s Designation of Assured Water Supply. Because the City was still classified as a small water provider at that time, it appears that it was not eligible to receive an initial allowance of groundwater in its account. This provision for those who may have qualified expired on February 7, 1995 (Administrative Rule R12-15-724.A.3).
According to Administrative Rule R12-15-724.A.4, for each calendar year of a designation, the director of ADWR shall calculate the volume of incidental recharge by multiplying the provider’s total water use from any source in the previous calendar year by the standard incidental recharge factor of 4 percent. This water is added to the groundwater allowance account and can be used to reduce the City’s replenishment obligation.
All grandfathered groundwater rights (Type 2 Non-Irrigation, Type 1 Non-Irrigation, and Irrigation) are eligible for extinguishment and the resulting credits can be pledged to a designated provider’s allowable groundwater account. According to the City’s 2004 Water Resources Master Plan, the City had 1,959.24 AF of credits pledged to its account at the time it had submitted its application for a designation of assured water supply.
According to ADWR records, the City currently has 44,129 AF in its groundwater allowance account. These credits can be used in the designation of assured water supply, but each credit can only be used once. Therefore, for the purposes of calculating the credits as a contribution towards an assured water supply, the total amount of credits must be divided by 100 years. In other words, the City's 44,129 AF of credits are equal to 441 AF per year for 100 years. However, these credits can be used, just as incidental recharge and groundwater allowance credits, to reduce the obligation to the CAGRD. Given the balance of these credits, and the City’s current intent to rely exclusively on recovered CAP and effluent, future extinguishment credits obtained by the City should not be pledged to its account. Instead, they can be remarketed to obtain revenues that can be used to increase long-term storage credits through market purchases when opportunities arise.
3.3.2. Central Arizona Groundwater Replenishment District The City is a member of the CAGRD. CAGRD membership satisfies one of the requirements for the City to maintain its Designation of Assured Water Supply known as consistency with the Management Goal. Currently, the City is striving to avoid paying
City of Surprise, Arizona Integrated Water Master Plan: Water Resources Update 04957020.0003
3-3
Section 3 Existing Water Supply Portfolio
replenishment obligations by accounting for water pumped from its wells as recovered water characterized either as effluent or CAP water.
The CAGRD rate for water use in the Phoenix AMA for 2015 is $574/AF. In 2013, the City reported that it had pumped approximately 7,550 AF of water from its wells. If this had been characterized as groundwater, the City would have incurred a replenishment obligation and a resulting cost of $3,835,400 to the CAGRD at the 2013 replenishment rate of $508/AF. Approximately 5,090 AF of the pumped water was characterized as annual stored and recovered CAP water with the balance being accounted for as recovered effluent. Using the recovered CAP water as an example, the total cost to deliver and store 5,090 AF in 2013 was $137/AF for a total of $697,330. The cost to replenish the same water in 2013 would have been $2,585,720. Therefore, just for using the recovered CAP water, the cost savings to the City was $1,888,390. The additional savings were obtained by using the effluent credits for the balance of the pumped water.
While very costly, the CAGRD does provide the City the ability to satisfy its full demand using groundwater if it chose to not store and recover or directly use its effluent and CAP water supplies.
3.3.3. Drought Exemption Groundwater Historically, the City has not received any drought exempt groundwater allocation. ADWR grants water providers a special drought pumping provision if they rely on surface water supplies that are constrained pursuant to a drought condition. Under these provisions, the amount of allowable groundwater pumping is quantified for each water provider that is not required to be replenished for that water year. Since the City is not reliant on surface water at this time, it has not had the opportunity to take advantage of this situation. In the future, if the City develops its CAP supplies using underground storage and recovery and/or developing a water treatment plant, the drought exemption provision may apply if M&I supplies are reduced due to drought conditions on the Colorado River. However, it is uncertain at this time how that would specifically affect the use of resources by the City, or to quantify how much water that might be.
Given the current conditions on the Colorado River, the City should begin to inquire with the ADWR regarding a drought exemption. Even if the City’s allocation is not reduced, a drought exemption would allow the City to use some of its pumped groundwater as groundwater exempt from CAGRD replenishment obligations, preserving that much additional CAP and effluent as stored water for future uses.
3.4. Reclaimed Water According to ADWR records, the City has been producing and using reclaimed water since 2002. Table 3-2 summarizes the reclaimed water production and use for the City for reporting years 2002 through 2013. It is assumed for the purposes of this document
3-4
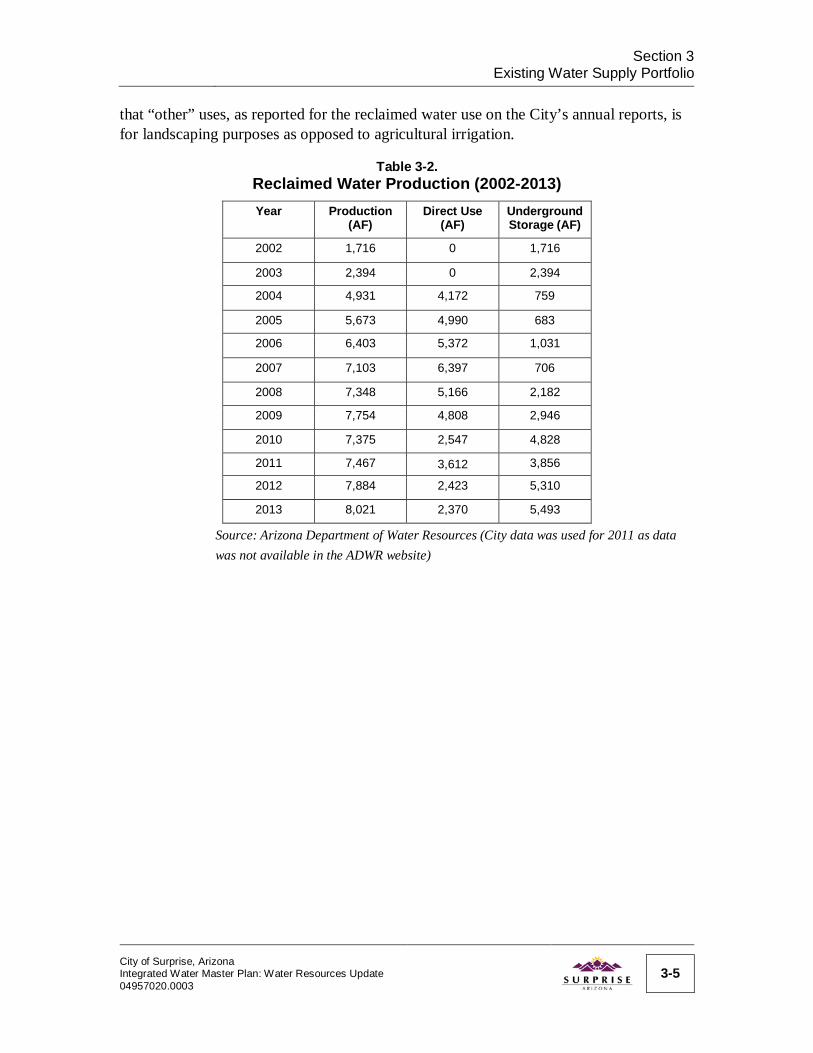
Section 3
Existing Water Supply Portfolio that “other” uses, as reported for the reclaimed water use on the City’s annual reports, is for landscaping purposes as opposed to agricultural irrigation.
Table 3-2. Reclaimed Water Production (2002-2013) Year Production
(AF) Direct Use
(AF) Underground Storage (AF)
2002 1,716 0 1,716
2003 2,394 0 2,394
2004 4,931 4,172 759
2005 5,673 4,990 683
2006 6,403 5,372 1,031
2007 7,103 6,397 706
2008 7,348 5,166 2,182
2009 7,754 4,808 2,946
2010 7,375 2,547 4,828
2011 7,467 3,612 3,856
2012 7,884 2,423 5,310
2013 8,021 2,370 5,493
Source: Arizona Department of Water Resources (City data was used for 2011 as data was not available in the ADWR website)
City of Surprise, Arizona Integrated Water Master Plan: Water Resources Update 04957020.0003
3-5

THIS PAGE INTENTIONALLY LEFT BLANK
4. Water Resources Infrastructure
This section describes the water and wastewater service providers within the City’s planning area and presents a brief summary of the existing and planned City water resources infrastructure and water quality.
4.1. Water and Sewer Service Providers Throughout the City’s MPA, there are 12 water service providers, including the City of Surprise (Figure 4-1). In SPA 1, the City of El Mirage provides water service to the Original Townsite. EPCOR Water, formerly Arizona American Water Company (AAWC), and the City of Surprise currently serve the remaining portions of the SPA 1. The City currently operates and maintains the drinking water system within its water service area.
In the remaining SPAs, the City plans to serve a majority of the area; however, there are nine other water service providers. As the City grows to the north, it may or may not choose to purchase the private water companies. Similarly, the City will have the option to serve reclaimed water within private water company service areas.
Throughout the City’s MPA, there are only two sewer service providers (Figure 4-2). While the City serves most of the planning area, EPCOR Water serves the Coyote Lakes development and various small pockets along Bell Road.
In 2008, the Steering Committee provided guidance that the current master plan should, as a baseline, consider the following planning areas:
Serving potable water to customers in all private water provider service areas, except the EPCOR Water and City of El Mirage service areas;
Serving reclaimed water to customers in all private water provider service areas, except the EPCOR Water and City of El Mirage service areas;
Providing wastewater collection and treatment services only within the City’s current sewer service area.
City of Surprise, Arizona Integrated Water Master Plan: Water Resources Update 04957020.0003
4-1
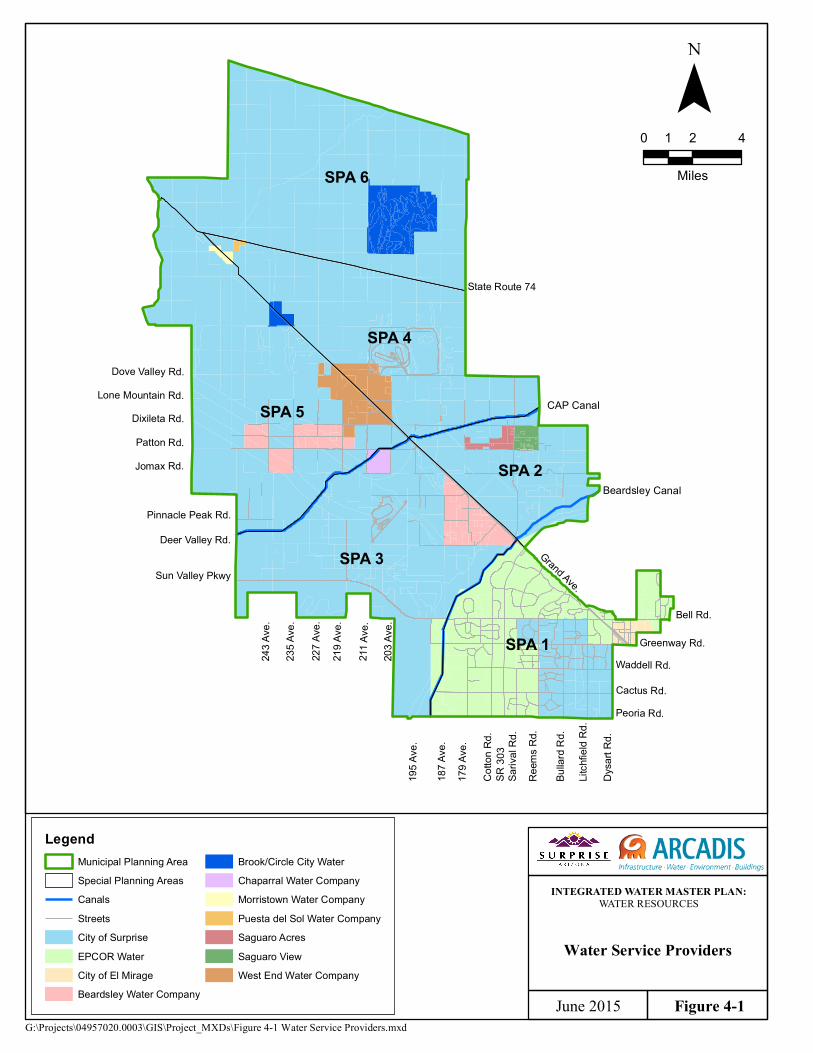
CAP Canal
Beardsley Canal
243 A
ve.
235 A
ve.
Sun Valley Pkwy
211 A
ve.
227 A
ve.
203 A
ve.
Patton Rd.
Grand Ave.
SR 30
3
Cactus Rd.
Reem
s Rd.
Waddell Rd.Greenway Rd.
Pinnacle Peak Rd.
Lone Mountain Rd.Dove Valley Rd.
State Route 74
Peoria Rd.
Sariv
al Rd
.
Cotto
n Rd.
Jomax Rd.
Dysa
rt Rd.
219 A
ve. Bell Rd.
187 A
ve.
179 A
ve.
Litch
field
Rd.
Deer Valley Rd.
Dixileta Rd.
Bulla
rd Rd
.
195 A
ve.
SPA 6
SPA 5
SPA 3
SPA 4
SPA 1
SPA 2
Figure 4-1
Water Service Providers
G:\Projects\04957020.0003\GIS\Project_MXDs\Figure 4-1 Water Service Providers.mxdJune 2015
INTEGRATED WATER MASTER PLAN:WATER RESOURCES
¯0 2 41
Miles
LegendMunicipal Planning AreaSpecial Planning AreasCanalsStreetsCity of SurpriseEPCOR WaterCity of El MirageBeardsley Water Company
Brook/Circle City WaterChaparral Water CompanyMorristown Water CompanyPuesta del Sol Water CompanySaguaro AcresSaguaro ViewWest End Water Company
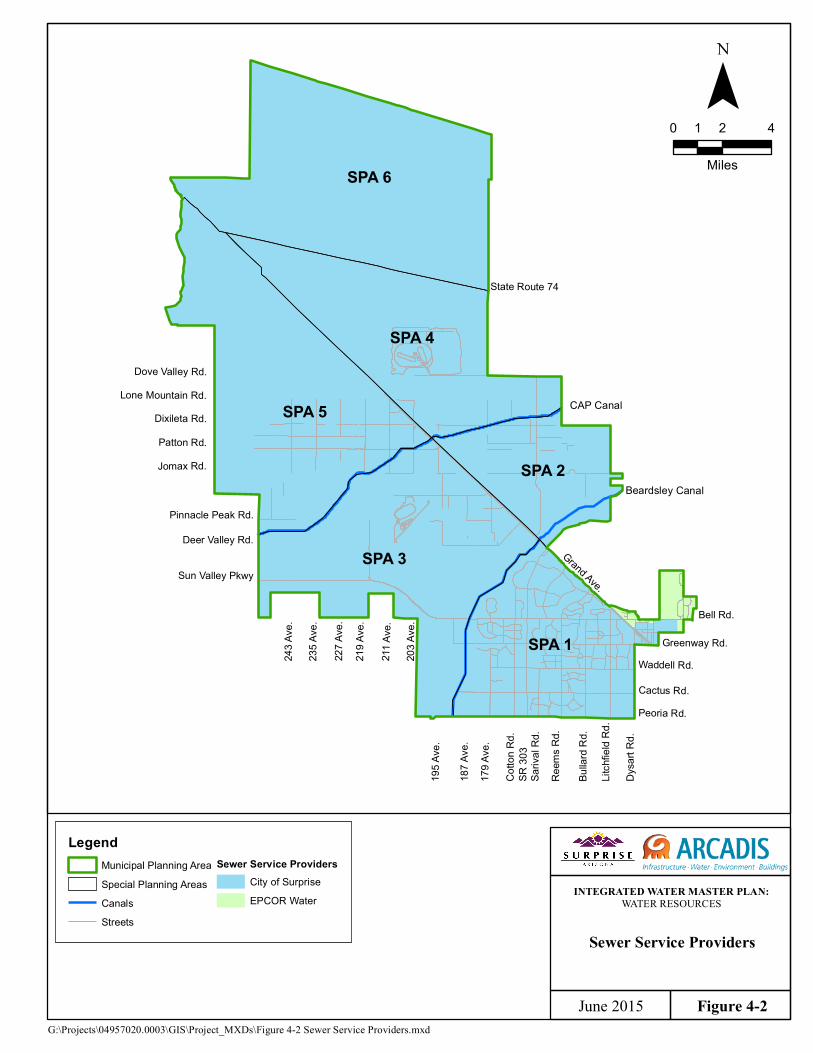
243 A
ve.
235 A
ve.
Sun Valley Pkwy
211 A
ve.
227 A
ve.
203 A
ve.
Patton Rd.
Grand Ave.
SR 30
3
Cactus Rd.
Reem
s Rd.
Waddell Rd.Greenway Rd.
Pinnacle Peak Rd.
Lone Mountain Rd.Dove Valley Rd.
State Route 74
Peoria Rd.
Sariv
al Rd
.
Cotto
n Rd.
Jomax Rd.
Dysa
rt Rd.
219 A
ve. Bell Rd.
187 A
ve.
179 A
ve.
Litch
field
Rd.
Deer Valley Rd.
Dixileta Rd.
Bulla
rd Rd
.
195 A
ve.
CAP Canal
Beardsley Canal
SPA 6
SPA 5
SPA 3
SPA 4
SPA 1
SPA 2
Figure 4-2
Sewer Service Providers
G:\Projects\04957020.0003\GIS\Project_MXDs\Figure 4-2 Sewer Service Providers.mxdJune 2015
INTEGRATED WATER MASTER PLAN:WATER RESOURCES
¯0 2 41
Miles
LegendMunicipal Planning AreaSpecial Planning AreasCanalsStreets
Sewer Service ProvidersCity of SurpriseEPCOR Water

Section 4 Water Resources Infrastructure
4.2. Existing and Planned Water Infrastructure The City’s existing and planned water resources infrastructure includes groundwater production wells, water supply facilities (WSFs), WRFs, and aquifer recharge facilities. Figure 4-3 illustrates the locations of the existing and currently planned water resources infrastructure. These facilities are briefly discussed in the following sections.
4.2.1. Groundwater Production Wells The existing and planned groundwater production wells for the City water service area were identified using the City’s water system GIS files and discussions with City staff. Sixteen groundwater production wells are currently used to meet water demands in the City’s service area and are operated and maintained by the City. The City’s existing wells have a firm capacity (defined by the City as 80 percent of the total well capacity) of approximately 25 mgd (28,000 AFY). A summary of the existing and planned wells is presented in Table 4-1.
4.2.2. Water Supply Facilities Water from production wells is routed to a regional WSF, where contaminants, if present above 80 percent the maximum contaminant level (MCL), are removed prior to entering the distribution system. The City currently owns 5 WSFs (Table 4-1), each accommodating between 2 to 10 production wells. Operation and maintenance of the facilities is currently provided by the City.
To date, the primary contaminant of concern is arsenic. At Ashton Ranch WSF, direct filtration with ferric chloride is used to remove elevated levels of arsenic in the groundwater. The City also operates arsenic treatment facilities at Roseview WSF (adsorption via granular ferric oxide media) and Rancho Gabriela and Desert Oasis WSFs (arsenic treatment facilities using direct filtration with ferric chloride). No other facilities require treatment at this time; however, arsenic, fluoride, and nitrate remain contaminants of concern for the future. The City’s recent Water Technology Assessment project considered site-specific constraints and identified potential treatment processes for these contaminants.
On-site chlorine generation is used for disinfection at the Rancho Gabriela WSF, and tablet chlorination is used at Desert Oasis and Roseview WSFs. The City replaced the tablet chlorinators at Ashton Ranch and Mountain Vista Ranch with on-site generation systems. Disinfection practices for future sites were also evaluated in the Water Technology Assessment project.
4-4
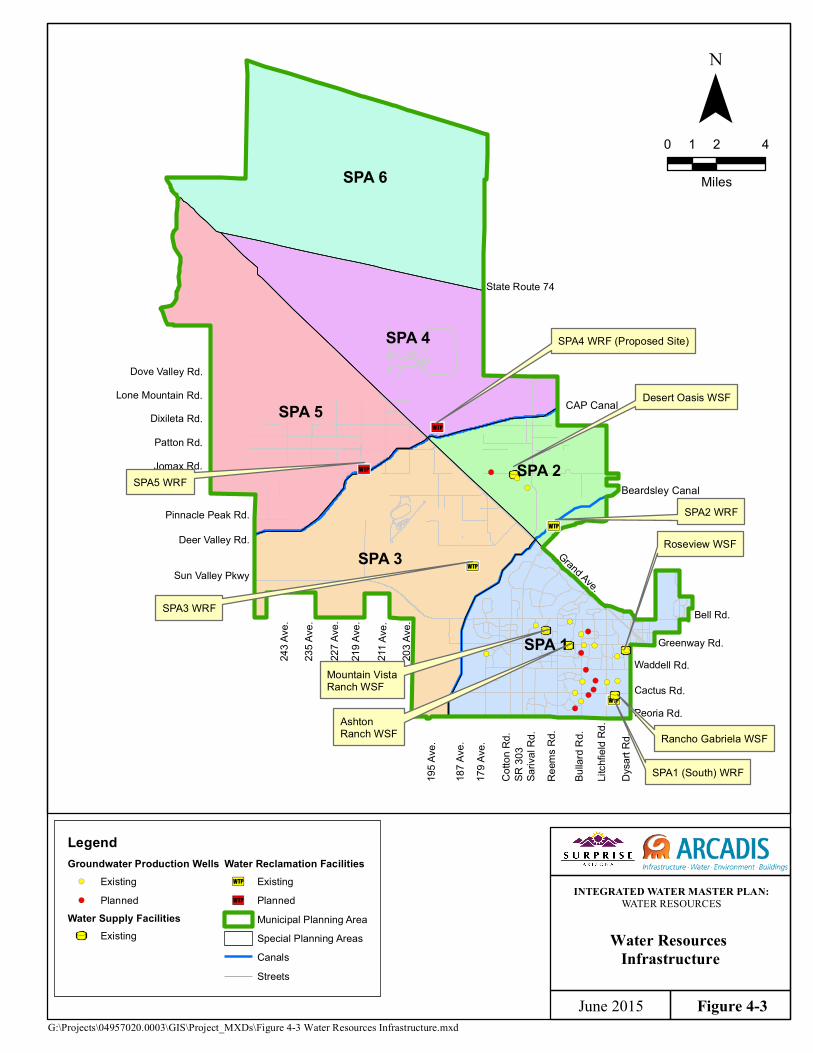
3Q
3Q
3Q
3Q
3Q
UT
UTUT
UT
UT!(
!(
!(
!(
!(
!(
!(
!(
!(
!(
!(
!(
!(!(
!(
!(
!(
!(
!(
!(!(
!(
!(
!(
!(
CAP Canal
Beardsley Canal
243 A
ve.
235 A
ve.
Sun Valley Pkwy
211 A
ve.
227 A
ve.
203 A
ve.
Patton Rd.
Grand Ave.
SR 30
3
Cactus Rd.
Reem
s Rd.
Waddell Rd.Greenway Rd.
Pinnacle Peak Rd.
Lone Mountain Rd.Dove Valley Rd.
State Route 74
Peoria Rd.
Sariv
al Rd
.
Cotto
n Rd.
Jomax Rd.
Dysa
rt Rd.
219 A
ve. Bell Rd.
187 A
ve.
179 A
ve.
Litch
field
Rd.
Deer Valley Rd.
Dixileta Rd.
Bulla
rd Rd
.
195 A
ve.
SPA 6
SPA 5
SPA 3
SPA 4
SPA 1
SPA 2
Figure 4-3
Water Resources Infrastructure
G:\Projects\04957020.0003\GIS\Project_MXDs\Figure 4-3 Water Resources Infrastructure.mxdJune 2015
SPA5 WRF
SPA4 WRF (Proposed Site)
SPA2 WRF
SPA3 WRF
SPA1 (South) WRF
Desert Oasis WSF
Mountain VistaRanch WSF
AshtonRanch WSF
Roseview WSF
Rancho Gabriela WSF
¯0 2 41
Miles
INTEGRATED WATER MASTER PLAN:WATER RESOURCES
LegendGroundwater Production Wells
!( Existing!( Planned
Water Supply FacilitiesUT Existing
Water Reclamation Facilities3Q Existing3Q Planned
Municipal Planning AreaSpecial Planning AreasCanalsStreets
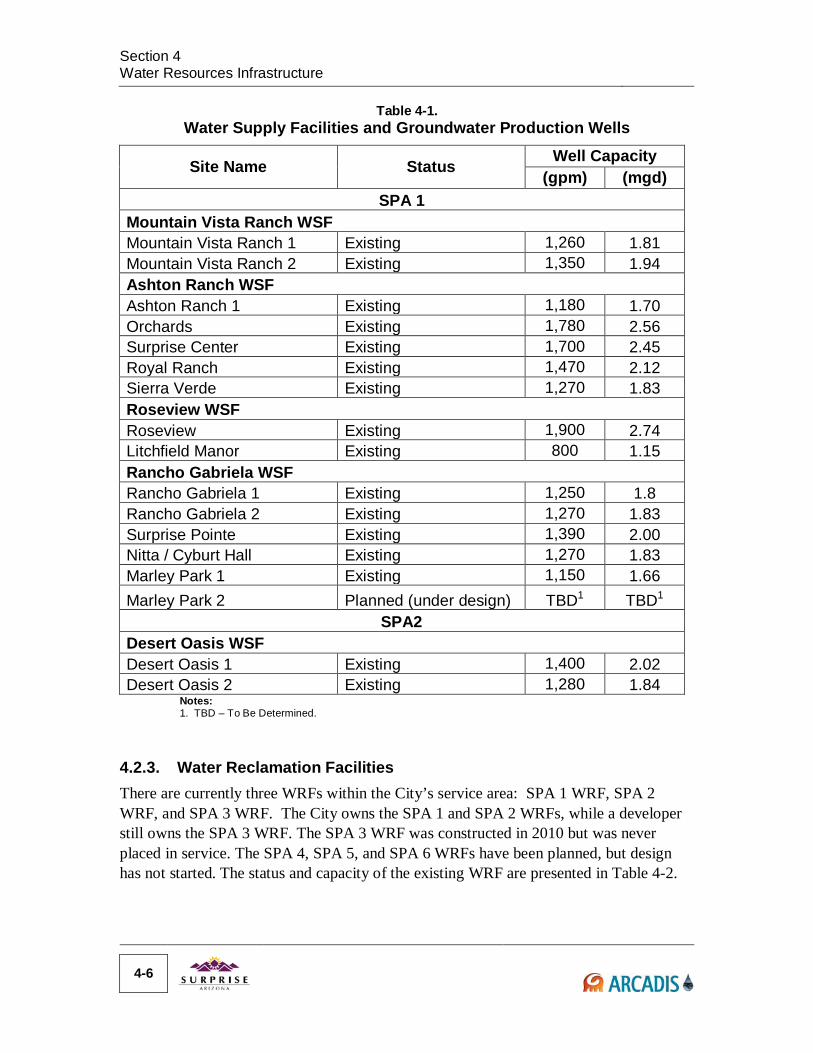
Section 4 Water Resources Infrastructure
Table 4-1.
Water Supply Facilities and Groundwater Production Wells
Site Name Status Well Capacity (gpm) (mgd)
SPA 1 Mountain Vista Ranch WSF Mountain Vista Ranch 1 Existing 1,260 1.81 Mountain Vista Ranch 2 Existing 1,350 1.94 Ashton Ranch WSF Ashton Ranch 1 Existing 1,180 1.70 Orchards Existing 1,780 2.56 Surprise Center Existing 1,700 2.45 Royal Ranch Existing 1,470 2.12 Sierra Verde Existing 1,270 1.83 Roseview WSF Roseview Existing 1,900 2.74 Litchfield Manor Existing 800 1.15 Rancho Gabriela WSF Rancho Gabriela 1 Existing 1,250 1.8 Rancho Gabriela 2 Existing 1,270 1.83 Surprise Pointe Existing 1,390 2.00 Nitta / Cyburt Hall Existing 1,270 1.83 Marley Park 1 Existing 1,150 1.66 Marley Park 2 Planned (under design) TBD1 TBD1
SPA2 Desert Oasis WSF Desert Oasis 1 Existing 1,400 2.02 Desert Oasis 2 Existing 1,280 1.84
Notes: 1. TBD – To Be Determined.
4.2.3. Water Reclamation Facilities There are currently three WRFs within the City’s service area: SPA 1 WRF, SPA 2 WRF, and SPA 3 WRF. The City owns the SPA 1 and SPA 2 WRFs, while a developer still owns the SPA 3 WRF. The SPA 3 WRF was constructed in 2010 but was never placed in service. The SPA 4, SPA 5, and SPA 6 WRFs have been planned, but design has not started. The status and capacity of the existing WRF are presented in Table 4-2.
4-6
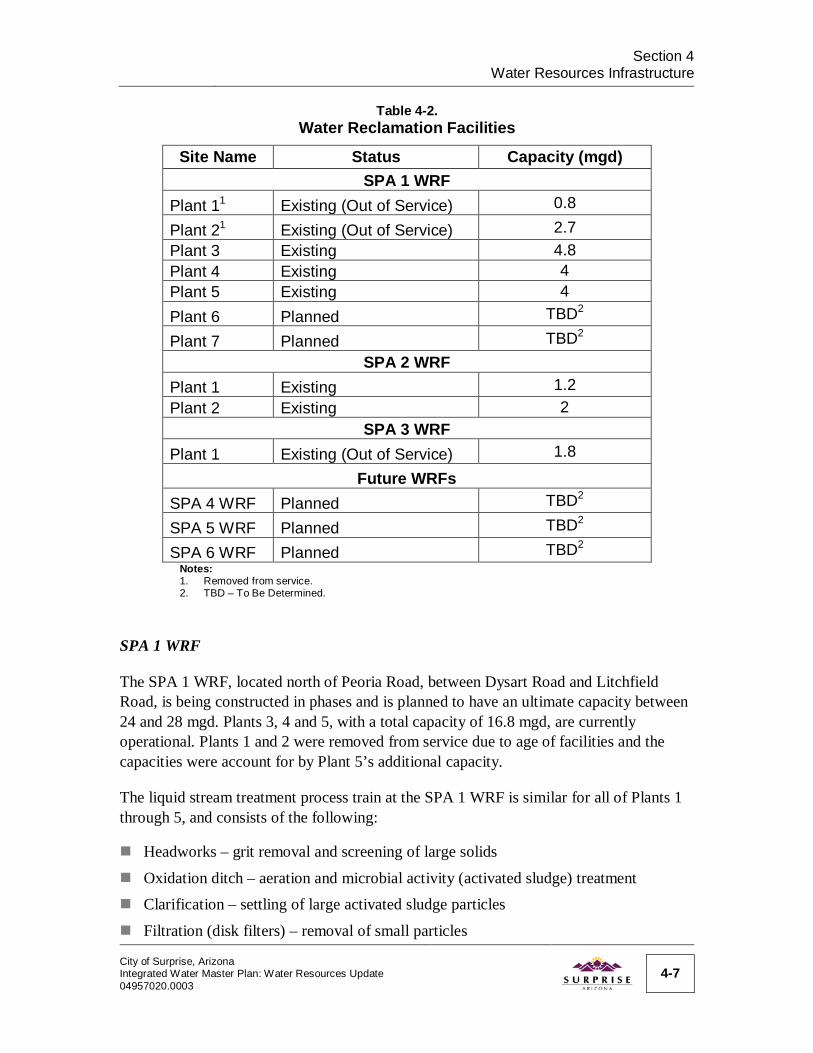
Section 4
Water Resources Infrastructure
Table 4-2. Water Reclamation Facilities
Site Name Status Capacity (mgd) SPA 1 WRF
Plant 11 Existing (Out of Service) 0.8
Plant 21 Existing (Out of Service) 2.7 Plant 3 Existing 4.8 Plant 4 Existing 4 Plant 5 Existing 4 Plant 6 Planned TBD2
Plant 7 Planned TBD2 SPA 2 WRF
Plant 1 Existing 1.2 Plant 2 Existing 2
SPA 3 WRF Plant 1 Existing (Out of Service) 1.8
Future WRFs SPA 4 WRF Planned TBD2
SPA 5 WRF Planned TBD2
SPA 6 WRF Planned TBD2 Notes:
1. Removed from service. 2. TBD – To Be Determined.
SPA 1 WRF
The SPA 1 WRF, located north of Peoria Road, between Dysart Road and Litchfield Road, is being constructed in phases and is planned to have an ultimate capacity between 24 and 28 mgd. Plants 3, 4 and 5, with a total capacity of 16.8 mgd, are currently operational. Plants 1 and 2 were removed from service due to age of facilities and the capacities were account for by Plant 5’s additional capacity.
The liquid stream treatment process train at the SPA 1 WRF is similar for all of Plants 1 through 5, and consists of the following:
Headworks – grit removal and screening of large solids
Oxidation ditch – aeration and microbial activity (activated sludge) treatment Clarification – settling of large activated sludge particles
Filtration (disk filters) – removal of small particles City of Surprise, Arizona Integrated Water Master Plan: Water Resources Update 04957020.0003
4-7
Section 4 Water Resources Infrastructure
Chlorination (on-site sodium hypochlorite generation) – disinfection of
microorganisms
Storage – lined basins for reuse and/or recharge
The SPA 1 WRF treatment process produces Class A+ reclaimed water. The reclaimed water from the chlorine contact chamber is either recharged in spreading basins or in vadose zone recharge wells. Reclaimed water that is not recharged is diverted through a series of pumps serving low-pressure and high-pressure reuse distribution systems.
SPA 2 WRF
The SPA 2 WRF, located south of Beardsley Canal at Pinnacle Peak Road, was constructed in phases. Phase 1 has a capacity of 1.2 mgd and uses a sequencing batch reactor (SBR) treatment process that produces Class A+ reclaimed water. Phase 2 of the SPA 2 WRF added an additional 2.0 mgd of capacity utilizing a membrane bioreactor (MBR) treatment process. Reclaimed water from the SPA 2 WRF is recharged in vadose zone recharge wells in SPA 2.
SPA 3 WRF
Construction of the SPA 3 WRF was completed in 2010, but was never placed in service. Once the area starts generating wastewater flows, the development group which built the WRF plans to vault the flows at a SPA 3 lift station and haul the flows to either the SPA 2 WRF or the SPA 1 WRF.
4.2.4. Recharge Facilities The City currently has three permitted recharge facilities, the SPA 1 WRF, SPA 2 WRF and SPA 3 WRF Recharge Facilities.
The City has been recharging reclaimed water at the SPA 1 WRF Recharge Facility under Underground Storage Facility (USF) Permit 71-562521.0003 since May 1998. The USF permit allows the City to recharge up to 8,066 AFY of reclaimed water, or the equivalent of 7.2 mgd. Due to poor infiltration rates in the spreading basins, the City constructed 20 vadose zone injection wells at the SPA 1 WRF with a capacity of 400 gallons per minute (gpm) per well.
The City obtained the SPA 2 WRF USF Permit 71-218761.0000 in September 2011. The USF permit allows the City to recharge up to 3,584 AFY of reclaimed water, or the equivalent 3.2 mgd.
The City obtained the SPA 3 WRF USF Permit 71-218760.0000 in January 2012. The USF permit allows the City to recharge up to 4,256 AFY of reclaimed water, or the equivalent 3.8 mgd.
4-8
Section 4
Water Resources Infrastructure 4.3. Water Quality 4.3.1. Surface Water At present, the only surface water available to the City is CAP and MWD water. Water quality data of the CAP and MWD water reaching the Surprise planning area were not available; however, other Phoenix-area cities have historically found CAP water easier to treat than other surface waters. CAP water does not require treatment if it is recharged. If potable water is desired, CAP water is typically treated using conventional water treatment technologies (coagulation, flocculation, and sedimentation followed by filtration and disinfection), pending a water quality study and treatment process evaluation.
4.3.2. Groundwater Groundwater entering the Ashton Ranch, Roseview, Rancho Gabriela, and Desert Oasis WSFs is treated for elevated levels of arsenic. After treatment, all WSFs will comply with both state and federal drinking water regulations.
4.3.3. Reclaimed Water The reclaimed water produced at the City’s existing WRFs meet Class A+ standards. Planned facilities will also produce Class A+ reclaimed water. Class A+ reclaimed water has undergone secondary treatment, filtration, nitrogen removal treatment, a high level of disinfection, and meets ADEQ water quality standards for water reuse (summarized in Section 2.8.3).
If used for deep well injection or aquifer storage and recovery (ASR), reclaimed water must meet drinking water standards to comply with APP and aquifer water quality standards. The additional treatment, including Total Organic Carbon (TOC) removal and disinfection by-product control, would be needed because there is no opportunity for additional subsurface treatment prior to the reclaimed water entering the aquifer.
City of Surprise, Arizona Integrated Water Master Plan: Water Resources Update 04957020.0003
4-9

THIS PAGE INTENTIONALLY LEFT BLANK
5. Water Resource Demand Projections
This section describes the methodology used to update water resource demand projections (drinking water, wastewater, and reclaimed water) and presents the baseline projections. Included are overviews of the demand projection methodology and the computer tool used to develop the projections, a review of the City’s land uses, and development of water resource demand factors.
5.1. General Overview To evaluate if a city has sufficient water for its residents and commercial customers, historical water consumption data are typically analyzed and used to project future water demands. The two most common methods to determine future water demands and wastewater flows utilize population and land use projections. Both methods are described below for projecting water demands, but apply to wastewater flows similarly.
The population-based method applies a unit per capita demand factor, in gallons per capita per day (gpcd), to population projections to determine future water demands. The unit per capita demand factor is determined by dividing a service area’s historical water demands by the historical population. The factor can be compared to nearby cities to confirm the value is indicative of the region.
The land use-based method applies land use-based demand factors, in gallons per acre per day (gpad) or gallons per day per dwelling unit (gpd/du), to a city’s land use projections to determine future water demands. Similar to the population-based method, demand factors based on historical water billing data can be compared to nearby cities.
Like the 2008 Integrated Water Master Plan, this Water Resources component update uses the land use-based method to project drinking water demands, wastewater flows (and, consequently, reclaimed water availability), and potential reclaimed water demands.
5.2. General Plan Land Use Categories The City’s General Plan 2035 Land Use Plan provides general guidelines for land use designations throughout the City’s MPA. For the purposes of the Water Resources component update, the most recent (June 2013) Land Use Plan was provided by the City (Figure 5-1). Definitions for each land use category obtained from the City’s General Plan 2035 are given below along with density ranges, in dwelling units per acre (du/acre), for each residential land use category:
City of Surprise, Arizona Integrated Water Master Plan: Water Resources Update 04957020.0003
5-1
Section 5 Water Resource Demand Projections
Rural Residential (0-1 du/acre) - This category is intended to be predominately
large-lot, single-family housing in a rural setting. Development in these areas consist mainly of homes with natural or consolidated open space on one acre lots (gross) or larger, ranging up to 10 acres in more remote, unincorporated areas in the county. The basic character of development is rural, with most natural features of the land retained. Keeping of horses or other livestock is permitted in certain areas subject to the adopted Rural Development Standards and Design Guidelines Policy. Public services are not required at a level as great as in higher density development. Limited commercial development serving the neighborhood may be allowed with desert conservation integrated into the site design.
Airport Preservation (0-2 du/acre) - This designation is used to protect both general aviation operations in and around existing and future airports/airparks, as well as to support the mission of Luke AFB, protecting it from encroachment. Land uses supported in this designation will include service uses, proving grounds, warehouse, Business Park, and/or manufacturing type industrial uses where appropriate. This land use is encouraged within the F-16 and future F-35 high noise impact areas and under the 65 Ldn (day-night sound level) boundaries. All future development within this category inside the high noise impact area shall be in compliance with A.R.S. section 28-8481.
Suburban Residential (1-3 du/acre) – This category is intended for large-lot, single-family housing. Suitability is determined on the basis of location, access, existing land use pattern, and natural and manmade constraints. Suburban Residential designated areas range from one to three dwelling units per acre. Limited neighborhood commercial is permitted in this category to serve local residents where deemed appropriate by the City.
Low Density Residential (3-5 du/acre) - This category is intended for predominantly single-family, detached residential development. Residential densities of up to five dwelling units per acre (gross) are typical of this category. In general these areas are quiet residential single-family neighborhoods but in some areas a mix of single-family, duplexes, townhouses, and low rise apartments would also be suitable, provided that the average density of such areas does not exceed five dwelling units per acre. This designation may also include such supporting land uses as neighborhood shops and services, parks and recreation areas, religious institutions, and schools. A full range of urban services and infrastructure is required.
5-2
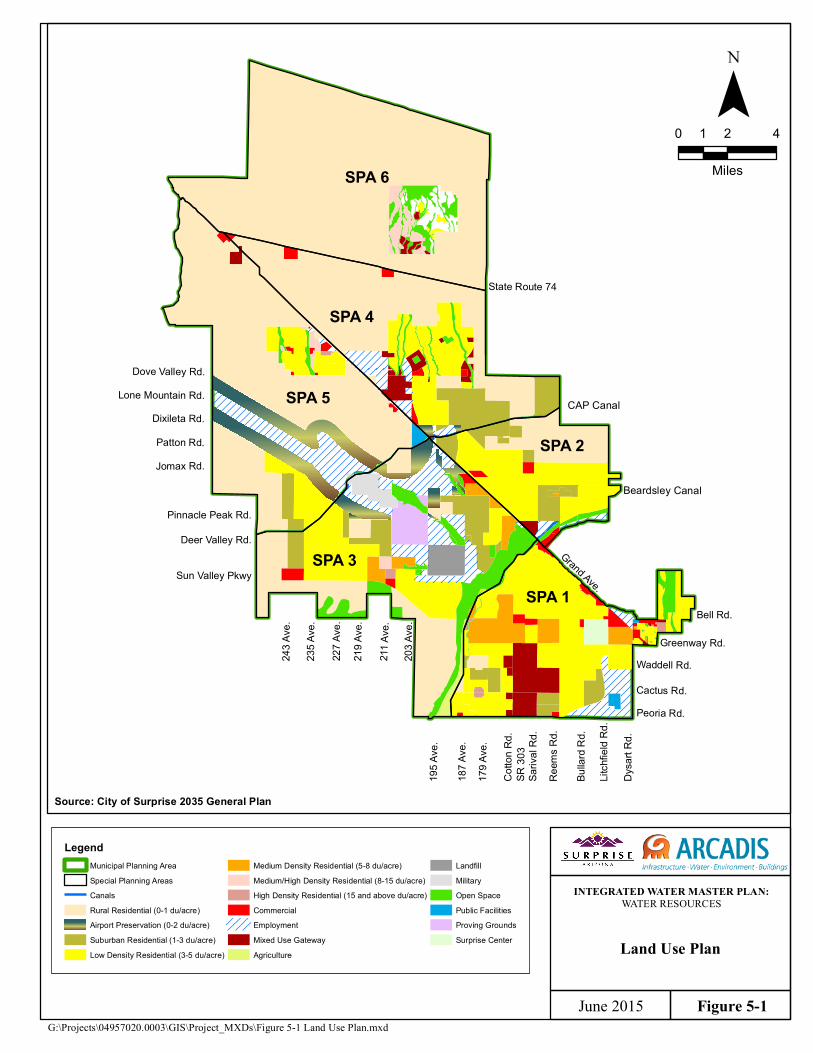
Beardsley Canal
CAP Canal
243 A
ve.
235 A
ve.
Sun Valley Pkwy
211 A
ve.
227 A
ve.
203 A
ve.
Patton Rd.
Grand Ave.
SR 30
3
Cactus Rd.
Reem
s Rd.
Waddell Rd.Greenway Rd.
Pinnacle Peak Rd.
Lone Mountain Rd.Dove Valley Rd.
State Route 74
Peoria Rd.
Sariv
al Rd
.
Cotto
n Rd.
Jomax Rd.
Dysa
rt Rd.
219 A
ve. Bell Rd.
187 A
ve.
179 A
ve.
Litch
field
Rd.
Deer Valley Rd.
Dixileta Rd.
Bulla
rd Rd
.
195 A
ve.
SPA 6
SPA 5
SPA 3
SPA 4
SPA 1
SPA 2
Figure 5-1
Land Use Plan
G:\Projects\04957020.0003\GIS\Project_MXDs\Figure 5-1 Land Use Plan.mxdJune 2015
INTEGRATED WATER MASTER PLAN:WATER RESOURCES
Source: City of Surprise 2035 General Plan
¯0 2 41
Miles
LegendMunicipal Planning AreaSpecial Planning AreasCanalsRural Residential (0-1 du/acre)Airport Preservation (0-2 du/acre)Suburban Residential (1-3 du/acre)Low Density Residential (3-5 du/acre)
Medium Density Residential (5-8 du/acre)Medium/High Density Residential (8-15 du/acre)High Density Residential (15 and above du/acre)CommercialEmploymentMixed Use GatewayAgriculture
LandfillMilitaryOpen SpacePublic FacilitiesProving GroundsSurprise Center
Section 5 Water Resource Demand Projections
Medium Density Residential (5-8 du/acre) – This category is intended for single-
family detached residential development integrated with townhouses, cluster developments, and low-rise apartment/condos. Residential densities of up to eight dwelling units per acre (gross) are typical of this category. In general these areas are a mix of single-family, duplexes, townhouses, and low rise apartments with the average density of such areas not exceeding five dwelling units per acre. This designation also includes supporting land uses within a 20 minute walk such as neighborhood shops and services, neighborhood parks and recreation areas, religious institutions, and schools. A full range of urban services and infrastructure is required.
Medium/High Density Residential (8-15 du/acre) – This category includes a mix of single-family homes, duplexes, manufactured, and modular homes, townhouses, apartments and condos. The gross density range for this category is eight to fifteen dwelling units per acre. This category also includes supporting land uses within a 15 minute walk such as neighborhood shops and services, neighborhood parks and recreation areas, religious institutions, and schools. A full range of urban services and infrastructure is required..
High Density Residential (15 and above du/acre) – This category provides for apartment and condominium complexes at 15 gross dwelling units per acre or higher. This category shall also include supporting land uses within a ten minute walk such as commercial and employment opportunities, parks and recreation areas, religious institutions, and schools. A full range of urban services and infrastructure is required.
Agriculture – This designation denotes areas that are intended to remain in agricultural production over the long-term. There are additional locations within the planning area that are expected to remain in agricultural production for the short-term. However, these areas are anticipated to transition to other land uses over time. According to Growing Smarter, agricultural land must be designated to provide residential development up to one dwelling unit per acre.
Commercial – This designation on the Land Use Map only denotes retail areas larger than 25 acres. The City of Surprise, in the past, has approved community and neighborhood commercial under 25 acres within other land use designations (i.e., residential), and these may not be shown on the Land Use Map. Commercial sites of less than 25 acres may continue to be approved by the City where appropriate. To encourage mixed-use development in commercial areas, high-density residential, that would serve as an accessory to the commercial use, may be conditionally allowed. As existing commercial land use properties are redeveloped outside of commercial uses, a land use amendment will be required to conform to newer land use categories.
Proving Grounds - Within the planning area, the Ford Motor Company has a proving ground that is used to test new vehicles and equipment. This use is expected to continue in the future.
Landfill – This designation is where the Northwest Regional Landfill (1,200 acres) is located. The fairly new landfill has an 80-year life span. Therefore, this land use will continue existing in Surprise for the foreseeable future.
5-4
Section 5
Water Resource Demand Projections Military - This designation was included in General Plan 2020. It is not included as a
land use in General Plan 2035, but is shown on the Land Use Map. It is land owned or leased by Luke Air Force Base and is intended for air base-related uses. Auxiliary Field #1 has a runway that is used to train military pilots as well as uses such as small target practice. This use is expected to continue into the foreseeable future.
Employment – This designation refers to appropriate areas where professional office, tourism/recreational uses (e.g., resorts, amusement facilities), service uses, office/warehouse, and/or manufacturing-type industrial uses is encouraged. This use allows incidental supportive residential in appropriate locations that is adequately buffered on a case-by-case basis. Supportive residential may be a component of an employment related development where deemed appropriate. The specific allowable use will be determined based upon the particular site, adjacent land use impact, buffering techniques, intensity of development, and traffic implications. However, the overall intent of this designation is to locate employment uses and generate jobs for Surprise. Where employment land use is designated in or around Luke Air Force Base F-16 and future F-35 Ldn contours, development must meet the requirements of A.R.S. Section 28-8481.
Surprise Center – Surprise Center was included in General Plan 2020. It is not included as a land use in General Plan 2035, but is shown on the Land Use Map. This area is intended as a mixed-use, 640-acre development project to include private sector commercial and employment land uses as well as municipal uses. The City of Surprise Municipal Center will include, but not be limited to, recreational and aquatic facilities, City offices, and a library. Surprise Center is intended to be a signature centerpiece for the City.
Mixed-Use - These areas are intended to provide a unique area that provides a variety of employment, commercial, and entertainment uses supported with high density residential dwellings. The Mixed-Use designation is intended to create a vibrant urban setting to allow for housing choices within walking distance from daily needs and commutes while providing employment, services, and entertainment to the surrounding area. To be effective, Mixed-Use designations must include a variety of uses within easy walking distance of each other, transit options within the area as well as extending into surrounding communities, and no one land use is intended to dominate a Mixed-Use area.
Open Space - This designation denotes areas that are to be precluded from development except for public recreational facilities or nature preserves. Development of recreation facilities should be limited to trails, trail heads, and minimal structures that support recreational uses. Open space areas should be left in a natural state due to topographic, drainage, vegetative, and landform constraints or the need to provide buffers between potentially incompatible land uses. The plan strives to create a linked open space system through the preservation of washes, public utility easements, and major corridors that link to the regional park and trail systems. State Trust Lands or privately held lands identified as park or open space may be developed at a maximum of one dwelling unit per acre per Growing Smarter legislation. Areas designated as open space within the Luke AFB Auxiliary Field
City of Surprise, Arizona Integrated Water Master Plan: Water Resources Update 04957020.0003
5-5
Section 5 Water Resource Demand Projections
noise contours or APZ shall provide only for open space uses which are both compatible with the operations of the auxiliary field and meet ARS requirements concerning military bases.
Public Facilities - This designation denotes acreage dedicated for public or semi-public uses that may include police/fire substations, schools, libraries, community centers, churches, wastewater treatment plants, etc.
5.3. Water Resource Demand Module The Water Resource Demand Module (Demand Module) was created in 2008 to provide a method for the City to dynamically simulate its existing and future water resource needs derived from GIS-based data and land use-based demand factors. The objective of the Demand Module was to provide water demand (potable and non-potable) and wastewater flow projections in a format compatible with City drinking water, wastewater, and reclaimed water infrastructure models.
Historically, integrated water master planning relied on spreadsheets to calculate water resource needs, and existing/future demands were manually entered into water system models. By using the City’s GIS-based data in an interactive database setting, future water resource needs can be calculated quickly and easily exported into water and wastewater system models. The Demand Module also allows users the opportunity to change development characteristics (land uses and development densities) or demand factors that can then be used to dynamically recalculate water resource needs. For example, if the City accepts a proposal for a large development in SPA 6, the City can quickly update the Demand Module to determine the development’s effect on water resource needs. Similarly, if historical data suggest that average water use in high density residential areas has decreased, the City can adjust the demand factors and rerun the Demand Module to obtain revised water resource needs.
The Demand Module integrates the City’s GIS database for planned land uses (General Plan), water and sewer service providers, SPAs, landscape plans, and development plans to spatially allocate demands across the City’s planning area. By intersecting these GIS databases, the tool creates a composite map composed of many small polygons, and the user can select any polygon, or combination of polygons, and change the attributes of the polygons (land use type, density, landscape type, etc.) to quickly recalculate the demand projections. The user can also change the drinking water, reclaimed water, and wastewater flow demand factors input into the tool to vary the demand projections. The Demand Module uses MAG population projections as a surrogate for estimating timing of development growth, or for providing a timeline for the demand projections. A detailed description of the development and calibration of the Demand Module is provided in Appendix A.
5-6
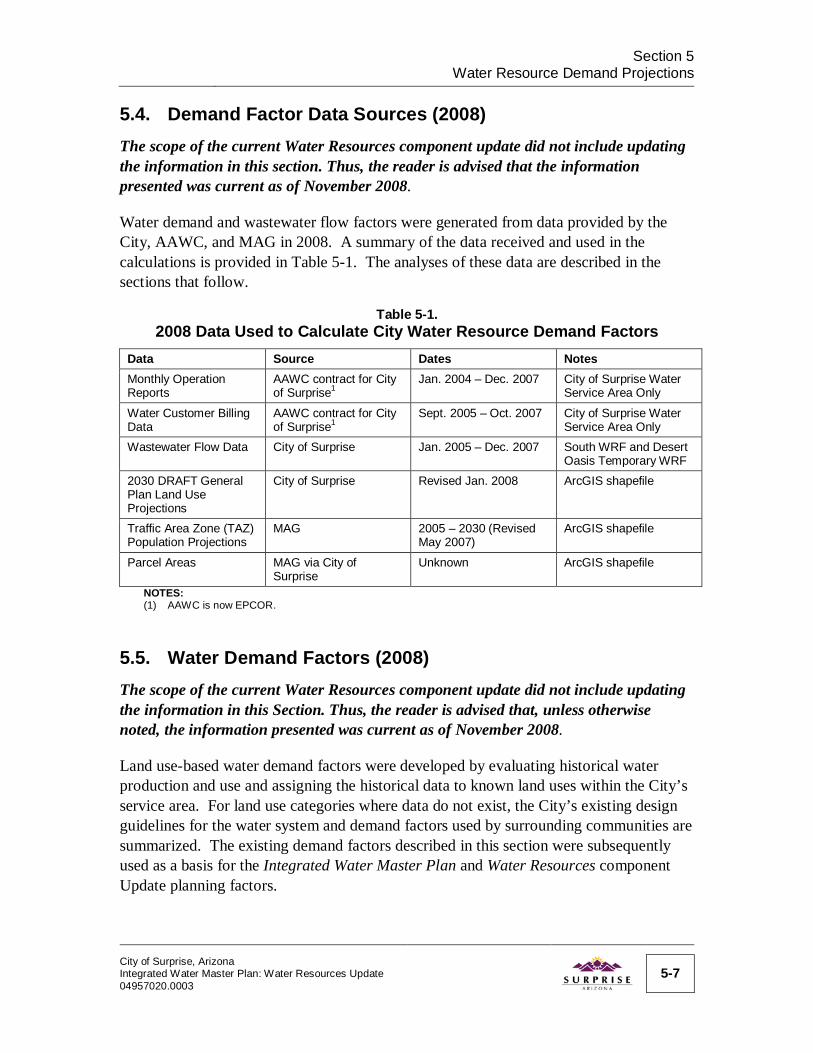
Section 5
Water Resource Demand Projections 5.4. Demand Factor Data Sources (2008) The scope of the current Water Resources component update did not include updating the information in this section. Thus, the reader is advised that the information presented was current as of November 2008.
Water demand and wastewater flow factors were generated from data provided by the City, AAWC, and MAG in 2008. A summary of the data received and used in the calculations is provided in Table 5-1. The analyses of these data are described in the sections that follow.
Table 5-1. 2008 Data Used to Calculate City Water Resource Demand Factors
Data Source Dates Notes Monthly Operation Reports
AAWC contract for City of Surprise1
Jan. 2004 – Dec. 2007 City of Surprise Water Service Area Only
Water Customer Billing Data
AAWC contract for City of Surprise1
Sept. 2005 – Oct. 2007 City of Surprise Water Service Area Only
Wastewater Flow Data City of Surprise Jan. 2005 – Dec. 2007 South WRF and Desert Oasis Temporary WRF
2030 DRAFT General Plan Land Use Projections
City of Surprise Revised Jan. 2008 ArcGIS shapefile
Traffic Area Zone (TAZ) Population Projections
MAG 2005 – 2030 (Revised May 2007)
ArcGIS shapefile
Parcel Areas MAG via City of Surprise
Unknown ArcGIS shapefile
NOTES: (1) AAWC is now EPCOR.
5.5. Water Demand Factors (2008) The scope of the current Water Resources component update did not include updating the information in this Section. Thus, the reader is advised that, unless otherwise noted, the information presented was current as of November 2008.
Land use-based water demand factors were developed by evaluating historical water production and use and assigning the historical data to known land uses within the City’s service area. For land use categories where data do not exist, the City’s existing design guidelines for the water system and demand factors used by surrounding communities are summarized. The existing demand factors described in this section were subsequently used as a basis for the Integrated Water Master Plan and Water Resources component Update planning factors.
City of Surprise, Arizona Integrated Water Master Plan: Water Resources Update 04957020.0003
5-7
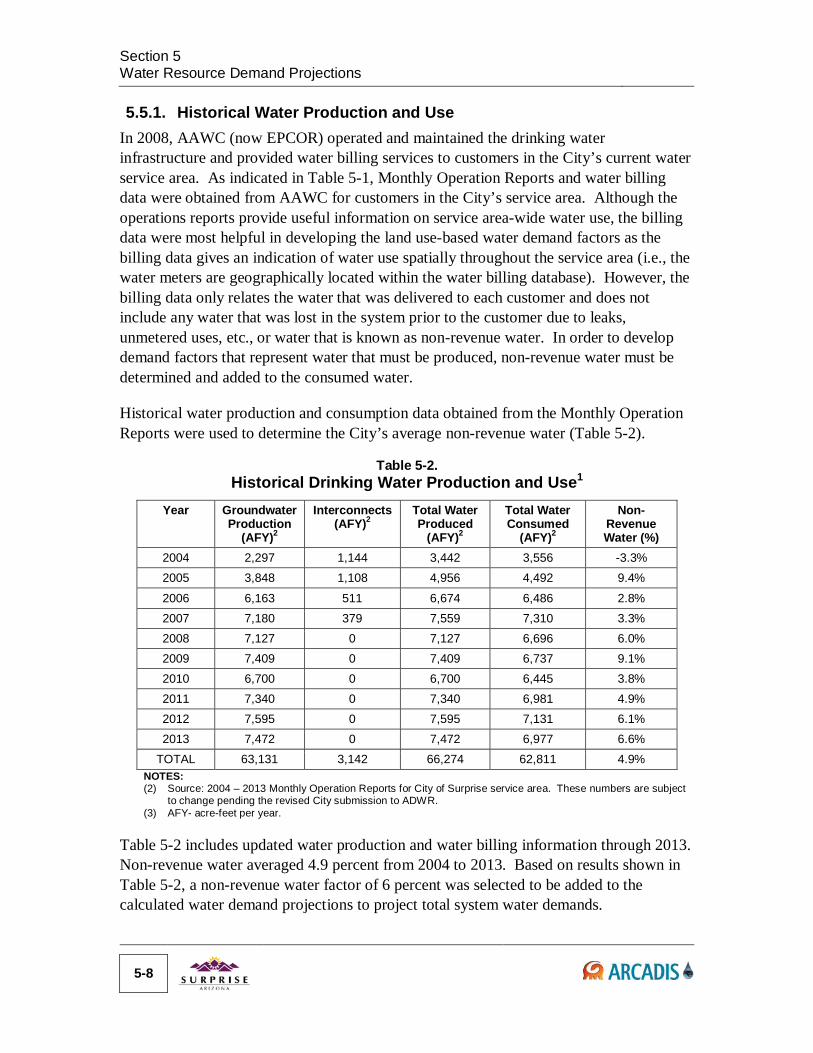
Section 5 Water Resource Demand Projections
5.5.1. Historical Water Production and Use
In 2008, AAWC (now EPCOR) operated and maintained the drinking water infrastructure and provided water billing services to customers in the City’s current water service area. As indicated in Table 5-1, Monthly Operation Reports and water billing data were obtained from AAWC for customers in the City’s service area. Although the operations reports provide useful information on service area-wide water use, the billing data were most helpful in developing the land use-based water demand factors as the billing data gives an indication of water use spatially throughout the service area (i.e., the water meters are geographically located within the water billing database). However, the billing data only relates the water that was delivered to each customer and does not include any water that was lost in the system prior to the customer due to leaks, unmetered uses, etc., or water that is known as non-revenue water. In order to develop demand factors that represent water that must be produced, non-revenue water must be determined and added to the consumed water.
Historical water production and consumption data obtained from the Monthly Operation Reports were used to determine the City’s average non-revenue water (Table 5-2).
Table 5-2. Historical Drinking Water Production and Use1
Year Groundwater Production
(AFY)2
Interconnects (AFY)2
Total Water Produced
(AFY)2
Total Water Consumed
(AFY)2
Non-Revenue Water (%)
2004 2,297 1,144 3,442 3,556 -3.3% 2005 3,848 1,108 4,956 4,492 9.4%
2006 6,163 511 6,674 6,486 2.8% 2007 7,180 379 7,559 7,310 3.3% 2008 7,127 0 7,127 6,696 6.0% 2009 7,409 0 7,409 6,737 9.1% 2010 6,700 0 6,700 6,445 3.8% 2011 7,340 0 7,340 6,981 4.9% 2012 7,595 0 7,595 7,131 6.1% 2013 7,472 0 7,472 6,977 6.6%
TOTAL 63,131 3,142 66,274 62,811 4.9% NOTES: (2) Source: 2004 – 2013 Monthly Operation Reports for City of Surprise service area. These numbers are subject
to change pending the revised City submission to ADWR. (3) AFY- acre-feet per year.
Table 5-2 includes updated water production and water billing information through 2013. Non-revenue water averaged 4.9 percent from 2004 to 2013. Based on results shown in Table 5-2, a non-revenue water factor of 6 percent was selected to be added to the calculated water demand projections to project total system water demands.
5-8
Section 5
Water Resource Demand Projections Between 2004 and 2013, all water demands in the City’s service area were served with potable water from City-owned groundwater production wells or two metered interconnects with EPCOR (located at Mountain Vista Ranch and Ashton Ranch Water Supply Facilities). EPCOR’s contribution to the total water served has been steadily decreasing since 2004 when it was 33 percent. The City has not used EPCOR’s interconnection since 2008.
5.5.2. Calculated Land Use Based-Demand Factors An average water consumption value for each water service meter was calculated from water customer billing data and used to calculate water demand factors. A description of the methodology used in 2008 is provided below:
Total 2007 average water consumption for all meters was multiplied by 106 percent (non-revenue water) and compared to 2007 historical water production. The two values were within 3 percent of each other.
Meter addresses from water customer billing data were geocoded into a shapefile using an address match function from ESRI’s ArcMap. Using this method, 97 percent of the existing 14,171 water meters were geographically located. The remaining meters that were not geospatially located accounted for 19 percent of 2007 annual average water consumption. Thirty of these meters with the highest water demands were manually located in GIS using Google Maps® in conjunction with the MAG Parcels shapefile. In this manner, 90 percent of the total annual average water consumption was accounted for in the located meters (Figure 5-2). The remaining 10 percent of water that could not be spatially allocated was assumed to be distributed evenly across the service area.
Using the 2030 DRAFT Land Use Plan provided by the City and water meter billing data, each water meter was spatially assigned to a land use category, and water demand factors were calculated. For residential areas, the total annual average metered water consumption
(September 2005 to October 2007) for each land use category was multiplied by 116 percent (to account for meters not located in GIS and for non-revenue water). This value was divided by the number of residential meters in the land use category, resulting in a demand factor (gpd/du) for each land use type (Table 5-3).
For non-residential areas, the total annual average water consumption for each land use category was multiplied by 116 percent (to account for meters not located and for non-revenue water) and divided by the total area obtained from the MAG Parcels shapefile, resulting in a demand factor (gpad) for each land use type (Table 5-3).
Land use categories do not limit the type of developments within an area, but rather describe the general policy for that area. For example, commercial properties and public use facilities (e.g., schools and parks) are often located within residential land use categories. Consequently, the “per dwelling unit” and “per acre” factors calculated above City of Surprise, Arizona Integrated Water Master Plan: Water Resources Update 04957020.0003
5-9
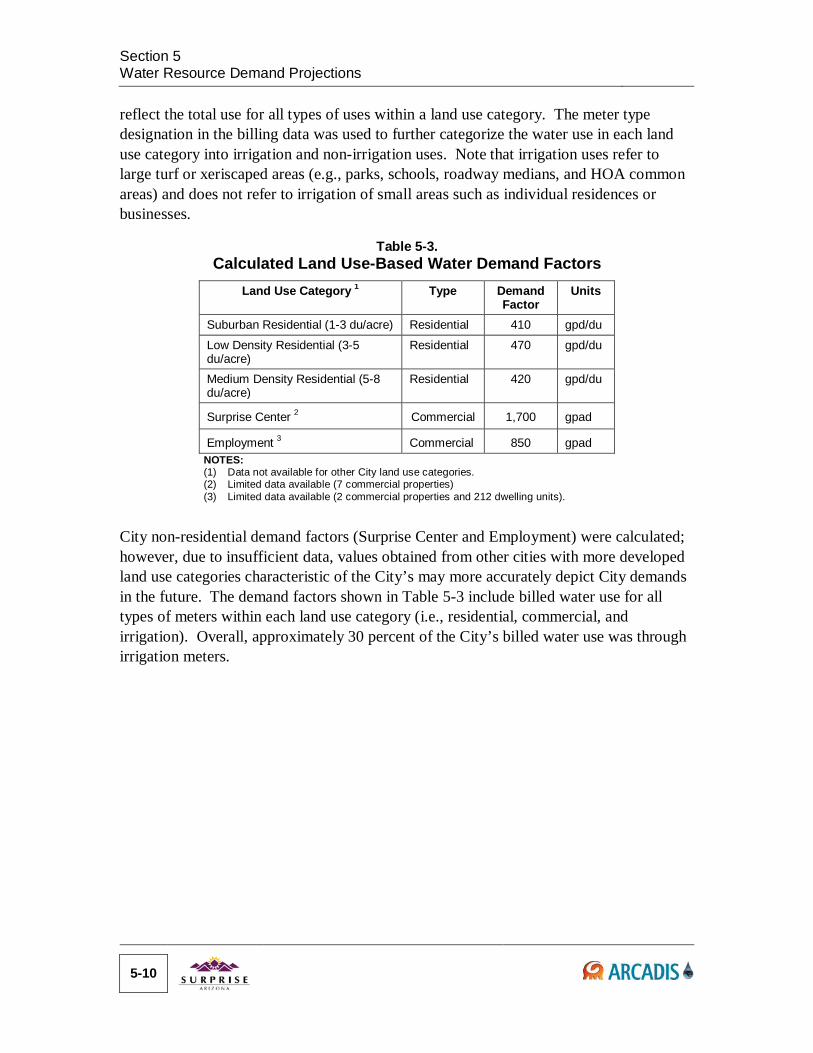
Section 5 Water Resource Demand Projections
reflect the total use for all types of uses within a land use category. The meter type designation in the billing data was used to further categorize the water use in each land use category into irrigation and non-irrigation uses. Note that irrigation uses refer to large turf or xeriscaped areas (e.g., parks, schools, roadway medians, and HOA common areas) and does not refer to irrigation of small areas such as individual residences or businesses.
Table 5-3. Calculated Land Use-Based Water Demand Factors
Land Use Category 1 Type Demand Factor
Units
Suburban Residential (1-3 du/acre) Residential 410 gpd/du
Low Density Residential (3-5 du/acre)
Residential 470 gpd/du
Medium Density Residential (5-8 du/acre)
Residential 420 gpd/du
Surprise Center 2 Commercial 1,700 gpad
Employment 3 Commercial 850 gpad NOTES: (1) Data not available for other City land use categories. (2) Limited data available (7 commercial properties) (3) Limited data available (2 commercial properties and 212 dwelling units).
City non-residential demand factors (Surprise Center and Employment) were calculated; however, due to insufficient data, values obtained from other cities with more developed land use categories characteristic of the City’s may more accurately depict City demands in the future. The demand factors shown in Table 5-3 include billed water use for all types of meters within each land use category (i.e., residential, commercial, and irrigation). Overall, approximately 30 percent of the City’s billed water use was through irrigation meters.
5-10
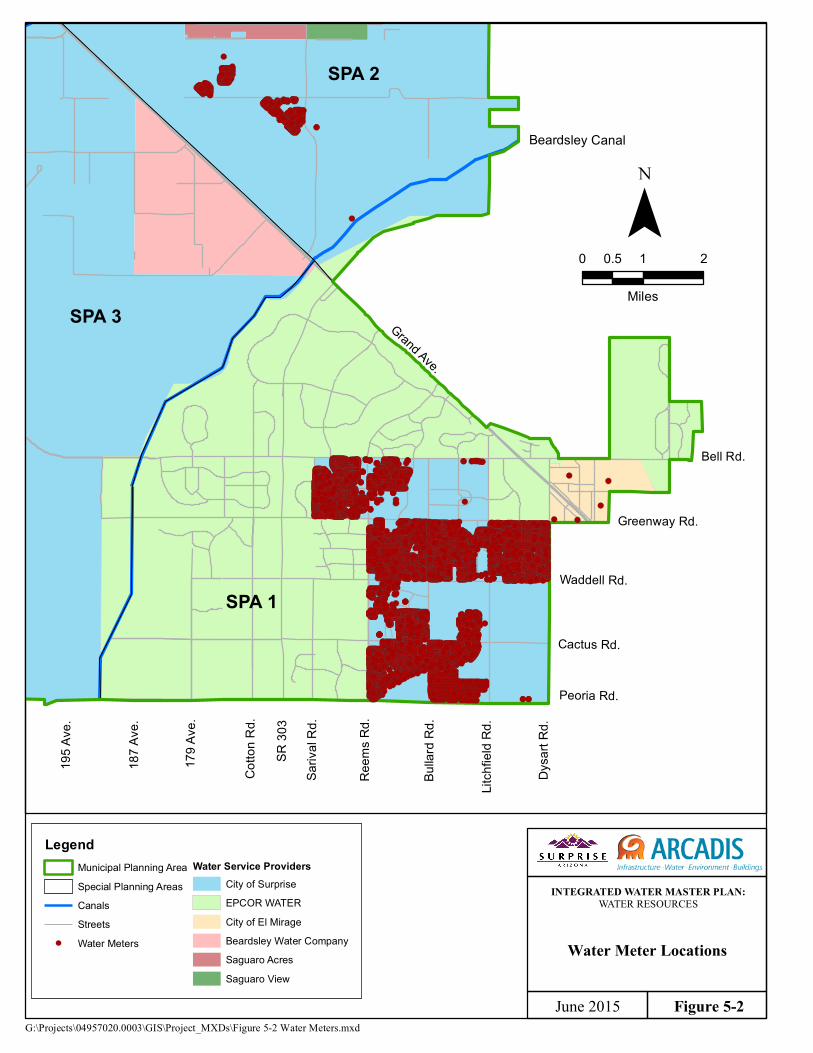
203 A
ve.
Grand Ave.
SR 30
3
Cactus Rd.
Reem
s Rd.
Waddell Rd.
Greenway Rd.
Peoria Rd.
Sariv
al Rd
.
Cotto
n Rd.
Dysa
rt Rd.
Bell Rd.
187 A
ve.
179 A
ve.
Litch
field
Rd.
Bulla
rd Rd
.
195 A
ve.
Beardsley Canal
SPA 3
SPA 1
SPA 2
Figure 5-2
Water Meter Locations
G:\Projects\04957020.0003\GIS\Project_MXDs\Figure 5-2 Water Meters.mxdJune 2015
INTEGRATED WATER MASTER PLAN:WATER RESOURCES
¯0 1 20.5
Miles
LegendMunicipal Planning AreaSpecial Planning AreasCanalsStreetsWater Meters
Water Service ProvidersCity of SurpriseEPCOR WATERCity of El MirageBeardsley Water CompanySaguaro AcresSaguaro View
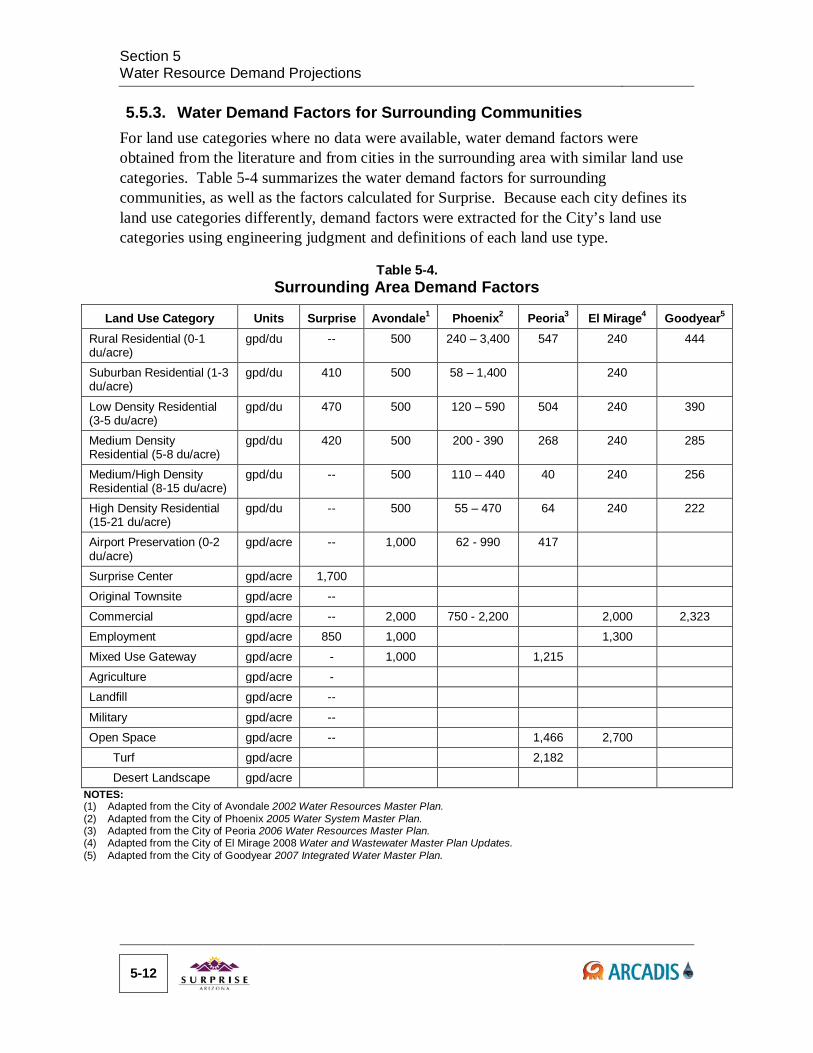
Section 5 Water Resource Demand Projections
5.5.3. Water Demand Factors for Surrounding Communities
For land use categories where no data were available, water demand factors were obtained from the literature and from cities in the surrounding area with similar land use categories. Table 5-4 summarizes the water demand factors for surrounding communities, as well as the factors calculated for Surprise. Because each city defines its land use categories differently, demand factors were extracted for the City’s land use categories using engineering judgment and definitions of each land use type.
Table 5-4. Surrounding Area Demand Factors
Land Use Category Units Surprise Avondale1 Phoenix2 Peoria3 El Mirage4 Goodyear5 Rural Residential (0-1 du/acre)
gpd/du -- 500 240 – 3,400 547 240 444
Suburban Residential (1-3 du/acre)
gpd/du 410 500 58 – 1,400 240
Low Density Residential (3-5 du/acre)
gpd/du 470 500 120 – 590 504 240 390
Medium Density Residential (5-8 du/acre)
gpd/du 420 500 200 - 390 268 240 285
Medium/High Density Residential (8-15 du/acre)
gpd/du -- 500 110 – 440 40 240 256
High Density Residential (15-21 du/acre)
gpd/du -- 500 55 – 470 64 240 222
Airport Preservation (0-2 du/acre)
gpd/acre -- 1,000 62 - 990 417
Surprise Center gpd/acre 1,700 Original Townsite gpd/acre -- Commercial gpd/acre -- 2,000 750 - 2,200 2,000 2,323 Employment gpd/acre 850 1,000 1,300 Mixed Use Gateway gpd/acre - 1,000 1,215 Agriculture gpd/acre - Landfill gpd/acre --
Military gpd/acre -- Open Space gpd/acre -- 1,466 2,700
Turf gpd/acre 2,182 Desert Landscape gpd/acre
NOTES: (1) Adapted from the City of Avondale 2002 Water Resources Master Plan. (2) Adapted from the City of Phoenix 2005 Water System Master Plan. (3) Adapted from the City of Peoria 2006 Water Resources Master Plan. (4) Adapted from the City of El Mirage 2008 Water and Wastewater Master Plan Updates. (5) Adapted from the City of Goodyear 2007 Integrated Water Master Plan.
5-12
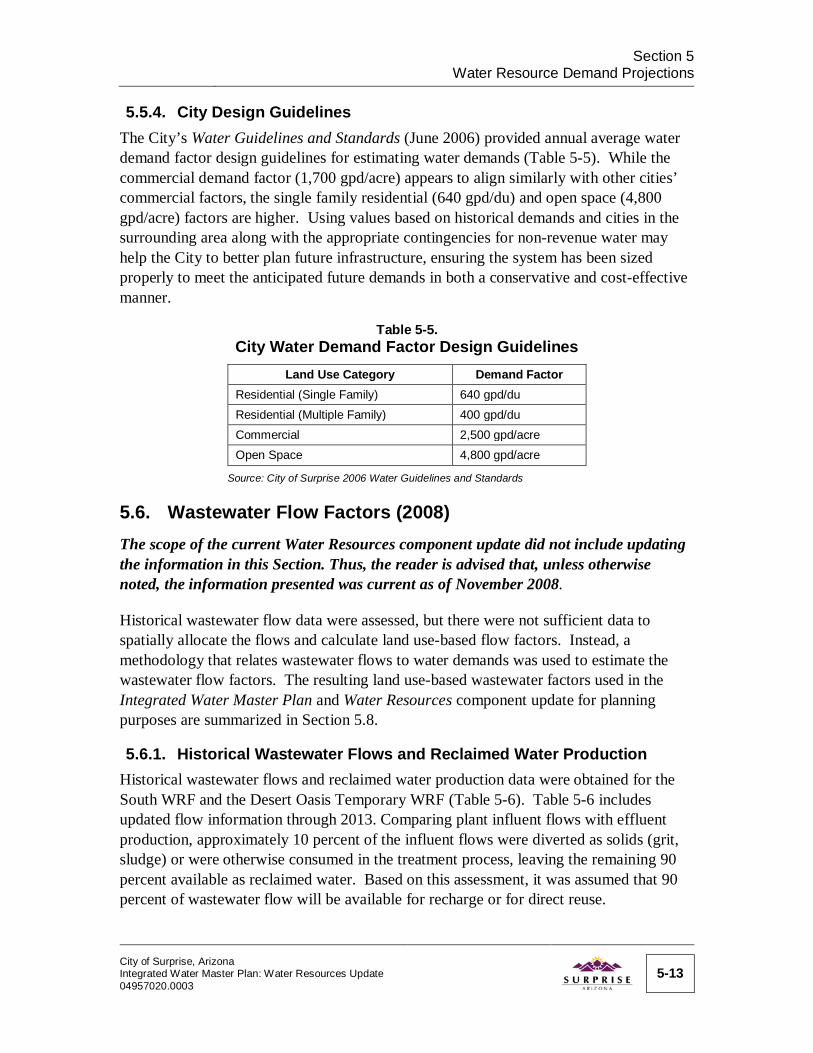
Section 5
Water Resource Demand Projections 5.5.4. City Design Guidelines
The City’s Water Guidelines and Standards (June 2006) provided annual average water demand factor design guidelines for estimating water demands (Table 5-5). While the commercial demand factor (1,700 gpd/acre) appears to align similarly with other cities’ commercial factors, the single family residential (640 gpd/du) and open space (4,800 gpd/acre) factors are higher. Using values based on historical demands and cities in the surrounding area along with the appropriate contingencies for non-revenue water may help the City to better plan future infrastructure, ensuring the system has been sized properly to meet the anticipated future demands in both a conservative and cost-effective manner.
Table 5-5. City Water Demand Factor Design Guidelines
Land Use Category Demand Factor Residential (Single Family) 640 gpd/du Residential (Multiple Family) 400 gpd/du Commercial 2,500 gpd/acre Open Space 4,800 gpd/acre
Source: City of Surprise 2006 Water Guidelines and Standards
5.6. Wastewater Flow Factors (2008) The scope of the current Water Resources component update did not include updating the information in this Section. Thus, the reader is advised that, unless otherwise noted, the information presented was current as of November 2008.
Historical wastewater flow data were assessed, but there were not sufficient data to spatially allocate the flows and calculate land use-based flow factors. Instead, a methodology that relates wastewater flows to water demands was used to estimate the wastewater flow factors. The resulting land use-based wastewater factors used in the Integrated Water Master Plan and Water Resources component update for planning purposes are summarized in Section 5.8.
5.6.1. Historical Wastewater Flows and Reclaimed Water Production Historical wastewater flows and reclaimed water production data were obtained for the South WRF and the Desert Oasis Temporary WRF (Table 5-6). Table 5-6 includes updated flow information through 2013. Comparing plant influent flows with effluent production, approximately 10 percent of the influent flows were diverted as solids (grit, sludge) or were otherwise consumed in the treatment process, leaving the remaining 90 percent available as reclaimed water. Based on this assessment, it was assumed that 90 percent of wastewater flow will be available for recharge or for direct reuse.
City of Surprise, Arizona Integrated Water Master Plan: Water Resources Update 04957020.0003
5-13
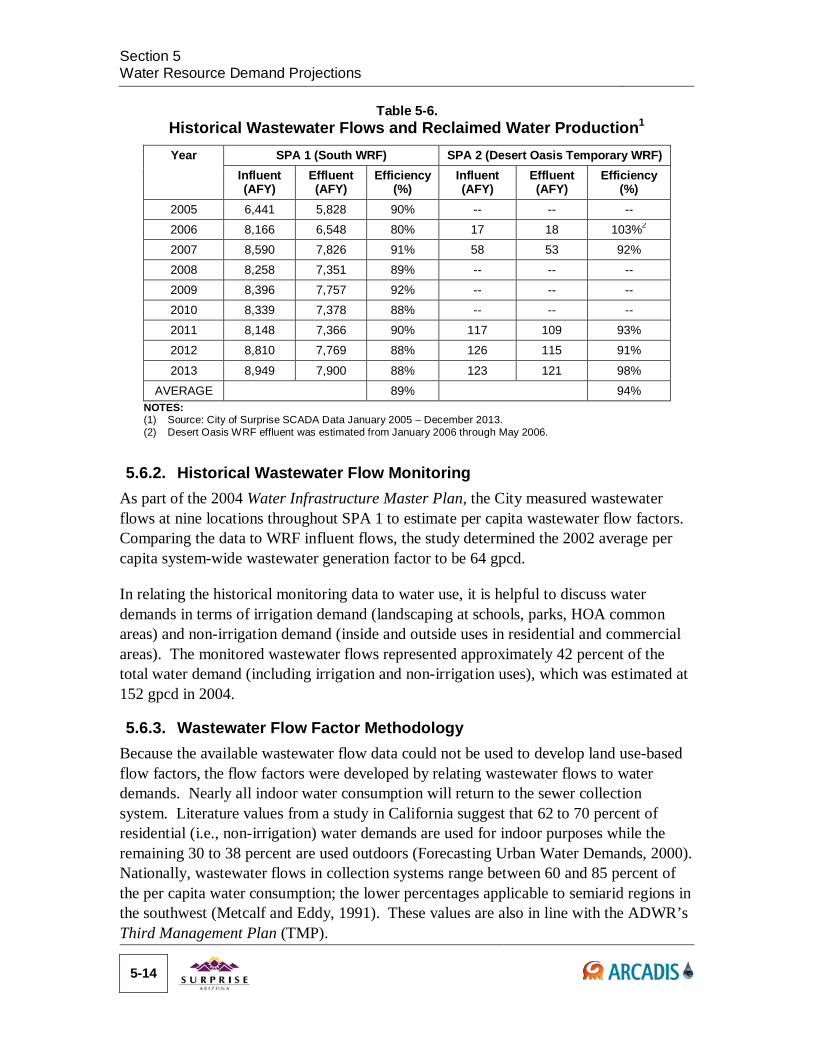
Section 5 Water Resource Demand Projections
Table 5-6.
Historical Wastewater Flows and Reclaimed Water Production1 Year SPA 1 (South WRF) SPA 2 (Desert Oasis Temporary WRF)
Influent (AFY)
Effluent (AFY)
Efficiency (%)
Influent (AFY)
Effluent (AFY)
Efficiency (%)
2005 6,441 5,828 90% -- -- -- 2006 8,166 6,548 80% 17 18 103%2 2007 8,590 7,826 91% 58 53 92% 2008 8,258 7,351 89% -- -- -- 2009 8,396 7,757 92% -- -- -- 2010 8,339 7,378 88% -- -- -- 2011 8,148 7,366 90% 117 109 93% 2012 8,810 7,769 88% 126 115 91%
2013 8,949 7,900 88% 123 121 98% AVERAGE 89% 94%
NOTES: (1) Source: City of Surprise SCADA Data January 2005 – December 2013. (2) Desert Oasis WRF effluent was estimated from January 2006 through May 2006.
5.6.2. Historical Wastewater Flow Monitoring As part of the 2004 Water Infrastructure Master Plan, the City measured wastewater flows at nine locations throughout SPA 1 to estimate per capita wastewater flow factors. Comparing the data to WRF influent flows, the study determined the 2002 average per capita system-wide wastewater generation factor to be 64 gpcd.
In relating the historical monitoring data to water use, it is helpful to discuss water demands in terms of irrigation demand (landscaping at schools, parks, HOA common areas) and non-irrigation demand (inside and outside uses in residential and commercial areas). The monitored wastewater flows represented approximately 42 percent of the total water demand (including irrigation and non-irrigation uses), which was estimated at 152 gpcd in 2004.
5.6.3. Wastewater Flow Factor Methodology Because the available wastewater flow data could not be used to develop land use-based flow factors, the flow factors were developed by relating wastewater flows to water demands. Nearly all indoor water consumption will return to the sewer collection system. Literature values from a study in California suggest that 62 to 70 percent of residential (i.e., non-irrigation) water demands are used for indoor purposes while the remaining 30 to 38 percent are used outdoors (Forecasting Urban Water Demands, 2000). Nationally, wastewater flows in collection systems range between 60 and 85 percent of the per capita water consumption; the lower percentages applicable to semiarid regions in the southwest (Metcalf and Eddy, 1991). These values are also in line with the ADWR’s Third Management Plan (TMP).
5-14
Section 5
Water Resource Demand Projections To determine the wastewater factor as a percentage of total water demand (i.e., the sum of irrigation and non-irrigation uses), it is necessary to first consider the amount of water used for non-irrigation uses and then consider the amount of water used for interior uses. The historical water billing data indicated 30 percent of the calculated Surprise water demands are for irrigation uses (large landscape) and 70 percent are for non-irrigation (indoor and outdoor) demands. Using the information above, it was assumed that indoor water use, and subsequently wastewater flow, was 65 percent of the non-irrigation (indoor and outdoor) water demand. When considering the total water demand (i.e., the sum of irrigation and non-irrigation uses), the wastewater factor is approximately 45 percent of the total demand, which is consistent with the value described above in Section 5.6.2.
5.7. Reclaimed Water Demand Factors (2008) The scope of the current Water Resources component update did not include updating the information in this Section. Thus, the reader is advised that, unless otherwise noted, the information presented was current as of November 2008.
In 2008, the City was in the process of installing reclaimed water meters for its first reuse customers. Historically, reclaimed water from the SPA 1 WRF was recharged or pumped to G Farms south of the plant. No reclaimed water customers were metered or billed. At the Desert Oasis Temporary WRF, reclaimed water was used to irrigate desert landscaping. Similar to the South WRF, no reclaimed water customers were metered or billed. Because no historical data were available, potential reclaimed water demand factors were based on values obtained from literature. Reclaimed water could be directly used for outdoor demands (front and backyards) or for larger landscape demands such as parks, school grounds, homeowner association (HOA) common areas, etc.
5.7.1. Residential/Commercial Outdoor Demand Factors Residential/commercial indoor water demands must be met with potable water while outdoor water demands can either be met with potable or non-potable water. As described above, indoor water use will constitute 65 percent of the non-irrigation water demand. Thus, it is assumed that the remaining 35 percent will constitute residential/ commercial outdoor demands that could be served with either potable or reclaimed water.
5.7.2. Landscape Demand Factors The Demand Module calculates landscape demands (capable of being served by reclaimed water) separate from land use category demands. The irrigation component of the residential demand factor was incorporated into the Demand Module using turf and xeriscape demand factors described in the ADWR TMP (4,000 and 1,300 gpad, respectively). Because schools, parks, and HOA areas are not found in other land use
City of Surprise, Arizona Integrated Water Master Plan: Water Resources Update 04957020.0003
5-15

Section 5 Water Resource Demand Projections
categories, landscape demand factors were not applied to non-residential land use categories.
5.8. Updated Water Resource Projections The land use database (General Plan land use categories and development densities) and the selected water resource demand factors (provided in Appendix A) were incorporated into the Demand Module. The Demand Module was then used to develop baseline water resource projections.
5.8.1. Basis for Updated Water Resource Projections The water resource demand projections were updated for land use and development conditions that City staff indicated were currently being discussed to develop the City’s 2035 General Plan. The following key assumptions were used to formulate the updated water resource projections (water demands, wastewater flows, reclaimed water availability, and reclaimed water demands):
Indoor, outdoor, and landscape demand factors were derived from City historical production and billing data. Demand factors for areas where the City had no data were obtained from literature or other community master plans having similar land use categories.
The landscape use codes and percentage of landscaped area were derived from the City’s Scenic Integrity Guidelines (May 2008).
MAG population projections were used as a surrogate for the rate of development throughout the planning area.
Based on the 2008 Integrated Water Master Plan findings, for build-out conditions, all densities within the Rural Residential land use category were set to 0.5 du/acre.
For build-out, the mid-point for the dwelling unit density ranges given in the City’s current General Plan were used for all remaining residential land use categories.
Consistent with the City’s 2008 Integrated Water Master Plan, the City will not serve drinking water or reclaimed water in the EPCOR or City of El Mirage service areas, but it will serve all other private water companies.
The City will continue to receive wastewater from its wastewater service area which encompasses all of the municipal planning area except EPCOR’s wastewater service area located in the southeastern portion of the City.
Based on historical flows entering and exiting the City’s WRFs, the reclaimed water available is equal to 90 percent of the wastewater generated.
5.8.2. Updated Projections Based on the key assumptions above, the City’s updated water resource projections were calculated for existing conditions, 2020, 2030 and build-out. Tables 5-7 and 5-8 summarize the projections for current and build-out conditions. Since the City does not
5-16
Section 5
Water Resource Demand Projections know when, or if, it will acquire private water companies (other than EPCOR and El Mirage), the updated water resource projections presented in Tables 5-7 and 5-8 include demands within the other private water company service areas.
The scope of the Water Resources update did not include a complete update of the Demand Module (i.e., demand and flow factors), nor did it allow a calibration update to current water demand and wastewater flow conditions. In addition, the calculated demands and flows in Tables 5-7 and 5-8 for the Surprise service area includes areas where it is known that not all customers are connected to the water and/or wastewater systems. Therefore, it should be noted that the calculated demands and flows for existing conditions are higher than what is currently observed. In any case, the primary focus of the water resource demand projections is for City build-out conditions.
City of Surprise, Arizona Integrated Water Master Plan: Water Resources Update 04957020.0003
5-17
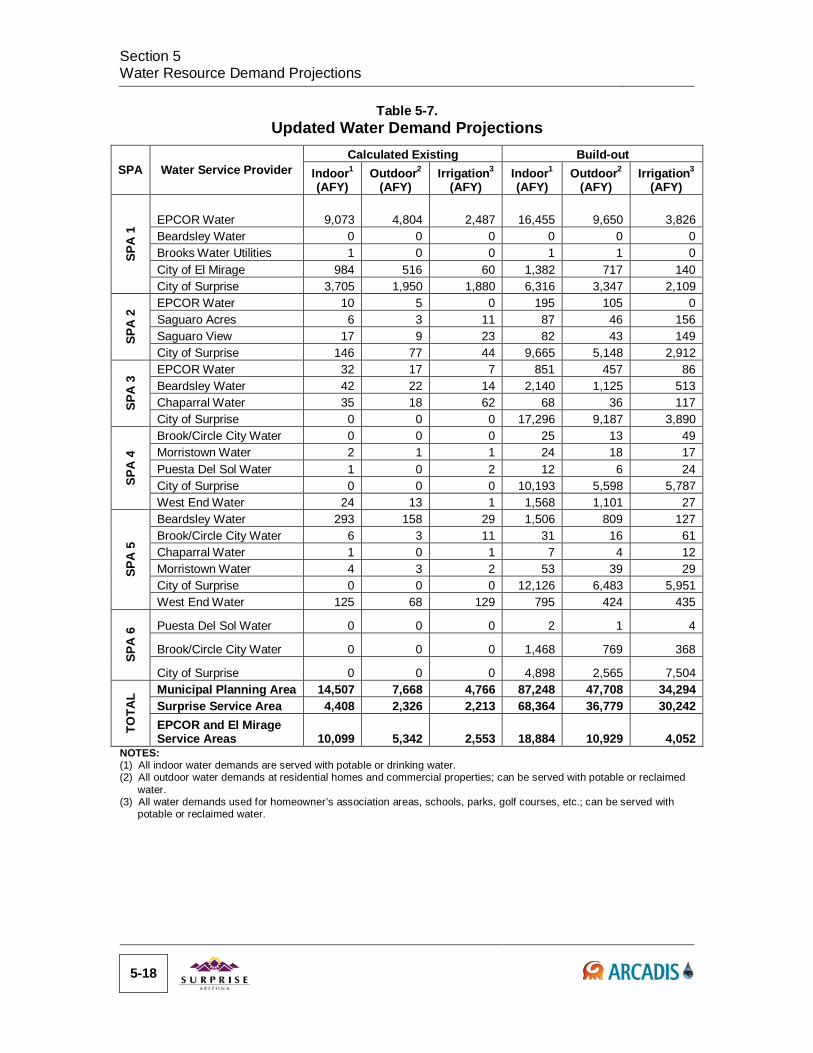
Section 5 Water Resource Demand Projections
Table 5-7.
Updated Water Demand Projections
SPA Water Service Provider Calculated Existing Build-out
Indoor1 (AFY)
Outdoor2 (AFY)
Irrigation3 (AFY)
Indoor1 (AFY)
Outdoor2 (AFY)
Irrigation3 (AFY)
SPA
1 EPCOR Water 9,073 4,804 2,487 16,455 9,650 3,826
Beardsley Water 0 0 0 0 0 0 Brooks Water Utilities 1 0 0 1 1 0 City of El Mirage 984 516 60 1,382 717 140 City of Surprise 3,705 1,950 1,880 6,316 3,347 2,109
SPA
2 EPCOR Water 10 5 0 195 105 0
Saguaro Acres 6 3 11 87 46 156 Saguaro View 17 9 23 82 43 149 City of Surprise 146 77 44 9,665 5,148 2,912
SPA
3 EPCOR Water 32 17 7 851 457 86
Beardsley Water 42 22 14 2,140 1,125 513 Chaparral Water 35 18 62 68 36 117 City of Surprise 0 0 0 17,296 9,187 3,890
SPA
4
Brook/Circle City Water 0 0 0 25 13 49 Morristown Water 2 1 1 24 18 17 Puesta Del Sol Water 1 0 2 12 6 24 City of Surprise 0 0 0 10,193 5,598 5,787 West End Water 24 13 1 1,568 1,101 27
SPA
5
Beardsley Water 293 158 29 1,506 809 127 Brook/Circle City Water 6 3 11 31 16 61 Chaparral Water 1 0 1 7 4 12 Morristown Water 4 3 2 53 39 29 City of Surprise 0 0 0 12,126 6,483 5,951 West End Water 125 68 129 795 424 435
SPA
6 Puesta Del Sol Water 0 0 0 2 1 4
Brook/Circle City Water 0 0 0 1,468 769 368
City of Surprise 0 0 0 4,898 2,565 7,504
TOTA
L Municipal Planning Area 14,507 7,668 4,766 87,248 47,708 34,294 Surprise Service Area 4,408 2,326 2,213 68,364 36,779 30,242 EPCOR and El Mirage Service Areas 10,099 5,342 2,553 18,884 10,929 4,052
NOTES: (1) All indoor water demands are served with potable or drinking water. (2) All outdoor water demands at residential homes and commercial properties; can be served with potable or reclaimed
water. (3) All water demands used for homeowner’s association areas, schools, parks, golf courses, etc.; can be served with
potable or reclaimed water.
5-18
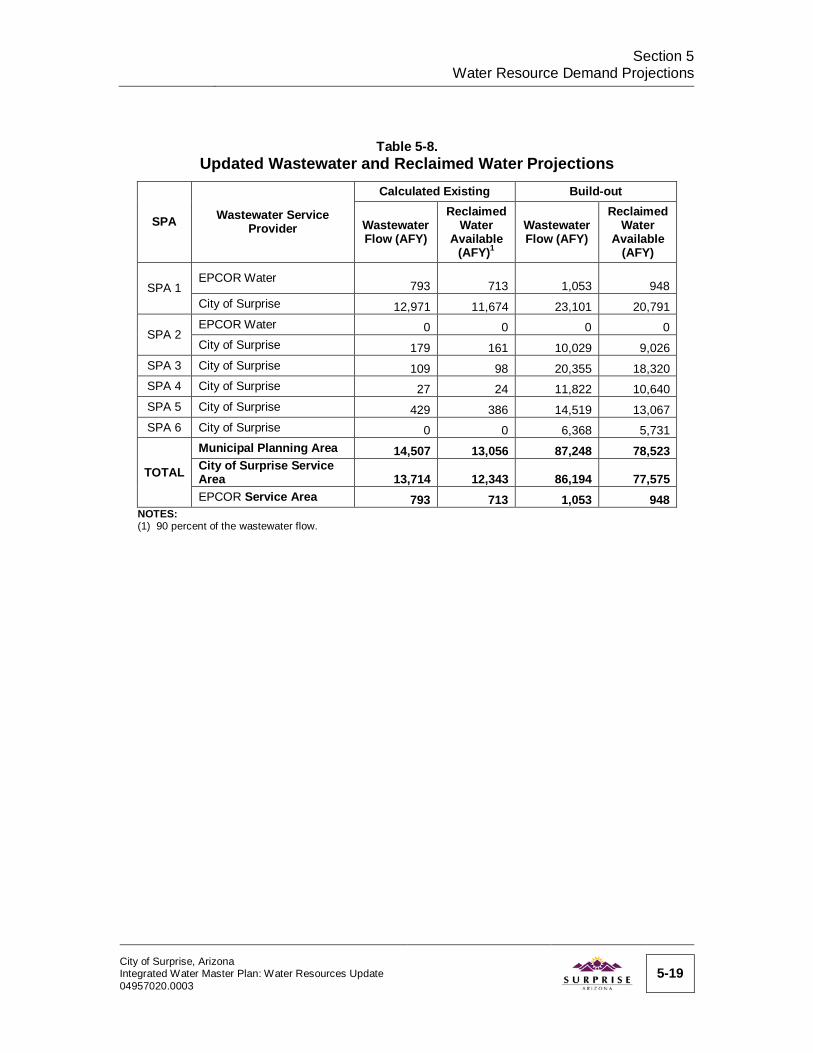
Section 5
Water Resource Demand Projections
Table 5-8. Updated Wastewater and Reclaimed Water Projections
SPA Wastewater Service Provider
Calculated Existing Build-out
Wastewater Flow (AFY)
Reclaimed Water
Available (AFY)1
Wastewater Flow (AFY)
Reclaimed Water
Available (AFY)
SPA 1 EPCOR Water
793 713 1,053 948 City of Surprise 12,971 11,674 23,101 20,791
SPA 2 EPCOR Water 0 0 0 0 City of Surprise 179 161 10,029 9,026
SPA 3 City of Surprise 109 98 20,355 18,320 SPA 4 City of Surprise 27 24 11,822 10,640 SPA 5 City of Surprise 429 386 14,519 13,067 SPA 6 City of Surprise 0 0 6,368 5,731
TOTAL
Municipal Planning Area 14,507 13,056 87,248 78,523 City of Surprise Service Area 13,714 12,343 86,194 77,575 EPCOR Service Area 793 713 1,053 948
NOTES: (1) 90 percent of the wastewater flow.
City of Surprise, Arizona Integrated Water Master Plan: Water Resources Update 04957020.0003
5-19

THIS PAGE INTENTIONALLY LEFT BLANK
6. Potential Future Water Supply Opportunities
This section describes water supplies that are potentially available to the City in the future. These supplies are identified and discussed to the extent that credible references were available, including informal interviews of staff from the CAP, CAGRD, CAWCD, AMWUA, ADWR, and others. Appendix C provides additional summary information compiled as part of this Water Resources component update, including descriptions, potential availability, regulatory/institutional considerations, general infrastructure requirements, general cost considerations, and priority for consideration.
The water supplies potentially available to the City include the following general categories:
Groundwater
Surface Water Water Stored Outside the AMA
Water Obtained from Private Water Company Acquisitions Reclaimed Water
6.1. Groundwater 6.1.1. Physical Availability The current provisions of the City’s Designation of Assured Water Supply are provided in Section 3.0. The Designation recognized that the City’s projected and committed demands for 2020 are 16,718 acre-feet annually, and that the City had demonstrated that after withdrawing 1,671,800 AF, or an average of 16,718 AFY over 100 years, of groundwater and stored water recovered outside the area of hydrologic impact, the depth to static water level within Surprise’s service area is not expected to exceed 1,000 feet below land surface. This groundwater represents the City’s only physically available water supply under the Designation, even though the water may be legally characterized as recovered CAP water or effluent. The City currently stores its CAP and effluent resources where ADWR does not consider it to be hydrologically connected to where the City pumps water from its wells, and therefore the water being stored does not add to, or reduce the rate of depletion of, the City’s physically available groundwater supplies.
Additional groundwater within the Phoenix AMA may be available to the City for future use. As is the case for use of groundwater under the current designation, the City must demonstrate that its use of groundwater will be consistent with the Phoenix AMA goal,
City of Surprise, Arizona Integrated Water Master Plan: Water Resources Update 04957020.0003
6-1

Section 6 Potential Future Water Supply Opportunities
which is safe yield as established by statute. This means the City must offset groundwater use with a combination of underground storage and recovery of renewable water supplies (CAP water, MWD surface water, reclaimed water, or other water supplies imported from outside the Phoenix AMA) or rely on the services of the CAGRD.
Reliance on the CAGRD is not without risk, however, as it may be very possible that the CAGRD runs out of renewable water supplies for meeting its future obligations, and, if the CAGRD’s replenishment activities are not within the City’s water service area, the physical availability of groundwater can still become a limitation.
As a result, the option of effectively relying on the CAGRD will increasingly depend, in large part, on where the CAGRD replenishes the groundwater used by the City. Specifically, the CAGRD does not have a facility within the Surprise area of hydrologic impact, and as such, even though the City would pay the CAGRD to replenish groundwater withdrawn for use by the City within the Phoenix AMA, the amount of groundwater physically available to the City will continue to decline since the replenishment of the groundwater withdrawn would occur outside the City’s area of hydrologic impact. While reliance on the CAGRD contributes towards the goal of safe yield for the Phoenix AMA, the City does not hydrologically benefit from reliance on its membership with the CAGRD. Regardless, the City pays the same membership dues and replenishment taxes as other members who may be gaining this benefit. Essentially, replenishment by the CAGRD and the City’s storage of CAP water and effluent outside the area of the City’s area of hydrologic impact mar contribute to the physical availability of others within the Phoenix AMA, but not the City of Surprise.
The summary of this potential future supply option is as follows:
Rather than pay the capital costs associated with acquiring new water supplies and the associated infrastructure, the City can CAGRD the replenishment assessment as required. This option assumes that the CAGRD can acquire needed future supplies and continue to gain approval of its required 10 – year operating plans.
Local groundwater is currently “legally” available. Reliance on “groundwater” will incur annual CAGRD cost increases that include the cost of
water, plus CAGRD operations Reliance on the CAGRD, as it currently operates, will not replace the groundwater where it is
being withdrawn by the City, effectively reducing the City’s physical availability over time while the City’s water demands continue to increase.
Reliance on groundwater while recharging CAP and reclaimed water outside the area of hydrologic impact will not replace the groundwater withdrawn by the City, effectively reducing the City’s physical availability over time while water demands continue to increase.
6-2
Section 6
Potential Future Water Supply Opportunities 6.1.2. Groundwater Allowance Account The City has a Groundwater Allowance Account under its Designation of Assured Water Supply. As described in section 3.3.1, many service areas had this account established with a specific balance when first receiving a designation; however, City staff indicates the City was deemed in transition from a small water provider to a large provider beginning in 2004. Based upon the criteria in place at that time, the City’s initial Groundwater Allowance Account was set at zero.
There are two types of “deposits” that are continually made into the Groundwater Allowance Account:
Incidental Recharge – this is an amount of water that is projected to be returned to the groundwater aquifer within the City’s service area through normal water use during each year. This amount is set at 4 percent of the City’s total annual water use. The percentage can be increased if definitive hydrologic evidence is provided to ADWR to substantiate an upward adjustment. Given the uses of water in the City’s service area, there is apparently little chance such an increase would be granted by the ADWR.
Extinguishment Credits – these are also known as Assured Water Supply credits. Extinguishment credits are created by the process of extinguishing existing Irrigation and Type 1 and Type 2 Grandfathered Groundwater Rights. If pledged to the City’s Groundwater Allowance Account, the credits can then be used to reduce the amount of an annual replenishment obligation when groundwater is used by the City. Specifically, pledged credits can offset the amount of groundwater use that exceeds the calculated excess groundwater pumping.
Type 2 Non-Irrigation Grandfathered Groundwater Rights can also be extinguished. However, by virtue of their character, they are typically not extinguished but simply added to the City portfolio for future value, which may include establishment of a satellite service area in the City’s future, or for leasing and generation of revenues that can, once again, be used to purchase additional water supplies and/or long-term storage credits.
In summary, if the City chooses to pursue the acquisition of extinguishment credits by enacting and enforcing an ordinance requiring extinguishment credits be conveyed to the City as a condition of development, or chooses to purchase credits in the market, the Extinguishment Credits should not be pledged to the City’s groundwater allowance account, but rather held until placed into the market for sale to generate revenues for the acquisition of additional Long-Term Storage Credits. This potential supply is given a classification of “medium” priority for future acquisition by the City simply because of the potential to convert the Extinguishment Credits to revenue for the acquisition of the Long-Term Storage Credits.
City of Surprise, Arizona Integrated Water Master Plan: Water Resources Update 04957020.0003
6-3

Section 6 Potential Future Water Supply Opportunities
6.1.3. Local Poor Quality Groundwater There are areas of groundwater supply that have very high TDS or are undergoing remediation for contamination immediately to the south of the City. While these supplies will incur some costs in acquisition, they should be evaluated more closely to determine whether the use of this water is physically and economically viable. Based upon an interview with staff of the CAGRD, this is likely to be one of the first new regional water supplies developed. It is possible that the CAWCD could be the entity that will develop this water supply on behalf of existing and future CAP subcontractors or CAGRD members using revenue bonds as a financing mechanism for the development of the water supply and the construction of the needed infrastructure.
ADWR is currently evaluating the southern Buckeye region for re-designation as a waterlogged area and will quantify the amount of water in storage as part of the evaluation. City staff should monitor the Department’s work to help determine if this option is feasible.
ADWR projected there may be between 2.8 and 3.3 million AF of poor quality groundwater in the waterlogged area. This water is generally of poor quality (TDS approximately 3,500 ppm) requiring treatment and additional infrastructure, and treatment and disposal of by-product (brine). In addition, the proximity of three existing growing municipal service areas (Goodyear, Avondale and Buckeye) will likely require partnerships to develop and use the supply. For example, it may be possible to trade access to CAP water from Buckeye’s recent NIA reallocation, and Goodyear’s existing CAP allocation, and tribal lease water, in exchange for helping to fund the infrastructure required to treat poor quality groundwater and deliver it to both Goodyear and Buckeye.
Potential hurdles will likely include a legal objection based upon the interconnectedness of the groundwater to surface flows in the Salt/Gila Rivers. Alternatively, if Goodyear, Buckeye, and Avondale choose not to participate in a partnership and/or view this water as “their” supply located within their service areas, they could challenge the development of this supply by any other party. There are currently no estimates for this water available, but a reasonable speculation as to the cost of this water ranges from $500 to $2,000/AFY.
In other examples, if there are groundwater supplies that are contaminated and subject to remediation, the water can be treated and used directly by the City for non-potable, and potentially potable, purposes. Under the statutes, such water supplies are deemed as if they are renewable water supplies until 2025 and therefore do not incur a replenishment obligation for their use.
Again, this water could be delivered to the City directly by a constructed pipeline or credited to the City by exchange with another water provider or directly with the
6-4
Section 6
Potential Future Water Supply Opportunities CAGRD. While this water may be lower in cost when compared to desalinated brackish groundwater, it is unlikely to be plentiful in supply and may have a finite time frame if the exemption from replenishment is not extended beyond 2025.
Costs for remediated groundwater can be zero, depending on where the site is located, the requirement for treatment by the deemed responsible party(ies), and the remediation plan associated with the contamination. Alternatively, it may be in the neighborhood of CAP costs if a pipeline would need to be constructed to bring the water to the City. The probability of this becoming a significant water supply for the City’s immediate future is considered low and uncertain.
6.2. Surface Water 6.2.1. Maricopa Water District A small portion of the City lies within the MWD planning area. Lands within this district have allocations to surface water from the Agua Fria River. The surface water is appurtenant to the lands where the water rights were historically established, and the City would need to execute a water delivery contract with the district to either have the water delivered to a treatment facility and then have the City deliver that water to the lands where the rights are appurtenant (as agent for the landowner), or use an underground storage and recovery project to accomplish the treatment and annual delivery of water using the aquifer. The reason this project would have to operate as an annual storage and recovery facility is to comply with the surface water statutes that govern the use of surface water in Arizona.
This water is a very low cost alternative but only available to those lands located within the MWD boundaries. Based on MWD’s recent average deliveries to its member lands of about 1.0 acre-foot per acre per year, this constitutes a very small supply of renewable surface water (estimated at 1,440 AFY average for the 1,440 acres of MWD member lands that are within the City’s water service area). If this water is desired for treatment and potable use, the City could also approach EPCOR to see if it could purchase capacity or a bulk water delivery contract from the White Tanks Water Treatment Plant developed by EPCOR at a site along the Beardsley Canal, near Cactus Road.
Another, and probably more economically viable method, would be to encourage the use of this water for urban lawn irrigation (much of the urbanized MWD service area is currently doing this). While the City does not derive a direct benefit, either by adding this water supply to its portfolio or by generating revenues from the delivery and sale of this water, it avoids the cost of treatment and/or underground storage and recovery and using its groundwater to serve this need. However, it entails a more complicated annual reporting process. Except for lands the City owns in its service area, the City would not incur the lawn irrigation demand in its portfolio, and would only be responsible for delivery of potable water for indoor use in the MWD service area. Because of the limited City of Surprise, Arizona Integrated Water Master Plan: Water Resources Update 04957020.0003
6-5
Section 6 Potential Future Water Supply Opportunities
amount of potential MWD water and the complexities involved with treatment and/or recharge and recovery of this water, use of the water for urban lawn irrigation is probably the best value for this water supply.
6.2.2. Central Arizona Project Water
6.2.2.1. Current CAP Allocations The City currently has a subcontract for CAP water. Prior to 2008, the City was not using the water because it did not have a water filtration plant, a permit to use one of the CAWCD regional recharge facilities, nor an underground storage project that could store CAP water within its planning area. However, as of December 31, 2014, the City has a balance of 21,308 AF of recoverable long term storage credits in its Long-Term Storage Account which includes CAP water and effluent. An agreement with CAWCD allows the City to recharge its CAP allocations at any of three CAWCD regional recharge facilities: the Tonopah, Hieroglyphic Mountains, and Aqua Fria facilities. The City holds Water Storage permits for all of these facilities.
The agreement with CAWCD is a cost-effective way for the City to continue to use its CAP subcontract. However, storing water in these facilities does not add to the City’s physical availability since the City’s wells are not considered within the area of hydrologic impact of the CAWCD storage facilities. In the near term, the City should investigate delivering its CAP allocation to the MWD as a groundwater savings facility. This will lower the cost of storage, and will also store water in what appears to be within the area of hydrologic impact.
6.2.2.2. Additional CAP Supplies The City will pursue an aggressive policy with the CAWCD to work to acquire any potentially available CAP water for future allocation to the City. While this is a low percentage opportunity, the value of the water to the City’s future in terms of the cost of the water and the avoidance of CAGRD obligations make it attractive and a high priority for future acquisition. Even if agricultural priority water (first to be reduced during shortages on the Colorado River) is all that is available, the City could acquire and bank this water for future use.
CAP water is offered in several different types of contracts, with one of the most reliable being a subcontract for M&I use, which is most commonly granted to potable water providers.
6.2.2.3. Indian Leases The City will pursue water that may be available for lease from tribes that have the authority to do so under recent water rights settlements. Availability of water from the San Carlos Apache Tribe is not currently established as the settlement terms have not yet been fully determined or satisfied; however, some amount of water may become
6-6
Section 6
Potential Future Water Supply Opportunities available in the future. Water from the Gila River Indian Community is currently being used for underground storage on and off the Community’s lands in conjunction with SRP, and, therefore, is not likely available for leasing as a long-term reliable supply.
The availability of Indian lease water to the City is entirely controlled by the Tribes and guided by the language of the complex Indian Water Rights settlements. If lease water is available, the water may be obtained for a specific period of time (ideally a 99 year term), helping the City to maintain a Designation of Assured Water Supply and potentially bridging the time needed for Arizona to develop additional regional water supplies that are truly sustainable and can eventually replace the need for leasing water on a long term basis.
6.2.3. Imported Water Supplies Additional Colorado River could be acquired by purchasing farm land along the Colorado River and conveying the water through the CAP, or some future alternative conveyance system, to the City. This potential supply could actually become more reliable than CAP water by virtue of the fact that water allocated historically for direct use on the river is higher in priority than the CAP. As a result, there is likely to be opposition by the CAWCD board and the CAP subcontractors to this strategy. According to CAGRD staff, the CAP becomes the likely candidate to purchase and deliver this water on behalf of existing and new subcontractors. The amount of water transferable would be based on the historic consumptive use (water actually used by crops) subtracting return flows that have run off the farms back to the river or infiltrated to the river’s subflow.
Additionally, the CAP has yet to authorize the use of the CAP for conveying non-CAP water in its facilities, which now appears unlikely as the CAP would have to prioritize use of its canal and may encounter challenges as to equitable distribution of its capacity. It is more likely that the CAP would acquire any such supplies on behalf of all existing and new subcontractors. Lastly, the agricultural economy on the Colorado River is experiencing a positive economic growth period, and the likelihood of water being permanently severed from the river and brought through the CAP is low for the foreseeable future.
Several tribes along the Colorado River also have large allocations to Colorado River water, but the ability to move water off their reservations to other water users by sale or lease is subject to legal challenge and unlikely to be resolved in the near future. Many believe that allowing the tribes to move the water off the reservations is somewhat of a water resources “Pandora’s Box” as it may be possible for the tribes to move the water anywhere along the river to any tributary state, thus increasing the risks of shortages to the CAP by virtue of the CAP’s last priority designation on the river.
City of Surprise, Arizona Integrated Water Master Plan: Water Resources Update 04957020.0003
6-7
Section 6 Potential Future Water Supply Opportunities
Other strategies to provide water from the Colorado River have emerged in recent years, including treating brackish groundwater water for agricultural use in exchange for Colorado River water to be transported to central Arizona. Again, the key element is to obtain the infrastructure capacity to move water to the central Arizona area. Proposals obtained by the City, if attractive, should be pursued with the caveat that the “transferring party” must provide a solution for transporting water to the City that is accepted and approved by the necessary parties prior to receiving payment from the City.
6.3. Water Stored Outside the AMA 6.3.1. Storage Potential There are several opportunities for surplus CAP water to be stored outside the Phoenix AMA for later recovery and importation. Although not an additional supply, these represent the potential to store water that perhaps other more local facilities could not. The issue of CAP wheeling this water also remains a factor. Water can be currently stored and imported from the Harquahala Irrigation Non-Expansion Area immediately to the west of the Phoenix AMA. A constructed facility and a groundwater savings facility are being operated by the Vidler Water Company in this area. Vidler is a company that specializes in buying and marketing water resources for profit.
In addition, the City could enter into an agreement with the Harquahala Valley Irrigation District (if there is available capacity) to operate a groundwater savings facility directly. This would reduce the cost of water by the amount the irrigation district would contribute (by virtue of power savings attributed to not having to pump groundwater) to the purchase of the CAP water for their direct use. The groundwater saved would become CAP water stored on behalf of the City for future withdrawal and use through the CAP (although this has several challenges as already discussed) or by exchange potentially with the CAGRD (this may have more potential).
6.3.2. Groundwater Importation Groundwater supplies can also be acquired and imported from the Harquahala Irrigation Non-Expansion Area (INA) for use by the City pursuant to specific statutory provisions that allow this to occur. Again, transportation or exchange of this water would have to be negotiated with the CAP/CAGRD in order to realize this supply. Currently, Vidler Water Company and a real estate concern that has purchased a significant amount of acreage in the area have indicated a willingness to sell all or part of their lands as a “water farm” to cities located downstream along the CAP, including the City of Tucson. The cost of this water is unknown, but it is believed that the land was purchased for prices up to $25,000/acre, and the purchase of the land to access the water would have to be at a significant increase in order to meet the rate of return expectations of the sellers.
6-8
Section 6
Potential Future Water Supply Opportunities In addition, two other groundwater basins have similar legal ability to have water exported to the Phoenix AMA: the McMullen Valley and Butler Valley areas. The McMullen Valley has a large amount of irrigated acreage that was purchased for future importation by the City of Phoenix, but later sold to a private entity, potentially making this water legally unavailable. Once again, both of these basins could be used to store and recover CAP water in the future using constructed facilities, or even groundwater savings facilities, but would require construction of diversions and discharges back to the CAP canal to implement, along with obtaining the ability to convey water (or more likely to exchange water) through the CAP.
6.4. Water Obtained from Private Water Company Acquisitions Within the exterior boundaries of the City’s current annexed area, and within the City’s general planning area, there are several private water companies. Two of these, EPCOR and Brook/Circle City Water Company, have CAP subcontracts. EPCOR has a subcontract for 11,093 AFY for use within its entire service area inside and outside of the City’s planning area. This allocation is not considered available to the City unless it acquires and/or arranges to provide water service within the EPCOR service area. Brooke/Circle City Water Company has an allocation of 3,932 AFY and is located entirely within the City’s planning area.
All of the private water companies located within the City’s annexed and general planning areas are non-designated suppliers, meaning that they do not have their own designation of assured water supply. As a result, developers within these service areas and Certificate of Convenience and Necessity areas (a planning area for a private water company awarded by the Arizona Corporation Commission) must apply for their own Certificates of Assured Water Supply. Part of the criteria for obtaining a Certificate is demonstrating that there is enough water physically available to satisfy the demand for the next 100 years. To facilitate development, some water companies have hydrogeologic models constructed to determine the amount of groundwater available and as such are awarded a Physical Availability Determination. When such a determination has not been made, the developer must conduct this analysis independently. This could be a factor in demonstrating future water supplies for private water companies that the City may consider acquiring in the future.
At the time of acquisition, the City will also gain access to the amount of groundwater that has been deemed physically available to developments, or planned developments, that have been issued Certificates of Assured Water Supply. A cursory review of ADWR records of entities that have filed for an Analysis of Assured Water Supply reveals that there may currently be 2,106 AFY of additional groundwater physically available (from primarily within the Beardsley Water Company service area). The City would also assume the water demands associated with these projects. In addition, if land owners have applied for and been granted a physically available groundwater supply by filing City of Surprise, Arizona Integrated Water Master Plan: Water Resources Update 04957020.0003
6-9
Section 6 Potential Future Water Supply Opportunities
applications for an Analysis of Assured Water Supply, that groundwater is tied to the prospective project for up to 10 years, with some limited rights for extension. Those water supplies could be assigned to the City as part of the development, or if the land does not develop in the future, the City could also acquire that physical availability for use on other lands within the City’s planning area if the City withdraws water from within the area of hydrologic impact. Circle City Water Company is currently not using its CAP water subcontract. As a result, the City could approach the water company about creating long-term water storage credits using this water and paying some added value to the Company for the credits.
6.5. Reclaimed Water Currently, reclaimed water produced by the SPA 1 WRF is delivered to several direct reuse customers for beneficial reuse, as well as recharge at vadose zone injection wells in SPA 1. Currently SPA 2 has a permanent regional WRF in operation and reclaimed water is being recharged in surface recharge basins until the reclaimed water volumes become high enough to allow recharge in the SPA 2 vadose zone injection wells. A temporary developer WRF was constructed in SPA 3, but was never put in operation. The current developer plan is to vault wastewater flows at a SPA 3 lift station and haul the wastewater to either the SPA 2 or SPA 1 WRF. The City has obtained a permit for recharging reclaimed water in vadose zone injection wells when the SPA 3 WRF becomes operational. SPA 4, SPA 5, and SPA 6 are also planned to have their own WRFs, but design has not started.
The City previously developed plans for direct reuse and recharge of reclaimed water because it recognized this supply as a critical component of its water resource portfolio. Reclaimed water is recognized as a drought proof supply of water that will grow as development continues. Direct use of reclaimed water will benefit the City by removing some non-potable demands from the drinking water system. Recharged reclaimed water will provide water storage credits that can be recovered as potable and/or non-potable supplies.
6.5.1. Reclaimed Water Availability Using the Demand Module previously described in Section 5, future reclaimed water availability was updated through build-out (Table 6-1). It should be noted that these values represent conditions as determined from estimates of land use densities, open space, landscape types provided by the City Planning Department, and findings of the 2008 Integrated Water Master Plan. Reclaimed water production within the City’s wastewater service area (which includes wastewater supply from portions of the EPCOR and El Mirage water service areas) is estimated to grow to approximately 77,600 AFY at build-out.
6-10
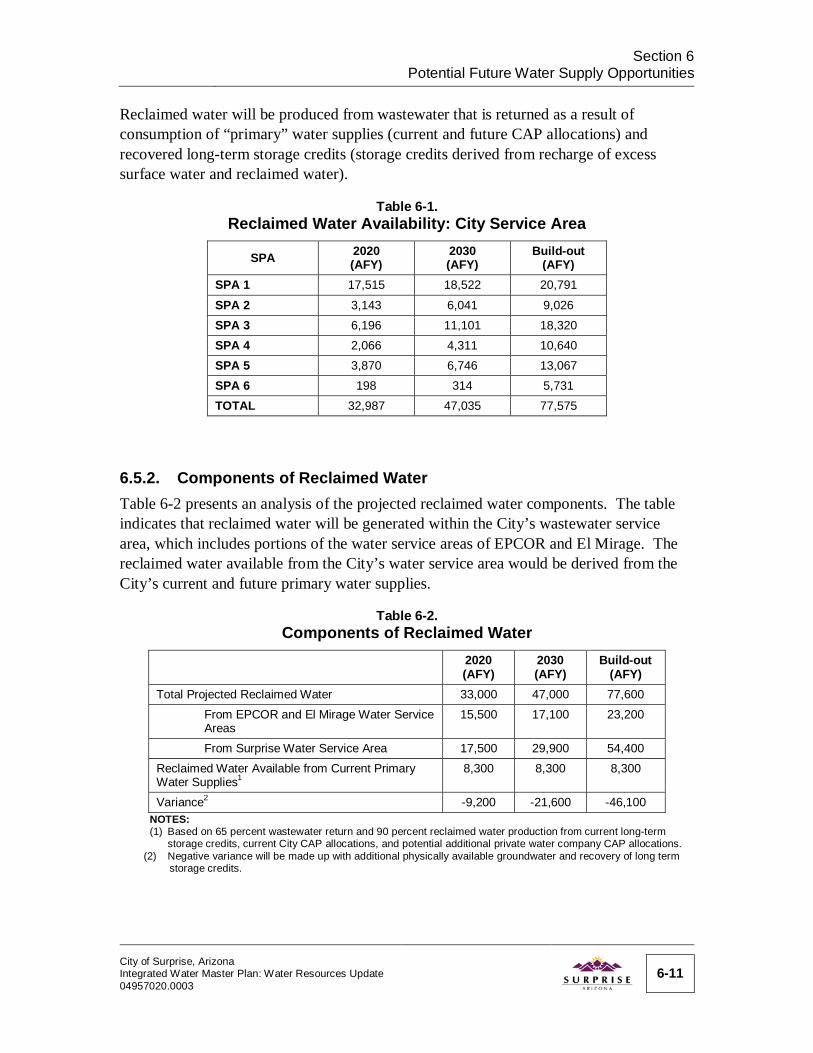
Section 6
Potential Future Water Supply Opportunities Reclaimed water will be produced from wastewater that is returned as a result of consumption of “primary” water supplies (current and future CAP allocations) and recovered long-term storage credits (storage credits derived from recharge of excess surface water and reclaimed water).
Table 6-1. Reclaimed Water Availability: City Service Area
SPA 2020 (AFY)
2030 (AFY)
Build-out (AFY)
SPA 1 17,515 18,522 20,791
SPA 2 3,143 6,041 9,026 SPA 3 6,196 11,101 18,320 SPA 4 2,066 4,311 10,640 SPA 5 3,870 6,746 13,067 SPA 6 198 314 5,731 TOTAL 32,987 47,035 77,575
6.5.2. Components of Reclaimed Water Table 6-2 presents an analysis of the projected reclaimed water components. The table indicates that reclaimed water will be generated within the City’s wastewater service area, which includes portions of the water service areas of EPCOR and El Mirage. The reclaimed water available from the City’s water service area would be derived from the City’s current and future primary water supplies.
Table 6-2. Components of Reclaimed Water
2020 (AFY)
2030 (AFY)
Build-out (AFY)
Total Projected Reclaimed Water 33,000 47,000 77,600 From EPCOR and El Mirage Water Service Areas
15,500 17,100 23,200
From Surprise Water Service Area 17,500 29,900 54,400 Reclaimed Water Available from Current Primary Water Supplies1
8,300 8,300 8,300
Variance2 -9,200 -21,600 -46,100 NOTES: (1) Based on 65 percent wastewater return and 90 percent reclaimed water production from current long-term
storage credits, current City CAP allocations, and potential additional private water company CAP allocations. (2) Negative variance will be made up with additional physically available groundwater and recovery of long term
storage credits.
City of Surprise, Arizona Integrated Water Master Plan: Water Resources Update 04957020.0003
6-11
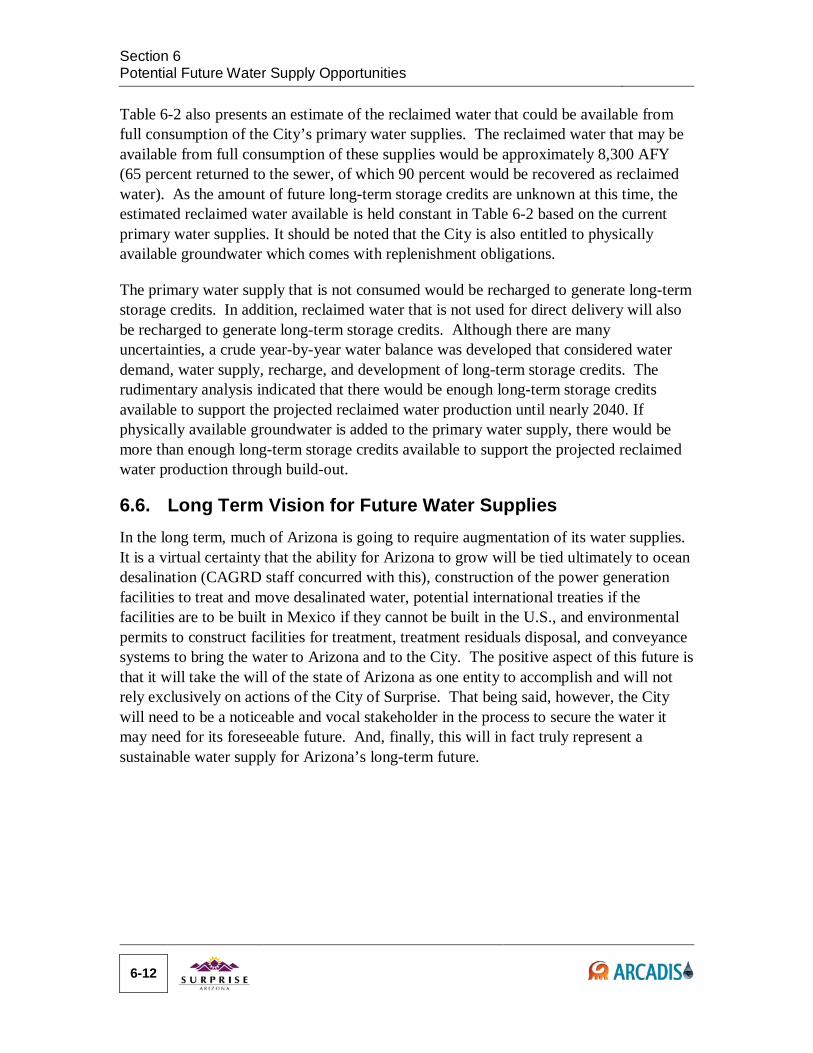
Section 6 Potential Future Water Supply Opportunities
Table 6-2 also presents an estimate of the reclaimed water that could be available from full consumption of the City’s primary water supplies. The reclaimed water that may be available from full consumption of these supplies would be approximately 8,300 AFY (65 percent returned to the sewer, of which 90 percent would be recovered as reclaimed water). As the amount of future long-term storage credits are unknown at this time, the estimated reclaimed water available is held constant in Table 6-2 based on the current primary water supplies. It should be noted that the City is also entitled to physically available groundwater which comes with replenishment obligations.
The primary water supply that is not consumed would be recharged to generate long-term storage credits. In addition, reclaimed water that is not used for direct delivery will also be recharged to generate long-term storage credits. Although there are many uncertainties, a crude year-by-year water balance was developed that considered water demand, water supply, recharge, and development of long-term storage credits. The rudimentary analysis indicated that there would be enough long-term storage credits available to support the projected reclaimed water production until nearly 2040. If physically available groundwater is added to the primary water supply, there would be more than enough long-term storage credits available to support the projected reclaimed water production through build-out.
6.6. Long Term Vision for Future Water Supplies In the long term, much of Arizona is going to require augmentation of its water supplies. It is a virtual certainty that the ability for Arizona to grow will be tied ultimately to ocean desalination (CAGRD staff concurred with this), construction of the power generation facilities to treat and move desalinated water, potential international treaties if the facilities are to be built in Mexico if they cannot be built in the U.S., and environmental permits to construct facilities for treatment, treatment residuals disposal, and conveyance systems to bring the water to Arizona and to the City. The positive aspect of this future is that it will take the will of the state of Arizona as one entity to accomplish and will not rely exclusively on actions of the City of Surprise. That being said, however, the City will need to be a noticeable and vocal stakeholder in the process to secure the water it may need for its foreseeable future. And, finally, this will in fact truly represent a sustainable water supply for Arizona’s long-term future.
6-12
7. Reclaimed Water Management
This section provides a review of the City’s available water reuse options, a summary of evaluations of reclaimed water management alternatives conducted in 2008, and, based on City policy development since completion of the Integrated Water Master Plan, a discussion of the City’s current direction and preferences in managing its valuable reclaimed water resource.
7.1. Reclaimed Water Availability and Demand The Demand Module described in Section 5 is used to project build-out reclaimed water availability and potential reclaimed water demands (outdoor and large landscape irrigation demands). Use of reclaimed water also has to consider the seasonal balance between reclaimed water supply and demand.
The SPA 1 WRF monthly reclaimed water production data from 2005 to 2007 were normalized (by dividing monthly flows by the average yearly flows) to determine seasonal fluctuations in reclaimed water availability (Figure 7-1). Reclaimed water production does not appear to fluctuate seasonally to a great extent. A similar analysis was performed on 2005-2007 monthly metered billing data from the City’s irrigation meters (which are assumed to represent large landscape irrigation demands), also shown on Figure 7-1. Between January and July, landscape irrigation demand was below average, dropping to 0.35 times the annual average demand. After July, the demand increased to 1.7 times the annual average demand. Due to these differences in availability and demands, a portion of the available reclaimed water would need to be recharged during low demand periods and recovered during peak months when reclaimed demands exceed the reclaimed water available.
For the purposes of evaluating reuse options, potential reclaimed water availability was assumed to be constant. The minimum reclaimed water demand was assumed to be 0.35 times the average reclaimed water demand. Maximum day reclaimed water demand was assumed to be 2 times average demand, which is consistent with the water billing data above.
City of Surprise, Arizona Integrated Water Master Plan: Water Resources Update 04957020.0003
7-1
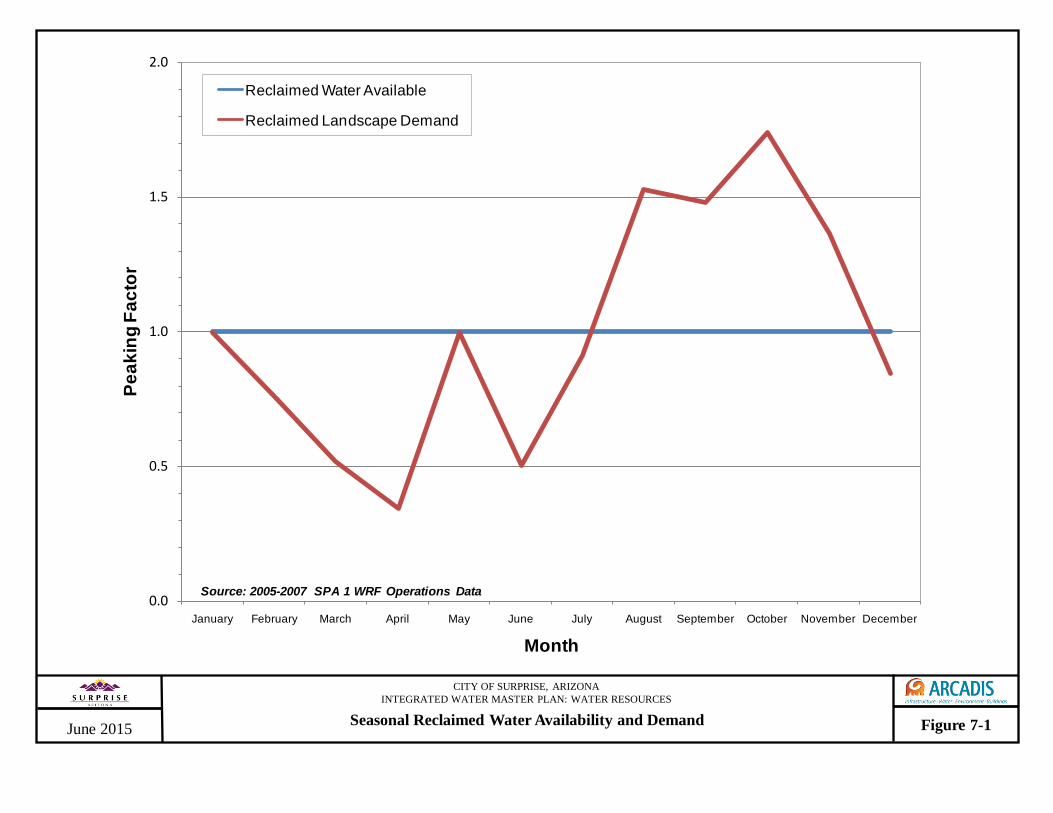
0.0
0.5
1.0
1.5
2.0
January February March April May June July August September October November December
Peak
ing
Fact
or
Month
Reclaimed Water Available
Reclaimed Landscape Demand
Source: 2005-2007 SPA 1 WRF Operations Data
Seasonal Reclaimed Water Availability and Demand Figure 7-1
CITY OF SURPRISE, ARIZONA INTEGRATED WATER MASTER PLAN: WATER RESOURCES
June 2015
Section 7
Reclaimed Water Management
7.2. Water Reuse Opportunities (2008) The scope of the current Water Resources component update did not include updating the information in this Section 7.2. Thus, the reader is advised that the information presented was current as of November 2008.
In the 2008 Integrated Water Master Plan project, general water reuse opportunities were presented and discussed at a workshop with the City’s Steering Committee and Technical Committee, resulting in the identification of opportunities that are applicable to the City. The applicable water reuse opportunities were divided into the following categories:
Groundwater Recharge
Direct Use of Reclaimed Water Discharge to Waterways
Water Exchanges
Within these categories, there are several methods to strategically use reclaimed water. Descriptions of each opportunity, including general infrastructure needs, permitting and institutional requirements, and cost information are presented in this section.
7.2.1. Groundwater Recharge Groundwater recharge serves two primary functions: it can reduce the effects of groundwater pumping on the groundwater table, and it can store water for future use. Recharge opportunities available to the City include use of City-owned facilities and regional facilities.
7.2.1.1. City-Owned Recharge Facilities The methods of groundwater recharge for reclaimed water considered in this project include surface recharge basins, vadose zone injection, and deep well injection/aquifer storage and recovery. The recharge concepts are depicted on Figure 7-2.
Surface Recharge
In surface recharge, water is introduced into constructed recharge basins and allowed to infiltrate through the bottoms of the basins. Surface recharge is by far the most common method of recharge, with many examples of large aquifer recharge facilities in the West Salt River Basin that use surface recharge basins.
The feasibility of surface recharge depends greatly on the geologic conditions of the recharge area. Review of available City hydrogeologic studies revealed infiltration rates ranging from 0.2 to 0.5 feet per day in SPA 1, up to 1.2 feet per day in SPA 2, and 4 to 10 City of Surprise, Arizona Integrated Water Master Plan: Water Resources Update 04957020.0003
7-3

Section 7 Reclaimed Water Management
feet per day in SPA 3. In general, relatively large areas are required to employ this recharge method, and at least 2 or more basins are required to allow for wet/dry cycling of the basins to optimize recharge and long term basin maintenance.
Figure 7-2: Groundwater Recharge Options
The potential advantages of using recharge basins may include:
High surface filtration area through the floor of basins can reduce plugging potential
Less frequent maintenance and longer life expectancy as compared to injection wells and other subsurface technologies
Additional trihalomethane (THM), total organic carbon (TOC), or total suspended solids (TSS) treatment is generally not needed
Relatively low cost, generally ranging from $100,000 to $250,000 per acre in capital and $8 to $10 per acre-foot recharged in operations and maintenance (O&M)
Potential limitations of using constructed recharge basins may include loss of water through evaporation, limited available land area, high land costs, proximity to airports (large open bodies of water near airports pose a bird hazard concern), and loss of valuable land space.
At a minimum the following permits would be required to construct and operate recharge basins:
ADWR USF and Water Storage (WS) Permits ADEQ APP – The APP may be added to the WRF’s APP if the recharge facility is
proximal to the WRF MCESD Approval to Construct (ATC) and Approval of Construction (AOC)
For a description of the applicable permits and other permits described in this section, refer to the Water Infrastructure component of the IWMP.
Surface Basins
VadoseZone
InjectionASR Well
Deep Well Injection
Water Table
7-4
Section 7
Reclaimed Water Management Vadose Zone Injection
In vadose zone injection recharge, water is introduced into large diameter (3 to 4 foot) bore holes with 12 to 20-inch diameter well casings drilled to above the local groundwater table and allowed to infiltrate into the unsaturated vadose zone. Similar to surface recharge, the feasibility of vadose zone injection depends greatly on the geologic conditions of the recharge area. Geologic conditions dictate the recharge rate, which can typically range from 200 to 500 gpm. The vadose zone injection wells planned for SPA 1 are expected to have injection capacities of approximately 400 gpm based on recent (2013) operational data. Vadose zone injection wells are spaced at a minimum of 100 feet apart.
The potential advantages of utilizing vadose zone injection wells include:
The ability to inject water below potential fine grained confining units in the upper 100 feet of vadose zone that might otherwise limit the effectiveness of surface recharge basins due to perching of recharge water on silts and clay layers
No water loss through evaporation Small surface footprint (10 feet by 10 feet, or less) for individual vadose zone
injection wells Relatively low cost and maintenance as compared to deep well and ASR type wells
A limiting factor for the feasibility of vadose zone recharge is the lifetime of the injection wells. Typically a vadose zone injection well is projected to have a limited lifetime of 5 to 10 years due to microbial activity and TSS decreasing the recharge rate. Pretreatment (filtration and disinfection) in addition to adequate operation and maintenance can extend the lifetime of an injection well. For the SPA 1 vadose zone injection wells, the City is treating the reclaimed water to remove particles larger than 10 microns. When considering the anticipated lifetime of the well and replacement costs, vadose zone wells and deep injection wells have similar requirements for capital expenditures.
If vadose zone injection wells are operated within the hydraulic capture zone of reclaimed water production wells, additional reclaimed water treatment may not be needed if the City can prove it is recovering all the reclaimed water that was recharged on a routine basis. Water recovered in such an operation would have to be used for non-potable purposes. If the City can show that the vadose zone thickness is sufficient for providing supplemental soil/aquifer treatment, additional reclaimed water treatment may also not be necessary. If, however, vadose zone injection wells are used solely for recharge and the water is not recovered on a routine basis, additional reclaimed water treatment would most likely be required to ensure that aquifer water quality regulations are met at the point of compliance, specifically the total trihalomethane (TTHM) MCL of 80 µg/L. It is important to note that if soil/aquifer treatment is used for either surface
City of Surprise, Arizona Integrated Water Master Plan: Water Resources Update 04957020.0003
7-5
Section 7 Reclaimed Water Management
spreading basins or vadose injection wells, additional monitoring wells may be required by ADEQ to demonstrate the MCLs are met at the point of compliance.
At a minimum, the following permits would be required for operating vadose zone injection wells:
ADWR USF and WS Permits ADEQ APP - may be included with the WRF’s APP if the recharge facility is
proximal to the WRF MCESD Approval to Construct (ATC) and Approval of Construction (AOC)
EPA Underground Injection Control Permit for Class V wells
Deep Injection and Aquifer Storage and Recovery
Deep injection wells are large (14 to 18-inch diameter) wells that are designed to inject water into deeper aquifer units, generally in the range of 600 to 2,500 feet below ground surface. Deep injection wells are designed similar to production wells. Unlike production wells, which are designed to only withdraw water from the aquifer, deep injection wells are designed to both inject water into the aquifer as well as periodically reverse flow to back flush the well. A discharge location for the back flush water such as a dry well or storage tank (for off-site disposal) will be required for deep injection and ASR wells. ASR wells are dual purpose wells that allow water to be injected and recovered (pumped out) using the same well. The advantage of using ASR wells is the dual purpose design allows for storage and recovery.
An Under Ground Injection Control (UIC) Permit issued by USEPA will be required for a deep injection well, and for an ASR well if it is drilled deep enough, if they are used for the purpose of injecting reclaimed water from a municipal water reclamation facility. The UIC permit rules require that a deep injection well must be designed to inject hazardous and non-hazardous wastes into deep, isolated rock formations below the lowermost underground sources of drinking water (USDW).
Permitting deep injection wells for the sole purpose of recharging reclaimed water may be difficult in Arizona because the state has determined that all groundwater in the state is potential drinking water and that any water injected cannot degrade the water groundwater quality. It is important to note that the ASR wells that have been permitted and that are in operation are for wells that recharge treated water from surface water sources (i.e., CAP water) or reclaimed water that is stored and recovered.
Deep injection wells or ASR wells may require a higher level of treatment prior to injection to help reduce the rate of fouling or clogging of the well screen and filter pack.
7-6
Section 7
Reclaimed Water Management The City of Scottsdale and City of Chandler employ ASR wells. The City of Scottsdale is concerned with groundwater decline and stores treated CAP water for potable water use.
At a minimum, the following permits would be required for operating deep injection wells or ASR wells:
ADWR USF and WS Permits
ADEQ APP - may be added to the WRF’s APP if the recharge facility is proximal to the WRF
MCESD Approval to Construct (ATC) and Approval of Construction (AOC) EPA Underground Injection Control Permit for Class I wells for deep wells
ADWR recovery well permit, for ASR wells
High Level Assessment of City-Owned Recharge Alternatives
The viability of the recharge options was assessed for recharge and recovery of a specific volume of reclaimed water. In order to compare the recharge options on an equal basis, both recharge and recovery were considered. It was assumed that recovery for the surface recharge, vadose zone injection and deep injection would be via potable production wells that would need treatment for arsenic, including residuals disposal. Recovery in an ASR well would not need treatment, but the recovered water could only be used for non-potable purposes.
The review of the recharge technologies reveal that recharge facility design, operation, and the need for additional reclaimed water treatment depend highly on local hydrogeology, groundwater quality, and reclaimed water quality conditions, and are normally not determined until site-specific studies are completed. To bracket the possible range of costs, two high level evaluations were completed. The initial evaluation considered no additional reclaimed water treatment, and the second evaluation considered additional treatment to meet aquifer water quality standards necessary for sub-surface injection (vadose zone, deep injection, and ASR). Details of the high level cost evaluations are provided in Appendix B.
The following assumptions were used when conducting the 2008 initial evaluation that considered no additional reclaimed water treatment:
Surface spreading basins, deep injection wells, and ASR wells were all assumed to have a life expectancy greater than 20 years. Vadose zone injection wells were assumed to have a life expectancy of 7 years, thus the vadose zone wells would have to be replaced twice over the 20-year evaluation period.
City of Surprise, Arizona Integrated Water Master Plan: Water Resources Update 04957020.0003
7-7
Section 7 Reclaimed Water Management
No additional treatment would be required to recharge the water (i.e. no TOC/TSS
removal).
The surface spreading basin infiltration rate was 1.0 ft/day. Vadose zone injection well capacity was 200 gpm. Deep injection and ASR well recharge capacities were 800 gpm. ASR recovery capacity, as well as potable production capacity, was 1,400 gpm.
In the second evaluation, considering advanced treatment, the following additional assumptions were made:
Surface spreading basins would not require any additional treatment. Vadose zone injection wells would directly impact the aquifer, and additional
treatment would be required to remove TTHM precursor material (TOC). Deep injection and ASR wells would require additional treatment to remove TTHM
precursor material and other particulates that cause biofouling. The treatment technology used in the evaluation was reverse osmosis with brine
treatment and disposal. Granular activated carbon is also an accepted technology, but its cost depends greatly on the extent of TOC and TTHM precursor removal needed, which is unknown at this time. Evaporation ponds were assumed for brine disposal.
The high level cost comparison of the recharge technologies indicate that if both recharge of reclaimed water and recovery of water to meet reclaimed water demands are considered, and if additional reclaimed water treatment is not needed, the four recharge technologies are comparable on a 20-year present worth basis. In this case, other non-cost decision criteria such as depth to groundwater, infiltration rates, relative proximity to other recharge facilities, availability of land, etc. should be considered when choosing an appropriate technology for an area. If additional reclaimed water treatment is necessary, however, surface spreading basins are the most economical.
Because the need for additional reclaimed water treatment and hydrogeologic conditions are not known at the time, surface recharge technologies were used for purposes of the evaluation of reclaimed water management program alternatives, unless another technology is specified in the alternative.
7.2.1.2. Regional Recharge Facilities Regional recharge facilities are large projects in which several entities (e.g., municipalities, governmental agencies, and private water companies) participate by sharing the cost of constructing and operating the facility or by paying the implementing agency a recharge fee to use the facility.
7-8
Section 7
Reclaimed Water Management The following regional recharge projects were considered available to the City for potentially recharging reclaimed water (Figure 7-3):
Hieroglyphic Mountains and Agua Fria Recharge Projects New River-Agua Fria Underground Storage Project
Agua Fria Linear Recharge Project
Hieroglyphic Mountains and Agua Fria Recharge Projects
The Hieroglyphic Mountains and Agua Fria regional recharge facilities are owned and operated by the CAWCD. The Arizona Water Banking Authority, CAGRD, City of Goodyear, City of Peoria, and other entities currently use the facilities to recharge CAP surface water allocations as well as excess CAP supplies. Currently, only the City of Peoria has purchased capacity ownership in one of these facilities (15 percent of the Agua Fria facility) for its designation of assured water supply purposes.
The Hieroglyphic Mountains and Agua Fria facilities have annual permitted recharge capacities of 35,000 AFY and 100,000 AFY, respectively. In general, the recharge facilities are operated on a “first-come, first-served” basis. Entities that have permits to use the facilities have surface water allocations or have purchased excess supplies and have a Water Use Agreement with CAWCD. The entities can order recharge capacity in the facilities by October for recharge in the following year. There are no capital costs associated with recharging CAP water at the regional recharge facilities for municipalities, only an O&M or recharge fee, which is currently $8 per acre-foot.
Pipelines and booster pumps would be required to get the reclaimed water from the City’s WRFs to the regional recharge facilities. The City would have to obtain an ADWR Water Storage Permit to recharge and store reclaimed water at the CAWCD facilities (as well as any permits associated with the pipeline routes and constructing the pipeline). In addition, the City would have to negotiate cost sharing and water exchange agreements with CAWCD and CAGRD.
Because the facility is located within the City’s MPA, thus minimizing the infrastructure needed to deliver water and also increasing the amount of water stored beneath the City’s MPA, use of the Hieroglyphic Mountains facility was retained for the 2008 reclaimed water management alternatives evaluation described in Section 7.3.
City of Surprise, Arizona Integrated Water Master Plan: Water Resources Update 04957020.0003
7-9

?>
?>
?>
243 A
ve.
235 A
ve.
Sun Valley Pkwy
211 A
ve.
227 A
ve.
203 A
ve.
Patton Rd.
Grand Ave.
SR 30
3
Cactus Rd.
Reem
s Rd.
Waddell Rd.Greenway Rd.
Pinnacle Peak Rd.
Lone Mountain Rd.Dove Valley Rd.
State Route 74
Peoria Rd.
Sariv
al Rd
.
Cotto
n Rd.
Jomax Rd.
Dysa
rt Rd.
219 A
ve. Bell Rd.
187 A
ve.
179 A
ve.
Litch
field
Rd.
Deer Valley Rd.
Dixileta Rd.
Bulla
rd Rd
.
195 A
ve.
CAP Canal
Beardsley Canal
SPA 6
SPA 5
SPA 3
SPA 4
SPA 1
SPA 2
Figure 7-3
Regional Recharge Options
M:\04957020.0003\GIS\Project_MXDs\Figure 7-3 Regional Recharge Options.mxdJune 2015
¯0 2 41
Miles
INTEGRATED WATER MASTER PLAN:WATER RESOURCES
CAP Hieroglyphic MountainsUSF 71-584466
35,000 AFY Capacity
Agua Fria Recharge Project, CAWCDUSF 71-566367
100,000 AFY Capacity
Agua Fria Linear Recharge40,000 - 60,000 AFY Capacity
NAUSP, SRPUSF 71-588558
30,000 - 75,000 AFY Capacity
LegendMunicipal Planning AreaSpecial Planning AreasCanalsStreetsLinear Recharge Project
?> Permitted Recharge Facilities
Section 7
Reclaimed Water Management Other CAWCD/CAGRD Regional Recharge Facilities
In 2008, the CAWCD facilities were not permitted to take reclaimed water; however, there has reportedly been recent interest to permit some facilities for reclaimed water. The interest is related to the CAGRD’s long-term water supplies or credits for their state-wide replenishment obligations. One long-term, renewable water supply that is being considered is reclaimed water from communities that cannot, or will not, utilize this water. The CAWCD and CAGRD have indicated that they are open to participating in cost-sharing agreements to construct the necessary conveyance facilities to deliver the reclaimed water to a regional CAWCD facility, and that they would obtain the necessary reclaimed water recharge permits. In exchange, the CAGRD would receive a portion of the resulting long term storage credits. The exchange ratio, as well as the cost-sharing arrangements, would be subject to negotiations on a case-by-base with CAWCD and CAGRD. CAGRD has indicated that the exchange ratio would likely be less than one-for-one. Thus, in the cost evaluations, the costs for this alternative were conservatively based on the current costs for recharging CAP water, and that 50 percent of the credits for recharging the reclaimed water could be subject to exchange with the CAGRD.
New River-Agua Fria River Underground Storage Project (NAUSP)
The NAUSP, constructed by the Salt River Project (SRP), began operations in October 2006 at a permitted capacity of 30,000 AFY. The facility is located in Glendale near the intersection of 107th Avenue and Bethany Home Road, adjacent to Skunk Creek. The facility currently includes five off-channel recharge basins. SRP anticipated that the facility will be re-rated to a permitted capacity of 50,000 AFY in October 2008. SRP is also currently in the process of permitting a sixth basin which will be in the Skunk Creek channel. The ultimate permitted capacity of all six recharge basins is anticipated to be 75,000 AFY, although there is some uncertainty because of actual recharge rates achieved and impacts to other recharge facilities in the region.
The NAUSP is currently fully owned by five participants: Chandler, Avondale, Glendale, Peoria, and the SRP. SRP indicates that there are no planned expansions of the facility and that there is no capacity ownership available to others at this time. There could be some flexibility in the future, but it is too early to know for sure.
Because of the uncertainty in future permitted capacity and future expansions, the NAUSP regional recharge facility was dropped from further consideration.
Agua Fria Linear Recharge Project
The Agua Fria Linear Recharge Project is a proposed regional project sponsored by the Multi-Cities Sub-Regional Operating Group (SROG): Phoenix, Mesa, Tempe, Scottsdale, and Glendale. SROG is proposing to recharge reclaimed water and create recreational City of Surprise, Arizona Integrated Water Master Plan: Water Resources Update 04957020.0003
7-11
Section 7 Reclaimed Water Management
and wetland habitat areas in the Agua Fria River. In “linear recharge,” rather than recharging all the water at one location, several discharge points along the riverbed are used. The project would have discharge locations along a ten-mile portion of the Agua Fria River stretching from Bell Road to Indian School Road. The primary objective of the project is to recharge treated wastewater from the 91st Avenue Wastewater Treatment Plant; however, the Phoenix and SROG have been looking for additional participants.
The SROG cities started the project in 2001 and completed Phase 1: Stakeholders Coordination and Public in 2003. Phase 2: Initial Technical Investigations / Economic Analyses / Feasibility Report Update is currently in process, and the final feasibility report is anticipated by the end of this year. Phase 2 also included preparation and submittal of a draft Environmental Impact Statement which stipulates a capacity of up to 100,000 AFY. The SROG project team indicated that the future of the project is currently unknown and that no additional funds have been set aside for the project for the next ten years. The project team also could not project a schedule for the remaining two phases of the project: Preliminary Designs and Final Design and Implementation.
Pipelines and booster pumps would be required to get the reclaimed water from the City’s WRFs to the regional recharge facility. The City would have to obtain an ADWR Water Storage Permit to recharge and store reclaimed water at the facility (as well as any permits associated with the pipeline routes and constructing the pipeline). In addition, the City would have to negotiate cost sharing (if any) and facility use agreements with SROG.
Because the facility is located close to the City’s planning area, the Agua Fria Linear Recharge Project was retained for the 2008 evaluations described in Section 7.3.
7.2.2. Direct Use of Reclaimed Water (2008) Direct use of reclaimed water occurs when reclaimed water is used in place of potable water for irrigation and other non-potable applications. Replacing current water sources with reclaimed water can result in an increase in available potable water. Direct reuse opportunities within the City’s planning area include landscape irrigation (e.g. HOA common spaces, parks, golf courses, and highway landscaping), residential irrigation, ornamental lakes, industrial and commercial applications (e.g. large evaporative cooling units, and/or landscape irrigation), and agricultural irrigation. The actual use of reclaimed water at these sites will depend on several factors, including cost-effectiveness of conveying water to the user, total demand, water quality needs, and the user’s perception of using reclaimed water.
In general, direct use of reclaimed water is broken down into two categories: open-access and restricted-access. As defined by ADEQ, open-access means that “access to reclaimed water by the general public is uncontrolled.” Open-access applications
7-12

Section 7
Reclaimed Water Management typically have a high potential for incidental human contact, especially with children (e.g., turf irrigation at schools, parks, and front yards or use in surface water recreational features). According to ADEQ, restricted-access means that “access to reclaimed water by the general public is controlled.” Restricted-access applications typically have a lower potential for incidental human contact, especially children (e.g., turf irrigation at golf courses, landscape irrigation along freeways and rights-of-way, and industrial/ commercial uses).
Instead of open-access and restricted-access demands, reclaimed water demands for this project were divided into large landscape irrigation demands and residential and commercial outdoor demands. The Demand Module provided the mechanism for projecting potential reclaimed water demands, based on the methodology described in Section 5. Large landscape demands (HOA common areas, parks, water features, schools, etc.) accounted for approximately 30 percent of the total water demand in 2008. Outdoor demands include residential and commercial outdoor water use, which was approximately 35 percent of the total residential and commercial demand. For the direct reuse alternatives described below, “serving the largest customers” will constitute serving the large landscape irrigation demands, and “maximizing reuse” will constitute serving all landscape and outdoor demands.
The infrastructure for direct reuse opportunities will depend on the reclaimed water demand within an area. If reclaimed water is only served to the largest customers, a skeleton system with a few connections would be sufficient. If, however, reclaimed water is served to all potential users including residential outdoor use, a larger network of pipes with multiple connections would be needed to sufficiently deliver water to the users. In both cases, the reclaimed water distribution system must also be able to manage imbalances in supply and demand caused by seasonal changes.
In workshops held with the City Technical and Steering Committees, four general direct use alternatives were identified for further evaluation as discussed in Section 7.3:
Serve largest reuse customers by SPA - The largest reuse customers in each SPA will be served with reclaimed water produced in each SPA. Any reclaimed water not used within a SPA will be recharged. Reclaimed demands exceeding reclaimed water available will be met with untreated groundwater or CAP water.
Maximize direct reuse by SPA - All potential reclaimed water customers will be served with reclaimed water produced in each SPA. Any reclaimed water not used within a SPA will be recharged. Reclaimed demands exceeding reclaimed water available will be met with untreated groundwater or CAP water.
Serve largest reuse customers via a fully-connected dual distribution system - The largest reuse customers will be served and water will be allowed to be moved among SPAs. Reclaimed demands exceeding reclaimed water available will be met with untreated groundwater or CAP water.
City of Surprise, Arizona Integrated Water Master Plan: Water Resources Update 04957020.0003
7-13
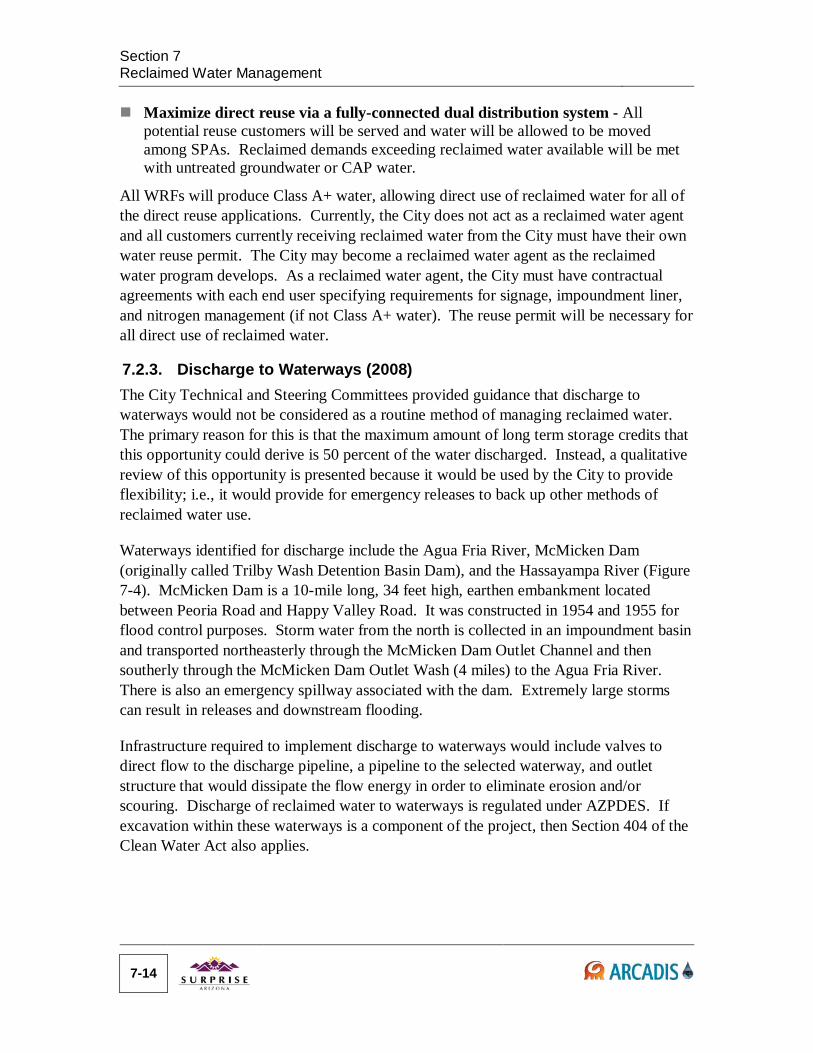
Section 7 Reclaimed Water Management
Maximize direct reuse via a fully-connected dual distribution system - All
potential reuse customers will be served and water will be allowed to be moved among SPAs. Reclaimed demands exceeding reclaimed water available will be met with untreated groundwater or CAP water.
All WRFs will produce Class A+ water, allowing direct use of reclaimed water for all of the direct reuse applications. Currently, the City does not act as a reclaimed water agent and all customers currently receiving reclaimed water from the City must have their own water reuse permit. The City may become a reclaimed water agent as the reclaimed water program develops. As a reclaimed water agent, the City must have contractual agreements with each end user specifying requirements for signage, impoundment liner, and nitrogen management (if not Class A+ water). The reuse permit will be necessary for all direct use of reclaimed water.
7.2.3. Discharge to Waterways (2008) The City Technical and Steering Committees provided guidance that discharge to waterways would not be considered as a routine method of managing reclaimed water. The primary reason for this is that the maximum amount of long term storage credits that this opportunity could derive is 50 percent of the water discharged. Instead, a qualitative review of this opportunity is presented because it would be used by the City to provide flexibility; i.e., it would provide for emergency releases to back up other methods of reclaimed water use.
Waterways identified for discharge include the Agua Fria River, McMicken Dam (originally called Trilby Wash Detention Basin Dam), and the Hassayampa River (Figure 7-4). McMicken Dam is a 10-mile long, 34 feet high, earthen embankment located between Peoria Road and Happy Valley Road. It was constructed in 1954 and 1955 for flood control purposes. Storm water from the north is collected in an impoundment basin and transported northeasterly through the McMicken Dam Outlet Channel and then southerly through the McMicken Dam Outlet Wash (4 miles) to the Agua Fria River. There is also an emergency spillway associated with the dam. Extremely large storms can result in releases and downstream flooding.
Infrastructure required to implement discharge to waterways would include valves to direct flow to the discharge pipeline, a pipeline to the selected waterway, and outlet structure that would dissipate the flow energy in order to eliminate erosion and/or scouring. Discharge of reclaimed water to waterways is regulated under AZPDES. If excavation within these waterways is a component of the project, then Section 404 of the Clean Water Act also applies.
7-14
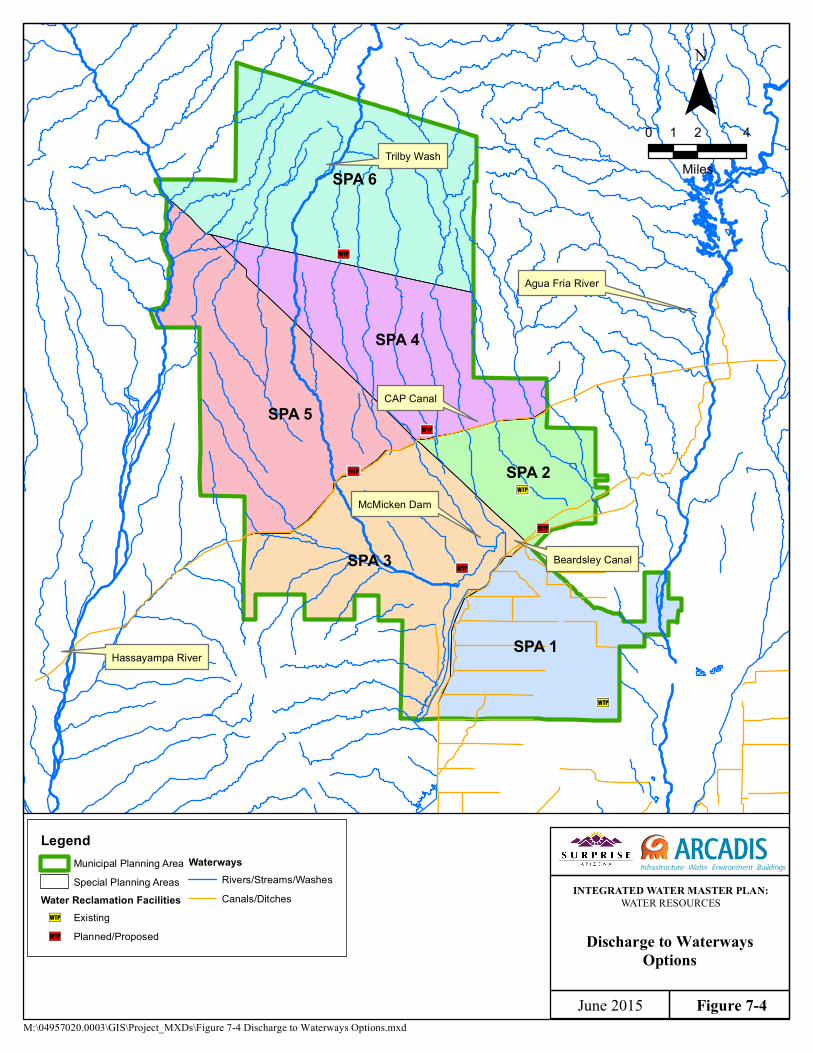
3Q
3Q
3Q
3Q
3Q
3Q
3Q
SPA 6
SPA 5
SPA 3
SPA 4
SPA 1
SPA 2
Figure 7-4
Discharge to WaterwaysOptions
M:\04957020.0003\GIS\Project_MXDs\Figure 7-4 Discharge to Waterways Options.mxdJune 2015
¯0 2 41
Miles
INTEGRATED WATER MASTER PLAN:WATER RESOURCES
Trilby Wash
Agua Fria River
Hassayampa River
McMicken Dam
CAP Canal
Beardsley Canal
LegendMunicipal Planning AreaSpecial Planning Areas
Water Reclamation Facilities3Q Existing3Q Planned/Proposed
WaterwaysRivers/Streams/WashesCanals/Ditches
Section 7 Reclaimed Water Management
7.2.4. Water Exchange Options (2008) Water exchanges refer to the possibility of trading reclaimed water for potable water or for rights to potable water. Exchanges with the CAGRD, local irrigation districts, or neighboring communities may be possible.
Potential Exchanges with CAGRD
There are two possible exchange opportunities with the CAGRD. First, the City could recharge reclaimed water wherever it can in its planning area (subject to the infrastructure and regulatory requirements discussed for City recharge facilities) and give the storage credits to the CAGRD. In return, the City could receive raw surface water for treatment at a surface water treatment plant. Second, the City could enter into a cost-sharing and exchange agreement as previously discussed in Section 7.2.1.2. In either option, the CAGRD would likely need an exchange ratio greater than one-for-one before agreeing to the exchange. The first option would be attractive to the City if it had, or was planning to build, a surface water treatment plant. The second option would be attractive if the City just needed recharge capacity to manage reclaimed water.
Potential Exchanges with Irrigation Districts
In this reuse opportunity, the City would deliver reclaimed water to a local irrigation district and/or farmer to replace pumped groundwater. In exchange, the City would receive long term storage credits through a groundwater savings facility. The ADWR rules for its Underground Water Storage, Savings and Replenishment Program allows for exchanges whereby a facility can use surface water or other renewable water supply “on a gallon-for-gallon substitute basis” in-lieu of the groundwater that it otherwise would have pumped. This program has typically been used to replace groundwater used for irrigated agriculture with CAP surface water, but it could also apply to reclaimed water.
In order to obtain a groundwater savings facility permit, the applicant must demonstrate 1) that the groundwater to be replaced would have otherwise been pumped, 2) that no other source of in-lieu water is reasonably available, and 3) that the recipient of the in-lieu water could not reasonably be expected to use the in-lieu water without the added benefits of establishing the exchange. The applicant obtains long term storage credits for the in-lieu water provided. The amount of storage credits that will be assigned to the applicant, or storer, may vary, but the amount is generally 95 percent of the water exchanged minus evaporation losses. The storage credits can generally be recovered anywhere within the AMA that the exchange was achieved. Because groundwater pumping is being replaced, this type of exchange achieves the same benefits to the aquifer as a recharge operation would.
The City is currently providing reclaimed water from its SPA 1 WRF to a farmer outside of the City’s planning area. A groundwater savings facility permit is not currently in
7-16
Section 7
Reclaimed Water Management place, but the City is working to obtain this permit soon. The City is not aware of any local irrigation districts that could participate in such an exchange on a large scale at this time. Further, the Maricopa Water District currently supplies surface water from the Lake Pleasant Reservoir to local farmers.
Because no local irrigation districts have been identified that could participate in a water exchange with the City, this option was dropped from further consideration for the water reuse evaluations.
Potential Exchanges with Neighboring Communities
Similar to exchanges with irrigation districts, the City could deliver reclaimed water to a neighboring community to replace groundwater pumped for a non-potable use. In exchange, the City would receive credits through a groundwater savings facility, or potentially receive raw surface water at a water treatment plant. Because the reclaimed water would most likely not be used for agricultural irrigation, this type of exchange would likely require a greater than one-for-one exchange. The City of El Mirage may be interested in receiving reclaimed water, but it has not expressed interest in the water exchange component. The City is not aware of other neighboring communities that are currently pumping groundwater for non-potable uses or are looking for large volumes of reclaimed water.
Because no neighboring community has been identified that could participate in a water exchange with the City, this option was dropped from further consideration for the water reuse evaluations.
7.3. Evaluation of Reclaimed Water Program Alternatives (2008) In the 2008 Integrated Water Master Plan project, reclaimed water management alternatives were developed with the assistance of the City’s Steering Committee and Technical Committee. The alternatives generally considered both reclaimed water recharge (local and regional) and direct re-use (serving only the largest customers and serving all customers), multiple WRF scenarios (6 WRFs with one in each SPA, 4 WRFs, and 3 WRFs), and interconnected systems (by SPA or City-wide).
The following specific alternatives were identified and evaluated:
Four alternatives considering recharge at City-owned facilities. The differences between the sub-alternatives included the technology used for recharge (i.e., spreading basins vs. injection technologies) and the location of the recharge facilities.
Two alternatives considering recharge at regional recharge facilities, the Hieroglyphic Mountains Recharge Facility and SROG’s Agua Fria Linear Recharge Project.
City of Surprise, Arizona Integrated Water Master Plan: Water Resources Update 04957020.0003
7-17
Section 7 Reclaimed Water Management
Eight alternatives considering direct reuse via dual distribution systems. The
differences between sub-alternatives included serving only the largest users, serving all potential customers, isolating reuse systems within each SPA, and establishing reuse systems that are inter-connected throughout the City’s planning area.
Each alternative was developed to allow sizing and configuration of the required reclaimed water infrastructure (production, storage, recharge, pumping and conveyance) so that they could be compared on the basis of 20-year present worth costs. In addition, a matrix comparison of the alternatives was used to identify the preferred reclaimed water management strategy. The matrix evaluation was based on decision criteria, including costs, which were considered significant in the consideration and selection of a preferred reclaimed water management alternative. The matrix evaluation was accomplished by a systematic weighting and scoring of the decision criteria for each alternative during a workshop with the City Steering and Technical Committees.
On the above basis, the recommended reclaimed water management strategy was to install a dual distribution system to serve only the largest reuse customers (landscape irrigation of HOA common areas, schools, parks, etc.), to use surface basin recharge where possible to balance reclaimed water demand and supply, and to recharge reclaimed water that is not directly reused.
7.4. Current City Reclaimed Water Direction A number of changes have occurred since completion of the Integrated Water Master Plan, including the national economic downturn which has led to significant reductions in local development and growth, and City budget limitations. In spite of the changes, the City has continued to expand the reclaimed water program.
The City’s current direction and policy (as specified in the Reclaimed Water Policy adopted by the City Council on May 19, 2015) is to recharge all reclaimed water and to recover the water within the area of hydrologic impact of the recharge facilities, and to direct serve large reuse customers close to the recharge conveyance pipelines that wish to be connected. The City will reconsider reclaimed water management alternatives in the future based on additional groundwater and geophysical surveys to determine feasible recharge locations, groundwater quality investigations to determine future groundwater treatment requirements, and investigation of the potential to exchange reclaimed water for other supply sources.
7-18
8. Evaluation of Water Resource Scenarios
This section summarizes how an updated Water Resource Model tool was used to evaluate water demand and supply scenarios. Included are an overview of the modeling methodology; a summary of the evaluations that were conducted in 2008, and resulting conclusions and guidance that were used in this current update; a discussion of the water resource scenarios that were modeled in the current update; and the resulting recommendation for additional future water supply volumes that should be planned for acquisition.
8.1. Water Resource Modeling Methodology A Water Resource Model was developed in 2008 to dynamically compare water demand projections developed in the Demand Module to existing and potentially available water supplies. The output of the Water Resource Model allows the user to determine whether the available supplies are sufficient to meet anticipated demands. Alternatively, the model can predict when existing water supplies will be fully used, when a gap (deficit) between supply and demand occurs, and the magnitude of the gap.
The Water Resource Model was compiled and run using commercially-available PowerSim software. The software read from the Demand Module’s database file and imported indoor, outdoor, and landscape demands for each water service provider and SPA within the Surprise MPA. In the 2008 Integrated Water Master Plan, the Water Resource Model used 2008, 2020, 2030, and build-out as the planning periods and interpolated for interim years. The current Water Resources component update uses 2013, 2020, 2030, and build-out as the planning periods. The planning periods can be adjusted by the user if the City’s development horizon changes.
The water supplies included in the Water Resource Model are based on assured water supply designations, hydrogeologic models (physical availability of groundwater), surface water rights, CAP subcontracts, and reclaimed water production projections. Additional water supplies can be added to the Water Resource Model based on anticipated water supply development projects or other new water supply projections.
The Water Resource Model output includes a series of graphs showing the aggregated water demand in each category (indoor, outdoor, and landscape) for each SPA, for each water service provider, and for each provider within each SPA. The user can change demands and supplies in the Water Resource Model interface to evaluate multiple water resource scenarios. A detailed description of the Water Resource Model is provided in Appendix E. City of Surprise, Arizona Integrated Water Master Plan: Water Resources Update 04957020.0003
8-1
Section 8 Evaluation of Water Resource Scenarios
The current Water Resources component update uses a similar methodology described above and in Appendix E. The platform used, however, is ArcGIS and Excel-based spreadsheets.
8.2. Guidance from 2008 Evaluations In 2008, the Water Resource Model was demonstrated in workshops with the City Steering and Technical Committees. The workshops provided an interactive environment for testing various demand and supply scenarios. The workshop participants used the model to investigate the effects of changing variables in the Water Resource Model and Demand Module on the water demand and supply balance.
A key parameter used in the Water Resource Model is the build-out date. The City uses information from MAG to project population over time. Although MAG projections did not go beyond 2030, the City provided guidance that an estimate of 2060 for a build-out date (i.e., 100 percent land coverage) is a reasonable assumption for planning purposes. If this development timeline changes, so will the estimated occurrence of various conditions (e.g., when demand exceeds supply) presented in this section.
8.2.1. Guidance from Evaluation of a Baseline Scenario Initially, a baseline development scenario was evaluated which assumed a target build-out population for the entire MPA of 1 million. In addition, potable and reclaimed water service would be provided to all private water companies except for EPCOR and the City of El Mirage. Although the private water company service areas would be served, their water allocations were not included in the total supply. The baseline scenario evaluation revealed the following important conclusions:
The total City water service area water demand would exceed available supply as early as 2025.
Reclaimed water is an important component of the water resources portfolio, potentially accounting for approximately 80 percent of the total supply at build-out.
8.2.2. Guidance from Evaluation of Alternate Scenarios In order to achieve a balance between supply and demand, either the demand must decrease or the supply must increase. Because acquisition of additional water supplies would be difficult, lengthy and expensive; alternate scenarios were evaluated which focused on methods to reduce demands, including implementing water conservation, not serving individual water companies, not serving SPA 6 potable water, reducing dwelling unit densities (effectively reducing the build-out population), and changing landscaping plans to reduce the amount of water used for irrigation.
The evaluations assumed that even if not serving drinking water to an area, the City would still be the wastewater service provider and would therefore receive the water
8-2
Section 8
Evaluation of Water Resource Scenarios resource benefit of the reclaimed water in the area. This is a reasonable assumption as the City is the designated wastewater service provider in its MPA in the Maricopa Association of Governments 208 Water Quality Management Plan. The evaluation of alternate scenarios provided the following conclusions:
Although conservation reduces overall demand, it should not be relied on as an additional water supply. However, implementing reasonable conservation methods should be included as part of the overall water management strategy.
Whether or not to serve private water companies has a minimal effect on the system-wide water demands. As such, the City can continue with its current strategy of acquiring private water companies to the extent practical as development occurs over time. When acquiring service areas, it will be beneficial to also acquire any water resources that are allocated to the private water company service areas.
Whether or not to serve SPA 6 has a dramatic effect on the system-wide water demands. When including SPA 6, water resources rapidly become stressed.
Planning for lower build-out populations (managing dwelling unit densities to lower planned population) also has a dramatic effect on system-wide water demands.
8.2.3. Summary of Guidance from 2008 Evaluations The most important guidance developed by the 2008 City Steering and Technical Committees was the desire to become sustainable, i.e., to manage development that will be supported by the water supplies that are available (including future reclaimed water). According to the evaluation of alternate scenarios, the most promising methods for achieving a balance in supply and demand were to not provide potable water service to SPA 6, and to manage future development densities.
Upon further review of alternatives, the City committees selected the alternative of managing future development densities and planning for a target build-out population between 500,000 and 700,000 (compared to the baseline target of 1 million). The committees also agreed that the City should provide water service to SPA 6 to ensure development of uniform water resources infrastructure and to provide a uniform level of water service for all residents within the City’s MPA. The Water Resource Model evaluations also pointed to the following conclusions that must be factored into the future water resources strategy:
Although it was considered within the margin of error of the planning assumptions, the evaluations predicted that demands would exceed supply some time before build-out. Any additional water supply that can be added to the City’s portfolio (e.g., CAP incentive recharge water, additional physically available groundwater, long term storage credits, etc.) would dramatically improve the demand/supply balance.
In order to achieve the target population between 500,000 to 700,000, the City must be prepared to reduce the allowable development densities. The evaluations were
City of Surprise, Arizona Integrated Water Master Plan: Water Resources Update 04957020.0003
8-3
Section 8 Evaluation of Water Resource Scenarios
based on managing the undeveloped Rural Residential average densities to between 0.5 and 1.0 du/acre.
Future landscaping guidelines must be implemented and enforced. The City cannot continue to develop using high water using landscape that is currently prevalent in SPA 1. At a minimum, the City should be prepared to implement the Scenic Integrity Guidelines to control future large landscape irrigation demands.
8.3. Updated Water Demands and Supplies Existing and potential future water supplies were described in Sections 3 and 6. Based on the descriptions, the additional water supplies shown in Table 8-1 are considered potentially available to the City and have been incorporated into the Water Resource Model. Chapter 6 discussed other potentially available supplies such as unallocated CAP water, tribal lease water, development of brackish groundwater and/or ocean desalination, and groundwater importation. However, because obtaining these supplies will be challenging, lengthy, and expensive, if it can be done at all, these additional supplies were not included in the Water Resource Model. As described in Appendix E, the potential future water supplies can be turned on or off in the Water Resource Model.
Table 8-1. Existing and Potential Future Water Supplies
Supply Status Annual Supply (AFY) Groundwater – Physically Available Existing1 16,718 Existing Long-Term Storage Credits Existing 33 CAP Allocation Existing2 10,249
Reclaimed Water Existing3 5,403 Additional CAP Supplies from Other Providers
Potential Future4 3,932
Additional Reclaimed Water Potential Future5 --5 Groundwater From Other Providers Potential Future6 2,106 Maricopa Water District (MWD) Surface Water
Unknown7 --7
Notes: (1) Based on current determination as provided by ADWR. This is a conservative number because the upper limit of
actual groundwater availability within the service area is unknown. ADWR does not “assign” future groundwater beyond the demand projections within the term of the Assured Water Supply designation (currently through 2020). This groundwater supply will still require replenishment by the CAGRD, so for water accounting purposes, the groundwater can be physically used by the City, but the City must pay for replenishing what it uses.
(2) This supply can only be “added” to the portfolio if the water becomes physically delivered within the City service area, within the capture area of City wells. It is assumed that the City will build infrastructure to allow addition of this supply to the portfolio.
(3) Based on current determination as provided by ADWR in the Assured Water Supply Designation. (4) Existing CAP allocation for Brooke/Circle City Water Companies. (5) Additional reclaimed water depends on demand projections. (6) Physically available groundwater for developments primarily within Beardsley Water Company service area. This
groundwater supply would require replenishment by the CAGRD, so for water accounting purposes, the groundwater can be physically used by the City but the City must pay for replenishing what it uses.
(7) The City has begun accounting for some deliveries within its service area as MWD surface water, but the amount is small (de minimus) and the future of deliveries is currently uncertain.
8-4
Section 8
Evaluation of Water Resource Scenarios The updated existing and potential future water supplies in Table 8-1 include the existing water supply portfolio identified by the City’s September 2010 DAWS, supplemented with other existing supplies that can be added to the DAWS provided that certain infrastructure and institutional actions are taken (refer to footnotes on Table 8-1).
8.4. Modeling of Updated Water Resource Scenarios The updated modeling of water resource scenarios includes input of water resource demand projections described in Section 5.8 and water supplies described in Section 8.3 into the updated Water Resource Model. The updated modeling also considers the guidance developed by the 2008 water resource scenario evaluations, and current information and guidance provided by the City as follows (in addition to updated assumptions outlined in Section 5.8):
The City will acquire all private water companies (supplies and demands) in its MPA except the City of El Mirage and EPCOR. The discussion of updated water resource scenarios below includes impacts if the City should decide to acquire the El Mirage and EPCOR service areas.
The 2008 Master Plan also assumed that the City would rely on "physically available" groundwater as part of its normal water supply due primarily to the terms of its DAWS at the time. Due to changes in ADWR policies regarding physically available groundwater, the City now does not wish to rely on groundwater as part of its normal water supply for long range planning purposes. The discussion of updated water resource scenarios below reflect the new City objective of relying only on renewable water supplies.
The updated demand/supply balance (based on the City’s desire to rely only on renewable water supplies, and to not acquire the service areas of EPCOR and El Mirage) is shown on Figure 8-1. The figure shows that the projected deficit in supply will first occur around approximately 2025 and, at City build-out, the supply deficit will be approximately 45,000 AFY.
8.4.1. Impacts of Wastewater Flow to Water Demand Ratio As noted in the 2008 Integrated Water Master Plan, wastewater flow data was insufficient to allow reliable calibration of wastewater flow projections. Although insufficient to allow calibration, additional wastewater flow and reclaimed water production information was made available in the current Water Resources component update. These new data imply the water resources demand projections may be overestimating reclaimed water availability, particularly in the short-term.
City of Surprise, Arizona Integrated Water Master Plan: Water Resources Update 04957020.0003
8-5
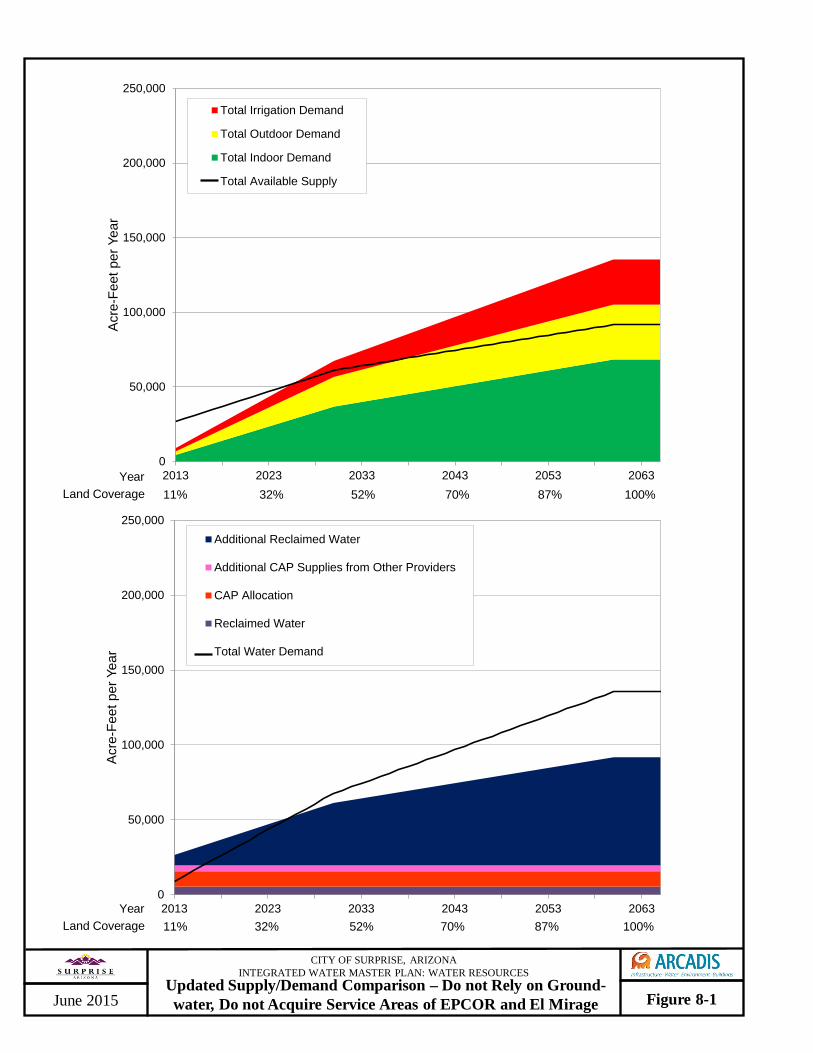
0
50,000
100,000
150,000
200,000
250,000
2013 2023 2033 2043 2053 2063
Acr
e-Fe
et p
er Y
ear
Total Irrigation Demand
Total Outdoor Demand
Total Indoor Demand
Total Available Supply
0
50,000
100,000
150,000
200,000
250,000
2013 2023 2033 2043 2053 2063
Acr
e-Fe
et p
er Y
ear
Additional Reclaimed Water
Additional CAP Supplies from Other Providers
CAP Allocation
Reclaimed Water
Total Water Demand
11% 32% 52% 70% 87% 100% Year
Land Coverage
11% 32% 52% 70% 87% 100% Year
Land Coverage
Figure 8-1 June 2015 Updated Supply/Demand Comparison – Do not Rely on Ground-water, Do not Acquire Service Areas of EPCOR and El Mirage
CITY OF SURPRISE, ARIZONA INTEGRATED WATER MASTER PLAN: WATER RESOURCES

Section 8
Evaluation of Water Resource Scenarios The projections were developed based on a wastewater flow to water demand ratio of 0.65, i.e., that 65 percent of the non-irrigation demands (indoor and outdoor demands of residential, institutional and commercial customers) is considered indoor demands and all of this demand is returned to the sewers. The 0.65 factor was assumed based on water consumption information cited in the water industry literature. Existing developments within the City do not appear to follow the national trends and the outdoor water use is probably higher due to the arid climate.
Thus, the supply/demand comparisons were evaluated by assuming a lower wastewater flow to water demand factor of 0.50 currently and increasing gradually to 0.65 at build-out. Future development, that must follow the City’s Scenic Integrity Guidelines, will probably have increasingly lower outdoor water demands. When considering overall supplies and demands, there is apparently very little impact of varying the wastewater flow to water demand factor, particularly at City build-out.
8.4.2. Other Potential Impacts to Projected Demand/Supply Balances In addition to impacts of potential changes to wastewater generation discussed above, the projected demand/supply balances are highly dependent on a number of other assumptions that can change over time. The projections should be viewed as estimates based on the best available information available at this time. For example, there are likely changes in plumbing codes forthcoming from the USEPA that would set new, more stringent limits on water fixtures in bathrooms and kitchens. This may cause manufacturers to redesign these fixtures to achieve the new targets, and older fixtures may become obsolete. The overall effect could be further, perhaps significant reductions in indoor water use. The City should continue to evaluate and update the supply/demand balance projections to account for real and predicted trends in water usage patterns.
8.4.3. Impacts of Acquiring El Mirage and EPCOR Service Areas If the City were to acquire the portion of its planning area currently served by El Mirage and EPCOR, it would have to provide potable water service to these areas. Figure 8-2 illustrates the projected demand/supply balance under this scenario, resulting in the following conclusions:
As shown on Figure 8-2, these two service areas would impose an additional water demand of approximately 18,000 AFY currently and 33,900 AFY at buildout. The projected deficit in supply would occur almost immediately and at City buildout would total approximately 80,000 AFY.
City of Surprise, Arizona Integrated Water Master Plan: Water Resources Update 04957020.0003
8-7
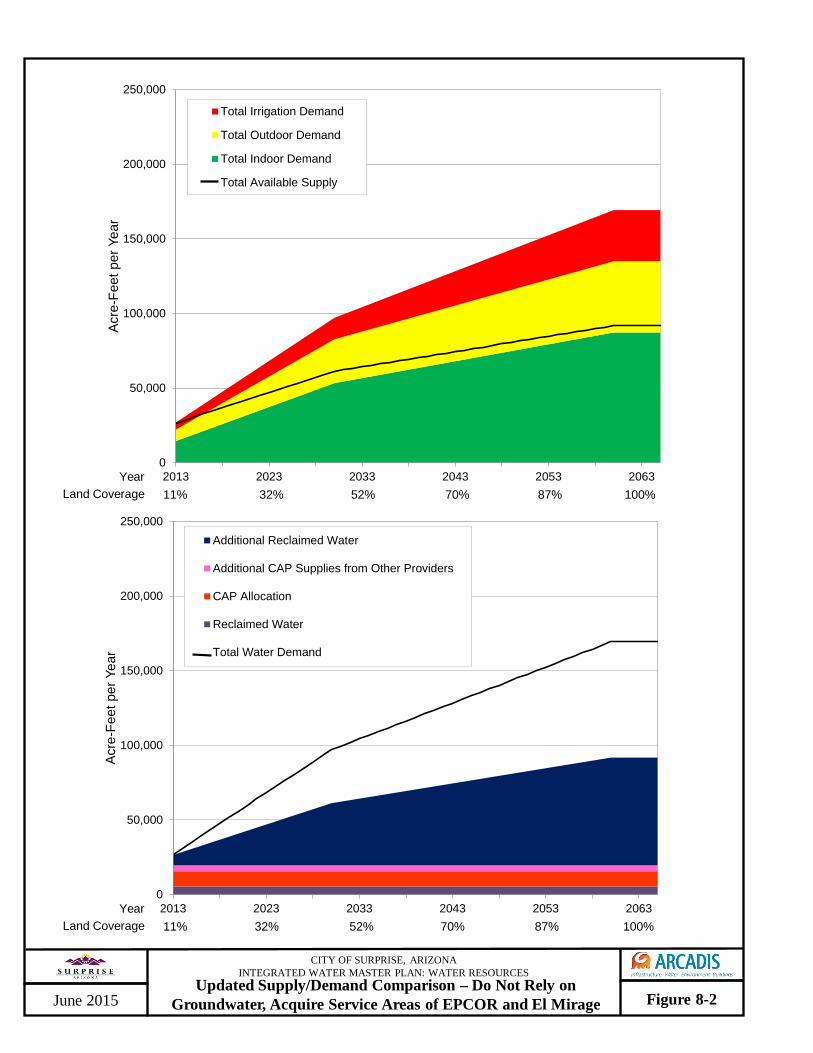
0
50,000
100,000
150,000
200,000
250,000
2013 2023 2033 2043 2053 2063
Acr
e-Fe
et p
er Y
ear
Total Irrigation Demand
Total Outdoor Demand
Total Indoor Demand
Total Available Supply
0
50,000
100,000
150,000
200,000
250,000
2013 2023 2033 2043 2053 2063
Acr
e-Fe
et p
er Y
ear
Additional Reclaimed Water
Additional CAP Supplies from Other Providers
CAP Allocation
Reclaimed Water
Total Water Demand
11% 32% 52% 70% 87% 100% Year
Land Coverage
11% 32% 52% 70% 87% 100% Year
Land Coverage
Figure 8-2 June 2015
CITY OF SURPRISE, ARIZONA INTEGRATED WATER MASTER PLAN: WATER RESOURCES
Updated Supply/Demand Comparison – Do Not Rely on Groundwater, Acquire Service Areas of EPCOR and El Mirage
Section 8
Evaluation of Water Resource Scenarios Currently these areas are served water from the El Mirage and EPCOR water supply portfolios. Not only would the City have to purchase the water infrastructure at fair market value, but it is questionable if either entity would be willing to relinquish portions of its water rights to serve these areas. If the City cannot acquire more water rights through the acquisitions, it would have to identify substantial additional water supplies to serve these areas.
8.4.4. Recommendation for Acquisition of Additional Water Supplies Based on the updated evaluation of water resource scenarios, the City should target additional new water supplies of at least 45,000 AFY, assuming that the El Mirage and EPCOR service areas are not acquired.
City of Surprise, Arizona Integrated Water Master Plan: Water Resources Update 04957020.0003
8-9

THIS PAGE INTENTIONALLY LEFT BLANK
9. Water Resource Management and Assured Water Supply Strategy
This section provides the recommended water resource management strategy resulting from the evaluations and scenario comparisons completed and summarized in Sections 1 through 8. This section also provides the recommended approach to administratively achieving and maintaining assured water supply status with the ADWR.
9.1. Basis for Water Resources Master Plan The recommended water resource management and assured water supply strategies are developed based on certain assumptions, significant findings related to potential future water supplies, and guidance provided by the City’s Technical and Steering Committees during completion of the 2008 Integrated Water Master Plan Project; and, the City Public Works and Water Resources Management staff, and City Council’s Committee on Water Resource Planning during the Water Resources component update.
Major Assumptions
The recommended water resource management and assured water supply strategies are based on the following major assumptions:
Build-out will comprise 100 percent coverage of the land and uses described in the City’s General Plan 2035; i.e., any additional development (redevelopment, development intensification, etc.) beyond the current General Plan 2035 is not considered.
Plans intend to provide guidance in full compliance with the regulatory framework. Recommendations are economically efficient and realistic.
Recommendations are practical and implementable. Strategies represent a bridge to the eventual acquisition of sustainable water supplies
and achieving a true sustainable balance between demands and supplies.
Potential Future Water Supplies
The significant findings from the review of potential future water supplies follow:
Long-term renewable water supplies currently available to the region (CAP, SRP, MWD surface water, etc.) have essentially been fully allocated. There is one more opportunity to secure a remaining portion of the NIA CAP water in the next few years. While the City was not successful in its last attempt, staff should begin
City of Surprise, Arizona Integrated Water Master Plan: Water Resources Update 04957020.0003
9-1
Section 9 Water Resource Management and Assured Water Supply Strategy
meeting with ADWR to determine the most optimal strategy for applying for a portion of this reallocation. While this water is less reliable than CAP M&I water, it can still be used through storage and recovery and is likely the least expensive known available long-term renewable supply remaining. There are no more large blocks of readily available renewable supplies that the City can pursue to fill significant shortfalls in future water supply, except for the CAP subcontract that could be acquired with the Circle City Water Company.
The next large blocks of water supply for the region are believed to be brackish groundwater from the southwest valley area and/or desalinated seawater, perhaps from as far away as Mexico. Both supplies will require large-scale and potentially complex water exchange agreements to allow cities like Surprise to gain access to the new supplies.
The permitting and institutional process to develop additional water supplies will be too challenging, lengthy, and expensive for a single entity (like Surprise) to achieve on its own. Likely, a regional water agency (like CAWCD, Bureau of Reclamation, etc.) will play key roles in developing new supplies with the coordination of, and for the benefit of, all communities in the region.
Reclaimed Water Guidance
The City’s current direction and policy is to recharge all reclaimed water and to recover the water within the area of hydrologic impact of the recharge facilities, and to direct serve large reuse customers close to the recharge conveyance pipelines that wish to be connected. The City will reconsider reclaimed water management alternatives in the future based on additional investigations to determine feasible recharge locations, future groundwater treatment requirements, and the potential to exchange reclaimed water for other supply sources.
Planning For Sustainability
With respect to future water resources, the primary guidance is that the City must plan to manage existing available water supplies (groundwater, CAP surface water, and reclaimed water) to balance demands with supplies at build-out. Groundwater that is actually used should be recharged CAP water, reclaimed water or other renewable water that is recovered within the recharge area of hydrologic impact to reduce or eliminate the depletion of the physically available groundwater within the City’s service area.
The City will strive to achieve this balance by planning for a target build-out population between 500,000 and 700,000 and implementing landscape guidelines to significantly reduce the landscape irrigation fraction of overall water demands. To achieve this sustainable balance of supplies and demands, the City should adopt and incorporate the following into its future land use planning:
9-2
Section 9
Water Resource Management and Assured Water Supply Strategy Managing future development densities – The target population range was achieved
by modeling residential densities in currently undeveloped areas to the middle of the density range identified in the General Plan 2035 for all residential categories except for Rural Residential ,which was modeled between 0.5 and 1.0 du/acre.
Implementing the new Scenic Integrity Guidelines in all new developments.
9.2. Recommended Water Resource Management Strategy In presenting the water resource management strategy, the following important definitions are noted:
“Groundwater,” as a physical resource, will be the primary basis of the City’s future water supply for many years to come. To conform to the City’s desire for sustainability, for the purposes of this discussion, all groundwater pumped from wells is considered recharged CAP, reclaimed water, and other renewable water that is recovered within the recharge area of hydrologic impact. Addressing the legal distinctions for this water is addressed under Section 9.3.
“Surface water” is constituted by water from the CAP, whether from the City’s or other subcontracts, and water from the Agua Fria River as managed by the MWD.
“Sustainable water” is water that is considered renewable on an annual basis which includes reclaimed, CAP surface water, MWD water, and desalinated seawater.
The recommended water resource management plan is organized chronologically into three time horizons: near-term recommendations should be addressed immediately, mid-term recommendations can be addressed over the next few years, and long-term recommendations are those that would achieve eventual water supply sustainability. The three time periods address the following water resources:
Near-Term – effectively manage supplies that are currently available:
Groundwater CAP water MWD water Reclaimed water
Mid-Term – potentially acquire other supplies that may be currently available:
Private water companies CAP water CAP NIA Water (Round 2)
Long-Term – position the City for its share of next available renewable water supplies:
Additional resources
City of Surprise, Arizona Integrated Water Master Plan: Water Resources Update 04957020.0003
9-3
Section 9 Water Resource Management and Assured Water Supply Strategy
9.2.1. Near-Term Water Resource Management: Groundwater The water resource management recommendations related to groundwater supplies that should be addressed as soon as possible are listed below along with appropriate justification.
Establish Area of Hydrologic Impact
Evaluate and, if financially feasible, implement institutional approvals and infrastructure necessary that will enable recovering water from underground storage within the area of hydrologic impact, as determined by ADWR, preferably within the City’s service area. This will “add” water to the aquifer and reduce or eliminate the rate of depletion of physically available supplies. This may also help to reduce the amount of dues calculated for payment to the CAGRD. The near-term actions for this recommendation include the following:
Meet with the ADWR and obtain a determination of where storage facilities and recovery wells should be located to be deemed within the area of hydrologic impact of each other.
Locate new wells, where economically viable, within the area of hydrologic impact of existing and new surface water and reclaimed water recharge facilities.
Conduct discussions with CAWCD to allow either 1) recharge of all City CAP allocations at the Hieroglyphic Mountains regional recharge facility and the Agua Fria Recharge Project, and/or 2) purchase of capacity in these facilities. The Hieroglyphics facility is within the City’s planning area and would make it more feasible to locate new recovery wells within the area of hydrologic impact. The Agua Fria facility is reasonably close to the City’s’ service area but would require not only new recovery wells built within the area of hydrologic impact, but would also require longer conveyance piping to get the recovered water to the City’s service area. The Aqua Fria facility would also require negotiations with Peoria to allow the City to locate new recovery wells within the area of hydrologic impact. Alternatively, the City could negotiate a connection to the Peoria’s water distribution system and for Peoria to recover water on behalf of the City.
If negotiations are successful for the Hieroglyphics facility, begin locating new wells within the area of hydrologic impact, as defined by ADWR, and construct necessary piping to connect the wells to the City water distribution system.
If negotiations are successful for the Agua Fria Recharge Project, conduct discussions with Peoria for approval to recover the City’s CAP allocation within the area of hydrologic impact and to convey it to the City’s water distribution system.
Conduct Groundwater Recharge and Quality Studies
The City should continue an aggressive campaign of groundwater development targeting areas where the depth to water (lift) and the quality of the groundwater are optimized to
9-4
Section 9
Water Resource Management and Assured Water Supply Strategy the extent practical. The City should complete a comprehensive hydrogeologic study of its entire planning area and consider having a comprehensive groundwater model constructed from the results. The purpose of these studies would be to:
Assist in well siting by identifying definitive areas of suitable water quality and predicting water production capacity.
Identify locations and project the amounts of natural groundwater recharge.
Identify artificial recharge potential and locations for recharge facilities. Define groundwater quality to determine the types and extent of groundwater treatment needed for future potable supplies.
Identify saturated thickness and adjacent or near-by wells owned by other parties including domestic wells, MWD, and private water companies.
Implement Groundwater Management
The City should continue recharging all its CAP water that it does not use directly and developing the recharge element of the reclaimed water program. However, recharge facilities should be developed within the City’s well field so that stored water “adds” to, or diminishes the reduction of, the City’s physically available groundwater supplies. Future uses of groundwater will have to be offset nearly 100 percent (there are some exceptions as discussed in Section 9.3) either by storing renewable water supplies underground in advance of withdrawals (long-term storage), in the same year that withdrawals are occurring (annual storage and recovery), or after withdrawals have occurred by paying the CAGRD to perform this service.
The City should apply pressure to ADWR and the CAGRD to establish a requirement for replenishment of its groundwater, whenever needed, to occur within its area of hydrologic impact.
Compare Costs of Groundwater Treatment vs. Surface Water Treatment
The City should update the drinking water evaluation in its long range plans for potable water supply and distribution to compare the costs for groundwater production, treatment, disinfection, and distribution against the cost of constructing and operating a surface water treatment plant for direct use of its CAP supply.
9.2.2. Near-Term Water Resources Management: Surface Water The water resource management recommendations related to surface water supplies that should be addressed as soon as possible are listed below along with appropriate justification.
City of Surprise, Arizona Integrated Water Master Plan: Water Resources Update 04957020.0003
9-5
Section 9 Water Resource Management and Assured Water Supply Strategy
Recharge all CAP Water Allocations
The City reduced the amount of its CAP water allocation being stored to approximately 50 percent of the allocation in 2011. The City should fund storing 100 percent of the CAP allocations since it is the least expensive source of long-term storage credits other than the City’s own reclaimed wastewater.
Pursue a Potential Drought Exemption from the ADWR
Given the current conditions on the Colorado River, the City should begin to inquire with the ADWR regarding a drought exemption. Even if the City’s allocation is not reduced, a drought exemption would allow the City to use some of its pumped groundwater as groundwater exempt from CAGRD replenishment obligations, preserving that much additional CAP and effluent as stored water for future uses.
Compare Costs of City-owned vs. Regional Recharge Facilities
The City should update the comparison of long-term recharge of CAP water at the CAWCD regional facilities versus prospective City-owned facilities that is included in the drinking water evaluations of the long range plans for potable water supply and distribution.
Encourage Continued Urban Irrigation with MWD Water
The City should encourage the delivery of MWD surface water to MWD member lands for exterior water use (urban irrigation), thereby reducing the demand on the City to provide potable and/or reclaimed water to these lands. This also includes investigating the feasibility of contracting with the MWD for taking delivery of MWD water and distributing the water to member lands on their behalf. The MWD may be able to provide its lands with an average of one acre-foot of surface water per year. There are approximately 1,440 acres of MWD lands within the City’s water service area. The benefits are that the City can save on infrastructure needs, pumping costs, and groundwater offsets (assured water supply management) for these lands. If the lands require additional water above and beyond the one acre-foot of surface water, the MWD can also deliver groundwater from its groundwater wells, again, eliminating the need for the City to provide infrastructure or water for these lands’ exterior water uses.
9.2.3. Near-Term Water Resource Management: Reclaimed Water The water resource management recommendations related to reclaimed water supplies that should be addressed as soon as possible are listed below along with appropriate justification.
9-6
Section 9
Water Resource Management and Assured Water Supply Strategy Recharge all Excess Reclaimed Water
Expand the reclaimed water recharge program and continue recharging all reclaimed water that is not used directly.
Master Plan Reclaimed Water Recharge Conveyance Infrastructure
Reclaimed water has been identified as the primary future water supply for the City. To accommodate the current direction and policy regarding reclaimed water management, the City should update its long range plans for the reclaimed water infrastructure. The reclaimed water recharge conveyance pumping facilities and pipelines should be sized to convey all reclaimed water produced to updated recharge locations.
Identify Potential to Serve Additional Reuses
The City should investigate the potential to serve reuse customers along the recharge conveyance pipelines. Information from this investigation should be used to refine the master plan for reclaimed water recharge conveyance infrastructure.
Develop City-owned Recharge Capacity for Excess Reclaimed Water
The City should update the locations and facility sizing for recharge of all excess reclaimed water. This evaluation, which is included in the City’s long range plans for reclaimed water infrastructure, focused on spreading basin recharge where possible, followed by vadose zone wells, then by aquifer storage and recovery wells. Facilities should be located in areas where City wells can physically access the stored water so that the stored water is deemed by ADWR to be increasing, or reducing the depletion of, the City’s physically available groundwater.
Pursue GSF Permits for Reclaimed Water Deliveries to Farms
The City is currently delivering reclaimed water to a farm outside of the City’s municipal planning area. Although providing this water is reducing the amount of groundwater pumped by the farm, a GSF permit has not been obtained that would allow the City to accrue long term storage credits for the water delivered to the farm. The City should complete the process to obtain GSF permits as soon as possible.
9.2.4. Mid-Term Water Resource Management: Private Water Companies In addition to using its own allocation of CAP water, the City may have an opportunity to acquire additional CAP water from the private water companies located within its annexed and planning areas. While there are multiple ways to acquire this water, most will take some period of time and financing to accomplish. The mid-term strategies for private water companies are as follows:
City of Surprise, Arizona Integrated Water Master Plan: Water Resources Update 04957020.0003
9-7

Section 9 Water Resource Management and Assured Water Supply Strategy
Potentially Acquire Private Water Company Allocation The City should investigate the potential to acquire the CAP allocation currently assigned to Circle City Water Company, which has a CAP subcontract and does not appear to currently have plans to put this water to direct use in the immediate future. There are three alternatives for acquiring these allocations: Negotiate for a temporary assignment of this water to the City.
Negotiate for a permanent acquisition of CAP water without acquiring the water companies.
Negotiate for a permanent acquisition of CAP water as part of an acquisition of the water companies.
9.2.5. Mid-Term Water Resource Management: Water Importation The City should monitor proposals for water importation from the Colorado River and carefully assess the viability of each proposal with primary emphasis on obtaining clearance for wheeling through the CAP system. The specific actions should include:
Consider placing a refundable deposit to secure a share of the water into an escrow account that only disburses funds when all conditions and institutional and legal barriers (including liability for lawsuits from interests in the area of export) have been overcome by the offeror.
Carefully evaluate each proposal in terms of secondary costs, including turn outs from the CAP, conveyance pipelines, pumps, storage (above and underground), and potential treatment requirements.
Consider allying with other local water users to share the cost of potential water importation programs.
9.2.6. Mid-Term Water Resources Management: Poor Quality Groundwater The City should evaluate the feasibility of accessing poor quality groundwater, either physically via treatment and conveyance, or by exchange for other water supplies, within the Phoenix AMA waterlogged area through partnerships with other parties of interest (Goodyear, Buckeye, CAWCD, CAGRD). ADWR is currently evaluating the area for re-designation as a poor quality groundwater area and will quantify the amount of water in storage as part of the evaluation. City staff should monitor ADWR’s work to help determine if this option is feasible.
9.2.7. Long-Term Water Resource Management: Additional Resources A portion of the City’s existing water supply portfolio is mined groundwater that requires replenishment or storage of additional water in advance to avoid creating a need for replenishment. As such, the City should attempt to “fill out” its water portfolio with additional resources developed as part of a regional supply effort in order to achieve true water resources sustainability. This will eliminate groundwater “mining,” provide a water supply buffer in case water demands exceed projections, and provide additional
9-8
Section 9
Water Resource Management and Assured Water Supply Strategy water supplies that could allow the City to plan for enhancing development opportunities in the future.
The City should establish a high profile presence in discussions that could generate a regional water supply augmentation program. The City should actively participate in the regional discussions to:
Express expectations to participate in newly developed supplies
Secure a “place at the table” Be seen and be heard
Influence policies and decisions
9.3. Recommended Assured Water Supply Strategy The assured water supply strategy deals with the regulatory framework and reporting requirements associated with Arizona’s water laws. In order to be effective, the City’s assured water supply strategy:
Must be compatible with the water resource management strategy
Must provide the City the ability to grow Must pass the “common sense” test
Must be economically efficient Must be diligently monitored
The components of assured water supply for the City include groundwater, surface water, reclaimed water, and water conservation.
9.3.1. Assured Water Supply Requirements ADWR’s Assured Water Supply program has very specific legal requirements the City must demonstrate. These requirements are briefly outlined below:
Physical Availability for 100 Years: For groundwater, physical availability means that it must be hydrogeologically available (groundwater levels cannot exceed 1,000 feet below ground surface or bedrock, whichever is shallower), and the infrastructure must also be available to use the groundwater. For surface water, physical availability means that a water filtration plant or an annual storage and recovery program (water stored underground and recovered from recovery wells in the same year) must be in place. To reduce the rate of reduction of the physical availability of groundwater, underground storage and recovery must occur within the mutual area of hydrologic impact. Replenishment by the CAGRD should also occur within the City’s area of hydrologic impact.
City of Surprise, Arizona Integrated Water Master Plan: Water Resources Update 04957020.0003
9-9

Section 9 Water Resource Management and Assured Water Supply Strategy
Legal Availability: For groundwater delivery and uses, water must be withdrawn
pursuant to the City’s service area right. For surface water to be legally available, there must be an executed contract for CAP water between the City and the CAWCD or to a party that contracts with the City.. For reclaimed water, it must be produced at City-owned facilities or under a contract between the City and another reclaimed water producer for delivery to the City to be counted as legally available. For MWD surface water, there must be an executed contract between the MWD and the City for the delivery and use of MWD water for the eligible lands served by the City.
Continuous Availability: The water supply must be considered uninterruptible (e.g., long term contracts, hydrologic analyses showing long term annual yield for surface water rights).
Water Quality: The water supply must meet or be able to meet the requirements of the Safe Drinking Water Act with economically feasible treatment.
Water Use Consistent with the Goal of the AMA: The goal of the AMA is safe yield by 2025; therefore, no mined groundwater can be used in new Designations of Assured Water Supply – it must be replaced with renewable water supplies or replenished by the CAGRD, or the City must show it has 100 percent renewable water supplies.
Water Use Consistent with the Goal of the AMA Management Plan: The water conservation requirements of the Groundwater Code must be met.
Financial Capability: New drinking water infrastructure needed to meet water demands must be shown in the City’s Capital Improvement Plan and/or executed development and/or annexation agreements.
9.3.2. Assured Water Supply - Groundwater For the purposes of the assured water supply strategy, water pumped from wells is not always defined as groundwater. By permitting a well as a recovery well, the legal identify of the water pumped by the well can be changed to whatever type of water the City has previously stored underground (CAP or reclaimed water), or the City can simply choose to account for the water as groundwater. However, groundwater (as defined under the Groundwater Management Act and, therefore, the Assured Water Supply requirements) must be eliminated entirely from the City’s water portfolio or it will have to be replenished by the CAGRD. This means that all water recovered from wells by the City actually are double cost – not only must the City pay for the cost of producing the water from the well, the City must store water in advance and have the water counted as stored water recovery, or the City must pay fees for replenishment to the CAGRD. On the other hand, if the City can demonstrate that it has enough renewable water supplies to meet 100 percent of the projected demand in its application for modification of Designation of Assured Water Supply), the City could withdraw from membership in the CAGRD.
9-10
Section 9
Water Resource Management and Assured Water Supply Strategy There is an account created by the ADWR for the City known as a Groundwater Withdrawal Account. This account holds special credits available to the City. They are:
Incidental Replenishment Credits – ADWR credits the City with 4 percent of its previous annual demand to the City’s Groundwater Withdrawal Account based upon the assumption that this amount of water is returned to the aquifer as a result of the use of water within the City. This water can be “recovered” by the City to reduce the amount of water counted from wells as groundwater.
Extinguishment Credits – Within the ADWR’s administrative rules, there is a provision that grandfathered groundwater rights (Irrigation, Type 1 Non-Irrigation, and Type 2 Non-Irrigation) can be “extinguished,” which means the grandfathered right is permanently eliminated from the AMA. Under the rules, extinguishment credits (also called assured water supply credits) equal to 1 acre-foot per credit, are created. For Irrigation Grandfathered Groundwater Rights, and for Type 1 Non-Irrigation Grandfathered Groundwater Rights, the formula for calculating the number of credits under the administrative rules is 1.5 multiplied by the number of acres on the groundwater right certificate, multiplied by the number of years between 2025 and the year the right is extinguished. For Type 2 Water Rights, it is the number of acre feet per year on the certificate. These credits can also be used to reduce the amount of the City’s replenishment obligation.
Factors that have the potential to reduce the amount of groundwater physically available to the City include the City’s existing commitments to serve, other local water providers’ commitments and projections to serve, and other groundwater rights in the area (other existing groundwater rights and uses in or near the City).
The recommended assured water supply strategy for groundwater supplies is summarized as follows.
Maximize Physical Availability
The City should make all efforts to maximize its groundwater’s physical availability in its Application for Modification of Assured Water Supply. The City should complete the following activities:
Develop a well development plan (included as part of the Water Infrastructure component of the 2008 Integrated Water Master Plan), including an emphasis of locating wells near existing underground storage facilities so that stored water is adding to, or reducing the depletion of, the City’s physically available groundwater supplies.
Demonstrate financial capability to construct new needed infrastructure in the water capital improvement plan and executed annexation and development agreements.
Develop a pumping plan for existing and potential wells in the service and planning areas.
City of Surprise, Arizona Integrated Water Master Plan: Water Resources Update 04957020.0003
9-11
Section 9 Water Resource Management and Assured Water Supply Strategy
Develop underground storage within the area of hydrologic impact of the City’s
current and future wells so that stored water is adding to, or reducing the depletion of, the City’s physically available groundwater supplies.
Develop a strategy for requiring replenishment by the CAGRD to occur within the City’s area of hydrologic impact.
Acquire Credits for Extinguished Groundwater Rights
The City should require groundwater rights in and near the City’s water service and planning areas (within the City’s annexed, or to be annexed, areas) be extinguished and the credits conveyed, but not pledged, to the City’s account at ADWR. The credits, once acquired by the City, could be sold to generate revenues to be used to acquire long-term storage credits for the City.
Increase Portfolio of Long-Term Storage and Extinguishment Credits
The City should investigate the potential to increase its portfolio of long-term storage credits and extinguishment credits through purchase in the market, once 100 percent of the City’s currently available CAP and reclaimed wastewater are fully utilized and/or stored, for the purposes of increasing future assured water supplies and as “insurance” in the case of unplanned pumping of groundwater that would otherwise require CAGRD replenishment. This may also provide a small amount of leverage in the determination of “membership dues” required by the CAGRD.
Accounting for Pumped Groundwater
The City should continue to account for pumped groundwater as recovered credits (either CAP or reclaimed wastewater annual storage and recovery) to eliminate the potential for a CAGRD replenishment tax being imposed on groundwater use.
Explore Alternative Water Accounting
The City should investigate the potential to deliver water as “water delivered to other rights” to avoid impacts to the City’s designation of assured water supply, and to avoid the requirement to use the City’s stored water credits to offset the potential for replenishment obligations attributed to the City’s use of groundwater under its service area right.
Continue to Explore Opportunities for Water Exchanges and Purchases
Other entities may have physical water delivery constraints, long-term storage credits, Type 1 irrigation rights (homeowner associations, schools, etc.), etc., and may approach the City with proposals for water exchanges, credits for sale, etc. The City should carefully investigate the water, feasibility, and economic advantages and disadvantages of
9-12
Section 9
Water Resource Management and Assured Water Supply Strategy each opportunity presented. The City should entertain and approve such proposals where its water portfolio can benefit at a reasonable economic cost or benefit.
9.3.3. Assured Water Supply – Surface Water The City’s permanent CAP allocation is considered perpetually renewable for the purposes of a Designation of Assured Water Supply. If the City develops treatment facilities to take delivery of the water and use it directly, the CAP water will be counted up to the capacity of the facility. If the City permits an annual underground storage and recovery facility, the capacity of the City to store and recover water on an annual basis will be counted as part of the City’s available supply.
Water from the MWD may be considered as part of the City’s assured water supply if deployed pursuant to the water resources management strategy. The urban irrigation supply will also effectively reduce the exterior water demand for the homes located within the MWD service area. The urban irrigation arrangement for this area may need documentation from the City and from the MWD. Additionally, during drier years, groundwater from MWD can be supplemented for urban irrigation customers without the City potentially incurring a groundwater replenishment obligation for the water use.
The recommended assured water supply strategy for surface water supplies is summarized as follows.
Maximize Physical Availability of Surface Water
The City should maximize the physical availability of its CAP water by permitting and operating annual and long-term underground storage and recovery facilities, and permitting all existing and new wells as recovery wells, within the area of mutual hydrologic impact.
The City should investigate the potential to develop and maintain a contractual relationship with the MWD for annual storage and recovery of MWD surface water to be delivered by the City as potable water to urbanized MWD member lands.
Document MWD Supply for Urban Irrigation
The City should also investigate the potential to develop and maintain a contractual relationship with MWD for urban irrigation deliveries for the land located within the City and the MWD service area. The City should also work with MWD to document that MWD member lands will have its exterior irrigation water supplied by the MWD.
9.3.4. Assured Water Supply - Reclaimed Water Reclaimed water represents the City’s largest growing renewable water supply in the future. Under the Assured Water Supply program, the ADWR only counts direct reuse City of Surprise, Arizona Integrated Water Master Plan: Water Resources Update 04957020.0003
9-13

Section 9 Water Resource Management and Assured Water Supply Strategy
opportunities as supply. In other words, a reclaimed water user that has the ability to take delivery and use reclaimed water can have its water demand counted as being met by reclaimed water, thereby “releasing” other water supplies for other uses. In addition, reclaimed water that is permitted for annual underground storage and recovery up to the capacity of the storage facilities and recovery wells can be counted in the assured water supply.
The recommended assured water supply strategy for reclaimed water supplies is summarized as follows.
Maximize Physical Availability
The City should maximize its physical availability of reclaimed water by permitting and operating annual and long-term underground storage and recovery facilities, including permitting all existing and future City wells as recovery wells, within the area of mutual hydrologic impact.
Document Direct Reuse Facilities and Demands
The City should continue to document all direct delivery opportunities, facilities and infrastructure, and projected demands for reclaimed water. The City should also clearly document planned infrastructure construction that will supply projected future demands. The City should update it long range plans for reclaimed water infrastructure.
9.3.5. Assured Water Supply - Water Conservation While water conservation is not a true water supply, it is an essential part of any water resource management program and is required under the Groundwater Management Act. The specific requirements are provided under the AMA management plans.
Historically, water conservation compliance was measured using gallon per capita per day (gpcd) targets. In the future, however, ADWR will work with the City to identify areas that show the greatest potential for water savings and will enter into an agreement with the City requiring implementation of specific water conservation programs and reporting on an annual basis using specific metrics agreed to by the City and ADWR.
Typically, most programs may be focused on exterior water uses by restricting landscape palettes in specific areas, requiring modern automated irrigation systems, and potentially even requiring artificial turf for large athletic and play surfaces. For interior uses, because most appliances are now efficient based on plumbing codes, even older, high water using devices will naturally be phased out with time. The City could accelerate the process if needed or required by ADWR through enforceable mandates and rebates. In some cases, for example, sub-metering of multi-family units has shown to be extremely effective and may be economically accomplished.
9-14
Section 9
Water Resource Management and Assured Water Supply Strategy The recommended assured water supply strategy for water conservation is summarized as follows.
Document Existing Water Conservation Program
The City, at a minimum, will be required to and should document the elements of its current water conservation program for inclusion in its designation application.
Develop a Formal Water Conservation Plan
The City should develop a water conservation plan that identifies measures that are currently in place and those that will be implemented in the future. The plan should also provide a projection of the expected water savings.
City of Surprise, Arizona Integrated Water Master Plan: Water Resources Update 04957020.0003
9-15

THIS PAGE INTENTIONALLY LEFT BLANK
10. References
ADWR (Arizona Department of Water Resources). 1999. Third Management Plan 2000-2010: Phoenix AMA (December).
Billings, R.B. and C.V. Jones. 2000. Forecasting Urban Water Demand. American Water Works Association.
Black & Veatch. 2008. City of Goodyear 2007 Integrated Master Plan. City of Goodyear, Arizona (June).
EDAW/AECOM. 2008. City of Surprise Scenic Integrity Guidelines. City of Surprise, Arizona (May).
Malcolm Pirnie, Inc., HDR, and Clear Creek Associates. 2006. Water Resources Master Plan. City of Peoria, Arizona (January).
Malcolm Pirnie, Inc., Carollo Engineers, CH2MHill, and Hoque & Associates. 2006a. 2005 Water System Master Plan. City of Phoenix, Arizona (November).
Malcolm Pirnie, Inc. 2008. Water and Wastewater Master Plan Updates. City of El Mirage, Arizona (April).
Metcalf & Eddy. 1991. Wastewater Engineering: Treatment, Disposal, Reuse. McGraw-Hill, Third Edition.
RBF Consulting. 2002. Water Resources Master Plan. City of Avondale, Arizona (March).
RBF Consulting. 2004. Water Resources Master Plan. City of Surprise, Arizona (June).
RBF Consulting. 2004a. Water Infrastructure Master Plan. City of Surprise, Arizona (June).
Surprise, City of. 2000. Surprise General Plan 2020: Imagine the Possibilities. City of Surprise, Arizona (November).
Surprise, City of. 2006. Water Guidelines and Standards. City of Surprise, Arizona (June).
City of Surprise, Arizona Integrated Water Master Plan: Water Resources Update 04957020.0003
10-1

THIS PAGE INTENTIONALLY LEFT BLANK
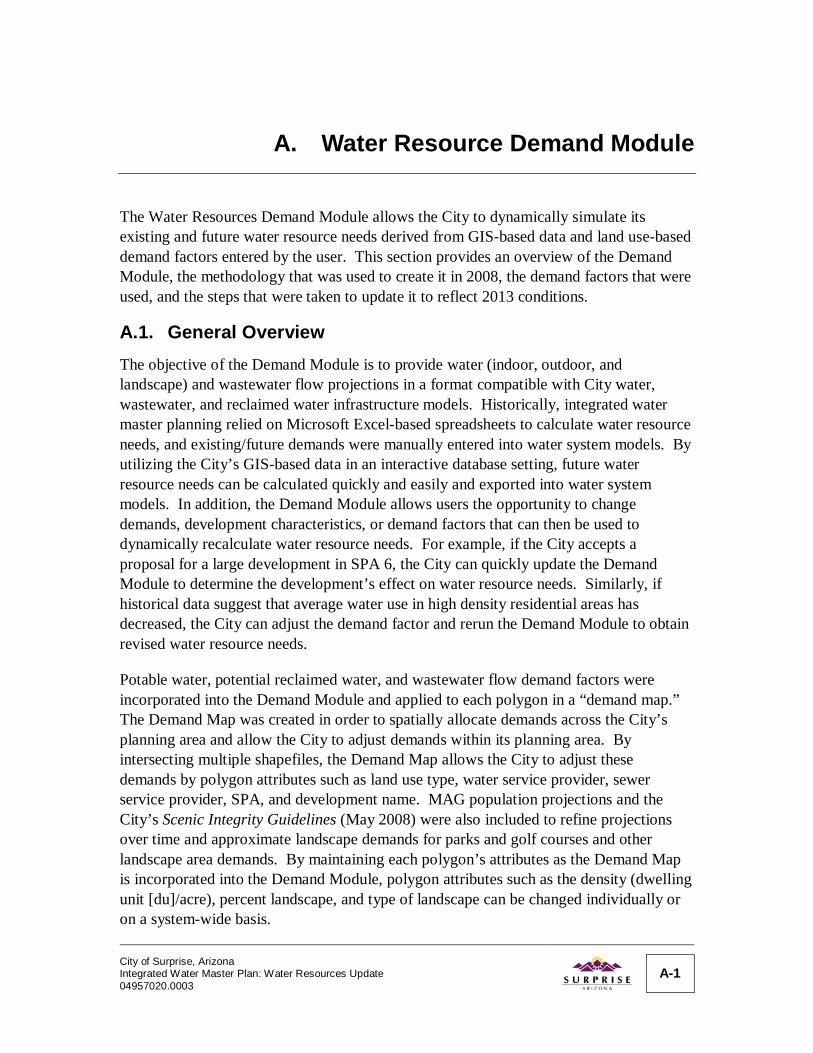
A. Water Resource Demand Module
The Water Resources Demand Module allows the City to dynamically simulate its existing and future water resource needs derived from GIS-based data and land use-based demand factors entered by the user. This section provides an overview of the Demand Module, the methodology that was used to create it in 2008, the demand factors that were used, and the steps that were taken to update it to reflect 2013 conditions.
A.1. General Overview The objective of the Demand Module is to provide water (indoor, outdoor, and landscape) and wastewater flow projections in a format compatible with City water, wastewater, and reclaimed water infrastructure models. Historically, integrated water master planning relied on Microsoft Excel-based spreadsheets to calculate water resource needs, and existing/future demands were manually entered into water system models. By utilizing the City’s GIS-based data in an interactive database setting, future water resource needs can be calculated quickly and easily and exported into water system models. In addition, the Demand Module allows users the opportunity to change demands, development characteristics, or demand factors that can then be used to dynamically recalculate water resource needs. For example, if the City accepts a proposal for a large development in SPA 6, the City can quickly update the Demand Module to determine the development’s effect on water resource needs. Similarly, if historical data suggest that average water use in high density residential areas has decreased, the City can adjust the demand factor and rerun the Demand Module to obtain revised water resource needs.
Potable water, potential reclaimed water, and wastewater flow demand factors were incorporated into the Demand Module and applied to each polygon in a “demand map.” The Demand Map was created in order to spatially allocate demands across the City’s planning area and allow the City to adjust demands within its planning area. By intersecting multiple shapefiles, the Demand Map allows the City to adjust these demands by polygon attributes such as land use type, water service provider, sewer service provider, SPA, and development name. MAG population projections and the City’s Scenic Integrity Guidelines (May 2008) were also included to refine projections over time and approximate landscape demands for parks and golf courses and other landscape area demands. By maintaining each polygon’s attributes as the Demand Map is incorporated into the Demand Module, polygon attributes such as the density (dwelling unit [du]/acre), percent landscape, and type of landscape can be changed individually or on a system-wide basis.
City of Surprise, Arizona Integrated Water Master Plan: Water Resources Update 04957020.0003
A-1
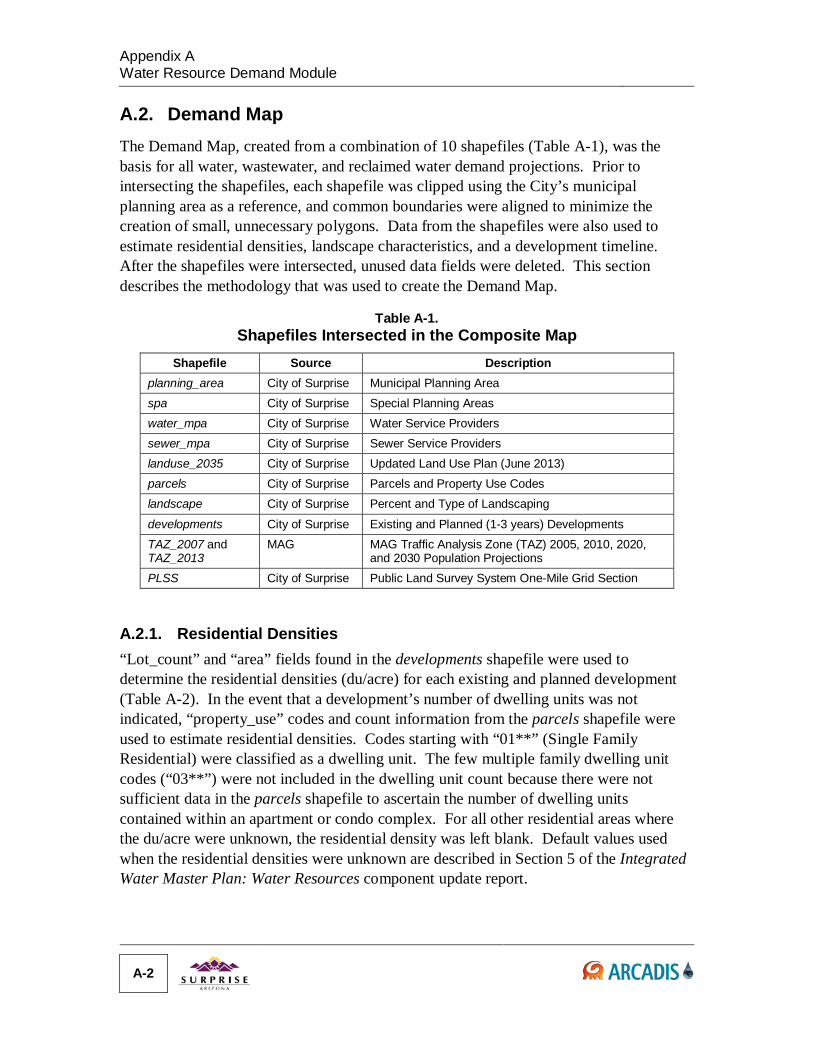
Appendix A Water Resource Demand Module
A.2. Demand Map The Demand Map, created from a combination of 10 shapefiles (Table A-1), was the basis for all water, wastewater, and reclaimed water demand projections. Prior to intersecting the shapefiles, each shapefile was clipped using the City’s municipal planning area as a reference, and common boundaries were aligned to minimize the creation of small, unnecessary polygons. Data from the shapefiles were also used to estimate residential densities, landscape characteristics, and a development timeline. After the shapefiles were intersected, unused data fields were deleted. This section describes the methodology that was used to create the Demand Map.
Table A-1. Shapefiles Intersected in the Composite Map
Shapefile Source Description planning_area City of Surprise Municipal Planning Area spa City of Surprise Special Planning Areas water_mpa City of Surprise Water Service Providers sewer_mpa City of Surprise Sewer Service Providers landuse_2035 City of Surprise Updated Land Use Plan (June 2013) parcels City of Surprise Parcels and Property Use Codes landscape City of Surprise Percent and Type of Landscaping
developments City of Surprise Existing and Planned (1-3 years) Developments TAZ_2007 and TAZ_2013
MAG MAG Traffic Analysis Zone (TAZ) 2005, 2010, 2020, and 2030 Population Projections
PLSS City of Surprise Public Land Survey System One-Mile Grid Section
A.2.1. Residential Densities “Lot_count” and “area” fields found in the developments shapefile were used to determine the residential densities (du/acre) for each existing and planned development (Table A-2). In the event that a development’s number of dwelling units was not indicated, “property_use” codes and count information from the parcels shapefile were used to estimate residential densities. Codes starting with “01**” (Single Family Residential) were classified as a dwelling unit. The few multiple family dwelling unit codes (“03**”) were not included in the dwelling unit count because there were not sufficient data in the parcels shapefile to ascertain the number of dwelling units contained within an apartment or condo complex. For all other residential areas where the du/acre were unknown, the residential density was left blank. Default values used when the residential densities were unknown are described in Section 5 of the Integrated Water Master Plan: Water Resources component update report.
A-2
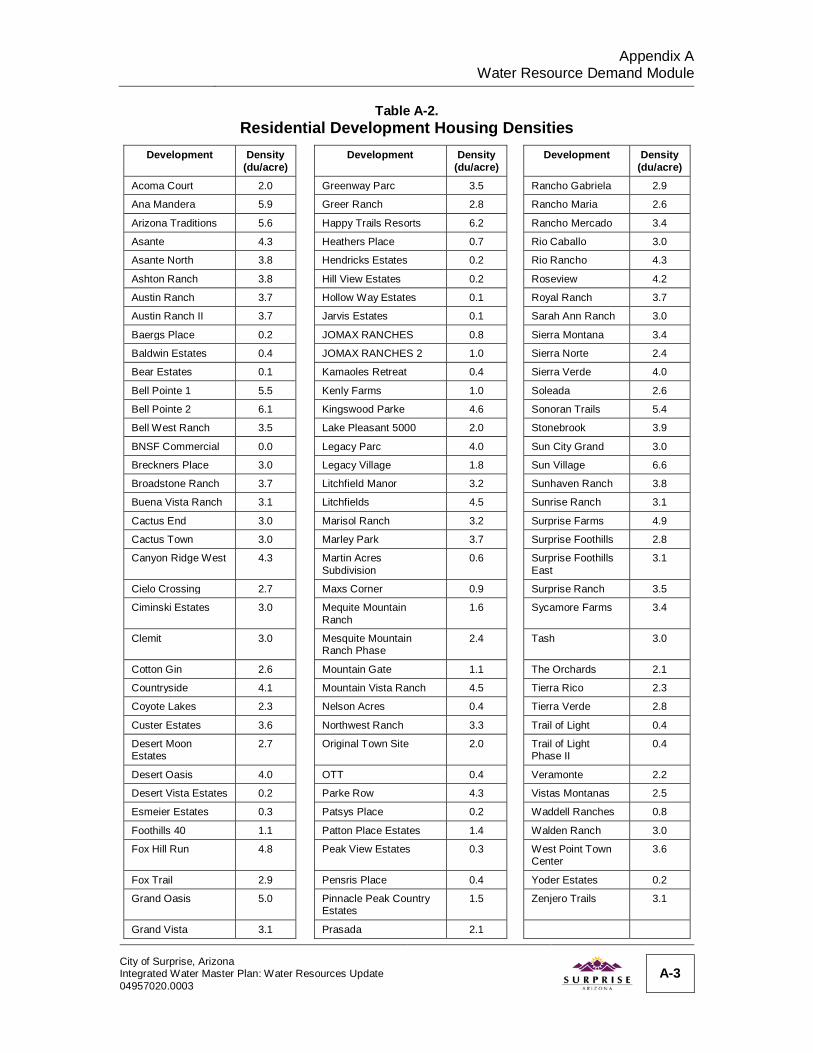
Appendix A
Water Resource Demand Module
Table A-2. Residential Development Housing Densities
Development Density (du/acre)
Development Density (du/acre)
Development Density (du/acre)
Acoma Court 2.0 Greenway Parc 3.5 Rancho Gabriela 2.9
Ana Mandera 5.9 Greer Ranch 2.8 Rancho Maria 2.6
Arizona Traditions 5.6 Happy Trails Resorts 6.2 Rancho Mercado 3.4
Asante 4.3 Heathers Place 0.7 Rio Caballo 3.0
Asante North 3.8 Hendricks Estates 0.2 Rio Rancho 4.3
Ashton Ranch 3.8 Hill View Estates 0.2 Roseview 4.2
Austin Ranch 3.7 Hollow Way Estates 0.1 Royal Ranch 3.7
Austin Ranch II 3.7 Jarvis Estates 0.1 Sarah Ann Ranch 3.0
Baergs Place 0.2 JOMAX RANCHES 0.8 Sierra Montana 3.4
Baldwin Estates 0.4 JOMAX RANCHES 2 1.0 Sierra Norte 2.4
Bear Estates 0.1 Kamaoles Retreat 0.4 Sierra Verde 4.0
Bell Pointe 1 5.5 Kenly Farms 1.0 Soleada 2.6
Bell Pointe 2 6.1 Kingswood Parke 4.6 Sonoran Trails 5.4
Bell West Ranch 3.5 Lake Pleasant 5000 2.0 Stonebrook 3.9
BNSF Commercial 0.0 Legacy Parc 4.0 Sun City Grand 3.0
Breckners Place 3.0 Legacy Village 1.8 Sun Village 6.6
Broadstone Ranch 3.7 Litchfield Manor 3.2 Sunhaven Ranch 3.8
Buena Vista Ranch 3.1 Litchfields 4.5 Sunrise Ranch 3.1
Cactus End 3.0 Marisol Ranch 3.2 Surprise Farms 4.9
Cactus Town 3.0 Marley Park 3.7 Surprise Foothills 2.8
Canyon Ridge West 4.3 Martin Acres Subdivision
0.6 Surprise Foothills East
3.1
Cielo Crossing 2.7 Maxs Corner 0.9 Surprise Ranch 3.5
Ciminski Estates 3.0 Mequite Mountain Ranch
1.6 Sycamore Farms 3.4
Clemit 3.0 Mesquite Mountain Ranch Phase
2.4 Tash 3.0
Cotton Gin 2.6 Mountain Gate 1.1 The Orchards 2.1
Countryside 4.1 Mountain Vista Ranch 4.5 Tierra Rico 2.3
Coyote Lakes 2.3 Nelson Acres 0.4 Tierra Verde 2.8
Custer Estates 3.6 Northwest Ranch 3.3 Trail of Light 0.4
Desert Moon Estates
2.7 Original Town Site 2.0 Trail of Light Phase II
0.4
Desert Oasis 4.0 OTT 0.4 Veramonte 2.2
Desert Vista Estates 0.2 Parke Row 4.3 Vistas Montanas 2.5
Esmeier Estates 0.3 Patsys Place 0.2 Waddell Ranches 0.8
Foothills 40 1.1 Patton Place Estates 1.4 Walden Ranch 3.0
Fox Hill Run 4.8 Peak View Estates 0.3 West Point Town Center
3.6
Fox Trail 2.9 Pensris Place 0.4 Yoder Estates 0.2
Grand Oasis 5.0 Pinnacle Peak Country Estates
1.5 Zenjero Trails 3.1
Grand Vista 3.1 Prasada 2.1
City of Surprise, Arizona Integrated Water Master Plan: Water Resources Update 04957020.0003
A-3
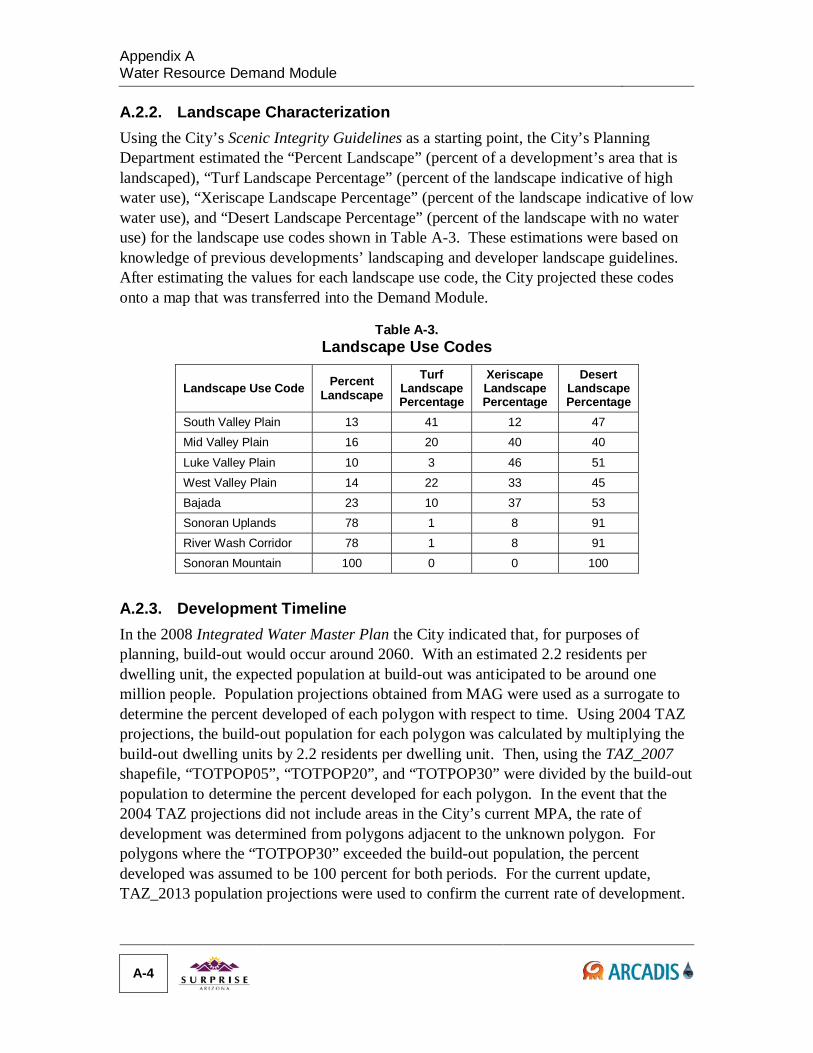
Appendix A Water Resource Demand Module
A.2.2. Landscape Characterization Using the City’s Scenic Integrity Guidelines as a starting point, the City’s Planning Department estimated the “Percent Landscape” (percent of a development’s area that is landscaped), “Turf Landscape Percentage” (percent of the landscape indicative of high water use), “Xeriscape Landscape Percentage” (percent of the landscape indicative of low water use), and “Desert Landscape Percentage” (percent of the landscape with no water use) for the landscape use codes shown in Table A-3. These estimations were based on knowledge of previous developments’ landscaping and developer landscape guidelines. After estimating the values for each landscape use code, the City projected these codes onto a map that was transferred into the Demand Module.
Table A-3. Landscape Use Codes
Landscape Use Code Percent Landscape
Turf Landscape Percentage
Xeriscape Landscape Percentage
Desert Landscape Percentage
South Valley Plain 13 41 12 47 Mid Valley Plain 16 20 40 40
Luke Valley Plain 10 3 46 51 West Valley Plain 14 22 33 45 Bajada 23 10 37 53 Sonoran Uplands 78 1 8 91 River Wash Corridor 78 1 8 91 Sonoran Mountain 100 0 0 100
A.2.3. Development Timeline In the 2008 Integrated Water Master Plan the City indicated that, for purposes of planning, build-out would occur around 2060. With an estimated 2.2 residents per dwelling unit, the expected population at build-out was anticipated to be around one million people. Population projections obtained from MAG were used as a surrogate to determine the percent developed of each polygon with respect to time. Using 2004 TAZ projections, the build-out population for each polygon was calculated by multiplying the build-out dwelling units by 2.2 residents per dwelling unit. Then, using the TAZ_2007 shapefile, “TOTPOP05”, “TOTPOP20”, and “TOTPOP30” were divided by the build-out population to determine the percent developed for each polygon. In the event that the 2004 TAZ projections did not include areas in the City’s current MPA, the rate of development was determined from polygons adjacent to the unknown polygon. For polygons where the “TOTPOP30” exceeded the build-out population, the percent developed was assumed to be 100 percent for both periods. For the current update, TAZ_2013 population projections were used to confirm the current rate of development.
A-4
Appendix A
Water Resource Demand Module A.2.4. Shapefile Intersection Unused fields from TAZ_2007, developments, and other shapefiles described in Table A-1 were deleted, and the shapefiles were intersected to create the Demand Map, consisting of 2,455 unique polygons (Figure A-1). Large polygons in SPAs 4, 5, and 6, where no development has occurred, were intersected with the PLSS shapefile to form smaller polygons, giving the City the ability to change attributes on a smaller level as new developments are planned and erected.
A.3. Demand Factors Demand factors used in the Demand Module were developed according to the following general process and are summarized in Table A-4.
In order to project demands for drinking water and reclaimed water separately, the water billed through irrigation meters (30 percent) was subtracted from the calculated demand factors described in Section 5 to determine non-irrigation (indoor and outdoor) demand factors for residential and commercial land uses.
The calculated water demand factors for non-irrigation residential uses were compared to demand factors obtained from surrounding areas and from City guidelines. The calculated City residential demand factors did not follow the expected pattern of lower demand factors in higher density residential uses. However, because there was only 2 years of billing data available and because high growth in the service area makes determining the number of dwelling units each year challenging, engineering judgment was used to assign demand factors for residential areas: One demand factor was calculated for all residential land use categories with less
than 5 du/acre, and a second factor was calculated for categories with more than 5 du/acre. The factor for less than 5 du/acre was based on the City’s billing data for Low Density Residential, and the factor for greater than 5 du/acre was based on the City’s billing data for Medium Density Residential.
When considering all water meters in all residential land use categories, 30 % of the billed water was for irrigation meters. This percentage was applied to the “total” demand factors, resulting in the non-irrigation factors shown in Table A-4.
The City indicated that the Mixed-Use Gateway areas will be densely populated areas with large commercial and employment areas. For the purposes of the 2008 Integrated Water Master Plan and this Water Resources component update, the Mixed-Use Gateway demand factor was estimated assuming a build-out residential density of 8 du/acre and the remaining area composed of commercial/employment. Based on the anticipated number of dwelling units in Sycamore Farms and Cielo Crossing (both located completely within Mixed-Use Gateway), 60 percent of the remaining area commercial (2,000 gpad), and 40 percent of the remaining area employment (1,000 gpad), the calculated demand factor for Mixed-Use Gateway was 2,200 gpad.
City of Surprise, Arizona Integrated Water Master Plan: Water Resources Update 04957020.0003
A-5

Demand Map Figure A-1 June 2015
Municipal Planning AreaMunicipal Planning Area
Demand Map
Demand Module
Special Planning AreasSpecial Planning Areas
Water Service ProvidersWater Service ProvidersSewer Service ProvidersSewer Service Providers Land UsesLand Uses
DevelopmentsDevelopments One-Mile PLSS GridOne-Mile PLSS Grid TAZ ProjectionsTAZ Projections
Landscape Use Codes
CITY OF SURPRISE, ARIZONA INTEGRATED WATER MASTER PLAN: WATER RESOURCES

Appendix A
Water Resource Demand Module
Table A-4. Demand Module Demand Factors
Land Use Category Units Non-Irrigation Water Wastewater
Flow Reclaimed
Water Production Indoor Outdoor Total
Residential
Rural Residential (0-1 du/acre)
gpd/du 210 110 320 210 190
Suburban Residential (1-3 du/acre)
gpd/du 210 110 320 210 190
Low Density Residential (3-5 du/acre)
gpd/du 210 110 320 210 190
Medium Density Residential (5-8 du/acre)
gpd/du 190 100 290 190 170
Medium/High Density Residential (8-15 du/acre)
gpd/du 190 100 290 190 170
High Density Residential (15-21 du/acre)
gpd/du 190 100 290 190 170
Commercial/Other
Airport Preservation (0-2 du/acre)
gpd/acre 390 210 600 390 350
Surprise Center gpd/acre 1,300 700 2,000 1,300 1,200
Original Townsite gpd/acre 800 400 1,200 800 720
Commercial gpd/acre 1,300 700 2,000 1,300 1,200
Employment gpd/acre 650 350 1,000 650 590
Mixed Use Gateway gpd/acre 1,200 1,000 2,200 1,200 1,080
Agriculture gpd/acre 2,600 1,400 4,000 2,600 2,340
Landfill gpd/acre 325 175 500 325 290
Military gpd/acre 650 350 1,000 650 590
Open Space gpd/acre 0 0 0 0 0
Public Facilities gpd/acre 650 350 1,000 650 590
Proving Grounds gpd/acre 325 175 500 325 290
Landscape
Turf gpd/acre 0 4,000 4,000 0 0
Xeriscape gpd/acre 0 1,300 1,300 0 0
Desert gpd/acre 0 0 0 0 0
City of Surprise, Arizona Integrated Water Master Plan: Water Resources Update 04957020.0003
A-7
Appendix A Water Resource Demand Module
For land use categories where demands were unique to the City (Surprise Center,
Landfill, Military, Proving Grounds, and Airport Preservation), engineering judgment was used to estimate these values based on values from similar land use categories (i.e. Commercial, Employment, and Mixed Use Gateway).
Indoor uses were assumed to be 65 percent of the non-irrigation demand; the remaining 35 percent was assigned to outdoor demand, which refers to the irrigation of the individual properties (e.g., front and back yard irrigation).
Wastewater flow was assumed to be 100 percent of the interior demand; i.e., nearly all water used within the home or business returns to the sewer system.
For large landscaped areas, the ADWR TMP factors for turf and xeriscape were used. By definition, the City’s “Open Space” land use category classifies open space as areas with natural vegetation. As such, the Open Space demand factor was assumed to be zero gpad.
A.4. Demand Module Methodology The Map created from the intersection of City shapefiles was integrated with water demand factors and other user input tables to create the Demand Module. Because the Demand Module is entirely GIS-based, standard GIS functions can be used to change a polygon’s field attributes and recalculate water resource needs. In order to make the Demand Module more user-friendly, a user interface was created to allow users to quickly and efficiently update field attributes and recalculate water resource needs. Overviews of the Demand Module’s user input tables, calculation equations, and user interface are described below.
A.4.1. User Input Tables In addition to the Demand Map, three user input tables were incorporated into the Demand Module to assist with the demand calculations and to provide default demand factors and landscape use codes for areas where no information could be obtained. Within the Demand Module, the user has the ability to change indoor and outdoor water demand factors for each land use category as well as turf and xeriscape landscaping demand factors for the City’s planning area (Figures A-2 and A-3). Used for planning purposes, these values were applied to all polygons in the map and served as the basis for water resource calculations. Because non-residential demands can vary widely, the Demand Module allows users to change an individual non-residential land use polygon’s demand factor. Landscape and residential demand factors cannot be changed at an individual polygon level.
Because City residential land use category definitions allow for a range of du/acre within a specific land use category, the Demand Module allows the user to modify the default du/acre value that is used in calculating residential demands (Figure A-2). In order to
A-8
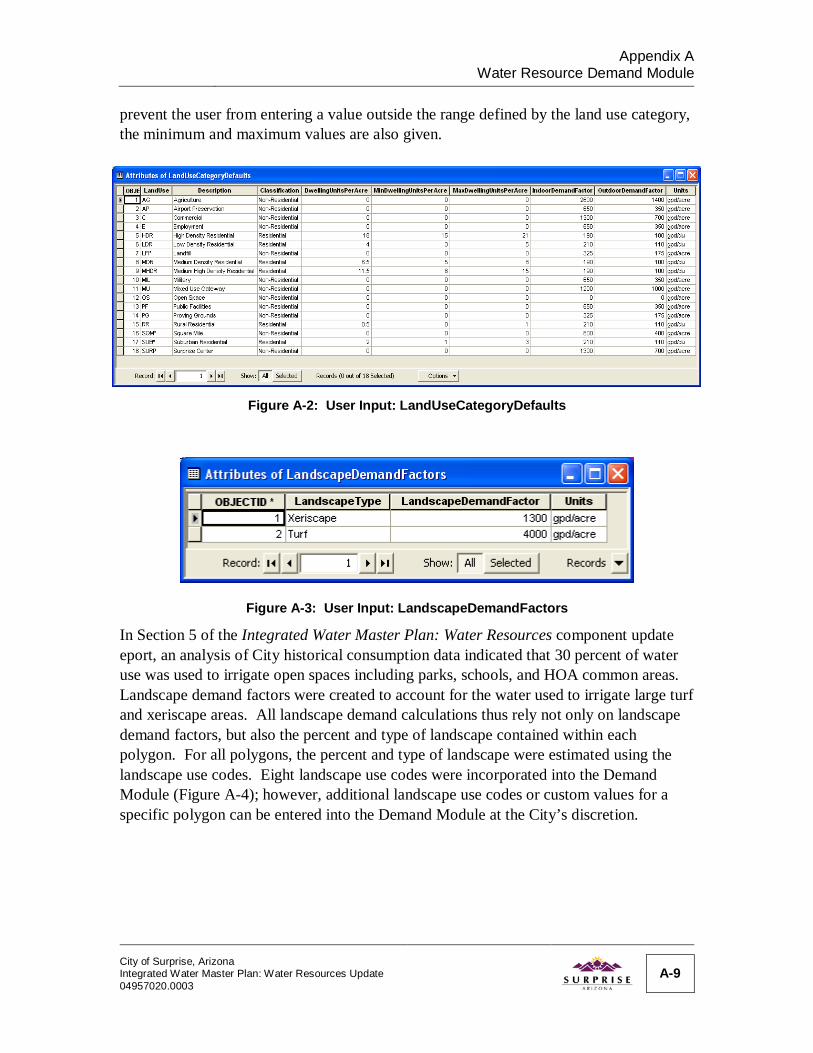
Appendix A
Water Resource Demand Module prevent the user from entering a value outside the range defined by the land use category, the minimum and maximum values are also given.
Figure A-2: User Input: LandUseCategoryDefaults
Figure A-3: User Input: LandscapeDemandFactors
In Section 5 of the Integrated Water Master Plan: Water Resources component update eport, an analysis of City historical consumption data indicated that 30 percent of water use was used to irrigate open spaces including parks, schools, and HOA common areas. Landscape demand factors were created to account for the water used to irrigate large turf and xeriscape areas. All landscape demand calculations thus rely not only on landscape demand factors, but also the percent and type of landscape contained within each polygon. For all polygons, the percent and type of landscape were estimated using the landscape use codes. Eight landscape use codes were incorporated into the Demand Module (Figure A-4); however, additional landscape use codes or custom values for a specific polygon can be entered into the Demand Module at the City’s discretion.
City of Surprise, Arizona Integrated Water Master Plan: Water Resources Update 04957020.0003
A-9
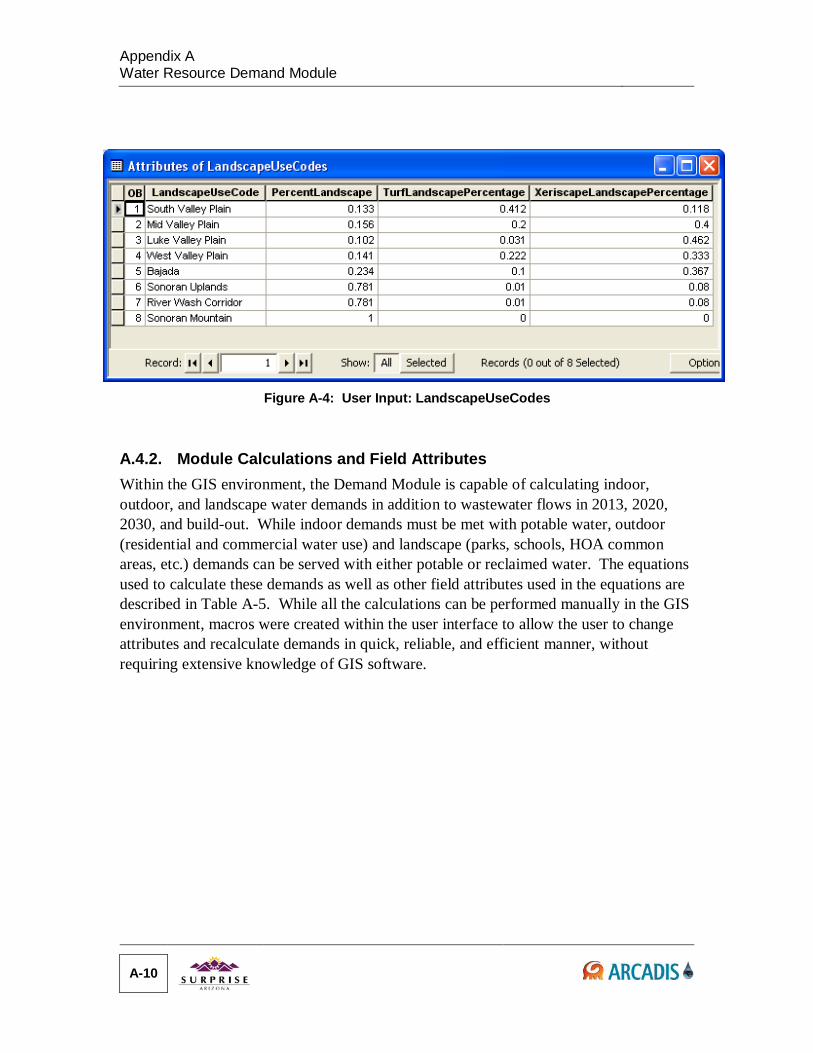
Appendix A Water Resource Demand Module
Figure A-4: User Input: LandscapeUseCodes
A.4.2. Module Calculations and Field Attributes Within the GIS environment, the Demand Module is capable of calculating indoor, outdoor, and landscape water demands in addition to wastewater flows in 2013, 2020, 2030, and build-out. While indoor demands must be met with potable water, outdoor (residential and commercial water use) and landscape (parks, schools, HOA common areas, etc.) demands can be served with either potable or reclaimed water. The equations used to calculate these demands as well as other field attributes used in the equations are described in Table A-5. While all the calculations can be performed manually in the GIS environment, macros were created within the user interface to allow the user to change attributes and recalculate demands in quick, reliable, and efficient manner, without requiring extensive knowledge of GIS software.
A-10
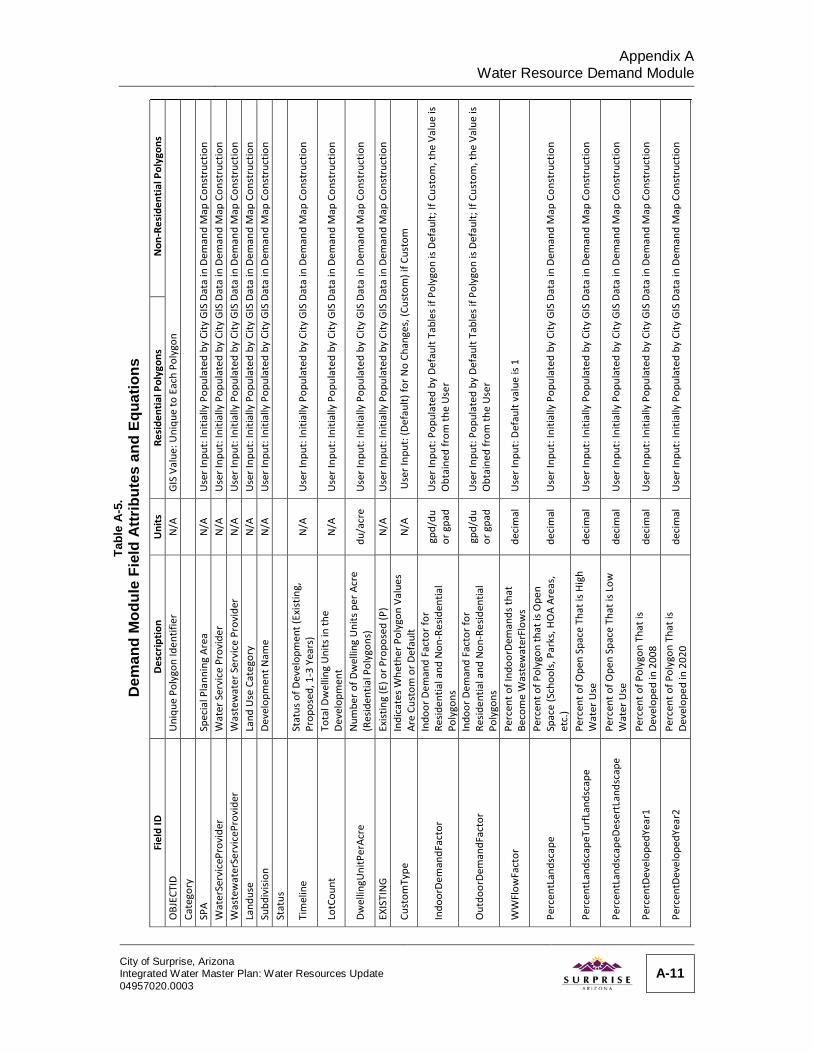
Appendix A
Water Resource Demand Module
Table A-4. Demand Module Field Attributes and Equations
Tabl
e A
-3.
Dem
and
Mod
ule
Fiel
d A
ttrib
utes
and
Equ
atio
ns
Fiel
d ID
D
escr
iptio
n U
nits
Re
side
ntia
l Pol
ygon
s N
on-R
esid
entia
l Pol
ygon
s O
BJEC
TID
Uni
que
Poly
gon
Iden
tifie
r N
/A
GIS
Val
ue: U
niqu
e to
Eac
h Po
lygo
n Ca
tego
ry
SP
A Sp
ecia
l Pla
nnin
g Ar
ea
N/A
U
ser I
nput
: Ini
tially
Pop
ulat
ed b
y Ci
ty G
IS D
ata
in D
eman
d M
ap C
onst
ruct
ion
Wat
erSe
rvic
ePro
vide
r W
ater
Ser
vice
Pro
vide
r N
/A
Use
r Inp
ut: I
nitia
lly P
opul
ated
by
City
GIS
Dat
a in
Dem
and
Map
Con
stru
ctio
n W
aste
wat
erSe
rvic
ePro
vide
r W
aste
wat
er S
ervi
ce P
rovi
der
N/A
U
ser I
nput
: Ini
tially
Pop
ulat
ed b
y Ci
ty G
IS D
ata
in D
eman
d M
ap C
onst
ruct
ion
Land
use
Land
Use
Cat
egor
y N
/A
Use
r Inp
ut: I
nitia
lly P
opul
ated
by
City
GIS
Dat
a in
Dem
and
Map
Con
stru
ctio
n Su
bdiv
isio
n De
velo
pmen
t Nam
e N
/A
Use
r Inp
ut: I
nitia
lly P
opul
ated
by
City
GIS
Dat
a in
Dem
and
Map
Con
stru
ctio
n St
atus
Tim
elin
e St
atus
of D
evel
opm
ent (
Exis
ting,
Pr
opos
ed, 1
-3 Y
ears
) N
/A
Use
r Inp
ut: I
nitia
lly P
opul
ated
by
City
GIS
Dat
a in
Dem
and
Map
Con
stru
ctio
n
LotC
ount
To
tal D
wel
ling
Uni
ts in
the
Deve
lopm
ent
N/A
U
ser I
nput
: Ini
tially
Pop
ulat
ed b
y Ci
ty G
IS D
ata
in D
eman
d M
ap C
onst
ruct
ion
Dwel
lingU
nitP
erAc
re
Num
ber o
f Dw
ellin
g U
nits
per
Acr
e (R
esid
entia
l Pol
ygon
s)
du/a
cre
Use
r Inp
ut: I
nitia
lly P
opul
ated
by
City
GIS
Dat
a in
Dem
and
Map
Con
stru
ctio
n
EXIS
TIN
G
Exist
ing
(E) o
r Pro
pose
d (P
) N
/A
Use
r Inp
ut: I
nitia
lly P
opul
ated
by
City
GIS
Dat
a in
Dem
and
Map
Con
stru
ctio
n
Cust
omTy
pe
Indi
cate
s Whe
ther
Pol
ygon
Val
ues
Are
Cust
om o
r Def
ault
N/A
U
ser I
nput
: (De
faul
t) fo
r No
Chan
ges,
(Cus
tom
) if C
usto
m
Indo
orDe
man
dFac
tor
Indo
or D
eman
d Fa
ctor
for
Resid
entia
l and
Non
-Res
iden
tial
Poly
gons
gpd/
du
or g
pad
Use
r Inp
ut: P
opul
ated
by
Defa
ult T
able
s if P
olyg
on is
Def
ault;
If C
usto
m, t
he V
alue
is
Obt
aine
d fr
om th
e U
ser
Out
door
Dem
andF
acto
r In
door
Dem
and
Fact
or fo
r Re
siden
tial a
nd N
on-R
esid
entia
l Po
lygo
ns
gpd/
du
or g
pad
Use
r Inp
ut: P
opul
ated
by
Defa
ult T
able
s if P
olyg
on is
Def
ault;
If C
usto
m, t
he V
alue
is
Obt
aine
d fr
om th
e U
ser
WW
Flow
Fact
or
Perc
ent o
f Ind
oorD
eman
ds th
at
Beco
me
Was
tew
ater
Flow
s de
cim
al
Use
r Inp
ut: D
efau
lt va
lue
is 1
Perc
entL
ands
cape
Pe
rcen
t of P
olyg
on th
at is
Ope
n Sp
ace
(Sch
ools,
Par
ks, H
OA
Area
s,
etc.
) de
cim
al
Use
r Inp
ut: I
nitia
lly P
opul
ated
by
City
GIS
Dat
a in
Dem
and
Map
Con
stru
ctio
n
Perc
entL
ands
cape
Turf
Land
scap
e Pe
rcen
t of O
pen
Spac
e Th
at is
Hig
h W
ater
Use
de
cim
al
Use
r Inp
ut: I
nitia
lly P
opul
ated
by
City
GIS
Dat
a in
Dem
and
Map
Con
stru
ctio
n
Perc
entL
ands
cape
Dese
rtLa
ndsc
ape
Perc
ent o
f Ope
n Sp
ace
That
is L
ow
Wat
er U
se
deci
mal
U
ser I
nput
: Ini
tially
Pop
ulat
ed b
y Ci
ty G
IS D
ata
in D
eman
d M
ap C
onst
ruct
ion
Perc
entD
evel
oped
Year
1 Pe
rcen
t of P
olyg
on T
hat i
s De
velo
ped
in 2
008
deci
mal
U
ser I
nput
: Ini
tially
Pop
ulat
ed b
y Ci
ty G
IS D
ata
in D
eman
d M
ap C
onst
ruct
ion
Perc
entD
evel
oped
Year
2 Pe
rcen
t of P
olyg
on T
hat i
s De
velo
ped
in 2
020
deci
mal
U
ser I
nput
: Ini
tially
Pop
ulat
ed b
y Ci
ty G
IS D
ata
in D
eman
d M
ap C
onst
ruct
ion
T a
ble
A-5
.
City of Surprise, Arizona Integrated Water Master Plan: Water Resources Update 04957020.0003
A-11
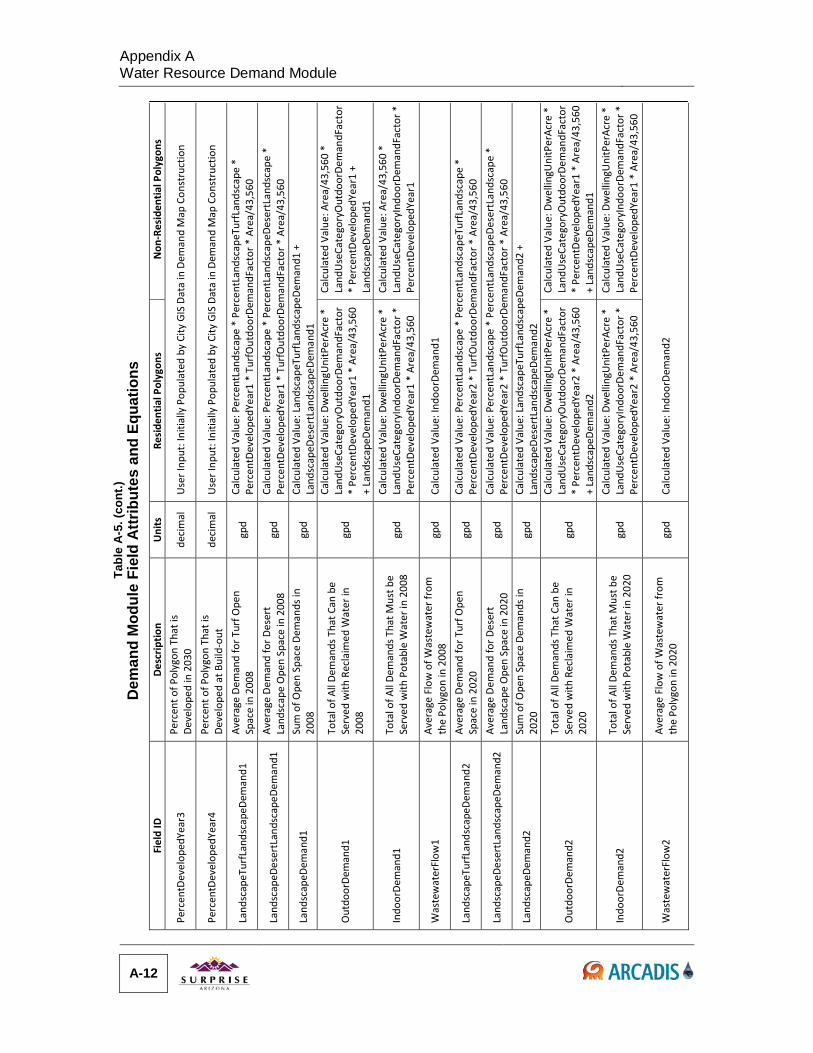
Appendix A Water Resource Demand Module
Ta
ble
A-3.
(con
t.)
Dem
and
Mod
ule
Fiel
d At
trib
utes
and
Equ
atio
ns
Fiel
d ID
De
scrip
tion
Uni
ts
Resi
dent
ial P
olyg
ons
Non
-Res
iden
tial P
olyg
ons
Perc
entD
evel
oped
Year
3 Pe
rcen
t of P
olyg
on T
hat i
s De
velo
ped
in 2
030
deci
mal
U
ser I
nput
: Ini
tially
Pop
ulat
ed b
y Ci
ty G
IS D
ata
in D
eman
d M
ap C
onst
ruct
ion
Perc
entD
evel
oped
Year
4 Pe
rcen
t of P
olyg
on T
hat i
s De
velo
ped
at B
uild
-out
de
cim
al
Use
r Inp
ut: I
nitia
lly P
opul
ated
by
City
GIS
Dat
a in
Dem
and
Map
Con
stru
ctio
n
Land
scap
eTur
fLan
dsca
peDe
man
d1
Aver
age
Dem
and
for T
urf O
pen
Spac
e in
200
8 gp
d Ca
lcul
ated
Val
ue: P
erce
ntLa
ndsc
ape
* Pe
rcen
tLan
dsca
peTu
rfLa
ndsc
ape
* Pe
rcen
tDev
elop
edYe
ar1
* Tu
rfO
utdo
orDe
man
dFac
tor *
Are
a/43
,560
Land
scap
e Des
ertL
ands
cape
Dem
and1
Av
erag
e De
man
d fo
r Des
ert
Land
scap
e O
pen
Spac
e in
200
8 gp
d Ca
lcul
ated
Val
ue: P
erce
ntLa
ndsc
ape
* Pe
rcen
tLan
dsca
peDe
sert
Land
scap
e *
Perc
entD
evel
oped
Year
1 *
Turf
Out
door
Dem
andF
acto
r * A
rea/
43,5
60
Land
scap
eDem
and1
Su
m o
f Ope
n Sp
ace
Dem
ands
in
2008
gp
d Ca
lcul
ated
Val
ue: L
ands
cape
Turf
Land
scap
eDem
and1
+
Land
scap
eDes
ertL
ands
cape
Dem
and1
Out
door
Dem
and1
To
tal o
f All
Dem
ands
Tha
t Can
be
Serv
ed w
ith R
ecla
imed
Wat
er in
20
08
gpd
Calc
ulat
ed V
alue
: Dw
ellin
gUni
tPer
Acre
*
Land
Use
Cate
gory
Out
door
Dem
andF
acto
r *
Perc
entD
evel
oped
Year
1 *
Area
/43,
560
+ La
ndsc
apeD
eman
d1
Calc
ulat
ed V
alue
: Are
a/43
,560
*
Land
Use
Cate
gory
Out
door
Dem
andF
acto
r *
Perc
entD
evel
oped
Year
1 +
Land
scap
eDem
and1
Indo
orDe
man
d1
Tota
l of A
ll De
man
ds T
hat M
ust b
e Se
rved
with
Pot
able
Wat
er in
200
8 gp
d Ca
lcul
ated
Val
ue: D
wel
lingU
nitP
erAc
re *
La
ndU
seCa
tego
ryIn
door
Dem
andF
acto
r *
Perc
entD
evel
oped
Year
1 *
Area
/43,
560
Calc
ulat
ed V
alue
: Are
a/43
,560
*
Land
Use
Cate
gory
Indo
orDe
man
dFac
tor *
Pe
rcen
tDev
elop
edYe
ar1
Was
tew
ater
Flow
1 Av
erag
e Fl
ow o
f Was
tew
ater
from
th
e Po
lygo
n in
200
8 gp
d Ca
lcul
ated
Val
ue: I
ndoo
rDem
and1
Land
scap
eTur
fLan
dsca
peDe
man
d2
Aver
age
Dem
and
for T
urf O
pen
Spac
e in
202
0 gp
d Ca
lcul
ated
Val
ue: P
erce
ntLa
ndsc
ape
* Pe
rcen
tLan
dsca
peTu
rfLa
ndsc
ape
* Pe
rcen
tDev
elop
edYe
ar2
* Tu
rfO
utdo
orDe
man
dFac
tor *
Are
a/43
,560
Land
scap
eDes
ertL
ands
cape
Dem
and2
Av
erag
e De
man
d fo
r Des
ert
Land
scap
e O
pen
Spac
e in
202
0 gp
d Ca
lcul
ated
Val
ue: P
erce
ntLa
ndsc
ape
* Pe
rcen
tLan
dsca
peDe
sert
Land
scap
e *
Perc
entD
evel
oped
Year
2 *
Turf
Out
door
Dem
andF
acto
r * A
rea/
43,5
60
Land
scap
eDem
and2
Su
m o
f Ope
n Sp
ace
Dem
ands
in
2020
gp
d Ca
lcul
ated
Val
ue: L
ands
cape
Turf
Land
scap
eDem
and2
+
Land
scap
eDes
ertL
ands
cape
Dem
and2
Out
door
Dem
and2
To
tal o
f All
Dem
ands
Tha
t Can
be
Serv
ed w
ith R
ecla
imed
Wat
er in
20
20
gpd
Calc
ulat
ed V
alue
: Dw
ellin
gUni
tPer
Acre
*
Land
Use
Cate
gory
Out
door
Dem
andF
acto
r *
Perc
entD
evel
oped
Year
2 *
Area
/43,
560
+ La
ndsc
ape D
eman
d2
Calc
ulat
ed V
alue
: Dw
ellin
gUni
tPer
Acre
*
Land
Use
Cate
gory
Out
door
Dem
andF
acto
r *
Perc
entD
evel
oped
Year
1 *
Area
/43,
560
+ La
ndsc
apeD
eman
d1
Indo
orDe
man
d2
Tota
l of A
ll De
man
ds T
hat M
ust b
e Se
rved
with
Pot
able
Wat
er in
202
0 gp
d Ca
lcul
ated
Val
ue: D
wel
lingU
nitP
erAc
re *
La
ndU
seCa
tego
ryIn
door
Dem
andF
acto
r *
Perc
entD
evel
oped
Year
2 *
Area
/43,
560
Calc
ulat
ed V
alue
: Dw
ellin
gUni
tPer
Acre
*
Land
Use
Cate
gory
Indo
orDe
man
dFac
tor *
Pe
rcen
tDev
elop
edYe
ar1
* Ar
ea/4
3,56
0
Was
tew
ater
Flow
2 Av
erag
e Fl
ow o
f Wa s
tew
ater
from
th
e Po
lygo
n in
202
0 gp
d Ca
lcul
ated
Val
ue: I
ndoo
rDem
and2
Tabl
e A
-4. (
cont
.) T
able
A-5
. (co
nt.)
A-12

Appendix A
Water Resource Demand Module
Tabl
e A
-3. (
cont
.) D
eman
d M
odul
e Fi
eld
Attr
ibut
es a
nd E
quat
ions
Fi
eld
ID
Desc
riptio
n U
nits
Re
side
ntia
l Pol
ygon
s N
on-R
esid
entia
l Pol
ygon
s
Land
scap
eTur
fLan
dsca
peDe
man
d3
Aver
age
Dem
and
for T
urf O
pen
Spac
e in
203
0 gp
d Ca
lcul
ated
Val
ue: P
erce
ntLa
ndsc
ape
* Pe
rcen
tLan
dsca
peTu
rfLa
ndsc
ape
* Pe
rcen
tDev
elop
edYe
ar3
* Tu
rfO
utdo
orDe
man
dFac
tor *
Are
a/43
,560
Land
scap
eDes
ertL
ands
cape
Dem
and3
Av
erag
e De
man
d fo
r Des
ert
Land
scap
e O
pen
Spac
e in
203
0 gp
d Ca
lcul
ated
Val
ue: P
erce
ntLa
ndsc
ape
* Pe
rcen
tLan
dsca
peDe
sert
Land
scap
e *
Perc
entD
evel
oped
Year
3 *
Turf
Out
door
Dem
andF
acto
r * A
rea/
43,5
60
Land
scap
eDem
and3
Su
m o
f Ope
n Sp
ace
Dem
ands
in
2030
gp
d Ca
lcul
ated
Val
ue: L
ands
cape
Turf
Land
scap
eDem
and3
+
Land
scap
eDes
ertL
ands
cape
Dem
and3
Out
door
Dem
and3
To
tal o
f All
Dem
ands
Tha
t Can
be
Serv
ed w
ith R
ecla
imed
Wat
er in
20
30
gpd
Calc
ulat
ed V
alue
: Dw
ellin
gUni
tPer
Acre
*
Land
Use
Cate
gory
Out
door
Dem
andF
acto
r *
Perc
entD
evel
oped
Year
3 *
Area
/43,
560
+ La
ndsc
apeD
eman
d3
Calc
ulat
ed V
alue
: Dw
ellin
gUni
tPer
Acre
*
Land
Use
Cate
gory
Out
door
Dem
andF
acto
r *
Perc
entD
evel
oped
Year
2 *
Area
/43,
560
+ La
ndsc
apeD
eman
d2
Indo
orDe
man
d3
Tota
l of A
ll De
man
ds T
hat M
ust b
e Se
rved
with
Pot
able
Wat
er in
203
0 gp
d Ca
lcul
ated
Val
ue: D
wel
lingU
nitP
erAc
re *
La
ndU
seCa
tego
ryIn
door
Dem
andF
acto
r *
Perc
entD
evel
oped
Year
3 *
Area
/43,
560
Calc
ulat
ed V
alue
: Dw
ellin
gUni
tPer
Acre
*
Land
Use
Cate
gory
Indo
orDe
man
dFac
tor *
Pe
rcen
tDev
elop
edYe
ar2
* Ar
ea/4
3,56
0
Was
tew
ater
Flow
3 Av
erag
e Fl
ow o
f Was
tew
ater
from
th
e Po
lygo
n in
203
0 gp
d Ca
lcul
ated
Val
ue: I
ndoo
rDem
and3
Land
scap
eTur
fLan
dsca
peDe
man
d4
Aver
age
Dem
and
for T
urf O
pen
Spac
e at
Bui
ld-o
ut
gpd
Calc
ulat
ed V
alue
: Per
cent
Land
scap
e *
Perc
entL
ands
cape
Turf
Land
scap
e *
Perc
entD
evel
oped
Year
4 *
Turf
Out
door
Dem
andF
acto
r * A
rea/
43,5
60
Land
scap
eDes
ertL
ands
cape
Dem
and4
Av
erag
e De
man
d fo
r Des
ert
Land
scap
e O
pen
Spac
e at
Bui
ld-o
ut
gpd
Calc
ulat
ed V
alue
: Per
cent
Land
scap
e *
Perc
entL
ands
cape
Dese
rtLa
ndsc
ape
* Pe
rcen
tDev
elop
edYe
ar4
* Tu
rfO
utdo
orDe
man
dFac
tor *
Are
a/43
,560
Land
scap
eDem
and4
Su
m o
f Ope
n Sp
ace
Dem
ands
at
Build
-out
gp
d Ca
lcul
ated
Val
ue: L
ands
cape
Turf
Land
scap
eDem
and4
+
Land
scap
eDes
ertL
ands
cape
Dem
and4
Out
door
Dem
and4
To
tal o
f All
Dem
ands
Tha
t Can
be
Serv
ed w
ith R
ecla
imed
Wat
er a
t Bu
ild-o
ut
gpd
Calc
ulat
ed V
alue
: Dw
ellin
gUni
tPer
Acre
*
Land
Use
Cate
gory
Out
door
Dem
andF
acto
r *
Perc
entD
evel
oped
Year
4 *
Area
/43,
560
+ La
ndsc
apeD
eman
d4
Calc
ulat
ed V
alue
: Dw
ellin
gUni
tPer
Acre
*
Land
Use
Cate
gory
Out
door
Dem
andF
acto
r *
Perc
entD
evel
oped
Year
1 *
Area
/43,
560
+ La
ndsc
apeD
eman
d1
Indo
orDe
man
d4
Tota
l of A
ll De
man
ds T
hat M
ust b
e Se
rved
with
Pot
able
Wat
er a
t Bui
ld-
out
gpd
Calc
ulat
ed V
alue
: Dw
ellin
gUni
tPer
Acre
*
Land
Use
Cate
gory
Indo
orDe
man
dFac
tor *
Pe
rcen
tDev
elop
edYe
ar4
* Ar
ea/4
3,56
0
Calc
ulat
ed V
alue
: Dw
ellin
gUni
tPer
Acre
*
Land
Use
Cate
gory
Indo
orDe
man
dFac
tor *
Pe
rcen
tDev
elop
edYe
ar1
* Ar
ea/4
3,56
0
Was
tew
ater
Flow
4 Av
erag
e Fl
ow o
f Was
tew
ater
from
th
e Po
lygo
n at
Bui
ld-o
ut
gpd
Calc
ulat
ed V
alue
: Ind
oorD
eman
d 4
Was
tew
ater
Flow
4
Shap
e_Le
ngth
Pe
rimet
er o
f Pol
ygon
ft
Ca
lcul
ated
Val
ue b
y GI
S Sh
ape_
Leng
th
Shap
e_Ar
ea
Area
of P
olyg
on
ft2
Calc
ulat
ed V
alue
by
GIS
Shap
e_Ar
ea
Tabl
e A
-4. (
cont
.) T
able
A-5
. (co
nt.)
City of Surprise, Arizona Integrated Water Master Plan: Water Resources Update 04957020.0003
A-13
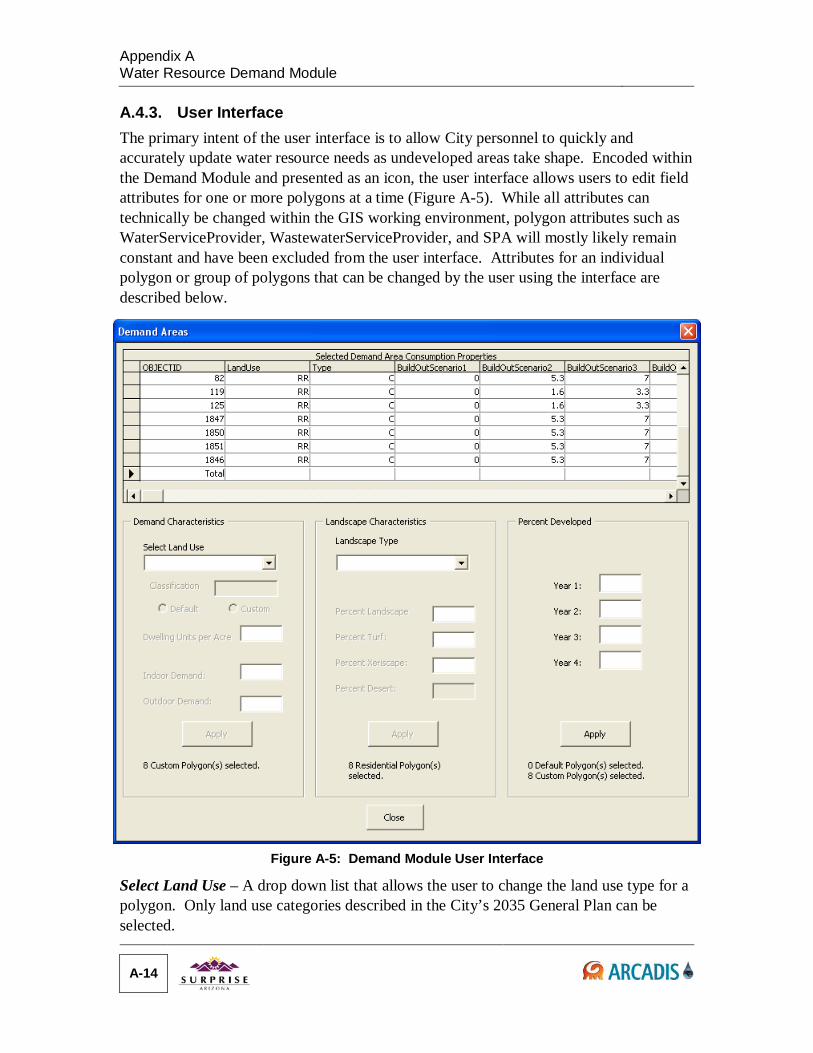
Appendix A Water Resource Demand Module
A.4.3. User Interface The primary intent of the user interface is to allow City personnel to quickly and accurately update water resource needs as undeveloped areas take shape. Encoded within the Demand Module and presented as an icon, the user interface allows users to edit field attributes for one or more polygons at a time (Figure A-5). While all attributes can technically be changed within the GIS working environment, polygon attributes such as WaterServiceProvider, WastewaterServiceProvider, and SPA will mostly likely remain constant and have been excluded from the user interface. Attributes for an individual polygon or group of polygons that can be changed by the user using the interface are described below.
Figure A-5: Demand Module User Interface
Select Land Use – A drop down list that allows the user to change the land use type for a polygon. Only land use categories described in the City’s 2035 General Plan can be selected.
A-14
Appendix A
Water Resource Demand Module Classification – Automatic field indicating the type of land use that was selected (residential or non-residential).
Default/Custom – Allows the user to select land use category “default” values obtained from the user input tables or input “custom” values characteristic of the polygon(s). “Custom” must be selected in order to change most of the attributes in the user interface. If “custom” is selected, the Module will use all values appearing in the interface to calculate water resource needs
Dwelling Units per Acre – Applicable only to residential land use types, the user can enter the number of dwelling units per acre for existing or planned developments if it differs from the land use category default value.
Indoor Demand – For non-residential polygons only, the user can enter a custom indoor demand (gpd/acre) for the polygon if it is known.
Outdoor Demand – For non-residential polygons only, the user can enter a custom outdoor demand (gpd/acre) for the polygon if it is known.
Landscape Type – If the user does not know the percent and type of open space (turf, desert landscape, desert), he/she may select a landscape use code characteristic of the area (Bajada, West Valley Plain, etc.). Additional landscape use codes can be entered in the “LandscapeUseCodes” user input table. If the user knows the specific characteristics of the polygon, “CUSTOM” may be selected.
Percent Landscape – The percent area of the polygon(s) that is landscaped (schools, parks, HOA common areas, golf courses, agriculture, etc.). This value is entered as a decimal.
Percent Turf – Percent of landscape area, entered as a decimal, that is characteristic of high water use (golf courses, parks, schools, lakes, etc.)
Percent Xeriscape – Percent of landscape area, entered as a decimal, that is characteristic of low water use (Xeriscape)
Percent Desert – Percent of landscape area, entered as a decimal, that is characteristic of no water use (natural desert, streets, parking lots, etc.). This value is calculated as the remaining landscaped portion that is not turf or Xeriscape.
Percent Developed: Year 1 – The percentage of the polygon that is developed in 2013, entered as a decimal.
Percent Developed: Year 2 – The percentage of the polygon that is developed in 2020, entered as a decimal. City of Surprise, Arizona Integrated Water Master Plan: Water Resources Update 04957020.0003
A-15
Appendix A Water Resource Demand Module
Percent Developed: Year 3 – The percentage of the polygon that is developed in 2030, entered as a decimal.
Percent Developed: Year 4 – The percentage of the polygon that is developed at build-out, entered as a decimal.
Apply – Accepts changes that were made in the interface and recalculates all demands and flows based on the updated values.
Close – Exits the user interface.
Selected Demand Area Consumption Properties – A summary of individual and total water resource needs for the selected polygon(s) which includes indoor, outdoor, and landscape demands and wastewater flows.
A.5. Update of Calibration of Demand Module In order to calibrate the Demand Module in 2008, existing conditions were verified in the existing polygons within the City’s current service area. City water meter locations were used to indicate the development status of each polygon within the City’s water service area. For each development that was completely built-out, 1.00 was entered into “PercentDevelopedYear1”. 0.00 was entered into areas where the City was not currently serving water, particularly in SPAs 2, 3, 4, 5, and 6. For residential areas partially developed (i.e. some water meters), the number of residential water meters in 2007 was divided by the development’s “LotCount” to determine the “PercentDevelopedYear1”. For non-residential areas partially-developed (Surprise Center), the total area of parcels with water meters was divided by the total area of the development. The extent of development for 2020, 2030, and build-out were not adjusted from the original estimated values unless “PercentDevelopedYear1” was already 1.00 (100 percent built-out). The development status for water service providers other than the City were kept as determined from the population data.
Once existing information had been entered for the polygons representing existing conditions, the Demand Module was run to determine existing water demands. According to historical data obtained from the City’s 2007 Monthly Operation Reports (obtained from EPCOR, formerlyAAWC), total production in 2007 was 7,605 AFY or 6.8 million gallons per day (mgd) in the City’s service area. In the same year, the Demand Module estimated demands to be 5.8 mgd, or approximately 85 percent of the existing demand. This variance was due to the landscape demand which, using the landscape use codes provided by the City, was only 15 percent of the total demand instead of 30 percent. For existing SPA 1 developments, the “PercentLandscape” was increased from 13.3 percent to 30 percent. When the Demand Module was run a second time, the total water demand was 6.9 mgd, or 102 percent of the existing water demand.
A-16
Appendix A
Water Resource Demand Module Demand Module calibration was only performed for water demands within the City’s water service area. Because no information could be obtained from other private water company service areas, additional calibrations could not be performed.
In the current Water Resources component update, historical water production was updated to 2013 (refer to Section 5 of update report). The update indicated that the total water production in 2013 was approximately 6.7 mgd. The updated Demand Module projects a 2013 total water demand of 6.9 mgd, or 103 percent of the existing production. For purposes of long range planning, the Demand Module is considered calibrated for projecting water demands.
City of Surprise, Arizona Integrated Water Master Plan: Water Resources Update 04957020.0003
A-17

THIS PAGE INTENTIONALLY LEFT BLANK
B. High Level Recharge Technology Cost Evaluation
In order to assess the viability of the recharge options, a high-level evaluation was performed for recharge and recovery of a specific volume of reclaimed water. Recharge followed by recovery was considered for each recharge technology. When using various recharge and recovery technologies, two types of treatment may be needed. The first treatment refers to treatment of reclaimed water prior to recharge such that the recharged water meets the water quality standards of the aquifer. This is particularly important in vadose zone, ASR, and deep well injection. The second type of treatment is treating the recovered water prior to delivery. It was assumed that recovery for the surface recharge, vadose zone injection, and deep injection would be via potable production wells that would need treatment for arsenic, including brine disposal. However, because water recovered from ASR wells can only be used for non-potable purposes, additional treatment of the recovered water is not needed.
The review of the recharge technologies reveal that recharge facility design, operation, and the need for additional reclaimed water treatment are highly dependent on local hydrogeology, groundwater quality, and reclaimed water quality conditions, and are normally not determined until site-specific studies are completed. To bracket the possible range of costs, two high level evaluations were completed. The initial evaluation considered no additional reclaimed water treatment while the second evaluation considered additional treatment to meet aquifer water quality standards necessary for sub-surface injection (vadose zone, deep injection, and ASR).
The scope of the current Water Resources component update did not include updating the information in this Appendix B. Thus, the reader is advised that the information presented was current as of November 2008.
City of Surprise, Arizona Integrated Water Master Plan: Water Resources Update 04957020.0003
B-1
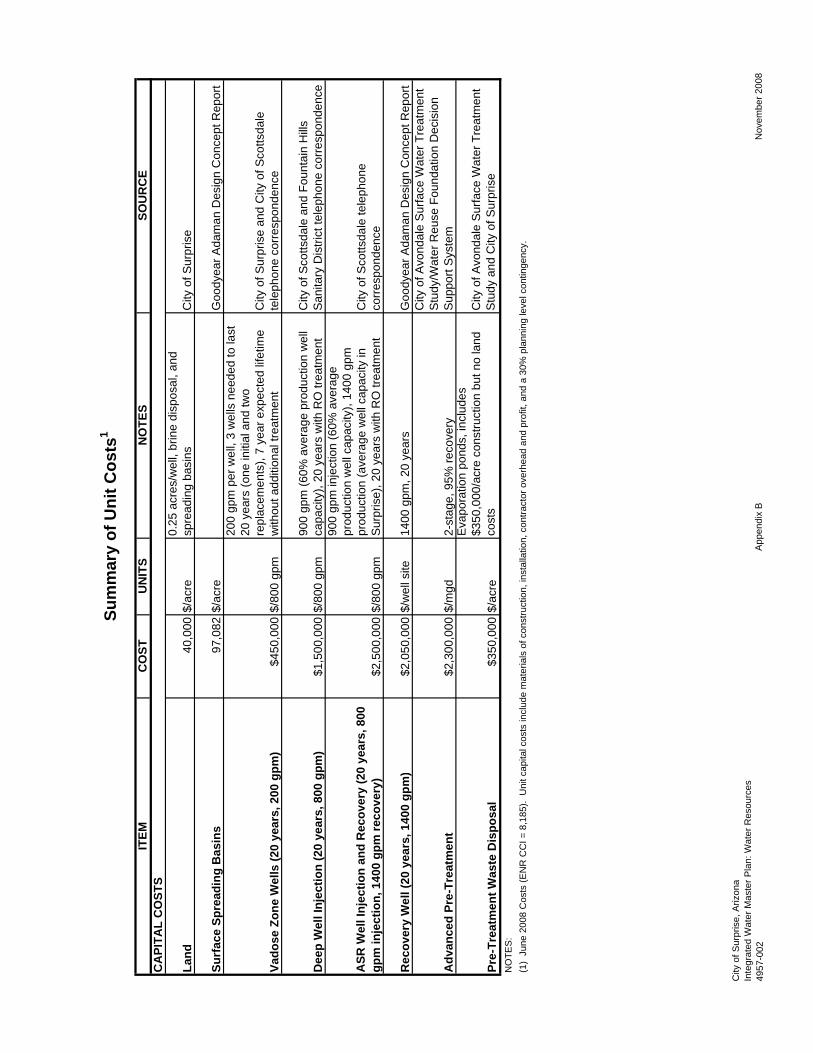
ITEM
CO
STU
NIT
SN
OTE
SSO
UR
CE
Land
40,0
00$/
acre
0.25
acr
es/w
ell,
brin
e di
spos
al, a
nd
spre
adin
g ba
sins
City
of S
urpr
ise
Surf
ace
Spre
adin
g B
asin
s97
,082
$/ac
reG
oody
ear A
dam
an D
esig
n C
once
pt R
epor
t
Vado
se Z
one
Wel
ls (2
0 ye
ars,
200
gpm
)$4
50,0
00$/
800
gpm
200
gpm
per
wel
l, 3
wel
ls n
eede
d to
last
20
yea
rs (o
ne in
itial
and
two
repl
acem
ents
), 7
year
exp
ecte
d lif
etim
e w
ithou
t add
ition
al tr
eatm
ent
City
of S
urpr
ise
and
City
of S
cotts
dale
te
leph
one
corr
espo
nden
ce
Dee
p W
ell I
njec
tion
(20
year
s, 8
00 g
pm)
$1,5
00,0
00$/
800
gpm
900
gpm
(60%
ave
rage
pro
duct
ion
wel
l ca
paci
ty),
20 y
ears
with
RO
trea
tmen
tC
ity o
f Sco
ttsda
le a
nd F
ount
ain
Hill
s S
anita
ry D
istri
ct te
leph
one
corr
espo
nden
ce
ASR
Wel
l Inj
ectio
n an
d R
ecov
ery
(20
year
s, 8
00
gpm
inje
ctio
n, 1
400
gpm
reco
very
)$2
,500
,000
$/80
0 gp
m
900
gpm
inje
ctio
n (6
0% a
vera
ge
prod
uctio
n w
ell c
apac
ity),
1400
gpm
pr
oduc
tion
(ave
rage
wel
l cap
acity
in
Sur
pris
e), 2
0 ye
ars
with
RO
trea
tmen
tC
ity o
f Sco
ttsda
le te
leph
one
corr
espo
nden
ce
Rec
over
y W
ell (
20 y
ears
, 140
0 gp
m)
$2,0
50,0
00$/
wel
l site
1400
gpm
, 20
year
sG
oody
ear A
dam
an D
esig
n C
once
pt R
epor
t
Adv
ance
d Pr
e-Tr
eatm
ent
$2,3
00,0
00$/
mgd
2-st
age,
95%
reco
very
City
of A
vond
ale
Sur
face
Wat
er T
reat
men
t S
tudy
/Wat
er R
euse
Fou
ndat
ion
Dec
isio
n S
uppo
rt S
yste
m
Pre-
Trea
tmen
t Was
te D
ispo
sal
$350
,000
$/ac
re
Eva
pora
tion
pond
s, in
clud
es
$350
,000
/acr
e co
nstru
ctio
n bu
t no
land
co
sts
City
of A
vond
ale
Sur
face
Wat
er T
reat
men
t S
tudy
and
City
of S
urpr
ise
(1)
June
200
8 C
osts
(EN
R C
CI =
8,1
85).
Uni
t cap
ital c
osts
incl
ude
mat
eria
ls o
f con
stru
ctio
n, in
stal
latio
n, c
ontra
ctor
ove
rhea
d an
d pr
ofit,
and
a 3
0% p
lann
ing
leve
l con
tinge
ncy.
Sum
mar
y of
Uni
t Cos
ts1
NO
TES
:
CA
PITA
L C
OST
S
City
of S
urpr
ise,
Ariz
ona
Inte
grat
ed W
ater
Mas
ter P
lan:
Wat
er R
esou
rces
4957
-002
App
endi
x B
Nov
embe
r 200
8
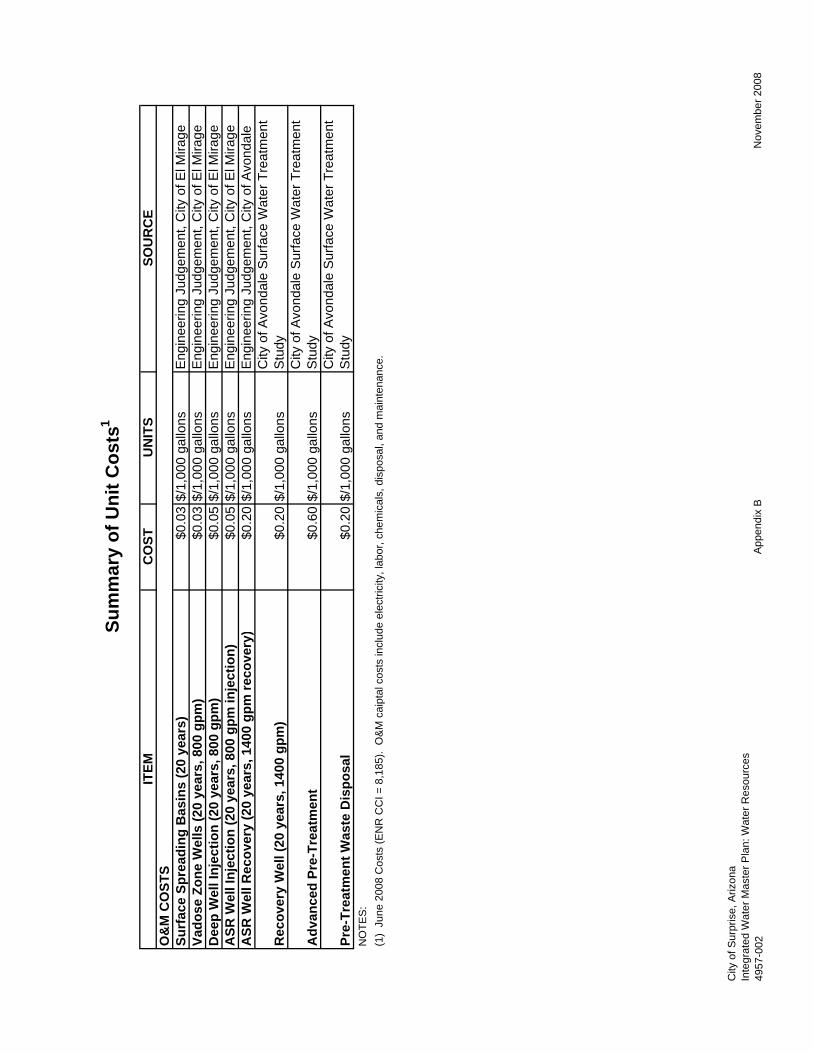
ITEM
CO
STU
NIT
SSO
UR
CE
Surf
ace
Spre
adin
g B
asin
s (2
0 ye
ars)
$0.0
3$/
1,00
0 ga
llons
Eng
inee
ring
Judg
emen
t, C
ity o
f El M
irag e
Vado
se Z
one
Wel
ls (2
0 ye
ars,
800
gpm
)$0
.03
$/1,
000
gallo
nsE
ngin
eerin
g Ju
dgem
ent,
City
of E
l Mira
g eD
eep
Wel
l Inj
ectio
n (2
0 ye
ars,
800
gpm
)$0
.05
$/1,
000
gallo
nsE
ngin
eerin
g Ju
dgem
ent,
City
of E
l Mira
g eA
SR W
ell I
njec
tion
(20
year
s, 8
00 g
pm in
ject
ion)
$0.0
5$/
1,00
0 ga
llons
Eng
inee
ring
Judg
emen
t, C
ity o
f El M
irag e
ASR
Wel
l Rec
over
y (2
0 ye
ars,
140
0 gp
m re
cove
ry)
$0.2
0$/
1,00
0 ga
llons
Eng
inee
ring
Judg
emen
t, C
ity o
f Avo
ndal
e
Rec
over
y W
ell (
20 y
ears
, 140
0 gp
m)
$0.2
0$/
1,00
0 ga
llons
City
of A
vond
ale
Sur
face
Wat
er T
reat
men
t S
tudy
Adv
ance
d Pr
e-Tr
eatm
ent
$0.6
0$/
1,00
0 ga
llons
City
of A
vond
ale
Sur
face
Wat
er T
reat
men
t S
tudy
Pre-
Trea
tmen
t Was
te D
ispo
sal
$0.2
0$/
1,00
0 ga
llons
City
of A
vond
ale
Sur
face
Wat
er T
reat
men
t S
tudy
(1)
June
200
8 C
osts
(EN
R C
CI =
8,1
85).
O&
M c
aipt
al c
osts
incl
ude
elec
trici
ty, l
abor
, che
mic
als,
dis
posa
l, an
d m
aint
enan
ce.
Sum
mar
y of
Uni
t Cos
ts1
NO
TES
:
O&
M C
OST
S
City
of S
urpr
ise,
Ariz
ona
Inte
grat
ed W
ater
Mas
ter P
lan:
Wat
er R
esou
rces
4957
-002
App
endi
x B
Nov
embe
r 200
8
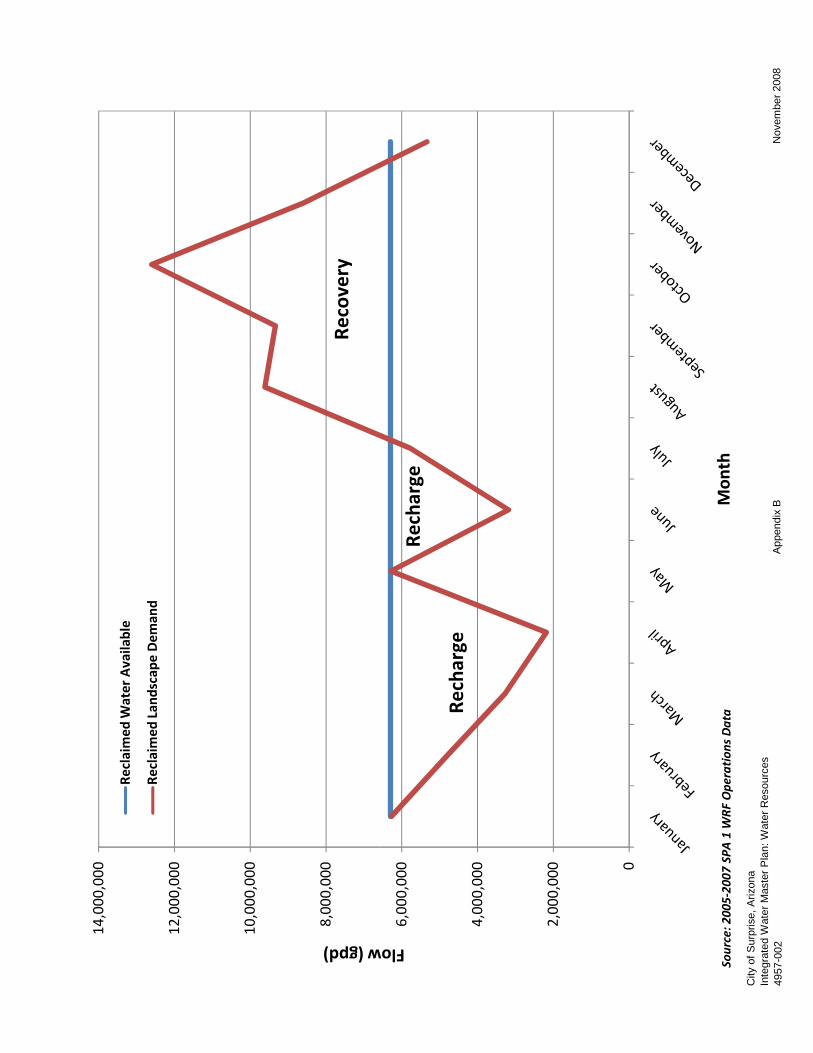
8,00
0,00
0
10,000
,000
12,000
,000
14,000
,000
w (gpd)Re
claimed
Water Available
Reclaimed
Lan
dscape
Dem
and
Recovery
City
of S
urpr
ise,
Ariz
ona
Inte
grat
ed W
ater
Mas
ter P
lan:
Wat
er R
esou
rces
4957
-002
App
endi
x B
Nov
embe
r 200
8
0
2,00
0,00
0
4,00
0,00
0
6,00
0,00
0
Flow
Mon
th
Recharge
Recharge
Source: 2005‐2007
SPA
1 WRF
Ope
ration
s Data

ITEM
QU
AN
TITY
UN
ITS
UN
IT C
OST
CO
ST2
Land
14.8
acre
s40
,000
$
593,
665
$
Spre
adin
g B
asin
s14
acre
s97
,082
$
1,34
3,77
3$
Vado
se Z
one
Wel
ls0
wel
l site
s45
0,00
0$
-
$
Dee
p In
ject
ion
Wel
ls0
wel
ls1,
500,
000
$
-
$
ASR
Wel
ls0
wel
ls2,
500,
000
$
-
$
Rec
over
y W
ells
4w
ells
2,05
0,00
0$
8,20
0,00
0$
Adv
ance
d Pr
e-Tr
eatm
ent
0m
gd2,
300,
000
$
-
$
Adv
ance
d Pr
e-Tr
eatm
ent W
aste
Dis
posa
l0
acre
s35
0,00
0$
-
$
TOTA
L C
API
TAL
CO
ST10
,137
,438
$
Spre
adin
g B
asin
s40
5,97
71,
000
gallo
ns0.
03$
13
,347
$
Va
dose
Zon
e W
ells
01,
000
gallo
ns0.
03$
-
$
Dee
p In
ject
ion
Wel
ls0
1,00
0 ga
llons
0.05
$
-$
A
SR W
ells
Inje
ctio
n0
1,00
0 ga
llons
0.05
$
-$
R
ecov
ery
01,
000
gallo
ns0.
20$
-
$
Rec
over
y W
ells
455,
918
1,00
0 ga
llons
0.20
$
91,1
84$
Adv
ance
d Pr
e-Tr
eatm
ent
01,
000
gallo
ns0.
60$
-
$
Adv
ance
d Pr
e-Tr
eatm
ent W
aste
Dis
posa
l0
1,00
0 ga
llons
0.20
$
-$
TO
TAL
O&
M C
OST
104,
531
$
NET
PR
ESEN
T W
OR
TH3
11,2
44,8
37$
$/
AF
46$
NO
TES
:
(3) 2
0 Y
ears
, 7 P
erce
nt In
tere
st.
Surf
ace
Spre
adin
g B
asin
s (N
o Tr
eatm
ent)
1
CA
PITA
L C
OST
S
O&
M C
OST
S
(1) A
naly
sis
base
d on
6.3
mgd
recl
aim
ed w
ater
ava
ilabl
e an
d 6.
3 m
gd la
ndsc
ape
dem
and,
whi
ch re
sults
in 4
.1 m
gd re
char
ge c
apac
ity a
nd 6
.3 m
gd
addi
tiona
l pro
duct
ion
capa
city
. A
naly
sis
does
not
incl
ude
pota
ble
wat
er c
ompo
nent
s, d
istri
butio
n sy
stem
infra
stru
ctur
e, re
clai
med
sys
tem
in
frast
ruct
ure,
or p
ipin
g.(2
) Jun
e 20
08 C
osts
(EN
R C
CI =
8,1
85).
City
of S
urpr
ise,
Ariz
ona
Inte
grat
ed W
ater
Mas
ter P
lan:
Wat
er R
esou
rces
4957
-002
App
endi
x B
Nov
embe
r 200
8
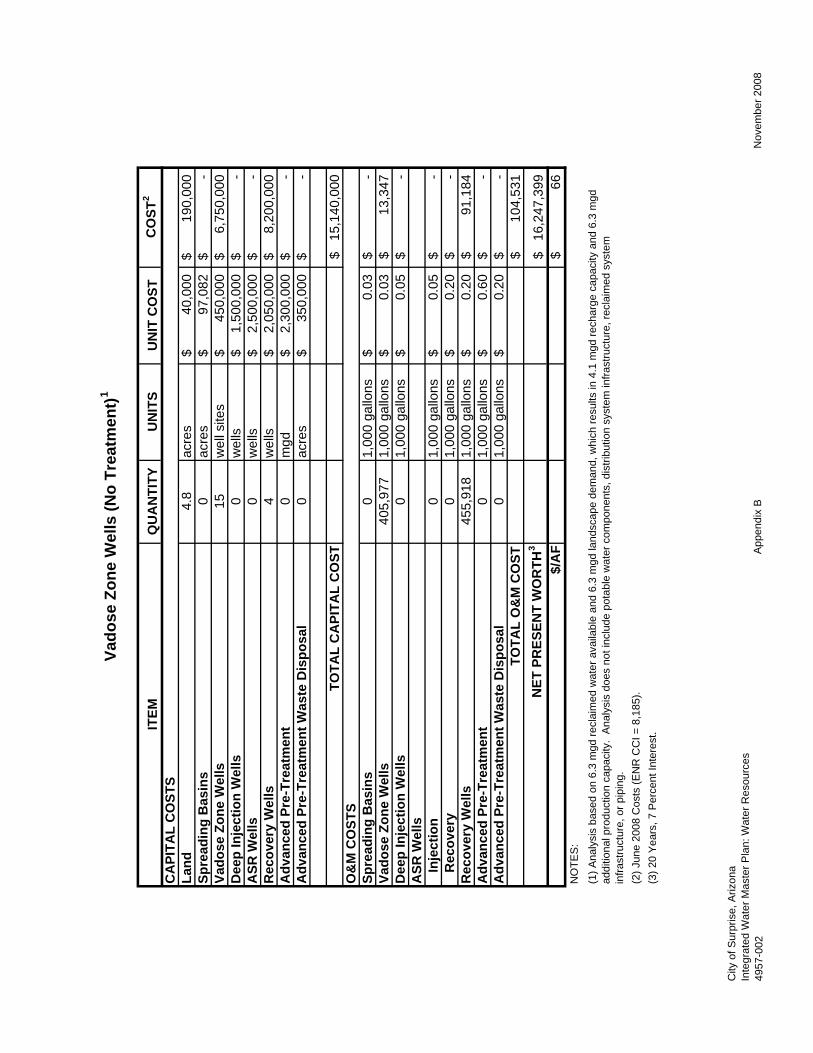
ITEM
QU
AN
TITY
UN
ITS
UN
IT C
OST
CO
ST2
Land
4.8
acre
s40
,000
$
190,
000
$
Spre
adin
g B
asin
s0
acre
s97
,082
$
-$
Va
dose
Zon
e W
ells
15w
ell s
ites
450,
000
$
6,75
0,00
0$
Dee
p In
ject
ion
Wel
ls0
wel
ls1,
500,
000
$
-
$
ASR
Wel
ls0
wel
ls2,
500,
000
$
-
$
Rec
over
y W
ells
4w
ells
2,05
0,00
0$
8,20
0,00
0$
Adv
ance
d Pr
e-Tr
eatm
ent
0m
gd2,
300,
000
$
-
$
Adv
ance
d Pr
e-Tr
eatm
ent W
aste
Dis
posa
l0
acre
s35
0,00
0$
-
$
TOTA
L C
API
TAL
CO
ST15
,140
,000
$
Spre
adin
g B
asin
s0
1,00
0 ga
llons
0.03
$
-$
Va
dose
Zon
e W
ells
405,
977
1,00
0 ga
llons
0.03
$
13,3
47$
Dee
p In
ject
ion
Wel
ls0
1,00
0 ga
llons
0.05
$
-$
A
SR W
ells
Inje
ctio
n0
1,00
0 ga
llons
0.05
$
-$
R
ecov
ery
01,
000
gallo
ns0.
20$
-
$
Rec
over
y W
ells
455,
918
1,00
0 ga
llons
0.20
$
91,1
84$
Adv
ance
d Pr
e-Tr
eatm
ent
01,
000
gallo
ns0.
60$
-
$
Adv
ance
d Pr
e-Tr
eatm
ent W
aste
Dis
posa
l0
1,00
0 ga
llons
0.20
$
-$
TO
TAL
O&
M C
OST
104,
531
$
NET
PR
ESEN
T W
OR
TH3
16,2
47,3
99$
$/
AF
66$
NO
TES
:
(2) J
une
2008
Cos
ts (E
NR
CC
I = 8
,185
).(3
) 20
Yea
rs, 7
Per
cent
Inte
rest
.
Vado
se Z
one
Wel
ls (N
o Tr
eatm
ent)
1
CA
PITA
L C
OST
S
O&
M C
OST
S
(1) A
naly
sis
base
d on
6.3
mgd
recl
aim
ed w
ater
ava
ilabl
e an
d 6.
3 m
gd la
ndsc
ape
dem
and,
whi
ch re
sults
in 4
.1 m
gd re
char
ge c
apac
ity a
nd 6
.3 m
gd
addi
tiona
l pro
duct
ion
capa
city
. A
naly
sis
does
not
incl
ude
pota
ble
wat
er c
ompo
nent
s, d
istri
butio
n sy
stem
infra
stru
ctur
e, re
clai
med
sys
tem
in
frast
ruct
ure,
or p
ipin
g.
City
of S
urpr
ise,
Ariz
ona
Inte
grat
ed W
ater
Mas
ter P
lan:
Wat
er R
esou
rces
4957
-002
App
endi
x B
Nov
embe
r 200
8

ITEM
QU
AN
TITY
UN
ITS
UN
IT C
OST
CO
ST2
Land
43.1
acre
s40
,000
$
1,72
3,91
9$
Spre
adin
g B
asin
s0
acre
s97
,082
$
-$
Va
dose
Zon
e W
ells
15w
ell s
ites
450,
000
$
6,75
0,00
0$
Dee
p In
ject
ion
Wel
ls0
wel
ls1,
500,
000
$
-
$
ASR
Wel
ls0
wel
ls2,
500,
000
$
-
$
Rec
over
y W
ells
4w
ells
2,05
0,00
0$
8,20
0,00
0$
Adv
ance
d Pr
e-Tr
eatm
ent
4.1
mgd
2,30
0,00
0$
9,43
0,00
0$
Adv
ance
d Pr
e-Tr
eatm
ent W
aste
Dis
posa
l38
acre
s35
0,00
0$
13
,421
,790
$
TOTA
L C
API
TAL
CO
ST39
,525
,709
$
Spre
adin
g B
asin
s0
1,00
0 ga
llons
0.03
$
-$
Va
dose
Zon
e W
ells
405,
977
1,00
0 ga
llons
0.03
$
13,3
47$
Dee
p In
ject
ion
Wel
ls0
1,00
0 ga
llons
0.05
$
-$
A
SR W
ells
Inje
ctio
n0
1,00
0 ga
llons
0.05
$
-$
R
ecov
ery
01,
000
gallo
ns0.
20$
-
$
Rec
over
y W
ells
455,
918
1,00
0 ga
llons
0.20
$
91,1
84$
Adv
ance
d Pr
e-Tr
eatm
ent
405,
977
1,00
0 ga
llons
0.60
$
243,
586
$
Adv
ance
d Pr
e-Tr
eatm
ent W
aste
Dis
posa
l40
5,97
71,
000
gallo
ns0.
20$
81
,195
$
TO
TAL
O&
M C
OST
429,
312
$
NET
PR
ESEN
T W
OR
TH3
44,0
73,8
44$
$/
AF
179
$
NO
TES
:
(3) 2
0 Y
ears
, 7 P
erce
nt In
tere
st.
Vado
se Z
one
Wel
ls w
ith T
reat
men
t1
CA
PITA
L C
OST
S
O&
M C
OST
S
(1) A
naly
sis
base
d on
6.3
mgd
recl
aim
ed w
ater
ava
ilabl
e an
d 6.
3 m
gd la
ndsc
ape
dem
and,
whi
ch re
sults
in 4
.1 m
gd re
char
ge c
apac
ity a
nd 6
.3 m
gd
addi
tiona
l pro
duct
ion
capa
city
. A
naly
sis
does
not
incl
ude
pota
ble
wat
er c
ompo
nent
s, d
istri
butio
n sy
stem
infra
stru
ctur
e, re
clai
med
sys
tem
in
frast
ruct
ure,
or p
ipin
g.(2
) Jun
e 20
08 C
osts
(EN
R C
CI =
8,1
85).
City
of S
urpr
ise,
Ariz
ona
Inte
grat
ed W
ater
Mas
ter P
lan:
Wat
er R
esou
rces
4957
-002
App
endi
x B
Nov
embe
r 200
8

ITEM
QU
AN
TITY
UN
ITS
UN
IT C
OST
CO
ST2
Land
2.0
acre
s40
,000
$
80,0
00$
Spre
adin
g B
asin
s0
acre
s97
,082
$
-$
Va
dose
Zon
e W
ells
0w
ells
450,
000
$
-$
D
eep
Inje
ctio
n W
ells
4w
ells
1,50
0,00
0$
6,00
0,00
0$
ASR
Wel
ls0
wel
ls2,
500,
000
$
-
$
Rec
over
y W
ells
4w
ells
2,05
0,00
0$
8,20
0,00
0$
Adv
ance
d Pr
e-Tr
eatm
ent
0m
gd2,
300,
000
$
-
$
Adv
ance
d Pr
e-Tr
eatm
ent W
aste
Dis
posa
l0
acre
s35
0,00
0$
-
$
TOTA
L C
API
TAL
CO
ST14
,280
,000
$
Spre
adin
g B
asin
s0
1,00
0 ga
llons
0.03
$
-$
Va
dose
Zon
e W
ells
01,
000
gallo
ns0.
03$
-
$
Dee
p In
ject
ion
Wel
ls40
5,97
71,
000
gallo
ns0.
05$
20
,299
$
A
SR W
ells
Inje
ctio
n0
1,00
0 ga
llons
0.05
$
-$
R
ecov
ery
01,
000
gallo
ns0.
20$
-
$
Rec
over
y W
ells
455,
918
1,00
0 ga
llons
0.20
$
91,1
84$
Adv
ance
d Pr
e-Tr
eatm
ent
01,
000
gallo
ns0.
60$
-
$
Adv
ance
d Pr
e-Tr
eatm
ent W
aste
Dis
posa
l0
1,00
0 ga
llons
0.20
$
-$
TO
TAL
O&
M C
OST
111,
482
$
NET
PR
ESEN
T W
OR
TH3
15,4
61,0
45$
$/
AF
63$
NO
TES
:
(3) 2
0 Y
ears
, 7 P
erce
nt In
tere
st.
(1) A
naly
sis
base
d on
6.3
mgd
recl
aim
ed w
ater
ava
ilabl
e an
d 6.
3 m
gd la
ndsc
ape
dem
and,
whi
ch re
sults
in 4
.1 m
gd re
char
ge c
apac
ity a
nd 6
.3 m
gd
addi
tiona
l pro
duct
ion
capa
city
. A
naly
sis
does
not
incl
ude
pota
ble
wat
er c
ompo
nent
s, d
istri
butio
n sy
stem
infra
stru
ctur
e, re
clai
med
sys
tem
in
frast
ruct
ure,
or p
ipin
g.(2
) Jun
e 20
08 C
osts
(EN
R C
CI =
8,1
85).
O&
M C
OST
S
Dee
p In
ject
ion
Wel
ls (N
o Tr
eatm
ent)1
CA
PITA
L C
OST
S
City
of S
urpr
ise,
Ariz
ona
Inte
grat
ed W
ater
Mas
ter P
lan:
Wat
er R
esou
rces
4957
-002
App
endi
x B
Nov
embe
r 200
8

ITEM
QU
AN
TITY
UN
ITS
UN
IT C
OST
CO
ST2
Land
40.3
acre
s40
,000
$
1,61
3,91
9$
Spre
adin
g B
asin
s0
acre
s97
,082
$
-$
Va
dose
Zon
e W
ells
0w
ells
450,
000
$
-$
D
eep
Inje
ctio
n W
ells
4w
ells
1,50
0,00
0$
6,00
0,00
0$
ASR
Wel
ls0
wel
ls2,
500,
000
$
-
$
Rec
over
y W
ells
4w
ells
2,05
0,00
0$
8,20
0,00
0$
Adv
ance
d Pr
e-Tr
eatm
ent
4.1
mgd
2,30
0,00
0$
9,43
0,00
0$
Adv
ance
d Pr
e-Tr
eatm
ent W
aste
Dis
posa
l38
acre
s35
0,00
0$
13
,421
,790
$
TOTA
L C
API
TAL
CO
ST38
,665
,709
$
Spre
adin
g B
asin
s0
1,00
0 ga
llons
0.03
$
-$
Va
dose
Zon
e W
ells
01,
000
gallo
ns0.
03$
-
$
Dee
p In
ject
ion
Wel
ls40
5,97
71,
000
gallo
ns0.
05$
20
,299
$
A
SR W
ells
Inje
ctio
n0
1,00
0 ga
llons
0.05
$
-$
R
ecov
ery
01,
000
gallo
ns0.
20$
-
$
Rec
over
y W
ells
455,
918
1,00
0 ga
llons
0.20
$
91,1
84$
Adv
ance
d Pr
e-Tr
eatm
ent
405,
977
1,00
0 ga
llons
0.60
$
243,
586
$
Adv
ance
d Pr
e-Tr
eatm
ent W
aste
Dis
posa
l40
5,97
71,
000
gallo
ns0.
20$
81
,195
$
TO
TAL
O&
M C
OST
436,
264
$
NET
PR
ESEN
T W
OR
TH3
43,2
87,4
90$
$/
AF
176
$
NO
TES
:
(3) 2
0 Y
ears
, 7 P
erce
nt In
tere
st.
Dee
p In
ject
ion
Wel
ls w
ith T
reat
men
t1
CA
PITA
L C
OST
S
O&
M C
OST
S
(1) A
naly
sis
base
d on
6.3
mgd
recl
aim
ed w
ater
ava
ilabl
e an
d 6.
3 m
gd la
ndsc
ape
dem
and,
whi
ch re
sults
in 4
.1 m
gd re
char
ge c
apac
ity a
nd 6
.3 m
gd
addi
tiona
l pro
duct
ion
capa
city
. A
naly
sis
does
not
incl
ude
pota
ble
wat
er c
ompo
nent
s, d
istri
butio
n sy
stem
infra
stru
ctur
e, re
clai
med
sys
tem
in
frast
ruct
ure,
or p
ipin
g.(2
) Jun
e 20
08 C
osts
(EN
R C
CI =
8,1
85).
City
of S
urpr
ise,
Ariz
ona
Inte
grat
ed W
ater
Mas
ter P
lan:
Wat
er R
esou
rces
4957
-002
App
endi
x B
Nov
embe
r 200
8

ITEM
QU
AN
TITY
UN
ITS
UN
IT C
OST
CO
ST2
Land
1.0
acre
s40
,000
$
40,0
00$
Spre
adin
g B
asin
s0
acre
s97
,082
$
-$
Va
dose
Zon
e W
ells
0w
ells
450,
000
$
-$
D
eep
Inje
ctio
n W
ells
0w
ells
1,50
0,00
0$
-$
A
SR W
ells
4w
ells
2,50
0,00
0$
10,0
00,0
00$
R
ecov
ery
Wel
ls0
wel
ls2,
050,
000
$
-
$
Adv
ance
d Pr
e-Tr
eatm
ent
0m
gd2,
300,
000
$
-
$
Adv
ance
d Pr
e-Tr
eatm
ent W
aste
Dis
posa
l0
acre
s35
0,00
0$
-
$
TOTA
L C
API
TAL
CO
ST10
,040
,000
$
Spre
adin
g B
asin
s0
1,00
0 ga
llons
0.03
$
-$
Va
dose
Zon
e W
ells
01,
000
gallo
ns0.
03$
-
$
Dee
p In
ject
ion
Wel
ls0
1,00
0 ga
llons
0.05
$
-$
A
SR W
ells
Inje
ctio
n40
5,97
71,
000
gallo
ns0.
05$
20
,299
$
R
ecov
ery
455,
918
1,00
0 ga
llons
0.20
$
91,1
84$
Rec
over
y W
ells
01,
000
gallo
ns0.
20$
-
$
Adv
ance
d Pr
e-Tr
eatm
ent
01,
000
gallo
ns0.
60$
-
$
Adv
ance
d Pr
e-Tr
eatm
ent W
aste
Dis
posa
l0
1,00
0 ga
llons
0.20
$
-$
TO
TAL
O&
M C
OST
111,
482
$
NET
PR
ESEN
T W
OR
TH3
11,2
21,0
45$
$/
AF
46$
NO
TES
:
(3) 2
0 Y
ears
, 7 P
erce
nt In
tere
st.
(1) A
naly
sis
base
d on
6.3
mgd
recl
aim
ed w
ater
ava
ilabl
e an
d 6.
3 m
gd la
ndsc
ape
dem
and,
whi
ch re
sults
in 4
.1 m
gd re
char
ge c
apac
ity a
nd 6
.3 m
gd
addi
tiona
l pro
duct
ion
capa
city
. A
naly
sis
does
not
incl
ude
pota
ble
wat
er c
ompo
nent
s, d
istri
butio
n sy
stem
infra
stru
ctur
e, re
clai
med
sys
tem
in
frast
ruct
ure,
or p
ipin
g.(2
) Jun
e 20
08 C
osts
(EN
R C
CI =
8,1
85).
O&
M C
OST
S
ASR
Wel
ls (N
o Tr
eatm
ent)1
CA
PITA
L C
OST
S
City
of S
urpr
ise,
Ariz
ona
Inte
grat
ed W
ater
Mas
ter P
lan:
Wat
er R
esou
rces
4957
-002
App
endi
x B
Nov
embe
r 200
8

ITEM
QU
AN
TITY
UN
ITS
UN
IT C
OST
CO
ST2
Land
39.3
acre
s40
,000
$
1,57
3,91
9$
Spre
adin
g B
asin
s0
acre
s97
,082
$
-$
Va
dose
Zon
e W
ells
0w
ells
450,
000
$
-$
D
eep
Inje
ctio
n W
ells
0w
ells
1,50
0,00
0$
-$
A
SR W
ells
4w
ells
2,50
0,00
0$
10,0
00,0
00$
R
ecov
ery
Wel
ls0
wel
ls2,
050,
000
$
-
$
Adv
ance
d Pr
e-Tr
eatm
ent
4.1
mgd
2,30
0,00
0$
9,43
0,00
0$
Adv
ance
d Pr
e-Tr
eatm
ent W
aste
Dis
posa
l38
acre
s35
0,00
0$
13
,421
,790
$
TOTA
L C
API
TAL
CO
ST34
,425
,709
$
Spre
adin
g B
asin
s0
1,00
0 ga
llons
0.03
$
-$
Va
dose
Zon
e W
ells
01,
000
gallo
ns0.
03$
-
$
Dee
p In
ject
ion
Wel
ls0
1,00
0 ga
llons
0.05
$
-$
A
SR W
ells
Inje
ctio
n40
5,97
71,
000
gallo
ns0.
05$
20
,299
$
R
ecov
ery
455,
918
1,00
0 ga
llons
0.20
$
91,1
84$
Rec
over
y W
ells
01,
000
gallo
ns0.
20$
-
$
Adv
ance
d Pr
e-Tr
eatm
ent
405,
977
1,00
0 ga
llons
0.60
$
243,
586
$
Adv
ance
d Pr
e-Tr
eatm
ent W
aste
Dis
posa
l40
5,97
71,
000
gallo
ns0.
20$
81
,195
$
TO
TAL
O&
M C
OST
436,
264
$
NET
PR
ESEN
T W
OR
TH3
39,0
47,4
90$
$/
AF
158
$
NO
TES
:
(3) 2
0 Y
ears
, 7 P
erce
nt In
tere
st.
ASR
Wel
ls w
ith T
reat
men
t1
CA
PITA
L C
OST
S
O&
M C
OST
S
(1) A
naly
sis
base
d on
6.3
mgd
recl
aim
ed w
ater
ava
ilabl
e an
d 6.
3 m
gd la
ndsc
ape
dem
and,
whi
ch re
sults
in 4
.1 m
gd re
char
ge c
apac
ity a
nd 6
.3 m
gd
addi
tiona
l pro
duct
ion
capa
city
. A
naly
sis
does
not
incl
ude
pota
ble
wat
er c
ompo
nent
s, d
istri
butio
n sy
stem
infra
stru
ctur
e, re
clai
med
sys
tem
in
frast
ruct
ure,
or p
ipin
g.(2
) Jun
e 20
08 C
osts
(EN
R C
CI =
8,1
85).
City
of S
urpr
ise,
Ariz
ona
Inte
grat
ed W
ater
Mas
ter P
lan:
Wat
er R
esou
rces
4957
-002
App
endi
x B
Nov
embe
r 200
8

Surf
ace
Spre
adin
g B
asin
s
Vado
se Z
one
Inje
ctio
n W
ells
w
ithou
t Tr
eatm
ent
Vado
se Z
one
Inje
ctio
n W
ells
w
ith T
reat
men
t
Dee
p W
ell
Inje
ctio
n w
ithou
t Tr
eatm
ent
Dee
p In
ject
ion
Wel
ls w
ith
Trea
tmen
t
ASR
Wel
ls
with
out
Trea
tmen
t
ASR
Wel
ls w
ith
Trea
tmen
t
Land
593,
665
$
19
0,00
0$
1,72
3,91
9$
80
,000
$
1,61
3,91
9$
40
,000
$
1,57
3,91
9$
Spr
eadi
ng B
asin
s1,
343,
773
$
-$
-$
-$
-$
-$
-$
V
ados
e Zo
ne W
ells
-$
6,75
0,00
0$
6,
750,
000
$
-$
-$
-$
-$
D
eep
Inje
ctio
n W
ells
-$
-$
-$
6,00
0,00
0$
6,
000,
000
$
-$
-$
A
SR
Wel
ls-
$
-
$
-
$
-
$
-
$
10
,000
,000
$
10,0
00,0
00$
R
ecov
ery
Wel
ls8,
200,
000
$
8,20
0,00
0$
8,
200,
000
$
8,20
0,00
0$
8,
200,
000
$
-$
-$
A
dvan
ced
Pre
-Tre
atm
ent
-$
-$
9,43
0,00
0$
-
$
9,
430,
000
$
-$
9,43
0,00
0$
Adv
ance
d P
re-T
reat
men
t Was
te
Dis
posa
l $
- $
- $
13,
421,
790
$
-
$
1
3,42
1,79
0 $
- $
13
,421
,790
TO
TAL
CA
PITA
L C
OST
($)
10,1
37,4
38$
15
,140
,000
$
39,5
25,7
09$
14
,280
,000
$
38,6
65,7
09$
10
,040
,000
$
34,4
25,7
09$
Spr
eadi
ng B
asin
s13
,347
$
-$
-$
-$
-$
-$
-$
V
ados
e Zo
ne W
ells
-$
13,3
47$
13
,347
$
-$
-$
-$
-$
D
eep
Inje
ctio
n W
ells
-$
-$
-$
20,2
99$
20
,299
$
-$
-$
A
SR
Wel
ls-
$
-
$
-
$
-
$
-
$
11
1,48
2$
111,
482
$
Rec
over
y W
ells
91,1
84$
91
,184
$
91,1
84$
91
,184
$
91,1
84$
-
$
-
$
Adv
ance
d P
re-T
reat
men
t-
$
-
$
24
3,58
6$
-$
243,
586
$
-
$
24
3,58
6$
A
dvan
ced
Pre
-Tre
atm
ent W
aste
D
ispo
sal
-$
-$
81,1
95$
-
$
81
,195
$
-$
81,1
95$
TO
TAL
O&
M C
OST
($)
91,1
84$
10
4,53
1$
429,
312
$
11
1,48
2$
436,
264
$
11
1,48
2$
436,
264
$
PRES
ENT
WO
RTH
CO
ST ($
)11
,103
,437
$
16,2
47,3
99$
44
,073
,844
$
15,4
61,0
45$
43
,287
,490
$
11,2
21,0
45$
39
,047
,490
$
$/A
F45
$
66$
17
9$
63$
17
6$
46$
15
8$
Com
paris
on C
ost S
umm
ary
of In
ject
ion
Tech
nolo
gy A
ltern
ativ
es
Cap
ital
Ope
ratio
n an
d M
aint
enan
ce
Pres
ent V
alue
($)
City
of S
urpr
ise,
Ariz
ona
Inte
grat
ed W
ater
Mas
ter P
lan:
Wat
er R
esou
rces
4957
-002
App
endi
x B
Nov
embe
r 200
8
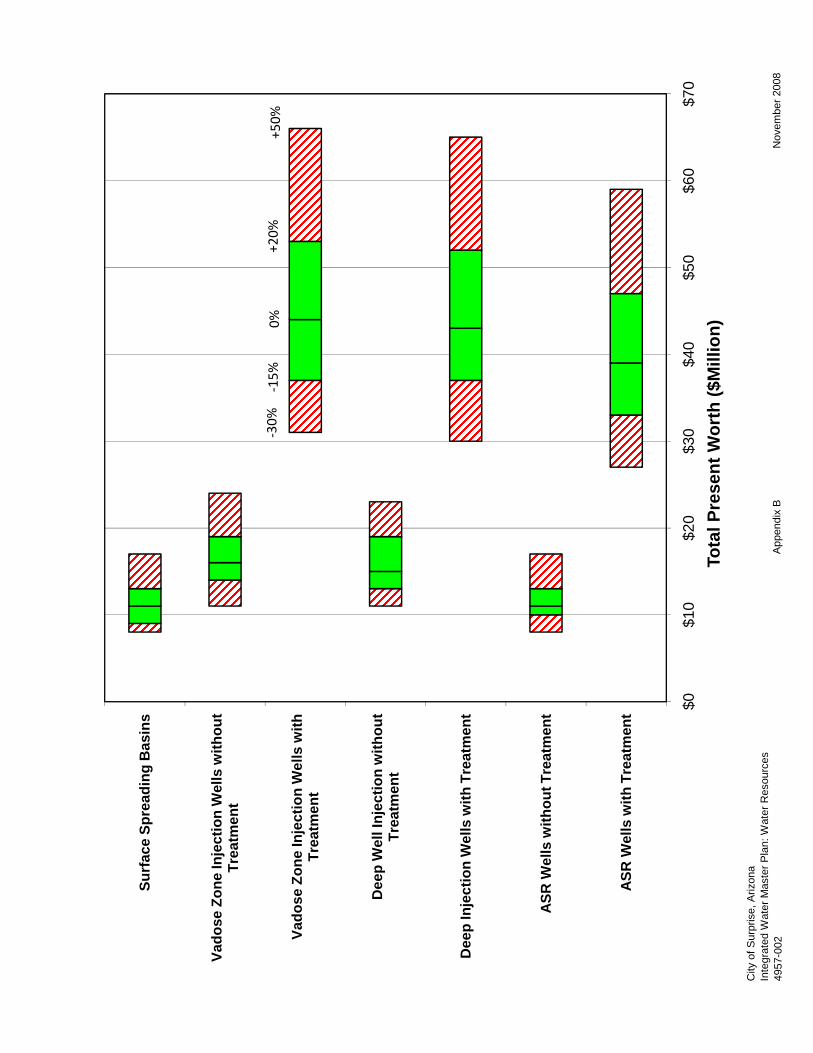
Dee
pW
ellI
njec
tion
with
out
Vado
se Z
one
Inje
ctio
n W
ells
with
Tr
eatm
ent
Vado
se Z
one
Inje
ctio
n W
ells
with
out
Trea
tmen
t
Surf
ace
Spre
adin
g B
asin
s
‐30%
‐15%
0%+20%
+50%
City
of S
urpr
ise,
Ariz
ona
Inte
grat
ed W
ater
Mas
ter P
lan:
Wat
er R
esou
rces
4957
-002
App
endi
x B
Nov
embe
r 200
8
$0$1
0$2
0$3
0$4
0$5
0$6
0$7
0
ASR
Wel
ls w
ith T
reat
men
t
ASR
Wel
ls w
ithou
t Tre
atm
ent
Dee
p In
ject
ion
Wel
ls w
ith T
reat
men
t
Dee
p W
ell I
njec
tion
with
out
Trea
tmen
t
Tota
l Pre
sent
Wor
th ($
Mill
ion)

THIS PAGE INTENTIONALLY LEFT BLANK
C. Potential Future Water Supply Opportunities
An objective of the Water Resources component update was to begin identifying additional water resources that can become part of a strategic water supply plan for the City. Thus, the work included updates to the City’s existing and potential future water supply portfolios. This Appendix C contains summaries of available water supplies that other agencies, entities and cities in Arizona are currently exploring. The summaries include potential availability, infrastructure and cost considerations, and priorities for City strategic planning.
Based on the assessment of potential future water supply opportunities, an Action Plan is recommended in Section 9 to begin closing the projected water supply/demand deficit at buildout. Since the projected supply deficits are substantial, it is recommended that the City begin implementing the Action Plan immediately.
City of Surprise, Arizona Integrated Water Master Plan: Water Resources Update 04957020.0003
C-1
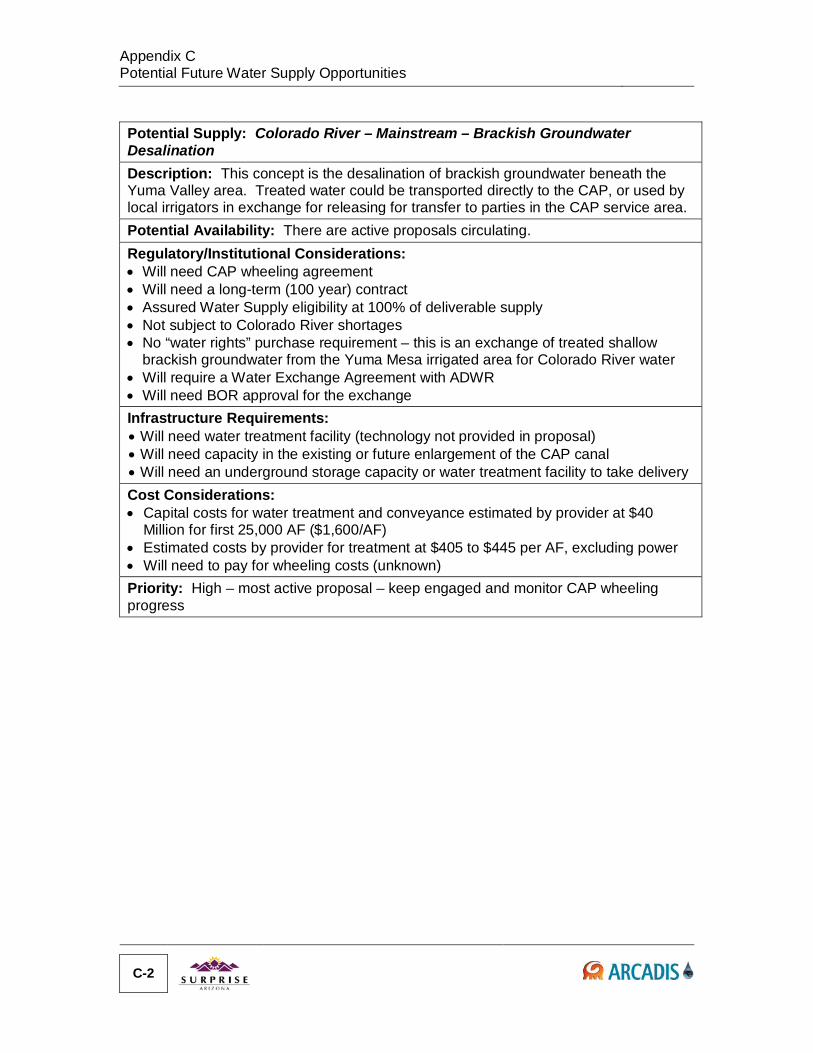
Appendix C Potential Future Water Supply Opportunities
Potential Supply: Colorado River – Mainstream – Brackish Groundwater Desalination Description: This concept is the desalination of brackish groundwater beneath the Yuma Valley area. Treated water could be transported directly to the CAP, or used by local irrigators in exchange for releasing for transfer to parties in the CAP service area. Potential Availability: There are active proposals circulating. Regulatory/Institutional Considerations: • Will need CAP wheeling agreement • Will need a long-term (100 year) contract • Assured Water Supply eligibility at 100% of deliverable supply • Not subject to Colorado River shortages • No “water rights” purchase requirement – this is an exchange of treated shallow
brackish groundwater from the Yuma Mesa irrigated area for Colorado River water • Will require a Water Exchange Agreement with ADWR • Will need BOR approval for the exchange Infrastructure Requirements: • Will need water treatment facility (technology not provided in proposal) • Will need capacity in the existing or future enlargement of the CAP canal • Will need an underground storage capacity or water treatment facility to take delivery Cost Considerations: • Capital costs for water treatment and conveyance estimated by provider at $40
Million for first 25,000 AF ($1,600/AF) • Estimated costs by provider for treatment at $405 to $445 per AF, excluding power • Will need to pay for wheeling costs (unknown) Priority: High – most active proposal – keep engaged and monitor CAP wheeling progress
C-2

Appendix C
Potential Future Water Supply Opportunities
Potential Supply: Colorado River – Mainstream – Priority 4 Mainstream Contract Water Description: This water is diverted from the main stem of the Colorado River pursuant to Entitlements based upon contracts between the US and water users in the State of Arizona entered into or established subsequent to September 30, 1968 up to 164,652 AFY, and a contract dated December 15, 1972 between the US and the CAWCD. The agricultural land would presumably be fallowed and the water transferred via the CAP canal. Land with these entitlements may have to be purchased in order to facilitate the transfer of this water. Potential Availability: Few known sellers Regulatory/Institutional Considerations: • Will need CAP wheeling agreement (institutional barrier) • Will probably need federal approval (institutional barrier) • Assured Water Supply eligibility at 100% of deliverable supply • Acquired contract is essentially a “permanent right” • Will required ADWR approval Infrastructure Requirements: • Will need capacity in the existing or future enlargement of the CAP canal • Will need an underground storage capacity or water treatment facility to take delivery Cost Considerations: • High acquisition cost of contract – generally anecdotal estimates at $4,000/AF (not
verifiable) Priority: Medium – keep informed through ADWR and CAWCD, and other cities
City of Surprise, Arizona Integrated Water Master Plan: Water Resources Update 04957020.0003
C-3
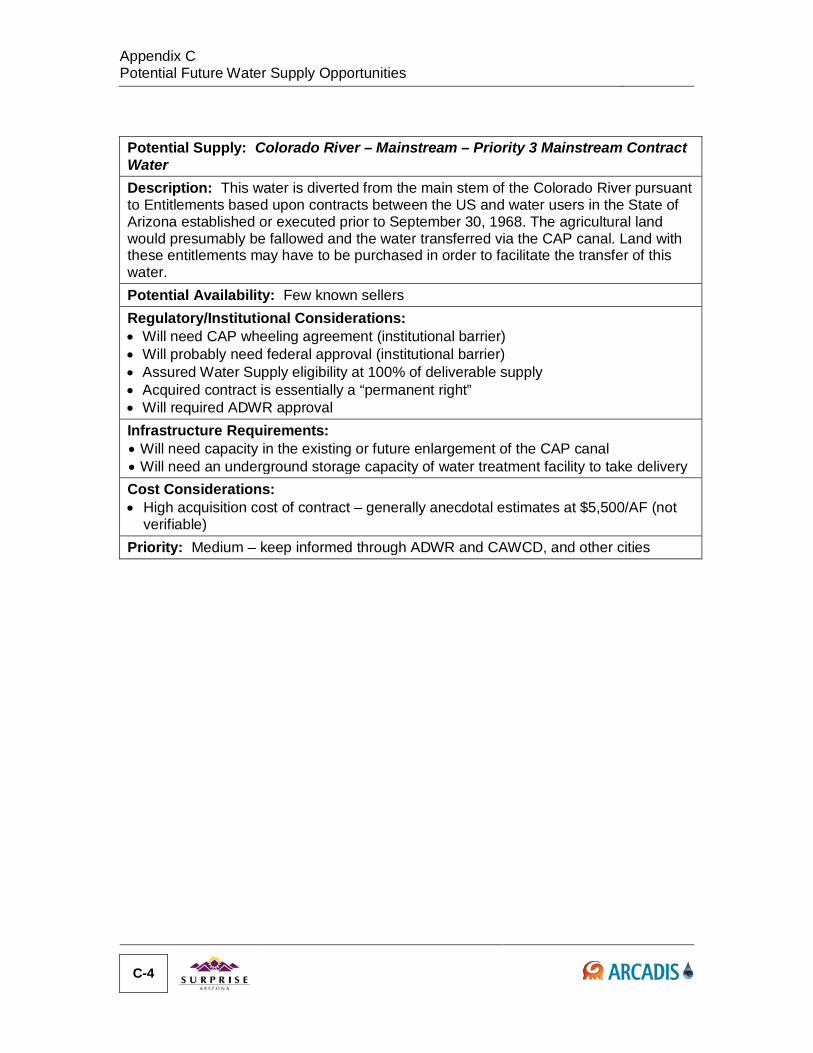
Appendix C Potential Future Water Supply Opportunities
Potential Supply: Colorado River – Mainstream – Priority 3 Mainstream Contract Water Description: This water is diverted from the main stem of the Colorado River pursuant to Entitlements based upon contracts between the US and water users in the State of Arizona established or executed prior to September 30, 1968. The agricultural land would presumably be fallowed and the water transferred via the CAP canal. Land with these entitlements may have to be purchased in order to facilitate the transfer of this water. Potential Availability: Few known sellers Regulatory/Institutional Considerations: • Will need CAP wheeling agreement (institutional barrier) • Will probably need federal approval (institutional barrier) • Assured Water Supply eligibility at 100% of deliverable supply • Acquired contract is essentially a “permanent right” • Will required ADWR approval Infrastructure Requirements: • Will need capacity in the existing or future enlargement of the CAP canal • Will need an underground storage capacity of water treatment facility to take delivery Cost Considerations: • High acquisition cost of contract – generally anecdotal estimates at $5,500/AF (not
verifiable) Priority: Medium – keep informed through ADWR and CAWCD, and other cities
C-4
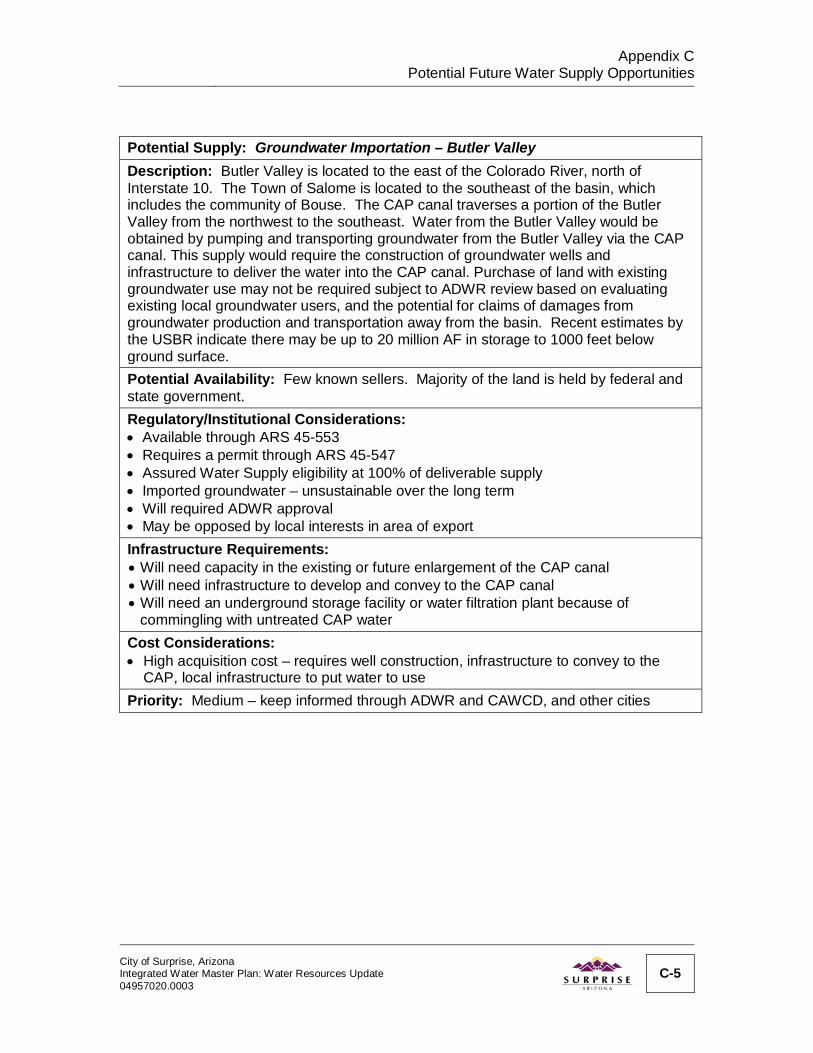
Appendix C
Potential Future Water Supply Opportunities
Potential Supply: Groundwater Importation – Butler Valley Description: Butler Valley is located to the east of the Colorado River, north of Interstate 10. The Town of Salome is located to the southeast of the basin, which includes the community of Bouse. The CAP canal traverses a portion of the Butler Valley from the northwest to the southeast. Water from the Butler Valley would be obtained by pumping and transporting groundwater from the Butler Valley via the CAP canal. This supply would require the construction of groundwater wells and infrastructure to deliver the water into the CAP canal. Purchase of land with existing groundwater use may not be required subject to ADWR review based on evaluating existing local groundwater users, and the potential for claims of damages from groundwater production and transportation away from the basin. Recent estimates by the USBR indicate there may be up to 20 million AF in storage to 1000 feet below ground surface. Potential Availability: Few known sellers. Majority of the land is held by federal and state government. Regulatory/Institutional Considerations: • Available through ARS 45-553 • Requires a permit through ARS 45-547 • Assured Water Supply eligibility at 100% of deliverable supply • Imported groundwater – unsustainable over the long term • Will required ADWR approval • May be opposed by local interests in area of export Infrastructure Requirements: • Will need capacity in the existing or future enlargement of the CAP canal • Will need infrastructure to develop and convey to the CAP canal • Will need an underground storage facility or water filtration plant because of
commingling with untreated CAP water Cost Considerations: • High acquisition cost – requires well construction, infrastructure to convey to the
CAP, local infrastructure to put water to use Priority: Medium – keep informed through ADWR and CAWCD, and other cities
City of Surprise, Arizona Integrated Water Master Plan: Water Resources Update 04957020.0003
C-5

Appendix C Potential Future Water Supply Opportunities
Potential Supply: Groundwater Importation – McMullen Valley Description: McMullen Valley is located to the south of the Town of Salome, Arizona and north of Interstate 10. This water would be obtained by pumping and transporting groundwater from the McMullen Valley via the CAP canal. The area has extensive irrigation from groundwater which would likely require the purchase and fallowing of farmland. This land was formerly held by the City of Phoenix as a part of its future water supply portfolio. This supply would require the construction of groundwater wells and infrastructure to deliver the water into the CAP canal. Potential Availability: One known owner may not be willing or able to sell Regulatory/Institutional Considerations: • Available through ARS 45-552 (Since the land is apparently no longer controlled by a
Phoenix AMA city, statute may no longer apply and would require a thorough legal analysis)
• Requires a permit through ARS 45-547 • Assured Water Supply eligibility at 100% of deliverable supply • Imported groundwater – unsustainable over the long term • Will required ADWR approval • May be opposed by local interests in area of export Infrastructure Requirements: • Will need capacity in the existing or future enlargement of the CAP canal • Will need infrastructure to develop and convey to the CAP canal • Will need an underground storage facility or water filtration plant because of
commingling with untreated CAP water Cost Considerations: • High acquisition cost – requires well construction, infrastructure to convey to the
CAP, local infrastructure to put water to use Priority: Low
C-6
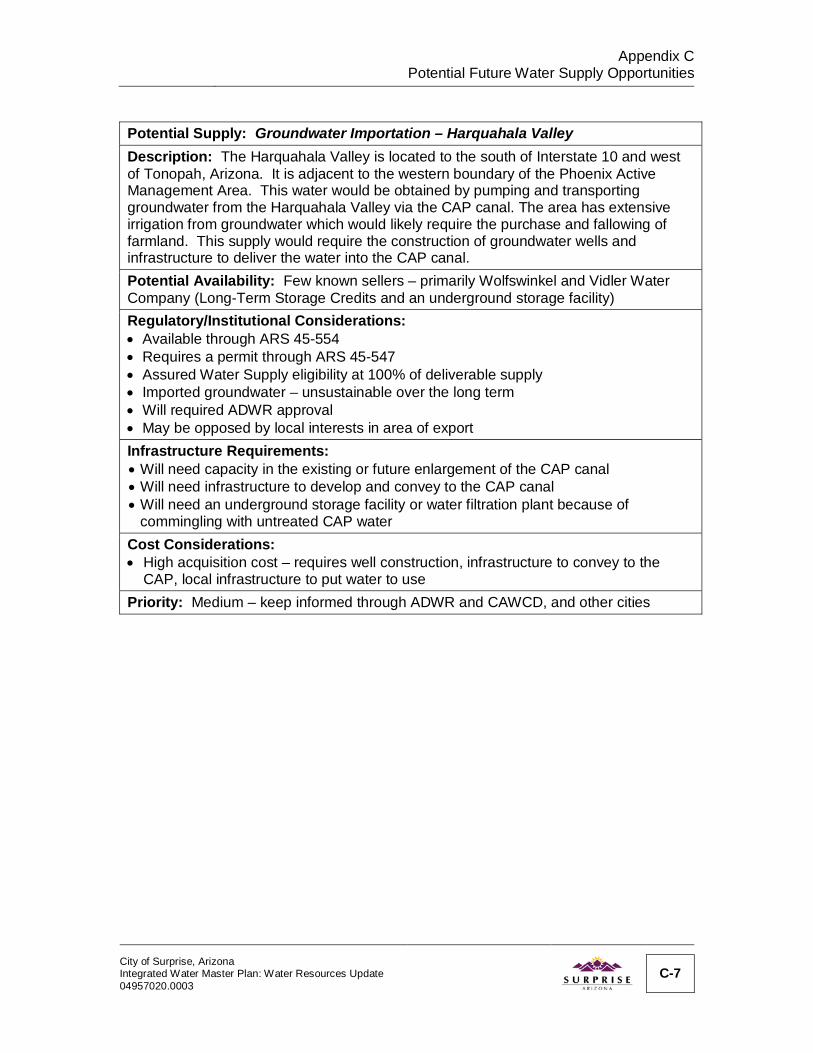
Appendix C
Potential Future Water Supply Opportunities Potential Supply: Groundwater Importation – Harquahala Valley Description: The Harquahala Valley is located to the south of Interstate 10 and west of Tonopah, Arizona. It is adjacent to the western boundary of the Phoenix Active Management Area. This water would be obtained by pumping and transporting groundwater from the Harquahala Valley via the CAP canal. The area has extensive irrigation from groundwater which would likely require the purchase and fallowing of farmland. This supply would require the construction of groundwater wells and infrastructure to deliver the water into the CAP canal. Potential Availability: Few known sellers – primarily Wolfswinkel and Vidler Water Company (Long-Term Storage Credits and an underground storage facility) Regulatory/Institutional Considerations: • Available through ARS 45-554 • Requires a permit through ARS 45-547 • Assured Water Supply eligibility at 100% of deliverable supply • Imported groundwater – unsustainable over the long term • Will required ADWR approval • May be opposed by local interests in area of export Infrastructure Requirements: • Will need capacity in the existing or future enlargement of the CAP canal • Will need infrastructure to develop and convey to the CAP canal • Will need an underground storage facility or water filtration plant because of
commingling with untreated CAP water Cost Considerations: • High acquisition cost – requires well construction, infrastructure to convey to the
CAP, local infrastructure to put water to use Priority: Medium – keep informed through ADWR and CAWCD, and other cities
City of Surprise, Arizona Integrated Water Master Plan: Water Resources Update 04957020.0003
C-7
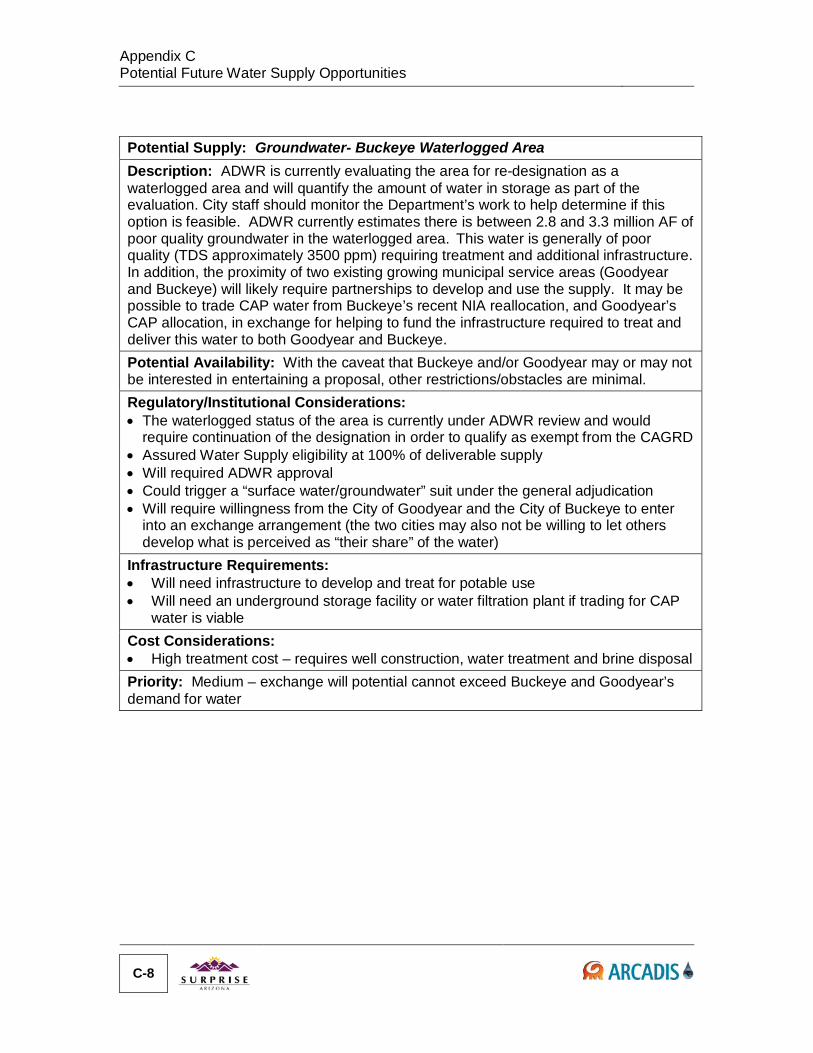
Appendix C Potential Future Water Supply Opportunities
Potential Supply: Groundwater- Buckeye Waterlogged Area Description: ADWR is currently evaluating the area for re-designation as a waterlogged area and will quantify the amount of water in storage as part of the evaluation. City staff should monitor the Department’s work to help determine if this option is feasible. ADWR currently estimates there is between 2.8 and 3.3 million AF of poor quality groundwater in the waterlogged area. This water is generally of poor quality (TDS approximately 3500 ppm) requiring treatment and additional infrastructure. In addition, the proximity of two existing growing municipal service areas (Goodyear and Buckeye) will likely require partnerships to develop and use the supply. It may be possible to trade CAP water from Buckeye’s recent NIA reallocation, and Goodyear’s CAP allocation, in exchange for helping to fund the infrastructure required to treat and deliver this water to both Goodyear and Buckeye. Potential Availability: With the caveat that Buckeye and/or Goodyear may or may not be interested in entertaining a proposal, other restrictions/obstacles are minimal. Regulatory/Institutional Considerations: • The waterlogged status of the area is currently under ADWR review and would
require continuation of the designation in order to qualify as exempt from the CAGRD • Assured Water Supply eligibility at 100% of deliverable supply • Will required ADWR approval • Could trigger a “surface water/groundwater” suit under the general adjudication • Will require willingness from the City of Goodyear and the City of Buckeye to enter
into an exchange arrangement (the two cities may also not be willing to let others develop what is perceived as “their share” of the water)
Infrastructure Requirements: • Will need infrastructure to develop and treat for potable use • Will need an underground storage facility or water filtration plant if trading for CAP
water is viable Cost Considerations: • High treatment cost – requires well construction, water treatment and brine disposal Priority: Medium – exchange will potential cannot exceed Buckeye and Goodyear’s demand for water
C-8
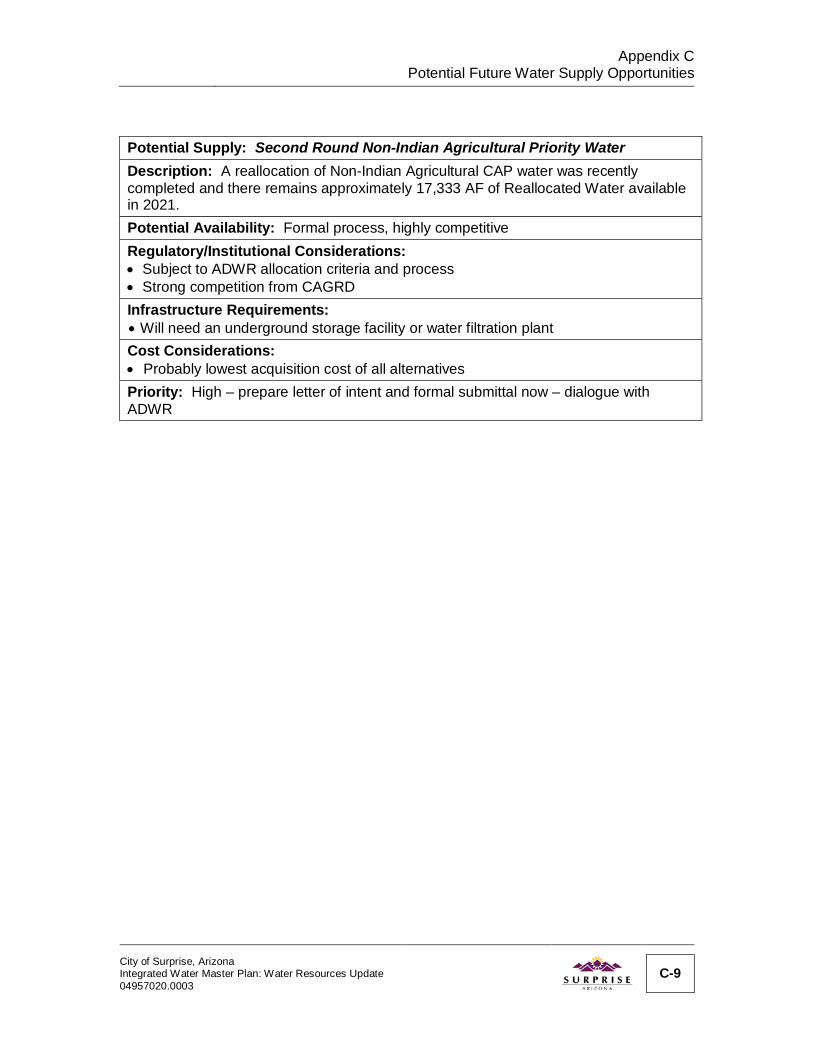
Appendix C
Potential Future Water Supply Opportunities
Potential Supply: Second Round Non-Indian Agricultural Priority Water Description: A reallocation of Non-Indian Agricultural CAP water was recently completed and there remains approximately 17,333 AF of Reallocated Water available in 2021. Potential Availability: Formal process, highly competitive Regulatory/Institutional Considerations: • Subject to ADWR allocation criteria and process • Strong competition from CAGRD Infrastructure Requirements: • Will need an underground storage facility or water filtration plant Cost Considerations: • Probably lowest acquisition cost of all alternatives Priority: High – prepare letter of intent and formal submittal now – dialogue with ADWR
City of Surprise, Arizona Integrated Water Master Plan: Water Resources Update 04957020.0003
C-9
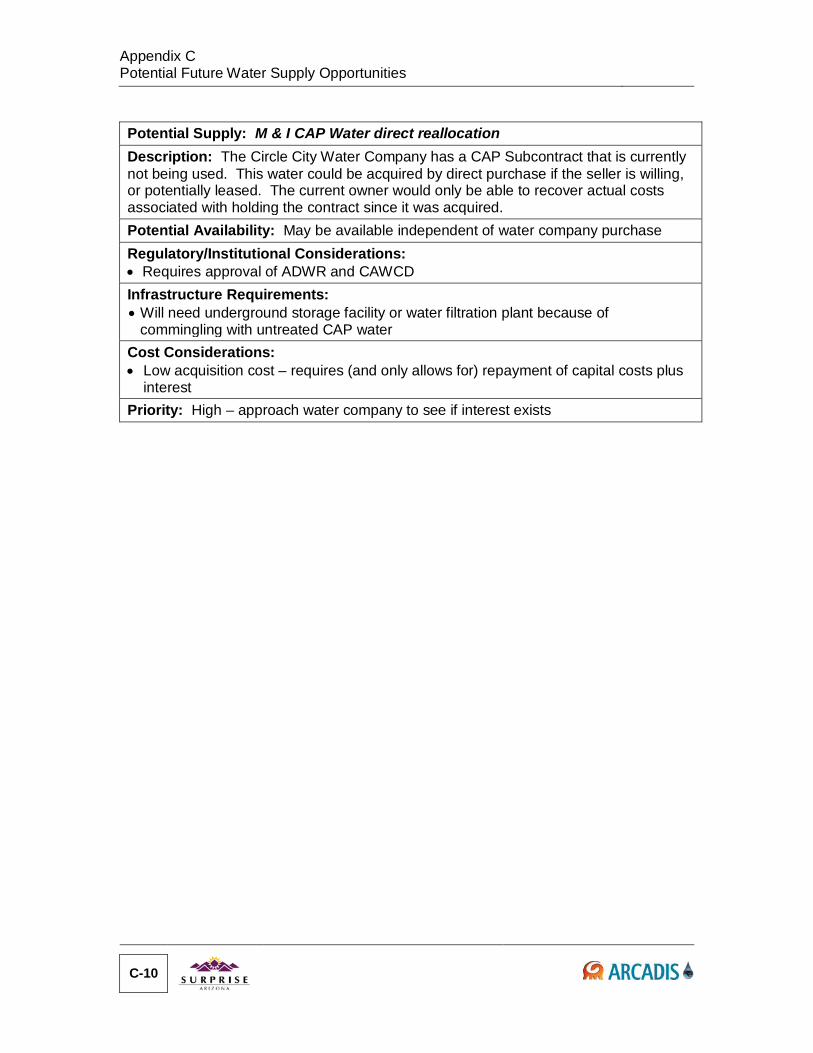
Appendix C Potential Future Water Supply Opportunities
Potential Supply: M & I CAP Water direct reallocation Description: The Circle City Water Company has a CAP Subcontract that is currently not being used. This water could be acquired by direct purchase if the seller is willing, or potentially leased. The current owner would only be able to recover actual costs associated with holding the contract since it was acquired. Potential Availability: May be available independent of water company purchase Regulatory/Institutional Considerations: • Requires approval of ADWR and CAWCD Infrastructure Requirements: • Will need underground storage facility or water filtration plant because of
commingling with untreated CAP water Cost Considerations: • Low acquisition cost – requires (and only allows for) repayment of capital costs plus
interest Priority: High – approach water company to see if interest exists
C-10
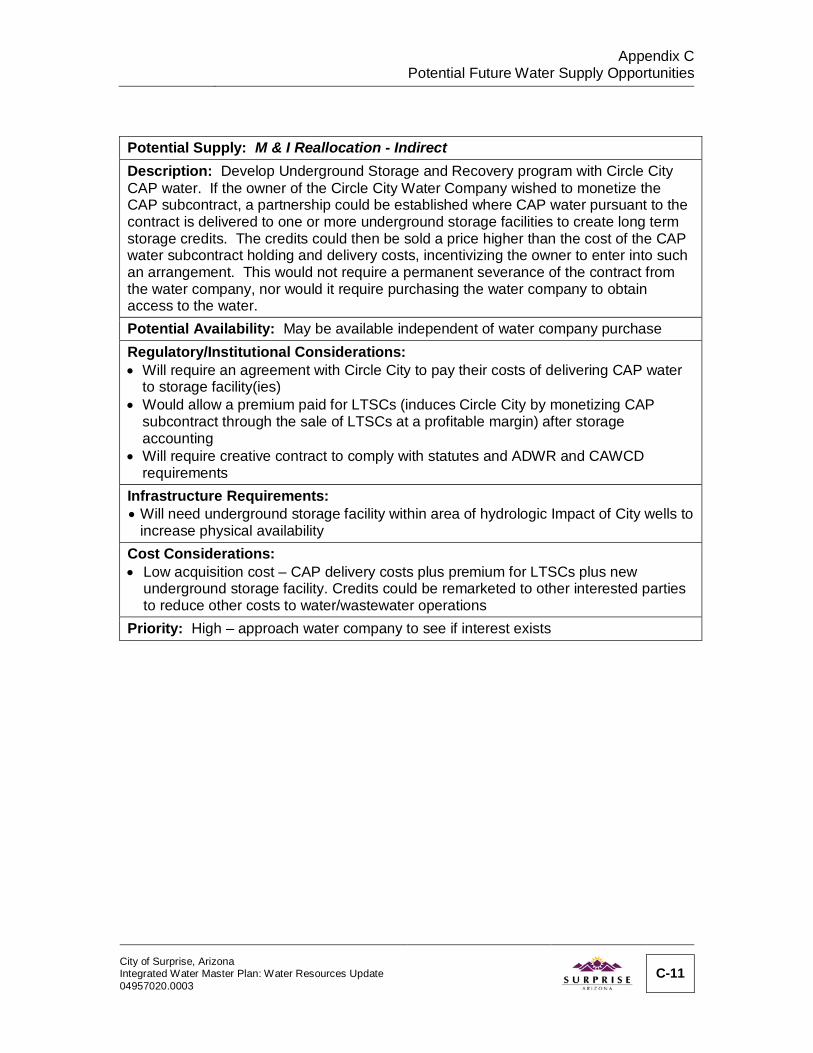
Appendix C
Potential Future Water Supply Opportunities
Potential Supply: M & I Reallocation - Indirect Description: Develop Underground Storage and Recovery program with Circle City CAP water. If the owner of the Circle City Water Company wished to monetize the CAP subcontract, a partnership could be established where CAP water pursuant to the contract is delivered to one or more underground storage facilities to create long term storage credits. The credits could then be sold a price higher than the cost of the CAP water subcontract holding and delivery costs, incentivizing the owner to enter into such an arrangement. This would not require a permanent severance of the contract from the water company, nor would it require purchasing the water company to obtain access to the water. Potential Availability: May be available independent of water company purchase Regulatory/Institutional Considerations: • Will require an agreement with Circle City to pay their costs of delivering CAP water
to storage facility(ies) • Would allow a premium paid for LTSCs (induces Circle City by monetizing CAP
subcontract through the sale of LTSCs at a profitable margin) after storage accounting
• Will require creative contract to comply with statutes and ADWR and CAWCD requirements
Infrastructure Requirements: • Will need underground storage facility within area of hydrologic Impact of City wells to
increase physical availability Cost Considerations: • Low acquisition cost – CAP delivery costs plus premium for LTSCs plus new
underground storage facility. Credits could be remarketed to other interested parties to reduce other costs to water/wastewater operations
Priority: High – approach water company to see if interest exists
City of Surprise, Arizona Integrated Water Master Plan: Water Resources Update 04957020.0003
C-11
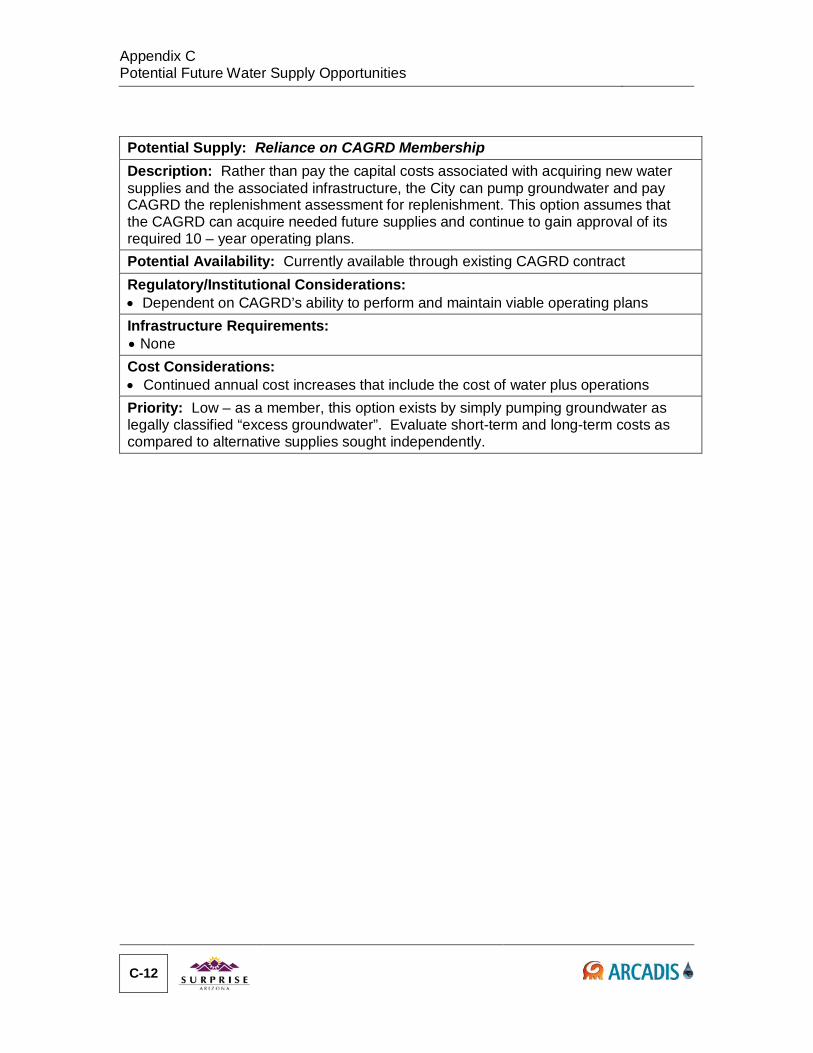
Appendix C Potential Future Water Supply Opportunities
Potential Supply: Reliance on CAGRD Membership Description: Rather than pay the capital costs associated with acquiring new water supplies and the associated infrastructure, the City can pump groundwater and pay CAGRD the replenishment assessment for replenishment. This option assumes that the CAGRD can acquire needed future supplies and continue to gain approval of its required 10 – year operating plans. Potential Availability: Currently available through existing CAGRD contract Regulatory/Institutional Considerations: • Dependent on CAGRD’s ability to perform and maintain viable operating plans Infrastructure Requirements: • None Cost Considerations: • Continued annual cost increases that include the cost of water plus operations Priority: Low – as a member, this option exists by simply pumping groundwater as legally classified “excess groundwater”. Evaluate short-term and long-term costs as compared to alternative supplies sought independently.
C-12
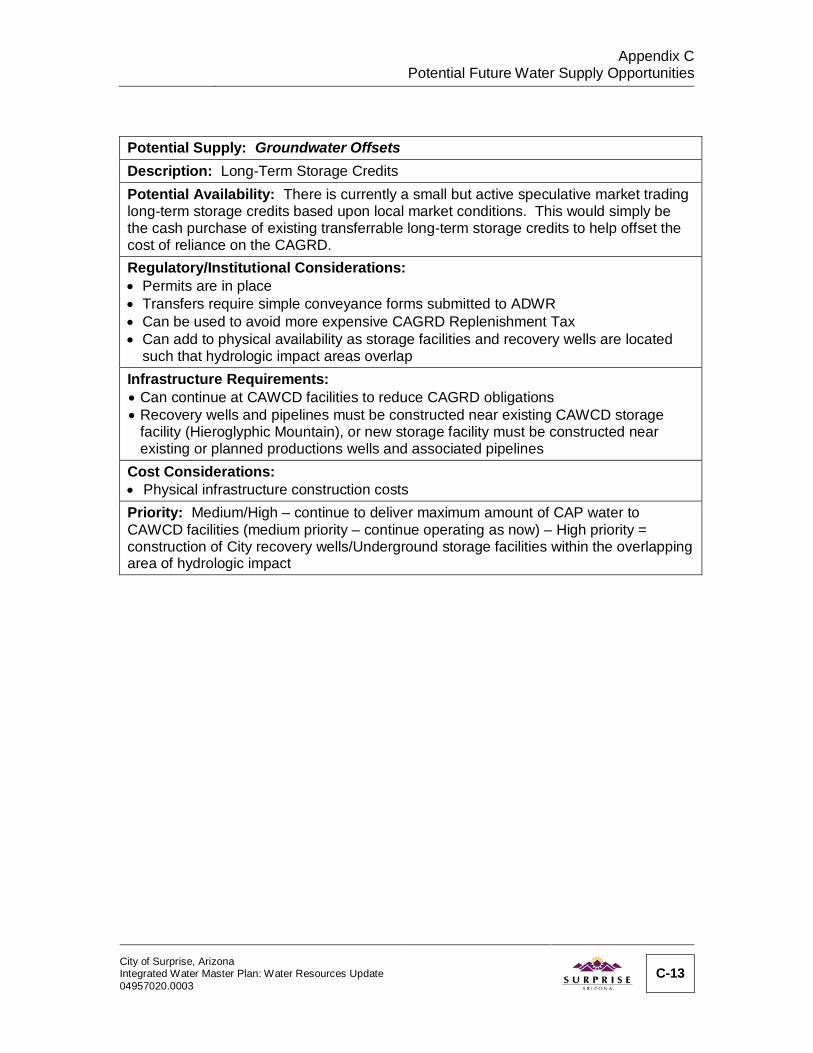
Appendix C
Potential Future Water Supply Opportunities
Potential Supply: Groundwater Offsets Description: Long-Term Storage Credits Potential Availability: There is currently a small but active speculative market trading long-term storage credits based upon local market conditions. This would simply be the cash purchase of existing transferrable long-term storage credits to help offset the cost of reliance on the CAGRD. Regulatory/Institutional Considerations: • Permits are in place • Transfers require simple conveyance forms submitted to ADWR • Can be used to avoid more expensive CAGRD Replenishment Tax • Can add to physical availability as storage facilities and recovery wells are located
such that hydrologic impact areas overlap Infrastructure Requirements: • Can continue at CAWCD facilities to reduce CAGRD obligations • Recovery wells and pipelines must be constructed near existing CAWCD storage
facility (Hieroglyphic Mountain), or new storage facility must be constructed near existing or planned productions wells and associated pipelines
Cost Considerations: • Physical infrastructure construction costs Priority: Medium/High – continue to deliver maximum amount of CAP water to CAWCD facilities (medium priority – continue operating as now) – High priority = construction of City recovery wells/Underground storage facilities within the overlapping area of hydrologic impact
City of Surprise, Arizona Integrated Water Master Plan: Water Resources Update 04957020.0003
C-13
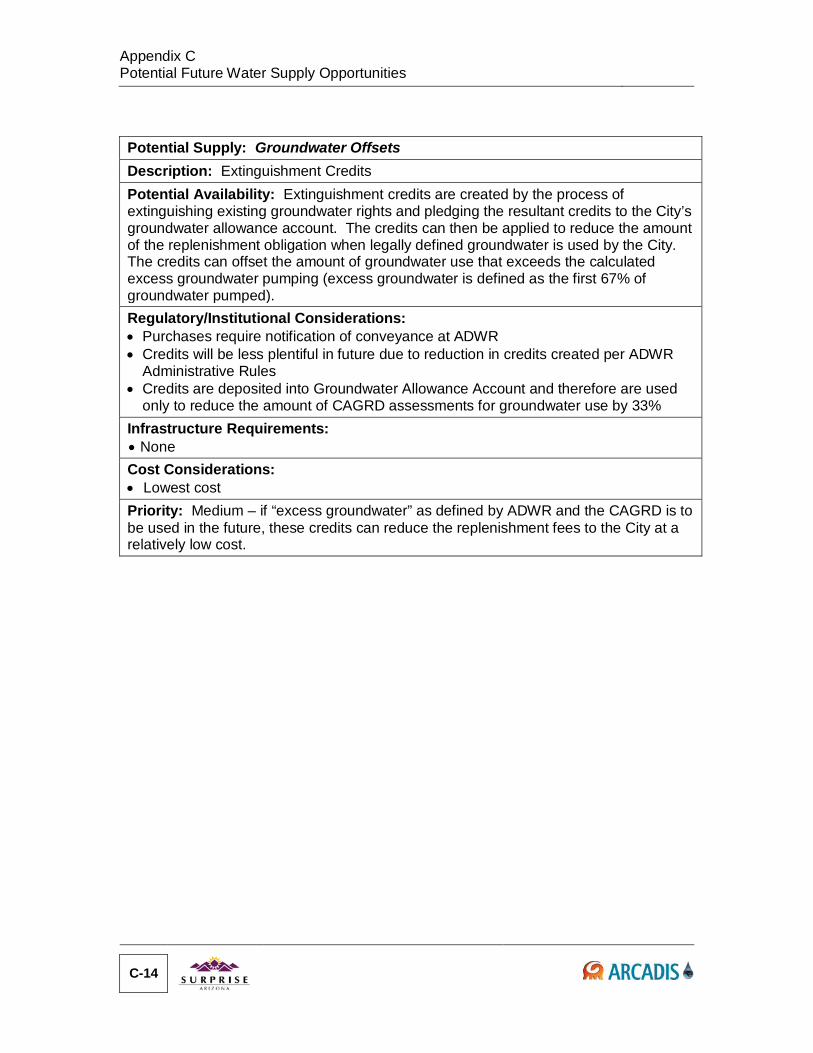
Appendix C Potential Future Water Supply Opportunities
Potential Supply: Groundwater Offsets Description: Extinguishment Credits Potential Availability: Extinguishment credits are created by the process of extinguishing existing groundwater rights and pledging the resultant credits to the City’s groundwater allowance account. The credits can then be applied to reduce the amount of the replenishment obligation when legally defined groundwater is used by the City. The credits can offset the amount of groundwater use that exceeds the calculated excess groundwater pumping (excess groundwater is defined as the first 67% of groundwater pumped). Regulatory/Institutional Considerations: • Purchases require notification of conveyance at ADWR • Credits will be less plentiful in future due to reduction in credits created per ADWR
Administrative Rules • Credits are deposited into Groundwater Allowance Account and therefore are used
only to reduce the amount of CAGRD assessments for groundwater use by 33% Infrastructure Requirements: • None Cost Considerations: • Lowest cost Priority: Medium – if “excess groundwater” as defined by ADWR and the CAGRD is to be used in the future, these credits can reduce the replenishment fees to the City at a relatively low cost.
C-14
D. Water Resource Model
Water resource modeling, or comparison of water demands against water supplies, was accomplished by integrating the Demand Module into the Water Resource Model. The Demand Module provides the water demand projections while the Water Resource Model provides the comparison of demands against existing and potential future water supplies. In 2008, this was accomplished at Arizona State University’s (ASU’s) Decision Theater via commercially-available PowerSim software as described below. For the current Water Resources component update, the analysis was performed using ArcGIS and Excel-based spreadsheets. This section describes the methodology used to design the Water Resource Model and to integrate it with the Demand Module. The methodology performed in the current update remains the same.
D.1. General Overview The Water Resource Model compares water demand projections developed in the Demand Module to existing and potentially available water supplies. The output of the Water Resource Model allows the user to determine whether the available supplies are sufficient to meet anticipated demands. Alternatively, the model can predict when existing water supplies will be fully used, when a gap (deficit) between supply and demand occurs, and the magnitude of the gap.
In 2008, the Water Resource Model was compiled and run using commercially-available PowerSim software. The software reads from the Demand Module’s database file and imports indoor, outdoor, and landscape demands for each water service provider and SPA within the Surprise MPA. In the 2008 Integrated Water Master Plan, the Water Resource Model used 2008, 2020, 2030, and build-out as the planning periods and interpolated for interim years; the current Water Resources component update used 2013, 2020, 2030, and build-out as the planning periods.
The water supplies included are based on assured water supply designations, hydrogeologic models (physical availability of groundwater), surface water rights, CAP subcontracts, and reclaimed water production projections. Additional water supplies can be added to the Water Resource Model based on anticipated water supply development projects, or other new water supply projections.
The Water Resource Model output includes a series of graphs that show the aggregated water demand in each category (indoor, outdoor, and landscape) for each SPA, for each water service provider, and for each provider within each SPA. The user can change
City of Surprise, Arizona Integrated Water Master Plan: Water Resources Update 04957020.0003
D-1
Appendix D Water Resource Model
demands and supplies in the Water Resource Model interface to evaluate multiple water resource scenarios.
D.2. Water Resource Supplies Water supplies are layered graphically and mathematically in the model starting with the known existing water supplies available. As future water resources become available, they can be added to the water supply. In the case of reclaimed water, where there is a linkage between land use/water demand and reclaimed water production, the growth in reclaimed water supplies becomes a function of the growth of calculated indoor water use (i.e., 90 percent of indoor demand).
D.3. Water Resource Model Dashboard The Water Resource Model includes a dashboard to control model assumptions and to display graphics of water supply and demand. There are five tables in the dashboard: the SPA table (Figure D-1), the provider table (Figure D-2), the development dates table (Figure D-3), the conservation table (Figure D-4), and the water supply table (Figure D-5).
The SPA table can be set to either serve or not serve customers in each SPA. The provider table can be set to provide potable water for indoor demands for each provider area; serve potable water, reclaimed water, or no water for outdoor use to each provider area; and serve potable water, reclaimed water, or no water for landscaping for each provider area. The supply table can accept input for additional future water supplies, which may be speculative, in addition to the year that future supplies are assumed to become available. The conservation table can be set to reduce water demand by a fixed percent for indoor, outdoor, and landscape uses. The development dates table can be set to choose specific years for build-out. The resulting water demands and water supply are automatically updated in the graphical outputs.
In addition to the dashboard tables, the water supply table includes an additional switch that indicates whether possible CAP subcontract water, groundwater, and other water that is entitled to other providers (Circle City, EPCOR (formerly AAWC), and MWD) is to be included in the total water supply. The Model also includes necessary mathematical calculations to produce the graphics and data structures to generate the detailed graphics.
D-2
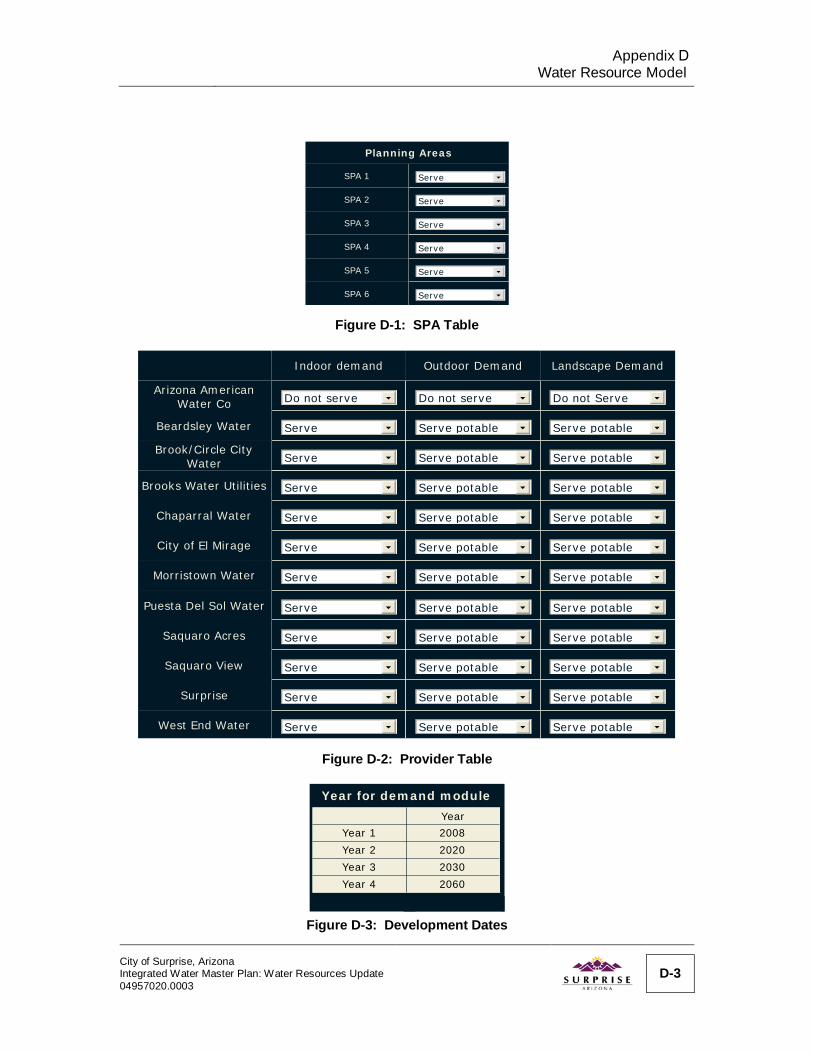
Appendix D Water Resource Model
Figure D-1: SPA Table
Figure D-2: Provider Table
Figure D-3: Development Dates
Serve
Serve
Serve
Serve
Serve
Serve
SPA 1
SPA 2
SPA 3
SPA 4
SPA 5
SPA 6
Planning Areas
Do not serve
Serve
Serve
Serve
Serve
Serve
Serve
Serve
Serve
Serve
Serve
Serve
Arizona AmericanWater Co
Beardsley Water
Brook/Circle CityWater
Brooks Water Utilities
Chaparral Water
City of El Mirage
Morristown Water
Puesta Del Sol Water
Saquaro Acres
Saquaro View
Surprise
West End Water
Do not serve
Serve potable
Serve potable
Serve potable
Serve potable
Serve potable
Serve potable
Serve potable
Serve potable
Serve potable
Serve potable
Serve potable
Do not Serve
Serve potable
Serve potable
Serve potable
Serve potable
Serve potable
Serve potable
Serve potable
Serve potable
Serve potable
Serve potable
Serve potable
Indoor demand Outdoor Demand Landscape Demand
Year for demand moduleYear
Year 1 2008Year 2 2020Year 3 2030Year 4 2060
City of Surprise, Arizona Integrated Water Master Plan: Water Resources Update 04957020.0003
D-3

Appendix D Water Resource Model
Figure D-4: Conservation Table
Figure D-5: Water Supply Table
D.4. Display of Water Resource Model Results The results from the Water Resource Model are displayed in two graphs on the dashboard: total demand and total supply. The total demand graph shows aggregated demand for indoor, outdoor, and landscape use for each year through build-out (Figure D-6). In addition, the demand graph can show these quantities for each previously saved scenario as reference data. The supply graph shows each of the sources of water from the water resources spreadsheet depending on the year the supply initially becomes available (Figure D-7). Both the demand graph and the supply graph include lines for total supply and total demand – the intersection of these two lines indicates the year that water demands begin to exceed water supplies.
Water ConservationYear 2008 2020 2030 2060
Indoor conservation (%) 0 0 0 0
Outdoor conservation (%) 0 0 0 0
Landscape conservation (%) 0 0 0 0
Current and future sources of waterYear Quantity
Groundwater physical availability Current 16,744 af/yr
CAP allocation Current 10,437 af/yr
Additional CAP supplies from other providers 0 af/yr
Reclaimed water Current 3,584 af/yr
Additional water for reclamation Depends on demand 117,858 af/yr
Imported Colorado River Water 2008 0 af/yr
Additional WWTP capacity 2012 0 af/yr
Tribal lease water 2008 0 af/yr
Imported stored water 2020 0 af/yr
Groundwater from other providers 2008 0 af/yr
Imported groundwater 2008 0 af/yr
MWD surface water 2008 0 af/yr
Non-commercial use only!
turn on additional CAP from other providers
Non-commercial use only!
D-4
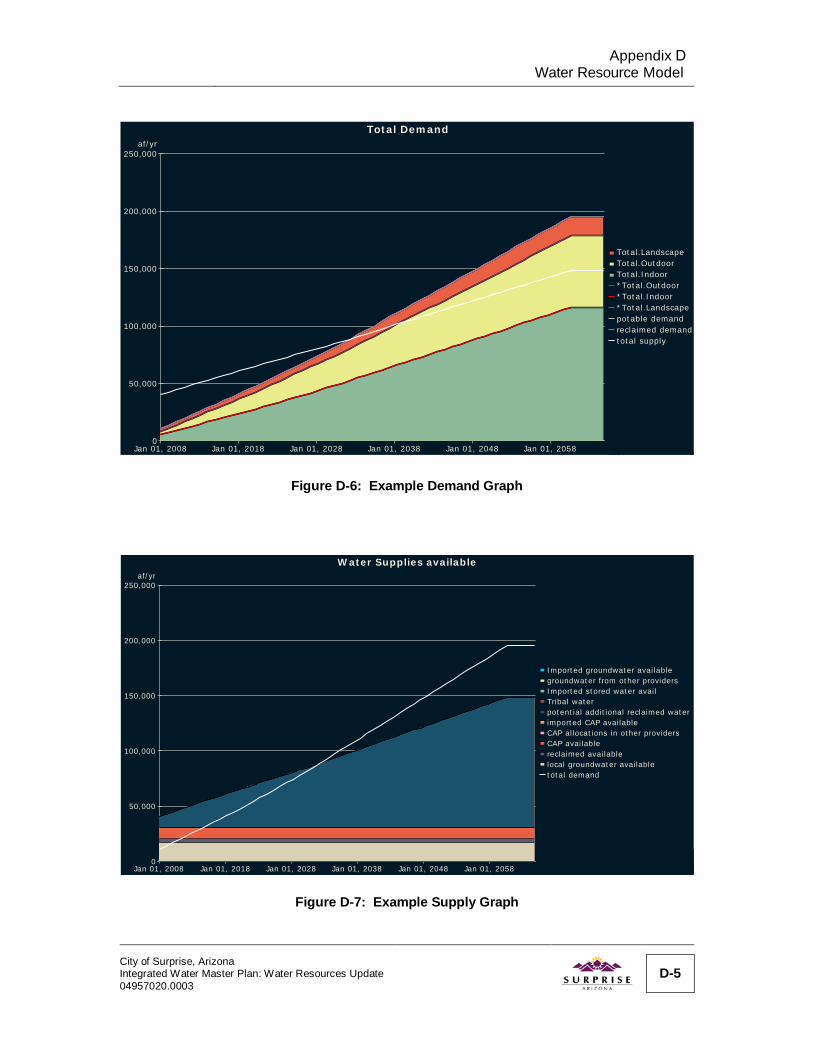
Appendix D Water Resource Model
Figure D-6: Example Demand Graph
Figure D-7: Example Supply Graph
Total Demand
Jan 01, 2008 Jan 01, 2018 Jan 01, 2028 Jan 01, 2038 Jan 01, 2048 Jan 01, 20580
50,000
100,000
150,000
200,000
250,000af/yr
Total.LandscapeTotal.OutdoorTotal.Indoor*Total.Outdoor*Total.Indoor*Total.Landscapepotable demandreclaimed demandtotal supply
Water Supplies available
Jan 01, 2008 Jan 01, 2018 Jan 01, 2028 Jan 01, 2038 Jan 01, 2048 Jan 01, 20580
50,000
100,000
150,000
200,000
250,000af/yr
Imported groundwater availablegroundwater from other providersImported stored water availTribal waterpotential additional reclaimed waterimported CAP availableCAP allocations in other providersCAP availablereclaimed availablelocal groundwater availabletotal demand
City of Surprise, Arizona Integrated Water Master Plan: Water Resources Update 04957020.0003
D-5
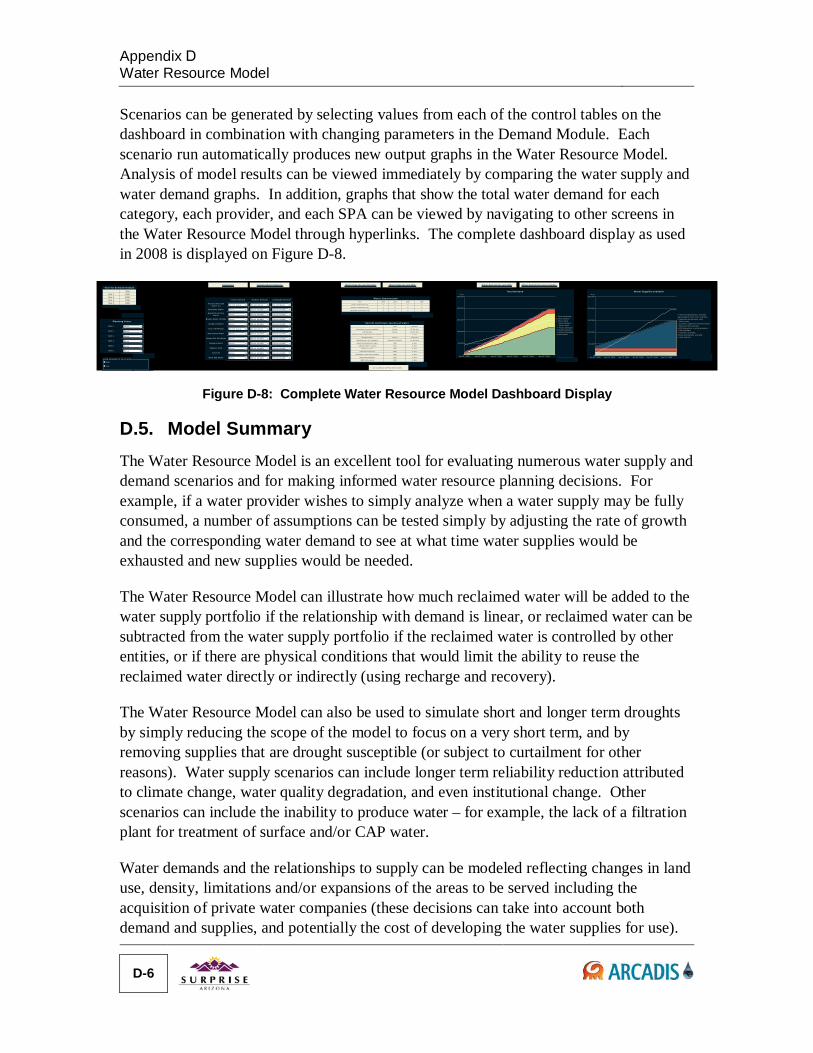
Appendix D Water Resource Model
Scenarios can be generated by selecting values from each of the control tables on the dashboard in combination with changing parameters in the Demand Module. Each scenario run automatically produces new output graphs in the Water Resource Model. Analysis of model results can be viewed immediately by comparing the water supply and water demand graphs. In addition, graphs that show the total water demand for each category, each provider, and each SPA can be viewed by navigating to other screens in the Water Resource Model through hyperlinks. The complete dashboard display as used in 2008 is displayed on Figure D-8.
Figure D-8: Complete Water Resource Model Dashboard Display
D.5. Model Summary The Water Resource Model is an excellent tool for evaluating numerous water supply and demand scenarios and for making informed water resource planning decisions. For example, if a water provider wishes to simply analyze when a water supply may be fully consumed, a number of assumptions can be tested simply by adjusting the rate of growth and the corresponding water demand to see at what time water supplies would be exhausted and new supplies would be needed.
The Water Resource Model can illustrate how much reclaimed water will be added to the water supply portfolio if the relationship with demand is linear, or reclaimed water can be subtracted from the water supply portfolio if the reclaimed water is controlled by other entities, or if there are physical conditions that would limit the ability to reuse the reclaimed water directly or indirectly (using recharge and recovery).
The Water Resource Model can also be used to simulate short and longer term droughts by simply reducing the scope of the model to focus on a very short term, and by removing supplies that are drought susceptible (or subject to curtailment for other reasons). Water supply scenarios can include longer term reliability reduction attributed to climate change, water quality degradation, and even institutional change. Other scenarios can include the inability to produce water – for example, the lack of a filtration plant for treatment of surface and/or CAP water.
Water demands and the relationships to supply can be modeled reflecting changes in land use, density, limitations and/or expansions of the areas to be served including the acquisition of private water companies (these decisions can take into account both demand and supplies, and potentially the cost of developing the water supplies for use).
Do not serve
Serve
Serve
Serve
Serve
Do not serve
Serve
Serve
Serve
Serve
Serve
Serve
Arizona AmericanWater Co
Beardsley Water
Brook/Circle CityWater
Brooks Water Utilities
Chaparral Water
City of El Mirage
Morristown Water
Puesta Del Sol Water
Saquaro Acres
Saquaro View
Surprise
West End Water
Do not serve
Serve potable
Serve potable
Serve potable
Serve potable
Do not serve
Serve potable
Serve potable
Serve potable
Serve potable
Serve potable
Serve potable
Do not Serve
Serve potable
Serve potable
Serve potable
Serve potable
Do not serve
Serve potable
Serve potable
Serve potable
Serve potable
Serve potable
Serve potable
Indoor demand Outdoor Demand Landscape Demand
Total Demand
Jan 01, 2008 Jan 01, 2018 Jan 01, 2028 Jan 01, 2038 Jan 01, 2048 Jan 01, 20580
50,000
100,000
150,000
200,000
250,000af/yr
Total.LandscapeTotal.OutdoorTotal.Indoor*Total.Outdoor*Total.Indoor*Total.Landscapepotable demandreclaimed demandtotal supply
Non-commercial use only!
Water Supplies available
Jan 01, 2008 Jan 01, 2018 Jan 01, 2028 Jan 01, 2038 Jan 01, 2048 Jan 01, 20580
50,000
100,000
150,000
200,000
250,000af/yr
Imported groundwater availablegroundwater from other providersImported stored water availTribal waterpotential additional reclaimed waterimported CAP availableCAP allocations in other providersCAP availablereclaimed availablelocal groundwater availabletotal demand
Non-commercial use only!
Water ConservationYear 2008 2020 2030 2060
Indoor conservation (%) 0 0 0 0
Outdoor conservation (%) 0 0 0 0
Landscape conservation (%) 0 0 0 0
Non-commercial use only!
Current and future sources of waterYear Quantity
Groundwater physical availability Current 16,744 af/yr
CAP allocation Current 10,437 af/yr
Additional CAP supplies from other providers 0 af/yr
Reclaimed water Current 3,584 af/yr
Additional water for reclamation Depends on demand 117,858 af/yr
Imported Colorado River Water 2008 0 af/yr
Additional WWTP capacity 2012 0 af/yr
Tribal lease water 2008 0 af/yr
Imported stored water 2020 0 af/yr
Groundwater from other providers 2008 0 af/yr
Imported groundwater 2008 0 af/yr
MWD surface water 2008 0 af/yr
Non-commercial use only!
stop simulation if out of waterfalse
true
Year for demand moduleYear
Year 1 2008Year 2 2020Year 3 2030Year 4 2060
Non-commercial use only!
Serve
Serve
Serve
Serve
Serve
Serve
SPA 1
SPA 2
SPA 3
SPA 4
SPA 5
SPA 6
Planning Areas
turn on additional CAP from other providers
Water Type for each SPA Water Demand for each providerWater Demand for each SPADetailed Water DemandDashboard Water Type for each Provider
D-6