AIZWAL SOLOAR CITY MASTER PLAN
120
Directorate of UD & PA, Govt. of Mizoram Supported by Ministry of New and Renewable Energy Government of India, New Delhi Development of Aizawl Solar City Master Plan, February 2011
-
Upload
independent -
Category
Documents
-
view
1 -
download
0
Transcript of AIZWAL SOLOAR CITY MASTER PLAN

Directorate of UD & PA, Govt. of Mizoram
Supported by
Ministry of New and Renewable Energy
Government of India, New Delhi
Development of Aizawl Solar City
Master Plan, February 2011


ACKNOWLEDGEMENT This Master Plan is an outcome of the Ministry of New and Renewable Energy’s (MNRE’s) Solar City Programme as part of the 11th five year plan. Their initiatives have led to the collaboration of the Directorate of Urban Development & Poverty Alleviation (DUDPA), Government of Mizoram with ICLEI-South Asia for the preparation of the Solar City Master Plan for Aizawl city, as part of this Programme. We gratefully acknowledge the support of Directorate of Urban Development & Poverty Alleviation, and Zoram Energy Development Agency (ZEDA) for providing assistance in primary and secondary data collection in the initial phase of master plan preparation. We would like to thank M/s Swastik Enterprise, Kolkata, for data collection and sample survey for Aizawl city. The report benefited enormously from peer review process by a gamut of experts from ICLEI South Asia and most importantly the Directorate of Urban Development & Poverty Alleviation, Zoram Energy Development Agency and the stakeholders of Aizawl Solar City Programme. We acknowledge their contributions and suggestions which streamlined the structure and composition of the master plan. The report would have not been possible without the generous support of the Ministry of New & Renewable Energy, Government of India. We extend our gratitude to the honorable secretary of MNRE, Mr. Deepak Gupta for his time and advice to make this report better. We specially thank Dr. Bibek Bandyopadyay, Advisor, MNRE and Dr. Arun Kumar Tripathi, Director, MNRE for their valuable advice and guidance during the preparation of this report. We also extend our thanks to the other officers and staff of the MNRE for their consistent support in preparing and finalizing the report.

ii
CONSULTED ORGANISATIONS:
1. Directorate of Urban Development & Poverty Alleviation, Government of Mizoram 2. Zoram Energy Development Agency (ZEDA), Government of Mizoram 3. Officials and Councilors of Aizawl Municipal Council 4. Mizoram State Electricity Board 5. District Supply Officer (DSO), 6. State Oil Coordinator 7. Hotels and restaurants 8. Small Scale Industries 9. Tourism Department 10. Education Department 11. Department of Health 12. Members of the civil society

iii
MNRE TEAM: Dr. Bibek Bandyopadhyay, Advisor & Head, MNRE Dr. Arun Kumar Tripathi, Director, MNRE Mr. Hiren Borah, Scientist “B”, MNRE
DEPARTMENT OF URBAN DEVELOPMENT AND POVERTY ALLEVIATION (DUDPA) AND ZORAM ENERGY DEVELOPMENT AGENCY (ZEDA) TEAM: Mr. P. L. Thanga, Chairman, State Level Coordination Committee on Aizawl Solar City Scheme Pu. P. Lalchhuanga, MCS, Director, UD & PA Deptt., Government of Mizoram Pu. Lalthuamliana, Deputy Secretary, UD & PA Department, Government of Mizoram Mr. David, Director, ZEDA Mr. Vanlalthanga, Engineer, Solar Cell, ZEDA
ICLEI SOUTH ASIA TEAM: Emani Kumar Dwipen Boruah Ravi Ranjan Guru Ashish Verma Laasya Bhagvatula

iv
ABBREVIATIONS AND ACRONYMS LED: Light Emitting Diode LEED: Leadership in Energy and Environmental Design LPD: Litres per day LPG: Liquefied Petroleum Gas m/s: Metres per Second M: Metre MNRE: Ministry of New and Renewable Energy MSW: Municipal Solid Waste MT: Metric Tons MU: Million Units MW: Mega Watt MWe: Mega Watt Equivalent MWh: Mega Watt-hour MWp: Mega Watt Peak NGO: Non-governmental Organization O&M: Operations and Maintenance PDD: Project Design Document PNG: Piped Natural Gas PPP: Public-Private Partnership R&D: Research and Development RE: Renewable Energy REC: Renewable Energy Certificate RET: Renewable Energy Technology SCADA: Supervisory Control and Data Acquisition SCMD: Standard Cubic Meters per Day SCP: Solar Cities Project SERC: State Electricity Regulatory Commission Sft: Square Feet SNA: State Nodal Agency SPV: Solar Photo Voltaic Sqm: Square Metre STP: Sewage Treatment Plant SWH: Solar Water Heater SWM: Solid Waste Management T/yr: Tons per Year T: Ton TeCO2: Tons of Equivalent Carbon Dioxide ULB: Urban Local Body UNFCCC: United Nations Framework Convention on Climate Change W: Watt Wh: Watt-hour WTP: Water Treatment Plant ZEDA: Zoram Energy Development Agency FITM: Feed in Tariff Mechanism FTL: Fluorescent Tube Light GDP: Gross Domestic Product GHG: Green House Gases GLS: Global Light Source GRIHA: Green Building Integrated Habitat Assessment
HH: House Hold HPSV: High Pressure Sodium Vapour Hrs/day: Hours per Day HVAC: Heating, Ventilation and Air-conditioning Hz: Hertz ICLEI SA: International Council for Local Environmental
Initiatives – South Asia IEA: International Energy Agency IEO: International Energy Outlook IREDA: Indian Renewable Energy Development Agency ISES: International Solar Energy Society JnNURM: Jawaharlal Nehru National Urban Renewal Mission Kg: Kilogram kHz: Kilo Hertz kL: Kilo litre kL: Kilo Litre kT/yr: Kilo Tons per Year kW: Kilo Watt kWe: Kilo Watt Equivalent kWh: kilo watt-hour kWp: Kilo Watt Peak L: Litre CHP: Combined Heat and Power CNG: Compressed Natural Gas CO2: Carbon Dioxide CPWD: Central Public Works Department CSP: Concentrating Solar Power DG Sets: Diesel Generator Sets DISCOM: Distribution Company DSM: Demand Side Management DTS: Decentralized Waste Water Treatment System DUDPA: Directorate of Urban Development & Poverty
Alleviation ECBC: Energy Conservation Building Code eCO2: Equivalent Carbon Dioxide EE: Energy Efficiency ESCo: Energy Service Company BOOT: Build, Operate, Own and Transfer BOT: Build, Operate and Transfer CAGR: Compound Annual Growth Rate CDM: Clean Development Mechanism CDP: City Development Plan CERC: Central Electricity Regulatory Commission CFA: Central Financial Assistance CFL: Compact Fluorescent Light AC: Air-conditioner BEE: Bureau of Energy Efficiency BIPV: Building Integrated Photovoltaic BMS: Building Management System

EXECUTIVE SUMMARY
The “Development of Solar Cities” programme by the Ministry of New and Renewable Energy (MNRE), Government of India, is an immense opportunity for contributing towards a sustainable India in the coming years. This programme is a crucial step towards supporting Indian cities for the development of renewable energy and energy efficiency projects and curbing conventional energy demand by 10% in the next five years. This master plan is the outcome of the programme’s objective to develop a road map for the city to envision and implement renewable energy and energy conservation strategies. The master plan approach is in tandem with the requirements of the MNRE guidelines. The master plan begins with the introductory city profile which encapsulates the city’s current energy demands and also the municipal Council services which are intrinsic to the city’s growing energy demand. The 2nd chapter provides the Current Energy Scenario of Aizawl. Detailed analysis of the trend and pattern of electricity, petrol, diesel, kerosene and LPG consumption has been discussed and thoroughly analysed to base the strategy development of the city. The main sources of energy in the city are electricity, petrol, diesel, LPG and kerosene.
The 3rd Chapter Energy Demand Forecast of Aizawl estimates the future conventional energy demand interpolating the past data of energy consumption as well as population growth data. However other key aspects detrimental to energy demand like city economic growth has also been considered for ascertaining the city’s future conventional energy demands. Goal for Year 2018: Studying the historical growth in consumption levels and population growth projections until the year 2018, it has been assessed that the energy consumption in Aizawl in 2018 can be ascertained under the highest growth scenario as 565.07MU. This gives the city a 10% reduction goal of 56.51 MU. The success of renewable energy technology projects can only be assured with an accurate resource assessment and its potential in the city. Hence the 4th Chapter Renewable energy and Energy Efficiency Strategies for AMC begins with the resource availability and intensity of renewable energy resources like solar, wind, hydro- and geothermal in the city. This chapter is the most substantial part of the master plan as it delineates the specific strategies for the city. For ease of study the city has been divided into Residential; Commercial & Institutional; Government & Municipal and Industrial sectors and both renewable energy and energy efficiency initiatives are enlisted within it. Case studies have been highlighted in the city which are 4-5 specific sites within the city where RE and EE technologies can be showcased. The aim was to meet minimum of 5% of the energy reduction through renewable energy measures. The primary or the most feasible actions for which the techno-economics have been developed under renewable energy measures are solar water heater and solar home light systems. Being in the special category state, Aizawl will be eligible to avail 90% subsidy for solar PV and 60% for solar thermal projects under different schemes of Ministry of New and Renewable Energy. Therefore all renewable energy projects are attractive in

2
terms of investment, return and payback period. The table below summarizes the year wise energy savings goal with RE and EE strategies in different sectors:
Energy Savings target over 5 years period of
implementation % of savings
target to achieve
Emission reduction/ year RE and EE Strategy for Aizawl City
1st Year
2nd year
Cumulative
3rd year
Cumulative
4th year
Cumulative
5th year Cumulati
ve
RE for Residential Sector 2.81 7.04 12.67 19.70 28.15 49.81% 19426
RE for Commercial & Inst. Sector 0.12 0.31 0.55 0.86 1.23 2.17% 721
RE for Industrial Sector 0.08 0.21 0.38 0.59 0.85 1.50% 706
RE for Municipal Sector 0.18 0.46 0.82 1.28 1.83 3.24% 1467
Total for RE strategy 3.21 8.01 14.42 22.44 32.05 56.72% 22320
EE for Residential Sector 2.07 5.17 9.31 14.49 20.69 36.62% 16763
EE for Commercial Sector 0.54 1.35 2.43 3.78 5.39 9.55% 4370
EE for Industrial Sector 0.58 1.44 2.59 4.03 5.76 10.19% 4662
EE for Municipal Sector 0.12 0.30 0.55 0.85 1.22 2.16% 988
Total for EE Strategy 3.31 8.27 14.88 23.15 33.07 58.51% 26783 RE and EE Combined Strategy 6.51 16.28 29.30 45.58 65.12 49103
11.52% 28.81% 51.86% 80.66% 115.24% Financial Outlay: The total indicative budget for development of Aizawl as Solar City is estimated at Rs.190.58crore which will be invested over the 5 years of implementation period of solar city development programme. The total budget will be shared by the state government/ City authority, MNRE and the private users. The budget for implementation of RE strategy and EE strategy is estimated at Rs.172.40crore and Rs.18.18crore respectively. While budget for RE strategy will be shared among MNRE, state/city and private users, private investors and state government will primarily drive EE activities.
Year 1 (Crore)
Year 2 (Crore)
Year 3 (Crore)
Year 4 (Crore)
Year 5 (Crore) Total (Crore)
State / City Share 0.75 1.12 1.50 1.87 2.25 7.49
MNRE Share 14.48 21.64 28.80 35.96 43.14 144.03
Private Share 3.91 5.86 7.81 9.77 11.72 39.07
Total Budget 19.14 28.63 38.11 47.60 57.11 190.58 Guidebook for development of Solar City: The “Guidebook for development of Solar City” is an integral part of the Master Plan. The guidebook provides generic information about general energy scenario, renewable energy scenario and energy efficiency initiatives in India, evolution of solar city concept, international solar city initiatives and local renewable network in its first two chapters. The third chapter describes the solar city programme in India and its objectives, targets and guidelines. Indicative renewable energy devices and energy efficiency measures are described in chapter 4 & 5. Financial models have been suggested in the 6th Chapter Financial Schemes and

3
Business Models to enable the city to implement the strategies listed here. The implementation phase under this programme will be the key indicator to determine the level of success for this MNRE programme. The 6th Chapter cites numerous schemes available in India as well as various business models which can be emulated for successful implementation of RE & EE projects. Not only financing but capacity building and awareness generation go hand in hand to ensure sustainability of the MNRE programme. All activities from developing a “Solar City Cell” to workshops and training have been discussed in the 7th Chapter Implementation Strategy for Solar City Programme. 8th Chapter Risk Analysis describes the risks involved in developing renewable energy projects in the Indian context and suggests mitigation methods for the cities. A generic approach has been taken to provide the preventive measures however risks are city-specific and requires intrinsic detailing for individual projects. The master plan provides a framework to compare and analyze alternative strategies and policies, in order to facilitate Council’s review and the decision-making process. Achieving significant reduction in energy consumption requires collective effort by all City departments, other government departments, businesses, industries and citizens. The City needs to become a bolder leader in its policies, planning, programs, advocacy and its own operations – there is a tremendous opportunity and need to demonstrate Community Leadership. The investigation showed that the biggest energy saving potential is in the residential sector and most significant RES potential is for solar energy projects. It is the responsibility of leaders in all tiers of government, commerce, industry and civil society to promote action towards more efficient and renewable energy use.

4

5
Table of Contents
ACKNOWLEDGEMENT ....................................................................................................................................... i CONSULTED ORGANISATIONS: ......................................................................................................................... ii MNRE TEAM: ................................................................................................................................................... iii DEPARTMENT OF URBAN DEVELOPMENT AND POVERTY ALLEVIATION (DUDPA) AND ZORAM ENERGY DEVELOPMENT AGENCY (ZEDA) TEAM: .......................................................................................................... iii ICLEI SOUTH ASIA TEAM: ................................................................................................................................. iii EXECUTIVE SUMMARY ..................................................................................................................................... 1 1. INTRODUCTION ................................................................................................................................... 7 1.1. Aizawl City Profile ................................................................................................................................ 7 1.2. Population Distribution ....................................................................................................................... 7 1.2.1. Location ............................................................................................................................................... 8 1.2.2. The Climate ......................................................................................................................................... 8 1.2.3. Civil Administration ............................................................................................................................. 8 1.2.4. Economy .............................................................................................................................................. 8 1.2.5. Education ............................................................................................................................................ 8 1.3. Developing Aizawl as ‘Solar City’ ......................................................................................................... 8 1.3.1. Preparation of Master Plan for ‘Aizawl Solar City’ .............................................................................. 9 2. ENERGY BASELINE STATUS OF AIZAWL CITY ..................................................................................... 11 2.1. Residential Sector .............................................................................................................................. 13 2.2. Commercial Sector ............................................................................................................................ 14 2.3. Industrial Sector ................................................................................................................................ 14 2.4. Government and Municipal Sector ................................................................................................... 15 3. ENERGY DEMAND FORECAST FOR AIZAWL ....................................................................................... 17 3.1. Forecasting Based on Population Growth ......................................................................................... 17 3.2. Forecasting Based on Past Data ........................................................................................................ 18 3.3. Goal for the year 2018 ...................................................................................................................... 18 4. RENEWABLE ENERGY STRATEGIES FOR AIZAWL ............................................................................... 19 4.1. Renewable Energy Resource Assessment ......................................................................................... 20 4.1.1. Solar Radiation .................................................................................................................................. 20 4.1.2. Waste generation .............................................................................................................................. 21 4.1.3. Liquid Waste from Sewage Treatment Plant .................................................................................... 21 4.1.4. Biomass Resources ............................................................................................................................ 22 4.2. RE Strategy for Residential sector ..................................................................................................... 22 4.2.1. RE Strategy for Government and Municipal Sector .......................................................................... 27 4.3. RE Strategy for Commercial and Institutional Sector........................................................................ 30 4.3.1. RE Strategy for Hotels ....................................................................................................................... 30 4.3.2. Renewable Energy Systems for Restaurants ..................................................................................... 32 4.3.3. Renewable Energy Systems for Hospitals ......................................................................................... 34 4.3.4. Renewable Energy Systems for Educational Institutes ..................................................................... 36 4.4. RE Strategy for Industrial Sector ....................................................................................................... 37 4.5. Waste to Energy Potential in Aizawl ................................................................................................. 38 4.6. Use of Wood Biomass for Thermal Application ................................................................................ 40 5. ENERGY EFFICIENCY STRATEGIES FOR AIZAWL ................................................................................. 43 5.1. EE Strategy for Residential sector ..................................................................................................... 44 5.2. EE Strategy for Government and Municipal Sector .......................................................................... 47 5.2.1. EE measures in Street Lighting .......................................................................................................... 49 5.2.2. Energy Efficiency Measures in Water Pumping ................................................................................ 51 5.2.3. Summary of EE Strategy for Government and Municipal Sector ...................................................... 52
6
5.3. EE Strategy for Commercial and Institutional Sector ........................................................................ 53 5.4. EE Strategy for Industrial Sector ....................................................................................................... 56 6. ACTION PLAN AND BUDGET .............................................................................................................. 59 6.1. Year-wise Goals of Energy Savings .................................................................................................... 59 6.2. Physical Target and Action Plan ........................................................................................................ 60 6.3. Implementation Strategy .................................................................................................................. 62 6.3.1. Establishment of the Solar City Cell .................................................................................................. 62 6.3.2. Awareness and Publicity ................................................................................................................... 62 6.3.3. Implementation of RE Strategy ......................................................................................................... 63 6.3.4. Renewable Energy Pilot Projects ...................................................................................................... 65 6.4. Financial outlays and sharing of fund ............................................................................................... 67 6.5. Potential Carbon Market Benefit ...................................................................................................... 69

7
CHAPTER 1
1. INTRODUCTION
1.1. Aizawl City Profile Aizawl, the capital of Mizoram state in India, is situated on a hill top with a beautiful scenery from all sides. The city is located north of the Tropic of Cancer in the northern part of Mizoram and is situated on a ridge 1132 metres (3715 ft) above sea level, with the Tlawng river valley to its west and the Tuirial river valley to its east. In the summer the temperature ranges from 20-30 deg Celsius, and in the winter 11-21 deg Celsius. Aizawl is a beautiful place that offers plenty of tourist attractions to tourists and habitants alike. Besides its breathtaking beauty, Aizawl is the storehouse of important Government offices, State Assembly House and Civil Secretariat. Various varieties of jungle products, monuments and memorials connected with legends and folklores are also available.
1.2. Population Distribution As of 2001 India census, Aizawl had a population of 228,280. Males constitute 50.80% of the population and females made up the remaining 49.20%. Mizos from various tribes make up the majority of the population. Christianity is the dominant religion in the city. Presbyterians make up the majority of the population. However, there are also significant numbers of the Salvation Army, Baptists, Seventh Day Adventists, United

8
Pentecostal Church and Roman Catholics in the city. There are also some cultural based Christian sects. Hinduism and Islam are also represented in very small numbers in the city population.
1.2.1. Location The city of Aizawl is located at the longitude 92.94oE and latitude 23.42oN. Aizawl is located north of the Tropic of Cancer in the northern part of Mizoram. It is situated on a ridge 1,132 metres (3715 ft) above sea level, with the Tlawng river valley to its west and the Tuirial river valley to its east.
1.2.2. The Climate The climate of Aizawl city is characterized by its coolness, relative high humidity nearly all the year round and abundant rainfall. The cold season from December to February is followed by the summer season from last part of February to the last week of May. The months of April, May, and June are usually hot. The south west monsoon season which follows thereafter continues till the first week of October. The rest of October and November constitute the autumn season. During the period from May to September, the skies are heavily clouded. In the cold season the skies are generally light in colour except on occasions when it is affected by passing western disturbances when short spells of cloudy weather occur which are followed by increase of cloudiness from March onwards. In the same way, most of the areas receive sufficient sunshine during the summer seasons. Whereas, most of the northern slopes receive insufficient sunshine due to over shadow of the sun's light by the hill slopes and ridges. The city temperature varies from 4oC to 31o C with an average humidity of 90%. Temperature begins to decrease rapidly from about the end of November. January is the coldest month with the mean daily maximum temperature at 20.2°C and the mean daily minimum of 11.4° C. During the cold season minimum day temperature goes down below 50C. April and May are the warmest months with mean daily maximum at about 26.3°C and the mean daily minimum at 17.5°C. The average temperature in winter is 11.8oC to 21.3°C and in summer it is 20.8°C to 29.80°C.
1.2.3. Civil Administration The Aizawl Municipal Council is formed in 2010 with 19 Ward Members. The Council is Administered by one elected Chairman, Vice Chairman and three Executive members.
1.2.4. Economy The Economy of Aizawl is basically sustained by Government services as it is Capital of Mizoram. The Major Banks are also located within Aizawl.
1.2.5. Education Education in Aizawl was mainly run by missionaries. Schools run by the Baptist Church of Mizoram, the Presbyterian Church of India, several Roman Catholic religious orders & the Seventh Day Adventists are among the best schools in Aizawl. Pachhunga University College was among the earliest college founded in 1958. Mizoram University established in 2001 provides affiliation to all the Colleges in Mizoram. Plans are being made to start a medical college, a National Institute of Technology & Indian Institute of Mass Communication.
1.3. Developing Aizawl as ‘Solar City’ The Ministry of New and Renewable Energy (MNRE), Govt. of India has launched a Scheme on “Development of Solar Cities” under which a total of 60 cities/towns are proposed to be supported for development as

9
“Solar/ Green Cities” during the 11th Plan period. The program aims at minimum 10% reduction in projected demand of conventional energy at the end of five years, which can be achieved through a combination of energy efficiency measures and enhancing supply from renewable energy sources. Out of this 5% will be from renewable energy source. MNRE has been providing financial support to the Department of Urban Development & Poverty Alleviation (Government of Mizoram) for preparing a Master Plan for developing Aizawl as a Solar City.
1.3.1. Preparation of Master Plan for ‘Aizawl Solar City’ The master plan preparation process is divided into six steps:
(i) Preparing energy base-line for year 2008 Energy base-line for the city is a detailed documentation of the existing energy demand and supply scenario for the city. Among other things, it consists of sector-wise energy consumption matrix and energy supply-mix for the base year. The city is divided into four sectors vis. Residential, commercial/ Institutional, Industrial and Municipal sector.
(ii) Demand Forecasting for 2013/2018 This step involves predicting the energy demand for 5 year and 10 year periods. To estimate the demand, growth in energy use in different sectors has been established. These growth rates are established based on immediate past trends and future growth plans. Based on the past time-series data and information on growth plans, growth rate in energy demand for different sectors has been estimated. These growth rates are used for making future projection of energy demand in each sector for year 2013 (five year) and 2018 (10 year).
(iii) Sector wise strategies This step involves carrying out techno-economic feasibility of different renewable energy and energy efficiency options for each sector based on techno-economic feasibility for such application to the concerned sectors. A renewable energy resources assessment has been done to identify the potential renewable energy sources for the city. This includes assessment of solar radiation, wind power density and availability, biomass resources and municipal/industrial wastes. A strategy has been prepared for use of techno economically feasible renewable energy technology options in each sector.
(iv) Year-wise goals of savings Year wise goals have been set to achieve targeted energy savings through demand side management by energy conservation and energy efficiency measures in different sectors & supply side measures based on renewable energy applications.
(v) Action Plan A five-year action plan has been prepared to achieve the set goals & expected GHG abatements. This includes establishment of solar city cell, capacity building and awareness generation.
(vi) Financial Outlay and sharing of fund An indicative financial outlay has been prepared for implementation of the proposed five-year action plan and potential sources of funding from respective sources (both public and private) has been indicated.

10

11
CHAPTER 2
This chapter gives details of electrical energy consumption for the Aizawl city for past 5 years. The consumption has been shown for different energy sources viz. electricity, LPG, diesel, petrol, kerosene, coal, firewood etc. The chapter also provides use of different electrical appliances based on the primary sample survey in Residential; Commercial & Institutional; Government & Municipal and Industrial sector.
2. ENERGY BASELINE STATUS OF AIZAWL CITYApart from electricity, the other main source of energy in the Aizawl city is diesel, petrol, coal/charcoal, kerosene, LPG and firewood. The people in the town use LPG, coal/charcoal, kerosene and wood to cook, to heat the water and other household activities. Majority of coal / charcoal is used for space heating during winter. Diesel and petrol are primarily used for vehicles. While electricity, diesel, petrol, LPG and coal show an increasing trend in consumption, consumption of kerosene found to be same for last five years and consumption of firewood shows a decreasing trend. The table below presents the consumption of energy in the city.
Table 1 : Energy sources and consumption in Aizawl city 1
Energy Sources Units 2003-04 2004-05 2005-06 2006-07 2007-08 Electricity KWh 56579431 62237374 70376143 80617428 90328441
LPG (kg) Kg 686126 727696 764507 810377 859000
Kerosene KL 7920 7920 7920 7920 7920
Diesel KL 13471 14560 16695 18304 27578
Petrol KL 8207 9613 9967 10266 10578
Fire Wood Kg 881947 839950 799952 761859 725580
Coal / Charcoal Kg 12340206 13574227 14931650 16424815 18067296
Table 2 : Energy sources and consumption in equivalent Million Units of electricity
Energy Sources 2003-04 2004-05 2005-06 2006-07 2007-08 Electricity 56.58 62.24 70.38 80.62 90.33
LPG 9.97 10.58 11.11 11.78 12.49
Kerosene 59.48 59.48 59.48 59.48 59.48
Diesel 153.25 165.64 189.92 208.23 313.73
Petrol 75.75 88.72 91.99 94.75 97.63
Fire Wood 3.08 2.93 2.79 2.66 2.53
Coal / Charcoal 120.53 132.59 145.84 160.43 176.47
478.64 522.17 571.52 617.94 752.66
1 Sources: State Electricity Board, Oil Marketing Companies, District Supply Officer, Local Coal Merchants, Local Firewood merchants

12
Figure 1 : Energy sources and consumption growth in Aizawl Town
Figure 2 : Distribution of energy consumption based on energy sources in Aizawl
Figure 3 : Distribution of energy consumption excluding petrol & diesel
13
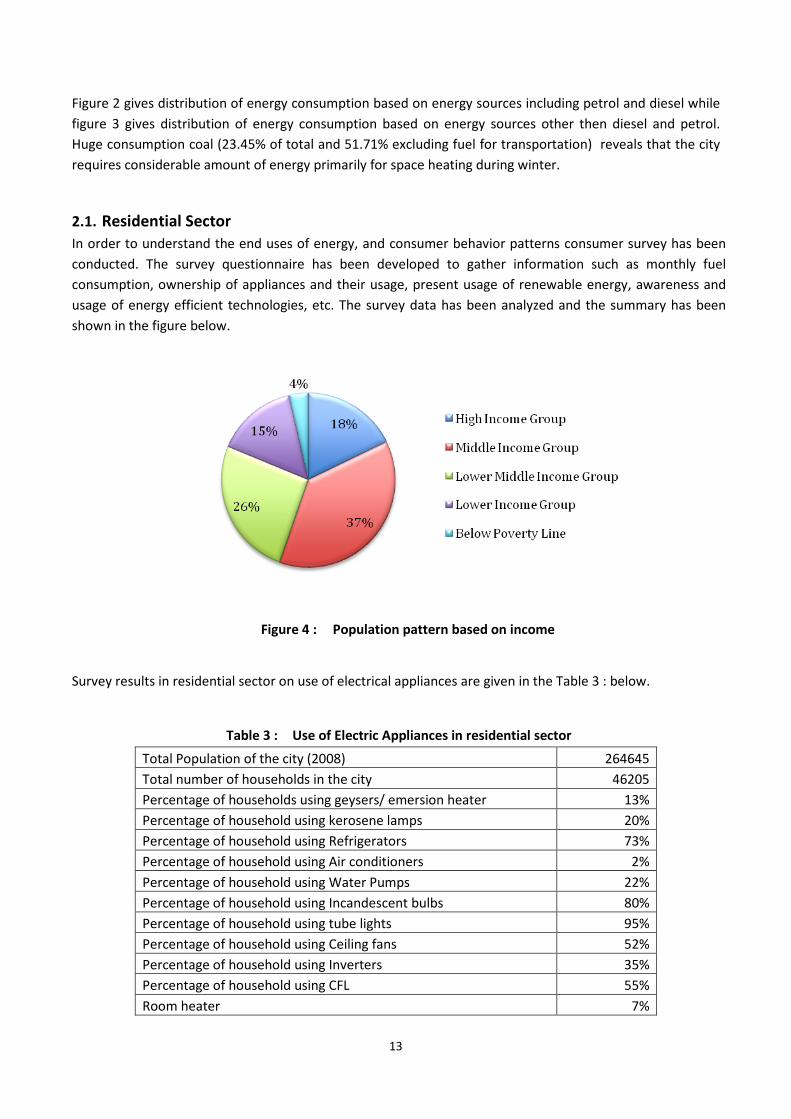
Figure 2 gives distribution of energy consumption based on energy sources including petrol and diesel while figure 3 gives distribution of energy consumption based on energy sources other then diesel and petrol. Huge consumption coal (23.45% of total and 51.71% excluding fuel for transportation) reveals that the city requires considerable amount of energy primarily for space heating during winter.
2.1. Residential Sector In order to understand the end uses of energy, and consumer behavior patterns consumer survey has been conducted. The survey questionnaire has been developed to gather information such as monthly fuel consumption, ownership of appliances and their usage, present usage of renewable energy, awareness and usage of energy efficient technologies, etc. The survey data has been analyzed and the summary has been shown in the figure below.
Figure 4 : Population pattern based on income
Survey results in residential sector on use of electrical appliances are given in the Table 3 : below.
Table 3 : Use of Electric Appliances in residential sector
Total Population of the city (2008) 264645 Total number of households in the city 46205 Percentage of households using geysers/ emersion heater 13% Percentage of household using kerosene lamps 20% Percentage of household using Refrigerators 73% Percentage of household using Air conditioners 2% Percentage of household using Water Pumps 22% Percentage of household using Incandescent bulbs 80% Percentage of household using tube lights 95% Percentage of household using Ceiling fans 52% Percentage of household using Inverters 35% Percentage of household using CFL 55% Room heater 7%

14
2.2. Commercial Sector Similar to the residential sector, a survey questionnaire has been prepared for commercial sector to understand the energy usage. There are about 7400 commercial/ institutional consumers in Aizawl. The summary of the survey is given below.
Figure 5 : Commerical and institutional consumers in Aizawl
Table 4 : Use of Electric Appliances in commercial sector
Total Number of Consumers 7364 Percentage of consumer using Refrigerators 43% Percentage of consumer using Air-Conditioners 8% Percentage of consumer using Water Pumps 10% Percentage of consumer using Incandescent Bulbs 45% Percentage of consumer using Tube Lights 94% Percentage of consumer using Ceiling Fans 47% Percentage of consumer using Inverters 27% Percentage of consumer using Generators 21%
2.3. Industrial Sector There are about 3157 small industrial units in Aizawl. Type of industries are segregated and shown in the figure 6 below.

15
Figure 6 : Segragation of Industrial sector
Table 5 : Use of Electrical Appliances in industrial sector
Total Number of consumers 3157 Percentage of consumers using Water Pumps 4% Percentage of consumers using Incandescent bulbs 86% Percentage of consumers using tube lights 98% Percentage of consumers using Ceiling fans 32%
2.4. Government and Municipal Sector Government offices and other municipal facilities in the Aizawl city are shown in the table below.
Table 6 : Use of Electric Appliances in industrial sector Sl. No. Particulars Numbers
1 Government Buildings 37 2 Municipal Markets/ complexes 12 3 Parks 1 4 Bus stand 6 5 Bus shelter 4 6 Street Lights - 400 watt HPSV 280 7 Street Lights - 250 watt HPSV 1513 8 Street Lights - 150 watt HPSV 227 9 Street Lights - 70 watt HPSV 1973
10 Street Lights - 40 watt fluorescent 153 12 Water Supply system - Pumping station details, capacity etc. 4 13 Total length of main road within city 104 km 14 Total length of sub ways 680 km 15 Total number of Traffic Point 15 16 Monuments 2

16

17
CHAPTER 3 This chapter forecasts the future consumption of Aizawl based on baseline energy consumption, past data and population growth. The forecasts figure gives us a clear view of the future conventional energy demands in the city based on which the strategies have been developed and substantiated. 3. ENERGY DEMAND FORECAST FOR AIZAWL Energy demand growth has been projected based population growth and time-series data on energy use during last five years. Since transport sector is not being covered under solar city scheme, petrol and diesel consumption has not been taken into account for preparing the baseline. 3.1. Forecasting Based on Population Growth Population projection for Aizawl Municipal Area has been taken from the City Development Plan (CDP) under JNNURM scheme.
Table 7 : Population Projection till 2018 2008 2013 2018
Households Population Households Population Households Population 46205 264645 55007 315060 63809 365475
Table 8 : Energy Consumption (MU) forecast till 2018
Energy Sources 2007-08 2013 2018 Population 264645 315060 365475
Electricity 90.33 107.54 124.74
LPG 17.85 21.25 24.65
Kerosene 79.62 94.79 109.96
Fuel Wood/ Fire Wood 2.53 3.01 3.50
Coal / Charcoal 176.47 210.09 243.71
Total Energy Consumption (MU) 366.80 436.67 506.55
Figure 7 : Energy consumption (MU) forecast based on population growth

18
3.2. Forecasting Based on Past Data Based on the past data, a linear growth has been considered for the projection.
Table 9 : Energy Consumption Forecast for Aizawl City (MU)
Energy Sources 2003-04 2004-05 2005-06 2006-07 2007-08 2013 2018 Electricity 56.58 62.24 70.38 80.62 90.33 132.14 175.08
LPG 9.97 10.58 11.11 10.41 11.63 12.94 14.51
Kerosene 59.48 59.48 59.48 59.48 59.48 59.48 59.48
Fuel Wood/ Fire Wood 3.08 2.93 2.79 2.66 2.53 1.84 1.16
Coal / Charcoal 120.53 132.59 145.84 160.43 176.47 244.98 314.84
249.64 267.81 289.61 313.60 340.44 451.38 565.07
Figure 8 : Forecasting of Energy Consumption (MU) based on past data
3.3. Goal for the year 2018 The maximum energy consumption in all sectors other then transport sector is projected as 565.07 Million Units. Therefore, goal for reduction in energy consumption through implementation of solar city programme is set as 56.51MU.

19
CHAPTER 4
This chapter delves into renewable energy resource assessment and strategy for introducing different Renewable Energy Technologies in different sectors of Aizawl city. Renewable energy resource availability and potential is a key criterion for suitable renewable energy technology installations and success. The chapter later develops the strategies for Aizawl city based on the renewable energy available in the city and the baseline energy consumption and future energy demands of the city.
4. RENEWABLE ENERGY STRATEGIES FOR AIZAWL The main objective of this chapter is to identify available renewable energy resources in Aizawl city and carry out techno-economic feasibility of different renewable energy options for residential, commercial, industrial and municipal sector and making a priority listing of the options. A renewable energy resources assessment has been done to identify the potential renewable energy sources for the Aizawl city. This includes assessment of solar radiation, wind power density and availability, biomass resources and municipal/industrial wastes etc. The strategy has been prepared for each sector identifying most techno economically viable renewable energy options considering wide range of potential consumers in the particular sector. An implementation target for development of solar city project in 5 years period has been set with an objective to meet at least 5% energy consumption from renewable energy on completion of the solar city project in Aizawl. For the residential sector, potential for introducing the following renewable energy devices has been worked out based on present energy use pattern of the residents, economic level, availability of such products and economic feasibility.
(i) Solar Water Heaters (ii) Solar Cookers (iii) Solar Lanterns (iv) Solar Home System (v) Solar PV system for Home Inverters
Commercial and Institutional Sector has been divided in to four broad categories as below and these categories again sub divided into further categories based on their capacity and functional differences.
(i) RE Strategy for Hotels (ii) RE Strategy for Restaurants (iii) RE Strategy for Hospitals (iv) RE Strategy for Educational Institutes
On the spot assessment have been carried out visiting each of these sub categories to identify present

20
energy demand, energy and fuel used, load shedding occurs, standby power supply provision, space available for installation of solar arrays and collectors etc. Based on the site visit and energy demand assessment, preliminary design/sizing of appropriate renewable energy devices have been worked out for each category establishment. An indicative budgetary financial implication, energy savings, payback period and GHG emission reduction has been estimated for each renewable energy option that has been suggested. Industrial sector is broadly divided into five categories. Suitable renewable energy technologies have been suggested for each of the category.
(i) Wood based industries (ii) Handlooms (iii) Handicrafts (iv) Food processing industries (v) Steel fabrication industries
Government & Municipal Sector is divided into three categories and options for appropriate renewable energy technologies have been recommended based on the assessment made on each category of the sector.
(i) Government Office Buildings (ii) Outdoor lighting for public places like parks, bus shelters, monuments etc (iii) Outdoor lighting Road safety- Street light, road blinkers, road studs etc
4.1. Renewable Energy Resource Assessment A preliminary assessment has been done for solar, wind and biomass resources and energy recovery potential from municipal solid waste and sewage treatment plant. While biomass data is for entire Aizawl district, there is no hydro potential in the city. 4.1.1. Solar Radiation Aizawl (92.72oE and 23.73oN) receives good amount of solar radiation with an annual average of 4.68kWh/ m2/day. Wind velocity in the city is low and cannot be considered for energy generation from wind.
Table 10 : Solar and wind data for Aizawl City Jan Feb Mar Apr May Jun Jul Aug Sep Oct Nov Dec Annual
Monthly Averaged Insolation Incident on a Horizontal Surface (kWh/M2/Day) kWh/m2/day 4.53 5.09 5.57 5.53 4.98 4.48 4.32 4.47 4.32 4.38 4.3 4.3 4.68
Monthly Averaged Wind Speed At 50 m Above The Surface Of The Earth (m/s) m/sec 2.48 2.62 2.76 2.52 2.38 2.72 2.68 2.47 2.14 2.02 2.14 2.25 2.43
Monthly Averaged Air Temperature At 10 m Above The Surface Of The Earth (°C) Minimum (deg C) 10.8 13.3 17.2 20.3 22.2 23.4 23.2 23.2 22.5 20.7 17 12.8 18.9 Maximum (deg
24.1 26.3 28.8 29.4 29.3 28.6 28.2 28.6 28.4 28.3 26.7 24.7 27.6

21
Figure 9 : Solar and wind potential in Aizawl
Figure 10 : Annual ambient temperature profile of Aizawl
4.1.2. Waste generation At present in Aizawl city have no proper/ scientific system of collection or disposal of solid waste. Only a fraction of total city solid wastes are collected and disposed at a Dumping Station at Tuirial about 20 kms away from Aizawl City Core area. As per the City Development Plan under JNNRUM, estimated quantity of solid waste generated in the city is 120Mt/day out of which an estimated amount of 30Mt per day is being disposed off to the dumping ground. 4.1.3. Liquid Waste from Sewage Treatment Plant In the city of Aizawl the need for proper / better sanitation is overdue. The situation is technically complicated due to less managed land use, congestion in excess, shortage of road width, sharp slope, and last but not the least, soil/rock nature. A sewerage scheme for the city of Aizawl has been prepared by PHED with the salient features below2
2 City Development Plan for Aizawl (under JNNURM)
:
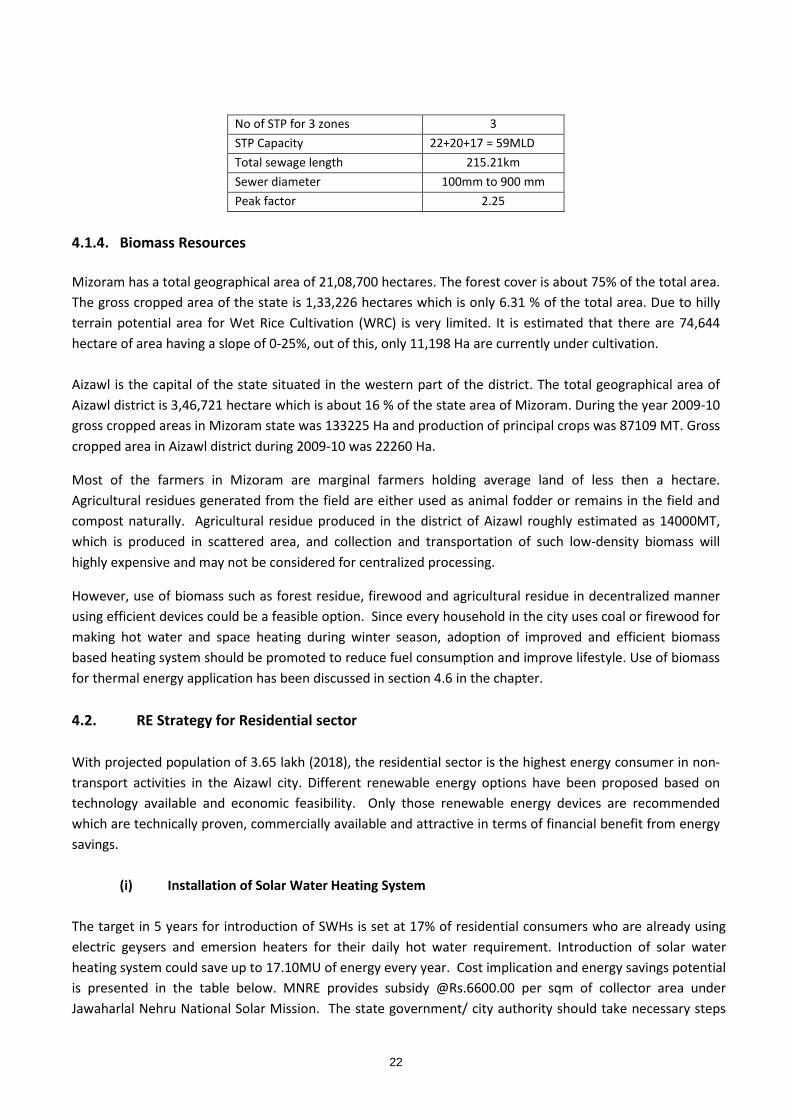
22
No of STP for 3 zones 3 STP Capacity 22+20+17 = 59MLD Total sewage length 215.21km Sewer diameter 100mm to 900 mm Peak factor 2.25
4.1.4. Biomass Resources Mizoram has a total geographical area of 21,08,700 hectares. The forest cover is about 75% of the total area. The gross cropped area of the state is 1,33,226 hectares which is only 6.31 % of the total area. Due to hilly terrain potential area for Wet Rice Cultivation (WRC) is very limited. It is estimated that there are 74,644 hectare of area having a slope of 0-25%, out of this, only 11,198 Ha are currently under cultivation. Aizawl is the capital of the state situated in the western part of the district. The total geographical area of Aizawl district is 3,46,721 hectare which is about 16 % of the state area of Mizoram. During the year 2009-10 gross cropped areas in Mizoram state was 133225 Ha and production of principal crops was 87109 MT. Gross cropped area in Aizawl district during 2009-10 was 22260 Ha.
Most of the farmers in Mizoram are marginal farmers holding average land of less then a hectare. Agricultural residues generated from the field are either used as animal fodder or remains in the field and compost naturally. Agricultural residue produced in the district of Aizawl roughly estimated as 14000MT, which is produced in scattered area, and collection and transportation of such low-density biomass will highly expensive and may not be considered for centralized processing.
However, use of biomass such as forest residue, firewood and agricultural residue in decentralized manner using efficient devices could be a feasible option. Since every household in the city uses coal or firewood for making hot water and space heating during winter season, adoption of improved and efficient biomass based heating system should be promoted to reduce fuel consumption and improve lifestyle. Use of biomass for thermal energy application has been discussed in section 4.6 in the chapter. 4.2. RE Strategy for Residential sector With projected population of 3.65 lakh (2018), the residential sector is the highest energy consumer in non-transport activities in the Aizawl city. Different renewable energy options have been proposed based on technology available and economic feasibility. Only those renewable energy devices are recommended which are technically proven, commercially available and attractive in terms of financial benefit from energy savings.
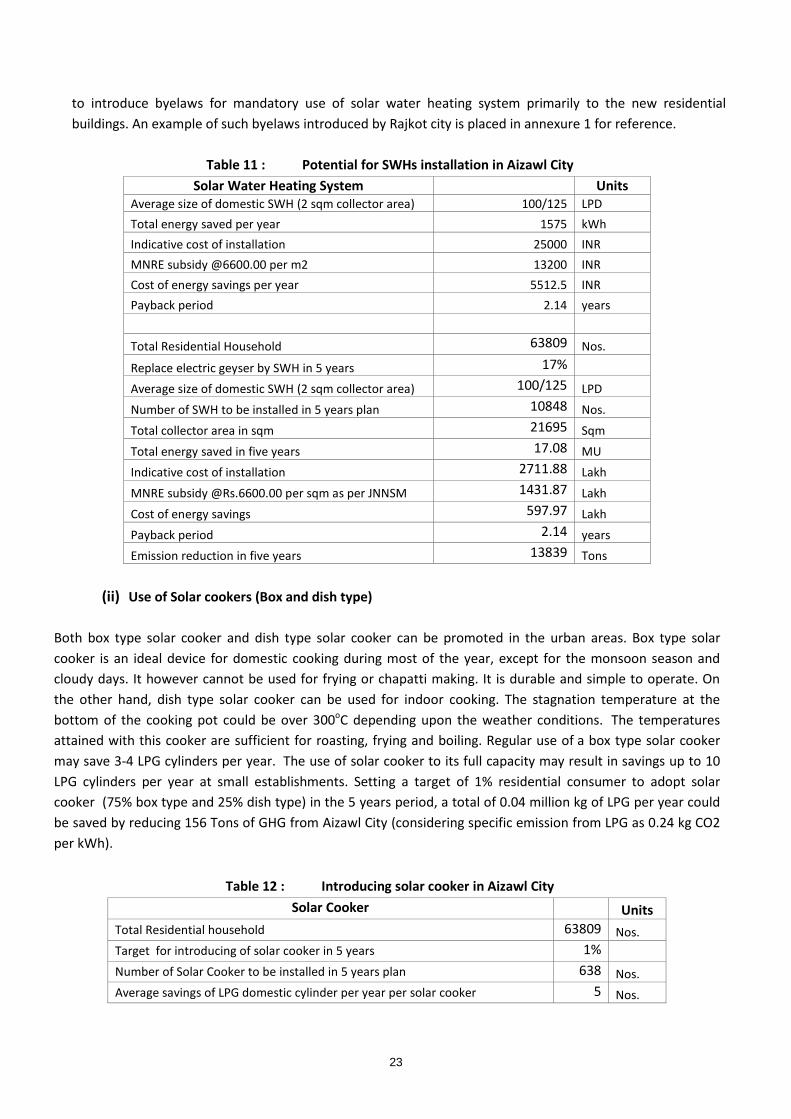
(i) Installation of Solar Water Heating System The target in 5 years for introduction of SWHs is set at 17% of residential consumers who are already using electric geysers and emersion heaters for their daily hot water requirement. Introduction of solar water heating system could save up to 17.10MU of energy every year. Cost implication and energy savings potential is presented in the table below. MNRE provides subsidy @Rs.6600.00 per sqm of collector area under Jawaharlal Nehru National Solar Mission. The state government/ city authority should take necessary steps
23
to introduce byelaws for mandatory use of solar water heating system primarily to the new residential buildings. An example of such byelaws introduced by Rajkot city is placed in annexure 1 for reference.
Table 11 : Potential for SWHs installation in Aizawl City Solar Water Heating System Units
Average size of domestic SWH (2 sqm collector area) 100/125 LPD Total energy saved per year 1575 kWh Indicative cost of installation 25000 INR MNRE subsidy @6600.00 per m2 13200 INR Cost of energy savings per year 5512.5 INR Payback period 2.14 years Total Residential Household 63809 Nos.
Replace electric geyser by SWH in 5 years 17% Average size of domestic SWH (2 sqm collector area) 100/125 LPD Number of SWH to be installed in 5 years plan 10848 Nos. Total collector area in sqm 21695 Sqm Total energy saved in five years 17.08 MU Indicative cost of installation 2711.88 Lakh MNRE subsidy @Rs.6600.00 per sqm as per JNNSM 1431.87 Lakh Cost of energy savings 597.97 Lakh Payback period 2.14 years Emission reduction in five years 13839 Tons
(ii) Use of Solar cookers (Box and dish type)
Both box type solar cooker and dish type solar cooker can be promoted in the urban areas. Box type solar cooker is an ideal device for domestic cooking during most of the year, except for the monsoon season and cloudy days. It however cannot be used for frying or chapatti making. It is durable and simple to operate. On the other hand, dish type solar cooker can be used for indoor cooking. The stagnation temperature at the bottom of the cooking pot could be over 300oC depending upon the weather conditions. The temperatures attained with this cooker are sufficient for roasting, frying and boiling. Regular use of a box type solar cooker may save 3-4 LPG cylinders per year. The use of solar cooker to its full capacity may result in savings up to 10 LPG cylinders per year at small establishments. Setting a target of 1% residential consumer to adopt solar cooker (75% box type and 25% dish type) in the 5 years period, a total of 0.04 million kg of LPG per year could be saved by reducing 156 Tons of GHG from Aizawl City (considering specific emission from LPG as 0.24 kg CO2 per kWh).
Table 12 : Introducing solar cooker in Aizawl City Solar Cooker Units
Total Residential household 63809 Nos. Target for introducing of solar cooker in 5 years 1% Number of Solar Cooker to be installed in 5 years plan 638 Nos. Average savings of LPG domestic cylinder per year per solar cooker 5 Nos.

24
Total LPG saved in five years 0.04 kg Total energy saved in five years 0.65 MU Indicative cost of installation (75% box type & 25% SK-14) 35.89 Lakh MNRE subsidy@60% of system cost as per JNNSM guidelines 21.54 Lakh Cost of energy savings 11.17 Lakh Payback period 1.29 years Emission reduction in five years 156 Tons
(iii) Solar lanterns to replace kerosene lamps/ candles
Solar lantern has the average capacity of providing three hours of continuous light from a single charge per day, and can work as source of light for poor families without electricity. Kerosene is the main source of burning light in economically weaker families in Aizawl and most of the people use candles during load shedding hours and survey results reveal that 20% of population use kerosene lanterns during load shedding to illuminate their houses. The city consumes about 8million liters of kerosene every year. Average consumption of kerosene per household is 2-5 litres per month. Assuming a household uses 3-4 lanterns, consumption of one lantern will be about 3 litres per month. Targeting 10% of population to replace at least one kerosene lantern with solar lantern can save 0.15 million litres of kerosene per year reducing 389 Tons of GHG per year. Detailed techno commercial is provided in the table below.
Table 13 : Introducing solar lanterns in Aizawl City
Solar Lantern Unit Capacity of residential Solar Home System 10 Wp Number lights per Solar Home System 1 Nos. Number of Kerosene lamp replaced by SL 1 Nos. Consumption of kerosene per lanterns/month 2 Litres Cost of kerosene per liters in the market 20 INR Cost of kerosene per year per household 480 INR Indicative cost of installing a SL 3000 INR MNRE subsidy @Rs.243.00 per Wp as per JNNSM 2430 INR Payback period when replacing the kerosene lamps 1.2 years Total Residential household 63809 Nos. Target to replace kerosene lamp in 5 years 10% Number of SL to be installed in 5 years plan 6381 Nos. Total kerosene lamp replaced 6381 Nos. Indicative cost of installation 191.43 Lakh Kerosene saved 153142 Litres Savings in terms of Electricity in five years 1.54 MU Cost of kerosene savings 30.63 Lakh MNRE subsidy @Rs.243.00 per Wp as per JNNSM 155.06 Lakh Payback period 1.2 years Emission reduction in five years 389 Tons

25
(iv) Use Solar Home Systems (SHS) A Solar Home System is a fixed indoor lighting system and consists of solar PV module, battery and balance of systems. Capacity of such system could be of 18Wp, 37Wp and 74Wp for different configuration. The luminaries used in the above systems comprise compact fluorescent lamp (CFL) of 7 W / 9 W / 11 W capacity respectively. The fan is of DC type with less than 20 W rating. One Battery of 12 V, 40 / 75 Ah capacity is also provided with SPV modules of 37Wp / 74Wp as required. The system will work for about 4 hours daily, if charged regularly. The Solar Home Lighting systems have been proposed to replace kerosene lamps used by 10% population in Aizawl city during load shedding hours. A 74Wp Solar Home System can replace 3-4 kerosene lamps with 4-5 hours backup hence replacing entire need of kerosene, which is estimated at an average of 5 litres per month per household. Assuming 10% replacement in the planned 5 years period an estimated amount of 0.38 million litres of kerosene could be saved per year reducing 972 Tons of GHG emission from the city. The potential of kerosene replacement with Solar Home Systems and financial implication thereon is indicated in the table below.
Table 14 : Introducing solar home system in Aizawl City
Solar Home System Units Capacity of residential Solar Home System 74 Wp Number lights per Solar Home System 4 Nos. Number of Kerosene lamp replaced by SHS 4 Nos. Consumption of kerosene per household/month (survey result) 5 Litres Cost of kerosene per litre in the market 20 INR Cost of kerosene per year per household 1200 INR Indicative cost of installing a SHS 22000 INR MNRE subsidy @Rs.243.00 per Wp as per JNNSM guidelines 17982 INR Payback period when replacing the kerosene lamps 3.3 years Total Residential household 63809 Nos. Target to replace kerosene lamp in 5 years 10% Number of SHS to be installed in 5 years plan 6381 Nos. Total kerosene lamp replaced 25524 Nos. Indicative cost of installation 1403.80 Lakh Kerosene saved 383 KL Savings in terms of Electricity 3.85 MU Cost of kerosene savings 77 Lakh MNRE Subsidy @Rs.243.00 per Wp as per JNNSM 1147 Lakh Payback period 3.3 years Emission reduction in five years 972 Tons
(v) Using Solar PV for Home Inverters
Use of solar panels to charge Home Inverter system could be an attractive option as standby power supply system during load shedding hours. In Aizawl city about 35% of household use inverters. Adopting 150Wp solar PV systems to charge their inverter battery, an aggregate of 3350kWp solar PV systems could be installed in the

26
residential buildings, which will generate 5.02 MU green energy per year and reduce the load demand and emission by 4070 Tons per year. It is assumed that MNRE will provide subsidy for these system @Rs.243.00 per Wp or 90% of system cost as per JNNSM guidelines. The potential of energy savings, green house gas emission reduction and budgetary financial implication is indicated in the table below.
Table 15 : Target for introducing Solar PV for Home Inverters in Aizawl City Solar PV for Home Inverters Unit
Capacity of solar PV system for Home Inverter 150 Wp Indicative cost of incorporating Solar PV to Home Inverter 37500 INR Total Residential household 63809 Nos. Target to introduce solar charger for inverter in 5 years 35% Number of solar inverter to be installed in 5 years plan 22333 Nos. Total PV capacity installed 3350 kWp Energy generated by PV arrays in five years 5.02 MU Cost of energy saved 176 Lakh Indicative cost of installation 8375 Lakh MNRE subsidy @Rs.243.00 per Wp as per JNNSM guidelines 8140 Lakh Payback period 1.33 Years Emission reduction in five years 4070 Tons
(vi) Summary of RE strategy for Residential Sector Implementation of renewable energy projects as proposed above will save 49.54MU energy per year, which will reduce GHG of 33370 Tons per year. When achieved the target, residential sector strategy will meet 87.67% of total target for energy savings for the city as per goal for developing solar cities. The entire target could be achieved with a total investment of about Rs.123.50cr in the 5 years period where contribution from MNRE will be about Rs.81.61cr as per JNNSM guidelines and balance fund of Rs.41.89cr could be met from the beneficiaries. It is recommended that promotion of solar water heating systems in residential sector should be given high priority, as energy savings from solar water heaters is the highest.
Table 16 : Summary of RE Strategy for Residential sector in Aizawl City
Physical Target Total Unit Target for the year of implementation
1 2 3 4 5
Solar Water Heater (100/125LPD) 6508 Nos. 1952 1627 1302 976 651
Solar Water Heater (200LPD) 5000 Nos. 1500 1250 1000 750 500
Solar Water Heater with HE (100LPD) 5000 Nos. 1500 1250 1000 750 500
Use of Solar cookers (dish type) 638 Nos. 191 160 128 96 64
LED Solar Home System (10Wp) 10000 Nos. 3000 2500 2000 1500 1000
Solar Home Systems (37Wp) 15000 Nos. 4500 3750 3000 2250 1500
Solar Home Systems (74Wp) 20000 Nos. 6000 5000 4000 3000 2000

27
Domestic Solar Pump (Av. 250Wp)* 15000 Nos. 4500 3750 3000 2250 1500
Total Budget* 12349.47 Lakh 1234.95 1852.42 2469.9 3087.37 3704.85
MNRE share 8160.58 Lakh 816.06 1224.09 1632.12 2040.15 2448.18 Beneficiaries share 4188.89 Lakh 418.89 628.33 837.78 1047.22 1256.67
4.2.1. RE Strategy for Government and Municipal Sector Being the capital of the state of Mizoram all Government Departments has offices in Aizawl including State Legislative Assembly. Apart from the government buildings/ institutions, other consumers in this sector are streetlights, markets, advertising hoardings, water supply etc. Renewable energy devices are suggested to all categories of consumers depending upon the energy demand. The sector has ample opportunity to save energy through introducing renewable energy and energy conservation measures and could show case these initiatives to encourage people to adopt further.
(i) Renewable Energy System for Government Buildings and Residential Complex Thirty-seven government buildings, educational and training Institutes, hospital campuses were identified and data collected to project renewable energy use in those establishments. Suggestion made for incorporation of solar PV and solar water heating systems in those buildings depending upon the requirement and feasibility for installation. Due to moderate to cold weather, Aizawl requires hot water for 5-6 months in a year. Solar water heating systems can be used for both hot water supply and space heating in government and institutional buildings. Similarly, solar PV systems can be used for uninterrupted power supply and reduce peak load in the office and institutional buildings. Table 17 shows government and institutional buildings in Aizawl with available area for installation of solar energy devices and recommended solar water heating systems and solar PV system. Installation of solar systems will save 1.84 MU energy/year at a cost of 23.85crores.
Table 17 : Government Office Buildings and residential Complex in Aizawl
Sl. No
. Name of the Building/ Campus
Description of function/
activities
Connected Load
(kW)
Area available to install solar
system (sqm)
Recommended Solar
Water Heaters
(LPD)
Recommended
Solar PV systems (kWp)
1 Women's Polytechnics Ed. Institute 200 3000 10000 40
2 Govt. Hrangbona College Ed. Institute 80 3000 5000 16
3 ZEDA Office 10 350 0 2 4 DIET Campus Trg. Centre 30 1000 0 6
5 Nazareth Hospital (R.N.) Hospital 30 1000 5000 6
6 Public Health Engineering Dept. Office 50 900 0 10 7 State Designated Agency (SDA) Office 10 200 0 2
8 Bethesda Hospital Hospital 10 800 5000 2
9 Central Jail Prison 50 3000 5000 10 10 I & PR Department Building Office 100 200 0 20
11 Land Revenue & Settlement Dept Office 100 600 0 20

28
12 Director of rural development Office 50 50 0 10 13 Tax Commissioner Office 20 50 0 4
14 Director of Trade & Commerce Office 30 50 0 6
15 S&WC building Office 100 2500 0 20 16 Director of Social Welfare Dept. Office 30 500 0 6
17 Mizoram Police Headquarters Office 50 1000 0 10
18 Director of School Education Office 20 200 0 4 19 MPSC Office 80 100 0 16
20 Director of Local Administration Office 50 100 0 10
21 Director of Industries Office 50 50 0 10 22 Director of Agricultural Office 20 200 0 4
23 Director of Tourism Office 10 150 0 2
24 Animal husbandry & Veterinary Office 30 150 0 6 25 Office of the CE/PWD Office 20 500 0 4
26 CE/PHE building Office 130 400 0 26
27 RIPANS Trg. Center 200 350 0 40 28 Central Agricultural University University 750 450 5000 150
29 Zoo Zoo 250 480 0 50
30 Pachhunga University College Ed. Institute 250 70 2000 50 31 Police Training Centre Trg. Center 250 1500 5000 50
32 UD & PA Office 10 100 0 2
33 Civil Secretariat Office 250 1000 0 50 34 Mizoram Legislative Assembly Assembly 120 2000 0 24
35 DOEACC Ed. Institute 250 150 0 50
Total potential 42000 3140
(ii) RE System for Outdoors lighting (Streets, Traffic, Road safety etc.) Aizawl has 104km main roads and 608kms pathways/subways. The city has about 4146 streetlights, which have been fixed for illumination streets, wards, etc. Due difficult hilly roads and pathways, many of them are difficult to provide with conventional street lightings. It is propose to introduce solar PV streetlights in the areas where there is no illumination and one such light in every three conventional lights to maintain minimum illumination level during load shedding hours. The tables below indicate targets, investment thereon and energy savings potential etc.
Table 18 : Solar PV Street Lighting System
Solar PV Street Lighting System Units Number of solar street lights proposed in every three existing streetlights 1400 Nos. Number of solar street lights proposed in areas where there is no streetlights 1000 Nos. Total number of solar streetlights 2400 Nos. PV module capacity 74 Wp Total PV Module capacity 178 kWp Total Investment @Rs.0.30 lakh/ system 720 Lakh

29
MNRE subsidy @Rs.243.00 per Wp 432 Lakh State/ city share 288 Lakh Energy Generated 0.27 MU Emission reduction 216 t/year
(iii) Summary of RE Strategy for Government and Municipal Sector The Government and Municipal sector can contribute 1.84 MU energy savings per year through introducing RE devices in the different government buildings, institutions, training centres, guesthouse and municipal utilities and services reducing GHG emission by 14677 Tons per year at an investment of 23.86 Cr.
Table 19 : Summary of RE Strategy for Government & Municipal Sector
Physical Target Total Unit
Target for the year of implementation 1 2 3 4 5
Solar water heaters for Hospitals and residential Institutes (1000 LPD average) 42 Nos. 4 6 8 11 13 Solar PV Power Plant for Office Buildings (Total 738 kWp of 2-150kWp capacity) 37 Nos. 4 6 7 9 11
Solar LED Street Light 6000 Nos. 600 900 1200 1500 1800
Solar PV Traffic Lights 20 Nos. 2 3 4 5 6
Solar Blinkers (37Wp) 200 Nos. 20 30 40 50 60
Road Stud 750 Nos. 75 113 150 188 225
Total Budget 2385.95 Lakh 238.6 357.89 477.19 596.49 715.79
MNRE share 2306.56 Lakh 230.66 345.98 461.31 576.64 691.97
Municipal/ State share 79.39 Lakh 7.94 11.91 15.88 19.85 23.82
(iv) Introducing Green Building features in new buildings The Aizawl Municipal authority may adopt byelaws to introduce Green Building concept in upcoming buildings in the city. A green building is one that utilizes its resources in as efficient a manner as possible, using as few natural resources as possible and conserving water, energy and managing waste. Passive design is an important feature to enable buildings to use lesser energy in their operation, and to reduce their impact on the surrounding environment. Development of green buildings is best done at the design and even pre-design stage itself, in order to ensure that measures are adopted in a comprehensive manner. However, at every stage of the building’s design, construction and operation, there are measures that can be taken to increase the building’s efficiency and to optimize its performance. Some such indicative measures are indicated in this chapter below.
A comprehensive green building design can target energy savings of 15-40% of a building’s overall energy consumption, and the extra capital costs incurred may be estimated at anywhere between 5-30% of the total project cost. However, the inclusion of green features into a building after construction has already begun may entail higher upfront costs. Please refer to the solar city guidebook (Chapter 5.10) for more information on energy efficient architecture and energy efficiency in buildings.

30
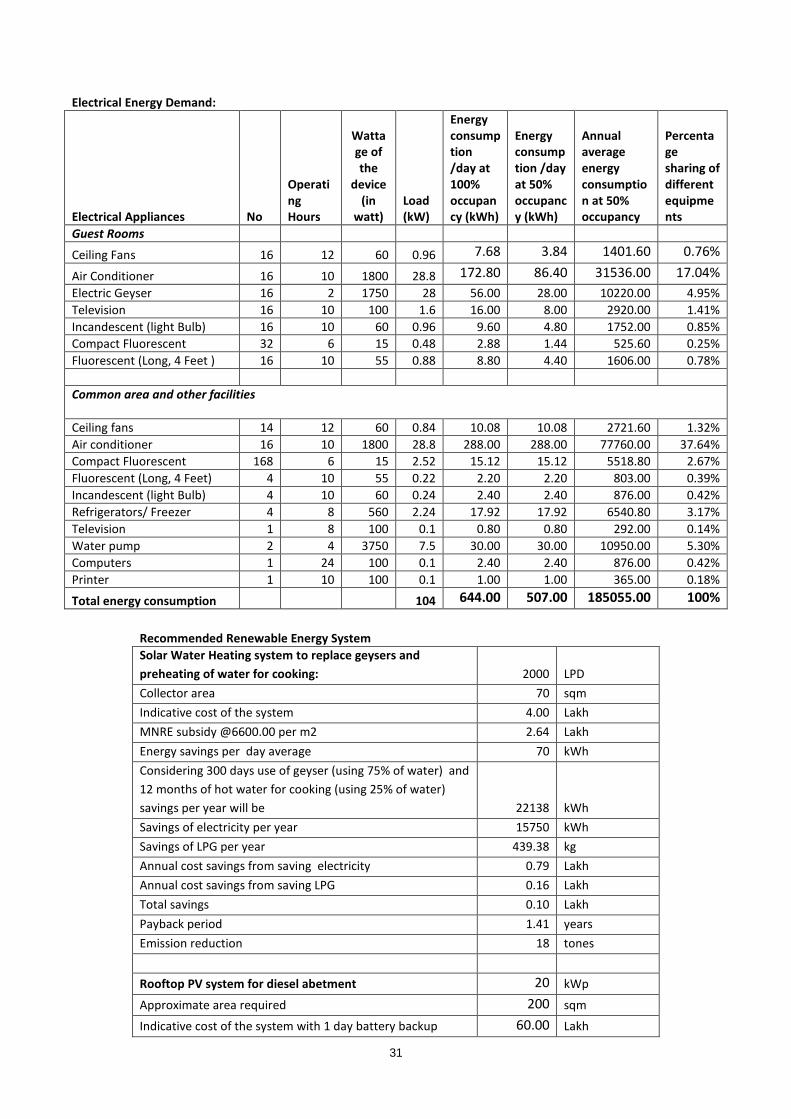
4.3. RE Strategy for Commercial and Institutional Sector The commercial sector also has a substantial part in energy consumption in Aizawl city. The sector consumes about 8% of total electricity consumed in the city with its 185 educational institutes, 25 medical service facilities, 39 hotels and restaurants and 105 odd restaurants. Different strategies are prepared for different categories of consumers based on type and quantum of energy consumed and availability of resource and space to generate renewable energy in their premises. While preparing the strategy, only techno economically viable and commercially available renewable energy options are considered. It is estimated that introduction of RE system in commercial and institutional sector in Aizawl city as described in the table 26 below will save 1.23 MU of energy in five years and reduce GHG emission by 721Tons. Introduction of solar water heater system should be given prime importance in the hotels. 4.3.1. RE Strategy for Hotels Case studies are made to assess renewable energy and energy conservation measures in hotels in Aizawl. Major energy requirement such as hot water and electricity during load shedding/ peak load could be met by solar energy. Solar thermal system can be used to generate hot water or steam for cooking. Solar PV power plant can be used to reduce or eliminate use of diesel generators which are being used during load shedding hours. Apart from that hotels also generate bio waste which can be used to produce biogas through bio-methanation process. Solar pumps and solar garden lights can be used for sprinkling water and beautification. Case Study A case study has been prepared for a typical a budget hotel. The tables below give us the energy appliances utilized by a typical budget hotel. Based on the energy baseline scenario specific renewable energy systems have been proposed which can help in energy saving at the case study site. The occupancy of the hotel has been taken to be 50% for the calculations mentioned below.
Table 20 : Case Study of Budget Hotel cum Bar & Restaurant No of rooms 16 Nos. Roof Area available 150 sqm Shadow free open space at ground 15 sqm Average Load Shedding 1-2 Hours/day Monthly LPG consumption for cooking 1620 kg Standby Power Supply System: Diesel Generator 1 (off peak load) 82.5 KVA
Average consumption of diesel per hour 16 liters/ hour
Diesel Generator 2 (peak load) 50 KVA
Average consumption of diesel per hour 12 Liters/hour
31
Electrical Energy Demand:
Electrical Appliances No
Operating Hours
Wattage of the
device (in
watt) Load (kW)
Energy consumption /day at 100% occupancy (kWh)
Energy consumption /day at 50% occupancy (kWh)
Annual average energy consumption at 50% occupancy
Percentage sharing of different equipments
Guest Rooms
Ceiling Fans 16 12 60 0.96 7.68 3.84 1401.60 0.76%
Air Conditioner 16 10 1800 28.8 172.80 86.40 31536.00 17.04% Electric Geyser 16 2 1750 28 56.00 28.00 10220.00 4.95% Television 16 10 100 1.6 16.00 8.00 2920.00 1.41% Incandescent (light Bulb) 16 10 60 0.96 9.60 4.80 1752.00 0.85% Compact Fluorescent 32 6 15 0.48 2.88 1.44 525.60 0.25% Fluorescent (Long, 4 Feet ) 16 10 55 0.88 8.80 4.40 1606.00 0.78% Common area and other facilities Ceiling fans 14 12 60 0.84 10.08 10.08 2721.60 1.32% Air conditioner 16 10 1800 28.8 288.00 288.00 77760.00 37.64% Compact Fluorescent 168 6 15 2.52 15.12 15.12 5518.80 2.67% Fluorescent (Long, 4 Feet) 4 10 55 0.22 2.20 2.20 803.00 0.39% Incandescent (light Bulb) 4 10 60 0.24 2.40 2.40 876.00 0.42% Refrigerators/ Freezer 4 8 560 2.24 17.92 17.92 6540.80 3.17% Television 1 8 100 0.1 0.80 0.80 292.00 0.14% Water pump 2 4 3750 7.5 30.00 30.00 10950.00 5.30% Computers 1 24 100 0.1 2.40 2.40 876.00 0.42% Printer 1 10 100 0.1 1.00 1.00 365.00 0.18%
Total energy consumption 104 644.00 507.00 185055.00 100%
Recommended Renewable Energy System Solar Water Heating system to replace geysers and preheating of water for cooking: 2000 LPD Collector area 70 sqm Indicative cost of the system 4.00 Lakh MNRE subsidy @6600.00 per m2 2.64 Lakh Energy savings per day average 70 kWh Considering 300 days use of geyser (using 75% of water) and 12 months of hot water for cooking (using 25% of water) savings per year will be 22138 kWh Savings of electricity per year 15750 kWh Savings of LPG per year 439.38 kg Annual cost savings from saving electricity 0.79 Lakh Annual cost savings from saving LPG 0.16 Lakh Total savings 0.10 Lakh Payback period 1.41 years Emission reduction 18 tones
Rooftop PV system for diesel abetment 20 kWp
Approximate area required 200 sqm
Indicative cost of the system with 1 day battery backup 60.00 Lakh

32
MNRE Subsidy @Rs.243.00 per Wp 48.60 Lakh
Approximate annual energy generation 30000 kWh
Fraction of DG power replaced 47%
Amount of diesel saved per year 9642 litres
Cost savings from diesel per year 3.85 Lakh
Annual O&M Cost of DG sets 1.00 Lakh
Payback period 2 years
Emission reduction 24 Tons Biogas system Organic Waste from kitchen and other services per day 30 kg Biogas plant recommended 3 CuM Investment 0.5 Lakh MNRE subsidy @50% 0.25 Lakh User’s share 0.25 Lakh LPG saved per year 438 kg Energy in terms of MU savings per year 0.0063 MU Cost savings per year 0.1752 Lakh Payback period 1.43 Years Emission Reduction per year 0.267 Tons
4.3.2. Renewable Energy Systems for Restaurants Aizawl has a number of restaurants and eateries. The city has more than 105 restaurants and which are categorised as large restaurant, medium restaurants/Dhabas and small restaurants. Solar water heaters can easily be introduced in these restaurants to meet their hot water demand for cooking and utensil cleaning. Since all the restaurants are using DG sets as standby power supply source during load shedding, PV power plant will be an attractive and profitable option for the restaurants. Introduction of RE system in 25% of restaurants in Aizawl city as described in the table below will save 0.24 MU of energy per year and reduce GHG emission by 187 Tons. Introduction of solar water heater system should be given prime importance followed by biogas system and solar PV system for diesel abatement. Case Study Case study of energy consumption and waste generation in a typical restaurant is presented below.
Table 21 : Case Study of Restaurant Roof Area available 150 sqm Connected load 50 kW Average Load Shedding 1-2 Hours/day Monthly LPG consumption for cooking 2700 kg Organic waste generated 100-120 Kg/day Standby Power Supply: Diesel Generator 65 KVA Average consumption of diesel per year 11.52 kL

33
Electrical Energy Demand: Electrical Appliances Nos. Operati
ng Hours
Load (W)
Total Load (kW)
Energy consumption /day
(kWh)
Use per year
Energy Consumpt
ion per year
(kWh)
Ceiling Fans (12 months) 5 12 60 0.30 2.40 365.00 876
Air Conditioner (12 months) 4 10 2000 8.00 48.00 365.00 17520
Micro oven 5 6 1000 5.00 30.00 365.00 10950 Milk Chiller 1 8 740 0.74 5.92 365.00 2161 Deep Freezer 1 8 560 0.56 4.48 365.00 1635 Compact Fluorescent 123 12 20 2.46 29.52 365.00 10775 Air conditioner for cold room 2 10 1500 3.00 30.00 365.00 10950 Television 3 8 100 0.30 2.40 365.00 876 Water pump 1 2 4 1500 3.00 12.00 365.00 4380 Water pump 2 1 4 1000 1.00 4.00 365.00 1460 Computers 12 24 100 1.20 28.80 365.00 10512 Printer 1 3 100 0.10 0.30 365.00 110 OTG 1 4 800 0.80 3.20 365.00 1168 Total 26.46 73372
Based on the portfolio of energy consumption in the restaurant following renewable energy systems have been recommended to save energy. The techno economics of installing the PV system is provided below.
Solar Water Heating system to replace LPG for preheating of water for cooking 1000 LPD
Approximate area required for installation 35 sqm Indicative cost of the system 2.00 lakh MNRE subsidy @6600.00 per m2 1.32 Lakh Energy savings per day average 35 kWh Savings of LPG per year 878.76 kg Annual cost savings from saving LPG 0.35 Lakh Payback period 1.94 years Emission reduction 8 Tons
Rooftop PV system for diesel abetment 20 kWp
Approximate area required 200 sqm
Indicative cost of the system with 1 day battery backup 60.00 Lakh
MNRE Subsidy @Rs.243.00 per Wp 48.60 Lakh
Approximate annual energy generation 30000 kWh
Fraction of DG power replaced 47%
Amount of diesel saved per year 9642 litres
Cost savings from diesel per year 3.85 Lakh
Annual O&M Cost of DG sets 1.00 Lakh
Payback period 2 years
Emission reduction 24 Tons

34
Biogas system Organic Waste from kitchen and other services per day 100-120 kg Biogas plant recommended 10 CuM Investment 0.5 Lakh MNRE subsidy @50% 0.25 Lakh User’s share 0.25 Lakh LPG saved per year 1460 kg Energy in terms of MU savings per year 0.02 MU Cost savings per year 0.58 Lakh Payback period 0.43 Years Emission Reduction per year 0.89 Tons
4.3.3. Renewable Energy Systems for Hospitals The Aizawl city has about 46 health care facilities, which includes hospitals having 50-100 beds. Apart from that the city has other health care facilities like dispensaries, dental clinic, microsurgery, day care centre and pathological laboratories. To portray the energy consumption scenario in these facilities a 100 and 50 bed Hospitals have been chosen in Aizawl city. Detailed energy consumption data have been collected and specific recommendations for renewable energy systems have been made. An average occupancy of 75% has been considered for making all calculations. Case Study A case study has been carried out for a typical 50 bedded Hospital. The energy baseline scenario of the Hospital reveals huge energy consumption on daily basis, supplemented by a high capacity diesel generators with back-up of 125 KVA and 75 KVA each. An average occupancy of 75% has been taken to provide the calculations given below.
Table 22 : Case Study for 50 bed hospital No of beds 50 Nos. Roof Area available 250 sqm Connected Load 150 KVA Average Load Shedding 1-2 Hours/day Average electricity bills per month 1.00 Lakh
Average occupancy 75% Standby Power Supply: Diesel Generator 1 75 KVA Diesel Generator 2 125 KVA
Average consumption of diesel per day 80 Liters/ day

35
Electrical Energy Demand:
Electrical Appliances Nos.
Operating Hours
Watt/ unit
Load (kW)
Energy consumption /day at 100% occupancy (kWh)
Energy consumption /day at 75% occupancy (kWh)
Utilization /year
Energy Consumption per year
Ceiling Fans 70 8 60 4.2 33.60 25.20 270 6804
Air Conditioner 20 6 1800 36 216.00 162.00 150 24300
Electric Geyser 30 4 1750 52.5 210.00 157.50 150 18900 Fluorescent tubes 200 10 55 11 110.00 82.50 365 30113 Water pump 2 4 8820 17.64 70.56 70.56 365 25754 Computers 6 24 100 0.6 14.40 14.40 365 5256 Printer 2 3 100 0.2 0.60 0.60 365 219 Auto clave 2 2 5000 10 20.00 20.00 365 7300
132 675.00 533.00 118646 Recommended Renewable Energy Systems The energy consumption baseline assessment of eth 50 bedded hospital in Aizawl, lead to the recommendation of Solar water heater to address the daily hot water requirement and PV systems for diesel abatement.
Solar Water Heating system 3000 LPD Approximate area required for installation 105 sqm Indicative cost of the system 6.00 Lakh MNRE subsidy @6600.00 per m2 3.96 lakh Energy savings per day average 157.5 kWh Electricity savings per year 57488 kWh Annual cost savings from saving electricity 2.01 Lakh Payback period 1.01 years Emission reduction 47 Tons
Rooftop PV system for diesel abetment 30 kWp
Approximate area required 300 sqm
Indicative cost of the system with 1 day battery backup 90 Lakh
MNRE Subsidy @Rs.243 per Wp 73 Lakh
Approximate annual energy generation 45000 kWh
Fraction of DG power replaced 39%
Amount of diesel saved per year 11250 litres
Cost savings from diesel per year 5 lakh
Annual O&M Cost of DG sets 0.5 Lakh
Payback period 3 years
Emission reduction 36 Tons
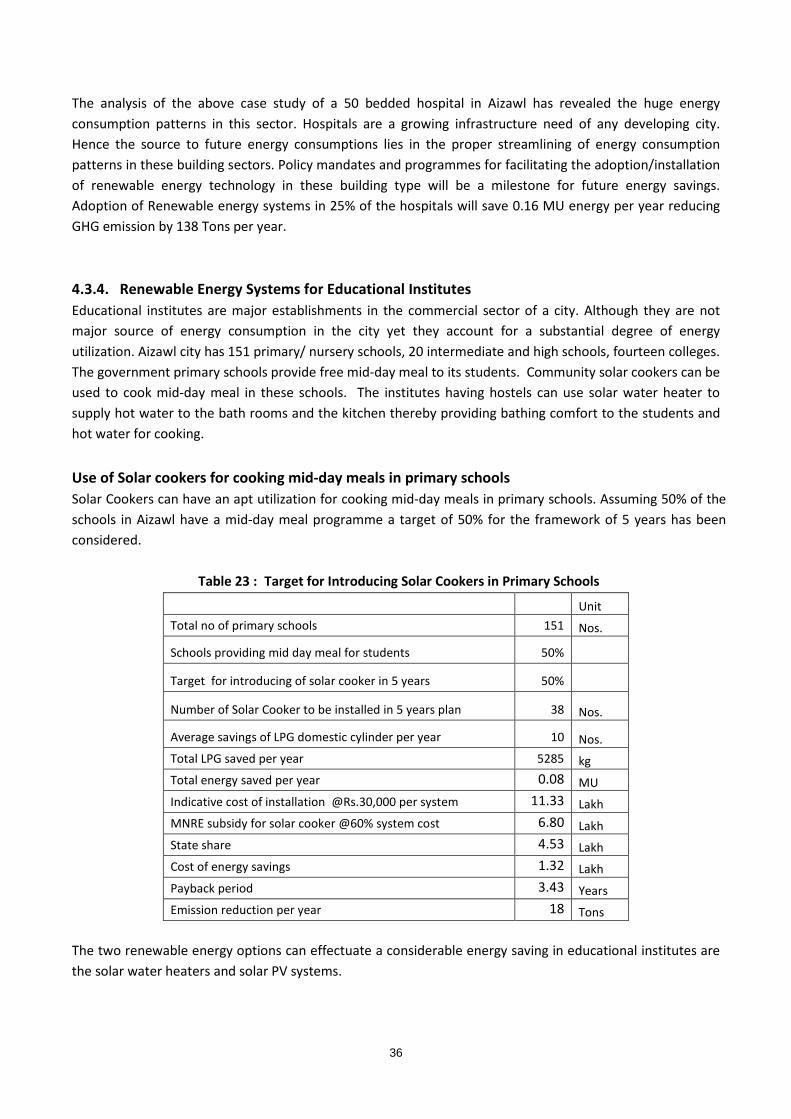
36
The analysis of the above case study of a 50 bedded hospital in Aizawl has revealed the huge energy consumption patterns in this sector. Hospitals are a growing infrastructure need of any developing city. Hence the source to future energy consumptions lies in the proper streamlining of energy consumption patterns in these building sectors. Policy mandates and programmes for facilitating the adoption/installation of renewable energy technology in these building type will be a milestone for future energy savings. Adoption of Renewable energy systems in 25% of the hospitals will save 0.16 MU energy per year reducing GHG emission by 138 Tons per year. 4.3.4. Renewable Energy Systems for Educational Institutes Educational institutes are major establishments in the commercial sector of a city. Although they are not major source of energy consumption in the city yet they account for a substantial degree of energy utilization. Aizawl city has 151 primary/ nursery schools, 20 intermediate and high schools, fourteen colleges. The government primary schools provide free mid-day meal to its students. Community solar cookers can be used to cook mid-day meal in these schools. The institutes having hostels can use solar water heater to supply hot water to the bath rooms and the kitchen thereby providing bathing comfort to the students and hot water for cooking. Use of Solar cookers for cooking mid-day meals in primary schools Solar Cookers can have an apt utilization for cooking mid-day meals in primary schools. Assuming 50% of the schools in Aizawl have a mid-day meal programme a target of 50% for the framework of 5 years has been considered.
Table 23 : Target for Introducing Solar Cookers in Primary Schools
Unit Total no of primary schools 151 Nos.
Schools providing mid day meal for students 50%
Target for introducing of solar cooker in 5 years 50%
Number of Solar Cooker to be installed in 5 years plan 38 Nos.
Average savings of LPG domestic cylinder per year 10 Nos. Total LPG saved per year 5285 kg Total energy saved per year 0.08 MU Indicative cost of installation @Rs.30,000 per system 11.33 Lakh MNRE subsidy for solar cooker @60% system cost 6.80 Lakh State share 4.53 Lakh Cost of energy savings 1.32 Lakh Payback period 3.43 Years Emission reduction per year 18 Tons
The two renewable energy options can effectuate a considerable energy saving in educational institutes are the solar water heaters and solar PV systems.

37
(i) Summary of RE strategy for Commercial and Institutional Sector
RE strategy for commercial and institutional sector, once implemented fully will save 1.02 MU of energy in five years and reduce GHG of 544 Tons per year. The primary focus should be given to introduction of solar water heaters for hotels, restaurants, hospitals and other residential institutes, which will save 0.56 MU per year. Solar PV power plant should be introduced for diesel abatement in the establishment that are using diesel sets as standby power supply source. The restaurants and hotels that has considerable amount of food and organic waste, should introduce biogas system. Use of solar cooker for preparing mid-day meal in primary schools will be an attractive option to save LPG for cooking and creation of awareness and demonstration about use of renewable energy devices among school children.
Table 24 : RE Strategy for Commercial and Institutional Sector
Physical Target Aggregate Capacity Unit
Target for the year of implementation 1 2 3 4 5
Solar Water Heater with HE for cooking 150 Nos. 15 23 30 38 45 Solar Water Heater with HE community cooking - 5000LPD 1 No. 1 0 0 0 0
Solar Water Heater (Average 500LPD) 50 Nos. 5 8 10 13 15
Solar PV Power Plant (10kWp) 5 Nos. 1 1 1 1 2
Solar PV Power Plant (5kWp) 10 Nos. 1 2 2 3 3
Solar PV Power Plant (1kWp) 100 Nos. 10 15 20 25 30
Solar PV Power Plant (0.50kWp) 75 Nos. 8 11 15 19 23
Solar PV Power Plant (0.25kWp) 76 Nos. 8 11 15 19 23
Biogas for Food waste (Av. 10CuM) 15 Nos. 2 2 3 4 5
Total Budget 687.2 Lakh 68.72 103.08 137.44 171.8 206.16
MNRE Share 541.21 Lakh 54.12 81.18 108.24 135.30 162.36
Beneficiary Share 145.99 Lakh 14.60 21.90 29.20 36.50 43.80
4.4. RE Strategy for Industrial Sector As per City Development Plan prepared for JNNURM, there are 3157 small-scale industries in Aizawl. Target has been set to cover 50% of these industries to incorporating RE systems based on the requirement and financial feasibility. Renewable energy devices are suggested to all categories of consumers depending upon the energy demand. Providing solar PV based uninterrupted power supply system will increase productivity and profitability to these industries.

38
Table 25 : Small Scale Industries in Aizawl Sl.
No. Category No. of Units Solar Water
Heater / unit Solar PV
Inverter /unit 1 Steel Fabrication 953 - 150Wp 2 Motor Workshop 240 200LPD 150Wp 3 Stone Quarry/ Crusher 24 - 150Wp 4 Black smithy/ Tin smithy 28 - 150Wp 5 Bakery 116 200LPD 150Wp 6 Rice Huller 7 - 150Wp 7 Chow making 53 200LPD 150Wp 8 Brick & Hollow Blocks 34 - 150Wp 9 Paper and Paper Works 248 - 150Wp 10 Knitting 93 - 150Wp 11 Tailoring 116 - 150Wp 12 Miscellaneous 391 - 150Wp 13 Tyre Works 56 - 150Wp 14 Shoe Repairing 3 - 150Wp 15 Candle Works 58 - 150Wp 16 Fruit Preservation 8 200LPD 150Wp 17 Radio & Tape Repairing Works 41 - 150Wp 18 Furniture Works 90 - 150Wp 19 Photography 5 - 150Wp 20 Handloom 593 - 150Wp Grand Total 3157
Table 26 : RE Strategy for Industrial Sector
Physical Target Aggregate Capacity Unit
Target for the year of implementation 1 2 3 4 5
Solar Water Heater (Av. 200LPD) 209 Nos. 21 31 42 52 63 Solar PV Power Plant (Av. 150Wp) 1579 Nos. 158 237 316 395 474
Total Budget 912.12 Lakh 91.21 136.82 182.42 228.03 273.63
MNRE Share 630.41 Lakh 63.04 94.56 126.08 157.60 189.12
Beneficiary Share 281.71 Lakh 28.17 42.26 56.34 70.43 84.51
4.5. Waste to Energy Potential in Aizawl Estimated solid waste generated in Aizawl city is 120 MT/day. Potential energy recovery from MSW through different treatment methods could be estimated from its calorific value and organic fraction etc. Since relevant details are not available for Aizawl, widely used estimates for municipal solid waste in India have been used for a preliminary assessment. However, waste to energy potential for the city is considered as an

39
indicative assessment and not included in the strategy to achieve energy savings goal under solar city programme.
(i) Waste to Energy Potential through thermo-chemical conversion In thermo-chemical conversion all of the organic matter, biodegradable as well as non-biodegradable, contributes to the energy output. Total electrical energy generation potential is estimated to be 0.29MWe and savings per year with 70% PLF is estimated as 1.78 MU.
Table 27 : Waste to Energy through thermo-chemical conversion
Unit Total non bio waste generated 10 Tons Net Calorific Value (conservative estimate) 2400 kcal/kg Energy recovery potential ( NCV x W x 1000/860) 27907 kWh Power generation potential 1163 kW Conversion efficiency 25% Net Power generation potential 0.29 MWe Plant Load Factor 70% Net electrical energy savings potential @70% PLF 1.78 MU Emission reduction per year 1444 Tons Total Investment 203 Lakh MNRE subsidy @ 50% subject to maximum of Rs.300.00 lakh per MW 87 Lakh State/City/Private Power Producer 116 Lakh Cost savings 80 Lakh Payback period 1.45 Years
(ii) Waste to Energy Potential through bio-methanation In bio-chemical conversion, only the biodegradable fraction of the organic matter can contribute to the energy output. It is estimated that a 0.63 MWe electrical energy generation is possible from this process which could save about 3.85 MU of energy every year assuming a 70% of PLF.
Table 28 : Waste to Energy through bio-methanation
Unit Total Bio waste collected 60 Tons/day Total biodegradable volatile solid (VS) 30% Typical digester efficiency 60% Typical bio-gas yield (m3 / kg. of VS destroyed) 0.80 CuM/kg Biogas yield 8640 CuM Calorific Value of bio-gas 5000 kcal/CuM Energy recovery potential 50232.56 kWh Power generation potential 2093 kW Conversion efficiency 30% Net Power generation potential 0.63 MWe Plant Load Factor 70%

40
Net electrical energy savings potential 3.85 MU Emission reduction per year 3119 Tons Total Investment 377 Lakh MNRE subsidy @ R.200.00 lakh per MW 126 Lakh State/City/Private Power Producer 251 Lakh Cost savings 173 Lakh Payback period 1.45 Years
(iii) Summary of Waste to Energy Potential in Aizawl City
A preliminary assessment for energy recovery from MSW has been done based on the widely used assumptions and presented in the table below.
Table 29 : Summary of waste to energy potential in Aizawl City
RE Strategy for Municipal Sector Units of Target
Target Capacity
Total Investment (Lakh)
MNRE subsidy (Lakh)
IPP Share (Lakh)
Amount of Energy Saved (MU)
Emissions Reductions per year (Tons)
Waste to Energy Potential for thermo-chemical conversion MWe 0.29 203 87 116 1.78 1444
Waste to Energy Potential for bio-methanation MWe 0.63 377 126 251 3.85 3119
Total MWe 0.92 580.23 212.79 367.44 5.63 4563
4.6. Use of Wood Biomass for Thermal Application Wood is a renewable source of energy because the carbon dioxide emitted when the wood is burned has been taken out of the atmosphere by the growing plant. Even allowing for emissions of fossil carbon dioxide in planting, harvesting, processing and transporting the fuel, replacing fossil fuel with wood fuel will typically reduce net CO2 emissions by over 90%. Wood is a very versatile fuel and can be burned in many different forms to provide all heating energy requirement for cooking, hot water and space heating during winter. Until recently wood fuelled heating has had the drawback of a lack of controllability. Automatic wood fuelled boilers, and many stoves, overcome this problem by utilising thermostats, which automatically control fuel and air intake with very responsive and programmable temperature settings. Using wood to heat commercial and public buildings is common in countries such as North America, Sweden, Austria and Denmark.
Modern wood stoves Wood stove technology has been developed to a point where clean burning and efficient stoves are now commonly available. Operating in an almost sealed enclosure, and with a well-controlled and distributed air supply, a number of these stoves are now approved for use in smoke control areas. Several design of wood stoves are available to heat a single room or to meet complete thermal energy demand of a house or an institutional building. The use of modern designs results in higher combustion

41
temperatures, and produces better fuel economy and fewer solid deposits than earlier designs. This technology provides the almost complete combustion of the tars and creosotes produced, resulting in a self-cleaning viewing window on the stove door and fewer deposits in the flue ways. Wood stoves incorporating a hot water boiler are also available in the market today. Such stoves can potentially provide the entire heating and hot water requirement for a house or an institution. Some manufacturers market stoves suitable for burning both coal and wood, but such stoves are usually a compromise design between the different requirements for burning these two fuels. Ranges can be used for cooking, hot water and central heating. Pellet Stoves and Boilers As an alternative to burning firewood or logs in a stove, fully automatic stoves designed to burn pellets are also available in the market. These are much more sophisticated devices than wood stoves and they have automatic ignition, automatic metering and feeding of pellets from an internal hopper, segregation of primary and secondary air supplies and combustion air fans. A fuel hopper can hold two days' fuel supply, and can be loaded manually from bags of pellets or pneumatically from a larger fuel store. As with wood stoves, pellet stoves can be supplied to provide a mixture of radiant and convective heating for a single room, or can incorporate an internal boiler to provide heating for a house. Automatic pellet stoves without internal boilers are particularly suitable for existing buildings where the cost of retrofitting a wet heating system could be prohibitive, or for low energy homes where the pellet stove could provide all of the heat required by air circulation. Pellet boilers and stoves range in size from a few kilowatts (kW), for houses or small commercial buildings, to megawatt (MW) units for district heating systems. Fully automatic, batch fed, pellet boilers can be installed in a boiler room, basement or other suitable area and are loaded with pellets through the top of the boiler into an internal hopper. Log boilers are designed to burn much larger pieces of wood than wood stoves or any other type of automatic or semi-automatic boiler. Loaded from they top, they can usually accept logs of up to 1 m in length, and are manufactured with outputs up to about 70 kW. In operation the controls on log boilers can be as sophisticated as those on fully automatic boilers. Separate control of primary and secondary air is usually provided together with a comprehensive control package to allow control of heating and hot water circuits. Combination of Biomass Stove with Solar Water Heating System Wood/pellet stoves can be combined with solar water heating to provide domestic hot water throughout the year. This is possible for both domestic and institutional establishment. Wood fuelled heating systems can also be linked with conventional gas, oil or electric water heaters to ensure uninterrupted hot water supply. Figure shows integration of solar thermal

42
collector to a hot water storage system and wood stove where mains cold water is introduced to the bottom of the upper coil and domestic hot water is produced on demand whenever a tap is opened. Solar coils are positioned lower down the tank so that the maximum benefit can be obtained from a solar panel. Benefits of Biomass Heating There are numerous benefits achieved by utilizing pellet fuel, including economical and environmental. Pellet fuel is utilized in a varied settings and applications, such as home heating appliances and large scale boilers in commercial operations. There are an estimated 1,000,000 residences/businesses in the U.S. alone currently heating with pellets. Direct thermal conversion of pellets has an efficiency level of approximately 80%. One ton of wood pellets have the energy equivalency of 2.8 barrels of fuel oil. Every ton of pellets used vs. oil reduces CO2 emissions by about 1.5 tons.

43
CHAPTER 5
This chapter delves into Energy Efficiency strategy for residential, commercial, industrial and municipal sector of Aizawl city. The chapter later develops the strategies for Aizawl city based on the Energy conservation and Energy Efficiency measures in the city and the baseline energy consumption and future energy demands of the city.
5. ENERGY EFFICIENCY STRATEGIES FOR AIZAWL While renewable energy technologies would provide clean energy, EE and DSM measures would help in reducing the energy demand. Energy Efficiency (EE) initiatives are the most financially feasible energy saving options in India today. In this report the EE measures have been thoroughly analyzed for all the four sectors, i.e. residential, commercial, industrial as well as municipal. The financial and technical analysis is provided for each strategy suggested in all the sectors. The list of EE and DSM measures suggested for different sectors is given below: Residential Sector:
− Replace Incandescent Lamps with Fluorescent − T5 tube light + Electronic Ballast to replace T12/T8 tube light+ Magnetic Ballast − Efficient ceiling fans to replace conventional ceiling fans − Replacement of conventional air-conditioners with EE star rated ACs − Replacement of conventional refrigerators with EE star rated refrigerators − Replacement of conventional water pumps with EE water pumps − Reduce energy consumption in existing private buildings − Reduce energy consumption in all new construction
Commercial and institutional building Sector:
− Replace Incandescent Lamps with Fluorescent − T5 tube light + Electronic Ballast to replace T12/T8 tube light+ Magnetic Ballast − Efficient ceiling fans to replace conventional ceiling fans − Replacement of conventional air-conditioners with EE star rated ACs − Replacement of conventional refrigerators with EE star rated refrigerators − Replacement of conventional water pumps with EE water pumps
Industrial Sector:
− Replace Incandescent Lamps with Fluorescent − T5 tube light + Electronic Ballast to replace T12/T8 tube light+ Magnetic Ballast

44
− Efficient ceiling fans to replace conventional ceiling fans − Replacement of conventional air-conditioners with EE star rated ACs − Energy efficiency in motors, furnaces, boilers, etc.
Municipal Sector:
− Replacement of 150 watt HPSV with LEDs − Replacement of 40 watt T8/T12 tube lights with T5 tube lights − Sensors for automatic on/off of street lights − Proper pump-system design (efficient Pump, pumps heads with system heads − Installation of variable speed drivers − Power saver installation in pump house − Plugging of leakages in the water supply system and use of efficient pumps and motors − Energy Efficiency Measures in WTP
A sector-wise techno-economic analysis of potential energy efficiency and DSM measures has been carried out. 5.1. EE Strategy for Residential sector Residential sector consumes largest amount of energy. Important proven and cost effective measures for the sector are described in this section. Based on the survey, it was found that incandescent lights are still used a lot in the residential sector. Utilizing the survey data the savings due to replacement of incandescent lamps with CFL are calculated and are presented in the table below.
(i) Replace Incandescent Lamps with Fluorescent Incandescent bulbs are the major and the most common source of high-energy consumption in the residential area. Replacement of incandescent lamps has acquired a substantial precedence in all the energy efficiency strategies as the most feasible option. The techno commercial for replacement of incandescent bulbs with CFL is given below. 80% households using incandescent bulbs have been considered as target group for replacements.
Table 30 : Replacement of incandescent lamps with fluorescent
Unit Total Residential household 63809 Nos. Target to replace incandescent bulb with CFL 80% Number of incandescent bulb to be replaced per household 4 Nos. Total number of incandescent bulb to be replaced 163351 Nos. Indicative cost of installation 245 Lakh Energy saved by replacing 60W bulb with 15W CFL 16.09 MU Cost of electricity savings 563 Lakh Payback period 0.43 years Emission reduction per year 13040 Tons

45
(ii) T5 tube light + Electronic Ballast to replace T12/T8 tube light+ Magnetic Ballast A conventional tube light (with magnetic ballast consuming 15W) consumes around 55 watts. It can be replaced with T5 tube (28W) with electronic ballast (4W) which will require around 32W. The calculations have been done for a period of 5 years assuming replacement of T 12 /T8 tube lights in 95% households using T12/T8 tube lights.
Table 31 : T5 tube light + Electronic Ballast to replace T12/T8 tube light+ Magnetic Ballast
Unit Total Residential household 63809 Nos. Target to replace T8/T12 by T5 tube lights 95% Number of T8/T12 tubes to be replaced per household 2 Nos. Total number of T8/T12 tube lights to be replaced 115175 Nos. Indicative cost of installation 576 Lakh Energy saved by replacing T8/T12(magnetic ballast) with T5 ( electronic ballast) 3.02 MU Cost of electricity savings 106 Lakh Payback period 5.44 years Emission reduction per year 2452 Tons
(iii) Efficient ceiling fans to replace conventional ceiling fans Replacing conventional fans with star rated fans can save substantial amount of electrical energy and money. The financial and technical analysis for replacement of conventional ceiling fans in residential sector of Aizawl city assuming replacement of old ceiling fans with star rated ones for 52% households.
Table 32 : Efficient Ceiling Fans to Replace Conventional Ceiling Fans
Unit Total Residential household 63809 Nos. Target to replace CF by EE Fans 52% Number of Conventional fan to be replaced per household 1 Nos. Total number of Conventional Fans to be replaced 17254 Nos. Indicative cost of installation 259 Lakh Energy saved by replacing Conventional Fans by EE Fans 0.35 MU Cost of electricity savings 12 Lakh Payback period 21 years Emission reduction per year 283 Tons
(iv) Replacement of conventional air-conditioners with EE star rated ACs Due to moderate to cold weather, use of air conditioner is not common in Aizawl. Survey results shows that less then 2% of residential households use air conditioners. These air conditioners can be replaced by start rated energy efficient air conditioners.

46
Table 33 : Replacement of conventional air-conditioners with EE star rated ACs
Unit Total Residential household 63809 Nos. Target to replace Conventional Acs by EE star rated AC 2% Number of Conventional ACs to be replaced per household 1 Nos. Total number of Conventional ACs to be replaced 26 Nos. Indicative cost of installation 4 Lakh Energy saved by replacing Conventional ACs by EE Star Rated ACs 8729 kWh Cost of electricity savings 0.31 Lakh Payback period 13 years Emission reduction per year 7 Tons
(iv) Replacement of conventional refrigerators with EE star rated refrigerators One of the most common appliance used in homes are the refrigerators. With increasing affordability refrigerators have become an indispensable item in most Indian households. They come in the capacity range of 200-400 litres. These days many BEE star rated energy efficient refrigerators are available in the Indian market. About 73% household use refrigerator and replacement of 5 % of those refrigerator with star rated ones will save 1.1MU electricity every year.
Table 34 : Replacement of Conventional Refrigerators with EE Star Rated Refrigerators
Unit Total Residential household 63809 Nos. Household using Conventional Refrigerators 73%
Target to replace Conventional Refrigerators by EE Star Rated Refrigerators 5% Number of Conventional Refrigerators to be replaced per household 1 No. Total number of Conventional Refrigerators to be replaced 2329 Nos. Indicative cost of installation 140 Lakh Energy saved 1.10 MU Cost of electricity savings 39 Lakh Payback period 3.6 years Emission reduction per year 894 Tons
(v) Replacement of conventional water pumps with EE star rated water pumps
Survey in Aizawl has shown that residential households use water pumps of 1.5 HP capacity which has an approximate electrical consumption of 2.2 kWh. Assuming 5% households in Aizawl use water pumps, 5% replacement of conventional pumps by energy efficient pumps have been targeted for energy savings.
Table 35 : Replacement of conventional water pumps with EE star rated water pumps Unit Total Residential household 63809 Nos. Household using Water Pumps 22%
Target to replace Conventional Water Pump by EE Pump 5%

47
Number of Conventional Pumps to be replaced per household 1 Nos. Total number of Conventional Pumps to be replaced 983 Nos. Indicative cost of installation 9.83 Lakh Energy saved by replacing Conventional Water Pumps by EE Water Pumps 0.11 MU Cost of electricity savings 3.77 Lakh Payback period 2.61 years Emission reduction per year 87 Tons
(vi) Summary of EE Strategy in Residential Sector
The estimated potential of energy savings in the residential sector through energy efficiency measures is 20.69MU per year which is alone can meet 37% of the target of 56.51 MU energy savings per year in Aizawl City. The reduction of emission through EE measures in residential sector is 16763 Tons per year. Replacement of incandescent bulbs with CFL, conventional fans, refrigerators and air conditioners with star rated one is the most potential scope for energy savings.
Table 36 : Summary of EE Strategy in Residential Sector
EE Measures in residential sector Unit
Target Capacity
Invest- ment (Lacs)
Energy Saved (MU)
GHG Reduction (Tons)
Indicative cost of replacing incandescent bulb Nos. 163351 245 16.10 13040
Indicative cost of replacing T12/T8 with T5 FTL Nos. 115175 576 3.03 2452
Indicative cost of replacing conventional Fans Nos. 17254 259 0.35 283
Indicative cost of replacing conventional AC Nos. 26 4 0.01 7
Indicative cost of replacing conventional refrigerators Nos. 2329 140 1.10 894
Indicative cost of installing a EE water pump Nos. 983 10 0.11 87
Total 1233 20.69 16763 5.2. EE Strategy for Government and Municipal Sector Government establishments and Municipal services annually incur huge expenditures on electricity consumption. Hence energy efficiency has become the call of the day for municipal organizations in India, owing to growing city needs. The Bureau of Energy Efficiency in India has already come out with the Manual for development of Municipal Energy Efficiency Projects. Energy conservation drives in government buildings and municipal utilities will become an exemplary initiative for similar activities in eth city. As a high visibility and administration center Municipal bodies across India should go ahead in implementing the strategies and replicating the success stories. Mizoram government has already taken few initiatives to save energy in government buildings. It is now mandatory that all government establishment CFL in place of incandescent bulbs. The following efficiency measures are suggested in government and municipal sector.
(i) Replacement of T12/T8 tube light+ Magnetic Ballast with T5 tube light + Electronic Ballast Replacement of average 50 numbers of T8/T12 tube lights with magnetic ballast with T5 tube with electronic ballast in 37 targeted government buildings can save 0.05MU of electricity per year reducing 39 Tons of GHG per year.
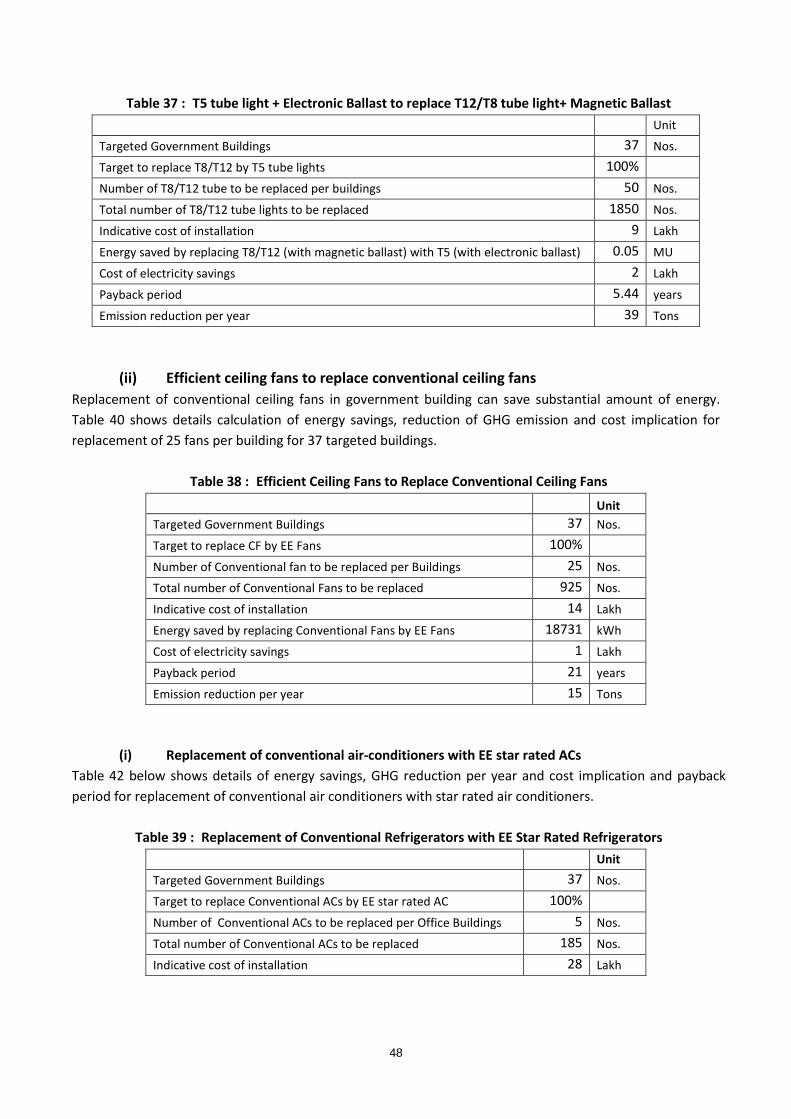
48
Table 37 : T5 tube light + Electronic Ballast to replace T12/T8 tube light+ Magnetic Ballast Unit
Targeted Government Buildings 37 Nos.
Target to replace T8/T12 by T5 tube lights 100%
Number of T8/T12 tube to be replaced per buildings 50 Nos.
Total number of T8/T12 tube lights to be replaced 1850 Nos.
Indicative cost of installation 9 Lakh
Energy saved by replacing T8/T12 (with magnetic ballast) with T5 (with electronic ballast) 0.05 MU
Cost of electricity savings 2 Lakh
Payback period 5.44 years
Emission reduction per year 39 Tons
(ii) Efficient ceiling fans to replace conventional ceiling fans Replacement of conventional ceiling fans in government building can save substantial amount of energy. Table 40 shows details calculation of energy savings, reduction of GHG emission and cost implication for replacement of 25 fans per building for 37 targeted buildings.
Table 38 : Efficient Ceiling Fans to Replace Conventional Ceiling Fans
Unit Targeted Government Buildings 37 Nos.
Target to replace CF by EE Fans 100%
Number of Conventional fan to be replaced per Buildings 25 Nos.
Total number of Conventional Fans to be replaced 925 Nos.
Indicative cost of installation 14 Lakh
Energy saved by replacing Conventional Fans by EE Fans 18731 kWh
Cost of electricity savings 1 Lakh
Payback period 21 years
Emission reduction per year 15 Tons
(i) Replacement of conventional air-conditioners with EE star rated ACs Table 42 below shows details of energy savings, GHG reduction per year and cost implication and payback period for replacement of conventional air conditioners with star rated air conditioners.
Table 39 : Replacement of Conventional Refrigerators with EE Star Rated Refrigerators
Unit
Targeted Government Buildings 37 Nos.
Target to replace Conventional ACs by EE star rated AC 100%
Number of Conventional ACs to be replaced per Office Buildings 5 Nos.
Total number of Conventional ACs to be replaced 185 Nos.
Indicative cost of installation 28 Lakh
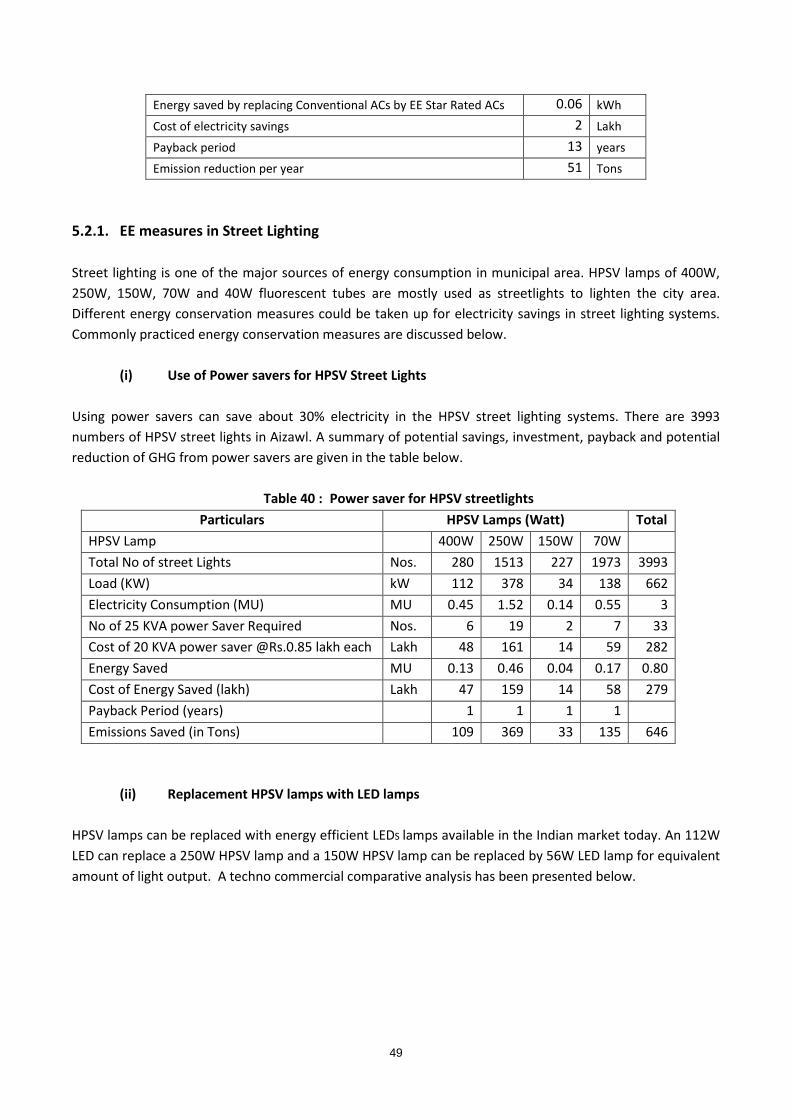
49
Energy saved by replacing Conventional ACs by EE Star Rated ACs 0.06 kWh
Cost of electricity savings 2 Lakh
Payback period 13 years
Emission reduction per year 51 Tons 5.2.1. EE measures in Street Lighting Street lighting is one of the major sources of energy consumption in municipal area. HPSV lamps of 400W, 250W, 150W, 70W and 40W fluorescent tubes are mostly used as streetlights to lighten the city area. Different energy conservation measures could be taken up for electricity savings in street lighting systems. Commonly practiced energy conservation measures are discussed below.
(i) Use of Power savers for HPSV Street Lights
Using power savers can save about 30% electricity in the HPSV street lighting systems. There are 3993 numbers of HPSV street lights in Aizawl. A summary of potential savings, investment, payback and potential reduction of GHG from power savers are given in the table below.
Table 40 : Power saver for HPSV streetlights Particulars HPSV Lamps (Watt) Total
HPSV Lamp 400W 250W 150W 70W Total No of street Lights Nos. 280 1513 227 1973 3993 Load (KW) kW 112 378 34 138 662 Electricity Consumption (MU) MU 0.45 1.52 0.14 0.55 3 No of 25 KVA power Saver Required Nos. 6 19 2 7 33 Cost of 20 KVA power saver @Rs.0.85 lakh each Lakh 48 161 14 59 282 Energy Saved MU 0.13 0.46 0.04 0.17 0.80 Cost of Energy Saved (lakh) Lakh 47 159 14 58 279 Payback Period (years) 1 1 1 1 Emissions Saved (in Tons) 109 369 33 135 646
(ii) Replacement HPSV lamps with LED lamps
HPSV lamps can be replaced with energy efficient LEDS lamps available in the Indian market today. An 112W LED can replace a 250W HPSV lamp and a 150W HPSV lamp can be replaced by 56W LED lamp for equivalent amount of light output. A techno commercial comparative analysis has been presented below.
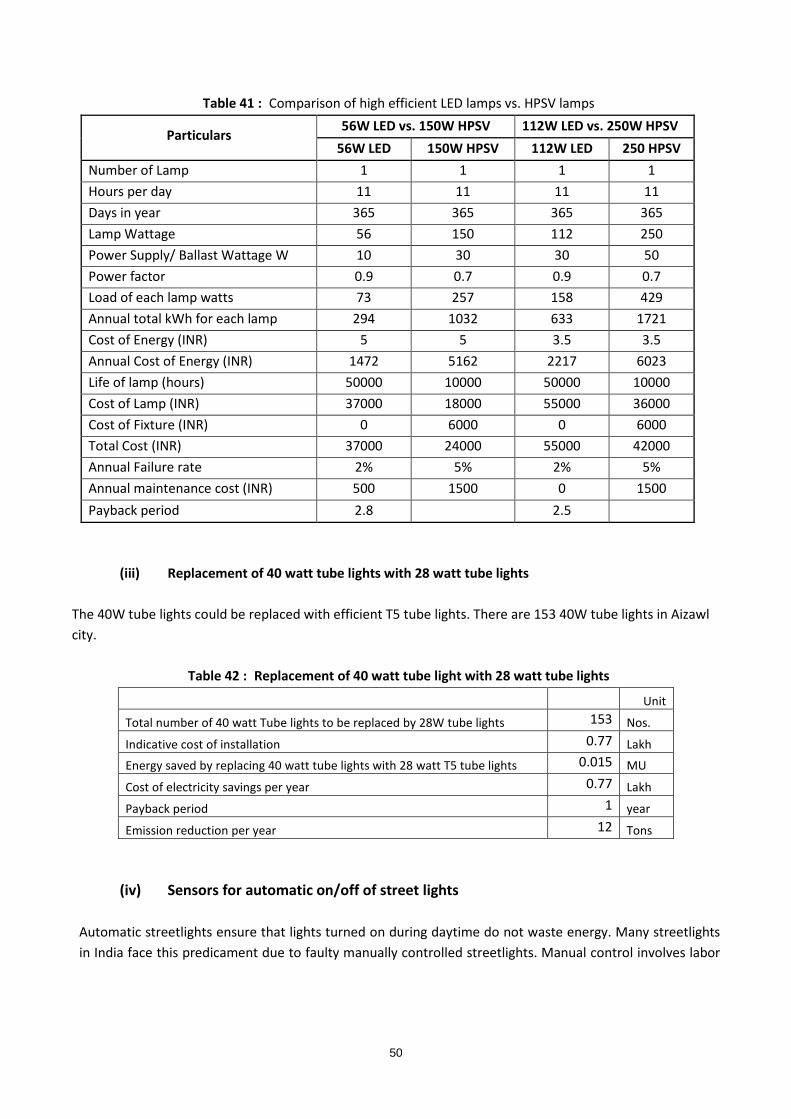
50
Table 41 : Comparison of high efficient LED lamps vs. HPSV lamps
Particulars 56W LED vs. 150W HPSV 112W LED vs. 250W HPSV
56W LED 150W HPSV 112W LED 250 HPSV Number of Lamp 1 1 1 1 Hours per day 11 11 11 11 Days in year 365 365 365 365 Lamp Wattage 56 150 112 250 Power Supply/ Ballast Wattage W 10 30 30 50 Power factor 0.9 0.7 0.9 0.7 Load of each lamp watts 73 257 158 429 Annual total kWh for each lamp 294 1032 633 1721 Cost of Energy (INR) 5 5 3.5 3.5 Annual Cost of Energy (INR) 1472 5162 2217 6023 Life of lamp (hours) 50000 10000 50000 10000 Cost of Lamp (INR) 37000 18000 55000 36000 Cost of Fixture (INR) 0 6000 0 6000 Total Cost (INR) 37000 24000 55000 42000 Annual Failure rate 2% 5% 2% 5% Annual maintenance cost (INR) 500 1500 0 1500 Payback period 2.8 2.5
(iii) Replacement of 40 watt tube lights with 28 watt tube lights The 40W tube lights could be replaced with efficient T5 tube lights. There are 153 40W tube lights in Aizawl city.
Table 42 : Replacement of 40 watt tube light with 28 watt tube lights
Unit
Total number of 40 watt Tube lights to be replaced by 28W tube lights 153 Nos.
Indicative cost of installation 0.77 Lakh
Energy saved by replacing 40 watt tube lights with 28 watt T5 tube lights 0.015 MU
Cost of electricity savings per year 0.77 Lakh
Payback period 1 year
Emission reduction per year 12 Tons
(iv) Sensors for automatic on/off of street lights Automatic streetlights ensure that lights turned on during daytime do not waste energy. Many streetlights in India face this predicament due to faulty manually controlled streetlights. Manual control involves labor
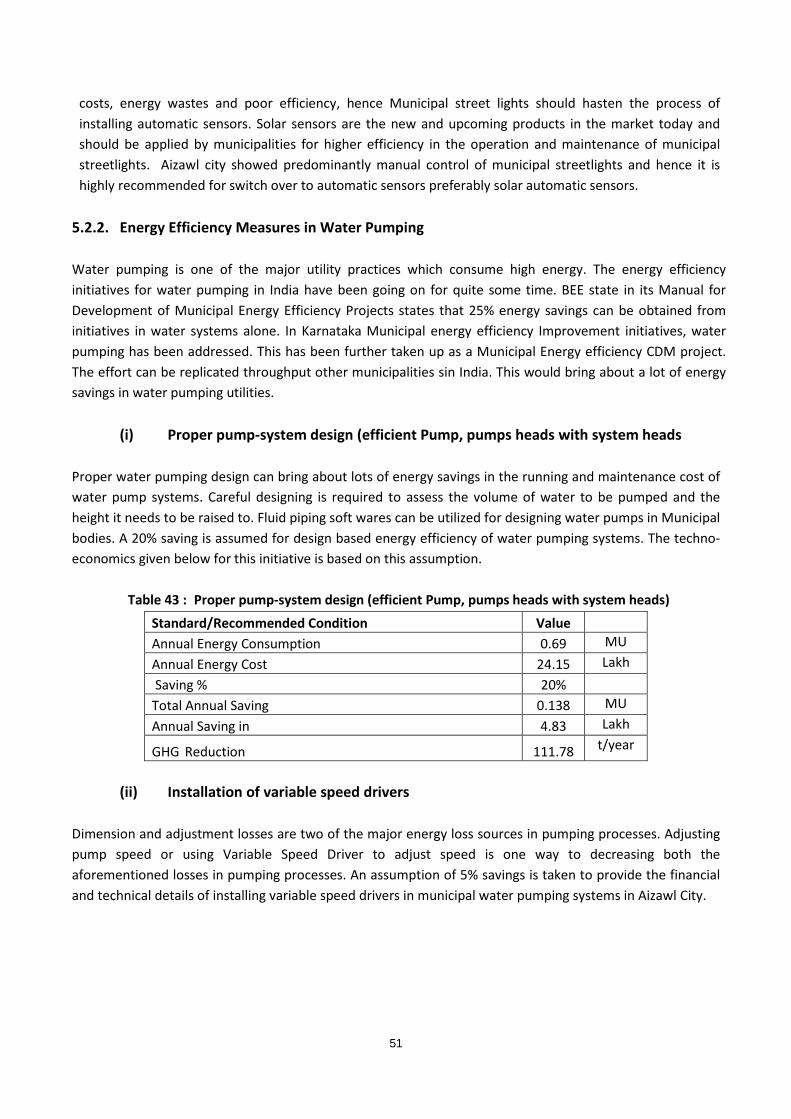
51
costs, energy wastes and poor efficiency, hence Municipal street lights should hasten the process of installing automatic sensors. Solar sensors are the new and upcoming products in the market today and should be applied by municipalities for higher efficiency in the operation and maintenance of municipal streetlights. Aizawl city showed predominantly manual control of municipal streetlights and hence it is highly recommended for switch over to automatic sensors preferably solar automatic sensors.
5.2.2. Energy Efficiency Measures in Water Pumping Water pumping is one of the major utility practices which consume high energy. The energy efficiency initiatives for water pumping in India have been going on for quite some time. BEE state in its Manual for Development of Municipal Energy Efficiency Projects states that 25% energy savings can be obtained from initiatives in water systems alone. In Karnataka Municipal energy efficiency Improvement initiatives, water pumping has been addressed. This has been further taken up as a Municipal Energy efficiency CDM project. The effort can be replicated throughput other municipalities sin India. This would bring about a lot of energy savings in water pumping utilities.
(i) Proper pump-system design (efficient Pump, pumps heads with system heads Proper water pumping design can bring about lots of energy savings in the running and maintenance cost of water pump systems. Careful designing is required to assess the volume of water to be pumped and the height it needs to be raised to. Fluid piping soft wares can be utilized for designing water pumps in Municipal bodies. A 20% saving is assumed for design based energy efficiency of water pumping systems. The techno-economics given below for this initiative is based on this assumption.
Table 43 : Proper pump-system design (efficient Pump, pumps heads with system heads)
Standard/Recommended Condition Value Annual Energy Consumption 0.69 MU Annual Energy Cost 24.15 Lakh Saving % 20% Total Annual Saving 0.138 MU Annual Saving in 4.83 Lakh
GHG Reduction 111.78 t/year
(ii) Installation of variable speed drivers
Dimension and adjustment losses are two of the major energy loss sources in pumping processes. Adjusting pump speed or using Variable Speed Driver to adjust speed is one way to decreasing both the aforementioned losses in pumping processes. An assumption of 5% savings is taken to provide the financial and technical details of installing variable speed drivers in municipal water pumping systems in Aizawl City.

52
Table 44 : Variable Speed Drivers
Standard/Recommended Condition Value Annual Energy Consumption 0.69 MU Annual Energy Cost 24.15 Lakh Saving % 5% Total Annual Saving 0.035 MU Annual Saving 1.21 Lakh
GHG Reduction 27.94 t/year
(iii) Power saver installation in pump house An assumption of 15% savings is taken as the energy saving potential for installing power saver in municipal pump houses. The following techno-economics is based on this assumption.
Table 45 : Power saver installation in pump house
Standard/Recommended Condition Value
Annual Energy Consumption in MU 0.69 MU
Annual Energy Cost in Rs. (lacs) 24.15 Lakh
Saving % 15%
Total Annual Saving in MU 0.10 MU
Annual Saving in Rs. (lacs) 3.62 Lakh
eCO2 (Ton) Reduction 83.84 t/year 5.2.3. Summary of EE Strategy for Government and Municipal Sector
The energy savings potential through energy efficiency measures in municipal sector is 1.22MU in five years which is about 2.16% of total target to achieve reducing emission of 988.12 Tons of GHG per year.
Table 46 : Summary of EE Strategy for Government and municipal sector
Energy Efficiency Measures Target (Nos.)
Investment (Lakh)
Electricity Saved (MU)
Emissions Saved (Tons)
Replacement of T8/T12 tube light with T5 1850.00 9.25 0.05 39.38 Replacement of Ceiling fans with star rated fans 925.00 13.88 0.02 15.17 Replacement of Acs with star rated Acs 185.00 27.75 0.06 51.25 Replacement of T8/T12 streetlights with T5 153.00 0.77 0.02 12.48 Power Savers 3993.00 281.52 0.80 646.28 Proper pump-system design 1.00 0.80 0.14 111.78 Installation of variable speed drivers 1.00 0.03 27.95 Standard/Recommended Condition 1.00 0.10 83.84
333.96 1.22 988.12
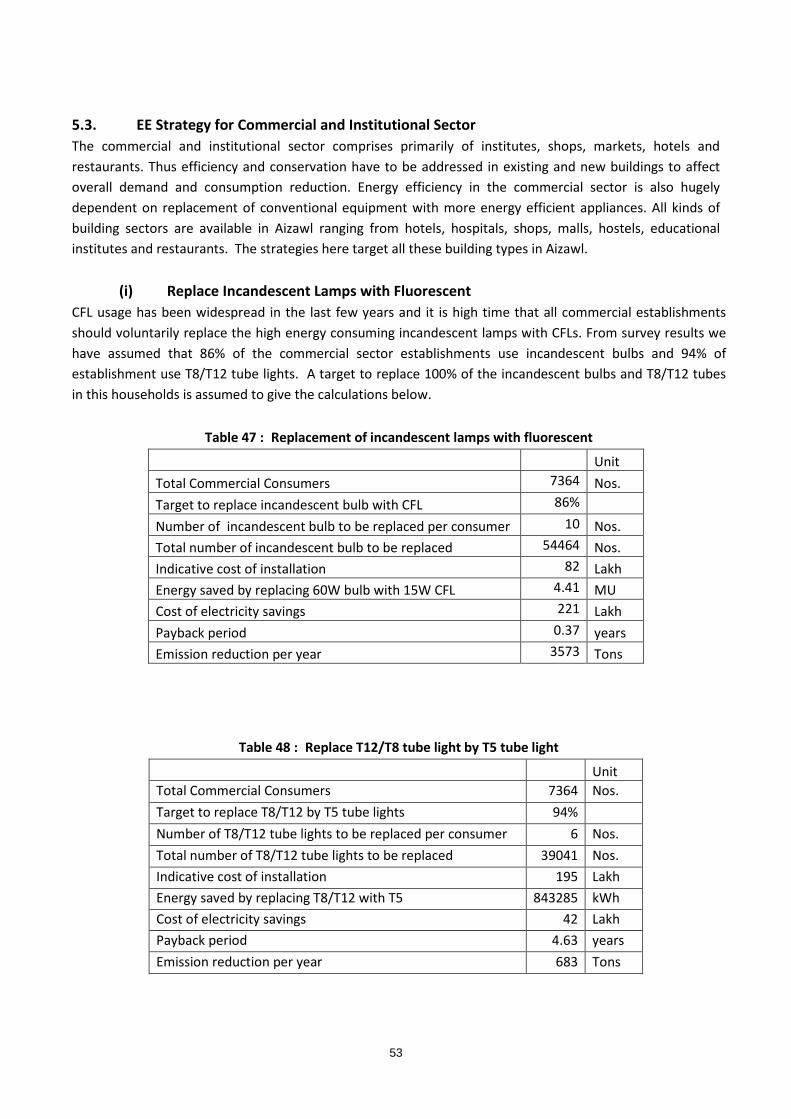
53
5.3. EE Strategy for Commercial and Institutional Sector The commercial and institutional sector comprises primarily of institutes, shops, markets, hotels and restaurants. Thus efficiency and conservation have to be addressed in existing and new buildings to affect overall demand and consumption reduction. Energy efficiency in the commercial sector is also hugely dependent on replacement of conventional equipment with more energy efficient appliances. All kinds of building sectors are available in Aizawl ranging from hotels, hospitals, shops, malls, hostels, educational institutes and restaurants. The strategies here target all these building types in Aizawl.
(i) Replace Incandescent Lamps with Fluorescent CFL usage has been widespread in the last few years and it is high time that all commercial establishments should voluntarily replace the high energy consuming incandescent lamps with CFLs. From survey results we have assumed that 86% of the commercial sector establishments use incandescent bulbs and 94% of establishment use T8/T12 tube lights. A target to replace 100% of the incandescent bulbs and T8/T12 tubes in this households is assumed to give the calculations below.
Table 47 : Replacement of incandescent lamps with fluorescent
Unit Total Commercial Consumers 7364 Nos. Target to replace incandescent bulb with CFL 86% Number of incandescent bulb to be replaced per consumer 10 Nos. Total number of incandescent bulb to be replaced 54464 Nos. Indicative cost of installation 82 Lakh Energy saved by replacing 60W bulb with 15W CFL 4.41 MU Cost of electricity savings 221 Lakh Payback period 0.37 years Emission reduction per year 3573 Tons
Table 48 : Replace T12/T8 tube light by T5 tube light
Unit Total Commercial Consumers 7364 Nos. Target to replace T8/T12 by T5 tube lights 94% Number of T8/T12 tube lights to be replaced per consumer 6 Nos. Total number of T8/T12 tube lights to be replaced 39041 Nos. Indicative cost of installation 195 Lakh Energy saved by replacing T8/T12 with T5 843285 kWh Cost of electricity savings 42 Lakh Payback period 4.63 years Emission reduction per year 683 Tons

54
(ii) Replacement of inefficient fans Analysis of the sample survey of Aizawl city reveals 47% consumers uses fans during summer. Assuming 10% of the conventional fans in the commercial sector of Aizawl can be replaced with more energy efficient fans the following techno-commercials have been calculated.
Table 49 : Replacement of Conventional Fans
Unit Total Commercial Consumers 7364 Nos. Consumers using Conventional Fans 47% Target to replace CF by EE Fans 10% Number of Conventional fan to be replaced per consumer 2 Nos. Total number of Conventional Fans to be replaced 692 Nos. Indicative cost of installation 10 Lakh Energy saved by replacing Conventional Fans by EE Fans 9691 kWh Cost of electricity savings 0.48 Lakh Payback period 21 years Emission reduction per year 8 Tons
(iii) Replacement of conventional air conditioners with EE star rated ones Merely 8 % of the commercial units in Aizawl City use air conditioning units. Assuming the replacement of 5% of the air-conditioning units with star rated air conditioning units the figures related to installments and energy savings are given below.
Table 50 : Replacement of Air conditioners with star rated ones Unit Total Commercial Consumers 7364 Nos. Consumers using Conventional ACs 8% Target to replace Conventional ACs by EE star rated ACs 5% Number of Conventional ACs to be replaced per household 5 Nos. Total number of Conventional ACs to be replaced 147 Nos. Indicative cost of installation 22 Lakh Energy saved by replacing Conventional ACs by EE Star Rated ACs 50370 kWh Cost of electricity savings 3 Lakh Payback period 8.77 years Emission reduction per year 41 Tons
(iv) Replacement of conventional refrigerators with EE star rated refrigerators Refrigerators in commercial sector are restricted to the food outlets, restaurants, hotels, guest houses, and ice-cream parlors. General trend reveals that the refrigerators of the range of 200-400 W are found in the commercial sector of Aizawl City. Approximately 43% of the consumers own a refrigerator and a target of replacing 5% refrigerators has been taken to show the energy saving potential of replacing conventional refrigerators in commercial sector of Aizawl city.

55
Table 51 : Replacement of Conventional Refrigerators with EE Star Rated Refrigerators
Unit Total Commercial Consumers 7364 Nos. Consumers using Conventional Refrigerators 43% Target to replace Conventional Refrigerators by EE Star Rated Refrigerators 5% Number of Conventional Refrigerators to be replaced per consumer 1 Nos. Total number of Conventional Refrigerators to be replaced 158 Nos. Indicative cost of installation 11 Lakh Energy saved by replacing Conventional Refrigerators by EE Star Rated ones 75047 kWh Cost of electricity savings 4 Lakh Payback period 3 years Emission reduction per year 61 Tons
Table 52 : Replacement of conventional water pumps with EE star rated water pumps Unit
Total Residential household 7364 Nos. Consumers using Water Pumps 10% Target to replace Conventional Water Pump by EE Pump 5% Number of Conventional Pumps to be replaced per consumer 1 Nos. Total number of Conventional Pumps to be replaced 52 Nos. Indicative cost of installation 1 Lakh Energy saved by replacing Conventional Water Pumps by EE Water Pumps 4639 kWh Cost of electricity savings 0 Lakh Payback period 3.17 years Emission reduction per year 4 Tons
(v) Summary of EE Strategy in Commercial & Institutional Sector The estimated energy savings potential from commercial and institutional sector through energy efficiency measures is 5.39MU in five years, which is 11% of total target to achieve. Potential for GHG reduction is 4370 Tons per year with an investment of Rs.321.00 lakh.
Table 53 : Summary of EE Strategy in Commercial & Institutional Sector
EE Measures Units Targets Investment
(INR)
Electricity Saved (MU)
Emissions Saved (Tons)
Replacement of incandescent with CFL Nos. 54464 82 4.41 3573 Replacement of T8/T12 tube lights with T5 FTL Nos. 39041 195 0.84 683 Replacement of conventional fans with EE fans Nos. 692 10 0.01 8 Replacement of conventional AC with star rated AC Nos. 147 22 0.05 41 Replacement of conventional refrigerators Nos. 158 11 0.08 61 Replacement of water pumps Nos. 52 1 0.00 4 321 5.39 4370
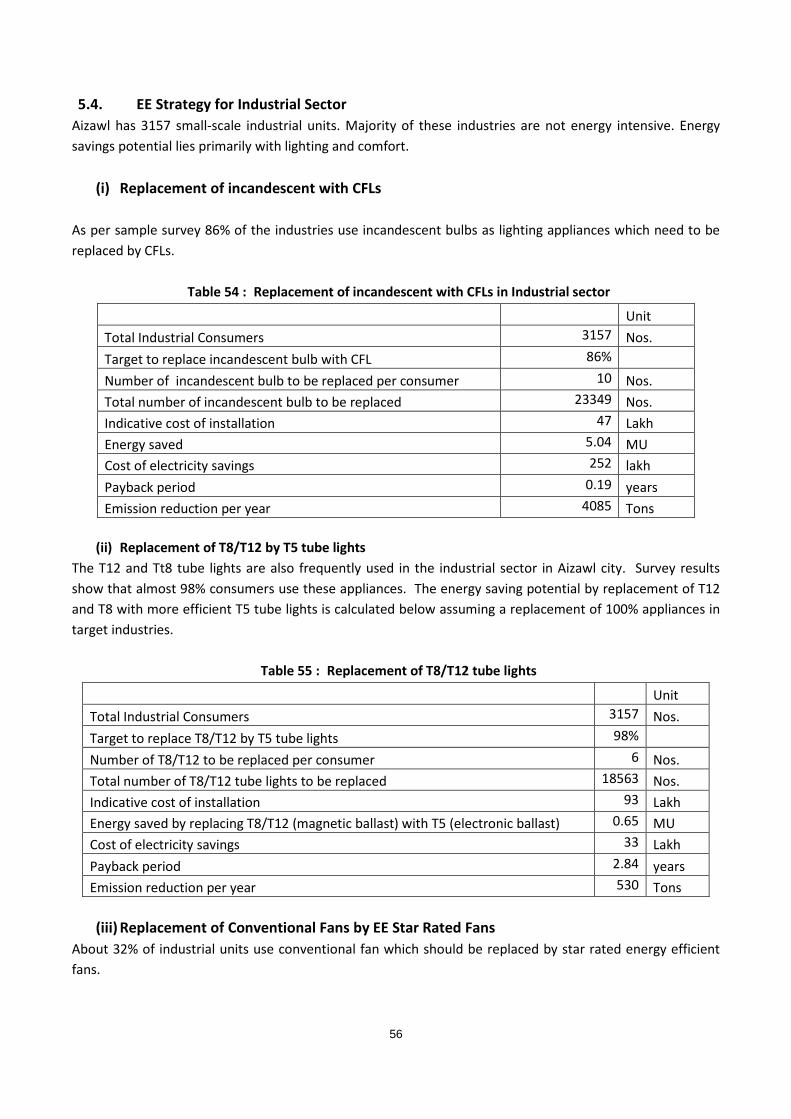
56
5.4. EE Strategy for Industrial Sector Aizawl has 3157 small-scale industrial units. Majority of these industries are not energy intensive. Energy savings potential lies primarily with lighting and comfort.
(i) Replacement of incandescent with CFLs As per sample survey 86% of the industries use incandescent bulbs as lighting appliances which need to be replaced by CFLs.
Table 54 : Replacement of incandescent with CFLs in Industrial sector
Unit Total Industrial Consumers 3157 Nos. Target to replace incandescent bulb with CFL 86% Number of incandescent bulb to be replaced per consumer 10 Nos. Total number of incandescent bulb to be replaced 23349 Nos. Indicative cost of installation 47 Lakh Energy saved 5.04 MU Cost of electricity savings 252 lakh Payback period 0.19 years Emission reduction per year 4085 Tons
(ii) Replacement of T8/T12 by T5 tube lights
The T12 and Tt8 tube lights are also frequently used in the industrial sector in Aizawl city. Survey results show that almost 98% consumers use these appliances. The energy saving potential by replacement of T12 and T8 with more efficient T5 tube lights is calculated below assuming a replacement of 100% appliances in target industries.
Table 55 : Replacement of T8/T12 tube lights
Unit Total Industrial Consumers 3157 Nos. Target to replace T8/T12 by T5 tube lights 98% Number of T8/T12 to be replaced per consumer 6 Nos. Total number of T8/T12 tube lights to be replaced 18563 Nos. Indicative cost of installation 93 Lakh Energy saved by replacing T8/T12 (magnetic ballast) with T5 (electronic ballast) 0.65 MU Cost of electricity savings 33 Lakh Payback period 2.84 years Emission reduction per year 530 Tons
(iii) Replacement of Conventional Fans by EE Star Rated Fans
About 32% of industrial units use conventional fan which should be replaced by star rated energy efficient fans.
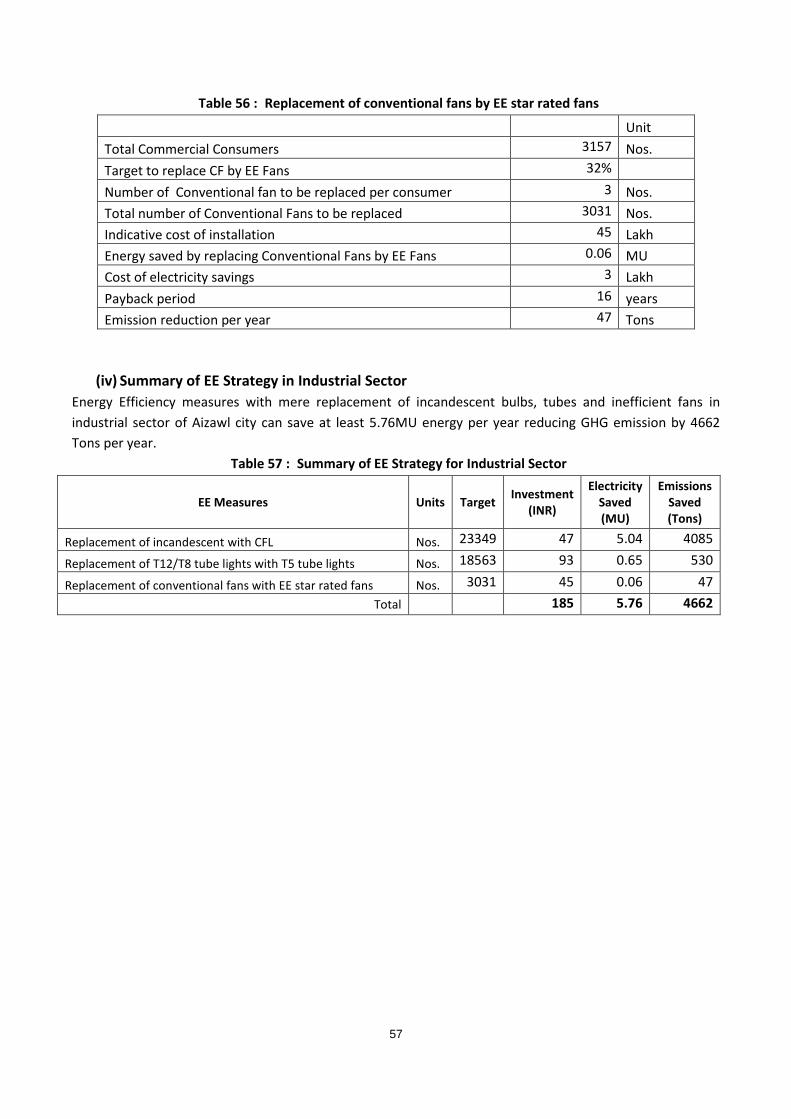
57
Table 56 : Replacement of conventional fans by EE star rated fans
Unit Total Commercial Consumers 3157 Nos. Target to replace CF by EE Fans 32% Number of Conventional fan to be replaced per consumer 3 Nos. Total number of Conventional Fans to be replaced 3031 Nos. Indicative cost of installation 45 Lakh Energy saved by replacing Conventional Fans by EE Fans 0.06 MU Cost of electricity savings 3 Lakh Payback period 16 years Emission reduction per year 47 Tons
(iv) Summary of EE Strategy in Industrial Sector Energy Efficiency measures with mere replacement of incandescent bulbs, tubes and inefficient fans in industrial sector of Aizawl city can save at least 5.76MU energy per year reducing GHG emission by 4662 Tons per year.
Table 57 : Summary of EE Strategy for Industrial Sector
EE Measures Units Target Investment (INR)
Electricity Saved (MU)
Emissions Saved (Tons)
Replacement of incandescent with CFL Nos. 23349 47 5.04 4085
Replacement of T12/T8 tube lights with T5 tube lights Nos. 18563 93 0.65 530
Replacement of conventional fans with EE star rated fans Nos. 3031 45 0.06 47 Total 185 5.76 4662

58
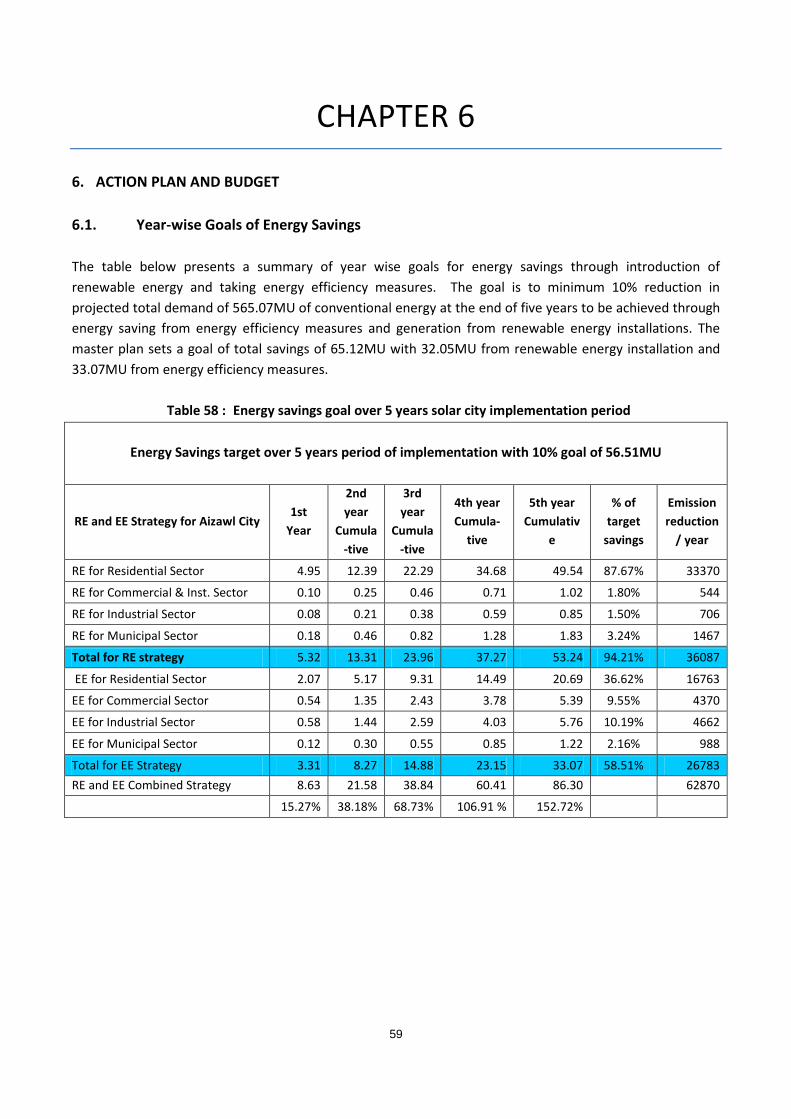
59
CHAPTER 6
6. ACTION PLAN AND BUDGET 6.1. Year-wise Goals of Energy Savings The table below presents a summary of year wise goals for energy savings through introduction of renewable energy and taking energy efficiency measures. The goal is to minimum 10% reduction in projected total demand of 565.07MU of conventional energy at the end of five years to be achieved through energy saving from energy efficiency measures and generation from renewable energy installations. The master plan sets a goal of total savings of 65.12MU with 32.05MU from renewable energy installation and 33.07MU from energy efficiency measures.
Table 58 : Energy savings goal over 5 years solar city implementation period
Energy Savings target over 5 years period of implementation with 10% goal of 56.51MU
RE and EE Strategy for Aizawl City 1st
Year
2nd year
Cumula-tive
3rd year
Cumula-tive
4th year Cumula-
tive
5th year Cumulativ
e
% of target
savings
Emission reduction
/ year
RE for Residential Sector 4.95 12.39 22.29 34.68 49.54 87.67% 33370
RE for Commercial & Inst. Sector 0.10 0.25 0.46 0.71 1.02 1.80% 544
RE for Industrial Sector 0.08 0.21 0.38 0.59 0.85 1.50% 706
RE for Municipal Sector 0.18 0.46 0.82 1.28 1.83 3.24% 1467
Total for RE strategy 5.32 13.31 23.96 37.27 53.24 94.21% 36087
EE for Residential Sector 2.07 5.17 9.31 14.49 20.69 36.62% 16763
EE for Commercial Sector 0.54 1.35 2.43 3.78 5.39 9.55% 4370
EE for Industrial Sector 0.58 1.44 2.59 4.03 5.76 10.19% 4662
EE for Municipal Sector 0.12 0.30 0.55 0.85 1.22 2.16% 988
Total for EE Strategy 3.31 8.27 14.88 23.15 33.07 58.51% 26783 RE and EE Combined Strategy 8.63 21.58 38.84 60.41 86.30 62870
15.27% 38.18% 68.73% 106.91 % 152.72%

60
6.2. Physical Target and Action Plan The Master Plan for developing Aizawl as Solar City sets a target of installing 224 MLD capacity Solar water heater with aggregate collector area of 4.47 million sqm, 5.69MWp cumulative solar PV systems, 154CuM Biogas systems and 788 nos. solar cookers. Physical target for renewable energy systems and energy efficient devices has been presented in the tables below. In the energy efficiency strategy the master plan set a goal of replacing 217815 numbers of incandescent bulbs with CFLs, 174629 numbers of T8/12 tubes with T5 tubes, 21902 star rated ceiling fans, 358 star rated air conditioners, 2487 star rated refrigerators and 1034 numbers of star rated water pumps with conventional ones.
Table 59 : Physical target of RE systems
Physical Target Aggregate Capacity Unit
Target for the year of implementation 1 2 3 4 5
Establishment of a “Solar City Cell” 1 No. 1 0 0 0 0
Awareness and Publicity
Publicity through electronic media 15 No. 4 4 3 2 2
Print Media/Publication 30 No. 9 9 6 3 3
Exhibitions, Outdoor Publicity, 50 No. 15 15 10 5 5
Workshops and Seminars 10 No. 3 3 2 1 1
RE Strategy for Residential Sector
Solar Water Heater (100/125LPD system) 4339 Nos. 434 651 868 1085 1302
Solar Water Heater (200LPD system) 6509 Nos. 651 976 1302 1627 1953
Solar Water Heater with HE (100LPD) 5000 Nos. 500 750 1000 1250 1500
Use of Solar cookers (dish type) 638 Nos. 64 96 128 160 191
LED Solar Home System (10Wp) 10000 Nos. 1000 1500 2000 2500 3000
Solar Home Systems (37Wp) 15000 Nos. 1500 2250 3000 3750 4500
Solar Home Systems (74Wp) 20000 Nos. 2000 3000 4000 5000 6000
RE Strategy for Commercial Sector (Hotels, Restaurants, Hospitals and Institutes)
Solar Water Heater with HE for cooking 150 Nos. 15 23 30 38 45 Solar Water Heater with HE community cooking - 5000LPD 1 No. 1 0 0 0 0
Solar Water Heater (Average 500LPD) 50 Nos. 5 8 10 13 15
Solar PV Power Plant (10kWp) 5 Nos. 1 1 1 1 2
Solar PV Power Plant (5kWp) 10 Nos. 1 2 2 3 3
Solar PV Power Plant (1kWp) 100 Nos. 10 15 20 25 30
Solar PV Power Plant (0.50kWp) 75 Nos. 8 11 15 19 23
Solar PV Power Plant (0.25kWp) 76 Nos. 8 11 15 19 23

61
Biogas for Food waste (Av. 10CuM) 15 Nos. 2 2 3 4 5
RE Strategy for Industrial sector Solar Water Heater (Av. 200LPD) 209 Nos. 21 31 42 52 63 Solar PV Power Plant (Av. 150Wp) 1579 Nos. 158 237 316 395 474
RE Strategy for Government and Municipal Sector
Solar water heaters for Hospitals and residential Institutes (1000 LPD average) 42 Nos. 4 6 8 11 13 Solar PV Power Plant for Office Buildings (Total 738 kWp of 2-150kWp capacity) 37 Nos. 4 6 7 9 11
Solar LED Street Light 2400 Nos. 240 360 480 600 720
Solar PV Traffic Lights 8 Nos. 1 1 2 2 2
Solar Blinkers (37Wp) 25 Nos. 3 4 5 6 8
Road Stud 750 Nos. 75 113 150 188 225
Table 60 : Physical target of EE devices
Physical Target Aggregate Capacity Unit
Target for the year of implementation
1 2 3 4 5
EE Strategy for Residential sector
CFL/LEDs (,000) 163 Nos. 17 25 32 40 49 T5 tube light + Electronic Ballast (,000) 115 Nos. 11 17 23 28 34
Efficient ceiling fans 17254 Nos. 1725 2588 3451 4313 5176
Star rated ACs 26 Nos. 3 4 5 6 8
Star rated refrigerators 2329 Nos. 233 349 466 582 699
Star rated water pumps 983 Nos. 98 147 197 246 295
EE Strategy for Commercial Sector
CFL/LEDs (,000) 54 Nos. 6 9 10 13 16
T5 tube light + Electronic Ballast (,000) 39 Nos. 4 6 8 10 11
Efficient ceiling fans 692 Nos. 69 104 138 173 208 Star rated ACs: 147 Nos. 15 22 29 37 44 Star rated refrigerators 158 Nos. 16 24 32 40 47
Star rated water pumps 52 Nos. 5 8 10 13 15
EE Strategy for Industrial Sector
CFL/LEDs 23349 Nos. 2335 3502 4670 5837 7005 T5 tube light + Electronic Ballast 18563 Nos. 1856 2784 3713 4641 5569 Star rated fans 3031 Nos. 303 455 606 758 909

62
EE Strategy for Government and Municipal Sector
T5 tube light + Electronic Ballast 1850 Nos. 185 278 370 463 555
Star rated fans 925 Nos. 93 139 185 231 278
Star rated AC in Govt. Buildings 185 Nos. 19 28 37 46 56
T5 tube lights in street lights 153 Nos. 15 23 31 38 46
6.3. Implementation Strategy 6.3.1. Establishment of the Solar City Cell The Solar City Cell is an integral component of the MNRE’s Development of Solar Cities” Scheme. The basic purpose of establishing a Solar City cell is to ensure exchange and collection of relevant data for sustenance, promotion and awareness generation of renewable energy and energy efficiency at the local level. The solar city cell will be the focal point and critical player for implementation of the solar city development programme. Solar City Cell will be established within the Aizawl Municipal Council and will function under the city administration. A senior technical officer at the level of executive engineer or above will be the overall in charge of the solar city cell. The officer in-charge will prepare all strategy and functioning modalities of the solar city cell. A full time technical expert will be associated to the Solar City Cell for day-to-day activities, documentation, communication and every other activity under Solar City Cell. The Solar City Cell will provide technical guidance, expertise and financial analyses of projects for potential investors- individual or companies. It will also help for customer outreach. It will act as a platform where all relevant stakeholders (citizens/manufacturers /banks/institutions etc.) can meet and exchange information on RE and EE. The Ministry of New and Renewable Energy, Government of India will provide Rs.10.00 Lakh (Rupees ten lakh only) for the establishment and operation the solar city cell for five years. The city administration will provide space for the cell and depute one senior engineer/ technical person of the level of executive engineer or above as an overall in-charge of the solar city cell. The detailed functions and modus operandi of the solar city cell is elaborated in the guidebook for development of solar city, which is an integral part of this master plan. 6.3.2. Awareness and Publicity Awareness and Publicity Programme will be taken up to creating awareness among mass and target sectors in the city about benefits and financial incentive for targeted Renewable Energy systems & devices. Under these programmes, information on technological developments, financial benefits and cost savings from RE system and EE measures, government initiatives and incentives for such devices/ measures, availability, price etc will be disseminated through various media. The Solar City Cell will primarily take up these programmes. MNRE has earmarked Rs.20.00 lakh (Rupees twenty lakh) for each city for awareness and publicity activities under the solar city development programme. The following activities are proposed for creation of awareness and publicity.

63
1. Publicity through electronic media
− Production and telecast of documentary films, short duration films, TV spots/advertisements etc through local TV network
− Production and broadcast of Radio sponsored programmes, Radio Spots/jingles and Radio Talks etc. through local FM channels
− Creating an interactive E-Commerce website exclusively for “Aizawl Solar City” for awareness campaigns, information sharing and support to the users for submission of online application for incentives etc.
2. Print Media/Publication
− Advertisements in colour and black & white in Newspapers/magazines/journals etc. − Printing of booklets/folders/brochures/posters/calendars/Trade Guide/ Compendium/ Newsletters
etc. on different promotional schemes under Aizawl Solar City project. − Develop educational programs on energy efficiency, distributed generation, and renewable energy
systems in buildings for homeowners, businesses, government staff, and those in the building industries.
3. Exhibitions, Outdoor Publicity, Campaign − Use of Exhibitions and Outdoor Publicity activities like hoardings, kiosks, bus panels, bus-stop
shelters, wall paintings, computerized animation display systems, etc. in the city. − Display and demonstration of RE and EE equipments in the Solar City Cell. − Organizing runs, debates, seminars, quiz, drawing, model making, poster, essay and slogan writing
competitions among others for school children and others; − Promotion and publicity of RE and EE by displaying models and posters etc in different public places,
institutions/organizations, hospitals, bus stand etc. − Encourage maximum participation by residents and business owners in the City’s energy efficiency
programs through marketing and education. − Educate government purchasing agents in each City department regarding the benefits of Energy
Star rated equipment, including the cost savings to the city. − Encourage community input on strategies for improving energy efficiency in building.
4. Workshops and Seminars
It is proposed to organize workshops and seminars on specific technologies for targeted audiences from residential, commercial, Institutional, Industrial and Municipal Sectors. 6.3.3. Implementation of RE Strategy The solar city development programme will be implemented through joint participation of the residential citizens of the Aizawl city, industries, commercial and institutional establishment, city municipal Council, state government and Ministry of New and Renewable Energy. Financial assistance for installation of various renewable energy devices and systems will be availed as per the provisions of various schemes of the
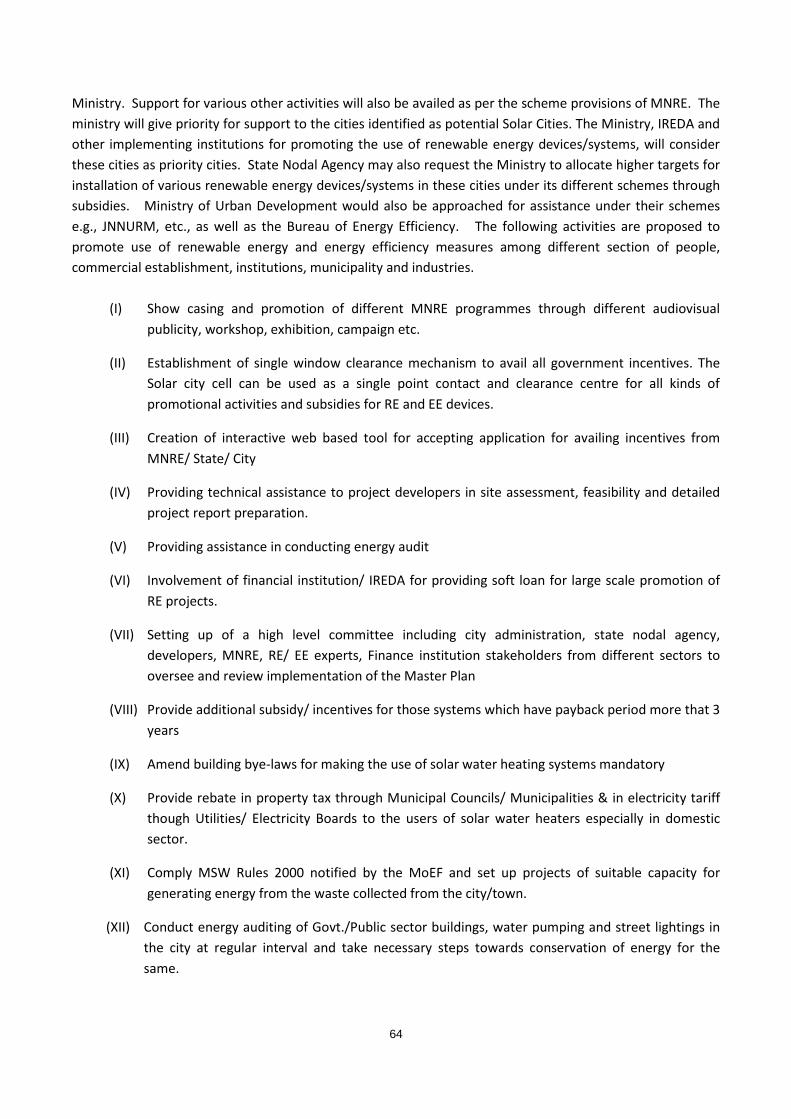
64
Ministry. Support for various other activities will also be availed as per the scheme provisions of MNRE. The ministry will give priority for support to the cities identified as potential Solar Cities. The Ministry, IREDA and other implementing institutions for promoting the use of renewable energy devices/systems, will consider these cities as priority cities. State Nodal Agency may also request the Ministry to allocate higher targets for installation of various renewable energy devices/systems in these cities under its different schemes through subsidies. Ministry of Urban Development would also be approached for assistance under their schemes e.g., JNNURM, etc., as well as the Bureau of Energy Efficiency. The following activities are proposed to promote use of renewable energy and energy efficiency measures among different section of people, commercial establishment, institutions, municipality and industries.
(I) Show casing and promotion of different MNRE programmes through different audiovisual publicity, workshop, exhibition, campaign etc.
(II) Establishment of single window clearance mechanism to avail all government incentives. The Solar city cell can be used as a single point contact and clearance centre for all kinds of promotional activities and subsidies for RE and EE devices.
(III) Creation of interactive web based tool for accepting application for availing incentives from MNRE/ State/ City
(IV) Providing technical assistance to project developers in site assessment, feasibility and detailed project report preparation.
(V) Providing assistance in conducting energy audit
(VI) Involvement of financial institution/ IREDA for providing soft loan for large scale promotion of RE projects.
(VII) Setting up of a high level committee including city administration, state nodal agency, developers, MNRE, RE/ EE experts, Finance institution stakeholders from different sectors to oversee and review implementation of the Master Plan
(VIII) Provide additional subsidy/ incentives for those systems which have payback period more that 3 years
(IX) Amend building bye-laws for making the use of solar water heating systems mandatory
(X) Provide rebate in property tax through Municipal Councils/ Municipalities & in electricity tariff though Utilities/ Electricity Boards to the users of solar water heaters especially in domestic sector.
(XI) Comply MSW Rules 2000 notified by the MoEF and set up projects of suitable capacity for generating energy from the waste collected from the city/town.
(XII) Conduct energy auditing of Govt./Public sector buildings, water pumping and street lightings in the city at regular interval and take necessary steps towards conservation of energy for the same.

65
(XIII) Issue G.O as regards to construction of energy efficient solar buildings at least in Govt. /Public sectors in accordance with ECBC : 2006 and follow up its implementation rigorously.
(XIV) Organize rigorous publicity, and also the training programmes/ business meets for various stake holders e.g. architects, engineers, builders & developers, financial institutions, NGOs, technical institutions, manufactures/suppliers, RWAs etc. so as to involve them actively in meeting the objective of solar city.
(XV) Generate necessary funds from State Govt. and other funding organizations for achieving the objective of making the city as “Solar City”. Benefits of the schemes of Govt. of India will also be taken in meeting the objectives.
(XVI) Promote National Rating System for construction of energy efficient Green Buildings in particular to commercial and institutional buildings
(XVII) Avail financial benefit from Carbon Market
6.3.4. Renewable Energy Pilot Projects MNRE will provide financial assistance for implementation of pilot projects in all sectors. Five categories of projects in different RE technologies are proposed in each sector. It is proposed that MNRE will provide financial assistance under JNNSM guidelines, users will contribute at least 10% of the project cost and balance amount if required will be supported by state for residential, commercial and industrial sector pilot projects. In the government sector pilot project, state will bear balance amount of fund after availing CFA under JNNSM. The total investment for implementation of all proposed pilot projects is estimated as Rs.329.85Lakh out of which MNRE will contribute Rs.234.80Lakh, City/ Sate will contribute Rs.79.06 Lakh and the users will contribute Rs.15.99 lakh. It is however suggested that MNRE will provide special incentive for pilot projects considering greater part of the project costs as CFA. All the pilot projects shall be executed in the first year of implementation. The following tables show pilot projects proposed and financial implication thereon in different sectors in the city.
Table 61 : Pilot Projects in Residential Sector
Sl. No.
Proposed Pilot Projects Capacity Unit Nos.
Cost per system (Lakh)
Total cost (Lakh)
MNRE Share (Lakh)
City/ State Share (Lakh)
Users share (Lakh)
1 Solar lanterns to replace kerosene lamps 10 Wp 200 0.03 6.00 5.40 0.00 0.60 2 Solar Home system to replace kerosene 74 Wp 100 0.22 22.20 19.98 0.00 2.22 3 PV system for Home inverter 150 Wp 20 0.45 9.00 7.29 0.81 0.90 4 Solar Water Heaters 100 LPD 100 0.25 25.00 13.20 5.58 6.22
Total 62.20 45.87 6.39 9.94
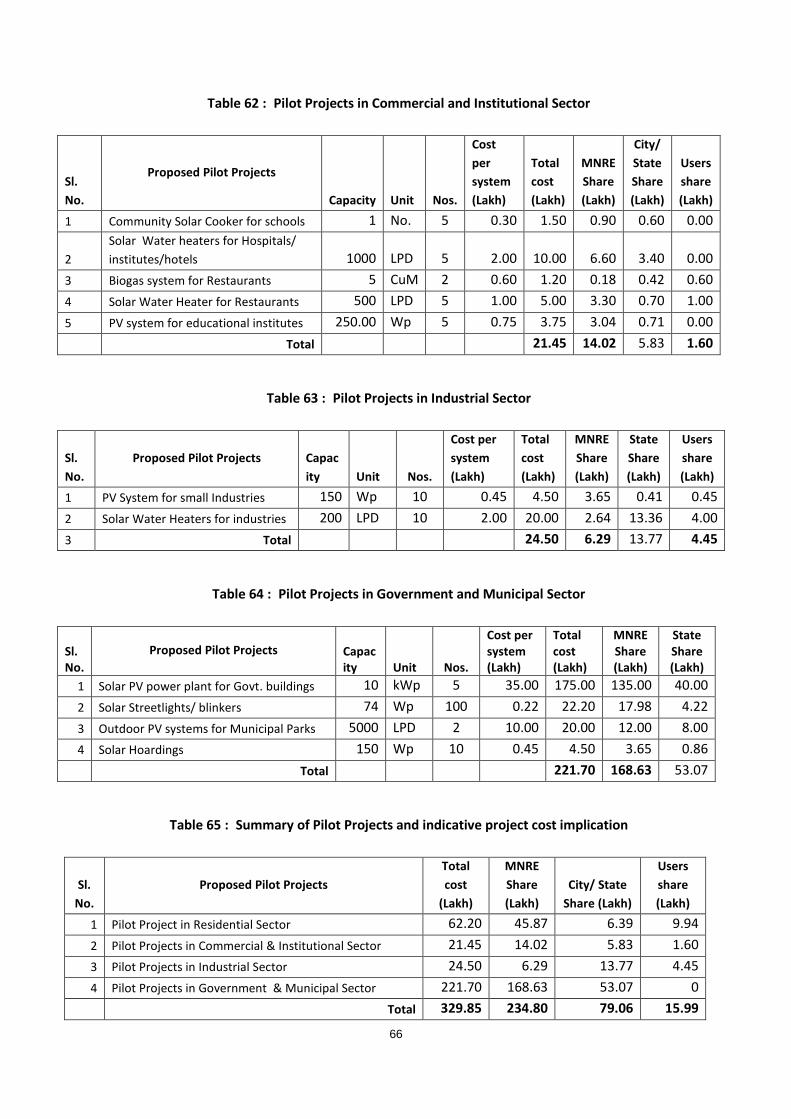
66
Table 62 : Pilot Projects in Commercial and Institutional Sector
Sl. No.
Proposed Pilot Projects
Capacity Unit Nos.
Cost per system (Lakh)
Total cost (Lakh)
MNRE Share (Lakh)
City/ State Share (Lakh)
Users share (Lakh)
1 Community Solar Cooker for schools 1 No. 5 0.30 1.50 0.90 0.60 0.00
2 Solar Water heaters for Hospitals/ institutes/hotels 1000 LPD 5 2.00 10.00 6.60 3.40 0.00
3 Biogas system for Restaurants 5 CuM 2 0.60 1.20 0.18 0.42 0.60 4 Solar Water Heater for Restaurants 500 LPD 5 1.00 5.00 3.30 0.70 1.00 5 PV system for educational institutes 250.00 Wp 5 0.75 3.75 3.04 0.71 0.00 Total 21.45 14.02 5.83 1.60
Table 63 : Pilot Projects in Industrial Sector
Sl. No.
Proposed Pilot Projects Capacity Unit Nos.
Cost per system (Lakh)
Total cost (Lakh)
MNRE Share (Lakh)
State Share (Lakh)
Users share (Lakh)
1 PV System for small Industries 150 Wp 10 0.45 4.50 3.65 0.41 0.45 2 Solar Water Heaters for industries 200 LPD 10 2.00 20.00 2.64 13.36 4.00 3 Total 24.50 6.29 13.77 4.45
Table 64 : Pilot Projects in Government and Municipal Sector
Sl. No.
Proposed Pilot Projects Capacity Unit Nos.
Cost per system (Lakh)
Total cost (Lakh)
MNRE Share (Lakh)
State Share (Lakh)
1 Solar PV power plant for Govt. buildings 10 kWp 5 35.00 175.00 135.00 40.00 2 Solar Streetlights/ blinkers 74 Wp 100 0.22 22.20 17.98 4.22 3 Outdoor PV systems for Municipal Parks 5000 LPD 2 10.00 20.00 12.00 8.00 4 Solar Hoardings 150 Wp 10 0.45 4.50 3.65 0.86
Total 221.70 168.63 53.07
Table 65 : Summary of Pilot Projects and indicative project cost implication
Sl. No.
Proposed Pilot Projects Total cost
(Lakh)
MNRE Share (Lakh)
City/ State Share (Lakh)
Users share (Lakh)
1 Pilot Project in Residential Sector 62.20 45.87 6.39 9.94 2 Pilot Projects in Commercial & Institutional Sector 21.45 14.02 5.83 1.60 3 Pilot Projects in Industrial Sector 24.50 6.29 13.77 4.45 4 Pilot Projects in Government & Municipal Sector 221.70 168.63 53.07 0
Total 329.85 234.80 79.06 15.99

67
6.4. Financial outlays and sharing of fund The total budget for development of Aizawl as Solar City is estimated at Rs.191.42 crore which will be invested over the 5 years of implementation period of solar city development programme. The total budget will be shared by the state government/ City authority (5%), MNRE (77%) and the private users (18%). The budget for implementation of RE strategy and EE strategy is estimated at Rs.172.76 crore and Rs.18.18crore respectively. Budget for establishment of the Solar City Cell and awareness and publicity is estimated at Rs.48.30 Lakhs which could be enhanced depending upon the requirement. While budget for RE strategy will be shared by MNRE, state/city and private users, private investors will primarily drive EE activities. A substantial amount of investment could be recovered or the entire project could be partially financed through carbon finance mechanism. A suitable methodology will be adopted to avail benefit from carbon market selling the CER generated from the project.
Table 66 : Sector wise annual budget and sharing of expenses for development of Aizawl Solar City
Unit Total Year 1 Year 2 Year 3 Year 4 Year 5 MNRE contribution for RE strategy
Establishment of Solar City Cell Lakh 10.00 3.52 1.62 1.62 1.62 1.62 Publicity and Awareness Lakh 28.00 8.15 8.15 5.60 3.05 3.05 RE for Residential Sector Lakh 8160.58 816.06 1224.09 1632.12 2040.15 2448.18 RE for Commercial & Inst. Sector Lakh 848.51 84.85 127.28 169.70 212.13 254.55 RE for Industrial Sector Lakh 630.41 63.04 94.56 126.08 157.60 189.12 RE for Govt. and Municipal Sector Lakh 2306.56 230.66 345.98 461.31 576.64 691.97 Total MNRE Share 11984.06 1206.28 1801.68 2396.43 2991.19 3588.49
State/city contribution Establishment of Solar City Cell Lakh 10.30 0.70 2.40 2.40 2.40 2.40 RE for Institutional Sector Lakh 122.33 12.23 18.35 24.47 30.58 36.70 RE for Municipal Sector Lakh 541.29 54.13 81.19 108.26 135.32 162.39 EE Measures for Inst. Sector Lakh 80.14 8.01 12.02 16.03 20.04 24.04 EE Measures for Municipal Sector Lakh 79.39 7.94 11.91 15.88 19.85 23.82 Total State share 833.45 83.35 125.02 166.69 208.36 250.04
Private/ Users contribution RE for Residential Sector Lakh 4188.89 418.89 628.33 837.78 1047.22 1256.67 RE for Commercial & Inst. Sector Lakh 195.79 19.58 29.37 39.16 48.95 58.74 RE for Industrial Sector Lakh 281.71 28.17 42.26 56.34 70.43 84.51 EE for Residential Sector Lakh 1233.11 123.31 184.97 246.62 308.28 369.93 EE for Commercial & Inst. Sector Lakh 240.43 24.04 36.07 48.09 60.11 72.13 EE Measures for Industrial Sector Lakh 184.97 18.50 27.75 36.99 46.24 55.49 Total Users share 6324.91 632.49 948.74 1264.98 1581.23 1897.47 Total Budget Lakh 19142.42 1922.11 2875.43 3828.10 4780.77 5736.00

68
Table 67 : Summary of budget and sharing of expenses
Year 1 (Crore)
Year 2 (Crore)
Year 3 (Crore)
Year 4 (Crore)
Year 5 (Crore) Total (Crore)
State / City Share 0.83 1.25 1.67 2.08 2.50 8.33 MNRE Share 12.06 18.02 23.96 29.91 35.88 119.84 Private Share 6.32 9.49 12.65 15.81 18.97 63.25 Total Budget 19.22 28.75 38.28 47.81 57.36 191.42
Figure 11 : Sharing of total budget for development of solar city Aizawl
Figure 12 : Sharing of RE Strategy Budget for Aizawl Solar City

69
Figure 13 : Sharing of EE Strategy Budget for Aizawl Solar City
Figure 14 : Year wise sharing of budget for Aizawl Solar City Programme
6.5. Potential Carbon Market Benefit The RE and EE activities under solar city programme will considerable amount of green house emission per year. The CER generated under this project can be sold to carbon market under suitable mechanism. It is estimated that a total of 42050 CERs could be sold from the project which will give a revenue of Rs.302.76 Lakh per year. If project life is considered 7 years, the income from carbon market will recover about 12.28% of the project cost.
Table 68 : Potential Carbon Market Benefit
Energy Saved
(MU) CER
(Tons) Value
(Lakh/year) Project life CER Value
(Lakh)
CER from entire RE strategy 53.76 36290 261.29 1829.01
CER from Entire EE strategy 33.07 26783 192.84 1349.86 CER from entire solar city project 86.82 63073 454.12 3178.87

70

71
Annexure 1 : Example of Byelaws for installation of solar water heating system
Regulation/Bye-laws for installation of Solar assisted water heating system in Functional buildings in Rajkot
The following provisions are formatted for inclusion in the building bye laws of RUDA 1 “No new building in the following categories in which there is a system or installation to supplying host water shall be built unless the system or the installation is also having an auxiliary solar assisted water heating system :
a) Hospital & Nursing Homes. b) Hotels, Lodges and Guest houses c) Hostels of schools, Colleges, Training Centers d) Barracks of armed forces, paramilitary forces and police e) Individual residential buildings having more that 150 Sq.mt. plinth area f) Functional Buildings of Railway station and Air ports like waiting rooms, retiring rooms, rest rooms, inspection bungalows and catering units. g) Community Centers, Banquet Halls, Barat Ghars, Kalyan mandaps and buildings for similar use.
2. Installation of Solar Water Heating System: (a) New Buildings: Clearance of plan for the construction of new buildings of the aforesaid categories shall only be given if they have a provision in the building design itself for an insulated pipeline from the rooftop in the building to various distribution points where hot water is required. The building must have a provision for continuous water supply to the solar water heating system. The building should also have open space on the rooftop which receives direct sun light. The load bearing capacity of the roof should atleast be 50 kg. per sqm. All new buildings of above said categories must complete installation of solar water heating systems before obtaining necessary license to commence their business. (b) Existing Buildings: Installation of Solar Assisted Water Heating Systems in the existing building shall be made mandatory at the time to change of use to above said category provided there is a system or installation for supplying hot water.
3. Capacity: The capacity of solar water heating system to be installed on the building of different categories shall be decided in consultation with the local bodies. The recommended minimum capacity shall not be less than 25 litres per day for each bathroom and kitchen subject to the condition that maximum of 50 % of the total roof area is provided with the system.
4. Specification: Installation of Solar Assisted Water Heating System shall conform to BIS (Bureau of India Standards) specification IS: 12933. The solar collectors used in the system shall have the BIS certification Mark.
5. Auxiliary System: Wherever hot water requirement is continuous, auxiliary, heating arrangement either with electric elements or oil of adequate capacity can be provided.

72
Annexure 2 : List of Experts/ consultant for Green Building Design Prof. C.L. Gupta Solar Energy Unit Sri Aurobindo Ashram Podicherry 605002 E-mail: [email protected] Ms Anand Mann & Mr Siddhartha Wig The Elements SCF 59, 1st Floor, Sector 6 Panchkula 134101 Phone: 0172-2580094 Prof. Arvind Krishnan, Centre for Advanced Studies in Architecture, School of Planning & Architecture, 4, Block B Indraprastha Estate, New Delhi-110002 Phone: 011-26107250/26167060 E-mail : [email protected] Dr. Vinod Gupta Space Design Consultants G 4, Masjid Moth, GK 2 New Delhi-110048 Phone: 011-40573213 Ext. 31, 40573264 Web: http://www.space-design.com Ms. Mili Majumdar, The Energy and Resources Institute, Darbari Seth Block, India Habitat Centre, Lodi Road, New Delhi – 110 003 Phone: 011-24682100/1 E-mail : [email protected] Mr Ashok B Lall B-25 Chirag Enclave New Delhi 110017 Also at 2B Ramkishore Road Civil Lines, Delhi 110054
Prof. J.K. Nayak, Energy System Engineering Deptt. Indian Institute of Technology, Bombay-400076 Mr Manmohan Dayal D-3/3552 Vasant Kunj New Delhi 110030 Sh. B. V. Doshi Vastushipa Foudation for Research in Environmental Design Sangath, Thaltej Road Ahmedabad- 380054 E-mail : [email protected] Mr Sanjay Prakash R-1/ 301 Hauz Khas Enclave New Delhi 110 016 Phone: 011-5165 5696/ 2656 9934 Email: [email protected] Sabu Francis & Associates A-104, Shiv Chamber Sector 11, CBD-Belapur, Navi Mumbai MAHARASHTRA E-mail : [email protected] Mr. Anurag Roy Roy and Partners D* /8184, Vasant Kunj New Delhi – 110 070 E-mail : [email protected] Mr Nimish Patel and Ms Parul Zaveri Abhikram 15 Laxmi Nivas Society, Paldi Ahmedabad 380007 Mr Upendra Kachru C-47, Pamposh Enclave, New Delhi 110048,

73
Phone: 011-26411741 E-mail: [email protected] Mr. Harish Ganeriwala Glaze Architecture Pvt. Ltd. 591, Block O New Alipore Kolkata – 700 053 Email: [email protected] Phone: 24005255 Mr. Pankaj Jain M/s Jain & Associates S-13/21, DLF-111 Gurgaon Phone: 0124-4605318,2352829
74
Annexure 3 : References & Bibliography
1. http://www.igreenspot.com/solar-powered-city-concept/, 12.08.09 2. “Solar and Sustainable Cities: Renewable Energy Information on Markets, Policy, Investment and
Future Pathways”, Eric Martinot, http://www.martinot.info/solarcities.htm, 10.08.09 3. “India: Addressing Energy Security and Climate Change”, Ministry of Environment and Forests,
Ministry of Power, Bureau of Energy Efficiency, Government of India 4. “Solar Radiation Handbook 2008”, Solar Energy Centre, Ministry of New and Renewable Energy,
Indian Meteorological Institute 5. http://www.mnre.gov.in/ 6. Source: State oil Coordinator (HPCL, BPCL, IOCL) 7. Source: State oil Coordinator (HPCL, BPCL, IOCL) 8. Source: State oil Coordinator (HPCL, BPCL, IOCL) 9. http://www.energymanagertraining.com/DesignatedConsumers/main.htm,
http://www.hindustanpetroleum.com/en/UI/AboutLPG.aspx 10. Aizawl CDP 11. Source: http://eosweb.larc.nasa.gov/ ; http://www.mnre.gov.in/ 12. Source: http://eosweb.larc.nasa.gov/ 13. Source: Biomass Resource Atlas of India (http://lab.cgpl.iisc.ernet.in/Atlas/Default.aspx) 14. Source: Aizawl Report 15. Case-study booklet on Renewable Energy. 2009 16. CII. 2005. Development of small ESCOs to undertake biomass gasification projects for industrial
applications. Report prepared for MNES. Confederation of Indian Industries. 17. Basic Information Sourced from: Ministry of Urban Development and Poverty Alleviation 2000. 18. (Biomethanation of Vegetable Market Waste – Untapped Carbon Trading Opportunities K. Sri Bala
Kameswari, B. Velmurugan, K. Thirumaran and R.A. Ramanujam. Department of Environmental Technology, Central Leather Research Institute (CLRI), Adyar, Chennai, India Proceedings of the International Conference on Sustainable Solid Waste Management,5 - 7 September 2007, Chennai, India. Pp.415-420)
19. Renewable Energy: Economic and Environmental Issues, Pimental et al 20. A roadmap for renewable energy risks, Lloyd. 21. http://www.nef.org.uk/logpile/woodfuel/burningwood.htm

75
Annexure 4 :
Project Proposal for
10kWp Stand Alone SPV Power Plant under
Development of Solar City Programme of MNRE
1. Title of the Project: 10kWp rooftop Solar PV system for ZEDA building at Aizawl
2. Name of the Project Proponent: Zoram Energy Development Agency (ZEDA)
3. Socio- Economic Justification of the Project:
Solar PV power plant generates clean electricity using sunlight thereby off set green house gases produced by fossil fuel based power generating system. The country’s majority generation capacity is largely coal based and produces high quantity of carbon dioxide and other harmful gases. If the untapped solar energy potential is realized carbon dioxide and other toxic gas emissions can be lowered by significant quantity and thereby saving our environment. Therefore, every kilowatt of solar energy produced has to be seen from this angle as a small but major step towards mitigation of carbon dioxide emission and subsequently combat climate change. The proposed 10kWp PV power plant will generate about 15,000 kWh of clean electrical energy per year and will reduce 12 tons of GHG per year. Many Government and commercial buildings in Aizawl use Diesel Generator sets as standby power supply system during load shedding hours. DG sets create pollution and generation cost of electricity from DG sets is high which is Rs.15-Rs.20 per kWh based on capacity of DG sets and utilization of capacity. Solar PV power plant generates electricity at much lower cost then DG sets and use of Solar PV power plant can replace diesel set completely or reduce fuel consumption. Use of Solar PV power plant also reduces peak load, air-conditioner load in particular.
4. Benefits of the proposed project:
The proposed 10kWp PV power plant in the Zoram Energy Development Agency (ZEDA) building will generate 15000kWh per year which will save equivalent amount of electricity consumed from the grid. The power plant will reduce peak load and will supply power during load shedding hours thereby replace the use of diesel generator sets for standby power supply.
PV systems are becoming increasingly popular in India however; experience in O&M of such system in is very low. The first hand experience PV system O&M train engineers and technical staff in Zoram Energy Development Agency (ZEDA) and will help in developing similar projects in future.

76
PART-A: Details of the Project Proponent
i
Name and Category of Project Proponent
a) Renewable Energy Service Providing Company (RESCO)
b) Financial Institutions (Banks, NBFCs, MFIs) c) Financial Integrator d) System Integrator e) Program Administrator
Name of the Project Proponent: Zoram Energy Development Agency (ZEDA) Category: Program Administrator.
ii
Name, Designation and Address of the Authorized Representative for Correspondence with telephone no., fax & email
Name: The Director Zoram Energy Development Agency (ZEDA)
iii
In case of Channel Partner other than Programme Administrator, the following information will be provided: a) Whether commercial or non-commercial. b) Copy of Articles of Association, Registration No. & Date;
PAN/TAN No. c) Audited Balance Sheet for last three years d) Annual Report of previous year e) Whether MNRE has earlier sanctioned any SPV projects
for implementation to the Project Proponent, if yes, please furnish information.
NA
iv
In case of 1 (e), please indicate: a) Government Department, Autonomous Institution set up
by Central/ State Government, State Renewable Energy Development Agency, Public Sector Undertaking
b) Others
State Renewable Energy Development Agency

77
PART-B: Details of the Project
1. Summary of the Proposal:
Aizawl, the capital of Mizoram state in India, is situated on a hill top with a beautiful scenery from all sides. The city is located north of the Tropic of Cancer in the northern part of Mizoram and is situated on a ridge 1132 metres (3715 ft) above sea level, with the Tlawng river valley to its west and the Tuirial river valley to its east. In the summer the temperature ranges from 20-30 deg Celsius, and in the winter 11-21 deg Celsius. Aizawl is a beautiful place that offers plenty of tourist attractions to tourists and habitants alike. Besides its breathtaking beauty, Aizawl is the storehouse of important Government offices, State Assembly House and Civil Secretariat. The renewable energy programmes in Mizoram is primarily being implemented through the Zoram Energy Development Agency (ZEDA) under Government of Mizoram. Various schemes in the field of Solar energy, Biomass, Remote Village Electrification Programme under the Ministry of New and Renewable Energy (MNRE) are being successfully implemented by the nodal agency. The Ministry of New and Renewable Energy (MNRE) approved financial assistance to Aizawl Municipal Council for developing Aizawl City as Solar City. The Master Plan for development of Aizawl as a solar city has been prepared.
It is proposed to install one 10kWp SPV power plant in the administrative building of Zoram Energy Development Agency (ZEDA) as model Renewable Energy power generating systems to cater the electrical energy demand for the stadium office and simultaneously to set example and encourage entrepreneurs to invest on such projects. The system will be installed in the stadium and will be opened to the interested public and entrepreneurs. Trained manpower will be deployed to explain about the system and benefits to the interested visitors. 2. Details of Project site: The city of Aizawl is located at the longitude 92.94oE and latitude 23.42oN. Average load shedding in the city reported be 2-3 hours per day. The average solar radiation on horizontal surface is 4.68kWh/m2/day.
3. Details of Project Beneficiaries: Zoram Energy Development Agency (ZEDA) will be the direct beneficiary of the project. Zoram Energy Development Agency is the state nodal agency for the MNRE and is responsible for promotion and implementation renewable energy programmes in the state. Various schemes in the field of Solar energy, Biomass, Remote Village Electrification Programme under the Ministry of New and Renewable Energy (MNRE) are being successfully implemented by the agency.
4. Details of Proposed Systems :
I. Proposed capacity of the SPV Power Plant: 10kWp II. Availability of shadow free roof area for the power plant : 160 Sqm
III. Details of loads to be energized by Power Plant, calculations and justification for the proposed capacity and expected annual energy generation

78
Details of the loads to be energized by Power Plant:-
Total Nos.
Load (W)
Total Load (kW)
Hours of Operation
Consumption / Day (kWh)
Annual Utilisation (days)
Annual Consumption (kWh)
Ceiling Fans 10 75 0.75 5 3.75 100 375 Air Conditioner 4 1500 6 6 36 100 3600 Television 2 100 0.2 2 0.4 264 105.6 Refrigerator 1 200 0.2 1 0.2 264 52.8 Electric Water Pump 1 3750 3.75 4 15 300 4500 Incandescent 12 60 0.72 4 2.88 264 760.32 CFLs 50 18 0.9 5 4.5 264 1188 Fluorescent Long 20 55 1.1 8 8.8 264 2323.2 Fluorescent Short 20 14 0.28 4 1.12 264 295.68 Computers 10 100 1 10 10 300 3000 Printers 4 100 0.4 10 4 300 1200 Total 15.3 86.65 17400.6
IV. Output Voltage of the Power Plant: 440 V V. Storage battery capacity: 30 kWh (3 hours backup for selected loads excluding ACs, coolers and
water pump) VI. Building for housing the battery bank and plant control systems: Separate rooms within the building
available VII. Distribution Network (if any): The existing distribution network will be used
VIII. Expected reduction in diesel consumption, if any: NA
System Components
Make and Model
Capacity Numbers Indigenous/ Imported
PV Module Make: MNRE approved supplier Mono/ Multi crystalline
200Wp at STC
50 nos. Indigenous
Charge Controller/ Inverter
MNRE approved supplier
10kW Integral part of Power Conditioning Unit
Indigenous
Power Conditioning Unit
MNRE approved supplier
10kW 1 no. Indigenous
Storage Battery Bank MNRE approved supplier
30kWh 1 set. Indigenous
Performance Data Acquisition System
BIS or equivalent NA 1 No Indigenous
Other components BIS approved or equivalent
As applicable
As required Indigenous

79
PART C: Implementation Schedule o Major Monitorable Milestones o Project Commissioning Timeline
• Project can be completed within 6 months from the date of finalization of vendor.
Sl. No.
Activities Progress Months
1 2 3 4 5 6 1 Application/ clearance from MNRE 2 Procurement Process 3 Site survey & Engineering design 4 Erection of array mounting Structures 5 Module mounting and cabling 6 Installation of Power Conditioning Unit 7 Testing and commissioning

80
PART D: Performance Monitoring Mechanism:
Performance Data Monitoring (Daily, Monthly and Annual energy generation , logging, compilation and sharing with MNRE)
Performance will be monitored with facilities for daily, monthly & annual power generation. Energy meters and data loggers will be installed accordingly.
Monthly monitoring of reduction in diesel consumption, if any Yes
Own Mechanism In built monitoring system with energy meter and data logger will installed
Third Party 5 years AMC will be signed with the supplier Remote Monitoring (for SPV power plants having capacity above 5 kWp)
Yes
PART E: Project Cost and Financing Details.
i. Cost of Systems Hardware ii. Cost of transportation, insurance
iii. Cost of civil works and electrical works iv. Cost of installation and Commissioning v. Cost of Annual Maintenance for 5 years
vi. Any other related costs
Rs. 24.00 Rs.0.50
Rs. 2.00 Rs.2.00
Rs. 2.00 Rs. 0.50
Total Cost of Systems
Rs. 31.00
Total kWp SPV Capacity
10kWp
Means of Finance a) Contribution of Project Proponent b) Contribution of Beneficiaries organization c) Envisaged CFA from MNRE d) Other Source (s) of Funding (capital grant) e) Envisaged Soft Loan assistance, if any f) Whether funds are in surplus or deficiency
a) ZEDA : Rs. 6.70 Lakh b) MNRE: Rs. 24.30 Lakh
Details of Project Revenue recurring, if any
NA
Project Duration
6 Months

81
PART F: Operation and Maintenance Arrangements The supplier will train engineers and technicians of ZEDA for day to day operation, monitoring and scheduled maintenance work such as cleaning, topping up of batteries etc. - Detail of Operation and Maintenance Arrangements. The system will be procured with minimum 5 years comprehensive annual maintenance contract service. During this period engineers and technicians from ZEDA will be trained for O&M of the system. - Arrangement for Generation Data Collection (applicable for SPV Power Plants having more than 10 kWp capacity). Details of monitoring equipment proposed to be installed and method of supplying data to MNRE/ designated agency. As stated above - Method of monitoring of reduction in diesel consumption, if any. DG set logbook is being maintained in the ZEDA. The same will be maintained to know in reduction of operating time of DG sets after installation of PV systems. The Solar system will - Strategy for training of the O&M Personnel of the Beneficiary Organization.
As stated above

82
PART G: Declarations and Certificates A. It is certified that I/we have read the guidelines issued by the Ministry vide 5/23/2009/P&C dated 16th June, 2010 and the related provisions/terms and conditions for availing financial support from the Ministry of New and Renewable Energy and I agree to abide by these guidelines and related terms and conditions. B. I understand that failure to comply by these guidelines may result in denial of financial support by the Ministry. C. I confirm that the present proposal in full or part has not been submitted / has been submitted to any other agency for seeking support (In case proposal has been submitted to any other agency or under consideration all details and a copy of the proposal must be submitted along with the present proposal).
D. I confirm that I will not submit the same proposal or a part thereof to any other funding agency, without prior knowledge of the Ministry of New and Renewable Energy. E. I confirm that the share of project proponent/beneficiaries shall not be lower than 20% in any circumstances. Projects owned by the Programme Administrators are exempt from this condition. F. I confirm that the proposed solar PV system has not been installed/ supplied at the proposed sites or to the proposed beneficiaries, prior to the receipt of project sanction letter from the Ministry. G. There is no duplication in the proposal and the submitted proposal is the only proposal by the proponent and to the best of our knowledge no other organization has submitted any proposal for the system at this site to MNRE for financial support. H. A detailed site survey has been done/or will be undertaken to identify the beneficiaries before actual supply and installation takes place. I. This is to certify that the various components of the SPV power plant will conform to the Relevant Standards, as mentioned in the Guidelines for Off-grid and Decentralized Solar Applications (Annexure-3) for SPV modules and components under JNNSM. Copies of the Relevant IEC/ BIS Certificates should be enclosed. J. It is mandatory to provide technical performance specifications of each component of the power plant proposed to be installed under the project. And for which the performance will be warranted. K. All technical parameters and warranty requirements must meet or exceed the requirements mentioned in the guidelines issued by the Ministry. I confirm that in case of any dispute, the decision of Secretary, Ministry of New and Renewable Energy, Government of India will be final and binding on all.
Signature _____________ Name & Designation
of Authorized Signatory Seal
Place: Date:

83
Annexure 5 :
Project Proposal for
Stand Alone Solar PV Systems for
Aizawl Municipal Council under
Development of Solar City Programme of MNRE
1. Title of the Project: Solar PV standalone systems for Aizawl Municipal Council
2. Name of the Project Proponent: Aizawl Municipal Council (AMC).
3. Socio- Economic Justification of the Project:
Solar PV power plant generates clean electricity using sunlight thereby off set green house gases produced by fossil fuel based power generating system. The country’s majority generation capacity is largely coal based and produces high quantity of carbon dioxide and other harmful gases. If the untapped solar energy potential is realized carbon dioxide and other toxic gas emissions can be lowered by significant quantity and thereby saving our environment. Therefore, every kilowatt of solar energy produced has to be seen from this angle as a small but major step towards mitigation of carbon dioxide emission and subsequently combat climate change. A cumulative capacity of 70kWp PV power plant will generate about 105,000kWh of clean electrical energy per year and will reduce 84tons of GHG per year. Use of solar streetlights and outdoor lights in the municipal parks will ensure illumination of these areas during load shedding hours. Reliable traffic lights, blinkers and road studs will increase road safety. Water pumps in the municipal parks will help in maintaining the parks green. Municipal parks can avoid use of Diesel Generator sets as standby power supply system during load shedding hours thereby reduces pollution and generation cost of electricity from DG sets. Use of Solar PV power plant also reduces peak load, air-conditioner load in particular.
4. Benefits of the proposed project:
The proposed standalone PV systems in the AMC area will maintain a minimum illumination level in the roads and parks of the municipal area during load shedding and will save 105000kWh per year which is equivalent to an amount of Rs.3.67 lakh electricity bill per year. The systems will reduce peak load and will supply power during load shedding hours thereby maintain minimum illumination level in the streets and replace the use of diesel generator sets for standby power supply.
PV systems are becoming increasingly popular in India however; experience in O&M of such system in is very low. The first hand experience PV system O&M train engineers and technical staff in Aizawl Municipal Council, which will help in developing similar projects in future.

84
PART-A: Details of the Project Proponent
i
Name and Category of Project Proponent
a) Renewable Energy Service Providing Company (RESCO)
b) Financial Institutions (Banks, NBFCs, MFIs) c) Financial Integrator d) System Integrator e) Program Administrator
Name of the Project Proponent: Aizawl Municipal Council, Aizawl, Mizoram Category: Program Administrator.
ii
Name, Designation and Address of the Authorized Representative for Correspondence with telephone no., fax & email
Name: The Director Address: Directorate of Urban Development & Poverty Alleviation, Government of Mizoram, Aizawl
iii
In case of Channel Partner other than Programme Administrator, the following information will be provided: a) Whether commercial or non-commercial. b) Copy of Articles of Association, Registration No. &
Date; PAN/TAN No. c) Audited Balance Sheet for last three years d) Annual Report of previous year e) Whether MNRE has earlier sanctioned any SPV projects
for implementation to the Project Proponent, if yes, please furnish information.
NA
iv
In case of 1 (e), please indicate: a) Government Department, Autonomous Institution set
up by Central/ State Government, State Renewable Energy Development Agency, Public Sector Undertaking
b) Others
Government Department
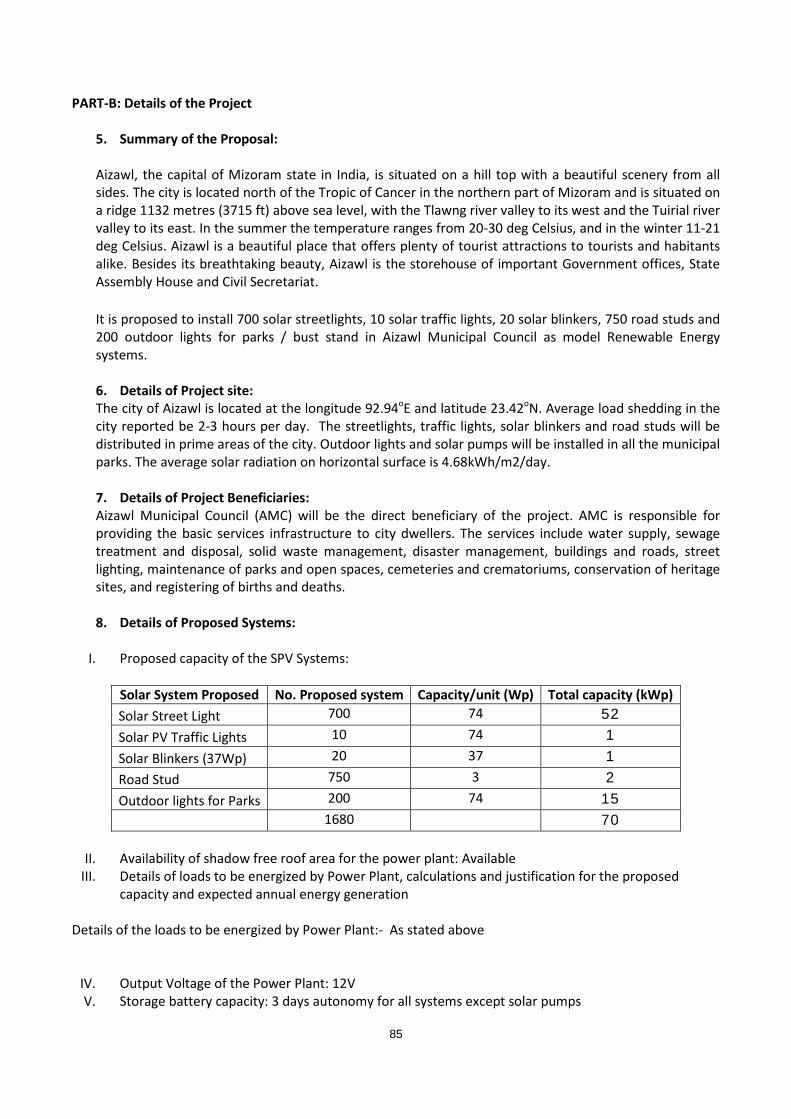
85
PART-B: Details of the Project
5. Summary of the Proposal:
Aizawl, the capital of Mizoram state in India, is situated on a hill top with a beautiful scenery from all sides. The city is located north of the Tropic of Cancer in the northern part of Mizoram and is situated on a ridge 1132 metres (3715 ft) above sea level, with the Tlawng river valley to its west and the Tuirial river valley to its east. In the summer the temperature ranges from 20-30 deg Celsius, and in the winter 11-21 deg Celsius. Aizawl is a beautiful place that offers plenty of tourist attractions to tourists and habitants alike. Besides its breathtaking beauty, Aizawl is the storehouse of important Government offices, State Assembly House and Civil Secretariat. It is proposed to install 700 solar streetlights, 10 solar traffic lights, 20 solar blinkers, 750 road studs and 200 outdoor lights for parks / bust stand in Aizawl Municipal Council as model Renewable Energy systems. 6. Details of Project site: The city of Aizawl is located at the longitude 92.94oE and latitude 23.42oN. Average load shedding in the city reported be 2-3 hours per day. The streetlights, traffic lights, solar blinkers and road studs will be distributed in prime areas of the city. Outdoor lights and solar pumps will be installed in all the municipal parks. The average solar radiation on horizontal surface is 4.68kWh/m2/day. 7. Details of Project Beneficiaries: Aizawl Municipal Council (AMC) will be the direct beneficiary of the project. AMC is responsible for providing the basic services infrastructure to city dwellers. The services include water supply, sewage treatment and disposal, solid waste management, disaster management, buildings and roads, street lighting, maintenance of parks and open spaces, cemeteries and crematoriums, conservation of heritage sites, and registering of births and deaths.
8. Details of Proposed Systems:
I. Proposed capacity of the SPV Systems:
Solar System Proposed No. Proposed system Capacity/unit (Wp) Total capacity (kWp) Solar Street Light 700 74 52 Solar PV Traffic Lights 10 74 1 Solar Blinkers (37Wp) 20 37 1 Road Stud 750 3 2 Outdoor lights for Parks 200 74 15 1680 70
II. Availability of shadow free roof area for the power plant: Available
III. Details of loads to be energized by Power Plant, calculations and justification for the proposed capacity and expected annual energy generation
Details of the loads to be energized by Power Plant:- As stated above
IV. Output Voltage of the Power Plant: 12V V. Storage battery capacity: 3 days autonomy for all systems except solar pumps

86
VI. Building for housing the battery bank and plant control systems: Not required VII. Distribution Network (if any): Not required (Standalone)
VIII. Expected reduction in diesel consumption, if any: NA
System Components
Make and Model
Capacity Numbers Indigenous/ Imported
PV Module Make: MNRE approved supplier Mono/ Multi crystalline
74Wp/ 37Wp/ 3Wp at STC
1680 nos. Indigenous
Charge Controller/ Inverter
MNRE approved supplier
As required As required Indigenous
Power Conditioning Unit
MNRE approved supplier
Not required Not required Indigenous
Storage Battery Bank MNRE approved supplier
As required As required Indigenous
Performance Data Acquisition System
BIS or equivalent NA NA Indigenous
Other components MNRE approved MPPT required for solar pumps
As required Indigenous

87
PART C: Implementation Schedule o Major Monitorable Milestones
o Project Commissioning Timeline
• Project can be completed within 6 months from the date of finalization of vendor. PART D: Performance Monitoring Mechanism:
Performance Data Monitoring (Daily, Monthly and Annual energy generation , logging, compilation and sharing with MNRE)
Performance will be monitored through regular inspection.
Monthly monitoring of reduction in diesel consumption, if any NA
Own Mechanism NA Third Party 5 years AMC will be signed with the supplier Remote Monitoring (for SPV power plants having capacity above 5 kWp)
NA
Sl. No. Activities
Progress Months 1 2 3 4 5 6 7 8
1 Application/ clearance from MNRE
2 Procurement Process
3 Installation and commissioning

88
PART E: Project Cost and Financing Details.
i) Cost of Systems Hardware ii) Cost of transportation, insurance iii) Cost of civil works and electrical works iv) Cost of installation and Commissioning v) Cost of Annual Maintenance for 5 years vi) Any other related costs
Rs. 193.00 Rs.4.00
Rs. 15.00 Rs.15.00 Rs. 15.00
Rs. 2.00 Total Cost of Systems
Rs. 244.00
Total kWp SPV Capacity
70kWp (Aggregate)
Means of Finance a) Contribution of Project Proponent b) Contribution of Beneficiaries organization c) Envisaged CFA from MNRE d) Other Source (s) of Funding (capital grant) e) Envisaged Soft Loan assistance, if any f) Whether funds are in surplus or deficiency
a) AMC : Rs.73.00 Lakh b) MNRE: Rs.171.00 Lakh
Details of Project Revenue recurring, if any NA
Project Duration
6 Months
PART F: Operation and Maintenance Arrangements The supplier will train engineers and technicians of AMC for day to day operation, monitoring and scheduled maintenance work such as cleaning, topping up of batteries etc. - Detail of Operation and Maintenance Arrangements. The system will be procured with minimum 5 years comprehensive annual maintenance contract service. During this period engineers and technicians from AMC will be trained for O&M of the system. - Arrangement for Generation Data Collection (applicable for SPV Power Plants having more than 10 kWp capacity). Details of monitoring equipment proposed to be installed and method of supplying data to MNRE/ designated agency. As stated above - Method of monitoring of reduction in diesel consumption, if any. NA - Strategy for training of the O&M Personnel of the Beneficiary Organization.
As stated above

89
PART G: Declarations and Certificates A. It is certified that I/we have read the guidelines issued by the Ministry vide 5/23/2009/P&C dated 16th June, 2010 and the related provisions/terms and conditions for availing financial support from the Ministry of New and Renewable Energy and I agree to abide by these guidelines and related terms and conditions. B. I understand that failure to comply by these guidelines may result in denial of financial support by the Ministry. C. I confirm that the present proposal in full or part has not been submitted / has been submitted to any other agency for seeking support (In case proposal has been submitted to any other agency or under consideration all details and a copy of the proposal must be submitted along with the present proposal).
D. I confirm that I will not submit the same proposal or a part thereof to any other funding agency, without prior knowledge of the Ministry of New and Renewable Energy. E. I confirm that the share of project proponent/beneficiaries shall not be lower than 20% in any circumstances. Projects owned by the Programme Administrators are exempt from this condition. F. I confirm that the proposed solar PV system has not been installed/ supplied at the proposed sites or to the proposed beneficiaries, prior to the receipt of project sanction letter from the Ministry. G. There is no duplication in the proposal and the submitted proposal is the only proposal by the proponent and to the best of our knowledge no other organization has submitted any proposal for the system at this site to MNRE for financial support. H. A detailed site survey has been done/or will be undertaken to identify the beneficiaries before actual supply and installation takes place. I. This is to certify that the various components of the SPV power plant will conform to the Relevant Standards, as mentioned in the Guidelines for Off-grid and Decentralized Solar Applications (Annexure-3) for SPV modules and components under JNNSM. Copies of the Relevant IEC/ BIS Certificates should be enclosed. J. It is mandatory to provide technical performance specifications of each component of the power plant proposed to be installed under the project. And for which the performance will be warranted. K. All technical parameters and warranty requirements must meet or exceed the requirements mentioned in the guidelines issued by the Ministry. I confirm that in case of any dispute, the decision of Secretary, Ministry of New and Renewable Energy, Government of India will be final and binding on all.
Signature _____________ Name & Designation
of Authorized Signatory Seal
Place: Date:
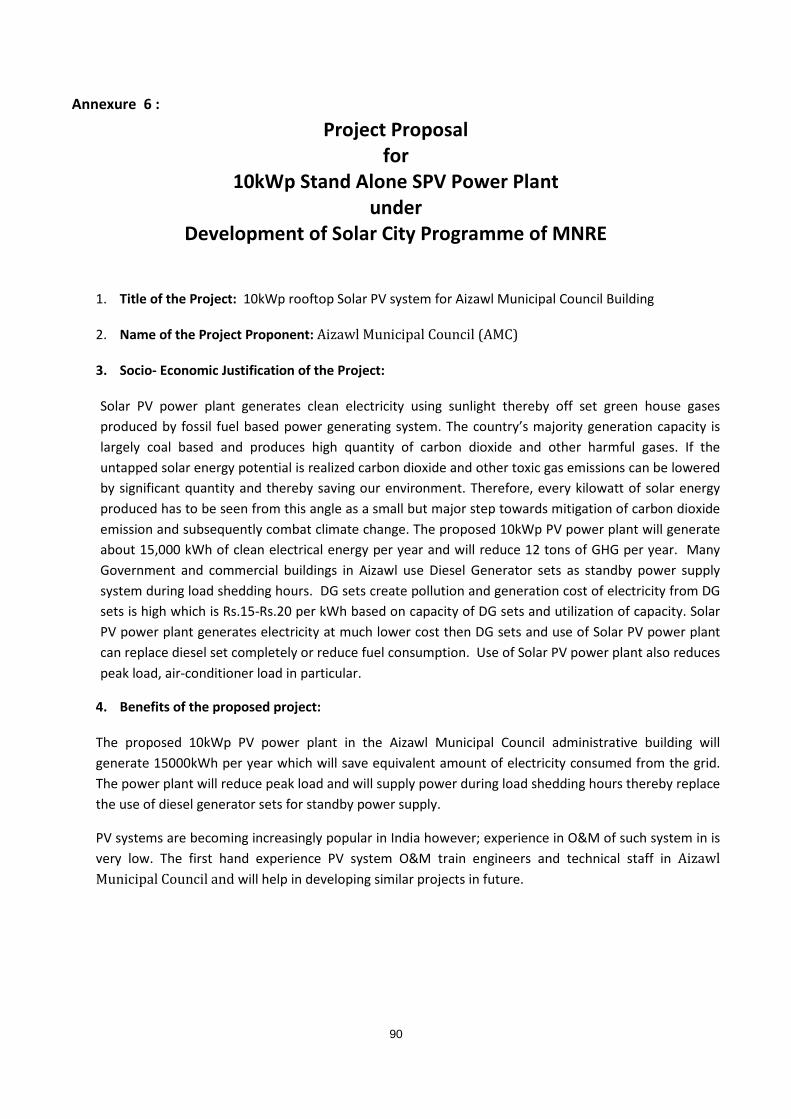
90
Annexure 6 :
Project Proposal for
10kWp Stand Alone SPV Power Plant under
Development of Solar City Programme of MNRE
1. Title of the Project: 10kWp rooftop Solar PV system for Aizawl Municipal Council Building
2. Name of the Project Proponent: Aizawl Municipal Council (AMC)
3. Socio- Economic Justification of the Project:
Solar PV power plant generates clean electricity using sunlight thereby off set green house gases produced by fossil fuel based power generating system. The country’s majority generation capacity is largely coal based and produces high quantity of carbon dioxide and other harmful gases. If the untapped solar energy potential is realized carbon dioxide and other toxic gas emissions can be lowered by significant quantity and thereby saving our environment. Therefore, every kilowatt of solar energy produced has to be seen from this angle as a small but major step towards mitigation of carbon dioxide emission and subsequently combat climate change. The proposed 10kWp PV power plant will generate about 15,000 kWh of clean electrical energy per year and will reduce 12 tons of GHG per year. Many Government and commercial buildings in Aizawl use Diesel Generator sets as standby power supply system during load shedding hours. DG sets create pollution and generation cost of electricity from DG sets is high which is Rs.15-Rs.20 per kWh based on capacity of DG sets and utilization of capacity. Solar PV power plant generates electricity at much lower cost then DG sets and use of Solar PV power plant can replace diesel set completely or reduce fuel consumption. Use of Solar PV power plant also reduces peak load, air-conditioner load in particular.
4. Benefits of the proposed project:
The proposed 10kWp PV power plant in the Aizawl Municipal Council administrative building will generate 15000kWh per year which will save equivalent amount of electricity consumed from the grid. The power plant will reduce peak load and will supply power during load shedding hours thereby replace the use of diesel generator sets for standby power supply.
PV systems are becoming increasingly popular in India however; experience in O&M of such system in is very low. The first hand experience PV system O&M train engineers and technical staff in Aizawl Municipal Council and will help in developing similar projects in future.

91
PART-A: Details of the Project Proponent
i
Name and Category of Project Proponent
a) Renewable Energy Service Providing Company (RESCO)
b) Financial Institutions (Banks, NBFCs, MFIs) c) Financial Integrator d) System Integrator e) Program Administrator
Name of the Project Proponent: Aizawl Municipal Council Category: Program Administrator.
ii
Name, Designation and Address of the Authorized Representative for Correspondence with telephone no., fax & email
Name: The Chairman Aizawl Municipal Council
iii
In case of Channel Partner other than Programme Administrator, the following information will be provided:
a) Whether commercial or non-commercial. b) Copy of Articles of Association, Registration No. &
Date; PAN/TAN No. c) Audited Balance Sheet for last three years d) Annual Report of previous year e) Whether MNRE has earlier sanctioned any SPV
projects for implementation to the Project Proponent, if yes, please furnish information.
NA
iv
In case of 1 (e), please indicate:
a) Government Department, Autonomous Institution set up by Central/ State Government, State Renewable Energy Development Agency, Public Sector Undertaking
b) Others
Autonomous Institution set by State Government (Urban Local Body)

92
PART-B: Details of the Project
1. Summary of the Proposal:
Aizawl, the capital of Mizoram state in India, is situated on a hill top with a beautiful scenery from all sides. The city is located north of the Tropic of Cancer in the northern part of Mizoram and is situated on a ridge 1132 metres (3715 ft) above sea level, with the Tlawng river valley to its west and the Tuirial river valley to its east. In the summer the temperature ranges from 20-30 deg Celsius, and in the winter 11-21 deg Celsius. Aizawl is a beautiful place that offers plenty of tourist attractions to tourists and habitants alike. Besides its breathtaking beauty, Aizawl is the storehouse of important Government offices, State Assembly House and Civil Secretariat. The renewable energy programmes in Mizoram is primarily being implemented through the Zoram Energy Development Agency (ZEDA) under Government of Mizoram. Various schemes in the field of Solar energy, Biomass, Remote Village Electrification Programme under the Ministry of New and Renewable Energy (MNRE) are being successfully implemented by the nodal agency. The Ministry of New and Renewable Energy (MNRE) approved financial assistance to Aizawl Municipal Council for developing Aizawl City as Solar City. The Master Plan for development of Aizawl as a solar city has been prepared.
It is proposed to install one 10kWp SPV power plant in the administrative building of Aizawl Municipal Council as model Renewable Energy power generating systems to cater the electrical energy demand for the office and simultaneously to set example and encourage entrepreneurs to invest on such projects. The system will be installed in the AMC administrative building and will be opened to the interested public and entrepreneurs. Trained manpower will be deployed to explain about the system and benefits to the interested visitors.
2. Details of Project site: The city of Aizawl is located at the longitude 92.94oE and latitude 23.42oN. Average load shedding in the city reported be 2-3 hours per day. The average solar radiation on horizontal surface is 4.68kWh/m2/day.
3. Details of Project Beneficiaries:
Aizawl Municipal Council (AMC) will be the direct beneficiary of the project. AMC is responsible for providing the basic services infrastructure to city dwellers. The services include water supply, sewage treatment and disposal, solid waste management, disaster management, buildings and roads, street lighting, maintenance of parks and open spaces, cemeteries and crematoriums, conservation of heritage sites, and registering of births and deaths.
4. Details of Proposed Systems :
i. Proposed capacity of the SPV Power Plant: 10kWp ii. Availability of shadow free roof area for the power plant : 160 Sqm
iii. Details of loads to be energized by Power Plant, calculations and justification for the proposed capacity and expected annual energy generation
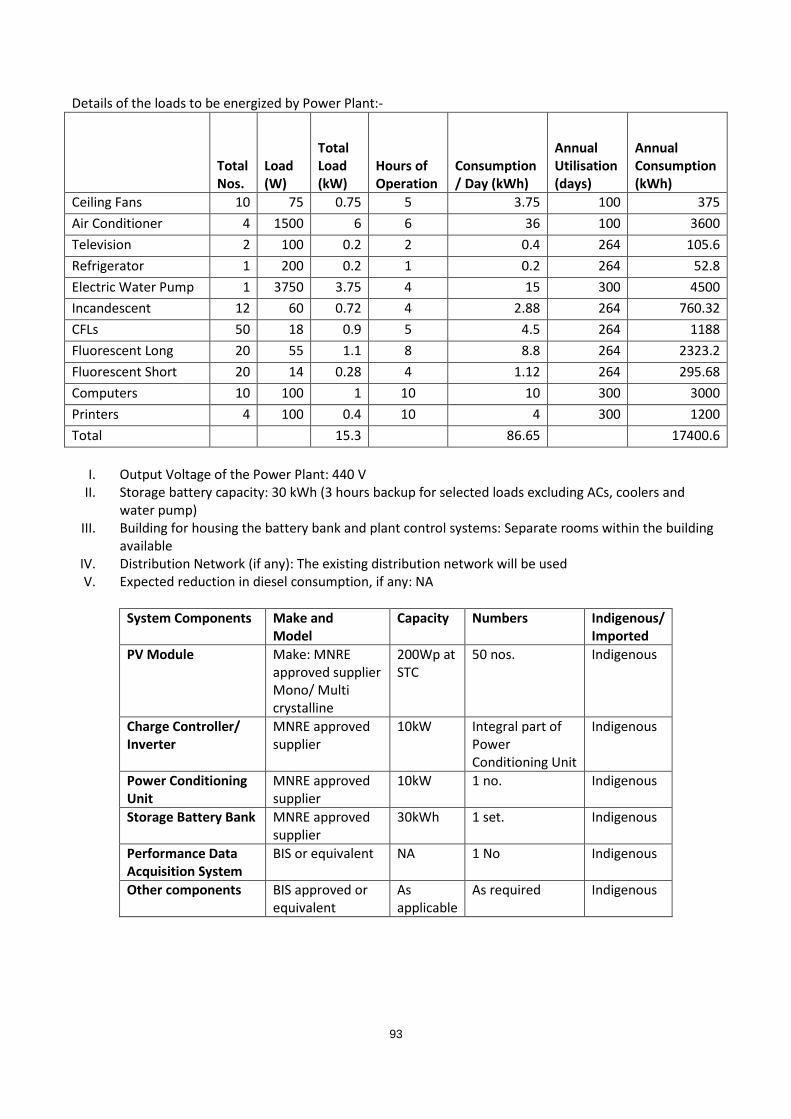
93
Details of the loads to be energized by Power Plant:-
Total Nos.
Load (W)
Total Load (kW)
Hours of Operation
Consumption / Day (kWh)
Annual Utilisation (days)
Annual Consumption (kWh)
Ceiling Fans 10 75 0.75 5 3.75 100 375 Air Conditioner 4 1500 6 6 36 100 3600 Television 2 100 0.2 2 0.4 264 105.6 Refrigerator 1 200 0.2 1 0.2 264 52.8 Electric Water Pump 1 3750 3.75 4 15 300 4500 Incandescent 12 60 0.72 4 2.88 264 760.32 CFLs 50 18 0.9 5 4.5 264 1188 Fluorescent Long 20 55 1.1 8 8.8 264 2323.2 Fluorescent Short 20 14 0.28 4 1.12 264 295.68 Computers 10 100 1 10 10 300 3000 Printers 4 100 0.4 10 4 300 1200 Total 15.3 86.65 17400.6
I. Output Voltage of the Power Plant: 440 V II. Storage battery capacity: 30 kWh (3 hours backup for selected loads excluding ACs, coolers and
water pump) III. Building for housing the battery bank and plant control systems: Separate rooms within the building
available IV. Distribution Network (if any): The existing distribution network will be used V. Expected reduction in diesel consumption, if any: NA
System Components
Make and Model
Capacity Numbers Indigenous/ Imported
PV Module Make: MNRE approved supplier Mono/ Multi crystalline
200Wp at STC
50 nos. Indigenous
Charge Controller/ Inverter
MNRE approved supplier
10kW Integral part of Power Conditioning Unit
Indigenous
Power Conditioning Unit
MNRE approved supplier
10kW 1 no. Indigenous
Storage Battery Bank MNRE approved supplier
30kWh 1 set. Indigenous
Performance Data Acquisition System
BIS or equivalent NA 1 No Indigenous
Other components BIS approved or equivalent
As applicable
As required Indigenous
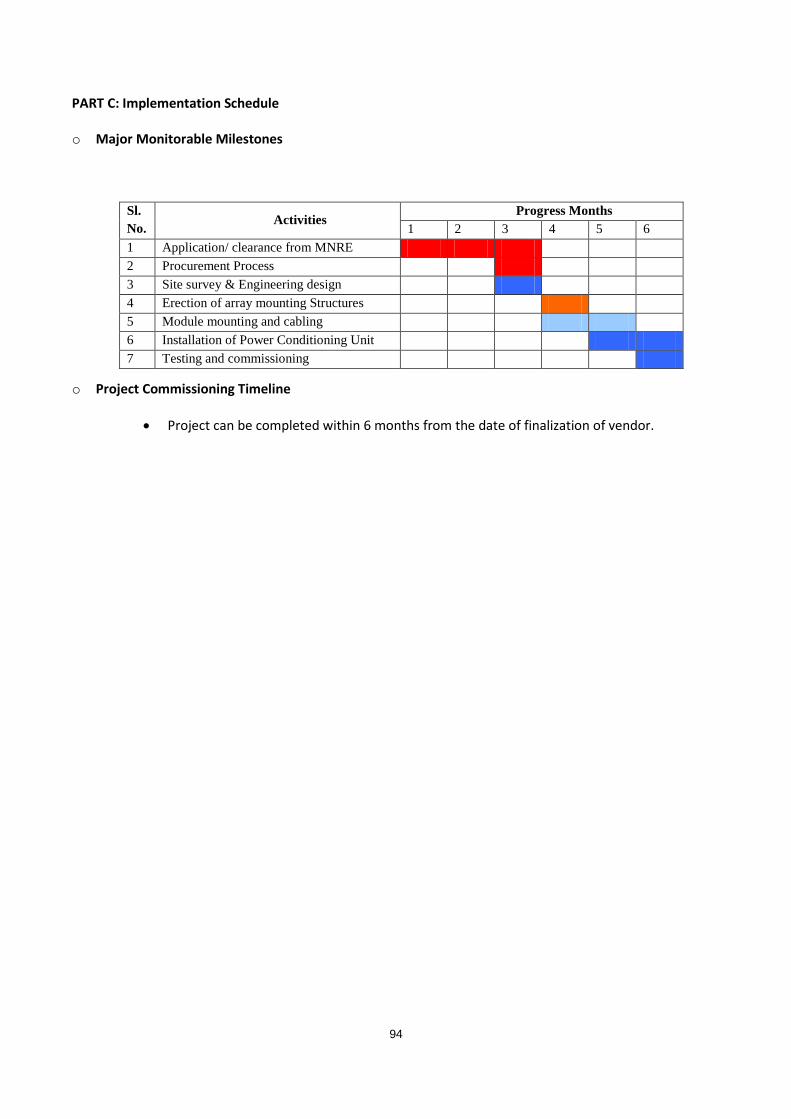
94
PART C: Implementation Schedule o Major Monitorable Milestones
o Project Commissioning Timeline
• Project can be completed within 6 months from the date of finalization of vendor.
Sl. No. Activities
Progress Months 1 2 3 4 5 6
1 Application/ clearance from MNRE 2 Procurement Process 3 Site survey & Engineering design 4 Erection of array mounting Structures 5 Module mounting and cabling 6 Installation of Power Conditioning Unit 7 Testing and commissioning

95
PART D: Performance Monitoring Mechanism:
Performance Data Monitoring (Daily, Monthly and Annual energy generation , logging, compilation and sharing with MNRE)
Performance will be monitored with facilities for daily, monthly & annual power generation. Energy meters and data loggers will be installed accordingly.
Monthly monitoring of reduction in diesel consumption, if any Yes
Own Mechanism In built monitoring system with energy meter and data logger will installed
Third Party 5 years AMC will be signed with the supplier Remote Monitoring (for SPV power plants having capacity above 5 kWp)
Yes
PART E: Project Cost and Financing Details.
i. Cost of Systems Hardware ii. Cost of transportation, insurance
iii. Cost of civil works and electrical works iv. Cost of installation and Commissioning v. Cost of Annual Maintenance for 5 years
vi. Any other related costs
Rs. 24.00 Rs.0.50
Rs. 2.00 Rs.2.00
Rs. 2.00 Rs. 0.50
Total Cost of Systems
Rs. 31.00
Total kWp SPV Capacity
10kWp
Means of Finance a) Contribution of Project Proponent b) Contribution of Beneficiaries organization c) Envisaged CFA from MNRE d) Other Source (s) of Funding (capital grant) e) Envisaged Soft Loan assistance, if any f) Whether funds are in surplus or deficiency
a) AMC/DUDPA : Rs. 6.70 Lakh b) MNRE: Rs. 24.30 Lakh
Details of Project Revenue recurring, if any
NA
Project Duration
6 Months

96
PART F: Operation and Maintenance Arrangements The supplier will train engineers and technicians of AMC for day to day operation, monitoring and scheduled maintenance work such as cleaning, topping up of batteries etc. - Detail of Operation and Maintenance Arrangements. The system will be procured with minimum 5 years comprehensive annual maintenance contract service. During this period engineers and technicians from AMC will be trained for O&M of the system. - Arrangement for Generation Data Collection (applicable for SPV Power Plants having more than 10 kWp capacity). Details of monitoring equipment proposed to be installed and method of supplying data to MNRE/ designated agency. As stated above - Method of monitoring of reduction in diesel consumption, if any. DG set logbook is being maintained in the AMC. The same will be maintained to know in reduction of operating time of DG sets after installation of PV systems. The Solar system will - Strategy for training of the O&M Personnel of the Beneficiary Organization.
As stated above

97
PART G: Declarations and Certificates A. It is certified that I/we have read the guidelines issued by the Ministry vide 5/23/2009/P&C dated 16th June, 2010 and the related provisions/terms and conditions for availing financial support from the Ministry of New and Renewable Energy and I agree to abide by these guidelines and related terms and conditions. B. I understand that failure to comply by these guidelines may result in denial of financial support by the Ministry. C. I confirm that the present proposal in full or part has not been submitted / has been submitted to any other agency for seeking support (In case proposal has been submitted to any other agency or under consideration all details and a copy of the proposal must be submitted along with the present proposal).
D. I confirm that I will not submit the same proposal or a part thereof to any other funding agency, without prior knowledge of the Ministry of New and Renewable Energy. E. I confirm that the share of project proponent/beneficiaries shall not be lower than 20% in any circumstances. Projects owned by the Programme Administrators are exempt from this condition. F. I confirm that the proposed solar PV system has not been installed/ supplied at the proposed sites or to the proposed beneficiaries, prior to the receipt of project sanction letter from the Ministry. G. There is no duplication in the proposal and the submitted proposal is the only proposal by the proponent and to the best of our knowledge no other organization has submitted any proposal for the system at this site to MNRE for financial support. H. A detailed site survey has been done/or will be undertaken to identify the beneficiaries before actual supply and installation takes place. I. This is to certify that the various components of the SPV power plant will conform to the Relevant Standards, as mentioned in the Guidelines for Off-grid and Decentralized Solar Applications (Annexure-3) for SPV modules and components under JNNSM. Copies of the Relevant IEC/ BIS Certificates should be enclosed. J. It is mandatory to provide technical performance specifications of each component of the power plant proposed to be installed under the project. And for which the performance will be warranted. K. All technical parameters and warranty requirements must meet or exceed the requirements mentioned in the guidelines issued by the Ministry. I confirm that in case of any dispute, the decision of Secretary, Ministry of New and Renewable Energy, Government of India will be final and binding on all.
Signature _____________ Name & Designation
of Authorized Signatory Seal
Place: Date:

98
Annexure 7 : Project Proposals
for Solar Thermal Systems/ Devices
Under Develppment of Solar City Programme of MNRE
1. Title of the Project : Solar Water Heating System for Hospitals in Aizawl Municipal Area 2. Name of the Project Proponent : Aizawl Municipal Council (AMC) 3. Socio- Economic Justification of the Project: There are many benefits of from solar water heater, and number one is economics. Solar water heater economics compare quite favorably with those of electric water heaters, while the economics aren't quite so attractive when compared with those of gas water heaters. Heating water with the sun also means long-term benefits, such as being cushioned from future fuel shortages and price increases, and environmental benefits. Economic Benefits Solar water heaters offered the largest potential savings compared to electric heating, with solar water-heater owners saving as much as 50% to 85% annually on their utility bills over the cost of electric water heating. Typical simple payback period of a solar water heating system is 2 to 3 years. Tax Incentives and Rebates Ministry of New and Renewable Energy (MNRE) offers subsidies on domestic as well as commercial solar water heating systems installations. Government of India offers 80% depreciation claim in the first two years itself on installation of commercial solar water heating systems. Long-Term Benefits Solar water heaters offer long-term benefits that go beyond simple economics. In addition to having free hot water after the system has paid for itself in reduced utility bills, it contributes towards future fuel shortages and price increases and reduce country's dependence on foreign oil. Environmental Benefits Solar water heaters do not pollute and contribute in reduction of GHG emission. A 100 LPD solar water heater system when replaces an electric water heater, the electricity displaced over 20 years represents more than 30 tons of avoided carbon dioxide emissions alone. 4. Benefits of the proposed project: There are 26 small and medium size hospitals in Aizawl Municipal area. in It is proposed to install Solar Water Heating systems in all hospitals in AMC area. Total potential for solar water heating systems in the hospital sector is estimated to be 18000 LPD. Complete installation of solar water heaters in the hospitals will save about 0.35MU electricity per year and reduce about 277 tons of GHG per year.

99
Ministry of New and Renewbale Energy (MNRE) declared AMC as a “Solar City” and a master plan has been prepared to reduce 10% energy consumption through renewable energy and energy efficiency measures. The master plan sets a goal to reduce 50.50MU electricity per year within 5 years period. Implementation of solar water heating projects in hospitals alone can contribute about 0.70% towards the set goal. Most importantly, hospitals will save considerable amount of electricity and will enjoy free hotwater within 2years of payback on the investment. They will avail subsidy from the MNRE and may avail 80% depreciation benefit in the first two years. PART-A: Details of the Project Proponent
I Name and Category of Project Proponent a) Renewable Energy Service Providing
Company (RESCO) b) Financial Institutions (Banks, NBFCs, MFIs) c) Financial Integrator d) System Integrator e) Program Administrator
Name of the Project Proponent: Aizawl Municipal Council, Aizawl, Mizoram. Category: Program Administrator.
II Name, Designation and Address of the Authorized Representative for correspondence with telephone no, fax & email
Name: The Chairman Address: Aizawl Municipal Council, Aizawl
III In case of Channel Partner other than Programme Administrator, the following information will be provided:
a) Whether commercial or non-commercial. b) Copy of Articles of Association, Registration
No. & Date c) Audited Balance Sheet for last three years d) Annual Report of previous year e) Whether MNRE has earlier sanctioned any
Solar Thermal project (s) for implementation to the Project Proponent, if yes, please furnish information
NA
IV In case of 1 (e), Please indicate:
a) Government Department, Autonomous Institution set up by Central/ State Government, State renewable Energy development agency, Public Sector Undertaking
b) Others
Autonomous Institution set by State Government (Urban Local Body)

100
PART-B: Details of the Project
Aizawl, the capital of Mizoram state in India, is situated on a hill top with a beautiful scenery from all sides. The city is located north of the Tropic of Cancer in the northern part of Mizoram and is situated on a ridge 1132 metres (3715 ft) above sea level, with the Tlawng river valley to its west and the Tuirial river valley to its east. In the summer the temperature ranges from 20-30 deg Celsius, and in the winter 11-21 deg Celsius. Aizawl is a beautiful place that offers plenty of tourist attractions to tourists and habitants alike. Besides its breathtaking beauty, Aizawl is the storehouse of important Government offices, State Assembly House and Civil Secretariat. The renewable energy programmes in Mizoram is primarily being implemented through the Zoram Energy Development Agency (ZEDA) under Government of Mizoram. Various schemes in the field of Solar energy, Biomass, Remote Village Electrification Programme under the Ministry of New and Renewable Energy (MNRE) are being successfully implemented by the nodal agency. The Ministry of New and Renewable Energy (MNRE) approved financial assistance to Aizawl Municipal Council for developing Aizawl City as Solar City. The Master Plan for development of Aizawl as a solar city has been prepared. It is proposed to install solar water heaters in all the hospitals as a part of solar city activities. The hospitals having more than 100 beds will be installed with solar water heater of capcity 5000LPD and hospitals with 50-100 beds will be installed solar water heaters of capacity 3000LPD each. Similarly, hospitals having less then 50 beds will be installed with 2000LPD solar water heaters. 5. Details of Project site:
The city of Aizawl is located at the longitude 92.94oE and latitude 23.42oN. The average solar radiation on horizontal surface is 4.68kWh/m2/day. Ambient temperature ranges from 20-30 deg Celsius in summar and the same is 11-21 deg Celsius during winter. 6. Details of Project Beneficiaries:
The hospitals will be directly benefited from the project saving electricty for heating water and will get hot water at very cheaper price.
7. Details of Proposed Systems :
I. Proposed capacity of the Solar Water Heating System is as below:
Unit capcity (LPD) Proposed Units Gross Capcity (LPD) 20-50 bedded hospitals 2000 2 4000 50- 100 bedded hospital 3000 3 9000 >100 bedded hospital 5000 1 5000 6 18000
II. Availability of shadow free roof area for the power plant : Sufficient area (175 sqm for 5000LPD,
90 sqm for 3000LPD and 70sqm for 2000LPD system) is available in each hospital.

101
PART C: Implementation Schedule • Major Monitorable Milestones
• Project Commissioning Timeline Project can be completed within 6 months from the date of finalization of technology partner.
Sl. No. Activities
Progress Months 1 2 3 4 5 6 7 8
1 Application/ clearance from MNRE 2 Procurement Process 3 Site survey & ystem integration layou 4 Erection of collector mounting Struct 5 Installation of Collectors & storage ta 6 Distribution Pipings 7 Testing and commissioning

102
PART D: Performance Monitoring Mechanism:
Performance Data Monitoring (Daily, Monthly and Annual energy generation, logging, compilation and sharing with MNRE)
Performance will be monitored with facilities for daily, monthly & annual power generation. Energy meters and data loggers will be installed accordingly.
Monthly monitoring of reduction in diesel/electricity/ other fuel consumption, if any. Yes
Own Mechanism In built monitoring system with energy meter and data logger will installed
Third Party 5 years AMC will be signed with the supplier
Yes PART E: Project Cost and Financing Details.
i. Cost of Systems Hardware
ii. Cost of transportation and insurance iii. Cost of civil works and electrical works iv. Cost of installation and commissioning v. Cost of Annual Maintenance for 5 years
vi. Any other cost
31.00Lakh
1.00Lakh 2.00Lakh 2.00Lakh 2.00Lakh 1.00Lakh
Total Cost of the Systems/Project 39.00Lakh Total Capacity & Collector Area 18000LPD (360sqm) Means of Finance
a) Contribution of Project Proponent b) Contribution of Beneficiaries
organization c) Envisaged CFA from MNRE d) Other Source (s) of Funding (capital
grant) e) Envisaged Soft Loan assistance, if any f) Whether funds are in surplus or
deficiency
a) Contribution of Project Proponent
b) Contribution from beneficiaries: Rs.23.00Lakh c) CFA from MNRE Rs.16.00Lakh
Details of Project Revenue recurring, if any NA Project Duration 6 months

103
PART F: Operation and Maintenance Arrangements The supplier will train engineers and technicians of AMC / hospital authority for day to day operation, monitoring and scheduled maintenance work such as cleaning etc. - Detail of Operation and Maintenance Arrangements. The system will be procured with minimum 5 years comprehensive annual maintenance contract service. During this period engineers and technicians from AMC/ hospital will be trained for O&M of the system. - Arrangement for Energy Savings Data Collection
(i) Flow meter will be installed where in manual recording of the reading will be maintained in a log. The reading will be taken on a regular periodic basis.
(ii) Data logging system for recording water temperature would be installed. This system will keep a log of the cold water and hot water at the inlet and outlet of the SWH system respectively.
(iii) Energy delivered in kcal by the SWH system will be calculated based on the quantity of the water consumed and temperature rise of the water (Δt).
(iv) The flow meter reading needs to be taken regularly and average from the temperature logging system needs to be noted regularly.
(v) Collected data will be reported to MNRE/ designated agencies on regular basis - Method of monitoring of reduction in conventional fuel consumption, if any. - NA - Strategy for training of the O&M Personnel of the Beneficiary Organization.
As stated above

104
PART G: Declarations It is certified that I/we have read the guidelines issued by the Ministry vide 5/23/2009/P&C dated 16th June, 2010 and the related provisions/terms and conditions for availing financial support from the Ministry of New and Renewable Energy and I agree to abide by these guidelines and related terms and conditions. I understand that failure to comply by these guidelines may result in denial of financial support by the Ministry. I confirm that the present proposal in full or part has not been submitted / has been submitted to any other agency for seeking support (In case proposal has been submitted to any other agency or under consideration all details and a copy of the proposal must be submitted along with the present proposal). I confirm that I will not submit the same proposal or a part thereof to any other funding agency, without prior knowledge of the Ministry of New and Renewable Energy. I confirm that the share of project proponent/beneficiaries shall not be lower than 20% in any circumstances. Projects owned by the Programme Administrators are exempt from this condition. I confirm that the proposed solar thermal system(s) have not been installed/supplied at the proposed sites or to the proposed beneficiaries, prior to the receipt of project sanction letter from the Ministry. There is no duplication in the proposal and the submitted proposal is the only proposal by the proponent and to the best of my / our knowledge no other organization has submitted any proposal for the systems at these site(s) to MNRE for financial support. A detailed site survey has been done/or will be undertaken to identify the beneficiaries before actual supply and installation takes place. In case of System Integrators, the beneficiaries will be charged net of MNRE subsidy towards cost of systems installed by them at their respective places. I confirm that in case of any dispute, the decision of Secretary, Ministry of New and Renewable Energy, Government of India will be final and binding on all.
Signature _____________ Name & Designation of Authorized Signatory Seal Place: Date:

105
Annexure
DETAILS OF SYSTEMS TO BE INSTALLED
Sl. no
Systems to be installed
Type of systems/ collector to be used*
Place(s) of installation**
No. of systems
No. of collectors/ dishes
Total collector area (sq. m)
Application
Total cost of systems/ units including AMC for 5 yrs (apprx)
Subsidy sought from MNRE @ Rs.6600/sq. m
State subsidy to be availed if any @ Rs. ----
Expected date of completion
1 Solar water heating systems
Flat plate type a) Domestic b) Others 20-50 beded
Hospitals 2 40 80 Hot water Sept 2011
50-100 bedded hospitals
3 90 180 Hot water
>100 Bedded hospitals
1 50 100
6 180 360 39.00 Lac 23.00 Lac ETC type a) Domestic b) Others Storage cum collector type
* Only those systems will be eligible for subsidy which have BIS/MNRE standards/ specifications or have approval from test centers of MNRE ** For domestic systems, only area of operation/implementation will be mentioned This is to certify that the various components of the Solar Thermal System (s) conform to the Relevant Standards, as mentioned in the Guidelines for Off-grid and Decentralized Solar Applications for Solar Collectors and components under JNNSM. Copies of the Relevant BIS/MNRE Certificates/specifications should be enclosed. Note: It is mandatory to provide technical performance specifications of each component of the system(s) to be installed under the project and for which the performance will be warranted. All technical parameters and warranty requirements must meet or exceed the requirements mentioned in the guidelines issued by the Ministry.
(Signature & Seal of Channel partner)
as Head of Organization

106
Annexure 8 : Project Proposals
for Solar Thermal Systems/ Devices
Under Develppment of Solar City Programme of MNRE
I. Title of the Project : Solar Water Heating System for Government Buildings in Aizawl
II. Name of the Project Proponent : Directorate of Urban Development and Poverty Alleviation
III. Socio- Economic Justification of the Project: There are many benefits of from solar water heater, and number one is economics. Solar water heater economics compare quite favorably with those of electric water heaters, while the economics aren't quite so attractive when compared with those of gas water heaters. Heating water with the sun also means long-term benefits, such as being cushioned from future fuel shortages and price increases, and environmental benefits. Economic Benefits Solar water heaters offered the largest potential savings compared to electric heating, with solar water-heater owners saving as much as 50% to 85% annually on their utility bills over the cost of electric water heating. Typical simple payback period of a solar water heating system is 2 to 3 years. Tax Incentives and Rebates Ministry of New and Renewable Energy (MNRE) offers subsidies on domestic as well as commercial solar water heating systems installations. Government of India offers 80% depreciation claim in the first two years itself on installation of commercial solar water heating systems. Long-Term Benefits Solar water heaters offer long-term benefits that go beyond simple economics. In addition to having free hot water after the system has paid for itself in reduced utility bills, it contributes towards future fuel shortages and price increases and reduce country's dependence on foreign oil. Environmental Benefits Solar water heaters do not pollute and contribute in reduction of GHG emission. A 100 LPD solar water heater system when replaces an electric water heater, the electricity displaced over 20 years represents more than 30 tons of avoided carbon dioxide emissions alone.
IV. Benefits of the proposed project: There are 37 government office buildings, educational institutes, training centre, guest house etc in Aizawl city. Due to moderate to cold weather, Aizawl requires hot water throughout the year and space heating during the winter. It is proposed to use solar water heating systems for both hot water supply and space heating in government and institutional buildings. Total potential for solar water heating systems in the government sector is estimated to be 395000 LPD. Complete installation of solar water heaters in the

107
government buildigs will save about 3.16MU electricity per year and reduce about 2528 tons of GHG per year. Ministry of New and Renewbale Energy (MNRE) declared AMC as a “Solar City” and a master plan has been prepared to reduce 10% energy consumption through renewable energy and energy efficiency measures. The master plan sets a goal to reduce 50.50MU electricity per year within 5 years period. Implementation of solar water heating projects in hotels and restaurant can contribute 6.25% towards the set goal. Most importantly, there will be considerable amount of electricity savings and it will provide living comfort to the workers/ inhabitants during winter and autumn. PART-A: Details of the Project Proponent I Name and Category of Project Proponent
a) Renewable Energy Service Providing Company (RESCO)
b) Financial Institutions (Banks, NBFCs, MFIs) c) Financial Integrator d) System Integrator e) Program Administrator
Name of the Project Proponent: Aizawl Municipal Council, Aizawl, Mizoram. Category: Program Administrator.
II Name, Designation and Address of the Authorized Representative for correspondence with telephone no, fax & email
Name: The Director Address: Directorate of Urban Development and Poverty Alleviation
III In case of Channel Partner other than Programme Administrator, the following information will be provided:
a) Whether commercial or non-commercial. b) Copy of Articles of Association, Registration
No. & Date c) Audited Balance Sheet for last three years d) Annual Report of previous year e) Whether MNRE has earlier sanctioned any
Solar Thermal project (s) for implementation to the Project Proponent, if yes, please furnish information
NA
IV In case of 1 (e), Please indicate:
a) Government Department, Autonomous Institution set up by Central/ State Government, State renewable Energy development agency, Public Sector Undertaking
b) Others
Government Department
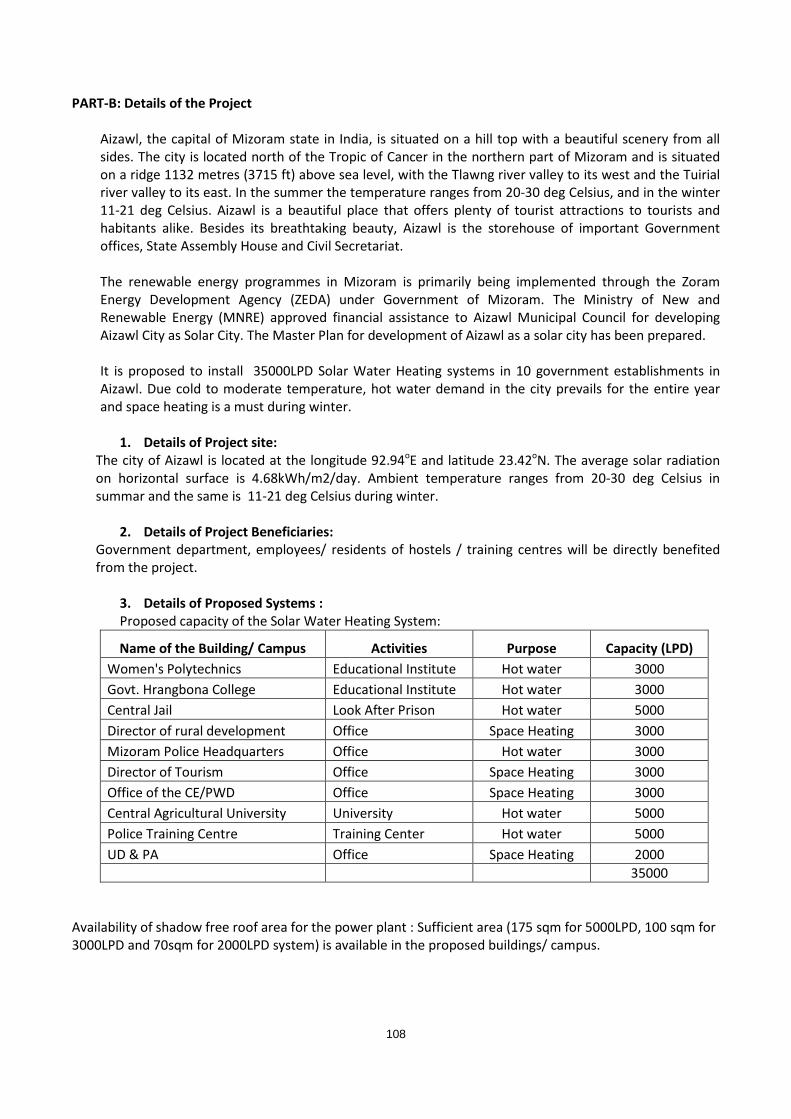
108
PART-B: Details of the Project
Aizawl, the capital of Mizoram state in India, is situated on a hill top with a beautiful scenery from all sides. The city is located north of the Tropic of Cancer in the northern part of Mizoram and is situated on a ridge 1132 metres (3715 ft) above sea level, with the Tlawng river valley to its west and the Tuirial river valley to its east. In the summer the temperature ranges from 20-30 deg Celsius, and in the winter 11-21 deg Celsius. Aizawl is a beautiful place that offers plenty of tourist attractions to tourists and habitants alike. Besides its breathtaking beauty, Aizawl is the storehouse of important Government offices, State Assembly House and Civil Secretariat. The renewable energy programmes in Mizoram is primarily being implemented through the Zoram Energy Development Agency (ZEDA) under Government of Mizoram. The Ministry of New and Renewable Energy (MNRE) approved financial assistance to Aizawl Municipal Council for developing Aizawl City as Solar City. The Master Plan for development of Aizawl as a solar city has been prepared.
It is proposed to install 35000LPD Solar Water Heating systems in 10 government establishments in Aizawl. Due cold to moderate temperature, hot water demand in the city prevails for the entire year and space heating is a must during winter.
1. Details of Project site:
The city of Aizawl is located at the longitude 92.94oE and latitude 23.42oN. The average solar radiation on horizontal surface is 4.68kWh/m2/day. Ambient temperature ranges from 20-30 deg Celsius in summar and the same is 11-21 deg Celsius during winter.
2. Details of Project Beneficiaries:
Government department, employees/ residents of hostels / training centres will be directly benefited from the project.
3. Details of Proposed Systems : Proposed capacity of the Solar Water Heating System:
Name of the Building/ Campus Activities Purpose Capacity (LPD) Women's Polytechnics Educational Institute Hot water 3000 Govt. Hrangbona College Educational Institute Hot water 3000 Central Jail Look After Prison Hot water 5000 Director of rural development Office Space Heating 3000 Mizoram Police Headquarters Office Hot water 3000 Director of Tourism Office Space Heating 3000 Office of the CE/PWD Office Space Heating 3000 Central Agricultural University University Hot water 5000 Police Training Centre Training Center Hot water 5000 UD & PA Office Space Heating 2000 35000
Availability of shadow free roof area for the power plant : Sufficient area (175 sqm for 5000LPD, 100 sqm for 3000LPD and 70sqm for 2000LPD system) is available in the proposed buildings/ campus.

109
PART C: Implementation Schedule • Major Monitorable Milestones
• Project Commissioning Timeline Project can be completed within 6 months from the date of finalization of technology partner.
PART D: Performance Monitoring Mechanism:
Performance Data Monitoring (Daily, Monthly and Annual energy generation, logging, compilation and sharing with MNRE)
Performance will be monitored with facilities for daily, monthly & annual power generation. Energy meters and data loggers will be installed accordingly.
Monthly monitoring of reduction in diesel/electricity/ other fuel consumption, if any. Yes
Own Mechanism In built monitoring system with energy meter and data logger will installed
Third Party 5 years AMC will be signed with the supplier
Yes
Sl. No. Activities
Progress Months 1 2 3 4 5 6 7 8
1 Application/ clearance from MNRE 2 Procurement Process 3 Site survey & ystem integration layout 4 Erection of collector mounting Structures 5 Installation of Collectors & storage tank 6 Distribution Pipings 7 Testing and commissioning

110
PART E: Project Cost and Financing Details.
i. Cost of Systems Hardware
ii. Cost of transportation and insurance iii. Cost of civil works and electrical works iv. Cost of installation and commissioning v. Cost of Annual Maintenance for 5 years
vi. Any other cost
54.00Lakh
2.00Lakh 4.00Lakh 4.00Lakh 4.00Lakh 1.00Lakh
Total Cost of the Systems/Project 70.00Lakh Total Capacity & Collector Area 35000LPD (700sqm) Means of Finance
a) Contribution of Project Proponent b) Contribution of Beneficiaries
organization c) Envisaged CFA from MNRE d) Other Source (s) of Funding (capital
grant) e) Envisaged Soft Loan assistance, if any f) Whether funds are in surplus or
deficiency
a) Contribution of Project Proponent b) Contribution from beneficiaries Department: 28.00Lakh c) CFA from MNRE 42.00Lakh
Details of Project Revenue recurring, if any NA Project Duration 6 months
111
PART F: Operation and Maintenance Arrangements The supplier will train engineers and technicians of concerned department for day to day operation, monitoring and scheduled maintenance work such as cleaning etc. - Detail of Operation and Maintenance Arrangements. The system will be procured with minimum 5 years comprehensive annual maintenance contract service. During this period engineers and technicians from concerned department will be trained for O&M of the system. - Arrangement for Energy Savings Data Collection
(i) Flow meter will be installed where in manual recording of the reading will be maintained in a log. The reading will be taken on a regular periodic basis.
(ii) Data logging system for recording water temperature would be installed. This system will keep a log of the cold water and hot water at the inlet and outlet of the SWH system respectively.
(iii) Energy delivered in kcal by the SWH system will be calculated based on the quantity of the water consumed and temperature rise of the water (Δt).
(iv) The flow meter reading needs to be taken regularly and average from the temperature logging system needs to be noted regularly.
(v) Collected data will be reported to MNRE/ designated agencies on regular basis - Method of monitoring of reduction in conventional fuel consumption, if any. - NA - Strategy for training of the O&M Personnel of the Beneficiary Organization.
As stated above

112
PART G: Declarations It is certified that I/we have read the guidelines issued by the Ministry vide 5/23/2009/P&C dated 16th June, 2010 and the related provisions/terms and conditions for availing financial support from the Ministry of New and Renewable Energy and I agree to abide by these guidelines and related terms and conditions. I understand that failure to comply by these guidelines may result in denial of financial support by the Ministry. I confirm that the present proposal in full or part has not been submitted / has been submitted to any other agency for seeking support (In case proposal has been submitted to any other agency or under consideration all details and a copy of the proposal must be submitted along with the present proposal). I confirm that I will not submit the same proposal or a part thereof to any other funding agency, without prior knowledge of the Ministry of New and Renewable Energy. I confirm that the share of project proponent/beneficiaries shall not be lower than 20% in any circumstances. Projects owned by the Programme Administrators are exempt from this condition. I confirm that the proposed solar thermal system(s) have not been installed/supplied at the proposed sites or to the proposed beneficiaries, prior to the receipt of project sanction letter from the Ministry. There is no duplication in the proposal and the submitted proposal is the only proposal by the proponent and to the best of my / our knowledge no other organization has submitted any proposal for the systems at these site(s) to MNRE for financial support. A detailed site survey has been done/or will be undertaken to identify the beneficiaries before actual supply and installation takes place. In case of System Integrators, the beneficiaries will be charged net of MNRE subsidy towards cost of systems installed by them at their respective places. I confirm that in case of any dispute, the decision of Secretary, Ministry of New and Renewable Energy, Government of India will be final and binding on all.
Signature _____________ Name & Designation of Authorized Signatory Seal Place: Date:

113
Annexure
DETAILS OF SYSTEMS TO BE INSTALLED
Sl. no
Systems to be installed
Type of systems/ collector to be used*
Place(s) of installation**
No. of systems
No. of collectors/ dishes
Total collector area (sq. m)
Application Total cost of systems/ units including AMC for 5 yrs (apprx)
Subsidy sought from MNRE @ Rs.6600/sq. m
State subsidy to be availed if any @ Rs. ----
Expected date of completion
1 Solar water heating systems
Flat plate type
a) Domestic b) Others Women's Polytechnics 3 30 60 Hot water
Govt. Hrangbona College
3 30 60 Hot water
Central Jail 1 50 100 Hot water Director of rural development
1 30 60 Space Heating
Mizoram Police Headquarters
1 30 60 Hot water
Director of Tourism 1 30 60 Space Heating Office of the CE/PWD 1 30 60 Space Heating Central Agricultural University
3
50 100 Hot water
Police Training Centre 1 50 100 Hot water UD & PA 1 20 40 Space Heating Total 20 1400 688 Hot water 70.00lac 42.00lac Sept 2011
ETC type a) Domestic b) Others Storage cum collector type
* Only those systems will be eligible for subsidy which have BIS/MNRE standards/ specifications or have approval from test centers of MNRE ** For domestic systems, only area of operation/implementation will be mentioned This is to certify that the various components of the Solar Thermal System (s) conform to the Relevant Standards, as mentioned in the Guidelines for Off-grid and Decentralized Solar Applications for Solar Collectors and components under JNNSM. Copies of the Relevant BIS/MNRE Certificates/specifications should be enclosed. Note: It is mandatory to provide technical performance specifications of each component of the system(s) to be installed under the project and for which the performance will be warranted. All technical parameters and warranty requirements must meet or exceed the requirements mentioned in the guidelines issued by the Ministry.
(Signature & Seal of Channel partner)
as Head of Organization

114
CONTACT Emani Kumar Dwipen Boruah ICLEI - Local Governments for Sustainability South Asia Secretariat NSIC Bhavan, STP building Okhla Industrial Estate Ground Floor Ph: 011-41067220/24/25 Fax: 011-41067221 E-mail: [email protected] General e-mail: [email protected] Web: www.iclei.org/sa