Mapping the spatial variation of soil water content at the field scale with different ground...
15
0 Mapping the Spatial Variation of Soil Water Content at the Field Scale with Different Ground Penetrating Radar Techniques L. Weihermüller, J.A. Huisman, S. Lambot, M. Herbst and H. Vereecken Forschungszentrum Jülich GmbH, ICG-IV Agrosphere, 52425 Jülich, Germany, Tel.: +49-2461-618669, e-mail: [email protected]
Transcript of Mapping the spatial variation of soil water content at the field scale with different ground...
0
Mapping the Spatial Variation of Soil Water Content
at the Field Scale with Different
Ground Penetrating Radar Techniques
L. Weihermüller, J.A. Huisman, S. Lambot, M. Herbst and H. Vereecken
Forschungszentrum Jülich GmbH, ICG-IV Agrosphere, 52425 Jülich, Germany,Tel.: +49-2461-618669,
e-mail: [email protected]
1
Abstract12
Two ground-penetrating radar (GPR) techniques were used to estimate the shallow soil water3content at the field scale. The first technique is based on the ground wave velocity measured4with a bistatic impulse radar connected to 450 MHz ground-coupled antennas. The second5technique is based on inverse modeling of an off-ground monostatic TEM horn antenna in the60.8 to 1.6 GHz frequency range. Data were collected on a 8 by 9 m partially irrigated7intensive research plot and along four 148.5 m transects. Time domain reflectrometry,8capacitance sensors, and volumetric soil samples were used as reference measurements. The9aim of the study was to test the applicability of the ground wave method and the off-ground10inverse modeling approach at the field scale for a soil with a silt loam texture. The results for11the ground wave technique were difficult to interpret due to the strong attenuation of the GPR12signal, which was related to the silt loam texture at the test site. The root mean square error of13the ground wave technique was 0.076 m³m-³ when compared to the TDR measurements and140.102 m³m-³ when compared with the volumetric soil samples. The off-ground monostatic15GPR measured less within field soil water content variability than the reference16measurements, resulting in a root mean square error of 0.053 m³m-³ when compared with the17TDR measurements and an error of 0.051 m³m-³ when compared with the volumetric soil18samples. The variability between the two GPR measurements was even larger with a RSME19of 0.115 m³m-³. In summary, both GPR methods did not provide adequate spatial information20on soil water content variation at the field scale. The main reason for the deviating results of21the ground wave method was the poor data quality due to high silt and clay content at the test22site. Additional reasons were shallow reflections and the dry upper soil layer that cannot be23detected by the ground wave method. In the case of off-ground GPR, the high sensitivity to24the dry surface layer is the most likely reason for the observed deviations. The off-ground25GPR results might be improved by using a different antenna that allows data acquisition in a26lower frequency range.27
28Keywords: GPR, ground wave, off-ground, TDR, soil water content, field scale29
30
2
1. Introduction
Knowledge of the shallow subsurface hydrogeophysical properties, including surface andsubsurface water content, is essential in the fields of agricultural and environmentalengineering, ground water hydrology, meteorology, soil landscape modeling, and soil physics.5Surface soil water content defines the boundary condition of important processes, such asinfiltration, runoff, and evaporation. In general, soil water content is highly variable in spaceand time. Spatial variability of soil water content is affected by both small scale variability insoil hydraulic properties at the centimeter scale (Ritsema and Dekker, 1998) and large scalevariability at the kilometer scale (Jackson and Le Vine, 1996). Additionally, lateral water10redistribution varies at scales from meters to several hundreds of meters under the influenceof topography (Western et al., 1998), and water redistribution by vegetation (Bouten et al.,1992; Hupet and Vanclooster, 2002). Disregarding the spatial variability of soil water contentmay contribute significantly to errors in many predictions, e.g. for infiltration, and surfacerunoff (Merz and Bardossy, 1998; Pauwels et al., 2001), crop yield, flood control (Schlesinger15et al., 1990), and meso-scale transpiration loss (Wood, 1997).Point information on soil water content can be obtained using different techniques, like TimeDomain Reflectrometry (TDR), capacitance sensors, or volumetric sampling. In general, theapplication of all these techniques is restricted to small observation areas and is generally tootime-consuming for soil water content mapping of larger areas (Western and Grayson, 1998).20Furthermore, these techniques may disturb the soil structure, prohibiting accurate in situ soilwater content measurements (Lunt et al., 2005). On the other hand, remote sensing providesan effective methodology for mapping surface soil water content over large areas (Cognard etal., 1995, D’Urso and Minacapilli, 2006). The disadvantage of most remote sensingtechniques is the low temporal resolution and the fact that the measurement averages within-25pixel variability and therefore masks the underlying heterogeneity observed at the landsurface (Famiglietti et al., 1999). An even more important disadvantage of remote sensing isthe shallow measurement depth and the inability to observe the soil water content when densevegetation is present (Ulaby et al., 1996).
Clearly, there is a gap between remote sensing and point measurements of soil water content.30At intermediate spatial scales, such as agricultural fields or small catchments, reliance onsparse point measurements or coarse remote sensing data might not provide the accurate soilwater content information required at these scales (e.g. for irrigation, precision farming, cropmanagement, erosion control). Therefore, there is a need for soil water content measurementtechniques that can provide dense and accurate measurements at this intermediate scale with a35high temporal resolution.
To investigate the relationship between field scale (effective) fluxes of water, energy, andcarbon dioxide and the spatial variations of these fluxes within the field, the FLOWatch testsite has been established. The within-field variability of these fluxes is strongly related to thespatial variation of soil water content. Therefore, a range of soil water content measurement40techniques are investigated within the FLOWatch project. During the last years, GroundPenetrating Radar (GPR) methods have shown promise for estimating soil water content atthe field scale (van Overmeeren et al., 1997; Weiler et al., 1998; Bohidar and Hermance,2002, Davis and Annan, 2002; Grote et al., 2003; Huisman et al., 2003a; Galagedara et al.,2005; Wollschläger and Roth, 2005). The advantage of GPR methods is that they provide a45means to monitor large areas and soil volumes relatively quickly and cost-effectively, andtherefore, may bridge the gap between point information and remote sensing data.
In general, three different approaches are available to map soil water content with GPR. Thefirst approach is based on the analysis of reflected waves (van Overmeeren et al., 1997;
3
Weiler et al., 1998; Huisman et al., 2003a; Lunt et al., 2005; Wollschläger and Roth, 2005).This method requires knowledge of the depth of the reflection for absolute soil water contentcalculations and is, therefore, less suited for mapping of surface soil water content. Thesecond method is based on the analysis of the ground wave velocity (Du and Rummel, 1996;Huisman et al., 2001; Hubbard et al., 2002; Grote et al., 2003; Huisman et al., 2003b). In5general, the ground wave is the part of the radiated energy that travels between the transmitterand receiver through the top of the soil. The third approach is based on analyzing the (sub-)surface reflections of an off-ground GPR system, as described by Davis and Annan (2002),Redman et al. (2002) and Lambot et al. (2004a, 2004b, 2006a) amongst others. The advantageof the monostatic off-ground GPR method proposed by Lambot et al. (2004a, 2004b, 2004c,102006a) is the possibility of a full wave inversion of the radar signal which takes into accountthe antenna effects and does not require an antenna height specific calibration above a perfectelectric conductor (PEC, e.g. a metal plate). In general, the antenna elevation above the soilinherently varies during field experiments, which may lead to significant errors using thetraditional off-ground methods. In our study, the ground wave approach and the monostatic15off-ground approach were tested on a field site where both texture and soil water content arehighly variable.
In contrast to the ground wave technique, the monostatic off-ground GPR methodology wasused for the first time to monitor soil water content at the field scale. Both methods werecompared with reference measurements obtained with Time Domain Reflectrometry (TDR) or20capacitance sensors, and volumetric soil samples in two measurement campaigns.The aim of this study was to test the applicability of the off-ground GPR and ground waveGPR method at the field scale to monitor soil water content of environmentally relevant soildepths (e.g. 0 - 5 or 0 - 10 cm), The soil water content of this shallow upper soil layer isrelevant for flood control, soil erosion protection, CO2 production, and plant water25availability.
2. Materials and Methods
2.1. FLOWatch test site30
The FLOWatch test site of the Forschungszentrum Jülich GmbH is situated in the southernpart of the Lower Rhine Embayment in Germany. The underlying sediments are Quaternarysediments, which are mostly fluvial deposits from the Rhine/Meuse river and the Rur riversystem, covered by eolian sediments (up to a depth of 1 m) from the Pleistocene and35Holocene. The test site is weakly inclined (< 4°) in east-west direction (Fig. 1). In the lowerpart of the test site, colluvial sediments eroded from the upper part can be found. The groundwater depth shows seasonal fluctuations between 3 - 5 m below the surface. The major soiltype is silt loam according to the USDA textural classification. In the upper part of the testsite, the uppermost 30 cm of the soil contains 35 % sand, 52 % loam, and 13 % clay,40compared to 13 % sand, 70 % loam, and 17 % clay in the lower part of the field. Due to thegeomorphology and soil texture variation, a high variability in the surface soil water contentis present. In general, the upper part of the test site shows lower surface soil water contentscompared to the lower part. The experimental field plot (15 x 15 m) is situated in the lowerpart of the test site (see Fig. 1).45
2.2. GPR and reference measurements
4
Following the approach of Lambot et al. (2004a, 2004b, 2004c, 2005), an ultra widebandstepped-frequency continuous-wave radar combined with an off-ground monostatic transverseelectromagnetic (TEM) horn antenna (BBHA 9120 A, Schwarzbeck Mess-Elektronik,Schönau, Germany) was used. The radar system was set up using a Vector Network Analyzer(VNA) (FSH6 equipped with a VSWR bridge and power provider, Rohde & Schwarz,5Munich, Germany) connected to an antenna system consisting of a linear polarized double-ridged broadband TEM horn. The antenna dimensions are 0.22 m in length and a 0.14 x 0.24m2 aperture area. The nominal frequency range was 0.8 – 1.8 GHz. Measurements wereperformed with the antenna aperture situated at heights from 0.36 to 0.46 m above ground.The VNA was calibrated at the connection between the antenna feed point and the high10quality N type 50 Ω impedance coaxial cable of 2.5 m length using a 50 Ω OSM (Open,Short, Match) series of a high precision standard calibration kit (ZVZ21-N, Rohde &Schwarz, Munich, Germany).
The transfer function describing the monostatic off-ground GPR system, expressed in the15frequency domain, is given by Lambot et al., 2004b:
where b(ω) and a(ω) are, respectively, the received and emitted signals at the VNA referenceplane, Hi(ω) is the antenna return loss, H(ω)= Ht(ω) Hr(ω) is the antenna transmitting-receiving transfer function, Hf(ω) is the antenna feedback loss, and )(ω↑
xxG is the transferGreen's function of the air-subsurface system modeled as a three-dimensional multilayered20medium. In general, the off-ground GPR measurements are performed in the frequencydomain. Knowledge of the antenna properties H(ω), Hi(ω), and Hf(ω) permits to remove theantenna effects from the S11(ω) function and to calculate ↑
xxG , which describes the response ofthe soil layers. In a next step, the frequency domain signal is transformed into the timedomain by Inverse Fast Fourier Transformation (IFFT). The resulting time domain25measurement is analyzed. A full description of the modeling of the radar signal is given byLambot et al. (2004a, 2004b, 2005). Due to the poor raw data quality in the higher frequencyrange, which might be caused by surface roughness, the fitting procedure using inversesimulation was performed on the frequency window of 800 to 1600 MHz only.
30For the ground wave method, the procedures described by Huisman et al. (2003a, 2003b) andGalagedara et al. (2005) were used. The first step in the ground wave method is theacquisition of a set of Wide Angle Reflection and Refraction (WARR) measurements. InWARR acquisition, the distance between the antennas is increased stepwise with thetransmitter at a fixed position. These WARR measurements are used to determine the optimal35distance between antenna and receiver (see below). In a second step, the GPR measurementsare performed with this optimal antenna separation (see section 3.2). The ground wavevelocity v can be calculated by dividing the travel distance (antenna separation) x by themeasured ground wave travel time (v = x/tGW). However, since the bistatic GPR systems donot have a fixed zero-time, the ground wave velocity must be calculated from the difference40in arrival time between the air wave and the ground wave. The relationship between groundwave arrival time tGW [s], antenna separation x [m], and soil permittivity εsoil then becomes
( ) 22
⎟⎠⎞
⎜⎝⎛ +−
=⎟⎠⎞
⎜⎝⎛=
xxttc
vc AWGW
soilε (2)
45
)()(1)()()(
)()()(11 ωω
ωωωωωω
↑
↑
−+==
xxf
xxi GH
GHHabS (1)
5
where tAW [s] is the air wave arrival time and c [3.0 108 ms-1] the speed of light in free space(Huisman et al., 2003a). In this study, a pulseEKKO1000 system (Sensors and Software Inc.,Toronto, Canada) with 225 MHz and 450 MHz antennas was used.As reference measurements of the soil water content, Time Domain Reflectrometry (TDR),capacitance sensors (Theta probe), and undisturbed soil samples (100 or 300 cm3 volumetric5samples) were used. All TDR measurements were made using a Campbell Scientific TDR 100system (Campbell Scientific Inc., Logan, Utah, USA) with a custom-made 3-wire probe of0.10 m length. The capacitance sensor was a 0.06 m long probe (ML2x, DeltaT Devices Ltd.,UK), from which only the millivoltage signal was stored and converted to dielectricpermittivity afterwards. The RMS error of the capacitance probe is approximately 0.03 m³m-³10(Evett and Steiner, 1995), and the sampling interval (0 - 0.06 m) is smaller than the TDRprobe but larger than the undisturbed soil sample (depth is 0 - 0.03 m for the 100 cm3 and 0 -0.05 m for the 300 cm3 rings). The calculation of the volumetric water content from thedielectric permittivity measured with GPR, TDR, and the Theta probe was based on Topp'sequation (Topp et al., 1980). The volumetric water content of the undisturbed soil samples15was obtained by oven drying at 105°C for 48 h.
For the GPR feasibility study, two measurement campaigns took place: the first one on 21st ofMarch 2005 and the second one on 27th of July 2005. For the first campaign, the intensiveresearch plot was plowed to a depth of 0.15 m and compacted afterwards using a 0.5 m longroller to reduce soil roughness. Because of the low natural spatial variation in soil water20content of this small research plot, one part (3 by 3 meter in the upper right corner) of the testplot was irrigated manually to create a wider range in soil water content. From visualobservations, irrigation did not change the soil density or soil roughness. This is mainly due tothe fact that the entire plot was smoothed and compacted before starting the experiment. Off-ground GPR measurements were performed every meter, resulting in 72 radar measurements.25The antenna height was fixed at 0.3 m above the ground. Before the measurements weremade, the off-ground GPR system was calibrated using a perfect electric conductor. Aftereach radar measurement, five juxtaposed Theta probe measurements were performed in thesoil just below the antenna for measuring the soil reference dielectric permittivity(measurement depth = 0.06 m). In addition, three 100 cm3 undisturbed soil samples were30extracted for each measurement location in every other line, resulting in 36 directmeasurements of the volumetric soil water content. For the Theta probe and the volumetricwater content measurements, averaged values for each measurement point were considered.
For the second measurement campaign, four transects were measured along the EW axis ofthe test site with a spacing of 8 meters. To reduce soil roughness, the field was tilled to a35depth of 0.15 m and compacted several days afterwards using a 2 ton roller. Changes involumetric soil water content caused by using the roller were accepted in the field experimentbecause all methods were equally affected. Each transect contains 12 measurement points. Ateach of these measurement points, monostatic off-ground GPR measurements and three TDRmeasurements were taken. Thus, 48 measurement points were sampled with TDR and off-40ground GPR. Three 300 cm3 volumetric samples were taken at every second measurementpoint (24 in total). The off-ground GPR system was mounted on a wooden frame in front of atractor. For the ground wave method, the GPR transmitter and receiver were installed onsleds, which were pulled by the tractor. Ground wave measurements were taken every 0.5 mby triggering the GPR system with an odometer. This resulted in 1188 ground wave45measurement points. The spacing between the antenna and receiver was fixed at 1.18 m. Theoptimal separation between antenna and receiver was obtained from preliminary WARRmeasurements along a 60 m transect.
6
In this study, we chose to use two different types of reference measurements in eachexperiment: one method that determines the dielectric permittivity (capacitance sensor in thefirst experiment and TDR in the second experiment) and volumetric soil samples. This choicewas motivated by practical reasons. Volumetric soil samples are very cumbersome to take,especially when the size fraction > 2 mm is significant. Because several volumetric soil5samples were required per sampling point in order to get an estimate at the scale of the GPRmeasurements, we decided to only take volumetric samples at every other sampling point.Because dielectric permittivity measurements are easier to make, we used these methods as asecond reference. Previous studies have shown that volumetric samples and TDR orcapacitance measurements gave similar results (e.g. Huisman et al., 2001; Lunt et al., 2005).10The difference in sampling depth between the reference measurements was also motivated bypractical considerations. Again, it is cumbersome to take volumetric soil samples up to adepth of 0.10 m. In contrast, a practical minimum length of TDR probes is ~0.10 m. Finally, itis also not feasible to take shallower volumetric samples (e.g. 0 – 0.01 m). Alternatively, itwould have been possible to determine the gravimetric water content (e.g. gram water per15gram soil) of this shallow upper layer. However, to convert the gravimetric water content tovolumetric water content (the soil property sensed by electromagnetic methods) informationon the dry bulk density of the upper layer is required. Such information is not available at thefield scale.
3. Results and Discussion20
3.1. Plot measurementsThe calculated soil water content from the off-ground GPR and the Theta probemeasurements from the first measurement campaign are plotted in Fig. 2. In general, thedielectric permittivity, and the calculated soil water content using Topp’s equation (Topp etal. 1980), was lower for the off-ground GPR than for the Theta probe. As Lambot et al. (2005,252006b) already stated, this behavior can be partly attributed to the effect of soil roughness onthe amplitude of the surface reflection. Another reason might be the vertical distribution ofthe soil water content. The Theta probe gives average values up to a depth of 0.06 m, whereasthe off-ground GPR provides values for which the depth of influence varies as a function ofsoil water content and the soil water content profile, and is therefore not precisely known.30During the experiment, the soil water content profile was characterized by an upper drier layerof ~0.015 m at the non-irrigated measurement points due to soil evaporation. Therefore, thelower soil water content estimates obtained with the off-ground GPR system might beexplained by the fact that this method is mainly sensitive to the upper part of the soil in thefrequency range of 0.8 to 1.8 GHz. For instance, Serbin and Or (2004) showed that surface35reflection GPR measurements were in good agreement with volumetric measurements for thetop 0.01 m layer of soil, but did not agree well with deeper TDR and gravimetric data. Thisexplanation was confirmed by the fact that for the higher soil water contents, pertaining to theirrigated area which did not exhibit the dry surface layer, off-ground GPR and Theta probemeasurements provide similar results (see Fig. 2).40
7
3.2. Field measurements
3.2.1. Preliminary WARR measurementsTo find the optimal distance between antenna and receiver, a transect of 60 m was measuredin the middle of the field. Along this transect, 20 WARR measurements with a maximum5antenna separation of 3 m and a step size of 0.1 m were performed with 225 MHz and 450MHz shielded antennas. Figure 3 shows four WARR measurements obtained with the 450MHz antenna along the 60 m transect. In general, the four WARR measurements appear quitedifferent. In the first WARR radargram (Fig. 3a) measured between 0 - 3 m, the air wave, theground wave and several reflected waves can be distinguished. However, the ground wave10can be only recognized between an antenna separation of 0.5 and 1.5 m. At larger antennaseparations a clear interference with a very shallow reflected wave that starts at 15 ns isdetectable. In the second WARR measurement (9 - 12 m, Fig. 3b), the signal attenuationclearly increased. The ground wave can only be detected up to an antenna separation of 1.8 m.The interference with a shallow reflected wave cannot be recognized anymore. However,15several critically refracted waves appeared. Critically refracted waves can be recognized aswaves parallel to the air wave but at later times. In the third WARR measurement (18 - 21 m,Fig. 3c), the signal attenuation has further increased and the ground wave can only clearly berecognized up to an antenna separation of 1.3 m. Finally, in the fourth WARR measurement(27-30 m, Fig. 3d), the attenuation has increased up to a level were the ground wave cannot be20recognized anymore in the radargram. Instead, only the air wave and several criticallyrefracted waves can be seen. Not all remaining WARR measurements of the 60 m transectwere as difficult to interpret as the WARR measurements shown in the lower right of Fig. 3d.However, high attenuation was prevalent and the ground wave was difficult to recognize insome WARR measurements. After careful inspection of all data, an antenna separation of 1.225m was selected for soil water content mapping, although the complexity of the WARRmeasurements in Fig. 3 suggested that considerable problems in the interpretation of thefixed-offset ground wave GPR measurements were to be expected.The WARR measurements made with the 225 MHz antennas showed a similar behavior(results not shown). However, the interference with shallow reflected waves was stronger30because of the lower resolution at lower frequencies. Therefore, the 450 MHz antennas wereselected for soil water content mapping along the four transects.
3.2.2. Ground wave GPRFigure 4 shows two of the four ground wave GPR profiles, where the horizontal wave at35approximately 14 ns corresponds with the air wave. Typically, it is assumed that the groundwave is the next arrival in the radargram. In the upper GPR profile (Transect 1) between 20and 50 m, a clear wave can be recognized. From the preliminary WARR measurements, thiswave was identified as the ground wave. The arrival time of the ground and the air wave werepicked to calculate the permittivity according to Eq. 2. Figure 4 also shows that the ground40wave is difficult to recognize in large parts of the GPR profile. Especially between 50 and 150m in Transect 4 (lower GPR profile) no clear signal from the soil is detectable. Although thereis a strong attenuated signal between 20 and 25 ns that we interpreted as the ground wave, thesimilarity with a similar feature between 18 and 20 ns could also indicate that the radargram isdominated by multiple critically refracted waves in this part of the profile. The soil water45content measured by the ground wave method at the field scale along the four transects isplotted in Fig. 5. The soil water content calculated by the ground wave method varied from0.126 to 0.286 m3m-3 in the upper and lower part, respectively. In general, a slight trend in thesoil water content is visible with lower soil water contents in the upper part and higher soilwater contents in the lower part.50
8
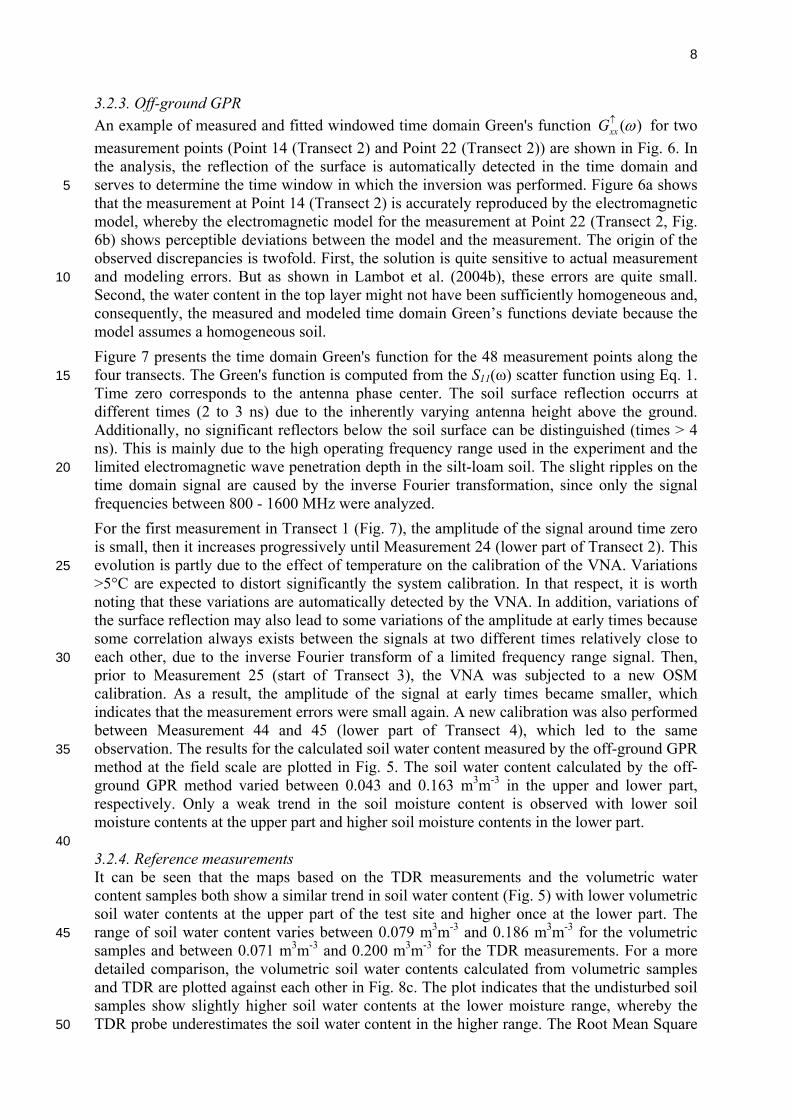
3.2.3. Off-ground GPRAn example of measured and fitted windowed time domain Green's function )(ω↑
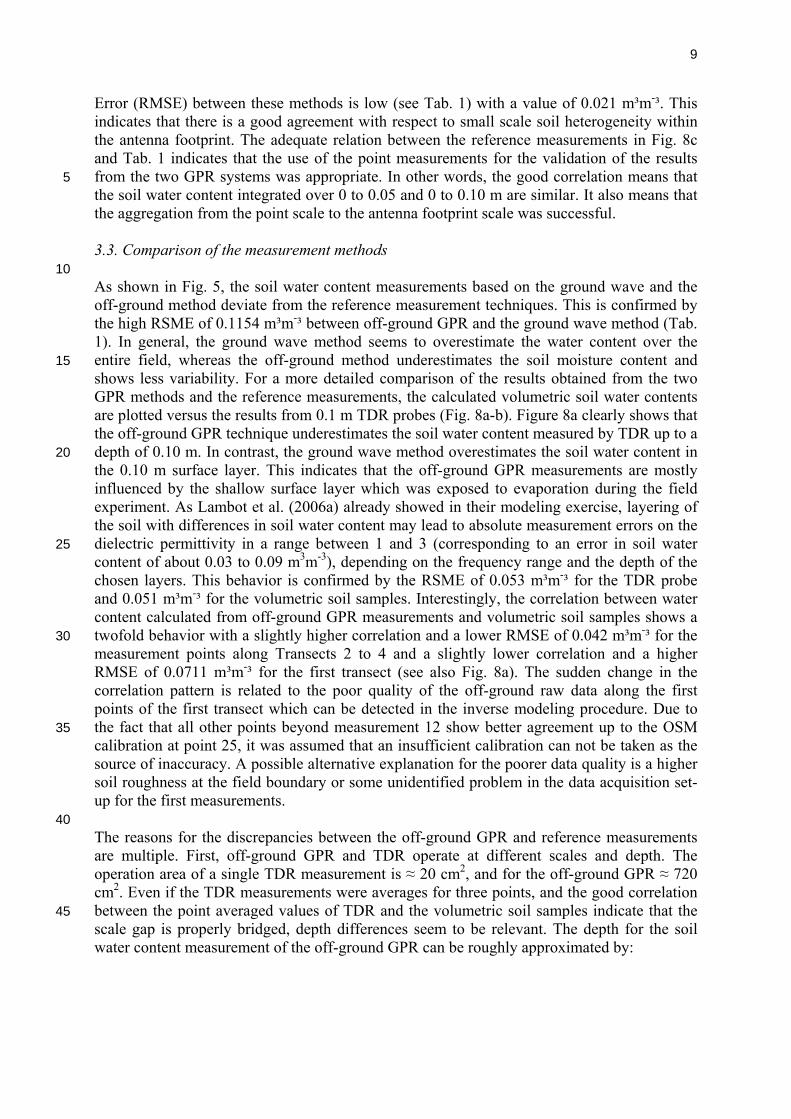
xxG for twomeasurement points (Point 14 (Transect 2) and Point 22 (Transect 2)) are shown in Fig. 6. Inthe analysis, the reflection of the surface is automatically detected in the time domain andserves to determine the time window in which the inversion was performed. Figure 6a shows5that the measurement at Point 14 (Transect 2) is accurately reproduced by the electromagneticmodel, whereby the electromagnetic model for the measurement at Point 22 (Transect 2, Fig.6b) shows perceptible deviations between the model and the measurement. The origin of theobserved discrepancies is twofold. First, the solution is quite sensitive to actual measurementand modeling errors. But as shown in Lambot et al. (2004b), these errors are quite small.10Second, the water content in the top layer might not have been sufficiently homogeneous and,consequently, the measured and modeled time domain Green’s functions deviate because themodel assumes a homogeneous soil.Figure 7 presents the time domain Green's function for the 48 measurement points along thefour transects. The Green's function is computed from the S11(ω) scatter function using Eq. 1.15Time zero corresponds to the antenna phase center. The soil surface reflection occurrs atdifferent times (2 to 3 ns) due to the inherently varying antenna height above the ground.Additionally, no significant reflectors below the soil surface can be distinguished (times > 4ns). This is mainly due to the high operating frequency range used in the experiment and thelimited electromagnetic wave penetration depth in the silt-loam soil. The slight ripples on the20time domain signal are caused by the inverse Fourier transformation, since only the signalfrequencies between 800 - 1600 MHz were analyzed.For the first measurement in Transect 1 (Fig. 7), the amplitude of the signal around time zerois small, then it increases progressively until Measurement 24 (lower part of Transect 2). Thisevolution is partly due to the effect of temperature on the calibration of the VNA. Variations25>5°C are expected to distort significantly the system calibration. In that respect, it is worthnoting that these variations are automatically detected by the VNA. In addition, variations ofthe surface reflection may also lead to some variations of the amplitude at early times becausesome correlation always exists between the signals at two different times relatively close toeach other, due to the inverse Fourier transform of a limited frequency range signal. Then,30prior to Measurement 25 (start of Transect 3), the VNA was subjected to a new OSMcalibration. As a result, the amplitude of the signal at early times became smaller, whichindicates that the measurement errors were small again. A new calibration was also performedbetween Measurement 44 and 45 (lower part of Transect 4), which led to the sameobservation. The results for the calculated soil water content measured by the off-ground GPR35method at the field scale are plotted in Fig. 5. The soil water content calculated by the off-ground GPR method varied between 0.043 and 0.163 m3m-3 in the upper and lower part,respectively. Only a weak trend in the soil moisture content is observed with lower soilmoisture contents at the upper part and higher soil moisture contents in the lower part.
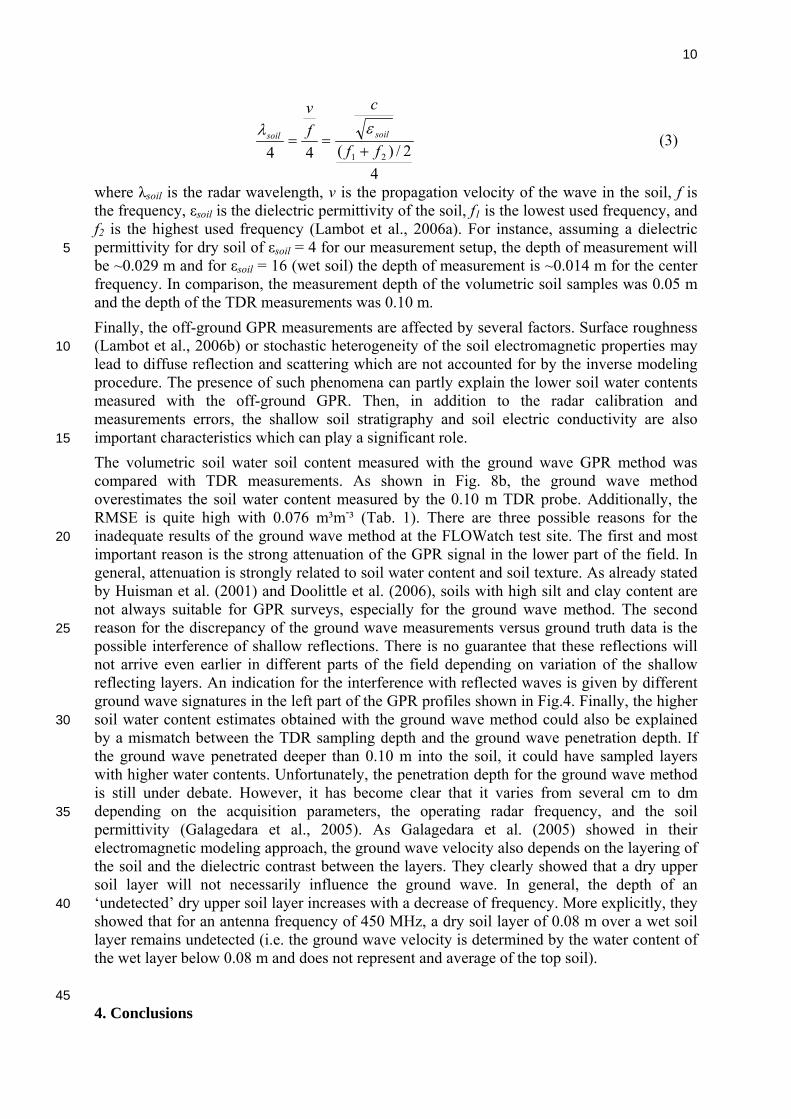
403.2.4. Reference measurementsIt can be seen that the maps based on the TDR measurements and the volumetric watercontent samples both show a similar trend in soil water content (Fig. 5) with lower volumetricsoil water contents at the upper part of the test site and higher once at the lower part. Therange of soil water content varies between 0.079 m3m-3 and 0.186 m3m-3 for the volumetric45samples and between 0.071 m3m-3 and 0.200 m3m-3 for the TDR measurements. For a moredetailed comparison, the volumetric soil water contents calculated from volumetric samplesand TDR are plotted against each other in Fig. 8c. The plot indicates that the undisturbed soilsamples show slightly higher soil water contents at the lower moisture range, whereby theTDR probe underestimates the soil water content in the higher range. The Root Mean Square50
9
Error (RMSE) between these methods is low (see Tab. 1) with a value of 0.021 m³m-³. Thisindicates that there is a good agreement with respect to small scale soil heterogeneity withinthe antenna footprint. The adequate relation between the reference measurements in Fig. 8cand Tab. 1 indicates that the use of the point measurements for the validation of the resultsfrom the two GPR systems was appropriate. In other words, the good correlation means that5the soil water content integrated over 0 to 0.05 and 0 to 0.10 m are similar. It also means thatthe aggregation from the point scale to the antenna footprint scale was successful.
3.3. Comparison of the measurement methods10
As shown in Fig. 5, the soil water content measurements based on the ground wave and theoff-ground method deviate from the reference measurement techniques. This is confirmed bythe high RSME of 0.1154 m³m-³ between off-ground GPR and the ground wave method (Tab.1). In general, the ground wave method seems to overestimate the water content over theentire field, whereas the off-ground method underestimates the soil moisture content and15shows less variability. For a more detailed comparison of the results obtained from the twoGPR methods and the reference measurements, the calculated volumetric soil water contentsare plotted versus the results from 0.1 m TDR probes (Fig. 8a-b). Figure 8a clearly shows thatthe off-ground GPR technique underestimates the soil water content measured by TDR up to adepth of 0.10 m. In contrast, the ground wave method overestimates the soil water content in20the 0.10 m surface layer. This indicates that the off-ground GPR measurements are mostlyinfluenced by the shallow surface layer which was exposed to evaporation during the fieldexperiment. As Lambot et al. (2006a) already showed in their modeling exercise, layering ofthe soil with differences in soil water content may lead to absolute measurement errors on thedielectric permittivity in a range between 1 and 3 (corresponding to an error in soil water25content of about 0.03 to 0.09 m3m-3), depending on the frequency range and the depth of thechosen layers. This behavior is confirmed by the RSME of 0.053 m³m-³ for the TDR probeand 0.051 m³m-³ for the volumetric soil samples. Interestingly, the correlation between watercontent calculated from off-ground GPR measurements and volumetric soil samples shows atwofold behavior with a slightly higher correlation and a lower RMSE of 0.042 m³m-³ for the30measurement points along Transects 2 to 4 and a slightly lower correlation and a higherRMSE of 0.0711 m³m-³ for the first transect (see also Fig. 8a). The sudden change in thecorrelation pattern is related to the poor quality of the off-ground raw data along the firstpoints of the first transect which can be detected in the inverse modeling procedure. Due tothe fact that all other points beyond measurement 12 show better agreement up to the OSM35calibration at point 25, it was assumed that an insufficient calibration can not be taken as thesource of inaccuracy. A possible alternative explanation for the poorer data quality is a highersoil roughness at the field boundary or some unidentified problem in the data acquisition set-up for the first measurements.
40The reasons for the discrepancies between the off-ground GPR and reference measurementsare multiple. First, off-ground GPR and TDR operate at different scales and depth. Theoperation area of a single TDR measurement is ≈ 20 cm2, and for the off-ground GPR ≈ 720cm2. Even if the TDR measurements were averages for three points, and the good correlationbetween the point averaged values of TDR and the volumetric soil samples indicate that the45scale gap is properly bridged, depth differences seem to be relevant. The depth for the soilwater content measurement of the off-ground GPR can be roughly approximated by:
10
42/)(44 21 ff
cfv
soilsoil
+==
ελ(3)
where λsoil is the radar wavelength, v is the propagation velocity of the wave in the soil, f isthe frequency, εsoil is the dielectric permittivity of the soil, f1 is the lowest used frequency, andf2 is the highest used frequency (Lambot et al., 2006a). For instance, assuming a dielectricpermittivity for dry soil of εsoil = 4 for our measurement setup, the depth of measurement will5be ~0.029 m and for εsoil = 16 (wet soil) the depth of measurement is ~0.014 m for the centerfrequency. In comparison, the measurement depth of the volumetric soil samples was 0.05 mand the depth of the TDR measurements was 0.10 m.Finally, the off-ground GPR measurements are affected by several factors. Surface roughness(Lambot et al., 2006b) or stochastic heterogeneity of the soil electromagnetic properties may10lead to diffuse reflection and scattering which are not accounted for by the inverse modelingprocedure. The presence of such phenomena can partly explain the lower soil water contentsmeasured with the off-ground GPR. Then, in addition to the radar calibration andmeasurements errors, the shallow soil stratigraphy and soil electric conductivity are alsoimportant characteristics which can play a significant role.15
The volumetric soil water soil content measured with the ground wave GPR method wascompared with TDR measurements. As shown in Fig. 8b, the ground wave methodoverestimates the soil water content measured by the 0.10 m TDR probe. Additionally, theRMSE is quite high with 0.076 m³m-³ (Tab. 1). There are three possible reasons for theinadequate results of the ground wave method at the FLOWatch test site. The first and most20important reason is the strong attenuation of the GPR signal in the lower part of the field. Ingeneral, attenuation is strongly related to soil water content and soil texture. As already statedby Huisman et al. (2001) and Doolittle et al. (2006), soils with high silt and clay content arenot always suitable for GPR surveys, especially for the ground wave method. The secondreason for the discrepancy of the ground wave measurements versus ground truth data is the25possible interference of shallow reflections. There is no guarantee that these reflections willnot arrive even earlier in different parts of the field depending on variation of the shallowreflecting layers. An indication for the interference with reflected waves is given by differentground wave signatures in the left part of the GPR profiles shown in Fig.4. Finally, the highersoil water content estimates obtained with the ground wave method could also be explained30by a mismatch between the TDR sampling depth and the ground wave penetration depth. Ifthe ground wave penetrated deeper than 0.10 m into the soil, it could have sampled layerswith higher water contents. Unfortunately, the penetration depth for the ground wave methodis still under debate. However, it has become clear that it varies from several cm to dmdepending on the acquisition parameters, the operating radar frequency, and the soil35permittivity (Galagedara et al., 2005). As Galagedara et al. (2005) showed in theirelectromagnetic modeling approach, the ground wave velocity also depends on the layering ofthe soil and the dielectric contrast between the layers. They clearly showed that a dry uppersoil layer will not necessarily influence the ground wave. In general, the depth of an‘undetected’ dry upper soil layer increases with a decrease of frequency. More explicitly, they40showed that for an antenna frequency of 450 MHz, a dry soil layer of 0.08 m over a wet soillayer remains undetected (i.e. the ground wave velocity is determined by the water content ofthe wet layer below 0.08 m and does not represent and average of the top soil).
454. Conclusions
11
In general, the spatial variation in soil water content measured with the ground wave and off-ground method did not correspond with the variations measured with TDR and volumetricsoil samples. The main reason for the failure of the ground wave method was the strongattenuation of the GPR signal, which is related to the texture at the test site. Shallowreflections and the dry upper soil layer might also have contributed to the poor5correspondence between the ground wave method and the reference measurements. Thevariations in the off-ground GPR results as compared with the reference measurements mightbe explained by differences in the sampling volume and depth. The low variations in the off-ground GPR data may be attributed to the homogeneously dry upper soil layer. However,several issues are still to be investigated to better understand the various factors affecting the10off-ground radar measurements (e.g. soil roughness, soil layering, and electricalconductivity). Therefore, laboratory experiments should be conducted and the results shouldbe implemented into modeling approaches. Especially soil surface roughness and soil layeringshould be taken into account in the electromagnetic inverse modeling approach. Future work,using lower frequency antennas, might also overcome the problem of soil surface roughness15for the off-ground GPR measurements, and therefore allow measurements under natural soilconditions without a priori smoothing of the soil surface. On the other hand, reliable andcomparable ground truth measurements are necessary to compare the off-ground GPR results.Nevertheless, the off-ground GPR configuration used in this study was not suitable to monitorthe soil water content of the upper 0 – 0.05 m layer, which is considered as an20environmentally relevant depth for important processes, such as CO2 production and plantwater availability. To overcome the problem of shallow measurement depths using off-groundGPR, lower frequencies should be used which allow deeper penetration into the soil profile.
The feasibility study of the two different GPR methods at the FLOWatch test site clearly25showed that the ground wave method was not suitable for this site and that the off-groundmethod is not comparable with standard soil physical soil water content measurementtechniques. Clearly, there is considerable need for a wider range of approaches to non-invasively map soil water content variation at the field scale.
30Acknowledgments
We thank R. Harms, H.G. Sittardt, and T. Pütz for their assistance with the measurements. Wealso want to thank the University of Amsterdam for the ‘ground wave GPR’ system. Finallywe wish to thank the two anonymous reviewers, whose insightful suggestions improved the35focus and organization of this manuscript.
12
References12
Bohidar, R.N., Hermance, J.F., 2002. The GPR refraction method. Geophysics 67, 160-1723Bouten, W., Heimovaara, T.J., Tiktak, A., 1992. Spatial patterns of throughfall and soil water4dynamics in a Doughlas fir stand. Water Resources Research 28, 3227-32335
Cognard, A.L., Loumagne, C., Normand, M., Olivier, P., Ottlé, C., Vidal-Madjar, D.,6Louahala, S., Vidal, A., 1995. Evaluation of the ERS1/synstetic aperture radar capacity to7estimate surface soil moisture: Two-year results over the Naizin watershed. Water Resources8Research 31, 975-9829
Davis, J.L., Annan, A.P., 2002. Ground penetrating radar to measure soil water content. p.10446-463. In: J.H. Dane and G.C. Topp (ed.) Methods of soil analysis. Part 4. SSSA Book Ser.115. SSSA, Madison, WI12
Doolittle, J.A., Minzenmayer, F.E., Waltman, S.W., Benham, E.C., Tuttle, J.W., Peaslee, S.,132006. State ground-penetrating radar soil suitability maps. Proceedings of the 11th14International Conference on Ground Penetrating Radar, June 19-22, Columbus Ohio, USA15
Du, S., Rummel, P., 1996. Reconaissance studies of moisture in the subsurface with GPR.16Proceedings of the 5th International Conference on Ground Penetrating Radar, Kitchener,17Ontario, Canada, 1241-124818
D’Urso, G., Minacapilli, M., 2006. A semi-empirical approach for surface soil water content19estimation from radar data without a-priori information on surface roughness. Journal of20Hydrology 321, 297-31021
Evett, S.J., 2000. Some aspects of time domain reflectrometry (TDR), neutron scattering and22capacitance methods of soil water content measurements, In: Comparison of soil water23measurement using the neutron scattering, time domain reflectrometry and capacitance24methods. IAEA-TECDOC-1137, IAEA, Vienna, Austria, 5-4925
Evett, S.J., Steiner, J.L., 1995. Precision of neutron scattering and capacitance type soil water26content gauges from field calibration. Soil Science Society of America Journal 59, 961-96827
Ferré, P.A., Knight, J.H., Rudolph, D.L., Kachanowski, R.G., 1998. The sampling areas of28conventional and alternative time domain reflectrometry probes. Water Resources Research2934, 2971-297930
Famigliette, J.S., Devereaux, J.A., Laymon, C.A., Tsegaye, T., Houser, P.R., Jackson, T.J.31Graham, S.T., Rodell, M., van Oevelen, P.J., 1999. Ground based investigation of soil32moisture variability within remote sensing footprints during the Southern Great Plains 199733(SGP97) Hydrology Experiment. Water Resources Research 35, 1839-185134
Galagedara, L.W., Redman, J.D., Parkin, G.W., Annan, A.P., Endres, A.L., 2005. Numerical35modeling of GPR to determine the direct ground wave sampling depth. Vadose Zone Journal364, 1096-110637
Grote, K., Hubbard, S., Rubin, Y., 2003. Field-scale estimation of volumetric water content38using ground-penetrating radar ground wave techniques. Water Resources Research 39, 1321-39133540
13
Hubbard, S., Grote, K., Rubin, Y., 2002. Mapping the volumetric soil water content of a1California vineyard using high-frequency GPR ground wave data. The Leading Edge 21, 552-25593
Huisman, J.A., Sperl, C., Bouten, W., Verstraten, J.M., 2001. Soil water content4measurements at different scales: accuracy of time domain reflectrometry and ground-5penetrating radar. Journal of Hydrology 245, 48-586
Huisman, J.A., Hubbard, S.S., Redman, J.D., Annan, P.A., 2003a, Measuring soil water7content with ground penetrating radar: A review. Vadose Zone Journal 2, 476-4918
Huisman, J.A., Snepvangers, J.J.J.C., Bouten, W., Heuvelink, G.B.M., 2003b. Monitoring9temporal development of spatial soil water content variation: Comparison of ground-10penetrating-radar and time domain reflectrometry. Vadose Zone Journal 2, 519-52911
Hupet, F., Vanclooster, M., 2002. Intraseasonal dynamics of soil moisture variability within a12small agricultural maize cropped field. Journal of Hydrology 261, 86-10113
Jackson, T.J., Le Vine, D.E., 1996. Mapping surface soil moisture using an aircraft-based14passive microwave instrument: Algorithm and example, Journal of Hydrology 184, 85-9915
Lambot, S., Slob, E.C., van den Bosch, I., Stockbroeckx, B., Scheers, B., Vanclooster, M.,162004a. Estimating soil electric properties from monostatic ground-penetrating radar signal17inversion in the frequency domain. Water Resources Research 40, W04-205, Doi:1810.1029/2003WR002 09519
Lambot, S., Slob, E.C., van den Bosch, I., Stockbroeckx, B., Vanclooster, M., 2004b.20Modeling of ground-penetrating radar for accurate characterization of subsurface electric21properties. IEEE Transaction on Geoscience and Remote Sensing 42, 2555-256822
Lambot, S., Rhebergen, J., van den Bosch, I., Slob, E.C., Vanclooster, M., 2004c. Measuring23the soil water content profile of a sandy soil with off-ground monostatic ground penetrating24radar. Vadose Zone Journal 3, 1063-107125
Lambot, S., Weihermüller, L., van den Bosch, I., Vanclooster, M., Slob, E.C., 2005. Full-26wave inversion of off-ground monostatic GPR signal focused on the surface reflection for27identifying surface dielectric permittivity. In: Lambot S., Gorriti, A.G., (Eds), Proceedings of28the 3rd International Workshop on Advanced Ground Penetrating Radar (IWAGPR). May 2 -294, Delft, Netherlands, 113-11830
Lambot, S., Weihermüller, L., Huisman, J.A., Vereecken, H., Vanclooster, M., Slob, E.C.,312006a. Analysis of air-launched ground-penetrating radar techniques to measure the soil32surface water content, Water Resources Research 42, W11403, doi:10.1029/2006WR00509733
Lambot, S., Antoine, M., Vanclooster, M., Slob, E.C., 2006b. Effect of soil roughness on the34inversion of off-ground monostatic GPR signal for noninvasive quantification of soil35properties. Water Resources Research 42: W3403, Doi: 10.1029/2005WR00441636
Lunt, I.A., Hubbard, S., Rubin, Y., 2005. Soil moisture content estimation using ground-37penetrating radar reflection data. Journal of Hydrology 307, 254-26938
Merz, B., Bardossy, A., 1998. Effect of spatial variability on the rainfall runoff process in a39small loess catchment. Journal of Hydrology 212, 304-31740
14
Pauwels, V.R.N., Hoeben, R., Verhoest, N.E.C., De Troch, F.P., 2001. The importance of the1spatial patterns of remotely sensed soil moisture in the improvement of discharge predictions2for small-scale basins through data assimilation. Journal of Hydrology 251, 88-1023
Redman, J.D., Davis, J.L., Galagedara, L.W., Parkin, G.W., 2002. Field studies of GPR air4lunched surface reflectivity measurements of soil water content. Proc. of the 9th Conference of5Ground-Penetrating Radar. Proc. SPIE 4758, 156-1616
Ritsema, C.J., Dekker, L.W., 1998, Three-dimensional patterns of moisture, water repellency,7bromide and pH in a sandy soil. Journal of Contaminant Hydrology 31, 295-3138
Schlesinger, W., Reynolds, J., Cunningham, G., Huenneke, L., Jarrell, W., Virginia, R.,9Whitford, W., 1990. Biological feedbacks in global desertification. Science 24, 1043-104810
Serbin, G. Or, D., 2004. Ground-penetrating radar measurement of soil water content11dynamics using a suspended horn antenna. IEEE Transaction on Geoscience and Remote12Sensing 42, 1695-170513
Topp, G.C., Davis, J.L., Annan, A.P., 1980. Electromagnetic determination of soil water14content: Measurements in coaxial transmission lines. Water Resources Research 16, 574-58215
Ulaby, F.T., Dubois, P.C. van Zyl, J., 1996. Radar mapping of surface soil moisture. Journal16of hydrology 184, 57-8417
van Overmeeren, R.A., Sariowan, S.V., Gehrels, J.C., 1997. Ground penetrating radar for18determining volumetric soil water content; results of comparative measurements at two sites.19Journal of Hydrology 197, 316-33820
Weiler, K.W., Steenhuis, T.S., Boll, J., Kung, K.-J.S., 1998. Comparison of ground21penetrating radar and time domain reflectrometry as soil water sensors. Soil Science Society22of America Journal 62, 1237-123923
Western, A.W., Grayson, R.B., 1998. The Tarrawarra data set: Soil moisture patterns, soil24characteristics, and hydrological flux measurements. Water Resources Research 34, 2765-25276826
Western, A.W., Blöschel, G., Grayson, R.B., 1998. Geostatistical characterization of the27Borden aquifer. Water Resources Research 27, 533-54628
Wollschläger, U., Roth, K., 2005. Estimation of temporal changes of volumetric soil water29content from ground-penetrating-radar reflections. Subsurface Sensing Technologies and30Applications 6, 207-21831
Wood, E.F., 1997. Effects of soil moisture aggregation on surface evaporation fluxes. Journal32of Hydrology 190, 397-41233
34