Measurement of ground movements in Stoke-on-Trent (UK) using radar interferometry
10
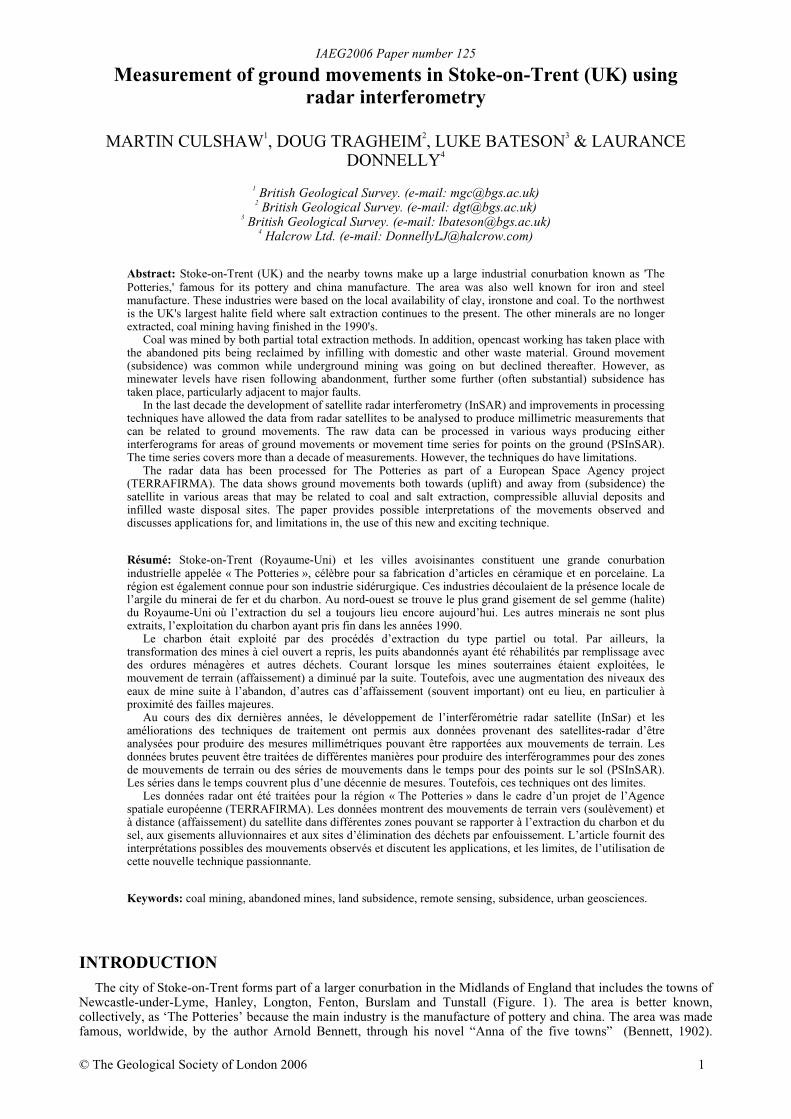
IAEG2006 Paper number 125 © The Geological Society of London 2006 1 Measurement of ground movements in Stoke-on-Trent (UK) using radar interferometry MARTIN CULSHAW 1 , DOUG TRAGHEIM 2 , LUKE BATESON 3 & LAURANCE DONNELLY 4 1 British Geological Survey. (e-mail: [email protected]) 2 British Geological Survey. (e-mail: [email protected]) 3 British Geological Survey. (e-mail: [email protected]) 4 Halcrow Ltd. (e-mail: [email protected]) Abstract: Stoke-on-Trent (UK) and the nearby towns make up a large industrial conurbation known as 'The Potteries,' famous for its pottery and china manufacture. The area was also well known for iron and steel manufacture. These industries were based on the local availability of clay, ironstone and coal. To the northwest is the UK's largest halite field where salt extraction continues to the present. The other minerals are no longer extracted, coal mining having finished in the 1990's. Coal was mined by both partial total extraction methods. In addition, opencast working has taken place with the abandoned pits being reclaimed by infilling with domestic and other waste material. Ground movement (subsidence) was common while underground mining was going on but declined thereafter. However, as minewater levels have risen following abandonment, further some further (often substantial) subsidence has taken place, particularly adjacent to major faults. In the last decade the development of satellite radar interferometry (InSAR) and improvements in processing techniques have allowed the data from radar satellites to be analysed to produce millimetric measurements that can be related to ground movements. The raw data can be processed in various ways producing either interferograms for areas of ground movements or movement time series for points on the ground (PSInSAR). The time series covers more than a decade of measurements. However, the techniques do have limitations. The radar data has been processed for The Potteries as part of a European Space Agency project (TERRAFIRMA). The data shows ground movements both towards (uplift) and away from (subsidence) the satellite in various areas that may be related to coal and salt extraction, compressible alluvial deposits and infilled waste disposal sites. The paper provides possible interpretations of the movements observed and discusses applications for, and limitations in, the use of this new and exciting technique. Résumé: Stoke-on-Trent (Royaume-Uni) et les villes avoisinantes constituent une grande conurbation industrielle appelée « The Potteries », célèbre pour sa fabrication d’articles en céramique et en porcelaine. La région est également connue pour son industrie sidérurgique. Ces industries découlaient de la présence locale de l’argile du minerai de fer et du charbon. Au nord-ouest se trouve le plus grand gisement de sel gemme (halite) du Royaume-Uni où l’extraction du sel a toujours lieu encore aujourd’hui. Les autres minerais ne sont plus extraits, l’exploitation du charbon ayant pris fin dans les années 1990. Le charbon était exploité par des procédés d’extraction du type partiel ou total. Par ailleurs, la transformation des mines à ciel ouvert a repris, les puits abandonnés ayant été réhabilités par remplissage avec des ordures ménagères et autres déchets. Courant lorsque les mines souterraines étaient exploitées, le mouvement de terrain (affaissement) a diminué par la suite. Toutefois, avec une augmentation des niveaux des eaux de mine suite à l’abandon, d’autres cas d’affaissement (souvent important) ont eu lieu, en particulier à proximité des failles majeures. Au cours des dix dernières années, le développement de l’interférométrie radar satellite (InSar) et les améliorations des techniques de traitement ont permis aux données provenant des satellites-radar d’être analysées pour produire des mesures millimétriques pouvant être rapportées aux mouvements de terrain. Les données brutes peuvent être traitées de différentes manières pour produire des interférogrammes pour des zones de mouvements de terrain ou des séries de mouvements dans le temps pour des points sur le sol (PSInSAR). Les séries dans le temps couvrent plus d’une décennie de mesures. Toutefois, ces techniques ont des limites. Les données radar ont été traitées pour la région « The Potteries » dans le cadre d’un projet de l’Agence spatiale européenne (TERRAFIRMA). Les données montrent des mouvements de terrain vers (soulèvement) et à distance (affaissement) du satellite dans différentes zones pouvant se rapporter à l’extraction du charbon et du sel, aux gisements alluvionnaires et aux sites d’élimination des déchets par enfouissement. L’article fournit des interprétations possibles des mouvements observés et discutent les applications, et les limites, de l’utilisation de cette nouvelle technique passionnante. Keywords: coal mining, abandoned mines, land subsidence, remote sensing, subsidence, urban geosciences. INTRODUCTION The city of Stoke-on-Trent forms part of a larger conurbation in the Midlands of England that includes the towns of Newcastle-under-Lyme, Hanley, Longton, Fenton, Burslam and Tunstall (Figure. 1). The area is better known, collectively, as ‘The Potteries’ because the main industry is the manufacture of pottery and china. The area was made famous, worldwide, by the author Arnold Bennett, through his novel “Anna of the five towns” (Bennett, 1902).
-
Upload
independent -
Category
Documents
-
view
2 -
download
0
Transcript of Measurement of ground movements in Stoke-on-Trent (UK) using radar interferometry
IAEG2006 Paper number 125
© The Geological Society of London 2006 1
Measurement of ground movements in Stoke-on-Trent (UK) usingradar interferometry
MARTIN CULSHAW1, DOUG TRAGHEIM2, LUKE BATESON3 & LAURANCEDONNELLY4
1 British Geological Survey. (e-mail: [email protected])2 British Geological Survey. (e-mail: [email protected])
3 British Geological Survey. (e-mail: [email protected])4 Halcrow Ltd. (e-mail: [email protected])
Abstract: Stoke-on-Trent (UK) and the nearby towns make up a large industrial conurbation known as 'ThePotteries,' famous for its pottery and china manufacture. The area was also well known for iron and steelmanufacture. These industries were based on the local availability of clay, ironstone and coal. To the northwestis the UK's largest halite field where salt extraction continues to the present. The other minerals are no longerextracted, coal mining having finished in the 1990's.
Coal was mined by both partial total extraction methods. In addition, opencast working has taken place withthe abandoned pits being reclaimed by infilling with domestic and other waste material. Ground movement(subsidence) was common while underground mining was going on but declined thereafter. However, asminewater levels have risen following abandonment, further some further (often substantial) subsidence hastaken place, particularly adjacent to major faults.
In the last decade the development of satellite radar interferometry (InSAR) and improvements in processingtechniques have allowed the data from radar satellites to be analysed to produce millimetric measurements thatcan be related to ground movements. The raw data can be processed in various ways producing eitherinterferograms for areas of ground movements or movement time series for points on the ground (PSInSAR).The time series covers more than a decade of measurements. However, the techniques do have limitations.
The radar data has been processed for The Potteries as part of a European Space Agency project(TERRAFIRMA). The data shows ground movements both towards (uplift) and away from (subsidence) thesatellite in various areas that may be related to coal and salt extraction, compressible alluvial deposits andinfilled waste disposal sites. The paper provides possible interpretations of the movements observed anddiscusses applications for, and limitations in, the use of this new and exciting technique.
Résumé: Stoke-on-Trent (Royaume-Uni) et les villes avoisinantes constituent une grande conurbationindustrielle appelée « The Potteries », célèbre pour sa fabrication d’articles en céramique et en porcelaine. Larégion est également connue pour son industrie sidérurgique. Ces industries découlaient de la présence locale del’argile du minerai de fer et du charbon. Au nord-ouest se trouve le plus grand gisement de sel gemme (halite)du Royaume-Uni où l’extraction du sel a toujours lieu encore aujourd’hui. Les autres minerais ne sont plusextraits, l’exploitation du charbon ayant pris fin dans les années 1990.
Le charbon était exploité par des procédés d’extraction du type partiel ou total. Par ailleurs, latransformation des mines à ciel ouvert a repris, les puits abandonnés ayant été réhabilités par remplissage avecdes ordures ménagères et autres déchets. Courant lorsque les mines souterraines étaient exploitées, lemouvement de terrain (affaissement) a diminué par la suite. Toutefois, avec une augmentation des niveaux deseaux de mine suite à l’abandon, d’autres cas d’affaissement (souvent important) ont eu lieu, en particulier àproximité des failles majeures.
Au cours des dix dernières années, le développement de l’interférométrie radar satellite (InSar) et lesaméliorations des techniques de traitement ont permis aux données provenant des satellites-radar d’êtreanalysées pour produire des mesures millimétriques pouvant être rapportées aux mouvements de terrain. Lesdonnées brutes peuvent être traitées de différentes manières pour produire des interférogrammes pour des zonesde mouvements de terrain ou des séries de mouvements dans le temps pour des points sur le sol (PSInSAR).Les séries dans le temps couvrent plus d’une décennie de mesures. Toutefois, ces techniques ont des limites.
Les données radar ont été traitées pour la région « The Potteries » dans le cadre d’un projet de l’Agencespatiale européenne (TERRAFIRMA). Les données montrent des mouvements de terrain vers (soulèvement) età distance (affaissement) du satellite dans différentes zones pouvant se rapporter à l’extraction du charbon et dusel, aux gisements alluvionnaires et aux sites d’élimination des déchets par enfouissement. L’article fournit desinterprétations possibles des mouvements observés et discutent les applications, et les limites, de l’utilisation decette nouvelle technique passionnante.
Keywords: coal mining, abandoned mines, land subsidence, remote sensing, subsidence, urban geosciences.
INTRODUCTIONThe city of Stoke-on-Trent forms part of a larger conurbation in the Midlands of England that includes the towns of
Newcastle-under-Lyme, Hanley, Longton, Fenton, Burslam and Tunstall (Figure. 1). The area is better known,collectively, as ‘The Potteries’ because the main industry is the manufacture of pottery and china. The area was madefamous, worldwide, by the author Arnold Bennett, through his novel “Anna of the five towns” (Bennett, 1902).
IAEG2006 Paper number 125
2
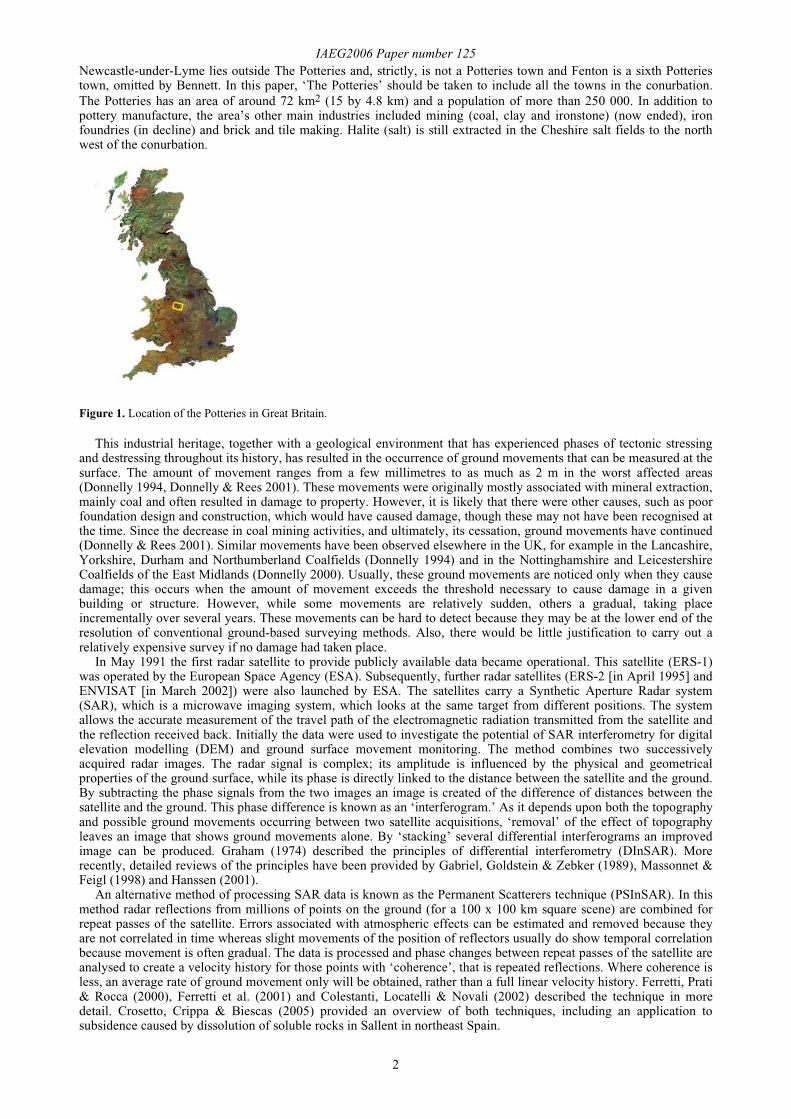
Newcastle-under-Lyme lies outside The Potteries and, strictly, is not a Potteries town and Fenton is a sixth Potteriestown, omitted by Bennett. In this paper, ‘The Potteries’ should be taken to include all the towns in the conurbation.The Potteries has an area of around 72 km2 (15 by 4.8 km) and a population of more than 250 000. In addition topottery manufacture, the area’s other main industries included mining (coal, clay and ironstone) (now ended), ironfoundries (in decline) and brick and tile making. Halite (salt) is still extracted in the Cheshire salt fields to the northwest of the conurbation.
Figure 1. Location of the Potteries in Great Britain.
This industrial heritage, together with a geological environment that has experienced phases of tectonic stressingand destressing throughout its history, has resulted in the occurrence of ground movements that can be measured at thesurface. The amount of movement ranges from a few millimetres to as much as 2 m in the worst affected areas(Donnelly 1994, Donnelly & Rees 2001). These movements were originally mostly associated with mineral extraction,mainly coal and often resulted in damage to property. However, it is likely that there were other causes, such as poorfoundation design and construction, which would have caused damage, though these may not have been recognised atthe time. Since the decrease in coal mining activities, and ultimately, its cessation, ground movements have continued(Donnelly & Rees 2001). Similar movements have been observed elsewhere in the UK, for example in the Lancashire,Yorkshire, Durham and Northumberland Coalfields (Donnelly 1994) and in the Nottinghamshire and LeicestershireCoalfields of the East Midlands (Donnelly 2000). Usually, these ground movements are noticed only when they causedamage; this occurs when the amount of movement exceeds the threshold necessary to cause damage in a givenbuilding or structure. However, while some movements are relatively sudden, others a gradual, taking placeincrementally over several years. These movements can be hard to detect because they may be at the lower end of theresolution of conventional ground-based surveying methods. Also, there would be little justification to carry out arelatively expensive survey if no damage had taken place.
In May 1991 the first radar satellite to provide publicly available data became operational. This satellite (ERS-1)was operated by the European Space Agency (ESA). Subsequently, further radar satellites (ERS-2 [in April 1995] andENVISAT [in March 2002]) were also launched by ESA. The satellites carry a Synthetic Aperture Radar system(SAR), which is a microwave imaging system, which looks at the same target from different positions. The systemallows the accurate measurement of the travel path of the electromagnetic radiation transmitted from the satellite andthe reflection received back. Initially the data were used to investigate the potential of SAR interferometry for digitalelevation modelling (DEM) and ground surface movement monitoring. The method combines two successivelyacquired radar images. The radar signal is complex; its amplitude is influenced by the physical and geometricalproperties of the ground surface, while its phase is directly linked to the distance between the satellite and the ground.By subtracting the phase signals from the two images an image is created of the difference of distances between thesatellite and the ground. This phase difference is known as an ‘interferogram.’ As it depends upon both the topographyand possible ground movements occurring between two satellite acquisitions, ‘removal’ of the effect of topographyleaves an image that shows ground movements alone. By ‘stacking’ several differential interferograms an improvedimage can be produced. Graham (1974) described the principles of differential interferometry (DInSAR). Morerecently, detailed reviews of the principles have been provided by Gabriel, Goldstein & Zebker (1989), Massonnet &Feigl (1998) and Hanssen (2001).
An alternative method of processing SAR data is known as the Permanent Scatterers technique (PSInSAR). In thismethod radar reflections from millions of points on the ground (for a 100 x 100 km square scene) are combined forrepeat passes of the satellite. Errors associated with atmospheric effects can be estimated and removed because theyare not correlated in time whereas slight movements of the position of reflectors usually do show temporal correlationbecause movement is often gradual. The data is processed and phase changes between repeat passes of the satellite areanalysed to create a velocity history for those points with ‘coherence’, that is repeated reflections. Where coherence isless, an average rate of ground movement only will be obtained, rather than a full linear velocity history. Ferretti, Prati& Rocca (2000), Ferretti et al. (2001) and Colestanti, Locatelli & Novali (2002) described the technique in moredetail. Crosetto, Crippa & Biescas (2005) provided an overview of both techniques, including an application tosubsidence caused by dissolution of soluble rocks in Sallent in northeast Spain.
IAEG2006 Paper number 125
3
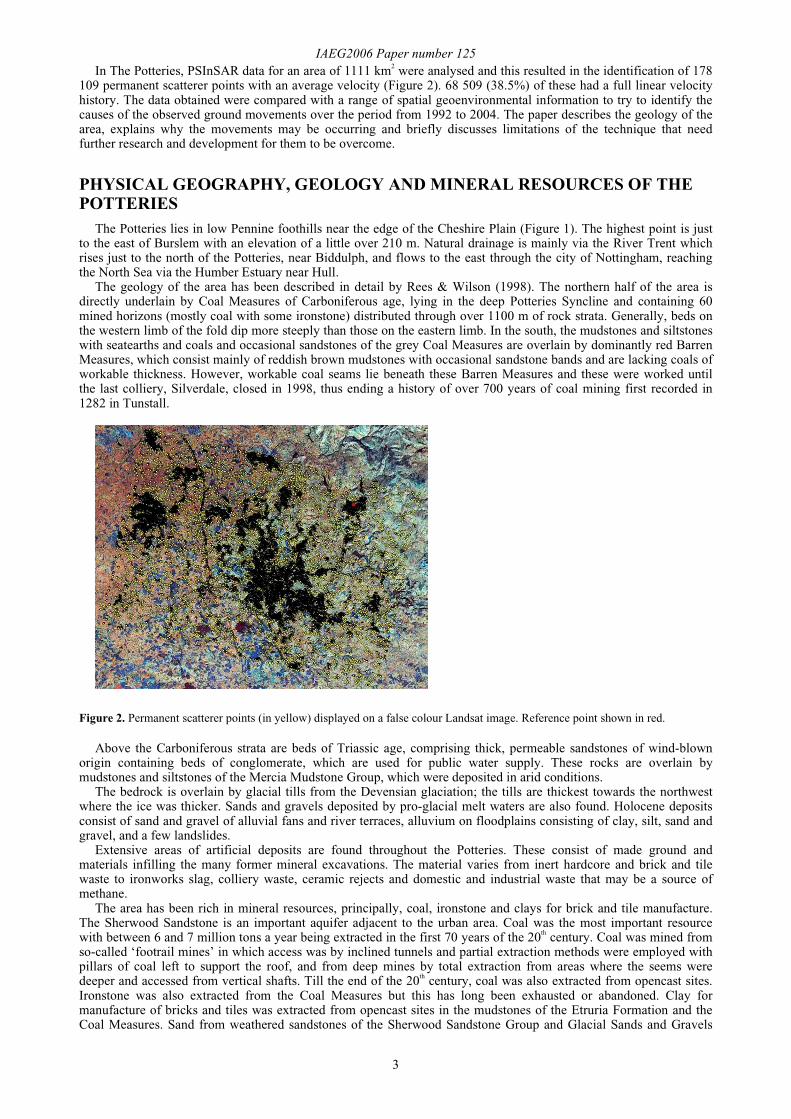
In The Potteries, PSInSAR data for an area of 1111 km2 were analysed and this resulted in the identification of 178109 permanent scatterer points with an average velocity (Figure 2). 68 509 (38.5%) of these had a full linear velocityhistory. The data obtained were compared with a range of spatial geoenvironmental information to try to identify thecauses of the observed ground movements over the period from 1992 to 2004. The paper describes the geology of thearea, explains why the movements may be occurring and briefly discusses limitations of the technique that needfurther research and development for them to be overcome.
PHYSICAL GEOGRAPHY, GEOLOGY AND MINERAL RESOURCES OF THEPOTTERIES
The Potteries lies in low Pennine foothills near the edge of the Cheshire Plain (Figure 1). The highest point is justto the east of Burslem with an elevation of a little over 210 m. Natural drainage is mainly via the River Trent whichrises just to the north of the Potteries, near Biddulph, and flows to the east through the city of Nottingham, reachingthe North Sea via the Humber Estuary near Hull.
The geology of the area has been described in detail by Rees & Wilson (1998). The northern half of the area isdirectly underlain by Coal Measures of Carboniferous age, lying in the deep Potteries Syncline and containing 60mined horizons (mostly coal with some ironstone) distributed through over 1100 m of rock strata. Generally, beds onthe western limb of the fold dip more steeply than those on the eastern limb. In the south, the mudstones and siltstoneswith seatearths and coals and occasional sandstones of the grey Coal Measures are overlain by dominantly red BarrenMeasures, which consist mainly of reddish brown mudstones with occasional sandstone bands and are lacking coals ofworkable thickness. However, workable coal seams lie beneath these Barren Measures and these were worked untilthe last colliery, Silverdale, closed in 1998, thus ending a history of over 700 years of coal mining first recorded in1282 in Tunstall.
Figure 2. Permanent scatterer points (in yellow) displayed on a false colour Landsat image. Reference point shown in red.
Above the Carboniferous strata are beds of Triassic age, comprising thick, permeable sandstones of wind-blownorigin containing beds of conglomerate, which are used for public water supply. These rocks are overlain bymudstones and siltstones of the Mercia Mudstone Group, which were deposited in arid conditions.
The bedrock is overlain by glacial tills from the Devensian glaciation; the tills are thickest towards the northwestwhere the ice was thicker. Sands and gravels deposited by pro-glacial melt waters are also found. Holocene depositsconsist of sand and gravel of alluvial fans and river terraces, alluvium on floodplains consisting of clay, silt, sand andgravel, and a few landslides.
Extensive areas of artificial deposits are found throughout the Potteries. These consist of made ground andmaterials infilling the many former mineral excavations. The material varies from inert hardcore and brick and tilewaste to ironworks slag, colliery waste, ceramic rejects and domestic and industrial waste that may be a source ofmethane.
The area has been rich in mineral resources, principally, coal, ironstone and clays for brick and tile manufacture.The Sherwood Sandstone is an important aquifer adjacent to the urban area. Coal was the most important resourcewith between 6 and 7 million tons a year being extracted in the first 70 years of the 20th century. Coal was mined fromso-called ‘footrail mines’ in which access was by inclined tunnels and partial extraction methods were employed withpillars of coal left to support the roof, and from deep mines by total extraction from areas where the seems weredeeper and accessed from vertical shafts. Till the end of the 20th century, coal was also extracted from opencast sites.Ironstone was also extracted from the Coal Measures but this has long been exhausted or abandoned. Clay formanufacture of bricks and tiles was extracted from opencast sites in the mudstones of the Etruria Formation and theCoal Measures. Sand from weathered sandstones of the Sherwood Sandstone Group and Glacial Sands and Gravels
IAEG2006 Paper number 125
4
are sources of sand and aggregates but are currently little exploited. Methane is drained from several abandoned minesand there has been research in the Potteries into methods of extracting methane from unworked seams.
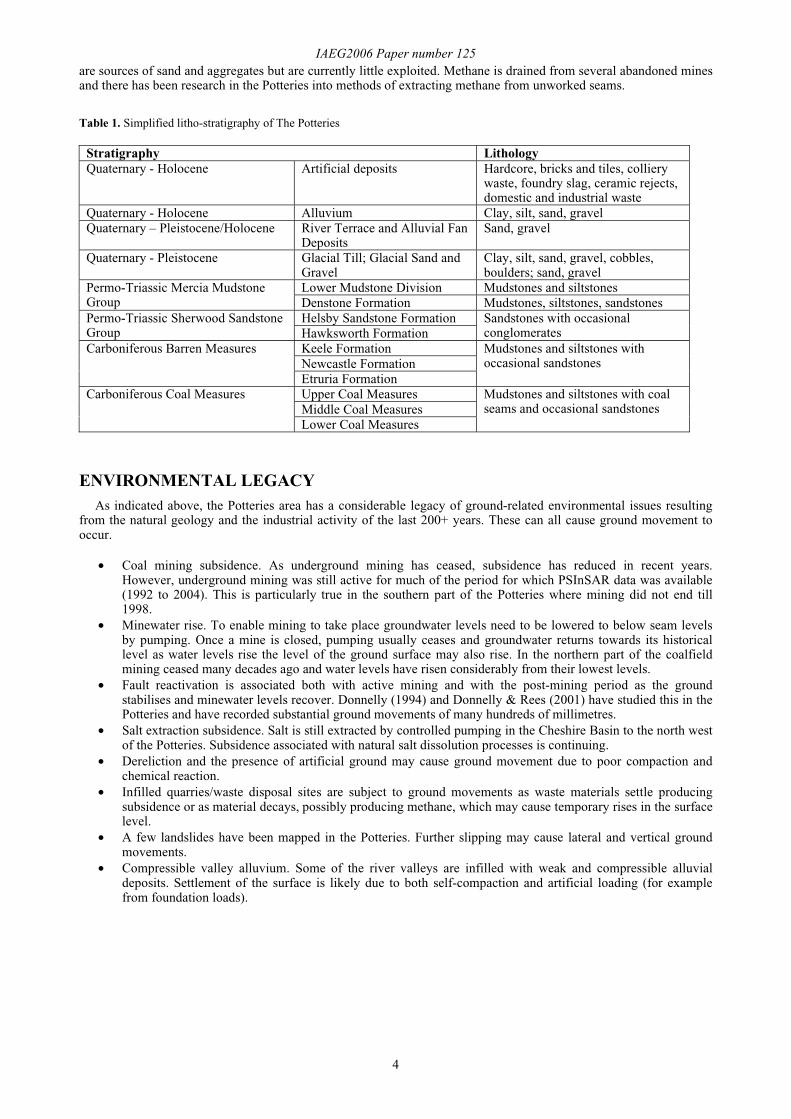
Table 1. Simplified litho-stratigraphy of The Potteries
Stratigraphy LithologyQuaternary - Holocene Artificial deposits Hardcore, bricks and tiles, colliery
waste, foundry slag, ceramic rejects,domestic and industrial waste
Quaternary - Holocene Alluvium Clay, silt, sand, gravelQuaternary – Pleistocene/Holocene River Terrace and Alluvial Fan
DepositsSand, gravel
Quaternary - Pleistocene Glacial Till; Glacial Sand andGravel
Clay, silt, sand, gravel, cobbles,boulders; sand, gravel
Lower Mudstone Division Mudstones and siltstonesPermo-Triassic Mercia MudstoneGroup Denstone Formation Mudstones, siltstones, sandstones
Helsby Sandstone FormationPermo-Triassic Sherwood SandstoneGroup Hawksworth Formation
Sandstones with occasionalconglomerates
Keele FormationNewcastle Formation
Carboniferous Barren Measures
Etruria Formation
Mudstones and siltstones withoccasional sandstones
Upper Coal MeasuresMiddle Coal Measures
Carboniferous Coal Measures
Lower Coal Measures
Mudstones and siltstones with coalseams and occasional sandstones
ENVIRONMENTAL LEGACYAs indicated above, the Potteries area has a considerable legacy of ground-related environmental issues resulting
from the natural geology and the industrial activity of the last 200+ years. These can all cause ground movement tooccur.
• Coal mining subsidence. As underground mining has ceased, subsidence has reduced in recent years.However, underground mining was still active for much of the period for which PSInSAR data was available(1992 to 2004). This is particularly true in the southern part of the Potteries where mining did not end till1998.
• Minewater rise. To enable mining to take place groundwater levels need to be lowered to below seam levelsby pumping. Once a mine is closed, pumping usually ceases and groundwater returns towards its historicallevel as water levels rise the level of the ground surface may also rise. In the northern part of the coalfieldmining ceased many decades ago and water levels have risen considerably from their lowest levels.
• Fault reactivation is associated both with active mining and with the post-mining period as the groundstabilises and minewater levels recover. Donnelly (1994) and Donnelly & Rees (2001) have studied this in thePotteries and have recorded substantial ground movements of many hundreds of millimetres.
• Salt extraction subsidence. Salt is still extracted by controlled pumping in the Cheshire Basin to the north westof the Potteries. Subsidence associated with natural salt dissolution processes is continuing.
• Dereliction and the presence of artificial ground may cause ground movement due to poor compaction andchemical reaction.
• Infilled quarries/waste disposal sites are subject to ground movements as waste materials settle producingsubsidence or as material decays, possibly producing methane, which may cause temporary rises in the surfacelevel.
• A few landslides have been mapped in the Potteries. Further slipping may cause lateral and vertical groundmovements.
• Compressible valley alluvium. Some of the river valleys are infilled with weak and compressible alluvialdeposits. Settlement of the surface is likely due to both self-compaction and artificial loading (for examplefrom foundation loads).
IAEG2006 Paper number 125
5
USE OF PSINSAR DATA FOR GROUND MOVEMENT OBSERVATION IN THEPOTTERIES
PSInSAR processingTwo principal variants of the PSInSAR processing method are available:
• The Standard Permanent Scatterers Analysis (SPSA) method is used for large area applications (minimum 100km2). The method is suitable for mapping urban conurbations and regions, to identify stable areas and tohighlight possible hazardous areas (for example, affected by landslides, subsidence, seismic faults, etc.).Permanent Scatterers (PS) are detected and their average velocity is then estimated by an automatic and cost-effective procedure, allowing the processing of large amounts of data in a short period of time. The methodcan be further streamlined if it is assumed that the ground movement is linear, that is, the rate of movement isfairly constant. Where it is not, non-linear processing should be carried out, but this is more time-consuming.
• The Advanced Permanent Scatterers Analysis (APSA) method is used for high-resolution applications onlimited areas (minimum 1 km2). The method is appropriate for small areas where a full exploitation of theinformation content of the satellite data is required. Typical applications include landslide detection andmonitoring or stability assessment of individual buildings or structures (dams, industrial plants, etc.). It is avery sophisticated and time-consuming analysis, requiring strong interaction with skilled personnel. Theprocedure is specific for each area.
Linear processing using the SPSA method was carried out for the Stoke-on-Trent area.
Interpretation of the PSInSAR dataThe spatial geoenvironmental information compared with the PSInSAR data is listed in Table 2.
Table 2. Spatial information available for comparison with PSInSAR dataMain spatial information type Specific spatial datasetsDigital geology at 1:250,000, 1:50,000 and 1:10,000scale
• Bedrock and superficial deposits geology (1:25,000)• Distribution of borehole and shafts (1:25,000)• Surface Mineral Resources (1:25,000)
Ordnance Survey topographical data, 1:250,000,1:50,000, 1:10,000, 1:2,500 and 1:1,250 scaleNEXTMap elevation data (DEM) (radar derived) • 5-metre cell size elevation dataset with a 1 metre
vertical accuracy, acquired via SAR interferometry.Derived geological data (1:50,000 scale) • Superficial deposits thickness
• Rockhead elevationGeohazard data (1:50,000 scale) • Shrink Swell
• Compressibility• Dissolution• Running Sand• Slope Stability
Engineering geological data (1:25,000 scale orlarger)
• Artificial Ground• Engineering characteristics• Hydrogeology• Undermined areas• Ground stability constraints• Leachate and gas constraints• Fault reactivation
Geophysical data • Magnetics• Gravity
PhD study of Donnelly (1994) • Ground optical surveying data
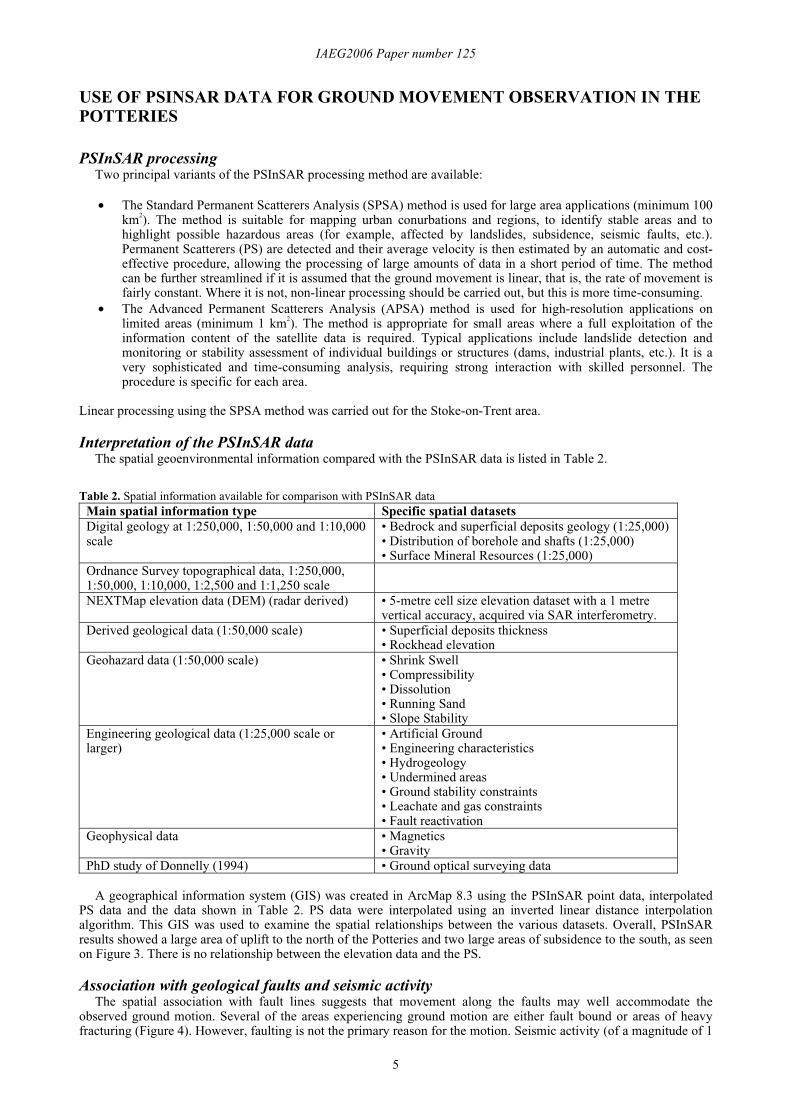
A geographical information system (GIS) was created in ArcMap 8.3 using the PSInSAR point data, interpolatedPS data and the data shown in Table 2. PS data were interpolated using an inverted linear distance interpolationalgorithm. This GIS was used to examine the spatial relationships between the various datasets. Overall, PSInSARresults showed a large area of uplift to the north of the Potteries and two large areas of subsidence to the south, as seenon Figure 3. There is no relationship between the elevation data and the PS.
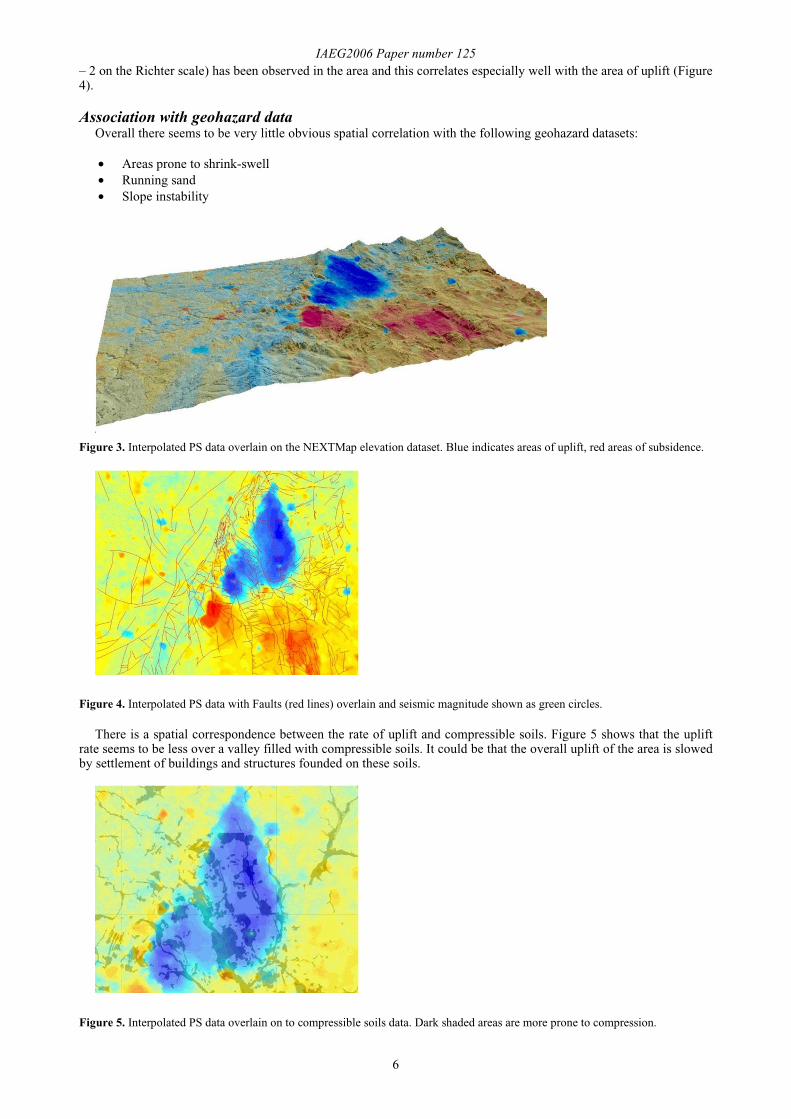
Association with geological faults and seismic activityThe spatial association with fault lines suggests that movement along the faults may well accommodate the
observed ground motion. Several of the areas experiencing ground motion are either fault bound or areas of heavyfracturing (Figure 4). However, faulting is not the primary reason for the motion. Seismic activity (of a magnitude of 1
IAEG2006 Paper number 125
6
– 2 on the Richter scale) has been observed in the area and this correlates especially well with the area of uplift (Figure4).
Association with geohazard dataOverall there seems to be very little obvious spatial correlation with the following geohazard datasets:
• Areas prone to shrink-swell• Running sand• Slope instability
Figure 3. Interpolated PS data overlain on the NEXTMap elevation dataset. Blue indicates areas of uplift, red areas of subsidence.
Figure 4. Interpolated PS data with Faults (red lines) overlain and seismic magnitude shown as green circles.
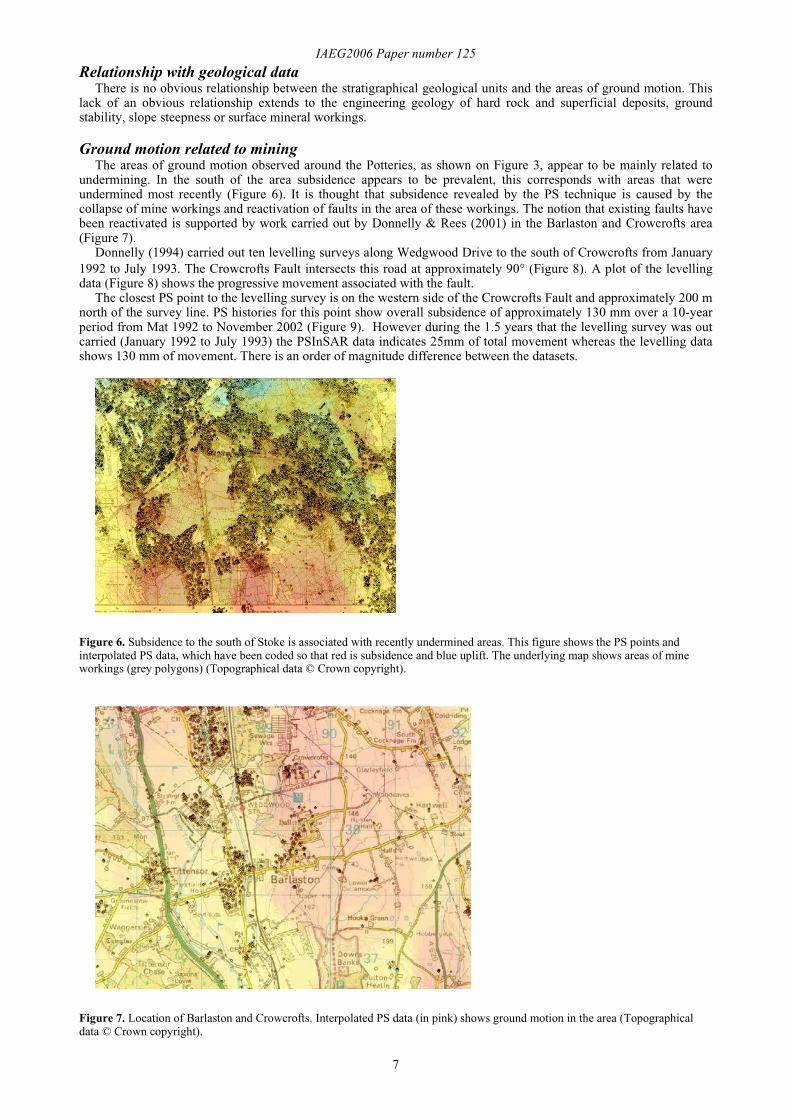
There is a spatial correspondence between the rate of uplift and compressible soils. Figure 5 shows that the upliftrate seems to be less over a valley filled with compressible soils. It could be that the overall uplift of the area is slowedby settlement of buildings and structures founded on these soils.
Figure 5. Interpolated PS data overlain on to compressible soils data. Dark shaded areas are more prone to compression.
IAEG2006 Paper number 125
7
Relationship with geological dataThere is no obvious relationship between the stratigraphical geological units and the areas of ground motion. This
lack of an obvious relationship extends to the engineering geology of hard rock and superficial deposits, groundstability, slope steepness or surface mineral workings.
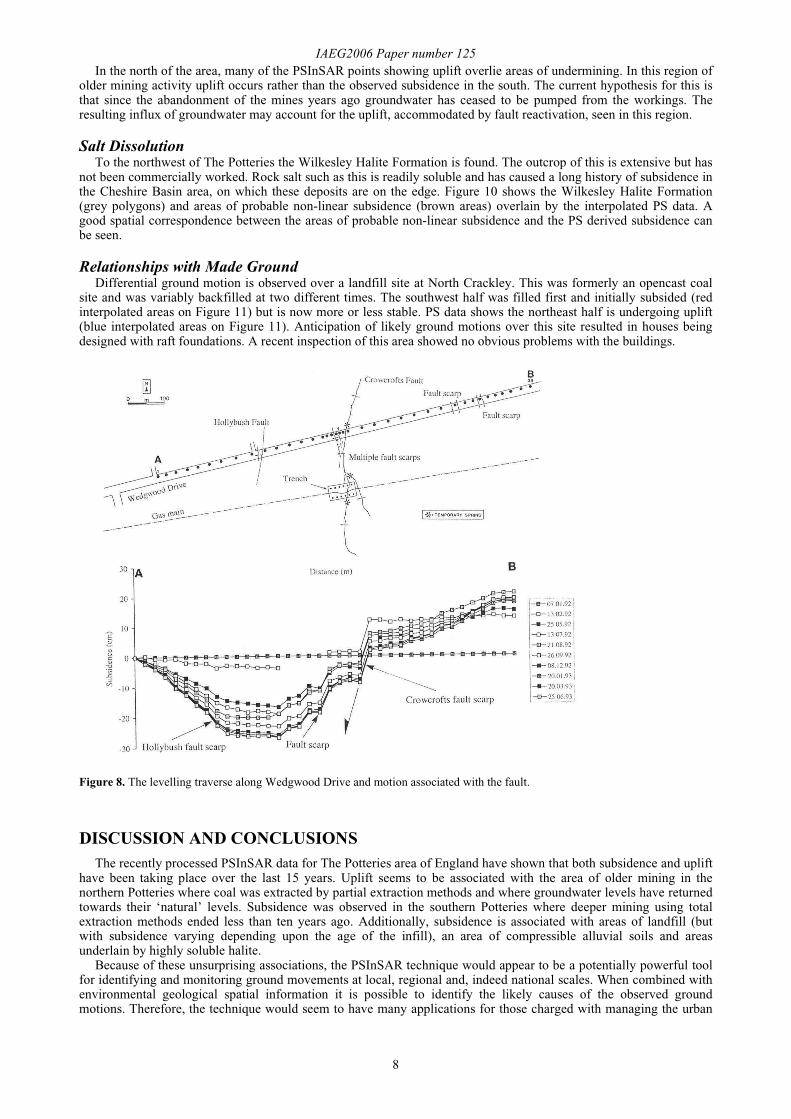
Ground motion related to miningThe areas of ground motion observed around the Potteries, as shown on Figure 3, appear to be mainly related to
undermining. In the south of the area subsidence appears to be prevalent, this corresponds with areas that wereundermined most recently (Figure 6). It is thought that subsidence revealed by the PS technique is caused by thecollapse of mine workings and reactivation of faults in the area of these workings. The notion that existing faults havebeen reactivated is supported by work carried out by Donnelly & Rees (2001) in the Barlaston and Crowcrofts area(Figure 7).
Donnelly (1994) carried out ten levelling surveys along Wedgwood Drive to the south of Crowcrofts from January1992 to July 1993. The Crowcrofts Fault intersects this road at approximately 90° (Figure 8). A plot of the levellingdata (Figure 8) shows the progressive movement associated with the fault.
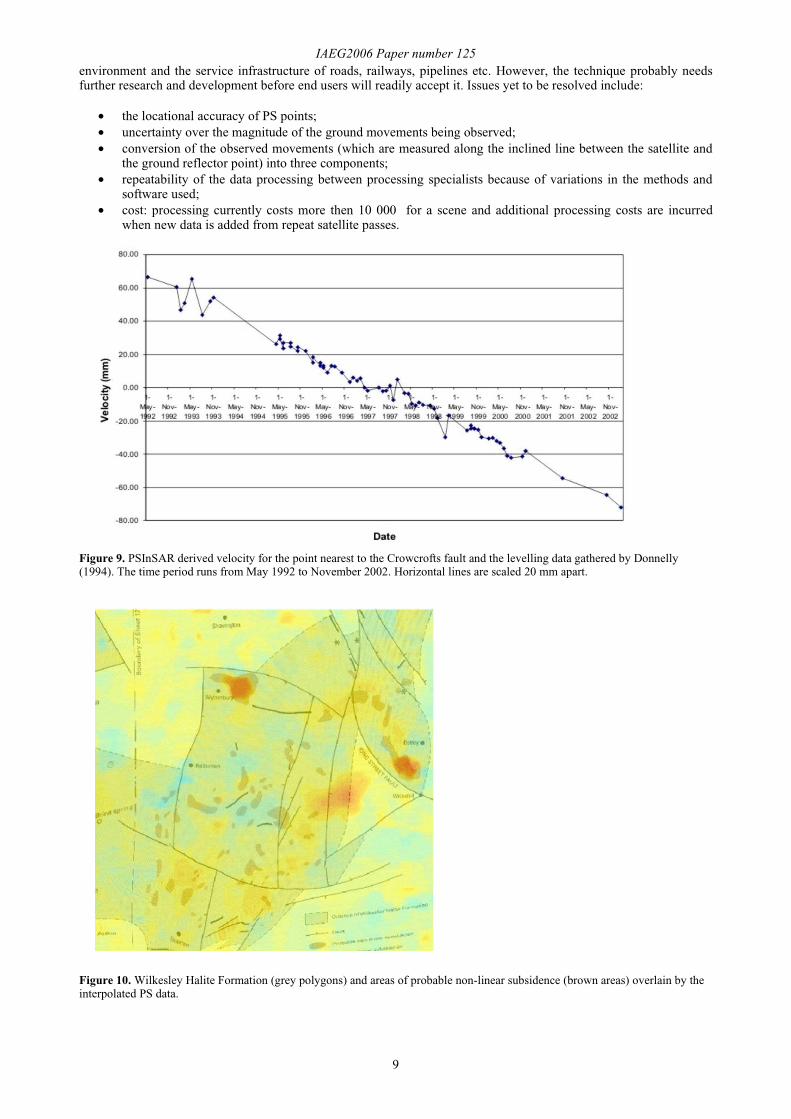
The closest PS point to the levelling survey is on the western side of the Crowcrofts Fault and approximately 200 mnorth of the survey line. PS histories for this point show overall subsidence of approximately 130 mm over a 10-yearperiod from Mat 1992 to November 2002 (Figure 9). However during the 1.5 years that the levelling survey was outcarried (January 1992 to July 1993) the PSInSAR data indicates 25mm of total movement whereas the levelling datashows 130 mm of movement. There is an order of magnitude difference between the datasets.
Figure 6. Subsidence to the south of Stoke is associated with recently undermined areas. This figure shows the PS points andinterpolated PS data, which have been coded so that red is subsidence and blue uplift. The underlying map shows areas of mineworkings (grey polygons) (Topographical data © Crown copyright).
Figure 7. Location of Barlaston and Crowcrofts. Interpolated PS data (in pink) shows ground motion in the area (Topographicaldata © Crown copyright).
IAEG2006 Paper number 125
8
In the north of the area, many of the PSInSAR points showing uplift overlie areas of undermining. In this region ofolder mining activity uplift occurs rather than the observed subsidence in the south. The current hypothesis for this isthat since the abandonment of the mines years ago groundwater has ceased to be pumped from the workings. Theresulting influx of groundwater may account for the uplift, accommodated by fault reactivation, seen in this region.
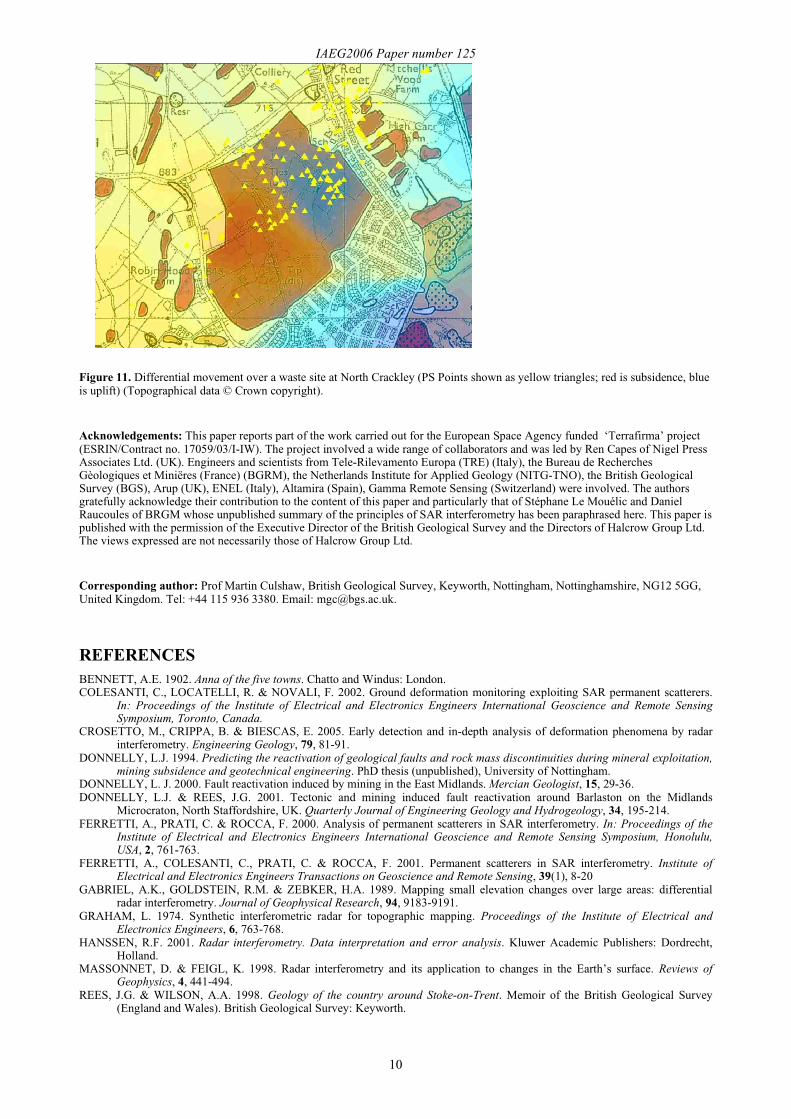
Salt DissolutionTo the northwest of The Potteries the Wilkesley Halite Formation is found. The outcrop of this is extensive but has
not been commercially worked. Rock salt such as this is readily soluble and has caused a long history of subsidence inthe Cheshire Basin area, on which these deposits are on the edge. Figure 10 shows the Wilkesley Halite Formation(grey polygons) and areas of probable non-linear subsidence (brown areas) overlain by the interpolated PS data. Agood spatial correspondence between the areas of probable non-linear subsidence and the PS derived subsidence canbe seen.
Relationships with Made GroundDifferential ground motion is observed over a landfill site at North Crackley. This was formerly an opencast coal
site and was variably backfilled at two different times. The southwest half was filled first and initially subsided (redinterpolated areas on Figure 11) but is now more or less stable. PS data shows the northeast half is undergoing uplift(blue interpolated areas on Figure 11). Anticipation of likely ground motions over this site resulted in houses beingdesigned with raft foundations. A recent inspection of this area showed no obvious problems with the buildings.
Figure 8. The levelling traverse along Wedgwood Drive and motion associated with the fault.
DISCUSSION AND CONCLUSIONSThe recently processed PSInSAR data for The Potteries area of England have shown that both subsidence and uplift
have been taking place over the last 15 years. Uplift seems to be associated with the area of older mining in thenorthern Potteries where coal was extracted by partial extraction methods and where groundwater levels have returnedtowards their ‘natural’ levels. Subsidence was observed in the southern Potteries where deeper mining using totalextraction methods ended less than ten years ago. Additionally, subsidence is associated with areas of landfill (butwith subsidence varying depending upon the age of the infill), an area of compressible alluvial soils and areasunderlain by highly soluble halite.
Because of these unsurprising associations, the PSInSAR technique would appear to be a potentially powerful toolfor identifying and monitoring ground movements at local, regional and, indeed national scales. When combined withenvironmental geological spatial information it is possible to identify the likely causes of the observed groundmotions. Therefore, the technique would seem to have many applications for those charged with managing the urban
IAEG2006 Paper number 125
9
environment and the service infrastructure of roads, railways, pipelines etc. However, the technique probably needsfurther research and development before end users will readily accept it. Issues yet to be resolved include:
• the locational accuracy of PS points;• uncertainty over the magnitude of the ground movements being observed;• conversion of the observed movements (which are measured along the inclined line between the satellite and
the ground reflector point) into three components;• repeatability of the data processing between processing specialists because of variations in the methods and
software used;• cost: processing currently costs more then 10 000 for a scene and additional processing costs are incurred
when new data is added from repeat satellite passes.
Figure 9. PSInSAR derived velocity for the point nearest to the Crowcrofts fault and the levelling data gathered by Donnelly(1994). The time period runs from May 1992 to November 2002. Horizontal lines are scaled 20 mm apart.
Figure 10. Wilkesley Halite Formation (grey polygons) and areas of probable non-linear subsidence (brown areas) overlain by theinterpolated PS data.
IAEG2006 Paper number 125
10
Figure 11. Differential movement over a waste site at North Crackley (PS Points shown as yellow triangles; red is subsidence, blueis uplift) (Topographical data © Crown copyright).
Acknowledgements: This paper reports part of the work carried out for the European Space Agency funded ‘Terrafirma’ project(ESRIN/Contract no. 17059/03/I-IW). The project involved a wide range of collaborators and was led by Ren Capes of Nigel PressAssociates Ltd. (UK). Engineers and scientists from Tele-Rilevamento Europa (TRE) (Italy), the Bureau de RecherchesGèologiques et Miniëres (France) (BGRM), the Netherlands Institute for Applied Geology (NITG-TNO), the British GeologicalSurvey (BGS), Arup (UK), ENEL (Italy), Altamira (Spain), Gamma Remote Sensing (Switzerland) were involved. The authorsgratefully acknowledge their contribution to the content of this paper and particularly that of Stéphane Le Mouélic and DanielRaucoules of BRGM whose unpublished summary of the principles of SAR interferometry has been paraphrased here. This paper ispublished with the permission of the Executive Director of the British Geological Survey and the Directors of Halcrow Group Ltd.The views expressed are not necessarily those of Halcrow Group Ltd.
Corresponding author: Prof Martin Culshaw, British Geological Survey, Keyworth, Nottingham, Nottinghamshire, NG12 5GG,United Kingdom. Tel: +44 115 936 3380. Email: [email protected].
REFERENCESBENNETT, A.E. 1902. Anna of the five towns. Chatto and Windus: London.COLESANTI, C., LOCATELLI, R. & NOVALI, F. 2002. Ground deformation monitoring exploiting SAR permanent scatterers.
In: Proceedings of the Institute of Electrical and Electronics Engineers International Geoscience and Remote SensingSymposium, Toronto, Canada.
CROSETTO, M., CRIPPA, B. & BIESCAS, E. 2005. Early detection and in-depth analysis of deformation phenomena by radarinterferometry. Engineering Geology, 79, 81-91.
DONNELLY, L.J. 1994. Predicting the reactivation of geological faults and rock mass discontinuities during mineral exploitation,mining subsidence and geotechnical engineering. PhD thesis (unpublished), University of Nottingham.
DONNELLY, L. J. 2000. Fault reactivation induced by mining in the East Midlands. Mercian Geologist, 15, 29-36.DONNELLY, L.J. & REES, J.G. 2001. Tectonic and mining induced fault reactivation around Barlaston on the Midlands
Microcraton, North Staffordshire, UK. Quarterly Journal of Engineering Geology and Hydrogeology, 34, 195-214.FERRETTI, A., PRATI, C. & ROCCA, F. 2000. Analysis of permanent scatterers in SAR interferometry. In: Proceedings of the
Institute of Electrical and Electronics Engineers International Geoscience and Remote Sensing Symposium, Honolulu,USA, 2, 761-763.
FERRETTI, A., COLESANTI, C., PRATI, C. & ROCCA, F. 2001. Permanent scatterers in SAR interferometry. Institute ofElectrical and Electronics Engineers Transactions on Geoscience and Remote Sensing, 39(1), 8-20
GABRIEL, A.K., GOLDSTEIN, R.M. & ZEBKER, H.A. 1989. Mapping small elevation changes over large areas: differentialradar interferometry. Journal of Geophysical Research, 94, 9183-9191.
GRAHAM, L. 1974. Synthetic interferometric radar for topographic mapping. Proceedings of the Institute of Electrical andElectronics Engineers, 6, 763-768.
HANSSEN, R.F. 2001. Radar interferometry. Data interpretation and error analysis. Kluwer Academic Publishers: Dordrecht,Holland.
MASSONNET, D. & FEIGL, K. 1998. Radar interferometry and its application to changes in the Earth’s surface. Reviews ofGeophysics, 4, 441-494.
REES, J.G. & WILSON, A.A. 1998. Geology of the country around Stoke-on-Trent. Memoir of the British Geological Survey(England and Wales). British Geological Survey: Keyworth.