Model track studies on fouled ballast using ground penetrating radar and multichannel analysis of...
10
Model track studies on fouled ballast using ground penetrating radar and multichannel analysis of surface wave P. Anbazhagan a, ⁎ , 1 , Su Lijun b, c, 1 , Indraratna Buddhima c, 2 , Rujikiatkamjorn Cholachat c a Department of Civil Engineering, Indian Institute of Science, Bangalore, 560012, India b School of Civil Engineering, Xi'an University of Architecture & Technology, Xi'an Shaanxi 710055 PR China c Faculty of Engineering, University of Wollongong, Wollongong, NSW 2522, Australia abstract article info Article history: Received 26 March 2010 Accepted 8 May 2011 Available online 26 May 2011 Keywords: Ballast Fouling GPR Seismic surface-wave survey Shear wave velocity Ballast fouling is created by the breakdown of aggregates or outside contamination by coal dust from coal trains, or from soil intrusion beneath rail track. Due to ballast fouling, the conditions of rail track can be deteriorated considerably depending on the type of fouling material and the degree of fouling. So far there is no comprehensive guideline available to identify the critical degree of fouling for different types of fouling materials. This paper presents the identification of degree of fouling and types of fouling using non- destructive testing, namely seismic surface-wave and ground penetrating radar (GPR) survey. To understand this, a model rail track with different degree of fouling has been constructed in Civil engineering laboratory, University of Wollongong, Australia. Shear wave velocity obtained from seismic survey has been employed to identify the degree of fouling and types of fouling material. It is found that shear wave velocity of fouled ballast increases initially, reaches optimum fouling point (OFP), and decreases when the fouling increases. The degree of fouling corresponding after which the shear wave velocity of fouled ballast will be smaller than that of clean ballast is called the critical fouling point (CFP). Ground penetrating radar with four different ground coupled antennas (500 MHz, 800 MHz, 1.6 GHz and 2.3 GHz) was also used to identify the ballast fouling condition. It is found that the 800 MHz ground coupled antenna gives a better signal in assessing the ballast fouling condition. Seismic survey is relatively slow when compared to GPR survey however it gives quantifiable results. In contrast, GPR survey is faster and better in estimating the depth of fouling. © 2011 Elsevier B.V. All rights reserved. 1. Introduction Railways are the massive means of transport in all countries to carry goods as well as passengers. The important component in railway is rail track, which consists of two parallel steel rails, anchored on perpendicular sleepers, these rails and sleepers being placed on a foundation. The foundation is normally compressed soil, on top of which a bed of ballast (aggregates) to distribute the load from the sleepers to the capping layers and formation soils. A ballast bed performs two major roles in the railway network, i.e., drainage and load bearing capacity. Rail ballast comprises of uniformly-graded coarse aggregates, produced from crushing locally available rocks such as granite, basalt, limestone, slag or gravel. During the operation, ballast fouling can take place due to ballast breakdown, infiltration of other materials from ballast surface or from base of ballast layer by filling of its voids. Major fouling reported worldwide is attributed to the breakdown of ballast (fine ballast), outside contamination by coal dust from trains carrying coal and due to soil intrusions from the base. Fouled ballast can cause the following major problems. i. Reduction in vertical (including uplift), lateral and longitudinal forces applied to the sleepers to retain the track in its required position. ii. Decrease in resilient modulus/strength and energy absorption capacity iii. Reduction in the voids space thereby leading to a considerable decrease in the movement of particles through the ballast. iv. Poor drainage of water falling onto track v. Vegetation growth in the rail track vi. Increased noise level and vii. Inadequate electrical resistance between rails. Therefore evaluation of the degree of fouling is necessary to ensure the optimum maintenance cycle thereby increasing track stability. The measures which are widely used to determine the fouling quantities are Fouling Index, Percentage of Fouling, D-Bar method, Journal of Applied Geophysics 74 (2011) 175–184 ⁎ Corresponding author. Tel.: + 91 80 22932467; fax: + 91 80 23600404. E-mail addresses: [email protected], [email protected], [email protected] (P. Anbazhagan), [email protected] (S. Lijun), [email protected] (I. Buddhima), [email protected] (R. Cholachat). URL: http://civil.iisc.ernet.in/~anbazhagan/ (P. Anbazhagan). 1 The first two authors have contributed equally to this paper. 2 Tel.: +61 2 4221 3046. 0926-9851/$ – see front matter © 2011 Elsevier B.V. All rights reserved. doi:10.1016/j.jappgeo.2011.05.002 Contents lists available at ScienceDirect Journal of Applied Geophysics journal homepage: www.elsevier.com/locate/jappgeo
Transcript of Model track studies on fouled ballast using ground penetrating radar and multichannel analysis of...

Journal of Applied Geophysics 74 (2011) 175–184
Contents lists available at ScienceDirect
Journal of Applied Geophysics
j ourna l homepage: www.e lsev ie r.com/ locate / jappgeo
Model track studies on fouled ballast using ground penetrating radar andmultichannel analysis of surface wave
P. Anbazhagan a,⁎,1, Su Lijun b,c,1, Indraratna Buddhima c,2, Rujikiatkamjorn Cholachat c
a Department of Civil Engineering, Indian Institute of Science, Bangalore, 560012, Indiab School of Civil Engineering, Xi'an University of Architecture & Technology, Xi'an Shaanxi 710055 PR Chinac Faculty of Engineering, University of Wollongong, Wollongong, NSW 2522, Australia
⁎ Corresponding author. Tel.: +91 80 22932467; fax:E-mail addresses: [email protected], anb
[email protected] (P. Anbazhagan), lijun@[email protected] (I. Buddhima), [email protected]
URL: http://civil.iisc.ernet.in/~anbazhagan/ (P. Anba1 The first two authors have contributed equally to th2 Tel.: +61 2 4221 3046.
0926-9851/$ – see front matter © 2011 Elsevier B.V. Aldoi:10.1016/j.jappgeo.2011.05.002
a b s t r a c t
a r t i c l e i n f oArticle history:Received 26 March 2010Accepted 8 May 2011Available online 26 May 2011
Keywords:BallastFoulingGPRSeismic surface-wave surveyShear wave velocity
Ballast fouling is created by the breakdown of aggregates or outside contamination by coal dust from coaltrains, or from soil intrusion beneath rail track. Due to ballast fouling, the conditions of rail track can bedeteriorated considerably depending on the type of fouling material and the degree of fouling. So far there isno comprehensive guideline available to identify the critical degree of fouling for different types of foulingmaterials. This paper presents the identification of degree of fouling and types of fouling using non-destructive testing, namely seismic surface-wave and ground penetrating radar (GPR) survey. To understandthis, a model rail track with different degree of fouling has been constructed in Civil engineering laboratory,University of Wollongong, Australia. Shear wave velocity obtained from seismic survey has been employed toidentify the degree of fouling and types of fouling material. It is found that shear wave velocity of fouledballast increases initially, reaches optimum fouling point (OFP), and decreases when the fouling increases. Thedegree of fouling corresponding after which the shear wave velocity of fouled ballast will be smaller than thatof clean ballast is called the critical fouling point (CFP). Ground penetrating radar with four different groundcoupled antennas (500 MHz, 800 MHz, 1.6 GHz and 2.3 GHz) was also used to identify the ballast foulingcondition. It is found that the 800 MHz ground coupled antenna gives a better signal in assessing the ballastfouling condition. Seismic survey is relatively slow when compared to GPR survey however it givesquantifiable results. In contrast, GPR survey is faster and better in estimating the depth of fouling.
+91 80 [email protected],w.edu.au (S. Lijun),(R. Cholachat).
zhagan).is paper.
l rights reserved.
© 2011 Elsevier B.V. All rights reserved.
1. Introduction
Railways are the massive means of transport in all countries tocarry goods as well as passengers. The important component inrailway is rail track, which consists of two parallel steel rails, anchoredon perpendicular sleepers, these rails and sleepers being placed on afoundation. The foundation is normally compressed soil, on top ofwhich a bed of ballast (aggregates) to distribute the load from thesleepers to the capping layers and formation soils. A ballast bedperforms two major roles in the railway network, i.e., drainage andload bearing capacity. Rail ballast comprises of uniformly-gradedcoarse aggregates, produced from crushing locally available rockssuch as granite, basalt, limestone, slag or gravel. During the operation,ballast fouling can take place due to ballast breakdown, infiltration of
other materials from ballast surface or from base of ballast layer byfilling of its voids. Major fouling reported worldwide is attributed tothe breakdown of ballast (fine ballast), outside contamination by coaldust from trains carrying coal and due to soil intrusions from the base.Fouled ballast can cause the following major problems.
i. Reduction in vertical (including uplift), lateral and longitudinalforces applied to the sleepers to retain the track in its requiredposition.
ii. Decrease in resilient modulus/strength and energy absorptioncapacity
iii. Reduction in the voids space thereby leading to a considerabledecrease in the movement of particles through the ballast.
iv. Poor drainage of water falling onto trackv. Vegetation growth in the rail trackvi. Increased noise level andvii. Inadequate electrical resistance between rails.
Therefore evaluation of the degree of fouling is necessary to ensurethe optimum maintenance cycle thereby increasing track stability.The measures which are widely used to determine the foulingquantities are Fouling Index, Percentage of Fouling, D-Bar method,

176 P. Anbazhagan et al. / Journal of Applied Geophysics 74 (2011) 175–184
Percentage Void Contamination and Relative Ballast Fouling Ratio. Thefirst three measures are commonly used; the fourth one is introducedby Queensland Rail (Feldman and Nissen, 2002) and the last one wasrecently developed by Indraratna et al.(2011). These methods arelaboratory based and require field sampling and testing, which arenormally carried out by digging trenches at even intervals; howeverthese processes require a lot of resources (i.e. time, money and manpower). Non-destructive testing of ground penetrating radar, infra-red imaging, seismic survey and electrical resistivity are popularamong others for fouling identification in the field (Anbazhagan et al.,2010). However none of the testing method has been quantified toassess the critical degree of fouling. To address these issues, this studypresents 1) construction technique of model rail tracks with variousdegree of fouling for different types of fouling materials, 2) estimationof low strain shear wave velocity using seismic surface-wave survey,3) identification of degree of fouling and ballast thickness by groundpenetrating radar, 4) comparing the seismic surface-wave survey andGPR results, and 5) identification of critical degree of fouling based onthe low strain shear wave velocity.
2. Materials and fouling measures
A model track was composed of four different fouling conditions,namely, clean ballast (CB), ballast fouled with fine ballast/pulverizedrock (FB), ballast fouled with coal (C) and ballast fouled with clayeysand (CS). The gradation of the clean ballast was selected within theupper and lower gradations recommended by the AustralianStandards (AS, 2758.7, 1996). The gradation of materials used inthis study is shown in Fig. 1; clean ballast are course aggregateshaving a minimum particle size of 9.5 mm and maximum size of62 mm. Fouling materials of pulverized rock, coal and clayey sandhave a maximum particle size of 9.5 mm.
Fouling conditions are measured using five methods.These areFouling Index, Percentage of Fouling, D-Bar method, Percentage VoidContamination and Relative Ballast Fouling Ratio. The Fouling Index(FI) can be calculated by the dry weight of fine particles. The FoulingIndex is the sum of the percentage of fine particles passing the4.75 mm sieve and the 75 micron sieve. D-Bar is a number thatrepresents the weighted geometric average of particle sizes passingthrough grading sieves from a full sample. A fresh ballast has a typicalD-Bar=36.0 mm and ballast is deemed to need replacement when D-Bar=10 mm. The percentage of fouling (% fouling) is the ratio of thedry weight of material passing 9.5 mm sieve to the dry weight of totalsample (Selig and Waters, 1994). The FI, D-bar and percentage offouling provide the same result although the specific gravities aretotally different. To overcome this issue, volume based method hasbeen developed by Feldman and Nissen(2002) called Percentage of
0
10
20
30
40
50
60
70
80
90
100
0.01 0.10 1.00 10.00 100.00
Particle size (mm)
Per
cent
age
of p
assi
ng (
%) Clean ballast
Fine ballast
Coal
Sandy clay
Fig. 1. The gradation of materials used to construct model track.
Void Contamination (PVC). PVC is a ratio between void volume in theballast particles and volume of fouling particles passing 9.5 mm sieve.This was further modified to consider the difference in specific gravityof various materials such as clay and coal. Relative Ballast FoulingRatio (Rbf) can be defined as a weighted ratio of the dry weight offouling particles (passing 9.5 mm sieve) to the dry weight of ballast(particles retaining on 9.5 mm sieve) by Indraratna et al.(2011).
The relative ballast fouling ratio (Rbf) can be defined as:
Rbf =Mf ×
GsbGsf
Mb× 100% ð1Þ
where, Mf and Mb, and Gsf and Gsb are mass and specific gravities offoulingmaterials and ballast respectively. Fig. 2 shows the relationshipsbetween FI and percentage of fouling and Rbf. In this study the fouledsectionswere built by varying the percentage of fouling and the RelativeBallast Fouling Ratio. The ratio between the weight of clean ballast andfoulingmaterials was chosen to result in an Rbf of 10% (% fouling of 4.94and 8.75 for coal and clayey sand), 25% (% fouling of 11.5, 19.35 and 20for coal, clayey sand and fine ballast), and 50% (% fouling of 20.64 and32.43 for coal and clayey sand). The thicknessof fouledpart of the ballastand the Rbf for each section are listed in Table 1. Design and constructionof the model track and preparation of fouled sections are discussed inthe next section.
3. Construction of model track
A section of full scale railway track has been built in the CivilEngineering Laboratory, University of Wollongong for this study. Themodel track has all of the components of a railway track system,including subgrade, capping layer, and ballast (clean/fouled). Noloading tests will be carried out on themodel track. Hence the boxwasconstructed with two layers of plywood boards. The outer layer is of18 mm thick plywood boards and the inner layer is of 12 mm thickmarine plywood boards which are water resistant. At the bottom ofthe box, PVC pipes were placed above the membrane for saturatingthe track for further studies. The box was strengthened with timberbracings to increase the stiffness of the side walls. Fig. 3 shows severalphotos of the box showing almost all of its details. The internaldimensions of the box are 4.76 m in length, 3.48 m in width, and0.79 m in height. The track is formed by a subgrade layer of clayeysand, a capping layer of road base material and a ballast layer. Thethicknesses of these layers were 15 cm for the subgrade, 15 cm for thecapping layer and 49 cm for the ballast, respectively. Geotextile and
0
10
20
30
40
50
0 5 10 15 20 25 30 35
Fouling Index
Rel
ativ
e ba
llast
fou
ling
rati
o (R
BF
R)
0
5
10
15
20
25
30
35P
erce
ntag
e of
fou
ling
(PoF
)
PoF-Coal fouled BallastRBFR-Sandy clay fouled ballastPoF-Sandy clay fouled ballastRBFR-Coal fouled Ballast
Fig. 2. Relationships between fouling index to percentage fouling and relative ballastfouling ratio for coal and sandy clay fouled ballast.

Table 1Details for the sub-sections.
Types of fouling Thickness offouled part (cm)
Relative ballastfouling ratio
Section 1 Coal 15 10%Section 2 Coal 20 25%Section 3 Ballast breakdown 27 25%Section 4 Clayey sand 27 25%Section 5 Clayey sand 20 10%Section 6 Clean N/A N/ASection 7 Clayey sand 20 50%Section 8 Clean N/A N/ASection 9 Coal 20 50%
177P. Anbazhagan et al. / Journal of Applied Geophysics 74 (2011) 175–184
Geogrids were placed between the subgrade and capping layer. RadarDetectable Geotextile was placed on top of the capping layer at the rightside of the box along the longitudinal direction to highlight the interfacebetween the ballast and the capping layer. Fig. 4a and b shows the crosssection across and along themodel track. All the dimensions in the graphsare in centimeters. The subgrade and capping were compacted andcombined using a handheld vibrating compactor. Even though sectionsshow up to top of rail, in this studyMASW and GPR surveys were carriedoutbeforeplacing the sleeper and rails i.e. the total sectionheight is57 cm.
The clean and fouled ballast were placed layer by layer having athickness of 4–6 cm and compacted using handheld vibrating plate.During compaction, plywoodboardswere inserted between2 sections aspartitions to secure a distinct vertical interface between adjacentsections. A layer of Geotextile was placed between adjacent sections toprevent fouling materials flowing from one section to another especiallywhenwatering the ballast. Two long timber barswith notcheswere usedto fix the partitions. Clean sections of ballast (6 and 8) were built bycompacting equal layers using a hand-held vibrating plate. The dense
Bracings
Membrane
Radar detectable Geotextile
Drainage pipes
Pipes for measuringmoisture content
Fig. 3. Details of th
clean ballast in section 8was built by usingmore layers than in section 6.The fouled sub-sections were prepared by following two differentmethods. From sections 1 to 5, the fouling materials were added to thetop of clean ballast before the compaction. During the preparation, alayer of clean ballast was firstly placed in the section, and then thecorresponding fouling material calculated according to a certain Rbfvalue (Table 1) and spread uniformly on the ballast surface. After that,the ballast together with the fouling material was compacted using ahand-held vibrating plate. For sections 7 and 9, by considering thevolume of fouling materials, the ballast and fouling materials weremixed together using a concrete mixer and then compacted in thesections layer by layer as above.
4. Seismic surface-wave survey
A number of seismic methods have been proposed for near-surfacecharacterization and measurement of shear wave velocity using a greatvariety of testing configurations, processing techniques, and inversionalgorithms. The most widely used techniques are Spectral Analysis ofSurface Waves (SASW) and Multichannel Analysis of Surface Waves(MASW). The SASW method has been used for subsurface investigationfor several decades (Al-Hunaidi, 1992; Ganji et al., 1997; Nazarian et al.,1983; Stokoeet al., 1994;Tokimatsu, 1995). In SASWmethod, the spectralanalysis was conducted on a surface wave generated by an impulsivesource and recorded by a pair of receivers. MASW is the improved newtechnique by incorporating a multichannel analysis of surface wavesusing active sources (Park et al., 1999;Xia et al., 1999; Xu et al., 2006). TheMASW has been found to be a more efficient method for unraveling theshallow subsurface properties (Anbazhagan and Sitharam, 2008a; Park etal., 1999; Zhang et al., 2004). MASW is increasingly being applied toearthquake geotechnical engineering for seismic microzonation and siteresponse studies (Anbazhagan and Sitharam, 2008b; Anbazhagan and
Saturation pipes
Saturation water supply
Connection of drainage
e model track.

5614821260
476
5650 604030606060 60
79 49
15
15
Saturation pipes
1 2 3 4 5 6 7 8 9
(b)
Saturation pipe
Saturation water
79 49
15
15
495049 50 348150
Drainage pipes(a)
Radar detectable Geotextile
Fig. 4. Schematic diagrams of the model track: (a) cross section across the rail direction and (b) longitudinal section along rail direction (dimensions: cm).
178 P. Anbazhagan et al. / Journal of Applied Geophysics 74 (2011) 175–184
Sitharam, 2008c; Anbazhagan and Sitharam, 2009). In particular, theMASW is used in geotechnical engineering for themeasurement of shearwave velocity and dynamic properties (Sitharam and Anbazhagan, 2008;Anbazhagan and Sitharam, 2008d), identification of subsurface materialboundaries and spatial variations of shear wave velocity (Anbazhaganand Sitharam, 2009).
MASWsystem consisting of 24 channels SmartSeis seismographwith12 geophones of 10 Hz capacity was used. The seismic waves werecreatedby impulsive sourceof 1 kg sledgehammerwith70 mm×70 mmsize aluminum plate with a number of shots. MASW survey was carriedout by arranging 12 geophones parallel to the y axis along sections 1–9(Fig. 4b). Different source to receiver distance and geophone spacing areinvestigated, and a good signal was obtained for a geophone spacing of0.25 m and source to first receiver spacing of 0.5 m. This configurationwas used to survey all the sections, and was similar to hard material(pavement) mapping field configuration (Anbazhagan and Sitharam,2008d). Each section was surveyed three times and the seismic signalswere recorded at a sampling interval of 0.125 ms and record length of256 ms (Anbazhagan et al., 2010).
Fig. 5. Dispersion curve
4.1. Dispersion curve and shear wave velocity
A dispersion curve is generally displayed as a function of phasevelocity versus frequency. Phase velocity canbe calculated fromthe linearslope of each component on the swept-frequency record. The shorterwavelengths are sensitive to the physical properties of surface layers (Xiaet al., 1999). For this reason, a particular mode of surface wave willpossess a unique phase velocity for each unique wavelength, leading tothedispersionof the seismic signal. For amulti-layered subsurfacemodel,Rayleigh-wave dispersion curves can be calculated by Knopoff's method(Schwab and Knopoff, 1972). Rayleigh-wave phase velocity, cRj, isdetermined by a characteristic equation F in its nonlinear, implicit form:
F fj; cRj; vs; vp;ρ; h� �
= 0 j = 1; 2; :::::::;mð Þ ð2Þ
where fj is the frequency, in Hz; cRj is the Rayleigh-wave phasevelocity at frequency fj; vs=(vs1, vs2,…, vsn)T is the S-wave velocityvector, with vsi the shear-wave velocity of the ith layer; n is the
Dispersion curve
Signal to noise ratio
of ballast sections.

Vs
DC
S/N
Loosely packed ballast
Densely packed ballast
Capping layer
Sub grade soil
Concrete floor
Top surface of ballast section
Vs
S/N
Fig. 6. A typical shear wave velocity (Vs) of section 8 with sectional profile. Legend Vs— shear wave velocity, Department of Civil Engineering— Dispersion curve and S/N— signal tonoise ratio.
100
120
140
160
0 5 10 15 20 25 30 35 40 45 50
Relative ballast fouling ratio (%)
Shea
r w
ave
velo
city
(m
/s)
Fouled by sandy clayFouled by coalClean+fine ballastDense clean ballast
Fig. 7. Shear wave velocity of clean and fouled ballast.
179P. Anbazhagan et al. / Journal of Applied Geophysics 74 (2011) 175–184
number of layers; vp=(vp1, vp2,…, vpn)T is the compressive P-wavevelocity vector, with vpi the P-wave velocity of the ith layer; ρ=(ρ1,ρ2, . . ., ρn)T is the density vector, with ρi the density of the ith layer;and h=(h1, h2,…, hn− 1)T is the thickness vector, with hi thethickness of the ith layer. Given a set of model parameters (vs, vp,ρ, and h) and a specific frequency (fj), the roots of Eq. (2) are thephase velocities. If the dispersion curve consists of m data points, aset of m equations in the form of Eq. (1) can be used to find phasevelocities at frequencies fj (j=1, 2,…,m) using the bisectionmethod (Press et al., 1992); (Xia et al., 1999). In this study, onlythe fundamental mode is considered. The lowest analyzablefrequency in this dispersion curve is around 10 Hz and highestfrequency is 90 Hz. A typical dispersion curve along with signalamplitude and signal to noise ratio is shown in Fig. 5.
Shear wave velocity can be derived from inverting the dispersivephase velocity of the surface (Rayleigh and/or Love) wave (Aki andRichards, 1980; Dorman and Ewing, 1962; Mari, 1984; Xia et al.,1999). Shear wave velocity profile was calculated using an iterativeinversion process that requires the dispersion curve developed earlieras input. A least-squares approach allows automation of the process(Xia et al., 1999). S-wave velocities of each layer can be represented asthe elements of a vector x of length n, or x=[vs1, vs2, vs3,…, vsn]T .Similarly, the measurements (data) of Rayleigh-wave phase velocitiesatmdifferent frequencies can be represented as the elements of a vectorb of lengthm, or b=[b1, b2, b3,…, bm]T. Since the model cR [Eq. (2)] is a
nonlinear function, Eq. (1) must be linearized by Taylor-seriesexpansion to employ the matrix theory:
JΔΧ = Δb ð3Þ
whereΔb=b−cR(x0) and is the difference between measured dataand model response to the initial estimation, in which cR(x0) is themodel response to the initial S-wave velocity estimates, X0; ΔX is a
10 20 30 40 50100
110
120
130
140
150
0
Relative ballast fouling ratio
Vs
of c
oal f
oule
d ba
llast
(m
/s)
120
125
130
135
140
145
150
Vs
of s
andy
cla
y fo
uled
bal
last
(m
/s)
Coal fouled ballast - C
Sandy clay fouled ballast - SC
OFP-C
OFP-SC
Clean ballast
Clean ballast CFP-C
CFP-SC
OFP-Optimum Fouling Point
CFP-Critical Fouling Point
Fig. 8. Optimum and critical degree of fouling for sandy clay and coal fouled ballast.
180 P. Anbazhagan et al. / Journal of Applied Geophysics 74 (2011) 175–184
modification of the initial estimation; and J is the Jacobianmatrix withm rows and n columns (mNn). The elements of the Jacobianmatrix arethe first-order partial derivatives of cR with respect to S-wavevelocities. Since the number of data points contained in the dispersioncurve is generally much larger than the number of layers used todefine the subsurface (mNn), Eq. (2) is usually solved by optimizationtechniques. The objective function can be defined as
Φ = ‖ JΔΧ−Δb‖2W‖ JΔΧ−Δb‖2 + α‖ΔΧ‖22 ð4Þ
where ‖‖2 is the l2-norm length of a vector, α is the damping factor,and W is a weighting matrix. This is a constrained (weighted) least-squares problem. More details about the sensitivity of eachparameter and calculation with respective examples are detailedin (Xia et al., 1999). Shear wave velocities of each location wereinverted from respective dispersion curves. Typical shear wavevelocity profile obtained for section 8 is shown in Fig. 6 and theinterpretation will be presented in the next section. Ballastthickness is obtained from MASW by using 20 layer models,which are comparable with model section layers.
4.2. Clean and fouled ballast Vs
Shear wave velocities for sections 1–9 were determined byaveraging three sets of data, having a standard deviation of lessthan 9. The study shows that the average shear wave velocity of clean
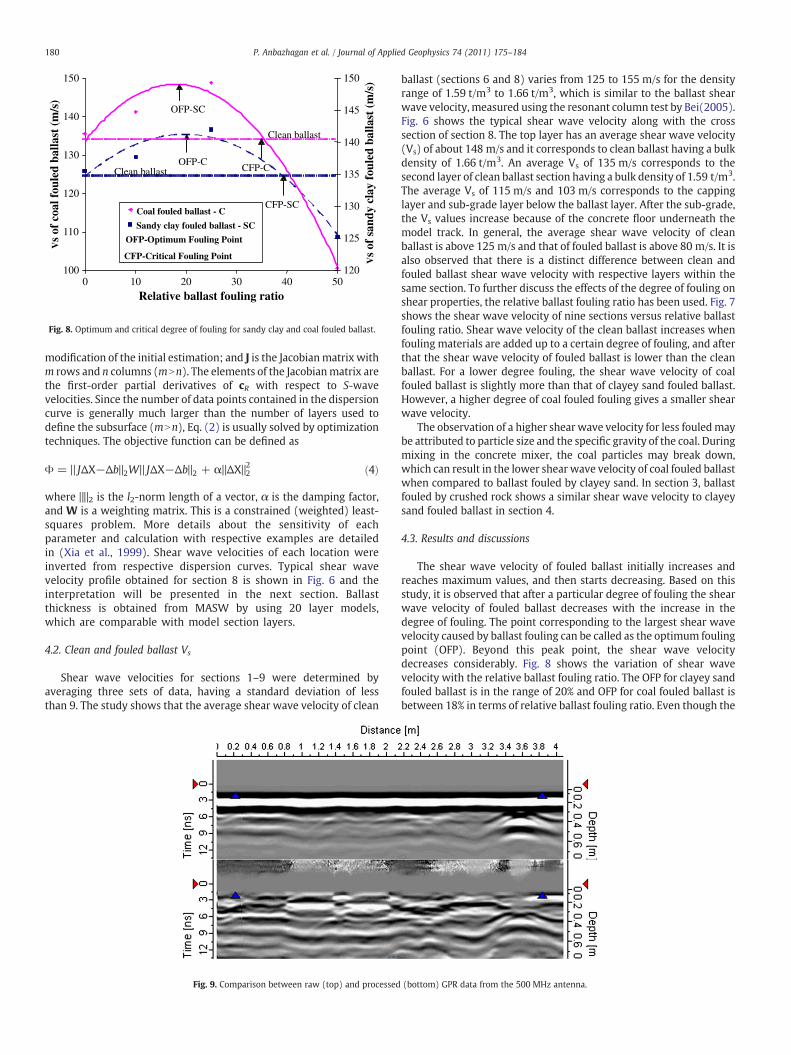
Fig. 9. Comparison between raw (top) and processed
ballast (sections 6 and 8) varies from 125 to 155 m/s for the densityrange of 1.59 t/m3 to 1.66 t/m3, which is similar to the ballast shearwave velocity, measured using the resonant column test by Bei(2005).Fig. 6 shows the typical shear wave velocity along with the crosssection of section 8. The top layer has an average shear wave velocity(Vs) of about 148 m/s and it corresponds to clean ballast having a bulkdensity of 1.66 t/m3. An average Vs of 135 m/s corresponds to thesecond layer of clean ballast section having a bulk density of 1.59 t/m3.The average Vs of 115 m/s and 103 m/s corresponds to the cappinglayer and sub-grade layer below the ballast layer. After the sub-grade,the Vs values increase because of the concrete floor underneath themodel track. In general, the average shear wave velocity of cleanballast is above 125 m/s and that of fouled ballast is above 80 m/s. It isalso observed that there is a distinct difference between clean andfouled ballast shear wave velocity with respective layers within thesame section. To further discuss the effects of the degree of fouling onshear properties, the relative ballast fouling ratio has been used. Fig. 7shows the shear wave velocity of nine sections versus relative ballastfouling ratio. Shear wave velocity of the clean ballast increases whenfouling materials are added up to a certain degree of fouling, and afterthat the shear wave velocity of fouled ballast is lower than the cleanballast. For a lower degree fouling, the shear wave velocity of coalfouled ballast is slightly more than that of clayey sand fouled ballast.However, a higher degree of coal fouled fouling gives a smaller shearwave velocity.
The observation of a higher shear wave velocity for less fouledmaybe attributed to particle size and the specific gravity of the coal. Duringmixing in the concrete mixer, the coal particles may break down,which can result in the lower shear wave velocity of coal fouled ballastwhen compared to ballast fouled by clayey sand. In section 3, ballastfouled by crushed rock shows a similar shear wave velocity to clayeysand fouled ballast in section 4.
4.3. Results and discussions
The shear wave velocity of fouled ballast initially increases andreaches maximum values, and then starts decreasing. Based on thisstudy, it is observed that after a particular degree of fouling the shearwave velocity of fouled ballast decreases with the increase in thedegree of fouling. The point corresponding to the largest shear wavevelocity caused by ballast fouling can be called as the optimum foulingpoint (OFP). Beyond this peak point, the shear wave velocitydecreases considerably. Fig. 8 shows the variation of shear wavevelocity with the relative ballast fouling ratio. The OFP for clayey sandfouled ballast is in the range of 20% and OFP for coal fouled ballast isbetween 18% in terms of relative ballast fouling ratio. Even though the
(bottom) GPR data from the 500 MHz antenna.
181P. Anbazhagan et al. / Journal of Applied Geophysics 74 (2011) 175–184
shear wave velocity of fouled ballast decreases after the OFP, it is stillgreater than the shear wave velocity of clean ballast, which meansthat the track may have sufficient resilient during this period, until itreaches a particular degree of fouling. However, limited studies areavailable to confirm this result. The shear wave velocity of fouledballast reduces below the shear wave velocity of clean ballast; degreeof fouling corresponding to this point can be defined as critical foulingpoint (CFP). Finer materials will be dominating thereby foulingbeyond this point may be not acceptable in terms of strength andbearing capacity of track. Fig. 8 also shows the critical fouling point ofclayey sand fouled ballast and coal fouled ballast. It is interesting tonote that coal fouled ballast reaches the critical fouling point beforeclayey sand fouled ballast. This model track study shows that seismicsurface-wave survey is more useful to identify not only the degree offouling but also the type of fouling materials with shear wave velocityusing multi layer models. For unknown field condition, determining
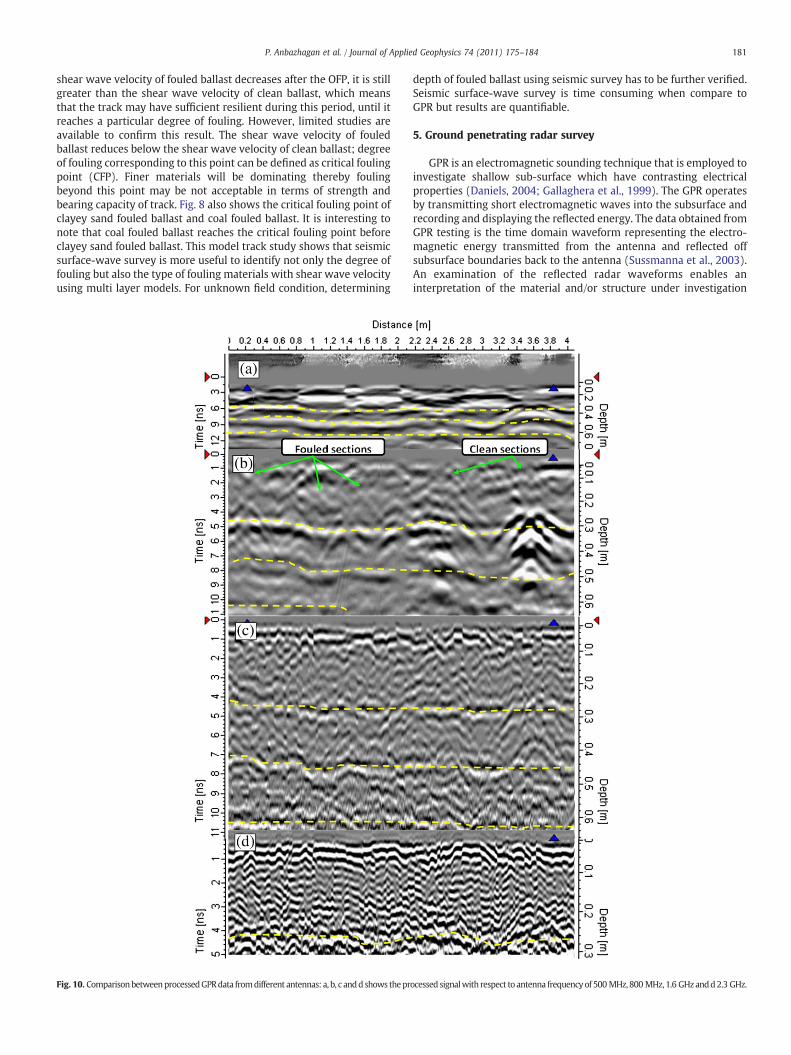
Fig. 10. ComparisonbetweenprocessedGPRdata fromdifferent antennas: a, b, c andd shows thepr
depth of fouled ballast using seismic survey has to be further verified.Seismic surface-wave survey is time consuming when compare toGPR but results are quantifiable.
5. Ground penetrating radar survey
GPR is an electromagnetic sounding technique that is employed toinvestigate shallow sub-surface which have contrasting electricalproperties (Daniels, 2004; Gallaghera et al., 1999). The GPR operatesby transmitting short electromagnetic waves into the subsurface andrecording and displaying the reflected energy. The data obtained fromGPR testing is the time domain waveform representing the electro-magnetic energy transmitted from the antenna and reflected offsubsurface boundaries back to the antenna (Sussmanna et al., 2003).An examination of the reflected radar waveforms enables aninterpretation of the material and/or structure under investigation
ocessed signalwith respect to antenna frequencyof 500MHz, 800MHz, 1.6 GHzandd2.3 GHz.

182 P. Anbazhagan et al. / Journal of Applied Geophysics 74 (2011) 175–184
(Clark et al., 2001). In radar survey, two kinds of velocity measure-ments can be carried out depending on whether the antenna offset isfixed or can be raised. Wide angle (WA) reflection or common mid-point (CMP) measurements provide the data necessary forcalculating propagation velocity. In the first case, one antennaremains stationary while the other is moved along the profiledirection. In the second case, both antennas are simultaneouslymoved apart at the same speed on either side of the midpoint ofthe profile (Tillard and Jean-Claude, 1995). The measurement canalso be achieved by using multi-offset method with multiple pairof antennae or one transmitter and multiple receivers.
Most of the GPR testing was carried out on actual railway lines(Brough et al., 2003; Carpenter et al., 2004; Eriksen et al., 2004). Thereare a lot of uncertainties within the actual rail track and it is difficult tocalibrate the GPR data with actual ground condition because of alimited number of trenches and time constraint. Variation of degree offouling also varies from site to site. In previous investigations limitedattempt has beenmade to known degree of fouling and type of foulingusing GPR testing on large scale model track. Leng and Al-Qadi(2010)carried out GPR survey on controlled model study in the laboratoryand measured accurately the dielectric constants of two commonballast types, granite and limestone, under various fouling andmoisture conditions. In order to investigate the relationship betweenrecorded GPR data and ballast fouling conditions, a number ofexperiments are conducted on the model track with four differentGPR frequencies.
5.1. Data and processing
Data were acquired using GPR with 500 MHz, 800 MHz, 1.6 GHzand 2.3 GHz ground coupled antennas. Wheel encoder was used tomeasure the traveling distance of the antennas over ballast surface.For the 500 MHz and 800 MHz antennas, an X3M control unit and anXV11 monitor were used to collect the data. For higher frequencyantennas, a CX10 monitor with a control unit was used. During thetesting, the antennas were placed on thin smooth plywood toprevent it from bouncing ballast surface. The horizontal samplinginterval is 0.01 m while other acquisition parameters are differentbetween antennas.
Fig. 11. Radargrams for (a) the 800 MHz a
Raw data were processed using data processing software. The aimof this processing is to enhance signal–noise ratio and highlightinterfaces and radargram textures. The processing includes band passfiltering, DC removal, subtract mean trace and gain control. Only veryfundamental filters were applied to the raw data to avoid introducingartificial textures into the radargram. A comparison between raw andprocessed data from the 500 MHz antenna traveling along the left sideof the track in the longitudinal direction is presented in Fig. 9. Thedepth in the radargram was calculated based on an estimated wavevelocity of 1.1×10⁸ m/s. From the raw data, two hyperbolas and twointerfaces can be observed below the time of about 5 ns but no usefulinformation can be obtained close to the ballast surface because ofnoise. After the abovementioned filters have been applied, an obviousimprovement of the signal/noise ratio can be observed. The interfacebetween ballast and capping layer is revealed at the time of about5 ns. Differences between textures of radargram at different locationscan be observed which can help us judge that the condition of theballast is not uniform.
5.2. Results and discussion
The quality of GPR data that can be obtained is strongly correlatedto the frequency of the antenna. Low frequency antenna can seedeeper into the ground but gives lower resolution. On the contrary,high frequency antenna gives high resolution but can only penetratethrough a shallower depth. For the specific application of monitoringballast, the very high frequency antenna will pick up ballast particlesand receive strong reflections from the voids between them. Thismakes it possible to evaluate ballast fouling condition bycomparing the textures of the radargram. However, the strongreflection from ballast voids will also weaken the reflections fromexisting interfaces and/or objects and make it difficult to recognizethem. Therefore antennas with four different frequencies weretested during the testing to find out an optimum frequency formonitoring the ballast condition.
Fig. 10 shows the processed GPR data for four antennas across thesections 1 to 9. The interfaces are marked out using dashed lines. Theresult of the 500 MHz antenna (Fig. 10a) shows the interfacesbetween ballast and capping layer, capping and subgrade and
nd (b) 1.6 GHz antennas along line 1.

183P. Anbazhagan et al. / Journal of Applied Geophysics 74 (2011) 175–184
subgrade and concrete floor. Two hyperbolas reflected from two steelpipes with a diameter of 50 mm are also showed on the radargram.Different textures are observed from different sub-sections of thetrack, but they are not very clear due to low resolution of the antenna.The 800 MHz antenna (Fig. 10b) could also detect the interfaces andembedded steel pipes from the hyperbolae and different texturesbetween clean and fouled sections were visible on the radargram. Thetextures of the clean sections (sections 6 and 8) were clearer thanthose of the adjacent fouled sections (such as section 7). Interfacesbetween different layers are also shown on the radargram of 1.6 GHzantenna (Fig. 10c), but the hyperbolas and difference of texture arenot very clear. The reason for this might be the reflections from ballastparticles. The 2.3 GHz antenna (Fig. 10d) only reveals the interfacebetween the ballast and the capping layer because of its smallerdepth of penetration. The comparison in Fig. 10 between the fourradargrams shows that as the frequency increased the texture ofthe radargram became finer, but the ability to detect interfaceswith the antenna decreased. Of the four frequencies tested here,the 800 MHz antenna gave the clearest image for monitoring thestate of the track layers.
Although the radargram textures for the 800 MHz antenna showsome difference between clean and fouled ballast, it is still difficult toidentify the fouling just by visual inspection of the radargram. Furtherevaluation methods, such as calculating and comparing the dielectricpermittivity or analyzing the amplitude or frequency spectra shouldbe developed. Fig. 11 shows the radargrams from the 800 MHz and1.6 GHz antennas traveling along line 1. As radar detectable Geotextilewas embedded under the ballast along line 1, the interface betweenballast and the capping layer is very prominent (Fig. 11a). It can befound that the recorded two-way travel times for the interface indifferent sub-sections are different. However, the depth of theinterface is the same all along the line. Therefore it can be concludedthat the propagation velocity of radar signal in different sub-sectionsis different, which is due to difference in fouling conditions. Thisindicates that it is possible to evaluate ballast fouling condition bymeasuring the propagation velocity of radar signal. GPR shows theinterface (depth) of fouling layer but type of fouling may not beidentified. GPR survey can be performed faster than seismic surface-wave survey. In an unknown field condition, direct application of GPRto measure degree and type of fouling has to be further investigatedusing a better signal processing.
6. Conclusions
Typical model track with clean and fouled ballast beds has beendesigned and constructed at the University of Wollongong. MASWand GPR surveyshave been conducted on model track to identify thedegree of fouling and type of fouling. Seismic surface-wave surveyshows that the shear wave velocity increases before optimum foulingpoint (OFP) and decreases after OFP. Coal fouled ballast bed reachesthe OFP ahead of sandy clay fouled ballast bed. Coal fouled ballast bedhas relatively higher shear strength before OFP but clay fouled ballastbed has relatively higher shear strength after the OFP. The shear wavevelocity of fouled ballast decreases after OFP and goes below the cleanballast. Degree of fouling corresponding to shear wave velocity offouled ballast equal to clean ballast is called as critical fouling point.The critical fouling point for sandy clay fouled ballast is 36% and coalfouled ballast is 39%.
GPR studies on model track show that the fouled layer can beidentified using GPR but still degree of fouling and type of fouling areuncertain. Among 500 MHz, 800 MHz, 1.6 GHz and 2.3 GHz surfacebound antenna, 800 MHz antenna gives relatively comparable results.
This study shows that seismic surface-wave survey can providelow strain shear wave velocity of ballast bed thereby enabling theidentification of type and degree of fouling. This shear wave velocitycan also be used to find low strain stiffness of substructure of the rail
track. While, depth of fouling layer identification can be approximatein seismic reaction survey, radar gram from GPR shows interface oflayer clearly. GPR results are qualitative and further calibration withactual track condition is needed.
Based on this study it can be concluded that MASW is the ideal toolfor type of fouling identification. However concrete method need tobe worked out to identify the degree of fouling based on shear wavevelocity by considering model and field studies. The parabolic shapeshear wave velocity variation shows two degree of fouling point forthe same shear wave velocity i.e. before OFP and after OFP. MASWsurvey in the field may not be as fast as GPR survey. Consideringlimitations in model track when compared to field, it is furtherplanned to conduct field model test using GPR as well as MASW toconfirm the finding in the model track.
Acknowledgment
The first author thanks the Endeavor and Australian Governmentfor being invited to be an Endeavor research fellow.
References
Aki, K., Richards, P.G., 1980. Quantitative Seismology. W.H. Freeman & Co.Al-Hunaidi, M.O., 1992. Difficulties with phase spectrum unwrapping in spectral
analysis of surface waves non-destructive testing of pavements. Can. Geotech. J 29,506–511.
Anbazhagan, P., Sitharam, T.G., 2008a. Mapping of average shear wave velocity forBangalore region: a case study. J. Environ. Eng. Geophysics 13 (2), 69–84.
Anbazhagan, P., Sitharam, T.G., 2008b. Seismic microzonation of Bangalore. J. Earth Syst.Sci. 117, No.S2, 833–852.
Anbazhagan, P., Sitharam, T.G., 2008c. Site characterization and site response studiesusing shear wave velocity. J. Seismology and Earthquake Eng. 10 (2), 53–67.
Anbazhagan, P., Sitharam, T.G., 2008d. Application of multichannel analysis of surfacewave survey in geotechnical engineering problems. Proceeding of 6th Asian YoungGeotechnical Engineers Conference, pp. 291–300.
Anbazhagan, P., Sitharam, T.G., 2009. Spatial variability of the weathered andengineering bed rock using multichannel analysis of surface wave survey. Pureand Applied Geophysics 166 (3), 409–428.
Anbazhagan, P., Indraratna, B., Rujikiatkamjorn, C., Su, L., 2010. Using a seismic surveyto measure the shear modulus of clean and fouled ballast. Geomechanics andGeoengineering: An International Journal 5 (2), 117–126.
AS 2758.7, 1996. Australian standard: aggregates and rock for engineering purposes.Part 7: Railway Ballast. .
Effects of railroad track structural components and subgrade on damping anddissipation of train induced vibration. Doctoral Thesis. : Bei S.The Graduate School,University of Kentucky, Lexington, Kentucky, China.
Brough, M., Stirling, A., Ghataora, G., Madelin, K., 2003. Evaluation of railway track bedand formation: a case study. NDT&E International 36, 145–156.
Carpenter, D., Jackson, P.J., Jay, A., 2004. Enhancement of the GPR method of railwaytrack bed investigation by the installation of radar detectable geosynthetics. NDT&EInternational 37, 95–103.
Clark, M.R., Gillespie, R., Kemp, T., McCann, D.M., Forde, M.C., 2001. Electromagneticproperties of railway ballast. NDT&E International 34, 305–311.
Daniels, D.J., 2004. Ground Penetrating Radar, 2nd ed. The Institution of ElectricalEngierrs, Stevenage, UK.
Dorman, J., Ewing, M., 1962. Numerical inversion of seismic surface wave dispersiondata and crust-mantle structure in the New York–Pennsylvania area. J. Geophys.Res. 67, 5227–5241.
Eriksen, A., Gascoyne, J., Al-Nuaimy, W., 2004. Improved productivity & reliability ofballast inspection using road-rail multi-channel GPR. 6th–7th July Proceedings ofRailway Engineering. Commonwealth Institute, London, UK, pp. 1–5.
Feldman, F., Nissen, D., 2002. Alternative Testing Method for the Measurement ofBallast Fouling: Percentage Void Contamination. Conference on Railway Engineer-ing, Wollongong, RTSA. pp. 101–109.
Gallaghera, G.P., Leiper, Q., Williamson, R., Clark, M.R., Forde, M.C., 1999. The applicationof time domain ground penetrating radar to evaluate railway track ballast. NDT&EInternational V32, 463–468.
Ganji, V., Gukunski, N., Maher, A., 1997. Detection of underground obstacles by SASWmethod—numerical aspects. J. Geotech. Geoenviron. Eng. 123 (3), 212–219.
Indraratna, B., Su, L., Rujikiatkamjorn, C., 2011. A new parameter for classification andevaluation of railway ballast fouling, Technical note. Can. Geotech. J. 48, 322–326.
Leng, Z., Al-Qadi, I.L., 2010. Railroad ballast evaluation using ground penetrating radar.January 10–14 Laboratory Investigation and Field Validation. TransportationResearch Board 89th Annual Meeting, Washington, D.C, pp. 1–15.
Mari, J.L., 1984. Estimation of static correction for shear-wave profiling using thedispersion properties of Love waves. Geophysics 49, 1169–1179.
Nazarian, S., Stokoe II, K.H., Hudson, W.R., 1983. Use of spectral analysis of surfacewaves method for determination of moduli and thicknesses of pavement systems.Transp. Res. Rec 930, 38–45.

184 P. Anbazhagan et al. / Journal of Applied Geophysics 74 (2011) 175–184
Park, C.B., Miller, R.D., Xia, J., 1999. Multi-channel analysis of surface waves. Geophysics64 (3), 800–808.
Press, W.H., Teukosky, S.A., Vetterling, W.T., Flannery, B.P., 1992. Numerical Recipes inC: Cambridge Univ. Press.
Schwab, F.A., Knopoff, L., 1972. Fast surface wave and free mode computations. In: Bolt,B.A. (Ed.), Methods in Computational Physics. Academic Press, pp. 87–180.
Selig, E.T., Waters, J.M., 1994. Track geotechnology and substructure management,London. Thomas Telford, New York, American Society of Civil Engineers.Publications Sales Dept.
Sitharam, T.G., Anbazhagan, P., 2008. Evaluation of Low strain dynamic properties usinggeophysical method: a case study. Consulting Ahead 2 (2), 34–50.
Stokoe II, K.H., Wright, G.W., James, A.B., Jose, M.R., 1994. Characterization ofgeotechnical sites by SASW method. In: Woods, R.D. (Ed.), Geophysical Character-ization of Sites: ISSMFE Technical Committee #10. Oxford Publishers, New Delhi.
Sussmanna, T.R., Ernest, T., Selig, J., Hyslip, P., 2003. Railway track condition indicatorsfrom ground penetrating radar. NDT&E International 36, 157–167.
Tillard, S., Jean-Claude, D., 1995. Analysis of GPR data: wave propagation velocitydetermination. J. Appl. Geophysics 33, 77–91.
Tokimatsu, K., 1995. Geotechnical site characterization using surface waves IS-TokyoProc. 1st Int. Conf. on Earth. Geotechn. Eng. 36.
Xia, J., Miller, R.D., Park, C.B., 1999. Estimation of near-surface shear-wave velocity byinversion of Rayleigh wave. Geophysics 64 (3), 691–700.
Xu, Y., Xia, J., Miller, R.D., 2006. Quantitative estimation ofminimum offset formultichannelsurface-wave surveywith actively exciting source. J. Appl. Geophysics 59 (2), 117–125.
Zhang, S.X., Chan, L.S., Xia, J., 2004. The selection of field acquisition parameters fordispersion images frommultichannel surface wave data. Pure and Appl. Geophysics161, 185–201.