Are E-Books a Different Channel? Multichannel Management ...
43
Are E-Books a Different Channel? Multichannel Management of Digital Products Hui Li * January 2021 Abstract Digital products are differentiated from online and offline physical products in important ways. This paper studies the influence of digital products on existing channels and the optimal multichannel man- agement strategy in the context of the book industry. Using individual-level online transaction data and county-level offline bookstore data, I estimate a demand model of book format and retailer choices across genres. I use the estimates to solve for publishers’ optimal wholesale pricing strategy across channels. The demand-side estimates reveal that e-books and offline bookstores appear to compete head-to-head in book genres that serve casual reading purposes such as fiction, science fiction, humor, and biographies, which I categorize as “casual” books. The supply-side results suggest that as local bookstore availability increases, publishers should charge higher wholesale prices in the offline print channel, especially for “casual” books. I find that the e-book channel does not always hurt print channels but can serve as a strategic complement and enhance the pricing power of print channels in some markets and genres; this complementarity does not rely on branding or marketing communication and crucially depends on the relative strength of the channels. Specifically, a new channel can help an existing channel when two conditions hold: first, the new channel is not too weak and can generate enough market expansion effect; second, the existing channel is not too strong and can avoid too much cannibalization from the new channel. I use counterfactual analysis to illustrate the mechanism behind this result and how a multichannel management strategy should account for relative strength across channels. * Carnegie Bosch Assistant Professor of Marketing at the Tepper School of Business, Carnegie Mellon University ([email protected]). 1
-
Upload
khangminh22 -
Category
Documents
-
view
1 -
download
0
Transcript of Are E-Books a Different Channel? Multichannel Management ...
Are E-Books a Different Channel? Multichannel Management of
Digital Products
Hui Li∗
January 2021
Abstract
Digital products are differentiated from online and offline physical products in important ways. This
paper studies the influence of digital products on existing channels and the optimal multichannel man-
agement strategy in the context of the book industry. Using individual-level online transaction data and
county-level offline bookstore data, I estimate a demand model of book format and retailer choices across
genres. I use the estimates to solve for publishers’ optimal wholesale pricing strategy across channels.
The demand-side estimates reveal that e-books and offline bookstores appear to compete head-to-head
in book genres that serve casual reading purposes such as fiction, science fiction, humor, and biographies,
which I categorize as “casual” books. The supply-side results suggest that as local bookstore availability
increases, publishers should charge higher wholesale prices in the offline print channel, especially for
“casual” books. I find that the e-book channel does not always hurt print channels but can serve as
a strategic complement and enhance the pricing power of print channels in some markets and genres;
this complementarity does not rely on branding or marketing communication and crucially depends on
the relative strength of the channels. Specifically, a new channel can help an existing channel when
two conditions hold: first, the new channel is not too weak and can generate enough market expansion
effect; second, the existing channel is not too strong and can avoid too much cannibalization from the
new channel. I use counterfactual analysis to illustrate the mechanism behind this result and how a
multichannel management strategy should account for relative strength across channels.
∗Carnegie Bosch Assistant Professor of Marketing at the Tepper School of Business, Carnegie Mellon University([email protected]).
1
1 Introduction
The past decade has witnessed the disruption of offline retail by online retail of physical products. Now, both
online and offline retail face a new disruption from online digital products. There are important features of
digital products that differentiate them from existing online and offline physical products. Consumers usually
get lower prices, broader selection, and easier search and browsing experience from digital products compared
to offline physical products. Consumers also face no shipping fees and get instant delivery for digital products
compared to online physical products. In addition to these differences in shopping experiences, consumers
use and interact with digital products in different ways than they do with physical products. The features of
digital products have led to a rapid growth in the consumer adoption of digital products. Music streaming
(e.g., Spotify) revenues surpassed physical format sales in the first half of 2015 in the U.S. (RIAA 2015).
Video streaming services (e.g., Hulu, Netflix, and Amazon) enjoyed even stronger growth and became an
$27.2 billion business in 2020.1
Digital products present new opportunities and challenges for multichannel management. Before the
introduction of digital products, firms sell the same physical product in different channels (e.g., Biyalogorsky
and Naik 2003; Pauwels and Neslin 2015). The same product can have different prices across channels
through channel-specific promotions or handling fees, which may lead to consumer confusion and channel
conflict (Neslin and Shankar 2009). The introduction of digital products allows firms to sell differentiated
products in different channels and avoid potential channel conflict. The challenge is to understand how the
digital channel affects existing physical channels and how firms should manage multiple channels.
In this paper, I study the influence of the digital products on existing online and offline channels and
the optimal multichannel management strategy in the context of e-books. I combine individual-level data
of online book and e-reader transactions and county-level data of offline bookstore availability and sales.
The data cover all major e-book and print book retailers. I use the estimated demand model to examine
publishers’ optimal multichannel pricing strategy by book genre and local bookstore availability. I study the
book industry because books are commodity products with relatively low brand-specific heterogeneity; the
substitution across channels are less driven by brand and more driven by channel-specific factors.
I start with estimating a demand model of consumer e-reader adoption and book purchase. Consumers
choose ex ante whether to buy e-readers, which are the gateway product of e-reading. Consumers then
select a book retailer, reading format in a number of book genres. There are four retailer-format options:
print books from Amazon, print books from other online retailers, print books from offline bookstores, and
e-books from Amazon. There are three book genres: “lifestyle,” “casual,” and “practical”. The “lifestyle”1See https://www.statista.com/outlook/206/109/video-streaming--svod-/united-states
2
genre contains subgenres such as cooking, travel, crafts, hobbies and home. The “casual” genre contains
subgenres such as fiction, science fiction, humor, and biographies. The “practical” genre contains subgenres
such as technology, business, medical, education, and reference. I allow consumers to buy multiple books
in each retailer-format-genre and allow local bookstore availability to affect all levels of consumer decisions.
The estimates reveal that consumers’ e-format preference differs by genre. The e-format specific utility is the
largest and positive for “casual” books and the smallest and negative for “practical” books. The estimated
own and cross elasticities suggest that e-books are closer substitutes to online print books overall and appear
to compete head-to-head with offline bookstores on “casual” books. One potential explanation is that for
“casual” book reading consumers value “convenience”, which is a common feature of e-books and offline
bookstores. Another finding is that local bookstore availability affects consumer choices. When consumers
have access to more local stores, they are more likely to choose the offline channel and buy more books from
it. Meanwhile, they are less likely to adopt e-reading and are less sensitive to e-book price cuts.
The demand model addresses an important question in the publishing industry: what extent of e-book
sales would have been print book sales in the absence of e-books and what extent would not have occurred?
I simulate the market outcomes without e-books. I find that 71.5% of e-book sales come from cannibalizing
print books and that 28.5% come from market expansion. The cannibalization rate is lower for neighborhoods
with more bookstores. Local bookstores bear most of the cannibalization burden among all print book
retailers.
I use the estimated demand model to solve for the optimal wholesale pricing strategy for publishers. I
allow the prices to differ by genre for the e-book and online channels and differ by genre and local bookstore
availability for the offline channel. The results show that the optimal wholesale prices of the offline channel
increase as local bookstore availability increases, especially for “casual” books. The reason is that the offline
channel is stronger and has smaller own elasticities in markets with more local bookstores. Publishers in
these markets can charge higher prices.
I further solve for the optimal wholesale pricing strategy when the e-channel is not present. Comparing
the optimal strategies with and without the e-channel, I find that the e-channel can enhance the pricing power
of the existing channels: when e-channel is present, the optimal prices of online and offline print channels
are higher in general, except for casual books in markets with large local bookstore availability. Whether
and when the e-channel helps the existing channels depend on the relative strength of the channels. In my
context, the strength of the offline channel is captured by local bookstore availability, which varies across
markets. The strength of the e-channel is captured by the e-format specific utility, which varies across genres.
I find that a new channel can help an existing channel when two conditions hold: first, the new channel is not
too weak and can generate enough market expansion effect; second, the existing channel is not too strong
3
and can avoid too much cannibalization from the new channel. When the two conditions hold, the new
channel can serve as a compensating substitute for the existing channels. The gain from market expansion
dominates the loss from cannibalization. Publishers can charge higher prices in the existing channels.
The findings relate to the antitrust case of Apple and the six largest publishers in the book industry.
Amazon was the major e-book retailer during the early years of e-book introduction. It signed a wholesale
contract with publishers and priced e-books of new releases at $9.99. Publishers were concerned that the low
e-book prices can hurt print book sales. Motivated by the concerns, the six largest publishers collaborated
with Apple in 2010. They forced the switch of the e-book pricing contract from a wholesale contract to
an agency contract, which allowed the publishers to control e-book pricing. The contract switch drew
close scrutiny from the Department of Justice and resulted in an antitrust lawsuit. The settlement was
that the industry switched back to the wholesale contract in 2012.2 This paper examines the optimal
multichannel management strategy for the publishers under the wholesale contract. I find that publishers
do not necessarily need to concern that the e-book channel may hurt the existing channels. In contrast, the
e-channel can help the existing channels and allow publishers to charge higher prices in existing channels
under certain conditions.
The paper contributes to the empirical literature on the demand-side interaction between online and
offline physical products. Some studies find online and offline physical products to be substitutes in terms
of distribution; the substitution pattern depends on demographics, product category, and offline store avail-
ability (e.g., Balasubramanian 1998; Sinai and Waldfogel 2004; Ansari et al. 2008; Brynjolfsson, Hu, and
Rahman 2009; Forman, Ghose, and Goldfarb 2009; Choi and Bell 2011). Other studies find online and
offline physical products to be complements in terms of marketing communication; the communication can
be regarding brand existence (Wang and Goldfarb 2017) and product attributes (e.g., Ching and Ishihara
2012; Narayanan, Manchanda, and Chintagunta 2005, Bell, Gallino, and Moreno 2017). While the existing
literature focuses on the setting in which the same physical product is sold through multiple channels, I study
a new setting in which a differentiated digital product is sold along with existing physical products through
multiple channels. I identify a novel way that channels can serve as complements, not just for branding or
marketing communication reasons. Specifically, the e-book channel can enhance the pricing power of the
print book channels in certain markets and genres.
The paper also contributes to the literature on multichannel management. Most studies are theoretical
and focus on whether firms should introduce an online channel (e.g., Chiang et al. 2003, Kumar and Ruan
2006, Zhang 2009) and how firms should optimally manage multiple channels (e.g., Lal and Sarvary 1999,2See https://www.justice.gov/opa/pr/justice-department-reaches-settlement-three-largest-book-publishers-and-continues-
litigate.
4
Zettlemeyer 2000, Ofek et al. 2011). Zhang (2009) finds that although channels cannibalize each other,
introducing a new channel can benefit if more channels generate market expansion and larger coverage. I
contribute to the literature by empirically studying both the demand-side problem of channel interaction
and the supply-side problem of multichannel management. The demand-side analysis provides insights
on the “multichannel cross-elasticity” matrix, which is an important gap in the multichannel management
literature (Neslin and Shankar 2009). The supply-side analysis provides insights on retail marketing mix
across channels, which is the least developed research stream in the multi-channel field (Verhoef et al. 2015).
In particular, the results highlight how channel strength affects optimal strategy.
Finally, the paper relates to the empirical literature on the demand-side interaction between digital and
traditional products. Studies have documented cannibalization between online newspapers and physical
newspapers (Gentzkow 2007), file sharing and record sales (Oberholzer-Gee and Strumpf 2007), and pdf and
print format (Kannan et al. 2009). Chen, Hu and Smith (2018) find that delaying an e-book launch results
in a small increase in print sales and a large decrease in total e-book sales. Most of these studies rely on
a natural experiment or data from a single firm. I use data that cover all major online and offline book
retailers, and I use structural models to reveal the underlying mechanisms of cannibalization.
2 Data
2.1 Industry and Data Description
Amazon launched its first e-reader, the Kindle, in 2007. Since then, the market size of e-books has grown
from $31.7 million in 2007 to $3.24 billion in 2013, accounting for 24% of publishers’ total sales at its peak
(Association of American Publishers 2013, 2015). By 2018, 26% of Americans had read an e-book (Pew
Research Center, 2018). Amazon is the largest e-book retailer. It was a monopoly until 2009 and accounted
for approximately 70% of the e-book market share by 2012 (Gilbert 2015). E-books are usually less expensive
than their print format counterparts. A typical New York Times bestseller costs only $9.99 in e-format on
Amazon. The low prices of e-books raised publishers’ concerns that e-books could erode print book sales. To
avoid such cannibalization, publishers have experimented with delaying the launch of the e-format product.
However, the delay only caused a permanent loss in e-book sales and an insignificant increase in print book
sales (Chen, Hu and Smith 2018). Publishers have since embraced the new digital channel. Random House
and HarperCollins launched their first digital-only imprints, all of which focused on genre fiction.3 What3See http://www.forbes.com/sites/suwcharmananderson/2013/03/10/beware-random-houses-ebook-imprints/.
5
remains unclear is how publishers can fully use the digital channel given the substitution across channels.
The e-book was not the first disruptor in the publishing industry. Before the e-book was introduced,
online print book retailers such as Amazon were regarded as the disruptor of offline bookstores. Since
Amazon was founded in 1994, the number of offline bookstores decreased by almost 20% from 1997 to 2007
(U.S. Census 1997, 2007). As the old disruptor, online print retailers remained the top sales channel for
publishers and accounted for 37.4% of the market in 2015 (Association of American Publishers 2015). This
paper studies the interactions among the new disruptor, the old disruptor and the traditional offline retailer.
It covers all major print book retailers and the major e-book retailer, Amazon.
I first obtain individual-level transaction data of consumer online book purchases between 2008 and 2012
from Comscore. For each book purchase, I observe the book title, format (e-book or print), price, quantity,
retailer, and household demographics, such as income, age, and zip code.4 There are three income groups
and three age groups. I further use web scrapers to collect format-specific prices and book genre information
and categorize the books into three genres. The “lifestyle” genre contains subgenres such as cooking, travel,
crafts, hobbies and home. The “casual” genre contains subgenres such as fiction, science fiction, humor, and
biographies. The “practical” genre contains subgenres such as technology, business, medical, education, and
reference. The data set includes 20,637 households, 72,619 book purchases, and 122,068 format-specific price
information.
I define the time period as a year because consumers were resampled every year. For each consumer, I
aggregate her purchase records to construct her book quantity choices at the year-genre-format-retailer level.
I also calculate the average book prices at the year-genre-format-retailer level for the entire market.5 Table
1 tabulates the average book prices by channel, genre, and over time. “Casual” books are the cheapest, with
an average e-book price of $8.1 and an average online print book price of $12.1. “Practical” books are the
most expensive, with an average e-book price of $11.5 and an average print book price of $27.8. The price
differences across formats and channels are mainly driven by the retailer-format specific pricing rules, which
are widely adopted in practice and are detailed in Section 6.1.
Second, I obtain county-level data on the yearly number of bookstores and bookstore sales between 2008
and 2012 from Esri Demographics and Business Database, County Business Patterns, and U.S. Economic
Census.6 I study demand at the county level because it can better capture the scope of consumer offline4Hardcovers account for only 5% of the transactions.5I use the sales-unweighted prices in the estimation, as the sales-weighted and unweighted prices differ by less than 2%.6Esri Demographics and Business Database contains county-level data on number of bookstores and sales
(http://www.esri.com/data/esri_data/business-overview/business). County Business Patterns data (CBP) contain county-level data on total number of establishments by industry (https://www.census.gov/programs-surveys/cbp.html). Eco-nomic Census data (ECN) contain county-level data on total number of establishments and sales by industry(https://www.census.gov/programs-surveys/economic-census.html). The Esri dataset is available for 2010 and is the mostcomprehensive among the three data sets: it covers the largest number of counties and covers all the counties in the Comscoreonline panel. CBP is available for years between 2008 and 2013. ECN is available for 2007 and 2012 because the census is
6
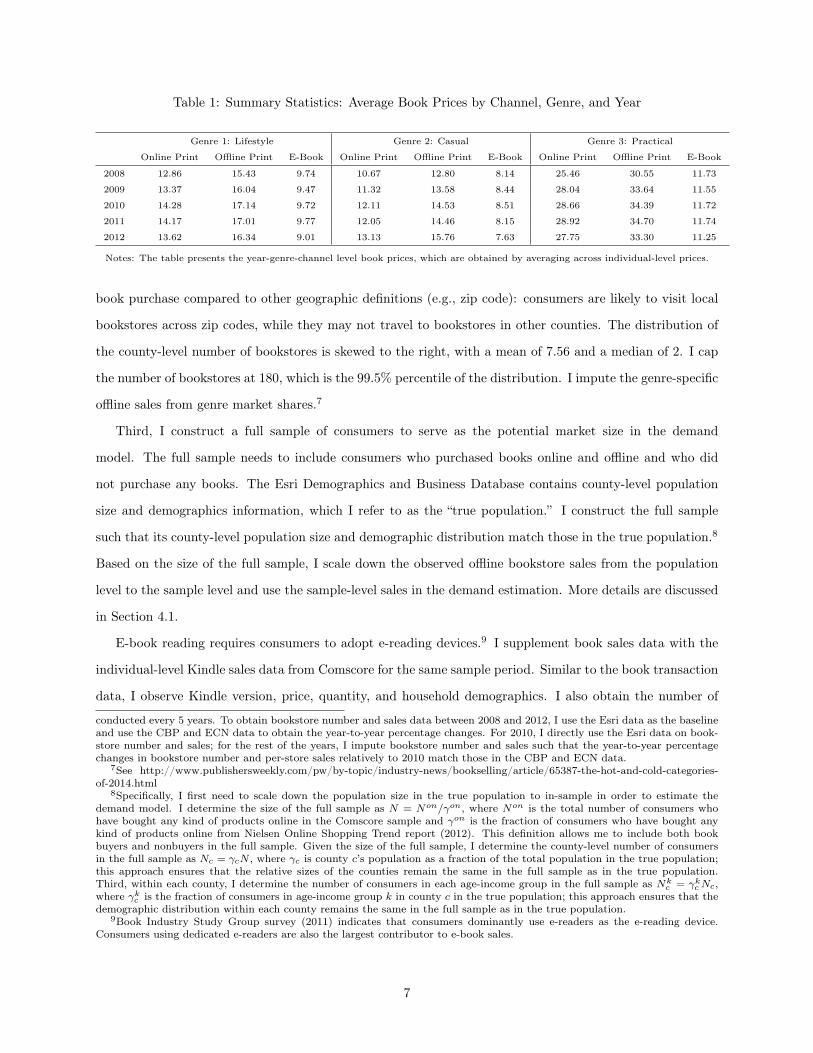
Table 1: Summary Statistics: Average Book Prices by Channel, Genre, and Year
Genre 1: Lifestyle Genre 2: Casual Genre 3: Practical
Online Print Offline Print E-Book Online Print Offline Print E-Book Online Print Offline Print E-Book
2008 12.86 15.43 9.74 10.67 12.80 8.14 25.46 30.55 11.73
2009 13.37 16.04 9.47 11.32 13.58 8.44 28.04 33.64 11.55
2010 14.28 17.14 9.72 12.11 14.53 8.51 28.66 34.39 11.72
2011 14.17 17.01 9.77 12.05 14.46 8.15 28.92 34.70 11.74
2012 13.62 16.34 9.01 13.13 15.76 7.63 27.75 33.30 11.25
Notes: The table presents the year-genre-channel level book prices, which are obtained by averaging across individual-level prices.
book purchase compared to other geographic definitions (e.g., zip code): consumers are likely to visit local
bookstores across zip codes, while they may not travel to bookstores in other counties. The distribution of
the county-level number of bookstores is skewed to the right, with a mean of 7.56 and a median of 2. I cap
the number of bookstores at 180, which is the 99.5% percentile of the distribution. I impute the genre-specific
offline sales from genre market shares.7
Third, I construct a full sample of consumers to serve as the potential market size in the demand
model. The full sample needs to include consumers who purchased books online and offline and who did
not purchase any books. The Esri Demographics and Business Database contains county-level population
size and demographics information, which I refer to as the “true population.” I construct the full sample
such that its county-level population size and demographic distribution match those in the true population.8
Based on the size of the full sample, I scale down the observed offline bookstore sales from the population
level to the sample level and use the sample-level sales in the demand estimation. More details are discussed
in Section 4.1.
E-book reading requires consumers to adopt e-reading devices.9 I supplement book sales data with the
individual-level Kindle sales data from Comscore for the same sample period. Similar to the book transaction
data, I observe Kindle version, price, quantity, and household demographics. I also obtain the number of
conducted every 5 years. To obtain bookstore number and sales data between 2008 and 2012, I use the Esri data as the baselineand use the CBP and ECN data to obtain the year-to-year percentage changes. For 2010, I directly use the Esri data on book-store number and sales; for the rest of the years, I impute bookstore number and sales such that the year-to-year percentagechanges in bookstore number and per-store sales relatively to 2010 match those in the CBP and ECN data.
7See http://www.publishersweekly.com/pw/by-topic/industry-news/bookselling/article/65387-the-hot-and-cold-categories-of-2014.html
8Specifically, I first need to scale down the population size in the true population to in-sample in order to estimate thedemand model. I determine the size of the full sample as N = Non/γon, where Non is the total number of consumers whohave bought any kind of products online in the Comscore sample and γon is the fraction of consumers who have bought anykind of products online from Nielsen Online Shopping Trend report (2012). This definition allows me to include both bookbuyers and nonbuyers in the full sample. Given the size of the full sample, I determine the county-level number of consumersin the full sample as Nc = γcN , where γc is county c’s population as a fraction of the total population in the true population;this approach ensures that the relative sizes of the counties remain the same in the full sample as in the true population.Third, within each county, I determine the number of consumers in each age-income group in the full sample as Nk
c = γkcNc,where γkc is the fraction of consumers in age-income group k in county c in the true population; this approach ensures that thedemographic distribution within each county remains the same in the full sample as in the true population.
9Book Industry Study Group survey (2011) indicates that consumers dominantly use e-readers as the e-reading device.Consumers using dedicated e-readers are also the largest contributor to e-book sales.
7

e-books available in the Kindle Store from a widely cited blog.10 A total of 126,630 e-books were available
in 2008, and 1,429,500 e-books were available in 2012. Finally, I obtain the yearly county-level rent between
2008 and 2012 from the American Community Survey. I obtain the yearly county-level wage in the bookstore
industry between 2008 and 2012 from the Bureau of Labor and Statistics.11 The local rent and wage are
used as instruments to treat the endogeneity of local bookstore availability.
2.2 Data Patterns
Literature has documented that consumer demand in online and offline channels depends on demographics,
product category, and offline store availability (e.g., Brynjolfsson, Hu, and Rahman 2009; Forman, Ghose,
and Goldfarb 2009). Consistent with the literature, I find that consumer demand depends on book genre
and local bookstore availability in my context.
To measure local bookstore availability, I use logged number of bookstores per million population, which is
a continuous variable.12 A challenge of using a continuous measure is that I need to solve consumer purchase
and publisher pricing decisions by bookstore availability in the model; the size of the problem increases with
the number of unique levels of local bookstore availability. Therefore, I discretize the continuous variable
of the logged number of bookstores per million population to 17 values as shown in the x-axis of Figure 1.
The discretization leads to 18 types of markets, each with either no bookstore or one of the 17 values of
bookstore availability.
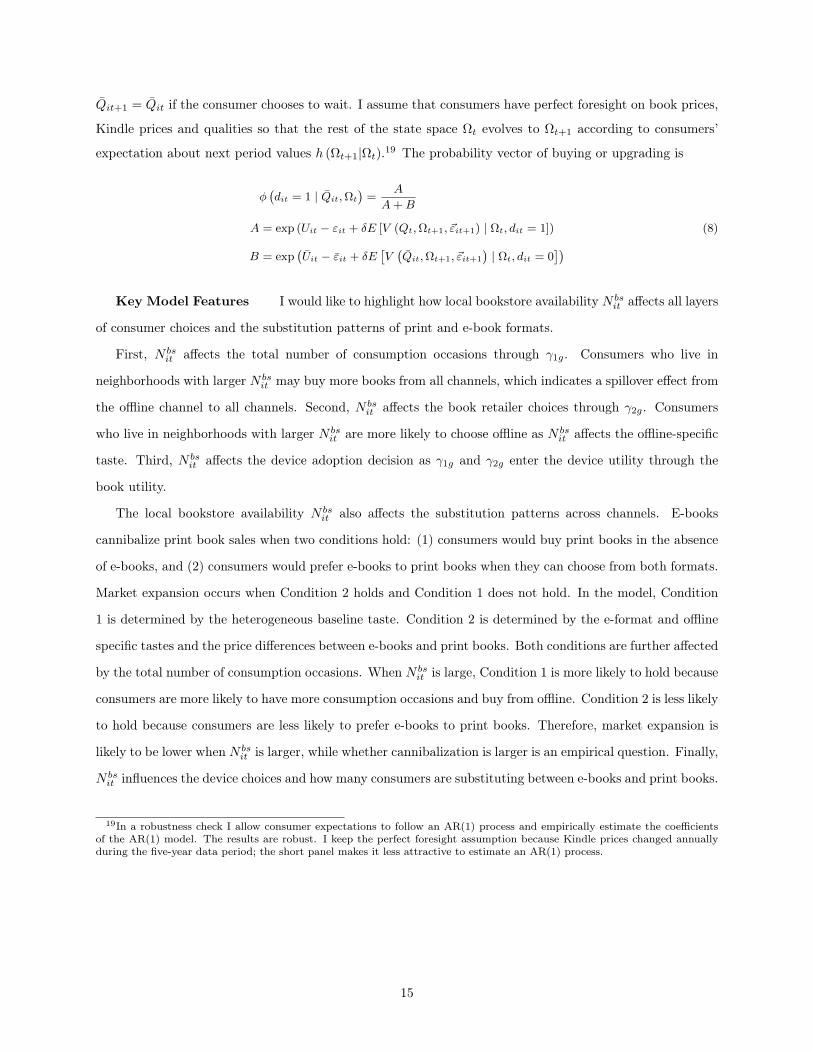
Book Format Consumers can choose e-format and print format for book purchase. Figure 1
presents the e-format market share by genre and local bookstore availability. Each curve represents one
genre. Each data point on the curve represents in a particular genre the aggregate e-format market share
for counties with the same logged number of bookstores per million population. The graph suggests that
consumer preference for the e-format appears to be the greatest for “casual” books, suggesting that “casual”
e-books are the strongest substitutes for their print book counterparts. The e-format market share drops as
bookstore availability increases, suggesting that consumers are more likely to choose the print format when
more local bookstores are available.
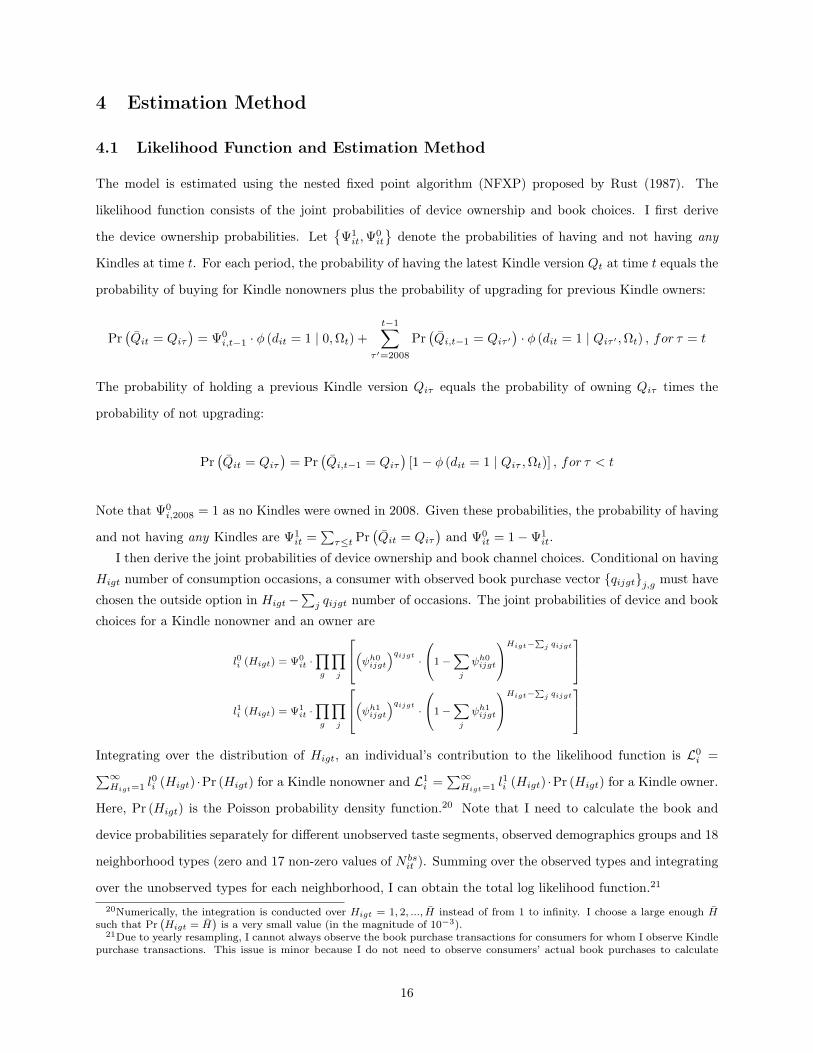
Print Book Retailer Consumers have three retailer options for print book purchase: Amazon, other
online retailers, and offline bookstores. Figure 2 plots the market shares of the three print book retailers by10This blog (http://ilmk.wordpress.com/category/analysis/snapshots/) takes monthly snapshots of Amazon.11The local rent information comes from the county-level median gross rent in the American Community Survey
(https://www.census.gov/programs-surveys/acs). The local wage information comes from the county-level wage in the “Sport-ing goods, hobby, book and music stores” industry from the Quarterly Census of Employment and Wages program, collectedby the Bureau of Labor and Statistics (https://www.bls.gov/cew/datatoc.htm#NAICS_BASED).
12The results are robust when I use logged number of bookstores and logged ratio of number of bookstores to number ofcoffee shops, as discussed in Section 4.2.1.
8
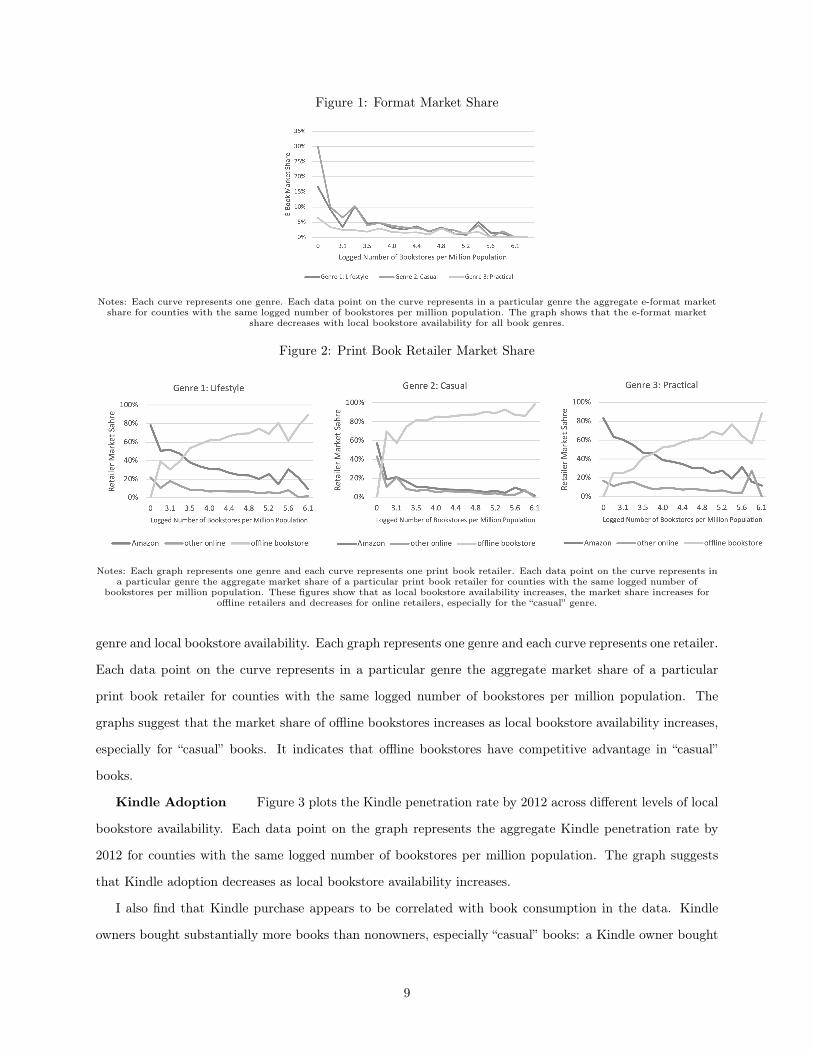
Figure 1: Format Market Share
Notes: Each curve represents one genre. Each data point on the curve represents in a particular genre the aggregate e-format marketshare for counties with the same logged number of bookstores per million population. The graph shows that the e-format market
share decreases with local bookstore availability for all book genres.
Figure 2: Print Book Retailer Market Share
Notes: Each graph represents one genre and each curve represents one print book retailer. Each data point on the curve represents ina particular genre the aggregate market share of a particular print book retailer for counties with the same logged number of
bookstores per million population. These figures show that as local bookstore availability increases, the market share increases foroffline retailers and decreases for online retailers, especially for the “casual” genre.
genre and local bookstore availability. Each graph represents one genre and each curve represents one retailer.
Each data point on the curve represents in a particular genre the aggregate market share of a particular
print book retailer for counties with the same logged number of bookstores per million population. The
graphs suggest that the market share of offline bookstores increases as local bookstore availability increases,
especially for “casual” books. It indicates that offline bookstores have competitive advantage in “casual”
books.
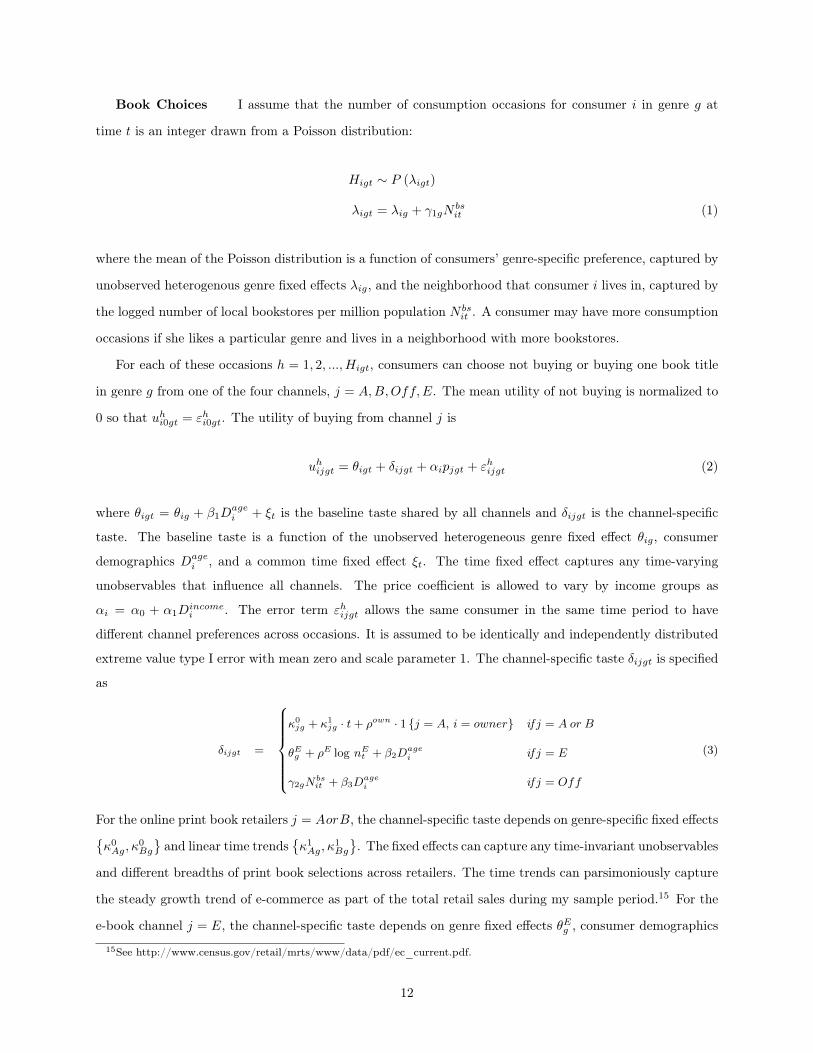
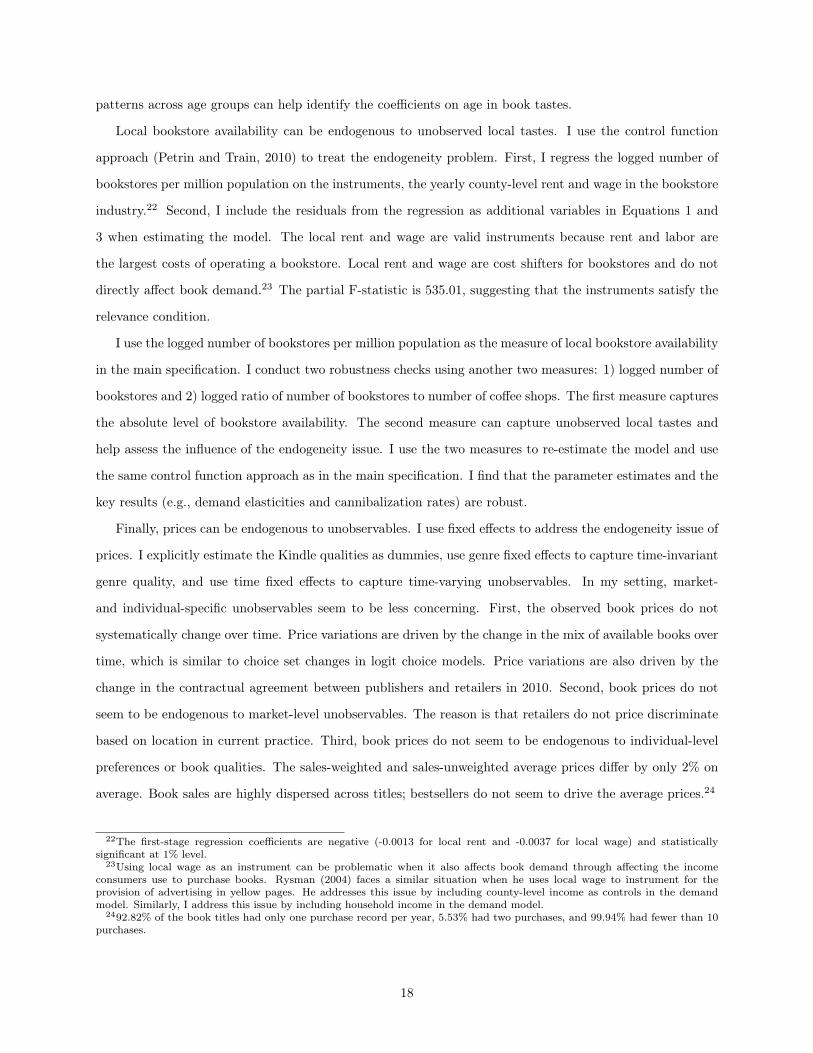
Kindle Adoption Figure 3 plots the Kindle penetration rate by 2012 across different levels of local
bookstore availability. Each data point on the graph represents the aggregate Kindle penetration rate by
2012 for counties with the same logged number of bookstores per million population. The graph suggests
that Kindle adoption decreases as local bookstore availability increases.
I also find that Kindle purchase appears to be correlated with book consumption in the data. Kindle
owners bought substantially more books than nonowners, especially “casual” books: a Kindle owner bought
9
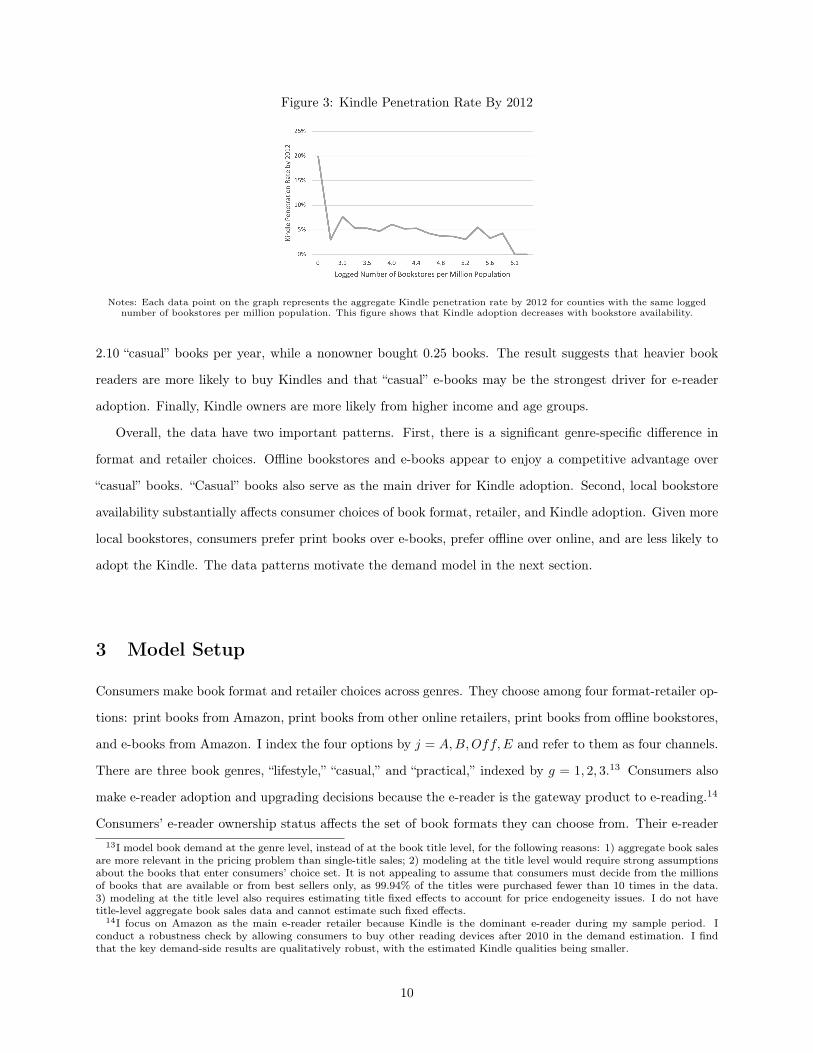
Figure 3: Kindle Penetration Rate By 2012
Notes: Each data point on the graph represents the aggregate Kindle penetration rate by 2012 for counties with the same loggednumber of bookstores per million population. This figure shows that Kindle adoption decreases with bookstore availability.
2.10 “casual” books per year, while a nonowner bought 0.25 books. The result suggests that heavier book
readers are more likely to buy Kindles and that “casual” e-books may be the strongest driver for e-reader
adoption. Finally, Kindle owners are more likely from higher income and age groups.
Overall, the data have two important patterns. First, there is a significant genre-specific difference in
format and retailer choices. Offline bookstores and e-books appear to enjoy a competitive advantage over
“casual” books. “Casual” books also serve as the main driver for Kindle adoption. Second, local bookstore
availability substantially affects consumer choices of book format, retailer, and Kindle adoption. Given more
local bookstores, consumers prefer print books over e-books, prefer offline over online, and are less likely to
adopt the Kindle. The data patterns motivate the demand model in the next section.
3 Model Setup
Consumers make book format and retailer choices across genres. They choose among four format-retailer op-
tions: print books from Amazon, print books from other online retailers, print books from offline bookstores,
and e-books from Amazon. I index the four options by j = A,B,Off,E and refer to them as four channels.
There are three book genres, “lifestyle,” “casual,” and “practical,” indexed by g = 1, 2, 3.13 Consumers also
make e-reader adoption and upgrading decisions because the e-reader is the gateway product to e-reading.14
Consumers’ e-reader ownership status affects the set of book formats they can choose from. Their e-reader13I model book demand at the genre level, instead of at the book title level, for the following reasons: 1) aggregate book sales
are more relevant in the pricing problem than single-title sales; 2) modeling at the title level would require strong assumptionsabout the books that enter consumers’ choice set. It is not appealing to assume that consumers must decide from the millionsof books that are available or from best sellers only, as 99.94% of the titles were purchased fewer than 10 times in the data.3) modeling at the title level also requires estimating title fixed effects to account for price endogeneity issues. I do not havetitle-level aggregate book sales data and cannot estimate such fixed effects.
14I focus on Amazon as the main e-reader retailer because Kindle is the dominant e-reader during my sample period. Iconduct a robustness check by allowing consumers to buy other reading devices after 2010 in the demand estimation. I findthat the key demand-side results are qualitatively robust, with the estimated Kindle qualities being smaller.
10

decisions also contain valuable information about their book reading preferences.
The model of book demand is motivated by several data patterns. First, consumers can buy multiple
books from a particular channel in a particular genre. Among the online consumers who bought books in a
channel-genre, 20% of them bought 2 books, 9% bought 3 books, and 5% bought 4 books in a channel-genre.
Second, consumers can buy from multiple channels within a particular genre. Among the online consumers
who bought books in a genre, 5.7% of them bought from two online channels and 0.14% bought from three
online channels in a genre. Third, consumers can buy from different channels for different genres. Among
the online consumers who bought books in multiple genres, 22.9% of them made different channel choices
across genres. Finally, there is considerable heterogeneity in consumers’ book quantity, channel, and genre
choices.
These data patterns suggest that I need a demand model that allows for multiple books bought within
a channel-genre and multiple channels chosen within a genre. I adopt a framework similar to Hendel (1999)
and Dubé (2004) to account for the multiple-discreteness in consumer demand. For a particular genre in
a particular period, consumers consider multiple future consumption occasions. For each occasion, they
choose whether to buy from one of the channels or not buying. I allow consumer preferences to vary across
occasions, which lead to different purchase and channel choices of each. Choosing to buy from the same
channel for multiple occasions results in multiple books bought within a channel-genre. Choosing different
channels for different occasions results in multiple channels chosen within a genre. I allow consumers to be
heterogeneous in their number of consumption occasions and within-occasion preferences. The model can
predict a vector of total purchases across channels and genres for each consumer in each period.
A noteworthy work on the e-book market is Li (2019), who studies inter-temporal price discrimination
of e-readers and e-books. I study the influence of e-books on existing channels and the optimal multichannel
strategy for publishers. My demand model differs from Li (2019) in important ways. First, I allow local
bookstore availability to affect all layers of consumer and firm decisions. It requires that I solve for these
decisions separately for 18 levels of bookstore availability, which significantly increases the computational
cost. To model bookstore availability, I also need to collect county-level data on bookstore availability and
sales and treat the endogeneity of bookstore availability using instruments. Second, Li (2019) assumes perfect
substitution across channels within a genre. I relax this assumption and allow for more flexible substitution
across channels, which is particularly important given my focus on multichannel management. Consumers
in my model can choose multiple channels within a genre. Third, Li (2019) abstracts from the supply-side
pricing problem of print books and thus simplifies the demand-side retailer choice of print books. I study
the supply-side pricing problem of both e-books and print books. Therefore, I fully model the demand-side
retailer choice as a function of retailer-specific prices.
11
Book Choices I assume that the number of consumption occasions for consumer i in genre g at
time t is an integer drawn from a Poisson distribution:
Higt ∼ P (λigt)
λigt = λig + γ1gNbsit (1)
where the mean of the Poisson distribution is a function of consumers’ genre-specific preference, captured by
unobserved heterogenous genre fixed effects λig, and the neighborhood that consumer i lives in, captured by
the logged number of local bookstores per million population N bsit . A consumer may have more consumption
occasions if she likes a particular genre and lives in a neighborhood with more bookstores.
For each of these occasions h = 1, 2, ...,Higt, consumers can choose not buying or buying one book title
in genre g from one of the four channels, j = A,B,Off,E. The mean utility of not buying is normalized to
0 so that uhi0gt = εhi0gt. The utility of buying from channel j is
uhijgt = θigt + δijgt + αipjgt + εhijgt (2)
where θigt = θig + β1Dagei + ξt is the baseline taste shared by all channels and δijgt is the channel-specific
taste. The baseline taste is a function of the unobserved heterogeneous genre fixed effect θig, consumer
demographics Dagei , and a common time fixed effect ξt. The time fixed effect captures any time-varying
unobservables that influence all channels. The price coefficient is allowed to vary by income groups as
αi = α0 + α1Dincomei . The error term εhijgt allows the same consumer in the same time period to have
different channel preferences across occasions. It is assumed to be identically and independently distributed
extreme value type I error with mean zero and scale parameter 1. The channel-specific taste δijgt is specified
as
δijgt =
κ0jg + κ1
jg · t+ ρown · 1 j = A, i = owner if j = A or B
θEg + ρE log nEt + β2Dagei if j = E
γ2gNbsit + β3D
agei if j = Off
(3)
For the online print book retailers j = AorB, the channel-specific taste depends on genre-specific fixed effectsκ0Ag, κ
0Bg
and linear time trends
κ1Ag, κ
1Bg
. The fixed effects can capture any time-invariant unobservables
and different breadths of print book selections across retailers. The time trends can parsimoniously capture
the steady growth trend of e-commerce as part of the total retail sales during my sample period.15 For the
e-book channel j = E, the channel-specific taste depends on genre fixed effects θEg , consumer demographics
15See http://www.census.gov/retail/mrts/www/data/pdf/ec_current.pdf.
12
Dagei , and time-varying e-book availability nEt .16 The e-book availability term can capture any time trend
in e-book preference because of increasing e-book availability. For the offline print channel j = Off , the
channel-specific taste depends on the logged number of local bookstores per million population N bsit and
consumer demographics Dagei . The influence of local bookstore availability γ2g can differ by genre, which
is motivated by the observed data pattern. The local bookstore availability N bsit can be endogenous to
unobserved local tastes. I treat the endogeneity issue using a control function approach. The details are in
Section 4.2.1. Finally, Kindle owners can have additional preference of buying print books from Amazon,
captured by ρown.
Let vhijgt denote the deterministic part of the utility uhijgt. Let superscript 0 denote Kindle nonowners
and 1 denote Kindle owners. The probability for consumer i to choose channel j in occasion h and genre g
at time t is
ψh0ijgt =
exp(vhijgt
)1 +
∑k=A,B,Off exp
(vhikgt
) (4)
ψh1ijgt =
exp(vhijgt
)1 +
∑k=A,B,Off,E exp
(vhikgt
)Note that for markets with no local bookstores, the choice of buying from the offline channel does not exist,
and the probability of buying from the offline channel is zero.
For each period t, I sum over the optimal channel choices across Higt consumption occasions and integrate
over the probability of havingHigt consumption occasions. The result is the model-predicted number of books
bought, or the optimal quantity choice, for consumer i in channel j and genre g:
qijgt =
∞∑Higt=1
∑h=1,..,Higt
ψhijgt
· Pr (Higt) (5)
where Pr (Higt) is the probability density function of Poisson distribution. The optimal quantity choice
allows consumers to choose different channels within a genre and across genres. It also allows consumers to
buy multiple books in the same channel for a particular genre.
I model book purchase independently across genres and do not allow for substitution across genres.
However, as discussed in Section 5.2 I allow the genre-specific preferences θig in θigt of Equation 2 to be
correlated across genres. Such correlation can generate the correlation of book consumption across genres.17
16The e-book availability is not genre-specific. If there is any difference in e-book availability across genres, it will be capturedby the genre fixed effects θEg .
17In the data there exists a mild correlation in book purchases across genres. Conditional on buying books in any of thethree genres, the correlation between the number of books bought is 0.22 for “lifestyle” and “practical” genres, 0.19 for “lifestyle”and “casual” genres, and 0.10 for “casual” and “practical” genres. This data pattern can be generated by either allowing forinteraction among genre-specific utilities (i.e., substitution across genres) or a positive correlation in genre-specific preferences.
13

Device Choices Consumers make ex-ante decisions of e-reader adoption. In each period, consumers
who have not purchased a Kindle decide whether to buy the latest Kindle version given its price Pt and
quality Qt. Consumers who own a Kindle of quality Qit decide whether to upgrade to the latest version. Let
V 0it and V 1
it denote the ex-ante indirect book utilities for Kindle nonowners and owners. A Kindle nonowner
who chooses not to buy a Kindle receives book utility only from print books; her device flow utility is
U0it = Γ · V 0
it + ε0it. A Kindle owner who chooses not to upgrade receives book utility from both print books
and e-books; her flow utility is U1it = Γ · V 1
it + Qit + ε1it. For both Kindle owners and nonowners, buying
the latest Kindle version gives them a flow utility of U1it = Γ · V 1
it + Qt + aiPt + ε1it.18 The price coefficient
can vary by income group as ai = a0 + a1Dincomei . The idiosyncratic shocks
ε0it, ε
1it, ε
1it
are identically and
independently distributed extreme value type I errors. The mean is the negative of the Euler constant and
the scale parameter is 1. I assume that these device-side shocks are independent of the book-side shocks.The ex-ante indirect book utilities for Kindle nonowners and owners at time t are obtained in two steps.
I first take expectations over the book utilities across consumption occasions and genres. I then integrateover the distribution of the total number of occasions. Specifically:
V0it =
∞∑Higt=1
Pr (Higt) · E
∑g
Higt∑h=1
maxj=A,B,Off
uhijgt
=
∞∑Higt=1
Pr (Higt) ·
∑g
Higt∑h=1
ln
1 +∑
i=A,B,Off
exp(vhijgt
)V
1it =
∞∑Higt=1
Pr (Higt) · E
∑g
Higt∑h=1
maxj=A,B,Off,E
uhijgt
=
∞∑Higt=1
Pr (Higt) ·
∑g
Higt∑h=1
ln
1 +∑
i=A,B,Off,E
exp(vhijgt
) (6)
Intuitively, consumers are motivated to buy Kindles because the enlarged choice set of book formats
increases their book utility from V 0it to V 1
it . To make the notation more general, I use Uit to jointly denote
the flow utility of waiting for nonowners and ownersU0it, U
1it
. Kindle quality is Qit = 0 for a nonowner.
Let dit denote the device decision at time t. It equals 1 if the consumer chooses to purchase or upgrade and
equals 0 if the consumer chooses to wait. The Bellman equation for the dynamic device decision is
V(Qit,Ωt, ~εit
)= max
Uit + δE
[V(Qit,Ωt+1, ~εit+1
)| Ωt, dit = 0
], (7)
Uit + δE [V (Qt,Ωt+1, ~εit+1) | Ωt, dit = 1]
where the state space contains the current Kindle ownership status Qit, the book prices and e-book avail-
ability, the latest Kindle price and quality, and the device-side idiosyncratic shocks ~εit ≡ εit, εit. The
Kindle ownership status evolves to Qit+1 = Qt if the consumer chooses to buy or upgrade and remains at
As the data cannot separately identify the two, I allow for the correlation in the genre-specific preferences θig in θigt of Equation2 and do not allow for interaction among genre-specific utilities. As shown in the estimation results in Section 5.2, the datareveal four heterogeneous preference segments. One of them prefers both “lifestyle” and “practical” books. One of them prefersall three genres. Both segments represent a positive correlation in genre preferences and can generate a positive correlation ingenre consumption.
18In this setup, Kindle qualities do not interact with book utilities so that consumers’ book utilities are not affected by thetypes of Kindles they use. The reason is that I cannot empirically identify such a relationship. I add Kindle quality dummiesto book utilities in a robustness check and find that the estimated dummies are insignificant.
14
Qit+1 = Qit if the consumer chooses to wait. I assume that consumers have perfect foresight on book prices,
Kindle prices and qualities so that the rest of the state space Ωt evolves to Ωt+1 according to consumers’
expectation about next period values h (Ωt+1|Ωt).19 The probability vector of buying or upgrading is
φ(dit = 1 | Qit,Ωt
)=
A
A+B
A = exp (Uit − εit + δE [V (Qt,Ωt+1, ~εit+1) | Ωt, dit = 1]) (8)
B = exp(Uit − εit + δE
[V(Qit,Ωt+1, ~εit+1
)| Ωt, dit = 0
])Key Model Features I would like to highlight how local bookstore availability N bs
it affects all layers
of consumer choices and the substitution patterns of print and e-book formats.
First, N bsit affects the total number of consumption occasions through γ1g. Consumers who live in
neighborhoods with larger N bsit may buy more books from all channels, which indicates a spillover effect from
the offline channel to all channels. Second, N bsit affects the book retailer choices through γ2g. Consumers
who live in neighborhoods with larger N bsit are more likely to choose offline as N bs
it affects the offline-specific
taste. Third, N bsit affects the device adoption decision as γ1g and γ2g enter the device utility through the
book utility.
The local bookstore availability N bsit also affects the substitution patterns across channels. E-books
cannibalize print book sales when two conditions hold: (1) consumers would buy print books in the absence
of e-books, and (2) consumers would prefer e-books to print books when they can choose from both formats.
Market expansion occurs when Condition 2 holds and Condition 1 does not hold. In the model, Condition
1 is determined by the heterogeneous baseline taste. Condition 2 is determined by the e-format and offline
specific tastes and the price differences between e-books and print books. Both conditions are further affected
by the total number of consumption occasions. When N bsit is large, Condition 1 is more likely to hold because
consumers are more likely to have more consumption occasions and buy from offline. Condition 2 is less likely
to hold because consumers are less likely to prefer e-books to print books. Therefore, market expansion is
likely to be lower when N bsit is larger, while whether cannibalization is larger is an empirical question. Finally,
N bsit influences the device choices and how many consumers are substituting between e-books and print books.
19In a robustness check I allow consumer expectations to follow an AR(1) process and empirically estimate the coefficientsof the AR(1) model. The results are robust. I keep the perfect foresight assumption because Kindle prices changed annuallyduring the five-year data period; the short panel makes it less attractive to estimate an AR(1) process.
15
4 Estimation Method
4.1 Likelihood Function and Estimation Method
The model is estimated using the nested fixed point algorithm (NFXP) proposed by Rust (1987). The
likelihood function consists of the joint probabilities of device ownership and book choices. I first derive
the device ownership probabilities. Let
Ψ1it,Ψ
0it
denote the probabilities of having and not having any
Kindles at time t. For each period, the probability of having the latest Kindle version Qt at time t equals the
probability of buying for Kindle nonowners plus the probability of upgrading for previous Kindle owners:
Pr(Qit = Qiτ
)= Ψ0
i,t−1 · φ (dit = 1 | 0,Ωt) +
t−1∑τ ′=2008
Pr(Qi,t−1 = Qiτ ′
)· φ (dit = 1 | Qiτ ′ ,Ωt) , for τ = t
The probability of holding a previous Kindle version Qiτ equals the probability of owning Qiτ times the
probability of not upgrading:
Pr(Qit = Qiτ
)= Pr
(Qi,t−1 = Qiτ
)[1− φ (dit = 1 | Qiτ ,Ωt)] , for τ < t
Note that Ψ0i,2008 = 1 as no Kindles were owned in 2008. Given these probabilities, the probability of having
and not having any Kindles are Ψ1it =
∑τ≤t Pr
(Qit = Qiτ
)and Ψ0
it = 1−Ψ1it.
I then derive the joint probabilities of device ownership and book channel choices. Conditional on having
Higt number of consumption occasions, a consumer with observed book purchase vector qijgtj,g must have
chosen the outside option in Higt−∑j qijgt number of occasions. The joint probabilities of device and book
choices for a Kindle nonowner and an owner are
l0i (Higt) = Ψ0it ·∏g
∏j
(ψh0ijgt)qijgt ·1−
∑j
ψh0ijgt
Higt−∑
j qijgt
l1i (Higt) = Ψ1it ·∏g
∏j
(ψh1ijgt)qijgt ·1−
∑j
ψh1ijgt
Higt−∑
j qijgt
Integrating over the distribution of Higt, an individual’s contribution to the likelihood function is L0i =∑∞
Higt=1 l0i (Higt) ·Pr (Higt) for a Kindle nonowner and L1
i =∑∞Higt=1 l
1i (Higt) ·Pr (Higt) for a Kindle owner.
Here, Pr (Higt) is the Poisson probability density function.20 Note that I need to calculate the book and
device probabilities separately for different unobserved taste segments, observed demographics groups and 18
neighborhood types (zero and 17 non-zero values of N bsit ). Summing over the observed types and integrating
over the unobserved types for each neighborhood, I can obtain the total log likelihood function.21
20Numerically, the integration is conducted over Higt = 1, 2, ..., H instead of from 1 to infinity. I choose a large enough Hsuch that Pr
(Higt = H
)is a very small value (in the magnitude of 10−3).
21Due to yearly resampling, I cannot always observe the book purchase transactions for consumers for whom I observe Kindlepurchase transactions. This issue is minor because I do not need to observe consumers’ actual book purchases to calculate
16

I impose additional over-identifying constraints. For each genre and county in each year, I impose one
constraint that let the model-predicted offline book sales be equal to those observed in the data Rgmt (Θ) =
Rgmt. Here, the model-predicted sales Rgmt (Θ) come from summing over the predicted individual quantities
in Equation 5. The observed sales Rgmt come from scaling down the population-level sales in the data to the
sample level. Specifically, the data contain the population-level offline book sales Rpopgmt. Let Ipopm denote the
population size and Im denote the sample size in market m. The sample-level sales are obtained by scaling
down the population-level sales as Rgmt = Rpopgmt/Ipopm ∗ Im. Overall, the model estimation is conducted by
solving a constrained optimization problem that maximizes the total log likelihood function subject to the
aggregate constraints Rgmt (Θ) = Rgmt. The number of constraints equals the number of unique county-
genre-year combinations in the data sample.
4.2 Identification
4.2.1 General Identification Strategy
The bookstore-related parameters γ1g, γ2g are identified from how consumer book channel and device
choices differ by local bookstore availability. Conditional on the local bookstore availability, the genre fixed
effects in the baseline taste are identified from the genre market shares. The genre fixed effects in the e-format
taste and the coefficient on time-varying e-book availability are identified from the genre-specific format
market shares and their variations over time. The retailer fixed effects and the time trends are identified
from the retailer market shares and their variations over time. The coefficients on demographics are identified
from the consumption patterns across demographic groups. The rest of the variation is explained by the
variation in book prices across genres, channels, and over time. On the device side, given the same Kindle
price and quality, the coefficient on book utility is identified from how Kindle adoption probabilities vary
by consumer type and bookstore availability. Given the same consumer type and bookstore availability, the
price coefficient and Kindle quality dummies are jointly identified from the Kindle adoption probabilities
over time. Parameters that enter book utility also enter device utility, so the device-side data can provide
additional identification power for the book-side parameters. For instance, the observed Kindle adoption
their Kindle purchase probability; the indirect book utilities in the Kindle purchase utilities are calculated by taking theexpectation over the error terms in the book choices. The log likelihood function of the Kindle purchase data thus contains onlyKindle adoption probabilities:
∑t ni1t log [Pr (dit = 1)] + ni0t log [1− Pr (dit = 1)]. Here, ni1t is the observed Kindle
sales, ni0t = Ni0 −∑tτ=1 ni1τ is the number of decisions to not buy, and Ni0 is the initial market size of type i consumers.
Yearly resampling also means that I cannot always observe Kindle adoption decisions for consumers for whom I observe booktransactions if their Kindle adoption occurred in a different year. I take a probabilistic view of consumers’ device ownershipstatus: for consumers who bought e-books, I assume that they own Kindles; for consumers who did not buy e-books, similar toGowrisakanran and Rysman (2012), I allow them to have Kindles with the model-predicted device ownership probability Ψ1
it.Li (2019) uses similar individual-level online transaction data and faces a similar resampling problem. I refer to Li (2019) formore details on how the log likelihood of the book purchase data is constructed.
17
patterns across age groups can help identify the coefficients on age in book tastes.
Local bookstore availability can be endogenous to unobserved local tastes. I use the control function
approach (Petrin and Train, 2010) to treat the endogeneity problem. First, I regress the logged number of
bookstores per million population on the instruments, the yearly county-level rent and wage in the bookstore
industry.22 Second, I include the residuals from the regression as additional variables in Equations 1 and
3 when estimating the model. The local rent and wage are valid instruments because rent and labor are
the largest costs of operating a bookstore. Local rent and wage are cost shifters for bookstores and do not
directly affect book demand.23 The partial F-statistic is 535.01, suggesting that the instruments satisfy the
relevance condition.
I use the logged number of bookstores per million population as the measure of local bookstore availability
in the main specification. I conduct two robustness checks using another two measures: 1) logged number of
bookstores and 2) logged ratio of number of bookstores to number of coffee shops. The first measure captures
the absolute level of bookstore availability. The second measure can capture unobserved local tastes and
help assess the influence of the endogeneity issue. I use the two measures to re-estimate the model and use
the same control function approach as in the main specification. I find that the parameter estimates and the
key results (e.g., demand elasticities and cannibalization rates) are robust.
Finally, prices can be endogenous to unobservables. I use fixed effects to address the endogeneity issue of
prices. I explicitly estimate the Kindle qualities as dummies, use genre fixed effects to capture time-invariant
genre quality, and use time fixed effects to capture time-varying unobservables. In my setting, market-
and individual-specific unobservables seem to be less concerning. First, the observed book prices do not
systematically change over time. Price variations are driven by the change in the mix of available books over
time, which is similar to choice set changes in logit choice models. Price variations are also driven by the
change in the contractual agreement between publishers and retailers in 2010. Second, book prices do not
seem to be endogenous to market-level unobservables. The reason is that retailers do not price discriminate
based on location in current practice. Third, book prices do not seem to be endogenous to individual-level
preferences or book qualities. The sales-weighted and sales-unweighted average prices differ by only 2% on
average. Book sales are highly dispersed across titles; bestsellers do not seem to drive the average prices.24
22The first-stage regression coefficients are negative (-0.0013 for local rent and -0.0037 for local wage) and statisticallysignificant at 1% level.
23Using local wage as an instrument can be problematic when it also affects book demand through affecting the incomeconsumers use to purchase books. Rysman (2004) faces a similar situation when he uses local wage to instrument for theprovision of advertising in yellow pages. He addresses this issue by including county-level income as controls in the demandmodel. Similarly, I address this issue by including household income in the demand model.
2492.82% of the book titles had only one purchase record per year, 5.53% had two purchases, and 99.94% had fewer than 10purchases.
18

4.2.2 Unobserved Consumption Occasions and Aggregate Offline Sales
The multiple-discreteness of the demand model induces an identification challenge: I do not observe the
number of consumption occasions and cannot distinguish, for instance, whether a consumer who bought five
books was purchasing five books on one occasion or one book on five occasions each. Hendel (1999) and
Dubé (2004) face a similar challenge. Similar to Hendel (1999) and Dubé (2004), I identify the parameters
in the number of occasions from the joint distribution of the number of books bought and the number of
channels chosen. Intuitively, a consumer can choose different channels for different consumption occasions
because the random components of her preference are uncorrelated across occasions. Therefore, a consumer
with more occasions would be more likely to purchase from multiple channels, while a consumer with fewer
occasions would be more likely to purchase from fewer channels.
An additional identification challenge in my context is that the book purchase data are at the individual
level for the online channels and at the county level for the offline channel. It means that I do not fully observe
all the channel choices that an individual makes. The challenge is how such data can identify substitution
patterns across individuals. Individuals differ in demographics and local bookstore availability in the model.
The substitution patterns across individuals are determined by the parameters regarding demographics and
bookstore availability in consumption occasions λigt and channel preference uhijgt. Therefore, the identifi-
cation challenge boils down to how these parameters are identified using a combination of individual-level
and aggregate data. Below I describe the intuition for the identification strategy. I further conduct a Monte
Carlo study to assess the identification power of such a dataset.
In the data, markets differ in demographics, bookstore availability, and aggregate book sales by channel.
The key parameters of interest, demographic- and bookstore-related parameters in consumption occasions
and channel preference, can be identified from how aggregate book sales vary by demographics and bookstore
availability across markets. Take the bookstore-related parameters as an example. The bookstore availability
enters consumption occasions through γ1g in Equations 1 and channel preference through γ2g in Equation 3.
A larger γ1g affects all channels as it increases the number of consumption occasions, while a larger γ2g only
favors the offline channel as it increases the offline-specific taste. Therefore, γ1g is identified if per-person
total sales across all channels are larger in markets with more bookstores, while γ2g is identified if offline
sales are disproportionally larger relative to total sales in markets with more bookstores. Similar to γ2g, the
demographic-related parameter on age in channel preference is identified if offline sales are disproportionally
larger relative to total sales in markets with older population. In general, the key parameters in consumption
occasions λigt are identified from how the per-person total sales vary across markets. The key parameters
in channel preference uhijgt are identified from how the channel-specific sales vary across markets. These
19
parameters are further identified from how device choices vary across markets.
Given the identified parameters in consumption occasions and channel preference, the substitution pat-
terns are determined. For instance, a larger bookstore-related parameter in channel preference indicates
that individuals in markets with more bookstores are more likely to prefer the offline channel. The model
fit results in Section 5.1 suggest that the estimated model is able to generate substitution patterns that
are consistent with the observed data. The identified parameters also allow me to distinguish whether the
aggregate offline book sales come from (1) many individuals, each with one purchase, or (2) one individual
with many purchases. The intuition is that if the parameters in consumption occasions are relatively larger,
then case (2) is more likely to happen, as a single consumer is more likely to have many occasions; if the
parameters in book preference are larger, then case (1) is more likely to happen, as more individuals are
more likely to buy books. Finally, although I do not observe individual-level offline purchases, the identified
parameters in channel preference allow me to determine which individuals are more likely to contribute to
the observed aggregate offline sales: the aggregate offline sales are more likely to come from consumers with
demographics or bookstore availability that favor the offline channel (e.g., older consumers in markets with
more bookstores).
I further conduct a Monte Carlo study as a robustness check to assess whether the model is able to
use aggregate offline sales data to recover key parameters related to substitution patterns and consumption
occasions. Gordon (2009) adopts a similar approach to illustrate how combining aggregate sales data and
penetration data can identify new purchase versus upgrading. First, I use the true parameter values to
simulate book and Kindle purchases for each individual. Second, I aggregate over the individual purchases
in the offline channel to form the county-level aggregate offline book sales. Third, I combine the aggregate
offline book sales with the individual-level online book and Kindle sales. The combined data have the same
features as the main dataset of the paper and are used to estimate the model. Finally, I compare the
estimates with the true parameters. The results suggest that the combined data can produce close estimates
of the true parameters. The details are in the appendix.
5 Demand-side Results
5.1 Model Fit
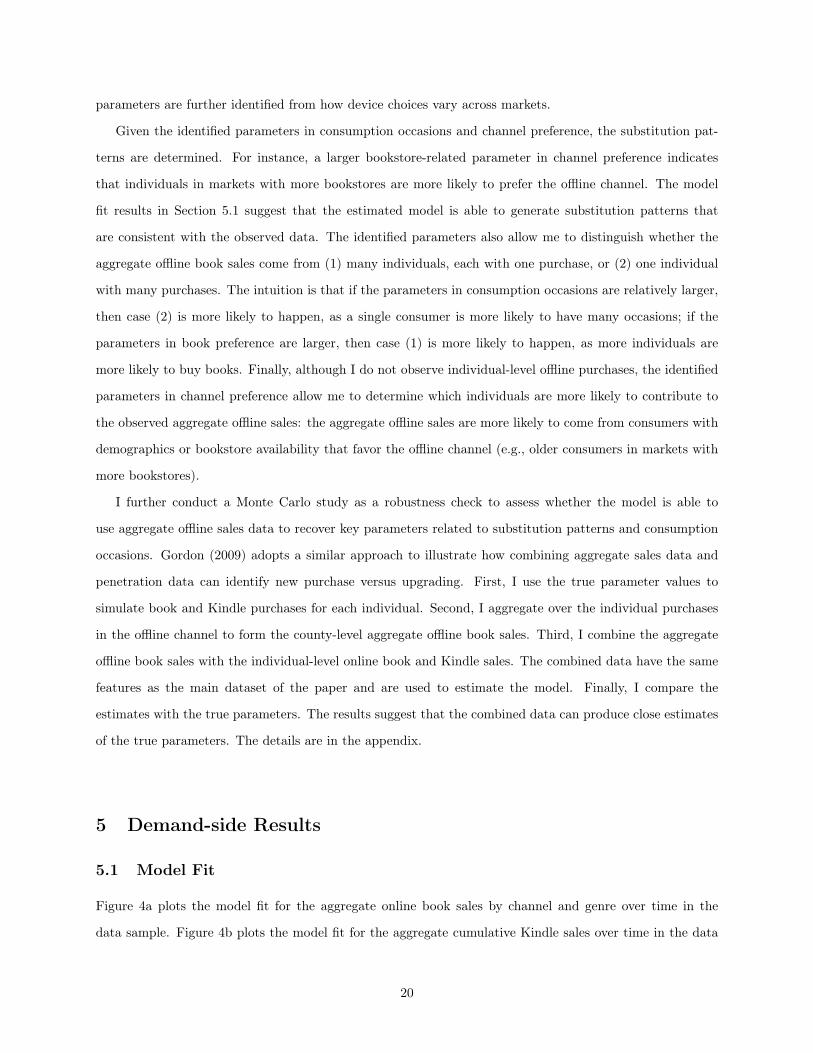
Figure 4a plots the model fit for the aggregate online book sales by channel and genre over time in the
data sample. Figure 4b plots the model fit for the aggregate cumulative Kindle sales over time in the data
20
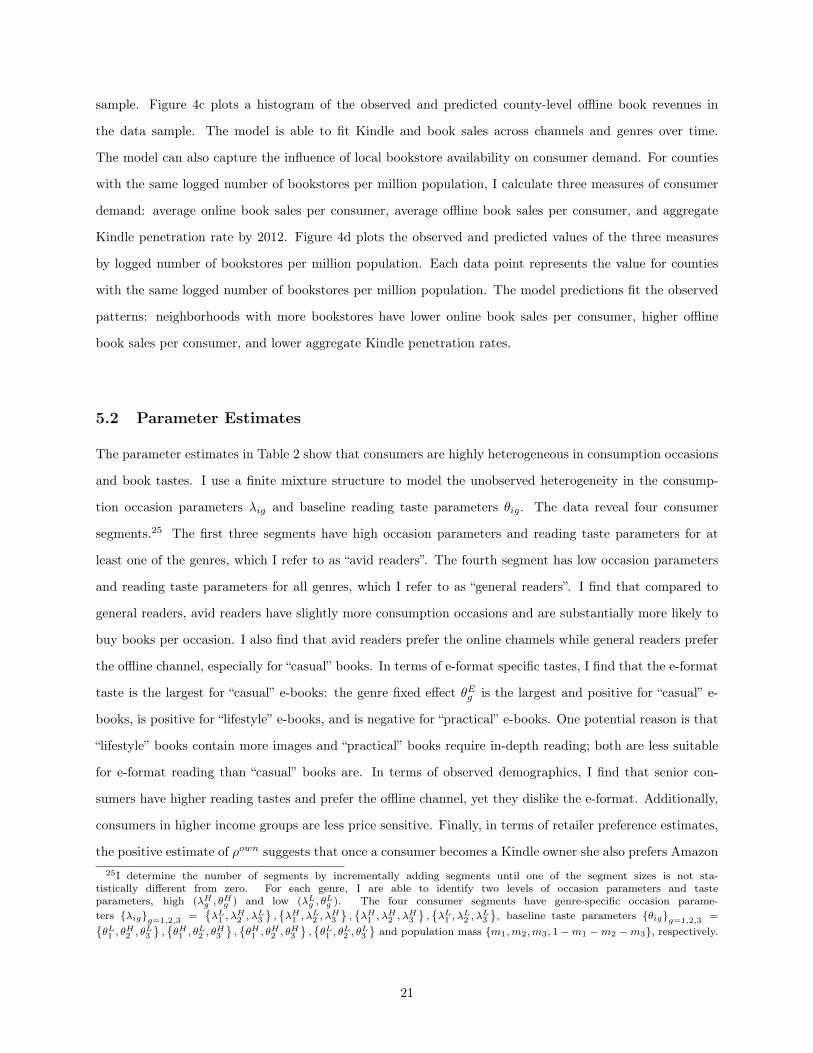
sample. Figure 4c plots a histogram of the observed and predicted county-level offline book revenues in
the data sample. The model is able to fit Kindle and book sales across channels and genres over time.
The model can also capture the influence of local bookstore availability on consumer demand. For counties
with the same logged number of bookstores per million population, I calculate three measures of consumer
demand: average online book sales per consumer, average offline book sales per consumer, and aggregate
Kindle penetration rate by 2012. Figure 4d plots the observed and predicted values of the three measures
by logged number of bookstores per million population. Each data point represents the value for counties
with the same logged number of bookstores per million population. The model predictions fit the observed
patterns: neighborhoods with more bookstores have lower online book sales per consumer, higher offline
book sales per consumer, and lower aggregate Kindle penetration rates.
5.2 Parameter Estimates
The parameter estimates in Table 2 show that consumers are highly heterogeneous in consumption occasions
and book tastes. I use a finite mixture structure to model the unobserved heterogeneity in the consump-
tion occasion parameters λig and baseline reading taste parameters θig. The data reveal four consumer
segments.25 The first three segments have high occasion parameters and reading taste parameters for at
least one of the genres, which I refer to as “avid readers”. The fourth segment has low occasion parameters
and reading taste parameters for all genres, which I refer to as “general readers”. I find that compared to
general readers, avid readers have slightly more consumption occasions and are substantially more likely to
buy books per occasion. I also find that avid readers prefer the online channels while general readers prefer
the offline channel, especially for “casual” books. In terms of e-format specific tastes, I find that the e-format
taste is the largest for “casual” e-books: the genre fixed effect θEg is the largest and positive for “casual” e-
books, is positive for “lifestyle” e-books, and is negative for “practical” e-books. One potential reason is that
“lifestyle” books contain more images and “practical” books require in-depth reading; both are less suitable
for e-format reading than “casual” books are. In terms of observed demographics, I find that senior con-
sumers have higher reading tastes and prefer the offline channel, yet they dislike the e-format. Additionally,
consumers in higher income groups are less price sensitive. Finally, in terms of retailer preference estimates,
the positive estimate of ρown suggests that once a consumer becomes a Kindle owner she also prefers Amazon25I determine the number of segments by incrementally adding segments until one of the segment sizes is not sta-
tistically different from zero. For each genre, I are able to identify two levels of occasion parameters and tasteparameters, high (λHg , θHg ) and low (λLg , θLg ). The four consumer segments have genre-specific occasion parame-ters λigg=1,2,3 =
λL1 , λ
H2 , λ
L3
,λH1 , λ
L2 , λ
H3
,λH1 , λ
H2 , λ
H3
,λL1 , λ
L2 , λ
L3
, baseline taste parameters θigg=1,2,3 =
θL1 , θH2 , θ
L3
,θH1 , θ
L2 , θ
H3
,θH1 , θ
H2 , θ
H3
,θL1 , θ
L2 , θ
L3
and population mass m1,m2,m3, 1−m1 −m2 −m3, respectively.
21
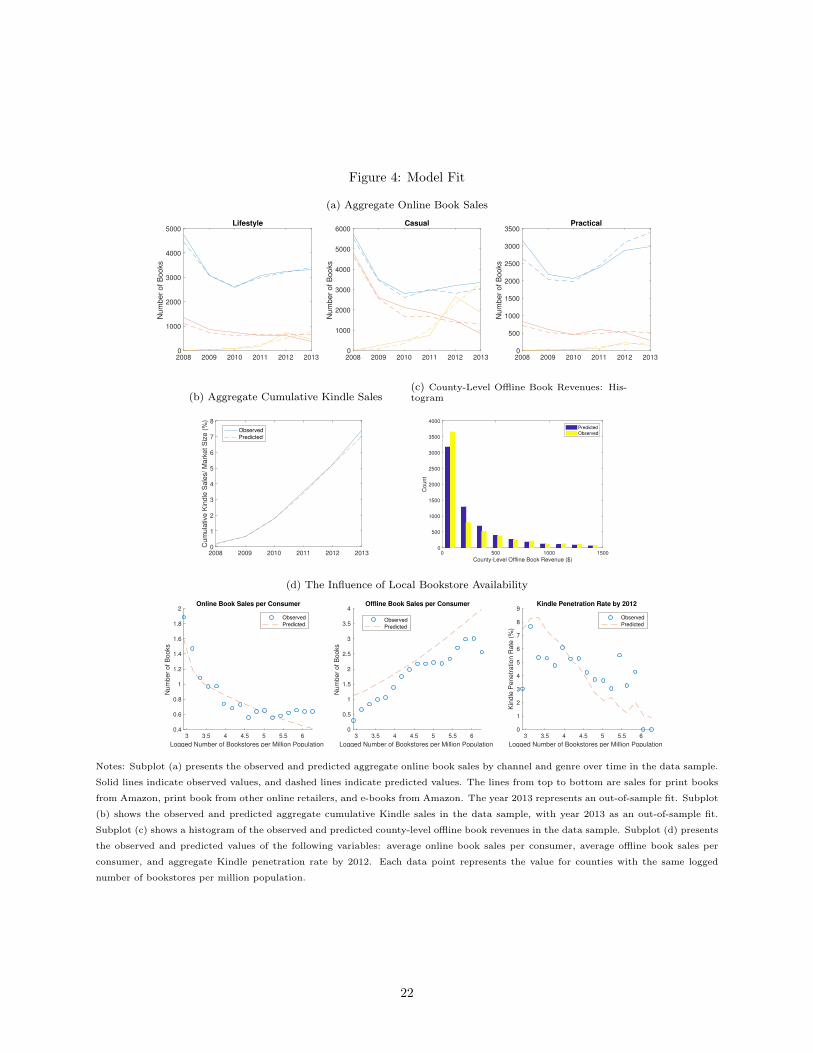
Figure 4: Model Fit
(a) Aggregate Online Book Sales
2008 2009 2010 2011 2012 2013
0
1000
2000
3000
4000
5000
Nu
mb
er
of
Bo
oks
Lifestyle
2008 2009 2010 2011 2012 2013
0
1000
2000
3000
4000
5000
6000
Nu
mb
er
of
Bo
oks
Casual
2008 2009 2010 2011 2012 2013
0
500
1000
1500
2000
2500
3000
3500
Nu
mb
er
of
Bo
oks
Practical
(b) Aggregate Cumulative Kindle Sales
2008 2009 2010 2011 2012 20130
1
2
3
4
5
6
7
8
Cum
ula
tive K
indle
Sale
s/ M
ark
et S
ize (
%)
Observed
Predicted
(c) County-Level Offline Book Revenues: His-togram
0 500 1000 1500
County-Level Offline Book Revenue ($)
0
500
1000
1500
2000
2500
3000
3500
4000C
ount
PredictedObserved
(d) The Influence of Local Bookstore Availability
3 3.5 4 4.5 5 5.5 6
Logged Number of Bookstores per Million Population
0.4
0.6
0.8
1
1.2
1.4
1.6
1.8
2
Nu
mb
er
of
Bo
oks
Online Book Sales per Consumer
Observed
Predicted
3 3.5 4 4.5 5 5.5 6
Logged Number of Bookstores per Million Population
0
0.5
1
1.5
2
2.5
3
3.5
4
Nu
mb
er
of
Bo
oks
Offline Book Sales per Consumer
Observed
Predicted
3 3.5 4 4.5 5 5.5 6
Logged Number of Bookstores per Million Population
0
1
2
3
4
5
6
7
8
9
Kin
dle
Pe
ne
tra
tio
n R
ate
(%
)
Kindle Penetration Rate by 2012
Observed
Predicted
Notes: Subplot (a) presents the observed and predicted aggregate online book sales by channel and genre over time in the data sample.
Solid lines indicate observed values, and dashed lines indicate predicted values. The lines from top to bottom are sales for print books
from Amazon, print book from other online retailers, and e-books from Amazon. The year 2013 represents an out-of-sample fit. Subplot
(b) shows the observed and predicted aggregate cumulative Kindle sales in the data sample, with year 2013 as an out-of-sample fit.
Subplot (c) shows a histogram of the observed and predicted county-level offline book revenues in the data sample. Subplot (d) presents
the observed and predicted values of the following variables: average online book sales per consumer, average offline book sales per
consumer, and aggregate Kindle penetration rate by 2012. Each data point represents the value for counties with the same logged
number of bookstores per million population.
22
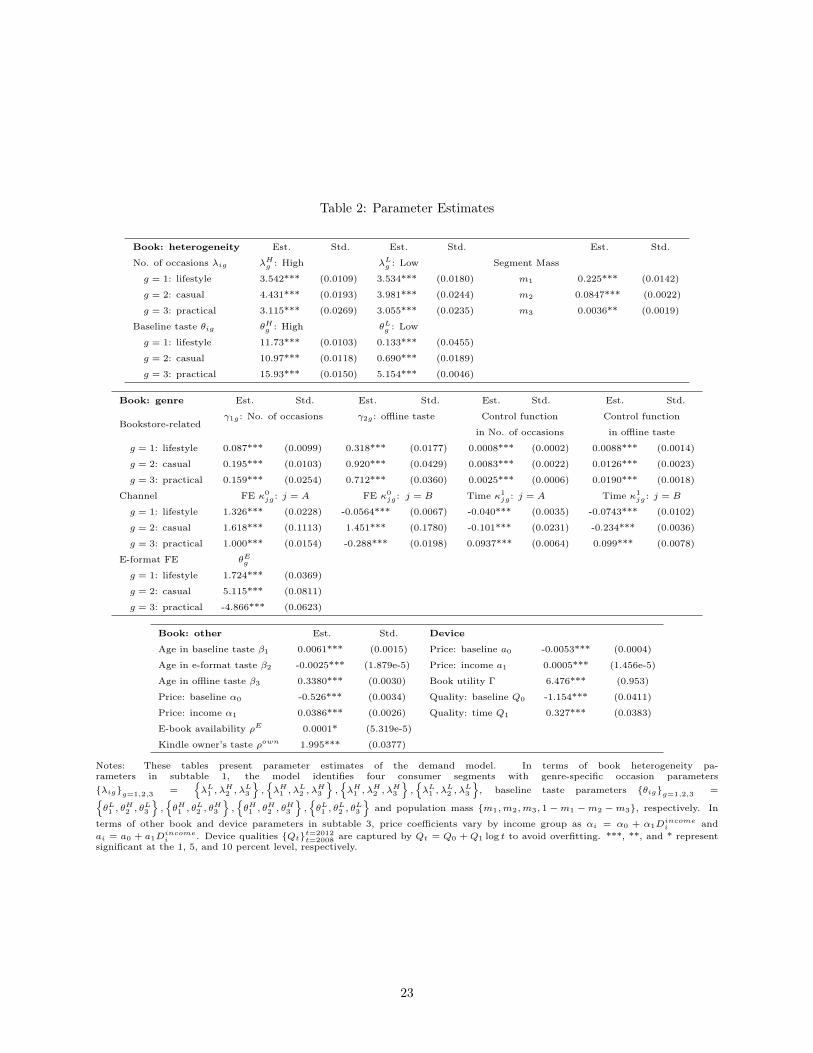
Table 2: Parameter Estimates
Book: heterogeneity Est. Std. Est. Std. Est. Std.
No. of occasions λig λHg : High λL
g : Low Segment Mass
g = 1: lifestyle 3.542*** (0.0109) 3.534*** (0.0180) m1 0.225*** (0.0142)
g = 2: casual 4.431*** (0.0193) 3.981*** (0.0244) m2 0.0847*** (0.0022)
g = 3: practical 3.115*** (0.0269) 3.055*** (0.0235) m3 0.0036** (0.0019)
Baseline taste θig θHg : High θLg : Low
g = 1: lifestyle 11.73*** (0.0103) 0.133*** (0.0455)
g = 2: casual 10.97*** (0.0118) 0.690*** (0.0189)
g = 3: practical 15.93*** (0.0150) 5.154*** (0.0046)
Book: genre Est. Std. Est. Std. Est. Std. Est. Std.
Bookstore-relatedγ1g : No. of occasions γ2g : offline taste Control function Control function
in No. of occasions in offline taste
g = 1: lifestyle 0.087*** (0.0099) 0.318*** (0.0177) 0.0008*** (0.0002) 0.0088*** (0.0014)
g = 2: casual 0.195*** (0.0103) 0.920*** (0.0429) 0.0083*** (0.0022) 0.0126*** (0.0023)
g = 3: practical 0.159*** (0.0254) 0.712*** (0.0360) 0.0025*** (0.0006) 0.0190*** (0.0018)
Channel FE κ0jg : j = A FE κ0
jg : j = B Time κ1jg: j = A Time κ1
jg : j = B
g = 1: lifestyle 1.326*** (0.0228) -0.0564*** (0.0067) -0.040*** (0.0035) -0.0743*** (0.0102)
g = 2: casual 1.618*** (0.1113) 1.451*** (0.1780) -0.101*** (0.0231) -0.234*** (0.0036)
g = 3: practical 1.000*** (0.0154) -0.288*** (0.0198) 0.0937*** (0.0064) 0.099*** (0.0078)
E-format FE θEg
g = 1: lifestyle 1.724*** (0.0369)
g = 2: casual 5.115*** (0.0811)
g = 3: practical -4.866*** (0.0623)
Book: other Est. Std. Device
Age in baseline taste β1 0.0061*** (0.0015) Price: baseline a0 -0.0053*** (0.0004)
Age in e-format taste β2 -0.0025*** (1.879e-5) Price: income a1 0.0005*** (1.456e-5)
Age in offline taste β3 0.3380*** (0.0030) Book utility Γ 6.476*** (0.953)
Price: baseline α0 -0.526*** (0.0034) Quality: baseline Q0 -1.154*** (0.0411)
Price: income α1 0.0386*** (0.0026) Quality: time Q1 0.327*** (0.0383)
E-book availability ρE 0.0001* (5.319e-5)
Kindle owner’s taste ρown 1.995*** (0.0377)
Notes: These tables present parameter estimates of the demand model. In terms of book heterogeneity pa-rameters in subtable 1, the model identifies four consumer segments with genre-specific occasion parametersλigg=1,2,3 =
λL1 , λ
H2 , λ
L3
,λH1 , λ
L2 , λ
H3
,λH1 , λ
H2 , λ
H3
,λL1 , λ
L2 , λ
L3
, baseline taste parameters θigg=1,2,3 =
θL1 , θH2 , θ
L3
,θH1 , θ
L2 , θ
H3
,θH1 , θ
H2 , θ
H3
,θL1 , θ
L2 , θ
L3
and population mass m1,m2,m3, 1−m1 −m2 −m3, respectively. In
terms of other book and device parameters in subtable 3, price coefficients vary by income group as αi = α0 + α1Dincomei and
ai = a0 + a1Dincomei . Device qualities Qtt=2012
t=2008 are captured by Qt = Q0 + Q1 log t to avoid overfitting. ***, **, and * representsignificant at the 1, 5, and 10 percent level, respectively.
23
for print book purchases. The finding suggests that although Amazon suffers cannibalization loss as a print
book retailer, it benefits from e-books in two ways: it gains additional e-book sales from market expansion
and gains additional print book sales from Kindle owners.
The estimated bookstore-related parameters γ1g and γ2g are positive. In the model, γ1g captures the
influence of bookstore availability on the number of consumption occasions and γ2g captures the influence
of bookstore availability on the preference for offline retailers. The positive estimates of γ1g and γ2g suggest
that as the local bookstore availability increases, consumers have more consumption occasions, are more
likely to buy from offline bookstores, and are less likely to adopt Kindles. The estimated γ2g is the largest
for “casual” books, suggesting that bookstore availability helps offline the most for “casual” books. If the
logged number of bookstores per million population increases from 2.9 to 4.8, the probability of choosing
offline in a consumption occasion would increase by 23.7 percentage points for “casual” books. The Kindle
penetration rate by 2012 would also drop by 39.6%.
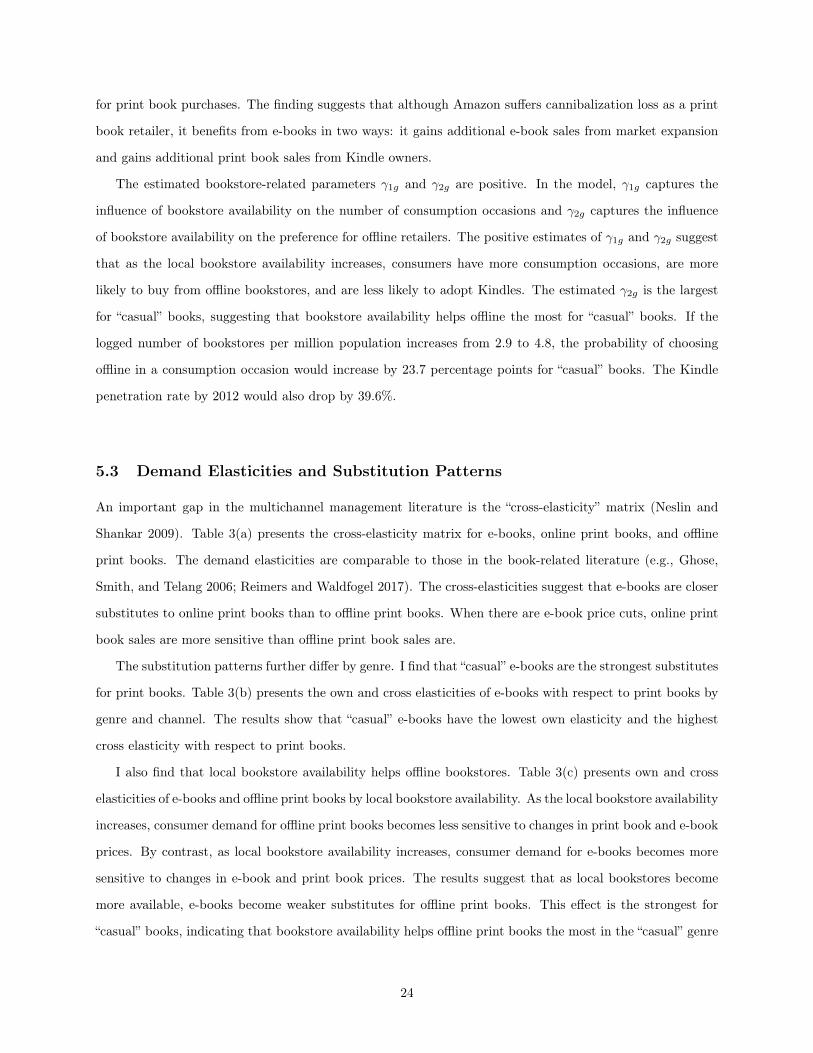
5.3 Demand Elasticities and Substitution Patterns
An important gap in the multichannel management literature is the “cross-elasticity” matrix (Neslin and
Shankar 2009). Table 3(a) presents the cross-elasticity matrix for e-books, online print books, and offline
print books. The demand elasticities are comparable to those in the book-related literature (e.g., Ghose,
Smith, and Telang 2006; Reimers and Waldfogel 2017). The cross-elasticities suggest that e-books are closer
substitutes to online print books than to offline print books. When there are e-book price cuts, online print
book sales are more sensitive than offline print book sales are.
The substitution patterns further differ by genre. I find that “casual” e-books are the strongest substitutes
for print books. Table 3(b) presents the own and cross elasticities of e-books with respect to print books by
genre and channel. The results show that “casual” e-books have the lowest own elasticity and the highest
cross elasticity with respect to print books.
I also find that local bookstore availability helps offline bookstores. Table 3(c) presents own and cross
elasticities of e-books and offline print books by local bookstore availability. As the local bookstore availability
increases, consumer demand for offline print books becomes less sensitive to changes in print book and e-book
prices. By contrast, as local bookstore availability increases, consumer demand for e-books becomes more
sensitive to changes in e-book and print book prices. The results suggest that as local bookstores become
more available, e-books become weaker substitutes for offline print books. This effect is the strongest for
“casual” books, indicating that bookstore availability helps offline print books the most in the “casual” genre
24
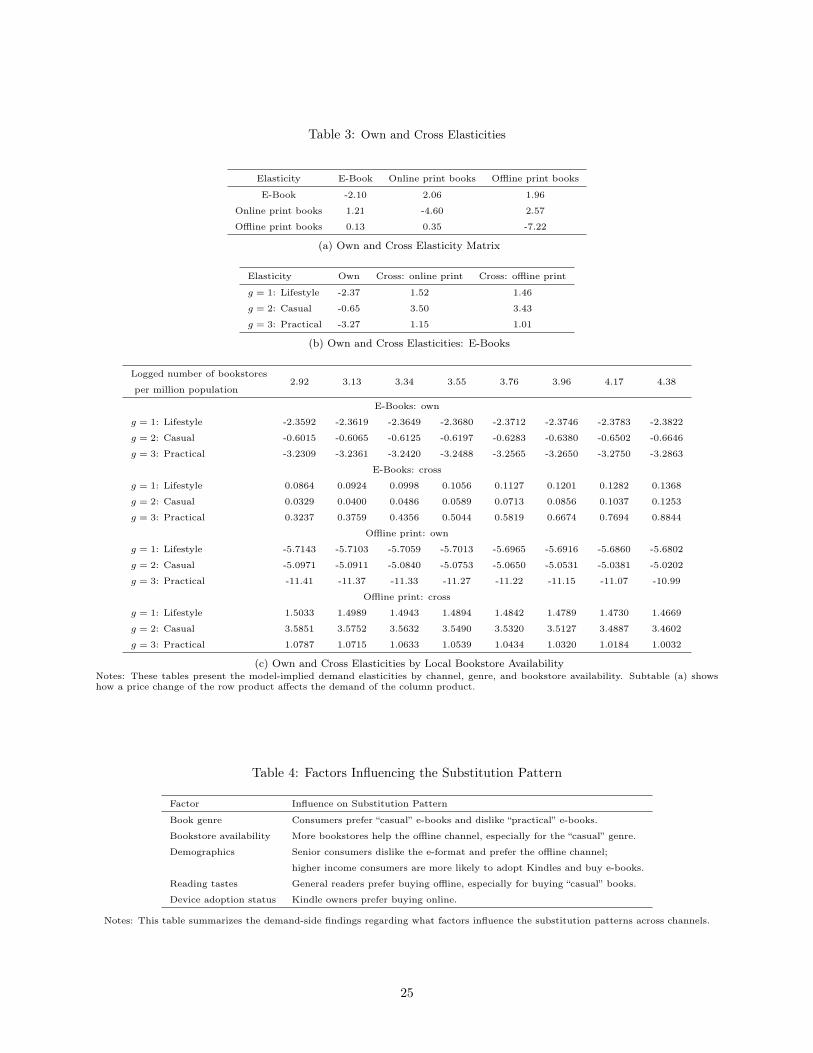
Table 3: Own and Cross Elasticities
Elasticity E-Book Online print books Offline print books
E-Book -2.10 2.06 1.96
Online print books 1.21 -4.60 2.57
Offline print books 0.13 0.35 -7.22
(a) Own and Cross Elasticity Matrix
Elasticity Own Cross: online print Cross: offline print
g = 1: Lifestyle -2.37 1.52 1.46
g = 2: Casual -0.65 3.50 3.43
g = 3: Practical -3.27 1.15 1.01
(b) Own and Cross Elasticities: E-Books
Logged number of bookstores2.92 3.13 3.34 3.55 3.76 3.96 4.17 4.38
per million population
E-Books: own
g = 1: Lifestyle -2.3592 -2.3619 -2.3649 -2.3680 -2.3712 -2.3746 -2.3783 -2.3822
g = 2: Casual -0.6015 -0.6065 -0.6125 -0.6197 -0.6283 -0.6380 -0.6502 -0.6646
g = 3: Practical -3.2309 -3.2361 -3.2420 -3.2488 -3.2565 -3.2650 -3.2750 -3.2863
E-Books: cross
g = 1: Lifestyle 0.0864 0.0924 0.0998 0.1056 0.1127 0.1201 0.1282 0.1368
g = 2: Casual 0.0329 0.0400 0.0486 0.0589 0.0713 0.0856 0.1037 0.1253
g = 3: Practical 0.3237 0.3759 0.4356 0.5044 0.5819 0.6674 0.7694 0.8844
Offline print: own
g = 1: Lifestyle -5.7143 -5.7103 -5.7059 -5.7013 -5.6965 -5.6916 -5.6860 -5.6802
g = 2: Casual -5.0971 -5.0911 -5.0840 -5.0753 -5.0650 -5.0531 -5.0381 -5.0202
g = 3: Practical -11.41 -11.37 -11.33 -11.27 -11.22 -11.15 -11.07 -10.99
Offline print: cross
g = 1: Lifestyle 1.5033 1.4989 1.4943 1.4894 1.4842 1.4789 1.4730 1.4669
g = 2: Casual 3.5851 3.5752 3.5632 3.5490 3.5320 3.5127 3.4887 3.4602
g = 3: Practical 1.0787 1.0715 1.0633 1.0539 1.0434 1.0320 1.0184 1.0032
(c) Own and Cross Elasticities by Local Bookstore AvailabilityNotes: These tables present the model-implied demand elasticities by channel, genre, and bookstore availability. Subtable (a) showshow a price change of the row product affects the demand of the column product.
Table 4: Factors Influencing the Substitution Pattern
Factor Influence on Substitution Pattern
Book genre Consumers prefer “casual” e-books and dislike “practical” e-books.
Bookstore availability More bookstores help the offline channel, especially for the “casual” genre.
Demographics Senior consumers dislike the e-format and prefer the offline channel;
higher income consumers are more likely to adopt Kindles and buy e-books.
Reading tastes General readers prefer buying offline, especially for buying “casual” books.
Device adoption status Kindle owners prefer buying online.
Notes: This table summarizes the demand-side findings regarding what factors influence the substitution patterns across channels.
25
when competing with e-books. Forman et al. (2009) find that as the distance to offline stores decreases,
online sales become less sensitive to online price cuts. I find a similar effect on offline sales: as local bookstores
become more available, offline print book sales become less sensitive to online price cuts.
Table 4 summarizes the factors found so far that affect the substitution pattern between print and e-
books. The most important demand-side finding is that e-books appear to compete head-to-head with
offline bookstores in the “casual” genre: first, e-books are the strongest substitutes to print books in the
“casual” genre; second, offline bookstores benefit the most from increasing local bookstore availability in the
“casual” genre. The reason for this head-to-head competition might be that consumers are most concerned
with convenience when buying “casual” books. Convenience is the advantage of both e-books and offline
bookstores. I find in later sections that the head-to-head competition between e-books and offline bookstores
drives the optimal multichannel management strategy on the supply side.
5.4 Cannibalization and Market Expansion
Given the demand estimates and substitution patterns, I examine the influence of the e-channel on existing
online and offline channels. I demonstrate how this influence varies by consumer type, retailer, genre, and
bookstore availability. Note that the purpose of this analysis is to decompose the overall e-book effect
into cannibalization and market expansion effects, conditioning on the observed prices. In the supply-side
counterfactuals, I fully solve for the optimal pricing problem and allow publishers to set different prices from
the observed ones.
Given the observed prices, I simulate the print book sales that would have occurred without e-books
SP0. I also simulate the print book and e-book sales when e-books are presentSP1, SE
. The loss of print
book sales SP0 − SP1 represents the e-book sales resulting from cannibalization. The rest of the e-book
sales SE−(SP0 − SP1
)come from market expansion; those sales would not otherwise have occurred in print
format. I define cannibalization rate as the percentage of total e-book sales that comes from cannibalization
SP0−SP1
SE .
I find that the introduction of e-books increases consumer book consumption. The model predicts that
a typical avid reader buys 6.11 print books per year before adopting a Kindle and after adopting a Kindle
buys 1.75 print books and 5.56 e-books. A typical general reader buys 1.10 print books before adopting a
Kindle and after adopting a Kindle buys 0.58 print books and 4.07 e-books. The implied cannibalization
rate is 78.4% for avid readers and 12.7% for general readers, which indicates that for avid readers a higher
fraction of their e-book purchases comes from cannibalization.26
26The reason is that the two types have the same e-format taste, so they are equally likely to prefer e-books to print books.
26
Overall, 69.1% of e-book sales come from cannibalizing print book sales while 30.9% of e-book sales come
from market expansion. The market expansion effect of e-books could be a result of both their convenience
and their price advantages over print books. Counterfactual results show that convenience plays a larger
role. If the positive e-format utility is zero, the market expansion rate would be 19.3%. If there were no
price difference between e-books and print books, the market expansion rate would be 28.3%.
I find that the cannibalization rate is smaller in markets with more bookstores. Local bookstore availabil-
ity influences cannibalization in two ways: it affects the number of Kindle owners, who substitute between
print and e-books and create cannibalization, and the cannibalization rate per Kindle owner. I find that as
local bookstore availability increases, consumers are more likely to choose offline print books without e-books
and switch to e-books when e-books are available, so the per-owner cannibalization rate increases. However,
as local bookstore availability increases, the number of Kindle owners drops. Overall, the decrease in the
number of Kindle owners dominates the increase in per-owner cannibalization, so the cannibalization rate
decreases with local bookstore availability. The cannibalization rate decreases from 71.1% to 68.5% when
the logged number of local bookstores per million population increases from 2.9 to 4.8.
I also find that the cannibalization rate decreases over time from 71.6% in 2008 to 67.3% in 2012. Avid
readers adopt Kindles earlier and have higher cannibalization rates. As more general readers start e-reading
over time, the mix of Kindle owners evolves and drives down the overall cannibalization rate.
Across print book retailers, I find that offline bookstores appear to bear most of the cannibalization
burden: 82% of the total loss in print book sales occurs in offline bookstores, 7% in Amazon, and 11%
in other online retailers. Amazon benefits from the introduction of e-books overall. Although Amazon
experiences a decrease in print book sales, it benefits from additional e-book sales and additional print
book sales from Kindle owners. Amazon’s total book revenue appears to increase by 8.3% after e-book
introduction.
6 Supply-side Analysis
6.1 Publisher Problem
In this section, I solve for the optimal multichannel pricing strategy for publishers and explore how the
strategy is affected by the introduction of the e-channel.
I make two assumptions regarding the pricing arrangement. First, I assume that the industry follows the
However, avid readers have higher baseline tastes and are more likely to buy print books in the absence of e-books.
27

wholesale contract, and I solve for the optimal wholesale pricing problem for publishers. There are two types
of contractual arrangements between publishers and retailers: under a wholesale contract, publishers set
wholesale prices to retailers and retailers set retail prices to consumers; under an agency contract, publishers
set retail prices directly to consumers and let retailers take a fixed percentage of the revenue. In practice,
the pricing of the print books always follows the wholesale contract. The pricing of the e-books follows
the wholesale contract, except for the years between 2010 and 2012, when the pricing followed an agency
contract. The contractual change of e-book pricing in 2010 was motivated by publishers’ concerns about
Amazon’s monopoly position. The six largest publishers collaborated with Apple and forced the application
of the agency contract, which drew close scrutiny from the Department of Justice and resulted in a lawsuit.
The settlement was that the industry switched back to the wholesale contract in 2012. I therefore focus on
the wholesale contract in my analysis. Second, I abstract from the optimal pricing decisions of the retailers.
I assume that the retailers follow the same pricing rules as before, for both books and Kindles. I discuss how
relaxing this assumption may influence the results in Section 6.4.1. In practice, publishers set the wholesale
prices and add a mark-up to provide the suggested retail price. Offline bookstores take a 30% to 50% discount
off the suggested retail price, and online retailers can take up to a 55% discount.27 These retailer-specific
pricing rules have been stable in this mature market (Reimers and Waldfogel 2017). The rules lead to a fixed
ratio between the observed wholesale prices and retail prices for each format and retailer.28 I assume that
the ratios remain the same in the counterfactuals as in the observed scenario. Specifically, let γj denote the
ratio between wholesale and retail prices for print book retailer j and let γe denote the ratio for e-books.
Given publishers’ optimal wholesale prices of print books wPjg and e-books wEg , retailers apply the ratios to
obtain the retail prices of print books as pPjg = γjwPjg for retailer j and obtain the retail price of e-books as
pEg = γewEg .
I focus on the trade-offs of multichannel pricing in a static setting. For each market, I let the bookstore
availability take the average value across years in the data.29 The demand-side results show that local
bookstore availability significantly influences consumer demand. It indicates that the optimal pricing strategy
may differ by bookstore availability. In practice, publishers have not been using bookstore availability to price
by market. Pricing by market can be less viable for the online channel but more viable for the offline channel,
as consumers are geographically segmented offline. I take a forward-looking view in the counterfactuals and
allow the publishers to price by market for offline print books and not for e-books or online print books.27http://www.smithpublicity.com/2014/03/determining-retail-price-printed-book/.28I obtain the observed wholesale prices from the observed Amazon retail prices. The wholesale prices of both formats are
50% of the list price on average. The list price of e-books is 80% of the list price of its print book counterpart. Amazon’s retailprice is 60% of the list price.
29The dynamic aspect of the demand model is that Kindle penetration increases over time. The static problem here assumesthat the market starts with a zero Kindle install base. It is challenging to solve for a dynamic pricing problem with threechannels. I start with the static problem to illustrate the key trade-offs in the setting with three channels.
28
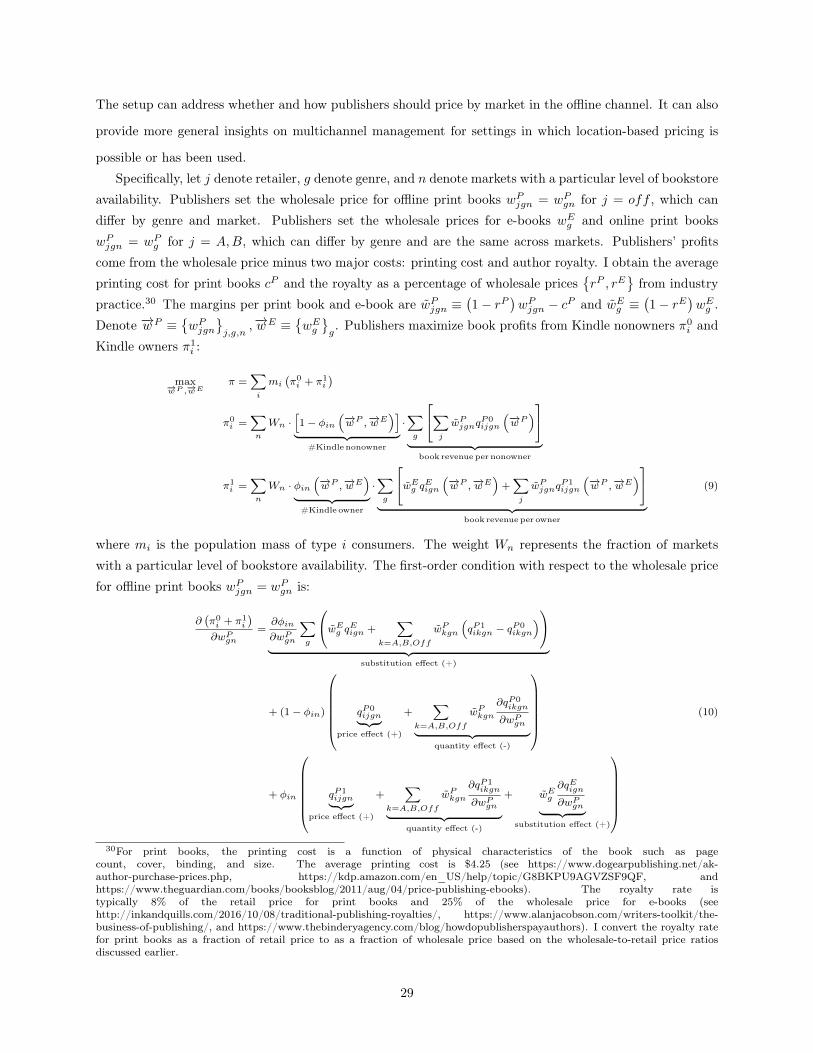
The setup can address whether and how publishers should price by market in the offline channel. It can also
provide more general insights on multichannel management for settings in which location-based pricing is
possible or has been used.
Specifically, let j denote retailer, g denote genre, and n denote markets with a particular level of bookstore
availability. Publishers set the wholesale price for offline print books wPjgn = wPgn for j = off , which can
differ by genre and market. Publishers set the wholesale prices for e-books wEg and online print books
wPjgn = wPg for j = A,B, which can differ by genre and are the same across markets. Publishers’ profits
come from the wholesale price minus two major costs: printing cost and author royalty. I obtain the average
printing cost for print books cP and the royalty as a percentage of wholesale pricesrP , rE
from industry
practice.30 The margins per print book and e-book are wPjgn ≡(1− rP
)wPjgn − cP and wEg ≡
(1− rE
)wEg .
Denote −→w P ≡wPjgn
j,g,n
,−→wE ≡wEgg. Publishers maximize book profits from Kindle nonowners π0
i and
Kindle owners π1i :
max−→wP ,−→wEπ =
∑i
mi(π0i + π1
i
)
π0i =
∑n
Wn ·[1− φin
(−→wP ,−→wE)]︸ ︷︷ ︸#Kindle nonowner
·∑g
∑j
wPjgnqP0ijgn
(−→wP)
︸ ︷︷ ︸book revenue per nonowner
π1i =
∑n
Wn · φin(−→wP ,−→wE)︸ ︷︷ ︸
#Kindle owner
·∑g
wEg qEign (−→wP ,−→wE)+∑j
wPjgnqP1ijgn
(−→wP ,−→wE)
︸ ︷︷ ︸book revenue per owner
(9)
where mi is the population mass of type i consumers. The weight Wn represents the fraction of markets
with a particular level of bookstore availability. The first-order condition with respect to the wholesale price
for offline print books wPjgn = wPgn is:
∂(π0i + π1
i
)∂wPgn
=∂φin
∂wPgn
∑g
wEg qEign +∑
k=A,B,Off
wPkgn
(qP1ikgn − q
P0ikgn
)︸ ︷︷ ︸
substitution effect (+)
+ (1− φin)
qP0ijgn︸ ︷︷ ︸
price effect (+)
+∑
k=A,B,Off
wPkgn∂qP0ikgn
∂wPgn︸ ︷︷ ︸quantity effect (-)
(10)
+ φin
qP1ijgn︸ ︷︷ ︸
price effect (+)
+∑
k=A,B,Off
wPkgn∂qP1ikgn
∂wPgn︸ ︷︷ ︸quantity effect (-)
+ wEg∂qEign
∂wPgn︸ ︷︷ ︸substitution effect (+)
30For print books, the printing cost is a function of physical characteristics of the book such as page
count, cover, binding, and size. The average printing cost is $4.25 (see https://www.dogearpublishing.net/ak-author-purchase-prices.php, https://kdp.amazon.com/en_US/help/topic/G8BKPU9AGVZSF9QF, andhttps://www.theguardian.com/books/booksblog/2011/aug/04/price-publishing-ebooks). The royalty rate istypically 8% of the retail price for print books and 25% of the wholesale price for e-books (seehttp://inkandquills.com/2016/10/08/traditional-publishing-royalties/, https://www.alanjacobson.com/writers-toolkit/the-business-of-publishing/, and https://www.thebinderyagency.com/blog/howdopublisherspayauthors). I convert the royalty ratefor print books as a fraction of retail price to as a fraction of wholesale price based on the wholesale-to-retail price ratiosdiscussed earlier.
29
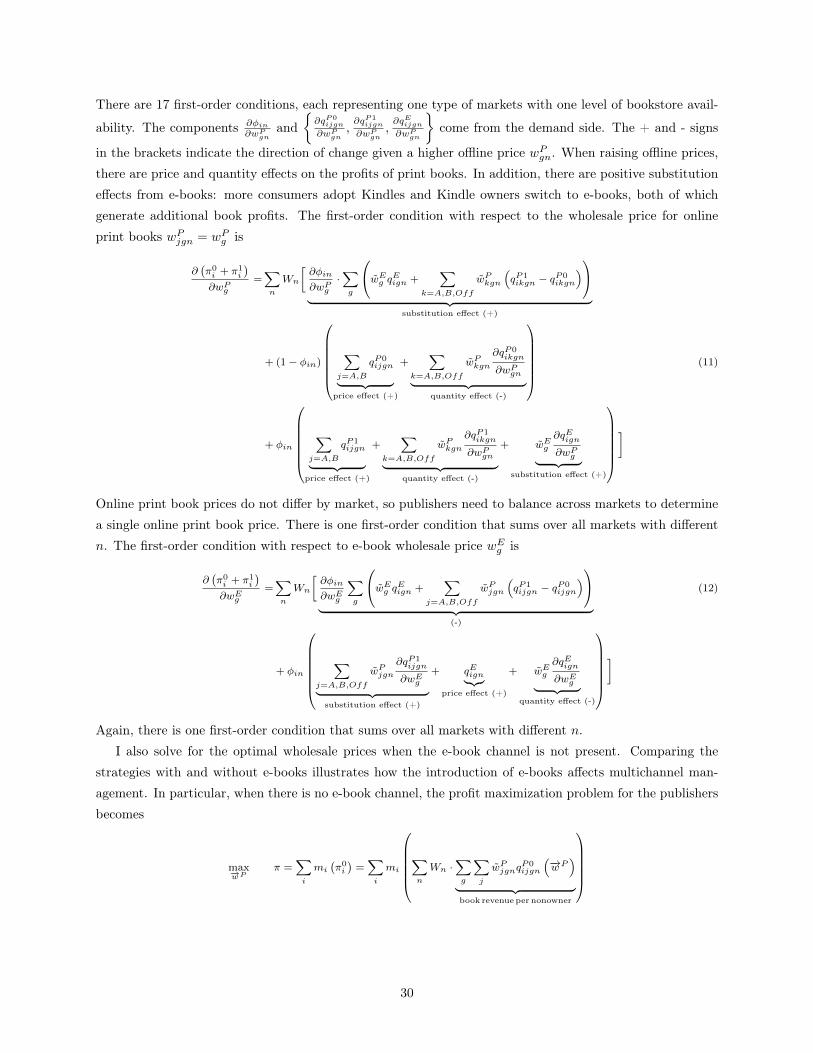
There are 17 first-order conditions, each representing one type of markets with one level of bookstore avail-
ability. The components ∂φin
∂wPgn
and∂qP0
ijgn
∂wPgn,∂qP1
ijgn
∂wPgn,∂qEijgn∂wP
gn
come from the demand side. The + and - signs
in the brackets indicate the direction of change given a higher offline price wPgn. When raising offline prices,
there are price and quantity effects on the profits of print books. In addition, there are positive substitution
effects from e-books: more consumers adopt Kindles and Kindle owners switch to e-books, both of which
generate additional book profits. The first-order condition with respect to the wholesale price for online
print books wPjgn = wPg is
∂(π0i + π1
i
)∂wPg
=∑n
Wn
[∂φin
∂wPg·∑g
wEg qEign +∑
k=A,B,Off
wPkgn
(qP1ikgn − q
P0ikgn
)︸ ︷︷ ︸
substitution effect (+)
+ (1− φin)
∑
j=A,B
qP0ijgn︸ ︷︷ ︸
price effect (+)
+∑
k=A,B,Off
wPkgn∂qP0ikgn
∂wPgn︸ ︷︷ ︸quantity effect (-)
(11)
+ φin
∑
j=A,B
qP1ijgn︸ ︷︷ ︸
price effect (+)
+∑
k=A,B,Off
wPkgn∂qP1ikgn
∂wPgn︸ ︷︷ ︸quantity effect (-)
+ wEg∂qEign
∂wPg︸ ︷︷ ︸substitution effect (+)
]
Online print book prices do not differ by market, so publishers need to balance across markets to determine
a single online print book price. There is one first-order condition that sums over all markets with different
n. The first-order condition with respect to e-book wholesale price wEg is
∂(π0i + π1
i
)∂wEg
=∑n
Wn
[∂φin
∂wEg
∑g
wEg qEign +∑
j=A,B,Off
wPjgn
(qP1ijgn − qP0
ijgn
)︸ ︷︷ ︸
(-)
(12)
+ φin
∑
j=A,B,Off
wPjgn∂qP1ijgn
∂wEg︸ ︷︷ ︸substitution effect (+)
+ qEign︸︷︷︸price effect (+)
+ wEg∂qEign
∂wEg︸ ︷︷ ︸quantity effect (-)
]
Again, there is one first-order condition that sums over all markets with different n.
I also solve for the optimal wholesale prices when the e-book channel is not present. Comparing the
strategies with and without e-books illustrates how the introduction of e-books affects multichannel man-
agement. In particular, when there is no e-book channel, the profit maximization problem for the publishers
becomes
max−→wPπ =
∑i
mi(π0i
)=∑i
mi
∑n
Wn ·∑g
∑j
wPjgnqP0ijgn
(−→wP)︸ ︷︷ ︸book revenue per nonowner
30

Figure 5: Optimal Wholesale Prices: Offline Print Books
3 3.5 4 4.5 5 5.5 6
Logged Number of Bookstores per Million Population
16
18
20
22
24
26
28
30
32
Unit: $
Genre 1: with E-ChannelGenre 2: with E-ChannelGenre 3: with E-ChannelGenre 1: without E-ChannelGenre 2: without E-ChannelGenre 3: without E-Channel
Notes: This figure presents the optimal wholesale prices for offline print books by genre and bookstore availability, with the e-channel(solid lines) and without the e-channel (dashed lines). The optimal prices are solutions to the optimal wholesale pricing problem. Thefigure shows that the optimal wholesale prices for offline print books are higher when the e-channel is present, suggesting that the
e-channel enhances the pricing power of the existing channels.
Table 5: Optimal Wholesale Prices: Online Print Books and E-Books
Without E-Channel With E-ChannelOnline Print Books Online Print Books E-Books
g = 1 16.97 17.51 12.85g = 2 22.03 22.06 17.86g = 3 28.62 28.82 21.16
Notes: Column 1 contains the optimal wholesale prices for online print books when the e-channel is not present. Columns 2 and 3contain the optimal wholesale prices for online print books and e-books when the e-channel is present. The optimal prices are
solutions to optimal wholesale pricing problem. The table shows that the optimal wholesale prices for online print books are higherwith than without the e-channel, suggesting that the e-channel enhances the pricing power of the existing channels.
The first-order conditions for offline and online print books become
∂π0i
∂wPgn= qP0
ijgn︸ ︷︷ ︸price effect (+)
+∑
k=A,B,Off
wPkgn∂qP0ikgn
∂wPgn︸ ︷︷ ︸quantity effect (-)
∂π0i
∂wPg=∑n
Wn
[ ∑j=A,B
qP0ijgn︸ ︷︷ ︸
price effect (+)
+∑
j=A,B,Off
wPjgn∂qP0ijgn
∂wPg︸ ︷︷ ︸quantity effect (-)
]
6.2 Optimal Multichannel Management Strategy
Figure 5 plots the optimal wholesale prices for offline print books by genre and bookstore availability. The
solid lines represent the optimal prices with an e-channel and the dashed lines represent the optimal prices
without an e-channel. Table 5 presents the optimal wholesale prices for online print books and e-books by
genre, with and without an e-channel.
When there is no e-channel, I find that the optimal wholesale prices for the offline channel increases as
31

Figure 6: Mechanism: Why Optimal Offline Prices Increase with Bookstore Availability
3 3.5 4 4.5 5 5.5 6
Logged Number of Bookstores per Million Population
-0.1
0
0.1
0.2
0.3
0.4
Un
it:
$
Profit Change Per Consumer
Genre 1: LifestyleGenre 2: CasualGenre 3: Practical
Notes: This figure illustrates why publishers should charge higher offline prices when there are more local bookstores. I first let allmarkets charge the same offline prices as the markets with the smallest non-zero bookstore availability, wP
gn = wP∗g1 . I then raise the
offline price by $1 and plot the profit change from this price increase by genre and local bookstore availability. Each data point on thegraph represents the per-consumer profit change in a particular genre given a particular level of bookstore availability. The figureshows a positive profit change from raising offline prices. Therefore, publishers should charge higher offline prices as bookstore
availability increases, especially for “casual” books.
the bookstore availability increases, especially for “casual” books. As the bookstore availability increases,
the offline channel becomes stronger and its own elasticities of demand become smaller. Publishers should
charge higher prices in the offline channel.
To further illustrate why publishers should charge higher offline prices as bookstore availability increases,
I force all markets to charge the same prices as the markets with the smallest non-zero bookstore availability,
wPgn = wP∗g1 . I then raise the price by $1 and plot the profit change per consumer from this price increase
in Figure 6. Each data point on the graph represents the per-consumer profit change in a particular genre
given a particular level of bookstore availability.31 Intuitively, a profit gain suggests that publishers should
raise prices; the higher the profit gain, the more publishers should raise prices. I find that there is indeed a
profit gain from raising prices. The profit gain increases with bookstore availability and is the highest for
“casual” books. This is consistent with the optimal pricing strategy in Figure 5: publishers should charge
higher prices as bookstore availability increases, especially for “casual” books.32
When the e-channel is present, I find that the optimal pricing pattern is similar to the scenario without
an e-channel. The main difference is that the optimal prices of online and offline print books are higher
in general when the e-channel is present, suggesting that the e-channel enhances the pricing power of the
existing channels. The only exception is “casual” book in markets with large bookstore availability for which31Figure 6 contains the per-consumer profit change for a typical consumer. I first compute the per-consumer profit change
for each heterogeneous consumer types. I then integrate over the distribution of the heterogeneous consumer types to obtainthe profit change for a typical consumer. Figure 7 contains the per-consumer profit change for a typical consumer, which iscomputed in a similar way.
32One caveat is that Figure 6 plots the per-consumer profit change in markets with a particular level of bookstore availability,while the optimal strategy in Figure 5 is a result of balancing across markets with different levels of bookstore availability.Therefore, a positive profit change in Figure 6 does not necessarily leads to a higher optimal price in Figure 5. However, theoverall pattern holds: a profit gain in Figure 6 suggests a higher optimal price in Figure 5.
32

the optimal offline prices are lower with an e-channel. I show the mechanism of this result in the next
subsection.
6.3 Mechanism: Influence of the E-Channel on the Existing Channels
When does the e-channel enhance the pricing power of the existing channels and when does it hurt the
existing channels? To answer this question, I compare the difference in publisher profits with and without
an e-channel. When an e-channel is not present, the publisher profit from a consumer of type i in genre g in
market n is
πign =∑j
wPjgnqP0ijgn
When an e-channel is present, the publisher profit from a consumer of type i in genre g in market n is
πign = (1− φin)
∑j
wPjgnqP0ijgn
+ φin
wEg qEign +∑j
wPjgnqP1ijgn
Conditional on charging the same prices, the introduction of an e-channel causes the following change in the
publisher profit:
πign − πign = φin
∑j
wPjgn(qP1ijgn − qP0
ijgn
)︸ ︷︷ ︸
cannibalization
+ wEg qEign︸ ︷︷ ︸
market expansion
(13)
The introduction of an e-channel can reduce profits because of the cannibalization effect on existing
channels: when publishers raise print book prices, consumers switch from print books to e-books and generate
smaller print book profits. However, the introduction of an e-channel can also generate additional profits
because of a market expansion effect: when publishers raise print book prices, consumers switch to e-reading
and generate additional e-book profits; publishers thus have fewer concerns when raising print book prices. If
the net effect of cannibalization and market expansion in Equation 13 is positive, the e-channel can enhance
the pricing power of the existing channels and allow publishers to charge higher prices in the existing channels.
The net effect of cannibalization and market expansion depends on the relative strength of channels. In
my context, the strength of the offline channel is captured by bookstore availability N bsi , which varies across
markets. The strength of the e-channel is captured by the e-format specific taste θEg , which varies across
genres. Recall that cannibalization happens when two conditions hold: 1) consumers buy print books in the
absence of e-books; 2) consumers prefer e-books to print books when e-books are available. Market expansion
happens when Condition 1 does not hold and Condition 2 holds. Therefore, the net effect of cannibalization
33

Figure 7: Mechanism: Why E-Channel Enhances the Pricing Power of Existing Print Channels
3 3.5 4 4.5 5 5.5 6
Logged Number of Bookstores per Million Population
-0.5
0
0.5
1
1.5
2
2.5
3
Unit: $
Profit Change Per Consumer
Genre 1: LifestyleGenre 2: CasualGenre 3: Practical
Notes: The figure plots the profit change per consumer because of the e-channel introduction as shown in Equation 13. Apositive value indicates that the publisher earns higher profits with than without the e-channel so that the publisher has
incentives to raise print book prices when e-channel is introduced.
and market expansion is larger when Condition 1 does not hold and Condition 2 holds. This is more likely
to happen when the print book channel is not too strong and when the e-channel is attractive enough. In
other words, the net effect is larger when N bsi is not too large and θEg is large enough.
As shown in Equation 13, the net effect of cannibalization and market expansion can be captured by the
per-consumer profit change because of the e-channel introduction if publishers still charge the same prices as
in the scenario without the e-channel. To further illustrate the net effect, I plot in Figure 7 the per-consumer
profit change in Equation 13 evaluated at the optimal wholesale prices without the e-channel. In particular,
I show how the profit change differs by bookstore availability and genre. Each point on the graph represents
the profit change in a particular genre under a particular level of bookstore availability. A positive profit
change indicates that the net effect of cannibalization and market expansion is positive, so publishers have
incentives to raise print book prices when the e-channel is introduced. Consistent with the intuition, the
net effect decreases with N bsi and increases with θEg . The implication of the net effect is consistent with
the optimal pricing strategies in Figure 5. For “lifestyle” and “practical” books, the net effect is positive so
that the presence of an e-channel increases optimal print book prices. For “casual” books, the net effect is
positive when N bsi is not too large so that the presence of e-channel increases optimal print book prices when
N bsi is not too large. Overall, the e-channel enhances the pricing power of the existing channels in most
cases. The only case in which the e-channel hurts is “casual” genre when N bsi is large. The reason is that
the relative strength of the channels, rather than the absolute strength, determines the results: although
“casual” genre has the largest θEg and the strongest e-channel, its print book channel is also stronger and
competes head-to-head with its e-channel, especially when when N bsi is large. Therefore, the net effect of the
e-channel is negative for “casual” books when N bsi is large; the e-channel does not help the existing channels
34
in this case.
In general, a new channel can help an existing channel under the following two conditions: 1) the existing
channel cannot be too strong compared with the new channel; otherwise, the cannibalization effect is large;
2) the new channel cannot be too weak compared with the existing channel; otherwise, the market expansion
effect is low. In my context, the e-channel helps the offline print channel when the print book channel is
not too strong and when the e-channel is attractive enough. In these cases, the e-channel can serve as a
compensating substitute for existing channels: the e-channel generates additional “compensating” revenue
when publishers charge higher prices in the existing channels; the gain from the compensating revenue
dominates the loss from cannibalization, so the e-channel allows publishers to have fewer concerns when
raising prices in existing channels.
6.4 Robustness Checks
6.4.1 Accounting for Retailer Responses
In the supply-side analysis, I abstract from retailers’ optimal pricing decisions and assume that the retailers
follow the same pricing rules as before (i.e., pPjg = γjwPjg and pEg = γew
Eg ). Existing literature on multichannel
management focuses on the case where the company directly sells through its own channels. In my context
there is an additional vertical relationship between the company (i.e., the publishers) and retailers. I focus
on the publishers’ decisions because studying the retailers’ decisions requires additional information about
retailers. In addition, the publishers’ multichannel decisions in the novel context of three channels has not
been studied before. The results can serve as a foundation for further analysis that incorporates retailer
responses.
Nevertheless, I conduct robustness checks by varying the values of γj , γe and Kindle prices and allow
them to be different from the observed values. In particular, I allow retailers to respond differently to the
new wholesale prices by examining four scenarios, each of which represents one type of differential responses
from the retailers. For example, I allow the offline channel to respond more than other channels through
cutting prices. The results on multichannel management strategies are robust. I provide more details in the
appendix.
35

Figure 8: Optimal Wholesale Prices under Duopoly Competition: Offline Print Books
3 3.5 4 4.5 5 5.5 6
Logged Number of Bookstores per Million Population
12.8
13
13.2
13.4
13.6
13.8
14
Unit:$
Genre 1: with E-ChannelGenre 2: with E-ChannelGenre 3: with E-ChannelGenre 1: without E-ChannelGenre 2: without E-ChannelGenre 3: without E-Channel
Notes: This figure presents the optimal wholesale prices for offline print books under duopoly competition. Compared withthe monopoly prices in Figure 5, the main finding that e-channel enhances the pricing power of the existing offline print
channel is robust when allowing for duopoly competition.
Table 6: Optimal Wholesale Prices under Duopoly Competition: Online Print Books and E-Books
Without E-Channel With E-ChannelOnline Print Books Online Print Books E-Books
g = 1 12.97 13.04 17.93g = 2 30.64 31.20 23.33g = 3 31.02 31.80 17.79
Notes: This table presents the optimal wholesale prices for online print books and e-books under duopoly competition.Compared with the monopoly prices in Table 5, the main finding that e-channel enhances the pricing power of the existing
online print channel is robust when allowing for duopoly competition.
6.4.2 Allowing for Duopoly Competition
In the supply-side analysis, I focus on the optimal multichannel management strategy for a monopoly pub-
lisher to illustrate the fundamental trade-offs when a new channel is introduced. In this subsection, I use a
simulation to show how allowing for duopoly competition may influence the main findings.33
I assume that there are two publishers that compete in all channels and have the same observed charac-
teristics. Note that this setup represents a duopoly setting with a stronger competition than a setting where
two publishers have different observed characteristics, so I can fully assess the influence of competition. This
setup also allows the two publishers to be closer substitutes in the same channel than in different channels,
which is a desirable feature given consumers’ substitution pattern in practice. The two publishers are still
differentiated in terms of unobserved characteristics and are allowed to choose different prices in equilibrium.
Consumers are also allowed to choose different publishers given different prices in equilibrium. I make neces-
sary adjustment to the demand model so that doubling the number of publishers does not artificially inflate
the channel-specific sales. More details of the adjustment are in the appendix.33Li and Srinivasan (2019) use a similar simulation to assess the influence of within-tier hotel competition on equilibrium
outcomes.
36

I re-solve for the optimal wholesale pricing strategies for the two publishers and present the results in
Figure 8 and Table 6. The two publishers have the same optimal pricing strategies, so I present the results
for one of them. I find that allowing for duopoly competition produces the same qualitative results: the
introduction of the e-channel increases the pricing power of the existing channels in general, except for the
“casual” genre in markets with large local bookstore availability. It suggests that the main results are robust
to the duopoly competition.
One difference that competition introduces is that the offline prices for the “practical” genre decrease with
bookstore availability in the duopoly case, while they increase with bookstore availability in the monopoly
case. This is because in the duopoly case the two firms split the sales in the same channel, so the positive
price effect is smaller. The negative quantity effect is also smaller, but not as much as the reduction in the
price effect. Overall, the change in the price effect outweighs the change in the quantity effect so that the
firms benefit less from raising prices in the duopoly case. However, the overall strategy still holds: as the
local bookstore availability increases, firms have more incentives to raise prices.
7 Conclusion
Many important multichannel management questions hinge on how different channels interact. I empirically
study the influence of the digital channel on the existing channels and solve for the optimal strategy of
multichannel management. I first estimate a structural model of consumer e-reader adoption and book
purchase. Given the demand estimates, I solve the optimal wholesale pricing problem for publishers and use
counterfactuals to illustrate the key trade-offs in multichannel management.
The demand-side results suggest that e-books compete head-to-head with offline bookstores for “casual”
books. The supply-side findings suggest that the e-channel can serve as a strategic complement to the
existing channels; the complementarity does not rely on branding or marketing communication but depends
on relative channel strengths. I find that the e-channel can help the existing channels when the new channel
is not too weak and the existing channel is not too strong.
This paper has managerial implications for multichannel management. In practice, publishers have
realized that “certain categories have a much larger digital adoption than others.” They have started to focus
on developing e-books for genres such as sci-fi, fantasy, mystery and romance fiction.34 The genre-specific
strategy echoes my finding that “casual” books are better suited for the digital format. I further suggest
that publishers can benefit from adopting market-specific strategies as markets differ in local bookstore34See http://www.wired.com/2013/06/digital-publishing-genre-fiction/
37
availability and consumers’ substitution patterns across channels.
One limitation of this paper is that I abstract from the retailers’ pricing decisions. Studying retailer
decision making requires additional information about retailers, which is not included in my data set. Another
limitation of this paper is that I do not model competition among retailers and publishers. The robustness
check of symmetric duopoly competition in Section 6.4.2 shows how competition affects the results in a
simplified setting. Fully solving for a competitive model with three channels can lead to more complex
competition patterns.
References
[1] Ansari, A., Mela, C. F., Neslin, S. A. 2008. “Customer Channel Migration.” Journal of MarketingResearch, 45(1), 60-76.
[2] Balasubramanian, S. 1998. “Mail versus Mall: A Strategic Analysis of Competition Between DirectMarketers and Conventional Retailers.” Marketing Science. 17, 181-195.
[3] Bell, D., Gallino, S., Moreno, A. 2017. “Offline Showrooms in Omnichannel Retail: Demand and Oper-ational Benefits.” forthcoming, Management Science.
[4] Biyalogorsky, E. and Naik P. 2003. “Clicks and Mortar: The Effect of Online Activities on Offline Sales,”Marketing Letters, 14, 1, 21–32.
[5] Brynjolfsson, E., Y. Hu, and M. Rahman 2009. “Battle of Retail Channels: How Product Selection andGeography Drive Cross- Channel Competition,” Management Science, 55 (11), 1755–65.
[6] Chen, H., Hu, Y.J. and Smith, M.D., 2018. “The Impact of E-book Distribution on Print Sales: Analysisof a Natural Experiment.” forthcoming, Management Science.
[7] Chiang, W. K., D. Chhajed, J. D. Hess. 2003. Direct marketing, indirect profits: A strategic analysis ofdual-channel supply-chain design. Management Sci. 49(1) 1–20.
[8] Ching, A., and Ishihara, M. 2012. “Measuring the Informative and Persuasive Roles of Detailing onPrescribing Decisions,” Management Science, 58 (7), 1374–87.
[9] Choi, J. and Bell D. 2011. “Preference Minorities and the Internet,” Journal of Marketing Research,58(4), 670–82.
[10] De los Santos, B., Hortaçsu, A., & Wildenbeest, M. R. (2012). Testing models of consumer searchusing data on web browsing and purchasing behavior. American Economic Review, 102(6), 2955-80.
[11] Dubé, J. P. (2004). Multiple discreteness and product differentiation: Demand for carbonated softdrinks. Marketing Science, 23(1), 66-81.
[12] Forman, C., Ghose, A., Goldfarb, A. 2009. “Competition Between Local and Electronic Markets: Howthe Benefit of Buying Online Depends on Where You Live.” Management Science, 55(1), 47-57.
[13] Gentzkow, M. 2007. “Valuing New Goods in a Model with Complementarity: Online Newspapers.”American Economic Review, 97(3), 713-44.
38
[14] Ghose, A., M. Smith, and R. Telang. 2006. Internet Exchanges for Used Books: An Empirical Analysisof Product Cannibalization and Welfare Impact.” Information Systems Research, 17(1), 3-19.
[15] Gilbert, R. 2015. " E-Books: A Tale of Digital Disruption." Journal of Economic Perspectives, 29 (3):165-84.
[16] Gordon, B. 2009. “A Dynamic Model of Consumer Replacement Cycles in the PC Processor Industry,”Marketing Science, 28(5), 846-867.
[17] Gowrisankaran, G. and Rysman, M. 2012. “Dynamics of Consumer Demand for New Durable Goods.”Journal of Political Economy. 120, 1173-1219.
[18] Hendel, I., 1999. Estimating multiple-discrete choice models: An application to computerization returns.The Review of Economic Studies, 66(2), pp.423-446.
[19] Lal, R., M. Sarvary. 1999. When and how is the Internet likely to decrease price competition? MarketingSci. 18(4) 485–503.
[20] Li, H. 2019. “Intertemporal Price Discrimination with Complementary Products: E-Books and E-Readers.” Management Science, 65(6), 2665-2694.
[21] Li, H. and Srinivasan, K. 2019. “Competitive Dynamics in the Sharing Economy: An Analysis in theContext of Airbnb and Hotels,” Marketing Science, 38(3), 365-391.
[22] Kannan, P. K., Pope, B., Jain, S. 2009. “Pricing Digital Content Product Lines: A Model and Applica-tion for the National Academies Press.” Marketing Science, 28(4), 620-636.
[23] Kumar, N., R. Ruan. 2006. On manufacturers complementing the traditional retail channel with a directonline channel. Quant. Market Economics. 4(3) 289–323.
[24] Narayanan, S., Manchanda, P., and Chintagunta P. 2005. “Temporal Differences in the Role of MarketingCommunication in New Product Categories,” Journal of Marketing Research, 42 (3), 278–90.
[25] Neslin, S. A., and Shankar, V. 2009. “Key Issues in Multichannel Customer Management: CurrentKnowledge and Future Directions.” Journal of Interactive Marketing, 23(1), 70-81.
[26] Oberholzer-Gee, F., Strumpf, K. 2007. “The Effect of File Sharing on Record Sales: An EmpiricalAnalysis.” Journal of Political Economy, 115(1), 1-42.
[27] Ofek, E., M. Sarvary, Z. Katona. 2011. “Bricks and Clicks”: The Impact of Product Returns on theStrategies of Multichannel Retailers. Marketing Science 30(1):42-60.
[28] Pauwels, K. and Neslin, S. 2015. “Building with Bricks and Mortar: The Revenue Impact of OpeningPhysical Stores in a Multichannel Environment,” Journal of Retailing, 91(2), pp.182-197.
[29] Petrin, A., Train, K. 2010. A control function approach to endogeneity in consumer choice models.Journal of Marketing Research, 47(1), 3-13.
[30] Reimers, I. and Waldfogel, J., 2017. “Throwing the Books at Them: Amazon’s Puzzling Long RunPricing Strategy.” Southern Economic Journal, 83(4), 869-885.
[31] Rysman, M., 2004. “Competition Between Networks: A Study of the Market for Yellow Pages.” TheReview of Economic Studies, 71(2), 483-512.
[32] Rust, J. 1987. “Optimal Replacement of GMC Bus Engines: An Empirical Model of Harold Zurcher.”Econometrica: Journal of the Econometric Society, 999-1033.
[33] Sinai, T. and Waldfogel J. 2004. “Geography and the Internet: Is the Internet a Substitute or a Com-plement for Cities?” Journal of Urban Economics, 56 (1), 1–24.
39
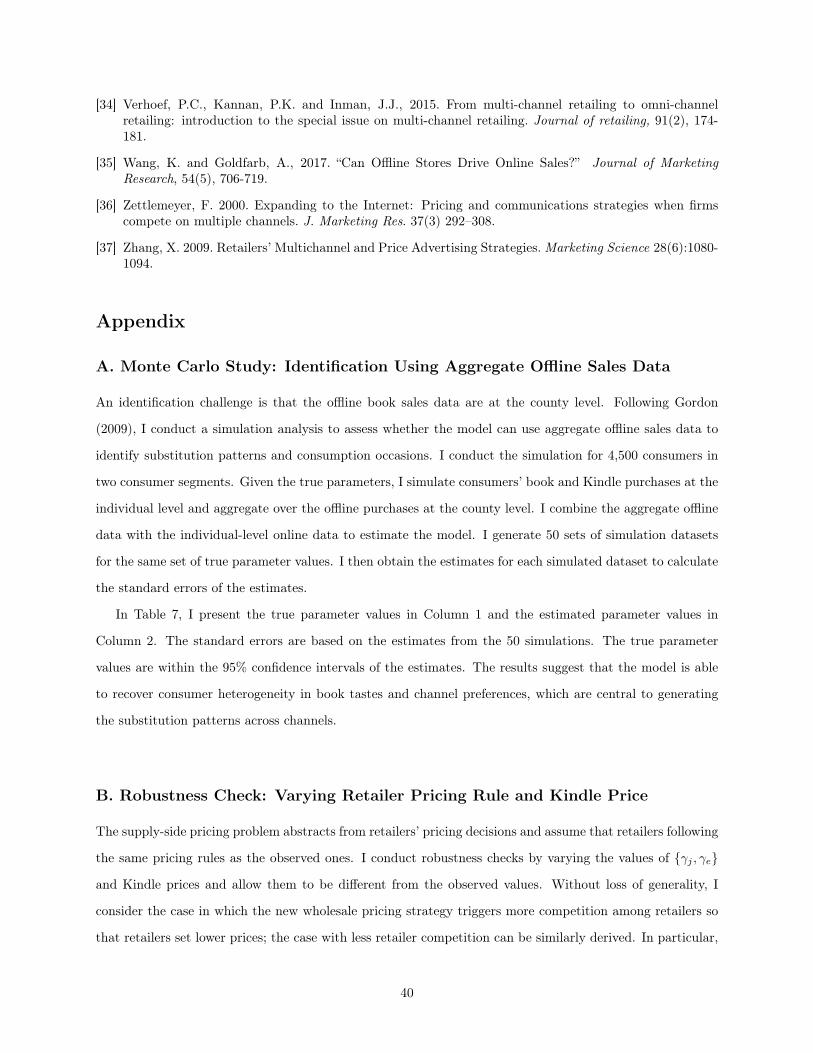
[34] Verhoef, P.C., Kannan, P.K. and Inman, J.J., 2015. From multi-channel retailing to omni-channelretailing: introduction to the special issue on multi-channel retailing. Journal of retailing, 91(2), 174-181.
[35] Wang, K. and Goldfarb, A., 2017. “Can Offline Stores Drive Online Sales?” Journal of MarketingResearch, 54(5), 706-719.
[36] Zettlemeyer, F. 2000. Expanding to the Internet: Pricing and communications strategies when firmscompete on multiple channels. J. Marketing Res. 37(3) 292–308.
[37] Zhang, X. 2009. Retailers’ Multichannel and Price Advertising Strategies. Marketing Science 28(6):1080-1094.
Appendix
A. Monte Carlo Study: Identification Using Aggregate Offline Sales Data
An identification challenge is that the offline book sales data are at the county level. Following Gordon
(2009), I conduct a simulation analysis to assess whether the model can use aggregate offline sales data to
identify substitution patterns and consumption occasions. I conduct the simulation for 4,500 consumers in
two consumer segments. Given the true parameters, I simulate consumers’ book and Kindle purchases at the
individual level and aggregate over the offline purchases at the county level. I combine the aggregate offline
data with the individual-level online data to estimate the model. I generate 50 sets of simulation datasets
for the same set of true parameter values. I then obtain the estimates for each simulated dataset to calculate
the standard errors of the estimates.
In Table 7, I present the true parameter values in Column 1 and the estimated parameter values in
Column 2. The standard errors are based on the estimates from the 50 simulations. The true parameter
values are within the 95% confidence intervals of the estimates. The results suggest that the model is able
to recover consumer heterogeneity in book tastes and channel preferences, which are central to generating
the substitution patterns across channels.
B. Robustness Check: Varying Retailer Pricing Rule and Kindle Price
The supply-side pricing problem abstracts from retailers’ pricing decisions and assume that retailers following
the same pricing rules as the observed ones. I conduct robustness checks by varying the values of γj , γe
and Kindle prices and allow them to be different from the observed values. Without loss of generality, I
consider the case in which the new wholesale pricing strategy triggers more competition among retailers so
that retailers set lower prices; the case with less retailer competition can be similarly derived. In particular,
40
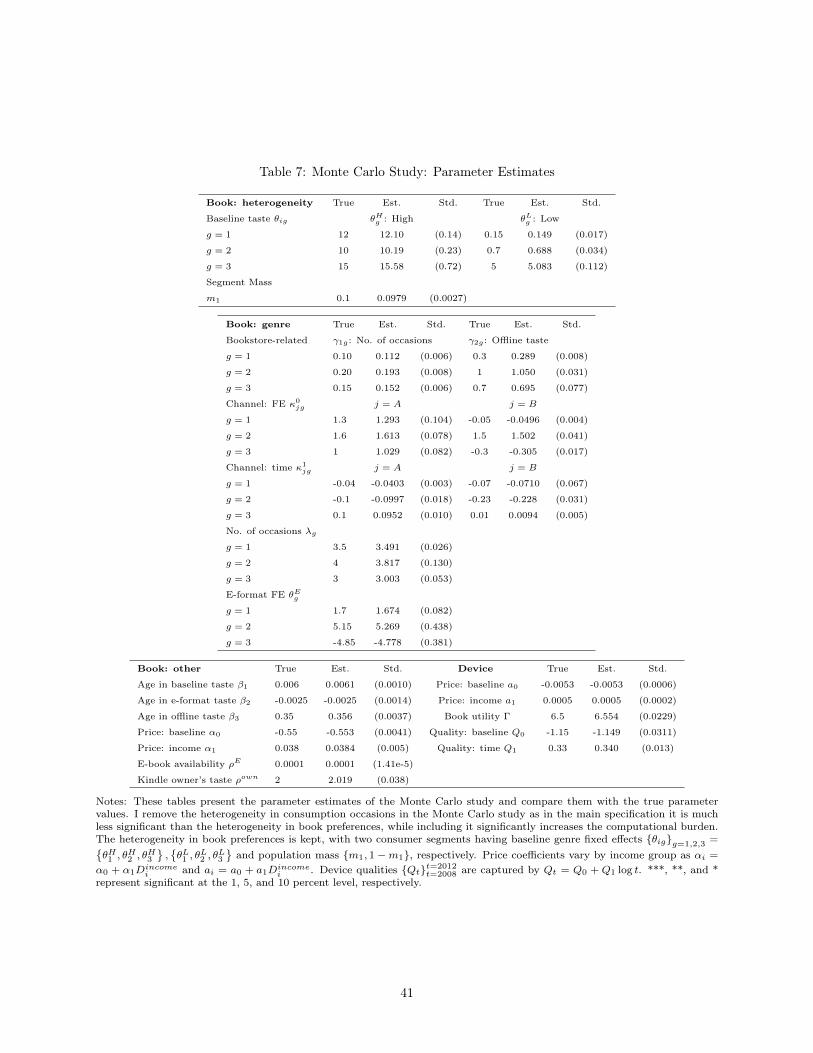
Table 7: Monte Carlo Study: Parameter Estimates
Book: heterogeneity True Est. Std. True Est. Std.
Baseline taste θig θHg : High θLg : Low
g = 1 12 12.10 (0.14) 0.15 0.149 (0.017)
g = 2 10 10.19 (0.23) 0.7 0.688 (0.034)
g = 3 15 15.58 (0.72) 5 5.083 (0.112)
Segment Mass
m1 0.1 0.0979 (0.0027)
Book: genre True Est. Std. True Est. Std.
Bookstore-related γ1g : No. of occasions γ2g : Offline taste
g = 1 0.10 0.112 (0.006) 0.3 0.289 (0.008)
g = 2 0.20 0.193 (0.008) 1 1.050 (0.031)
g = 3 0.15 0.152 (0.006) 0.7 0.695 (0.077)
Channel: FE κ0jg j = A j = B
g = 1 1.3 1.293 (0.104) -0.05 -0.0496 (0.004)
g = 2 1.6 1.613 (0.078) 1.5 1.502 (0.041)
g = 3 1 1.029 (0.082) -0.3 -0.305 (0.017)
Channel: time κ1jg j = A j = B
g = 1 -0.04 -0.0403 (0.003) -0.07 -0.0710 (0.067)
g = 2 -0.1 -0.0997 (0.018) -0.23 -0.228 (0.031)
g = 3 0.1 0.0952 (0.010) 0.01 0.0094 (0.005)
No. of occasions λg
g = 1 3.5 3.491 (0.026)
g = 2 4 3.817 (0.130)
g = 3 3 3.003 (0.053)
E-format FE θEg
g = 1 1.7 1.674 (0.082)
g = 2 5.15 5.269 (0.438)
g = 3 -4.85 -4.778 (0.381)
Book: other True Est. Std. Device True Est. Std.
Age in baseline taste β1 0.006 0.0061 (0.0010) Price: baseline a0 -0.0053 -0.0053 (0.0006)
Age in e-format taste β2 -0.0025 -0.0025 (0.0014) Price: income a1 0.0005 0.0005 (0.0002)
Age in offline taste β3 0.35 0.356 (0.0037) Book utility Γ 6.5 6.554 (0.0229)
Price: baseline α0 -0.55 -0.553 (0.0041) Quality: baseline Q0 -1.15 -1.149 (0.0311)
Price: income α1 0.038 0.0384 (0.005) Quality: time Q1 0.33 0.340 (0.013)
E-book availability ρE 0.0001 0.0001 (1.41e-5)
Kindle owner’s taste ρown 2 2.019 (0.038)
Notes: These tables present the parameter estimates of the Monte Carlo study and compare them with the true parametervalues. I remove the heterogeneity in consumption occasions in the Monte Carlo study as in the main specification it is muchless significant than the heterogeneity in book preferences, while including it significantly increases the computational burden.The heterogeneity in book preferences is kept, with two consumer segments having baseline genre fixed effects θigg=1,2,3 =θH1 , θ
H2 , θ
H3
,θL1 , θ
L2 , θ
L3
and population mass m1, 1−m1, respectively. Price coefficients vary by income group as αi =
α0 + α1Dincomei and ai = a0 + a1Dincomei . Device qualities Qtt=2012t=2008 are captured by Qt = Q0 + Q1 log t. ***, **, and *
represent significant at the 1, 5, and 10 percent level, respectively.
41
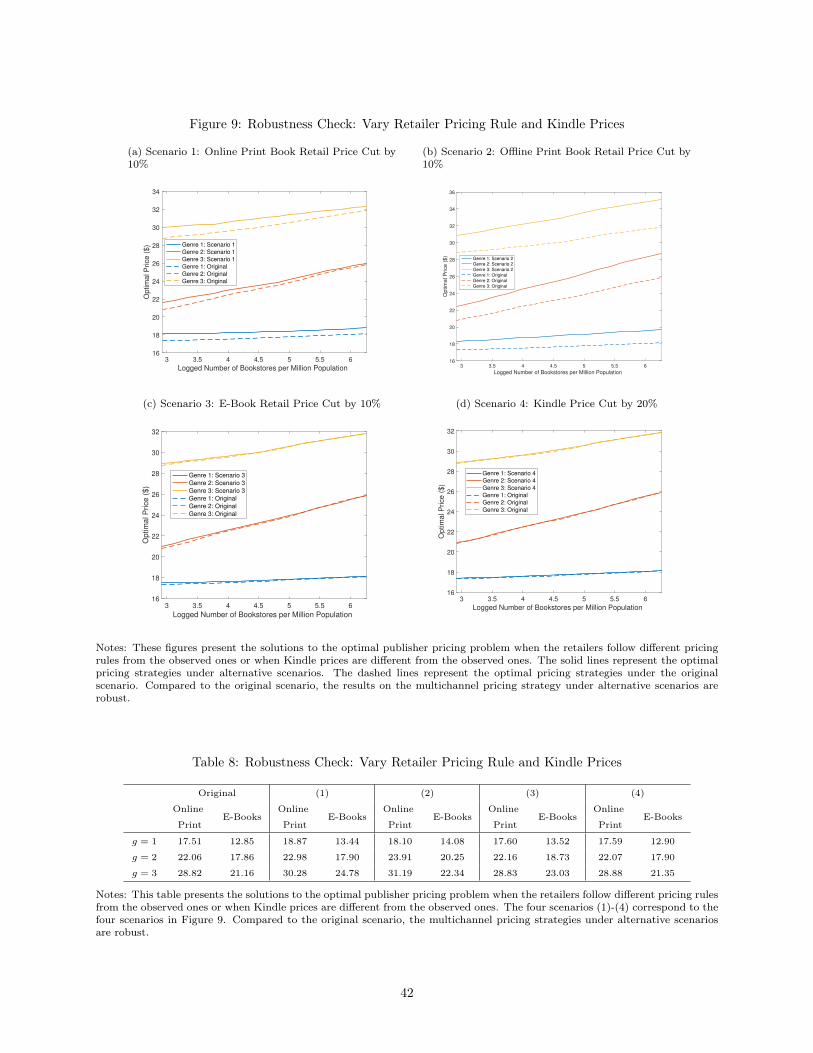
Figure 9: Robustness Check: Vary Retailer Pricing Rule and Kindle Prices
(a) Scenario 1: Online Print Book Retail Price Cut by10%
3 3.5 4 4.5 5 5.5 6
Logged Number of Bookstores per Million Population
16
18
20
22
24
26
28
30
32
34
Optim
al P
rice (
$) Genre 1: Scenario 1
Genre 2: Scenario 1Genre 3: Scenario 1Genre 1: OriginalGenre 2: OriginalGenre 3: Original
(b) Scenario 2: Offline Print Book Retail Price Cut by10%
3 3.5 4 4.5 5 5.5 6
Logged Number of Bookstores per Million Population
16
18
20
22
24
26
28
30
32
34
36
Optim
al P
rice (
$)
Genre 1: Scenario 2Genre 2: Scenario 2Genre 3: Scenario 2Genre 1: OriginalGenre 2: OriginalGenre 3: Original
(c) Scenario 3: E-Book Retail Price Cut by 10%
3 3.5 4 4.5 5 5.5 6
Logged Number of Bookstores per Million Population
16
18
20
22
24
26
28
30
32
Optim
al P
rice (
$)
Genre 1: Scenario 3Genre 2: Scenario 3Genre 3: Scenario 3Genre 1: OriginalGenre 2: OriginalGenre 3: Original
(d) Scenario 4: Kindle Price Cut by 20%
3 3.5 4 4.5 5 5.5 6
Logged Number of Bookstores per Million Population
16
18
20
22
24
26
28
30
32
Optim
al P
rice (
$)
Genre 1: Scenario 4Genre 2: Scenario 4Genre 3: Scenario 4Genre 1: OriginalGenre 2: OriginalGenre 3: Original
Notes: These figures present the solutions to the optimal publisher pricing problem when the retailers follow different pricingrules from the observed ones or when Kindle prices are different from the observed ones. The solid lines represent the optimalpricing strategies under alternative scenarios. The dashed lines represent the optimal pricing strategies under the originalscenario. Compared to the original scenario, the results on the multichannel pricing strategy under alternative scenarios arerobust.
Table 8: Robustness Check: Vary Retailer Pricing Rule and Kindle Prices
Original (1) (2) (3) (4)
OnlineE-Books
OnlineE-Books
OnlineE-Books
OnlineE-Books
OnlineE-Books
Print Print Print Print Print
g = 1 17.51 12.85 18.87 13.44 18.10 14.08 17.60 13.52 17.59 12.90
g = 2 22.06 17.86 22.98 17.90 23.91 20.25 22.16 18.73 22.07 17.90
g = 3 28.82 21.16 30.28 24.78 31.19 22.34 28.83 23.03 28.88 21.35
Notes: This table presents the solutions to the optimal publisher pricing problem when the retailers follow different pricing rulesfrom the observed ones or when Kindle prices are different from the observed ones. The four scenarios (1)-(4) correspond to thefour scenarios in Figure 9. Compared to the original scenario, the multichannel pricing strategies under alternative scenariosare robust.
42
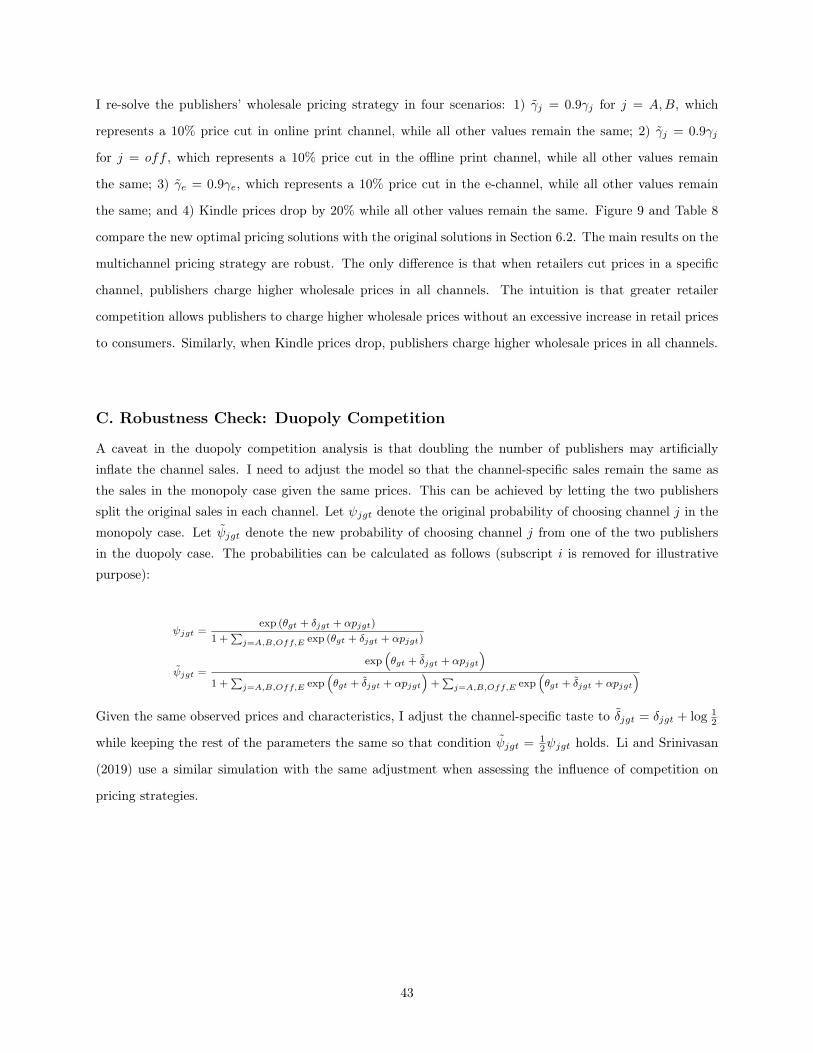
I re-solve the publishers’ wholesale pricing strategy in four scenarios: 1) γj = 0.9γj for j = A,B, which
represents a 10% price cut in online print channel, while all other values remain the same; 2) γj = 0.9γj
for j = off , which represents a 10% price cut in the offline print channel, while all other values remain
the same; 3) γe = 0.9γe, which represents a 10% price cut in the e-channel, while all other values remain
the same; and 4) Kindle prices drop by 20% while all other values remain the same. Figure 9 and Table 8
compare the new optimal pricing solutions with the original solutions in Section 6.2. The main results on the
multichannel pricing strategy are robust. The only difference is that when retailers cut prices in a specific
channel, publishers charge higher wholesale prices in all channels. The intuition is that greater retailer
competition allows publishers to charge higher wholesale prices without an excessive increase in retail prices
to consumers. Similarly, when Kindle prices drop, publishers charge higher wholesale prices in all channels.
C. Robustness Check: Duopoly Competition
A caveat in the duopoly competition analysis is that doubling the number of publishers may artificially
inflate the channel sales. I need to adjust the model so that the channel-specific sales remain the same as
the sales in the monopoly case given the same prices. This can be achieved by letting the two publishers
split the original sales in each channel. Let ψjgt denote the original probability of choosing channel j in the
monopoly case. Let ψjgt denote the new probability of choosing channel j from one of the two publishers
in the duopoly case. The probabilities can be calculated as follows (subscript i is removed for illustrative
purpose):
ψjgt =exp (θgt + δjgt + αpjgt)
1 +∑j=A,B,Off,E exp (θgt + δjgt + αpjgt)
ψjgt =exp
(θgt + δjgt + αpjgt
)1 +
∑j=A,B,Off,E exp
(θgt + δjgt + αpjgt
)+∑j=A,B,Off,E exp
(θgt + δjgt + αpjgt
)Given the same observed prices and characteristics, I adjust the channel-specific taste to δjgt = δjgt + log 1
2
while keeping the rest of the parameters the same so that condition ψjgt = 12ψjgt holds. Li and Srinivasan
(2019) use a similar simulation with the same adjustment when assessing the influence of competition on
pricing strategies.
43