Kayseri Mevlevihanesi Hakkinda Notlar Turkce Ingilizce ozet ile
Upload
independentCategory
view
1download
0
ORIGINAL ARTICLE
A new approximation in determination of zonation boundariesof ignimbrite by ground penetrating radar: Kayseri,Central Anatolia, Turkey
Tamer Koralay Æ Selma Kadioglu Æ Yusuf Kagan Kadioglu
Received: 21 June 2006 / Accepted: 5 November 2006 / Published online: 6 December 2006� Springer-Verlag 2006
Abstract Ground penetrating radar (GPR) method is
used as a tool to identify the zonation boundaries in
ignimbrite series through their columnar section. Ig-
nimbrites can be classified in terms of welding degree,
colour, texture and mineralogical compositions. The
research area comprises a part of _Incesu (Kayseri)
ignimbrite at Central Anatolia, Turkey. This ignim-
brite is divided into three levels and each level has
clear differences in terms of macroscopic and micro-
scopic views. This paper presents the results of an
application of GPR for the determination of zonation
boundary within the ignimbrite flow unit in the view of
their textural and petrological features. RAMAC CU
II equipment was used with 250 MHz shielded antenna
on parallel ten profiles to observe the physical differ-
ence among the ignimbrite levels of the study area.
Two levels out of three have been defined at the _Incesu
ignimbrite and supported by field geology and petro-
graphical studies. The first level, which is extremely
fractured structure, is about 1.5 m thick and matches
with middle level of the _Incesu ignimbrite. The second
level has an average 50–75 cm thickness and matches
with lower level of the ignimbrite. In this manner,
vertical lithological variations should be taken into
consideration during petrological investigation of the
ignimbrites.
Keywords Ignimbrite � Zonation boundary �Ground penetrating radar (GPR) � Petrography �_Incesu/Kayseri
Introduction
Ignimbrite is composed of the main lithology of the
pyroclastic flow, which can be formed by the gravita-
tional column collapse associated to plinian eruption
from stratovolcanoes clusters and/or to the sustained
fountaining of lower eruptive columns during caldera
forming eruptions (Sparks and Wilson 1976; Cas and
Wright 1988; Druitt 1998). This led to the classification
of ignimbrites in terms of welding degree, colour, tex-
ture and mineralogical compositions. These features
can be best distinguished through the columnar section
than the horizontal extensions. Due to different ero-
sion and tectonic events, some parts of the ignimbrite
may be lost, which led the researcher to identify the
same ignimbrite series with different definition. The
study area comprises a part of the ignimbrites of
Central Anatolia around _Incesu Town (Kayseri, Tur-
key). The _Incesu ignimbrite has a wide exposure with
different colours and textures. Field investigations
showed that they have similar colours and textures at
the horizontal exposures and different colours and
textures at the vertical lithology. Due to the tectonic
events and erosions some parts of the ignimbrite were
eroded and/or covered by young soil.
T. Koralay � Y. K. Kadioglu (&)Geological Engineering Department, Ankara University,Faculty of Engineering, Tandogan 06100, Ankara, Turkeye-mail: [email protected]
T. Koralaye-mail: [email protected]
S. KadiogluGeophysical Engineering Department, Ankara University,Faculty of Engineering, Tandogan 06100, Ankara, Turkeye-mail: [email protected]
123
Environ Geol (2007) 52:1387–1397
DOI 10.1007/s00254-006-0581-x
The aim of this paper is to figure out the columnar
lithological changes and boundaries, of the covered
and unobserved outcrops through mineralogy, petrog-
raphy, and GPR method.
Geological setting
Regional geology
Turkey is located in the Alpine–Himalayan orogenic
belt and has shown a very complex tectonic evolution
during the Mesozoic and Tertiary ages. The neotec-
tonics of Turkey is governed by three major elements.
These are: the Aegean–Cyprean arc, the dextral North
Anatolian Fault zone and the sinistral East Anatolian
Fault Zone (Bozkurt 2001). The Central Anatolian
Volcanic Province (CAVP) is located in the centre of
Turkey and extends 300 km along a NE–SW direction,
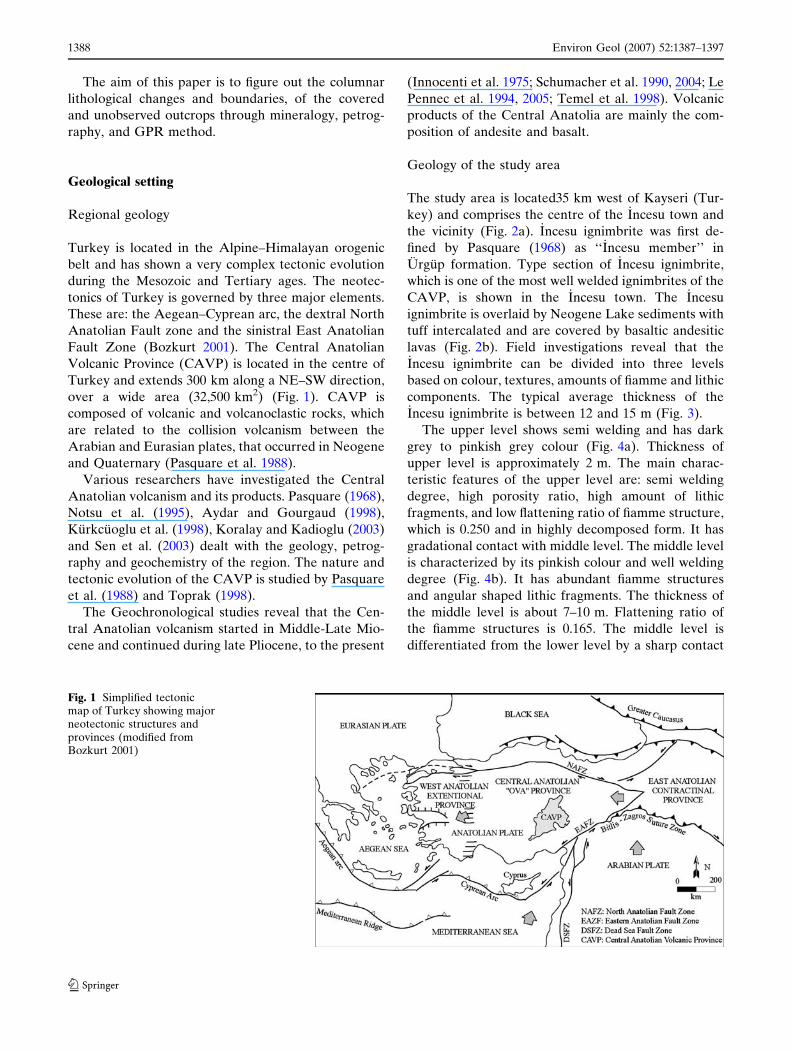
over a wide area (32,500 km2) (Fig. 1). CAVP is
composed of volcanic and volcanoclastic rocks, which
are related to the collision volcanism between the
Arabian and Eurasian plates, that occurred in Neogene
and Quaternary (Pasquare et al. 1988).
Various researchers have investigated the Central
Anatolian volcanism and its products. Pasquare (1968),
Notsu et al. (1995), Aydar and Gourgaud (1998),
Kurkcuoglu et al. (1998), Koralay and Kadioglu (2003)
and Sen et al. (2003) dealt with the geology, petrog-
raphy and geochemistry of the region. The nature and
tectonic evolution of the CAVP is studied by Pasquare
et al. (1988) and Toprak (1998).
The Geochronological studies reveal that the Cen-
tral Anatolian volcanism started in Middle-Late Mio-
cene and continued during late Pliocene, to the present
(Innocenti et al. 1975; Schumacher et al. 1990, 2004; Le
Pennec et al. 1994, 2005; Temel et al. 1998). Volcanic
products of the Central Anatolia are mainly the com-
position of andesite and basalt.
Geology of the study area
The study area is located35 km west of Kayseri (Tur-
key) and comprises the centre of the _Incesu town and
the vicinity (Fig. 2a). _Incesu ignimbrite was first de-
fined by Pasquare (1968) as ‘‘_Incesu member’’ in
Urgup formation. Type section of _Incesu ignimbrite,
which is one of the most well welded ignimbrites of the
CAVP, is shown in the _Incesu town. The _Incesu
ignimbrite is overlaid by Neogene Lake sediments with
tuff intercalated and are covered by basaltic andesitic
lavas (Fig. 2b). Field investigations reveal that the_Incesu ignimbrite can be divided into three levels
based on colour, textures, amounts of fiamme and lithic
components. The typical average thickness of the_Incesu ignimbrite is between 12 and 15 m (Fig. 3).
The upper level shows semi welding and has dark
grey to pinkish grey colour (Fig. 4a). Thickness of
upper level is approximately 2 m. The main charac-
teristic features of the upper level are: semi welding
degree, high porosity ratio, high amount of lithic
fragments, and low flattening ratio of fiamme structure,
which is 0.250 and in highly decomposed form. It has
gradational contact with middle level. The middle level
is characterized by its pinkish colour and well welding
degree (Fig. 4b). It has abundant fiamme structures
and angular shaped lithic fragments. The thickness of
the middle level is about 7–10 m. Flattening ratio of
the fiamme structures is 0.165. The middle level is
differentiated from the lower level by a sharp contact
Fig. 1 Simplified tectonicmap of Turkey showing majorneotectonic structures andprovinces (modified fromBozkurt 2001)
1388 Environ Geol (2007) 52:1387–1397
123

Fig. 2 a Location map ofthe study area. b Geologymap of the study area
Environ Geol (2007) 52:1387–1397 1389
123

(Fig. 4c). The lower level isdark-brown or black col-
oured and has more vitreous structure than the other
levels (Fig. 4d). The lower level has 2 m thickness and
very dense welding degree. Flattening ratio of the fi-
amme structures is about 0.064.
Petrography
The _Incesu ignimbrite is composed of phenocrysts and
crystal fragments, pumice and pumice fragments,
shards and lithic fragments. In terms of rock forming
components, the _Incesu ignimbrite has vitric tuff
characteristic. The amount of crystal components de-
creases while shard components increase from the
upper to the lower level. Each level contains such
phenocrysts as plagioclase, pyroxene, opaque minerals,
and low amount of amphibole, biotite and quartz. In
general, plagioclase and pyroxene are the most abun-
dant phenocryst in the ignimbrite. The _Incesu ignim-
brite shows eutaxitic texture formed by flattened
pumice fragments (fiammes) and shards. The eutaxitic
texture is better developed in the lower and middle
levels than in the upper level (Fig. 4e–h).
Plagioclase is one of the most frequent minerals in
the ignimbrite. They are euhedral and subhedral. The
size of crystals is usually 3–10 mm. The plagioclases in
the upper level are more euhedral crystals and bigger
in size than those in the middle and lower levels
(Fig. 4e). Pyroxenes are usually thin and small subhe-
dral crystals. They seem colourless to pale green with a
very weak pleochroism (Fig. 4e).
Lithic fragments (xenoliths) are spherical, ellipsoi-
dal and angular in shape. They have mostly andesitic
and basaltic composition. There is a sharp border be-
tween lithic fragments and matrix of the ignimbrite.
The pumice fragments are dark brown in colour and
mostly altered to clay mineralization (Fig. 4f).
Shards are the most abundant component within the_Incesu ignimbrite. They are generally small (<0.5–
1 mm) particles and platy in shape. These shapes sig-
nificantly change if the shards remain hot and plastic
after deposition. Crystal and lithic components of the
ignimbrite samples, especially those, taken from the
middle or lower levels are surrounded by platy shards
(Fig. 4f–h). The amounts of the shards increase from
the upper level to the lower level (Fig. 4e–h).
Ground penetrating radar
Ground penetrating radar (GPR) method, which uses
electromagnetic (EM) waves, works in dielectric
medium with high frequency generally between 25 and
1,600 MHz to image the subsurface. GPR is relatively
new EM geophysical exploration technique that is
gaining widespread use for mapping shallow subsurface
geological structures and locating underground objects.
GPR uses the principle of scattering of electromagnetic
waves (Davis and Annan 1989). The high frequency
electromagnetic wave is radiated from a transmitting
antenna, travels through the material at a velocity until
it hits an object or a discontinuity that has different
electrical properties from surrounding medium, is
scattered back to the surface and is detected by a
receiving antenna. The resulting record, similar to one
of the time–amplitude plots, is called as a trace. A scan
is a trace, where colour scale has been applied to the
amplitude values (Daniels 1989). The basic unit of the
electromagnetic travel time is nanosecond (ns). GPR
measurements are made by pulling the shielded an-
tenna continuously or step by step with a constant
space between transmitter and receiver unshielded
antennas over the ground on a profile, or at discreet
points along the surface. Traces that are displayed side
Fig. 3 Generalized stratigraphical columnar section of _Incesuignimbrite
1390 Environ Geol (2007) 52:1387–1397
123

by side form a GPR time-distance record, called rad-
agram, which shows how the reflections vary in the
subsurface. Therefore, its data section is very similar to
a seismic reflection section. GPR time–distance record
can be viewed as a 2D pseudo-image of the Earth after
some processing steps, with the horizontal axis, the
distance along the surface, and the vertical axis being
the two-way travel time of the radar wave. The two-
way travel time can be converted to depth if velocity of
the medium is known. 3D visualization can be con-
structed from several parallel profiles by using parallel
2D profiles (Kadioglu and Daniels 2002, 2004). The 3D
data volume interpretation is easier than that of 2D
profiles. Because of the enhanced line to line, trace to
trace, time to time correlations of reflections, it is more
confident. Moreover, 3D data contain much more
Fig. 4 Hand specimen andmicrophotograph of upper,middle and lower levels of the_Incesu ignimbrite (Plgplagioclase; Prx pyroxene;Opq. M. opaque mineral;V vesicule; allmicrophotographs are takenin plane polarized light)
Environ Geol (2007) 52:1387–1397 1391
123

information. In our approximation, a hybrid 2D/3D
data collection, processing and interpretation have
been done.
GPR method has been widely applied for mapping
shallow stratigraphy and fractures (Benson 1995; Rust
and Russell 2000; Green et al. 2003; Aldas et al. 2006),
for aiding in the characterization of contaminated sites
by locating buried features of interest (Kadioglu and
Daniels 2002, 2004), for searching carstic cavities
(Kadioglu and Ulugergerli 2004), for identifying con-
taminated areas where a light non-aqueous phase li-
quid (LNAPL) hydrocarbon has been redistributed by
a rising water table in a previously hydrocarbon
residual free vadose zone using GPR (Kim et al. 2000)
and for identifying buried archaeological artifacts
(Sambuelli et al. 1999; Cezar et al. 2001). GPR method
is used for figuring out covered outcrops and charac-
terizing the volcanic and their deposits (Russell and
Stasiuk 1997; Rust and Russell 2000; Cagnoli and Ul-
rych 2001; Miyamoto et al. 2003; Gomez-Ortiz et al.
2006).
Data acquisition and processing
RAMAC CU II system with 250 MHz shielded an-
tenna, whose depth resolution is about 0.1–0.15 m and
antenna separation is 0.36 m, has been used for data
gathering. The study area was a horizontal platform
with a size of 27 · 50 m, and ten 2D profiles, which
were spaced 3 m apart, were established as parallel.
Length of the profiles was 50 m. Trace spacing was
0.05 m and total time window was 193 ns with 0.377 ns
time sampling interval per trace on each profile. GPR
data processing was performed with Reflex-Win V3.5.
Figure 5 shows cross and plan view of the GPR profile
measurements within the _Incesu ignimbrite.
The following processing routine was applied to the
collected data: zero time moving, dewow, band pass
frequency filter, gain, velocity analysis, cross correla-
tion, and diffraction stack. Topography effects were
neglected because of the horizontal platform of the
study area. The Reflex-Win program allows con-
structing a synthetic hyperbole for any given special
velocity value using time–distance equation formula of
EM waves to be matched with diffraction patterns
throughout the profiles. The matching leads a velocity
analysis. When true velocity value is found, the
selected diffraction hyperbole on the profile matches
with synthetic hyperbole (Gomez-Ortiz et al. 2006;
Leucci and Negri 2006). The velocity analyses are
realized by different diffraction hyperboles on the
profiles, and then, the mean velocity is determined to
transform the time scale to the depth scale. Therefore,
the velocity is accepted as constant according to the
depth to transform the time scale to the depth scale or
to apply migration process (Rust and Russel 2000).
However, this acceptance does not mean the EM
wave velocity is constant vertically and laterally. The
EM wave velocity (V) is inversely related to the
dielectric constant (K) (Davis and Annan 1989). K is
related to water content and porosity of the levels.
GPR reflections are caused primarily by vertical dif-
ferences in the dielectric properties of levels of the
medium and are given by the reflection coefficient
RC ¼ffiffiffiffiffiffi
K1
p�
ffiffiffiffiffiffi
K2
p� ��ffiffiffiffiffiffi
K1
pþ
ffiffiffiffiffiffi
K2
p� �
; where K1 and K2
are the dielectric constants of the upper layer and the
lower layer of the medium, respectively (Lunt et al.
2005). If the velocity were constant, any GPR reflec-
tions would not happen on the 2D profile sections
(radagrams).
In the data several hyperbolic diffractions, which
allow an accurate velocity analyses, are present. Fig-
ure 6 shows a representative example of velocity
analyses using the ReflexW 3.5 software. The mean
velocity was determined as 0.14 m/ns for the ignimbrite
(Fig. 6). This velocity was used to convert time to
depth. About 73 ns (5.11 m) was used to present the
2D profile sections because the wave amplitudes
attenuated in the tuff layer and terminated in the
limestone.
Results and discussion
The modal mineralogical compositions, density,
porosity and humidity determinations on samples of
each ignimbrite level reveal clear differences betweenFig. 5 Field view of the study area showing GPR profilemeasurements
1392 Environ Geol (2007) 52:1387–1397
123

the levels (Table 1). The high alteration and disinte-
gration of the upper level may cause to gain high
porosity and low density with variable modal miner-
alogical compositions (Table 1). The results of the
middle and lower levels indicated that the phenocrysts
(plagioclase, mafic, and opaque minerals), xenoliths
(pumice, basaltic and rhyolitic fragments) and shards
increased the bulk density from the upper level toward
the lower level. On the other hand, the compactions
and welding of these products with volcanic ashes in-
creased from upper level toward the lower level,
leading to a decrease in the porosity with humidity
ratios (Table 1).
One of the objectives of this research was to map the
depth of each ignimbrite levels from the interpretation
of GPR profiles. In order to monitor of these features
the processed 2D profiles with their interpretation are
shown in Fig. 7. Here 1.lb represents the first level
boundary, which indicates the middle level of ignim-
brite. 2.lb indicates the lower level of the ignimbrite and
bb represents the basement boundary of the whole
ignimbrite levels. The depth range of each middle and
lower levels is changing from 1.2 to 1.5 m and 0.5 to 1 m,
respectively. There are also some clear inclined cracks
within the ignimbrite levels (profiles 1, 2 and 9 in Fig. 7).
During GPR data processing the mean velocity was
determined as 0.14 m/ns for the ignimbrite (Fig. 6),
while Rust and Russel (2000) used 0.09 m/ns to apply
migration process and Gomez-Ortiz et al. (2006) have
found that the mean velocity range of the EM waves
was between 0.07 and 0.12 m/ns. The reason for the
high mean velocity of the EM waves can be explained
with the abundance of the shard components in the_Incesu ignimbrite. Depth of the ignimbrite is about 2 m
and the depth ranges of the middle level vary from 1.2
to 1.5 m. There are also some clear inclined fractures
within the ignimbrite levels (profiles 1, 2 and 9 in
Fig. 7) as seen in examples on hand specimens in
Fig. 4a and c. The reflections of the EM waves are
usually generated by any type of discontinuities, which
represent differentiations of properties of the medium
such as changes in the electrical properties of rocks,
variations of the water content, changes in bulk den-
sity, and changes in the EM velocity or dielectric
constant. The success of a GPR survey depends on a
sufficient dielectric contrast to produce measurable
reflection events (Gomez-Ortiz et al. 2006). Therefore,
the discontinuities as faults, fractures and cracks can
also be detected by GPR method (Seol et al. 2001;
Orlando 2002; Porsani et al. 2006; Grasmueck et al.
2005).
Three-dimensional visualization was constructed by
a series of parallel 2D profiles, starting from different
profiles and depth levels, to correlate layer signatures
from each profile according to depth (Figs. 8, 9). There
areclear continuation boundaries between the middle
(1.lb) and the lower level (2.lb). All these levels have a
clear boundary between the ignimbrite and their
basement (Fig. 8). Figure 9 is prepared in order to
view the 3D visualizations of subsurface of the 2D
profiles. Here, all boundaries are almost horizontal
between the ignimbrite levels and their basement sur-
faces.
According to the 2D radagrams and their 3D visu-
alizations (Figs. 7, 8, 9), three level boundaries have
been observed. The first two levels belong to the
middle and lower levels of the ignimbrite and the third
level belongs to the tuff level of Neogene lake sedi-
ments. On above these levels, a soil unit with a thick-
ness of 10–20 cm was interpreted as the disintegrated
and decomposed products of the upper level of the_Incesu ignimbrite. This level does not include in the
Fig. 6 The velocity analysison Reflex-Win V.3.5. Thehyperbola matching leadsa velocity analysis
Table 1 Physical properties and modal mineralogical composi-tions of _Incesu ignimbrite levels
Physical properties andmodal mineralogicalcompositions
Ignimbrite levels
Upperlevel
Middlelevel
Lowerlevel
Bulk density (g/cm3) 1.72 2.23 2.37Porosity (%) 6.97 1.69 0.45Humidity (%) 0.18–0.35 0.19 0.13Shards (%) 5–7 11 20Xenoliths (%) 2–5 4 6Plagioclase (%) 2–12 10 15Mafic and opaque min (%) 1–6 5 8
Environ Geol (2007) 52:1387–1397 1393
123

GPR data processing because of their variable petro-
graphical features and negligible thickness.
The depth of the boundary between the middle level
and the lower level is 1.5 m and this boundary is seen
as transitive at very small dimensions exterior one or
two fractures (Figs. 7, 8, 9). When these levels are
combined respectively with geology, the middle level
matches with a reddish pink ignimbrite and the lower
level with a blackish brown ignimbrite. The lower level
is less fractured and its boundary with the tuff level is
almost flat and in 2 m depths. The lower level is very
thin and whose thickness is 0.5 m. The tuff level is also
thin which is about 1 m and represents Neogene lake
sediments, when combined with geology. Finally, all
these levels are based on the limestone of the research
area.
The first boundary of the _Incesu ignimbrite has po-
sitive reflection (see amplitude–colour scale on Fig. 7),
which means that EM wave velocity of the lower level
is bigger than that of the middle level, or the dielectric
constant value of the lower level is smaller than that of
the middle level, according to the reflection coefficient
relation with the dielectric constant (K) and velocity
(V) between two levels. Moreover, the second bound-
ary between the lower level of the ignimbrite and the
tuff layer has negative reflections because the tuff layer
dielectric constant is bigger than that of the lower level
of the _Incesu ignimbrite (Figs. 7, 8, 9).
Dielectric constant value (K) depends on mineral
types, welding degree, flattening ratio and quantity of
fiamme structure, size and amount of lithic fragment
(xenoliths), porosity ratio, and humidity of a layer with
Fig. 7 Interpreted of selectedprocessed profiles of themeasurements
1394 Environ Geol (2007) 52:1387–1397
123

Kair = 1 and Kwater = 81. Therefore, increasing the
humidity ratio causesincrease in the K value andde-
crease in the velocity of the layers. K is inversely re-
lated to the porosity of the dry volcanic materials (Rust
and Russel 2000). However, for mixing model changes
in volume percentage of water will dominate changes
in K (Lunt et al. 2005). In addition, porosity is inversely
related to the density. These relations indicate that K
value decreases from the middle to the lower level. The
results give a positive reflection coefficient for the
interface between two levels. Furthermore, the abun-
dance of shard components in the _Incesu ignimbrite
decreases K values of the two levels.
The variations of the petrographical features and
physical properties of the ignimbrite levels causedif-
ferent reflection signals in the radagram of the GPR
profiles. As a result, GPR data can be used to deter-
mine the zonation boundaries within the ignimbrite
flow unit in view of their textural and petrological
features.
Conclusions
The ignimbrite is represented by the main lithology of
a pyroclastic suite and their mineral compositions and
textural feature changes through the columnar sec-
tions. The welding degree, colour, texture and miner-
alogical compositions reveal that the _Incesu ignimbrite
is divided into three levels as upper, middle and lower.
Fig. 8 3D visualizations ofthe 2D profiles including;a 9–10 profiles, b 7–10profiles; c 5–10 profiles;d 3–10 profiles and e allprofiles of the measurementarea (Symbols are similar toFig. 7)
Environ Geol (2007) 52:1387–1397 1395
123

Eutaxitic texture is dominant in the middle and lower
level samples and these levels have more compact
structure than the upper level.
Relative dielectric permittivity is active parameter
in the GPR method. This parameter led to definition of
the lithological unit and cracks of each unit. If there is
dielectric permittivity difference between host medium
and any object, or between two layers underground,
then the high frequency electromagnetic wave will re-
flect up and reach to receiver. Therefore, this boundary
can be observed on the GPR profile data. Here, if there
are permittivity differences in the ignimbrite levels,
GPR method can identify these levels physically.
The 2D data collection and processing were pro-
ceeded initially along a processing sequence, then a
block of data was formed by combining the profile
lines through the 3D view that is closely approxi-
mates an image of the subsurface, with the anomalies
that are associated with the object of interest located
in their special positions. The results of the GPR
method supply the geological discovery according to
differentiates of the dielectric permittivity parameter
value, which represents a physical underground
parameter in the layers. In addition, GPR method
could distinguish three thin layers successfully at the
study area as can be examined through the geological
investigation of the zonation of the ignimbrite. The
processing results of the radagrams showed that the
GPR could distinguish the thin ignimbrite levels with
reflected EM waves from the boundaries of different
units.
Acknowledgments This study was financially supported byDPT 2003-K-120-190-4-1 and Scientific Research Projects Unitof the Ankara University under grant nos. 2003-07-45-015 and2005-07-45-027. The authors would also like to extend theirthanks to unknown reviewers of the manuscript for their valu-able contributions.
References
Aldas GU, Kadıoglu S, Ulugergerli E (2006) The usage ofground penetrating radar (gpr) in designing blast pattern.Rock Mech Rock Eng 39:281–290
Aydar E, Gourgaud A (1998) The geology of Mount Hasanstratovolcano, Central Anatolia, Turkey. J Volcanol Geo-therm Res 85:129–152
Benson AK (1995) Applications of ground penetrating radar inassessing some geological hazards: examples of groundwatercontaminants, faults, cavities. J Appl Geophys 33:177–193
Bozkurt E (2001) Neotectonics of Turkey—a synthesis. Geodin-amica Acta 14:3–30
Cagnoli B, Ulrych TJ (2001) Ground penetrating radar images ofunexposed climbing dune-forms in the Ubehebe hydrovol-canic field (Death Valley, California). J Volcanol GeothermRes 109:279–298
Cas RAF, Wright JV (1988) Volcanic succession modern andancient. Unwin Hyman, London pp 528
Fig. 9 3D visualizations ofthe subsurface view of the 2Dprofiles starting with; a theboundary plane of middleignimbrite level; b theboundary plane of tuff level;c the boundary plane oflimestone
1396 Environ Geol (2007) 52:1387–1397
123

Cezar GS, Rocha PLF, Buarque A, Costa A (2001) TwoBrezilian archeological sites investigated by GPR: Serranoand Morro Grande. J Appl Geophys 47:227–240
Daniels JJ (1989) Fundamentals of ground penetrating radar.Proceedings of SAGEEP. Golden Colorado
Davis JL, Annan AP (1989) Ground-penetrating radar for high-resolution mapping of soil and rock stratigraphy. GeophysProspect 37:531–551
Druitt TH (1998) Pyroclastic density currents. In: JS Guilbert,RSJ Sparks (eds) The physics of explosive volcanic erup-tions. J Geol Soc Lond 145:145–182
Gomez-Ortiz D, Martın-Velazquez S, Martın-Crespo T, Mar-quez A, Lillo J, Lopez I, Carreno F (2006) Characterizationof volcanic materials using ground penetrating radar: a casestudy at Teide volcano (Canary Islands, Spain). J ApplGeophys 59:63–78
Grasmueck M, Weger R, Horstmeyer H (2005) Full-resolution3D GPR imaging. Geophysics 70:12–19
Green A, Gross R, Holliger K, Horstmeyer H, Baldwin J (2003)Results of 3-D georadar surveying and trenching the SanAndreas fault near its northern landward limit. Tectono-physics 368:7–23
Innocenti F, Mazzuoli R, Pasquare G, Redicati de BF, Villari L(1975) The Neogene calc-alkaline volcanism of CentralAnatolia: geochronological data of Kayseri–Nigde area.Geol Mag 112:349–360
Kadioglu S, Daniels JJ (2002) A hybrid 2d/3d ground penetratingradar (gpr) survey of brownfield site along Lake Street inChicago, Illinois (USA). In: International conference onEarth sciences and electronics 2002 (ICESE-2002), vol 2, pp255–261
Kadioglu S, Daniels JJ (2004) Integrated 3D visualization ofGPR data and EM-61 data. Geochim Cosmochim Acta68(11):A468
Kadıoglu S, Ulugergerli EU (2004) Determination of cavitiesusing ground penetrating radar in Dalaman-Akkopru damconstruction Area. The sixteenth international geophysicscongress and exhibition of Turkey, Abstract book 372–375
Kim C, Daniels JJ, Guy E, Radzevicius SJ, Holt J (2000)Residual hydrocarbons in a water-saturated medium: adetection strategy using ground penetrating radar. EnvironGeosci 7(4):169–176
Koralay T, Kadioglu YK (2003) Petrographic determination oftop and botoom levels of ignimbrites: _Incesu (Kayseri)ignimbrite. J Fac Eng Arch Selcuk Univ 18:43–54
Kurkcuoglu B, Sen E, Aydar E, Gourgaud A, Gundogdu N(1998) Geochemical approach to magmatic evolution of Mt.Erciyes stratovolcano Central Anatolia, Turkey. J VolcanolGeotherm Res 85:473–494
Le Pennec JL, Bourdier JL, Froger JL, Temel A, Camus G,Gourgaud A (1994) Neogene ignimbrites of the Nevsehirplateau (Central Turkey): stratigraphy, distribution andsource constraints. J Volcanol Geotherm Res 63:59–87
Le Pennec JL, Temel A, Froger JL, Sen S, Gourgaud A,Bourdier JL (2005) Stratigraphy and age of the Cappadociaignimbrites, Turkey reconciling field constraints with pale-ontologic, radiochronologic, geochemical and paleomag-netic data. J Volcanol Geotherm Res 141:45–64
Leucci G, Negri S (2006) Use of ground penetrating radar to mapsubsurface archaeological features in an urban area. JArchaeol Sci 33:502–512
Lunt IA, Hubbard SS, Rubin Y (2005) Soil moisture contentestimation using ground-penetrating radar reflection data. JHydrol 307:254–269
Miyamoto H, Haruyama J, Rokugawa S, Onishi K, Toshioka T,Koshinuma J (2003) Acquisition of ground penetratingradar data to detect lava tubes: preliminary results on theKomoriana cave at Ruji volcano in Japan. Bull Eng GeolEnv 62:281–288
Notsu K, Fujitani T, Ui T, Matsuda J, Ercan T (1995)Geochemical features of collision-related volcanic rocks incentral and eastern Anatolia, Turkey. J Volcanol GeothermRes 64:171–192
Orlando L (2002) Ground penetrating radar in massive rock: acase history. Eur J Environ Eng Geophys 7:265–279
Pasquare G, (1968) Geology of the Cenozoic volcanic area ofCentral Anatolia. Atti Accad Naz Lincei Mem 9:55–204
Pasquare G, Poli S, Vezzoli L, Zanchi A (1988) Continental arcvolcanism and tectonic setting in Central Anatolia, Turkey.Tectonophysics 146:217–230
Porsani JL, Sauck WA, Junior AOS (2006) GPR for mappingfractures and as a guide for the extraction of oranamentalgranite from a quarry. A case study from southern Brazil. JAppl Geophys 58:177–187
Russell JK, Stasiuk MV (1997) Characterization of volcanicdeposits with ground penetrating radar. Bull Volcanol58:515–527
Rust AC, Russell JK (2000) Detection of welding in pyroclasticflows with ground penetrating radar: insights from field andforward modelling data. J Volcanol Geotherm Res 95:23–34
Sambuelli L, Socco LV, Brecciaroli L (1999) Acquisition andprocessing of electric, magnetic and GPR data on a Romansite (Victimulae, Salussola, Biella). J Appl Geophys 41:189–204
Schumacher R, Keller J, Bayhan H (1990) Depositional charac-teristics of ignimbrites in Cappadocia, Central Anatolia,Turkey. In: Savascın MY, Eronat AH (eds) Proceedings ofthe international Earth science congress on Aegean regions(IESCA 1990), vol 2, pp 435–449
Schumacher UM, Schumacher R, Gotte-Viereck GL, Lepetit P(2004) Areal distribution and bulk rock density variations ofthe welded incesu ignimbrite, Central Anatolia, Turkey.Turk J Earth Sci 13:249–267
Sen E, Kurkcuoglu B, Aydar E, Gourgaud A, Vincent PM (2003)Volcanological evolution of Mount Erciyes stratovolcanoand origin of the Valibaba Tepe ignimbrite (CentralAnatolia, Turkey). J Volcanol Geotherm Res 125:225–246
Seol SJ, Kim JH, Song Y, Chung SH (2001) Finding the strikedirection of fractures using GPR. Geophys Prospect 49:300–308
Sparks RSJ, Wilson L (1976) A model for the formation ofignimbrites by gravitational column collapse. J Geol SocLond 132:441–451
Temel A, Gundogdu MN, Gourgaud A, Le Pennec JL (1998)Ignimbrites of Cappadocia (Central Anatolia, Turkey):petrology and geochemistry. J Volcanol Geotherm Res85:447–471
Toprak V (1998) Vent distribution and its relation to regionaltectonics, Cappadocian Volvanics, Turkey. J VolcanolGeotherm Res 85:55–67
Environ Geol (2007) 52:1387–1397 1397
123
Copyright © 2022 FDOKUMEN