Light requirements and depth zonation of marine macroalgae
10
Vol. 88: 83-92, 1992 l MARINE ECOLOGY PROGRESS SERIES Mar. Ecol. Prog. Ser. Published October 29 Light requirements and depth zonation of marine macroalgae Stiig Markager*,Kaj Sand-Jensen** Botanical Institute. Aarhus University, Nordlandsvej 68, DK-8240 Risskov. Denmark ABSTRACT: Light compensation points (I,) for growth were low (0.3 to 2.5 pmol n r 2 S-') for the temperate marine macroalgae Chondrus crispus, Fucus serratus, Petalonia fascia, Porphyra purpurea and Ulva lactuca measured at 7 'C. These I,-values corresponded to those estimated by a physiological model including light absorption and quantum yield for growth to describe carbon gain, and weight specific dark respiration, dark loss rate and thallus specific carbon (m01 C m-* thallus) to describe carbon loss. Absorption and quantum yield were close to the theoretical maximum for all species and could not explain differences in I,. Respiration and thallus specific carbon varied more than 15-fold and were the main factors responsible for variations in I,. Experimental &-values correspond to 0.12 to 0.61 % of the yearly surface light dose in Denmark (56" N). These values agree with the K of surface light (%SI) available at the depth limits of leathery and foliose macroalgae at different latitudes. Hence, there is no surplus of energy to balance grazing and mechanical losses, and these factors must be of minor importance for macroalgae growing at great depths. A literature review of depth limits for marine macroalgae reveals an upper zone of mainly leathery algae with depth limits of about 0.5 %) SI, an intermediate zone of foliose and delicate algae with depth limits at about 0.10 % SI, and a lower zone of encrusted algae extending down to about 0.01 % SI. This zonation pattern is accompanied by a decrease in thallus specific carbon (i.e. thinner thalli) with increasing depth. The inverse relationship between growth rate at low light and thallus specific carbon suggests that a thin thallus is essential for growth and survival of marine macroalgae at great depths. INTRODUCTION The light compensation point (I,) for growth of marine macroalgae is a central parameter in coastal ecology. Attached macroalgae are important in many coastal ecosystems as primary producers (Mann 1973, 1982) and structural components with a rich macro- fauna. The light compensation point sets the physio- logical constraints for the depth limit of attached macroalgae and affects the ability of macroalgae to grow in shaded habitats, below rocks or canopies of other algae, and to sustain epiphyte loads. Despite the importance, however, few determinations of I, for growth of marine macroalgae are available (Chapman Present addresses: 'Institute of Life Sciences and Chemistry, Roskilde University. PO Box 260, DK-4000 Roskilde, Denmark " Freshwater Biological Laboratory, University of Copen- hagen, Helsingergade 51. DK-3400 Hillerod, Denmark & Lindley 1980, Schonbeck & Norton 1980, Maggs & Guiry 1987, Sand-Jensen 1988a). Here we determine I,-values of marine red, brown and green macroalgae displaying a range of thallus thicknesses. The minimum light requirement for a plant is reached when captured light provides just enough ATP and reducing equivalents to balance loss pro- cesses within the tissue. Both the ability to capture and utilize light and the loss processes in the plant depend on several physiological parameters which, accord- ingly, affect the light compensation point. The common method to determine I, for growth is to plot growth rates (y) vs light (X) for low light intensities. This method only allows judgement of the relative impor- tance of the y-axis intercept (loss rate in the dark) and the slope of the line (light utilization efficiency) for the regulation of I, (x-axis intercept), and parameters which influence the dark loss rate and the light utilisa- tion efficiency cannot be evaluated. In this paper we examine how the &level of macroalgae depends on O Inter-Research 1992
-
Upload
independent -
Category
Documents
-
view
0 -
download
0
Transcript of Light requirements and depth zonation of marine macroalgae

Vol. 88: 83-92, 1992 l MARINE ECOLOGY PROGRESS SERIES Mar. Ecol. Prog. Ser.
Published October 29
Light requirements and depth zonation of marine macr oalgae
Stiig Markager*, Kaj Sand-Jensen**
Botanical Institute. Aarhus University, Nordlandsvej 68, DK-8240 Risskov. Denmark
ABSTRACT: Light compensation points (I,) for growth were low (0.3 to 2.5 pmol n r 2 S- ' ) for the temperate marine macroalgae Chondrus crispus, Fucus serratus, Petalonia fascia, Porphyra purpurea and Ulva lactuca measured at 7 'C. These I,-values corresponded to those estimated by a physiological model including light absorption and quantum yield for growth to describe carbon gain, and weight specific dark respiration, dark loss rate and thallus specific carbon (m01 C m-* thallus) to describe carbon loss. Absorption and quantum yield were close to the theoretical maximum for all species and could not explain differences in I,. Respiration and thallus specific carbon varied more than 15-fold and were the main factors responsible for variations in I,. Experimental &-values correspond to 0.12 to 0.61 % of the yearly surface light dose in Denmark (56" N). These values agree with the K of surface light (%SI) available at the depth limits of leathery and foliose macroalgae at different latitudes. Hence, there is no surplus of energy to balance grazing and mechanical losses, and these factors must be of minor importance for macroalgae growing at great depths. A literature review of depth limits for marine macroalgae reveals an upper zone of mainly leathery algae with depth limits of about 0.5 %) SI, an intermediate zone of foliose and delicate algae with depth limits at about 0.10 % SI, and a lower zone of encrusted algae extending down to about 0.01 % SI. This zonation pattern is accompanied by a decrease in thallus specific carbon (i.e. thinner thalli) with increasing depth. The inverse relationship between growth rate at low light and thallus specific carbon suggests that a thin thallus is essential for growth and survival of marine macroalgae at great depths.
INTRODUCTION
The light compensation point (I,) for growth of marine macroalgae is a central parameter in coastal ecology. Attached macroalgae are important in many coastal ecosystems as primary producers (Mann 1973, 1982) and structural components with a rich macro- fauna. The light compensation point sets the physio- logical constraints for the depth limit of attached macroalgae and affects the ability of macroalgae to grow in shaded habitats, below rocks or canopies of other algae, and to sustain epiphyte loads. Despite the importance, however, few determinations of I, for growth of marine macroalgae are available (Chapman
Present addresses: 'Institute of Life Sciences and Chemistry, Roskilde University. PO Box 260, DK-4000 Roskilde, Denmark
" Freshwater Biological Laboratory, University of Copen- hagen, Helsingergade 51. DK-3400 Hillerod, Denmark
& Lindley 1980, Schonbeck & Norton 1980, Maggs & Guiry 1987, Sand-Jensen 1988a). Here we determine I,-values of marine red, brown and green macroalgae displaying a range of thallus thicknesses.
The minimum light requirement for a plant is reached when captured light provides just enough ATP and reducing equivalents to balance loss pro- cesses within the tissue. Both the ability to capture and utilize light and the loss processes in the plant depend on several physiological parameters which, accord- ingly, affect the light compensation point. The common method to determine I, for growth is to plot growth rates (y) vs light (X) for low light intensities. This method only allows judgement of the relative impor- tance of the y-axis intercept (loss rate in the dark) and the slope of the line (light utilization efficiency) for the regulation of I, (x-axis intercept), and parameters which influence the dark loss rate and the light utilisa- tion efficiency cannot be evaluated. In this paper we examine how the &level of macroalgae depends on
O Inter-Research 1992
84 Mar. Ecol. Prog. Ser. 88: 83-92. 1992
the basic physiological parameters: weight specific respiration, thallus specific carbon content (carbon per thallus area, analogous to 'leaf specific mass'; Wit- kowski & Lamont 1991), light absorption and quantum g ......... 0 ............................................................
yield for growth. Light compensation points measured in laboratory
experiments and depth limits in nature are difficult to compare. Laboratory measurements of I, represent the - absolute (or physiological) minimum llght require- ments. In nature, macroalgae may need a surplus of energy to balance grazing and mechanical damage and to allow physiological adjustments to environmen- tal changes. The natural light climate is very variable and light intensities above saturation are utilized less efficiently than low Light. A surplus of energy is also needed to form new biomass and reproductive units. The mean light intensity at the depth limit is, therefore, o 20 40 6 0 8 0
expected to be significantly higher than laboratory measurements of I, and differences between the two Incident light for growth (prnol rn-'s-') may quantify the extra energy needed to balance losses in the field, we our experimental Fig. 1. Petalonia fascia. Specific growth rate vs incident llght
at 7 "C. (-) Linear relationship calculated by linear regres- I,-values with literature values of light availability at sion for points below 10 Clmol m.Z s-,; Eq. fitted to all the maximum depth of macroalgal growth. data points
MATERIALS AND METHODS
Laboratory growth experiments were described in de- tail by Markager (in press). Briefly, attached individuals of 5 marine macroalgae were collected in Arhus Bay, Denmark, (salinity about 20 %a) and cut into discs (Ulva lactuca, Petalonia fascia, Porphyra purpurea) or 2 to 4 cm apical shoots (Fucus serratus, Chondrus crispus). After 7 to 14 d acclimation, thallus pieces were grown at 7 "C at 5 to 8 different light intensities and in the dark for 13 to 4 1 d. The growth medium was GF/C filtered sea- water enriched with 500 pg NH,-N l-', 500 yg NO,-N 1- ' and 100 pg PO4-P I-'. The experiment was repea- ted 6 times with 1 to 3 species each time. Growth rates (p) were getermined from changes in carbon content of the tissue' over time ( t ) . Thallus specific carbon (D) and dark respiration ( R d ) were measured at the end of the experiments on all thalli from the dark and from each light intensity. Dark respiration was measured as oxy- gen consumption in closed bottles over 14 h at 7 'C and converted to carbon units assuming RQ of 0.8 m01 CO? mol-' 02. Fractional light absorption (A) was measured every week as 1 minus fractional transmission (Vermaat & Sand-Jensen 1987) on all thalli.
The light compensation point was estimated from the relationship between growth rate and light (e.g. Fig. l ) , by (1) selecting a light in.tensity below which the points show a linear relationship and then calculat- ing I, by regression analysis, and (2) calculating the parameters for one of the common p-I or P-I functions
(Bannister 1979, Jassby & Platt 1976) and then calcu- lating I,. Method 1 is objective, apart from the selec- tion of the appropriate light range, and allows calcula- tion of confidence limits for I,. Method 2 seems objective, but the selection of p-I equation can bias the estimate of I, (Geider et al. 1985), and this method does not provide confidence limits for I,. For Method 2 we used the equation of Bannister (1979) which has a shape parameter (m) which should minimize the influ- ence of curve shape on I,:
where p = net growth rate; cu = initial slope of growth rate vs light; p , = maximal growth rate; and (-pd) = loss rate in the dark. The difference between I,-values determined by the linear regression (Method 1 ) and the p-I curve (Method 2) was 0 to 1.2 pm01 m-2 S-' (mean value 0.35 pm01 m-2 S-') and 2.7 times less than the 95 %
confidence limits found by the linear regression method (mean values ? 0.95 pm01 m-2 S-'; Table 1 ) . Thus, the un- certainty related to the choice of calculation method was small compared to the uncertainty of growth measure- ments of I,. We subsequently chose the linear regression method because it provides confidence limits for I,.
Light-limited net growth rate of macroalgae with a flat thallus can be expressed by
Symbols and units are defined in Table 1. The product 14,A represents the area specific carbon gain per unit

Markager & Sand-Jensen: Light requirements of macroalgae 85
Table 1 Observed and calculated llght compensation polnts (I,, pm01 m ' S - ' ) and the parameters that determine the calculated I, in different experiments with 5 species of marine macroalgae Thallus specific carbon at I, (D, m01 C m-' thallus area , one side), weight speclfic dark respiration (R,,, mm01 C mol-' cell C d- l ) , dark loss rates ( p , , , mm01 C mol-l cell C d - l ) and fractional light absorption (A, dlmensionless) are mean values of 10 to 14 ind~v~dua l s (Markager in press). Gross quantum yleld for growth (b,, mm01 C mol-' absorbed photons) is the mean value of tndividuals at lirnltlng light (Markager in press) k (dimensionless) = slope of the linear relat~onshlp between parallel measurements of dark respiration and specific growth rate for 25 to 90 ~ n d i v ~ d u a l s Thallus specific carbon and absorption at I, were calculated by ~ntet-polat~on between values in the dark and at low Ilght. Area speclf~c res- piratton at l, was calculated as (R, + k p G l ) D , (mmol C m d.'). Photosynthetic effic~ency ( a ) 1s calculated as Ad,, [mmol C m L d - '
(prnol n ~ - % ~ ' ) ' ] . CL: mlnimum estlrnates (see text) of confidence h m ~ t s ( p > U 95), CV. coefficient of vat-latlon (SD/mean)
Fucus Porphyl-a Chondrus Ulva lactuca Petalonia fascia
serratus purpurea cnspus
Llght dark cycle 24 0 24.0 14.10 24.0" 24:O 24-0 14.10 14 10 14.10 24.0 14.10
4 ' ~ 83 70 92 56 86 74 100 95 98 7 3 99 Absorpt~on at I, 0.63 0.63 0.65 0.40 0.58 0.60 0.59 0.68 0.89 0 .48 0 88
(cbgA) 4.5 3 .8 5 2 1 9 4.3 3.8 5.1 5 6 7.5 3.0 7 5
D a t I , 0.46 0.59 0 58 0.36 0.30 0.45 0.35 0 35 2.46 0.38 4.38 Dark resptration 6.0 5 1 3.5 13.0 24.0 21.6 18.6 30.6 2 7 2 9 0.47 Dark loss rate 12.0 1.3 9.3 12.0 35.0 5.8 13.0 11.9 1 2 8 5 0.32 k 0.11 0.07 0.16 0.10 0.19 -0.03 0.17 0 00 0.06 0.18 0.03 Respiration at I, 3 .3 3.0 2.9 5.1 9.0 9.7 7.2 10.7 6 8 1.7 2.1
Observed I, 1.87 0.33 1.37 2.47 2.20 1.61 1.61 2.45 1.12 1.28 0.44 Calculated I, 0.73 0.80 0.56 2.65 2.10 2.53 1.42 1.92 0.90 0 55 0.28 CL of observed I, 0.3 1 73 1.35 0.97 1.21 1.50 0.89 1.02 3.55 0 89 6 75 CV of calculated I, - 0.12 0.35 - - 0.13 0.29 0.41 0 16 - 0.27
"Data from Sand-Jensen (1988a, b)
time. The basic loss process is the carbon specific maintenance respiration (R,,), equivalent to the respi- ration of indimduals kept in the dark for a long time. However, because the respiration rate increases lin- early with the growth rate with the slope k (Langdon 1988, Sand-Jensen 1988a, Geider & Osborn 1989, Sand-Jensen & Madsen 1991, Markager & Sand- Jensen unpubl.), the term k p g is added to R,. Here p, represents the gross growth rate defined as the observed growth rate (p) plus the dark loss rate (-pd). To obtain the loss rate per unit area of the thallus, the carbon specific respiration rate is multiplied by the thallus specific carbon (D). Eq. 2 is rearranged to yield the light compensation point (I,) at zero growth (p = 0):
For p = 0, pg is equal to the dark loss rate which is inserted in Eq. 3. I,-values calculated from Eq. 3 are hereafter denoted calculated I,-values and the &-values estimated by linear regression from p-I plot are denoted observed values, because they (though calculated) are derived directly from measured growth rates.
Values for R, and pd were attained for individuals kept in the dark for at least 25 d , and k was deter- mined from the relationship between respiration rate and growth rate for all individuals in each experi- ment. Gross quantum yield for growth (&g) was calcu-
lated individually for each thalli from the increase in b~omass (X, - xo) and dark respiration (Rd), both con- verted to carbon units, and measurements of absorbed
11ght (1,)
The measured values for absorbed light also include reflection and absorption by non photosynthetic active compounds, and the calculated &-values, therefore, underestimate the true quantum yield (Markager in press). Quantum yield is known to decrease as the light intensity approaches saturation. Therefore, only values for light-limited individuals were used to calculate dg-values.
RESULTS
Light compensation points
Observed I,-values were between 0.33 and 2.45 pm01 m-' S-' and averaged 1.52 (Table 1 ) . Three experiments with Ulva lactuca (a foliose green alga) yielded 0.33, 1.37 and 1.87 pm01 m-' S-', slightly lower than 2.47 pm01 m-2 S-' found by Sand-Jensen (1988a). In 4 experiments with the foliose brown alga Petalonia fascja, &-values were from 1.61 to 2.45, and the

86 Mar. Ecol. Prog. Ser. 88: 83-92, 1992
I,-value was lower, 1.12 pm01 m-* S-', for the leathery brown alga Fucus serratus. The foliose red alga Porphyra purpurea had an &-value of 1.28 pm01 m-2 S-'
and the leathery red alga Chondrus crispus showed the lowest value of 0.44 pm01 m-2 S-'. The small range (Table 1) means that none of the differences between species were statistically significant, given the uncer- tainty of the estimates.
The reported I,-values represent intensities during the light period. For Ulva lactuca and Petalonia fascia, where experiments were performed in continuous light or a 14 : 10 light: dark cycle, &-values were rela- tively unaffected by the length of the light period (Table 1). Thus, the 24 h light dose to reach I, was lower for individuals kept in a light: dark cycle.
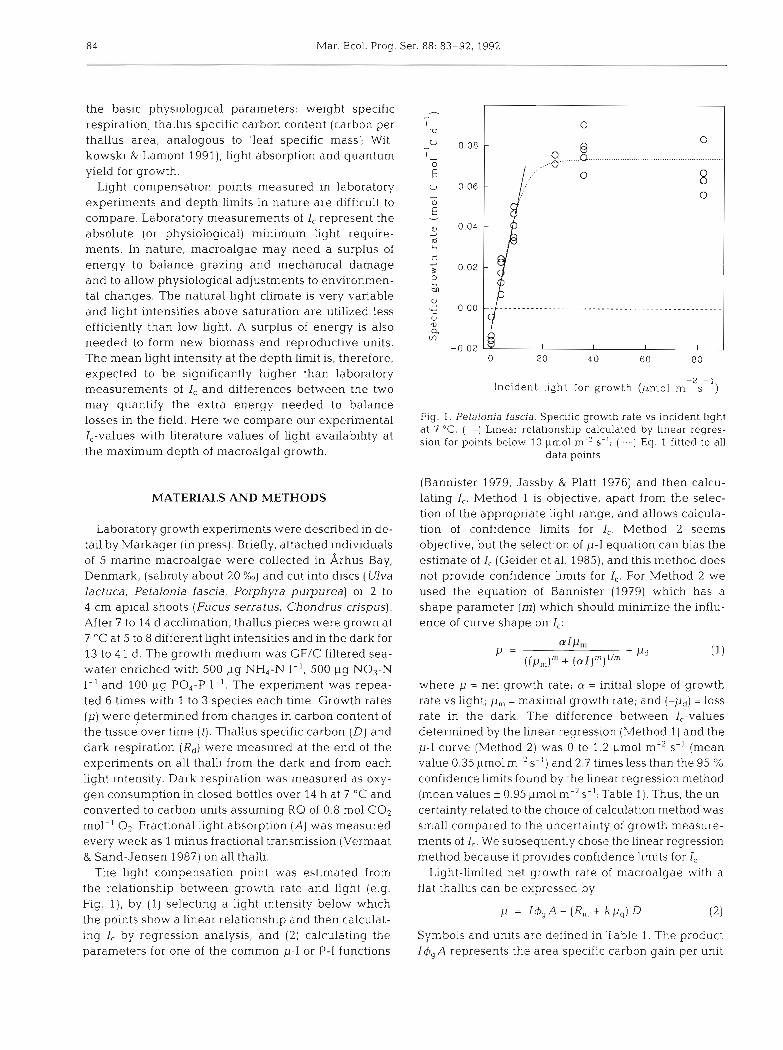
The I,-values calculated from Eq. 3 ranged from 0.28 to 2.53 pm01 m-2 S-' (Table 1) and show a significant correlation (r = 0.71, p = 0.013; t-test) to observed values (Fig. 2). Assuming that differences exceeding 2 SD are significant, Chondrus crispus has significantly lower calculated I,-values than U1va lactuca and Fucus serratus in 1 experiment and than Petalonia fascia in 2 experiments.
Regulation of I,
Light absorption was higher in Fucus serratus and Chondrus crispus than in the other species with lower thallus specific carbon (Table 1). There was no signifi-
cant difference in gross quantum yield between species. Mean dark respiration was high for Petalonia fascia (mean 23.8 mm01 C m01 cell C-' d-l), inter- mediate for Ulva lactuca, F. serratus and Porphyra pur- purea (2.7 to 6.0 mm01 C m01 cell C-' d-l) and low for C. crispus (0.47 mm01 C m01 cell C-' d-l). No system- atic variations in k and dark loss rate could be de- tected. However, for all 3 parameters (R,, k and ,ud) values were particularly low for C. crispus, indicating very low weight specific loss rates.
We can identify the sensitivity of I, to variations in the parameters affecting I,. Light absorption and quantum yield varied about 2-fold among the 5 species whereas the 4 parameters affecting the area specific respiration rate varied 15-fold or more (Table 2) . The sensitivity of I, to variation of each parameter in Eq. 3 was calculated from the first partial derivative which has the unit pm01 m-2 S-' (parameter unit)-' (Table 2). The product of the first derivative and the range of variation for the specific parameter yields the potential contribution to the variation in I, caused by that para- meter. We calculated the contribution to the variability in I, for the entire range of values observed in our experiments (Table 1). Calculations identified D (60 to 70 % of the potential variation) and R, (ca 25 % of the variation in I,) as the main parameters influencing I, (Table 3). Absorption and quantum yield had, because of low variability, negligible effects on I,, and I, was relatively unaffected by variations of k and dark loss rate (Table 3). These results, based on the entire range observed for each parameter, refer to the total variabil- ity in I, for all 5 species. Within-species variability was, however, smaller than that among species particularly for D. Variability in I, was, for Ulva lactuca, mainly dependent on R, and to a smaller extent on A and D. For Petalonia fascia the main parameters controlling I, were D and R, (Table 3). The sum of variation in I, for each parameter (Table 3) represents a maximum esti- mate of I , variability. Any positive relationship be- tween gain (A and 4,) and loss parameters (R,, pd, k and D), or negative relations within gain or loss para- meters, will reduce the actual variation in I,. For the loss parameters we did find a negative correlation between R, and D. Hence, the actual variation of area1 specific respiration was smaller (6.3-fold) than the sum of variation m each of the loss parameters.
0 1 2 3 DISCUSSION
-2 Observed I= (prnol m S- ' ) Minimum light requirements
Fig, 2. Calculated (Eq . 3) versus observed values of the light compensation point for growth a t 7 "C; (a ) Ulva lactuca; (m) Observed and calculated I,-values ranged between
Petalonia fascia; ( 0 ) Fucus serratus; (v) Chondrus crispus; 0.3 and 2.7 pmol m-2 S-' the species acclimated . .
(v) Porphyra purpurea to low light at 7 'C. Because the species represent

Markager & Sand-Jensen: Light requirements of macroalgae
Table 2. First partial derivatives of the parameters in the equations for I , (Eq. 3) and the mean values for the 11 experiments in Table 1, uslng a 14 : 10 h hght: dark cycle for all expenments. The range and variability of the parameters are given. Units as in Table 1
Parameter dIc Mean of Minimum Maximum Range Factor of 1st pa r t~a l variation
d x denvative
Quantum yield dIc - - (Rm - k ~ d ) D
-0 029 56 100 4 4 1 8 d 4
Absorption dIc - - (R, - k ~ d ) D -
d A A 24
dI, ( R , - kPd) Thallus specific carbon - -
dD A 4
Dark respiration dIc - D - - -
dR, A 4
k dIc PdD
d k A 4
dIc k D Dark loss rate - - 0.021 0.32 35.0 34.7 109
dPd A 4
different taxonomic groups and thallus thicknesses, this interval may, overall, be a realistic range for foliose and leathery marine macroalgae grown at 7 "C. Literature data for these thallus types support this con- clusion. Values between 2.2 and 3.3 pm01 m-2 s-' in Ascophyllum nodosurn and Pelvetia canaliculata can be calculated from growth data (10 'C) presented by Schonbeck & Norton (1980). Chapman & Lindley (1980) found 0.64 pm01 m-' S-' (0 to 1 "C) in Laminaria solidungula and Maggs & Guiry (1987) obtained very low values (0.2 pm01 m-2 S-', 15 "C) for a filamentous red alga. Low values (0.3 to 0.8 pm01 m-' S-', 10 "C)
were also found for 3 Larninana species and Sacco- rhiza polyschides (Kain 1966). However, some of these values may be underestimated because they are based on changes in surface area or fresh weight. Some species are able to increase their area or fresh weight at low light and in the dark, at the expense of their carbon reserves (Chapman & Lindley 1980, Sand- Jensen 1988a, Markager & Sand-Jensen unpubl.).
Reported &values for photosynthesis are usually higher than I,-values for growth. Mean values for 22 species of marine macroalgae were 6.2 pm01 m-2 S- ' at 5 "C and 7.7 pm01 m-2 S-' at 10 'C (King & Schramm
Table 3. Mean values of the product dI,/dx (X,,,,-X,,,,) (dI,/dx = mean of the first partial derivative, and (X,,,-X,,,) = range of the parameter for individuals grown at I,) for the 6 parameters In Eq. 3. Values are shown for all expenments together, for 4
experiments with Ulva lactuca, and for 4 experiments with Petalonia fascia. Unlts are pm01 m-' S-'
Parameter All experiments Ulva lactuca Petalonia fascja
Mean % of sum Mean % of sum Mean % of sum of means of means of means
Quantum yield (4,) -0.1 1 0.32 -0.10 2.0 -0.09 2.0 Absorption -1.94 5.6 - 1.06 21.4 -0.56 12.4 Thallus specific carbon 22.58 65.1 1.12 22.5 1.51 33.5 Dark respiration 8.94 25.8 2.25 45.2 1.63 36.3 k 0.38 1.1 0.18 3.6 0.44 9.9 Dark loss rate 0.74 2.1 0.27 5.4 0.26 5.9
Sum of absolute values 34.7 100.0 4.97 100.0 4.50 100.0

88 Mar. Ecol. Prog. Ser. 88: 83-92, 1992
1976). Dunton & Jodwalis (1988) estimated I, for photo- synthesis to be about 3 b~mol m-' s-' in Laminaria solidungula (2 "C) and Matta & Chapman (1991) found 26.3 pm01 m ' S-' in Colpomenia peregrina (15 to 20 "C). Apart from methodological differences, a pos- sible explanation for the discrepancy is that respiration rates increase with growth rates (Langdon 1988, Sand- Jensen 198813, Markager & Sand-Jensen unpubl.). I,- values obtained in photosynthesis experiments with plants grown at normal light intensities (King & Schramm 1976, Matta & Chapman 1991) will, there- fore, be higher than I,-values for growth with plants acclimated to low light conditions (Sand-Jensen 1988b). Consequently, photosynthetic measurements of I, do not allow estimates of minimum light require- ments for growth and maximum depth penetration, unless experiments are performed with individuals acclimated to light intensities about the I,-value. This aspect is frequently overlooked.
Factors affecting minimum light requirements
The I,-model (Eq. 3) is a combination of well-known relationships between light intensity and carbon gain, and between growth rate and respiration. The model is able to explain most of the variation in the observed I,- values, despite the large confidence limits relative to the small range of I,-values. Furthermore, no system- atic deviation from a 1 : 1 relationship was found (Fig. 2) and the mean values were in close agreement. Hence, the model developed here should provide a useful basis for the analysis of variations in I,.
The sensitivity analysis showed that the 9-fold varia- tion in I, observed over the 11 experiments (Table 1) was primarily attributable to differences in weight specific dark respiration rate and thallus specific car- bon whereas the influence of light absorption and quantum yield was much smaller. To appreciate this difference in variability of gain and loss processes of organic carbon, we must consider the physical con- straints on the parameters.
The gain parameters (A and rb) have well defined upper limits (1 for A and 125 mm01 C mol-' photons for &; Raven 1984), and the observed values are with~n about 50 ".;, of these values and consequently vary less than 2-fold. For quantum yield the differences between the observed and the theoretical values were mainly due to reflection and absorption by structural compo- nents (Markager in press). Furthermore, all values be- low 92 mm01 C mol-' photons were found in experi- ments with continuous light suggesting that this represents a stress which reduces quantum yield. We therefore conclude that about 95 mm01 C mol-' photons is a realistic value for all species in a natural light cli-
mate. A detailed analysis of quantum yield for growth for the species treated here is provided by Markager (in press). Light absorption varies more than quantum yield but was closely correlated with the log thallus specific carbon (Markager in press), probably because absorp- tion in thin species is limited by the maximum possible pigment content per unit area (Markager in press) and package effects (Rabinowitch 1951, Britz & Briggs 1987). Overall, carbon gain in individuals adapted to low light is close to the maximum attainable provided that nutri- ents and growth conditions otherwise are adequate. The low values for absorption and quantum yield for Ulva lactuca included in Table 1 (A = 0.4, 4, = 56 mm01 C mol-' photons) from Sand-Jensen (1988a, b) are pre- sumably due to nitrogen limitation and high light levels in the field at collection of plants for experiments.
The carbon specific respiration rate varied consider- ably, and in contrast to the upper limits for A and $, the physical constraints on lower limjts of R, are not quantified in the literature. Consequently, we are unable to determine a theoretical lower limit for I,. Fucus serratus, Chondrus crispus and Porphyra pur- purea had low rates of dark respiration which, in C. cnspus, more than compensated for the high thallus specific carbon. C. crispus and P. purpurea had the lowest area specific respiration rates among the 5 species. If this is a general phenomenon among red algae, it could explain their common dom~nance at great depths (Sears & Cooper 1978, Dring 1981, Math- ieson et al. 1981), but further experiments are needed to test this hypothesis.
Experimental I,-values and depth limits
Subtidal vegetation of macroalgae can be divided into 3 zones (Vadas & Steneck 1988). An uppermost zone dominated by large brown algae with an understorey of other algae; an intermediate zone where foliose and del- icately-branched species dominate, still wi.th an under- storey of crustose algae; and a deep community where vegetation consists only of crustose, often calcified algae (Norton et al. 1977, Littler et al. 1985, Vadas & Steneck 1988). The vertical extension of these zones is set by light attenuation in the water column and is, therefore, best described by the percent of surface light ("h SI) reaching their maximum depth of growth. Reported extinction depths for these 3 zones range from 0.12 to 1..5 % S1 (mean 0.48 "/o SI) for the upper zone, where large brown algae dominate, from 0.02 to 0.22 % S1 (mean 0.12 %I SI) for that dominated by foliose algae, and from 0.003 to 0.05 % S1 (mean 0.012 % SI) for the deepest zone dominated by crustose algae, with the extremely low values of 0.0005 %S1 (Littler et al. 1985) and 0.00023 ?L S1 (Agegian S( Abbott 1985) as apparent

Markager & Sand-Jensen Light requirements of macroalgae 89
exceptions (Table 4) . The value of Llttler et al. (1985) was found by extrapolation of a light attenuation curve between 0 and 120 m (Fig. 1 in Littler et al. 1986) down to 268 m and Agegian & Abbott (1985) only provided a mean attenuation coefficient of 0.052 m-' fol- the entire water column. Direct light measurements are needed to confirm the exact light levels as % S1 for these deepest records of macroalgae.
I f these depth h i t s corresponded to a fixed light dose, then depth limits as U/o S1 are expected to be shallower at higher latitudes due to less incoming surface light. This expectation is not supported by the data (Table 4) for leathery and foliose algae. In fact, the deepest growing large brown algae were found in the arctic (Chapman &
Lindley 1980, Dunton 1990), where the annual light dose at the maximum depth of Laminaria solidungula was 45 to 50 m01 m-2 yr-' (Dunton 1990), which is lower than 71 m01 m-2 yr-' for Laminaria hyperbora at Helgoland (North Sea) (Luning & Dring 1979). Perhaps reduced metabolic rates associated with lower temperature at higher latitudes compensate for the lower surface Light there, so that depth limits, given as % SI, are relatively independent of latitude. Data for crustose species from temperate and especially from arctic regions are needed before a general statement can be made for this group.
Our experimental I,-values (0.3 to 2.5 pm01 m-2 S- ' ) in a 14: 10 h 1ight:dark cycle correspond to 5.5 to 46 m01 m-2 y r - ' or about 0.12 to 0.61 YO S1 in Denmark (56" N) , where mean water temperatures are close to the experi- mental temperature (7 "C). These values agree with % S1 values in Table 4 for leathery and foliose algae. The cor- respondence suggests that algae living at depths with % S1 in the lower part of the ranges in Table 4 have no surplus energy to cover grazing or mechanical losses. This is supported by observations of particularly deep growth when grazing is insignificant. For example, Vadas & Steneck (1988) found lower depth limits (0.4 % SI) for large brown algae when herbivores were few, which is lower than that reported for Laminaria hyper- bora (1.5 % SI) on a location subjected to grazing by Echi- nus esculentus (Kain 1971, 1976). It therefore appears that the greatest depth limits in Table 4 are set directly by the physiological light compensation point for growth.
Thallus-specific carbon influencing macroalgal zonation
Vertical distribution of macroalgae in the 3 zones as proposed by Vadas & Steneck (1988) is supported by
Table 4 Depth llmits of manne macroalgae w t h sheet-like thalli in metres and In percent of surface l ~ g h t (% SI) for localities from tropical to high arctlc northern regions Species are divided into 3 morphological types Leathery species have a thick thallus wlth many cell-layers and fol~ose specles have a thin thallus with only one or few cell-layers In cases where the reference listed depth
limits for many species, only the deepest occurring specles in each group was included
Species Lat~tude Depth Leathery Foliose Crustose Source (ON) (m) ( % SI) (% SI) (% SI)
Cystoseira sp. 27 8.5 0.2 Neushul (1971) Cystoseira sp. 28 9.5 0.12 Neushul (1971) Agarum cribrosum 4 3 40 0.44 Vadas & Steneck (1988) Lamlnaria h yperborea 54 8 0.7 Luning & Dnng (1979) Laminaria hyperborea 54 19 1.0-1.9 Kain (1971), Kain et al. (1976) Lamlnaria solidungula 70 6 4 0.2 Dunton (1990) Laminaria solidungula 69 2 0 0 18 Chapman & Lindley (1980) Foliose macroalgae 11 140 0.18 Hillis-Colinvaux (1985), Colin et al. (1986) Lobophora variega ta 16 140 0.06 Agegian & Abbott (1985) A4onostroma sp. 2 1 118 0.22 Agegian & Abbott (1985) Johnson-Sea-linkia profunda 24 157 0.02 Littler et al. (1985) ~Maripelta sp. 28 13 0.12 Neushul (1971) Ptilota serrata 4 3 50 0.11 Vadas & Steneck (1988) Phycodrys rubens 4 3 50 0.11 Vadas & Steneck (1988) Coralllnes 11 228 0.004 Hillis-Colinvaux (19851, Colin et al. (1986) Crustose red algae 16 250 0.00023' Agegian & Abbott (1985) Crustose red algae 2 1 182 0.008 Agegian & Abbott (1985) Crustose red algae 24 268 0.0005 Littler et al. (1985) Crustose red algae 36 Cave 0.003 Larkum et al. (1967) Leptophytum laeve 43 63 0.02 Vadas & Steneck (1988) Lithothanlnion sp. 54 15 0.05 Liining & Dring (1979)
Overall mean 0.48 0 12 0.012
' calculated from a mean attenuation coefficient of 0.052 m-' for the water column as stated in the paper; a lower attenuation coefficient due to the spectral changes at great depths may increase this value to about 0.0005 %

Mar. Ecol. Prog. Ser. 88: 83-92, 1992
the data in Table 4. Algal growth forms in these zones correspond to 3 levels of thallus specific carbon (D). D-values between 1.5 and 4.5 m01 C m-' are represen- tative for leathery species, e.g. Fucus or Laminaria species and Chondrus crispus (Liining 197 1, 1979, Raven et al. 1979, this study). The foliose species in this study had D-values between 0.3 and 0.6 m01 C m-2 at I,, representative for 'thin algae', and the density of the deepest crustose algae in Littler et al. (1985) can be calculated to be 0.0087 m01 C m-2 (Littler et al. 1986).
Thallus specific carbon (D) regulates the area specific growth rate in 2 ways. Together with the car- bon specific respiration (R) it affects the area specific respiration (R, = RD) which, as shown above, is a keyfactor for the carbon balance per unit area and thus for I,. However, D also regulates the specific gross growth rate [net growth plus respiratory losses, m01 C (m01 cell C)-' d-l] attainable for a certain carbon surplus per unit area. Though light absorption, and thereby carbon fixation, increases to some extent with D (Markager in press), the specific gross growth rate will decline in direct proportion to D for a constant carbon fixation rate per unit area. This is the situation because the variation in D is much larger (15-fold in this experiment) than the variation in light absorption
0 1 2 3 4
Thallus specific carbon - 2
(m01 C m )
(2-fold here). Therefore, macroalgae will show an inverse relationship between light limited gross growth rate and D as depicted in the 4 examples in Fig. 3. For leathery algae (1, Fig. 3) growing to a maximum depth of 0.5 % SI, calculated gross growth rate approaches 2 mm01 C mol-' C d-' when the thallus specific carbon reaches 4.4 m01 C m-' This gross growth rate exceeds dark respiration rates in some thick species and allows a low, but not unrealistic, specific growth rate. For example, the dark respiration rate of Chondrus crispus was only 0.5 mm01 C mol-' C d-l. For an alga living at 0.10 % S1 (2, Fig. 3) a thallus specific carbon content of 4.4 m01 C m-', however, will provide an unacceptable low growth rate. The D-value yielding a gross growth rate of 2 mm01 C mol-' C d-' is 0.69 m01 C m-' at this % SI. At even lower light, e.g. 0.01 % S1 (3, Fig. 3), Dmust be lower than 0.05 m01 C m-2 before gross growth rate exceeds 2 mm01 C mol-' C d-l. The upper level of D-values in 1 and 2 (Fig. 3) corresponds to that for leathery and foliose algae found in this study. A D-value of 0.05 m01 C m-2 for crustose algae is higher than the value calculated from Littler et al. (1986), which, however, represents an exceptionally deep living species. At higher light levels crustose algae may be thicker, such as
Peysonellia sp. (a fleshy crustose algae) found to have its depth limit above the deepest oc- curring calcified crustose red algae (Agegian & Abbott 1985, Littler et al. 1985). Other data 0 for thallus specific carbon in crustose macro- algae are not available. The last curve (4 , Fig. 3) is for an alga living at great depths with only 0.0005 % S1 at a latitude receiving a mean light intensity of 550 pm01 m-' S-' at the sea surface (24O N), the conditions for the deepest occurring crustose in Littler et al.
.... .... ...... (1985). This species should, for a D-value of 0.0087 m01 C m-2, be able to attain a gross growth rate of 1.2 mm01 C mol-' C d-' (ab- sorption by photosynthetic active pigments
............. assumed to be 0.45 and quantum yield to be
5 95 mm01 C mol-' photons). Dark respiration of this species must, therefore, be very low. Assuming a dark respiration rate as for C. crispus in this experiment (0.5 mm01 C mol-l C d-l) the net qrowth rate will be 0.7 mm01
Fig. 3. Relationship between thallus specific carbon and specific gross rnol-' C d-I corresponding to a generation growth rate at 4 combinations of light intensity and absorption. (1) A time of Survival at such a low growth rate leathery alga living at 0.5 % SI, light absorption = 0.9; (2) A foliose alga living at 0.10 % SI, light absorption = 0.7; (3) A crustose algae living at possible in a with
0.01 % SI, light absorption = 0.5; (4 ) A crustose alga living at 0.0005% practically no grazing achieved by thallus cal- SI, llght absorption = 0.45. Mean surface light (SI) was 238 pm01 m-? S- ' cification or lack of grazers. in examples l to 3 corresponding to Danish conditions (56" N) and The examples in Fig. 3 are based on the dif- 550 ,urn01 m-2 S- ' in example 4 corresponding to conditions at Bahamas Islands (24O N). Quantum yield was in all cases assumed to be 95 mm01 ferent morphological types, their mean depth
C mol-' absorbed ~ h o t o n s . The thallus s~ecif lc carbon where aross limits obtained fromTable and realistic ~ ~ 1 - growth rate drops below 2 mm01 C moi-' cell C d-l is indicate; ues for absorption and quantum yield from

Markager & Sand-Jensen: Light requirements of macroalgae 9 1
Table 1 . Values for D, where gross growth rates drop below 2 mm01 C mol-' C d- ' are indicated. This level of gross growth rate allows a low positive net growth for species with a dark loss rate corresponding to the lowest experimentally derived dark respiration rates in Table 1. The indicated D-values are the maximum possible in each case, but for leathery and foliose algae, they correspond to measured values of D for these groups. We therefore conclude that Fig. 3 pro- vides a realistic picture of possible combinations of depth limits, respiratory losses and net growth rates of marine macroalgae at low light.
The curves in Fig. 3 predict that thin thalli (i.e. low thallus specific carbon) ensure higher specific growth rates at light limitation than thick thalli. The crustose life form represents the most extreme adaptation and the most suitable multicellular thallus with low thallus specific carbon. Thick thalli, on the other hand, pro- vide several advantages at high light such as greater mechanical strength, ability to form a canopy and shade-out competitors, better possibility for differenti- ation of cells and storage of carbohydrates and nutri- ents as exemplified by Laminaria species (Liining 1971, Chapman & Lindley 1980) . Thallus specific carbon, therefore, becomes an important part of the physiological features regulating vertical zonation and growth strategies of subtidal marine macroalgae. Low growth rate at low light also means that deep-living algae need long time to form the biomass. Accordingly, the proportion of perennial species increases with depth (Mathieson 1 9 7 9 ) .
In Danish coastal regions Porphyra purpurea and the erect form of Petalonia fascia only grow in shallow water (0 to 1.5 m) whereas the other 3 species occur in most of the subtidal zone with erect macroalgal vege- tation except for the deepest parts where vegetation is dominated by Phycodrys rubens and Delesseria san- guinea. Because the 5 species had approximately the same light requirements for survival in our laboratory experiments the differences in depth-zonation must be related to their growth form/strategy. Porphyra pur- purea and Petalonia fascia are probably restricted to very shallow water due to their annual lifecycle and Fucus serratus and Chondrus crispus are probably excluded from the deepest parts due to their thick thallus. However, additional experiments are needed on the physiology of particularly deep-living species and on actual loss rates in the field for different species, to further evaluate the parameters that determine macroalgal depth zonation.
We conclude that macroalgal growth and survival in low light require high photosynthetic efficiency at low light, low dark respiration rate, low thallus specific carbon, resistance against grazing, and possibly a perennial life cycle. High quantum yield and high
photosynthetic efficiency seem to be common among most species. Dark respiration rates, on the other hand, can vary over 2 orders of magnitude (0 .5 to 3 0 mm01 C mol-' C d-', half-life of the carbon content at 1 3 8 6 and 23 d respectively) but even at the lowest respiration rates, low thallus specific carbon (i.e. a thin thallus) is essential for growth at low light.
Acknowledgements. This work was supported by the Danish Natural Science Research Council grant 11-7795 to the project: 'Structural and ecophysiological adaptations of macrophytes to ecological conditions in the transition between aerial and submerged life' and grant 11-7139 to S .M. We thank T. Lieu, H Nielsen and S. Siune for technical assistance, T. Madsen, B. Olesen, H.-H. Schierup and K. Skovhus for valuable discus- sions, L. Mathiesen for help with collection and identification of the species and C . M. Duarte for valuable comments to the manuscript.
LITERATURE CITED
Agegian, C. R., Abbott, I . A. (1985). Deep water macroalgal communities. a companson between Penguin Bank (Hawaii) and Johnston Atoll. In: Gabnele, C., et al. (eds.) Proc. 5th Int. Coral Reef Congr. Antenne Museum - EPHE, Moorea, French Polynesia, 5 . 47-50
Bannister. T T (1979). Quantitative description of steady state, nutrient-saturated algal growth, including adaption. Limnol. Oceanogr. 24: 76-96
Britz, S J . , Briggs, W. R. (1987). Chloroplast movement and light transmission in Ulva: The sieve effect in a Iight- scattering system. Acta Physiol. Plant. 9: 149-162
Chapman, A. R. O., Lindley, J . E. (1980) Seasonal growth of Lamlnana solidungula in the Canadian High Arctic in relation to irradiance and dissolved nutrient concentra- tions Mar. Biol. 57. 1-5
Colin, P. L., Devaney, D. M., Hillis-Colinvaux, L., Suchanek, T H , Harrison, J . T. (1986). Geology and biological zona- tion of the reef slope, 50-360 m depth at Enewetak Atoll, Marshal1 Islands. Bull. mar. Sci. 38: 11 1-128
Dnng, M. J . (1981). Chromatic adaptation of photosynthesis in benthic marine algae: a n examination of its ecological significance using a theoretical model. Limnol. Oceanogr 26: 271-284
Dunton, K. H. (1990). Growth and production in Lamlnana solidunyula: relation to continuous underwater light levels in the Alaskan High Arctic. Mar Biol. 106: 297-304
Dunton, K. H., Jodwalis, C. M. (1988). Photosynthetic perfor- mance of Larninana solldungula measured in situ in the Alaskan High Arctic. Mar Biol. 98. 277-285
Geider, R J . , Osborne, B. A. (1989). Respiration and micro- algal growth: a review of the quantitative relationship between dark respiration and growth. New Phytol. 112: 327-341
Geider, R. J . , Osborne, B. A., Raven, J. A (1985). Light dependence of growth and photosynthesis in Phaeo- dactylum tricornuturn (Bacillariophyceae). J . Phycol 21: 609-619
Hill is-Colinvau, L. (1985). Halirneda and other deep fore- reef algae at Enewetak Atoll. Proc. 5th Int. Coral Reef Cong., Tahiti, p. 9-14
Jassby, A. D., Platt, T. (1976) Mathematical formulation of the relationship between photosynthesis and light for phytoplankton. Limnol. Oceanogr. 21: 540-547

92 Mar. Ecol. Prog. Ser. 88: 83-92, 1992
Kain, J . M. (1966). The role of light in the ecology of Laminana hyperborea. In: Bambridge, R.. Clifford, G. Rackham. 0. (ed.) Light as a n ecological factor. Blackwell, Oxford, p. 319-334
Kain, J . M. (1971). Continuous recording of underwater light in relation to Laminaria distribution In: Crisp, D. J . (ed.) Proc. 4th Eur, mar. Biol. Symp. Cambndge Univ. Press, London, p. 335-346
Kain, J . M. (1976). The biology of Laminaria hyperborea. Oceanogr. mar. Biol. A. Rev. 17: 101-161
Kain, J . M., Drew, E. A., Jupp., B. P. (1976). Light and the ecol- ogy of Laminaria hyperborea 11. In: Evans, G. C., Bain- bridge, R., Rackham. 0 . (eds.) Light as an ecological factor. Blackwell, Oxford, p. 63-92
King, R. J., Schramm, W. (1976). Photosynthetic rates of benthic marine algae in relation to l ~ g h t intensity and seasonal vanations. Mar. Biol. 37: 215-222
Langdon, C. (1988). On the causes of interspecific differences in the growth-irradiance relationship for phytoplankton. 11. A general review. J . Plankton. Res. 10: 1291-1312
Larkum, A. W. D., Drew. E. A., Crossett, R. N. 0. (1967). The vertical distribution of attached marine algae in Malta. J . Eco~ . 55: 361-371
Littler, M. M,, Littler, D. S., Blair, S. M., Norris, J . N. (1985). Deepest known plant life discovered on an uncharted seamount. Science 227: 57-59
Littler, M. M,, Littler, D. S., Blair, S. M., Norris, J. N. (1986). Deep-water plant communities from an uncharted seamount off San Salvador Island, Bahamas: distribution, abundance, and primary productivity. Deep Sea Res. 33: 881-892
Liining, K. (1971). Seasonal growth of Laminana hyperborea under recorded underwater light conditions near Helgo- land. In: Crisp, D. J . (ed.) Proc. 4th Eur. Mar. Biol. Symp. Cambridge Univ. Press, London, p. 347-361
Liining, K. (1979). Growth strategies of three Laminaria species (Phaeophyceae) inhabiting different depth zones in the sublittoral region of Helgoland (North Sea) Mar. Ecol. Prog. Ser. 1: 195-207
Luning, K. , Dring, M. J. (1979). Continuous underwater light measurement near Helgoland (North Sea) and its significance for characteristic light limits in the sub- littoral region. Helgolander wiss. Meeresunters. 32: 403-424
Maggs, C. A., Gujry, M. D. (1987). Environmental control of macroalgal phenology. In: Crawford, R . M. M. (ed.) Plant life in aquatic and amphibious habitats. Blackwell, Oxford, p 359-373
Mann, K. H. (1973). Seaweeds: their productivity and strategy for growth. Science 182: 975-981
This article was presented by M. J Dring, Belfast, Northern Ireland
Mann, K. H (1982). Ecology of coastal waters. Studies in Ecology 8. Blackwell, Oxford
Markager, S. (in press). Light absorption and quantum yield for growth in five species of marine macroalgae. J. Phycol.
Mathieson, A. C. (1979). Vertical distribution and longevity of subtidal seaweeds in northern New England, U.S.A. Bot. Mar. 22. 511-520
Mathieson, A. C., Hehre, E. J. , Reynolds, N. B. (1981) Investi- gations of New England manne algae I: a floristic and descriptive ecological study of the marine algae at Jeffrey Point, New Hampshire, U.S.A. Bot. Mar. 24: 521-532
Matta, J. L., Chapman, D. J . (1991). Photosynthetic responses and daily carbon balance of Colpomenia peregrina: sea- sonal variations and differences between intertidal and subtidal populations. Mar. Biol. 108: 303-313
Neushul, M . (1971). Submarine illumination in Macrocystls beds. Nova Hedwigia, Beih. 32: 241-254
Norton, T. A., Hiscock, K., Kitching, J . A. (1977). The ecology of Lough Ine XX. The Laminaria forest at Carrigathorna. J. Eco~. 65: 919-941
Rabinowitch. E. 1. (1951). Photosynthesis and related pro- cesses, Vol. 11. Wiley-Interscience, New York
Raven, J . A. (1984). A cost-benefit analysis of photon absorp- tion by photosynthetic unicells. New Phytol. 98: 593-625
Raven, J . A. , Smith, F. A., Glldewell, S. M. (1979). Photo- synthetic capacities and biological strategies of giant- celled and small-celled macroalgae. New Phytol. 83: 299-309
Sand-Jensen. K. (1988a). Minimum light requirements for growth in Ulva lactuca. Mar. Ecol. Prog. Ser. 50: 187-193
Sand-Jensen, K. (1988b). Photosynthetic responses of Ulva lactuca at very low Light. Mar. Ecol. Prog. Ser. 50: 195-201
Sand-Jensen, K . , Madsen, T. V. (1991). Minimum light requirements of submerged freshwater macrophytes in laboratory growth experiments. J . Ecol. 79: 749-764
Schonbeck, M. W., Norton, T A. (1980). Factors controlling the lower limits of fucoid algae on the shore. J. exp. mar. Biol. Ecol. 43. 131-150
Sears, J . R . , Cooper, R . A . (1978). Descriptive ecology of off- shore, deep-water, benthic algae in the temperate western north Atlantic Ocean. Mar. Biol. 44: 309-314
Vadas, R. L., Steneck, R. S. (1988). Zonation of deep water benthic algae in the gulf of Maine. J . Phycol. 24: 338-346
Vermaat, J. E., Sand-Jensen, K. (1987). Survival, metabolism and growth of Ulva lactuca under winter conditions: a laboratory study of bottlenecks In the life cycle. Mar. Biol. 95: 55-61
Witkowski, E. T F., Lamont, B B. (1991). Leaf specific mass confounds leaf density and thickness. Oecologla 88: 486-493
Manuscript first received: July 1, 1992 Revised version accepted: September 21, 1992