Fluid focusing and its link to vertical morphological zonation at the Dajishan vein-type tungsten...
14
Fluid focusing and its link to vertical morphological zonation at the Dajishan vein-type tungsten deposit, South China Xiangchong Liu a,b , Huilin Xing b, ⁎, Dehui Zhang a, ⁎ a State Key Laboratory of Geological Processes and Mineral Resources, School of Earth Sciences and Resources, China University of Geosciences (Beijing), Beijing 100083, China b Centre for Geoscience Computing, School of Earth Sciences, The University of Queensland, Brisbane, QLD 4072, Australia abstract article info Article history: Received 5 November 2013 Received in revised form 30 March 2014 Accepted 3 April 2014 Available online 15 April 2014 Keywords: Dajishan Tungsten Morphological zonation Fluid focusing Permeability ratio Aspect ratio Five-floor vertical zonation in vein morphology is a common phenomenon in exo-contact vein-type tungsten de- posits of South China and has been widely applied for practical exploration, but the causative mechanisms are poorly understood. We combine fractal methods and finite element based numerical analysis to investigate the link between the fluid focusing and the vertical morphological characteristics at the Dajishan tungsten deposit and to determine vein growth mechanisms. Fractal analysis of vein morphology indicates that the growth mech- anisms of veins in the lower part of ore bodies were mainly controlled by growth rate. Anisotropic permeability tensor method is applied to evaluate the anisotropic flow behaviors in joints. Numerical experiments on perme- ability ratio and aspect ratio controlled by stress state indicate that the NWW-striking joints in the host rock sig- nificantly affect the fluid focusing in these joints and the other potential conduits. The higher permeability and aspect ratios in the lower levels of the joint systems lead to the more fluid focusing in the lower part of ore bodies, which delivers more fluids required for precipitating silica. The five-floor zonation at this deposit is related to the regional tectonic evolution from the Indosinian (257–205 Ma) to Yanshanian (205–135 Ma) in South China. This paper may also help to better understand the vertical morphological zonation in this type of tungsten deposits in China. © 2014 Elsevier B.V. All rights reserved. 1. Introduction Vertical morphological zonation is a common phenomenon at exo-contact vein-type tungsten deposits in South China (Gu, 1984). Field geologists have identified five zones based on the vein mor- phology since 1960s, and proposed a five-floor vertical morphologi- cal zonation. In the five-floor zonation, the top zone is called thread vein zone where thin veins not over 1 cm in thickness occur. These barren thin veins gradually become thicker and richer in tungsten downwards, forming the veinlet zone then mixing zone of veinlet- thick veins. The veins in the mixing zone converge downwards into a few wolframite-quartz veins often exceeding 1 m in thickness, which is called thick vein zone. At the root of the five-floor zonation, these thick veins shrink downwards and become barren (more de- tails see Clarke, 1983; Liu and Ma, 1993). The five-floor zonation has played an important role in prospecting this type of tungsten de- posits in the last few decades (Gu, 1984; Mao et al., 2013; Wang et al., 2010; Xu et al., 2008). However, the reason for such a zonation is still unclear. Although vertical morphological zonation is one of the most appar- ent characteristics in the vein-type tungsten deposits, South China, it is not well developed elsewhere. Vein-style tungsten-tin deposits in Cornwall, England and in Panasqueira, Portugal also show variable vein thicknesses (Foxford et al., 2000; Hall, 1971; Sanderson et al., 2008), but these sheeted vein systems do not exhibit as regular mor- phological zonation as those in South China. The distinctive morpholog- ical characteristics of veins in China may indicate complicated coupling of magmatic hydrothermal processes and regional tectonic evolution (Liu and Ma, 1993; Yu, 2004). Therefore, it is necessary to better clarify the mechanisms of the five-floor zonation to understand its links to mineralization and to better target blind deposits. With regard to hydrogeology, formation of these deposits involved complicated problems that coupled thermal, hydraulic, mechanical, and chemical processes (Ingebritsen and Appold, 2012; Zhao et al., 2012). Massive quartz veins at these deposits require extremely focused flow to deposit silica given its low solubility in aqueous fluids (Akinfiev and Diamond, 2009; Zhu et al., 1981). Percolation models suggest that fracture evolution is essential to the locations and styles of tungsten- tin mineralization, and that the veins tend to develop when localized opening and channelized flow happens at the backbones of fracture sys- tems (Roberts et al., 1998, 1999; Sanderson et al., 2008). This means that focused flow in fractures is one of the necessary conditions to account for the morphological zonation. Analytical solutions (Zhao et al., 2006, Ore Geology Reviews 62 (2014) 245–258 ⁎ Corresponding authors at: School of Earth Sciences and Resources, China University of Geosciences (Beijing), Beijing 100083, China. E-mail addresses: [email protected] (H. Xing), [email protected] (D. Zhang). http://dx.doi.org/10.1016/j.oregeorev.2014.04.005 0169-1368/© 2014 Elsevier B.V. All rights reserved. Contents lists available at ScienceDirect Ore Geology Reviews journal homepage: www.elsevier.com/locate/oregeorev
Transcript of Fluid focusing and its link to vertical morphological zonation at the Dajishan vein-type tungsten...

Ore Geology Reviews 62 (2014) 245–258
Contents lists available at ScienceDirect
Ore Geology Reviews
j ourna l homepage: www.e lsev ie r .com/ locate /oregeorev
Fluid focusing and its link to vertical morphological zonation at theDajishan vein-type tungsten deposit, South China
Xiangchong Liu a,b, Huilin Xing b,⁎, Dehui Zhang a,⁎a State Key Laboratory of Geological Processes and Mineral Resources, School of Earth Sciences and Resources, China University of Geosciences (Beijing), Beijing 100083, Chinab Centre for Geoscience Computing, School of Earth Sciences, The University of Queensland, Brisbane, QLD 4072, Australia
⁎ Corresponding authors at: School of Earth Sciences anGeosciences (Beijing), Beijing 100083, China.
E-mail addresses: [email protected] (H. Xing), zhdehu
http://dx.doi.org/10.1016/j.oregeorev.2014.04.0050169-1368/© 2014 Elsevier B.V. All rights reserved.
a b s t r a c t
a r t i c l e i n f oArticle history:Received 5 November 2013Received in revised form 30 March 2014Accepted 3 April 2014Available online 15 April 2014
Keywords:DajishanTungstenMorphological zonationFluid focusingPermeability ratioAspect ratio
Five-floor vertical zonation in veinmorphology is a common phenomenon in exo-contact vein-type tungsten de-posits of South China and has been widely applied for practical exploration, but the causative mechanisms arepoorly understood. We combine fractal methods and finite element based numerical analysis to investigate thelink between the fluid focusing and the vertical morphological characteristics at the Dajishan tungsten depositand to determine vein growthmechanisms. Fractal analysis of veinmorphology indicates that the growthmech-anisms of veins in the lower part of ore bodies were mainly controlled by growth rate. Anisotropic permeabilitytensor method is applied to evaluate the anisotropic flow behaviors in joints. Numerical experiments on perme-ability ratio and aspect ratio controlled by stress state indicate that the NWW-striking joints in the host rock sig-nificantly affect the fluid focusing in these joints and the other potential conduits. The higher permeability andaspect ratios in the lower levels of the joint systems lead to themorefluid focusing in the lower part of ore bodies,which deliversmore fluids required for precipitating silica. The five-floor zonation at this deposit is related to theregional tectonic evolution from the Indosinian (257–205Ma) to Yanshanian (205–135Ma) in South China. Thispaper may also help to better understand the vertical morphological zonation in this type of tungsten deposits inChina.
© 2014 Elsevier B.V. All rights reserved.
1. Introduction
Vertical morphological zonation is a common phenomenon atexo-contact vein-type tungsten deposits in South China (Gu, 1984).Field geologists have identified five zones based on the vein mor-phology since 1960s, and proposed a five-floor vertical morphologi-cal zonation. In the five-floor zonation, the top zone is called threadvein zone where thin veins not over 1 cm in thickness occur. Thesebarren thin veins gradually become thicker and richer in tungstendownwards, forming the veinlet zone then mixing zone of veinlet-thick veins. The veins in the mixing zone converge downwards intoa few wolframite-quartz veins often exceeding 1 m in thickness,which is called thick vein zone. At the root of the five-floor zonation,these thick veins shrink downwards and become barren (more de-tails see Clarke, 1983; Liu and Ma, 1993). The five-floor zonationhas played an important role in prospecting this type of tungsten de-posits in the last few decades (Gu, 1984; Mao et al., 2013;Wang et al.,2010; Xu et al., 2008). However, the reason for such a zonation is stillunclear.
d Resources, China University of
[email protected] (D. Zhang).
Although vertical morphological zonation is one of the most appar-ent characteristics in the vein-type tungsten deposits, South China, itis not well developed elsewhere. Vein-style tungsten-tin deposits inCornwall, England and in Panasqueira, Portugal also show variablevein thicknesses (Foxford et al., 2000; Hall, 1971; Sanderson et al.,2008), but these sheeted vein systems do not exhibit as regular mor-phological zonation as those in South China. The distinctivemorpholog-ical characteristics of veins in China may indicate complicated couplingof magmatic hydrothermal processes and regional tectonic evolution(Liu and Ma, 1993; Yu, 2004). Therefore, it is necessary to better clarifythe mechanisms of the five-floor zonation to understand its links tomineralization and to better target blind deposits.
With regard to hydrogeology, formation of these deposits involvedcomplicated problems that coupled thermal, hydraulic, mechanical,and chemical processes (Ingebritsen and Appold, 2012; Zhao et al.,2012).Massive quartz veins at these deposits require extremely focusedflow to deposit silica given its low solubility in aqueous fluids (Akinfievand Diamond, 2009; Zhu et al., 1981). Percolation models suggest thatfracture evolution is essential to the locations and styles of tungsten-tin mineralization, and that the veins tend to develop when localizedopening and channelized flowhappens at the backbones of fracture sys-tems (Roberts et al., 1998, 1999; Sanderson et al., 2008). Thismeans thatfocused flow in fractures is one of the necessary conditions to accountfor the morphological zonation. Analytical solutions (Zhao et al., 2006,

246 X. Liu et al. / Ore Geology Reviews 62 (2014) 245–258
2008) demonstrate that fluid focusing in joints or faults depends ontheir hydraulic characteristics (permeability ratio) and geometric char-acteristics (aspect ratio).
In this paper, we firstly present the geological background of theDajishan tungsten deposit. Then, we illustrate vein thickness distribu-tion at this deposit using fractal techniques, which characterize its mor-phological characteristics improving that described by Liu and Ma(1993). These fractal methods can trace the history of vein growthand help understand the use of morphological zonation in exploration.These data and observations are used as constraints on the numericalmodeling. Next, we numerically investigate fluid flow and heat transferusing an anisotropic permeability tensor. Numerical experiments indi-cate that permeability and aspect ratios significantly influence the de-gree and location of fluid focusing in oriented joints. Finally, we builda link between the focused flow in the existing joints and the verticalmorphological zonation constrained by fractal methods.
2. Background
The Dajishan tungsten deposit, located in Quannan County,Jiangxi Province, is a large-scale vein-type and granite-type tungsten
Fig. 1. (a) A simplifiedmap showing the tectonic units in the South China Block (modified from1985); (c), (d) Plane map and cross section map of the Dajishan tungsten deposit, respectivelyboundary; 5, unconformity; 6, tungsten-bearing quartz veins; 7, location of the sample lines ofmλπ, granite porphyry; Qπ, quartz porphyry; δ, diorite; Q, Quaternary; E, Paleogene; K, Cretaceouline for Fig. 1d and is also used in the numerical model.
polymetallic deposit. The vein-type deposit discovered in 1917 hasa WO3 reserve of 160,000 tonnes with an average grade of 2.04%(Mao et al., 2013). The ore deposit lies in the Nanling Range of theCathaysian Block that is situated inboard from the subduction zoneof the Western Pacific plate (Fig. 1a). Recent data suggest that tung-sten concentration of stream sediments in the Cathaysian Block is 5–250 times the Clark value (0.6 ppm) of crust in East China (Chi et al.,2012). The Yanshanian (205–135Ma)was themost important epochfor magmatic activity in South China (Zhou et al., 2006). Mesozoicgranites are present throughout this region, consisting of Jurassicgranites mainly distributed in the Nanling Range and in the interiorof South China tectonic block and Cretaceous granites along thepresent-day continental margin (Zhou et al., 2006). Almost all ofthe polymetallic tungsten deposits in Jiangxi were related toYanshanian granites and formed at the endo- or exo-contact of gran-ite intrusions (Guo et al., 2011; Mao et al., 2013).
The exposed strata include Cambrian, Devonian, and Paleogenerocks (Fig. 1b). The Cambrian strata consist of low-grade metamorphicsandstone and slate that hosts the Dajishan granite and ore body.These sedimentary rocks strike 300°–320° and dip 20°–40°. TheDevoni-an strata consist of coarse sandstone, phyllite, and quartz conglomerate,
Guo et al., 2011); (b) Regional geological map of the Dajishan tungsten deposit (Sun et al.,(modified from Sun, 1989). 1, fault; 2, reverse fault; 3, indeterminated fault; 4, geologicaleasuring veinmorphology; γ-granite;γ5
2− 1, two-mica granite;γ52− 2
, muscovite granite;s; J, Jurassic; C, Carboniferous; D, Devonian; , Cambrian; A-A′ in Fig. 1c is the cross-section

Fig. 2. Schematic pattern of diagenesis and mineralization at the Dajishan deposit (Kong,1982). I, Biotite granite; II, Two-mica granite; III1, Muscovite granite; III2, Stockscheiders;III3, Quartz phrase; IV1, Microcline quartz veins; IV2, Beryl quartz veins; IV3, Wolframitequartz veins.
247X. Liu et al. / Ore Geology Reviews 62 (2014) 245–258
strike 30°–50° and dip 40°–80°. The contact relationship between theDevonian and Cambrian units is an angular unconformity (Zhou, 2009).
The main structure at the Dajishan deposit is a synclinorium with aNE-striking axis and four groups of structural elements, divided bytheir orientations: EW, NE, NNE, and NWW structures (Fig. 1c). TheEW structures include an EW silification belt in the contact betweenthe Wuliting granite and the host rock, quartz porphyry filled in anEW fault, and the No.14 EW vein in the ore body. The NE structures in-clude the Dajishanfeng Fault (F5) and the Chuandiwo Fault (F1-F4). TheNNE-trending structures consist of small-scale compressive faults inmineralized area. A few faults in this group are filled with tungsten-bearing quartz veins, although most are small faults that cut the orebody. The NWW-striking structures include the ore-bearing fracturesand a fault filled with diorite (Zhou, 2009).
Magmatic rocks in the ore district include biotite granite, two-micagranite, muscovite granite, diorite, and quartz porphyry (Fig. 1). TheWuliting biotite granite is dated at 238.4 ± 1 Ma by the zircon U-Pbmethod (Zhang et al., 2004b), whereas its whole-rock Rb-Sr age is 167± 1 Ma (Sun, 1989) and its biotite K-Ar age is 160.3 ± 3.0 Ma and164.2 ± 3.5 Ma (Jiang et al., 2004). The two-mica granite occurringbelow the ore body is dated at 161Ma by thewhole-rock Rb-Sr isochron(Sun, 1989) and at 160.6±2.8Ma by themuscovite K-Armethod (Jianget al., 2004). The muscovite granite occurs from the level of 517 m to0 m. It consists of five small intrusions, of which the No.69 granite isthe largest and Ta-Nb-W-Be mineralized (Fig. 1d). The whole-rock Rb-Sr age of the No.69 granite is 159 ± 5 Ma (Sun, 1989), while its zirconU-Pb age is 151.7 ± 1.6 Ma (Zhang et al., 2006). Drill data indicatethat the muscovite granite was intruded later than the two-mica gran-ite. The diorite is the host rock of the vein-type ore body in the middleset. The quartz porphyry swarm occurs in the Cambrian strata, but itsage is unknown. Geophysical data show that the Dajishan ore districtis situated above EW-trending blind granite with an area of severalthousand km2 (Zhou, 2009).
The tungsten-bearing quartz veins occur in the Cambrianmetamor-phic sandstone, slate, and diorite. Alteration of wall rock includes silici-fication, tourmalinization, and biotitization in the sandstone,greisenization in the granite, and biotitization in the diorite (Sun,1989). Ore minerals include wolframite, scheelite, tungstite,bismuthinite, native Bi, and molybdenite, and gangue minerals arequartz, feldspar, muscovite, calcite, and tourmaline. The typical min-erals in the middle vein set are orthoclase, microcline, perthite, and al-bite (Zhou, 2009).
The age of mineralization at the Dajishan vein-type deposit is 160±1.3 Ma dated by the molybdenite Re-Os isochron (Zhang et al., 2011)and 144 Ma and 147 Ma by the muscovite 40Ar-39Ar method (Zhanget al., 2006). Hydrogen and oxygen isotopic measurements (δ18O =9.9–11.5‰, D = −75.1 to −60.7‰) in the three types of granitesuggest that they were formed by crustal anatexis, and the fluidswere derived from magmatic water (Zhuang et al., 1991). The ore-forming fluids are interpreted to be magmatic in the main minerali-zation stage, and then were mixed with meteoric waters in a latestage (Zhang et al., 1997). Based on oxygen isotope mineral pairs(quartz and wolframite, quartz and scheelite, and quartz and mica),mineralization temperatures were 300–400 °C (Zhang et al., 1997).Infrared measurements suggest that the fluid inclusions in wolframiteexperienced relatively simple evolution history and had higher temper-ature range than those in quartz (Ni et al., 2006). Themineralized fluidswere in the H2O-NaCl system or in the H2O-CO2-CH4-NaCl system(Wang et al., 2013; Xi et al., 2008). Homogenization temperatures of in-clusions in quartz are 200–330 °C, and salinities are typically 4–10 wt%(Wang et al., 2013; Xi et al., 2008). The fluid pressure at the time ofmin-eralization is estimated to be 114–132 MPa, indicating that the ore-forming depth was 4.6–5.3 km (Xi et al., 2008).
Fig. 2 shows the spatial zonation of the granites and veins alongwith the interpreted relative timing of granite and vein emplace-ment. The magmatic-hydrothermal system is interpreted to be
multi-phrase from a magmatic to post-magmatic period (Kong,1982; Teng, 1990), with both the spatial and temporal distributionsas the consequence to tectonic activity. At the Dajishan vein-type de-posit, silicates and oxides are present in the upper part of vein sys-tems, whereas oxides, sulfides, and carbonates are dominant in thelower part (Teng, 1990).
3. Geological structures
Previous studies suggest that the mineralization at the depositwas controlled by fractures (Liu and Yu, 2009; Zhou, 2009), andtherefore the structural characteristics of joints and faults are sum-marized below. Joint numbers and orientations were measured ona line transect normal to vein orientation. A geochemical profilethrough the Dajishanfeng Fault was measured at 467 m level to con-strain fluid flow and heat transfer therein.
3.1. Joints
Previous studies indicate that two sets of preferred orientated jointsoccur at this deposit, and their azimuths are 9°∠74° and 181°∠66°, re-spectively (Zhou, 2009; see Fig. 3a). The definition of the azimuth isdip direction∠dip angle. The corresponding principal stresses are252°∠79° (σ1), 95°∠11° (σ2), and 5°∠4° (σ3) (Zhou, 2009). The jointsdipping north aremore abundant than those dipping south. Themineraland associated alteration assemblages in one set show no differencefrom the other. The preferred orientations of joints we measuredshow a similar result to the previous studies (Fig. 3b). Our measure-ments also indicate that vein density increases with increasing jointdensity (Fig. 4).

Fig. 3. Rose diagrams of dip direction of joints at the Dajishan tungsten deposit. (a) 446joint orientations were measured from the level of 317 m to 985 m by Zhou (2009). (b)To supplement the data in Zhou (2009), 32 joint orientations were measured from thelevel of 267 m to 467 m. Both two diagrams show that the set of joints that dips NNE ismore abundant than the one dipping SSW.
248 X. Liu et al. / Ore Geology Reviews 62 (2014) 245–258
3.2. Faults
The Dajishanfeng Fault and Chuandiwo Fault are situated in the eastand in the west of ore-bearing veins, respectively. The DajishanfengFault outcrops near the unconformity between the Cambrian and Devo-nian strata, trending 50° and dipping 40°–60° NW. It consists of com-pressive fracture zones and reverse faults without obvious strike-slipmovement. Previous studies indicate that the barren DajishanfengFault predates mineralization as it is cut by veins both at 467 m and at985 m levels (Zhou, 2009). The geochemical profile through this faultat 467 m level indicates that rock type changes from hornfels to meta-sandstone, and that quartz veins become fewer and thinner from DP1-1 to DP1-12 (Fig. 5). Along the profile, grades of WO3 fall from1156 ppm to 10 ppm with a significant rise at the eastern side of thefault. These data indicate this fault played a minor role in mineraliza-tion. Previous studies suggest that the Chuandiwo Fault also shows littlecontrol on formation of mineralized veins (Zhou, 2009).
3.3. Veins
The ore-bearing veins are divided into three vein sets by their loca-tions: the north set, the middle set, and the south set. The south andnorth sets occur in the Cambrian strata, whereas the middle set mainlyoccurs in the diorite. The vein sets extend horizontally 300–650mwiththe eastern end close to the Dajishanfeng Fault. Most veins trend 280°–300° and dip 65°–80° NNE (Zhou, 2009). The ore bodies are wedge-shaped, and numerous thin veins converge to a few thick veins down-wards (Fig. 6).
Fig. 4. Vein density increases with joint density. The data were measured at three levels,467 m, 317 m, and 267 m. The average joint density is 0.83/m, and the average vein den-sity is 0.42/m. The average joint density in the north set is 0.67/m, 0.98/m both in themid-dle and south sets.
In Section 4, we characterize the vertical morphological zonationusing the data of vein morphology. In Sections 6 and 7, we conductnumerical simulations using the data of structures.
4. Morphological characteristics of veins
The middle and north sets were chosen as the objects in this study.The middle set becomes barren at 517 m level and wedges out at 267m level, whereas the north set extends to the level of 100 m (Fig. 1d).The two-mica granite present below the middle and north sets occursat the level of 240 m and 100 m, respectively (Zhou, 2009). Using theclassification of the five-floor zonation (Fig. 4 in Liu and Ma, 1993),the middle set between the 467 m and 317 m levels represents thefifth zone of the vein system, i.e. the thin out zone, and the north set be-tween the 467 m and 317 m levels represents the fourth zone, i.e. thethick vein zone.
Fifteen horizontal traverses normal to veinswere chosen tomeasurevein thickness, length, and density in themiddle and north sets (Fig. 1d;Table 1). True vein thickness has been transformed from the valuemea-sured along scan lines by vein’s dip angle. The minimum vein thicknessrecordedwas 1.0 cm. Data of vein length in themiddle set were not suc-cessfully obtained due to inadequate exposure.
4.1. Methods
The distribution of vein thickness is a useful tool for characterizingfracture evolution and fluid channelization in vein-style deposits(André-Mayer and Sausse, 2007; Gillespie et al., 1999; Monecke et al.,2001; Sanderson et al., 2008). Given that fractal-geometry techniqueshave been widely applied to quantify rock structures (Kruhl, 2013),these fractal methods were applied to describe themorphological char-acteristics of the vein systems at the Dajishan deposit.
Similar to other non strata-bound vein systems, both power lawand negative exponential distributions were compared to identifyvein thickness distribution. Power law distribution follows the func-tion (Gillespie et al., 1999):
N tð Þ∝t−Dt ; ð1Þ
Negative exponential distribution follows the function (Sandersonet al., 2008):
N tð Þ∝e−Dtt ; ð2Þ
where N(t) is the number of objects of size t or larger, t represents veinthickness, and Dt is the fractal dimension of thickness. Low values of Dt
mean that there is a large proportion of thick veins compared to thinones (Gillespie et al., 1999).
The relationship between vein thickness and length infers the seg-ment linkage of vein system. Their relation is generally expressed by(Gillespie et al., 1999):
t∝Lc; ð3Þ
where t is the vein thickness, L is the vein length, and c is the power-lawexponent. Vein systems evolve from isolated veins to interacting veinsthrough segment linkage (Kim and Sanderson, 2005), increasing thevalue of c.
4.2. Results
Fig. 7 and Table 2 show the fitted distributions of vein thickness andthe related parameters. For the north set, the distribution of vein thick-ness at 317 m level is ambiguous due to the large fit goodness in bothpower law (R2 = 0.92) and negative exponential (R2 = 0.97) distribu-tions, whereas vein thickness at 467 m level conforms to a power law

Fig. 5. (a) A simplifiedmapof the deposit at level 467m. It shows the relative location ofDP1 to the deposit. (b) The geochemical profile DP1 and its related geological cross section. It startswith the east of themiddle set and strikes 110°, covering 220m. DP1-1 is the starting point. Blocky and fragmented hornfels occurs in 0–55m, where 2–6 cm thick quartz veins trend 5°–12° and dip 75°, occurring wolframite and sulfide. In 55–74 m, hornfels is well fragmented and has 1 cm thick quartz veins that strike approximate E-W. The fracture zone is theDajishanfeng Fault. In 74–220 m, metamorphic sandstone is silicified and few barren quartz veins occur. Grades of WO3 drop from 1156 ppm at DP1-1 to 10 ppm at DP1-12.
249X. Liu et al. / Ore Geology Reviews 62 (2014) 245–258
distribution. Veins at 317 m level have smaller fractal dimension (theslope of the fitted line) than those at 467m level either for negative ex-ponential distribution or for power law distribution. For the middle set,vein thickness at both levels conforms to power lawdistributions. Veinsat 317 m level have larger fractal dimension than the ones at 467 mlevel. For power law distribution, the middle set has a smaller averagefractal dimension than the north set.
Veins at 317 m level in the north set have smaller power-law expo-nentn than the ones at 467m level (Table 2). This resultwasfitted by 10pairs of thickness-length data at both levels.
4.3. Vein growth mechanisms
The channelized fluid flow through fractures is often explained by apercolation model (Sanderson et al., 2008) or by a stochastic model(Monecke et al., 2001). In the percolationmodel, a percolation thresholdis the critical point, above which well-linked fractures characterized bydecreasing Dt and increasing c allow focused flow through part of thefracture system (Sanderson et al., 2008). In the stochastic model, Dt fol-lows the function (Monecke et al., 2001):
Dt∝rnrg
ð4Þ
a
Fig. 6. (a) Euhedral wolframite often occurs in thick veins, the photo taken at 417m level in theaperture was large and was held open for enough time for crystal growth; (b) Parallel thread vNWW.
rn is the nucleation rate defined as the number of newly createdveins in a unit time and a unit volume, and rg is the growth rate de-fined as the increment of vein thickness in a unit time. A high nucle-ation rate rn produces a large fractal dimension Dt, whereas a highgrowth rate rg yields a small Dt. Combination of these two modelsmight help to better understand vein growth mechanisms (André-Mayer and Sausse, 2007).
Data of veins in Table 1 and fractal dimensions of power law dis-tribution in Table 2 were chosen to make the following comparisons.Dt b 1 in the two sets indicates that the systems are above the thresh-old and well connected. The north set at 317 m level has smaller Dt
than the same set at 467 m level, therefore characterized by a rela-tive high amount of thick veins. This is consistent with higher growthrate represented by larger vein thickness and lower nucleation ratereflected by smaller vein density at 317 m level; therefore, vein mor-phology in the north set between 467 m and 317 m levels was con-trolled by increasing growth rate and decreasing nucleation ratedownwards. This combined contribution reduced Dt in the northset from 467 m to 317 m level.
Two lines of evidence were used to explain the growth mecha-nisms of veins in the north set. One line is the average strain(Table 1). High strain in the vein system at 317m level is interpretedto be linked to large growth rate, compared to that at 467 m level.The other is the power-law relationship between vein thickness
Thread veinsb
north set with a hammer as the scale. Themorphology of wolframite implies that fractureeins (b1 cm in thickness) outcrop at 985 m level (Zhou, 2009). Veins in (a) and (b) trend

Table 1Database of veins in the middle and north sets.
Vein set Level (m) Section Length (m) Vein number Vein density (/m) Strain (%) Average strain (%) Average veindensity (/m )
Average veinthickness (m)
Middle set 467 1 47 23 0.49 8.37 9.25 0.47 0.192 20 11 0.55 3.833 22 6 0.27 4.914 15 9 0.58 19.91
317 5 29 14 0.48 6.20 3.92 0.39 0.106 17 6 0.35 4.637 23 8 0.35 0.93
North set 467 8 30 12 0.40 4.64 4.00 0.43 0.089 74 34 0.46 2.82
10 50 22 0.44 4.54317 11 14 6 0.43 5.16 4.59 0.26 0.21
12 27 7 0.26 4.2813 37 7 0.19 3.1314 37 8 0.22 5.4215 32 6 0.19 4.95
250 X. Liu et al. / Ore Geology Reviews 62 (2014) 245–258
and length (Table 2). Comparison of power-law exponent cimplies that the vein system at 317 m level evolved to a higherlevel of linkage and allowed more focused flow, therefore in-creasing the vein growth rate and decreasing the fractal dimen-sion of vein thickness.
The middle set at 317 m level has a larger fractal dimension thanat 467m level (Table 2), meaning a smaller proportion of thick veins.
a
Power law distribution
c
Fig. 7. Vein thickness distributions. (a) and (b) are the fitted power law distribution and negatithe fitted power law distribution and negative exponential distribution for vein thickness in th
This trend of fractal dimension is ascribed to growth rate rather thannucleation rate. The vein system at 317 m level has a smaller averagethickness but a slightly lower average vein density than at 467 mlevel. This means that the decrease of growth rate from 467 m to317 m level contributes to the increase of fractal dimension, to alarge degree. This downward trend of growth rate is consistentwith the downward decrease of average strain (Table 1).
b
Negative exponent distribution
d
ve exponential distribution for vein thickness in the north set, respectively. (c) and (d) aree middle set, respectively. Fractal dimensions of vein thickness are the fitted slopes.
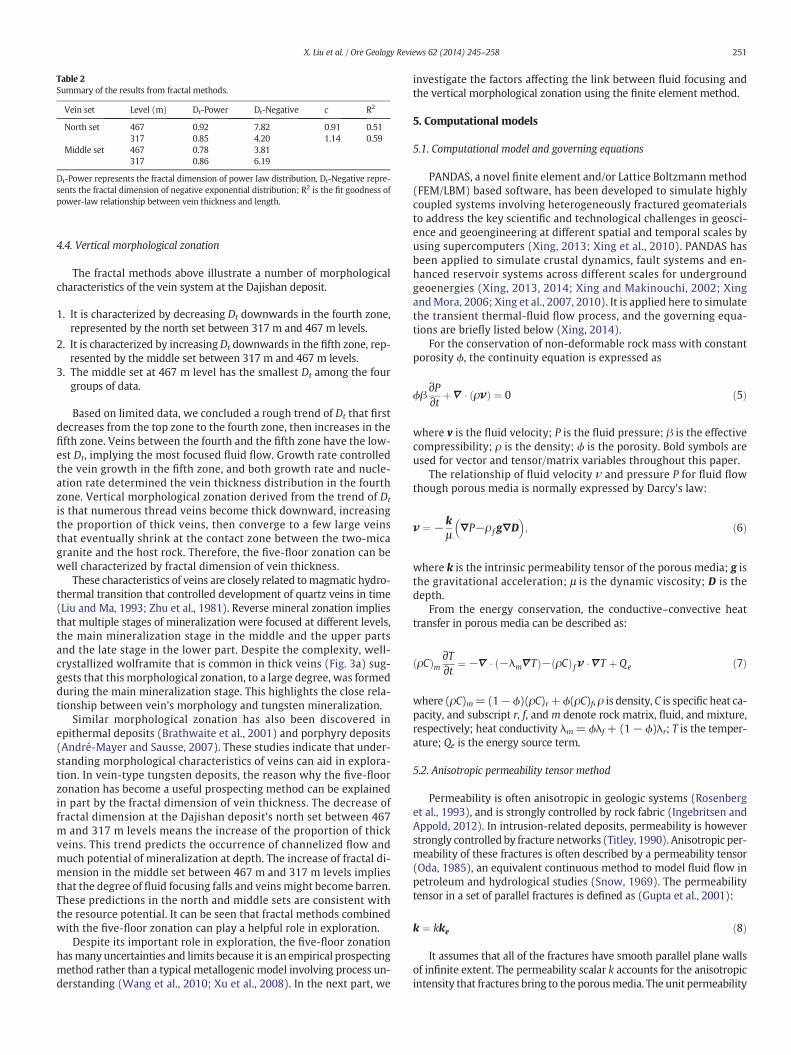
Table 2Summary of the results from fractal methods.
Vein set Level (m) Dt-Power Dt-Negative c R2
North set 467 0.92 7.82 0.91 0.51317 0.85 4.20 1.14 0.59
Middle set 467 0.78 3.81317 0.86 6.19
Dt-Power represents the fractal dimension of power law distribution, Dt-Negative repre-sents the fractal dimension of negative exponential distribution; R2 is the fit goodness ofpower-law relationship between vein thickness and length.
251X. Liu et al. / Ore Geology Reviews 62 (2014) 245–258
4.4. Vertical morphological zonation
The fractal methods above illustrate a number of morphologicalcharacteristics of the vein system at the Dajishan deposit.
1. It is characterized by decreasing Dt downwards in the fourth zone,represented by the north set between 317 m and 467 m levels.
2. It is characterized by increasing Dt downwards in the fifth zone, rep-resented by the middle set between 317 m and 467 m levels.
3. The middle set at 467 m level has the smallest Dt among the fourgroups of data.
Based on limited data, we concluded a rough trend of Dt that firstdecreases from the top zone to the fourth zone, then increases in thefifth zone. Veins between the fourth and the fifth zone have the low-est Dt, implying the most focused fluid flow. Growth rate controlledthe vein growth in the fifth zone, and both growth rate and nucle-ation rate determined the vein thickness distribution in the fourthzone. Vertical morphological zonation derived from the trend of Dt
is that numerous thread veins become thick downward, increasingthe proportion of thick veins, then converge to a few large veinsthat eventually shrink at the contact zone between the two-micagranite and the host rock. Therefore, the five-floor zonation can bewell characterized by fractal dimension of vein thickness.
These characteristics of veins are closely related tomagmatic hydro-thermal transition that controlled development of quartz veins in time(Liu and Ma, 1993; Zhu et al., 1981). Reverse mineral zonation impliesthat multiple stages of mineralization were focused at different levels,the main mineralization stage in the middle and the upper partsand the late stage in the lower part. Despite the complexity, well-crystallized wolframite that is common in thick veins (Fig. 3a) sug-gests that this morphological zonation, to a large degree, was formedduring the main mineralization stage. This highlights the close rela-tionship between vein’s morphology and tungsten mineralization.
Similar morphological zonation has also been discovered inepithermal deposits (Brathwaite et al., 2001) and porphyry deposits(André-Mayer and Sausse, 2007). These studies indicate that under-standing morphological characteristics of veins can aid in explora-tion. In vein-type tungsten deposits, the reason why the five-floorzonation has become a useful prospecting method can be explainedin part by the fractal dimension of vein thickness. The decrease offractal dimension at the Dajishan deposit’s north set between 467m and 317 m levels means the increase of the proportion of thickveins. This trend predicts the occurrence of channelized flow andmuch potential of mineralization at depth. The increase of fractal di-mension in the middle set between 467 m and 317 m levels impliesthat the degree of fluid focusing falls and veins might become barren.These predictions in the north and middle sets are consistent withthe resource potential. It can be seen that fractal methods combinedwith the five-floor zonation can play a helpful role in exploration.
Despite its important role in exploration, the five-floor zonationhasmany uncertainties and limits because it is an empirical prospectingmethod rather than a typical metallogenic model involving process un-derstanding (Wang et al., 2010; Xu et al., 2008). In the next part, we
investigate the factors affecting the link between fluid focusing andthe vertical morphological zonation using the finite element method.
5. Computational models
5.1. Computational model and governing equations
PANDAS, a novel finite element and/or Lattice Boltzmann method(FEM/LBM) based software, has been developed to simulate highlycoupled systems involving heterogeneously fractured geomaterialsto address the key scientific and technological challenges in geosci-ence and geoengineering at different spatial and temporal scales byusing supercomputers (Xing, 2013; Xing et al., 2010). PANDAS hasbeen applied to simulate crustal dynamics, fault systems and en-hanced reservoir systems across different scales for undergroundgeoenergies (Xing, 2013, 2014; Xing and Makinouchi, 2002; XingandMora, 2006; Xing et al., 2007, 2010). It is applied here to simulatethe transient thermal-fluid flow process, and the governing equa-tions are briefly listed below (Xing, 2014).
For the conservation of non-deformable rock mass with constantporosity ϕ, the continuity equation is expressed as
ϕβ∂P∂t þ∇ � ρνð Þ ¼ 0 ð5Þ
where v is the fluid velocity; P is the fluid pressure; β is the effectivecompressibility; ρ is the density; ϕ is the porosity. Bold symbols areused for vector and tensor/matrix variables throughout this paper.
The relationship of fluid velocity ν and pressure P for fluid flowthough porous media is normally expressed by Darcy’s law:
ν ¼ −kμ
∇P−ρ f g∇D� �
; ð6Þ
where k is the intrinsic permeability tensor of the porous media; g isthe gravitational acceleration; μ is the dynamic viscosity; D is thedepth.
From the energy conservation, the conductive–convective heattransfer in porous media can be described as:
ρCð Þm∂T∂t ¼ −∇ � −λm∇Tð Þ− ρCð Þ fν �∇T þ Qe ð7Þ
where (ρC)m=(1−ϕ)(ρC)r+ ϕ(ρC)f, ρ is density, C is specific heat ca-pacity, and subscript r, f, and m denote rock matrix, fluid, and mixture,respectively; heat conductivity λm = ϕλf + (1− ϕ)λr; T is the temper-ature; Qe is the energy source term.
5.2. Anisotropic permeability tensor method
Permeability is often anisotropic in geologic systems (Rosenberget al., 1993), and is strongly controlled by rock fabric (Ingebritsen andAppold, 2012). In intrusion-related deposits, permeability is howeverstrongly controlled by fracture networks (Titley, 1990). Anisotropic per-meability of these fractures is often described by a permeability tensor(Oda, 1985), an equivalent continuous method to model fluid flow inpetroleum and hydrological studies (Snow, 1969). The permeabilitytensor in a set of parallel fractures is defined as (Gupta et al., 2001):
k ¼ kke ð8Þ
It assumes that all of the fractures have smooth parallel plane wallsof infinite extent. The permeability scalar k accounts for the anisotropicintensity that fractures bring to the porousmedia. The unit permeability

252 X. Liu et al. / Ore Geology Reviews 62 (2014) 245–258
tensor ke accounts for the directional effect in the fluid flow due to frac-tures in the medium. The unit permeability tensor is defined as:
ke ¼ kij ¼ δij−ninj ð9Þ
where i, j stand for the orthogonal axes x, y, and z; δij is the Kroneckerdelta, vanishing when i ≠ j and unity when i = j; ni is the componentof the vector n normal to the fracture plane. The function of ni is definedby:
nx ¼ cosα cosβny ¼ sinα cosβnz ¼ sinβ
ð10Þ
where α is the dip direction of fractures, and β is the dip angle. The per-meability scalar k is defined as:
k ¼ λfw3 ð11Þ
where w is the fracture aperture, and λ is a dimensionless constant.The value of λ approaches the upper limit 1/12, when the fracturesystem behaves more like parallel plate conduits. The fracture densi-ty f is defined by f = N/H, whereN represents the number of fracturesin a sample volume, and H is the length of a representative line thatcrosses the sample volume. The permeability tensor becomes a diag-onal matrix, and the values in the diagonal line are the principalpermeability.
6. Numerical modeling of fractures at the deposit
A geometric model has been built along the section line A-A′(Fig. 8). The Dajishanfeng Fault and Chuandiwo Fault were omittedin the model given their minor roles in mineralization. Most ore-bearing veins have similar orientations to the preferred orientedjoints, particularly the set dipping north. This implies that these ori-ented joints may become potential conduits for mineralized fluids,therefore were incorporated in the model. The joint system consistsof five parts ( -3 to -7) with the same size, corresponding to the fivezones ( -3 the fifth zone and -7 the first zone). The contact zone ( -1)refers to the Cambrian strata and early crystallized granite givenmultiple magmatic activities. The boundary and initial conditionsare shown in Fig. 8.
Fig. 8.The geometrymodel used in the numerical simulations. The location of cross sectionA-A′ is shown in Fig. 1c. It trends NNE, normal to the vein sets. The Z-axis represents thepaleodepth. -1 stands for the contact zone, and the joint system consists of -3, -4, -5,-6, and -7, corresponding to the fifth zone to the first zone. Each part of the joint systemis 0.3 km high and 0.15 km wide, meaning the same aspect ratio of 2. Magmatic fluidsare released from the top of magma. The boundary conditions include 100 °C and40 MPa at top and 600 °C and 170 MPa at the top of magma. The right and left sideshave free boundary conditions.
6.1. Hydraulic parameters
The permeability tensor of oriented joints was calculated usingEqs. (8)–(10) (Appendix A). The diagonalized unit permeabilitytensor is:
ke ¼1:0
0:70:3
24
35 ð12Þ
The major axis (k11 = 1.0) is on the intersection of the two sets andtrends NWW, theminor (k33 =0.3) bisects the obtuse angle of the twosets and strikes NNE, and the intermediate (k22 =0.7) bisects the acuteangle and is along the vertical dimension (Fig. 9). The coordinate systemin the simulations is NNE as X-axis, NWW as Y-axis, and the vertical di-mension as Z-axis. X-axis is perpendicular to the oriented joints, and Y-axis is along the oriented joints. The 2Dmodel in Fig. 8 corresponds to X-Z plane and invokes k22 and k33.
Both the joint aperture and density are required to compute the per-meability scalar k. Aperture that controls permeability scalar of jointsvaries during the evolution of hydrothermal systems (Ingebritsen andManning, 2010). It is also difficult to know if joints are connected or un-connected. For simplicity, the permeability’s order of magnitude isconstrained by the depth-dependent permeability (Ingebritsen andManning, 2010):
logk≈−11:5−3:2 logZ ð13Þ
where k is in m2 and Z is in km. Mineralization depth is estimated to be~5 km (Xi et al., 2008), so the permeability’s order of magnitude is ap-proximately 10−16.7 m2. Existing quartz veins imply that this valuemight be a lower limit for the jointed host rock.
Diorite is the host rock for the middle set, and field measurementsshow that joint density here is slightly higher than the one in thenorth set but equal to the value in the south set (Fig. 6). Given theslight difference in joint density between the diorite and the Cambri-an strata, we did not differentiate between the diorite and the Cam-brian strata in the models.
6.2. Key assumptions
Several assumptions have been made to focus the models on theshort period of time when magmatic fluids were released. First, sev-eral lines of evidence indicate that high permeability is localized inthe upper crust and has a limited lifetime, ranging 100–103 years(Ingebritsen and Manning, 2010). This short-lived high permeability isthe key to form ore deposits (Cathles and Shannon, 2007; Ingebritsenand Appold, 2012; Liu, 2011; Lupi et al., 2011; Weatherley andHenley, 2013), and therefore numerical experiments were run for nomore than 1000 years. Permeability of all units was assumed to befixed and was not changed as a result of thermo-mechanical stressand chemical precipitation (Germanovich and Lowell, 1992; Lowellet al., 1993).
Fig. 9. The principle permeability in the coordinate system used in the simulations.

Table 3Hydraulic parameters in experiment 1.
Unit Magma -1 -2 -3, -4, -5, -6, -7
kx (m2) 1.0 × 10⁻¹⁸ 1.0 × 10⁻¹⁶ 2.0 × 10⁻¹⁶ 3.0 × 10⁻¹⁵
kz (m2) 1.0 × 10⁻¹⁸ 1.0 × 10⁻¹⁶ 2.0 × 10⁻¹⁶ 3.0 × 10⁻¹⁵
Φ 0.0015 0.015 0.02 0.05
The porosity and permeability are cited from Sheldon and Ord (2005). The density anddynamic viscosity of fluid are 1 × 10³ kg m−3 and 1.3 × 10⁻⁴ Pa s, respectively. Thespecific heat capacity of fluid and rock are 1000 J kg−1 K−1 and 4200 J kg−1 K−1,respectively. The thermal conductivity of fluid and rock are 0.6 W m−1 K−1 and 2.0 Wm−1 K−1, respectively.
253X. Liu et al. / Ore Geology Reviews 62 (2014) 245–258
Second, fluid inclusions in wolframite or in quartz are mainly two-phase aqueous-rich (Cao et al., 2009; Song et al., 2011; Wang et al.,2007, 2009, 2013;Wei et al., 2012; Xi et al., 2008), implying that boilingwas not the dominant mechanism controlling mineralization in thistype of deposits (Wang et al., 2011). Given this constraint, we assumedthat the release ofmagmatic fluidswas driven by constant overpressureduring a short period, neglecting thermal expansion of fluids and fluidproduction in wall rocks (Hanson, 1995). Fluid inclusion analysis atthe Dajishan deposit also suggests that lithostatic pressures werereached (Xi et al., 2008), and that a pressure gradient approximating105 Pa/m existed over 1 kilometer. In this case, the effect of the gravityterm (104 Pa/m) in Eq. (6) was ignored.
Third, the contact zone is considered to be permeable at about600 °C. Inmagmatic hydrothermal systems, brittle-ductile transition(BDT) exists around the contact zone (Fournier, 1999). Recent nu-merical simulations employing temperature-dependent permeabili-ty indicate BDT is defined at 650–750 °C (Coumou et al., 2009),higher than 350–400 °C constrained by Fournier (1999). Generally,the BDT depends on temperature as well as mineralogy and strainrate (Fournier, 1999; Ingebritsen, 2012; Simpson, 2001). For simplic-ity, we consider the contact zone -1 as permeable rock when mag-matic volatiles were expelled.
6.3. Models
Fluid focusing in joints depends on both the permeability ratio ofjoints to host rock and the aspect ratio of long axis to short axis (Zhaoet al., 2006, 2008). We conducted four numerical experiments to il-lustrate the link between fluid focusing and the five-floor zonation.In experiment 1, permeability in each unit is isotropic and eachpart of the joint system has the same permeability and aspect ratios.This ideal case acts as a reference experiment. In experiment 2, weinvestigated how permeability ratio influences fluid focusing in thejoint system. In this experiment, we did not follow the assumptionof an infinitely extended fracture plane in permeability tensor, be-cause joints in geological environments are not always connectedin all directions. Previous numerical simulations indicate that themaximum connectivity often occurs in the direction of maximumprinciple stress (Sanderson and Zhang, 1999; Zhang and Sanderson,2001). The maximum principle stress during mineralization was al-most vertical (Zhou, 2009), so we elevated the vertical permeabilityand increased the permeability ratio and the degree of anisotropy. Inexperiment 3, we studied how geometric characteristics of the jointsystem affect fluid flow therein. The width of the vein set decreasesdownwards (Liu and Ma, 1993; Zhou, 2009), implying the lowerpart of the joint system has larger aspect ratio than the other parts.Experiment 4 was conducted to examine the combined influence ofpermeability ratio and aspect ratio. We displayed the output in1 year to represent a transient result and the one in 20 years to rep-resent the steady state.
7. Simulation results
7.1. Experiment 1
Hydraulic parameters are shown in Table 3. After 1 year, a largepressure gradient occurred in the lower part of the joint system,driving fluids flow into the joint system (Fig. 10a, b). In the upperpart, fluids moved outwards due to high fluid pressure relative tothe host rock. Fluid moved fastest (9.4 × 10⁻⁸ m/s) in the lowerpart of joint system. After 20 years, the pressure gradient and fluidvelocity has decreased relative to 1 year (Fig. 10c, d), the maximumvelocity decreasing to 8.2 × 10⁻⁸ m/s, and flow was mainly focusedin the third zone ( -5). Table 4 shows that pressure distributions inall four experiments have reached steady state after 20 years. Forconvenience, velocity ratio is defined as the ratio of maximum
velocity in any experiment to the maximum in experiment 1 after20 years. This parameter was used to highlight the difference be-tween this experiment and the following experiments (Table 4).
7.2. Experiment 2
Previous studies using convection-type models have shown thesignificant impact of anisotropy on flow patterns and heat transfer(Dutrow et al., 2001; Gerdes et al., 1998; Hurwitz et al., 2002, 2003;López and Smith, 1996; Rosenberg et al., 1993). In this experiment,porosity and vertical permeability of the fourth and fifth zones was in-creased to 0.14 and 7.0 × 10⁻¹⁴m2, respectively. After 1 year, the pres-sure gradient around these two parts was much higher thanexperiment 1, causing faster flow in the fourth and fifth zones(Fig. 11a, b). After 20 years, fluid flow became slightly slower thanbefore but was still most focused in fourth zone with a velocityratio of 1.3 (Fig. 11c, d, Table 4).
7.3. Experiment 3
We reduced the width of the fourth and fifth zones from 150 m to60 m, raising their aspect ratios from 2 to 5. All units have the samehydraulic parameters as experiment 1. After 1 year, one large pres-sure gradient was generated around these two zones, moving fluidstoward them (Fig. 12a, b). After 20 years, pressure gradient inthese areas became lower, decreasing fluid velocity therein, andfluids weremost focused in the fourth zone, not in the fifth zone any-more (Fig. 12c, d). The velocity ratio decreased from 1.9 after 1 yearto 1.6 after 20 years.
7.4. Experiment 4
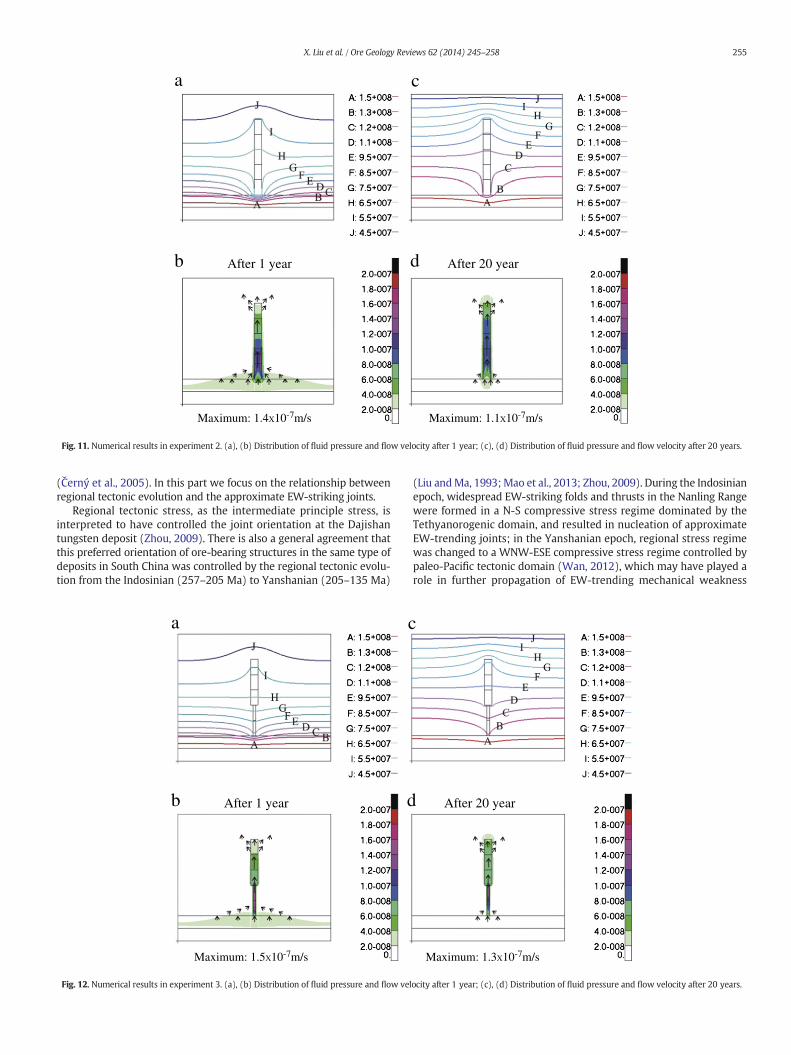
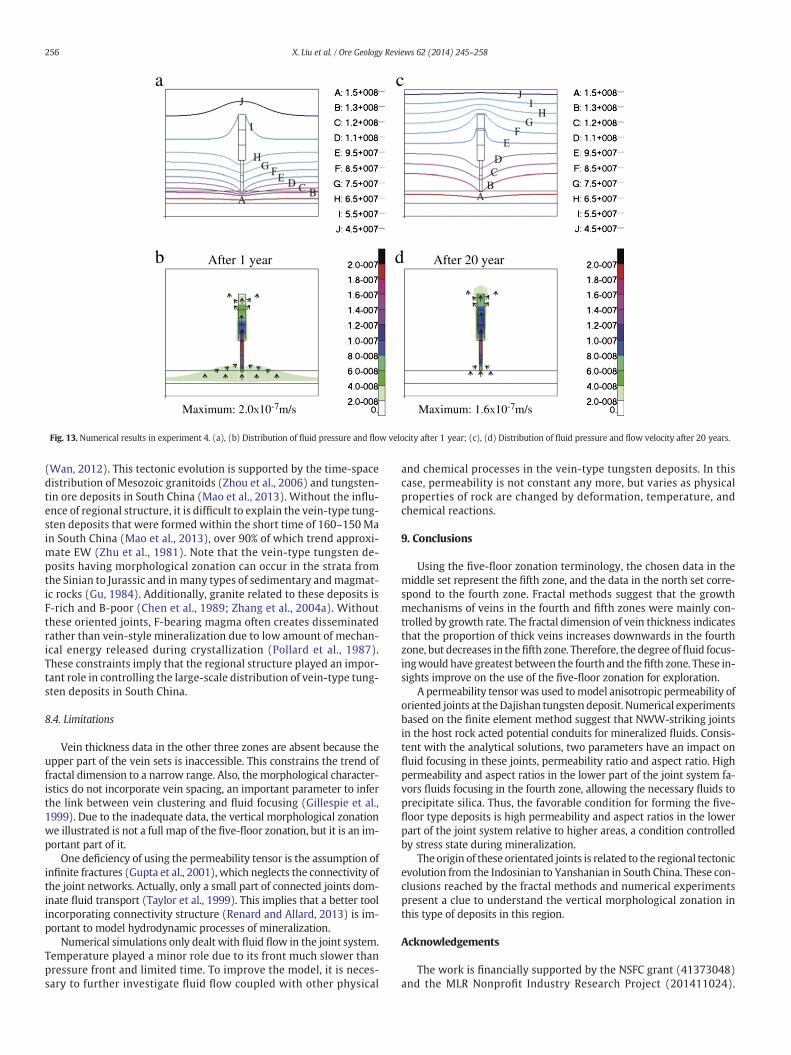
We adopted the same geometric size of joint system as that of ex-periment 3 and the same hydraulic parameters as that of experiment2. Thus, the fourth and fifth zones have higher aspect ratio and higherpermeability than the other zones. This experiment has the hydraulicand geometric characteristics closest to those of the Dajishan tung-sten deposit, compared to the other experiments. After 1 year, flowvelocity in the fifth zone increased rapidly upwards, reached itspeak in the fourth zone, and then decreased gradually upwards(Fig. 13a, b). In the steady state after 20 years, the fourth zone stillhad larger pressure gradient and higher degree of fluid focusingthan other zones (Fig. 13c, d). The velocity ratios in this experimentare higher than the one in any other experiments.
8. Discussions
8.1. Comparisons with analytical solutions
Fluid focusing in joints has been positively correlated with per-meability ratio and aspect ratio (Eq. (23) in Zhao et al., 2006). The in-teraction of these two parameters implies that fluid focusing isrelated to an increment of one parameter as well as to the currentvalue of the other (Zhao et al., 2006). These conclusions, together

b
a
After 1 year After 20 year
Maximum: 9.4X10⁻⁸m/s Maximum: 8.2X10⁻⁸m/s
d
c
Fig. 10. Numerical results in experiment 1. (a), (b) Distribution of fluid pressure and flow velocity after 1 year; (c), (d) Distribution of fluid pressure and flow velocity after 20 years. Thearrows show the direction of fluid flow. The unit of pressure is Pa, and the unit of velocity is m/s.
254 X. Liu et al. / Ore Geology Reviews 62 (2014) 245–258
with comparisons between experiment 1 and others (Table 4), wereused to test the numerical results.
In experiment 1, fluids were focused in the joint system due to apermeability ratio greater than 1. This is consistent with one conclu-sion from the analytical solutions that a permeability ratio largerthan 1 is a prerequisite for fluid focusing in joints. In experiment 2,elevating vertical permeability of the fourth and fifth zones is equiv-alent to increasing the permeability ratio. An increase of flow veloc-ity is consistent with a positive correlation between fluid focusingand permeability ratio. In experiment 3, the high aspect ratio in thelower part of the joint system led to accelerated flow, which is inagreement with the analytical solutions. In experiment 4, high per-meability and aspect ratios in the fourth and fifth zones exerted themost significant influence on fluid focusing in joints. This is consis-tent with the nonlinear relationship of the analytical solutions. Thecomparisons above suggest that the numerical experiments matchwell with the analytical solutions.
8.2. Insights from simulations
The nature of the initial fracture system is of vital importance to thesubsequent development of vein-style mineralization (Sanderson et al.,2008). Numerical experiments suggest that the NWW-striking jointsacted the main pathways channelizing fluids. In experiment 1, fluidflow was most focused in the third zone after a short geological time.However, this ideal case does not agree with the constraint from fractalmethods that fluid flowwasmost concentrated between the fourth and
Table 4Results of the four numerical experiments.
Numerical experiment 1 2 3 4
Pressure increment during 50 days after 20 years b7 Pa b16 Pa b6 Pa b16 PaVelocity ratio after 1 year 1.1 1.4 1.9 2.4Velocity ratio after 20 years 1.0 1.3 1.6 2.0
Pressure change during 50 days indicates that the four experiments reached steady state,given that the pressure gradient after 20 years is approximately 105 Pa/m.
the fifth zone. Increasing the permeability ratio (experiment 2) or as-pect ratio (experiment 3) in the fourth and fifth zones improved the de-gree of fluid focusing and lowered the focusing location. Experiment 4indicates that increasing the permeability ratio and aspect ratio in thefourth and fifth zones together had the most significant impact onfluid flow. In this case, fluid flow was most focused in the fourth zone,therefore allowing for the greatest potential to transfer heat and mass.This implies that high permeability and aspect ratios in the lower partof the joint system are a necessary but an insufficient condition for pre-cipitating quartz in the fourth zone.
Permeability and aspect ratios in the joint system are closely relatedto stress state during mineralization. Previous numerical models(Sanderson and Zhang, 1999; Zhang and Sanderson, 2001) indicatethat loading direction exerts an important influence on deformation,and that only those fractures parallel to maximum principle stressremain open. Hence, the maximum principle stress that was verticalduring mineralization improved the connectivity of subverticalNWW-striking joints, therefore increasing their permeability ratio.Those models also suggest that enhanced fluid flow is extremely lo-calized in small areas of the fracture network when a critical stressstate is reached. Fluid pressure in the lower part of the joint systemwas much higher than the upper part, allowing it to reach the criticalstress state easily. If so, fluid flow would be highly localized in a fewlarge fractures. This localization of deformation in the lower part ofthe deposit corresponds to a high aspect ratio. For the upper part ofthe joint system, it is relatively difficult to reach the critical statedue to low fluid pressure. This leads to uniformly distributed aper-tures and low flow velocity. In this case, the aspect ratio in theupper part was lower than in the lower part. Therefore, fluid focusinginfluenced by permeability ratio and aspect ratio is essentially con-trolled by the coupling of mechanical deformation and fluid flow.
8.3. Control of regional structure
Theorientations of vein-style tungsten-tin deposits are controlled bygranite emplacement and crystallization or by external stress regimes
a c
Maximum: 1.4X10⁻⁷m/s Maximum: 1.1X10⁻⁷m/s
b After 1 year After 20 yeard
Fig. 11. Numerical results in experiment 2. (a), (b) Distribution of fluid pressure and flow velocity after 1 year; (c), (d) Distribution of fluid pressure and flow velocity after 20 years.
255X. Liu et al. / Ore Geology Reviews 62 (2014) 245–258
(Černý et al., 2005). In this part we focus on the relationship betweenregional tectonic evolution and the approximate EW-striking joints.
Regional tectonic stress, as the intermediate principle stress, isinterpreted to have controlled the joint orientation at the Dajishantungsten deposit (Zhou, 2009). There is also a general agreement thatthis preferred orientation of ore-bearing structures in the same type ofdeposits in South China was controlled by the regional tectonic evolu-tion from the Indosinian (257–205 Ma) to Yanshanian (205–135 Ma)
a c
Maximum: 1.5X10⁻⁷m/s
b After 1 year d
Fig. 12. Numerical results in experiment 3. (a), (b) Distribution of fluid pressure and flow vel
(Liu andMa, 1993;Mao et al., 2013; Zhou, 2009). During the Indosinianepoch, widespread EW-striking folds and thrusts in the Nanling Rangewere formed in a N-S compressive stress regime dominated by theTethyanorogenic domain, and resulted in nucleation of approximateEW-trending joints; in the Yanshanian epoch, regional stress regimewas changed to a WNW-ESE compressive stress regime controlled bypaleo-Pacific tectonic domain (Wan, 2012), which may have played arole in further propagation of EW-trending mechanical weakness
Maximum: 1.3X10⁻⁷m/s
After 20 year
ocity after 1 year; (c), (d) Distribution of fluid pressure and flow velocity after 20 years.
a c
Maximum: 2.0X10⁻⁷m/s Maximum: 1.6X10⁻⁷m/s
b After 1 year After 20 yeard
Fig. 13. Numerical results in experiment 4. (a), (b) Distribution of fluid pressure and flow velocity after 1 year; (c), (d) Distribution of fluid pressure and flow velocity after 20 years.
256 X. Liu et al. / Ore Geology Reviews 62 (2014) 245–258
(Wan, 2012). This tectonic evolution is supported by the time-spacedistribution of Mesozoic granitoids (Zhou et al., 2006) and tungsten-tin ore deposits in South China (Mao et al., 2013). Without the influ-ence of regional structure, it is difficult to explain the vein-type tung-sten deposits that were formed within the short time of 160–150 Main South China (Mao et al., 2013), over 90% of which trend approxi-mate EW (Zhu et al., 1981). Note that the vein-type tungsten de-posits having morphological zonation can occur in the strata fromthe Sinian to Jurassic and inmany types of sedimentary andmagmat-ic rocks (Gu, 1984). Additionally, granite related to these deposits isF-rich and B-poor (Chen et al., 1989; Zhang et al., 2004a). Withoutthese oriented joints, F-bearing magma often creates disseminatedrather than vein-style mineralization due to low amount of mechan-ical energy released during crystallization (Pollard et al., 1987).These constraints imply that the regional structure played an impor-tant role in controlling the large-scale distribution of vein-type tung-sten deposits in South China.
8.4. Limitations
Vein thickness data in the other three zones are absent because theupper part of the vein sets is inaccessible. This constrains the trend offractal dimension to a narrow range. Also, the morphological character-istics do not incorporate vein spacing, an important parameter to inferthe link between vein clustering and fluid focusing (Gillespie et al.,1999). Due to the inadequate data, the vertical morphological zonationwe illustrated is not a full map of the five-floor zonation, but it is an im-portant part of it.
One deficiency of using the permeability tensor is the assumption ofinfinite fractures (Gupta et al., 2001), which neglects the connectivity ofthe joint networks. Actually, only a small part of connected joints dom-inate fluid transport (Taylor et al., 1999). This implies that a better toolincorporating connectivity structure (Renard and Allard, 2013) is im-portant to model hydrodynamic processes of mineralization.
Numerical simulations only dealt with fluid flow in the joint system.Temperature played a minor role due to its front much slower thanpressure front and limited time. To improve the model, it is neces-sary to further investigate fluid flow coupled with other physical
and chemical processes in the vein-type tungsten deposits. In thiscase, permeability is not constant any more, but varies as physicalproperties of rock are changed by deformation, temperature, andchemical reactions.
9. Conclusions
Using the five-floor zonation terminology, the chosen data in themiddle set represent the fifth zone, and the data in the north set corre-spond to the fourth zone. Fractal methods suggest that the growthmechanisms of veins in the fourth and fifth zones were mainly con-trolled by growth rate. The fractal dimension of vein thickness indicatesthat the proportion of thick veins increases downwards in the fourthzone, but decreases in thefifth zone. Therefore, the degree offluid focus-ingwould have greatest between the fourth and thefifth zone. These in-sights improve on the use of the five-floor zonation for exploration.
A permeability tensor was used tomodel anisotropic permeability oforiented joints at theDajishan tungstendeposit. Numerical experimentsbased on the finite element method suggest that NWW-striking jointsin the host rock acted potential conduits for mineralized fluids. Consis-tent with the analytical solutions, two parameters have an impact onfluid focusing in these joints, permeability ratio and aspect ratio. Highpermeability and aspect ratios in the lower part of the joint system fa-vors fluids focusing in the fourth zone, allowing the necessary fluids toprecipitate silica. Thus, the favorable condition for forming the five-floor type deposits is high permeability and aspect ratios in the lowerpart of the joint system relative to higher areas, a condition controlledby stress state during mineralization.
Theorigin of these orientated joints is related to the regional tectonicevolution from the Indosinian to Yanshanian in South China. These con-clusions reached by the fractal methods and numerical experimentspresent a clue to understand the vertical morphological zonation inthis type of deposits in this region.
Acknowledgements
The work is financially supported by the NSFC grant (41373048)and the MLR Nonprofit Industry Research Project (201411024).

257X. Liu et al. / Ore Geology Reviews 62 (2014) 245–258
Xiangchong Liu also acknowledges the scholarship from the CSC andthe financial support from the GPMR Open Project Program(NGPMR2011). We would like to thank Liqiang Yang, Shide Mao,Yongquan Li, Zhiwei Tian, Huaizhong Yu, Jinfang Gao, Yan Liu,Nianchao Zhang, Quanshu Li, and Paul D. Bons for helpful advicesand discussions, as well as the staffs of the Dajishan Tungsten Com-pany in field work. David Polya is appreciated for presenting hispaper about wolframite solubility. Xiangchong Liu thanks ChunxiLu for her continuing encouragement and appreciates the help ofBo Zhao and Rongzhen Zhang. The related calculation was carriedout by using PANDAS software on the savanna supercomputer atUQ. We also thank Dr Peter Schaubs of CSIRO Earth Science and Re-source Engineering and an anonymous reviewer for their construc-tive comments and advice to improve the manuscript significantly.
Appendix A
The unit permeability tensor of two sets of joints is as follows:
ke ¼ w1ke1 þw2ke2
ke1 and ke2 are the unit permeability tensors of the first set of joints(9°∠74°) and the second one (181°∠66°), respectively, and w1 and w2
are the corresponding weighting coefficients. Their values calculatedby Eqs. (9) and (10) are:
ke1 ¼0:976 0:011 −0:1540:011 0:995 0:070−0:154 0:070 0:030
24
35;w1 ¼ 0:67
ke2 ¼0:877 0:328 −0:0090:328 0:124 0:025−0:009 0:025 0:999
24
35;w2 ¼ 0:33
References
Akinfiev, N.N., Diamond, L.W., 2009. A simple predictive model of quartz solubility inwater–salt–CO2 systems at temperatures up to 1000 °C and pressures up to1000 MPa. Geochim. Cosmochim. Acta 73, 1597–1608.
André-Mayer, A.-S., Sausse, J., 2007. Thickness and spatial distribution of veins in a por-phyry copper deposit, Rosia Poieni, Romania. J. Struct. Geol. 29, 1695–1708.
Brathwaite, R.L., Cargill, H.J., Christie, A.B., Swain, A., 2001. Lithological and spatial controlson the distribution of quartz veins in andesite- and rhyolite-hosted epithermal Au–Ag deposits of the Hauraki Goldfield, New Zealand. Mineral. Deposita 36, 1–12.
Cao, X.F., Lu, X.B., He, M.C., Niu, H., Du, B.F., Mei, W., 2009. An infrared microscope inves-tigation of fluid inclusions in coexisting quartz and wolframite: a case study ofYaogangxian quartz vein wolframite deposit. Miner. Depos. Chin. 28 (5), 611–620(In Chinese with English Abstract).
Cathles, L.M., Shannon, R., 2007. How potassium silicate alteration suggests the formationof porphyry ore deposits begins with the nearly explosive but barren expulsion oflarge volumes of magmatic water. Earth Planet. Sci. Lett. 262, 92–108.
Černý, P., Blevin, P.L., Cuney, M., London, D., 2005. Granite-related ore deposits. Society ofEconomic Geologists 100th Anniversary pp. 337–370.
Chen, Y.C., Pei, R.F., Zhang, H.L., Lin, X.D., Li, C.Y., Hu, Y.J., Liu, H.Q., Xian, B.Q., 1989. The Ge-ology of Nonferrous and Rare Metal Deposits Related to Mesozoic Granitoids inNanling Region. Geological Publishing Housing Beijing, China 507 pp.
Chi, Q.H., Wang, X.Q., Xu, S.F., Zhou, J., Liu, H.L., Liu, D.S., Zhang, B.M., Wang, W., 2012.Temporal and spatial distribution of tungsten and tin in South China Continent.Front. Earth Sci. Chin. 19 (3), 70–83 (In Chinese with English abstract).
Clarke, M.C.G., 1983. Current Chinese thinking on the South China tungsten province.Trans. Inst. Min. Metall. Sect. B 92, 10–15.
Coumou, D., Driesner, T., Geiger, S., Paluszny, A., Heinrich, C.A., 2009. High-resolutionthree-dimensional simulations of mid-ocean ridge hydrothermal systems. J. Geophys.Res. 114.
Dutrow, B.L., Travis, B.J., Gable, C.W., Henry, D.J., 2001. Coupled heat and silica transportassociated with dike intrusion into sedimentary rock: effects on isotherm locationand permeability evolution. Geochim. Cosmochim. Acta 65, 3749–3767.
Fournier, R.O., 1999. Hydrothermal processes related to movement of fluid from plasticinto brittle rock in the magmatic-epithermal environment. Econ. Geol. 94,1193–1212.
Foxford, K.A., Nicholson, R.A., Polya, D.A., Hebblethwaite, R.P.B., 2000. Extensionalfailure and hydraulic valving at Minas da Panasqueira, Portugal. J. Struct. Geol.22, 1065–1086.
Gerdes, M.L., Baumgartner, L.P., Person, M., 1998. Convective fluid flow through heteroge-neous country rocks during contact metamorphism. J. Geophys. Res. 103,23983–24003.
Germanovich, L.N., Lowell, R.P., 1992. Percolation theory, thermoelasticity, and discretehydrothermal venting in the Earth's crust. Science 255, 1564–1567.
Gillespie, P.A., Johnston, J.D., Loriga, M.A., McCaffrey, K.J.W., Walsh, J.J., Watterson, J., 1999.Influence of layering on vein systematics in line samples. Geol. Soc. London Spec.Publ. 155, 35–56.
Gu, J.Y., 1984. Morpholgical zonation of tungsten deposits in South China. In: Yu, H.Z. (Ed.), Proc. Symposium Tungsten Geology (Chinese edition), Nanchang, 1981. GeologicalPublishing House, Beijing, pp. 35–45 (in Chinese).
Guo, C., Mao, J., Bierlein, F., Chen, Z., Chen, Y., Li, C., Zeng, Z., 2011. SHRIMP U–Pb (zircon),Ar–Ar (muscovite) and Re–Os (molybdenite) isotopic dating of the Taoxikeng tung-sten deposit, South China Block. Ore Geol. Rev. 43, 26–39.
Gupta, A., Penuela, G., Avila, R., 2001. An integrated approach to the determination of per-meability tensors for naturally fractured reservoirs. J. Can. Pet. Technol. 40, 43–48.
Hall, A., 1971. Greisenisation in the granite of Cligga Head, Cornwall. Proc. Geol. Assoc. 82,209–230.
Hanson, R.B., 1995. The hydrodynamics of contact metamorphism. Geol. Soc. Am. Bull.107, 595–611.
Hurwitz, S., Ingebritsen, S.E., Sorey, M.L., 2002. Episodic thermal perturbations associatedwith groundwater flow: an example from Kilauea Volcano, Hawaii. J. Geophys. Res.107.
Hurwitz, S., Kipp, K.L., Ingebritsen, S.E., Reid, M.E., 2003. Groundwater flow, heat trans-port, and water table position within volcanic edifices: implications for volcanic pro-cesses in the Cascade Range. J. Geophys. Res. 108, 2557.
Ingebritsen, S.E., 2012. Modeling the formation of porphyry-copper ores. Science 338(6114), 1551–1552.
Ingebritsen, S.E., Appold, M.S., 2012. The physical hydrogeology of ore deposits. Econ.Geol. 107, 559–584.
Ingebritsen, S.E., Manning, C.E., 2010. Permeability of the continental crust: dynamic var-iations inferred from seismicity and metamorphism. Geofluids 10, 193–205.
Jiang, G.H., Hu, R.Z., Xie, G.Q., Zhao, J.H., Tang, Q.L., 2004. K-Ar ages of plutonism and min-eralization at the Dajishan tungsten deposit, Jiangxi Province, China. Acta Mineral.Sin. 24 (3), 253–256 (In Chinese with English abstract).
Kim, Y.-S., Sanderson, D.J., 2005. The relationship between displacement and length offaults: a review. Earth Sci. Rev. 68 (3–4), 317–334.
Kong, Z.Q., 1982. Investigation on metallogenic regularity in Dajishan tungsten deposit.Geol. Explon. 6, 27–43 (In Chinese).
Kruhl, J.H., 2013. Fractal-geometry techniques in the quantification of complex rock struc-tures: a special view on scaling regimes, inhomogeneity and anisotropy. J. Struct.Geol. 46, 2–21.
Liu, L.M., 2011. Fluid overpressure and rock fracturing caused by shallow intrusion andtheir constraints on hydrothermal mineralization. Front. Earth Sci. Chin. 18 (5),78–89 (In Chinese with English abstract).
Liu, Y.J., Ma, D.S., 1993. Vein-type tungsten deposits of China and adjoining regions. OreGeol. Rev. 8, 233–246.
Liu, N.Q., Yu, C.W., 2009. Complexity of ore-controlling fracture system of Dajishan tung-sten deposit, China. Front. Earth Sci. Chin. 16, 320–325.
López, D.L., Smith, L., 1996. Fluid flow in fault zones: influence of hydraulic anisotropy andheterogeneity on the fluid flow and heat transfer regime. Water Resour. Res. 32 (10),3227–3235.
Lowell, R.P., Cappellen, P.V., Germanovich, L.N., 1993. Silica precipitation in fractures andthe evolution of permeability in hydrothermal upflow zones. Science 260, 192–194.
Lupi, M., Geiger, S., Graham, C.M., 2011. Numerical simulations of seismicity-induced fluidflow in the Tjörnes Fracture Zone, Iceland. J. Geophys. Res. 116 (B7), B07101.
Mao, J., Yanbo, C., Maohong, C., Pirajno, F., 2013. Major types and time–space distributionof Mesozoic ore deposits in South China and their geodynamic settings. Mineral.Deposita 48 (3), 267–294.
Monecke, T., Gemmell, J.B., Monecke, J., 2001. Fractal distributions of veins in drill corefrom the Hellyer VHMS deposit, Australia: constraints on the origin and evolutionof the mineralising system. Mineral. Deposita 36 (5), 406–415.
Ni, P., Huang, J., Wang, X., Jiang, S., Ling, H., 2006. Infrared fluid inclusion microthermometryon coexisting wolframite and quartz from Dajishan tungsten deposit, Jiangxi province,China. Geochim. Cosmochim. Acta 70 (18, Supplement), A444.
Oda, M., 1985. Permeablity tensor for discontinuous rock masses. Geotechnique 35 (4),483–495.
Pollard, P.J., Pichavant, M., Charoy, B., 1987. Contrasting evolution of fluorine- and boron-rich tin systems. Mineral. Deposita 22 (4), 315–321.
Renard, P., Allard, D., 2013. Connectivity metrics for subsurface flow and transport. Adv.Water Resour. 51, 168–196.
Roberts, S., Sanderson, D.J., Gumiel, P., 1998. Fractal analysis of Sn-Wmineralization fromCentral Iberia. Econ. Geol. 93, 360–365.
Roberts, S., Sanderson, D.J., Gumiel, P., 1999. Fractal analysis and percolation properties ofveins. Geol. Soc. London Spec. Publ. 155 (1), 7–16.
Rosenberg, N.D., Spera, F.J., Haymon, R.M., 1993. The relationship between flow and per-meability field in seafloor hydrothermal systems. Earth Planet. Sci. Lett. 116 (1–4),135–153.
Sanderson, D.J., Zhang, X., 1999. Critical stress localization of flow associated with defor-mation of well-fractured rock masses, with implications for mineral deposits. Geol.Soc. London Spec. Publ. 155 (1), 69–81.
Sanderson, D.J., Roberts, S., Gumiel, P., Greenfield, C., 2008. Quantitative analysis of tin-and tungsten-bearing sheeted vein systems. Econ. Geol. 103, 1043–1056.
Sheldon, H.A., Ord, A., 2005. Evolution of porosity, permeability and fluid pressure in di-latant faults post-failure: implications for fluid flow and mineralization. Geofluids 5,272–288.

258 X. Liu et al. / Ore Geology Reviews 62 (2014) 245–258
Simpson, F., 2001. Fluid trapping at the brittle–ductile transition re-examined. Geofluids 1(2), 123–136.
Snow, D.T., 1969. Anisotropie permeability of fractured media. Water Resour. Res. 5 (6),1273–1289.
Song, S.Q., Hu, R.Z., Bi, X.W., Wei, W.F., Shi, S.H., 2011. Fluid inclusion geochemistry ofTaoxikeng tungsten deposit in southern Jiangxi Province, China. Geochimica 40 (3),237–248 (In Chinese with English abstract).
Sun, G.A., Shi, M.K., Zhang, H.L., Hu, X.W., 1985. The Petrology, Geochemistry, and Miner-alization of the Dajishan Granite. China University of Geosciences, Wuhan 326–363.
Sun, G.A., 1989. Dajishan tungsten, niobium, and tantalum deposit in Jiangxi Province. In:Chen, Y.C., et al. (Eds.), The Geology of Nonferrous and RareMetal Deposits Related toMesozoic Granitoids in Nanling Range, China. Geological Publishing Housing, Beijing,pp. 74–87 (In Chinese).
Taylor, W.L., Pollard, D.D., Aydin, A., 1999. Fluid flow in discrete joint sets: field observa-tions and numerical simulations. J. Geophys. Res. 104, 28983–29006.
Teng, J.D., 1990. Vertical zoning of mineralization in the Dajishan Mine. Min. Geol. 11 (2),13–24 (In Chinese).
Titley, S.R., 1990. Evolution and style of fracture permeability in intrusion-centered hy-drothermal systems. In: Geophysics Study Committee, N.R.C. (Ed.), The Role of Fluidsin Crustal Processes. The National Academies Press, Washington, D.C., pp. 50–63.
Wan, T.F., 2012. The tectonics of China. Springer, Berlin Heidelberg pp. 149–196.Wang, Q.Y., Hu, R.Z., Peng, J.T., Bi, X.W., Wu, L.Y., Liu, H., Su, B.X., 2007. Charactersitics and
significance of the fluid inclusions from Yaogangxian tungsten deposit in south ofHunan. Acta Petrol. Sin. Acta 23 (9), 2263–2273.
Wang, X.D., Ni, P., Jiang, S., Zhao, K., Wang, T., 2009. Origin of ore-forming fluid in thePiaotang tungsten deposit in Jiangxi Province: evidence from helium and argon iso-topes. Chin. Sci. Bull. 55 (7), 628–634.
Wang, D.H., Tang, J.X., Ying, L.J., Chen, Z.H., Xu, J.X., Zhang, J.J., Li, S.R., Zeng, Z.L., 2010.Application of five levels + basement model for prospecting deposits into depth.J. Jilin Univ. (Earth Sci. Ed.) 40 (4), 733–738 (In Chinese with English abstract).
Wang, D., Lu, H.Z., Bi, X.W., 2011. Comparison of characteristics of ore forming fluids be-tween quartz-vein tungsten deposits and porphyry copper deposits associated withgranitic rocks. Front. Earth Sci. Chin. 18 (5), 121–131 (In Chinese with Englishabstract).
Wang, X.D., Ni, P., Yuan, S.D., Wu, S.H., 2013. Fluid inclusion studies of Dajishan tungstendeposit in Jiangxi Province. Miner. Depos. Chin. 32, 308–322 (In Chinese with Englishabstract).
Weatherley, D.K., Henley, R.W., 2013. Flash vaporization during earthquakes evidencedby gold deposits. Nat. Geosci. 6 (4), 294–298.
Wei, W.F., Hu, R.Z., Bi, X.W., Peng, J.T., Su, W.C., Song, S.Q., Shi, S.H., 2012. Infraredmicrothermometric and stable isotopic study of fluid inclusions in wolframite at theXihuashan tungsten deposit, Jiangxi province, China. Mineral. Deposita 47 (6),589–605.
Xi, B.B., Zhang, D.H., Zhou, L.M., Zhang, W.H., Wang, C., 2008. Characteristics of ore-forming fluid evolution in Dajishan tungsten deposit, Quannan County, Jiangxi. ActaGeol. Sin. 82 (7), 956–966.
Xing, H.L., 2013. PANDAS — a highly coupled nonlinear simulator got multiscalegeocomputing. User’s Manual Version 1.0The University of Queensland.
Xing, H., 2014. Finite element simulation of transient geothermal flow in extremely het-erogeneous fractured porous media. J. Geochem. Explor. http://dx.doi.org/10.1016/j.gexplo.2014.03.002.
Xing, H.L., Makinouchi, A., 2002. Three dimensional finite element modelling ofthermomechanical frictional contact between finite deformation bodies usingR-minimum strategy. Comput. Methods Appl. Mech. Eng. 191, 4193–4214.
Xing, H.L., Mora, P., 2006. Construction of an intraplate fault system model of SouthAustralia, and simulation tool for the iSERVO institute seed project. Pure Appl.Geophys. 163, 2297–2316.
Xing, H.L., Makinouchi, A., Mora, P., 2007. Finite elementmodeling of interacting fault sys-tem. Phys. Earth Planet. Inter. 163, 106–121.
Xing, H.L., Gao, J., Zhang, J., Liu, Y., 2010. Towards an integrated simulator for En-hanced Geothermal Reservoirs. Proceedings World Geothermal Congress 2010,Indonesia, pp. 25–29 (http://www.geothermal-energy.org/pdf/IGAstandard/WGC/2010/3224.pdf).
Xu, J.X., Zeng, Z.L., Wang, D.H., Chen, Z.H., Liu, S.B., Wang, C.H., Ying, L.J., 2008. A new typeof tungsten deposit in southern Jiangxi and the new model of “five floors + base-ment” for prospecting. Acta Geol. Sin. 82 (7), 880–887 (In Chinese with Englishabstract).
Yu, C.W., 2004. Fractal dilation of multiple hydraulic fracturing. Front. Earth Sci. Chin. 11(3), 11–44 (In Chinese with English abstract).
Zhang, X., Sanderson, D.J., 2001. Evaluation of instability in fractured rock masses usingnumerical analysis methods: effects of fracture geometry and loading direction.J. Geophys. Res. 106 (B11), 26671–26687.
Zhang, G.X., Xie, Y.N., Yu, F.J., Zhang, H.B., 1997. Stable isotope geochemistry of distinctmetallogenic stages of tungsten deposits in Dajishan mine, Jiangxi. Acta Geosci. Sin.18, 197–199 (In Chinese with English abstract).
Zhang, D.H., Zhang, W.H., Xu, G.J., 2004a. The ore fluid geochemistry of F-rich silicatemelt-hydrous fluid system and its metallogeny: the current status and problems.Front. Earth Sci. Chin. 11 (2), 479–490 (In Chinese with English abstract).
Zhang, W.L., Hua, R.M., Wang, R.C., Li, H.M., Chen, P.R., 2004b. Single zircon U-Pb isotopicage of the Wuliting granite in Dajishan area of Jiangxi, and its geological implication.Acta Geol. Sin. 78 (3), 352–358 (In Chinese with English abstract).
Zhang, W.L., Hua, R.M., Wang, R.C., Chen, P.R., Li, H.M., 2006. New dating of the Dajishangranite and related tungsten mineralization in South Jiangxi. Acta Geol. Sin. 80 (7),956–962 (In Chinese with English abstract).
Zhang, S.M., Chen, Z.H., Shi, G.H., Li, L.X., Qu, W.J., Li, C., 2011. Re-Os isotopic dating of mo-lybdenite from Dajishan tungsten deposit in Jiangxi Province. Miner. Depos. Chin. 30(6), 1113–1121 (In Chinese with English abstract).
Zhao, C.B., Hobbs, B.E., Ord, A., Peng, S.L., Liu, L.M., Mühlhaus, H.B., 2006. Analytical solu-tions for pore-fluid flow focusing within inclined elliptic inclusions in pore-fluid-saturated porous rocks: solutions derived in an elliptical coordinate system. Math.Geol. 38 (8), 987–1010.
Zhao, C., Hobbs, B., Ord, A., Peng, S., Liu, L., 2008. Inversely-mapped analytical solutions forflow patterns around and within inclined elliptic inclusions in fluid-saturated rocks.Math. Geol. 40 (2), 179–197.
Zhao, C.B., Reid, L.B., Regenauer-Lieb, K., 2012. Some fundamental issues in computationalhydrodynamics of mineralization: a review. J. Geochem. Explor. 112, 21–34.
Zhou, L.M., 2009. Numerical modeling of paleo-tectonic stress field and metallogenicprognosis in Dajishan tungsten deposit, Quannan, Jiangxi. (Master dissertation)China University of Geosciences (Beijing), Beijing p. 67 (In Chinese with Englishabstract).
Zhou, X.M., Sun, T., Shen, W.Z., Shu, L.S., Niu, Y.L., 2006. Petrogenesis of Mesozoicgranitoids and volcanic rocks in south China : a response to tectonic evolution.Episodes 29, 26–33.
Zhu, Y.L., Li, C.Y., Lin, Y.H., 1981. Tungsten deposit geology in South Jiangxi Province. Jiang-xi People's Publishing House, Nanchang pp. 1–440 (In Chinese).
Zhuang, L.C., Lin, W.S., Xie, T.H., 1991. Stable isotope geochemistry of the Dajishantungsten mine in Jiangxi Province. Bulletin of the YiChang Institute of Geology andMineral Resources Chinese Academy of Geological Sciences., 16 pp. 109–120 (InChinese with English abstract).