Core tungsten transport in WEST long pulse L-mode plasmas
16
HAL Id: hal-02989885 https://hal.archives-ouvertes.fr/hal-02989885 Submitted on 5 Nov 2020 HAL is a multi-disciplinary open access archive for the deposit and dissemination of sci- entific research documents, whether they are pub- lished or not. The documents may come from teaching and research institutions in France or abroad, or from public or private research centers. L’archive ouverte pluridisciplinaire HAL, est destinée au dépôt et à la diffusion de documents scientifiques de niveau recherche, publiés ou non, émanant des établissements d’enseignement et de recherche français ou étrangers, des laboratoires publics ou privés. Core tungsten transport in WEST long pulse L-mode plasmas X. Yang, P. Manas, C. Bourdelle, J. Artaud, R. Sabot, Yann Camenen, J. Citrin, F. Clairet, C. Desgranges, P. Devynck, et al. To cite this version: X. Yang, P. Manas, C. Bourdelle, J. Artaud, R. Sabot, et al.. Core tungsten transport in WEST long pulse L-mode plasmas. Nuclear Fusion, IOP Publishing, 2020, 60 (8), pp.086012. 10.1088/1741- 4326/ab9669. hal-02989885
-
Upload
khangminh22 -
Category
Documents
-
view
2 -
download
0
Transcript of Core tungsten transport in WEST long pulse L-mode plasmas

HAL Id: hal-02989885https://hal.archives-ouvertes.fr/hal-02989885
Submitted on 5 Nov 2020
HAL is a multi-disciplinary open accessarchive for the deposit and dissemination of sci-entific research documents, whether they are pub-lished or not. The documents may come fromteaching and research institutions in France orabroad, or from public or private research centers.
L’archive ouverte pluridisciplinaire HAL, estdestinée au dépôt et à la diffusion de documentsscientifiques de niveau recherche, publiés ou non,émanant des établissements d’enseignement et derecherche français ou étrangers, des laboratoirespublics ou privés.
Core tungsten transport in WEST long pulse L-modeplasmas
X. Yang, P. Manas, C. Bourdelle, J. Artaud, R. Sabot, Yann Camenen, J.Citrin, F. Clairet, C. Desgranges, P. Devynck, et al.
To cite this version:X. Yang, P. Manas, C. Bourdelle, J. Artaud, R. Sabot, et al.. Core tungsten transport in WESTlong pulse L-mode plasmas. Nuclear Fusion, IOP Publishing, 2020, 60 (8), pp.086012. �10.1088/1741-4326/ab9669�. �hal-02989885�

Core tungsten transport in WEST long pulse L-mode plasmas
X. Yang,1, 2 P. Manas,3 C. Bourdelle,3 J. F. Artaud,3 R. Sabot,3 Y. Camenen,4 J. Citrin,5 F. Clairet,3 C.
Desgranges,3 P. Devynck,3 T. Dittmar,6 A. Ekedahl,3 N. Fedorczak,3 C. Gil,3 T. Loarer,3 Ph. Lotte,3 O. Meyer,3
J.Morales,3 M. Peret,3 Y. Peysson,3 C. D. Stephens,7 G. Urbanczyk,8 D. Vezinet,3 L. Zhang,1 and X. Gong1
1Institute of Plasma Physics, Chinese Academy of Science, Hefei, 230031, China/P.R. China2University of Science and Technology of China, Hefei, 230026, China/P.R. China
3CEA, IRFM, F-13108 Saint Paul-Lez-Durance, France4CNRS, Aix-Marseille Univ., PIIM UMR7345, Marseille, France
5DIFFER - Dutch Institute for Fundamental Energy Research, Eindhoven, the Netherlands6Forschungszentrum Julich GmbH, Institut fur Energie- und Klimaforschung-Plasmaphysik, D-52425 Julich, Germany
7University of California, Los Angeles, California 90095-1547, USA8Advanced Energy Research Center, Shenzhen University, Shenzhen 518060, China
Tungsten transport is investigated in WEST long pulse L-mode plasmas operated with the strikepoint on the actively cooled upper tungsten divertor. The pulses are mostly heated by lower hy-brid waves. It is experimentally found that tungsten does not centrally accumulate throughoutthese ∼ 30 s reproducible discharges despite large normalised electron density gradients R/Lne .To explain these observations, turbulent and neoclassical transport of electrons and tungsten ionsare computed with GKW [1] and NEO [2, 3] respectively. Additionally, interpretative integratedmodelling simulations are also performed to keep data coherency despite the lack of measurementsof some quantities such as the Ti profiles. Modelled R/Lne are found consistent with interferometryinversions and the tungsten peaking factor R/LnW remains comparable to R/Lne due to dominantturbulent diffusivities inside r/a = 0.3−0.8. In the central region r/a < 0.3 neoclassical W transportdominates but the convective velocities are several order of magnitudes lower compared to plasmaswith toroidal rotation velocities induced by a neutral beam injection (NBI) torque. Finally, nitrogenis seeded in these pulses leading to an enhanced energy content which is consistent with stabilisedion temperature gradient modes from dilution.
PACS numbers:
1. INTRODUCTION
Tungsten (W) accumulation in the core of tokamakplasmas causes a large increase of the radiated power dueto its high cooling rate, which severely restricts the oper-ational domain. For instance, it is routinely observedin machines with tungsten environments such as JETand ASDEX Upgrade, that W can accumulate in neutralbeam injection (NBI) only heated H-mode plasmas [4, 5].Indeed NBI torque and central particle sources lead to en-hanced inward tungsten convection. In this context, thetokamak WEST, which operates in a full W environment[6, 7], has achieved 32 s L-mode pulses without any signof W accumulation. These pulses were performed on theupper actively cooled W divertor [8] with nitrogen puff-ing phases in order to explore the ammonia formation[9]. Observations of the absence of W accumulation withonly radio-frequency heating systems (no input torque)are not new, e.g. [13] where H-mode plamas with only ioncyclotron resonance heating (ICRH) are analysed. Nev-ertheless, for these Alcator C-Mod plasmas, the densityprofiles are flat and the ICRH heating systems are knownto prevent W accumulation [14]. Thus, the interestingpoints raised by these WEST long pulse L-mode plasmasare the fact that no ICRH has been used (no beneficialeffect on W transport) and that the density profiles areparticularly peaked, which should lead to unfavourableW convection. Therefore, it is important to understand
tungsten transport in these conditions for future opti-mized operations.
Core W transport results of both neoclassical (colli-sional) and turbulent physics [10, 11]. Neoclassical par-ticle convection is proportional to the normalised densityand ion temperature gradients. Hence electron densitypeaking plays a key role in W accumulation. In thepresence of toroidal rotation, the detrimental effect ofdensity peaking is further amplified [12]. On the otherhand, microinstabilities such as the ion temperature gra-dient (ITG) and the trapped electron mode (TEM) alsoproduce significant core impurity transport, which withsufficiently large turbulent diffusion can compensate forthe unfavourable neoclassical convection. In this contri-bution, WEST long pulse L-mode plasmas are studiedwhere despite peaked electron densities, the W concen-tration remains stable throughout the whole pulse. Tung-sten transport analysis are performed for a representativecase thanks to the neoclassical code NEO [2, 3] and to thegyrokinetic codes GKW [1] and QuaLiKiz [15]; QuaLiKizemploys a high-frequency expansion for the eigenfunctionevaluation, enabling faster computations compatible withintegrated modelling.
The paper is organised as follows. In Section 2 theWEST tokamak and the long pulse scenarios are de-scribed and in particular a representative pulse is furtherscrutinised. Soft X-ray (SXR) measurements to accountfor the W content are discussed and reflectometry mea-surements allow us to assess the turbulent state of the

2
plasma, such as whether trapped electron mode turbu-lence is dominant or not. Additionally, stringent tests fordata coherency, such as enforcing a consistent Zeff withrespect to the flux consumption in ohmic phases, are per-formed with the transport code METIS [16]. These in-terpretative integrated modelling simulations are manda-tory to compensate or minimise the lack of experimentaldata due to the very recent operation of WEST. In Sec-tion 4, modelling tools are described and used to analysethe main experimental observations from Section 2 suchas the peaked electron density profiles, flat tungsten den-sities and improved confinement with nitrogen seeding.Finally, conclusions are given in Section 5.
2. EXPERIMENTAL SETUP ANDOBSERVATIONS
WEST is a full tungsten (W) superconducting activelycooled tokamak with a plasma volume of 14 m3, a majorradius of 2.5 m, an aspect ratio A = R/r between 5 and6 and a magnetic field of 3.7 T. The WEST programmeaims at power/particle exhaust studies on the ITER-likeactively cooled tungsten divertor for discharges reach-ing 1000s, while maintaining good bulk plasma perfor-mances. It is equipped with 9 MW of ion cyclotron reso-nance heating (ICRH) and 7 MW of lower hybrid currentdrive (LHCD) [6, 7].
The upper divertor is made of actively cooled, W-coated, copper tiles [6, 8]. In the present phase 1 ofWEST, the lower divertor is equipped with a set of ac-tively cooled ITER-like plasma facing units (PFU) [17]and is complemented with inertially cooled W coatedunits. Other side limiters are all W coated (Fig. 1). Inthe 2nd phase of WEST operation, to be started in 2020,the lower divertor will be fully equipped with ITER-likePFUs [18].
The main plasma configuration is in lower single null(LSN), but WEST can be operated in double null (DN)as well as in upper single null (USN) to, in particular, per-form long pulses on the actively cooled upper divertor inthis first phase of operation. Thanks to reproducible 30s pulses, 20 minutes of plasmas were achieved in 2 daysin USN. Since these long pulses were performed to studyammonia formation, N2 was puffed either from the up-per divertor or the midplane. Boronisations [19] openedup the operational window to higher density ranges, butthe fraction of radiated power remained around 50% ofthe LHCD power [20]. The reported experiments havebeen carried out 2 months after the last boronisation.This means that the short term potential effects on theplasma performances had fully vanished whilst the levelof oxygen was lower than prior to the boronisation.
In this work, a USN 33 s long L-mode plasma withdominant electron heating and low torque is presented(discharge #54178). To monitor the W behaviour,bolometers, SXR, UV spectroscopy and visible spec-troscopy are installed which can be used to measure the
FIG. 1: Picture of WEST vacuum vessel, May 2018
radiated power, radiation of soft X emission, and the lineemission of highly ionized W as well as W I, separately.Line of sights (LOS) of the SXR and a few among the240 LOSs of the visible spectroscopy [21] are shown inFigs. 2(a) and (b), respectively.
2.1. Absence of tungsten accumulation withpeaked electron density profiles
Time traces of several parameters of this representa-tive WEST long pulse L-mode plasma are presented inFig. 3. The magnetic field was at its nominal value, 3.7T, the plasma current at 0.4 MA and the edge safetyfactor at q95 = 4.8. Through the discharge heated viaLHCD antennas with up to 2.8 MW, the radiated power,the peaking factor (defined as ratios of SXR line inte-grated intensities) and the UV line emission of W XLIVdisplay a stable behaviour, which suggests that the Wcontent remains constant. A significant increase in theradiated power is observed during the ICRH phase and isnot further discussed in this paper. More details on theplasma response in presence of ICRH are reported in [23].

3
FIG. 2: (a) LOSs (gray lines) of SXR and the positions wherethe N2 can be seeded. The two red LOSs of SXR will be used todefine the W peaking factor. (b) LOSs of bolometers. (c) A fewof the 240 LOSs of the visible spectroscopy diagnostic. (d) LOS ofinterferometers [22].
During the N2 seeding phase, the plasma’s stored energyand the neutron flux both increase, indicating improvedconfinement. Meanwhile, the SXR peaking factor andthe UV line emission of W XLIV decrease and the totalradiated power slightly increases. These observations arerobustly reproduced in several other similar USN longpulses. Finally, it is to be noted that the W sources (notshown here) from the divertor and the LCHD limiter,monitored with visible spectroscopy (W I at 400.8 nm),do not feature significant changes throughout the LHCDheated phase.
The electron temperature profiles are measured byelectron cyclotron emission (ECE) as shown in Fig. 6for the discharge #54178 at 8 s. Te is reliable in therange of r/a < 0.6 when LHCD heating is used. Oncebeyond this range, the ECE signal is polluted by LHCDnon-thermal electrons [24]. These suprathermal electronscan also affect the high field side signals yielding horizon-tal asymmetries on the Te profiles. For this reason, onlythe low field side (LFS) values are considered. The elec-tron density profiles were inverted from interferometrymeasurements, with 8 lines of sight and using a modi-fied hyperbolic tangent formulation [25]. These invertedprofiles are compared to reflectometer measurements inFig. 4 (top panel). During LHCD phases, stray ECE ra-diation is emitted by the fast electrons and deterioratesthe signal to noise ratio. As a consequence the uncer-tainty on the profile positions from reflectometry risesfrom ±1 cm to approximately ±4 cm. This issue, presentin the current analysis, has been solved later by increas-ing the sweeping time from 1 to 10 µs; this reduces thefrequency bandwidth on the signal detection in order todiminish the ECE noise. At the plasma’s edge, density
profiles measured by these two different diagnostics areconsistent and feature a relatively large density peaking.This density peaking remains large even at mid-radius.Such peaked density profiles can lead to large inward neo-classical convective tungsten velocities and potentially totungsten accumulation. Hence, to properly predict tung-sten transport, theoretical models should first correctlypredict these levels of electron density peaking. This isfurther investigated in Section 4. Finally, because someexperimental data is lacking due to diagnostics being notavailable at the time of the WEST operation (e.g. Ti pro-files), a particular effort is carried out throughout thiswork to maximise the data consistency checks in orderto minimize the impact of missing measurements. In-terpretative integrated modelling is used together withsynthetic diagnostics to maximise the data consistencyvalidation. This methodology is described in Section 3.
2.2. Density fluctuation measurements and TEMturbulence
Density fluctuations were also measured with the coreX-mode reflectometer [26]. Measurements were per-formed at t = 3.7s, just before the LHCD ramp-up, andat t = 8s, LHCD plateau, before the N2 injection phase.Each of the 2 channels probed 10 frequencies (radial po-sitions). Each frequency plateau lasted 25 ms, leading toan overall measurement time of 300 ms. The positions ofthe probing zone were recovered using the density pro-files provided by the interferometry lines inversion. Thefrequency spectra exhibit a classical shape with low fre-quency and broadband components [27, 28]. Unlike theOhmic phase, the LHCD phase contained an increase of15-20 dB of the background ECE noise. As shown in Fig.5 a quasi-coherent component [27, 29] can be observed ataround 70 kHz with r/a = 0.37 and r/a = 0.26 on theLFS. Its amplitude is much smaller at r/a = 0.45 andhardly above the broadband component further out. Asit was shown in [30, 31], the quasi-coherent modes in thecore are a signature of TEM turbulence. In the Ohmicphase, quasi-coherent modes are hardly detectable evenif the amplitude of the broadband component is few dBlower.
2.3. Improved energy content during N2 seeding
Improved confinement with impurity seeding is com-monly observed in stellarators [32] and medium sizedtokamaks whether, it is due to reduced core heat dif-fusivities and increased central electron densities for theradiative improved mode at TEXTOR-94 [33] and alsofor L-mode plasmas as in DIII-D [34], or due to im-proved pedestal pressure in H-mode plasmas as in AS-DEX Upgrade [35] and JT-60U [36]. For WEST dis-charge #54178, N2 was puffed at a rate of 0.2 Pa m3 s−1
through the midplane between 10 and 20 s (see Fig. 3).
4
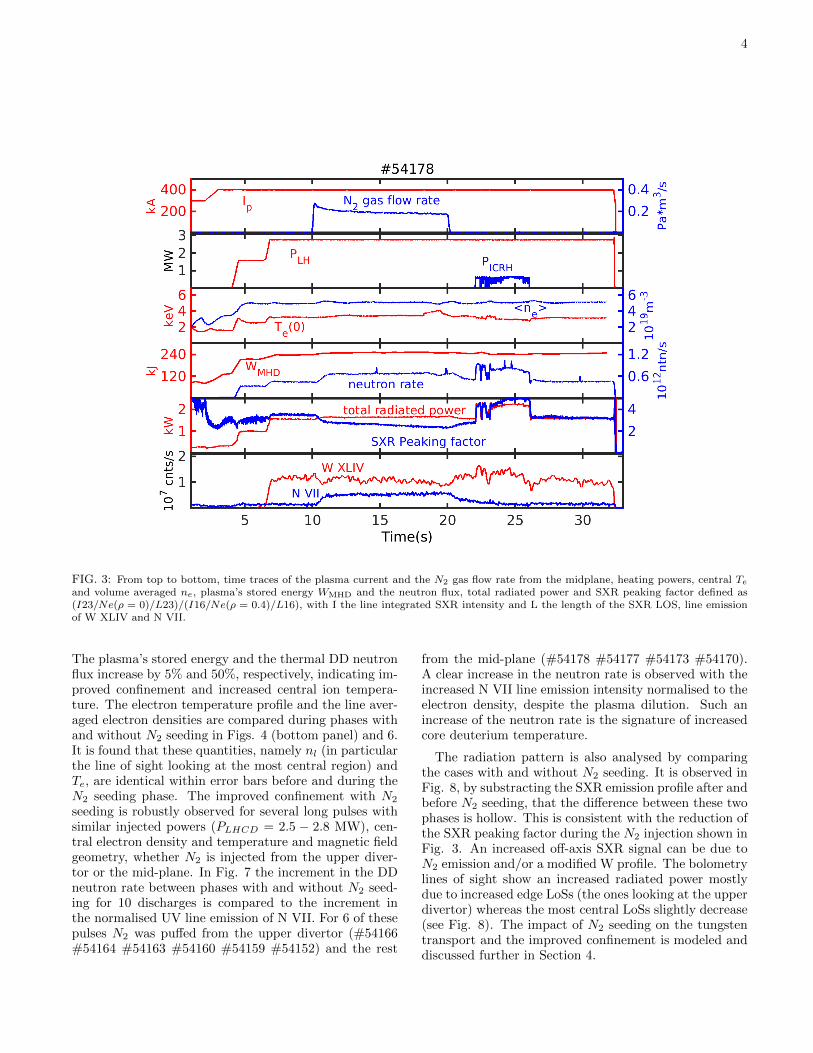
FIG. 3: From top to bottom, time traces of the plasma current and the N2 gas flow rate from the midplane, heating powers, central Teand volume averaged ne, plasma’s stored energy WMHD and the neutron flux, total radiated power and SXR peaking factor defined as(I23/Ne(ρ = 0)/L23)/(I16/Ne(ρ = 0.4)/L16), with I the line integrated SXR intensity and L the length of the SXR LOS, line emissionof W XLIV and N VII.
The plasma’s stored energy and the thermal DD neutronflux increase by 5% and 50%, respectively, indicating im-proved confinement and increased central ion tempera-ture. The electron temperature profile and the line aver-aged electron densities are compared during phases withand without N2 seeding in Figs. 4 (bottom panel) and 6.It is found that these quantities, namely nl (in particularthe line of sight looking at the most central region) andTe, are identical within error bars before and during theN2 seeding phase. The improved confinement with N2
seeding is robustly observed for several long pulses withsimilar injected powers (PLHCD = 2.5 − 2.8 MW), cen-tral electron density and temperature and magnetic fieldgeometry, whether N2 is injected from the upper diver-tor or the mid-plane. In Fig. 7 the increment in the DDneutron rate between phases with and without N2 seed-ing for 10 discharges is compared to the increment inthe normalised UV line emission of N VII. For 6 of thesepulses N2 was puffed from the upper divertor (#54166#54164 #54163 #54160 #54159 #54152) and the rest
from the mid-plane (#54178 #54177 #54173 #54170).A clear increase in the neutron rate is observed with theincreased N VII line emission intensity normalised to theelectron density, despite the plasma dilution. Such anincrease of the neutron rate is the signature of increasedcore deuterium temperature.
The radiation pattern is also analysed by comparingthe cases with and without N2 seeding. It is observed inFig. 8, by substracting the SXR emission profile after andbefore N2 seeding, that the difference between these twophases is hollow. This is consistent with the reduction ofthe SXR peaking factor during the N2 injection shown inFig. 3. An increased off-axis SXR signal can be due toN2 emission and/or a modified W profile. The bolometrylines of sight show an increased radiated power mostlydue to increased edge LoSs (the ones looking at the upperdivertor) whereas the most central LoSs slightly decrease(see Fig. 8). The impact of N2 seeding on the tungstentransport and the improved confinement is modeled anddiscussed further in Section 4.

5
0 0.5 1
r/a
0
2
4
6n
e (
10
19
m-3
)Interferometry inversion
Reflectometry
-0.4 -0.2 0 0.2 0.4
Z(m)
3
4
5
6
7
nl (
10
19
m-2
)
w/o N2 seeding (8 s)
w/ N2 seeding (15 s)
FIG. 4: (top panel) Inverted electron density profile from interfer-ometry (blue) compared to the measured electron density profilefrom reflectometry (red) at 8 s for discharge #54178. (bottompanel) Line integrated densities from interferometry for the phaseswith and without nitrogen seeding (phases at 8 and 15 s respec-tively) against the vertical coordinate Z given by the intersectionof the line of sights with the vertical axis at R = 2.5 m. Error barsare computed from variations within a 200 ms time window aroundthe stationnary phases at 8 and 15 s.
3. INTEGRATED MODELLING AND DATACONSISTENCY USING METIS
We perform interpretative integrated modelling usingMETIS [16] to compensate the lack of measurements in-herent to newly operating tokamaks as is the case forWEST. METIS is a fast integrated tokamak modellingtool combining 0D scaling laws for kinetic profiles with1D current diffusion modelling and 2D equilibria. Thesesimulations allow data consistency checks, such as cen-tral Ti consistent with the measured DD neutron rate.Here, the electron temperature and density profiles usedare fitted from ECE measurements and interferometryinversions (see Fig. 4 and 6).In the USN of WEST, Bremsstrahlung LoSs are pollutedby visible light reflections on the upper divertor. There-fore, the effective charge (Zeff) is deduced from the flux
FIG. 5: Reflectometry spectra (Welch with 1024 points averagedover 25 ms) at t=3.7s (Ohmic blue) and t=8s (LHCD phase red)
0 0.2 0.4 0.6 0.8
r/a
1000
2000
3000
4000
5000
Te
(e
V)
w/ N2 seeding
w/o N2 seeding
FIG. 6: Electron temperature profiles from ECE measurementswith and without nitrogen seeding (phases at 8 and 15 s respec-tively). Suprathermal electrons at r/a > 0.6 are observed duringthese LHCD heated phases.
consumption during the ohmic phase (up to 4 s). In thisphase, Zeff is adjusted until, using the Sauter resistivity[37], the reconstructed loop voltage matches the mea-sured one (see Fig. 9). With this method, Zeff is foundto be 2.8 on the current flat top before LHCD.
The density of light impurities C/O/N is simplifiedand only N is assumed to be present. Some Cu is alsoknown to be present in the discharge thanks to the UVmeasurements [38] which are not calibrated. Hence, aratio nCu/nN = 0.04 is assumed. The amount of W(density profiles chosen to have the same shape as ne) isadjusted to match the total radiated power. In METIS,radiated power and charge states of W increase self-consistently with the Te profile using ionisation and re-combination rates from ADAS data (no transport is as-sumed). The radiated power from line emission and ther-mal Bremsstrahlung are computed from the cooling rates.

6
6 8 10 12
Normalised Increased N VII 105
0.5
1
1.5
2
2.5
3In
cre
ased N
eutr
on flu
x (
ntn
/s)
1011
Upper DivertorMidplane
FIG. 7: Increment in the DD neutron rate between phases withand without N2 seeding versus increased line emission intensity ofN VII normalized to the electron density. N2 seeded from the upperdivertor/midplane are shown in blue/red.
-0.5 0 0.5
Z (m)
0
50
100
150
200
250
SX
R in
ten
sity (
W/m
2)
S2 = w/ N2 seeding
S1 = w/o N2 seeding
S2-S1(a)
0 5 10 15
Chords
0
0.05
0.1
0.15
0.2
Pra
d (
MW
)
w/o N2 seeding
w/ N2 seeding
(b)
FIG. 8: (a) The horizontal line integrated SXR emission and (b)radiated power for each chords of the two bolometric cameras.Chord 1 starts below the midplane, close to the lower divertor andchord 16 is the furthest view above the midplane, cf Fig. 2.
0 10 20 30
Time (s)
0
0.5
1
1.5
Vlo
op
(V
)
Magnetics
METIS
FIG. 9: Time trace of the loop voltage measured by the magneticscompared to the modelled loop voltage of the METIS interpretativerun for the pulse #54178
0 10 20 30 40
Time (s)
0
0.5
1
1.5
2
2.5
Pra
d (
W)
106
Bolometers
METIS
FIG. 10: Radiated power measured by the bolometer vs themodelled radiated power from the interpretative METIS run for#54178.
As illustrated in Fig. 10, the W concentration is adjustedduring LHCD and LHCD+ICRH phases in order for theMETIS reconstructed radiated power to match the mea-sured bolometer value. This leads to nW /ne = 1.1×10⁻⁴
per MW of LHCD and 2×10⁻⁴ per MW of ICRH power.The H concentration is measured using the Hα/(Hα +
Dα) ratio from the visible spectroscopy diagnostic [21].We take nH/(nH + nD) = 0.1. The shape of the iontemperature profile is taken to follow the square root ofthe electron pressure and is scaled with the measured DDneutron rate as illustrated by Fig. 11, yielding Te/Ti ∼2 in the plasma core (r/a = 0.5). The assumption wemake with regards to the profile shape will be furtherdiscussed, as it is particularly important for the powerbalance analysis.
The thermal energy content based on the ion and elec-tron density and temperature profiles is compared to theenergy content obtained by magnetic reconstruction; we

7
0 10 20 30 40
Time (s)
0
5
10
15n
eu
tro
n r
ate
(s
-1)
1011
METIS
Neutron detector
FIG. 11: DD neutron rate as measured vs modelled from theMETIS interpretative run for #54178.
0 10 20 30 40
Time (s)
0
0.5
1
1.5
2
2.5
W (
J)
105
WMHD
Wth
METIS
FIG. 12: Energy content estimated from the NICE equilibriumreconstruction and the modelled interpretative METIS thermal en-ergy content for #54178.
use NICE [39] to perform the construction based on bothmagnetic measurements and the polarimetry chords. Asillustrated on Fig. 12, METIS reconstructed thermal en-ergy content agrees within 20% with the NICE WMHD.
Modelling work of the LHCD power deposition is on-going using C3PO-LUKE [40], and thus is not availablefor this discharge. The difficulty in reproducing the cen-trally peaked Hard X-Ray measured profile and the mea-sured plasma current is likely due to the presence of heavyW ions. The modelled current varies from 300 when weassume fully ionised W ions to 400 kA when using ADASfor W ionization states. The truth lies somewhere in be-tween these two extremes as electrons of 10keV or 100keVwill not be impacted by the same ionization state of W.This phenomenon is presently under study. Meanwhile,a slightly off-axis LHCD power deposition has been as-sumed, at ρ = 0.2, with a Gaussian width of 0.3 and acurrent drive efficiency of 5× 10¹⁸ A/W/m2.
In the following, we describe a METIS interpretative
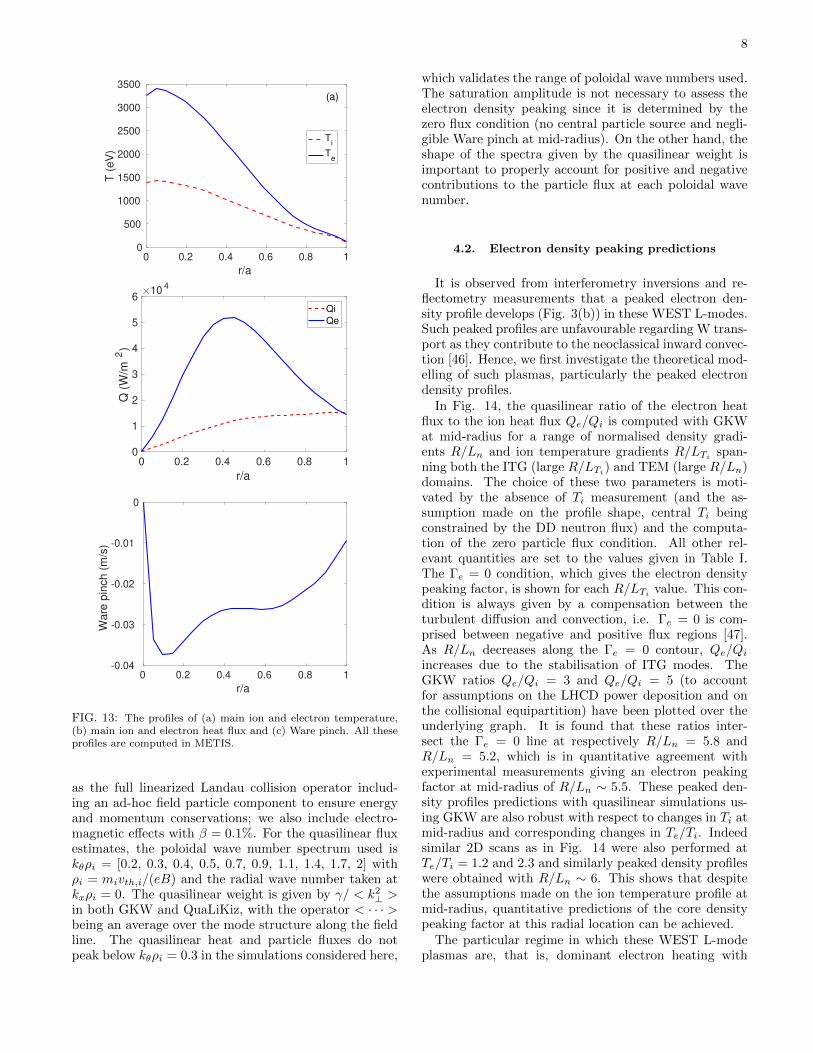
run at 8 s during the LHCD heating phase and prior tothe N2 seeding; this serves as input for the microstabilityand neoclassical modelling presented in the next Section.In Fig. 13 the ion and electron temperature profiles areplotted together with the electron and ion heat fluxesprofiles while taking into account the power depositionfrom LHCD, the ohmic power, the collisional equiparti-tion and the radiated power. We find the Ware pinch(also shown) to be negligible for density peaking predic-tions at mid-radius and important in the central radialdomain r/a < 0.3.
It is to be noted that the ratio Qe/Qi at mid-radius issensitive to the Ti profile since the only source for the ionheat flux is the collisional equipartition. Since Ti is notmeasured, we have tested several shapes (proportional tone or Te) of the ion temperature profiles while keeping thecentral value to match the measured neutron flux. Theresulting values of Qe/Qi lie between 3 and 4. Thus,despite the lack of Ti measurements, Qe/Qi is expectedto be large at mid-radius.
Important parameters for the following analysis atmid-radius are summarized in Table I.
r/a R/LTe Te/Ti s q Zeff ν∗ Qe(kW/m2) Qi(kW/m2)
0.5 15 1.8 0.9 1.7 2.8 0.5 50 13
TABLE I: Parameters for #54178 at mid-radius taken at 8 s.
4. THEORETICAL MODELLING
The turbulent transport is modelled using the gyroki-netic code GKW [1] and results are compared to Qua-LiKiz [15] due to its fast computation capabilities androbustness with respect to integrated modelling resultsin JETTO for JET plasmas [41–43]. The analysis is car-ried out at 8 s in the LHCD heating only phase. In theseTEM dominated plasmas, characterised by large Te/Tiand Qe/Qi (see Table I and density fluctuation measure-ments in Fig. 5), the limitations of QuaLiKiz due to theassumed fluid eigenfunctions [44] and the reduced col-lision operator are studied. We investigate the electronparticle transport as well as W transport, then we discussthe impact of N2 seeding on confinement.
4.1. Simulation setup
For the neoclassical transport, the code NEO is usedwith 5 Laguerre and 17 Legendre polynomials togetherwith the full Fokker-Planck collision operator. For theturbulent transport, GKW results were not used tobenchmark the results of QuaLiKiz but to provide morerealistic simulations. For instance, in GKW we use theMiller geometry [45] instead of the s−α geometry as well
8
0 0.2 0.4 0.6 0.8 1
r/a
0
500
1000
1500
2000
2500
3000
3500
T (
eV
)
Ti
Te
(a)
0 0.2 0.4 0.6 0.8 1
r/a
0
1
2
3
4
5
6
Q (
W/m
2)
104
Qi
Qe
0 0.2 0.4 0.6 0.8 1
r/a
-0.04
-0.03
-0.02
-0.01
0
Wa
re p
inch
(m
/s)
FIG. 13: The profiles of (a) main ion and electron temperature,(b) main ion and electron heat flux and (c) Ware pinch. All theseprofiles are computed in METIS.
as the full linearized Landau collision operator includ-ing an ad-hoc field particle component to ensure energyand momentum conservations; we also include electro-magnetic effects with β = 0.1%. For the quasilinear fluxestimates, the poloidal wave number spectrum used iskθρi = [0.2, 0.3, 0.4, 0.5, 0.7, 0.9, 1.1, 1.4, 1.7, 2] withρi = mivth,i/(eB) and the radial wave number taken atkxρi = 0. The quasilinear weight is given by γ/ < k2
⊥ >in both GKW and QuaLiKiz, with the operator < · · · >being an average over the mode structure along the fieldline. The quasilinear heat and particle fluxes do notpeak below kθρi = 0.3 in the simulations considered here,
which validates the range of poloidal wave numbers used.The saturation amplitude is not necessary to assess theelectron density peaking since it is determined by thezero flux condition (no central particle source and negli-gible Ware pinch at mid-radius). On the other hand, theshape of the spectra given by the quasilinear weight isimportant to properly account for positive and negativecontributions to the particle flux at each poloidal wavenumber.
4.2. Electron density peaking predictions
It is observed from interferometry inversions and re-flectometry measurements that a peaked electron den-sity profile develops (Fig. 3(b)) in these WEST L-modes.Such peaked profiles are unfavourable regarding W trans-port as they contribute to the neoclassical inward convec-tion [46]. Hence, we first investigate the theoretical mod-elling of such plasmas, particularly the peaked electrondensity profiles.
In Fig. 14, the quasilinear ratio of the electron heatflux to the ion heat flux Qe/Qi is computed with GKWat mid-radius for a range of normalised density gradi-ents R/Ln and ion temperature gradients R/LTi span-ning both the ITG (large R/LTi
) and TEM (large R/Ln)domains. The choice of these two parameters is moti-vated by the absence of Ti measurement (and the as-sumption made on the profile shape, central Ti beingconstrained by the DD neutron flux) and the computa-tion of the zero particle flux condition. All other rel-evant quantities are set to the values given in Table I.The Γe = 0 condition, which gives the electron densitypeaking factor, is shown for each R/LTi
value. This con-dition is always given by a compensation between theturbulent diffusion and convection, i.e. Γe = 0 is com-prised between negative and positive flux regions [47].As R/Ln decreases along the Γe = 0 contour, Qe/Qiincreases due to the stabilisation of ITG modes. TheGKW ratios Qe/Qi = 3 and Qe/Qi = 5 (to accountfor assumptions on the LHCD power deposition and onthe collisional equipartition) have been plotted over theunderlying graph. It is found that these ratios inter-sect the Γe = 0 line at respectively R/Ln = 5.8 andR/Ln = 5.2, which is in quantitative agreement withexperimental measurements giving an electron peakingfactor at mid-radius of R/Ln ∼ 5.5. These peaked den-sity profiles predictions with quasilinear simulations us-ing GKW are also robust with respect to changes in Ti atmid-radius and corresponding changes in Te/Ti. Indeedsimilar 2D scans as in Fig. 14 were also performed atTe/Ti = 1.2 and 2.3 and similarly peaked density profileswere obtained with R/Ln ∼ 6. This shows that despitethe assumptions made on the ion temperature profile atmid-radius, quantitative predictions of the core densitypeaking factor at this radial location can be achieved.
The particular regime in which these WEST L-modeplasmas are, that is, dominant electron heating with

9
Qe/Q
i=3
Qe/Q
i=5
e=0
2 3 4 5 6
R/Ln
0
2
4
6
8
10
12R
/LT
i
100
101
102
Qe/Q
i
FIG. 14: Quasilinear Qe/Qi computed from GKW. The Γe = 0condition (white line) and the Qe/Qi = 3− 5 (black lines) are alsoshown. Intersections of these conditions are underlined with blackrectangles.
Te/Ti ∼ 2 and electron-electron collisionalities of the or-der of νeea/vth,i = 0.06 at mid-radius, can be difficult forreduced models due to the combination of strong TEMturbulence and collisional stabilisation. In Fig. 15 (toppanel) the Γe = 0 conditions are compared between pre-vious results obtained with GKW and simulations per-formed with QuaLiKiz. In contrast to GKW where tur-bulence is found on the whole (R/LTi
, R/Ln) domain,stable regions are found in QuaLiKiz for R/LTi
< 5 andR/Ln < 5. This yields two regimes regarding Γe = 0, oneat R/LTi
> 5, where turbulent convection compensatesturbulent diffusion but gives reduced electron peakingfactors (R/Ln ∼ 2) compared to GKW (R/Ln ∼ 5) andone regime at R/LTi < 5 where the electron peaking isgiven by a threshold for the trapped electron mode tur-bulence destabilised by R/Ln. This threshold results inlarge peaking factors 4 < R/Ln < 6 due to strong col-lisional stabilisation of the ∇Te driven TEM. In bothregimes, large discrepancies exist between GKW andQuaLiKiz predictions of the density peaking at Γe = 0.Additionally, the ratios Qe/Qi = 3 − 5 in QuaLiKiz areobtained for larger R/Ln and there are no overlappingbetween Γe = 0 and Qe/Qi = 3−5 conditions. These re-sults do not depend only on R/LTi
and R/Ln and severalkey parameters have been tested such as R/LTe
, Te/Ti,νei, s, q. No combinations of these inputs could recon-cile the two conditions for the particle flux and the heatfluxes ratio computed with QuaLiKiz. A very strong de-
GKW
QuaLiKiz
Q e/Q i
=3
Qe/Q
i=5Stable
2 3 4 5 6
R/Ln
0
2
4
6
8
10
12
R/L
Ti
0
0.5
1
1.5
2
2.5
e (
m-2
s-1
)
1020
0 1 2 3 4 5
R/Ln
0
1
2
3
4
5
6R
/LT
i
0
0.02
0.04
0.06
0.08
0.1
e R
/ (
ne
*2 v
th,i
)
FIG. 15: Comparison of the Γe = 0 condition between GKW(solide lines) and QuaLiKiz (dashed lines) for the nominal case(top panel) and the simpler case R/LTe = 0 and νe,i = 0 (bottompanel).
pendence of the turbulent fluxes was found with the col-lisionality, resulting in overstabilisation of the trappedelectron modes destabilised by R/LTe
which is not thecase in GKW and thus explaining the absence of stableregions in Fig. 14.
This discrepancy between QuaLiKiz and GKW is spe-cific to the TEM dominant condition of the plasmas anal-ysed. Indeed, if we zero R/LTe
and νe,i, we recover agood agreement between the codes as illustrated in Fig.15 bottom panel. It is worth mentioning that, withoutR/LTe
driven turbulence, the electron peaking factor is

10
FIG. 16: Ratios of the electron and total heat fluxes computedfrom GKW. These are compared to results obtained from powerbalance analysis in the transport code METIS. Inside r/a = 0.3,linear modes are stable.
given by a transition from a stable and an unstable regionin both codes.
From now on, turbulent transport will be modelledwith GKW. Nevertheless, it has to be emphasised thatsuch gyrokinetic codes cannot be routinely used in fluxdriven integrated modelling due to time consuming sim-ulations. First principle based reduced models such asQuaLiKiz are, on the other hand, particularly suited forsuch endeavors and thus are currently being further val-idated/developed (in particular regarding the collisionoperator) for plasma scenario predictions in these TEMdominated regimes [48].
4.3. Tungsten transport modelling
Compared to the previous Section where we spanneda large range of R/LTi
and R/Ln, we compute the tung-sten transport from the experimental (Te, ne) and recon-structed profiles (e.g. Ti) with their corresponding gra-dients (gradient driven approach) on the radial domainr/a = 0.1− 0.8. As a consistency check, the ratio of theelectron heat flux over the total heat flux is comparedbetween GKW and the power balance analysis from thetransport code METIS (Fig. 16).
From r/a = 0.4 to r/a = 0.8, a dominant electron heatflux ratio is qualitatively reproduced in the modelling.Inside r/a = 0.2 linear modes are found stable. We notethat in this region, micro-tearing modes, which can drivelarge electron heat fluxes [49], are linearly marginally sta-ble. GKW flux ratios decrease towards the magnetic axis,unlike the experimentally inferred fluxes. This can beattributed to missing MHD transport such as sawteeth(experimentally observed) in GKW modelling but alsoto the assumed LHCD power deposition profile. Asider/a = 0.3, dominant TEM turbulence is found in thesimulations yielding realistic ratios of Qe/Qtot > 0.5 forr/a above 0.3. Observation of quasi-coherent modes from
r/a = 0.26 to r/a = 0.45 also supports the prediction ofTEM instabilities.
We now analyse tungsten transport with these condi-tions. To account for neoclassical tungsten transport, theturbulent amplitude from GKW has been normalised us-ing the turbulent ion heat flux from power balance anal-ysis (as in e.g. [50, 51]). The total tungsten flux can thenbe expressed as:
ΓW = ΓW,NEO + ΓW,GKWQi,an
Qi,GKW
with the subscript ’an’ denoting the anomalous trans-port computed from the power balance ion heat fluxQi,an = Qi,PB−Qi,NEO. For a stationnary phase, withouttungsten sources inside r/a = 0.8, the resulting tungstenpeaking factor can be computed with:
R/LnW= −R VNEO/Qi,an + VGKW/Qi,GKW
DNEO/Qi,an +DGKW/Qi,GKW(1)
In the top panel of Fig. 17 the different transport coef-ficients from Eq. 1 are summarised with no toroidal ro-tation velocity Vφ = 0 km/s. In the radial domain whereturbulence is linearly destabilised (0.3 ≤ r/a ≤ 0.8), theneoclassical tungsten convection and diffusion coefficientsare 3 orders of magnitude lower than the correspondingturbulent coefficients. For r/a < 0.3, linear turbulence isstable and thus neoclassical transport of tungsten, even-though relatively small, is the dominant transport mech-anism.
In the bottom panel of Fig. 17, the resulting tungstenpeaking factor (normalised density gradient for ΓW = 0)can be separated into two regimes. Inside 0.3 ≤ r/a ≤0.8, the tungsten peaking factor is defined solely by tur-bulent transport coefficients (neoclassical couterparts arenegligible) and remains below the electron density peak-ing. Turbulent diffusion tends to flatten the W profiles re-sulting in a peaking factor of ∼ 2 at mid-radius comparedto an electron peaking factor of ∼ 5.5. Below r/a < 0.3,neoclassical transport determines the W peaking factorresulting in larger values compared to R/Lne
. Never-theless, neoclassical peaking of R/LnW
remains at valuesmuch lower than what is encountered in tungsten accu-mulation scenarios (e.g. [4]).
The impact of toroidal rotation on central neoclassicaltungsten transport is key to explaining large neoclassi-cal convections and the resulting accumulation [4, 12].In this context the same simulations as in Fig. 17 havebeen performed including a toroidal rotation profile witha central value of the toroidal velocity Vφ(r/a = 0) = 150km/s, decreasing to 0 at r/a = 1. These profiles havebeen included for both neoclassical and turbulent trans-port and the results are gathered in Fig. 18 (top panel).With toroidal rotation, neoclassical convection is in-creased and is now up to one order of magnitude largerthan the rescaled turbulent convection. Neoclassical dif-fusion, on the other hand, remains lower than the turbu-lent diffusion but only 1 order of magnitude instead of 3

11
0 0.2 0.4 0.6 0.8
r/a
10-4
10-3
10-2
10-1
100
101
V,D
(m
/s,m
2/s
)
DGKW
(Qi,an
/Qi,GKW
)
DNEO
VNEO
VGKW
(Qi,an
/Qi,GKW
)
V = 0 km/s
0 0.2 0.4 0.6 0.8
r/a
0
1
2
3
4
5
6
7
8
R/L
n
e-
W
TurbulentNeocl.
FIG. 17: Turbulent vs neoclassical transport coefficients (toppanel) using the scaling factor as discussed in the text. The re-sulting tungsten peaking factor is shown in the bottom panel.
as in Fig. 17. Additionally, it can be noted that the neo-classical diffusion increases as r/a decreases which comesfrom the peaked toroidal rotation profile used. Finally,in Fig. 18, the turbulent convection is decreased com-pared to the case without toroidal rotation due to theadditional roto-diffusion mechanism with centrifugal ef-fects [52]. Even in the absence of torque generated byNBI heating systems, intrinsic rotation can be substan-tial. To include such levels of rotation in the analysis(not measured in this discharge), an additional case witha central toroidal rotation of 20 km/s has been added.This value is based on previous measurements performedon the Tore Supra tokamak in ohmic [53, 54] and LHCDheated phases [55]. The resulting tungsten peaking fac-tor for the two chosen levels of rotation is now larger(Fig. 18 bottom panel) in the whole radial domain butmore substantially inside r/a < 0.3 due to stable turbu-lence and dominant neoclassical transport. This increaseof R/LnW
is due to the neoclassical convection increasingwith toroidal rotation. In the case of central Vφ = 150km/s, similar values of R/LnW
as observed in tungstenaccumulation phases at AUG, (e.g. [5]) or JET (e.g. [4])are found. For the intrinsic rotation case, a more modestincrease in R/LnW
is found (a factor 5 lower than for
0 0.2 0.4 0.6 0.8
r/a
10-2
10-1
100
101
V,D
(m
/s,m
2/s
)
DGKW
(Qi,an
/Qi,GKW
)
DNEO
VNEO
VGKW
(Qi,an
/Qi,GKW
)
V (r/a=0) =
150 km/s
0 0.2 0.4 0.6 0.8
r/a
0
20
40
60
80
100
120
R/L
nW
V (r/a=0) = 0 km/s
V (r/a=0) = 20 km/s
V (r/a=0) = 150 km/s
FIG. 18: Same as Fig. 17 including now a toroidal rotation profile.The resulting R/LnW is also shown for different levels of centraltoroidal rotation velocities (these values are discussed in the text).
Vφ(r/a = 0) = 150 km/s) but still noticeable. In theturbulence dominated radial domain 0.3 ≤ r/a ≤ 0.8,the increased neoclassical convection is tempered by theturbulent diffusion. Nevertheless, W peaking factors inthis domain are larger than for a pure turbulent case.
In this WEST plasma the observed absence of W ac-cumulation can be theoretically explained by the ab-sence/reduced level of toroidal rotation and the largeturbulent diffusion allowing for low W neoclassical trans-port inside r/a = 0.3 and leading to a dominant turbu-lent transport for r/a > 0.3 as is also the case in Alca-tor C-Mod ICRH heated H-mode plasmas [13]. Even forthe peaked density profiles found in these WEST L-modeplasmas (which should drive unfavourable W convection)compared to the flat profiles found in [13], one of the mainparameters for central tungsten accumulation is the cen-tral toroidal velocity. In our fixed gradients approach,the role of the central particle source due to NBI heatingsystems is not considered and could also have a significantimpact [14, 42]. Overall, the resulting W density gradi-ent lengths are lower/comparable to the electron densitygradient lengths accross most of the plasma core.

12
e =
0
Q e/Q i
=3
2 3 4 5 6
R/Ln
0
2
4
6
8
10
12
R/L
Ti
-0.08
-0.06
-0.04
-0.02
0
0.02
0.04
0.06
0.08
FIG. 19: The normalised electron flux computed from GKW (Γe =0 condition in white) is compared for a pure plasma (solid lines)and for a contaminated plasma including nitrogen (nN/ne = 0.02),copper and tungsten (dashed lines). The latter two impurities al-most behave as traces due to low concentrations (nz/ne ∼ 10−4).Contours correspond to the pure plasma case.
4.4. N2 impact on stability and W transport
As analysed in Section 2, it can be seen that the ni-trogen seeding improves the plasma confinement and theneutron flux. To study this behaviour, simulations inthe 2D domain (R/LTi
, R/Ln) of Fig. 14 are performedfor a pure plasma (no impurities) at mid-radius and for aplasma including N2 to a concentration of nN/ne = 0.02.On Fig. 19 such results are compared and the Γe = 0and Qe/Qi = 3 conditions are emphasised. It is foundthat, with N2, Γe = 0 and Qe/Qi = 3 are simultaneouslyachieved for larger R/LTi values; this is in qualitativeagreement with the increased DD neutron rate measuredin the experiment. The electron peaking factor matchingboth Γe = 0 and Qe/Qi = 3 is not particularly affected,increasing from 5.2 for the pure plasma to 5.8 with nitro-gen. This is consistent with the minor impact observedon the experimental electron density profiles during ni-trogen seeding phases.
To further investigate the shift observed in R/LTi
found in Fig. 19, a scan in the nitrogen concentrationonly, i.e. while keeping all the other input parametersfixed, has been performed starting from profiles of the8 s phase (without nitrogen seeding). The quasilinearheat flux ratios Qe/Qtot at mid-radius are then plotted inFig. 20. It is observed that with increasing nitrogen con-centrations, the electron heat flux becomes increasinglydominant over the ion heat flux (sum over the main ionsand nitrogen). This is consistent with the stabilisationof ITG modes.
The normalised frequencies for the most unstable lin-
0 0.01 0.02 0.03 0.04
nN
/ne
0.6
0.7
0.8
Qe/(
Qe+
Qi)
8 s phase
15 s phase
FIG. 20: Predicted ratio of the electron heat flux to the total heatflux (electrons, deuterium, nitrogen) at r/a = 0.5 with increasingnitrogen concentrations up to levels from the nitrogen seeding phaseat 15 s.
ear modes are plotted (Fig. 21) for the wave numberrange kθρi = 0.2 − 1.5 at increasing nitrogen concen-trations. Negative/positive frequencies correspond tothe direction of the electron/ion diamagnetic drifts andare characteristic of TEM/ITG modes. With increasingnN/ne, the transition between the TEM and ITG modesis pushed to larger wave numbers, hence contributing lessto the radial transport. This clearly shows that ITGs arestabilised compared to TEMs modes, mostly from mainion dilution, resulting in higher Qe/Qtot. For a fixed ionheat flux Qi, a larger R/LTi is needed, leading to bet-ter confinement and an increased Ti (consistent with theobserved increased neutron flux during nitrogen seedingphases at WEST). This stabilisation of turbulence andin particular of the ITG has been largely documented inprevious theoretical (e.g. [56, 57]) and experimental stud-ies (e.g. [58]). It is to be noted that in our approach, wedid not considered the E ×B shearing (no toroidal rota-tion profile) which could also play an increased role withreduced momentum transport in the N2 seeding phase.
In Fig. 3, it was shown that the central W peakingfactor, computed from SXR line intensities [59], is re-duced during the nitrogen seeding phase. Thus, R/LnW
is computed for the two radial positions r/a = 0.5and r/a = 0.1 where turbulent and neoclassical trans-port dominate respectively. Fig. 22 shows the tungstenpeaking factor against the nitrogen concentrations. Atr/a = 0.5, the turbulent R/LnW
is not significantly af-fected for the discussed range of nN/ne. In contrast,R/LnW
from neoclassical transport first decreases (in-creasing neoclassical diffusion) and then increases (in-creasing neoclassical convection) with nN/ne. Finally,the total R/LnW
as computed using Eq. 1 is dominatedby turbulent transport and thus is not changed with thefraction of nitrogen content. At r/a = 0.1, neoclassicaldiffusion increases, with little increase of the convectionresulting in a decrease of the tungsten peaking factor.This is in qualitative agreement with observations dis-

13
0 0.5 1 1.5
k i
-1
-0.5
0
0.5
1
1.5
2
R/v
th
TEM
ITGnN
/ne=0
nN
/ne=0.01
nN
/ne=0.02
nN
/ne=0.03
nN
/ne=0.04
FIG. 21: Normalised linear mode frequency spectra with increas-ing nitrogen fractions at r/a = 0.5. Negative values correspond tothe electron diamagnetic drift direction.
cussed in Section 2 and can be explained from neoclas-sical transport only, with increasing nitrogen concentra-tions.
5. CONCLUSIONS
Long pulse dicharges were obtained in the third ex-perimental campaign of the WEST tokamak in a robustand reproducible way. It is observed that tungsten doesnot centrally accumulate in such discharges eventhoughthe electron density peaking from these L-mode plas-mas are relatively large (R/Ln ∼ 5.5 at mid-radius).In the core of the WEST plasmas with dominant radiofrequency electron heating, reflectometry measurementsfeature quasi-coherent modes, signature of trapped elec-tron mode turbulence. Improved confinement is also ob-served during nitrogen seeding phases where the neutronflux increases with the nitrogen content. The absence ofW accumulation in radio-frequency heated plasmas is notnew and it was also observed in Alcator C-Mod H-modeplasmas [13] with ICRH heating only. However, the den-sity profiles in these plasmas are flat which reduces theunfavourable inward neoclassical convection of W.
To explain the features observed in these WEST longpulse L-mode plasmas, extensive neoclassical and tur-bulent simulations have been performed with the codesNEO and GKW/QuaLiKiz respectively. A particular ef-fort has also been made with regards to the input datafor such gradient driven codes. Indeed, interpretativeintegrated modelling simulations have been performedwith METIS to keep a reasonable level of consistencybetween available measurements and assumptions (e.g.on the Ti profiles). WEST operates in dominant elec-tron heating (Qe/Qi > 3 at mid-radius), where TEMare the dominant unstable modes. For this turbulenceregime, comparing quasilinear turbulent transport withQuaLiKiz and GKW yielded strong disagreement. In-
0 0.01 0.02 0.03 0.04
nN
/ne
0
2
4
6
8
R/L
n
R/Ln
W
(NEO)
R/Ln
W
(GKW+NEO)
R/Ln
e
(EXP)
r/a = 0.5
0 0.01 0.02 0.03 0.04
nN
/ne
0
2
4
6
8
R/L
n
R/Ln
W
(NEO)
R/Ln
e
(EXP)
r/a = 0.1
FIG. 22: Tungsten peaking factor including neoclassical and tur-bulent transport for increasing fraction of nitrogen at r/a = 0.5(top panel). The purely neoclassical peaking factor has been alsocomputed at r/a = 0.1 (bottom panel) for increasing nN/ne whereturbulence is completely stabilised in the modelling.
deed, a reduced collision operator as well as the fluidlimit for the eigenfunctions are used in QuaLiKiz whichoverstabilise R/LTe
driven TEM. This results in discrep-ancies with GKW results and experimental observationsregarding the electron density peaking and the heat fluxratio Qe/Qi. This clearly shows that in regimes withdominant electron heating and non-negligible collisionaleffect, results obtained from reduced models (in particu-lar for integrated modelling) should be treated with cau-tion. Additional development is undergoing for the Qua-LiKiz collision operator to improve predictions in suchregimes.
The electron density peaking deduced from GKW sim-ulations and interferometry inversions are in quantitativeagreement. The large values of R/Lne
are obtained inregimes where TEM turbulence is dominant, which isconsistent with observations made at the ASDEX Up-grade tokamak [60]. In this condition, neoclassical con-vection of tungsten is negligible for 0.3 ≤ r/a ≤ 0.8due to large turbulent diffusion, resulting in marginallypeaked predicted W profiles. For r/a < 0.3 where tur-bulence is completely stabilised and neoclassical trans-

14
port dominates, the resulting tungsten peaking factor(R/LnW
at the zero particle flux ΓW = 0) stays below4. This is due to the absence of significant toroidal ro-tation in such plasmas, which reduces the unfavourableneoclassical W convection which is in contrast producedby centrifugal effects when NBI heating is used in AUGand JET. The observation of steady core radiated powerduring these long pulses are consistent with strong turbu-lent diffusion and reduced neoclassical tungsten convec-tion, preventing W to accumulate, a result also found in[13]. Finally, the observed improved confinement duringnitrogen seeding phases was investigated. As in previousworks [56, 57], it is found from linear gyrokinetic sim-ulations (GKW) that the linear ITG modes are mainlystabilised from dilution yielding higher R/LTi
to match
the heat flux ratio Qe/Qi; this could explain the observedincrease in core confinement.
Acknowledgments
This work was supported by the program of ChinaScholarships Council, the National Natural Science Foun-dation of China (Grant Nos. 11775269, 11905146), theNational Key Research and Development Program ofChina (No. 2018YFE0311100), and Users with Ex-cellence Program of Hefei Science Center CAS (No.2019HSC-UE014).
[1] A. G. Peeters, Y. Camenen, F. J. Casson, W. A. Hornsby,A. P. Snodin, D. Strintzi, G. Szepezi, Computer PhysicsCommnunications 180, 2650 (2009)
[2] E. Belli and J. Candy, Plasma Physics and ControlledFusion 50, 095010 (2008)
[3] E. Belli and J. Candy, Plasma Physics and ControlledFusion 54, 015015 (2012)
[4] C. Angioni et al, Nuclear Fusion 54, 083028 (2014)[5] T. Odstrcil et al, Plasma Physics and Controlled Fusion
60, 014003 (2018)[6] J. Bucalossi et al, Fusion Engineering and Design 89, 907
(2014)[7] C. Bourdelle et al, Nuclear Fusion 55, 063017 (2015)[8] M. Richou et al, Fusion Engineering and Design 98-99,
1394-1398 (2015)[9] T. Dittmar et al, to be published in Physica Scripta
[10] C. Angioni et al, Physics of Plasmas 22, 055902 (2015)[11] F. Casson et al, Plasma Physics and Controlled Fusion
57, 014031 (2015)[12] C. Angioni and P. Helander, Plasma Physics and Con-
trolled Fusion 56, 124001 (2014)[13] A. Loarte et al, Physics of Plasmas 22, 056117 (2015)[14] F. J. Casson et al, Nuclear Fusion, Accepted for publica-
tion (2020)[15] C. Bourdelle et al, Plasma Physics and Controlled Fusion
58, 014036 (2016)[16] J. F. Artaud, Nuclear Fusion 58, 105001 (2018)[17] J. Bucalossi et al, Symposium on Fusion Engineering
(2019)[18] M. Missirlian et al, Fusion Engineering and Design 89,
1048-1053 (2014)[19] J. Bucalossi et al, Plasma Facing Materials Conference
(2019)[20] M. Goniche et al, Radiofrequency power in Plasmas Con-
ference (2019)[21] O. Meyer et al, Review of Scientific Instruments 87,
11E309 (2016)[22] C. Gil et al, Fusion Engineering and Design 140, 81
(2019)[23] L. Colas et al, Radiofrequency power in Plasmas Confer-
ence (2019)[24] J. L. Segui et al, Review of Scientific Instruments 76,
123501 (2005)
[25] R. J. Groebner et al, Nuclear Fusion 41, 1789 (2001)[26] R. Sabot et al, Nuclear Fusion 46, S685 (2006)[27] A. Kramer-Flecken et al, Nuclear Fusion 44, 1143 (2004)[28] Y. Sun et al, Review of Scientific Instruments 89, 073504
(2018)[29] V. A. Vershkov et al, Nuclear Fusion 45, S203 (2005)[30] H. Arnichand et al, Nuclear Fusion 54, 123017 (2014)[31] H. Arnichand et al, Plasma Physics and Controlled Fu-
sion 58, 014037 (2016)[32] M. Osakabe et al, Plasma Physics and Controlled Fusion
56, 095011 (2014)[33] R. R. Weynants et al, Nuclear Fusion 39, 1637 (1999)[34] G. L. Jackson et al, Nuclear Fusion 42, 28 (2002)[35] J. Schweinzer et al, Nuclear Fusion 51, 113008 (2011)[36] H. Urano et al, Nuclear Fusion 55, 03310 (2015)[37] O. Sauter et al, Physics of Plasmas 6, 2834 (1999)[38] C. Desgranges, EPS (2018)[39] B. Faugeras et al, Nuclear Fusion 58, 106032 (2018)[40] Y. Peysson and J. Decker Physics of Plasmas 15, 092509
(2008)[41] J. Citrin et al, Plasma Physics and Controlled Fusion 59,
124005 (2017)[42] S. Breton et al, Nuclear Fusion 58, 096003 (2018)[43] F. Casson et al, to be submitted (2019)[44] P. Cottier et al, Plasma Physics and Controlled Fusion
56, 015011 (2014)[45] R. L. Miller, M. S. Chu, J. M. Greene, Y. R. Lin-Liu and
R. E. Waltz, Physics of Plasmas 5, 973 (1998)[46] P. Helander and D. J. Sigmar, Collisional Transport in
Magnetised Plasmas[47] C. Angioni et al, Physics of Plasmas 16, 060702 (2009)[48] C. D. Stephens, private communications[49] H. Doerk et al, Physical Review Letters 106, 155003
(2011)[50] C. Angioni et al, Nuclear Fusion 51, 023006 (2011)[51] F. Casson et al, Nuclear Fusion 56, 063026 (2013)[52] Y. Camenen et al, Physics of Plasmas 16, 012503 (2009)[53] A. Romannikov et al, Nuclear Fusion 40, 319 (2000)[54] J. Bernardo et al, Plasma Physics and Controlled Fusion
57, 035002 (2015)[55] B. Chouli et al, Plasma Physics and Controlled Fusion
56, 095018 (2014)[56] M. Frojdh et al, Nuclear Fusion 32, 419 (1992)

15
[57] R. R. Dominguez and G. M. Staebler et al, Nuclear Fu-sion 33, 51 (1993)
[58] G. McKee et al, Physical Review Letters 84, 1922 (2000)[59] M. Sertoli et al, Journal of Plasma Physics 85, 905850504
(2019)[60] C. Angioni et al, Physics of Plasmas 12, 040701 (2005)