ALTERATION MINERAL ZONATION MAPPING IN WESTERN PART OF CUDDAPAH BASIN ALTERATION MINERAL ZONATION...
71
ALTERATION MINERAL ZONATION MAPPING IN WESTERN PART OF CUDDAPAH BASIN ALTERATION MINERAL ZONATION MAPPING IN WESTERN PART OF CUDDAPAH BASIN USING REMOTE SENSING TECHNIQUES M. DEEPAK KAVIARUSU, S. JAYSREE, A. RUPAK CHANDAR, S. SURJITH, G. YALINI Under the guidance of: Dr. N. Nagappan, Centre for Remote Sensing, Bharathidasan University, Trichy-620023.
Transcript of ALTERATION MINERAL ZONATION MAPPING IN WESTERN PART OF CUDDAPAH BASIN ALTERATION MINERAL ZONATION...

ALTERATION MINERAL ZONATION MAPPING IN WESTERN PART OF CUDDAPAH BASIN
ALTERATION MINERAL ZONATION MAPPING IN
WESTERN PART OF CUDDAPAH BASIN USING
REMOTE SENSING TECHNIQUES
M. DEEPAK KAVIARUSU, S. JAYSREE, A. RUPAK CHANDAR, S. SURJITH, G. YALINI
Under the guidance of: Dr. N. Nagappan, Centre for Remote Sensing,
Bharathidasan University, Trichy-620023.

ALTERATION MINERAL ZONATION MAPPING IN WESTERN PART OF CUDDAPAH BASIN
AKNOWLEDGEMENT
First and above all, we praise God, the almighty for providing us this opportunity
and granting us the capability to proceed successfully. This project appears in its current
form due to the assistance and guidance of several people. We would therefore like to
offer my sincere thanks to all of them.
We take immense pleasure in thanking Prof. Dr. C. J. Kumanan Head of Centre
for Remote Sensing (CRS), Dr. D. Ramesh Associate Professor, and all other members of
CRS family, Bharathidasan University for having permitted us to carry out this project
work.
We wish to express my deep sense of gratitude to our Guide Dr, N. Nagappan
Scientist, CRS for his able guidance and useful suggestions, which helped us in
completing the project work, in time.
We thank Dr. J. Saravanavel, Dr. C .Lakshmanan, Dr. K. Palanivel, Dr. S.
Gunasekaran, Dr. R. Sakthivel for helping us to carry out this project in a successful
manner.
We are greatly beholden to Mrs. D. Gayatri, Ms. A. Mary Vasanthakumari, and
Ms. Vasavi for their immense help during our study period.
And special thanks to our scholar Mr. N. Ramalingam for his timely help and
patients in supporting us to complete this project. We also thank Mr. N. Arunachalam ,
Mr. S. Karthick Subramanian , Mr S. Sugumaran, Mr. Jaiyendran, Mr. Rajasiman,
Mr. Thamaraikannan, Ms. Sandhiya, Mr. Krishna kumar, Mr. Vivekanandan, Mr.
Valavan, Ms. Kirthika for helping us to carry out this project in a successful manner.
We would also like to thank Mr. Suresh, Mr. Diwakar, Mrs. Gowri, Mr.
Arumugam, Mrs. Vijaya, Mr. Karthick and Mr. Charles for their helping hands in every
situation of our study.
Words are inadequate in offering my thanks to the Project Trainees and Project
Assistants, of CRS for their encouragement and cooperation in carrying out the project
work.
Importantly, we would like to express my heartfelt thanks to our beloved Parents
and Family Members for their love and blessings, our Friends for their help and wishes
for the successful completion of this project.

ALTERATION MINERAL ZONATION MAPPING IN WESTERN PART OF CUDDAPAH BASIN
ABSTRACT
The Cuddapah basin was formed during the earliest period of Upper – Middle
Proterozoic and is endowed with rich mineral wealth; it is still being altered due to
several Structurally and Geomorphologically controlled factors. This study is made in
order to delineate the alteration zones and henceforth prepare the mineral zonation map.
Remote Sensing is the powerful tool in exploration of mineral. Along with the satellite
data and the Digital Image Processing software, the Alteration Mineral Zonation
Mapping is more effective. Here we use the Geology and Mineral map of GSI to prepare
the lithology and mineral map and to validate it with the processed images from the
Landsat ETM data. Digital Image Processing such as band ratio, PCA, MNF,
Classification helps to identify the Structurally and Geomorphologically controlled
alteration zones. These alteration Corridors are useful for further narrow downing the
study for mineral zonation mapping. Apart from the regular image processing, FLAASH
and SAM aids in dealing with the narrow band satellite data and produce more accurate
results. Here the Western part of the Cuddapah basin is taken under study which
comprises of various lithology like Limestone, Dolomite, Shale, Granite, Quartzite etc.,
and with minerals like Asbestos, Cooper, Uranium, Clay, Diamond, etc., When the study
area was processed they could give the hydrothermal alteration zones, structurally and
geomorhologically altered zones. These corridors narrowed down in zoning the minerals
like Talc, Steatite, Hornblende, Biotite, Hematite, Magnesite, Olivine, Butlerite, etc.,

ALTERATION MINERAL ZONATION MAPPING IN WESTERN PART OF CUDDAPAH BASIN
TABLE OF CONTENTS
CHAPTER
NO
TITLE PAGE NO
ABSTRACT
LIST OF FIGURES
1 INTRODUCTION AND LITERATURE REVIEW
1.1 BACKGROUND 1
1.2 LITERATURE REVIEW 3
1.2.1 ATMOSPHERIC CORRECTION 3
1.2.2 MINIMUM NOISE FRACTION
TRANSFORMATION 4
1.2.3 PIXEL PURITY INDEX 5
1.2.3 n-D VISUALIZATION 5
1.2.4 SPECTRAL ANGLE MAPPER 5
2 METHODOLOGY
2.1 AIMES & OBJECTIVE 6
2.2 STUDY AREA 6
2.3 METHODOLOGY 6
2.4 DATA PRODUCTS 9
2.5 GEOLOGY OF STUDY AREA 10
3 PREPARATION OF THEMATIC LAYERS
3.1 GENERAL 13
3.2 BASE MAP 13

ALTERATION MINERAL ZONATION MAPPING IN WESTERN PART OF CUDDAPAH BASIN
3.3 LITHOLOGY AND MINERAL MAPPING 13
3.4 STRUCTURAL MAPPING 13
3.5 LINEAMENT DENSITY 14
3.6 GEOMORPHOLOGY 14
4 DIGITAL IMAGE PROCESSING
4.1 LANDSAT ETM 17
4.2 PROCESSING TECHNIQUES 18
4.2.1 BAND RATIO 18
4.2.2 PRINCIPAL COMPONENT ANALYSIS 18
4.2.3 MINIMUM NOISE FRACTION 19
4.2.4 TARGET DETECTION 19
4.3 BAND COMBINATION FOR MINERALS 20
4.4 ASTER 21
4.5 APPLYING MINERAL INDEX 23
4.6 IDENTIFICATION AND EXTRACTION OF
ENDMEMBERS 23
4.6.1 PIXEL PURITY INDEX 24
4.6.2 IDENTIFICATON OF ENDMEMBERS 24
4.6.3 EXTRACTION OF ENDMEMBERS 24
4.6.4 SPECTRAL ANGLE MAPPER 24
5 RESULTS AND DISCUSSION 25
REFERENCES

ALTERATION MINERAL ZONATION MAPPING IN WESTERN PART OF CUDDAPAH BASIN
LIST OF FIGURES
S.no Name
1 Study area
2 Methodology
3 Base map
4 Lithology map
5 Mineral map
6 Lineament map
7 Lineament Density map
8 Geomorphology map
LANDSAT ETM PROCESSED MAPS
9 Colour transformation map
10 Low Pass filter map
11 Unsupervised classification Isodata map
12 Unsupervised classification K-means map
13 Principal Component Analysis map
14 Minimum Noise Fraction map
15 Carbonate Index
16 Iron Index
17 Oxide Index
18 Silica Index
19 Vegetative Index
20 Alteration Zones
21 Hydrothermal Alteration
22 Band Combination (Iron)
23 Band Combination (Vegetation)
24 Band Combination (Hydroxyl)
25 Granite Index
26 Structurally Altered Zones
ASTER PROCESSED MAPS

ALTERATION MINERAL ZONATION MAPPING IN WESTERN PART OF CUDDAPAH BASIN
27 Vegetative Index
28 Hydroxyl Bearing Mineral Index
29 Kaolinite Index
30 Calcite Index
31 Silica Index
32 Carbonate Index
33 Mafic Index
34 Ferric Oxide
35 Sulphide Index
36 Sericite Index
37 Gossans
38 Alteration Zones
MINERAL ZONATION MAPS
39 Quartz
40 Orthoclase
41 Pyrite
42 Olivine
43 Magnetite
44 Biotite
45 Talc
46 Haematite
47 Magnesite
48 Hornblende
49 Steatite
50 Silica
51 Buterlite

ALTERATION MINERAL ZONATION MAPPING IN WESTERN PART OF CUDDAPAH BASIN

ALTERATION MINERAL ZONATION MAPPING IN WESTERN PART OF CUDDAPAH BASIN
INTRODUCTION AND LITERATURE REVIEW
1.1 BACKGROUND
Remote Sensing is the science of making inferences about material objects from
measurements, made at distance, without coming into physical contact with the objects
understudy. Visual perception of objects is the best example of remote sensing. We see
an object by the light reflected from the object falling on the human eye. Here, eye is the
sensor and the nervous system carries information to the brain, which interprets the
information in terms of the identification and location of the object seen. Modern remote
sensing is an extension of this natural phenomenon. However, currently the term remote
sensing is used more commonly to denote identification of earth features by detecting the
characteristic electromagnetic radiation that is reflected and or emitted by the earth
surface. A remote sensing system consists of a sensor to collect the radiation and a
platform- an aircraft, balloon, rocket, satellite or even a ground- based sensor- supporting
stand- on which a sensor can be mounted. The information received by the sensor is
suitably manipulated and transported back to the earth- may be telemetered as in the case
of unmanned spacecraft, or brought back through films, magnetic tapes, etc., as in aircraft
or manned spacecraft systems. The data are reformatted and processed on the ground to
produce either photographs, or computer compatible magnetic tapes (CCT). The
photographs/ CCTs are interpreted visually/ digitally to produce thematic maps and other
resources information.
Remote Sensing technology has opened up new vistas for mapping planning,
management and monitoring of natural resources. Both aerial photographs and satellite
data-based studies have proved their capabilities in various fields like geological and
geomorphological, structural mapping, mineral targeting, groundwater targeting, forest
and soil mapping, land use planning, flood mapping, irrigation and water resource
management, etc., Detailed information can be extracted accurately from high resolution
satellite data and large scale aerial photographs. Further detailed digital information can
be generated using the above data in Geographical Information System (GIS). The
interpretation of aerial and satellite data for various resource application has been
successfully carried out in the country, and it has proven its utility with respect to time

ALTERATION MINERAL ZONATION MAPPING IN WESTERN PART OF CUDDAPAH BASIN
and space. In this study, a brief account in remote sensing application in mapping of
various mineral resources has been dealt with.
Multispectral sensors measure multiple, wide, separated wavelength bands and
hyperspectral sensors measure multiple, narrow and contiguous wavelength bands.
Although most hyperspectral sensors measure hundreds of wavelength bands, and most
multispectral sensors measure only few, it’s not the number of measured wavelengths
that defines a sensor as multispectral or hyperspectral; it’s the narrowness and contiguous
nature of the measurements. For example, a sensor that is measured only 20 bands could
be considered hyperspectral if the bands were contiguous and 10nm wide. If a sensor
measured 20 wavelength bands that were 100 nm wide or separated by nonmeasured
wavelength ranges, the sensor could be considered multispectral.
The thematic mapper(TM) is an advanced, multispectral scanning, earth resources sensor
designed to achieve higher image resolution, sharper spectral separation, improved
geometric fidelity, and greater radiometric accuracy and resolution than that of the MSS
sensor. This sensor also images a swath that is 185km (115 miles) wide, but each pixel in
a TM Scene represents a 30 m x 30m ground area, except in the case of the far- infrared
band 7, which uses a larger 120 m x 120 m pixel. The TM sensor has seven bands that
simultaneously record reflected or emitted radiation from the earth’s surface in the blue-
green (band 1), green (band 2), red (band 3), near- infrared (band 4), mid- infrared (band
5 and 7), and the far- infrared (band 6) portions of the electromagnetic spectrum. It
collects image data in a 16 day repeat cycle. Landsat 5 satellites operate in sun-
synchronous, near- polar orbits of about 705 km above the earth.
The Enhanced Thematic Mapper/ Landsat 7 satellite is a multispectral scanning
radiometer developed by NASA, was launched on April 15th, 1999. A swath width of
Landsat 7 image data is 185 km. It consists of 8 bands having pixel resolution 30 m for
visible blue (0.45- 0.52 µm), green (0.53- 0.61 µm), red (0.63- 0.69µm), near infrared
(0.78- 0.90µm), infrared (1.55- 1.75µm), SWIR (2.09- 2.35µm) and panchromatic (0.52-
0.90 µm) with pixel resolution 15 m (all are reflected radiation from the earth’s surface).
Thermal band having pixel resolution 60 m, emitted band with range (10.40- 12.50µm).

ALTERATION MINERAL ZONATION MAPPING IN WESTERN PART OF CUDDAPAH BASIN
Landsat satellite sensors collect image data in a 16- day repeat cycle. It operates in sun-
synchronous, near- polar orbits at about 705 km above the earth.
In the present study, mineral discrimination is carried out using ASTER, Landsat- 7/
ETM.
1.2 LITRETURE REVIEW
Multispectral remote sensing involves the collection of visible, near infrared, and short-
wave infrared images in several broad wavelength bands. Since different materials reflect
and absorb differently at different wave lengths, it is possible to differentiate among
materials by their spectral reflectance signature as observed in these remote sensing
images, whereas direct identification is usually not possible. Developed for remote
sensing applications in the mid- 1980s, hyperspectral sensors acquire images in over one
hundred contiguous spectral bands. Well-developed application areas include geology;
forestry; marine, coastal zone and inland waters; agriculture; ecology; urban; snow and
ice; and atmosphere. There are also numerous military applications in camouflage,
littoral zone mapping and land mine detection.
1.2.1 ATMOSPHERIC CORRECTION
Introduction
The nature of remote sensing requires that solar radiation pass through the atmosphere
before it is collected by the instrument. Because of this, remotely sensed images include
information about the atmosphere and the earth’s surface. For those interested in
quantitative analysis of surface reflectance, removing the influence of the atmosphere is a
critical pre- processing step. To compensate for atmospheric effects, properties such as
the amount of water vapour, distribution of aerosols, and seen visibility must be known.
Because direct measurements of these atmospheric properties are rarely available, there
are techniques that infer them from their imprint on satellite data. These properties are
then used to constrain highly accurate models of atmospheric radiation transfer to
produce an estimate of the true surface reflectance. Moreover, atmospheric corrections of
this type can be applied on a pixel- by- pixel basis because each pixel in hyperspectral

ALTERATION MINERAL ZONATION MAPPING IN WESTERN PART OF CUDDAPAH BASIN
image contains an independent measurement of atmospheric water vapour absorption
bands.
ENVI’s Fast Line- of- sight Atmospheric Analysis of Spectral Hypercubes (FLAASH)
module is a first- principles atmospheric correction modelling tool for retrieving spectral
reflectance from hyperspectral radiance reflectance. With FLAASH, you can accurately
compensate for atmospheric effects. FLAASH corrects wavelengths in the visible
through near- infrared and short- wave infrared regions, up to 3 mm (For thermal regions,
use the Basic-Tools- Pre-processing- Calibration Utilities- Thermal Atmospheric
Correction menu option). Unlike many other atmospheric corrections that interpolate
radiation transfer properties from a pre- calculated database of modelling results,
FLAASH incorporates the MODTRAN4 radiation transfer code. Correction for the
adjacency effects (pixel mixing due to scattering of surface- reflected radiance). An
option to compute a scene – average visibility (aerosol/ haze amount). FLAASH uses the
most advanced technique for handling particularly stressing atmospheric conditions, such
as the presence of clouds.
1.2.2 Minimum Noise Fraction Transformation
The minimum noise fraction (MNF) transformation is used to determine the inherent
dimensionality of image data, to segregate noise in the data and to reduce the
computational requirements for the subsequent processing (Boardman and Kruse, 1994).
The inherent dimensionality of the data is determined by examination of the eigenvalues
and associated eigenimages. The data space is divided into two parts: one associated with
large Eigen values and coherent Eigen images and a second with near unity Eigen values
and noise- dominated images. By using only the coherent portions in subsequent
processing, the noise is separated from the data, thus improving spectral processing
results. In a common practise, MNF components with Eigen values less than 1 are
usually excluded from the data as noise in order to improve the subsequent spectral
processing results (Qui et al. 2006).

ALTERATION MINERAL ZONATION MAPPING IN WESTERN PART OF CUDDAPAH BASIN
1.2.3 Pixel Purity Index
The Pixel Purity Index (PPI) is a means to determine automatically the relative purity of
the pixels from the higher order MNF Eigen images (Boardman, 1993; Boardman et al.,
1995). The Pixel Purity Index is computed by repeatedly projecting n- dimensional
scatter plots into a random unit vector. The extreme pixels in each projection are
recorded and total number of time each pixel is marked as extreme is noted. A ‘pixel
purity image’ is created in which the digital number (DN) of each pixel corresponds to
the number of times that pixel was recorded as extreme.
1.2.4 n- Dimensional endmember visualization:
When spectral end members are defined from a hyperspectral image, each image
endmember should have the maximum abundance of the physical material that it
represents. (Ideally, each endmember would be a single pure material, but pure pixels of
each member may not be present in the image). If image spectra are represented as points
in an end- dimensional, scatter plot, endmembers should correspond to cusps at the edge
of the cloud of spectral points.
1.2.5 Spectral Angle Mapper:
The Spectral Angle Mapper (SAM) developed by Kruse et al., (1993) is a physically
based spectral classification that evaluates similarity between image and end member
spectra. This algorithm determines spectral similarity between the two spectra by
calculating the angle between them. Smaller angles represent closer matches to the
reference spectrum. The result is a classification image and a rule image for an each
endmember. Darker pixels in the rule images represent smaller spectral angles, and thus
spectra that are more similar to the reference spectrum. The SAM- score is compared in
terms of the angular difference, measured in radiance ranging from zero to π/2. The
smaller the spectral angle, the more similar is the unknown pixel to the reference (target)
spectra.

ALTERATION MINERAL ZONATION MAPPING IN WESTERN PART OF CUDDAPAH BASIN
ALTERATION MINERAL ZONATION MAPPING IN WESTERN PART OF CUDDAPAH BASIN
METHODOLOGY
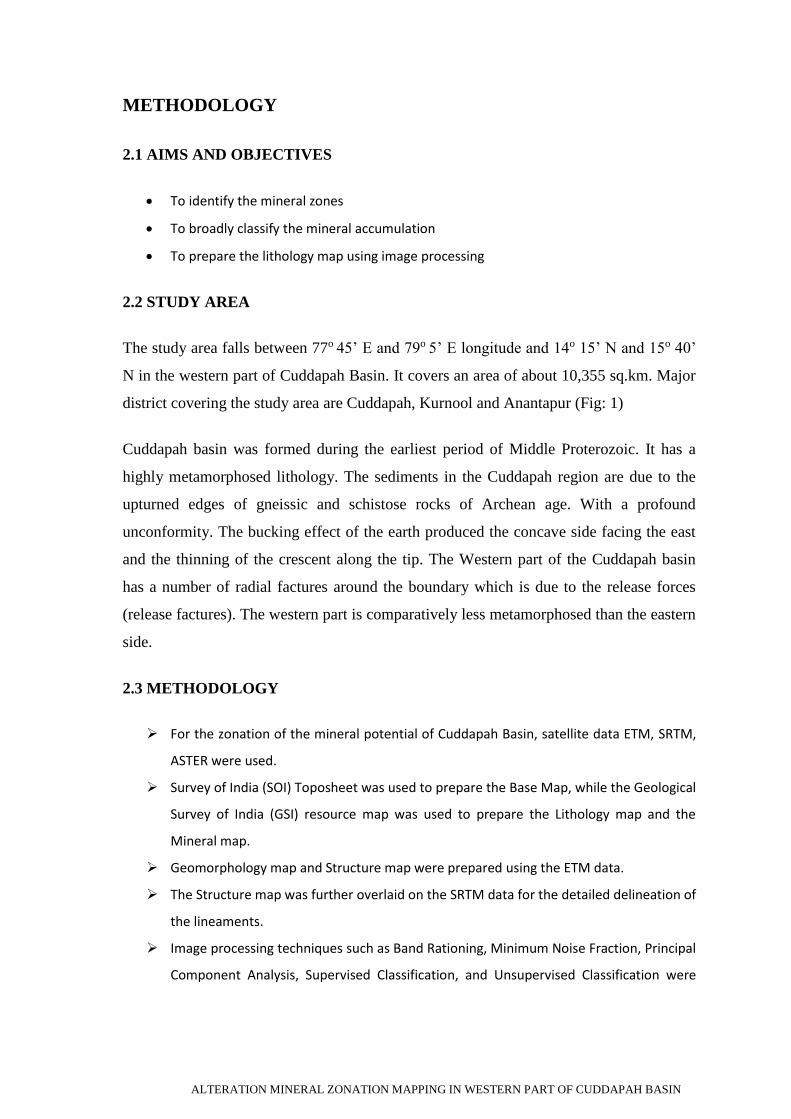
2.1 AIMS AND OBJECTIVES
To identify the mineral zones
To broadly classify the mineral accumulation
To prepare the lithology map using image processing
2.2 STUDY AREA
The study area falls between 77o 45’ E and 79o 5’ E longitude and 14o 15’ N and 15o 40’
N in the western part of Cuddapah Basin. It covers an area of about 10,355 sq.km. Major
district covering the study area are Cuddapah, Kurnool and Anantapur (Fig: 1)
Cuddapah basin was formed during the earliest period of Middle Proterozoic. It has a
highly metamorphosed lithology. The sediments in the Cuddapah region are due to the
upturned edges of gneissic and schistose rocks of Archean age. With a profound
unconformity. The bucking effect of the earth produced the concave side facing the east
and the thinning of the crescent along the tip. The Western part of the Cuddapah basin
has a number of radial factures around the boundary which is due to the release forces
(release factures). The western part is comparatively less metamorphosed than the eastern
side.
2.3 METHODOLOGY
For the zonation of the mineral potential of Cuddapah Basin, satellite data ETM, SRTM,
ASTER were used.
Survey of India (SOI) Toposheet was used to prepare the Base Map, while the Geological
Survey of India (GSI) resource map was used to prepare the Lithology map and the
Mineral map.
Geomorphology map and Structure map were prepared using the ETM data.
The Structure map was further overlaid on the SRTM data for the detailed delineation of
the lineaments.
Image processing techniques such as Band Rationing, Minimum Noise Fraction, Principal
Component Analysis, Supervised Classification, and Unsupervised Classification were

ALTERATION MINERAL ZONATION MAPPING IN WESTERN PART OF CUDDAPAH BASIN
done in order to identify structurally and Geomorphologically controlled alteration
zones.
ASTER data was processed for applying the mineral indices such as for Quartz, Calcite,
Mafic Minerals, Kaolinite, Alunite, OH bearing Minerals, Carbonate etc.
Further the processed image of the ETM and ASTER were compared to narrow down the
regions of the Alteration zones.
Those alteration corridors were taken and the Spectral Angle Mapper (SAM) is done
using the FLAASH module.
After the atmospheric correction of the ASTER data, radiance is converted to reflectance
followed by the Minimum Noise Fraction (MNF) and Pixel Purity Index (PPI). n-D
visualization is done and the end members are selected for Resampling using the USGS
mineral spectral Library.
Finally the SAM is run and the minerals of the selected corridors are mapped.

ALTERATION MINERAL ZONATION MAPPING IN WESTERN PART OF CUDDAPAH BASIN
Figure 2

ALTERATION MINERAL ZONATION MAPPING IN WESTERN PART OF CUDDAPAH BASIN
2.4 DATA PRODUCTS
Two digital data are used in this study, especially for digital image processing, such as,
ASTER
Landsat ETM

ALTERATION MINERAL ZONATION MAPPING IN WESTERN PART OF CUDDAPAH BASIN
ABSTRACT
2.5 GEOLOGICAL SETTINGS OF CUDDAPAH
The crescent shaped Cuddapah basin, on the eastern fringe of the Eastern Dharwar
Craton (EDC), is surrounded by granitic and gneissic terrain including thin, linear N–S
trending K-granitic plutons and greenstone belts towards the north, west and south (Fig:4).
The semi-circular boundary on these three sides is an undisturbed geological contact
representing an Eparchean unconformity. The metamorphosed sandstones, shales, dolomite,
quartzites and limestones are the main rock types of the basin. The lithostratigraphy of the
basin is divided into the Cuddapah super group and the Kurnool group.
The Cuddapah supergroup of middle Proterozoic (1600– 1300 Ma) consists of three
sub groups, namely Papagni, Chitravati and Nallamalai. Eastern part of the basin is occupied
by the Nallamalai group of rocks which are highly disturbed, folded and faulted. They are
overlain by the Kurnool group of rocks of middle to late Proterozoic (980–520 Ma) period
in the central part. The Cuddapah supergroup is composed dominantly of argillaceous and
arenaceous sequences with subordinate calcareous sediments. Each of the three subgroups
starts with quartzite and ends with a shale unit representing an overall shallow marine shelf-
environment with cyclic transgression and regression in the basin. Contemporaneous igneous
activities are manifested as sills, flows and other intrusives along the western periphery of the
basin and the eastern Nallamalai group (Nagaraja Rao et al., 1987). Plausible explanations for
the evolution of more than 10-km thick sedimentary column in the Cuddapah basin are
equivocal. A crustal sag of more than 10 km was envisioned through vertical tectonic
movements along pre-existing faults.
The basic sills exposed in the south-western part led to the proposal that the western
Cuddapah basin evolved under a thermal regime. The eastern Cuddapah basin, with a linear
shape and complex fold patterns, seems to correspond well with a stress based model in
which a graben structure accounts for subsidence. Pulses of thermally driven crustal sagging,
punctuated by events of extensional stretching are supported by the multiple transgressive
and regressive cycles in the basin. A tectonic setting behind a collision belt is considered as
an alternative mechanism where such high order of crustal sagging is possible (Ramam and
Murty, 1997). This foreland basin is the Proterozoic analogue of the Phanerozoic Himalayan
orogeny with its foredeep Ganga basin in front of the rising mountain chain (Radha Krishna
and Naqvi, 1986). The adjoining, EGMB is mostly characterized by high-grade charnockite,
khondalite and leptinite of middle to late Proterozoic period. Sialic basement of orthogneisses

ALTERATION MINERAL ZONATION MAPPING IN WESTERN PART OF CUDDAPAH BASIN
ABSTRACT
and grandiorites, which are known collectively as the peninsular gneiss, and limited
occurrences of K-granite, carbonatite, syenite and an orthosite form the next most important
lithologic unit in the EGMB. Though the number and ages of the metamorphic events in the
EGMB are debatable, the most widespread episode, when most of the granulites in the belt
are formed, was around 1000 Ma (Paul et al., 1990). The Nellore schist belt of early
Proterozoic period is located between the Cuddapah basin to the west and the granulite
terrane of the EGMB to the east.
The gneisses of 252 A.P. Singh, D.C. Mishra / Journal of Geodynamics 33 (2002)
249–267 Khammam schist belt, further north, exhibits arrested charnockitization features
and interpreted as the lower crustal assemblages of a collision (Sarvothaman, 1994). The
EGMB is further characterized by a series of sills and dykes with minor proportion of
volcanic rocks of the middle to late Proterzoic period known as Kandra volcanics or Kandra
igneous complex (Rao, 1992). The petrographic and petrochemical characteristics of this
volcanic belt led to the proposal that they belong to an ophiolite complex (Leelanandam,
1990). The largest Archean metamorphosed anorthositic complex (of about 200 km2) near
Kanigiri is another significant feature associated with the Nellore schist belt in this area. This
association of the Nellore greenstone belts and the Kanigiri anorthosite complex further
vindicate the tectonic setting of Proterozoic continental collision (Ramam and Murty, 1997).

ALTERATION MINERAL ZONATION MAPPING IN WESTERN PART OF CUDDAPAH BASIN
ABSTRACT

ALTERATION MINERAL ZONATION MAPPING IN WESTERN PART OF CUDDAPAH BASIN
ABSTRACT

ALTERATION MINERAL ZONATION MAPPING IN WESTERN PART OF CUDDAPAH BASIN
ABSTRACT
PREPARATION OF THEMATIC LAYERS
3.1GENERAL
The thematic maps were preparation was done by visual interpretation using Landsat ETM
data. Maps like base map, lithology were prepared by the hard copy interpretation.
Lineament, geomorphology and structure maps were prepared using the soft copies of SRTM and
ETM in ArcGIS.
3.2 BASE MAP
The base map was prepares from the Survey of India Toposheet and it was further matched with the
Google earth data and the Landsat ETM data for updation. The major districts covering the study
area are Cuddapah, Kurnool and Anantapur (Fig 3)
3.3 LITHOLOGY AND MINERAL MAP
The lithology map was prepared using the Geology Map of Geological Survey of India (GSI).
The GSI maps of Kurnool, Cuddapah, Anantapur districts were manually interpreted and traced. It
was later scanned and digitized in ArcGIS. The area is almost equally covered by Limestone,
Dolomite, Shale, and Quartzite. Granite, Basic Sill, Basic Flow, Gneiss, Meta Andesite, were also
vectorized using GSI map (Fig 4). Minerals such as Asbestos, Barite, Clay, Copper, Diamond,
Limestone, High Grade Limestone, Ochre, Talc, Steatite, and Uranium were mapped (Fig 5).
3.4 STRUCTURAL MAP
In general the lineaments can be defined as a long linear or curvilinear feature which formed
by tectonism. According to Ramasamy (1986) lineaments id defined as a long linear or curvilinear
features which are structurally or tectonically controlled and can be seen only through aerial
photographs or satellite imageries. The remotely sensed data provides a panoramic view and are
once again a very good tool for mapping the pattern ad orientation of the hill ranges and the folded
structures.
The lineaments were first mapped on the basis of the morphological expression and
anomalies such as straight and sharp linear ridges, lithological straightness, sharp lithological
boundaries and contacts, offset lithologies and structural trend lines break in slopes, long ad linear
fracture valleys, soil tone linearity’s etc. using Landsat ETM data. It was then overlaid on the SRTM
data for detailed delineation of lineaments (Fig 6).
3.5 LINEAMENT DESITY

ALTERATION MINERAL ZONATION MAPPING IN WESTERN PART OF CUDDAPAH BASIN
ABSTRACT
The total length of lineaments per unit area is called as lineament density. These types of
lineament density diagrams were used to find the structurally controlled alteration zones (Fig 7).
3.6 GEOMORPHOLOGY
The size, shape, pattern configuration and the spatial networks of the various landform
elements have been interpreted using ETM data ad various landform which have been formed due
to different geomorphic process have been interpreted such as Structural hills, Pediments, Fracture
Fills, Colluvial fills, Flood Plains etc. These different landforms express distinct morphogenetic
expression of their own in the satellite imagery (Fig 8). The following are the geomorphological units
demarcated from the study area by onscreen interpretation.
Bazada
Colluvial fills
Deep pediments
Dissected lateritic upland
Flood plain
Fracture fills
Lateritic uplands
Linear ridges
Moderate pediments
Plateau
Reservoir
River
Shallow pediments
Structural hills
Valley fills
3.6.1 Structural Hills
These are the hills formed due to the regional tectonics showing structural trends of
the region. The hill ranges in general have shown anticlinal hills, synclinal valleys and the
ring shaped hills which could be easily delineated from the satellite imagery.
3.6.2 Linear Ridges

ALTERATION MINERAL ZONATION MAPPING IN WESTERN PART OF CUDDAPAH BASIN
ABSTRACT
Linear ridges are also the structural hill which are linear i shape trending few
kilometres, the features are delineated in the same way as like structural hills with the same
tone, texture, shape and linearity in addition
3.6.3 Plateau
Plateau is a flat topped hill is an area of high land usually with a flat terrain. It is also
called as high plain or tableland.
3.6.4 Fractured Valley
Valleys are deep depression found in between two hills formed as a result of rapid
erosion. A valley formed due to fracture are called fracture valley, in the study area they are
filled with debris and vegetation. In satellite imagery the barren and filled fracture valley
could be easily differentiated with the tone. A filled fracture valley will be fully loaded with
good vegetation hence giving good red tone.
3.6.5 Pediments
These are generally sloping bedrock surface terminating against a mountain front,
usually by a sharp breaking slope. Pediments are identified as gently undulating rock folded
surface without weathered mantle, but often partly mantled with thin veneer of soil obtained
from the upland masses bordering the hills. This is formed by combination of process, such
as back weathering, sheet wash and lateral erosion. These zones are generally low permeable
with poor infiltration and are considered to be the run-off zones. However, the structural
features such as fractures, joints, which transverse this unit could act as a good recharge
zones in LANDSAT satellite imagery pediments are identified by their grey to yellow tone,
medium texture, highly irregular pattern and close association with foothills indicates the
pediments where the slope is low to moderate, generally the left out rocky materials preen
over here.
a) Buried Pediment shallow: This unit is characterised by very high run-off and poor
groundwater recharge region. Consists of very low weathered zone with thickness of
materials varying up to 5m. In the Imagery Shallow Pediment is identified by pale yellowish
tone lacks vegetation.

ALTERATION MINERAL ZONATION MAPPING IN WESTERN PART OF CUDDAPAH BASIN
ABSTRACT
b) Buried Pediment deep: The thickness of this zone varies from 10 to 20m and favours a good
amount of water to circulate within the zone before reaching the deeper fracture zone. In
this zone infiltration is moderately good. Deep pediments are identified in the imagery by
dark reddish tone and coarse texture.
c) Buried Pediment medium: These areas are in the mid category of deep ad shallow, these
could be located by its irregular and coarse texture having the mixed tone found in deep and
shallow pediments.
3.6.6 Colluvial Fills
Colluvial fills are the eroded material brought down the hill by the drainages. In any
satellite imagery this fills could be located by its finger shaped flow in the foot hills, good
results can be made by further image processing like PC Analysis.
3.6.7 Flood Plain
Flood plains are found along the course of any river in the mature stage, it is to be
noted that water can reach the reach the maximum extent of the flood plain when the same
river is flooded. The flood plains are potential areas of ground water thus having good
vegetation showing deep red tone in FCC.

ALTERATION MINERAL ZONATION MAPPING IN WESTERN PART OF CUDDAPAH BASIN
ABSTRACT

ALTERATION MINERAL ZONATION MAPPING IN WESTERN PART OF CUDDAPAH BASIN
ABSTRACT
DIGITAL IMAGE PROCESSING
4.1 LANDSAT ETM
In order to take advantage of and make good use of remote sensing data, we must be
able to extract meaningful information from the imagery. Much interpretation and
identification of targets in remote sensing imagery is performed manually or visually, i.e. by
a human interpreter. Recognising targets in the key to interpretation and information
extraction. Observing the differences between targets and their backgrounds involves
comparing different targets based on any, or all, of the visual elements of tone, shape, size,
pattern, texture, shadow and association.
The digital image processing involves the manipulation and interpretation of digital
images with the aid of a computer. The computer is programmed to insert the data into an
equation, or series of equations, and then store the results of the computation for each pixel.
These results from a new digital image that may be displayed or recorded in pictorial format
or additional programs may further manipulate itself. Image processing applications software
normally resides as an executable command module on the hard disk of a system. These
characteristic of softwares is essential and helpful to users.
Digital processing may be used to enhance data as a prelude to visual interpretation. Digital
processing and analysis may also be carried out to automatically identify targets and extract
information completely without manual intervention by a human interpreter. Digital image processing
may involve numerous procedures including formatting and correcting of the data, digital
enhancement to facilitate better visual interpretation, are even automated classification of targets and
features entirely by computer. In order to process remote sensing imagery digitally, the data must be
recorded and available in the digital form suitable for storage on a computer tape or disk.
At last but not the least, an important element in the image analysis is integration of data. In the early
days of analog, remote sensing when the only remote sensing data source are aerial photography, the
capability for integration of data from different sources was limited. Today, with most data available
in digital format from as wide array of sensors, data integration is a common method used for
interpretation and analysis. Data integration fundamentally involves the combining or merging of data
from multiple sources in an effort to extract better and/ or more information. This may include data
that are multi temporal, multi resolution, multi sensors or multi data type in nature.

ALTERATION MINERAL ZONATION MAPPING IN WESTERN PART OF CUDDAPAH BASIN
ABSTRACT
The various techniques of digital image processing are image rectification techniques,
enhancement techniques, spatial fixture techniques, band combination techniques,
classification techniques, spectral wizard techniques and also statistical analysis. The image
processing techniques prefer the greatest potential for preserving the correct radiometry and
the maximum resolution of the images. It is fast and accurate and flexible to cater to the
analyst requirement. This helps the scientists in precise image interpretation.
Image Processing Software
For the present study, the digital image processing were done with the help of ENVI
(ENvironment for Visualizing Images) software and its run by IDL (Interactive Data
Language) program. ENVI strengths lies in its unique approach to image processing. It
combines file-based and band-based techniques with interactive functions. This software is
usefully interactive, prompting the user for specified inputs.
4.2 PROCESSING TECHNIQUES APPLIED
4.2.1 Band Ratio
Band rationing is powerful technique for extracting spectral information from multi spectral
imagery and is widely used for lithologic and alteration mapping. Band ratio images enhance
spectral differences between rocks suppress topography affects. Atmospheric corrections should
be made carefully to provide meaningful ratio image. Multispectral remote sensing is useful for
recognising altered rocks because their reflectance spectral differ from those of country rock
(Sabins 1987).
4.2.2 Principal Component Analysis
Principle Component Analysis (PCA) is used in various applications including remote sensing
(Blodget et al 1978) PCA is used to compress multichannel image data by calculating a new
coordinate system, so as to condense the scene variance in the original data into a new set of
variables which are called principal component (PCs). These data are decorrelated and most of the
image variance I confined within the first few channels. In the study, after transformation, the data
were scaled or linearly contrast stretched. This procedure increases the spectral discrimination
capacity among terrestrial materials (Qari 1991) (Fig 13).
4.2.3 Minimum Noise Fraction
The Minimum Noise Fraction (MNF) transformation is used to determine the inherent
dimensionality of image data, ti segregate noise in the data, and to reduce the computational
requirements for subsequent processing (See Boardman and Kruse, 1994). The MNF transform
has modified from Green et al. (1998) and implemented in ENVI is essentially two cascaded
ALTERATION MINERAL ZONATION MAPPING IN WESTERN PART OF CUDDAPAH BASIN
ABSTRACT
Principal Component’s transformations. The first transformation, Based on an estimated noise
covariance matrix, decorrelates and rescales the noise in the data. The first step results in
transformed data in which the noise as unit variance and no band-to-band correlations. The
second step is the standard principal components transformation of the noise whitened data. For
the purpose of further spectral processing, the inherent dimensionality of the dta is determined by
the examination of the final eigen values and the associated images. The data space can be
divided into two parts: one part associated with large eigen values and coherent eigen images, and
a complimentary part with near-unity eigen values and noise- dominated images. By using only
the coherent portions, the noise is separated from the data, thus improving spectral processing
results (Fig 14).
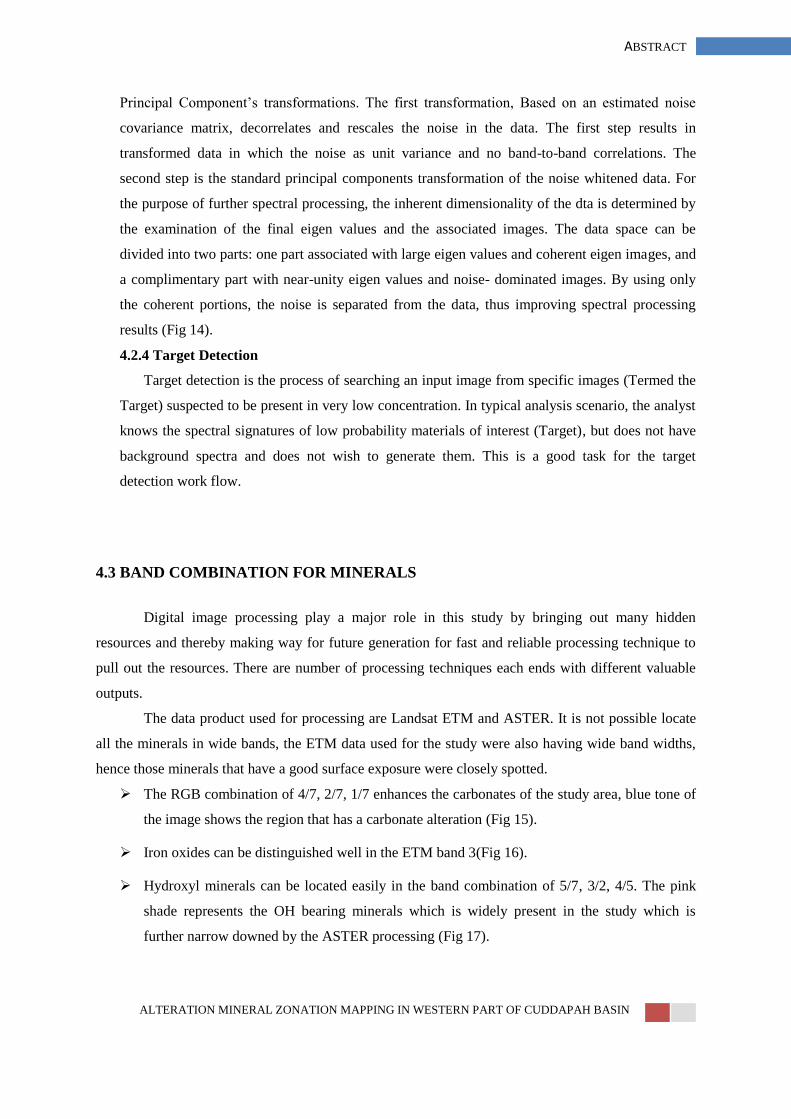
4.2.4 Target Detection
Target detection is the process of searching an input image from specific images (Termed the
Target) suspected to be present in very low concentration. In typical analysis scenario, the analyst
knows the spectral signatures of low probability materials of interest (Target), but does not have
background spectra and does not wish to generate them. This is a good task for the target
detection work flow.
4.3 BAND COMBINATION FOR MINERALS
Digital image processing play a major role in this study by bringing out many hidden
resources and thereby making way for future generation for fast and reliable processing technique to
pull out the resources. There are number of processing techniques each ends with different valuable
outputs.
The data product used for processing are Landsat ETM and ASTER. It is not possible locate
all the minerals in wide bands, the ETM data used for the study were also having wide band widths,
hence those minerals that have a good surface exposure were closely spotted.
The RGB combination of 4/7, 2/7, 1/7 enhances the carbonates of the study area, blue tone of
the image shows the region that has a carbonate alteration (Fig 15).
Iron oxides can be distinguished well in the ETM band 3(Fig 16).
Hydroxyl minerals can be located easily in the band combination of 5/7, 3/2, 4/5. The pink
shade represents the OH bearing minerals which is widely present in the study which is
further narrow downed by the ASTER processing (Fig 17).

ALTERATION MINERAL ZONATION MAPPING IN WESTERN PART OF CUDDAPAH BASIN
ABSTRACT
Silica can be narrowed down in the band rationing of ETM band 3 and band 5. The coarse
texture and the bright tone of the image helps to identify the silica rich region in the study
area (Fig 18).
The vegetation can be clearly mapped in the Band 1 of the ETM data. The bright tone
represents the vegetation zones in the study area. They are mostly present in the flood plains
(Fig 19).
The RGB band combination of 5/7, 5/4, 3/1 and 5/7, 3/1, 4/3 will help to delineate the
alteration zones on the whole from the imagery (Fig 20).
5/7, 5/4, 3/1 gives the region where the iron oxides have undergone hydrothermal alterations
(Fig 21).
Similarly 7/4, 4/3, 5/4 shows the iron ions in red tone, vegetation in green tone and hydroxyl
minerals in blue tone (Fig 22 ).
Granite is visible in the band 3 of Landsat ETM is processed with MNF (Fig 25).
4.4 ASTER
The advanced space brone thermal emission and reflection radiometer (ASTER) is a
high spatial, spectral and radiometric resolution multispectral remote sensing sensor on
national aeronautics and space administration (NASA) earth observing system AM-1 (EOS
AM-1) polar orbiting spacecraft. It was launched in December 1999. EOS AM-1 spacecraft
operates near polar orbits at 705 km altitude. The recurrent cycle is 16 days. The ASTER
instrument is a cooperative effort between the Japanese Ministry of Economic Trade and
Industry (METI) and NASA. It has three separate instrument subsystems which provide
observations in three different spectral regions of electromagnetic spectrum, including visible
and near infrared radiation (VNIR), shortwave infrared radiation (SWIR) and thermal
infrared radiation (TIR). The VNIR subsystem has three recording channels between 0.52 and
0.86 µm and an additional backward-looking band for constructing digital elevation models
(DEMs) with spatial resolution of 15 m. The SWIR subsystem has six recording channels
from 1.6 to 2.43 µm, at a spatial resolution of 30 m, while the TIR subsystem has five
recording channels, covering the 8.125 to 11.65 µm wavelength region with spatial resolution
of 90 m. ASTER swath width is 60 km (each scene is 60 × 60 km ) and is useful for regional
mapping, but cross-track pointing capability extends the total viewing to 232 km. ASTER

ALTERATION MINERAL ZONATION MAPPING IN WESTERN PART OF CUDDAPAH BASIN
ABSTRACT
sensor can acquire approximately 600 scenes daily (Fujisada, 1995; Abrams and Hook,
1995; Yamaguchi et al. 1999; Abrams, 2000; Yamaguchi et al., 2001).
ASTER provides data useful for studying the interaction among the geosphere,
hydrosphere, cryosphere, lithosphere and atmosphere of the earth from the geophysical point
of view. To be more specific, wide range of science investigations and applications includes:
(1) geology and soil; (2) land surface climatology; (3) vegetation and ecosystem dynamics;
(4) volcano monitoring; (5) hazard monitoring; (6) carbon cycle and marine ecosystem; (7)
hydrology; (8) aerosol and cloud; (9) evapotranspiration rate; and (10) land surface and land
cover change (Fujisada, 1995). ASTER standard data products are available ‘on-demand’
from the Earth Remote Sensing Data Analysis Center (ERSDAC, Japan) and the EROS data
center (EDC, USA). Basically, all the ASTER captured data are processed to generate
Level1A data product. It consists of unprocessed raw image data and coefficients for
radiometric correction. The Level-1B (radiance-at-sensor) data product is a resampled image
data generated from the Level-1A data by applying the radiometric correction coefficients.
Level-2B data products of physical parameters including surface radiance data with nominal
atmospheric corrections (Level-2B01), surface reflectance data contains atmospherically
corrected VNIR-SWIR data (Level-2B07 or AST-07), surface emissivity data with
MODTRAN atmospheric correction and a temperature-emissivity separation (TES) algorithm
(Level-2B04) are generated on the basis of user request. Level-4B data product is also
generated under the user request from the alongtrack stereo observation in the near infrared
channel (band 3N and 3B) in order for the construction of digital elevation models (DEMs).
Level-3A is a geometrically well-corrected orthorectified ASTER standard data product with
ASTER-driven DEM, which is radiometrically equivalent to Level-1B radiance-at-sensor
data (Gillespie et al., 1998; Yamaguchi et al., 1999; Abrams, 2000; Yamaguchi et al., 2001;
Ninomiya, 2005, 2003a, b, c).
Recently, two new crosstalk-corrected ASTER SWIR reflectance products had been
released, which include: (1) AST-07XT SWIR reflectance data product available ‘on-
demand’ from ERSDAC and EDC (Iwasaki and Tonooka, 2005) and (2) RefL1b SWIR
reflectance data product complied and introduced (Mars and Rowan, 2010). The AST-07XT
SWIR reflectance data product is similar to AST-07 surface reflectance data that consist of
VNIR and SWIR bands, except that the crosstalk correction algorithm and atmospheric

ALTERATION MINERAL ZONATION MAPPING IN WESTERN PART OF CUDDAPAH BASIN
ABSTRACT
correction (nonconcurrently acquired MODIS water vapor data) have been applied (Iwasaki
and Tonooka, 2005; Biggar et al., 2005; Mars and Rowan, 2010). RefL1b and AST-07XT
reflectance datasets have crosstalk correction; differences between these datasets should be
caused by the addition of the radiometric correction factors and use of concurrently acquired
water vapor data in the atmospheric correction of the RefL1b data (Mars and Rowan, 2010).
During scene acquisition of ASTER data, there is optical ‘crosstalk’ effect caused by stray of
light from band 4 detector into adjacent band 5 and 9 detectors on SWIR subsystem. Such
deviations from correct reflectance result in false absorption features and distortion of
diagnostic signatures and consequently misidentification of spectroscopic results.
4.5 APPLYING MINERAL INDEX
The mineral indexes were done by using the Band Math tool from the ENVI software. The
formula used in this mineral index enhances the specific mineral according to their response
to each band.
Stabilized Vegetative Index (StVI) = [𝑏𝑎𝑛𝑑 3
𝑏𝑎𝑛𝑑 2] [
𝑏𝑎𝑛𝑑 1
𝑏𝑎𝑛𝑑 2] (Fig 26)
OH bearing Alteration Mineral Index (OHI) = [𝑏𝑎𝑛𝑑 7
𝑏𝑎𝑛𝑑 6] [
𝑏𝑎𝑛𝑑 4
𝑏𝑎𝑛𝑑 6] (Fig 27)
Kaolinite Index (KLI) = [𝑏𝑎𝑛𝑑 4
𝑏𝑎𝑛𝑑 5] [
𝑏𝑎𝑛𝑑 8
𝑏𝑎𝑛𝑑 6] (Fig 28)
Alunite Index (ALI) = [𝑏𝑎𝑛𝑑 7
𝑏𝑎𝑛𝑑 5] [
𝑏𝑎𝑛𝑑 7
𝑏𝑎𝑛𝑑 8]
Calcite Index (CLI) = [𝑏𝑎𝑛𝑑 6
𝑏𝑎𝑛𝑑 8] [
𝑏𝑎𝑛 𝑑9
𝑏𝑎𝑛𝑑 8] (Fig 29)
Quartz Index (QI) = [𝑏𝑎𝑛𝑑 10∗𝑏𝑎𝑛𝑑 10
𝑏𝑎𝑛𝑑 10∗𝑏𝑎𝑛𝑑 12] (Fig 30)
Carbonate Index (CI) = [𝑏𝑎𝑛𝑑 13
𝑏𝑎𝑛𝑑 14] (Fig 31)
Mafic Index (MI) = [𝑏𝑎𝑛𝑑 12
𝑏𝑎𝑛𝑑 13] (Fig 32)

ALTERATION MINERAL ZONATION MAPPING IN WESTERN PART OF CUDDAPAH BASIN
ABSTRACT
4.6 IDENTIFICATION AND EXTRACTION OF ENDMEMBERS
Any spectral mapping methods require an end member value to accurately map a particular
feature and differentiate it from other. Hence the accuracy of the result depends upon the purity of the
endmember. The endmember values can be obtained as follows:
1. From the spectra corresponding to pixels within the image,
2. From library of endmembers spectra either measured in the laboratory or in the field,
3. With the automatic methods of constructing end members from higher order PCA (Principal
Component Analysis) eigenvalues (Boardman, 1993), Pixel Purity Index (PPI).
4.6.1 PIXEL PURITY INDEX (PPI)
The Pixel Purity Index (PPI) is a means of identifying spectrally pure in multi spectral
images. These pure pixels typically correspond to the mixing endmembers. The PPI is
computed by repeatedly projecting n- dimensional scatter plots onto a random vector. The
extreme pixels in each projection recorded and the number of times that pixel was recorded
as being extreme. PPI plot shows the number of extreme pixels satisfying the threshold
criteria found by the PPI processing as a function of the number of iterations.
4.6.2 IDENTIFICATION OF ENDMEMBER
The choice of endmember is very important in unmixing analysis; hence, it has to be
chosen with careful analysis. As stated above PPI method was used to identify the
endmembers.
In order to extract the purest pixels, PC 1 band was chosen since it consists maximum
information in it. About 50,000 iterations were given and the PPI output image is generated when the
PPI curve reached a stable straight line. The pixel with higher PPI score indicates higher purity and
hence, appears brighter in the image. Pixel with lower score is less ‘spectrally pure’ and appears
darker in the PPI image. Pixels with higher PPi score are usually taken as endmembers for using
spectral unmixing (Boardman 1993). The PPI images were then linked with the FCC of the
corresponding images to obtain the pixels which were brighter and the feature that corresponds to
particular pixels were identified to form 3 classes namely vegetation , hill, sand.

ALTERATION MINERAL ZONATION MAPPING IN WESTERN PART OF CUDDAPAH BASIN
ABSTRACT
4.6.3 EXTRATION OF ENDMEMBERS
The endmembers for 3 classes were chosen from the plot window of the spectra of the image
pure pixel. Pixels with high PPI score were taken as endmembers.
4.6.4 SPECTRAL ANGLE MAPPER
The Spectral Angle Mapper (SAM) is a physically based spectral classification that uses an n-
dimensional angle to match pixels to reference spectra. The algorithm determines the spectral
similarity between two spectra by calculating the angle between the spectra, treating them as vectors
in a space with dimensionally equal to the number of bands. This technique, when used on calibrated
reflectance data, is relatively insensitive to illumination and albedo effects. (Kruse et. al, 1993) SAM
compares the angle between the end member spectrum vector and each pixel vector in n- dimensional
space. Smaller angles represent closer matches to the reference spectrum. Pixels away than the
specified maximum angle threshold in radiance are not classified.
The end members for the SAM classification is also derived from the PPI approach. The pixels with
the highest score is taken as the end member.
The endmembers thus selected are compared with the FCC and is then given as an input to SAM
classifier. SAM for each individual image is run by selecting number of endmember for specific
minerls. It is then overlaid on the various ASTER single bands inorder to find the minerls occurances.
The output is then compared with the Lithology map, Mineral map and the Mineral Index maps
prepared by the Digital Image Processing and the Minerals are mapped along with the alteration
zones.

ALTERATION MINERAL ZONATION MAPPING IN WESTERN PART OF CUDDAPAH BASIN
ABSTRACT
Fig
ure
1

ALTERATION MINERAL ZONATION MAPPING IN WESTERN PART OF CUDDAPAH BASIN
ABSTRACT
Fig
ure
3

ALTERATION MINERAL ZONATION MAPPING IN WESTERN PART OF CUDDAPAH BASIN
ABSTRACT
Fig
ure
4

ALTERATION MINERAL ZONATION MAPPING IN WESTERN PART OF CUDDAPAH BASIN
ABSTRACT
Fig
ure
5

ALTERATION MINERAL ZONATION MAPPING IN WESTERN PART OF CUDDAPAH BASIN
ABSTRACT
Fig
ure
6

ALTERATION MINERAL ZONATION MAPPING IN WESTERN PART OF CUDDAPAH BASIN
ABSTRACT
Figure 7

ALTERATION MINERAL ZONATION MAPPING IN WESTERN PART OF CUDDAPAH BASIN
ABSTRACT
Fig
ure
8

ALTERATION MINERAL ZONATION MAPPING IN WESTERN PART OF CUDDAPAH BASIN
ABSTRACT
Figure 9

ALTERATION MINERAL ZONATION MAPPING IN WESTERN PART OF CUDDAPAH BASIN
ABSTRACT
Figure 10

ALTERATION MINERAL ZONATION MAPPING IN WESTERN PART OF CUDDAPAH BASIN
ABSTRACT
Figure 11

ALTERATION MINERAL ZONATION MAPPING IN WESTERN PART OF CUDDAPAH BASIN
ABSTRACT
Figure 12

ALTERATION MINERAL ZONATION MAPPING IN WESTERN PART OF CUDDAPAH BASIN
ABSTRACT
Figure 13

ALTERATION MINERAL ZONATION MAPPING IN WESTERN PART OF CUDDAPAH BASIN
ABSTRACT
Figure 14

ALTERATION MINERAL ZONATION MAPPING IN WESTERN PART OF CUDDAPAH BASIN
ABSTRACT
Figure 15

ALTERATION MINERAL ZONATION MAPPING IN WESTERN PART OF CUDDAPAH BASIN
ABSTRACT
Figure 16

ALTERATION MINERAL ZONATION MAPPING IN WESTERN PART OF CUDDAPAH BASIN
ABSTRACT
Figure 17

ALTERATION MINERAL ZONATION MAPPING IN WESTERN PART OF CUDDAPAH BASIN
ABSTRACT
Figure 18

ALTERATION MINERAL ZONATION MAPPING IN WESTERN PART OF CUDDAPAH BASIN
ABSTRACT
Figure 19

ALTERATION MINERAL ZONATION MAPPING IN WESTERN PART OF CUDDAPAH BASIN
ABSTRACT
Fig
ure
3
9

ALTERATION MINERAL ZONATION MAPPING IN WESTERN PART OF CUDDAPAH BASIN
ABSTRACT
Fig
ure
4
0

ALTERATION MINERAL ZONATION MAPPING IN WESTERN PART OF CUDDAPAH BASIN
ABSTRACT
Fig
ure
4
1

ALTERATION MINERAL ZONATION MAPPING IN WESTERN PART OF CUDDAPAH BASIN
ABSTRACT
Fig
ure
4
2

ALTERATION MINERAL ZONATION MAPPING IN WESTERN PART OF CUDDAPAH BASIN
ABSTRACT
Fig
ure
4
3

ALTERATION MINERAL ZONATION MAPPING IN WESTERN PART OF CUDDAPAH BASIN
ABSTRACT
Fig
ure
4
4

ALTERATION MINERAL ZONATION MAPPING IN WESTERN PART OF CUDDAPAH BASIN
ABSTRACT
Fig
ure
4
5

ALTERATION MINERAL ZONATION MAPPING IN WESTERN PART OF CUDDAPAH BASIN
ABSTRACT
Fig
ure
4
6

ALTERATION MINERAL ZONATION MAPPING IN WESTERN PART OF CUDDAPAH BASIN
ABSTRACT
Fig
ure
4
9

ALTERATION MINERAL ZONATION MAPPING IN WESTERN PART OF CUDDAPAH BASIN
ABSTRACT
Fig
ure
4
8

ALTERATION MINERAL ZONATION MAPPING IN WESTERN PART OF CUDDAPAH BASIN
ABSTRACT
Fig
ure
4
7

ALTERATION MINERAL ZONATION MAPPING IN WESTERN PART OF CUDDAPAH BASIN
ABSTRACT
Fig
ure
5
0

ALTERATION MINERAL ZONATION MAPPING IN WESTERN PART OF CUDDAPAH BASIN
ABSTRACT
Fig
ure
5
1

ALTERATION MINERAL ZONATION MAPPING IN WESTERN PART OF CUDDAPAH BASIN
ABSTRACT

ALTERATION MINERAL ZONATION MAPPING IN WESTERN PART OF CUDDAPAH BASIN
ABSTRACT
RESULTS AND DISCUSSION:
The digital image processing has given good results especially in finding out the
altered minerals. Band ratios highlighted various altered minerals whereas the Principal
Component Analysis discriminated the different lithological characters. The digital image
processing of LANDSAT ETM data when compared and correlated with the Lithology and
Mineral map prepared from the Geology and Mineral Resource map of Geological Survey of
India could give us the broad classification of the region that has been altered.
When these maps are overlaid on the Lineament density map, the identification of the
structurally controlled alteration zones is quite easy and accurate. Similarly the
Geomorphologically controlled are also identified and this gives the corridors of the
alteration zones. These corridor or alteration windows can still be narrowed down using the
ASTER data processing for specific altered mineral zone mapping.
Mineral index applied on the various band math combinations of the ASTER data
helps us to delineate the region that has a unique kind of alteration or the accumulation of the
specific mineral type. (Eg. OH bearing alteration mineral index, Calcite index, Mafic index,
Quartx index, etc.,)
The FLAASH (Fast Line of Sight Atmospheric Analysis of Spectral Hypercubes)
module of Digital Image Processing uses the meta data of the particular image and processes
it for atmospheric correction modelling for retrieving spectral reflectance from thee radiance
images. SAM module of the Digital image processing is a powerful tool for the narrow band
data like ASTER to target the mineral zones that are altered. The end members of the pure
pixel index that is derived from atmospherically corrected FLAASH image is imported to
SAM module. SAM measures the similarity of unknown and reference spectra in n-
dimensions. Thus the altered minerals of the selected corridors are found.
Finally the overlaying of SAM output on the single bands of ASTER data could zone
minerals altered in the Cuddapah Basin namely Hornblende, Magnetite, Orthoclase, Apatite,
Olivine, Pyrite, Biotite, Butlerite, Quartz, Steatite, Talc, Hematite, Illite, Hypersthene, Silica,
Magnesite and Barite.
Accurate alteration mapping can be done by further extensive field study.

ALTERATION MINERAL ZONATION MAPPING IN WESTERN PART OF CUDDAPAH BASIN
ABSTRACT
REFERENCES
1. Nagaraju and K. Guru Rajesh Environmental Impact of Barytes Deposit: A Case Study
from Mangampeta Area, Cuddapah Basin, Andhra Pradesh, India.
2. Abrams M (2000). The Advanced Spaceborne Thermal Emission and Reflection
Radiometer (ASTER): data products for the high spatial resolution imager on NASA’s
Terra platform. Int. J. Rem. Sens., 21: 847-859.
3. Abrams M, Hook SJ (1995). Simulated ASTER data for geologic studies. IEEE Tran.
Geol. Rem. Sens., 33(3).
4. B. T. San, E. O. Sumer, B. Gurcay Comparison of band ratioing and spectral indices
methods for detecting alunite and kaolinite minerals using ASTER data in Biga region,
Turkey.
5. Biggar SF, Thome KJ, McCorkel JT, D'Amico JM (2005). Vicarious calibration of the
ASTER SWIR sensor including crosstalk correction. Proceedings Int. Society Opt. Eng.,
5882-588217.
6. Boardman,l J.W., 1993, Automated Spectral Unmixing of AVIRIS data using convex
geometry concepts, summaries of the fourth JPL Airborne geosciences Workshop, JPL
publication 93-26, NASA jet propulsion llLaboratory, Pascdena, Calif., pp 11-14
7. Fujisada H (1995). Design and performance of ASTER instrument. In: Breckinridge, J.B.
(Ed.), Proceedings Int. Soc. Opt. Eng., 2583: 16- 25.
8. Asadi Haroni and A. Lavafan Integrated analysis of aster and landsat etm data to map
exploration targets in the muteh gold-mining area, Iran Isfahan University of
Technology, Isfahan, Iran (* [email protected]).
9. H.V. Ram Babu , Basement structure of the Cuddapah Basin from gravity anomalies,
Tectonophysics, 223 (1993) 411-422 Elsevier Science Publishers B.V., Amsterdam.
10. Hewson RD, Cudahy TJ, Mizuhiko S, Ueda K, Mauger AJ (2005). Seamless geological
map generation using ASTER in the Broken Hill–Curnamona province of Australia. Rem.
Sen. Environ. 99: 159- 172.
11. Iwasaki A., Tonooka H (2005). Validation of a crosstalk correction algorithm for
ASTER/SWIR. IEEE Trans. Geosci. Rem. Sens., 43(12): 2747-2751.
12. Elsayed Zeinelabdein, A. I. Albiely, Ratio image processing techniques: a prospecting
tool for mineral deposits, red sea hills, ne sudan, The International Archives of the

ALTERATION MINERAL ZONATION MAPPING IN WESTERN PART OF CUDDAPAH BASIN
ABSTRACT
Photogrammetry, Remote Sensing and Spatial Information Sciences. Vol. XXXVII. Part
B8. Beijing 2008.
13. Kanlinowski A, Oliver S (2004). ASTER Mineral Index Processing. Remote Sensing
Application Geoscience Australia. Aust. Government Geoscience Website:
http://www.ga.gov.au/image_cache/GA7833.pdf.
14. Kurse, F.A., Lefkoff, A.B., Boardman, J.B., Heidebrecht, K.B., Shapiro, A.T., Barloon,
P.J., and Goetz, A.F.H., 1933b, The spectral Image Processing System (SIPS) –
Interactive Visualization and Analysis of Imaging Spectrometer Data: Remote Sensing of
Environment, Special issue on AVIRIS, May-June 1993, v.44,p. 145-163.
15. Leelanandam, C., 1990. The Kandra volcanics in Andhra Pradesh: possible ophiolite?
Current Science 59, 785–788.
16. Mars JC, Rowan LC (2006). Regional mapping of phyllic- and argillicaltered rocks in the
Zagros magmatic arc, Iran, using Advanced Spaceborne Thermal Emission and
Reflection Radiometer (ASTER) data and logical operator algorithms. Geosphere, 2(3):
161-186.
17. Mars JC, Rowan LC (2010). Spectral assessment of new ASTER SWIR surface
reflectance data products for spectroscopic mapping of rocks and minerals.
Rem.Sens.Environ, 114: 2011-2025.
18. Md. Bodruddoza Mia, Yasuhiro Fujimitsu Mapping hydrothermal altered mineral
deposits using Landsat 7 ETM+ image in and around Kuju volcano, Kyushu, Japan, J.
Earth Syst. Sci. 121, No. 4, August 2012, pp. 1049–1057 Indian Academy of Sciences.
19. Nagaraja Rao, B.K., Rajurkar, S.T., Ramalingaswamy, G., Ravindra Babu, B., 1987.
Stratigraphy, structure and evolution of the Cuddapah basin. Geol. Soc. India Memoir 6,
33–86.
20. Paul, D.K., Barman, T., McNaughton, N.J., Flecther, I.R., Potts, P.J., Ramkrishnan, M.,
Augustine, P.F., 1990. Archean Proterozoic evolution of Indian charnockites—isotope
and geochemical evidence from granulites of the Eastern Ghat belt. J. Geol. 98, 253–263.
21. Radha Krishna, B.P., Naqvi, S.M., 1986. Precambrian continental crust of India and its
evolution. J. Geol 94, 145–166.
22. Ramam, P.K., Murty, V.N., 1997. Geology of Andhra Pradesh. Geol. Soc. India
Publication, Bangalore, India.
23. Rao, A.T., 1992. The Kandra igneous complex from the Precambrian Nellore Schist Belt,
A.P. J. Geol. 64, 187–195.

ALTERATION MINERAL ZONATION MAPPING IN WESTERN PART OF CUDDAPAH BASIN
ABSTRACT
24. Reda Amer, Timothy Kusky, Paul C. Reinert, Abduwasit Ghulam Image processing and
analysis using landsat etm+ imagery for lithological mapping at fawakhir, central
eastern desert of egypt asprs 2009 Annual Conference Baltimore, Maryland March 9-13,
2009.
25. SAAC Corral, felipe gonzález, albert griera, mercè corbella, david gómez-gras ,esteve
cardellach Landsat ETM+ Imaging for the Exploration of Epithermal Deposits in the
Azuero Peninsula (Panama) macla nº 15. September 2011.
26. Sarvothaman, H., 1994. Studies of gravity of Khamam and Krishna districts, Andhra
Pradesh. Records Geol. Surv. India 127 (5), 62–64.
27. Yamaguchi YI, Fujisada H, Kahle AB, Tsu H, Kato M, Watanabe H, Sato I, Kudoh M
(2001). ASTER instrument performance, operation status, and application to Earth
sciences. IEEE Trans. Geosciences. Rem. Sens., pp. 1215-1216.
28. Yamaguchi YI, Fujisada H, Kudoh M, Kawakami T, Tsu H, Kahle AB, Pniel M (1999).
ASTER instrument characterization and operation scnorio. Adv. Spa. Res., 23(8): 1415-
144.