Hydrothermal alteration in the ASK-57 and ASK-86 ...
176
Hydrothermal alteration in the ASK-57 and ASK-86 exploratory wells at Hoffell/Miðfell within the Tertiary Geitafell volcano Byron Fabian Pilicita Masabanda Faculty of Earth Sciences University of Iceland 2021
-
Upload
khangminh22 -
Category
Documents
-
view
4 -
download
0
Transcript of Hydrothermal alteration in the ASK-57 and ASK-86 ...

Hydrothermal alteration in the ASK-57 and ASK-86 exploratory wells at Hoffell/Miðfell
within the Tertiary Geitafell volcano
Byron Fabian Pilicita Masabanda
Faculty of Earth Sciences University of Iceland
2021


Hydrothermal alteration in the ASK-57 and ASK-86 exploratory well at Hoffell/Miðfell
within the Tertiary Geitafell volcano
Byron Fabian Pilicita Masabanda
17 ECTS thesis submitted in partial fulfillment of a Magister Scientiarum degree in Geology
Advisors Enikö Bali
Guðmundur Heiðar Guðfinnsson
Master’s Examiner Tobias Björn Weisenberger
Faculty of Earth Sciences School of Engineering and Natural Sciences
University of Iceland Reykjavik, January 2021

Hydrothermal alteration in the ASK-57 and ASK-86 exploratory wells at Hoffell/Miðfell in Geitafell volcano Hydrothermal alteration in wells at Hoffell/Miðfell 17 ECTS thesis submitted in partial fulfillment of a Magister Scientiarum degree in Geology Copyright © 2021 Byron Pilicita All rights reserved Faculty of Earth Sciences School of Engineering and Natural Sciences University of Iceland Askja, Sturlugata 7 101 Reykjavík Iceland Telephone: 525 4000 Bibliographic information: Byron Pilicita, 2021, Hydrothermal alteration in the ASK-57 and ASK-86 exploratory wells at Hoffell/Miðfell in Geitafell volcano, Master’s thesis, Faculty of Earth Science, University of Iceland, pp. 174. Printing: Háskólaprent Reykjavik, Iceland, December 2020

Abstract The Hoffell/Miðfell area is part of a hydrothermal system located on the south flank of the Tertiary Geitafell volcano. Several wells have been drilled in the area and various studies have been carried out, showing interaction between hot intrusions and meteoric water that led to the development of prograde and retrograde alteration. However, there is a lack of detailed mineral chemistry data from the area, as from most Icelandic geothermal systems. The ASK-57 and ASK-86 core sections show volcanic sequences affected by progressive high-temperature hydrothermal metamorphism that was followed by low-temperature zeolitization after a drop in regional temperatures. These events can be identified from the hydrothermal mineral assemblages formed and precipitated in vesicles, veins and the matrix of the rocks analyzed. Stage I is characterized by the crystallization of fine-grained chlorite interbedded with fine-grained epidote in veins, small vesicles and filling the bottom parts of geopetal structures. Stage II occurred after a progressive temperature increase that formed chlorite + epidote + wairakite + calcite + quartz + albite ± K-feldspar ± actinolite ± clinopyroxene ± magnetite ± ilmenite ± titanite. Stage III occurred after temperature drop and is marked by zeolite mineralization that includes laumontite, yugawaralite, stellerite, stilbite, and chabazite. Altogether 15 different mineral phases were identified, and there are at least three separate temperature-controlled “alteration zones” in the Hoffell/Miðfell core sections.
Útdráttur Hoffells/Miðfellssvæðið er hluti af jarðhitasvæði á suðurjaðri Geitafellseldstöðvarinnar sem virk var á tertíer. Nokkrar holur hafa verið boraðar á svæðinu og margvíslegar rannsóknir gerðar, sem sýna samverkan heitra innskota og grunnvatnskerfis sem leiddi af sér rísandi og hnígandi ummyndunarstig. Hins vegar er skortur á nákvæmum greiningum á efnasamsetningu steinda frá þessu svæði sem og frá flestum jarðhitakerfum á Íslandi. Kjarnar úr holum ASK-57 og ASK-86 bera merki um stafla eldgosamyndana sem orðið hafa fyrir stígandi háhitaummyndun og seinna meir, eftir að hiti á svæðinu féll, lághitaummyndun sem einkennist af zeólítum. Hægt er að bera kennsl á þessa atburði út frá fylkjum jarðhitasteinda sem mynduðust og féllu út í blöðrum, sprungum og grunnmassa bergsýna sem skoðuð voru. Stig I einkennist af kristöllun fínkorna klóríts með fínkorna epidóti í sprungum, smáum blöðrum og í neðra hluta hálffylltra blaðra. Stig II átti sér stað eftir hiti reis og fól í sér myndun steindafylkisins klórít + epidót + wairakít + kalsít + kvars + albít ± kalífeldspat ± aktínólít ± klínópýroxen ± magnetít ± ilmenít ± títanít. Stig III varð eftir hitastig féll og einkennist af myndun zeólítanna laumontíts, yugwaralíts, stelleríts, stilbíts og kabasíts. Borin voru kennsl á alls 15 mismunandi steintegundir og það eru að minnsta kosti þrjú mismunandi hitastigsháð „ummyndunarbelti“ í kjörnunum frá Hoffells/Miðfellssvæðinu.


Dedication
To my wife Sigrún,
my family in Ecuador, and my new family in Iceland.


vii
Table of Contents List of Figures ...................................................................................................................... x
List of Tables ..................................................................................................................... xix
Abbreviations .................................................................................................................... xxi
Acknowledgements ......................................................................................................... xxiii
1 Introduction ................................................................................................................... 25
1.1 Geological framework ........................................................................................... 26
1.2 Geothermal Systems .............................................................................................. 28
1.3 Description and well locations .............................................................................. 30
1.3.1 ASK-57 ........................................................................................................ 30
1.3.2 ASK-86 ........................................................................................................ 30
2 Methods .......................................................................................................................... 33
2.1 Sampling ................................................................................................................ 33
2.2 Stereomicroscope analysis .................................................................................... 33
2.3 Petrographic microscope analysis ......................................................................... 33
2.4 SEM-EDS analysis ................................................................................................ 34
2.5 Electron microprobe analysis ................................................................................ 34
3 Petrography Description .............................................................................................. 35
3.1 ASK57-01 (365.65 m) ........................................................................................... 35
3.2 ASK57-05 (376.18 m) ........................................................................................... 37
3.3 ASK57-09 (424.36 m) ........................................................................................... 39
3.4 ASK57-10 (431.60 m) ........................................................................................... 42
3.5 ASK57-11 (465.09 m) ........................................................................................... 44
3.6 ASK86-01 (370.50 m) ........................................................................................... 46
3.7 ASK86-04 (424.70 m) ........................................................................................... 48

viii
3.8 ASK86-05 (437.00 m) ........................................................................................... 50
3.9 ASK86-07 (461.82 m) ........................................................................................... 52
3.10 ASK86-09 (478.87 m) ........................................................................................... 55
3.11 ASK86-11 (481.67 m) ........................................................................................... 56
3.12 ASK86-12 (486.95 m) ........................................................................................... 58
4 Mineral Chemistry ....................................................................................................... 61
4.1 Feldspar ................................................................................................................. 61
4.2 Pyroxene ................................................................................................................ 63
4.3 Amphiboles ........................................................................................................... 65
4.4 Epidote .................................................................................................................. 67
4.5 Chlorite .................................................................................................................. 69
4.6 Zeolites .................................................................................................................. 71
4.7 Fe-Ti Oxides ......................................................................................................... 76
4.8 Titanite .................................................................................................................. 79
4.9 Carbonates ............................................................................................................. 80
5 Discussion ...................................................................................................................... 83
5.1 Alteration Sequence .............................................................................................. 83
5.1.1 Matrix alteration .......................................................................................... 84
5.1.2 Mineral infilling in veins ............................................................................. 86
5.1.3 Mineral infilling in vesicles ......................................................................... 87
5.2 Temperature implication ....................................................................................... 90
5.2.1 Stage I. Clay minerals and fine-grained chlorite and epidote ...................... 90
5.2.2 Stage II. Calc-silicate assemblage and quartz ............................................. 91
5.2.3 Stage III. Zeolite formation ......................................................................... 94
5.3 Implications for fluid pH and CO2 concentration ................................................. 96
5.4 Implications of the new data ................................................................................. 97
6 Conclusions ................................................................................................................... 99

ix
7 Recommendations ....................................................................................................... 101
References ........................................................................................................................ 103
Appendix A ....................................................................................................................... 111
Appendix B ....................................................................................................................... 113
Appendix C ....................................................................................................................... 117
Appendix D ....................................................................................................................... 141
Appendix E ....................................................................................................................... 143
Appendix F ....................................................................................................................... 157
Appendix G ...................................................................................................................... 173

x
List of Figures Figure 1. Distribution and names of active systems within the volcanic zones and belts
in Iceland as depicted by Jóhannesson and Sæmundsson (1998) in Thordarson and Höskuldsson (2008). Abbreviations are as follows: RR, Reykjanes Ridge; RVB, Reykjanes Volcanic Belt; SISZ, South Iceland Seismic Zone; WVZ, West Volcanic Zone; MIB, Mid-Iceland Belt; EVZ, East Volcanic Zone; NVZ, North Volcanic Zone; TFZ, Tjörnes Fracture Zone; KR, Kolbeinsey Ridge; ÖVB, Öræfi Volcanic Belt; and SVB, Snæfellsnes Volcanic Belt. Numbers refer to volcanic systems listed in Table 1. The large open circle indicates the approximate centre of the Iceland mantle plume/anomaly as depicted by Wolfe et al. (1997). ................ 28
Figure 2. Location of Geitafell central volcano, outlined with a dashed red line, and the surface lithology in the SE of Iceland. The location of Hoffell, the site of the boreholes, is marked with a filled red triangle. (Base map from http://jardfraedikort.is/index_enska.html) ........................................................ 29
Figure 3. Location of the ASK-57 and ASK-86 wells at the Hoffell/Miðfell localities (Base map taken from https://orkustofnun.is/orkustofnun/gagnasofn/borholur/)................................. 31
Figure 4. Photomicrographs of ASK57-01; A, B, C in plane-polarized light and D in cross-polarized; (A) Plagioclase embedded in an altered groundmass with anhedral oxides; (B) Cluster of prismatic epidotes filling the center of a vesicle; (C) Micro-epidote and fine-grained mass filling a rounded vesicle; (D) Concentric chlorite on the border of the vesicle enclosing both epidote and granular colorless minerals. ....................................................................... 36
Figure 5. Backscattered electron images of ASK57-01 (A) Elongated vesicle filled with epidote, chlorite, calcite and tiny albite. The groundmass is composed of albite, amphibole and interstitial epidote ; (B) Cluster of epidotes with interstitial calcite and albite enclosed by chlorite at the edge of a vesicle (see Figure 4B); (C) Rounded vesicle filled with microcrystalline chlorite and epidote (see Figure 4C); (D) Zoom-in of image 5B showing microcrystalline epidote with both interstitial chlorite and quartz. .................. 37
Figure 6. Photomicrographs of ASK86-05 with plane-polarized light; (A) Microlites of plagioclase embedded in an epidote-chlorite matrix; (B) Prismatic quartz with both primary and secondary fluid inclusions; (C) Calcite crystal with twinning planes surrounded by a colorless mineral and concentric chlorite and quartz. (D) Prismatic epidote (pale yellow) with acicular amphiboles embedded in a colorless to brownish mineral in the center of a vesicle ............................................................................................. 38
Figure 7. Backscattered electron images of ASK57-05. (A) Epidote on the border of a vesicle and albite and amphibole with both interstitial chlorite and quartz in the groundmass; (B) Combined backscattered electron image and an X-ray map that shows concentric distribution of quartz (Si-light blue)

xi
enclosing chlorite (dark blue), epidote (Ca- and Si-rich, small pale-yellow patches) and calcite veins (Ca-rich, orange). Notice the pink dots (Ti) in the groundmass (possibly titanite or ilmenite); (C) Epidote, chlorite and quartz inside a vesicle; (D) Border of a vesicle that shows epidote between quartz and chlorite, which are distributed concentrically within the vesicle; (E) Amphibole embedded in interstitial zeolites inside a vesicle; (F) Vesicle filled with a cluster of prismatic K-feldspar, zeolites (stilbite, see section 4.6), calcite and quartz, and concentric K-feldspar and epidote bands. ................................................................................................................ 40
Figure 8. Photomicrographs of ASK86-09; A and C with plane-polarized light, B and D with cross-polarized light. (A) Amygdales in a fine-grained matrix with plenty of disseminated oxides. Vesicles filled with chlorite; (B) An empty fracture cutting a vesicle filled with a brownish to colorless mineral and tiny epidotes in the center of the vesicle (blue interference colors); (C) Isolated crystals of epidote embedded in a brownish mineral with a splintery surface; (D) Cluster of brownish acicular amphiboles, crystallized after green chlorite, embedded in a colorless mineral in the center of the vesicle. ......................................................................................... 41
Figure 9. Backscattered electron images of ASK57-09 (A) Vesicle filled with chlorite embedded in a groundmass of albite, amphibole and disseminated oxides; (B) Vesicles filled with concentric chlorites and zeolites with tiny epidotes; (C) Well-developed epidotes embedded in prismatic zeolites filling a vesicle (see Figure 5D); (D) Combined backscattered electron image and an X-ray map showing silica-rich areas (bright purple) enclosed by concentric chlorite (light blue). Notice the small vesicles are only filled with chlorite and surrounded by the matrix (albite is bright pink). .................. 42
Figure 10. Photomicrographs of ASK86-10; A and D with plane-polarized light, B and C with cross-polarized light. (A) Irregular-shape amygdales filled with chlorite in a fine-grained matrix. Notice a plagioclase phenocryst being replaced by epidote in the center of the image; (B) Very angular and highly elongate vesicle filled with chlorite, showing anomalous first-order interference colors; (C) Fracture filled with anhedral quartz; (D) Well-developed epidote crystals embedded in a splintery mineral surface. .............. 43
Figure 11. Backscattered electron images of ASK57-10 (A) Groundmass composed of albite, amphibole, and interstitial chlorite, and cut by fractures filled with chlorite, epidote, zeolite, and amphibole; (B) Zoom-in of image 8A showing acicular amphibole embedded in zeolites and enclosed by chlorite; (C) Epidote and amphibole with interstitial zeolites, all of them filling a vesicle; (D) Combined backscattered electron image and an X-ray map showing silica-rich veins (yellow) cutting the matrix. Notice the concentric epidote (light blue) filling the vesicle. ............................................ 44
Figure 12. Photomicrographs of ASK86-11; A and C with plane-polarized light, B and D with cross-polarized light. (A) Cluster of altered plagioclases in a fine-grained matrix; (B) Epidote rimming a plagioclase phenocryst; (C)

xii
Chlorite replacing entirely a mafic phenocryst; (D) Cavity filled with quartz, cut by a calcite vein. ............................................................................. 45
Figure 13. Backscattered electron images of ASK57-11 (A) Plagioclase phenocryst replaced by chlorite, and albite partially replaced by epidote. Notice the formation of ilmenite, quartz, and calcite veins; (B) Cavity filled with epidote, quartz, and K-feldspar; (C) Vesicle filled with a cluster of epidotes, interstitial anorthite, and K-feldspar; (D) Combined backscattered electron image and an X-ray map showing calcite veins (orange) that cut chloritized plagioclase (green). Notice the disseminated ilmenite (pink). ................................................................................................. 46
Figure 14. Photomicrographs of ASK86-01; B and C with plane-polarized light, A and D with cross-polarized light. (A) Concentrically zoned amygdales in a fine-grained groundmass; (B) Aggregates of prismatic epidote crystals surrounded by pleochroic brownish mineral; (C) Tabular scaly aggregates of chlorite; (D) Twinning planes in calcite. ..................................................... 47
Figure 15. Backscattered electron images from ASK86-01 (A) Amphibole and albite in the groundmass with chlorite and epidote filling a fracture; (B) Secondary minerals filling vesicles; (C) Micro-chlorite and micro-epidote filling a rounded vesicle; (D) Center of a vesicle where an intergrowth of zeolites and K-feldspar can be seen. ................................................................ 48
Figure 16. Photomicrographs of ASK86-04; A, B and D with cross-polarized light, C with plane-polarized light. (A) Amygdales filled with concentric chlorite in a relative course-grained groundmass composed of plagioclase and oxides; (B) Aggregates of secondary minerals filling a vesicle; (C) Border of a vesicle that shows the sequence of crystallization epidote, chlorite and feldspar; (D) Zoom-in of the vesicle border in the figure 16C. ....................... 49
Figure 17. Backscattered electron images of ASK86-04 (A) Amphibole and magnetite in the groundmass surrounding a vesicle filled with epidote, amphibole, and interstitial zeolites; (B) Albite, chlorite and chalcopyrite in the groundmass; (C) Secondary minerals filling a vesicle; (D) Fracture filled with chlorite at the edges and albite and epidote in the center. ........................ 50
Figure 18. Photomicrographs of ASK86-04; A, B, C and D with plane-polarized light.(A) Groundmass composed of partially altered plagioclase and opaque ore; (B) Poligonal crack filled with tabular chlorite and micro-chlorite; (C) Geopetal structure in an elongate vesicle. The bottom side (left side in the picture) filled with fine-grained chlorite (in the border of the vesicle) and fine-grained epidote. The top side (right side of the picture) filled with coarse-grained chlorite; (D) Calcite vein cross-cutting a perlitic crack. ................................................................................................. 51
Figure 19. Backscattered electron images of ASK86-05 (A) Vesicle filled with micro-chlorite on the border and epidote; (B) Photomicrograph of the same area as image A; (C and D) Granular aggregates of chlorite and epidote filling

xiii
the vesicle shown in images A and B; (D) Groundmass minerals next to the vesicle border. ............................................................................................. 52
Figure 20. Photomicrographs of ASK86-07; A, B, C and D with plane-polarized light; (A) Amygdaloidal texture with a groundmass composed of plagioclase and disseminated oxides. Amygdale is cross-cut by an empty vein. Vesicle filled with concentric chlorite, epidote and zeolite (B) Vesicle filled with chlorite on the border and well-developed epidote next to the colorless feldspar; (C) Vesicle filled with chlorite on the border and fibrous epidote. Brownish pleochroic mineral formed in the middle of the vesicle; (D) Micro-chlorite (dark brownish mineral at the bottom of the vesicle) filling a vesicle in sharp contact with colorless zeolites (at the top of the vesicle). .......................................................................................................................... 53
Figure 21. Backscattered electron images from ASK86-07 (A) Vesicle filled with chlorite on the border with prismatic epidote and zeolites, (see Figure 7B); (B) Concentric chlorite filling a vesicle and micro-chlorite on the border; (C) Calcite and chalcopyrite traces with zeolites and epidote filling the upper part of the vesicle in sharp contact with micro-chlorite; (D) Fibrous and prismatic epidote with albite, zeolites and K-feldspar, and chlorite on the border of the vesicle (see the Figure 7C); (E-F) Combined backscattered electron images and X-ray maps showing the unmixing texture between K-feldspar (K-rich, pink) and albite (Na-rich, blue), and both enclosed by epidote (Ca-rich, orange) and chlorite (Mg-rich, green). ..... 54
Figure 22. Photomicrographs of ASK86-09; A and C with plane-polarized light, B and D with cross-polarized light. (A) Amygdales filled with chlorite. Noticeable are incipient poligonal cracks; (B) Altered groundmass composed of plagioclase, oxides and interstitial alteration minerals; (C) Vesicle filled with chlorite on the border, cluster of fibrous epidotes, calcite with twinning planes and brownish feldspar; (D) Irregular chlorite haloes surrounded epidote and in the center of the vesicle. Notice the high amount of the brownish feldspar filling the vesicle. ........................................ 56
Figure 23. Backscattered electron images of ASK86-09. (A) Vesicle filled with chlorite on the border and haloes in the center, epidote, calcite and albite (see Figure 23C); (B) Vesicle filled with zeolites (chabazite), epidote, albite and calcite; (C and D) Zoom-in of images 23A and 23B showing albite laths and anhedral calcite. ...................................................................... 56
Figure 24. Photomicrographs of ASK86-011; A and B with plane-polarized light, C and D with cross-polarized light. (A) Calcite vein cutting the groundmass of plagioclase and oxides; (B) Tabular aggregates of chlorite filling a rounded vesicle; (C) Vesicle filled with subhedral quartz and calcite with twin planes. (D) Brownish feldspar crystallized between quartz (on the border) and epidote (in the center) in a vesicle. ................................................ 57
Figure 25. Backscattered electron images of ASK86-011. (A) Groundmass next to a vesicle filled with epidote, calcite and quartz grains; (B) Center of a vesicle filled with radial prismatic zoned epidote surrounded by feldspar, calcite

xiv
and quartz; (C and D) Zoom-in of images 22C and 22D, showing zeolites intergrown with K-feldspar. ............................................................................. 58
Figure 26. Photomicrographs of ASK86-012; A and B with plane-polarized light, C with cross-polarized light. (A) Vesicle filled with chlorite on the border, zeolites, and epidote, cross-cut by a zeolite vein; (B) Vesicle filled with fibrous chlorite with intercalation of zeolites on the border; (C) Vesicle filled with chlorite on the border and prismatic quartz. ................................... 59
Figure 27. Backscattered electron images of ASK86-12 (A) Fracture filled with zeolites and granular calcite in a fine groundmass; (B) Border of a vesicle (red line dashed) that shows skeletal ilmenite and titanite surrounded by quartz in the inner wall; (C) Epidote and quartz crystals cut by a calcite vein in the center of a vesicle; (D) Acicular amphibole in the center of a vesicle; (E) K-feldspar intergrowth with albite, crystallized after chlorite and quartz; (F) Combined backscattered electron image and an X-ray map that shows epidote (Ca-rich, intense red) in the center of a vesicle surrounded by intergrowth of K-feldspar (K-rich, green) and albite (Na-rich, blue), quartz (black, see Figure 27 E), chlorite (Mg-rich, light blue) on the border of the vesicle and cut by zeolite vein (stellerite, Ca-rich, mixture of red and blue) with some calcite traces in the vein borders (Ca-rich, red). .......................................................................................................... 60
Figure 28. (A, B and C) Ternary classification diagram Ab-An-Or for feldspars in (A) vesicles and (B and C) matrix. (D and E) Backscatter electron images of ASK-05. (D) Replacement of labradorite (light grey) by albite (dark grey) in matrix; (D) Cluster of K-feldspar crystals analyzed in calcite and zeolite in a vesicle. 1,2 Compositions of hydrothermal and igneous feldspars from the Reykjanes geothermal system (Libbey and William-Jones, 2016). 3 Composition of feldespars in volcanic rocks from Geitafell central volcano (Thorlacius, 1991); Cal: calcite, Qz: quartz, Zeo: zeolite (stilbite, see section 4.6), Amph: amphibole, Mt: magnetite. ............................................... 62
Figure 29. Ternary classification diagram Wo-En-Fe for clinopyroxenes in the matrix (circles) and vesicles (triangles) from ASK86 and ASK57 in comparison with clinopyroxenes in rocks from (A) Hellisheiði, Krafla and Reykjanes and (B) Geitafell. In (B), phenocrysts trend along the dashed line and the groundmass along the solid line (Thorlacius, 1991); (C) Variation diagram showing Mg-number (Mg/Mg++Fe2+) vs Al2O3 for clinopyroxenes from ASK86 and ASK57 in the matrix (circles) and vesicles (triangles) in comparison with clinopyroxenes in different rocks from Geitafell volcano. (D and E) Backscatter electron images from both ASK86-07 and ASK86-12 showing interstitial clinopyroxenes. 1 Hellisheiði (Helgadóttir et al., 2015), 2 Krafla (Schiffman et al., 2004), 3 Reykjanes (Marks et al., 2010), 4 Geitafell (Thorlacius, 1991), 5 Geitafell (Friðleifsson, 1983a); Amph: amphibole, Plg: plagioclase, Mt: magnetite, Chl: chlorite, Qz: quartz. ........... 65
Figure 30. (A and B) Variation diagrams showing Si vs Mg number (Mg/Mg++Fe2+) of amphibole in the matrix (circles) and vesicles (triangles) of ASK86 and ASK57 core samples in comparison with metamorphic/deuteric, igneous
xv
and hydrothermal amphiboles. 1,2 Intrusive complex (Zachariáš, 2008); 3,4 Reykjanes and Nesjavellir hydrothermal systems (Marks et al., 2010), 5 Hellisheiði hydrothermal system (Helgadóttir et al., 2015) and 6 Geitafell Tertiary hydrothermal system (Friðleifsson, 1983a). (C) Backscatter electron image of a vesicle in ASK86-09 showing amphibole in calcite. (D) Backscatter electron image of the matrix in ASK86-07 showing interstitial amphibole. (E) Backscatter electron image of ASK86-12 showing aggregates of amphibole in the matrix; Cal: calcite, Ep: epidote, Zeo: zeolite, Plg: plagioclase, Mt: magnetite, Cpx: clinopyroxene. .......................................................................................................................... 67
Figure 32. (A) Ternary plot showing the compositions of epidote group minerals, classified according to M3+ cation substitution, M3+ = Al3+, Mn3+ or Fe3+, corresponding to the clinozoisite, piemontite and epidote end-members, respectively (Franz and Liebscher, 2004); (B) Backscatter electron image showing epidote in a vesicle exibiting patchy zonation with Al-rich/Fe-poor zones (dark-grey) and Al-poor/Fe-rich zones (light-grey). (C) Line scan of Fe2O3 and Al2O3 contents (wt%) in epidote that shows oscillatory zoning. (D) Backcscatter electron image showing oscillatory zonation in epidote in accordance with Figure 4C; K-fds: K-feldspar, Ab: Albite, Zeo: Zeolite. .............................................................................................................. 69
Figure 33. (Al+Q)–Mg–Fe compositional classification diagram for chlorite (Zane and Weiss, 1998) in the ASK86 and ASK57 core samples, and comparison with samples from the (A) Geitafell (Friðleifsson, 1983a) and (B) Hellisheiði (Helgadóttir et al., 2015) geothermal systems. (C) Backscatter electron image of ASK86-01 showing interstitial chlorite with plagioclase and amphiboles in the matrix. (D) Backscatter electron image of ASK86-01 showing chlorite in a vesicle with interstitial albite and amphibole; Amph: amphibole, Plg: plagioclase, Ab: albite. ............................................... 71
Figure 34. Plots of (A) Si/Al against (Ca+Mg)/(Na+K) and (B) TSi (Si/Si+Al) against Na/(Na+Ca) for classification of zeolite-group minerals, showing compositions of zeolites from ASK86 and ASK57 cores and a comparison with zeolites from different areas around the world (electron microprobe data for which the charge balance error (E) is better than ±10%). Stilbite: Lauren Hill Intrusion (Bargar et al., 1993), Harborville (RRUFF Project Website); Stellerite: Kustani Region and Clackamas County (RRUFF Project Website); Chabazite: Laurel Hill intrusion (Bargar et al., 1993); Yugawaralite: Khandivali Quarry (RRUFF Project Website); Wairakite: Laurel Hill intrusion (Bargar et al., 1993) and Medicine Lake Volcano (Bargar et al., 1993); Heulandite: Prospect Park, Passaic County; Epistilbite: Berufjörður, Iceland (RRUFF Project Website); and Laumontite: Pine Creek, Inyo County (RRUFF Project Website). .................. 72
Figure 35. (A) Stilbite from ASK-57-05 under the polarizing microscope in a vesicle, crystallized between a quartz rim and calcite. (B) Backscatter electron image from ASK57-05 showing the same mineral phases as in panel A; Stb: stilbite, Qz: quartz, Cal: calcite, K-fds, K-feldspar. .................................. 72

xvi
Figure 36. Cluster of stellerite crystals in ASK86-12 filling a fracture seen in a polarizing microscope; (B) Backscatter electron image of ASK86-12 showing stellerite in a vein cross-cutting the matrix; Str: Stellerite, Amph: amphibole, Ttn: titanite, Mt: magnetite. ........................................................... 73
Figure 37. Cluster of yugawaralite crystals filling a vesicle in ASK86-07 seen under a polarizing microscope; (B) Backscatter electron image of ASK86-07 showing yugawaralite in a vesicle with K-feldspar intergrown; Yug: yugawarilite, Wa: wairakite, K-fds: K-feldspar. .............................................. 73
Figure 38. (A) Prismatic chabazite crystals of ASK86-09 seen under a polarizing microscope; (B) Backscatter electron image of ASK86-09 showing a chabazite crystal with K-feldspar intergrown, Cbz: chabazite, Ep: epidote, Wa: wairakite, K-fds: K-feldspar. .................................................................... 74
Figure 39. (A) Prismatic laumontite crystals in a vesicle in ASK86-07 (dashed white line shows the vesicle border) seen under a polarizing microscope; (B) Backscatter electron image of ASK57-10 showing instertitial laumontite crystals in the center of the picture, filling the last empty hole in the vesicle after epidote, actinolite and calcite crystallization, Lau: laumontite, Ep: epidote, Chl: chlorite, Act: actinolite, Cal: calcite. .......................................... 74
Figure 40. (A) Interstitial wairakite in a vesicle in ASK86-01 seen under a polarizing microscope; (B) Backscatter electron image from ASK86-01 showing a wairakite crystal with K-feldspar intergrown. (C) Diagram for the classification of the wairakite-analcime compositional series with the ASK86 and ASK57 wairakite compositions. Red field represents the composition of wairakite in geothermal wells, and the purple field in metamorphic rocks (Utada, 2001); Wa: wairakite, Chl: chlorite, Ep: epidote, K-fds: K-feldspar. ............................................................................... 76
Figure 41. (A) Backscatter electron image of ASK86-07 showing magnetite with intergrowth of titanite in a matrix primarily composed of albite. (B) Backscatter electron image of ASK86-12 showing skeletal ilmenite partially replaced with titanite. Ttn: titanite, Ab: albite, Qz: quartz. ............... 78
Figure 42. (A) The ternary diagram TiO2-Fe2O3-FeO showing the major solid-solution series and the approximate fields in which different Fe-Ti oxides can be found (redrawn after Buddington and Lindsley, 1964; domains taken from Nadoll, 2011). The fields within dashed black lines mark the compositions of primary Fe-Ti oxides in volcanic rocks from Geitafell volcano: 1 ilmenite in grabbros and lavas, 2 titanomagnetite in gabbros, lavas and acid rocks, 3 magnetite in gabbros (Thorlacius, 1991); (B) FeT [FeO wt% *(molar mass Fe/ molar mass FeO)] versus V/Ti [(V2O3 wt% * (2 * molar mass V/molar mass V2O3)/(TiO2 * molar mass Ti/molar mass TiO2)] proposed by Wen et al. (2017) for magnetite discrimination. Note that the vertical axis is logarithmic. Data for igneous magnetite from mafic to felsic volcanic rocks are taken from varies authors cited in Wen et al. (2017). The bold black line marks the boundary between unaltered and hydrothermally altered igneous magnetite. The dashed black line in (B) is

xvii
the approximate boundary separating re-equilibrated porous magnetite and hydrothermal magnetite. The blue solid arrow represents the trend of re-equilibration towards hydrothermal magnetite, showing that the concentration of Ti in magnetite drops during the dissolution-reprecipitation process (Wen et al., 2017). ....................................................... 78
Figure 43. (A) Backscatter electron image showing skeletal ilmenite partially replaced with titanite (B) Backscatter electron image from ASK86-07 showing instititial titanite in the matrix. (C) Al vs Fe diagram showing the Fe/Al ratio domains of titanites. Titanites in volcanic and plutonic rocks typically plot close to the 1:1 line and almost always have >1:2 ratio; in silica-undersaturated volcanic and plutonic rocks, typically >1:1 ratio; in metamorphic, hydrothermal, and pegmatitic environments, they have widely scattered Fe/Al; whereas eclogite tends to have titanite with the lowest Fe/Al, typically <1:8 (Kowallis et al., 2018). (D) Al+Fe vs F (a.p.f.u) diagram showing the compositions of titanite formed in different environments (redrawn after Kowallis et al., 2018); Ab: albite, Qz: quartz, Ilm: ilmenite, Ttn: titanite, Mt: magnetite. ....................................................... 79
Figure 44. (A and B) Backscatter electron images of ASK57-05 showing calcite, epidote, and zeolites filling vesicles and hosting acicular actinolite; Ep: epidote, Zeo: zeolite, Amph: amphibole. ......................................................... 81
Figure 45. (A and A’) Photographs showing flow texture and chilled margins formed by hydrothermal alteration of the rock. (A) ASK57 core section from 443.90 m to 444.74; (A’) Unrolled section from image (A). (B and B’) Photographs showing structural control on the fluid patterns forming veins and alteration halos; (B) ASK57 core section from 457.67m to 458.41; (B’) Unrolled section from B image; (C and C’) Photographs showing textural control on the secondary mineralization and the formation of veins and amydales. (C) ASK86 core section from 480.25m to 480.7m (C’) Photograph using binocular microscope of the ASK86-10 sample at 480.54m depth. (D) ASK86 core section from 492.80to 492.92, showing structural contact control on the fluid patterns that altered both lithologies, the felsic rock (rhyolite) at the top and the mafic rock (basalt) below. (A, A’, B, B’,C, C’ and D are images provided courtesy of Dr. Guðmundur Ómar Friðleifsson). ........................................................................................... 85
Figure 46. (A) Backscattered electron image of ASK86-11 showing anhedral re-crystallized magnetite in a matrix. (B and C) Backscattered electron image maps of ASK86-12 and ASK57-09, respectively, showing Ti concentration in matrix related to ilmenite and titanite. ................................... 86
Figure 47. Vein systems in some of the samples from Hoffell/Miðfell wells. (A) Photomicrographs from ASK86-05 in plane-polarized light showing a calcite vein cross-cutting a chlorite vein; (B) Photomicrographs from ASK57-10 in plane-polarized light showing an epidote vein cross-cutting a quartz vein; (C) Photomicrographs from ASK57-11 in cross-polarized light showing a calcite vein cross-cutting euhedral quartz. .............................. 87

xviii
Figure 48. (A) Geopetal structure of chlorite (Chl)-smectite (Smc?)-epidote (Ep), showing on-going alteration of likely smectite (light-teal green) to microcrystalline chlorite (dark-green). (B) Photomicrograph from ASK86-12 showing rim and irregular shape veins of chlorite with interstitial quartz (bright) and feldspars (brownish). (C) X-ray map showing the crystalization sequence of secondary minerals in a vesicle: quartz (Si-rich, light blue) chlorite (Al-rich, dark-green) epidote (Al-rich, light-green) calcite (Ca-rich, orange) ................................................................... 88
Figure 49. X-ray maps showing the crystallization sequence of secondary minerals in some vesicles. (A) quartz (Si-rich, light blue) zeolite (Si- and Ca-rich, pale blue) calcite (Ca-rich, orange) K-feldspar (K-rich, blue); (B) quartz (Si-rich, red) calcite (Ca-rich, green); (C) chlorite rim (Mg-rich, light green) calcite (Ca-rich, red) epidote (Ca- and Al-rich, orange, coarse grains). ................................................................................................... 88
Figure 50. (A) Backscattered electron image of a vesicle infilling from ASK86-01 showing albite (dark grey) integrowth with calcite (light grey) and drusy albite filling an open space. (B and C) X-ray maps of a vesicle infilling from ASK86-01showing albite (Na-rich, blue) and K-feld (K-rich, pink) intergrowth with zeolite (Si-rich, light blue) after epidote crystallization (Ca-rich, orange). ............................................................................................. 89
Figure 51. X-ray maps of a vesicle from ASK57-10 showing the crystalization sequence of secondary minerals. (A) Coarse-grained crystals of epidote (Ca) on a vesicle border; (B) Zeolites (Si-rich, pale yellow) filling the center of the vesicles (and quartz veins (Si-rich, yellow); (C) Acicular actinolite (Mg-rich) intergrowth with zeolites (green lines in the center of the vesicle); Notice the presence of albite (Na-rich, red in the Figure A), quartz veins (Si-rich, intense yellow in the Figure B) and chlorite in the matrix. ............................................................................................................... 89
Figure 52. X-ray maps of a vesicle of ASK86-07 showing the crystallization sequence of secondary minerals. (A) Rim of chlorite (Mg-rich, green); (B) Coarse-grained epidotes (Ca-rich, orange); (C) Zeolites (Si-rich, blue) as the last crystallization phase. ........................................................................................ 89
Figure 53. (A and B) Photomicrographs of vapor-rich fluid inclusions in the quartz of ASK86-09. Thin section under the polarizing microscope. ............................. 94

xix
List of Tables Table 1. Wells and core sections used for this study ........................................................... 33
Table 2. Representative microprobe analyses of plagioclase in the matrix reported as wt% oxide components and number of cations. Calculated cation numbers of plagioclase on the basis of 8 oxygen atoms, using the spreadsheet for mineral formula calculations at https://serc.carleton.edu/. ............................... 61
Table 3. Representative microprobe analyses of feldspars in vesicles, wt% oxides and number of cations. Cation numbers were calculated on the basis of 8 oxygen atoms, using spreadsheets for mineral formula calculations at https://serc.carleton.edu/. .................................................................................. 63
Table 4. Representative microprobe analyses of pyroxenes. Calculated number of cations on the basis of 6 oxygen atoms, using the spreadsheet for mineral formula calculations at https://serc.carleton.edu/. ............................................ 64
Table 5. Representative microprobe analyses of amphiboles. Calculated number of cations on the basis of 24 oxygens, using the spreadsheet for mineral formula calculations by Locock ( 2014, and based on the nomenclature of amphiboles by Hawthorne et al. (2012). ........................................................... 66
Table 6. Representative microprobe analyses of epidotes. Calculated number of cations on the basis of 12.5 oxygen atoms, using the spreadsheet for mineral formula calculations at https://serc.carleton.edu/. ............................... 68
Table 7. Representative microprobe analyses of chlorites. Calculated number of cations at the standard of 28 anions, using a spreadsheet at: http://www.open.ac.uk/earth-research/tindle/AGT/AGT_Home_2010/Microprobe-2.html, and based on the nomenclature of chlorites by Deer et al. (2013). ........................................ 70
Table 8. Representative microprobe analyses of zeolite group minerals. Calculated number of cations in each zeolite (based on the nomenclature of zeolites by Deer et al. 2013), using the spreadsheet for mineral formula calculations at: https://serc.carleton.edu/. Calculated charge balance E%, according to Passaglia (1970) and Deer et al. (2004): E% = 100 × [(Al + Fe3+) – (ΣM+) – 2(ΣM2+)]/ [(ΣM+) + 2(ΣM2+)]. H2O component returned by difference from 100% using the total oxide wt.% (Campbell et al., 2016). ...................... 75
Table 9. Representative microprobe analyses of magnetite and ilmenite. Calculated number of cations on the basis of 4 oxygen atoms (spinel group), using the spreadsheet for mineral formula calculation at https://serc.carleton.edu/. FeT (wt%) and V/Ti values calculated based on Wen et al. (2017). FeT = [FeO wt% *(molar mass Fe/ molar mass FeO)] and V/Ti = [(V2O3 wt% * (2 * molar mass V/molar mass V2O3)/(TiO2 * molar mass Ti/molar mass TiO2)] ................................................................................................................ 77
xx
Table 10. Representative microprobe analyses of titanite. Calculated number of cations on the basis of 5 oxygen atoms, using the spreadsheet for mineral formula calculation at https://serc.carleton.edu/. ........................................................... 80
Table 11. Representative microprobe analyses of calcite. Calculated number of cations on the basis of 6 oxygen atoms, using the spreadsheet for mineral formula calculation at https://serc.carleton.edu/. ........................................................... 81
Table 12. Temperature ranges of hydrothermal alteration minerals and the conditions of their formation in the Hoffell/Miðfell wells from : 1. Palmason et al., 1978 (ML-CM: mixed-layer clay minerals); 2. Corbett and Leach, 1997, 3. Reyes, 1998; 4. Manning and Bird, 1986; 5. Kristmannsdóttir, 1979; 6. Larsson et al., 2002; 7. Nadoll et al., 2014 and Zhao et al. 2019; 8. Thompson and Thompson, 1996; 9. Kristmannsdóttir and Tómasson 1978; 10. Marosvölgyi, 2009; 11. Fridriksson et al., 2001; and 12. Weisenberger and Selbekk, 2009. Note: Figure G 2 shows the secondary mineral association at different levels in the Hoffell/Miðfell core sections. ................. 90
Table 13. Comparison of vein systems and vesicles infilling episodes defined by Friðleifsson (1983 a, b) with this study. ab: albite, act: actinolite, cal: calcite, cha: chabazite, chc: chalcedony, chl: chlorite, cpx: clinopyroxene, ep: epidote, fds:feldpar, gt: garnet, heu: heulandite, ill: ilmenite, K-fds: K-feldspar, lau: laumontite, mo: mordenite, py: pyrite, px: pyroxene, qz: quartz, sph: sphene, pr: phrenite, sco: scolecite, stb: stilbite, str: stellerite, ttn: titanite, tho: thomsonite, wa: wairakite, yu: yugawaralite. ........................ 98

xxi
Abbreviations SEM-EDS = Scanning Electron Microscope with an Energy Dispersive Spectrometer
EPMA = Electron Probe Micro-Analyzer
Wt% = weight percentage
Ab = albite
Amph = amphibole
An = anorthite
Cal = calcite
Cbz = chabazite
Chl = chlorite
Cpx = clinopyroxene
Cz = clinozoisite
Ep = epidote
En = enstatite
Fds = feldspar
Fs = fosterite
Hbl = hornblende
Ilm = ilmenite
K-fds = K-feldspar
Mt = magnetite
Or = orthoclase
Pm = piemontite
Qz = quartz
Stb = stilbite
Str = stellerite
Ttn = titanite
Wo = wollastonite
Wa = wairakite
Yug = yugawaralite
Zeo = zeolite


xxiii
Acknowledgements
The success and final outcome of this thesis required a lot of support from many people. First, I would like to express my gratitude to the Government of Iceland for funding the scholarship to pursue this master program in Geothermal-Geology through GRÓ GTP at the University of Iceland. I also would like to express my deepest gratitude to Mr. Lúdvík S. Georgsson ex-director of UNU-GTP (currently GRÓ GTP) for the given opportunity to be part of the masters´ program, and the GRÓ GTP staff Guðni Axelsson, Málfríður Ómarsdóttir, Ingimar Haraldsson, Vigdís Harðardóttir, Markús Wilde and for all the support during my studies in Iceland.
Gratitude to my supervisors Enikö Bali and Guðmundur Heiðar Guðfinnsson for providing me this thesis and for the time and knowledge invested on it. Special thanks to Guðmundur Ómar Friðleifsson for the valuable comments and suggestion in this thesis.
In Ecuador, thanks to Matilde Urquizo for giving me the opportunity to have being part of the Geothermal Department of CELEC EP that allowed me to participate in the UNU-GTP program, and Bernardo Beate for introducing me to the geothermal world and encouraging me to do a master’s degree.
I thank all who were part of my journey during my self-esteem and self-confidence redesign before to come to Iceland, and to you Byron for believing in yourself and in your dreams.


25
1 Introduction Understanding hydrothermal systems in volcanic regions at plate boundaries is important for geothermal exploration and exploitation. Plausible pre-production geothermal models have generally been developed based on direct geological, physical and chemical measurements in drill holes. The internal structure of explored fossil and active high-temperature systems give hints of the interaction between high-temperature fluids and host rocks at different pressures, revealing how extensive hydrothermal alteration has been printed in the rocks and the existence of different flow patterns. Analysis of such fluid circulation allows to trace the temperature evolution and chemical changes in systems in order to estimate the productive life of a reservoir and suggest new exploratory and/or production drilling sites.
Hydrothermal alteration is the mineralogical, textural and chemical response of the rocks to thermal and chemical changes in their environment. Hydrothermal alteration causes mineral phase transformations, growth of new minerals, dissolution and precipitation of minerals, and ionic interchange between minerals of the rocks and fluids. The original composition of the rocks is important; however, the most influential factors are the permeability of the system, temperature and the composition of the hydrothermal fluids.
Temperature affects the order and type of mineral crystallization. Higher temperatures favor the formation of more crystalline minerals (Corbett and Leach, 1997). For example, well-crystallized epidote forms at >220°C, but poorly crystalline grains form already at 180°C (Reyes, 1990). Fluid properties, especially its acidity (pH) and chemical components, control the stability ranges of different mineral phases at different temperatures. For example, the CO2 concentration of the fluid determines the precipitation of calcite or wairakite at <300° (Corbett and Leach, 1997). Furthermore, low pH of hydrothermal fluids tends to cause significant alteration of rocks. All these changes are conditional on primary and secondary permeability of the host rock. These factors control in how much contact the host rock is with hydrothermal fluids and govern plenty of secondary structures (e.g., in amygdales and veins) that provide evidence for the deposition sequences and overprinting of secondary minerals during different thermal events.
Geitafell central volcano, where the geothermal wells of the present study are located, is a fossil and exhumed geothermal system, considered an analogue of the active Krafla geothermal system. Some studies have been done in the area related to its tectonic evolution (Saemundsson, 1979), stratigraphy, hydrothermal alteration, metamorphism, (Friðleifsson, 1983, Liotta et al., 2018), petrology (Thorlacius, 1991), fluid interaction, heat sources (Friðleifsson, 1984, and Pope et al., 2014), fracture analyses and fluid pathways (Liotta et al 2018). As a result, different phases of magmatism have been unraveled and fluid circulation models have been developed in order to understand the thermal evolution of this central volcano. However, almost all geothermal models have uncertainties that can be minimized with new data. In general, detailed and published studies of mineral chemistry from Icelandic geothermal systems are scarce.

26
The objective of this study is to constrain the evolution of the multi-stage hydrothermal alteration of the Hoffell/Miðfell area within the southern part of Geitafell volcano. To this end, I have done petrographic and chemical identification of secondary mineral phases present in the cores from the ASK-57 (from 362.80 to 465.70 m depth) and ASK-86 (from 364.00 to 505.00 m depth) wells. This analysis has resulted in a model that builds on previous studies (like detailed mapping in an exhumed field) to better define the different thermal events and temperature evolution. Although analysis, storage and acquisition of core sections are more expensive than cuttings samples, the core samples offer a great advantage by giving undisturbed cross-sections, sample mixing is avoided, original structures are preserved, and chemical alteration by drilling fluids does not take place, giving highly accurate chemical analyses.
1.1 Geological framework Iceland is a basalt plateau located at the divergent plate boundary of the Eurasian and American plates, specifically at the junction of the Mid-Atlantic Ridge and the Greenland–Iceland–Faeroe Ridge. In addition, Iceland is a result of the interaction between this spreading plate boundary with a mantle plume (Vink, 1984; White et al., 1995; Bjarnason et al., 1996; Wolfe et al., 1997; Allen et al., 1999). As a consequence, Iceland is entirely made up of volcanic rocks, predominantly basalts (~80-85%), and lesser amounts of intermediate and felsic rocks (~10%) and volcano sediments (~5-10%) (Sæmundsson, 1979; Friðleifsson, 1983a). This succession has formed a platform of 350,000 km2 with a crustal thickness of 10-40 km that rises more than 3000 m above the surrounding sea floor (Gudmundsson, 2000). Approximately 30% of this platform is above the sea level and forms an emergent 312 × 490 km wide island, which constitutes the subaerial part of Iceland. It started forming about 44-26 million year ago. The oldest rocks at the surface date to about 16 million years ago and are found in the northwest of the island (Westfjords), whereas older rocks are situated below sea level. In addition, the North Atlantic Igneous Province (NAIP), that includes Iceland, is the result of mantle plume activity for the last 65 million years (Saunders et al., 1997).
Active volcanism in Iceland results from superposition of the spreading plate boundary over the Iceland mantle plume as well as the relative motion of these two structures. The surface expression of this interaction is the formation of volcanic zone lineaments (Figure 1). The following descriptions of these volcanic zones are taken from Foulger et al. (1992), Gudmundsson (1995), Gudmundsson (2000), Thordarson and Larsen (2007), Einarsson, (2008) and Thordarson and Geirsdóttir (2019).
The RVS (Reykjanes Volcanic Zone) is characterized by fissure eruptions beneath the Pleistocene glacier, postglacial eruptive fissures, normal faults and open fissures that are arranged en echelon along the plate boundary. The WVZ (West Volcanic Zone) is formed by open fissures and eruptive fissures, which activity has been dwindling in the last few million years and only a minor part of the total spreading is occurring in this zone at the present. The EVZ (East Volcanic Zone) is characterized by eruptive fissures and normal faults. These fissure swarms of the volcanic systems are largely parallel to the zone itself and define a strong NE trend. It has taken over as the main rift zone in the southern half of Iceland from the receding WVZ in the last 3 million years. The NVZ (North Volcanic Zone) is formed by rifting structures, eruptive fissures and lava shields, which are responsible for

27
a good part of the Holocene volcanism. Although the systems of the NVZ all have some of the characteristics of volcanic systems, they are remarkably different from each other in their volcanic structure, magma composition and volcanic activity (e.g, the Þeistareykir, Krafla and Askja volcanic systems). The MIB (Mid-Iceland Belt) does not fit readily into the rift zones as the mentioned above, and volcanic activity has been low in the Holocene.
Volcanism also occurs in zones outside the immediate plate boundary. There are two volcanic belts in Iceland, with an age < 2 million years, forming a clear unconformity with older volcanic rock formations. The first is the SSW-NNE trending Öræfajökull Volcanic Belt (ÖVB) located east of the plume center, and represented by normal faults and extensional fissures. Geitafell central volcano is located to the east of this volcanic belt. The second is the WNW-ESE trending Snæfellsnes Vocanic Belt (SVB), which related to the development of a NE-SW transform zone system.
In addition, there are two main seismic zones. The first is the Tjörnes Fracture Zone (TFZ) which is located off the northern part of Iceland, and characterized by a broad zone of seismicity, transform faulting and crustal extension that connects the southern end of the submarine Kolbeinsey Ridge to the Northern Volcanic Rift Zone (Einarsson, 1991; Stefánsson et al., 2003). The second is the South Iceland Seismic Zone (SISZ), which is located in the southern part of Iceland, and takes up the transform motion between the Reykjanes Ridge and the Eastern Volcanic Zone (Einarsson, 1991).
It has been estimated that the average eruption recurrence is one eruption every five years or 200 eruptions in the last 1000 years. This means that there have been 5 million eruptions since the birth of Iceland, 24 million years ago (Gudmundsson et al., 2008). The current active volcanoes have been grouped with fissure swarms to define volcanic systems. Fissure swarms are elongate volcanic structures, which are aligned to the axis of their host rift zone, and they are expressions of elongated magma reservoirs (Thordarson and Geirsdóttir, 2019). All together there are 30 active volcanic systems in Iceland (Figure 1).
Central volcanoes are the largest volcanic edifices, commonly capped by calderas where geothermal circulation is enhanced. Within the rifting zones, their activity tends to occur in distinct rifting episodes, characterized by “eldar” (fires in Icelandic), which entails an episode composed of recurring earthquake swarms and volcanic eruptions within the fissure swarm (Thordarson and Geirsdóttir, 2019). Within the summit caldera, the eruptions occur on circular summit vents or ring fractures, or on short, often radial, fissures on the outer flanks of the volcano (Gudmundsson, 2000). Tertiary-age central volcanoes show an effusive basaltic volcanism domain with small periods of intermediate and silicic volcanism (Thordarson and Larsen, 2007).
In this context, Geitafell is a central volcano in the SE of Iceland, formed within a rift zone in central Iceland. It was active from 5 to 6 million years ago (Late Miocene). Its volcanic edifice consists of tholeiitic lavas (60%), hyaloclastites (30%) and rhyolite (10%). These volcanic products are the result of a long period of magmatic activity characterized by the extrusion of relatively evolved, small volume, phenocryst-poor basaltic lavas, grading into basaltic andesites, and early events that included the mixing of basic and acid magma, resulting in the production of composite units (Thorlacius, 1991; Figure 2). The volcano experienced central region uplift, caldera subsidence and a regional flexure that modified its structure. Several intrusion events have been mapped, including gabbro intrusions, radial

28
dike swarms, cone-sheet swarms, acid intrusions and basaltic dike swarms (Friðleifsson, 1983a; Burchardt and Guðmundsson, 2009).
Figure 1. Distribution and names of active systems within the volcanic zones and belts in Iceland as depicted by Jóhannesson and Sæmundsson (1998) in Thordarson and Höskuldsson (2008). Abbreviations are as follows: RR, Reykjanes Ridge; RVB, Reykjanes Volcanic Belt; SISZ, South Iceland Seismic Zone; WVZ, West Volcanic Zone; MIB, Mid-Iceland Belt; EVZ, East Volcanic Zone; NVZ, North Volcanic Zone; TFZ, Tjörnes Fracture Zone; KR, Kolbeinsey Ridge; ÖVB, Öræfi Volcanic Belt; and SVB, Snæfellsnes Volcanic Belt. Numbers refer to volcanic systems listed in Table 1. The large open circle indicates the approximate centre of the Iceland mantle plume/anomaly as depicted by Wolfe et al. (1997).
1.2 Geothermal Systems Geothermal systems are active hydrothermal resources that occur in widely diverse geologic settings. These requires fluid, heat (temperature), and permeability for being economically affordable to produce energy or other direct uses. In Iceland, the geothermal systems have been classified as high- or low-temperature areas. Most of the high-temperature systems are associated with central volcanoes or within active fissure swarms on the plate boundary (Arnórsson et al., 2008). These systems have temperature over 200°C at 1 km depth within an active central volcano (e.g., Askja, Hengill, Kerlingarfjöll, Krafla, Þeistareykir, Katla), or are outside of a central volcano but near the center of an active volcanic system (e.g., Reykjanes, Eldvörp-Svartsengi, Krýsuvík), are at the margin of a central volcanoes (e.g., Námafjall, Hrómundartindur, Grændalur), or outside the margin of central a volcano but on a fissure swarm (i.e. Öxarfjörður, Geysir, Hveravellir). Low-temperature areas are generally located at faults or fault systems outside of active volcanoes. Most of them occur in early Quaternary rocks (West and South of Iceland). There are about 250 known low-temperature

29
systems in Iceland, ranging from minor hot spring areas to major thermal areas. Their temperature are much higher at the top of the systems than elsewhere at similar depth, and remain constant or little change at certain depth in lower parts. (Guðmundsson, 2018).
Figure 2. Location of Geitafell central volcano, outlined with a dashed red line, and the surface lithology in the SE of Iceland. The location of Hoffell, the site of the boreholes, is marked with a filled red triangle. (Base map from http://jardfraedikort.is/index_enska.html)
Fossil high-temperature systems mainly occur in Tertiary and Lower-Quaternary formations, related to central volcanoes (e.g., Breiðdalur, Setberg, Vatnsdalur, Geitafell). These volcanic complexes are typically embedded within basaltic rock sequences formed by fissure swarms, interbedded with intermediate to acid volcanic products. These fossil systems have alteration aureoles composed of abundant chlorite and epidote mainly. Other secondary mineral identified in these systems include calcite, quartz, actinolite, adularia, albite, garnet and sulfides indicating temperatures over 250°C (Arnórsson et al., 2008).
In Geitafell, the formerly active high temperature hydrothermal system has been zoned by mineral assemblages that show progressive appearance of index minerals (chlorite epidote garnet actinolite) in matrix, vesicles, and veins as a result of interaction between hot intrusive rocks and ground-waters at shallow depths, resulting in contact metamorphism and hydrothermal alteration that includes sanidinite facies, hornfelses and skarn deposits (Friðleifsson, 1983a). Liotta et al. (2018) has stated that the temperature of the circulating fluid ranged from 255°C to 320 °C, and progressively cooled down to 60–90 °C at the boundary between the magma chamber and host rocks in Geitafell. They also mention the mixing of high (up to 10.6 wt% NaCl equiv.) and low-salinity fluids in the system that mixed with meteoric fluids.

30
1.3 Description and well locations The Hoffell and Miðfell localities (Figure 3) are within an area recently discovered as a low-temperature geothermal field (e.g., Kristinsson et al., 2020), within the southeastern flank of the deeply eroded Geitafell volcano, and within its high-grade actinolite zone (Friðleifsson 1983a). The geothermal field is about 20 km north of the Höfn village in Hornafjörður. (for regional location see Figure 2).
A temperature deviation discovered near Hoffell during a regional geothermal survey by shallow drilling in the Hornafjörður area prompted a systematic geothermal exploration that began in 1992 (Stapi, 1994, Surface geology, magnetic measurements, chemical analysis of water and drilling survey were completed. As a result, the area was shown to have abnormal thermal gradient (up to 186°C/km) and 70-80°C temperature deep in the system based on fluid chemical composition analysis (Stapi Geological Services,1994). According to the borehole map viewer of Orkustofnum, there are currently 6 deep hot-water wells and 40 gradient wells in the area (Figure 3).
The following description of the wells, used in this study, is based on the borehole database of Orkustofnun (https://orkustofnun.is/orkustofnun/gagnasofn/borholur/). Detailed information about the wells is in Table A 1.
1.3.1 ASK-57.
Well ASK-57 is vertical, sited between Hoffell and Miðfell (64°N 23.634', 15°W 20.560'; WGS84) and is allocated to the Miðfell location (Figure 3). It was drilled down to 465.7 m depth, and its hole diameter varies between 168.3-75.69 mm. This well was drilled in four different periods. The first started in December 1993 and reached 206 m depth, the second in July 2002 from 206 to 306 m depth, the third in December 2005 from 306 to 364 m depth, and the last one in May 2006 down to the final depth of 465.7 m. It was not drilled further down because of the hardness of the rock. Only drill cuttings were recovered from the first 362.8 m of the well, but a continuous drill core from the remaining 102.9 meters. Geological summary of the core section is shown in Figure A 1. In accordance with a heat-flow chart, the geothermal gradient is about 110°C/km in the well down to 206 m depth. Later on a feed zone was found at 341.0 m depth.
1.3.2 ASK-86.
ASK-86 is also a vertical well, located south of well ASK-57 at a distance of 156 m (64°N 23.551', 15°W 20.588'; WGS84) (Figure 3). It was drilled down to 505.0 m depth, and its hole diameter varies from 219.07-75.69 mm. This well was drilled in two different periods. The first drilling started in December 2003 and reached 364 m depth. Due to the very dense and very tough rock found at the bottom of the first drilling stage, the drilling method was changed from cushion drilling to continuous-coring, with nice core recovery. This second drilling started in July 2006 and reached to the present bottom, 505 m. A feed zone was located at 364.0 m, and hot artesian water (54°C) with flow rate about 3.5 l/s resulted at the wellhead.

31
Figure 3. Location of the ASK-57 and ASK-86 wells at the Hoffell/Miðfell localities (Base map taken from https://orkustofnun.is/orkustofnun/gagnasofn/borholur/).


33
2 Methods This chapter documents the procedures and methods used for the analysis of the samples selected. The sampling from the core sections was made at Reykjanes Power Plant where the recovered drill cores were temporarily stored, and lab analyses were made at the Institute of Earth Sciences, University of Iceland
2.1 Sampling There were 102.9 m and 129.63 m long drill core sections recovered from wells ASK-57 and ASK-86, respectively (Table 1). The lithological sequence is similar in both wells (Figure A 1). The rocks are mainly volcanic of basaltic composition, highly vesicular and altered. The alteration produced secondary mineral phases in the rock matrix, former vesicles and fractures seen in the cores. The sampling focused on rock sections with high concentrations of amygdales and veins. From the ASK-57 core, 11 samples were collected and 12 samples from the ASK-86 core. A ~5-8 cm long section was cut from each chosen part of the core and split lengthwise. One of the half sections was returned to the original core box for archive, and the other half was taken for this study.
Table 1. Wells and core sections used for this study
Well Core section Number of samples collected ASK-57 from 362.80 to 465.70 m depth 11 ASK-86 from 364.00 to 505.00 m depth 12
2.2 Stereomicroscope analysis A fairly large portion of the core sections sampled (~5 cm in length) was analyzed under stereomicroscope to define color, textures, microstructures, vesicle sizes, and the mineral phases that comprise the rock (Appendix B). Furthermore, this analysis helped decide which samples to take for thin section preparation, to be inspected under the petrographic microscope. Samples were inspected dry and wet. Wetting of the samples enhances the color of minerals, especially the alteration phases. 10% HCl solution was also used to find carbonates. The analysis was done using an Olympus Stereomicroscope SZX10 with a video camera and Olympus Stream Software.
2.3 Petrographic microscope analysis Petrographic analysis was an essential procedure for the analysis of the particular features and mineral phases of each rock sample. After the stereomicroscope analysis, 5 samples from the ASK-57 core were chosen for thin section preparation and 7 from the ASK-86 core.

34
This analysis was used to define the texture and structure of the rock, optical and physical properties of primary and secondary mineral phases in the groundmass, vesicles and veins, their modal percentage in the rock, and to determine the rock type and the secondary mineralization sequence (Appendix C). It also helped to decide which thin sections should be analyzed with the Scanning Electron Microscope with an Energy Dispersive Spectrometer (SEM-EDS), and find secondary mineral phases with fluid inclusions. In total, 24 thin sections were made. Two thin sections were made from each sample, one with the standard 30 µm thickness, while the other is 100 μm thick. The 100 μm thin sections were made in order to ensure the preservation of fluid inclusions, if present. All the thin sections were analyzed under an Olympus BX51 polarized light microscope. The microscope has objective lenses of 2x, 4x, 10x and 20x magnification. Also attached is an Olympus UC30 camera with the ability to take photomicrographs with both plane and cross-polarized light, and a connection to a computer with image analysis software.
2.4 SEM-EDS analysis SEM-EDS analysis allowed recognition of mineral phases impossible to identify with the optical microscope and to uncover new ones not seen under the optical microscope. After the optical microscope analysis, 12 thin sections were carbon coated to make them electrically conductive for the SEM-EDS analysis. Chemical compositions were obtained with the Energy Dispersive Spectrometer (EDS) on the SEM, returning EDS spectra with element peaks that depend on the composition of the mineral under the electron beam. Each EDS Spectrum was compared to standard mineral spectrums from Reed (2005). As a result, 16 different EDS spectra were identified (Appendix D) and 10 mineral phases in different thin sections (Chapter 3 and 4). The SEM also provides backscatter electron images, and the EDS can be used to acquire element maps, which were helpful in determining mineral crystallization sequences (Chapter 5 and Appendix E). The Scanning Electron Microscope is a Hitachi TM3000 tabletop machine with an EDS from Bruker and the associated Bruker Esprit software for Windows. The accelerating voltage was 15 kV, and it was used in the analysis mode to determine element compositions of minerals.
2.5 Electron microprobe analysis After the SEM-EDS analysis, 6 thin sections were selected to determine mineral chemical compositions using an Electron Probe Micro Analyzer (EPMA). This analysis resulted in a data file of chemical components of each mineral phase identified in the previous analyses. To identify individual mineral phase, the oxide weight percentages were used as an input in specific formula spreadsheets, which calculate cation numbers based on the standard formula of each mineral phase (Appendix F). Analyses with total weight percentage of oxides, cation number and error values outside certain limits were dismissed. The electron microprobe analyses were performed with a JEOL JXA-8230 Super Probe. An acceleration voltage of 15 kV and a beam current from 2 to 10 nA were used. Well-characterized natural materials were used as primary and secondary standards. The electron microprobe also allows acquisition of backscatter electron (BSE) images.

35
3 Petrography Description General texture and mineralogical assemblages of the rock samples are similar in both drill cores. Most of the samples are amygdaloidal basalts and a few andesites and rhyolitic intrusions. The samples are very fine grained, and the groundmass generally consists of fine plagioclase, altered glass and oxides, yet with some variations.
The following descriptions are based on an observation under the polarization microscope using plane and cross-polarized light, aided by SEM observations coupled with use of the EDS.
3.1 ASK57-01 (365.65 m) The thin section of a basaltic-andesitic lava contains filled vesicles, namely amygdales, in a microcrystalline groundmass showing relatively even grain size with subhedral opaque minerals. The groundmass is composed of plagioclase embedded in a greenish altered matrix (Figure 4A). Vesicles are filled with chlorite, epidote, black fine-grained mass, and a bluish pleochroic mineral. According to an estimation from observation under the microscope, the sample consists of 70% groundmass and 30% vesicles (Table C 1).
The filled vesicles range in size from 2.5 mm to 7 mm (Figure C 1.1). They have low to elongate sphericity and are angular to sub-angular. Epidote has green to yellow color with a weak to moderate pleochroism. There are well-developed clusters of prismatic epidotes of up to 1 mm in length, filling the center of some vesicles (Figure 4B). Microcrystalline epidote is also observed as granular aggregates next to an unidentified black fine-grained material filling entirely rounded vesicles (Figure 4C). Chlorite is distinguished by medium to high relief with anomalous greenish to bluish interference colors in cross-polarized light (Figure 4D). This mineral fills entirely some vesicles forming concentric aggregates of laminar to fibrous crystals of up to 0.1 mm in length (Figure C 1.1). Colorless minerals partially fill some vesicles showing anomalous interference colors in polygonal granular aggregate with splintery surface (Figure 4D).

36
Figure 4. Photomicrographs of ASK57-01; A, B, C in plane-polarized light and D in cross-polarized; (A) Plagioclase embedded in an altered groundmass with anhedral oxides; (B) Cluster of prismatic epidotes filling the center of a vesicle; (C) Micro-epidote and fine-grained mass filling a rounded vesicle; (D) Concentric chlorite on the border of the vesicle enclosing both epidote and granular colorless minerals.
Based on SEM-EDS analysis, albite and amphiboles were identified in the rock matrix with interstitial epidote. The opaque mineral has been identified as disseminated chalcopyrite in the vesicles and the groundmass (Figure D 1.16). This analysis also confirms the emplacement of epidote and chlorite and shows the crystallization of calcite in vesicles (Figure 5A and 5B). According to the EDS spectra, the black, fine mass is microcrystalline chlorite, and this is also found interstitially between microcrystalline epidote with a few quartz grains (Figure 5C and 5D). The colorless mineral with splintery surface has been identified as interstitial albite filling remaining spaces in vesicles.

37
Figure 5. Backscattered electron images of ASK57-01 (A) Elongated vesicle filled with epidote, chlorite, calcite and tiny albite. The groundmass is composed of albite, amphibole and interstitial epidote ; (B) Cluster of epidotes with interstitial calcite and albite enclosed by chlorite at the edge of a vesicle (see Figure 4B); (C) Rounded vesicle filled with microcrystalline chlorite and epidote (see Figure 4C); (D) Zoom-in of image 5B showing microcrystalline epidote with both interstitial chlorite and quartz.
3.2 ASK57-05 (376.18 m) This thin section of a fine-grained basaltic andesite lava shows a microcrystalline texture with a few amygdales. The groundmass has experienced extensive alteration, and it is composed of microlites of plagioclase with interstitial chlorite and epidote. Plagioclase shows uniform size up to 0.2 mm in length, showing a weak flow alignment. A few disseminated opaque minerals, up to 0.05 mm in size, show cubic to anhedral habits (Figure 6A). The original vesicles are now filled with chlorite, epidote, quartz, and calcite. According to an estimation from observation under the microscope, the sample consists of 90% groundmass (60% plagioclase, 35% alteration minerals, 5% oxides) and 10% vesicles (Table C 2).

38
The filled vesicles have a size up to 8 mm and have medium sphericity and roundness (Figure C 2.1 and C2.2). Inside of these, epidote shows up as a cluster of elongate prismatic crystals up to 0.2 mm with zonation. Chlorites show fibrous habit, filling entirely some vesicles and forming a concentric rim on the border of others. Quartz shows well-developed prismatic crystals with plenty of primary and secondary fluid inclusions (Figure 6B). Rhombohedral calcite shows typical twin planes, and its grain size is about 3 mm. Calcite in the middle of vesicles also contains primary fluid inclusions (Figure 6C). Subhedral minerals with brownish to colorless pleochroism and second to third order interference colors are emplaced between calcite and the chlorite inside vesicles. In addition, acicular amphiboles show high relief and weak pleochroism, and these are embedded inside some vesicles with other alteration mineral (Figure 6D).
Figure 6. Photomicrographs of ASK86-05 with plane-polarized light; (A) Microlites of plagioclase embedded in an epidote-chlorite matrix; (B) Prismatic quartz with both primary and secondary fluid inclusions; (C) Calcite crystal with twinning planes surrounded by a colorless mineral and concentric chlorite and quartz. (D) Prismatic epidote (pale yellow) with acicular amphiboles embedded in a colorless to brownish mineral in the center of a vesicle
The SEM-EDS analysis shows that albite and amphibole with interstitial chlorite and quartz constitute the groundmass (Figure 7A). It also shows Ti-rich small grains, which apparently are ilmenite crystals in the groundmass (Figure 7B). SEM-EDS analyses also confirmed the presence of epidote, calcite, quartz, and chlorite in vesicles with a few chalcopyrite (Figure

39
7A and 7C). Additionally, acicular amphiboles were also identified inside of some vesicles (Figure 7D and 7E). Epidote is found as clusters and individual crystals, filling some veins within vesicles as the calcite does (Figure 7B). Well-developed prismatic and colorless zeolite crystals (based on EDS spectra, figure D1.12) were emplaced after quartz. Cluster of prismatic K-feldspar is found in the center of some vesicles and filling some veins inside of vesicles (Figure 7F).
3.3 ASK57-09 (424.36 m) This thin section of a basaltic lava has concentrically zoned amygdales in a microcrystalline matrix. The matrix is composed of plagioclase, more or less uniform in size up to 0.1 mm. Interstitial alteration minerals and disseminated oxides are also part of the matrix. Opaque minerals show subhedral grain shape with cubic habits of up to 0.05 mm in size (Figure 8A). Vesicles are filled with chlorite, epidote, and a brownish mineral. Empty cracks - of up to 0.1 mm thickness also occur cutting some vesicles (Figure 8B). Based on observation under microscope, the sample consists of 70% groundmass (40% plagioclase, 30% alteration minerals and 30% oxides) and 30% vesicles (Table C 3).
The vesicle sizes are from 0.5 to 6 mm. These have low sphericity and are sub-rounded to very angular (Table C 3.1, C 3.2 and C 3.3). The vesicles are filled completely with secondary minerals. Chlorite fills entirely some vesicles forming tabular to spherulitic scaly aggregates up to 0.1 mm in size (Figure 8A). This mineral also crystallizes concentrically on the border of some vesicles. Epidote shows yellowish pleochroism with high relief and well-developed prismatic crystals that are embedded in a brownish to colorless mass. In contrast to the other samples, here the epidotes are sparsely emplaced in the middle of vesicles as individual crystals (Figure 8B and 8C). Amphiboles are acicular crystals up to 0.2mm in length with greenish to brown colors and moderate relief. These form clusters of crystals in the middle of the vesicles, embedded in a brownish crystal mass (Figure 8D). This brownish to colorless mineral shows a moderate relief, prismatic form, with 1st to 3rd order interference colors, and splintery surface, emplaced after the chlorite crystallization (Figure 8B, 8C and 8D).

40
Figure 7. Backscattered electron images of ASK57-05. (A) Epidote on the border of a vesicle and albite and amphibole with both interstitial chlorite and quartz in the groundmass; (B) Combined backscattered electron image and an X-ray map that shows concentric distribution of quartz (Si-light blue) enclosing chlorite (dark blue), epidote (Ca- and Si-rich, small pale-yellow patches) and calcite veins (Ca-rich, orange). Notice the pink dots (Ti) in the groundmass (possibly titanite or ilmenite); (C) Epidote, chlorite and quartz inside a vesicle; (D) Border of a vesicle that shows epidote between quartz and chlorite, which are distributed concentrically within the vesicle; (E) Amphibole embedded in interstitial zeolites inside a vesicle; (F) Vesicle filled with a cluster of prismatic K-feldspar, zeolites (stilbite, see section 4.6), calcite and quartz, and concentric K-feldspar and epidote bands.
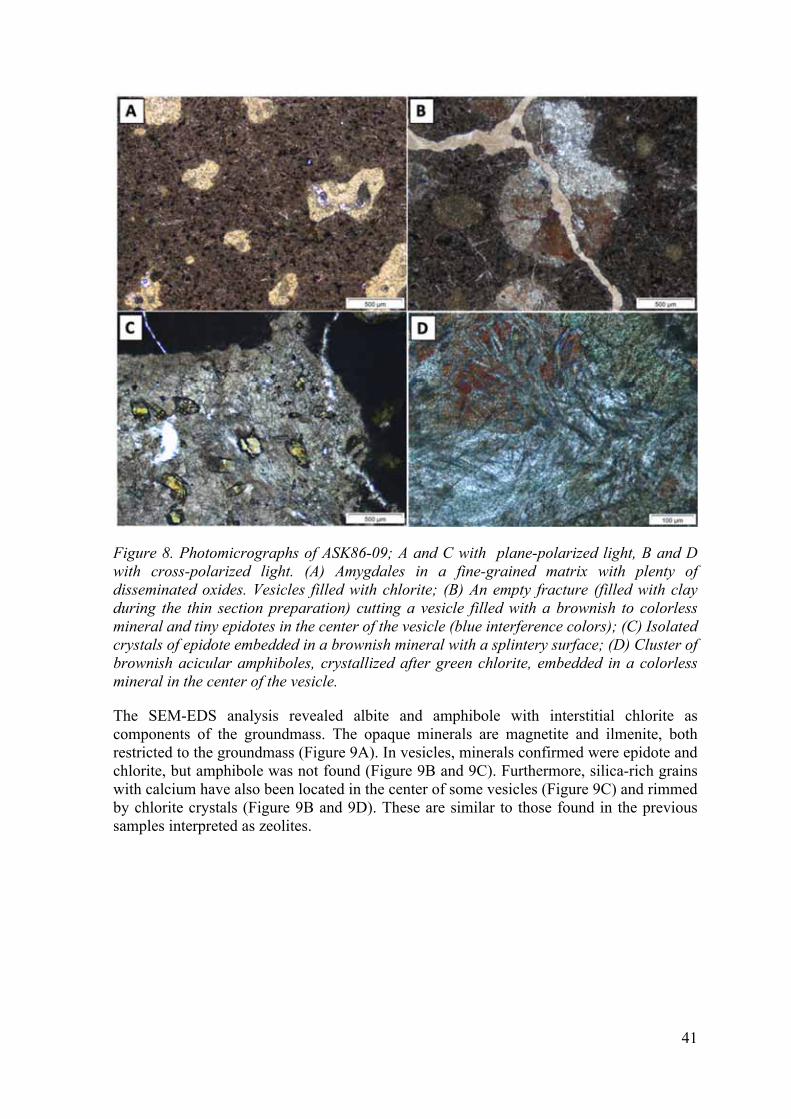
41
Figure 8. Photomicrographs of ASK86-09; A and C with plane-polarized light, B and D with cross-polarized light. (A) Amygdales in a fine-grained matrix with plenty of disseminated oxides. Vesicles filled with chlorite; (B) An empty fracture (filled with clay during the thin section preparation) cutting a vesicle filled with a brownish to colorless mineral and tiny epidotes in the center of the vesicle (blue interference colors); (C) Isolated crystals of epidote embedded in a brownish mineral with a splintery surface; (D) Cluster of brownish acicular amphiboles, crystallized after green chlorite, embedded in a colorless mineral in the center of the vesicle.
The SEM-EDS analysis revealed albite and amphibole with interstitial chlorite as components of the groundmass. The opaque minerals are magnetite and ilmenite, both restricted to the groundmass (Figure 9A). In vesicles, minerals confirmed were epidote and chlorite, but amphibole was not found (Figure 9B and 9C). Furthermore, silica-rich grains with calcium have also been located in the center of some vesicles (Figure 9C) and rimmed by chlorite crystals (Figure 9B and 9D). These are similar to those found in the previous samples interpreted as zeolites.

42
Figure 9. Backscattered electron images of ASK57-09 (A) Vesicle filled with chlorite embedded in a groundmass of albite, amphibole and disseminated oxides; (B) Vesicles filled with concentric chlorites and zeolites with tiny epidotes; (C) Well-developed epidotes embedded in prismatic zeolites filling a vesicle (see Figure 5D); (D) Combined backscattered electron image and an X-ray map showing silica-rich areas (bright purple) enclosed by concentric chlorite (light blue). Notice the small vesicles are only filled with chlorite and surrounded by the matrix (albite is bright pink).
3.4 ASK57-10 (431.60 m) This sample is a basaltic rock that contains amygdales in a fine-grained matrix. The groundmass is composed of microlites of plagioclase, typically elongate, uniform in size, and scattered evenly within an altered sample. There are also phenocrysts of plagioclase embedded in the matrix, altered to clay, and replaced by epidote (Figure 10A). It was also noticed that both fractures and vesicles are filled with epidote and chlorite. Disseminated opaque minerals show subhedral to cubic habits and high relief. An estimation based on microscope observation indicates that the sample consists of 5% phenocrysts, 65% groundmass (15% microlites of plagioclase, 15% opaque minerals, 70% alteration minerals) and 30% vesicles (Table C 4).

43
The vesicles are highly elongate and rounded to very angular and reach up to 1 mm in size on the elongated axis (Figure 10A and C 4.3). Inside vesicles, epidote shows prismatic habit up to 0.1 mm in size, with cleavage, and occurs in the center of vesicles. Chlorite shows spherulitic and prismatic crystals with anomalous first order interference colors (Figure 10B). Chlorite fills entirely some vesicles and in others it covers the inner border. Acicular amphiboles are emplaced in a few vesicles, similar to the ones found in sample ASK57-09. Granular quartz filling fractures and containing primary fluid inclusions is also present (Figure 10C). A colorless mineral is emplaced in the center of some vesicles, interbedded with epidote and amphiboles, showing a splintery surface (Figure 10D).
Figure 10. Photomicrographs of ASK86-10; A and D with plane-polarized light, B and C with cross-polarized light. (A) Irregular-shape amygdales filled with chlorite in a fine-grained matrix. Notice a plagioclase phenocryst being replaced by epidote in the center of the image; (B) Very angular and highly elongate vesicle filled with chlorite, showing anomalous first-order interference colors; (C) Fracture filled with anhedral quartz; (D) Well-developed epidote crystals embedded in a splintery mineral surface.
Based on SEM-EDS spectra, albite and amphiboles were identified in the groundmass (Figure 11A). Chlorite and the oxides occur interstitially. The oxides are mainly magnetite and ilmenite (Figure 11B). Epidote and chlorite fill many of the vesicles and fractures, but acicular amphibole, as clusters of grains, was also identified inside vesicles and fractures (Figure 11B). In addition, colorless minerals are calcium silicates that are interbedded with epidotes and amphiboles. Based on their EDS spectra, these could be zeolites (Figure 11B, 11C and D1.12, wairakite, see section 4.6). Also noticed were fractures filled with silica but were difficult to distinguish under the optical microscope (Figure 11D).

44
Figure 11. Backscattered electron images of ASK57-10 (A) Groundmass composed of albite, amphibole, and interstitial chlorite, and cut by fractures filled with chlorite, epidote, zeolite, and amphibole; (B) Zoom-in of image 8A showing acicular amphibole embedded in zeolites and enclosed by chlorite; (C) Epidote and amphibole with interstitial zeolites, all of them filling a vesicle; (D) Combined backscattered electron image and an X-ray map showing silica-rich veins (yellow) cutting the matrix. Notice the concentric epidote (light blue) filling the vesicle.
3.5 ASK57-11 (465.09 m) This thin section shows an andesitic lava with glomeroporphyric texture (Figure 12A, C5.1 and C5.2). The glomerocrysts are large crystals of plagioclase, up 1.5 mm, in a fine-grained matrix. The matrix is composed of microcrystalline plagioclase, showing relatively even grain size with plenty of mafic minerals. Opaque minerals are disseminated, and some of them show corona texture, encircling chlorite, and epidote (Figure C 5.11). All the plagioclases and mafic minerals have been partially or completely altered to both epidote and chlorite. Epidote occurs as pale yellow to green crystals rimming the plagioclase (Figure 12B), whereas chlorite shows dark green color, replacing partially or entirely mafic minerals (Figure 12C). There are a few elongate cavities filled with epidote, chlorite and quartz, and calcite veins that cut all the previous elements mentioned (Figure 12D). Quartz contains primary fluid inclusions. According to an estimation from observation under the microscope,

45
the sample consists of 15% phenocrysts, 80% groundmass and 5% cavities or vesicles (Table C 5).
Figure 12. Photomicrographs of ASK86-11; A and C with plane-polarized light, B and D with cross-polarized light. (A) Cluster of altered plagioclases in a fine-grained matrix; (B) Epidote rimming a plagioclase phenocryst; (C) Chlorite replacing entirely a mafic phenocryst; (D) Cavity filled with quartz, cut by a calcite vein.
The SEM-EDS analysis shows that plagioclase is altered to albite and confirms the presence of epidote and chlorite (Figure 13A). Plenty of oxides are cubic ilmenites, disseminated and embedded among some altered plagioclase. As mentioned above, cavities are filled with quartz and epidote (Figure 13B and 13C), but also with albite and K-feldspar. It was confirmed that the veins crosscutting the matrix and vesicles are filled with calcite (Figure 13D).

46
Figure 13. Backscattered electron images of ASK57-11 (A) Plagioclase phenocryst replaced by chlorite, and albite partially replaced by epidote. Notice the formation of ilmenite, quartz, and calcite veins; (B) Cavity filled with epidote, quartz, and K-feldspar; (C) Vesicle filled with a cluster of epidotes, interstitial anorthite, and K-feldspar; (D) Combined backscattered electron image and an X-ray map showing calcite veins (orange) that cut chloritized plagioclase (green). Notice the disseminated ilmenite (pink).
3.6 ASK86-01 (370.50 m) The thin section shows an amygdaloidal lava texture (Figure 14A). The groundmass is fine-grained, but it contains euhedral plagioclase microcrysts of up to 0.4 mm on the elongated axis. The groundmass contains also subhedral to euhedral oxides. Epidote and chlorite partially replace the groundmass minerals. Based on an estimation from observation under the microscope, the sample consists of 60% groundmass and 40% vesicles (Table C 6).
The former vesicles range in size from 2 to 9 mm, with moderate sphericity and are sub-rounded to moderately rounded (Figure 14A). The vesicles are filled completely with secondary minerals. Epidote shows a pseudo-hexagonal shape and is up to 1.5 mm on the elongated axis (Figure 14B). This mineral occurs on the border and center of the vesicles as aggregates of elongate prismatic crystals. Chlorite exists as tabular scaly aggregates filling the vesicles partially and completely (Figure 14C). The grain size of the chlorite is < 0.1

47
mm, and it is surrounded by a dark-grey mass, which is difficult to distinguish under the microscope due to its irregular grain size. There is also rhombohedral calcite in the vesicles, that shows typical twin planes, and its grain size is about 3 mm (Figure 14D). A brownish mineral with a splintery surface filling interstitial spaces between epidotes was also noticed (Figure 14B).
Figure 14. Photomicrographs of ASK86-01; B and C with plane-polarized light, A and D with cross-polarized light. (A) Concentrically zoned amygdales in a fine-grained groundmass; (B) Aggregates of prismatic epidote crystals surrounded by pleochroic brownish mineral; (C) Tabular scaly aggregates of chlorite; (D) Twinning planes in calcite.
The SEM-EDS analysis shows the presence of both albite and amphibole in the groundmass (Figure 15A). It also confirms the emplacement of epidote, calcite and chlorite in vesicles. Chlorite occurs also in the groundmass and as filling fractures (Figure 15A and 15B).
EDS spectra show microcrysts of chlorite, which appears like a dark-grey clay mineral that fills the vesicles partially and coexists with micro-epidote emplaced on the border and in center of vesicles (Figure 15C). There is also a pleochroic brownish mineral with splintery surface, which is difficult to distinguish in the optical microscope. The EDS spectra indicate that this mineral is an intergrowth of zeolites (wairakite, see section 4.6) and K-feldspar. (Figure 15B and 15D).

48
Figure 15. Backscattered electron images from ASK86-01 (A) Amphibole and albite in the groundmass with chlorite and epidote filling a fracture; (B) Secondary minerals filling vesicles; (C) Micro-chlorite and micro-epidote filling a rounded vesicle; (D) Center of a vesicle where an intergrowth of zeolites and K-feldspar can be seen.
3.7 ASK86-04 (424.70 m) This thin section has microcrystalline basaltic lava groundmass with amygdales. The groundmass is relatively coarse-grained and consists predominantly of plagioclase which is weakly aligned. The groundmass is also rich in subhedral to euhedral disseminated oxides. Secondary minerals fill completely the former vesicles and fractures. According to an estimation with the microscope, the sample consists of 50% groundmass, 40% vesicles and 10% oxides, and the rock is moderately altered (about 30%, Figure C 7).
The vesicles range in size from 0.5 to 3 mm and are highly elongated and angular to rounded (Figure 16A). The vesicles are filled completely with secondary minerals. Epidote occurs as aggregates of elongate prismatic crystals and with fibrous habit. Its size is about 0.2 mm on the elongated axis (Figure 16B), and it precipitated on the border and in the center of vesicles. Chlorite shows spherulitic and tabular habit, filling the vesicles partially or completely (Figure 16C and 16D). The grain size of chlorite is about < 0.1 mm, and like in sample ASK86-01, it is surrounded by dark-grey mass, identified as micro-chlorite. There is also

49
anhedral calcite in the center of the vesicles, surrounded by the pleochroic brownish mineral. Its size is about 3 mm and it shows typical twin planes.
Figure 16. Photomicrographs of ASK86-04; A, B and D with cross-polarized light, C with plane-polarized light. (A) Amygdales filled with concentric chlorite in a relative course-grained groundmass composed of plagioclase and oxides; (B) Aggregates of secondary minerals filling a vesicle; (C) Border of a vesicle that shows the sequence of crystallization epidote, chlorite and feldspar; (D) Zoom-in of the vesicle border in the figure 16C.
In accordance with the SEM-EDS spectra, this sample has albite and amphibole in the groundmass with magnetite and chalcopyrite (Figure 17A and 17B). The presence of epidote, calcite, chlorite and zeolites in vesicles is also confirmed (Figure 17C). There are also both amphiboles and interstitial feldspar deposited after epidote and chlorite, which has a brownish pleochroism under the microscope (Figure 17A). It was identified that fractures have been filled from the border to center with albite, chlorite, and epidote (Figure 17D).

50
Figure 17. Backscattered electron images of ASK86-04 (A) Amphibole and magnetite in the groundmass surrounding a vesicle filled with epidote, amphibole, and interstitial zeolites; (B) Albite, chlorite and chalcopyrite in the groundmass; (C) Secondary minerals filling a vesicle; (D) Fracture filled with chlorite at the edges and albite and epidote in the center.
3.8 ASK86-05 (437.00 m) The thin section shows concentrically zoned amygdales within an altered basaltic lava matrix. This groundmass is fine-grained, mainly composed of plagioclase. (Figure 18A). Flow pattern is accentuated by the amygdales and plagioclase, and the groundmass shows polygonal fractures, arcuate, overlapping, and intersecting cracks. Alteration was strongly influenced by the pre-existing structures as chlorite-epidote alteration is common along and adjacent to the polygonal fractures (Figure 18B). The subhedral plagioclases in the groundmass are partially altered and their size is up to 0.2 mm on the elongated axis. The groundmass contains also cubic anhedral oxides. According to an estimation based on observation under the microscope the sample consists of 65% groundmass, 30% vesicles and 5% oxides, and the rock is strongly altered (Table C 8).
The vesicles range in size from 0.2 mm to 8 mm on the elongated axis (Figure C 8.1, C 8.2 and C 8.3). These are variable from highly elongated to having moderate sphericity and from being sub-rounded to sub-angular (Figure 18C). This thin section also shows secondary

51
fractures, up to 0.1 mm thick. The vesicles and fractures are filled entirely with secondary minerals. Epidote exits in aggregates of elongate prismatic and granular crystals up to 0.1 mm (Figure 18C). It fills vesicles in a variety of ways; some epidotes are in the center of a vesicle surrounded by chlorite. Chlorite is found as tabular scaly aggregates, filling the vesicles partially and completely. The grain size of chlorite is < 0.1 mm, and it is surrounded by a dark-grey mass, with the use of SEM, identified as microcrystals of chlorite in the previous samples (Figure 18C). Tabular and spherulitic epidote is also crystallized in the secondary fractures. Irregular calcite crystals fill entirely fractures or micro-veins that crosscut the poligonal cracks (Figure 18D).
Figure 18. Photomicrographs of ASK86-04; A, B, C and D with plane-polarized light.(A) Groundmass composed of partially altered plagioclase and opaque ore; (B) Poligonal crack filled with tabular chlorite and micro-chlorite; (C) Geopetal structure in an elongate vesicle. The bottom side (left side in the picture) filled with fine-grained chlorite (in the border of the vesicle) and fine-grained epidote. The top side (right side of the picture) filled with coarse-grained chlorite; (D) Calcite vein cross-cutting a perlitic crack.
SEM-EDS analysis shows the presence of albite and amphibole in the groundmass (Figure 19A and 19E). Disseminated magnetite and titanite are also present and restricted to the groundmass. Epidote and chlorite fill the vesicles, whereas chlorite and calcite fill veins. Calcite is also filling small vesicles in the groundmass. In accordance with the SEM spectra, micro-chlorite is crystallized on the border of some vesicles, surrounding granular epidote and filling the polygonal cracks (Figure 19A, 19B and 19C).

52
Figure 19. Backscattered electron images of ASK86-05 (A) Vesicle filled with micro-chlorite on the border and epidote; (B) Photomicrograph of the same area as image A; (C and D) Granular aggregates of chlorite and epidote filling the vesicle shown in images A and B; (D) Groundmass minerals next to the vesicle border.
3.9 ASK86-07 (461.82 m) The thin section of this basaltic lava has an amygdaloidal texture (Figure 20A). Amygdales are aligned within the fine-grained groundmass. This matrix is composed of microcrysts of plagioclases with up to 0.1 mm length, with interstitial epidote and chlorite as a result of alteration. There are also disseminated anhedral opaque minerals. Empty secondary crakcs up to 0.1 mm thick also occur and crosscut the former vesicles. According to an estimation by observation under the microscope, the sample consists of 70% groundmass, 25% vesicles and 5% oxides (Table C 9).
The vesicles range in size from 1 mm to 4 mm (Figure C 9.1 and C 9.2). These have moderate sphericity and are sub-rounded (Figure 20A). The vesicles are filled concentrically with different secondary minerals. Epidote has a pseudo-hexagonal shape, crystallized as aggregates of elongate fibrous to prismatic crystals from the border to the center in the vesicles and are up to 1 mm on the elongated axis (Figure 20B and 20C). Chlorite appears as tabular scaly aggregates filling partially or completely some vesicles. There is also a

53
brownish pleochroic mineral with a splintery surface, identified previously as zeolites intergrown with K-feldspar (Figure 20C), and a colorless mineral showing a well-developed prismatic crystal habit (Figure 20B). Micro-chlorite fills completely and partially some vesicles, and this appears as a micro-granular opaque mass under the microscope (Figure 20D).
Figure 20. Photomicrographs of ASK86-07; A, B, C and D with plane-polarized light; (A) Amygdaloidal texture with a groundmass composed of plagioclase and disseminated oxides. Amygdale is cross-cut by an empty vein. Vesicle filled with concentric chlorite, epidote and zeolite (B) Vesicle filled with chlorite on the border and well-developed epidote next to the colorless feldspar; (C) Vesicle filled with chlorite on the border and fibrous epidote. Brownish pleochroic mineral formed in the middle of the vesicle; (D) Micro-chlorite (dark brownish mineral at the bottom of the vesicle) filling a vesicle in sharp contact with colorless zeolites (at the top of the vesicle).
According to the SEM-EDS spectra, this sample has albite and amphibole in the groundmass along with Fe-Ti oxides (Figure 21A). Also confirmed is the emplacement of epidote, chlorite, and micro-chlorite in vesicles (Figure 21A, 21B and 21C). In addition, chalcopyrite and calcite are also observed as trace minerals in vesicles (Figure 21C). The colorless prismatic mineral was identified as zeolites (Figure 21A and 21D, laumontite, see section 4.6). Furthermore, the brownish mineral with splintery surface has an unmixing texture and is composed of albite and zeolites (yugawaralite, see section 4.6) with K-feldspar intergrowth. (Figure 21D, 21E and 21F).
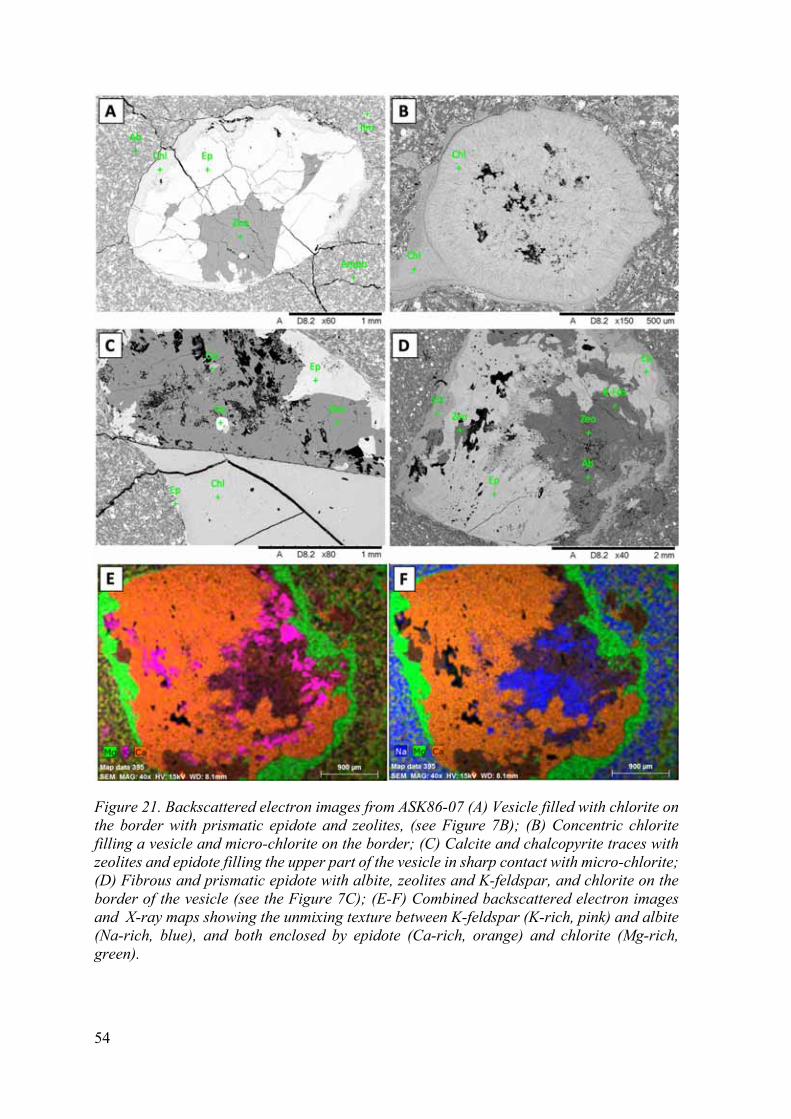
54
Figure 21. Backscattered electron images from ASK86-07 (A) Vesicle filled with chlorite on the border with prismatic epidote and zeolites, (see Figure 7B); (B) Concentric chlorite filling a vesicle and micro-chlorite on the border; (C) Calcite and chalcopyrite traces with zeolites and epidote filling the upper part of the vesicle in sharp contact with micro-chlorite; (D) Fibrous and prismatic epidote with albite, zeolites and K-feldspar, and chlorite on the border of the vesicle (see the Figure 7C); (E-F) Combined backscattered electron images and X-ray maps showing the unmixing texture between K-feldspar (K-rich, pink) and albite (Na-rich, blue), and both enclosed by epidote (Ca-rich, orange) and chlorite (Mg-rich, green).

55
3.10 ASK86-09 (478.87 m) This thin section of a basaltic lava has a microcrystalline groundmass with fully filled vesicles (Figure 22A). The groundmass consists predominantly of plagioclase, uniform in size and weakly aligned (Figure 22B). Interstitial epidote and chlorite have formed in the matrix as a result of the alteration process. Anhedral crystals of opaque minerals are disseminated in a considerable quantity in the matrix (Figure 22A and 22B). An estimation based on microscope observation indicates that the sample consists of 60% groundmass, 35% vesicles and 5% oxides, and that the rock is strongly altered (Table C 10).
The former vesicles are range in size from 4 mm to 6 mm (Figure C 10.1). These have moderate to low sphericity and are sub-angular to sub-rounded. Epidote is present in the vesicles as subhedral crystals of up to 1.5 mm on the elongated axis. It crystallized from the border to the center of the vesicle (Figure 22C). Chlorite shows spherulitic and tabular habit, filling completely some of the vesicles. Well-developed chlorite is found on the border and decreases in size to the center of vesicles, forming spherulitic aggregates (Figure 22A). Chlorite also fills partially some vesicles next to epidote, calcite and feldspar (Figure 22C).
The grain size of the chlorite is about 0.1 mm. Calcite crystallized as interstitial patches in the vesicles and shows typical twin planes (Figure 22C). As in the previous samples, a brownish mineral occupies a considerable portion of the vesicles but has even darker color with a mud-like appearance (Figure 22D). This thin section also has some patches of a colorless prismatic mineral in the center of some vesicles.

56
Figure 22. Photomicrographs of ASK86-09; A and C with plane-polarized light, B and D with cross-polarized light. (A) Amygdales filled with chlorite. Noticeable are incipient poligonal cracks; (B) Altered groundmass composed of plagioclase, oxides and interstitial alteration minerals; (C) Vesicle filled with chlorite on the border, cluster of fibrous epidotes, calcite with twinning planes and brownish feldspar; (D) Irregular chlorite haloes surrounded epidote and in the center of the vesicle. Notice the high amount of the brownish feldspar filling the vesicle.
SEM-EDS analysis confirmed the presence of chlorite, epidote and calcite (Figure 23A and 23B), and it also allowed identification of albite, zeolites (chabazite, see section 4.6) and anhedral calcite filling vesicles (Figure 23B, 23C and 23D).
Figure 23. Backscattered electron images of ASK86-09. (A) Vesicle filled with chlorite on the border and haloes in the center, epidote, calcite and albite (see Figure 23C); (B) Vesicle filled with zeolites (chabazite), epidote, albite and calcite; (C and D) Zoom-in of images 23A and 23B showing albite laths and anhedral calcite.
3.11 ASK86-11 (481.67 m) This thin section of a basalt has filled vesicles in a fine groundmass. The groundmass is composed of microcrysts of plagioclases, uniform in size and cut by calcite veins up < 0.1

57
mm thick. The groundmass also contains disseminated opaque minerals (Figure 24A). According to an estimation on an observation under the microscope, the sample consists of 70% groundmass and 30% vesicles (Table C 11).
The former vesicles have size up to 6 mm and have high to moderate sphericity and are sub-rounded to sub-angular (Figure C 11.1 and C 11.2). The vesicles are filled entirely with secondary minerals. Chlorite occurs as tabular scaly aggregates filling completely some vesicles (Figure 24B) and forming granular patches in others. The grain size of the chlorite is about < 0.1 mm. Epidote has a subhedral shape with length up to 0.5 mm on the elongated axis. This mineral is mainly found on the border and center of the vesicles. Tabular calcite fills the center of some vesicles, showing typical twinning (Figure 24C). Its grain size is up to 0.3 mm. Anhedral fine-grained calcite also crystallizes in fractures that cut grains of quartz crystallized in vesicles. The quartz is subhedral to euhedral grains of up to 0.5 mm in diameter. There are also patches of brownish feldspar (similar as in the previous samples) between quartz and epidote (Figure 24D).
Figure 24. Photomicrographs of ASK86-011; A and B with plane-polarized light, C and D with cross-polarized light. (A) Calcite vein cutting the groundmass of plagioclase and oxides; (B) Tabular aggregates of chlorite filling a rounded vesicle; (C) Vesicle filled with subhedral quartz and calcite with twin planes. (D) Brownish feldspar crystallized between quartz (on the border) and epidote (in the center) in a vesicle.
Based on the SEM-EDS spectra, this sample has albite and amphibole in the groundmass with interstitial chlorite as an alteration product and disseminated magnetite (Figure 25A, see section 4.7). The emplacement of epidote, quartz, and calcite in the vesicles with some

58
magnetite traces are also confirmed (Figure 25B and 25C). Zonation halos are also seen in some epidotes (Figure 25D). The brownish mineral texture is an intergrowth of zeolites and K-feldspar. (Figure 25D).
Figure 25. Backscattered electron images of ASK86-011. (A) Groundmass next to a vesicle filled with epidote, calcite and quartz grains; (B) Center of a vesicle filled with radial prismatic zoned epidote surrounded by feldspar, calcite and quartz; (C and D) Zoom-in of images 22C and 22D, showing zeolites intergrown with K-feldspar.
3.12 ASK86-12 (486.95 m) This thin section of a basaltic rock has a microcrystalline texture with a few amygdales. The groundmass has experienced extensive chloritization and is also composed of microlithic plagioclase and plenty of disseminated opaque ore. Plagioclase shows uniform size of up to 0.1 mm in length, embedded in the matrix with interstitial chlorite. Oxides and sulfides show cubic to anhedral habits with size up to 0.2 mm (Figure 26A). The original vesicles are now filled with aggregates of chlorite, epidote, quartz, and feldspar. The sample has a moderate number of fractures of up to 0.5 mm width and are filled with secondary minerals. According to an estimation by observation under the microscope, the sample consists of 90% groundmass (10% oxides, 60% altered plagioclase, 30% alteration minerals) and 10% vesicles (Table C 12).

59
The filled vesicles are ranging in size from 1.5 to 4 mm (Figure C 12.1 and C 12.2). These have moderate to high sphericity and are sub-rounded. Inside of these, epidote is present as aggregates of elongate prismatic crystals up to 0.7 mm in length. Chlorite fills completely some vesicles, and partially others with epidote, quartz and feldspar, and appears as concentric aggregates of elongate prismatic crystals (Figure 26B). Subhedral quartz with size up to 1 mm fills some vesicles (Figure 26C). Quartz contains plenty of fluid inclusions (Figure C 12.13 and C 12.14). A brownish pleochroic mineral fills some vesicles after the crystallization of chlorite showing a splintery surface with undefined habit. On the other hand, well-developed prismatic crystals fill fractures showing subhedral grain shapes (Figure 26A).
Figure 26. Photomicrographs of ASK86-012; A and B with plane-polarized light, C with cross-polarized light. (A) Vesicle filled with chlorite on the border, zeolites, and epidote, cross-cut by a zeolite vein; (B) Vesicle filled with fibrous chlorite with intercalation of zeolites on the border; (C) Vesicle filled with chlorite on the border and prismatic quartz.
Based on SEM-EDS spectra, this sample contains albite and amphibole in the groundmass with interstitial chlorite as an alteration product (Figure 27A). The oxides identified are ilmenite and magnetite, all of them emplaced both in the matrix and vesicles (Figure 27A and 27B). This analysis confirms the presence of epidote, chlorite, and quartz in the vesicles (Figure 27B, 27C and 27D). In addition, zeolites (stellerite, see section 4.6) were identified in vesicles and filling fractures (Figure 27A), with some traces of calcite, and acicular amphibole restricted to vesicles (Figure 27D). In vesicles, epidotes and quartz are cut by calcite veins. (Figure 27C). K-feldspar is intergrown with albite forming irregular stripes that run separately in the center of the vesicles (Figure 27E and 27F).

60
Figure 27. Backscattered electron images of ASK86-12 (A) Fracture filled with zeolites and granular calcite in a fine groundmass; (B) Border of a vesicle (red line dashed) that shows skeletal ilmenite and titanite surrounded by quartz in the inner wall; (C) Epidote and quartz crystals cut by a calcite vein in the center of a vesicle; (D) Acicular amphibole in the center of a vesicle; (E) K-feldspar intergrowth with albite, crystallized after chlorite and quartz; (F) Combined backscattered electron image and an X-ray map that shows epidote (Ca-rich, intense red) in the center of a vesicle surrounded by intergrowth of K-feldspar (K-rich, green) and albite (Na-rich, blue), quartz (black, see Figure 27 E), chlorite (Mg-rich, light blue) on the border of the vesicle and cut by zeolite vein (stellerite, Ca-rich, mixture of red and blue) with some calcite traces in the vein borders (Ca-rich, red).

61
4 Mineral Chemistry For electron microprobe analysis, six representative samples were chosen from the cores of both boreholes, from the Hoffell-Miðfell area, two from ASK57 and four from ASK86 wells. The complete set of microprobe analyses, including cation number calculations, are presented in Appendix F.
4.1 Feldspar Feldspars can be found in both the matrix and vesicles (i.e., Figure 5A, 9A, 7F, 16 D), although K-feldspars are exclusively as secondary minerals in vesicles. Analyses of plagioclase and K-feldspars are plotted in the ternary classification diagram Ab-An-Or (Figure 28A and 28C). Typical plagioclase and K-feldspar electron microprobe analyses, their calculated cation numbers and An content are given in Table 2 and 3.
Table 2. Representative microprobe analyses of plagioclase in the matrix reported as wt% oxide components and number of cations. Calculated cation numbers of plagioclase on the basis of 8 oxygen atoms, using the spreadsheet for mineral formula calculations at https://serc.carleton.edu/.
Analysis (wt%)
86-01 MA2 57-05-MA1 57-05-MA2 57-10-MA28 86-07-MA19 86-12-MA1 370 m 376.1 m 376.1 m 431.6 m 468.1 m 486.9 m
SiO2 66.96 59.63 52.19 68.07 68.60 63.62TiO2 0.02 0.04 0.10 0.01 0.05 0.00Al2O3 19.59 24.13 29.51 20.62 21.43 22.57
FeO(total) 0.30 1.36 1.17 0.49 0.34 0.00MnO 0.00 0.02 0.01 0.02 0.00 0.01MgO 0.00 0.66 0.04 0.00 0.00 0.00CaO 0.19 5.34 12.53 0.15 0.46 3.44Na2O 11.43 8.23 4.20 10.41 9.97 9.58BaO 0.00 0.00 0.00 0.00 0.02 0.00K2O 0.08 0.20 0.20 0.04 0.07 0.12Total 98.58 99.61 99.95 99.81 100.94 99.34
Based on the 8 oxygen atoms Si 2.968 2.658 2.374 3.007 3.006 2.824Ti 0.001 0.001 0.004 0.000 0.002 0.000Al 1.023 1.268 1.582 1.073 1.107 1.181
Fe3+ 0.011 0.051 0.044 0.000 0.000 0.000Fe2+ 0.000 0.000 0.000 0.018 0.012 0.000Mn 0.000 0.001 0.001 0.001 0.000 0.000Mg 0.000 0.044 0.003 0.000 0.000 0.000Ca 0.009 0.255 0.611 0.007 0.021 0.164Na 0.982 0.711 0.370 0.892 0.847 0.824Ba 0.000 0.000 0.000 0.000 0.000 0.000K 0.005 0.011 0.012 0.002 0.004 0.007
Total 5.000 5.000 5.000 5.000 5.000 5.000An 0.89 26.09 61.51 0.80 2.45 16.44
The majority of plagioclase compositions in the matrix range from An62Ab37Or1 to An1Ab99Or0, falling in the fields of labradorite to albite. Their content of the Or component

62
is always low, generally <0.8 wt%. Primary zoning in plagioclase crystals could not be assessed because of alteration; however, it seems that labradorite crystals have been replaced by albite.
Figure 28. (A, B and C) Ternary classification diagram Ab-An-Or for feldspars in (A) vesicles and (B and C) matrix. (D and E) Backscatter electron images of ASK-05. (D) Replacement of labradorite (light grey) by albite (dark grey) in matrix; (D) Cluster of K-feldspar crystals analyzed in calcite and zeolite in a vesicle. 1,2 Compositions of hydrothermal and igneous feldspars from the Reykjanes geothermal system (Libbey and William-Jones, 2016). 3 Composition of feldespars in volcanic rocks from Geitafell central volcano (Thorlacius, 1991); Cal: calcite, Qz: quartz, Zeo: zeolite (stilbite, see section 4.6), Amph: amphibole, Mt: magnetite.
The SEM analyses reveal that feldspars in vesicles are intergrown with both zeolites and calcite. The plagioclase ranges in composition from An17 to An0.2, falling in the fields of oligoclase and albite. On the other hand, the K-feldspars vary in composition from nearly pure K-feldspar Or96.4Ab3.5An0.1 to Or90.6Ab5.0An4.4 (Figure 28A). Overall, these feldspars are similar to the hydrothermal feldspars observed in the Reykjanes and Geitafell geothermal systems, where K-feldspar has been identified as adularia (e.g.: Friðleifsson, 1983a, Libbey and William-Jones, 2016). In addition, some of the feldspars in the matrix are similar to feldspars in basaltic rocks reported by Thorlacius (1991).

63
Table 3. Representative microprobe analyses of feldspars in vesicles, wt% oxides and number of cations. Cation numbers were calculated on the basis of 8 oxygen atoms, using spreadsheets for mineral formula calculations at https://serc.carleton.edu/.
Analysis (wt%)
86-01 K1 57-05 K1 57-05-KF4 86-07-K26 86-09-K18 86-09-A6 86-12-K1 86-12-A4 370 m 376.1 m 376.1 m 468.1 m 478.8 m 478.8 m 486.9 m 486.9 m
SiO2 64.47 64.34 63.27 64.18 64.83 68.90 63.78 63.51TiO2 0.00 0.01 0.02 0.01 0.00 0.03 0.00 0.00Al2O3 18.65 18.37 18.66 19.14 19.50 21.64 18.88 22.76
FeO(total) 0.14 0.01 0.06 0.01 0.00 0.01 0.01 0.02MnO 0.00 0.00 0.03 0.01 0.00 0.01 0.00 0.01MgO 0.01 0.00 0.00 0.00 0.01 0.00 0.00 0.01CaO 0.06 0.03 0.00 0.42 0.04 0.55 0.02 3.46Na2O 0.72 0.40 0.47 0.53 0.61 9.19 0.59 9.71BaO 0.23 0.04 1.06 0.61 0.25 0.01 0.98 0.00K2O 16.23 16.79 16.29 14.94 15.97 0.05 15.95 0.11Total 100.50 99.99 99.86 99.86 101.21 100.39 100.21 99.58
Based on the 8 oxygen atoms Si 2.962 2.972 2.944 2.985 2.960 3.051 2.956 2.809Ti 0.000 0.000 0.001 0.000 0.000 0.001 0.000 0.000Al 1.010 1.000 1.023 1.049 1.049 1.129 1.031 1.187
Fe3+ 0.006 0.000 0.002 0.000 0.000 0.000 0.000 0.001Fe2+ 0.000 0.000 0.000 0.000 0.000 0.000 0.000 0.000Mn 0.000 0.000 0.001 0.000 0.000 0.001 0.000 0.000Mg 0.000 0.000 0.000 0.000 0.000 0.000 0.000 0.000Ca 0.003 0.001 0.000 0.021 0.002 0.026 0.001 0.164Na 0.064 0.036 0.042 0.048 0.054 0.789 0.053 0.833Ba 0.004 0.001 0.019 0.010 0.004 0.000 0.015 0.000K 0.951 0.989 0.967 0.886 0.930 0.003 0.943 0.006
Total 5.00 5.00 5.00 5.00 5.00 5.00 5.00 5.00An 0.28 0.13 0.00 2.18 0.22 3.18 0.08 16.35
4.2 Pyroxene Under petrographic microscope, pyroxenes have an unrecognizable optical and morphological properties, and their SEM spectra are similar to amphibole spectra (Figure D 1. 3, 4 and 5). Thus, pyroxenes were only possible to be identified by EMPA.
Pyroxenes analyzed in both vesicles and matrix are plotted in the ternary classification diagram Wo-Fs-En (Figure 29A and 29B). The electron microprobe data for representative pyroxenes is shown in Table 4. The content of SiO2 ranges between 51.17% and 53.97%; CaO from 20.15% to 24.76%; FeOT varies from 4.26% to 14.81%; and Mg from 9.35% to 12.76%. Overall, most pyroxene compositions fall in and close to the diopside field.
Primary igneous clinopyroxenes are frequently augite-diopside solid-solutions, rich in Mg (Figure 29A and 29B) and are distinct from the hydrothermal clinopyroxenes that systematically have less Ca with far less variation in Fe content (e.g.: Marks et al., 2010). The pyroxenes analyzed range from Wo44Fs07En28 to Wo50Fs25En39, which lower in Mg and higher in Ca than igneous clinopyroxenes observed at Reykjanes (Marks et al., 2010), Krafla (Schiffman et al., 2004) or Hellisheiði (Helgadóttir et al., 2015). They are also higher in Wo-content that the clinopyroxenes analyzed by Thorlacius (1991). Clinopyroxenes in vesicles have more Mg (En) than the clinopyroxenes in the matrix. Additionally, the pyroxenes analyzed have Mg-numbers from 53 to 84. Some clinopyroxenes in vesicles fall into the skarn and gabbro pyroxene fields for Geitafell volcano as reported by Friðleifsson (1983a) and Thorlacius (1991), respectively. Some clinopyroxenes in the matrix fall close to the dike

64
pyroxene field, but most of them show different composition than the pyroxenes analyzed in previous studies in Geitafell (Figure 29B and 29C).
Table 4. Representative microprobe analyses of pyroxenes. Calculated number of cations on the basis of 6 oxygen atoms, using the spreadsheet for mineral formula calculations at https://serc.carleton.edu/.
Analysis (wt%)
57-05-MCpx5 57-05-MCpx6 86-07-S15-MCpx10 86-07-MCpx11 86-09-MCpx16 86-12-VCpx4 376.1 m 376.1 m 468.1 m 468.1 m 478.8 m 486.9 m
SiO2 51.81 51.17 51.98 52.32 52.48 53.86 TiO2 0.11 0.16 0.02 0.10 0.07 0.00 Al2O3 0.80 2.26 0.22 0.39 0.55 0.91 FeO 13.79 14.81 14.06 13.26 13.41 4.32 MnO 0.57 0.42 0.70 0.64 0.75 3.51 MgO 10.59 9.91 10.05 9.93 10.28 12.76 CaO 21.25 20.15 23.34 23.36 22.83 24.76 Na2O 0.16 0.26 0.11 0.12 0.13 0.17 NiO 0.00 0.01 0.03 0.00 0.00 0.00 K2O 0.03 0.03 0.01 0.01 0.01 0.00
Cr2O3 0.01 0.01 0.01 0.01 0.03 0.00 Total 99.14 99.76 100.53 100.15 100.54 100.29
Based on the 6 oxygen atomsSi 1.997 1.975 1.983 2.001 1.997 2.006 Ti 0.003 0.005 0.001 0.003 0.002 0.000 Al 0.036 0.103 0.010 0.018 0.025 0.040
Fe2+ 0.445 0.478 0.418 0.424 0.427 0.135 Mn 0.019 0.014 0.023 0.021 0.024 0.111 Mg 0.609 0.570 0.572 0.566 0.583 0.709 Ca 0.878 0.833 0.954 0.957 0.931 0.988 Na 0.012 0.020 0.008 0.009 0.009 0.012 Ni 0.000 0.000 0.001 0.000 0.000 0.000 K 0.002 0.002 0.001 0.001 0.000 0.000 Cr 0.000 0.000 0.000 0.000 0.001 0.000
Total 4.000 4.000 3.970 4.000 4.000 4.000 Wo 45.46 44.29 48.32 49.15 47.96 53.96 En 31.52 30.31 28.95 29.07 30.05 38.69 Fs 23.02 25.41 22.72 21.78 21.99 7.35

65
Figure 29. Ternary classification diagram Wo-En-Fe for clinopyroxenes in the matrix (circles) and vesicles (triangles) from ASK86 and ASK57 in comparison with clinopyroxenes in rocks from (A) Hellisheiði, Krafla and Reykjanes and (B) Geitafell. In (B), phenocrysts trend along the dashed line and the groundmass along the solid line (Thorlacius, 1991); (C) Variation diagram showing Mg-number (Mg/Mg++Fe2+) vs Al2O3 for clinopyroxenes from ASK86 and ASK57 in the matrix (circles) and vesicles (triangles) in comparison with clinopyroxenes in different rocks from Geitafell volcano. (D and E) Backscatter electron images from both ASK86-07 and ASK86-12 showing interstitial clinopyroxenes. 1 Hellisheiði (Helgadóttir et al., 2015), 2 Krafla (Schiffman et al., 2004), 3 Reykjanes (Marks et al., 2010), 4 Geitafell (Thorlacius, 1991), 5 Geitafell (Friðleifsson, 1983a); Amph: amphibole, Plg: plagioclase, Mt: magnetite, Chl: chlorite, Qz: quartz.
4.3 Amphiboles Compositions of amphibole in both vesicles and matrix are plotted in an appropriate two-dimensional diagram in terms of Si and Mg/(Mg + Fe2+) in accordance with Leake et al. (1997). Representative electron microprobe analyses of amphiboles are shown in Table 5. According to the SEM-EDS spectra, many amphiboles show a hornblende spectrum (Figure D 6). However, amphiboles in ASK57 and ASK86 range in composition from actinolite-ferroactinolite to magnesio-hornblende (Figura 30A). These are monoclinic amphiboles in which CaB ≥ 1.50 and (Na + K) < 0.50 (Leake et al., 1997), although there are Ca-rich amphiboles identified as edenite in accordance with the spreadsheet of Locock (2014) (Table 5). No significant compositional differences were found between amphiboles in the matrix and vesicles (Figura 30A and 30B).

66
Table 5. Representative microprobe analyses of amphiboles. Calculated number of cations on the basis of 24 oxygens, using the spreadsheet for mineral formula calculations by Locock ( 2014, and based on the nomenclature of amphiboles by Hawthorne et al. (2012).
Analysis (wt%)
86-01-MAm1
57-05-Am2
57-10-S23-MAm7
86-7-MAm12
86-09-Am18
86-09-Am19
86-12-Am5
86-12-MAm7
370 m 367.1 431.6 m 468.1 m 478.8 478.8 486.9 m 486.9 m SiO2 52.28 53.16 54.32 51.40 53.15 52.21 50.61 51.26TiO2 0.15 0.20 0.04 0.27 0.12 0.08 0.94 1.02Al2O3 1.87 1.14 2.38 1.94 2.41 2.36 1.99 1.85Cr2O3 0.01 0.00 0.00 0.00 0.01 0.00 0.04 0.00MnO 0.45 0.39 0.32 0.51 0.52 0.42 0.29 0.28FeO 19.38 18.87 21.14 15.31 18.85 23.47 12.56 12.95NiO 0.00 0.00 0.00 0.00 0.00 0.00 0.03 0.02BeO
MgO 11.67 11.74 8.34 10.60 11.58 8.88 14.15 14.32CaO 11.40 11.66 12.29 18.82 11.88 11.54 18.15 17.74Na2O 0.20 0.10 0.16 0.18 0.19 0.25 0.25 0.26K2O 0.07 0.04 0.11 0.03 0.06 0.07 0.01 0.01
F 0.10 0.00 0.00 0.00 0.31 0.13 0.92 0.16Cl 0.11 0.08 0.02 0.02 0.02 0.01 0.00 0.00
O=F,Cl (calc) -0.07 -0.02 0.00 -0.01 -0.13 -0.05 -0.39 -0.07
Total 97.62 97.35 99.12 99.07 98.97 99.36 99.56 99.80Formula Assignments T (ideally 8 apfu)
Si 7.765 7.895 7.974 7.577 7.772 7.757 7.378 7.414Al 0.235 0.105 0.026 0.337 0.228 0.243 0.342 0.316Ti 0.030 0.103 0.111
Fe3+
T subtotal 8.000 8.000 8.000 7.944 8.000 8.000 7.823 7.841C (ideally 5 apfu)
Ti 0.016 0.023 0.005 0.013 0.009
Al 0.092 0.095 0.385 0.187 0.170
Cr 0.002 0.002 0.005
Fe3+ 0.095 0.034 0.070
Ni 0.003 0.002Mn2+ 0.039 0.064 0.036 0.035Fe2+ 2.211 2.283 2.595 1.887 2.240 2.785 1.531 1.566Mg 2.584 2.599 1.825 2.329 2.524 1.967 3.075 3.087
C subtotal 5.000 5.000 4.849 4.280 5.000 5.001 4.650 4.690B (ideally 2 apfu)
Mn2+ 0.056 0.049 0.064 0.053
Fe2+ 0.101 0.060 0.000 0.000 0.031 0.061 0.000 0.000Ca 1.814 1.855 1.933 2.000 1.861 1.837 2.000 2.000Na 0.029 0.028 0.046 0.000 0.043 0.049 0.000 0.000
B subtotal 2.000 1.992 1.979 2.000 1.999 2.000 2.000 2.000A (from 0 to 1 apfu)
Ca 0.000 0.000 0.000 0.972 0.000 0.000 0.835 0.749Na 0.029 0.000 0.000 0.051 0.011 0.023 0.071 0.073K 0.014 0.007 0.021 0.006 0.012 0.013 0.003 0.001
A subtotal 0.043 0.007 0.021 1.029 0.023 0.036 0.909 0.823O (non-W) 22.000 22.000 22.000 22.000 22.000 22.000 22.000 22.000W (ideally 2 apfu)
OH 1.925 1.981 1.995 1.994 1.853 1.939 1.575 1.928F 0.049 0.141 0.059 0.424 0.072Cl 0.027 0.019 0.005 0.006 0.006 0.001 0.001
O
W subtotal 2.001 2.000 2.000 2.000 2.000 1.999 2.000 2.000Sum
T,C,B,A 15.043 14.999 14.849 15.253 15.022 15.037 15.382 15.354
Species actinolite actinolite ferro-actinolite edenite actinolite ferro-
actinoliteedenite edenite

67
The amphiboles analyzed have Mg numbers from 41 to 60 after recalculation of the ratio of Fe2+ and Fe3+. Magmatic and metamorphic/deuteric amphiboles (amphiboles altered by late-fluid reactions during the magmatic crystallization) have Mg numbers over 60 to 90 (Zachariáš, 2008; Figure 30 A). On the other hand, hydrothermal amphiboles have a larger range in composition. The amphiboles analyzed are compositionally similar to those observed at Reykjanes (Marks et al., 2010), Hellisheiði (Helgadóttir et al., 2015) and Geitafell (Friðleifsson, 1983a), but are different from those at Nesjavellir (Marks et al., 2010; Figure 30B).
Figure 30. (A and B) Variation diagrams showing Si vs Mg number (Mg/Mg++Fe2+) of amphibole in the matrix (circles) and vesicles (triangles) of ASK86 and ASK57 core samples in comparison with metamorphic/deuteric, igneous and hydrothermal amphiboles. 1,2 Intrusive complex (Zachariáš, 2008); 3,4 Reykjanes and Nesjavellir hydrothermal systems (Marks et al., 2010), 5 Hellisheiði hydrothermal system (Helgadóttir et al., 2015) and 6 Geitafell Tertiary hydrothermal system (Friðleifsson, 1983a). (C) Backscatter electron image of a vesicle in ASK86-09 showing amphibole in calcite. (D) Backscatter electron image of the matrix in ASK86-07 showing interstitial amphibole. (E) Backscatter electron image of ASK86-12 showing aggregates of amphibole in the matrix; Cal: calcite, Ep: epidote, Zeo: zeolite, Plg: plagioclase, Mt: magnetite, Cpx: clinopyroxene.
4.4 Epidote Epidote can be found both in the vesicles and matrix. It is associated mainly with chlorite and calcite. Electron microprobe analyses of typical epidotes are shown in Table 6. SiO2 content ranges from 34.34% to 38.85% with an average of 37.51%; CaO is from 21.8% to 24.2 % with an average of 23.1%; Al2O3 changes from 20.06% to 30.64 % with an average of 24.32%; FeOT varies from 4.67 % to 16.84 % with an average of 12.6%; and MnO is from 0.45% to 0.01% with an average of 0.14%.The composition is dominated by the clinozoisite

68
end-member (from Cz65Ep33Pm2 to Cz90Ep9Pm1), similar to what is observed in the Reykjanes and Geitafell geothermal systems (Friðleifsson, 1983a; Figure 31A).
Epidote crystals of up to 1mm in length commonly show zonation. Oscillatory zoning is rarely observed in common metamorphic epidote and is more common in hydrothermal epidote (Franz and Liebscher, 2004). Figure 31C shows a profile of 12 points that show oscillatory zoning with respect to Al and Fe. This profile shows that in general the Al2O3 content varies between 22.46 and 25.35 wt%, whereas the differences in Fe2O3 content from zone to zone are about 4.1 wt%, between 10.99 and 15.09 wt%, with an anomalous Al-rich and Fe-poor point on the edge of the crystal (Figure 31D). This composition variation can also be identified by the grey color variation in the backscatter electron images (Figure 31B and 31D). Fe-poor zones are related to dark-grey halos, while the Al-rich are related to light-grey halos, even where the zonation is not so regular (Figure 31B).
Table 6. Representative microprobe analyses of epidotes. Calculated number of cations on the basis of 12.5 oxygen atoms, using the spreadsheet for mineral formula calculations at https://serc.carleton.edu/.
Analysis (wt%)
86-01-E1 57-05-E1 57-10-S19-E31 86-07-E17 86-09-S27-E8 86-12-E6 370 m 376.1 m 431.6 m 468.1 m 478.8 m 486.9 m
SiO2 37.97 37.47 37.73 37.66 38.05 37.40TiO2 0.00 0.60 0.02 0.01 0.02 0.00 Al2O3 24.50 22.18 23.60 23.79 24.61 22.55FeO 12.42 14.49 13.80 14.00 13.34 15.61MnO 0.23 0.04 0.08 0.02 0.12 0.05 MgO 0.03 0.09 0.15 0.01 0.04 0.00 CaO 23.28 23.11 23.03 23.30 23.15 22.95Na2O 0.00 0.02 0.04 0.02 0.02 0.00 SrO 0.06 0.01 0.10 0.10 0.07 0.10 K2O 0.01 0.00 0.00 0.01 0.00 0.01 Total 98.50 98.02 98.54 98.92 99.42 98.67
Based on the 12.5 oxygen atomsSi 3.218 3.176 3.198 3.192 3.225 3.170Ti 0.000 0.038 0.001 0.001 0.002 0.000Al 1.224 1.108 1.179 1.188 1.229 1.126
Fe3+ 0.396 0.462 0.440 0.446 0.425 0.498Mn 0.016 0.003 0.005 0.001 0.008 0.003Mg 0.004 0.012 0.019 0.001 0.005 0.000Ca 2.114 2.098 2.091 2.116 2.102 2.084Na 0.000 0.002 0.003 0.001 0.002 0.000Sr 0.003 0.000 0.005 0.005 0.003 0.005K 0.000 0.000 0.000 0.000 0.000 0.001
Total 6.975 6.899 6.941 6.952 7.001 6.886Pm 0.99 0.19 0.34 0.08 0.51 0.20 Cz 74.80 70.43 72.57 72.63 73.91 69.21Ep 24.21 29.38 27.09 27.29 25.58 30.59

69
Figure 31. (A) Ternary plot showing the compositions of epidote group minerals, classified according to M3+ cation substitution, M3+ = Al3+, Mn3+ or Fe3+, corresponding to the clinozoisite, piemontite and epidote end-members, respectively (Franz and Liebscher, 2004); (B) Backscatter electron image showing epidote in a vesicle exibiting patchy zonation with Al-rich/Fe-poor zones (dark-grey) and Al-poor/Fe-rich zones (light-grey). (C) Line scan of Fe2O3 and Al2O3 contents (wt%) in epidote that shows oscillatory zoning. (D) Backcscatter electron image showing oscillatory zonation in epidote in accordance with Figure 4C; K-fds: K-feldspar, Ab: Albite, Zeo: Zeolite.
4.5 Chlorite Chlorite analyzed in both vesicles and matrix is plotted in (Al+Q)–Mg–Fe compositional classification diagram proposed by Zane and Weiss (1998). Electron microprobe data for typical chlorites are shown in Table 7. The results show that SiO2 ranges from 24.71% to 28.65%, with an average of 27.10%; Al2O3 from 16.06% to 19.93%, with an average of 18.50%; FeO from 24.20% to 28.41%, with an average of 26.19%; and MgO from 13.66% to 16.63%, with an average of 15.02%. No significant compositional differences were found between poorly developed chlorite crystals and well-developed chlorite crystals in vesicles and matrix (Figure 32A, 5B, 5C and 5D).

70
Based on the (Al+Q)–Mg–Fe diagram (Figure 32A), chlorites were classified and named, showing that the chlorites in ASK86 and ASK57 cores are mainly trioctahedral chamosite, and trioctahedral clinochlore of type I in which FeT + Mg Al (Zane and Weiss, 1998).
Overall, the variation in MgO and FeOT contents in the chlorites analyzed is relatively restricted, similar to what is observed in the epidote zone in Geitafell (Friðleifsson, 1983a), and in the case of chlorites in a lava flow at Hellisheiði (Helgadóttir et al., 2015; Figure 32A and 32B).
Table 7. Representative microprobe analyses of chlorites. Calculated number of cations at the standard of 28 anions, using a spreadsheet at: http://www.open.ac.uk/earth-research/tindle/AGT/AGT_Home_2010/Microprobe-2.html, and based on the nomenclature of chlorites by Deer et al. (2013).
Analysis (wt%)
86-01-Micro-Chl1 86-01-Chl1 86-01 MChl5 57-05-Chl2 57-05-Chl14 86-12-Chl10 370 m 370 m 370 m 376.1 m 376.1 m 486.9 m
SiO2 24.71 27.35 26.31 26.72 28.65 27.82 TiO2 0.19 0.00 0.29 0.00 0.00 0.00 Al2O3 17.63 19.08 19.16 16.06 17.38 17.44 FeO 26.49 26.35 25.02 25.40 24.62 28.41 MnO 0.32 0.38 0.29 0.26 0.30 0.35 MgO 15.00 15.50 13.66 14.84 16.63 14.31 CaO 0.28 0.12 0.29 0.20 0.22 0.16 Na2O 0.04 0.03 0.10 0.14 0.06 0.00 Cr2O3 0.00 0.00 0.02 0.04 0.01 0.00 NiO 0.00 0.03 0.02 0.00 0.04 0.01 Total 84.66 88.84 85.16 83.66 87.92 88.50
Based on the 36 oxygen atoms Si 5.491 5.711 5.715 5.946 5.986 5.899 Ti 0.033 0.000 0.048 0.000 0.000 0.000 Al 4.618 4.696 4.905 4.213 4.280 4.359 Cr 0.000 0.000 0.003 0.008 0.002 0.000
Fe3+ 0.000 0.000 0.000 0.000 0.000 0.000 Fe2+ 4.923 4.602 4.545 4.727 4.302 5.038 Mn 0.060 0.067 0.052 0.048 0.053 0.062 Mg 4.969 4.825 4.423 4.923 5.180 4.523 Ni 0.000 0.006 0.004 0.000 0.007 0.003 Zn 0.000 0.000 0.000 0.000 0.000 0.000 Ca 0.066 0.027 0.068 0.048 0.050 0.036 Na 0.017 0.014 0.041 0.059 0.025 0.000
Total 20.176 19.947 19.804 19.973 19.885 19.921n (Al+Q) 40.02 43.22 46.57 40.12 41.39 41.20
n (Fe3+Fe2+) 29.85 27.72 27.08 29.33 26.59 30.98 n (Mg) 30.13 29.06 26.35 30.55 32.02 27.82

71
Figure 32. (Al+Q)–Mg–Fe compositional classification diagram for chlorite (Zane and Weiss, 1998) in the ASK86 and ASK57 core samples, and comparison with samples from the (A) Geitafell (Friðleifsson, 1983a) and (B) Hellisheiði (Helgadóttir et al., 2015) geothermal systems. (C) Backscatter electron image of ASK86-01 showing interstitial chlorite with plagioclase and amphiboles in the matrix. (D) Backscatter electron image of ASK86-01 showing chlorite in a vesicle with interstitial albite and amphibole; Amph: amphibole, Plg: plagioclase, Ab: albite.
4.6 Zeolites Many of the zeolite minerals included in this study have been compared to well-identified zeolites from different locations in order to identify them using the identification parameters of Coombs et al. (1997) and Campbell et al. (2016). According to the SEM-EDS spectra (Figure D 1.12), only calcium-rich zeolites are present. Representative chemical analyses of these zeolites are given in Table 8, and the results are plotted in the binary diagrams Si/Si+Al (TSi) vs Na/(Na+Ca) and Si/Al vs (Ca+Mg)/(Na+K) (Figure 33).
These hydrous Ca-Al silicates occur as secondary minerals in vesicles and veins. The zeolites identified in the ASK86 and ASK57 borehole cores are stilbite, stellerite, yugawaralite, chabazite and laumontite and wairakite.

72
Figure 33. Plots of (A) Si/Al against (Ca+Mg)/(Na+K) and (B) TSi (Si/Si+Al) against Na/(Na+Ca) for classification of zeolite-group minerals, showing compositions of zeolites from ASK86 and ASK57 cores and a comparison with zeolites from different areas around the world (electron microprobe data for which the charge balance error (E) is better than ±10%). Stilbite: Lauren Hill Intrusion (Bargar et al., 1993), Harborville (RRUFF Project Website); Stellerite: Kustani Region and Clackamas County (RRUFF Project Website); Chabazite: Laurel Hill intrusion (Bargar et al., 1993); Yugawaralite: Khandivali Quarry (RRUFF Project Website); Wairakite: Laurel Hill intrusion (Bargar et al., 1993) and Medicine Lake Volcano (Bargar et al., 1993); Heulandite: Prospect Park, Passaic County; Epistilbite: Berufjörður, Iceland (RRUFF Project Website); and Laumontite: Pine Creek, Inyo County (RRUFF Project Website). Textural characteristics support the zeolite identification where the chemical analyses ovelap.
Stilbite from ASK57-05 (376.1 m) is generally colorless in vesicles (Figure 34A and 34B). Analyses of stilbite show that TSi ranges from 0.72 to 0.73 and Na/Na+Ca ranges from 0.16 to 0.23 (Figure 34A). Common stilbite has TSi values from 0.71 to 0.78 (Coombs et al., 1997).
Figure 34. (A) Stilbite from ASK-57-05 under the polarizing microscope in a vesicle, crystallized between a quartz rim and calcite. (B) Backscatter electron image from ASK57-05 showing the same mineral phases as in panel A; Stb: stilbite, Qz: quartz, Cal: calcite, K-fds, K-feldspar.
Stellerite has been identified in ASK89-12 (486.9 m) in veins showing colorless prismatic crystals (Figure 35A and 35B). Analyses of stellerite show TSi values of 0.76 and Si/Al ratio

73
about 3.3 (Figure 33A and 33B). Common stellerite has TSi values from 0.75 to 0.78 (Coombs et al., 1997). Stellerite occurs as tabular crystals up to 1.5 cm in veins in the Hvammsvík area, Hvalfjörður, together with yugawaralite and laumontite (Selbekk and Weisenberger, 2005).
Figure 35. Cluster of stellerite crystals in ASK86-12 filling a fracture seen in a polarizing microscope; (B) Backscatter electron image of ASK86-12 showing stellerite in a vein cross-cutting the matrix; Str: Stellerite, Amph: amphibole, Ttn: titanite, Mt: magnetite.
Yugawaralite from ASK86-07 (468.1 m) is colorless in vesicles, sometimes surrounded by wairakite (Figure 36A and B). TSi ranges from 0.74 to 0.75 and the Si/Al ratio is about 3 (Figure 33A and B). Common yugawaralite has TSi values from 0.71 to 0.78 (Coombs et al., 1997), and nearly constant Si/Al with a range of (Ca+Mg)/(Na+K) ratios (Figure 33A and B). Yugawaralite has been found in the Reykjavík area and West Iceland (Selbekk and Weisenberger, 2005; Tschernich, 1992).
Figure 36. Cluster of yugawaralite crystals filling a vesicle in ASK86-07 seen under a polarizing microscope; (B) Backscatter electron image of ASK86-07 showing yugawaralite in a vesicle with K-feldspar intergrown; Yug: yugawarilite, Wa: wairakite, K-fds: K-feldspar.
Chabazite in ASK86-09 (478.8 m) is colorless and fills vesicles (Figure 37A and 37B). Analyses of chabazite show TSi ranging from 0.68 to 0.69, Si/Al from 2.19 to 2.25 and

74
(Ca+Mg)/(Na+K) < 6.5. Common chabazite has TSi values from 0.58 to 0.80 and Si/Al from 2 to 2.7 and (Ca+Mg)/(Na+K) < 10 (Coombs et al., 1997; Figure 33A). Chabazite is common in cavities of basaltic rocks in Iceland related to low-temperature geothermal systems.
Figure 37. (A) Prismatic chabazite crystals of ASK86-09 seen under a polarizing microscope; (B) Backscatter electron image of ASK86-09 showing a chabazite crystal with K-feldspar intergrown, Cbz: chabazite, Ep: epidote, Wa: wairakite, K-fds: K-feldspar.
Laumontite has been identified in vesicles in samples ASK57-10 (431.60 m) and ASK86-07 (461.82 m), showing colorless crystals and square cross-sections. Analyses of laumontite shows TSi ranging from 0.66 to 0.67 (similar values to representative laumontite), Si/Al from 1.98 to 2.05 and (Ca+Mg)/(Na+K) > 60. In laumontite, Ca content dominates over K and Na. Approximately 1.5 Ca is replaced by 3(K, Na) apfu and reduced H2O (Coombs et al., 1997; Figure 33A).
Figure 38. (A) Prismatic laumontite crystals in a vesicle in ASK86-07 (dashed white line shows the vesicle border) seen under a polarizing microscope; (B) Backscatter electron image of ASK57-10 showing instertitial laumontite crystals in the center of the picture, filling the last empty hole in the vesicle after epidote, actinolite and calcite crystallization, Lau: laumontite, Ep: epidote, Chl: chlorite, Act: actinolite, Cal: calcite.

75
Table 8. Representative microprobe analyses of zeolite group minerals. Calculated number of cations in each zeolite (based on the nomenclature of zeolites by Deer et al. 2013), using the spreadsheet for mineral formula calculations at: https://serc.carleton.edu/. Calculated charge balance E%, according to Passaglia (1970) and Deer et al. (2004): E% = 100 × [(Al + Fe3+) – (ΣM+) – 2(ΣM2+)]/ [(ΣM+) + 2(ΣM2+)]. H2O component returned by difference from 100% using the total oxide wt.% (Campbell et al., 2016).
Analysis 57-05 Z2 86-01 Z1 86-07-S16-Z5 86-09-S25-Z4 86-12 Z2 57-10-Z5 (wt%) 376.1 m 370 m 468.1 m 478.8 m 486.9 m 431.6 m SiO2 58.75 53.77 61.33 55.75 62.23 52.15
Al2O3 17.59 21.86 17.79 21.02 15.53 22.26FeO 0.04 0.04 0.08 0.00 0.00 0.08MnO 0.04 0.02 0.01 0.00 0.00 0.05MgO 0.00 0.03 0.01 0.01 0.02 0.00CaO 8.71 11.10 9.01 8.59 8.33 11.13Na2O 0.94 0.27 0.12 0.37 0.05 0.02BaO 0.00 0.00 0.00 0.04 0.00 0.00K2O 0.26 0.40 0.11 3.05 0.04 0.06SrO 0.30 0.14 0.12 0.06 0.10 0.00Total 86.62 87.62 88.58 88.88 86.30 85.74H2O 13.38 12.38 11.42 11.12 13.70 14.26
Based on 72 O 96 O 32O 24O 72 O 48 OSi 28.934 32.478 11.928 14.170 38.825 16.131Al 10.210 15.561 4.078 6.297 11.419 8.115
Fe2+ 0.016 0.018 0.013 0.000 0.000 0.020Mn 0.018 0.009 0.002 0.000 0.000 0.013Mg 0.000 0.026 0.003 0.003 0.020 0.000Ca 4.596 7.183 1.878 2.339 5.568 3.689Na 0.893 0.317 0.043 0.181 0.066 0.009Ba 0.000 0.000 0.000 0.003 0.000 0.000K 0.160 0.312 0.028 0.989 0.032 0.023Sr 0.174 0.096 0.027 0.018 0.070 0.000
Total 45.000 56.000 18.000 24.000 56.000 28.000E% -3.47 2.24 5.21 6.77 0.05 9.80
Si/(Si+Al) 0.74 0.68 0.75 0.69 0.77 0.67Na/(Na+Ca) 0.16 0.04 0.02 0.07 0.01 0.00
Si/Al 2.83 2.09 2.93 2.25 3.40 1.99(Ca+Mg)/(Na+K) 4.31 17.48 26.57 11.75 41.28 389.27
Mineral type Stilbite Wairakite Yugawaralite Chabazite Stellerite Laumontite
Wairakite was identified in vesicles in samples ASK86-01 (370 m), ASK57-10 (431,6 m) and ASK86-09 (478.8 m), showing a drusy habit with a brownish color and with K-feldspar intergrown (Figure 39A and 39B). TSi ranges from 0.66 to 0.70; Si/Al from 1.9 to 2.3; and Na/(Na+K) is < 0.1. Most wairakites have TSi values from 0.65 to 0.69 and Na/(Na+K) < 0.3 (Coombs et al., 1997; Figure 33A). In hydrothermal wairakite the Si content is near 32 and Na 0.6 to 1.0 per unit cell. In those from low-grade metamorphic rocks the range is wider between 31.5 to 32.5 Si per unit cell, and wide ranges in Ca and Na. (Figure 39).

76
Figure 39. (A) Interstitial wairakite in a vesicle in ASK86-01 seen under a polarizing microscope; (B) Backscatter electron image from ASK86-01 showing a wairakite crystal with K-feldspar intergrown. (C) Diagram for the classification of the wairakite-analcime compositional series with the ASK86 and ASK57 wairakite compositions. Red field represents the composition of wairakite in geothermal wells, and the purple field in metamorphic rocks (Utada, 2001); Wa: wairakite, Chl: chlorite, Ep: epidote, K-fds: K-feldspar.
4.7 Fe-Ti Oxides The Fe-Ti oxides in the ASK57 and ASK86 cores commonly occur in the matrix, and a few of them are emplaced in vesicles. These oxides are mainly magnetite and ilmenite. Some magnetite grains show micro-porosity (Figure 40A). Ilmenite shows a skeletal texture, and both magnetite and ilmenite are partially replaced/altered by titanite. In addition, ilmenites in vesicles are intergrown with quartz (Figure 40B and see also Figure 27B).
In Figure 41A, the ASK86-57 samples have been plotted in the ternary system TiO2-Fe2O3-FeO, proposed by Buddington and Lindsley (1964). Representative chemical analyses of the Fe-Ti oxides are given in Table 9. According to the microprobe data, most of the magnetite crystals contain some TiO2 (0.29-3.09 wt.%), Al2O3 (0.13-2.5 wt.%), Mg (72-1127 ppm), Mn (364-743 ppm), V (407-2297 ppm), and Cr (0-699 ppm), coupled with FeT (64.99-68.17 wt.%). It is noticed that one sample shows a relatively low TiO2 content of 0.26 wt% coupled

77
with the lowest FeT content (65.39 wt%) and falls in the re-equilibrated magnetite field. On the other hand, the other samples show variable TiO2 contents (0.11-0.49 wt%), coupled with the highest FeT content (70.25-74.64 w%), falling in the hydrothermal magnetite field (Figure 41B). Ilmenite contains TiO2 (50.14-51.84 wt.%), FeOT (41.85-44.77 wt.%) and trace amount of Mg (464-760 ppm), Mn (17014-32186 ppm), V (2202-3915 ppm), and Cr (6-239 ppm), but has been largely replaced by titanite (Figure 41B).
Table 9. Representative microprobe analyses of magnetite and ilmenite. Calculated number of cations on the basis of 4 oxygen atoms (spinel group), using the spreadsheet for mineral formula calculation at https://serc.carleton.edu/. FeT (wt%) and V/Ti values calculated based on Wen et al. (2017). FeT = [FeO wt% *(molar mass Fe/ molar mass FeO)] and V/Ti = [(V2O3 wt% * (2 * molar mass V/molar mass V2O3)/(TiO2 * molar mass Ti/molar mass TiO2)]
Analysis (wt%) 57-10-O2 86-07-O7 86-07-O8* 86-09-O12 86-12-O9 86-12-O3 86-12-O5* 431.6 m 468.1 m 468.1 m 478.8 m 486.9 m 486.9 m 486.9 m
Magnetite Ilmenite SiO2 0.44 0.89 0.66 0.62 1.17 0.13 0.11TiO2 0.49 3.09 2.48 2.48 0.16 50.59 50.84Al2O3 0.34 0.16 0.13 0.40 0.27 0.02 0.01Cr2O3 0.05 0.01 0.03 0.10 0.04 0.03 0.00Fe2O3 64.09 57.92 60.30 60.21 63.04 0.00 0.00FeO 30.99 33.75 33.17 33.22 31.59 44.77 44.63MnO 0.05 0.05 0.09 0.08 0.04 2.20 2.41MgO 0.03 0.04 0.01 0.08 0.04 0.13 0.08V2O3 0.17 0.10 0.06 0.20 0.12 0.36 0.58NiO 0.03 0.02 0.03 0.01 0.00 0.00 0.00Total 96.67 96.04 96.95 97.41 96.45 98.22 98.66
Element (wt%) Ti 0.30 1.85 1.49 1.48 0.09 30.33 30.48Ni 0.02 0.02 0.02 0.01 0.00 0.00 0.00Cr 0.03 0.01 0.02 0.07 0.03 0.02 0.00V 0.11 0.07 0.04 0.14 0.08 0.24 0.39Al 0.18 0.08 0.07 0.21 0.14 0.01 0.01Mn 0.04 0.04 0.07 0.07 0.03 1.70 1.86Fe+2 24.09 26.24 25.78 25.82 24.56 34.80 34.69Fe+3 44.83 40.51 42.17 42.11 44.09 0.00 0.00Mg 0.02 0.02 0.01 0.05 0.02 0.08 0.05
Based on 4 oxygen atomsSi 0.017 0.035 0.026 0.024 0.046 0.005 0.004Ti 0.015 0.092 0.074 0.073 0.005 1.463 1.465Al 0.016 0.007 0.006 0.018 0.013 0.001 0.001Cr 0.001 0.000 0.001 0.003 0.001 0.001 0.000
Fe3+ 1.913 1.734 1.792 1.777 1.881 0.000 0.000Fe2+ 1.028 1.123 1.095 1.090 1.047 1.440 1.430Mn 0.002 0.002 0.003 0.003 0.001 0.072 0.078Mg 0.002 0.002 0.001 0.005 0.002 0.007 0.004V 0.005 0.003 0.002 0.006 0.004 0.011 0.018Ni 0.001 0.001 0.001 0.000 0.000 0.000 0.000
V/Ti 0.38 0.04 0.03 0.09 0.84 0.01 0.01FeT (wt%) 73.91 71.27 72.66 72.63 73.57 38.80 34.70

78
Figure 40. (A) Backscatter electron image of ASK86-07 showing magnetite with intergrowth of titanite in a matrix primarily composed of albite. (B) Backscatter electron image of ASK86-12 showing skeletal ilmenite partially replaced with titanite. Ttn: titanite, Ab: albite, Qz: quartz.
Figure 41. (A) The ternary diagram TiO2-Fe2O3-FeO showing the major solid-solution series and the approximate fields in which different Fe-Ti oxides can be found (redrawn after Buddington and Lindsley, 1964; domains taken from Nadoll, 2011). The fields within dashed black lines mark the compositions of primary Fe-Ti oxides in volcanic rocks from Geitafell volcano: 1 ilmenite in grabbros and lavas, 2 titanomagnetite in gabbros, lavas and acid rocks, 3 magnetite in gabbros (Thorlacius, 1991); (B) FeT [FeO wt% *(molar mass Fe/ molar mass FeO)] versus V/Ti [(V2O3 wt% * (2 * molar mass V/molar mass V2O3)/(TiO2 * molar mass Ti/molar mass TiO2)] proposed by Wen et al. (2017) for magnetite discrimination. Note that the vertical axis is logarithmic. Data for igneous magnetite from mafic to felsic volcanic rocks are taken from varies authors cited in Wen et al. (2017). The bold black line marks the boundary between unaltered and hydrothermally altered igneous magnetite. The dashed black line in (B) is the approximate boundary separating re-equilibrated porous magnetite and hydrothermal magnetite. The blue solid arrow represents the trend of re-equilibration towards hydrothermal magnetite, showing that the concentration of Ti in magnetite drops during the dissolution-reprecipitation process (Wen et al., 2017).

79
4.8 Titanite Titanite commonly occurs partially (or completely) replacing ilmenite in the matrix (Figure 42A and 42B). The composition of titanite from the examined samples ranges from 68 to 92 mol.% titanite end-member (Table 10). The Al and Fe contents range from 0.06 to 0.24 atoms per formula unit (a.p.f.u.) and 0.05 to 0.37 a.p.f.u., respectively, together with F from 0.06 to 0.34 a.p.f.u. Some of the samples have Fe/Al ratio close to 1:1 showing volcanic/plutonic events related to the titanite formation or poor analyses, but most of them have <1:2 ratio, indicating metamorphic/hydrothermal processes (Figure 42C). In Figure 42D, Al+Fe is plotted as a function of F (both in a.p.f.u), where in the case of most the titanite in ASK86-57 core samples, compositions fall in the field of metamorphic/hydrothermal environment (Kowallis et al., 2018).
Figure 42. (A) Backscatter electron image showing skeletal ilmenite partially replaced with titanite (B) Backscatter electron image from ASK86-07 showing instititial titanite in the matrix. (C) Al vs Fe diagram showing the Fe/Al ratio domains of titanites. Titanites in volcanic and plutonic rocks typically plot close to the 1:1 line and almost always have >1:2 ratio; in silica-undersaturated volcanic and plutonic rocks, typically >1:1 ratio; in metamorphic, hydrothermal, and pegmatitic environments, they have widely scattered Fe/Al; whereas eclogite tends to have titanite with the lowest Fe/Al, typically <1:8 (Kowallis et al., 2018). (D) Al+Fe vs F (a.p.f.u) diagram showing the compositions of titanite formed in different environments (redrawn after Kowallis et al., 2018); Ab: albite, Qz: quartz, Ilm: ilmenite, Ttn: titanite, Mt: magnetite.

80
Table 10. Representative microprobe analyses of titanite. Calculated number of cations on the basis of 5 oxygen atoms, using the spreadsheet for mineral formula calculation at https://serc.carleton.edu/.
Analysis wt%
57-05-MT9 56-10-T9 86-07-MT7 86-09-T13 86-12-T3 86-12-T4376.1 m 431.6 m 468.1 m 478.8 m 486.9 m 486.9 m
SiO2 30.36 31.73 30.91 28.20 30.71 31.14 TiO2 35.25 32.32 30.76 34.97 31.45 29.26 Al2O3 1.48 3.50 4.36 2.32 3.79 4.73 FeO 2.58 2.15 2.39 5.38 2.50 3.26 MnO 0.03 0.03 0.00 0.31 0.04 0.02 MgO 0.13 0.01 0.00 0.13 0.09 0.03 CaO 27.45 27.95 28.39 24.75 27.04 27.81
Na2O 0.05 0.02 0.01 0.18 0.02 0.02 NiO 0.00 0.00 0.02 0.01 0.00 0.00 K2O 0.04 0.06 0.01 0.04 0.01 0.02
Cr2O3 0.00 0.03 0.04 0.00 0.07 0.01 F 0.93 0.77 0.61 1.29 1.04 1.28 Cl 0.07 0.01 0.00 0.03 0.01 0.00
Total 98.37 98.58 97.51 97.61 96.76 97.57 Based on the 5 oxygen atoms
Si 1.006 1.034 1.011 0.949 1.022 1.022 Ti 0.878 0.792 0.757 0.885 0.787 0.723 Al 0.058 0.134 0.168 0.092 0.149 0.183
Fe3+ 0.179 0.218 0.295 0.251 0.233 0.329 Mn 0.001 0.001 0.000 0.009 0.001 0.000 Mg 0.006 0.001 0.000 0.006 0.004 0.001 Ca 0.974 0.976 0.995 0.893 0.964 0.978 Na 0.003 0.002 0.001 0.012 0.001 0.001 Ni 0.000 0.000 0.000 0.000 0.000 0.000 K 0.002 0.002 0.000 0.002 0.001 0.001 Cr 0.000 0.001 0.001 0.000 0.002 0.000 F 0.098 0.079 0.063 0.137 0.109 0.133 Cl 0.004 0.000 0.000 0.002 0.000 0.000
Total 3.09 3.08 3.06 3.14 3.11 3.13 XTtn 0.90 0.91 0.92 0.86 0.88 0.84
4.9 Carbonates The only carbonate mineral in the ASK86 and ASK57 cores is calcite. The chemical analysis shows almost pure calcite end-member (>97.8 %). Fe, Mg, Mn, Sr were also detected, but as trace components (Table 11). Calcite fills partially vesicles and veins and hosts acicular amphiboles (actinolite according to the analyses above, Figure 43A and B).

81
Figure 43. (A and B) Backscatter electron images of ASK57-05 showing calcite, epidote, and zeolites filling vesicles and hosting acicular actinolite; Ep: epidote, Zeo: zeolite, Amph: amphibole.
Table 11. Representative microprobe analyses of calcite. Calculated number of cations on the basis of 6 oxygen atoms, using the spreadsheet for mineral formula calculation at https://serc.carleton.edu/.
Analysis (wt%)
57- 10-Cal10 57- 10-Cal11 57- 10-Cal12 86-09-S26-Cal1 86-09-S23-Cal7431.6 m 431.6 m 431.6 m 478.8 m 478.8 m
FeO 0.00 0.00 0.05 0.06 0.07 MnO 0.04 0.04 0.02 0.08 0.10 MgO 0.01 0.00 0.07 0.00 0.02 CaO 57.36 57.67 56.68 58.39 47.11SrO 0.02 0.00 0.09 0.00 0.00 BaO 0.00 0.00 0.02 0.00 0.00 CO2 42.58 42.29 43.08 41.47 52.70Total 100.005 99.999 99.997 99.999 99.998
Based on the 6 oxygen atoms FeT 0.000 0.000 0.001 0.002 0.002Mn 0.001 0.001 0.000 0.002 0.003Mg 0.000 0.000 0.003 0.000 0.001Ca 2.074 2.091 2.040 2.134 1.557Sr 0.000 0.000 0.002 0.000 0.000Ba 0.000 0.000 0.000 0.000 0.000C 1.962 1.954 1.976 1.931 2.219
XMnCO3 0.05 0.05 0.02 0.11 0.16 XCaCO3 99.91 99.94 99.65 99.81 99.66XMgCO3 0.01 0.01 0.16 0.00 0.06 XFeCO3 0.00 0.00 0.07 0.08 0.11


83
5 Discussion The combination of petrographic observation, SEM-EDS and EMPA analyses in rocks from Hoffell/Miðfell can provide unequivocal evidence for the presence of a hydrothermal system related to Geitafell volcano. The local area has been mapped as the lowermost lava unit (tholeiitic) belonging to the Geitafell volcano (Basalt Lava Unit I), intruded by basaltic cone sheets and dykes and a few acid intrusions (Friðleifsson, 1983a and Thorlacius, 1991). A minor outcrop of subaerial rhyolitic rock is exposed farthest to the east in the Hoffell/Miðfell field, within lava unit I, but considered (by Friðleifsson 1983a) to belong to the older Setberg central volcano just southeast of the Geitafell volcano and mark the onset of the Geitafell volcano. Accordingly, tholeiitic lavas of Geitafell lava unit I and possibly some intermediate to rhyolitic rocks belonging to the Setberg Central Volcano (CV), should be intersected by the drillholes in the Hoffell/Miðfell study area. The area has also been included within the actinolite alteration zone of the Geitafell CV, with actinolite, epidote, and garnet as index minerals (Friðleifsson, 1983a). However, no garnet has been found in the cores analyzed in this study, while it is found exposed on surface as amygdale mineral in outcrops close to the drillholes.
5.1 Alteration Sequence The formation of hydrothermal minerals is dependent on permeability, the temperature and pressure, fluid composition, the initial composition of the rock and the number of hydrothermal regimes (Reyes, 1990). Secondary mineral sequences provide information on the hydrothermal alteration history and allow to infer conditions in active hydrothermal systems (Friðleifsson, 1983a). The predominant rock types encountered in the Hoffell/Miðfell cores are basalts, trachy-basalts and andesites, interbedded with rhyolites and paleosoils, and crosscut by mafic dikes and trachyandesite intrusions (Williams, 2020). The intermediate and acid rocks presumably belong to the Setberg CV (Friðleifsson personal comment, a discussion above).
The mineral crystallization sequence in this study has been interpreted based on petrographic observations under stereomicroscope, petrographic microscope and SEM-EDS and EMPA analyses. The alteration processes in Hoffell/Miðfell rocks were mainly controlled by primary textural and structural features (i.e., contacts of different formations, lava-flow pattern, vesicularity) and by the presence of radial, or irregularly distributed, fractures that crosscut the volcanic sequences. These form flow structures, chilled margins, amygdales and veins (Figure 44).
Chemical compositions and textural features evidence that the most mineral phases found in Hoffell/Miðfell rocks have a hydrothermal origin. Chlorite, epidote, quartz, actinolite, albite, K-feldspar, calcite, titanite and zeolites are characterized as secondary minerals that form at different temperature ranges and at variable fluid conditions (see section 5.2) in high to low T hydrothermal systems. On the other hand, there is an unusual presence of secondary

84
clinopyroxene in the matrix, furthermore secondary magnetite and ilmenite were also identified. The evidence for the secondary origin of these minerals is the following:
1) The chemical composition of clinopyroxenes analyzed in matrix and vesicles overlap with the secondary pyroxene field of Reykjanes, but do not overlap with the igneous pyroxene fields of Geitafell, Hellisheiði, Krafla systems (see Figure 29). Hydrothermal clinopyroxene becomes more abundant with depth related to a relative enrichment of CaSiO3, and related to contact metamorphism (Manning and Bird, 1986; Marks 2011).
2) Secondary magnetite is very rare in hydrothermal environments like the one in Geitafell. Fe-hydroxides are the usual hydrothermal alteration products of magnetite (Friðleifsson personal comment). Although the V/Ti ratios are similar to igneous magnetite, the Fe wt% is higher than igneous. As fluid-magnetite interaction proceeds, the magnetite becomes compositionally more pure (higher iron content than its precursor) until chemical equilibration is achieved (Wen et al., 2017). In this context, magnetite of Hoffell/Miðfell rocks fall in the hydrothermal magnetite field (see Figure 41B) due to re-equilibration.
3) Most of the ilmenites were identified in the matrix and can be interpreted as relic igneous minerals. However, a few ilmenites have crystalized in vesicles intergrown with hydrothermal quartz (see Figure 40B and Figure 27B). This textural feature observed in a metabasalt contradicts with igneous origin and suggests the presence of hydrothermal ilmenite in some samples of Hoffell/Miðfell rocks.
5.1.1 Matrix alteration
In general, the matrix in basalts and andesites from both wells show a greenish color due to propylitic alteration. Petrographic observations under polarization microscope show that the mafic minerals are altered to chlorite and actinolite, and plagioclase to albite, and formation of epidote. However, the EPMA analysis takes a crucial role in the identification of the secondary minerals in the matrix of rock in the Hoffell/Miðfell wells. For example, noticed is the presence of hydrothermal albite replacing partially primary plagioclase in the matrix (albitization, Figure 28B, C and E). What was identified as hornblende by SEM-EDS is in fact fine-grained actinolite that appears interstitially in the matrix (Figure D 1.6, and Figure 30). Secondary clinopyroxenes are mainly calcic pyroxenes that are emplaced in the matrix (Figure 29A and 29B) and in some vesicles as a cluster of aggregate minerals. Most of the magnetite is hydrothermal magnetite based on the Fe, Ti and V analyses (Figure 45), and titanite was identified replacing partially magnetite and ilmenite.

85
Figure 44. (A and A’) Photographs showing flow texture and chilled margins formed by hydrothermal alteration of the rock. (A) ASK57 core section from 443.90 m to 444.74; (A’) Unrolled section from image (A). (B and B’) Photographs showing structural control on the fluid patterns forming veins and alteration halos; (B) ASK57 core section from 457.67m to 458.41; (B’) Unrolled section from B image; (C and C’) Photographs showing textural control on the secondary mineralization and the formation of veins and amydales. (C) ASK86 core section from 480.25m to 480.7m (C’) Photograph using binocular microscope of the ASK86-10 sample at 480.54m depth. (D) ASK86 core section from 492.80to 492.92, showing structural contact control on the fluid patterns that altered both lithologies, the felsic rock (rhyolite) at the top and the mafic rock (basalt) below. (A, A’, B, B’,C, C’ and D are images provided courtesy of Dr. Guðmundur Ómar Friðleifsson).

86
Figure 45. (A) Backscattered electron image of ASK86-11 showing anhedral re-crystallized magnetite in a matrix. (B and C) Backscattered electron image maps of ASK86-12 and ASK57-09, respectively, showing Ti concentration in matrix related to ilmenite and titanite.
5.1.2 Mineral infilling in veins
Most of the fractures in the Hoffell/Miðfell rocks are filled with secondary minerals forming vein systems along the core sections. In thin-sections, the thickness of most of the veins is less than 0.5 mm. Five main vein systems have been identified: (1) Fine-grained chlorite veins, (2) quartz veins, (3) epidote-chlorite-actinolite-zeolite veins (4) calcite veins and (5) zeolite veins. These vein systems are described below in chronological order based on cross-cutting relationships.
1. Fine-grained chlorite veins. These occur usually in polygonal fractures in highly altered basaltic flows (Figure C 8.7, C 8.8, and C 8.9). Fine-grained chlorite veins appear to be formed during the earliest alteration process, followed by crystallization of coarse-grained chlorite veins, and crosscut by calcite veins (Figure 46A).
2. Quartz veins. These occur in irregular fractures and elongated cavities in altered basalts and rhyolites (Figure 10C and Figure E 5.A). Quartz veins appear to be the first vein system formed after the crystallization of fine-grained chlorite in vesicles and veins and they are also crosscut by epidote veins (Figure 46B and 51B,).
3. Epidote-chlorite-actinolite-zeolite vein system. This includes several generations of veins throughout the fracture system. Epidote and chlorite crystallize in the fracture wall of some veins, followed by acicular amphiboles and zeolites (Figure 11A). Veins of this system also include both coarse-grained epidote and coarse-grained chlorite veins (Figure C 4.7 and C 8.9) distributed throughout both wells (ASK57 and ASK86). This vein system indicates that several generations of fluids took part in the formation of its multiple veins. Veins of this system cross-cut quartz veins and appear to be contemporaneous with the crystallization of coarse-grained epidote and chlorite in vesicles (see later). However, the zeolites infilling in center of some veins of this system are related to the latest alteration process.
4. Calcite veins usually have anhedral crystals of calcite. The calcite veins commonly cut the epidote and chlorite vein systems in basalt, andesites and rhyolites (C 5.7, C 5.8, C 8.15, E 5.A), and cut euhedral quartz (Figure 46 C) and epidotes emplaced inside of some vesicles (Figure 12D, 13D, 27 C, E 11.D). Calcite veins appear to be formed after the epidote-chlorite-actinolite-zeolite vein system in the transition to the latest alteration process.
5. Zeolite veins have coarse-grained zeolites in basalts, mainly at the bottom of the ASK 86 well. Calcite is a trace component in crystalline zeolite veins. These veins crosscut the previous vein systems and amygdales (Figure 26A, Figure C 12.1, C 12.2, C

87
12.5). This suggest that zeolite (stilbite-stellerite mainly) vein formation occurs during the latest alteration process in the system.
Figure 46. Vein systems in some of the samples from Hoffell/Miðfell wells. (A) Photomicrographs from ASK86-05 in plane-polarized light showing a calcite vein cross-cutting a chlorite vein; (B) Photomicrographs from ASK57-10 in plane-polarized light showing an epidote vein cross-cutting a quartz vein; (C) Photomicrographs from ASK57-11 in cross-polarized light showing a calcite vein cross-cutting euhedral quartz.
5.1.3 Mineral infilling in vesicles
Rocks recovered from Hoffell/Miðfell boreholes show variable sizes of vesicles depending on the lithology. Some rocks have as much as 30% vesicles that are now amygdales filled with secondary minerals (Appendix C). These amygdales show different sequences of mineral precipitation at different stages, and many of them show geopetal structures (Figure G 1).
Based on crystal grain size and special distribution of minerals in the vesicles, the chronological infilling sequence is generally as follow: fine-grained chlorite/epidote coarse-grained chlorite/epidote quartz actinolite calcite albite K-feldspar zeolites. Detailed infilling observations are described below.
Massive microcrystalline chlorite filled small vesicles completely, sometimes interbedded with fine-grained epidote (Figure C 1.4 and C 1.5). These minerals also fill the bottom of larger vesicles forming the base of geopetal structures (Figure 47A). Layered silica also appears in a few large vesicles (Figure B 3).
In larger vesicles, concentric layers of secondary minerals were precipitated along the inner walls. Some vesicles are filled completely by chlorite with different habits. Coarse-grained chlorite forms circular rims along the inner wall of the vesicle followed by radial aggregates of chlorite that fill the remaining void of the vesicle (Figure C 10.10 and C 11.5). Chlorite also forms irregular rims and aggregates in some vesicles, after quartz crystallization (Figure 47B, 47C, C 12.7 and C12.8). In some samples, this coarse-grained, euhedral chlorite is the first mineral which is deposited in vesicles walls, interbedded with quartz, and followed by epidote, actinolite, calcite and zeolites in the central part of the vesicles (Figure C 1.11, C 3.6, C3.8 and E1.C). Epidote crystals increase in size and appear more prismatic in the inner part of the vesicles (Figure E 4.E, E 9.A, E 11.A).

88
Figure 47. (A) Geopetal structure of chlorite (Chl)-smectite (Smc?)-epidote (Ep), showing on-going alteration of likely smectite (light-teal green) to microcrystalline chlorite (dark-green). (B) Photomicrograph from ASK86-12 showing rim and irregular shape veins of chlorite with interstitial quartz (bright) and feldspars (brownish). (C) X-ray map showing the crystalization sequence of secondary minerals in a vesicle: quartz (Si-rich, light blue) chlorite (Al-rich, dark-green) epidote (Al-rich, light-green) calcite (Ca-rich, orange)
Well-developed crystals of drusy quartz form rims on the vesicle borders and clusters of minerals that fill partially some vesicles (Figure 26C, Figure 48A, 48B and C 12.7). Detailed observations also show rims on vesicle borders of both K-feldspar and epidote, interbedded in drusy quartz rims on the inner part of vesicles (Figure E 2.A). However, some vesicles show that coarse-grained quartz was emplaced before epidote, chlorite, and calcite. (Figure 48, 48B, E 2.M and E 2N). Coarse-grained calcite fills the center of some vesicles (Figure E10.E), and anhedral calcite (with intergrowth of albite) was emplaced between epidote crystals and zeolites in some vesicles after chlorite crystallization (Figure 48C, E10 C and E10F). Acicular actinolite also appears to be intergrown with epidote, calcite, zeolites and quartz, and fine-grained albite fills the remaining voids of some vesicles after chlorite, epidote, and calcite crystallization (Figure 49, E 2.O, E 2. P, C3.6 and C3.9).
Figure 48. X-ray maps showing the crystallization sequence of secondary minerals in some vesicles. (A) quartz (Si-rich, light blue) zeolite (Si and Ca-rich, pale blue) calcite (Ca-rich, orange) K-feldspar (K-rich, blue); (B) quartz (Si-rich, red) calcite (Ca-rich, green); (C) chlorite rim (Mg-rich, light green) calcite (Ca-rich, red) epidote (Ca- and Al-rich, orange, coarse grains).

89
Figure 49. (A) Backscattered electron image of a vesicle infilling from ASK86-01 showing albite (dark grey) integrowth with calcite (light grey) and drusy albite filling an open space. (B and C) X-ray maps of a vesicle infilling from ASK86-01showing albite (Na-rich, blue) and K-feld (K-rich, pink) intergrowth with zeolite (Si-rich, light blue) after epidote crystallization (Ca-rich, orange).
Figure 50. X-ray maps of a vesicle from ASK57-10 showing the crystalization sequence of secondary minerals. (A) Coarse-grained crystals of epidote (Ca) on a vesicle border; (B) Zeolites (Si-rich, pale yellow) filling the center of the vesicles (and quartz veins (Si-rich, yellow); (C) Acicular actinolite (Mg-rich) intergrowth with zeolites (green lines in the center of the vesicle); Notice the presence of albite (Na-rich, red in the Figure A), quartz veins (Si-rich, intense yellow in the Figure B) and chlorite in the matrix.
The remaining and interstitial spaces in between coarse-grained epidote, chlorite, and calcite, as well as the cores of the vesicles, were commonly filled with well-shaped zeolites (stilbite, stellerite, yugawaralite, chabazite, laumontite and wairakite). Some of these zeolites have K-feldspar intergrowths. (Figure 51).
Figure 51. X-ray maps of a vesicle of ASK86-07 showing the crystallization sequence of secondary minerals. (A) Rim of chlorite (Mg-rich, green); (B) Coarse-grained epidotes (Ca-rich, orange); (C) Zeolites (Si-rich, blue) as the last crystallization phase.

90
In general, the geopetal structures formed in the ASK86 and ASK57 rock samples are similar to those described by Friðleifsson (1983a). The early deposition marks a sharp contact with the high and low temperature mineral phases. The difference lies in the infilling minerals at the bottom of some vesicles, and the absence and inclusion of some mineral phases during the hydrothermal alteration (see section 5.4).
5.2 Temperature implication Table 12 summarizes the temperature ranges of secondary minerals and the environment and stages where they occur in the rocks from the Hoffell/ Miðfell wells.
Table 12. Temperature ranges of hydrothermal alteration minerals and the conditions of their formation in the Hoffell/Miðfell wells from : 1. Palmason et al., 1978 (ML-CM: mixed-layer clay minerals); 2. Corbett and Leach, 1997, 3. Reyes, 1998; 4. Manning and Bird, 1986; 5. Kristmannsdóttir, 1979; 6. Larsson et al., 2002; 7. Nadoll et al., 2014 and Zhao et al. 2019; 8. Thompson and Thompson, 1996; 9. Kristmannsdóttir and Tómasson 1978; 10. Marosvölgyi, 2009; 11. Fridriksson et al., 2001; and 12. Weisenberger and Selbekk, 2009. Note: Figure G 2 shows the secondary mineral association at different levels in the Hoffell/Miðfell core sections.
Mineral assemblages developed in Hoffell/Miðfell area represent alteration processes (rock/fluid) in different stages at different temperature and pH ranges. These alteration process can be divided into three major stages.
5.2.1 Stage I. Clay minerals and fine-grained chlorite and epidote
The stage I is characterized by the mineral assemblage smectite/fine-grained chlorite ± fine-grained epidote in the matrix, veins (vein system 1) and in the bottom of geopetal structures in vesicles.
Fine-grained sediments (mud) have been reported as the earliest in filling material on the vesicle floors unrelated to hydrothermal activity. Few vesicles show layered silica (chemical precipitation, Figure B 3), which may have segregated from a silica-rich sediment upon

91
alteration (Friðleifsson, 1983a). These geopetal structures provide a clear indication that the cored rock sequences were tilted after the precipitates were originally deposited horizontally in the vesicles (Figure G 1.B) and provide the first stage of the alteration process at low temperature. Based on the EDS-spectra and chemical composition, these sediments have been altered and replaced by microcrystalline chlorite that forms the base geopetal structures during fluid flow in basaltic-andesitic rocks in the samples analyzed.
It is noticed that fine-grained chlorite could be a product of recrystallization of smectite due to temperature increase. In general, smectite is stable at 140°C, and chlorite has a large temperature range (from <50°C to >300°C, Table 12). Sometimes, fine-grained epidote interbedded with microcrystalline chlorites suggest crystallization temperatures in the range of 180°C - 220°C (Corbett and Leach, 1997). However, in active high-temperature areas in Iceland, smectite occurs up to 200°, mixed-layer clay minerals (ML-CM) to 240°C and chlorite above that temperature (Palmason et al., 1978).
The main chlorite-forming processes have been reported as follows: (1) replacement of non-clay substrate (volcanic glass), (2) replacement of a clay-mineral precursor, and (3) precipitation directly from pore fluids which sourced magnesium and iron from the volcanic rock (Anjos et al., 2003 and Ma et al., 2017). The habit of the microcrystalline chlorites suggests that these could be the result of clay-mineral alteration (chlorite-forming process number 2). Ma et al (2017) and Weisenberger and Selbekk (2009) mention smectite as a precursor mineral for chlorite, especially trioctahedral smectite. Smectite is common in volcanic rocks during the early stages of alteration (Ma et al., 2017). In addition, many core samples instantly absorbed water during the petrographic description under stereomicroscope, which suggests the presence of clay minerals.
Based on the presence of fine-grained chlorite as a product of recrystallization of smectite and the range temperatures in active geothermal systems in Iceland, the minimum temperature of stage 1 is ~ 50 °C, and the presence of fine-grained chlorite/epidote suggest that the maximum temperature of the stage 1 is ~230 °C.
5.2.2 Stage II. Calc-silicate assemblage and quartz
This stage is demarcated by the sharp contact between chemical precipitation of both fine-grained chlorite-epidote, along with coarse-grained calc-silicates, in vesicles, and albitization-propylitization alteration in the matrix of most of the rocks. This stage is characterized by the alteration mineral assemblages of chlorite + epidote + wairakite + calcite quartz + albite ± K-feldspar ± actinolite ± clinopyroxene ± magnetite ± ilmenite ± titanite, in vesicles and veins (vein systems 2, 3 and 4), and chlorite + epidote + albite + actinolite + clinopyroxene + magnetite + ilmenite + titanite, in the matrix, and it marks the highest alteration temperature (peak alteration) in the system before the temperature dropped again.
In the matrix, the albitization process involves an interface-coupled dissolution–reprecipitation mechanism that allows hot and alkaline fluids to mobilize and transport a wide variety of major, minor and trace elements, including elements such as Al and Ti, which are commonly regarded as relatively immobile during hydrothermal alteration. In this context, labradorite plagioclase has been replaced by albite in an aqueous sodium silicate solution (Hövelmann et al., 2010). In addition, Reyes (1998) describes the albitization process as a Na-metasomatism of plagioclase as part of a propylitic alteration assemblage.

92
At the same time, disseminated Fe-Ti oxides in the matrix have suffered re-equilibration processes. Low Fe concentration in magnetite indicates early crystallization from a cooling magma. On the other hand, high Fe content is coupled with hydrothermal alteration due to a dissolution-precipitation process. In the samples analyzed, most of the magnetite has hydrothermal origin that forms at lower temperature than igneous magnetite as a result of the infiltration of hydrothermal fluid, break-down of reactant minerals, nucleation and re-crystallization (Wen et al., 2017). Hydrothermal magnetite has lower concentrations of trace elements, but higher Fe content than igneous magnetite (Dare et al., 2014; Nadoll et al., 2014). Igneous magnetite has V/Ti ratios that are generally <1, probably due to the higher concentration of Ti relative to V in silicate melts. In sharp contrast, hydrothermal magnetite has V/Ti ratios that are generally > 1 (Figure 41B). Zhao et al. (2019) reveals that magnetite is replaced by hematite at 200°C, and in geological terms this process can even be at lower temperature. Li et al. (2019) show that hematite is directly formed on the magnetite surface at 275°C and demonstrate that the magnetite oxidation kinetics do not always quicken with temperature. This suggests that magnetite should be stable below 200°C in hydrothermally altered rocks.
As hydrothermal magnetite forms, a coeval process is the replacement of ilmenite by titanite. The replacement reaction can be illustrated as below (Wen, et al., 2017):
Ilmenite + Ca2+ (aq) + H4SiO4 (aq) -> Titanite + Fe2+ (aq)+ 2H2O
In addition, the hydrothermal titanite formation is also most likely due to hydration reactions involving clinopyroxene, ilmenite and quartz. The hydrothermal reaction is stabilized at high oxygen (O2) and water (H2O) fugacity, which controls the abundance of Fe3+ substituting in the titanite Ti-site during hydrothermal activity (Kowallis, 1997; René, 2008; Pandit, 2018). This has been explained by the following equilibrium reaction:
7 Clinopyroxene + 3 Ilmenite + 5 SiO2 (quartz) + 2 H2O = 2 Amphibole + 3 Titanite
Reyes (1998) states that titanite starts to appear in the range of 180 to 220°C in some hydrothermal systems with fine-grained epidote (e.g., Wairakei and Tongonan), and remains stable up to > 320°C.
Clinopyroxenes in vesicles and matrix are diopside and show different chemical composition than those reported in previous studies from Geitafell (Friðleifsson, 1983a, Thorlacious 1991). However, a few clinopyroxenes in vesicles have similar Mg# and Al2O3 wt% as those found within skarn deposits in Geitafell (outer contact aureole to a gabbro intrusion). On the other hand, the clinopyroxenes analyzed are similar to the hydrothermal clinopyroxenes in Reykjanes that form at lower temperature than igneous clinopyroxenes. It is important to point out that secondary clinopyroxene composition ranges from diopside to hedenbergite with minor augite (Manning and Bird, 1986).
The amphiboles analyzed in matrix and vesicles have a similar range in composition (mainly actinolite) as the amphiboles analyzed by Friðleifsson (1983a), but larger composition range than the actinolites from Hellisheiði (Helgadóttir et al., 2015), suggesting a greater variation of Si content in actinolite in the rocks of the Hoffell/Miðfell wells compared to the altered igneous and metamorphic rocks of Hellisheiði. In addition, the actinolite analyzed shows a trend towards hornblende composition similar to the hydrothermal actinolite in Reykjanes, suggesting that actinolite is produced by the interaction of meteoric water with a magma

93
intrusion. Actinolite appears to be stable in active hydrothermal systems at temperatures >280-350°C and secondary clinopyroxene at >350°C (Reyes, 1998), and they are related to intrusive bodies. In this context, the presence of a local intrusion beneath the bottom of the drilled wells of this study could be one factor affecting the hydrothermal system. The exploration well HF-1, located 88 m from the well ASK86 in the SE direction, is reported reaching a coarse-grained granophyric intrusion at about 1050 km depth. This intrusion has been identified in all five exploration wells (Kristinsson et al., 2018), and its minimum horizontal extension is about 1.36 km (distance from HF-1 to HF-5).
In vesicles, coarse-grained varieties of both chlorite and epidote precipitated from an already high-temperature pore fluid on the edges of the vesicles and veins. Epidote crystals increase in size and appear more prismatic with increasing temperature (Thompson and Thompson, 1996), and were emplaced along with and after chlorite crystals. Some epidotes show patchy and oscillatory zonation that corresponds to chemical zoning with alternating Fe-rich and Al-rich rims and bands (Figure 31), indicating a fluctuation in the concentrations of Al and Fe3+ during the hydrothermal alteration processes and crystal growth.
Quartz in veins and vesicles crystallizes from high-temperature silica-rich fluids due to both rapid and slow drop in temperature, commonly within open spaces (Saunders et al., 1994). Active geothermal systems are saturated in SiO2 and quartz or silica (cristobalite, tridymite or amorphous silica) form in all mineral assemblages (Henley et al., 1984, Corbett and Leach, 1997). In high temperature areas in Iceland, quartz occurs from 180 to >300°C (Kristmannsdóttir, 1979, Franzson, 1998). In similar temperature range, based on oxygen and silicon isotopes analyses, Kleine et al. (2018) suggest that the formation of high-temperature (200°C-300°C) quartz is the result of equilibrium fractionation and progressive fluid interaction in Geitafell. This temperature range could be constrained by fluid inclusion analysis in future studies.
In vesicles and veins, euhedral calcite and drusy wairakite support the suggestion of boiling conditions during the alteration processes in the Hoffell/Miðfell wells (Tulloch, 1982; Reyes, 1998). In a simplest case, “boiling” (phase separation) will result in the coexistence of two types of inclusions, representing the trapping of either the liquid phase or the vapor phase during the secondary mineral formation (Roedder, 1984). In the thin sections of this study, quartz, calcite, epidote and chlorite crystals contain plenty of primary and secondary fluid inclusions (Appendix C). However, there was no clear evidence for a boiling process in these fluid inclusions. Most of them have sizes of a few microns, and they are dominated by a vapor-rich phase (Figure 52), indicating that many of the secondary minerals have precipitated from a vapor phases and sporadic boiling occurred in the system, but not necessarily at the site of mineral phase precipitations.

94
Figure 52. (A and B) Photomicrographs of vapor-rich fluid inclusions in the quartz of ASK86-09. Thin section under the polarizing microscope.
K-feldspar, calcite and wairakite are stable at 260°C (Browne, 1978) if the concentration of CO2 is high in the alteration fluid. This environment also causes deposition of calcite at the expense of epidote and wairakite during steam separation, similar to the mineral sequence observed in the Hoffell/Miðfell cores. Furthermore, Reyes (1998) shows that K-feldspar crystallization is characterized by the alteration of primary plagioclase to albite and wairakite at >240°C. This temperature is similar to the formation temperature stablished for the secondary micro-sized K-feldspar in the Hengill area (250°C, Larsson et al., 2002).
Wairakite occurs either in hydrothermal systems or in low-grade metamorphic rocks at hotter levels than other zeolites. The composition of wairakite in both types of occurrence tends to be Ca-rich with some range in Si content. In the ASK57 and ASK86 core samples, Si and Na content are similar to what is observed in geothermal systems (Utada, 2001), in contrast to wairakite in metamorphic rocks that have larger compositional range (see Figure 39). The calcite/wairakite coexistence marks a fluctuation of CO2 concentration in the fluid during mineral growth, and the transition to low-temperature zeolites.
Based on the presence actinolite the maximum temperature of stage 2 is from 280 °C to 350 °C. This range of temperature can be even higher based on the presence of secondary clinopyroxene. In addition, the hydrothermal assemblage of quartz + wairakite + calcite in the center of some vesicles suggests that the minimum temperature of stage 2 to be about 180 °C.
5.2.3 Stage III. Zeolite formation
Stage III was characterized by the crystallization of low-temperature zeolites that crystallized in the remaining and interstitial spaces among the coarse-grained crystals of stage II, and forms the last vein system, marking a temperature drop in the system.
Calcium zeolites are the most common in Icelandic geothermal fields (Kristmannsdóttir and Tómasson, 1978). Interaction between aqueous electrolyte solutions and volcanic rocks forms zeolites in geothermal systems (Neuhoff et al., 2000). All zeolites identified are dominated by the framework cation Ca (see Figure D 1.12). This could be related to the high Ca / (Na + K) ratio in the tholeiitic basalts affected by constant fluid composition (Weisenberger and Selbekk, 2009).

95
Zeolite minerals are particularly temperature sensitive. Zeolites become more hydrated at lower temperature conditions. In the Hoffell/Miðfell cores, laumontite (110-180°C) forms at cooler levels instead of wairakite (>200°C), indicating a temperature decrease in the hydrothermal system, and followed by the crystallization of the other identified lower temperature zeolites. The hydrous zeolites found in the Hoffell/Miðfell cores occur under typical low temperature condition (<50-180°C), in accordance with similar studies in other areas, such as Hvalfjörður (Weisenberger and Selbekk, 2009), Þeistareykir (Marosvölgyi, 2009) and Reyðarfjörður (Kristmannsdóttir, 1982). Basaltic flows and hyaloclastic rocks of Iceland show zeolite zones as a result of a geothermal gradient at temperature ranging between 50 and 200°C (Kristmannsdóttir and Tómasson, 1978).
Laumontite is a typical intermediate-temperature index zeolite in geothermal systems (Marosvölgyi, 2009). Most laumontite occurs as a result of hydrothermal alteration in rock that had abundant basaltic glass and/or plagioclase (Deer et al., 2004). In Iceland, laumontite is common in low-temperature areas (i.e., Reykjavík area, Hvalfjörður, Reykholtsdalur) and rare in high-temperatures areas (i.e., Nesjavellir, Þeistareykir, Krafla). Yugawaralite is not a common zeolite in Iceland, but it has been found in low-temperature areas and fossil systems (i.e., Snæfellsnes peninsula and Hvalfjörður) and in high-temperature areas (i.e., Þeistareykir) in highly altered andesites and tholeiites with wairakite (Weisenberger and Selbekk, 2009; Marosvölgyi, 2009).
Ca-stilbite has been found in basaltic rocks within the Hvalfjörður low-temperature geothermal area near Reykjavik, where it occurs in the same zone as thomsonite, heulandite and mordenite at depths from 800 to 1000 m (Kristmannsdóttir and Tómasson, 1978). It has been reported that stilbite forms solid-solution with stellerite in low-grade metabasalts in the east and north of Iceland (i.e., Berufjörður and Eyjafjörður), and their formation is a sensitive function of temperature, coexisting minerals and the local geothermal gradient (Fridriksson et al., 2001). Stilbite and stellerite form due to meteoric water percolation in basaltic rocks (Iijima, 1980).
Chabazite marks the lowest temperature in the system (< 70°C), and with thomsonite, this is a very common zeolite species in Iceland (Neuhoff et al. 2000). Chabazite forms by meteoric water percolation in basaltic tephra in an alkaline environment (Iijima, 1980; Marantos et al., 2011).
The retrograde evolution of zeolites in Hoffell/Miðfell rocks is characterized by the transition from high-temperature (wairakite) to low-temperature zeolites (yugawaralite, stellerite, stilbite, and chabazite). This is supported by the mode of occurrence of low-temperature zeolites, which are intergrown with irregular rims of wairakite (see Figure 36 and Figure 37), and by the stellerite veins that crosscut the earlier formed amygdales.
Stage 3 is a product of superposition of zeolites upon cooling of the Geitafell central volcano and is limited by the occurrence of laumontite (230 °C) and chabazite (<70°C). Indeed, the present-day artesian flow (3.5 l/s) from ASK86 is ~54°C, from a feed zone at 364 m depth (Friðleifsson personal information).

96
5.3 Implications for fluid pH and CO2 concentration
The primary fluid sources of the hydrothermal fluids in Geitafell are meteoric fluids of low salinity that interacted with hot intrusive rocks and developed a zoned mineralogical assemblage (Pope et al., 2014; Liotta et al., 2018).
Fine-grained chlorite coexists with clay minerals in environments where fluid pH is 5-6 (Corbett and Leach, 1997). The paragenesis epidote + chlorite minerals, with the appearance of secondary actinolite and clinopyroxene occurs at near neutral to alkaline conditions (Corbett and Leach, 1997; Reyes, 1998). Thus, products of hydrothermal activity in the Hoffell/Miðfell cores are mainly neutral acidity (pH 6-7) alteration suites (e.g., actinolite, clinopyroxene, epidote, calcite, K-feldspar, albite, zeolites).
The formation of acicular actinolite in vesicles is related to sodic-calcic alteration, which may form by the interaction of meteoric fluids with magmatic-hydrothermal systems (Thompson and Thompson, 1996). At higher temperatures than actinolite formation secondary clinopyroxene formation in the matrix could indicate a large fluctuation in the mass flux of alteration fluids. The minimum temperatures of equilibration of hydrothermal clinopyroxenes correspond to times of rapid temperature decreases as fluid flux increased to maximum values (Manning and Bird, 1986).
The calcite-wairakite intercalation in the center of some vesicles suggests CO2 fluctuations in the hydrothermal fluids. Calcite is stable at relatively high CO2 concentration in the fluid, otherwise, its place is taken by wairakite (Thompson and Thompson, 1996; Corbett and Leach, 1997). It is common that calcite replaces calcium-bearing minerals (epidote, zeolites, Ca-plagioclases) as a result of boiling and exsolution of CO2 (Thompson and Thompson, 1996). Calcite also coexists with chlorite and calcium-silicate minerals, as in the Hoffell/Miðfell rock cores, and this assemblage is interpreted to reflect the decreasing mobility of Fe, Mn and Mg, while the fluid pH increases (Leach et al., 1985). In contrast, zeolites crystallize in environment with low CO2 fluid concentration. Apparently, zeolites are considered to have formed by geothermal gradient change in Hoffell/Miðfell core rocks. Active migration of Na, K, Ca, Mg, silica and alumina between host rock and pore water is common at low temperature. In addition, leaching of alkalis increases the pH and alkalinity accelerates the host rock alteration, releasing silica and alumina to construct the zeolite frameworks (Iijima, 1980).
Secondary albite and K-feldspar in Hoffell/Miðfell core rocks show Na/K ratio fluctuations in the hydrothermal fluids. Albite forms where fluids have a high Na/K ratio at low permeability conditions. In contrast, K-feldspar occurs where the fluids have a low Na/K ratio within high fluid flow conditions (Browne, 1978). The Na/K ratio in water is the result of a dissolution-precipitation reaction rather than an ion exchange reaction. This implies that the crystallization of hydrothermal albite and K-feldspar is determined not only by temperature, but also depend on the composition of the host rock minerals (Larsson, 2002). Corbett and Leach (1997) also suggest that the K-feldspar-quartz-magnetite-chalcopyrite mineral association is stable in open spaces in fluids with <15 wt % NaCl.

97
It has also been noted that the presence of hydrothermal magnetite (magnetite in the matrix) reflects neutral to alkaline conditions (Corbett and Leach, 1997), and titanite is commonly emplaced at low XCO2 values (Schuiling and Vink, 1967).
It is important to mention that in equilibrium with acidic fluids a diaspore + pyrophyllite + alunite + illite + dickite whereas in equilibrium with highly alkalic fluids a K-feldspar (orthoclase), + biotite + quartz + magnetite + anhydrite + sulphides mineral assemblages form at similar temperatures to those deduced from the Hoffell/Miðfell rock cores. The absence of most of these minerals confirms that fluid pH during hydrothermal alteration in the area should have been close to neutral.
5.4 Implications of the new data The new data available is based on petrographic observation and mineral chemistry analyses. Thus, it is important to point out the scarce detailed and published studies of mineral chemistry from Icelandic geothermal systems.
In this study, most of the mineral phases analyzed have been found previously by Friðleifsson (1983 a, b and 1984). According to Friðleifsson (1983 a, b and 1984), Hoffell/Miðfell area is in the actinolite alteration zone. Mineral assemblages in veins and vesicles of ASK86 and ASK57 samples are quite similar to those described by Friðleifsson (1983a). The veins systems of ASK86 and ASK57 seem to be related to the lower actinolite zone (Table 13). The main difference is the absence of some vein systems in the samples analyzed here (e.g., the earliest event veins (vein systems 1-a, 1-b and 2-a) reported by Friðleifsson 1983a), and the absence of some mineral phases (garnet, prehnite, heulandite, scolecite). The earliest infilling material in veins of ASK87-ASK57 samples is fine-grained chlorite, which could be related to the vein systems 2 reported by Friðleifsson (1983a) as these systems also occur in polygonal fractures. In addition, the veins systems 2, 3, 4 and 5 of this study fit well with the vein systems 2, 3 and 4 reported by Friðleifsson (1983a). Similar conclusions can be made regarding the vesicle infilling minerals. Infilling episodes 1-a, 1-b and 2-abc reported by Friðleifsson (1983a and b) are not present in the samples analyzed. Friðleifsson (1983a) mentioned that the layered mud and limonite show regional distribution, but they are not present in all vesicles (only one sample shows banded chalcedony, Figure B 3). This suggest that locally, either the ground water percolation was absent before the hydrothermal alteration, or there was a replacement/alteration event of clay-minerals by fine-grained chlorite during the early stages of the hydrothermal alteration.
The EPMA analysis reveals that this fined-grained chlorite has similar composition to coarse-grained chlorite, and sometimes interbedded with fine-grained epidote. At higher temperatures, the actinolite zone has been defined by the index minerals chlorite, epidote, actinolite and garnet, but garnet has not been found in the matrix, vesicles, or veins in this study. On the other hand, secondary pyroxene (diopside) was found mainly in the matrix, but rarely also in vesicles; actinolite shows a composition range similar to previous studies, and magnetite-ilmenite are hydrothermal altered based on textural and chemical evidence. In addition, two new low-temperature zeolites have been identified in the system in this study (yugawaralite and stellerite). The presence of these new mineral phases implies that several generations of fluids with different temperatures and compositions took part in the

98
growth of secondary mineral phases in the defined actinolite alteration zone at different depths.
Table 13. Comparison of vein systems and vesicles infilling episodes defined by Friðleifsson (1983 a, b) with this study. ab: albite, act: actinolite, cal: calcite, cha: chabazite, chc: chalcedony, chl: chlorite, cpx: clinopyroxene, ep: epidote, fds:feldpar, gt: garnet, heu: heulandite, ill: ilmenite, K-fds: K-feldspar, lau: laumontite, mo: mordenite, py: pyrite, px: pyroxene, qz: quartz, sph: sphene, pr: phrenite, sco: scolecite, stb: stilbite, str: stellerite, ttn: titanite, tho: thomsonite, wa: wairakite, yu: yugawaralite.
The Geitafell hydrothermal system was characterized by a progressive evolution of a cold groundwater system into an active high-temperature system that compare in all respect to active high-temperature systems like in Krafla, NE-Iceland, reaching temperatures within the limits of the hydrostatic boiling point curve down to a depth of some 2.5 km maximum – i.e., up to ~350°C and possibly a little higher. Locally, in contact aureoles of gabbro intrusion, the temperature reached 400-600°C which developed a hedenbergite-garnet-actinolite paragenesis. In these conditions short lived supercritical fluid condition seemed to have prevailed for a while, continued into superheated condition before adjusting to the boiling point curve upon colling of the gabbro intrusions (Friðleifsson, 1983a). As the volcano drifted out of the active rift zone the volcanic active ceased and the system finally cooled and was superimposed by low-temperature regional zeolitization.
Based on the alteration paragenesis, the peak temperature in Hoffell/Miðfell area is up to ~350°C. The field is about 4 km south of the major gabbro intrusion described by Friðleifsson (1983a, b, 1984), and stratigraphically about ½ a km below it at about 2.5 depth within the active Miocene central volcano. Some localized heat source within the Hoffell/Miðfell area (seen in deeper drillholes, Sigurðsson et al., 2020) may have added to the heat budget during the peak alteration studied in the drill cores of ASK57 and ASK86.

99
6 Conclusions Detailed investigation has shown that the mineral assemblages observed in the Hoffell/Miðfell rocks in the ASK-86 and ASK-57 wells resulted in at least three stages of alteration.
Stage I is characterized by the crystallization of fine-grained chlorite with fine-grained epidote in small vesicles at ~230°C. These mineral phases fill completely small vesicles and the bottoms of geopetal structures in larger vesicles. An estimation based on petrographic observations indicates that fine-grained chlorite could be a product of recrystallization of earlier deposited smectite and other low-temperature deposits in amygdales and earliest veins upon rise in temperature as the high temperature hydrothermal system developed.
Stage II is characterized by the peak alteration assemblage chlorite + epidote + wairakite + calcite + quartz + albite ± K-feldspar ± actinolite ± clinopyroxene ± magnetite ± ilmenite ± titanite in vesicles and veins, and by albitization of plagioclase, and apparent formation of hydrothermal magnetite, replacement of ilmenite by titanite and formation of secondary clinopyroxene in the matrix. The highest alteration temperature of this assemblage in the system is around 350°C. No significant differences were found between the chemistry of the fine-grained and coarse-grained chlorite and epidote.
Stage III is characterized by the precipitation of low-temperature zeolites due to drop in the regional thermal gradient as the volcano cooled down while drifting out of the active Miocene rift zone towards its present location ~50 km east of it. In total, six different zeolites were found in the Hoffell/Miðfell rocks: wairakite, laumontite, yugawaralite, stellerite, stilbite, and chabazite. The first zeolite marks the transition from a high temperature above 200°C, down towards 100°C and further decrease to below 50°C.
The alteration assemblages at each stage also indicate composition fluctuations in the alteration fluids. Minerals in the stage 1 form in the pH 5-6 range (slightly acid), while the minerals in the stages 2 and 3 form in the pH 7-8 range (neutral to alkaline). In addition, the CO2 contents in the alteration fluids fluctuated from high CO2 (high temperature calc-silicates) to low CO2 (low-temperature zeolites) contents.


101
7 Recommendations Further studies should focus on the following points:
X-ray diffraction (XRD) analyses to define the presence of high and low-temperature clay at different alteration stages, verify the possible transition from smectite to fine-grained chlorite, and define the crystallographic parameters of zeolites found in this study.
Fluid inclusion analyses to estimate deep temperatures and possible boiling-effervescence processes during the precipitation of mineral phases.
Cathodoluminescence analyses to identify growth conditions, fracturing, dissolution, overgrowth, deformation, diffusion or recrystallization in quartz and calcite phases to model depositional sequences in the system.
Analyses of kinematic structures, permeability, and hydraulic conductivity to define the fluid-pathways history and the possible sealing processes.
Analysis of the possible influence of the coarse-grained granophyric intrusion found deeper in the exploration wells in the area on the observed alteration processes.


103
References Anjos, S. M. C., De Ros, L.F., and Silva, C. M. A., 2003: Chlorite authigenesis and porosity preservation in the Upper Cretaceous marine sandstones of the Santos Basin, offshore eastern Brazil. In: R. H. Worden & S. Morad (Eds.), Clay mineral cements in sandstones (pp. 219–316). Oxford: Inter- national Association of Sedimentology Special Publication UK: 34, DOI: 10.1002/9781444304336.ch13.
Allen, R.M., Nolet, G., Morgan, W.J., Vogfjord, K., Bergsson, B.H., Erlendsson, P.G., Foulger, R., Jakobsdóttir, S., Julian, B.R., Pritchard, M., Ragnarsson, S., and Stefánsson, R., 1999: The thin hot plume beneath Iceland. Geophys. J. Int. 137:51–63, https://doi.org/10.1046/j.1365-246x.1999.00753.x
Arnórsson, S., Axelsson, G., and Sæmundsson., 2008: Geothermal systems in Iceland, Jökull No. 58, 269-302.
Bargar, K., Keith, T., and Beeson, M., 1993: Hydrothermal Alteration in the Mount Hood Area, Oregon, U.S. Geological Survey Bulletin 2054, 53 p.
Bjarnason, I. T., Wolfe, C. J., Solomon, S. C., and Gudmundson, G., 1996. Initial results from the ICEMELT experiment: Body-wave delay times and shear-wave splitting across Iceland, Geophys. Res. Lett., 23, 459 – 462.
Browne R.P.L 1978: Hydrothermal Alteration in active geothermal fields, Earth Planet Science, Vol 6, 229-250.
Buddington, A.F., and Lindsley, D.H., 1964: Iron-titanium oxide minerals and synthetic equivalents, Journal of Petrology, v. 5, p. 310-357.
Burchardt, S., Guðmundsson, Á., 2009: The infrastructure of Geitafell volcano, Southeast Iceland. Studies in Volcanology: The Legacy of George Walker: IAVCEI Sp. Pub. 2, pp. 349–370.
Campbell, L.S., Charnock, J., Dyer, A., Hillier, S., Chenery, S., Stoppa, F., Henderson C.M.B., Walcott, R., and Rumsey, M., 2016: Determination of zeolite-group mineral compositions by electron probe microanalysis, Mineralogical Magazine, Vol. 80(5), pp. 781–807.
Coombs, D.S., Alberti, A., Armbruster, T., Artioli, G., Colella, C., Galli, E., Grice, J., Liebau, F., Mandarino, J.A., Minato, H., Nickel, E.H., Passaglia, E., Peacor,D.R., Quartieri, S., Rinaldi, R., Ross, M., Sheppard, R.A, Tillmanns, E., and Vezzalini, G., 1997: Recommended nomenclature for zeolite minerals: report of the subcommittee on zeolites of the International Mineralogical Association, Commission on new Minerals and Mineral names, The Canadian Mineralogist, Vol. 35, pp. 1571-1606.
Corbett, G., 2018: Epithermal gold-silver and porphyry copper-gold exploration, Short Course Manual, Chapter 2, at https://corbettgeology.com/

104
Corbett, G., and Leach T., 1997: Southwest pacific rim gold-copper systems: structure, alteration, and mineralization. Short Course Manual, Society of Economic Geologists, Special Publication 6, 318p.
Dare, S. A. S., Barnes, S., Beaudoin, G., Méric, J., Boutroy, E. and Potvin-Doucet, C., 2014: Trace elements in magnetite as petrogenetic indicators. Miner. Deposita 49, 785–796.
Deer, W.A., Howie, R.A., and Zussman, J., 2013: An Introduction to the Rock-Forming Minerals (3rd Edition). 498 p. The Mineralogical Society, London.
Einarsson, P., 1991: Earthquakes and present-day tectonism in Iceland. Tectonophysics 189, 261–279.
Foulger, G.R., Jahn, C.H., Seeber, G., Einarsson, P., Julian, B.R., and Heki, K., 1992: Post-rifting stress relaxation at the divergent plate boundary in Northeast Iceland. Nature 358, 488–490.
Franzson, H., 1998: Reservoir geology of the Nesjavellir high-temperature field in SW-Iceland. Proceedings of the 19th Annual PNOC-EDC Geothermal Conference, Manila, 13-20.
Franz, G., and Liebscher., 2004: Physical and Chemical Properties of the Epidote Minerals Gerhard, An Introduction, Reviews in Mineralogy & Geochemistry, Vol. 56, pp. 1-82.
Friðleifsson, G.Ó., 1983a: The Geology and Alteration history of the Geitafell Central Volcano, South-East Iceland, PhD-Thesis, Edinburgh University, 371 p.
Friðleifsson, G.Ó., 1983b: Mineralogical evolution of a hydrothermal system, Geothermal Resources Council, Transaction, Vol 7, 147-152.Friðleifsson, G.Ó., 1984: Mineralogical evolution of a hydrothermal system. II. Heat sources – fluid interactions, Geothermal Resources Council, Transaction, Vol 8, 119 -123.
Friðleifsson, G.Ó., 1984: Mineralogical evolution of a hydrothermal system. II. Heat sources – fluid interactions, Geothermal Resources Council, Transaction, Vol 8, 119 -123.
Fridriksson, T., Neuhoff, P., Arnórsson, S., and Bird, D., 2001: Geological constraints on the thermodynamic properties of the stilbite—stellerite solid solution in low-grade metabasalts, Geochimica et Cosmochimica Acta, Vol. 65, No. 21, pp. 3993– 4008.
Fowler, A.P.G., Zierenberg, R.A., Schiffman, P., Marks, N., and Friðleifsson, G.Ó., 2015: Evolution of fluid–rock interaction in the Reykjanes geothermal system, Iceland: Evidence from Iceland Deep Drilling Project core RN-17B, Journal of Volcanology and Geothermal Research, 302, 47–63.
Guðmundsson, Á. 1995. Infrastructure and mechanics of volcanic systems in Iceland. J. Volcanol. Geotherm. Res. 64,1–22.
Guðmundsson, Á., 2000: Dynamics of volcanic systems in Iceland: examples of tectonism and volcanism at juxtaposed hot spot and mid-ocean ridge systems. Annu. Rev. Earth Planet. Sci. 28, 107–140.

105
Gudmundsson, M. T., Larsen, G, Höskuldsson, A., and Gylfason, Á.G., 2008: Volcanic Hazards in Iceland, Jökull 58, 251–268.
Gudmundsson, M. T., 2018: Geothermal areas – the basics-The young igneous systems – heat source magma – the high temperature geothermal areas of Iceland, Lecture 3 presentation, Course: Geothermal Energy. University of Iceland.
Hawthorne, F.C., Oberti, R., Harlow, G.E., Maresch, W.V., Martin, R.F., Schumacher, J.C., Welch, M.D., 2012: IMA report, nomenclature of the amphibole supergroup. American Mineralogist 97, 2031–2048.
Helgadóttir, H.G., Franzson, H., Óskarsson, N., Grönvold, K., and Steinþórsson, S., 2015: Hydrothermal Alteration of Pyroxene in the Hellisheiði Geothermal Field, SW-Iceland, Proceedings World Geothermal Congress 2015, Melbourne, Australia, 11p.
Henley, R.W., Truesdall, A.H., and Barton, P.B. Jr., eds., 1984: Fluid mineral equilibria in hydrothermal systems: Reviews in Economic Geology, v. 1, 267 p.
Hitachi High-Technology Corporation, 2011. Hitachi Tabletop Microscope TM3000 Brochure at https://www.hitachi-hightech.com/
Hövelmann, J., Putnis, A., Geisler-Wierwille, T., Schmidt, B., and Golla-Schindler, U., 2010: The replacement of plagioclase feldspars by albite: Observations from hydrothermal experiments. Contributions to Mineralogy and Petrology 159, 43-59, DOI: 10.1007/s00410-009-0415-4.
Iijima, A., 1980: Geology of natural zeolites and zeolitic rocks, Pure and Appl. Chem., Plenary paper and Geology and Mineralogy, Vol. 52, 215-213.
Kleine, B.I., Stefánsson, A., Halldórsson S.A., Whitehouse M.J., and Jónasson, K., 2018: Silicon and oxygen isotopes unravel quartz formation processes in the Icelandic crust, Geochem. Persp. Let. 7, 5-11, doi: 10.7185/geochemlet.1811.
Kowallis, B.J., Christiansen, E.H., and Griffen, D.T., 1997: Compositional variations in titanite, Geological Society of America Abstracts with Programs, V. 29, p. A-402.
Kowallis, J., Christiansen, E.H., Dorais, M.J., Winkel, T., Henze, P., Franzen, L., and Mosher, H. – Young, B., 2018: Compositional Variation of Fe, Al, and F in Titanite, GSA Annual Meeting – Indianapolis, DOI: 10.1130/abs/2018AM-320564.
Kristinsson, S.G., Ingimarsson, H., Weisenberger, T.B., and Erlendsson, Ö., 2018: Hoffell in Nesjar - Hole HF-5 Drilling history, geology, performance and measurements, ÍSOR report for RARIK, 65 pp.
Kristinsson, S.G., Ingimarsson, H., Þorgilsson, G., Árnadóttir, S., Ólafsson, M., Þórðarson, P.E., Halldórsson, Þ. 2020: From exploration to utilization, Hoffell low temperature geothermal field, southeastern Iceland. Proceedings World Geothermal Congress 2020, Reykjavik, (WGC conference postponed to 2021), 13 p,
Kristmannsdóttir, H., 1982: Alteration in the IRDP drill hole compared with other drill holes in Iceland., Journal of Geophysical Research, 87, B8, 6525-6531.

106
Kristmannsdóttir, H., 1979. Alteration of basaltic rocks by hydrothermal activity at 100-300°C. International Clay conference 1978. Ed. By Mortland and Farmer. Elsevier Sci. Publ. Company, Amsterdam 1979, pp 359-367.
Kristmannsdóttir, H., and Tómasson, J., 1978: Zeolite zones in geothermal areas in Iceland. In Bish, D.L. and Ming, D.W. (eds), Natural Zeolites: Occurrence, Properties, Use, Elmsford, New York, Pergamon Press, p. 277-284.
Larsson, D., Gronvold, K., Oskarsson, N., and Gunnlaugsson, E., 2002: Hydrothermal alteration of plagioclase and growth of secondary feldspar in the Hengill Volcanic Centre, SW Iceland., Journal of Volcanology and Geothermal Research 114, 275-290.
Leake, B.E., Woolley, A.R., Arps C.E., Birch, W.D., Gilbert, M.C., Grice, J.D., Hawthorne, F.C., Kato, A., Kisch, H.J., Krivovichev, V.G., Linthou, T.K., Laird, J., Mandarino, J.A., Maresch, W,V., Nickel, E.H., Rock, N.M.S., Schumacher, J.C., Smith, D.C., Stephenson, N.C.N., Ungaretti, L., Whittaker, E.J.W., and Youzhi, G., 1997: Nomenclature of Amphiboles: Report of the Subcommittee of the International Mineralogical Association, Commission on New Minerals and Mineral Names. American Mineralogist, 82, 1019-1037.
Li, Z., Chanéac, C., Berger, G., Delaunay, S., Graff, A., and Lefèvre, G., 2019: Mechanism and kinetics of magnetite oxidation under hydrothermal conditions., Royal Society of Chemistry, 9, 33633, DOI: 10.1039/c9ra03234g.
Libbey, R.B., and Williams-Jones, A.E., 2016: Compositions of hydrothermal silicates and carbonates as indicators of physicochemical conditions in the Reykjanes geothermal system, Iceland, Geothermics 64, 15–27.
Liotta, D., Brogi, A., Ruggieri, G., Rimondi, V., Zucchi, M., Helgasdóttir, H.M., Montegrossi, Friðleifsson, G.Ó., 2018: Fracture analysis, hydrothermal mineralization and fluid pathways in the Neogene Geitafell central volcano: insights for the Krafla active geothermal system, Iceland, Journal of Volcanology and Geothermal Research, VOLGEO-06502; 21 pp
Locock, A., 2014: An Excel spreadsheet to classify chemical analyses of amphiboles following the IMA 2012 recommendations, Computers & Geosciences 62 (2014) 1–11.
Ma, P.J., Lina, C. Y., Zhanga, S. Q., Donga, C. M., and Xua, Y. F., 2017: Formation of chlorite rims and the impact of pore-lining chlorite on reservoir quality: a case study from Shiqianfeng sandstones in upper Permian of Dongpu Depression, Bohai Bay Basin, eastern China, Australian Journal of Earth Sciences, Vol. 64, No. 6, 825–839.
Manning C.E., and Bird, D.K., 1986: Hydrothermal clinopyroxenes of the Skaergaard intrusion, Contrib Mineral Petrol 92, 437-447.
Marantos, I., Christidis, G.E., and Ulmanu, M., 2011: Zeolite formation and deposits, In: Inglezakis, V, J., and Zorpas., (Eds.), Handbook of natural zeolites, Chapter 2.1, pp 19-36.
Marks, N., Schiffman, P., Zierenberg, R.A., Franzson, H., and Friðleifsson, G.Ó., 2010: Hydrothermal alteration in the Reykjanes geothermal system: Insights from Iceland deep drilling program well RN-17, Journal of Volcanology and Geothermal Research 189, 172–190.

107
Marosvölgyi, K., 2009; Retrograde Alteration of Basaltic Rocks in the Þeistareykir High-Temperature Geothermal Field, North-Iceland., University of Iceland, School of Renewable Energy Science, Master’s thesis, Akureyri, 45 pp.
Nadoll, P., 2011: Geochemistry of magnetite from hydrothermal ore deposits and host rocks - case studies from the Proterozoic Belt Supergroup, Cu-Mo-porphyry + skarn and Climax-Mo deposits in the western United States. Ph. D. thesis, University of Auckland.
Nadoll, P., Angerer, T., Mauk, J. L., French, D. and Walshe, J., 2014: The chemistry of hydrothermal magnetite: a review. Ore Geol. Rev. 61, 1–32.
Neuhoff, P.S., Fridriksson, T., and Bird, D.K., 2000: Zeolite parageneses in the North Atlantic Igneous Provinces: implications for geotectonics and groundwater quality of basaltic crust. Int Geol Rev 42:15–44
Pálmason, G., Arnórsson, S., Friðleifsson, I.B., Kristmannsdóttir, H., Saemundsson, K., Stefánsson, V., Steingrímsson, B., Tómasson, J., and Kristjánsson, L., 1979. The Iceland crust: Evidence from drillhole data on structure and processes. In: Deep Drilling Result in the Atlantic Ocean. Ed M. Talwani, C.G. Harrison and D.E. Hayes. Mauric Ewing Series 2m, p. 43-65.
Pandit, D., 2018: Crystallization evolution of accessory minerals in palaeoproterozoic granites of Bastar Craton, India, Current Science, Vol. 114, no, DOI: 10.18520/cs/v114/i11/2329-2342.
Passaglia, E., 1970: The crystal chemistry of chabazites. Am. Mineral. 55, 1278-1301.
Pope, E.C., Bird, D.K., Arnórsson, S., 2014: Stable isotopes of hydrothermal minerals as tracers for geothermal fluids in Iceland. Geothermics 49, 99–110.
Reed S.J.B., 2005: Appendix. In Electron Microprobe Analysis and Scanning Electron Microscopy in Geology (pp. 162-178). Cambridge: Cambridge University Press. doi:10.1017/CBO9780511610561.011.
Réne, M., 2008: Titanite-ilmenite-magnetite phase relations in amphibolites of the chýnov area (bohemian massif, czech republic), Acta Geodyn. Geomater., Vol. 5, No. 3 (151), 239–246.
Reyes, A. G., 1990: Petrology of Philippine geothermal system and the application of alteration mineralogy to their assessment. Journal of Volcanology and Geothermal Research 43, 279-304.
Reyes, A. G., 1998: Petrology and mineral alteration in hydrothermal systems: From diagenesis to volcanic catastrophes, UNU-GTP, Iceland, Report 18, 77pp.
Roedder, E., 1984: Fluid inclusions. Rev Mineral 12, Mineralogical Society of America, 644 pp.
Saunders, A.D., Fitton, J.G., Kerr A.C., Norry, M.J. and Kent, R.W. 1997: The North Atlantic igneous province. In: Mahoney J.J. & Coffin M.F. (eds) Large Igneous Provinces.

108
American Geophysical Union, Geophysical Monograph, 100, 45–93. https://doi.org/10.1029/GM100p0045
Saemundsson, K., 1979: Outline of the geology of Iceland. Jökull 29, 7–28.
Schiffmand, P., Zierenberg, R.A., Mortensen, A.K., Friðleifsson, G.Ó, and Elders, W.A., 2014: High temperature metamorphism in the conductive boundary layer adjacent to a rhyolite intrusion in the Krafla geothermal system, Iceland, Geothermics 49, 42–48.
Schuiling, R.D., and Vink, B.W., 1967: Stability relations of some titanium-minerals (sphene, perovskite, rutile, anatase)., Geochimica et Cosmochimica Acta, Vol 31, 2399-2411
Selbekk, R.S., and Weisenberger, T., 2005: Stellerite from the Hvalfjördur area, Iceland. Jökull 55, 49-52.
Stapi Geological Services, 1994: Geothermal exploration in East-Skaftafellssýsla in the years 1993- 1994. County committee of East-Skaftafellssýsla, report, 200 pp.
Stefánsson, R., Gudmundsson, G., and Halldórsson P., 2003: The South Iceland earthquakes 2000 – a challenge for earthquake prediction research. Report VI-R03017, 21 pp, Icelandic Meteorological Office, Reykjavík, Iceland.
Thordarson. T., and Larsen G., 2007: Volcanism in Iceland in historical time: Volcano types, eruption styles and eruptive history, Journal of Geodynamics 43, 118–152.
Thordarson, T., and Höskuldsson, A., 2008: Postglacial volcanism in Iceland, JÖKULL No. 58, 197-228.
Thordarson T., and Geirsdóttir Á., 2019: Volcanic succession, and climate evolution in Iceland-Course: Field Guide Holaskogar, Hreppar
Thorlacius, J.M., 1991: Petrological Studies of the Geitafell Central Volcano, S.E. Iceland. MSc thesis, University of Edinburgh, United Kingdom.
Thompson, A. J. B. and Thompson, J. F. H., 1996: Atlas of Alteration: A field and petrographic guide to hydrothermal alteration minerals, Geological Association of Canada, 119p.
Tschernich, R.W., 1992: Zeolites of the World. Geoscience Press, Tucson. 563 pp.
Tulloch, A.J., 1982: Mineralogical observations on carbonate scaling in geothermal wells at Kawerau and Broadlands. Proc. N. Z. Geotherm. Workshop, 131–134.
Utada, M., 2001: Zeolites in hydrothermally altered rocks. In Bish, D.L. and Ming, D.W. (eds) Natural Zeolites: Occurrence, Properties, Applications, Reviews in Mineral. and Geochem., Miner. Soc. Am. 45, 305-322.
Vink, G. E. 1984: A hotspot model for Iceland and the Vøring plateau, J. Geophys. Res., 89, 9949 – 9959, doi:10.1029/JB089iB12p09949.

109
Williams, F., 2020: Petrography and Geochemistry of Hydrothermally Altered Rocks from Hoffell, Master’s thesis, Faculty of Earth Science, University of Iceland, (not yet published).
Weisenberger, T., and Selbekk R.S., 2009: Multi-stage zeolite facies mineralization in the Hvalfjörður area, Iceland., Int J Earth Sci (Geol Rundsch), Vol 98, 985-999, DOI: 10.1007/s00531-007-0296-6.
Wen, G., Li, J.W., Hofstra, A.H., Koenig, A.E., Lowers, H.A., and Adams, D., 2017: Hydrothermal reequilibration of igneous magnetite in altered granitic plutons and its implications for magnetite classification schemes: Insights from the Handan-Xingtai iron district, North China Craton Guang., Geochim. Cosmochim. Acta 213, 255–270.
White, R. S., Bown, J. W., and Smallwood, J. R., 1995: The temperature of the Iceland plume and origin of outward propagating V-shaped ridges, J. Geol. Soc. London, 152, 1039 – 1045.
Wolfe, C.J., Bjarnason, I.T., VanDecar, J.C., and Solomon S.C., 1997: Seismic structure of the Iceland plume. Nature 385, 245-247.
Zachariáš, J., 2008: Compositional trends in magmatic and hydrothermal silicates of the Petráčkova hora intrusive complex, Bohemian Massif – link between the magmatic processes and intrusion-related gold mineralization., Journal of Geosciences, 53, 105–117., DOI: 10.3190/jgeosci.021.
Zane, A., and Weiss., Z., 1998: A procedure for classifying rock-forming chlorites based on microprobe data., Rend. Fis. Acc. Lincei 9, 51–56, https://doi.org/10.1007/BF02904455.
Zhao, J., Brugger. J., and Pring, A., 2019: Mechanism and kinetics of hydrothermal replacement of magnetite by hematite, Geoscience Frontiers 10, 29-4.


111
Appendix A Table A 1. Borehole information of the ASK-57 and ASK-86 wells. (taken from: https://orkustofnun.is/orkustofnun/gagnasofn/borholur/)
Borehole name: ASK-57 Identification: 72967 Local Name: Miðfell Buyer: Stapi hf. - geological laboratory Owner: - RARIK Closing depth: 465.7 meters Feeding depth: 341 meters Hole width, maximum: 168.3 mm Hole width, minimum: 75.692 mm Start of drilling: 15/12/1993 Close of drilling: 14/06/2006 Name of drill: Einráður Drilling company: Ræktunarsamband Flóa- og Skeiða Purpose: Heat pit level Category: Temperatures Pit Inspire category: Geophysical Research Type of drilling: Vertical well Municipality: The municipality of Hornafjörður Municipality Number: 7708 Older district: Nesjahreppur The district Number: 7702 WGS84 N/W: 64°N23.634’/15°W20.560’ ISN93 X/Y Coordinates: 676332.6/ 437533.5
Borehole name: ASK-86 Identification: 72996 Local Name: Hoffell Buyer: Stapi hf. - geological laboratory Owner: - RARIK Closing depth: 505 meters Feeding depth: 364 meters Hole width, maximum: 219.075 mm Hole width, minimum: 75.692 mm Start of drilling: 13/12/2003 Close of drilling: 01/07/2006 Name of drill: Einráður Drilling company: Ræktunarsamband Flóa og Skeiða Purpose: Heat pit level Category: Temperatures Pit Inspire category: Geophysical Research Type of drilling: Vertical well Municipality: The municipality of Hornafjörður Municipality Number: 7708 Older district: Nesjahreppur The district Number: 7702 WGS84 N/W:64°N23.551’/15°W 20.588’ISN93 X/Y coordinates: 676319/437378

112
Figure A 1. Stratigraphic correlation between ASK56 and ASK86 wells and sample locations. Rock identification based on Williams, (2020), and correlation based on images provided courtesy of Dr. Guðmundur Ómar Friðleifsson. Lines between wells are lithology contact correlations (Ps:Paleosoils).

113
Appendix B Description of samples under stereomicroscope. (Thin sections were not made of these samples.
ASK-57-HI2 (depth: 371.47-371.54 m): Greenish rock. Highly altered basalt showing a greenish color, amygdaloidal texture with fine-grained groundmass and crosscut by veins. The matrix shows disseminated chlorite (Chl). Former vesicles ranging in size from 1mm to 2mm. Vesicles and veins are filled with chlorite (Chl), epidote (Ep) calcite (Cal) and quartz (Qz).
ASK-57-HI3 (depth: 372.20-372.27 m): Greenish to grey -amygdaloidal basalt showing a fine-grained matrix. Former vesicles are elongated and size of up to 7 mm in length. These are occupied by secondary (from the border to de center) chlorite (Chl), epidote (Ep), calcite (Cal) and zeolites (Zeo?).
ASK-57-HI4 (depth: 374.58 – 374.64m): Grey basalt with showing and aphanitic texture with some amygdales. Vesicles are elongated and ranging in size from 3mm to 2cm. Some vesicles are filled with chlorite and the others show chemical precipitation of silica forming banded structures (chalcedony). It also shows veins occupied by chlorite in the border, epidote and zeolites (Figure A1.2).
ASK-57-HI6 (depth: 400.43-400.49m) Dark-grey basalt showing few amygdales in an aphanitic groundmass. The vesicles show uniform size of up to 3 mm and filled with chlorite (Chl). The sample is also crosscut by quartz veins (Qz).

114
ASK-57-HI7 (depth: 414.27 -414.32m) Pale-white to light greenish rhyolite showing a glomeroporphyritic textures composed of plagioclase laths occurring as phenocrysts in a fine-grained matrix. Plagioclase (Plg) shows uniform size of up to 2 mm in length and partially replaced by epidote (Ep). Mafic minerals (magnetite/ilmenite – Mt-Ilm?) and chlorite (Chl) are disseminated. The section is cross cut by epidote veins.
ASK-57-HI8 (depth: 417.70-417.81m) Light-grey rhyolites showing a porphyritic texture composed of phenocryst of plagioclases (Plg) in a fine-grain matrix. The former vesicles size up to 1mm, and they are partially filled with epidote (Ep).
ASK-86-HI2 (depth: 372.20 – 372.25m) Light-green basaltic rock with amygdaloidal texture in a fine-grained matrix. The former vesicles ranging in size from 1mm to 5mm. These are occupied by white silica layer and inner chlorite (Chl) rim in the border and zeolites? (Zeo) in the center. It is also notice epidote (Ep) and light-teal green clay (smectite? -Smc)
ASK-86-HI3 (depth: 368.66 – 368.70m) Light-green rhyolite showing a porphyritic texture with whitish fine grain matrix. It is composed of phenocrysts of plagioclase (Plg) of up to 2mm in length. Plagioclase is altered to epidote (Ep), and mafic minerals are altered to chlorite (Chl). The sample is crosscut by quartz veins.
ASK-86-HI6 (457.60-457.67m) Grey to greenish basaltic rock showing an amygdaloidal texture with altered aphanitic groundmass. The elongated former vesicles ranging in size from 7mm to 5mm in length. These are filled with chlorite (Chl), epidote (Ep), smectite? (Smc), quartz (Qz) and zeolite (Zeo).

115
ASK-86-HI8 (469.32-469.41) Dark grey to green basaltic rock showing an aphanitic texture with few rounded vesicles. Mafic minerals are disseminated. The former vesicles ranging around 5mm in size. Some of the vesicles are occupied by chlorite (Chl), and the others by chlorite in the border and zeolites (Zeo?) in the center.
ASK-86-HI10 (479.34-479.41) Greenish volcanic rock (lava) showing and aphanitic groundmass and plenty of amygdales and veins. Mafic minerals are disseminated and restricted to the matrix. Former vesicles ranging in size from 3mm to 9mm. Secondary veins size of up to 1 mm of thickness. Vesicles and veins are filled with epidote (Ep), chlorite (Chl), quartz (Qz) and zeolites (Zeo?).


117
Appendix C Table C 1. Petrographic analysis under petrographic microscope using plane and cross polirazed ligth of the sample ASK57-01.
Sample: ASK57-01 Depth: 365.65–365.71 m Figures B1 Stereomicroscope description:
Altered volcanic rock showing an amygdaloidal texture with fine-grained groundmass. The elongate vesicles suggest a lava flow structure. The former vesicles ranging in size from 1mm to 4mm, and these are occupied by clay minerals; others are filled with clay at the border, epidote and calcite at the center.
1, 2
Microscopy description: Texture: Amigdaloidal (Highly vesicular) 1 Structures: Vesicular with some flow alignment of vesicles and perlitic structure 3
Texture elements Modal %
estimated Figures B1
Groundmass: Fine-Grained textures individual grains are very small with some flow alignment. 70% 3
Vesicles: Type Size Sphericity Roundness
Proportion filled
1 2.5 mm low subangular entirely 5% 1, 4, 5 2 7 mm elongated angular entirely 25% 1, 6
Fractures: Type Thickness Distribution Shape
Proportion filled
non-visible Total 100%
Primary minerals: Morphological properties Optical properties
Observations Mineral % Estimated
Figures B1 Grain size Grain shape Mineral habit Cleavage Relief
Color and pleochroism
Extinction behaviour
Interference Color
1 non-visible
Groundmass minerals:
Morphological properties Optical properties Observations Mineral
% Estimated
Figures B1 Grain size Grain shape Mineral habit Cleavage Relief
Color and pleochroism
Extinction behaviour
Interference Color
1 200 µm subhedral prismatic indistinct low colorless indistinct anomalous Altered to sericite? Plagioclase 30
3 2 < 1µm anhedral massive indistinct low green isotropic
Massive patch of matrix altered
to clay
Microcrysts altered
60
3 ≤ 50 µm anhedral granular indistinct high isotropic
Uniformly indistinguishable crystals forming large masses
Chalcopyrite and
Magnetite 10
Secondary minerals in vesicles
Morphological properties Optical properties Mineral Fluid
inclusions Figures B1
Grain size Grain shape Mineral habit Cleavage Relief Color and pleochroism
Extinction behaviour
Interference Color
Observations
Type 1 - 1 ≤ 1 mm euhedral orthorhombic
- radial perfect (100) high
pale green to yellow - weak to
moderate
40° 2nd Crystalized in
the center of the vesicles
Epidote Primary
and Secondary
7, 13
Type 1 - 2 100 µm subhedral laminar - fibrous orthogonal
medium to high green 1-3° 1st
Crystalized in the border of the
vesicles Chlorite Primary 9, 12
Type 1 - 3 < 50 µm anhedral polygonal granular
aggregate indistinct high
colorless - no pleochroism
indistinct anomalous Crystalized in
the center of the vesicles
Calcite 10
Type 1 - 4 200 µm subhedral prismatic orthogonal
(110) high
colorless - brown
10° 2nd - 3th Crystalized in
the center of the vesicles
Feldspar
Type 2 - 1 < 50 µm euhedral prismatic -
basal 100 indistinct pale yellow 40° 2nd
Microcrysts of epidote in the
center and clay in the border
Microcrysts of epidote
8
Type 2 - 2 < 1 µm indistinct massive indistinct low dark-green indistinct indistinct Fills completely
and partially vesicles
Microcrysts of chlorite
5
Secondary mineral in fractures
Morphological properties Optical properties Mineral
Fluid inclusions
Figures B1 Grain size Grain shape Mineral habit Cleavage Relief Color and
pleochroism Extinction behaviour
Interference Color
Observations
non- visible fractures
Crystallization sequence of secondary minerals: Vesicles 1: Chlorite-Epidote-Feldspar-Carbonates; Vesicles 2: Microcrysts of chlorite - Epidote 11, 4 Observations: Highly altered rock Name of the rock: Altered amygdaloidal trachy-andesite

118
Figure C 1. Photomicrographs from ASK57-01; 2 in stereomicroscope; 1, 3, 4, 5, 7, 9, 10, 11, 12 and 13 in plane-polarized light; 2, 6 and 8 in cross-polarized light.

119
Table C 2. Petrographic analysis under petrographic microscope using plane and cross polirazed ligth of the sample ASK57-05.
Sample: ASK57-05 Depth: 376.18 – 376.24 m Figures B2 Stereomicroscope description:
Grey volcanic rock showing an aphanitic texture with few vesicles. There is no a clear structure in the sample. The vesicles are about 8 mm in size, and these are occupied by epidote, chlorite and calcite. Some of the alteration minerals are deposited in band structures.
1, 2
Microscopy description: Texture: Concentric crystallization in vesicles in a microcrystalline groundmass 3 Structures: Massive 3
Texture Elements Modal %
estimated Figures B2
Groundmass: Fine-grained textures, individual grains are very small with some flow alignment. 70% 6
Vesicles: Type Size Sphericity Roundness
Proportion filled
1 8 mm medium rounded entirely 30% 4, 5
Fractures: Type Distribution Size Shape
Proportion filled
non-visible Total 100%
Primary minerals:
Morphological properties Optical properties Observations Mineral
% Estimated
Figures B2 Grain size Grain shape Mineral habit Cleavage Relief
Color and pleochroism
Extinction behaviour
Interference Color
non-visible
Groundmass minerals:
Morphological properties Optical properties Observations Mineral
% Estimated
Figures B2 Grain size Grain shape Mineral habit Cleavage Relief
Color and pleochroism
Extinction behaviour
Interference Color
1 200 µm subhedral prismatic indistinct low colorless indistinct anomalous Altered to sericite? Plagioclase 50
6
2 < 100 µm anhedral laminar indistinct medium dark green indistinct 1st Interstitial in matrix
Chlorite 25
3 < 100 µm anhedral massive-spherulitic
indistinct high yellow greenish
indistinct 2nd Interstitial in matrix
Epidote 15
4 ≤ 50 µm subhedral granular indistinct high isotropic Semi-cubic crystals in
large masses Ilmenite 10
Secondary minerals in vesicles
Morphological properties Optical properties Observations Mineral
Fluid inclusions
Figures B2 Grain size Grain shape Mineral habit Cleavage Relief
Color and pleochroism
Extinction behaviour
Interference Color
Type 1 - 1 500 µm euhedral laminar - fibrous
orthogonal medium to high
green 1-3° 1st Post- epidote
- crystallization
Chlorite primary 8, 9
Type 1 - 2 100 - 200
µm euhedral prismatic perfect
(100) high
pale green to yellow - weak to
moderated
40° 2nd
Microcrysts of epidote in the border of the
vesicles
Epidote 10 ,11
Type 1 - 3 ≤ 3 mm subhedral prismatic orthogonal
(110) high
colorless - brown
10° 2nd - 3th
Crystalized in the center of the vesicle
after chlorite
Feldspar primary 13
Type 1 - 4 ≤ 500 µm subhedral prismatic
hexagonal crystals
seldom distinct
moderate colorless parallel 1st Crystalized
after chlorite Quartz primary 12, 14
Type 1 - 5 ≤ 3 mm anhedral polygonal granular
aggregate indistinct high
colorless - no pleochroism
indistinct anomalous
In the center of the vesicle, shows typical
twinning
Calcite secondary 15
Type 2 - 1 100 µm euhedral prismatic - basal
perfect (100)
indistinct pale yellow 40° 2nd In the border of the vesicle
Epidote 10
Type 2 - 2 500 µm euhedral laminar - fibrous
orthogonal medium to
high green 1-3° 1st
Fills the 80% of the vesicle
Chlorite primary 5
Secondary mineral in fractures
Morphological properties Optical properties Mineral
Fluid inclusions
Figures B2 Grain size Grain shape Mineral habit Cleavage Relief
Color and pleochroism
Extinction behaviour
Interference Color
Observations
non- visible fractures
Crystallization sequence of secondary minerals: Vesicles 1: Epidota - Chlorita Quartz - Calcite - Feldspar; Vesicles 2: Epidote - Chlorite 8, 1, 5 Observations: Greenish color indicating a propylitic alteration Name of the rock: Microcrystalline basaltic andesite

120
Figure C 2. Photomicrographs from ASK57-05; 1 and 2 in stereomicroscope; 6, 7, 8, 9, 10, 12, 13, 14 and 15 in plane-polarized light; 3, 4, 5 and 11 in cross-polarized light

121
Table C 3. Petrographic analysis under petrographic microscope using plane and cross polirazed ligth of the sample ASK57-09.
Sample: ASK57-09
Depth: 424.36 – 424.42 m Figures B3
Stereomicroscope description:
Grey volcanic rock showing and amygdaloidal texture with aphanitic groundmass. Plagioclase is barely identified and sulfides are disseminated. There are two groups of vesicles in the sample, one of them ranging from <1mm in size and are filled with chlorite? quartz and sulfides. The other group of vesicles ranging from 2 mm to 6 mm in size and are filled with quartz and trace epidote.
2, 3
Microscopy description: Texture: Concentrically zoned amygdales in a microlithic groundmass 1 Structures: Massive 4
Texture elements Modal %
estimated Figures B3
Groundmass: Composed of plagioclase, matrix altered, opaque and carbonate minerals. Green patches as a result of propylitic alteration.
70% 4
Vesicles: Type Size Sphericity Roundness
Proportion filled
1 500 µm low subangular completely 10%
1 2 ≤ 6 µm low very angular completely 6
Fractures: Type Thickness Distribution Shape
Proportion filled
20%
1 100 µm fracture zone lineal completely < 1% 1, 5 Total 100%
Primary minerals:
Morphological properties Optical properties Observations Mineral % Estimated
Figures B3 Grain
size Grain shape
Mineral habit Cleavage Relief Color and pleochroism
Extinction behaviour
Interference Color
non-visible
Groundmass minerals:
Morphological properties Optical properties Mineral % Estimated
Figures B3 Grain
size Grain shape
Mineral habit Cleavage Relief Color and
pleochroism Extinction behaviour
Interference Color
Observations
1 100 µm subhedral prismatic indistinct low colorless oblique 1st - 2th due to alteration
Indistinct the mineral borders
Plagioclase
40%
4 2 50 µm anhedral Aggregate indistinct low greenish indistintc
1st due to restitution
Matrix replaced by chlorite
Chlorite 30%
3 < 50 µm anhedral prismatic - cubic indistinct moderate isotropic Disseminated in the matrix
Magnetite and
Ilmenite 30%
Secondary minerals in vesicles
Morphological properties Optical properties Observations Mineral
Fluid inclusions
Figures B3 Grain
size Grain shape
Mineral habit Cleavage Relief Color and
pleochroism Extinction behaviour
Interference Color
Type 1 - 1 100 µm subhedral Tabular scaly aggregates
perfect 001 moderate to high
pale green inclined 1st (blue Berlin)
Fills completely and partially the vesicles, (from
the border of the vesicles)
Chlorite primary 8, 13
Type 1 - 2 200 µm anhedral prismatic orthogonal moderate colorless -
brown inclined 2nd - 3th
Crystalized post chlorite with
splintery surface Interstitial
between quartz
Actinolite primary 9
Type 1 - 3 50 µm subhedral prismatic hexagonal
crystals indistinct low colorless inclined 1st Crystalized in the
middle of the vesicle
Quartz primary 10, 14
Type (1) - (2) - 4 < 1 µm anhedral dendritic/drusy/pris
matic indistinct moderate
colorless to brownish
inclined 1st to 3th Crystalized in the
vesicles type 1 and 2
Zeolite 11
Type 2 - 2 ≤ 500 µm
subhedral prismatic perfect
cleavage in one direction
high yellowish parallel 3th Isolated crystals in the middle of
the vesicles Epidote primary 12, 15
Secondary mineral in fractures
Morphological properties Optical properties Mineral
Fluid inclusions
Figures B3 Grain
size Grain shape
Mineral habit Cleavage Relief Color and
pleochroism Extinction behaviour
Interference Color
Observations
non-visible
Crystallization sequence of secondary minerals:
Vesicles 1: Chlorite - Quartz - Actinolite - Zeolites; Vesicles 2: Zeolites - Epidote 8, 5
Observations: The dark greenish color of the rock is due to chloritization, fractures are secondary post-crystallization Name of the rock: Amygdaloidal trachy-basalt chloritized

122
Figure C 3. Photomicrographs from ASK57-09; 2 and 3 in stereomicroscope; 1, 4, 5, 6, 7, 8, 9, 10, 11, 12, 13, 14 and 15 in plane-polarized light.

123
Table C 4. Petrographic analysis under petrographic microscope using plane and cross polirazed ligth of the sample ASK57-10.
Sample: ASK57-10 Depth: 431.6 – 431.54 m Figures B4 Stereomicroscope description:
Altered volcanic rock showing an amygdaloidal texture with groundmass highly altered to clay minerals. The former vesicles ranging in size from <1mm to 8 mm, and these are occupied by clay (smectite?) and epidote.
1, 2
Microscopy description: Texture: Amygdaloidal - Microcrystalline with some phenocrysts of albitized plagioclase 3 Structures: Flow alignment in the groundmass highly vesicular 5
Texture elements Modal %
estimated Figures B4
Groundmass: Elongate crystals more or less uniform in size and flow alignment 65% 5
Vesicles: Type Size Sphericity Roundness
Proportion filled
1 ≤ 500um high rounded entirely 5% 8, 9
2 1 µm - 1 mm highly elongate very angular completely 15%
Fractures: Type Thickness Distribution Shape Proportion
filled 1 100 µm fracture zone Sinuous empty 5% 6, 7
Phenocrysts Plagioclase 10% 4 Total 100%
Primary minerals: Morphological properties Optical properties
Observations Mineral %
Estimated Figures B4 Grain size Grain shape Mineral habit Cleavage Relief
Color and pleochroism
Extinction behaviour
Interference Color
1 ≤ 1,5 mm subhedral prismatic indistinct low colorless 45° 1st
Phenocrysts of plagioclases
albitized altered to epidote
Plagioclase 10% 4
Groundmass minerals:
Morphological properties Optical properties Observations Mineral
% Estimated Figures B4
Grain size Grain shape Mineral habit Cleavage Relief Color and
pleochroism Extinction behaviour
Interference Color
1 100 µm subhedral prismatic indistinct low Colorless 45° 1st Plagioclase shows flow alignment
Plagioclases 15%
5 2 1 µm subhedral cubic - granular indistinct high isotropic
Disseminated opaque grains
Magnetite and Ilmenite
15%
3 < 1 µm indistinct massive - granular indistinct low green isotropic
Massive patch of microcrysts
Altered microcrysts 70%
Secondary minerals in vesicles
Morphological properties Optical properties Mineral
Fluid inclusions
Figures B4 Grain size Grain shape Mineral habit Cleavage Relief
Color and pleochroism
Extinction behaviour
Interference Color
Observations
Type 1 - 1 1 µm subhedral prismatic indistinct medium colorless indistinct 1st
Located on the inner border of vesicles, some
vesicles are only filled with
zeolites/chlorite?
Chlorite
8
Type 1 - 2 100 µm subhedral prismatic with
striations perfect (100) high yellow greenish indistinct 2nd
Located in the center of
vesicles and these are
albitization products
Epidote
9, 10
Type 1 - 3 < 1 um anhedral massive indistinct low dark - grey indistinct non - visible
Located on the outer border of vesicles and
alteration product of
plagioclase
Clay
11
Type 2 - 1 100 µm subhedral prismatic with
striations imperfect (100) high yellow greenish parallel 2nd
Located from the border to the
center of the vesicles
Epidote primary
and secondary
9, 13, 14
Type 2 - 2 500 µm subhedral prismatic perfect (001) high colorless to pale yellow
anomalous blue
interference Colors
1st - 2nd
Hydrothermal product of
plagioclase, located with epidote and
actinolite
Epidote 12
Type 2 - 3 300 µm subhedral prismatic -
fibrous orthogonal (110) moderate
colorless to greenish
10° 2nd - 3th Located in the
center of vesicles
Actinolite 10
Type 2 - 4 500 µm subhedral prismatic indistinct moderate colorless 0° 1st Located in the
center of vesicles
Zeolites primary
and secondary
12, 15
Secondary mineral in fractures
Morphological properties Optical properties Mineral
Fluid inclusions Figures B4
Grain size Grain shape Mineral habit Cleavage Relief Color and
pleochroism Extinction behaviour
Interference Color
Observations
Type 1 - 1 < 100 µm subhedral microcrystalline
massive aggregates
indistinct moderate colorless 0° 1st Quartz 6
Type 1 - 2 50 µm subhedral laminar - fibrous
indistinct medium to high green 1-3° 1st
Crystallized as radial
aggregates from the border to the
center of the fracture and in
the center, there is an opaque
mineral crystallization
Chlorite 7
Type 1 - 3 200 µm subhedral prismatic with
striations perfect 100 high yellow greenish parallel 2nd
Crystalized after of quartz
crystallization Epidote 6
Crystallization sequence of secondary minerals: Vesicles 1: Microcrysts of chlorite - Epidote - Zeolites; Vesicles 2: Epidote - Actinolite - Quartz: Fractures: Epidote - Zeolites 8 Observations: The fractures apparently are elongated vesicles, but there are fractures Name of the rock: Amygdaloidal basalt

124
Figure C 4. Photomicrographs from ASK57-10; 1 and 2 in stereomicroscope; 3, 5, 6, 7, 9, 10, 11, 12, 13, 14 and 15 in plane-polarized light; 4 and 8 in cross-polarized light.

125
Table C 5. Petrographic analysis under petrographic microscope using plane and cross polirazed ligth of the sample ASK57-11.
Sample: ASK57-11 Depth: 465.09 – 465.04m Figures 5B Stereomicroscope description:
Grey volcanic rock showing porphyritic and glomeroporphyritic textures composed of plagioclase laths occurring as phenocrysts in a fine-grained matrix. Epidote, chlorite and sulfides are secondary. Sulfides are disseminated in the rock, chlorite is emplaced at the border of the plagioclase, and plagioclases are partially replaced by epidote.
1, 2
Microscopy description: Texture: Relic porphyritic texture - Glomerocrysts of plagioclases. 3 Structures: Flow-aligned plagioclase phenocrystals in a microcrystalline matrix. 3, 4
Texture elements Modal %
estimated Figures B5
Groundmass: Microcrystalline plagioclase, showing relatively even grain size with plenty of mafic minerals. Some opaque minerals are oxidized, and plagioclase is altered to clay given a glassy appearance.
80% 5
Vesicles: Type Size Sphericity Roundness
Proportion filled
1 1 mm highly elongate very angular completely 5% 6
Fractures: Type Thickness Distribution Shape
Proportion filled
1 ≤ 50 µm fracture zone lineal completely < 1% 7, 8
Phenocrysts Plagioclase 10% 9
Chlorite 5% 10 Total 100%
Primary minerals: Morphological properties Optical properties
Observations Mineral %
Estimated Figures B5
Grain size Grain shape Mineral habit Cleavage Relief Color and pleochroism
Extinction behaviour
Interference Color
1 ≤1.5 mm subhedral prismatic indistinct low Colorless 45° 1st Chloritized and argillitized plagioclase partially and
entirely Plagioclase 10% 9
Secondary minerals:
Morphological properties Optical properties Observations Mineral
% Estimated
Figures B5 Grain size Grain shape Mineral habit Cleavage Relief
Color and pleochroism
Extinction behaviour
Interference Color
1 1 mm anhedral
pseudo-hexagonal
tabular crystals and fibrous
perfect high dark green indistinct 1st
Alteration product of plagioclase, mainly in the
border and completely substitution
Chlorite < 1% 10
2 500 µm anhedral prismatic perfect high pale yellow
to pale green oblique 3th
Alteration product of plagioclase, mainly in the
center of the mineral Epidote < 5% 11
Groundmass minerals:
Morphological properties Optical properties Observations Mineral
% Estimated
Figures B5 Grain size Grain shape Mineral habit Cleavage Relief
Color and pleochroism
Extinction behaviour
Interference Color
1 100 µm subhedral prismatic indistinct low colorless indistinct 1st Argillitic Altered Plagioclase 85%
5 2 50 µm anhedral cubic indistinct moderate isotropic
Disseminated in the whole sample
Ilmenite and
Magnetite 15%
Secondary minerals in vesicles
Morphological properties Optical properties Mineral
Fluid inclusions
Figures B5 Grain size Grain shape Mineral habit Cleavage Relief
Color and pleochroism
Extinction behaviour
Interference Color
Observations
1 50 µm subhedral prismatic crystals
indistinct low colorless inclined 1st Crystalized in the middle
of the vesicle Quartz primary 6, 14, 15
2 50 µm anhedral cubic indistinct moderate isotropic Opaque disseminated in
the matrix and crystalized in the border of vesicles
Magnetite 11
3 200 µm anhedral prismatic perfect high pale yellow
to pale green oblique 3th Filling partially the vesicles Epidote 12
4 1 mm anhedral tabular crystals
and fibrous perfect moderate dark green indistinct 1st Filling partially the vesicles Chlorite 10
Secondary mineral in fractures
Morphological properties Optical properties Mineral
Fluid inclusions
Figures B5 Grain size Grain shape Mineral habit Cleavage Relief Color and
pleochroism Extinction behaviour
Interference Color
Observations
1 50 µm anhedral tabular perfect
rhombohedral Low colorless
symmetrical to cleavage
low to 4th Filling completely the fracture
Calcite 13
2 10 µm anhedral tabular crystals and fibrous
perfect moderate Pale green indistinct 1st Filling partially the fracture Chlorite 7
Crystallization sequence of secondary minerals: Vesicles: Chlorite - Epidote - Quartz - Magnetite; Fractures: Chlorite - Calcite 7 Observations: The fractures apparently are elongated vesicles, but they are fractures. It seems this rock is a shallow intrusion Name of the rock: Propylitic altered andesite

126
Figure C 5. Photomicrographs from ASK57-11; 1 and 2 in stereomicroscope; 4, 7, 10, 11, 12, 14 and 15 in plane-polarized light; 3, 5, 6, 8, 9 and 13 in cross-polarized light.

127
Table C 6. Petrographic analysis under stereomicroscope and petrographic microscope using plane and cross polirazed ligth of the sample ASK86-01.
Sample: ASK86-01
Depth: 370.50 – 370.65m Figures B6
Stereomicroscope description:
Greenish volcanic rock with amygdaloidal texture in a fine-grained matrix. The former vesicles ranging in size from 1mm to 9mm, and these are occupied by clay minerals and by epidote, chlorite and calcite from the border to the center.
1, 2, 3
Microscopy description: Texture: Filled vesicles called amygdule’s in fine-grained groundmass composed by equigranular plagioclase and glass. 4 Structures: Massive or weakly aligned 5
Texture elements modal % estimate
Figures B6
Groundmass: Microcrystalline equigranular plagioclases 60% altered in a glass matrix, alteration minerals crystalized in cavities.
60% 4, 5
Vesicles: Type Size Sphericity Roundness
Proportion filled
1 2 mm moderate subrounded completely 10% 6, 7 2 9 mm moderate moderate 30% 6, 7
Fractures: Type Size Distribution Shape
Proportion filled
non-visible Total 100%
Primary minerals: Morphological properties Optical properties
Observations Mineral %
Estimated Figures
B6 Grain size
Grain shape
Mineral habit Cleavage Relief Color and
pleochroism Extinction behaviour
Interference Color
non- visible
Groundmass minerals:
Morphological properties Optical properties Observations Mineral
% Estimated
Figures B6 Grain
size Grain shape
Mineral habit Cleavage Relief Color and
pleochroism Extinction behaviour
Interference Color
1 400 µm euhedral prismatic indistinct low colorless to
brownish due to alteration
parallel 1st - 2nd to 3th due to alteration
Altered to epidote with interstitial microcrysts Plagioclase 90% 5
2 <100 µm
anhedral skeletal indistinct moderate isotropic Patches disseminated Magnetite 10% 5
Secondary mineral in vesicles
Morphological properties Optical properties Mineral
Fluid inclusions
Figures B6 Grain
size Grain shape
Mineral habit Cleavage Relief Color and
pleochroism Extinction behaviour
Interference Color
Observations
Type 2 - 1 ≤1.5 mm
anhedral
found in aggregates of
elongate prismatic crystals
perfect (100) high
pistachio-green to
yellowish-green
oblique to cleavage
2nd Fills the border of the vesicle, some of them
show zonation Epidote primary 8, 13
Type 1 - 1 100 mm subhedral tabular scaly aggregates
perfect (001) moderate to
high pale green inclined
1st (blue Berlin)
Crystallization of chlorite surrounded by clay
Chlorite
6, 9
Type 1 - 2 <1 µm indistinct low isotropic
Fills the vesicles and cross cutting by veins of calcite, some vesicles are filled just by clay
others with clay in the border and chlorite in the
center
Microcrysts of chlorite
7
Type 2 - 2 3 mm anhedral tabular perfect
rhombohedral low to
moderate colorless
symmetrical to cleavage
low to 4th
Perfect crystal in the middle of the vesicles,
and drusy calcite around the prismatic
Calcite primary 10, 14
Type 2 - 3 <100 µm
subhedral tabular scaly aggregates
perfect (001) moderate to
high pale green Inclined 1st
Crystallization of Chlorite cross-cutting the
actinolite? Chlorite
6, 9
Type 2 - 4 1 mm anhedral prismatic - fibrous
perfect (100) moderate pale brown - green
oblique 2nd - 3rd Splintery surface to define
Zeolites
11,15
Secondary mineral in fractures
Morphological properties Optical properties Mineral
Fluid inclusions
Figures B6 Grain
size Grain shape Mineral habit Cleavage Relief
Color and pleochroism
Extinction behaviour
Interference Color Observations
non- visible
Crystallization sequence of secondary minerals:
Vesicles 1: Microcryst of chlorite - Chlorite; Vesicles 2: microcrysts of chlorite - Epidote - Zeolites - Calcite 12
Observations: The rock experienced moderate to high propylitic alteration Name of the rock: Amygdaloidal altered trachy-andesite

128
Figure C 6. Photomicrographs from ASK86-01; 1, 2, 3 in stereomicroscope; 4, 5, 6, 7, 8, 10, 12,13, 14 and 15 in plane-polarized light; 9 and 11 in cross-polarized light.

129
Table C 7. Petrographic analysis under stereomicroscope and petrographic microscope using plane and cross polirazed ligth of the sample ASK86-04.
Sample: ASK86-04
Depth: 424.70 – 424.74 m Figures B7
Stereomicroscope description:
Aphanitic volcanic rock showing an altered fine-grained matrix. Alteration minerals as chlorite and quartz are disseminated and fill fractures. The rock shows breccia texture at the fractures where epidote is also emplaced.
1 ,2, 3
Microscopy description:
Texture: Amygdales in fine-grained mass composed of plagioclase, glass and sulfides. 4, 5, 6 Structures: Matrix is massive or weakly aligned 4
Texture elements Modal % Estimated
Figures B7
Groundmass: Microcrystalline texture, showing relatively even grain size with mafic minerals. It is composed of plagioclase, altered matrix, and cluster of disseminated opaque minerals.
55% 4, 5
Vesicles:
Type Size Sphericity Roundness Proportion
filled
1 500 µm high rounded entirely 25% 6
2 3 mm low - high elongate
angular -very angular
entirely 19% 7
Fractures: Type Thickness Distribution Shape
Proportion filled
1 50 µm fracture elongated
lineal entirely 1% 8, 9
Total 100%
Primary minerals: Morphological properties Optical properties
Observations Mineral %
Estimated Figures
B7 Grain size
Grain shape
Mineral habit Cleavage Relief Color and
pleochroism Extinction behaviour
Interference Color
non-visible
Groundmass minerals:
Morphological properties Optical properties Observations Mineral
% Estimated
Figures B7 Grain
size Grain shape
Mineral habit Cleavage Relief Color and
pleochroism Extinction behaviour
Interference Color
1 <100 µm subhedral prismatic indistinct low colorless Oblique
1st - 3th due to alteration
Shows alteration and flow-alignment Plagioclase 50% 5
2 <1 um indistinct low olive green isotropic Interstitial among
plagioclases Microcrysts
altered 40% 5
3 ≤100 µm
anhedral indistinct low isotropic Patches embedded in
an altered matrix Magnetite and Pyrite
10% 5
Secondary mineral in vesicles
Morphological properties Optical properties Mineral Fluid
inclusions Figures
B7 Grain size
Grain shape Mineral habit Cleavage Relief
Color and pleochroism
Extinction behaviour
Interference Color Observations
Type 1 - 1 <1 um isotropic Fills completely and partially the vesicles
Microcrysts of chlorite
6
Type 1 - 2 <100 µm
subhedral tabular scaly aggregates
perfect (001) high pale green inclined 1st (blue Berlin)
Concentric crystallization filling partially the vesicles
Chlorite 6
Type 2 - 1 200 µm euhedral
found in aggregates of
elongate prismatic
crystals and also fibrous
perfect (100) high yellowish oblique to cleavage
2nd- 3th
Fills partially the vesicles, concentrates
in the border and appears also in the
middle of the vesicles
Epidote 10
Type 2 - 2 100 µm subhedral tabular scaley
aggregates perfect (001) high pale green inclined
1st (blue Berlin)
Crystalized after microscrysts of epidote
Chlorite 11
Type 2 - 3 3 mm anhedral tabular perfect
rhombohedral low colorless symmetrical to cleavage anomalous Show calcite twinning Calcite 12
Type 2 - 4 100 µm anhedral granular
aggregates low brownish indistinct 1st Zeolites 13
Secondary mineral in fractures
Morphological properties Optical properties Mineral
Fluid inclusions
Figures B7 Grain
size Grain shape
Mineral habit Cleavage Relief Color and
pleochroism Extinction behaviour
Interference Color
Observations
Type 1 - 1 100 µm subhedral tabular scaly aggregates
perfect 001 high pale green inclined 1st (blue Berlin)
Concentric crystallization filling
partially or completely the fractures
Chlorite 8
Type 1 - 2 100 µm anhedral granular
aggregates none low colorless indistinct 1st Fills the center of the
fractures Albite 8
Crystallization sequence of secondary minerals: Vesicle 1: Clay - Chlorite: Vesicles 2: Epidote - Chlorite - Zeolites - Epidote - Calcite; Fracture: Chlorite - Albite 14, 15 Observations: Highly altered rock Name of the rock: Amygdaloidal basalt altered

130
Figure C 7. Photomicrographs from ASK86-04; 1, 2, 3 in stereomicroscope; 4, 7, 8, 9, 10, 12, 14 and 15 in plane-polarized light; 5, 6, 11, and 13 in cross-polarized light.

131
Table C 8. Petrographic analysis under stereomicroscope and petrographic microscope using plane and cross polirazed ligth of the sample ASK86-05.
Sample: ASK86-05 Depth: 437.00 – 437.04 m Figures B8 Stereomicroscope description:
Altered volcanic rock showing an amygdaloidal texture with aphanitic groundmass. The former vesicles ranging in size from 1 mm to 2 mm, and these are occupied by green and grey clay minerals (smectite? -chlorite?). 1, 2
Microscopy description: Texture: Concentrically zoned amygdales within an altered matrix composed by argilitized plagioclase and glass. It is also noticed oxidation patches 3, 4, 5 Structures: Amygdales aligned within the finely groundmass and spherical cracks known as perlitic cracks (contraction during cooling of viscous lava or magma) 7, 8, 9
Texture elements Modal %
estimated Figures B8
Groundmass: Composed of plagioclase, microcrysts and opaque minerals. The plagioclase shows an argillitic alteration and the matrix to a green clay (smectite?).
70% 6
Vesicles: Type Size Sphericity Roundness
Proportion filled
1 <2 mm moderate subangular entirely 10% 3, 5 2 8 mm highly elongate subrounded entirely 20% 4
Fractures: Type Thickness Distribution Shape Proportion
filled
1 <100 µm mosaic breccia spherical entirely < 1 7, 8 2 <100 µm fracture zone lineal entirely <1 8
Total 100%
Primary minerals:
Morphological properties Optical properties Observations Mineral
% Estimated
Figures B8 Grain size Grain shape Mineral habit Cleavage Relief
Color and pleochroism
Extinction behaviour
Interference Color
non-visible
Groundmass minerals:
Morphological properties Optical properties Observations Mineral
% Estimated
Figures Grain size Grain shape Mineral habit Cleavage Relief
Color and pleochroism
Extinction behaviour
Interference Color
1 <200 µm subhedral prismatic indistinct low colorless oblique 1st - 3th due to alteration
Altered to sericite showing a flow pattern
Plagioclase 20% 6
2 <1 µm indistinct low olive green isotropic Main component of the matrix
Microcrysts altered
75% 6
3 ≤50 µm anhedral skeletal to cubic indistinct
low isotropic Shows oxidation halos
Magnetite 5% 6
Secondary mineral in vesicles
Morphological properties Optical properties Mineral
Fluid inclusions
Figures B8 Grain size Grain shape Mineral habit Cleavage Relief
Color and pleochroism
Extinction behaviour
Interference Color
Observations
Type 1 and 2, 1 ≤100 µm subhedral
found in aggregates of elongate prismatic crystals
perfect (100) moderate to
high yellowish to pale green
oblique to cleavage
2nd
Fills complete the two types of vesicles; some crystals are in the center of the vesicle surrounded by chlorite. This also fill the vesicle with a granular brownish mineral (epidote)
Epidote 10, 11, 12
Type 1 and 2, 2 100 µm subhedral tabular scaly aggregates
perfect 001 high pale green inclined 1st (blue Berlin)
Crystallization of chlorite surrounded by clay
Chlorite 10, 13, 14
Type 1 and 2, 3 <1 µm indistinct
Fills completely and partially small vesicles and the border of many of them. The rest of the vesicle is filled with epidote, chlorite and aggregate minerals
Microcrysts of chlorite 13
Type 1 and 2, 4 1 µm anhedral Found in aggregates
indistinct moderate colorless to pale yellowish
indistinct 2nd to 3th Mass of cluster of microcrysts
Microcrysts of epidote
11
Secondary mineral in fractures
Morphological properties Optical properties Mineral
Fluid inclusions Figures B8
Grain size Grain shape Mineral habit Cleavage Relief Color and
pleochroism Extinction behaviour
Interference Color Observations
Type 1 - 1 <1 µm indistinct
Fills completely and partially small vesicles and the border of many of them.
Microcryst of chlorite
7, 8
Type 1 - 2 <100 µm subhedral tabular scaly aggregates
perfect (001) high pale green inclined 1st (blue Berlin)
Occupy some perlitic cracks
Chlorite 8
Type 2 - 1 3 mm anhedral tabular perfect
rhombohedral low to
moderate colorless
symmetrical to cleavage
low to 4th
Irregular crystals in a vein that cross-cut the perlitic cracks
Calcite
15
Crystallization sequence of secondary minerals: Microcrysts of chlorite - Chlorite - Epidote - Aggregate of microcrysts of epidote - Calcite 3 Observations: Highly altered rock Name of the rock: Amygdaloidal basaltic lava flow

132
Figure C 8. Photomicrographs from ASK86-05; 1 and 2 in stereomicroscope; 6, 7, 8, 9, 10, 11, 12 and 14 in plane-polarized light; 3, 4, 5, 13 and 15 in cross-polarized light.

133
Table C 9. Petrographic analysis under stereomicroscope and petrographic microscope using plane and cross polirazed ligth of the sample ASK86-07.
Sample: ASK86-07 Depth: 461.82-461.75 m Figures B9 Stereomicroscope description:
Light grey volcanic rock showing an amygdaloidal texture with altered aphanitic groundmass. The former vesicles ranging in size from 1mm to 5mm, and these are occupied by smectite? quartz and epidote. This last one located at the center of the vesicle suggesting the last alteration process.
1 ,2
Microscopy description: Texture: Full vesicles amygdales called fine-grained mass composed of plagioclase, glass and oxidized sulfides. 3 Structures: Amygdales aligned within the finely groundmass 1, 4
Texture elements Modal %
estimated Figures B9
Groundmass: Flow-aligned plagioclases embedded in a microlithic matrix and disseminated opaque minerals.
70% 4
Vesicles: Type Size Sphericity Roundness
Proportion filled
1 ≤ 4 mm moderate subrounded entirely 30% 5, 6
Fractures: Type Thickness Distribution Shape Proportion
filled
1 <100 um fracture sublineal hollow < 1 7 Total 100%
Primary minerals: Morphological properties Optical properties
Observations Mineral %
Estimated Figures B9
Grain size Grain shape Mineral habit Cleavage Relief Color and
pleochroism Extinction behaviour
Interference Color
non-visible
Secondary mineral in vesicles
Morphological properties Optical properties Mineral
% Estimated
Figures B9 Grain size Grain shape Mineral habit Cleavage Relief
Color and pleochroism
Extinction behaviour
Interference Color
Observations
1 100 µm subhedral prismatic indistinct low colorless oblique 1st - 3th due to alteration
Altered showing a flow pattern
Plagioclase 70%
4, 5 2 <1 µm indistinct low olive green isotropic
Altered to secondary mineral (smectite?)
Microcrysts altered
15%
3 <100 µm anhedral indistinct low isotropic
Patches embedded in an altered matrix
Magnetite and
Ilmenite 5%
Groundmass minerals:
Morphological properties Optical properties Observations Mineral
Fluid inclusions
Figures B9 Grain size Grain shape Mineral habit Cleavage Relief
Color and pleochroism
Extinction behaviour
Interference Color
1 <1 µm opaque
Fills completely and partially with quartz the vesicles
Microcrysts of chlorite
5, 8
2 <100 µm anhedral mosaic
texture in aggregates
indistinct low colorless indistinct 1st
Fills completely and partially cavities and vesicles
Zeolites primary 6, 8, 9, 11,
13
3 100 µm subhedral tabular scaly aggregates
perfect (001)
high pale green inclined 1st (blue Berlin)
Concentric crystallization filling partially the vesicles
Chlorite 9
4 <1 mm subhedral prismatic orthogonal moderate colorless to brownish
inclined - partial 2nd
Splintery surface Zeolites 10
5 1 mm euhedral
Found in aggregates of elongate prismatic crystals and also fibrous
perfect (100)
high yellowish to pale green
oblique 2nd
Fills partially the vesicles, concentrates mostly in the center of the vesicle
Epidote primary 12, 14, 15
Secondary mineral in fractures
Morphological properties Optical properties Mineral
Fluid inclusions
Figures B9 Grain size Grain shape Mineral habit Cleavage Relief
Color and pleochroism
Extinction behaviour
Interference Color
Observations
non-visible
Crystallization sequence of secondary minerals: Microcrysts of chlorite - Chlorite -Epidote - Zeolites 9, 10 Observations: Rock shows moderate to highly alteration Name of the rock: Amygdaloidal basaltic lava flow

134
Figure C 9. Photomicrographs from ASK86-07; 1, and 2 in stereomicroscope; 6, 7, 9, 10, 11, 12, 13, 14 and 15 in plane-polarized light; 3, 4, 5, 8 and 9 in cross-polarized light.

135
Table C 10. Petrographic analysis under stereomicroscope and petrographic microscope using plane and cross polirazed ligth of the sample ASK86-09.
Sample: ASK86-09 Depth: 478.87 – 478.95 m Figures B10 Stereomicroscope description:
Light grey-greenish volcanic rock showing an amygdaloidal texture with aphanitic groundmass. The former vesicles ranging in size from 2 mm to 6 mm. Chlorite, epidote, calcite and quartz are filling the vesicles. Argilitization takes place given a distinctive greenish color to the rock, and there is also disseminated sulfides at the matrix
1
Microscopy description: Texture: Concentrically zoned amygdales in a finely - microlithic groundmass 2 Structures: Matrix is massive or weakly aligned with perlitic cracks 3
Texture elements Modal %
estimated Figures B10
Groundmass: Composed by plagioclase, microcrysts and opaque minerals. It is altered to dark-greenish secondary minerals
65% 3
Vesicles:
Type Size Sphericity Roundness Proportion
filled
1 ≤ 4mm moderate subrouded entirely 5% 4, 5
2 ≤ 6mm low subangular entirely and partially
30% 6
Fractures: Type Thickness Distribution Shape
Proportion filled
1 1 um mosaic spherical partially < 1% 7, 8 Total 100%
Primary minerals: Morphological properties Optical properties
Observations Mineral %
Estimated Figures B10
Grain size Grain shape Mineral habit Cleavage Relief Color and
pleochroism Extinction behaviour
Interference Color
non-visible
Groundmass minerals
Morphological properties Optical properties Mineral
% Estimated
Figures B10 Grain size Grain shape Mineral habit Cleavage Relief
Color and pleochroism
Extinction behaviour
Interference Color
Observations
1 100 µm subhedral prismatic indistinct low colorless oblique 1st - 2th due to alteration
Argilitic alteration
Plagioclase 30%
3
2 < 1 µm indistinct low dark grey to dark green
isotropic Altered to smectite?
Microcrysts altered to
clay minerals
60%
3 < 50 µm subhedral indistinct low isotropic
Subhedral opaque minerals embedded in an altered matrix
Magnetite-Ilmenite
10%
Secondary mineral in vesicles
Morphological properties Optical properties Observations Mineral
Fluid inclusions
Figures B10 Grain size Grain shape Mineral habit Cleavage Relief
Color and pleochroism
Extinction behaviour
Interference Color
Type 1 - 1 100 µm subhedral tabular scaly aggregates perfect 001 high
high pleochroism
from pale green to yellowish
inclined 1st (blue Berlin)
Concentric crystallization
filling completely vesicles, to
the center the crystals become
thinner or smaller given a dark mass
Chlorite 1, 4
Type 1 - 2 1 um anhedral granular
aggregates indistinct low indistinct indistinct 2nd
Increase of grain size from the
border to the center
Microcryst of epidote
5
Type 2 -1 100 µm subhedral tabular scaly aggregates
perfect (001) high pale green inclined 1st (blue Berlin)
Crystallization of chlorite in
both the border and center of vesicles
Chlorite 10
Type 2 - 2 1.5 mm subhedral
elongate prismatic crystals, Fibrous
indistinct perfect pale green to yellow
parallel to length of elongate crystals
2nd to 3th
Crystallization from the
border of the vesicles to the
center
Epidote primary
and secondary
11, 9
Type 2 - 3 500 µm anhedral coarse
anhedral aggregate
perfect rhombohedral
low colorless symmetrical to cleavage
traces anomalous
Calcite twinning
Calcite 12
Type 2 - 4 200 µm anhedral coarse
anhedral aggregate
indistinct medium colorless indistinct violet 4th Patches
embedded in a zeolite
Zeolites 1 primary 13, 15
Type 2 - 5 500 µm anhedral drusy -
fibrous - dendritic
indistinct low
colorless to brownish
high pleochroism
indistinct anomalous Mainly fills the center of the
vesicles Zeolites 2 14
Secondary mineral in fractures
Morphological properties Optical properties Mineral
Fluid inclusions
Figures B10 Grain size Grain shape Mineral habit Cleavage Relief
Color and pleochroism
Extinction behaviour
Interference Color
Observations
1 <1 um anhedral drusy -
fibrous - dendritic
indistinct low
colorless to brownish
high pleochroism
indistinct anomalous
Fills partially the fractures, most of them
are empty
Zeolites
8
Crystallization sequence of secondary minerals: Vesicles 1: Microcrysts of chlorite - Microcrysts of epidote; Vesicles 2: Chlorite - Epidote - Zeolites 1 - Zeolites 2 - Calcite 2, 9 Observations: The rock looks greenish and part of the clay minerals are gone due to the thin section arrangement. It means this is highly altered. Name of the rock: Amygdaloidal basalt

136
Figure C 10. Photomicrographs from ASK86-09; 1 in stereomicroscope; 2, 4, 5, 7, 8, 9, 10, 11, 13, 14 and 15 in plane-polarized light; 3, 6, and 12 in cross-polarized light.

137
Table C 11. Petrographic analysis under stereomicroscope and petrographic microscope using plane and cross polirazed ligth of the sample ASK86-11.
Sample: ASK86‐11 Depth: 481.67 – 481.77 m Figures B11
Stereomicroscope description:
Light grey‐greenish volcanic rock showing an amygdaloidal texture with aphanitic groundmass. The former vesicles ranging around 6mm in size, and micro fractures are also present. Vesicles are occupied by two different groups of minerals. The first group is smectite and chlorite and the second is epidote (border) and calcite (center). Fractures are also filled with calcite. These secondary minerals co‐exist in one vesicle in some cases. The greenish color indicates argilitization of the matrix of the rock.
1, 2
Microscopy description:
Texture: Filled vesicles in a fine‐grained groundmass 3
Structures: Matrix is massive 4
Texture elements Modal % estimated
Figures B11
Groundmass: Composed of plagioclase, microcrysts and opaque minerals. Matrix altered to a greenish clay
70% 4
Vesicles:
Type Size Sphericity Roundness Proportion
filled
1 ≤ 6 mm high subrounded entirely
30%
3
2 ≤6 mm high subrounded entirely 5
3 ≤ 4 mm moderate subangular entirely 6
Fractures:
Type Thickness Distribution Shape Proportion
filled
1 50 µm fracture zone lineal entirely‐partially
< 1% 7
Total 100%
Primary minerals:
Morphological properties Optical properties
Observations Mineral %
Estimated Figures B11
Grain size Grain shape Mineral habit Cleavage Relief Color and
pleochroism Extinction behaviour
interference Color
non‐visible
Groundmass minerals:
Morphological properties Optical properties
Mineral %
Estimated Figures B11
Grain size Grain shape Mineral habit Cleavage Relief Color and
pleochroism Extinction behaviour
interference Color
Observations
1 100 µm subhedral prismatic indistinct low colorless Oblique 1st ‐ 2th due to alteration
weakly argillitic alteration
Plagioclase 50%
4
2 <1 µm indistinct low dark grey to dark green
isotropic
Altered to secondary minerals
(smectite?)
Microcrysts altered to secondary minerals
40%
3 <50 µm anhedral indistinct low isotropic
subhedral opaque minerals
embedded in an altered matrix
Magnetite 10%
Secondary minerals in Vesicles
Morphological properties Optical properties
Observations Mineral Fluid
inclusions Figures B11
Grain size Grain shape Mineral habit Cleavage Relief Color and
pleochroism Extinction behaviour
interference Color
Type 1 ‐ 1 100 µm subhedral tabular scaly aggregates
perfect (001) high pale green inclined 1st (blue Berlin)
Crystallization of chlorite filling all the
vesicle
Chlorite 5, 8
Type 2 ‐ 1 ≤500 µm subhedral prismatic hexagonal crystals
Seldom distinct
moderate colorless parallel 1st
Crystalized from the
border with small crystals and bigger in to the center
Quartz primary and
secondary 6, 7
Type 2 ‐ 3 ≤300 µm
anhedral prismatic tabular
perfect rhombohedral
low colorless symmetrical to cleavage
low to 4th
Irregular crystals with
typical twinning
Calcite 6, 7
Type 2 ‐ 3 ≤500 µm subhedral prismatic Rosette Crystals
perfect cleavage in one direction
high Yellowish parallel 3th Crystalized in the center of the vesicle
Epidote primary and
secondary 8
Type 2 ‐ 3 300 µm anhedral interstitial patches and prismatic
indistinct moderate colorless to brownish
inclined 1st
Crystallization between
epidote and quartz
Zeolites 9, 11
Type 3 ‐ 1 <100 µm subhedral prismatic perfect
cleavage in one direction
high Yellowish parallel 3th
Crystals of epidote in the border of the
vesicles
Epidote 10, 13
Type 3 ‐ 2 ≤500 m subhedral prismatic hexagonal crystals
Seldom distinct
moderate colorless parallel 1st Crystallization after epidote
Quartz primary and
secondary 12, 14, 15
Type 3 ‐ 3 300 m anhedral interstitial patches and prismatic
indistinct moderate colorless to brownish
inclined 1st
Interstitial mineral
among quartz crystals
Calcite 12
Secondary mineral in fractures
Morphological properties Optical properties
Mineral Fluid
inclusions Figures B11
Grain size Grain shape Mineral habit Cleavage Relief Color and
pleochroism Extinction behaviour
interference Color
Observations
1 ≤300 m anhedral prismatic tabular
indistinct low colorless indistinct low to 4th Irregular crystals
Calcite 4
Crystallization sequence of secondary minerals: Vesicles 1: Chlorite ‐ Epidote; Vesicles 2: Quartz ‐ Calcite ‐ Zeolites ‐ Epidote; Vesicle 3: Epidote ‐ Quartz ‐ Zeolites; Fracture: Calcite 1, 5
Observations: Argillic alteration in the matrix
Name of the rock: Amygdaloidal basalt

138
Figure C 11. Photomicrographs from ASK86-11; 1 and 2 in stereomicroscope; 5, 9, 10, 11, 12, 13, 14 and 15 in plane-polarized light; 3, 4, 6, 7, and 8 in cross-polarized light.

139
Table C 12. Petrographic analysis under stereomicroscope and petrographic microscope using plane and cross polirazed ligth of the sample ASK86-12.
Sample: ASK86-
12 Depth: 486.95-487.03 m Figures B12
Stereomicroscope description:
Dark-greenish to grey volcanic rock showing an aphanitic texture with few vesicles and veins. The former vesicles ranging in size about 2 mm and are filled with chlorite at the border and quartz in the center of the vesicle. Secondary process forms fractures filled with calcite. Apparently, the crystallization sequence of the secondary minerals are chlorite, quartz and calcite. This sequence is suggested because the fractures cut and displace the former vesicles and different secondary mineral are emplaced at each structure.
1
Microscopy description: Texture: Microcrystalline texture, showing relatively even grain size with plenty of larger mafic minerals and few amygdales. 2, 3 Structures: Massive rock crosscut by fractures (apparently fracture zones) 2
Texture elements Modal %
estimated Figures
B12
Groundmass: Microlithic Plagioclase altered and embedded in a chloritized matrix with disseminated opaque minerals. 92% 4
Vesicles: Type Size Sphericity Roundness
Proportion filled
1 1.5 mm low subangular entirely 2% 3, 6 2 4 mm moderate subrounded entirely 4% 11
Fractures: Type Thickness Distribution Shape
Proportion filled
1 ≤500 µm fracture zone lineal entirely 2% 2, 5 Total 100%
Primary minerals:
Morphological properties Optical properties Observations Mineral
% Estimated
Figures B12 Grain size
Grain shape
Mineral habit Cleavage Relief Color and pleochroism
Extinction behaviour
Interference Color
non-visible
Groundmass minerals:
Morphological properties Optical properties Mineral
% Estimated
Figures B12 Grain size
Grain shape
Mineral habit Cleavage Relief Color and
pleochroism Extinction behaviour
Interference Color
Observations
1 100 µm subhedral prismatic indistinct low colorless Inclined 1st Argillic alteration Plagioclase 35%
4
2 ≤100 µm anhedral aggregates indistinct low pale green indistinct 2nd Product of alteration Chlorite 5%
3 1 µm indistinct indistinct indistinct low dark greenish isotropic Altered to clay and
substitute by epidote
Matrix 50%
4 200 µm anhedral cubic indistinct medium isotropic Ilmenite - Magnetite
10%
Secondary minerals in vesicles
Morphological properties Optical properties Observations Mineral
Fluid inclusions
Figures B12 Grain size
Grain shape
Mineral habit Cleavage Relief Color and
pleochroism Extinction behaviour
Interference Color
Type 1 - 1 100 µm subhedral
concentric aggregates of
elongate prismatic crystals
perfect 001 moderate pale green to
green
parallel to length of elongate crystals
2nd Fill completely the
vesicle, intercalated with zeolites
Chlorite 3, 6
Type 1 - 2 <100 µm
anhedral aggregates -
skeletal indistinct low Colorless indistinct 1st
Crystalized after a microcrysts of
chlorite Quartz 7
Type 2 - 1 100 µm subhedral
concentric aggregates of
elongate prismatic crystals
perfect 001 moderate pale green to
green
parallel to length of elongate crystals
2nd Crystalized at the
border of the vesicle
Chlorite 8
Type 2 - 1 ≤1 µm subhedral prismatic
hexagonal crystals
seldom distinct
moderate colorless parallel 1st Replaces zeolite, as
the last event of crystallization
Quartz primary 7, 9, 10, 13
Type 2 - 3 <1 µm anhedral fibrous patches indistinct low colorless indistinct 3th Post-crystallization
of chlorite Feldspar 11, 12
Type 2 - 4 700 µm subhedral prismatic
rosette crystals
perfect cleavage in
one direction high yellowish parallel 3th
Crystalized in the center of the vesicle
with zeolite? Epidote primary 12
Secondary mineral in fractures
Morphological properties Optical properties Mineral Fluid
inclusions Figures B12 Grain
size Grain shape
Mineral habit Cleavage Relief Color and pleochroism
Extinction behaviour
Interference Color
Observations
Type 1 - 1 < 1 mm subhedral Prismatic hexagonal
crystals
Seldom distinct
low colorless parallel 1st Fills completely the
fractures Zeolites primary 15, 14
Crystallization sequence of secondary minerals: Vesicles 1: Quartz - Chlorite. Vesicles 2: Quartz - Chlorite, Quartz, Feldspar, Epidote. Sequence cross-cutting by zeolite veins. 3, 11 Observations: Greenish Color due to chloritization Name of the rock: Chloritized basalt with amygdales

140
Figure C 12. Photomicrographs from ASK86-12; 1 in stereomicroscope; 2, 3, 6, 7, 8, 10, 11, 12, 13, 14 and 15 in plane-polarized light; 4, 5, and 9 in cross-polarized light.

141
Appendix D Figure D 1. Mineral spectra obtained during the SEM-EDS analyses on the Hoffell/Miðfell cores ASK57 and ASK86.

142

143
Appendix E Figure E 1. Mineral phases determined during the the SEM-EDS analysis of the ASK57-01 sample.

144
Figure E 2. Mineral phases determined during the the SEM-EDS analysis of the ASK57-05 sample.

145
Figure E 2. (Cont.) Mineral phases determined during the SEM-EDS analysis of the ASK57-05 sample.

146
Figure E 3. Mineral phases determined during the the SEM-EDS analysis of the ASK57-09 sample.

147
Figure E 4. Mineral phases determined during the the SEM-EDS analysis of the ASK57-10 sample.

148
Figure E 5. Mineral phases determined during the the SEM-EDS analysis of the ASK57-11 sample.

149
Figure E 6. Mineral phases determined during the the SEM-EDS analysis of the ASK86-01 sample.

150
Figure E 7. Mineral phases determined during the the SEM-EDS analysis of the ASK86-04 sample.

151
Figure E 8. Mineral phases determined during the the SEM-EDS analysis of the ASK86-05 sample.

152
Figure E 9. Mineral phases determined during the the SEM-EDS analysis of the ASK86-07 sample.

153
Figure E 10. Mineral phases determined during the the SEM-EDS analysis of the ASK86-09 sample.

154
Figure E 11. Mineral phases determined during the the SEM-EDS analysis of the ASK86-11 sample.

155
Figure E 12. Mineral phases determined during the the SEM-EDS analysis of the ASK86-12 sample.


157
Appendix F Table F 1. Microprobe analyses of plagioclase in the matrix reported as oxide components. Calculated cation numbers of plagioclase on the basis of 8 oxygen atoms, using spreadsheet for mineral formula calculation at https://serc.carleton.edu/.
Analysis (wt%) 86-01 MA1 86-01 MA2 86-01-MA3 57-05-MA1 57-05-MA2 57-05-MA3 57-05-MA4 57-05-MA5 57-05-MA6 57-05-MA7 57-05-MA8 57-10-MA28
370.50 m 376.18 m 431.60 m SiO2 68.01 66.96 67.03 59.63 52.19 52.30 64.37 65.85 63.28 64.38 55.00 68.07 TiO2 0.00 0.02 0.06 0.04 0.10 0.12 0.03 0.04 0.05 0.02 0.13 0.01Al2O3 19.93 19.59 19.71 24.13 29.51 29.29 21.95 20.53 19.12 21.71 27.19 20.62
FeO(total) 0.30 0.30 0.44 1.36 1.17 1.10 0.41 0.39 0.52 0.40 1.10 0.49MnO 0.02 0.00 0.00 0.02 0.01 0.01 0.01 0.01 0.01 0.01 0.01 0.02MgO 0.00 0.00 0.00 0.66 0.04 0.09 0.06 0.00 0.01 0.02 0.09 0.00CaO 0.20 0.19 0.25 5.34 12.53 11.26 2.83 1.32 0.60 2.92 9.69 0.15Na2O 11.62 11.43 11.56 8.23 4.20 4.22 9.98 10.48 0.66 10.07 5.57 10.41 BaO 0.00 0.00 0.00 0.00 0.00 0.00 0.00 0.00 0.20 0.02 0.00 0.00K2O 0.04 0.08 0.05 0.20 0.20 0.24 0.09 0.59 15.96 0.16 0.27 0.04Total 100.12 98.58 99.10 99.61 99.95 98.62 99.74 99.21 100.41 99.71 99.05 99.81
Based on the 8 oxygen atomsSi 2.968 2.968 2.955 2.658 2.374 2.410 2.843 2.916 2.912 2.843 2.506 3.007 Ti 0.000 0.001 0.002 0.001 0.004 0.004 0.001 0.001 0.002 0.001 0.004 0.000 Al 1.025 1.023 1.024 1.268 1.582 1.591 1.143 1.072 1.037 1.130 1.460 1.073
Fe3+ 0.011 0.011 0.016 0.051 0.044 0.000 0.015 0.014 0.020 0.015 0.014 0.000 Fe2+ 0.000 0.000 0.000 0.000 0.000 0.042 0.000 0.000 0.000 0.000 0.028 0.018 Mn 0.001 0.000 0.000 0.001 0.001 0.000 0.000 0.000 0.000 0.000 0.000 0.001 Mg 0.000 0.000 0.000 0.044 0.003 0.006 0.004 0.000 0.001 0.002 0.006 0.000 Ca 0.009 0.009 0.012 0.255 0.611 0.556 0.134 0.063 0.029 0.138 0.473 0.007 Na 0.983 0.982 0.988 0.711 0.370 0.377 0.855 0.900 0.059 0.862 0.492 0.892 Ba 0.000 0.000 0.000 0.000 0.000 0.000 0.000 0.000 0.004 0.000 0.000 0.000 K 0.002 0.005 0.003 0.011 0.012 0.014 0.005 0.033 0.937 0.009 0.016 0.002
Total 5.000 5.000 5.000 5.000 5.000 5.000 5.000 5.000 5.000 5.000 5.000 5.000 Or 0.22 0.46 0.28 1.14 1.17 1.47 0.53 3.34 91.40 0.87 1.63 0.22Ab 98.84 98.64 98.54 72.77 37.31 39.82 86.00 90.37 5.73 85.44 50.16 98.98 An 0.93 0.89 1.18 26.09 61.51 58.71 13.48 6.29 2.86 13.69 48.22 0.80
Sample code reference:
(86-01-MA1) - 86-01: analysis from ASK86-01sample; M: in matrix; A: albite; 1: Analysis number. Or: orthoclase; Ab: albite; An: anorthite

158
Table F 1 (Cont.) Microprobe analyses of plagioclase in the matrix reported as oxide components. Calculated cation numbers of plagioclase on the basis of 8 oxygen atoms, using spreadsheet for mineral formula calculation at https://serc.carleton.edu/.
Analysis (wt%) 57-10-MA29 57-10-MA30 86-07-MA19 86-07-MA20 86-09-MA9 86-09-MA10 86-12-MA1 86-12-MA2 86-12-MA4 86-12-MA5 86-12-MA6
431.60 m 461.82 m 478.87 m 486.95 m SiO2 64.84 68.62 68.60 66.22 69.12 69.25 63.62 64.01 54.80 54.80 54.17 TiO2 0.07 0.07 0.05 0.03 0.06 0.00 0.00 0.00 0.23 0.16 0.16Al2O3 21.65 21.03 21.43 21.49 21.38 21.28 22.57 22.93 27.29 27.83 28.28
FeO(total) 0.55 0.34 0.34 3.01 0.40 0.50 0.00 0.01 1.44 1.14 1.26MnO 0.03 0.01 0.00 0.03 0.01 0.02 0.01 0.02 0.03 0.04 0.03MgO 0.04 0.00 0.00 1.26 0.00 0.00 0.00 0.00 0.12 0.08 0.11CaO 0.16 0.26 0.46 0.39 0.24 0.21 3.44 3.47 10.27 10.30 10.97 Na2O 10.51 11.07 9.97 8.90 9.59 9.35 9.58 9.33 5.56 5.42 4.90BaO 0.00 0.00 0.02 0.03 0.00 0.00 0.00 0.00 0.00 0.00 0.00K2O 0.12 0.08 0.07 0.09 0.05 0.05 0.12 0.12 0.28 0.29 0.25Total 97.98 101.48 100.94 101.44 100.85 100.66 99.34 99.89 100.02 100.06 100.14
Based on the 8 oxygen atomsSi 2.903 2.968 3.006 2.910 3.042 3.059 2.824 2.832 2.476 2.474 2.453 Ti 0.002 0.002 0.002 0.001 0.002 0.000 0.000 0.000 0.008 0.005 0.006 Al 1.143 1.072 1.107 1.113 1.109 1.108 1.181 1.196 1.453 1.481 1.509
Fe3+ 0.000 0.000 0.000 0.000 0.000 0.000 0.000 0.000 0.054 0.043 0.010 Fe2+ 0.021 0.012 0.012 0.111 0.015 0.019 0.000 0.000 0.000 0.000 0.038 Mn 0.001 0.001 0.000 0.001 0.000 0.001 0.000 0.001 0.001 0.001 0.001 Mg 0.003 0.000 0.000 0.082 0.000 0.000 0.000 0.000 0.008 0.005 0.007 Ca 0.008 0.012 0.021 0.018 0.011 0.010 0.164 0.164 0.497 0.498 0.532 Na 0.912 0.928 0.847 0.758 0.818 0.801 0.824 0.800 0.487 0.474 0.430 Ba 0.000 0.000 0.000 0.000 0.000 0.000 0.000 0.000 0.000 0.000 0.000 K 0.007 0.004 0.004 0.005 0.003 0.003 0.007 0.007 0.016 0.017 0.014
Total 5.000 5.000 5.000 5.000 5.000 5.000 5.000 5.000 5.000 5.000 5.000 Or 0.73 0.45 0.48 0.62 0.34 0.32 0.69 0.71 1.61 1.70 1.47Ab 98.44 98.29 97.07 97.04 98.32 98.43 82.87 82.37 48.69 47.95 44.04 An 0.82 1.26 2.45 2.34 1.34 1.25 16.44 16.93 49.70 50.35 54.49
Sample code reference: (57-10-MA-29) - 57-10: analysis from ASK57-10 sample; M: in matrix; A: albite; 29: analysis number. Or: orthoclase; Ab: albite; An: anorthite

159
Table F 2. Microprobe analyses of feldspars in vesicles. Calculated cation numbers of feldspars on the basis of 8 oxygen atoms, using spreadsheets for mineral formula calculation at https://serc.carleton.edu/.
Analysis (wt%)
86-01 K1
86-01 K2
86-01-K3
86-01-K4
86-01-K5
57-05 K1
57-05 K2
57-05 K3
57-05-KF4
57-05-KF5
57-05-KF6
57-05-K8
57-05-K9
57-05-K10
57-05-A4
86-07-K22
86-07-K23
370.50 m 376.18 m 461.82 m SiO2 64.47 65.03 64.43 62.72 64.18 64.34 64.49 64.37 63.27 63.68 63.98 63.76 63.58 54.66 52.02 65.32 64.73 TiO2 0.00 0.00 0.00 0.04 0.01 0.01 0.01 0.01 0.02 0.02 0.00 0.05 0.01 0.15 0.13 0.01 0.01 Al2O3 18.65 18.47 18.71 19.34 18.74 18.37 18.38 18.53 18.66 18.80 18.68 18.89 22.64 27.42 29.73 19.45 19.64
FeO(total) 0.14 0.05 0.00 0.02 0.00 0.01 0.04 0.01 0.06 0.12 0.07 0.38 0.49 0.98 1.06 0.00 0.00 MnO 0.00 0.01 0.00 0.01 0.01 0.00 0.00 0.01 0.03 0.00 0.01 0.00 0.01 0.02 0.00 0.01 0.02 MgO 0.01 0.00 0.01 0.01 0.01 0.00 0.00 0.00 0.00 0.00 0.00 0.00 0.02 0.12 0.10 0.00 0.02 CaO 0.06 0.03 0.03 0.02 0.02 0.03 0.01 0.01 0.00 0.00 0.02 0.03 3.50 10.46 12.62 0.02 0.03 Na2O 0.72 0.40 0.52 0.72 0.43 0.40 0.42 0.46 0.47 0.44 0.53 0.40 9.43 5.31 4.01 0.50 0.51 BaO 0.23 0.20 0.02 2.21 0.43 0.04 0.19 0.05 1.06 0.47 0.47 0.74 0.00 0.00 0.00 0.22 0.65 K2O 16.23 16.52 16.71 15.65 16.85 16.79 16.68 16.89 16.29 16.76 16.39 16.27 0.10 0.27 0.20 15.68 15.61 Total 100.50 100.71 100.44 100.74 100.66 99.99 100.22 100.34 99.86 100.30 100.16 100.51 99.78 99.39 99.88 101.22 101.22
Based on 8 Oxygen atomsSi 2.962 2.988 2.959 2.910 2.950 2.972 2.975 2.961 2.944 2.938 2.956 2.946 2.816 2.486 2.370 2.987 2.967 Ti 0.000 0.000 0.000 0.001 0.000 0.000 0.000 0.000 0.001 0.001 0.000 0.002 0.000 0.005 0.004 0.000 0.000 Al 1.010 1.000 1.013 1.058 1.015 1.000 0.999 1.004 1.023 1.022 1.017 1.029 1.182 1.470 1.596 1.048 1.061
Fe3+ 0.006 0.002 0.000 0.001 0.000 0.000 0.002 0.000 0.002 0.004 0.003 0.015 0.000 0.017 0.011 0.000 0.000 Fe2+ 0.000 0.000 0.000 0.000 0.000 0.000 0.000 0.000 0.000 0.000 0.000 0.000 0.018 0.021 0.030 0.000 0.000 Mn 0.000 0.000 0.000 0.000 0.000 0.000 0.000 0.000 0.001 0.000 0.000 0.000 0.000 0.001 0.000 0.000 0.001 Mg 0.000 0.000 0.001 0.001 0.000 0.000 0.000 0.000 0.000 0.000 0.000 0.000 0.001 0.008 0.007 0.000 0.001 Ca 0.003 0.002 0.002 0.001 0.001 0.001 0.000 0.001 0.000 0.000 0.001 0.001 0.166 0.510 0.616 0.001 0.001 Na 0.064 0.036 0.046 0.065 0.038 0.036 0.038 0.041 0.042 0.040 0.048 0.036 0.810 0.468 0.354 0.044 0.045 Ba 0.004 0.003 0.000 0.037 0.007 0.001 0.003 0.001 0.019 0.008 0.008 0.013 0.000 0.000 0.000 0.004 0.011 K 0.951 0.968 0.979 0.926 0.988 0.989 0.982 0.991 0.967 0.986 0.966 0.959 0.005 0.016 0.012 0.915 0.913
Total 5.000 5.000 5.000 5.000 5.000 5.000 5.000 5.000 5.000 5.000 5.000 5.000 5.000 5.000 5.000 5.000 5.000 Or 93.43 96.29 95.33 93.32 96.21 96.34 96.25 95.94 95.82 96.11 95.21 96.29 0.56 1.60 1.20 95.26 95.15 Ab 6.28 3.54 4.52 6.55 3.71 3.53 3.72 4.00 4.18 3.87 4.70 3.58 82.52 47.11 36.07 4.63 4.71 An 0.28 0.17 0.15 0.12 0.08 0.13 0.03 0.05 0.00 0.02 0.09 0.13 16.92 51.28 62.73 0.11 0.14
Sample code reference: (57-05-KF4) - 57-05: analysis from ASK57-05 sample; K: K-feldspar; (A: albite) F: in a fracture; 4: analysis number. Or: orthoclase; Ab: albite; An: anorthite

160
Table F 2. (Cont.) Microprobe analyses of feldspars in vesicles. Calculated cation numbers of feldspars on the basis of 8 oxygen atoms, using spreadsheets for mineral formula calculation at https://serc.carleton.edu/.
Analysis (wt%)
86-07-K22
86-07-K23
86-07-K24
86-07- K25
86-07-K26
86-09-K11
86-09-K14
86-09-K17
86-09-K18
86-12-K1
86-12-K2
86-12-K3
86-12-A1
86-12-A2
86-12-A3
86-12-A4
461.82 m 478.870 486.95 m SiO2 65.32 64.73 64.19 64.85 64.18 64.80 63.09 69.21 64.83 63.78 64.13 63.97 63.55 63.73 63.76 63.51 TiO2 0.01 0.01 0.02 0.01 0.01 0.00 0.00 0.00 0.00 0.00 0.01 0.02 0.04 0.00 0.00 0.00 Al2O3 19.45 19.64 20.02 19.77 19.14 19.49 19.35 21.12 19.50 18.88 18.76 18.83 18.89 22.53 22.68 22.76
FeO(total) 0.00 0.00 0.08 0.05 0.01 0.00 0.33 0.00 0.00 0.01 0.00 0.00 0.01 0.01 0.02 0.02 MnO 0.01 0.02 0.02 0.02 0.01 0.00 0.00 0.00 0.00 0.00 0.00 0.02 0.00 0.01 0.00 0.01 MgO 0.00 0.02 0.00 0.00 0.00 0.00 0.01 0.00 0.01 0.00 0.01 0.01 0.00 0.00 0.00 0.01 CaO 0.02 0.03 0.05 0.04 0.42 0.02 0.82 0.22 0.04 0.02 0.10 0.00 0.00 3.30 3.22 3.46 Na2O 0.50 0.51 0.09 0.47 0.53 0.37 0.52 9.28 0.61 0.59 0.57 0.54 0.59 9.59 9.62 9.71 BaO 0.22 0.65 1.12 0.75 0.61 0.52 0.54 0.01 0.25 0.98 0.58 1.10 1.09 0.01 0.01 0.00 K2O 15.68 15.61 16.19 15.72 14.94 15.91 14.30 0.06 15.97 15.95 16.33 16.16 16.26 0.14 0.17 0.11 Total 101.22 101.22 101.77 101.69 99.86 101.11 98.97 99.90 101.21 100.21 100.48 100.65 100.43 99.31 99.49 99.58
Based on 8 Oxygen atomsSi 2.987 2.967 2.940 2.961 2.985 2.973 2.962 3.078 2.960 2.956 2.956 2.955 2.940 2.830 2.825 2.809 Ti 0.000 0.000 0.001 0.000 0.000 0.000 0.000 0.000 0.000 0.000 0.000 0.001 0.001 0.000 0.000 0.000 Al 1.048 1.061 1.081 1.064 1.049 1.054 1.071 1.107 1.049 1.031 1.019 1.025 1.030 1.179 1.184 1.187 Fe3 0.000 0.000 0.000 0.000 0.000 0.000 0.000 0.000 0.000 0.000 0.000 0.000 0.000 0.000 0.001 0.001 Fe2 0.000 0.000 0.003 0.002 0.000 0.000 0.013 0.000 0.000 0.000 0.000 0.000 0.000 0.000 0.000 0.000 Mn 0.000 0.001 0.001 0.001 0.000 0.000 0.000 0.000 0.000 0.000 0.000 0.001 0.000 0.000 0.000 0.000 Mg 0.000 0.001 0.000 0.000 0.000 0.000 0.001 0.000 0.000 0.000 0.000 0.001 0.000 0.000 0.000 0.000 Ca 0.001 0.001 0.002 0.002 0.021 0.001 0.041 0.010 0.002 0.001 0.005 0.000 0.000 0.157 0.153 0.164 Na 0.044 0.045 0.008 0.042 0.048 0.033 0.047 0.800 0.054 0.053 0.051 0.048 0.053 0.826 0.826 0.833 Ba 0.004 0.011 0.018 0.012 0.010 0.008 0.009 0.000 0.004 0.015 0.009 0.016 0.016 0.000 0.000 0.000 K 0.915 0.913 0.946 0.916 0.886 0.931 0.856 0.004 0.930 0.943 0.960 0.952 0.960 0.008 0.010 0.006
Total 5.000 5.000 5.000 5.000 5.000 5.000 5.000 5.000 5.000 5.000 5.000 5.000 5.000 5.000 5.000 5.000 Or 95.26 95.15 98.96 95.44 92.77 96.5 90.6 0.45 94.28 94.57 94.54 95.16 94.75 0.77 0.99 0.62 Ab 4.63 4.71 0.80 4.36 5.05 3.4 5.0 98.28 5.51 5.35 4.99 4.84 5.23 83.37 83.56 83.03 An 0.11 0.14 0.24 0.20 2.18 0.1 4.4 1.28 0.22 0.08 0.48 0.00 0.01 15.85 15.46 16.35
Sample code reference: (86-07-K22) - 86-07: analysis from ASK86-07 sample; K: K-feldspar; (A: albite); 22: analysis number. Or: orthoclase; Ab: albite; An: anorthite

161
Table F 3. Microprobe analyses of pyroxenes. Calculated cation numbers of pyroxenes on the basis of 6 oxygen atoms, using the spreadsheet for mineral formula calculation at https://serc.carleton.edu/.
Analysis (wt%)
57-05-MCpx5
57-05-MCpx6
86-07-S15-MCpx8
86-07-S15-MCpx9
86-07-S15-MCpx10
86-07-MCpx11
86-09-MCpx16
86-12-VCpx1
86-12-VCpx2
86-12-VCpx3
86-12-VCpx4
86-12-MCpx5
376.18 m 461.82 m 478.87 m 486.95 m SiO2 51.81 51.17 52.41 53.71 51.98 52.32 52.48 52.73 53.49 53.97 53.86 51.88 TiO2 0.11 0.16 0.08 0.06 0.02 0.10 0.07 0.00 0.00 0.00 0.00 0.12 Al2O3 0.80 2.26 0.54 0.67 0.22 0.39 0.55 0.88 0.42 0.94 0.91 0.31 FeO 13.79 14.81 13.55 12.98 14.06 13.26 13.41 9.65 9.24 4.26 4.32 14.70 MnO 0.57 0.42 0.71 0.60 0.70 0.64 0.75 0.68 0.86 3.36 3.51 0.83 MgO 10.59 9.91 9.84 10.05 10.05 9.93 10.28 11.67 11.08 12.73 12.76 9.35 CaO 21.25 20.15 22.54 23.04 23.34 23.36 22.83 23.84 23.64 24.76 24.76 22.54 Na2O 0.16 0.26 0.10 0.15 0.11 0.12 0.13 0.15 0.09 0.18 0.17 0.19 NiO 0.00 0.01 0.00 0.00 0.03 0.00 0.00 0.00 0.00 0.00 0.00 0.00 K2O 0.03 0.03 0.02 0.01 0.01 0.01 0.01 0.01 0.03 0.00 0.00 0.01
Cr2O3 0.01 0.01 0.03 0.02 0.01 0.01 0.03 0.00 0.00 0.03 0.00 0.00 Total 99.14 99.76 100.82 101.44 100.53 100.15 100.54 99.62 98.91 100.25 100.29 100.45
Based on the 6 oxygen atoms Si 1.997 1.975 2.014 2.029 1.983 2.001 1.997 1.996 2.048 2.011 2.006 1.999 Ti 0.003 0.005 0.002 0.002 0.001 0.003 0.002 0.000 0.000 0.000 0.000 0.003 Al 0.036 0.103 0.025 0.030 0.010 0.018 0.025 0.039 0.019 0.041 0.040 0.014
Fe+2 0.445 0.478 0.435 0.410 0.418 0.424 0.427 0.306 0.296 0.133 0.135 0.474 Mn 0.019 0.014 0.023 0.019 0.023 0.021 0.024 0.022 0.028 0.106 0.111 0.027 Mg 0.609 0.570 0.564 0.566 0.572 0.566 0.583 0.659 0.632 0.707 0.709 0.537 Ca 0.878 0.833 0.928 0.932 0.954 0.957 0.931 0.967 0.970 0.988 0.988 0.931 Na 0.012 0.020 0.008 0.011 0.008 0.009 0.009 0.011 0.007 0.013 0.012 0.014 Ni 0.000 0.000 0.000 0.000 0.001 0.000 0.000 0.000 0.000 0.000 0.000 0.000 K 0.002 0.002 0.001 0.001 0.001 0.001 0.000 0.000 0.001 0.000 0.000 0.000 Cr 0.000 0.000 0.001 0.000 0.000 0.000 0.001 0.000 0.000 0.001 0.000 0.000
Total 4.000 4.000 4.000 4.000 3.970 4.000 4.000 4.000 4.000 4.000 4.000 4.000 Wo 45.46 44.29 48.15 48.86 48.32 49.15 47.96 50.07 51.09 54.06 53.96 47.93 En 31.52 30.31 29.25 29.65 28.95 29.07 30.05 34.11 33.32 38.68 38.69 27.67 Fs 23.02 25.41 22.60 21.49 22.72 21.78 21.99 15.82 15.59 7.26 7.35 24.40
Sample code reference: (57-05-MCpx5) - 57-05: analysis from ASK57-05 sample; M: matrixr; (V: vesicle); Cpx: clinopyroxene; 5: analysis number. Wo: wollastonite; En: enstatite; Fs: ferrosilite

162
Table F 4. Microprobe analyses of amphiboles. Calculated cation numbers of amphiboles on the basis of 24 oxygens, using the spreadsheet for mineral formula calculation by Locock (2014).
Analysis (wt%)
86-01-MAm1
86-01-MAm2
86-01-MAm3*
86-01-MAm4
57-05-VAm3
57-10-MAm4
57-10-VAm7
86-7-MAm12*
86-09-MAm13*
86-09-MAm15*
370.50 m 376.18
m 431.60 m
461.82 m
478.87 m
SiO2 52.28 50.56 52.05 50.75 54.19 52.81 54.32 51.40 49.38 50.08TiO2 0.15 0.20 0.25 0.48 0.31 0.00 0.04 0.27 0.10 0.78Al2O3 1.87 3.63 2.99 4.24 1.36 2.11 2.38 1.94 1.18 3.83Cr2O3 0.01 0.02 0.01 0.00 0.07 0.01 0.00 0.00 0.02 0.04MnO 0.45 0.33 0.34 0.38 0.39 0.76 0.32 0.51 0.54 0.41
FeO(total) 19.38 19.69 18.07 18.72 15.83 17.61 21.14 15.31 13.30 14.75NiO 0.00 0.00 0.02 0.00 0.01 0.00 0.00 0.00 0.00 0.03MgO 11.67 10.57 11.92 11.40 13.58 11.78 8.34 10.60 11.66 12.50CaO 11.40 11.58 11.56 11.42 11.92 12.11 12.29 18.82 19.90 16.81Na2O 0.20 0.28 0.25 0.36 0.13 0.16 0.16 0.18 0.29 0.52K2O 0.07 0.14 0.06 0.10 0.03 0.12 0.11 0.03 0.08 0.04
F 0.10 0.07 0.00 0.27 0.02 0.94 0.00 0.00 0.16 0.00Cl 0.11 0.08 0.10 0.12 0.05 0.02 0.02 0.02 0.05 0.05
O=F,Cl (calc) -0.07 -0.05 -0.02 -0.14 -0.02 -0.40 0.00 -0.01 -0.08 -0.01
Total 97.62 97.10 97.61 98.10 97.87 98.03 99.12 99.07 96.58 99.82Formula Assignments T (ideally 8 apfu)
Si 7.765 7.57 7.679 7.488 7.885 7.807 7.974 7.577 7.49 7.289Al 0.235 0.43 0.321 0.512 0.115 0.193 0.026 0.337 0.211 0.657Ti 0.03 0.011 0.054
Fe3+ T
subtotal 8 8 8 8 8 8 8 7.944 7.712 8
C (ideally 5 apfu) Ti 0.016 0.023 0.028 0.053 0.034 0.005 0.031Al 0.092 0.21 0.199 0.226 0.118 0.174 0.385 Cr 0.002 0.002 0.001 0.008 0.002 0.003 0.004
Fe3+ 0.095 0.146 0.075 0.16 0.024 Ni 0.003 0.001 0.004
Mn2+ 0.051 0.039 0.064 0.069 0.05Fe2+ 2.211 2.26 2.072 2.054 1.894 2.153 2.595 1.887 1.687 1.795Mg 2.584 2.359 2.622 2.508 2.946 2.596 1.825 2.329 2.637 2.712C
subtotal 5 5 5 5.001 5.001 5 4.849 4.28 4.396 4.596
B (ideally 2 apfu) Mn2+ 0.056 0.042 0.043 0.047 0.048 0.044 Fe2+ 0.101 0.06 0.083 0.097 0.033 0 0 0 0 0 Ca 1.814 1.858 1.827 1.805 1.858 1.918 1.933 2 2 2 Na 0.029 0.041 0.047 0.051 0.037 0.038 0.046 0 0 0 B
subtotal 2 2.001 2 2 1.976 2 1.979 2 2 2
A (from 0 to 1 apfu) Ca 0 0 0 0 0 0 0 0.972 1.234 0.621Na 0.029 0.041 0.025 0.051 0 0.008 0 0.051 0.084 0.146K 0.014 0.026 0.011 0.019 0.006 0.023 0.021 0.006 0.015 0.007A
subtotal 0.043 0.067 0.036 0.07 0.006 0.031 0.021 1.029 1.333 0.774
O (non-W) 22 22 22 22 22 22 22 22 22 22
W (ideally 2 apfu) OH 1.925 1.946 1.976 1.842 1.977 1.556 1.995 1.994 1.909 1.989F 0.049 0.035 0.127 0.011 0.44 0.078
Cl 0.027 0.019 0.024 0.031 0.012 0.004 0.005 0.006 0.013 0.011O W
subtotal 2.001 2 2 2 2 2 2 2 2 2
Sum T, C, B, A 15.043 15.068 15.036 15.071 14.983 15.031 14.849 15.253 15.441 15.37
Species actinolite actinolite actinolite actinolite actinolite actinolite ferro-
actinoliteedenite edenite edenite
Sample code reference: (86-01-MAm1); 86-01: analysis from ASK86-01 sample; M: in matrix; (V: in a vesicle); Am: Amphibole; 1: analysis number * Analysis with warning observations due to the totals for any of A, B, C, T or W are outside the expected values.

163
Table F 4. (Cont.) Microprobe analyses of amphiboles. Calculated cation numbers of amphiboles on the basis of 24 oxygens, using the spreadsheet for mineral formula calculation by Locock (2014).
Analysis (wt%)
86-09-Am18
86-09-Am19
86-09-Am23*
86-09-Am24
86-09-Am25
86-12-Am5*
86-12-Am6*
86-12-MAm7*
86-12-MAm8*
86-12-MAm11*
478.87 m 486.95 m SiO2 53.15 52.21 51.44 51.61 50.77 50.61 50.83 51.26 47.54 51.11TiO2 0.12 0.08 0.04 0.08 0.06 0.94 1.10 1.02 1.72 1.02Al2O3 2.41 2.36 2.13 1.47 4.16 1.99 1.95 1.85 3.36 2.06Cr2O3 0.01 0.00 0.00 0.03 0.01 0.04 0.00 0.00 0.00 0.03MnO 0.52 0.42 0.32 0.85 0.41 0.29 0.33 0.28 0.31 0.34FeOT 18.85 23.47 15.10 23.05 21.95 12.56 12.84 12.95 14.05 12.55NiO 0.00 0.00 0.04 0.00 0.02 0.03 0.01 0.02 0.01 0.00MgO 11.58 8.88 14.90 8.62 8.60 14.15 14.49 14.32 13.89 14.66CaO 11.88 11.54 13.17 11.90 12.00 18.15 17.89 17.74 17.12 17.56Na2O 0.19 0.25 0.26 0.12 0.32 0.25 0.25 0.26 0.30 0.29K2O 0.06 0.07 0.06 0.09 0.10 0.01 0.00 0.01 0.02 0.01
F 0.31 0.13 0.00 0.15 0.00 0.92 0.00 0.16 0.00 0.00Cl 0.02 0.01 0.02 0.02 0.10 0.00 0.00 0.00 0.01 0.00
O=F,Cl (calc) -0.13 -0.05 0.00 -0.07 -0.02 -0.39 0.00 -0.07 0.00 0.00
Total 98.97 99.36 97.48 97.92 98.48 99.56 99.68 99.80 98.33 99.63Formula Assignments T (ideally 8 apfu)
Si 7.772 7.757 7.475 7.809 7.578 7.378 7.362 7.414 7.055 7.386Al 0.228 0.243 0.365 0.191 0.422 0.342 0.333 0.316 0.588 0.351Ti 0.004 0.103 0.12 0.111 0.192 0.111
Fe3+ 0.157 T
subtotal 8 8 8.001 8 8 7.823 7.815 7.841 7.835 7.848
C (ideally 5 apfu) Ti 0.013 0.009 0.009 0.007 Al 0.187 0.17 0.071 0.31 Cr 0.002 0.004 0.001 0.005 0.003
Fe3+ 0.034 0.07 0.436 0.081 0.094 Ni 0.004 0.003 0.003 0.001 0.002 0.001
Mn2+ 0.039 0.055 0.025 0.036 0.04 0.035 0.039 0.041Fe2+ 2.24 2.785 1.242 2.836 2.646 1.531 1.555 1.566 1.744 1.517Mg 2.524 1.967 3.228 1.944 1.914 3.075 3.129 3.087 3.073 3.158C
subtotal 5 5.001 4.949 5 5 4.65 4.725 4.69 4.857 4.719
B (ideally 2 apfu) Mn2+ 0.064 0.053 0.053 0.027 Fe2+ 0.031 0.061 0 0 0 0 0 0 0 0Ca 1.861 1.837 2 1.929 1.919 2 2 2 2 2Na 0.043 0.049 0 0.017 0.054 0 0 0 0 0B
subtotal 1.999 2 2 1.999 2 2 2 2 2 2
A (from 0 to 1 apfu) Ca 0 0 0.05 0 0 0.835 0.776 0.749 0.722 0.719Na 0.011 0.023 0.074 0.017 0.037 0.071 0.069 0.073 0.087 0.081K 0.012 0.013 0.012 0.017 0.019 0.003 0.001 0.003 0.002A
subtotal 0.023 0.036 0.136 0.034 0.056 0.909 0.845 0.823 0.812 0.802
O (non-W) 22 22 22 22 22 22 22 22 22 22
W (ideally 2 apfu) OH 1.853 1.939 1.995 1.922 1.974 1.575 2 1.928 1.996 1.999F 0.141 0.059 0.073 0.424 0.072
Cl 0.006 0.001 0.005 0.005 0.026 0.001 0.004 0.001O W
subtotal 2 1.999 2 2 2 2 2 2 2 2
Sum T, C, B, A 15.022 15.037 15.086 15.033 15.056 15.382 15.385 15.354 15.504 15.369
Species actinolite ferro-
actinolite actinolite
ferro-actinolite
ferro-actinolite
edenite edenite edenite edenite edenite
Sample code reference: (86-01-MAm1); 86-01: analysis from ASK86-01 sample; M: in matrix; (V: in a vesicle); Am: Amphibole; 1: analysis number. * Analysis with warning observations due to the totals for any of A, B, C, T or W are outside the expected values.

164
Table F 5. Microprobe analyses of the zonation halos in an epidote from the sample ASK86-01. Calculated cation numbers of epidotes on the basis of 12.5 oxygen atoms, using the spreadsheet for mineral formula calculation at https://serc.carleton.edu
Analysis (wt%) 86-01-E1 86-01-E2 86-01-E3 86-01-E4 86-01-E5 86-01-E6 86-01-E7 86-01-E8 86-01-E9 86-01-E10 86-01-E11 86-01-E12
370.50 m SiO2 37.97 37.56 37.90 37.94 37.79 37.53 37.83 37.61 38.09 37.75 38.85 37.94 TiO2 0.00 0.00 0.00 0.00 0.02 0.00 0.03 0.00 0.01 0.05 0.00 0.00Al2O3 24.50 22.46 23.45 24.65 24.18 22.74 25.29 23.34 25.35 24.24 30.64 23.91
FeO(total) 12.42 14.64 13.97 12.25 12.78 15.09 11.75 13.97 10.99 12.94 4.67 13.49 MnO 0.23 0.11 0.12 0.04 0.05 0.08 0.07 0.13 0.11 0.04 0.14 0.13MgO 0.03 0.00 0.04 0.00 0.01 0.01 0.02 0.00 0.05 0.03 0.17 0.02CaO 23.28 23.34 23.41 23.37 23.31 22.91 23.04 22.82 23.52 23.20 24.20 23.10 Na2O 0.00 0.01 0.00 0.01 0.02 0.01 0.02 0.00 0.00 0.02 0.00 0.00SrO 0.06 0.03 0.07 0.00 0.09 0.14 0.05 0.25 0.01 0.11 0.00 0.07K2O 0.01 0.01 0.00 0.00 0.01 0.00 0.01 0.00 0.01 0.00 0.01 0.01Total 98.50 98.16 98.96 98.27 98.25 98.52 98.10 98.12 98.14 98.37 98.69 98.67
Based on the 12,5 oxygen atoms Si 3.218 3.183 3.212 3.215 3.203 3.181 3.206 3.187 3.228 3.199 3.292 3.215 Ti 0.000 0.000 0.000 0.000 0.001 0.000 0.002 0.000 0.001 0.003 0.000 0.000 Al 1.224 1.122 1.171 1.231 1.208 1.136 1.263 1.166 1.266 1.211 1.530 1.194
Fe3+ 0.396 0.467 0.445 0.391 0.408 0.481 0.375 0.445 0.350 0.413 0.149 0.430 Mn 0.016 0.008 0.008 0.003 0.004 0.006 0.005 0.009 0.008 0.003 0.010 0.010 Mg 0.004 0.000 0.005 0.001 0.001 0.002 0.003 0.001 0.006 0.004 0.022 0.002 Ca 2.114 2.119 2.126 2.122 2.117 2.080 2.092 2.072 2.136 2.107 2.197 2.098 Na 0.000 0.001 0.000 0.001 0.002 0.001 0.001 0.000 0.000 0.002 0.000 0.000 Sr 0.003 0.001 0.004 0.000 0.004 0.007 0.002 0.012 0.000 0.005 0.000 0.004 K 0.000 0.001 0.000 0.000 0.001 0.000 0.000 0.000 0.000 0.000 0.001 0.000
TOTAL 6.98 6.90 6.97 6.96 6.95 6.89 6.95 6.89 7.00 6.95 7.20 6.95Pm 0.99 0.48 0.51 0.19 0.22 0.36 0.31 0.56 0.48 0.19 0.61 0.59Cz 74.80 70.27 72.07 75.77 74.60 69.98 76.88 71.95 77.95 74.44 90.58 73.08 Ep 24.21 29.25 27.42 24.04 25.18 29.65 22.81 27.50 21.58 25.37 8.81 26.33
Pm: Piemontite; Cz; Clinozoisite; Ep: Epidote

165
Table F 6. Microprobe analyses of epidotes. Calculated cation numbers of epidotes on the basis of 12.5 oxygen atoms, using the spreadsheet for mineral formula calculation at https://serc.carleton.edu/.
Analysis (wt%) 57-05-VE1 57-10-FE26 57-10-ME30 57-10-VE31 86-07-VE14 86-07-VE15 86-07-ME16 86-09-VE1 86-09-VE2 86-09-VE7 86-12-VE6 86-12-VE8 376.18 m 68.75 m 461.82 m 478.87 486.95 m
SiO2 37.47 38.16 37.41 37.73 37.78 37.54 38.05 37.91 37.13 37.87 37.40 37.88 TiO2 0.60 0.01 0.15 0.02 0.00 0.04 0.02 0.02 0.00 0.06 0.00 0.07 Al2O3 22.18 25.55 23.10 23.60 24.79 25.07 25.68 26.93 24.03 26.10 22.55 25.73
FeO(total) 14.49 10.78 14.24 13.80 12.17 11.91 11.10 10.14 13.69 10.29 15.61 10.81 MnO 0.04 0.10 0.10 0.08 0.12 0.26 0.12 0.12 0.09 0.15 0.05 0.29 MgO 0.09 0.16 0.02 0.15 0.00 0.02 0.03 0.01 0.00 0.01 0.00 0.03 CaO 23.11 23.65 23.04 23.03 23.28 22.98 23.28 23.63 23.27 23.53 22.95 23.11 Na2O 0.02 0.04 0.04 0.04 0.01 0.01 0.00 0.00 0.01 0.05 0.00 0.03 SrO 0.01 0.00 0.18 0.10 0.00 0.26 0.11 0.13 0.00 0.08 0.10 0.09 K2O 0.00 0.01 0.00 0.00 0.02 0.01 0.01 0.00 0.00 0.01 0.01 0.01 SiO2 98.02 98.48 98.28 98.54 98.17 98.09 98.39 98.89 98.22 98.16 98.67 98.04
Based on the 12.5 oxygen atoms Si 3.176 3.234 3.170 3.198 3.202 3.181 3.225 3.213 3.147 3.209 3.170 3.210 Ti 0.038 0.001 0.009 0.001 0.000 0.002 0.001 0.001 0.000 0.004 0.000 0.004 Al 1.108 1.276 1.154 1.179 1.238 1.252 1.282 1.345 1.200 1.303 1.126 1.285
Fe3+ 0.462 0.344 0.454 0.440 0.388 0.380 0.354 0.323 0.437 0.328 0.498 0.345 Mn 0.003 0.007 0.007 0.005 0.009 0.018 0.008 0.008 0.007 0.011 0.003 0.021 Mg 0.012 0.021 0.002 0.019 0.000 0.002 0.004 0.001 0.000 0.002 0.000 0.004 Ca 2.098 2.148 2.092 2.091 2.114 2.087 2.114 2.146 2.113 2.137 2.084 2.098 Na 0.002 0.003 0.004 0.003 0.001 0.001 0.000 0.000 0.001 0.004 0.000 0.002 Sr 0.000 0.000 0.009 0.005 0.000 0.013 0.005 0.007 0.000 0.004 0.005 0.004 K 0.000 0.001 0.000 0.000 0.001 0.000 0.000 0.000 0.000 0.000 0.001 0.000
TOTAL 6.899 7.034 6.902 6.941 6.952 6.937 6.994 7.044 6.904 7.003 6.886 6.975 Pm 0.19 0.44 0.46 0.34 0.53 1.11 0.51 0.50 0.40 0.67 0.20 1.25 Cz 70.43 78.43 71.43 72.57 75.73 75.87 77.97 80.22 73.03 79.36 69.21 77.86 Ep 29.38 21.13 28.11 27.09 23.74 23.01 21.52 19.29 26.57 19.98 30.59 20.89
Sample code reference: (57-01-VE1); 57-01: analysis from ASK57-01 sample; V: in a vesicle, (M: in matrix; F: in a fracture); E: epidote; 1: analysis number Pm: piemontite; Cz; clinozoisite; Ep: epidote

166
Table F 7. Microprobe analyses of chlorites. Calculated number of cations at the standard of 28 anions, using a spreadsheet at: http://www.open.ac.uk/earth-research/tindle/AGT/AGT_Home_2010/Microprobe-2.html, and based on the nomenclature of chlorites by Deer et al. (2013).
Analysis (wt%)
86-01-VC1*
86-01-VC1
86-01-VC2
86-01-VC3
86-01-VC4
86-01-MC5
86-01-MC6*
86-01-MC7*
86-01-MC8*
86-01-MC9*
57-05-VC2
57-05-VC14
86-12-VC10
86-12-VC11
86-12-VC12
86-12-VC13
370.50 m 376.18 m 486.95 m SiO2 24.71 27.35 27.48 26.99 27.28 26.31 26.47 26.51 27.47 26.92 26.72 28.65 27.82 27.04 28.38 27.47 TiO2 0.19 0.00 0.00 0.00 0.03 0.29 0.26 0.25 0.28 0.59 0.00 0.00 0.00 0.00 0.03 0.01 Al2O3 17.63 19.08 19.67 18.95 19.24 19.16 19.15 18.93 19.93 19.48 16.06 17.38 17.44 17.90 17.32 18.60
FeO(total) 26.49 26.35 26.83 25.07 25.64 25.02 25.38 25.63 26.46 24.20 25.40 24.62 28.41 27.82 27.65 28.01 MnO 0.32 0.38 0.33 0.33 0.35 0.29 0.33 0.32 0.33 0.25 0.26 0.30 0.35 0.36 0.38 0.40 MgO 15.00 15.50 15.77 15.56 15.48 13.66 14.74 15.66 15.12 15.05 14.84 16.63 14.31 14.48 14.31 14.13 CaO 0.28 0.12 0.11 0.15 0.13 0.29 0.30 0.30 0.29 0.53 0.20 0.22 0.16 0.23 0.31 0.24 Na2O 0.04 0.03 0.05 0.05 0.03 0.10 0.02 0.03 0.18 0.09 0.14 0.06 0.00 0.04 0.04 0.06 Cr2O3 0.00 0.00 0.01 0.02 0.01 0.02 0.02 0.00 0.02 0.00 0.04 0.01 0.00 0.00 0.04 0.00 NiO 0.00 0.03 0.01 0.02 0.00 0.02 0.04 0.02 0.01 0.00 0.00 0.04 0.01 0.02 0.04 0.02 Total 84.66 88.84 90.26 87.14 88.19 85.16 86.72 87.65 90.10 87.10 83.66 87.92 88.50 87.89 88.50 88.94
Based on the 36 oxygen atomsSi 5.491 5.711 5.651 5.718 5.717 5.715 5.655 5.611 5.653 5.680 5.946 5.986 5.899 5.771 5.991 5.783 Ti 0.033 0.000 0.000 0.000 0.004 0.048 0.042 0.040 0.043 0.093 0.000 0.000 0.000 0.000 0.004 0.001 Al 4.618 4.696 4.768 4.732 4.752 4.905 4.822 4.723 4.834 4.845 4.213 4.280 4.359 4.503 4.309 4.615 Cr 0.000 0.000 0.001 0.003 0.002 0.003 0.004 0.000 0.004 0.000 0.008 0.002 0.000 0.000 0.006 0.000
Fe3+ 0.000 0.000 0.000 0.000 0.000 0.000 0.000 0.000 0.000 0.000 0.000 0.000 0.000 0.000 0.000 0.000 Fe2+ 4.923 4.602 4.615 4.442 4.494 4.545 4.534 4.537 4.554 4.271 4.727 4.302 5.038 4.966 4.881 4.932 Mn 0.060 0.067 0.058 0.059 0.062 0.052 0.060 0.058 0.057 0.044 0.048 0.053 0.062 0.065 0.069 0.071 Mg 4.969 4.825 4.835 4.914 4.836 4.423 4.694 4.941 4.638 4.734 4.923 5.180 4.523 4.607 4.503 4.434 Ni 0.000 0.006 0.002 0.004 0.000 0.004 0.007 0.003 0.002 0.000 0.000 0.007 0.003 0.003 0.006 0.003 Zn 0.000 0.000 0.000 0.000 0.000 0.000 0.000 0.000 0.000 0.000 0.000 0.000 0.000 0.000 0.000 0.000 Ca 0.066 0.027 0.024 0.033 0.030 0.068 0.069 0.068 0.065 0.119 0.048 0.050 0.036 0.053 0.070 0.055 Na 0.017 0.014 0.020 0.022 0.013 0.041 0.010 0.013 0.072 0.035 0.059 0.025 0.000 0.016 0.017 0.025
Total 20.176 19.947 19.974 19.926 19.909 19.804 19.896 19.993 19.921 19.821 19.973 19.885 19.921 19.985 19.856 19.920 n(Al+Q) 40.02 43.22 43.37 43.77 44.00 46.57 44.72 42.89 45.00 46.02 40.12 41.39 41.20 41.57 41.97 43.20 n(FeT) 29.85 27.72 27.66 26.69 26.97 27.08 27.16 27.34 27.25 25.60 29.33 26.59 30.98 30.31 30.19 29.91 n(Mg) 30.13 29.06 28.97 29.53 29.02 26.35 28.12 29.77 27.75 28.38 30.55 32.02 27.82 28.12 27.85 26.89
Sample code reference: (86-01-VC1); 86-01: analysis from ASK86-01 sample; V: in a vesicle, (M: in matrix); C: chlorite; 1: analysis number. * Analysis in microcrysts.

167
Table F 8. Microprobe analyses of zeolite group minerals. Calculated number of cations in each zeolite (based on the nomenclature of zeolites by Deer et al. 2013), using the spreadsheet for mineral formula calculations at: https://serc.carleton.edu/. Calculated charge balance E%, according to Passaglia (1970) and Deer et al. (2004): E% = 100 × [(Al + Fe3+)–(ΣM+)–2(ΣM2+)]/ [(ΣM+) + 2(ΣM2+)]. H2O component returned by difference from 100% using the total oxide wt.% (Campbell et al., 2016).
Analysis (wt%) 86-01-VZ1 86-01-VZ2 86-01-VZ3 86-01-VZ4 57-05-VZ1 57-05-VZ2 57-05-VZ3 57-05-VZ4 57-10-VZ1 57-10-VZ2 57-10 FZ6 57-10 FZ7 57-10 VZ5
370.50 m 376.18 m 431.60 m SiO2 53.77 53.62 53.48 54.40 58.44 58.75 59.22 57.91 50.26 52.76 55.32 53.90 52.15 Al2O3 21.86 21.44 21.52 20.38 18.02 17.59 18.07 18.67 19.49 20.91 21.22 20.75 22.26
FeO(total) 0.04 0.06 0.00 0.13 0.01 0.04 0.03 0.00 0.00 0.04 0.51 0.30 0.08 MnO 0.02 0.05 0.01 0.00 0.00 0.04 0.00 0.00 0.02 0.00 0.00 0.00 0.05 MgO 0.03 0.00 0.00 0.00 0.00 0.00 0.00 0.03 0.02 0.00 0.00 0.00 0.00 CaO 11.10 10.96 10.37 10.45 8.35 8.71 7.92 8.78 10.39 10.95 10.57 10.40 11.13 Na2O 0.27 0.22 0.33 0.36 1.30 0.94 1.31 1.03 0.15 0.19 0.31 0.31 0.02 BaO 0.00 0.00 0.00 0.00 0.00 0.00 0.00 0.00 0.00 0.03 0.00 0.00 0.00 K2O 0.40 0.41 0.44 0.48 0.31 0.26 0.72 0.50 0.21 0.19 0.26 0.29 0.06 SrO 0.14 0.16 0.04 0.05 0.22 0.30 0.09 0.00 0.19 0.07 0.06 0.06 0.00 Total 87.62 86.91 86.18 86.24 86.65 86.62 87.35 86.91 80.72 85.15 88.25 86.01 85.74 H2O 12.38 13.09 13.82 13.76 13.35 13.38 12.65 13.09 19.28 14.85 11.75 13.99 14.26
Based on the 96 O 96 O 96 O 96 O 72 O 72 O 72 O 72 O 96 O 96 O 96 O 96 O 48 O Si 32.478 32.690 32.839 33.446 28.644 28.934 28.786 28.330 33.045 32.871 33.282 33.246 16.131 Ti 0.000 0.000 0.000 0.000 0.000 0.000 0.000 0.000 0.000 0.000 0.000 0.000 0.000 Al 15.561 15.405 15.574 14.768 10.410 10.210 10.352 10.764 15.103 15.354 15.046 15.084 8.115
Fe2+ 0.018 0.029 0.000 0.067 0.002 0.016 0.012 0.000 0.000 0.021 0.257 0.157 0.020 Mn 0.009 0.025 0.005 0.000 0.000 0.018 0.000 0.000 0.010 0.000 0.000 0.000 0.013 Mg 0.026 0.004 0.000 0.000 0.000 0.000 0.000 0.019 0.019 0.000 0.000 0.000 0.000 Ca 7.183 7.159 6.822 6.884 4.385 4.596 4.125 4.602 7.319 7.309 6.813 6.873 3.689 Na 0.317 0.258 0.388 0.425 1.239 0.893 1.233 0.972 0.190 0.231 0.357 0.366 0.009 Ba 0.000 0.000 0.000 0.000 0.000 0.000 0.000 0.000 0.000 0.008 0.000 0.000 0.000 K 0.312 0.316 0.346 0.375 0.194 0.160 0.443 0.312 0.172 0.153 0.201 0.231 0.023 Sr 0.096 0.114 0.026 0.035 0.125 0.174 0.048 0.000 0.141 0.054 0.043 0.044 0.000
Total 56.000 56.000 56.000 56.000 45.000 45.000 45.000 45.000 56.000 56.000 56.000 56.000 28.000 E% 2.24 2.03 7.92 1.34 -0.40 -3.47 3.41 2.26 -1.43 1.65 7.24 5.61 9.80
Si/Si+Al 0.68 0.68 0.68 0.69 0.73 0.74 0.74 0.72 0.69 0.68 0.69 0.69 0.67 Na/Na+Ca 0.04 0.03 0.05 0.06 0.22 0.16 0.23 0.17 0.03 0.03 0.05 0.05 0.00
Si/Al 2.09 2.12 2.11 2.26 2.75 2.83 2.78 2.63 2.19 2.14 2.21 2.20 1.99 Ca+Mg/Na+K 17.48 19.28 16.47 14.96 3.21 4.31 3.22 4.75 22.13 25.66 17.01 16.76 389.27 Mineral type wairakite wairakite wairakite wairakite stilbite stilbite stilbite stilbite wairakite wairakite wairakite wairakite Laumontite
Sample code reference: (86-01-VZ1); 86-01: analysis from ASK86-01 sample; V: in a vesicle, (F: in fracture); Z: zeolite; 1: analysis number.

168
Table F 8. (Cont.) Microprobe analyses of zeolite group minerals. Calculated number of cations in each zeolite (based on the nomenclature of zeolites by Deer et al. 2013), using the spreadsheet for mineral formula calculations at: https://serc.carleton.edu/. Calculated charge balance E%, according to Passaglia, (1970) and Deer et al., (2004): E% = 100 × [(Al + Fe3+)–(ΣM+)–2(ΣM2+)]/ [(ΣM+) + 2(ΣM2+)]. H2O component returned by difference from 100% using the total oxide wt.% (Campbell et al., 2016).
Analysis (wt%) 86-07-VZ1 86-07-VZ2 86-07-VZ3 86-07-VZ4 86-07-VZ5 86-07-VZ7 86-09-VZ1 86-09-VZ3 86-09-VZ4 86-09-VZ5 86-09-VZ6 86-12-VZ1 86-12-VZ2
461.82 m 478.87 m 124.14 SiO2 54.67 56.93 61.47 62.01 61.33 61.71 54.09 53.87 55.75 55.50 54.67 62.28 62.23 Al2O3 21.09 23.55 17.84 17.56 17.79 17.60 20.67 21.43 21.02 21.37 21.16 16.64 15.53
FeO(total) 0.03 0.09 0.05 0.03 0.08 0.06 0.04 0.06 0.00 0.04 0.00 0.00 0.00 MnO 0.00 0.00 0.02 0.00 0.01 0.00 0.00 0.00 0.00 0.00 0.03 0.00 0.00 MgO 0.03 0.02 0.01 0.00 0.01 0.00 0.01 0.04 0.01 0.00 0.00 0.00 0.02 CaO 10.89 11.88 9.41 9.64 9.01 9.20 10.71 10.42 8.59 9.14 10.11 8.67 8.33 Na2O 0.48 0.07 0.13 0.00 0.12 0.03 0.16 0.29 0.37 0.18 0.26 0.39 0.05 BaO 0.00 0.05 0.01 0.00 0.00 0.00 0.00 0.00 0.04 0.07 0.00 0.00 0.00 K2O 0.34 0.05 0.17 0.04 0.11 0.06 0.36 0.41 3.05 2.59 0.90 0.06 0.04 SrO 0.06 0.00 0.00 0.05 0.12 0.02 0.00 0.00 0.06 0.00 0.02 0.00 0.10 Total 87.60 92.64 89.11 89.33 88.58 88.68 86.04 86.52 88.88 88.90 87.16 88.04 86.30 H2O 12.41 7.36 10.89 10.67 11.42 11.32 13.96 13.48 11.12 11.10 12.84 11.96 13.70
Based on the 96 O 48O 32O 32O 32O 32O 96 O 96 O 24 O 24 O 24 O 72 O 72 O Si 33.025 16.30 11.883 11.981 11.928 12.005 33.379 32.974 14.170 14.140 14.238 37.902 38.825 Al 15.015 7.951 4.064 3.999 4.078 4.035 15.033 15.460 6.297 6.417 6.495 11.935 11.419
Fe2+ 0.017 0.024 0.008 0.005 0.013 0.009 0.023 0.033 0.000 0.010 0.000 30.457 31.199 Mn 0.000 0.000 0.003 0.000 0.002 0.000 0.000 0.000 0.000 0.000 0.006 0.000 0.000 Mg 0.028 0.008 0.004 0.000 0.003 0.000 0.008 0.038 0.003 0.002 0.000 9.591 9.176 Ca 7.048 3.646 1.949 1.996 1.878 1.918 7.081 6.834 2.339 2.495 2.821Na 0.566 0.038 0.047 0.000 0.043 0.012 0.195 0.346 0.181 0.090 0.132 0.000 0.000 Ba 0.000 0.005 0.001 0.000 0.000 0.000 0.000 0.000 0.003 0.005 0.000 0.000 0.000 K 0.258 0.019 0.041 0.009 0.028 0.015 0.281 0.317 0.989 0.842 0.300 0.000 0.016 Sr 0.043 0.000 0.000 0.011 0.027 0.005 0.000 0.000 0.018 0.000 0.007 4.543 4.474
Total 56.000 28.000 18.000 18.000 18.000 18.000 56.000 56.000 24.000 24.000 24.000 94.426 95.110 E% -0.21 8.12 1.90 -0.44 5.21 4.43 2.74 7.55 6.77 8.26 6.66 0.00 0.00
Si/Si+Al 0.69 0.67 0.75 0.75 0.75 0.75 0.69 0.68 0.69 0.69 0.69 0.04 0.03 Na/Na+Ca 0.07 0.01 0.02 0.00 0.02 0.01 0.03 0.05 0.07 0.03 0.04 0.00 0.06
Si/Al 2.20 2.05 2.92 3.00 2.93 2.98 2.22 2.13 2.25 2.20 2.19 3.18 3.40 Ca+Mg/Na+K 11.61 96.19 41.39 183.63 26.57 107.00 36.42 19.86 11.75 27.85 20.22 12.19 41.28 Mineral Type wairakite laumontite yugawaralite yugawaralite yugawaralite yugawaralite wairakite wairakite chabazite chabazite chabazite stellerite stellerite
Sample code reference: (86-01-VZ1); 86-01: analysis from ASK86-01 sample; V: in a vesicle, (F: in fracture); Z: zeolite; 1: analysis number.

169
Table F 9. Microprobe analyses (normalized) of magnetite and ilmenite. Calculated cation numbers of magnetite and ilmenite on the basis of 4 oxygen atoms (spinel group), using the spreadsheet for mineral formula calculation at https://serc.carleton.edu/.
Analysis
(wt%)
57-10-O1
57-10-O2
57-10-O3
57-10-O4
57-10-O5
57-10-O6
86-07-O7
86-07-O8
86-07-O9
86-07-O10
86-09-O11
86-09-O12
86-09-O13
86-12-O8
86-12-O9
86-12-O2
86-12-O3
86-12-O5
86-12-O10
431.60 m 461.82 m 478.87 m 486.95 m Magnetite Ilmenite
SiO2 2.68 0.44 3.11 0.44 2.31 2.86 0.89 0.66 0.84 0.68 0.89 0.62 0.62 0.99 1.17 0.12 0.13 0.11 0.08 TiO2 0.52 0.49 0.29 0.64 0.62 0.31 3.09 2.48 2.51 0.26 1.83 2.48 1.69 0.11 0.16 50.14 50.59 50.84 51.84 Al2O3 1.27 0.34 1.00 2.50 0.95 0.95 0.16 0.13 0.17 0.58 0.45 0.40 0.36 0.24 0.27 0.02 0.02 0.01 0.09 Cr2O3 0.05 0.05 0.00 0.07 0.01 0.04 0.01 0.03 0.01 0.00 0.05 0.10 0.09 0.01 0.04 0.01 0.03 0.00 0.04 Fe2O3 57.11 64.09 56.90 59.01 57.48 57.68 57.92 60.30 59.66 56.43 60.54 60.21 61.50 64.36 63.04 0.00 0.00 0.00 0.00 FeO 33.78 30.99 33.95 30.52 32.89 33.76 33.75 33.17 33.44 27.68 32.86 33.22 32.37 31.65 31.59 44.59 44.77 44.63 41.85 MnO 0.10 0.05 0.08 0.06 0.08 0.09 0.05 0.09 0.05 0.03 0.08 0.08 0.08 0.02 0.04 2.46 2.20 2.41 4.16 MgO 0.09 0.03 0.19 0.07 0.13 0.15 0.04 0.01 0.02 0.13 0.06 0.08 0.07 0.04 0.04 0.11 0.13 0.08 0.12 V2O3 0.26 0.17 0.20 0.34 0.15 0.18 0.10 0.06 0.06 0.10 0.09 0.20 0.18 0.14 0.12 0.34 0.36 0.58 0.32 NiO 0.03 0.03 0.00 0.02 0.03 0.02 0.02 0.03 0.00 0.01 0.00 0.01 0.01 0.00 0.00 0.00 0.00 0.00 0.03 Total 95.89 96.67 95.73 93.67 94.64 96.02 96.04 96.95 96.76 85.91 96.85 97.41 96.97 97.56 96.45 97.78 98.22 98.66 98.52
Element (wt%)Ti 0.31 0.30 0.18 0.38 0.37 0.19 1.85 1.49 1.50 0.16 1.10 1.48 1.01 0.07 0.09 30.06 30.33 30.48 31.08 Ni 0.02 0.02 0.00 0.01 0.02 0.01 0.02 0.02 0.00 0.01 0.00 0.01 0.01 0.00 0.00 0.00 0.00 0.00 0.02 Cr 0.03 0.03 0.00 0.05 0.00 0.03 0.01 0.02 0.01 0.00 0.03 0.07 0.06 0.01 0.03 0.00 0.02 0.00 0.02 V 0.18 0.11 0.13 0.23 0.10 0.12 0.07 0.04 0.04 0.07 0.06 0.14 0.12 0.09 0.08 0.23 0.24 0.39 0.22 Al 0.67 0.18 0.53 1.32 0.50 0.50 0.08 0.07 0.09 0.31 0.24 0.21 0.19 0.13 0.14 0.01 0.01 0.01 0.05 Mn 0.07 0.04 0.07 0.05 0.07 0.07 0.04 0.07 0.04 0.03 0.06 0.07 0.06 0.02 0.03 1.90 1.70 1.86 3.22 Fe2+ 26.26 24.09 26.39 23.72 25.57 26.24 26.24 25.78 25.99 21.52 25.54 25.82 25.16 24.60 24.56 34.66 34.80 34.69 32.53 Fe3+ 39.95 44.83 39.80 41.27 40.20 40.34 40.51 42.17 41.73 39.47 42.35 42.11 43.01 45.02 44.09 0.00 0.00 0.00 0.00 Mg 0.06 0.02 0.11 0.04 0.08 0.09 0.02 0.01 0.01 0.08 0.04 0.05 0.04 0.03 0.02 0.07 0.08 0.05 0.07 FeT 66.21 68.91 66.19 64.99 65.77 66.58 66.75 67.95 67.72 60.99 67.89 67.94 68.17 69.62 68.65 34.66 34.80 34.69 32.53
Based on 4 oxygen atomsSi 0.105 0.017 0.122 0.018 0.092 0.112 0.035 0.026 0.033 0.030 0.035 0.024 0.025 0.039 0.046 0.004 0.005 0.004 0.003 Ti 0.015 0.015 0.009 0.019 0.019 0.009 0.092 0.074 0.075 0.009 0.054 0.073 0.050 0.003 0.005 1.456 1.463 1.465 1.496 Al 0.059 0.016 0.046 0.119 0.045 0.044 0.007 0.006 0.008 0.031 0.021 0.018 0.017 0.011 0.013 0.001 0.001 0.001 0.004 Cr 0.002 0.001 0.000 0.002 0.000 0.001 0.000 0.001 0.000 0.000 0.001 0.003 0.003 0.000 0.001 0.000 0.001 0.000 0.001
Fe3+ 1.690 1.913 1.685 1.793 1.729 1.706 1.734 1.792 1.774 1.887 1.796 1.777 1.825 1.900 1.881 0.000 0.000 0.000 0.000 Fe2+ 1.111 1.028 1.117 1.030 1.099 1.110 1.123 1.095 1.105 1.029 1.083 1.090 1.068 1.039 1.047 1.441 1.440 1.430 1.343 Mn 0.003 0.002 0.003 0.002 0.003 0.003 0.002 0.003 0.002 0.001 0.003 0.003 0.003 0.001 0.001 0.080 0.072 0.078 0.135 Mg 0.006 0.002 0.011 0.004 0.008 0.009 0.002 0.001 0.001 0.009 0.004 0.005 0.004 0.003 0.002 0.006 0.007 0.004 0.007 V 0.008 0.005 0.006 0.011 0.005 0.006 0.003 0.002 0.002 0.003 0.003 0.006 0.006 0.004 0.004 0.011 0.011 0.018 0.010 Ni 0.001 0.001 0.000 0.000 0.001 0.001 0.001 0.001 0.000 0.000 0.000 0.000 0.000 0.000 0.000 0.000 0.000 0.000 0.001
V/Ti 0.57 0.38 0.77 0.60 0.28 0.66 0.04 0.03 0.03 0.42 0.06 0.09 0.12 1.43 0.84 FeT 70.66 73.91 70.63 69.60 70.25 71.08 71.27 72.66 72.38 65.39 72.61 72.63 72.97 74.64 73.57

170
Table F 10. Microprobe analyses of titanite. Calculated cation numbers of titanite on the basis of 5 oxygen atoms, using the spreadsheet for mineral formula calculation at https://serc.carleton.edu/.
Analysis (wt%) 57-05-MT9 56-10-T9 56-10-T10 56-10-T11 56-10-T12 86-07-T1 86-07-T2 86-07-T3 86-07-T6 86-07-MT7 86-09-T13 86-12-T2 86-12-T3 86-12-T4 376.18 m 431.60 m 461.82 478.87 486.95
SiO2 30.36 31.73 31.21 31.21 31.80 27.93 29.93 30.70 28.96 30.91 28.20 30.61 30.71 31.14 TiO2 35.25 32.32 36.13 31.10 33.11 28.55 30.19 30.47 28.20 30.76 34.97 31.03 31.45 29.26 Al2O3 1.48 3.50 1.94 4.37 3.11 4.51 4.33 4.04 4.25 4.36 2.32 3.81 3.79 4.73
FeO(total) 2.58 2.15 1.14 1.86 5.89 2.73 2.62 2.38 3.23 2.39 5.38 2.39 2.50 3.26 MnO 0.03 0.03 0.04 0.01 0.31 0.04 0.04 0.01 0.00 0.00 0.31 0.04 0.04 0.02 MgO 0.13 0.01 0.02 0.04 0.36 0.65 0.37 0.03 0.15 0.00 0.13 0.08 0.09 0.03 CaO 27.45 27.95 26.62 26.64 23.72 25.39 26.44 27.44 26.16 28.39 24.75 26.77 27.04 27.81 Na2O 0.05 0.02 0.06 0.50 0.29 0.11 0.22 0.03 0.17 0.01 0.18 0.03 0.02 0.02 NiO 0.00 0.00 0.03 0.00 0.00 0.00 0.02 0.00 0.02 0.02 0.01 0.00 0.00 0.00 K2O 0.04 0.06 0.03 0.04 0.03 0.09 0.14 0.02 0.14 0.01 0.04 0.02 0.01 0.02
Cr2O3 0.00 0.03 0.07 0.00 0.04 0.00 0.00 0.01 0.04 0.04 0.00 0.05 0.07 0.01 F 0.93 0.77 1.64 3.33 2.15 0.81 1.82 0.79 1.17 0.61 1.29 0.77 1.04 1.28 Cl 0.07 0.01 0.01 0.03 0.03 0.06 0.15 0.00 0.10 0.00 0.03 0.01 0.01 0.00
Total 98.37 98.58 98.95 99.13 100.84 90.87 96.28 95.94 92.59 97.51 97.61 95.61 96.76 97.57 Based on the 5 oxygen atoms
Si 1.006 1.034 1.035 1.030 1.036 0.980 1.004 1.024 1.002 1.011 0.949 1.027 1.022 1.022 Ti 0.878 0.792 0.901 0.772 0.811 0.753 0.761 0.764 0.734 0.757 0.885 0.783 0.787 0.723 Al 0.058 0.134 0.076 0.170 0.119 0.186 0.171 0.159 0.173 0.168 0.092 0.151 0.149 0.183
Fe3+ 0.179 0.218 0.054 0.262 0.207 0.359 0.319 0.267 0.371 0.295 0.251 0.230 0.233 0.329 Mn 0.001 0.001 0.001 0.000 0.009 0.001 0.001 0.000 0.000 0.000 0.009 0.001 0.001 0.000 Mg 0.006 0.001 0.001 0.002 0.017 0.034 0.019 0.002 0.008 0.000 0.006 0.004 0.004 0.001 Ca 0.974 0.976 0.946 0.942 0.828 0.954 0.950 0.981 0.970 0.995 0.893 0.962 0.964 0.978 Na 0.003 0.002 0.004 0.032 0.018 0.007 0.014 0.002 0.012 0.001 0.012 0.002 0.001 0.001 Ni 0.000 0.000 0.001 0.000 0.000 0.000 0.001 0.000 0.001 0.000 0.000 0.000 0.000 0.000 K 0.002 0.002 0.001 0.002 0.001 0.004 0.006 0.001 0.006 0.000 0.002 0.001 0.001 0.001 Cr 0.000 0.001 0.002 0.000 0.001 0.000 0.000 0.000 0.001 0.001 0.000 0.001 0.002 0.000 F 0.098 0.079 0.172 0.348 0.222 0.090 0.193 0.084 0.128 0.063 0.137 0.081 0.109 0.133 Cl 0.004 0.000 0.001 0.002 0.002 0.004 0.009 0.000 0.006 0.000 0.002 0.000 0.000 0.000
Total 3.102 3.080 3.173 3.349 3.223 3.094 3.202 3.084 3.134 3.063 3.139 3.082 3.110 3.133 XTtn 0.90 0.91 0.84 0.69 0.78 0.89 0.79 0.90 0.85 0.92 0.86 0.91 0.88 0.84 Ttn: titanite

171
Table F 11. Microprobe analyses of calcite in fractures and vesicles. Calculated cation numbers of calcite on the basis of 6 oxygen atoms, using the spreadsheet for mineral formula calculation at https://serc.carleton.edu/.
Analysis (wt%)
57-10-Cal10
57-10-Cal11
57-10-Cal12 86-09-Cal1 86-09-Cal2 86-09-Cal3 86-09-Cal4 86-09-Cal5 86-09-Cal6 86-09-Cal7 86-09-Cal8 86-09-Cal9
431.60 m 478.87 m FeO(total) 0.00 0.00 0.05 0.06 0.01 0.01 0.00 0.03 0.21 0.07 0.30 0.17
MnO 0.04 0.04 0.02 0.08 0.11 0.24 0.01 0.21 0.15 0.10 0.53 0.41MgO 0.01 0.00 0.07 0.00 0.00 0.00 0.00 0.00 0.02 0.02 0.04 0.03CaO 57.36 57.67 56.68 58.39 55.58 54.80 56.15 56.80 54.07 47.11 54.25 56.52 SrO 0.02 0.00 0.09 0.00 0.00 0.03 0.00 0.00 0.00 0.00 0.00 0.02BaO 0.00 0.00 0.02 0.00 0.02 0.07 0.03 0.00 0.02 0.00 0.01 0.03CO2 42.58 42.29 43.08 41.47 44.28 44.87 43.81 42.97 45.52 52.70 44.87 42.83 Total 100.005 99.999 99.997 99.999 99.997 100.009 100.004 100.002 100.000 99.998 100.001 100.009
Based on the 6 oxygen atomsFe(total) 0.000 0.000 0.001 0.002 0.000 0.000 0.000 0.001 0.006 0.002 0.008 0.005
Mn 0.001 0.001 0.000 0.002 0.003 0.007 0.000 0.006 0.004 0.003 0.015 0.012 Mg 0.000 0.000 0.003 0.000 0.000 0.000 0.000 0.000 0.001 0.001 0.002 0.001 Ca 2.074 2.091 2.040 2.134 1.979 1.941 2.007 2.047 1.904 1.557 1.922 2.041 Sr 0.000 0.000 0.002 0.000 0.000 0.001 0.000 0.000 0.000 0.000 0.000 0.000 Ba 0.000 0.000 0.000 0.000 0.000 0.001 0.000 0.000 0.000 0.000 0.000 0.000
CO2 1.962 1.954 1.976 1.931 2.009 2.025 1.996 1.973 2.042 2.219 2.026 1.970 XMnCO3 0.05 0.05 0.02 0.11 0.15 0.34 0.02 0.29 0.22 0.16 0.76 0.56XCaCO3 99.91 99.94 99.65 99.81 99.82 99.58 99.96 99.68 99.40 99.66 98.70 99.09 XMgCO3 0.01 0.01 0.16 0.00 0.00 0.00 0.00 0.00 0.06 0.06 0.10 0.07XFeCO3 0.00 0.00 0.07 0.08 0.02 0.01 0.00 0.03 0.30 0.11 0.43 0.24


173
Appendix G Figure G 1. Concentration of geopetal structures in the ASK86 core section from 462.43to 463.33m depth. (B, C and D) Geopetal structures showing clay-texture-chlorite in the base and well-developed crystals of epidote (Ep), chlorite (Chl) and zeolite (Zeo) in the top of the vesicles; (B) ASK86 core section from 445.29m to 445.71m depth; (C) Photograph by steremicroscope from ASK86-10 sample at 116.54m depth; (D) Backscattered electron image from ASK86-07 sample at 463.02m depth. (A, A’ and B are images shared by Friðleifsson, G.Ó)

174
Figure G 2. Paragenesis and crystallization sequences of the secondary minerals in the Hoffell/Miðfell cores from the wells ASK57 and ASK86.