Mal J Nutr 25 (Supplement) - Nutrition Society of Malaysia
147
Mal J Nutr 25 (Supplement): 000-000, 2019
-
Upload
khangminh22 -
Category
Documents
-
view
2 -
download
0
Transcript of Mal J Nutr 25 (Supplement) - Nutrition Society of Malaysia

Mal J Nutr 25 (Supplement): 000-000, 2019

MALAYSIAN JOURNAL OF NUTRITIONPeer-reviewed Journal of the Nutrition Society of Malaysia
(http//www.nutriweb.org.my)
EDITOR-IN-CHIEFTee E Siong, PhD
President, Nutrition Society of Malaysia
EDITORIAL BOARDDr Imelda Angeles-Agdeppa
(Food and Nutrition Research Institute, Philippines)
Assoc Prof Dr Hamid Jan Bin Mohd Jan(Universiti Sains Malaysia)
Assoc Prof Dr Hazizi Abu Saad(Universiti Putra Malaysia)
Emeritus Prof Dr Khor Geok Lin(Universiti Putra Malaysia)
Prof Dr Moy Foong Ming(University of Malaya)
Assoc Prof Dr Pattanee Winichagoon(Mahidol University, Thailand)
Prof Dr Poh Bee Koon(Universiti Kebangsaan Malaysia)
Dr Sangeetha Shyam(International Medical University, Malaysia)
Prof Dr Suzana Shahar(Universiti Kebangsaan Malaysia)
Dr Umi Fahmida(SEAMEO Regional Centre for Food and Nutrition, Indonesia)
Prof Dr Zalilah Mohd Shariff(Universiti Putra Malaysia)
ADVISORY PANELDr Azza Gohar (National Nutrition Institute, Egypt)
Prof Cecilia Florencio (University of The Philippines, Diliman)
Prof Dr JC Henry (Singapore Institute for Clinical Sciences)
Dr Le Thi Hop (National Institute of Nutrition, Vietnam)
Assoc Prof Dr Majid Karandish (Ahwaz University of Medical Science,
Iran)
Prof Reynaldo Martorell (Emory University, United States of
America)
Dr V Prakash (Central Food Technological Research
Institute, India)
Dr Siti Muslimatun (Indonesia International Institute for Life
Sciences)
Prof Mark L Wahlqvist (Monash University, Australia & National
Health Research Institute, Taiwan)
The Journal•Serves as a forum for the sharing of research findings and information across broad areas
in nutrition.•Publishes original research reports, topical article reviews, book reviews, case reports, short
communications, invited editorials and letters to the editor.•Welcomes articles in nutrition and related fields such as dietetics, food science, biotechnology,
public health and anthropology.

Malaysian Journal of NutritionVol. 25 Supplement, 2019
Contents
Invited EditorialGuest EditorDr Jane Willcox, La Trobe University, Victoria, Australia
Sv
Dietary diversity beliefs and practices among working mothers in Jakarta: a qualitative study Aria Kekalih, Judhiastuty Februhartanty, Muchtaruddin Mansyur & Anuraj Shankar
S1
Comparing intake adequacy and dietary diversity between adolescent schoolgirls with normal nutritional status (NG) and undernutrition (UG) based on BMI-for-age (BAZ) living in urban slums in Central JakartaRika Rachmalina, Helda Khusun, Luluk Basri Salim, Luh Ade Ari Wiradnyani & Drupadi HS Dillon
S19
Food purchasing behaviour among urban slum women in East Jakarta: a qualitative studyDian Sufyan, Judhiastuty Februhartanty, Saptawati Bardosono, Helda Khusun, Evi Ermayani, Purnawati Hustina Rachman & Anthony Worsley
S33
Exposure and approval of food marketing strategies: a mixed methods study among household food providers in JakartaSelma Avianty, Helda Khusun, Saptawati Bardosono, Judhiastuty Februhartanty & Anthony Worsley
S47
Association between food marketing exposure and consumption of confectioneries among pre-school children in JakartaMaria Meilan Y Fernandez, Judhiastuty Februhartanty & Saptawati Bardosono
S63
Eating behaviour of young female workers with low socioeconomic status in Malang City, East Java: a qualitative study Intan Yusuf Habibie, Inge Brouwer & Judhiastuty Februhartanty
S75
Eating behaviour of adolescent schoolgirls in Malang, East Java: a qualitative studyMulia Sondari, Inge Brouwer & Judhiastuty Februhartanty
S87

Perceptions of the causes of obesity among normal weight, overweight and obese Indonesian women: a mixed methods approachIsmi Irfiyanti Fachruddin, Judhiastuty Februhartanty, Saptawati Bardosono, Helda Khusun & Anthony Worsley
S97
A qualitative study comparing the coping strategies between food secure and food insecure households of Kaluppini indigenous people in South SulawesiNurbaya, Aria Kekalih & Judhiastuty Februhartanty
S111
Early development process of drama and storytelling scripts as media for nutrition education on balanced diets among elementary school childrenSuci Destriatania, Fenny Etrawati & Judhiastuty Februhartanty
S123
Acknowledgements S139

Mal J Nutr 25 (Supplement): v-viii, 2019
Invited Editorial
Indonesian nutrition research: A varied and active area of scholarship
Dedicating the current journal supplement to Indonesian nutrition research illustrates the emerging liveliness of nutrition focused interest and scholarship in the region. Indonesia, like other low – middle income countries is immersed in a nutrition transition, reflected by changes in the diversification and health of dietary patterns across populations (Lipoeto et al., 2004; Popkin, 2006a). In developing countries this transition is driven by economic development, urbanisation and globalisation, along with changes to the food supply and the increasing dominance of multinational food companies (Moodie et al., 2013; Popkin, 2002, 2006b). The double burden of malnutrition sees increasing symptoms of overnutrition, obesity and non-communicable diseases, occurring alongside the prevailing symptoms of undernutrition, protein-energy malnutrition and micronutrient deficiencies (Popkin, 2006a). This transition, and the subsequent consequences, pose new population health challenges for policy makers. Thoughtful research is required to direct public health policy and interventions to tackle the consequences of nutrition transition. Indonesian scientists face many challenges to research and international publication (Teixeira da Silva & Winarto, 2013) and more opportunities for them to inform the body of nutrition transition work are required and welcome.
The papers in this special issue highlight many of the health and nutritional issues facing at-risk populations in Indonesia, including indigenous and rural populations and the urban poor. Consistent with the nutrition transition in which Indonesia finds itself, there are studies that examine food insecurity and undernutrition and those that focus on obesity. The nutrition topics range from food purchasing and dietary practices to approval of food marketing to integrating nutrition messages into educational storytelling. The inclusion of a number of papers utilising qualitative methodology allows a deeper dive into recording communities attitudes and behaviours. The results should be welcomed by policy makers providing pointers for targeted preventive approaches in at-risk communities.
Low-income and indigenous communities commonly shoulder a major burden of malnutrition (Müller & Krawinkel, 2005; Toyama et al., 2001). Understanding how resilient individuals and communities cope and manage food insecurity is crucial to allow policy makers to reinforce and encourage strategies to mitigate malnutrition (Davies, 2016). In this issue, Nurbaya and colleagues qualitatively compare the coping tactics of food secure and insecure households with young children of the Kaluppini indigenous people in South Sulawesi (Nurbaya, Kekalih & Februhartanty, 2019). Both food secure and insecure households reported making dietary changes, such as reducing consumption or substituting foods, borrowing food or money, and engaging in traditional coping strategies, such as food sharing. A difference highlighted between the two groups was the capacity for members of the food secure households to travel outside the village to other islands or internationally to generate income. While signifying an adaptable livelihood, the loss of family members to outside work has family and community repercussions. The authors identify the need for appropriate food and agriculture programmes such as home gardens. Importantly,

vi
more work is required to develop cultural stability and adaptive capacity to allow communities to respond to the variability of food supply.
In a different community, the food purchasing behaviour of women dwelling in urban slums in East Jakarta was investigated by Sufyan and colleagues (2019). Paralleling the previous study, women’s food acquisition was influenced by multiple environmental factors. These included food accessibility and convenience, family pressures, time availability, cost efficiency, and food store marketing tactics. The researchers found that most women, who were responsible for their family food provision, purchased ready-to-eat foods rather than cooking them at home, for either their family or themselves. These energy-dense, nutrient-poor meals, available at the local store, were signalled by the researchers as potential contributors to obesity. The vulnerability of urban slum dwellers to restricted dietary diversity, including more convenience and less whole foods, is supported by others’ work in urban slums. Kimani-Murage and colleagues (2014) noted that complex nature of chronic poverty and the high levels of food insecurity in urban slum settings in Nairobi, Kenya, often engendered the use of coping strategies that negatively impacted on health. Sufyan and colleagues (2019) provide a detailed account of food acquisition within the context of an urban slum setting and highlights the complex web of factors contributing to nutrition related health. Broad community, academic and policy player engagement will be required to transform the local and international evidence and experience into sustainable action at the local level.
Food marketing and communication in low-middle income countries is influential in food purchasing and consumption (Hastings et al., 2003). This marketing influences consumers to purchase more highly processed energy-dense, low-nutrient food (Hastings et al., 2003) and has had significant impact in areas such as breast milk substitutes (Vinje et al., 2017). The theme of food marketing is seen in two of the studies in this issue (Avianty et al., 2019; Fernandez, Februhartanty & Bardosono, 2019) and emerges in other research on the influences on food choice, consumption and obesity. The debate about ways to restrict food marketing continues to rage internationally with a specific focus on advertising of unhealthy food to children (Matthews, 2007). In this issue, Avianty and colleagues (2019) report that the majority of Indonesian primary household food providers (n=279) did not approve of the marketing of “fast” foods and those high in sugar. Importantly, more than 60% of participants disapproved of in-school vending machines stocked with these foods as well as the advertising of them on television and radio. This is consistent with consumer and public interest groups in other countries who support food marketing restrictions (Matthews, 2007). However, in Avianty et al.’s study while participants supported the advertising of fruit, vegetables and water, they were more ambivalent about marketing in schools. Concerningly, more than half (64.5%) approved of food companies selling high sugar and “fast” foods providing nutrition education in schools or on television. Schools provide a strong channel for food companies through their sponsorship of school events, provision of educational or sporting equipment and stocking nutrient poor foods and drinks in canteens and vending machines. While the reduction of food marketing exposure is undoubtedly required as part of an overall strategy to improve nutrition for children, Indonesian policy makers will be challenged by the influence of the powerful multinational food companies. The research also suggests a need for government measures to counteract negative marketing in order to swing the ambivalent consumers towards health.

vii
The challenges of nutrition transition are exceedingly varied and complex, as are the health policies and programmes required to moderate its negative health and community impacts. The studies in this issue contribute to the field and provide a rich story of the role nutrition within different community contexts. In order to reduce the negative health impacts of nutrition transition, strong and evolving endeavours are required in health and nutrition policy and promotion. Each research paper in this issue provides pointers for potential solutions and could contribute to a road map for policy makers.
We are indebted to Professor Khor, all the reviewers and the technical team of the Malaysian Journal of Nutrition, for working with Indonesian researchers to grow the voice for Indonesian nutrition.
Jane Willcox PhDGuest EditorSchool of Allied Health, Human Services and Sport, La Trobe University, Victoria, Australia
References
Avianty S, Khusun H, Bardosono S, Februhartanty J & Worsley A (2019). Exposure and approval of food marketing strategies: a mixed methods study among household food providers in Jakarta. Mal J Nutr 25(Supplement):47-62.
Davies S (2016). Adaptable livelihoods: Coping with food insecurity in the Malian Sahel: Springer.
Fernandez MMY, Februhartanty J & Bardosono S (2019). Association between food marketing exposure and consumption of confectioneries among pre-school children in Jakarta. Mal J Nutr 25(Supplement):63-73.
Hastings G, Stead M, McDermott L, Forsyth A, MacKintosh AM, Rayner M & Angus K (2003). Review of research on the effects of food promotion to children. London: Food Standards Agency.
Kimani-Murage EW, Schofield L, Wekesah F, Mohamed S, Mberu B, Ettarh R & Ezeh A (2014). Vulnerability to food insecurity in urban slums: Experiences from Nairobi, Kenya. J Urban Health 91(6):1098-1113.
Lipoeto NI, Wattanapenpaiboon N, Malik A & Wahlqvist ML (2004). Nutrition transition in west Sumatra, Indonesia. Asia Pac J Clin Nutr 13(3):312-6.
Matthews AE (2007). Children and obesity: a pan-European project examining the role of food marketing. Eur J Public Health 18(1):7-11.
Moodie R, Stuckler D, Monteiro C, Sheron N, Neal B, Thamarangsi T & Group LNA (2013). Profits and pandemics: prevention of harmful effects of tobacco, alcohol, and ultra-processed food and drink industries. Lancet 381(9867):670-679.
Müller O & Krawinkel M (2005). Malnutrition and health in developing countries. CMAJ 173(3):279-286.
Nurbaya, Kekalih A & Februhartanty J (2019). A qualitative study comparing the coping strategies between food secure and food insecure households of Kaluppini indigenous people in South Sulawesi. Mal J Nutr 25(Supplement):111-122.
Popkin BM (2002). An overview of the nutrition transition and its health implications: the Bellagio meeting. Public Health Nutr 5:93-103.
Popkin BM (2006a). Global nutrition dynamics: the world is shifting rapidly toward a diet linked with noncommunicable diseases. Am J Clin Nutr 84(2):289-298.
Popkin BM (2006b). Technology, transport, globalization and the nutrition transition food policy. Food Policy 31(6):554-569.

viii
Sufyan D, Februhartanty J, Bardosono S, Khusun H, Ermayani E, Rachman PH & Worsley A (2019). Food purchasing behaviours among urban slum women in East Jakarta: a qualitative study. Mal J Nutr 25(Supplement):33-46.
Teixeira da Silva J & Winarto B. (2013). Challenges to science development and international publishing in Indonesia. Asian and Australasian Journal of Plant Science and Biotechnology 7 (Special Issue 1):46-56.
Toyama N, Wakai S, Nakamura Y & Arifin A (2001). Mother’s working status and nutritional status of children under the age of 5 in urban low-income community, Surabaya, Indonesia. J Trop Pediatr 47(3):179-181.
Vinje KH, Phan LTH, Nguyen TT, Henjum S, Ribe LO & Mathisen R (2017). Media audit reveals inappropriate promotion of products under the scope of the International Code of Marketing of Breast-milk Substitutes in South-East Asia. Public Health Nutr 20(8):1333-1342.

Mal J Nutr 25 (Supplement): 1-17, 2019
__________________________
*Corresponding author: Aria Kekalih, MD, MIT, PhDDepartment of Community Medicine, Faculty of Medicine, Universitas IndonesiaJl. Pegangsaan Timur No.16, 10430, Central Jakarta, IndonesiaTel: +6221 3141066; Cellular phone: +628129984449Email: [email protected] or [email protected]
Dietary diversity beliefs and practices among working mothers in Jakarta: a qualitative study
Aria Kekalih1,2,3*, Judhiastuty Februhartanty2, Muchtaruddin Mansyur3 & Anuraj Shankar4
1Department of Nutrition, Faculty of Medicine Universitas Indonesia, Indonesia; 2South East Asian Ministers of Education Organization Regional Centre for Food and Nutrition (SEAMEO RECFON)/Pusat Kajian Gizi Regional (PKGR) Universitas Indonesia, Jakarta, Indonesia; 3Department of Community Medicine, Faculty of Medicine Universitas Indonesia, Indonesia; 4Harvard T.H. Chan School of Public Health, USA
ABSTRACT
Introduction: Dietary diversity is a global challenge in complementary feeding. Despite more women joining the workforce in developing countries, there are limited studies on the beliefs of working mothers and their experiences in relation to the provision of dietary diversity as recommended by the World Health Organization. Methods: This qualitative study explored the behavioural, normative and control beliefs of working mothers on dietary diversity practices, based on the Theory of Planned Behaviour (TPB). A total of 25 mothers of different occupational levels were recruited from workplaces in Jakarta. Results: Working mothers at the lower occupational levels showed a lack of understanding of the importance of dietary diversity and reported poor practices. These included the late introduction of animal protein as a food source, and few types of feeding instant foods. Due to their limited knowledge of nutrition, these working mothers tended to accept poor dietary diversity practices as normal. Conclusion: Working mothers at the lower occupational levels practised poor dietary diversity owing to work-related factors. Efforts should be undertaken to provide correct nutritional information related to complementary feeding at workplaces, especially to working mothers in the unskilled occupations.
Keywords: Child-feeding, working mothers, unskilled labour, qualitative study, Indonesia, dietary diversity
INTRODUCTION
Dietary diversity has been described as the number of different food groups consumed over a given reference period (Ruel, 2003). It is an important indicator of infant and young child feeding (IYCF) practices for children aged 6-24 months (WHO, 2008). Dietary diversity has
been reported to be associated with height-for-age z-scores (HAZ) of young children in developing countries (Chua et al., 2012; Jones et al., 2014). Poor dietary diversity in complementary feeding practice can lead to deficiencies of essential micronutrients, which may lead to impaired immune systems and
S2 Kekalih A, Februhartanty J, Mansyur M et al.
permanent adverse effects on the growth and development of children (Henjum et al., 2015).
According to the World Health Organization (WHO) (2008), complementary feeding may be assessed using the five following indicators: (1) the introduction of solid, semi-solid or soft foods; (2) minimum dietary diversity; (3) minimum meal frequency; (4) minimum acceptable diet and (5) the consumption of iron-rich or iron-fortified foods. Complementary feeding that consists of less than four food groups and the delayed introduction of food variety, especially foods containing animal protein, are some of the significant problems in achieving dietary diversity (Menon, 2012; Zahiruddin et al., 2016).
Most working women are in the reproductive age group (Grzywacz et al., 2010; Singh & Hoge, 2010). The number of women joining the workforce has been on the increase, but this has been mainly at the lower skilled and unskilled levels (ILO, 2006; Cohany & Sok, 2007). This phenomenon is also found in Indonesia. The employment-to-population ratio (EPR) that indicates the percentage of people in employment from the total working age population has increased in female workers by > 5.0% in the last decade, in Indonesia, and is much higher than that for male workers. However, only 0.5% of working women were in leadership and management roles in Indonesia, compared to 1.6% for men (ILO, 2017), indicating that most women are employed in the lower levels of occupation, as unskilled labourers and informal workers. Working women face several challenges in trying to adhere to optimal practices for feeding infants and young children. They were unlikely to follow the recommended practise of exclusive breastfeeding until the child was 6 months and then begin sustained, complementary breastfeeding
until the child was 2 years of age (Ong et al., 2005; Baker & Milligan, 2008; Gennetian et al., 2010).
Many working women often do not have sufficient resources in their families or at the workplace for child-care support (Toyama et al., 2001; Du & Dong, 2010; Roshita, Schubert & Whittaker, 2012). The dietary diversity of young children may be affected, either positively through increased economic capacity of the mother to buy a wider variety of foods, or negatively as a result of the reduced time that working mothers have to prepare a variety of foods (Priebe, 2010; Razavi, 2012). This situation underlines the importance of understanding the beliefs and practices of working mothers regarding the provision of optimal dietary diversity.
Studies in developing countries have revealed poor dietary diversity practices among working mothers, although the evidence for this is contradictory in the middle- and high-income countries (Dewey & Adu-Afarwuah, 2008; Faber, Laubscher & Berti, 2014). There are few studies done in developing countries that have investigated dietary diversity challenges among working mothers in lower occupational levels (Vereecken & Maes, 2010; Razavi, 2012). Studies in Southeast Asian countries found poor dietary diversity practices among children aged 6–24 months (Batal, Boulghourjian & Akik, 2010; Senarath et al., 2012).
The aim of this study was to explore dietary diversity practices and its related beliefs among working mothers in Jakarta, Indonesia, as a basis for designing interventions to promote appropriate complementary feeding for working mothers. This qualitative study was undertaken based on the Theory of Planned Behaviour (TPB) to explore the behavioural, normative and control beliefs to dietary diversity practices

S3Child dietary diversity practices among working mothers 3
among mothers working at different occupation levels (Ajzen & Manstead, 2007).
MATERIALS AND METHODS
Theoretical framework The TPB model is widely used in the design of behavioural change interventions. The TPB model stipulates that three sets of beliefs mediate behavioural intentions, namely (i) behavioural beliefs, e.g. working mothers’ attitudes based on perceived benefits and problems in practicing dietary diversity; (ii) control beliefs, namely perceptions related to control over necessary resources, e.g. capacity to cook and process the food, child-care resources when mother is working, and support to engage in dietary diversity practices; and (iii) normative beliefs e.g. subjective norms determined by perceptions of the views of other working mothers on complementary feeding (Ajzen & Manstead, 2007; Weir et al., 2010).
Recruitment of participantsThe International Labour Organization (ILO) categorises occupations into the following broad groups or levels (i) lowest level, unskilled labour; (ii) medium level, skilled labour and (iii) highest level, professional (ILO, 2006; Cohany & Sok, 2007; Vereecken & Maes, 2010). The study was conducted in Jakarta, which was chosen as it was a key urban location, with working mothers employed in different categories of occupations.
Working mothers with at least one child aged 6-23 months of age were recruited from these workplaces. A garment manufacturing factory was selected for the unskilled labour participants, and chemical and food factories for skilled and professional level workers. The participants at highest level were those who worked as managers and professionals, while
the medium level or skilled labour were technicians, clerks, and service workers, and those at the lowest level were unskilled labourers. Non-working mothers were also included as a fourth group. They were recruited from among the wives of male workers in the study workplaces as it was convenient to do so.
The present study targeted to recruit a minimum number of 24 subjects for the four groups, based on the recommendations of having 6-10 participants per group to reach saturation (Tashakkori & Teddlie, 2003). A final total of 25 participants were recruited, comprising six working mothers representing unskilled labour, seven representing skilled labour, six professional managers and six non-working mothers. We also visited two houses in each group to interview caregivers (three grandmothers and five babysitters) and families (four husbands), and to observe the child’s activities. Three workplace supervisors from each employment group, and two officers from the Mother and Child Health Directorate, Ministry of Health, were also interviewed about policy and health education facility in the workplace.
WHO indicator on dietary diversityThe WHO Minimum Dietary Diversity indicator states that children who are 6–23 months of age should receive foods from four or more out of seven food groups besides breastmilk. The seven food groups are listed as follows: (1) staples, (2) vitamin A–fruits/ vegetables, (3) other fruits and vegetables, (4) animal-source protein (meat/poultry/fish), (5) milk and milk-related products, (6) plant source protein (legumes) and (7) eggs. The introduction of dietary diversity is recommended from 6 months of age, as breastmilk alone will by then no longer be sufficient to provide the child’s nutrient requirements (Jones et

S4 Kekalih A, Februhartanty J, Mansyur M et al.
al., 2014). Infants can be fed pureed, mashed and semi-solid foods prepared from infant cereals, vegetables, fruits, meat, and other protein-rich foods (Abeshu, Lelisa & Geleta, 2016). The participating women were questioned on the food groups given to their child on the previous day.
In-depth interview The health belief model adopted from the TPB (Ajzen & Manstead, 2007) provides a useful framework to identify the determinants of feeding practice. These consist of three primary aspects: (i) attitude or behavioural beliefs, (ii)
perceived norms concerning performance of the behaviour (normative beliefs, environmental constraints), and (iii) self-efficacy with respect to performing the behaviour (skills, abilities and control beliefs) (Fishbein, Von Haeften & Appleyard, 2001). The questions were targeted at working mothers and verified with caregivers, other family members and employers.
Card-sorting for exploring dietary diversity practiceThe researchers also used a participatory technique, namely card-sorting, to stimulate discussions arising from
Table 1. Information explored in the qualitative study
InformationFunction in the
behavioural model
Source Participatory techniques†
1. Value of maintaining child nutrition among working mothers
Behavioural belief
Working mother peer
None
2. Value of dietary diversity importance in child feeding
Behavioural belief
Working mother peer
Activities 1 and 2
3. Knowledge of dietary diversity and timing of giving different types of food
Skill and abilities
Working mother peer
Activities 1 and 2
4. Value of parenting and child feeding among peers of working mothers
Normative belief
Working mother peer
Activity 4
5. Perspective on difficulties in complementary feeding practices
Self-Efficacy/ Control Belief
Working mother peer
Activity 3
6. Extent of dependency on family and child caregiver for child care
Control Belief Father or caregiver
Activity 4
7. Facilitation and support from employer related to child care and feeding practices (not only exclusive breastfeeding)
Environmental constraint
Employer/workplace
supervisor and Ministry of
Health (MoH) officer
Activity 4
8. Perspective on effect of working on child feeding and dietary diversity
9. Perspective on effect of child feeding on child nutrition status
Outcome evaluation
Working mother peer,
father or caregiver
None

S5Child dietary diversity practices among working mothers
the responses of mothers on their perspectives and the problems they faced in achieving dietary diversity practices, as well as their contacts with whom they discussed feeding problems. (Neufeld et al., 2004). Card-sorting consisted of four types of activities that were designed to investigate (i) the knowledge of mothers on the introduction of foods to infants, (ii) the timeline of dietary diversity practices, (iii) the problems in implementing complementary feeding practices, and (iv) contacts and channels they sought to obtain information on child feeding problems. The card-sorting activities were designed by the research team, reviewed by two nutrition experts and pretested among five volunteers with similar characteristics as the participants (Kerr, Hilari & Litosseliti, 2010).
Based on a list of food groups prepared by two nutrition experts and another list of commonly consumed
foods by children <2 years old (Ferguson et al., 2006), a final list comprising a total of 17 food groups was developed for the qualitative study. These are staples (rice porridge, filtered porridge, soft rice, instant porridge, potatoes and mung bean porridge), plant protein sources [tempeh (fermented soybean) and tofu, both from soy], animal protein sources (chicken, chicken liver, fish, egg and meat), vegetables, fruits and beverages (formula milk and sweetened tea). Filtered porridge is rice porridge with finer texture after being filtered while soft rice is Indonesian steam chicken rice or nasi tim.
An A3 sheet paper with an age timeline from 0 month to 1.5 years was provided to the mothers. In line with each activity, the mothers used sticky cards to paste pictures of the foods that they had fed to their child according to the age timeline. An example of a card-sorting sheet is shown in Figure 1.
0
mo
6
mo
9
mo
12
mo
1.5
yo
2
yo
Formula Milk
Tofu
Meat
Soft Rice
Mung beanPorridge
InstantPorridge
Egg
Rice
Tempeh
Chicken
Potato
Porridge
Fish
Fruit
Chicken Liver
Vegetable
Figure 1. Example of dietary diversity card-sorting sheet. Each sticky note describes different foods that the mother can attach to a specific age of the child (e.g. chicken must be introduced at 6 month old of child age, while mung bean porridge was introduced at 1.5 years old of child age)

S6 Kekalih A, Februhartanty J, Mansyur M et al.
Using this card sorting instrument, we could observe how many food groups were given according to the child’s age, based on mother’s knowledge and experience (Activity 1 and Activity 2). Following this, we explored their related beliefs underlying their dietary diversity practices.
Activity 3 was aimed at assessing problems and challenges experienced by the mothers in providing complementary feeding. Problems were listed based on discussion with the nutrition experts and pretested before including them on the sticky cards (Menon, 2012; Senarath et al., 2012). We asked the mothers to stick the cards in the order from the most to the least troubling.
Activity 4 was aimed at assessing the priority that mothers assigned to the persons with whom they mostly shared information on child-feeding. This is a part of the subjective norms in the Health Belief Model. Three groups, namely, family members, health workers, and other working mothers were on a prepared list from which the participants were requested to select from.
Before data collection, two interviewers were trained so that they had an adequate understanding of the instruments used. All card-sorting activities were audio recorded, its results were photographed. The analysis was conducted based on recorded interviews transcribed in verbatim and from the photographs of the card-sorting activities.
Data collection Data were collected from August to October 2014 using in-depth interviews of both working and non-working mothers. In-depth interviews were also conducted with fathers, caregivers and employers. Each session began with a brief introduction and description of the purpose of the study. Participants
were informed that there were no right or wrong answers and were encouraged to share their views regarding dietary diversity in complementary feeding. In order to obtain a better understanding and avoid bias in the interview process, the researcher conducted the interviews in the Indonesian language. The interviews lasted 45-90 minutes per session and were held in a closed room. Information from the in-depth interviews was validated via cross-checking and the findings were reconfirmed with the subjects.
Qualitative data transcription All recordings and written notes were converted into transcripts. Two researchers with a background in nutritional education and complementary feeding research read the transcripts independently, and then coded them into descriptive words or phrases. Photographs of card sorting results were coded based on their similarities in practices and knowledge. The coded transcripts were compiled and grouped into themes. The themes that emerged were then reviewed and edited. Key issues were compiled in a matrix so that the comparison of dietary diversity feeding practices among women from different occupations could be undertaken. Saturation was considered when the researcher had reached the point of no new findings or themes. Triangulation of source, method and analysis was explored to ensure the validity of the qualitative data. Information gathered from the peers of the mothers, families and key informants was used to complement information provided by the mothers (Fusch & Ness, 2015).
Ethical considerations The study procedures were fully approved by the Health Research Ethics Committee of the Faculty of Medicine,

S7Child dietary diversity practices among working mothers
Universitas Indonesia (number 155a/H2.FI/ETIK/2014).
RESULTS
Characteristics of the informants Characteristics of the informants are shown in Table 2.
Problems in achieving dietary diversity In general, the mothers knew that filtered porridge could be given to children who were < 9 months of age, rice porridge could be introduced at 9 months, and steamed rice at 12 months of age. Based on the in-depth interviews using card sorting, we found that the children of mothers at the lower levels of
employment were introduced to the food groups at various ages. Figure 2 shows an example of mothers from unskilled and skilled labour level which indicated the late introduction of foods, compared to another from the professional level, who introduced more diverse foods in a timely manner.
In the former case, the mother only gave staples and soft fruits such as banana at age < 9 months. Animal protein food sources such as chicken, chicken liver or fish were given later when the child was 12 months old. By contrast, the mother from the professional category introduced fish, chicken liver and vegetables beginning at the age of 6 months. Quotes from a
Table 2. Characteristics of the subjects: working and non-working mothers
CharacteristicsNon-
working (n=6)
Unskilled labour
(n=6)
Skilled labour
(n=7)
Professional/Manager
(n=6)
Child Age
6–11 months12–17 months18–23 months
222
213
313
141
Birth orderFirst childSecond or older
24
33
43
42
SexBoyGirl
33
42
43
33
Provided Minimal Dietary Diversity (MDD) 4 1 3 4
Mother Employment duration
>5 years<5 years
NANA
33
34
33
Age>30 years old<30 years old
42
24
34
33
Additional informants in each groupCaregivers
Grandmother 1 1 1 0Babysitter 1 1 1 2
Family (husband) 1 1 1 1
NA=not applicable

S8 Kekalih A, Februhartanty J, Mansyur M et al.
0
mo
6
mo
9
mo
12
mo
1.5
yo
2
yo
InstantPorridge
FormulaMilk
Fruit Potatoes
Fish
Soft Rice
Chicken Liver
Mung beanPorridge
Rice Tempeh
Egg
Meat
Tea
Tofu
Chicken
Vegetable
Porridge
(a) Practised by L, 33 years old, mother of 13-month-old boy; L is an administrative staff
member and represents the working mothers at the skilled labour level
0
mo
6
mo
9
mo
12
mo
1.5
yo
2
yo
Formula Milk
Tofu
Meat
Soft Rice
Mung beanPorridge
InstantPorridge
Egg
Rice
Tempeh
Chicken
Potato
Porridge
Fish
Fruit
Chicken Liver
Vegetable
(b) Practised by ED, 40 years old caregiver of P’s 17-month-old girl; P is a 34 years old and represents working mothers at the professional level
Figure 2. Examples of card-sorting activity and timeline for dietary diversity practice. The figures show (a) late introduction and inadequate dietary diversity by a mother at an unskilled labour level; and (b) more diverse complementary foods with timely introduction of animal protein by a mother at a professional level. (mo: months old of child age; yo: years old of child age)
S9Child dietary diversity practices among working mothers
working mother and a caregiver at the lower occupational level were presented as follows.
“Porridge with sliced vegetables and probably minced banana or papaya… I think that was the only food that my child can have before one year old…” (Su, 27 years old, labourer in a garment factory, unskilled labour, mother of a 12-month-old girl)
“Why despite knowing that vegetables were important for the child at 9 months of age, yet I gave them at the age of 12 months? I just started with something that she (the child) likes such as chicken porridge and banana” (Y, 34 years old, paid caregiver of a 15-month-old girl whose mother works as a garment labourer, unskilled labour)
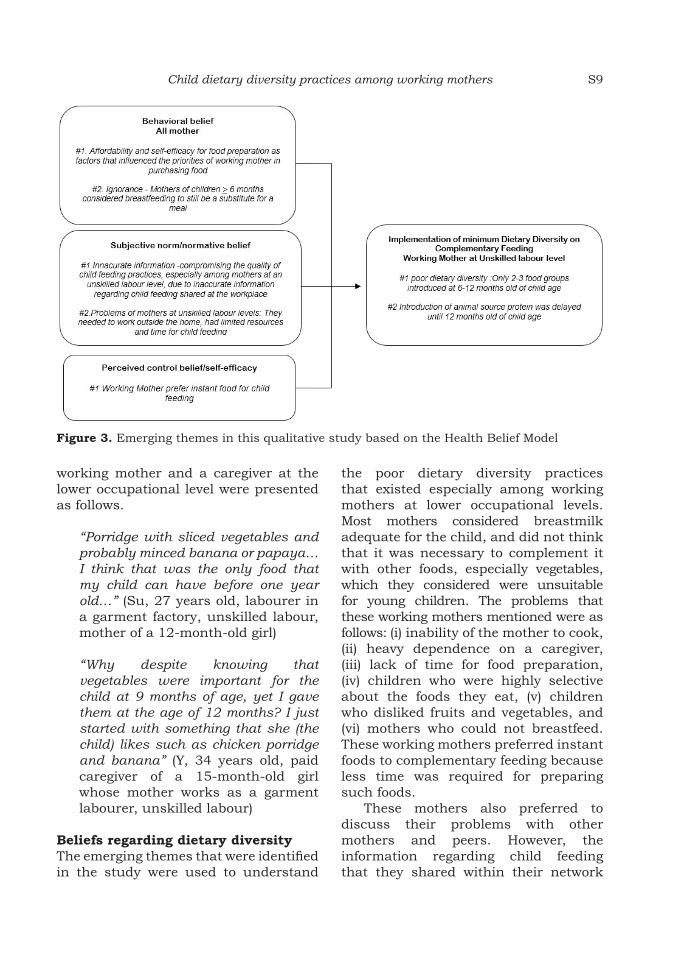
Beliefs regarding dietary diversity The emerging themes that were identified in the study were used to understand
the poor dietary diversity practices that existed especially among working mothers at lower occupational levels. Most mothers considered breastmilk adequate for the child, and did not think that it was necessary to complement it with other foods, especially vegetables, which they considered were unsuitable for young children. The problems that these working mothers mentioned were as follows: (i) inability of the mother to cook, (ii) heavy dependence on a caregiver, (iii) lack of time for food preparation, (iv) children who were highly selective about the foods they eat, (v) children who disliked fruits and vegetables, and (vi) mothers who could not breastfeed. These working mothers preferred instant foods to complementary feeding because less time was required for preparing such foods.
These mothers also preferred to discuss their problems with other mothers and peers. However, the information regarding child feeding that they shared within their network
Figure 3. Emerging themes in this qualitative study based on the Health Belief Model

S10 Kekalih A, Februhartanty J, Mansyur M et al.
was found to be mostly inaccurate. Furthermore, mothers at the unskilled labour level were insufficiently exposed to health care information, either at their workplace or from other sources. The emerging themes that were identified based on the behavioural model are described in Figure 3.
Representative viewpointsThe following are examples that have been selected to represent the views of the various categories of employment in this study.
Emerging theme in behavioural belief #1: Affordability and self-efficacy for food preparation as factors that influenced the priorities of working mother in purchasing food In prioritising food purchases, mothers generally preferred to provide staples with only one or two additional food groups. At an earlier age (6-9 months), fruit was preferred because it could be easily minced, and children, in general, liked the taste of fruits. When the children reached 12-23 months and were introduced to family food, fruits were given less frequently, because of its price. Vegetables were also given less often because the working mother said that they did not have enough time to prepare, and because the children did not like the taste of vegetables.
“She likes fruit… but we only buy fruit when we have extra money… Our priority is to buy chicken, tempeh (fermented soybean) followed by vegetables…” (E, 33 years old, administrative staff member, skilled labour, mother of a 13-month-old boy)
“We know that vegetables are important at her age, but it takes time to prepare… it also takes more time for her to chew the vegetable” (W, 35
years old, professional, mother of an 8-month-old girl)
Emerging theme in behavioural belief #2: Ignorance - mothers of children ≥ 6 months considered breast milk as a substitute for meal Most working mothers, especially those at the lower occupation levels, said they tried to continue to breastfeed when working, but faced challenges, such as storing milk at their workplace. Some mothers were not aware that breast milk alone was insufficient for children ≥ 6 months of age. Some of these mothers continued breastfeeding the child as long as the child was satisfied, and did not introduce complementary feeding, especially among mothers with children aged 6-10 months.
“He is restless and crying when I get home, most of the time, I breastfeed him to make him sleep… And I think that’s enough food for him” (Ra, 27 years old, administrative staff member, mother of an 8-month-old boy)
“I give my expressed breast milk to my daughter after work… She enjoys it and then we play together until she falls asleep…” (Re, 29 years old, manager, mother of a 10-month-old girl)
Emerging theme in normative belief #1: Inaccurate information - compromising the quality of child feeding practices, especially among mothers at an unskilled labour level, due to inaccurate information regarding child-feeding shared at the workplaceMothers at unskilled labour levels admitted their preference for sharing information and discussing feeding problems with their co-workers at their workplace. Such information presumably gathered from more experienced mothers.

S11Child dietary diversity practices among working mothers
It may have been inaccurate and this could account for the quality of child feeding practices being compromised.
Working mothers at the unskilled labour level seldom received health education about recommended feeding practices, in the workplace or from community health cadres. Most caregivers helping the mothers at the lower levels of occupation did not take the children for routine growth measurements at the integrated community-based health posts (called Posyandu in the Indonesian language).
“We never had a chance to bring our kid to Posyandu because we work... I am not sure my neighbour (who babysat her child when she works) would take her there” (N, 28 years old, an unskilled labourer working at a small garment factory, mother of a 15-month-old girl)
“I never took her to Posyandu… it’s not far … but for me she’s healthy enough… her mom never asked me anyway” (Id, 28 years old, caregiver, helping Su, an unskilled labourer in a garment factory, mother of a 12-month-old girl)
By contrast, mothers working at higher occupation levels are well informed and reminded by other working mothers or health workers about healthy child feeding practices.
“I was advised by Mrs XX (her senior co-worker) to buy ready-to-eat infant porridge… because it is practical, time-saving and yet cheap” (Su, 27 years old, unskilled labourer in a garment factory, mother of a 12-month-old girl) “I was once influenced by my friend (pointing at her working peer) to buy
‘healthy porridge’; but my child had diarrhoea and was admitted to a hospital after consuming porridge from the vendor. I did not know what was wrong with the porridge… it was traumatic… but I had no choice back then, because I could only prepare instant food” (Ef, 33 years old, administrative staff member, skilled labour, mother of a 13-month-old boy)
“I am happy with child care here (pointing at child care facility in the office), the nurse gave me information about how to prepare complementary food… We also have pictures of our children who succeed exclusive breastfeeding and reach 2 years old” (W, 35 years old, professional, mother of a 8-month-old girl)
“Here the moms (referring to her co-workers, who were also working mothers) are quite talkative about breastfeeding and child feeding… I hesitate if I failed to give my child proper feeding… Yes, they often protest if I say anything about instant food (for my child feeding)” (R, 28 years old, professional, mother of a 15-month-old boy)
Also, mothers working at higher occupation levels had access to breastfeeding rooms, child weighing programmes and education or consultation programmes, that are provided by the companies.
“We know that most of our staff here are the new moms… Therefore, we provide a special room for breast milk expression and a nurse to give them information about how to prepare food to their children” (W, 45 years old, manager of a private company, employer of professionals)

S12 Kekalih A, Februhartanty J, Mansyur M et al.
“Our breastfeeding room… with privacy for breast-pumping, refrigerator and health education brochures. But you may see the pictures of staff’s children who succeeded with exclusive breastfeeding or who are > 2 years old… It’s part of our motivational and education programme” (Re, 29 years old, manager of an international company, professional, mother of a 10-month-old girl)
Emerging theme in subjective norm/normative belief #2: Problems of mothers at unskilled labour levels: They needed to work outside the home, had limited resources and time for child feeding Mothers at unskilled labour levels had to work in informal sectors or small companies because their families needed the extra income. Some of them made time at night or in the early morning to prepare food or delegated food preparation to the caregiver. In delegating food preparation, some may have faced additional problems due to limited resources or money to be given to the caregiver.
“I pushed myself to get up earlier in the morning… then I cooked my child’s food… it was exhausting… but even though my husband asked me to resign, I am tied to a work contract at my company and my boss did not allow me to leave” (E, 33 years old, administration staff member, mother of a 13-month-old boy)
“She only gave me approximately 10.000 rupiahs daily for her child’s food… what do you expect me to do? So, I just buy any food I can with that amount of money… as long as she eats something” (En, child caregiver and neighbour of SL, who worked in a small garment factory, mother of an 18-month-old girl)
“In fact, it’s sad to leave my daughter and let my neighbour take care of her (while shedding tears) … feed her… but what can I do… I need to earn… to work… because my husband’s income alone is not enough to feed our family…” (N, 28 years old, who worked in a small garment factory, mother of a 15-month-old girl)
Emerging themes in self-efficacy/control belief #1: Working mothers prefer instant foods for child feeding Most working mothers at the lower occupation levels provided their child with instant foods because they thought such foods were nutritious and did not require much time to prepare. Non-working mothers were more likely to prepare and cook the foods themselves.
“Because I had to get back to work when the child was approximately 3 months old, I mostly prepared instant food from the supermarket” (L, 33 years old, unskilled labourer in garment factory, mother of an 8-month-old boy)
“Nowadays, we can easily buy healthy child noodles from street or legal vendors… they have good variations of sliced meat and vegetables” (N, 25 years old, secretary, mother of a 7-month-old boy)
“Every morning I decide what to cook for my child, based on what he likes, for instance, soft rice nasi tim… We bought the ingredients from the market 2-3 days before” (Si, 22 years old, non-working mother of a 9-month-old boy)
An officer at the Ministry of Health confirmed this issue and said that fortification of instant foods was a strategy in Indonesia to address the lack of nutrient diversity in instant foods.

S13Child dietary diversity practices among working mothers
“We are concerned that our diversification strategy may fail, knowing that the SUSENAS (National Indonesian Economy Census) data showed that our people’s consumption of instant foods has been increasing… therefore, the strategy of fortification of instant foods has become an unfinished debate” (AS, officer in the nutrition section at the Ministry of Health Republic of Indonesia)
DISCUSSION
To the best of our knowledge, the present study was the first in Indonesia that used a behavioural model to qualitatively explore the determinants of complementary feeding practices, especially dietary diversity, among working mothers at three occupational levels. By framing the emerging themes into a behavioural model, the study identified behavioural, control and normative beliefs that influence dietary diversity practice
Overall, working mothers faced difficulties in feeding vegetables to infants and young children, and wrongly believed that breast milk could replace complementary food beyond 6 months of age. The challenges in feeding young children vegetables were also noted (Knai et al., 2006). In addition, this study identified poor dietary diversity practices that were specific to working mothers at lower occupational levels, including the late introduction of protein from animal sources, and the provision of staples with only one or two other food groups.
Women who joined the workforce were expected to become more empowered in some of the following ways: i) economically, through income generation and control over finances, ii)socially, through social support, access to health services, in control of own health care and greater mobility, and iii)legally, through better bargaining power
(Na et al., 2015). However, in developing countries, there is an increasing number of mothers join at the unskilled labour level. As such, they are said to be in transition in trying to gain empowerment as they continue to struggle with limited resources (Razavi, 2012). The evidence that the empowerment of women improves complementary feeding practice is mixed (Vereecken & Maes, 2010; Malapit et al., 2015). Malapit et al. (2015) reported that, in Nepal, women’s empowerment in areas such as control over income and reduced workload was positively associated with the improvement of children’s diets.
In this study, mothers working at the unskilled levels admitted that they needed to work to financially help their families. However, they experienced a loss of control over child feeding, owing to their dependence on others. By contrast, working mothers at higher levels of the workforce, who often chose to work as an act of self-actualisation, were involved in making decisions regarding child feeding. Thus, the different domains of women’s empowerment (control of resources and autonomy, workload and time, and social support) may relate differently to the dietary intake and nutritional status of a child (Cunningham et al., 2015).
Mothers working at the unskilled labour level had a small network of peers whom they relied on to discuss child-feeding problems. However, this study found that they received compromised nutritional advice like the tendency to buy instant foods or the late introduction of animal proteins. Storey & Figueroa (2012) explained that behavioural change was influenced not only by individual thinking related to the benefit of action, but also the perception of others in the community. When the community constantly share inaccurate messages, it might lead to compromised norms of behaviours related to child care and feeding (Devine

S14 Kekalih A, Februhartanty J, Mansyur M et al.
et al., 2009). The normative beliefs that lead complementary feeding practices being compromised among unskilled labourers and the sharing of such beliefs among their peers, highlight the need for food literacy education for working mothers, especially among those at the lower occupation levels. Among the mothers at the unskilled work level, exposure to nutrition-related education and child-care support facilities were limited. Breastfeeding rooms and health education services by health professionals were found to be a part of employee facilities only in large companies, but not in unskilled labour workplaces. These working mothers also faced challenges to bring their children to the community health posts (Posyandu) for health-care needs. Socially disadvantaged working mothers in United States also experienced a similar situation of exposing their children to potential health and developmental risks (Grzywacs et al., 2010).
Thus, the delivery of nutritional education to improve feeding practices needs to be widely targeted to include health workers, family members and also peers of working mothers. This approach is in line with the initiative that addressed the first 1000 days of life by the Indonesian government, which emphasised the equal importance of breastfeeding and complementary feeding quality. In this regard, complementary feeding education must also be strengthened and balanced with breastfeeding education (Ministry of Welfare GoI, 2013). Since it is known that the workplace has a big contribution in developing the perspectives of mothers on proper child feeding practices, inter-sectoral collaboration among related government agencies such as the Ministry of Health, Ministry of Labour, Ministry of Industry and Ministry of Women Empowerment needs to be intensified. Further studies on effective educational
strategies in workplace settings to improve the quality of complementary feeding are much needed.
Limitations of studyAs the sample size was small and the coverage was not wide, these findings do not necessarily represent the views of all working mothers in the study area. The participants were selected and stratified based on occupation levels, and the findings may be applicable to other individuals with similar characteristics and context (working mothers in urban areas).
CONCLUSION
The present qualitative study revealed that working mothers at lower occupation levels practised poor dietary diversity owing to several work-related factors. Efforts to provide correct nutrition information related to complementary feeding should be undertaken at workplaces, especially for working mothers, in the lower levels of occupation.
Acknowledgements
AK received a scholarship for doctorate study, attending the course and workshop at the Harvard School of Public Health entitled ‘Analysis of Health and Nutrition Data from Low-Income Countries’, and a support for manuscript preparation and analysis, from the Higher Education Network Ring Initiative (HENRI) Program, a partnership supported by a grant from the United States Agency for International Development-Indonesia (Cooperative Agreement AID-497-A-11-00002) to the Harvard School of Public Health in partnership with, and with in-kind contributions from, the SEAMEO Regional Centre for Food and Nutrition, Universitas Indonesia, University of Mataram, Andalas University, the Summit Institute of Development and Helen Keller International, with additional contributions from the Rajawali Foundation and Harvard Kennedy School Indonesia Program.
Authors’ contributions
AK, designed the study, conducted data analysis and prepared the first draft of the article; JF, designed the study, supervised data analysis and

S15Child dietary diversity practices among working mothers
contributed to the final draft of the article; MM, designed the study, supervised data analysis and contributed to final draft of the article; AS, designed the study and contributed to the final draft of the article.
Conflict of interest
The authors declare no potential conflicts of interest with respect to the research, authorship or publication of this article.
References
Abeshu MA, Lelisa A & Geleta B (2016). Complementary feeding: review of recommendations, feeding practices, and adequacy of homemade complementary food preparations in developing countries – Lessons from Ethiopia. Frontiers in Nutrition 3:41. doi: 10.3389/fnut.2016.00041.
Ajzen I & Manstead A (2007). Changing health-related behaviours: an approach based on the Theory of Planned Behaviour. In JDM Hewstone (eds). The scope of social psychology: Theory and applications. (pp. 43-63). Psychology Press, New York.
Baker M & Milligan K (2008). Maternal employment, breastfeeding, and health: evidence from maternity leave mandates. Journal of Health Economics 27(4): 871–887. doi: 10.1016/j.jhealeco.2008.02.006.
Batal M, Boulghourjian C & Akik C (2010). Complementary feeding patterns in a developing country: a cross-sectional study across Lebanon. East Mediterr Health J 16(2):180-6.
Chua EY, Zalilah MS, Chin YS & Norhasmah S (2012). Dietary diversity is associated with nutritional status of Orang Asli children in Krau Wildlife Reserve, Pahang. Malaysian Journal of Nutrition 18(1):1-13.
Cohany SR & Sok E (2007). Trends in labor force participation of married mothers of infants. Monthly Labor Review 130:9-16.
Cunningham K, Ruel M, Ferguson E & Uauy R (2015). Women’s empowerment and child nutritional status in South Asia: a synthesis of the literature. Maternal & Child Nutrition 11(1):1–19. doi: 10.1111/mcn.12125.
Devine CM, Farrell TJ, Blake CE, Jastran M, Wethington E & Bisogni CA (2009). Work conditions and the food choice coping strategies of employed parents. Journal of Nutrition Education and Behavior 41(5):365–370. doi: 10.1016/j.jneb.2009.01.007.
Dewey KG & Adu-Afarwuah S (2008). Systematic review of the efficacy and effectiveness of complementary feeding interventions in developing countries. Maternal & Child Nutrition 4(S1):24–85.
Du F & Dong X (2010). Women’s labor force participation and childcare choices in urban China during the economic transition. Department of Economics, The University of Winnipeg, Canada.
Faber M, Laubscher R & Berti C (2014). Poor dietary diversity and low nutrient density of the complementary diet for 6- to 24-month-old children in urban and rural KwaZulu-Natal, South Africa. Maternal & Child Nutrition 12(3):528-545. doi: 10.1111/mcn.12146.
Ferguson EL, Darmon N, Fahmida U, Fitriyanti S, Harper TB & Premachandra IM (2006). Design of optimal food-based complementary feeding recommendations and identification of key “problem nutrients” using goal programming. The Journal of Nutrition 136(9): 2399–404. doi: 10.1093/jn/136.9.2399.
Fishbein M, Von Haeften I & Appleyard J (2001). The role of theory in developing effective interventions: implications from project SAFER. Psychology, Health and Medicine 6(2):223–238. doi: 10.1080/13548500123176.
Fusch PI & Ness LR (2015). Are we there yet? Data saturation in qualitative research. The Qualitative Report 20(9): 1408–1416.
Gennetian LA, Hill HD, London AS & Lopoo LM (2010). Maternal employment and the health of low-income young children. Journal of Health Economics 29(3):353–363. doi: 10.1016/j.jhealeco.2010.02.007.
Grzywacz JG, Tucker J, Clinch CR & Arcury TA (2010). Individual and job-related variation in infant feeding practices among working mothers. American Journal of Health Behavior 34(2):186–196.
Henjum S, Torheim LE, Thorne-Lyman AL, Chandyo R, Fawzi WW, Shrestha PS & Strand TA (2015). Low dietary diversity and micronutrient adequacy among lactating women in a peri-urban area of Nepal. Public Health Nutrition 18(17):3201–3210.
ILO (2006). Changing patterns in the world of work: International Labour Conference, 95th session 2006. International Labour Office, Geneva.
ILO (2017). Indonesia Jobs Outlook 2017: Harnessing technology for growth and job creation. International Labour Office, Jakarta.

S16 Kekalih A, Februhartanty J, Mansyur M et al.
Jones AD, Ickes SB, Smith LE, Mbuya MN, Chasekwa B, Heidkamp RA, Menon P, Zongrone AA & Stoltzfus RJ (2014). World Health Organization infant and young child feeding indicators and their associations with child anthropometry: a synthesis of recent findings. Maternal & Child Nutrition 10(1):1–17. doi: 10.1111/mcn.12070.
Kerr J, Hilari K & Litosseliti L (2010). Information needs after stroke: What to include and how to structure it on a website. A qualitative study using focus groups and card sorting. Aphasiology 24(10):1170–1196. doi: 10.1080/02687030903383738.
Knai C, Pomerleau J, Lock K & McKee M (2006). Getting children to eat more fruit and vegetables: a systematic review. Preventive Medicine 42(2): 85–95. doi: 10.1016/j.ypmed.2005.11.012.
Malapit HJL, Kadiyala S, Quisumbing AR, Cunningham K & Tyagi P (2015). Women’s empowerment mitigates the negative effects of low production diversity on maternal and child nutrition in Nepal. The Journal of Development Studies 51(8):1097–1123. doi: 10.1080/00220388.2015.1018904.
Menon P (2012). The crisis of poor complementary feeding in South Asia: where next?’ Maternal & Child Nutrition 8:1–4. doi: 10.1111/j.1740-8709.2011.00394.x.
Ministry of Welfare GoI (Menteri Koordinator bidang Kesejahteraan Rakyat Republik Indonesia) (2013). Policy Framework of First 1000 Days Movement in Indonesia (Kerangka kebijakan 1000 HPK). Ministry of Welfare GoI, Jakarta.
Na M, Jennings L, Talegawkar SA & Ahmed S (2015). Association between women’s empowerment and infant and child feeding practices in sub-Saharan Africa: An analysis of demographic and health surveys. Public Health Nutrition 18(17):3155–3165. doi: 10.1017/S1368980015002621.
Neufeld A, Harrison MJ, Rempel GR, Larocque S, Dublin S, Stewart M & Hughes K (2004). Practical issues in using a card sort in a study of nonsupport and family caregiving. Qualitative Health Research 14(10):1418–1428. doi: 10.1177/1049732304271228.
Ong G, Yap M, Li FL & Choo TB (2005) Impact of working status on breastfeeding in Singapore: evidence from the National Breastfeeding Survey 2001. European Journal of Public Health 15(4):424–430. doi: 10.1093/eurpub/cki030.
Priebe J (2010). Child costs and the causal effect of fertility on female labor supply: An investigation for Indonesia 1993-2008. Poverty, equity and growth in developing and transition countries: statistical methods and empirical analysis discussion papers No. 45. Courant Research Centre, The University of Göttingen.
Razavi S (2012). Gender Equality and Development: World Development Report. United Nations Research Institute for Social Development (UNRISD), Geneva.
Roshita A, Schubert E & Whittaker M (2012). Child-care and feeding practices of urban middle class working and non-working Indonesian mothers: a qualitative study of the socio-economic and cultural environment. Maternal & Child Nutrition 8(3):299–314.
Ruel MT (2003). Operationalizing dietary diversity: a review of measurement issues and research priorities J Nutr 133(11 Suppl 2):3911S–3926S. doi: 10.1093/jn/133.11.3911S.
Senarath U, Agho KE, Akram DE, Godakandage SS, Hazir T, Jayawickrama H, Joshi N, Kabir I, Khanam M, Patel A, Pusdekar Y, Roy SK, Siriwardena I, Tiwari K & Dibley MJ (2012). Comparisons of complementary feeding indicators and associated factors in children aged 6–23 months across five South Asian countries. Maternal & Child Nutrition 8(Suppl 1):89–106. doi: 10.1111/j.1740-8709.2011.00370.x.
Singh S & Hoge G (2010). Debating Outcomes for “Working” Women: Illustrations from India. Journal of Poverty 14(2):197–215. doi: 10.1080/10875541003711821.
Storey D & Figueroa ME (2012). Toward a Global Theory of Health Behavior and Social Change. In Obregon R & Waisbord S (eds). The Handbook of Global Health Communication (pp. 70–94). Wiley-Blackwell, Hoboken, NJ.
Tashakkori A & Teddlie C (2003). SAGE Handbook of Mixed Methods in Social & Behavioral Research. SAGE, Thousand Oaks, CA.
Toyama N, Wakai S, Nakamura Y & Arifin A (2001). Mother’s working status and nutritional status of children under the age of 5 in urban low income community, Surabaya, Indonesia. Journal of Tropical Pediatrics 47(3):179–181. doi: 10.1093/tropej/47.3.179.

S17Child dietary diversity practices among working mothers
Vereecken C & Maes L (2010). Young children’s dietary habits and associations with the mothers’ nutritional knowledge and attitudes. Appetite 54(1):44–51. doi: 10.1016/j.appet.2009.09.005.
Weir Z, Bush J, Robson SC, McParlin C, Rankin J & Bell R (2010). Physical activity in pregnancy: a qualitative study of the beliefs of overweight and obese pregnant women. BMC Pregnancy Childbirth 10:18
WHO (2008). Indicators for assessing infant and young child feeding practices: conclusions of a consensus meeting held 6-8 November 2007 in Washington DC, USA. World Health Organization, Washington, DC.
Zahiruddin QS, Gaidhane A, Kogade P, Kawalkar U, Khatib N & Gaidhane S (2016). Challenges and patterns of complementary feeding for women in employment: A qualitative study from rural India. Current Research in Nutrition and Food Science Journal 4(1):48–53.

Mal J Nutr 25 (Supplement): 19-32, 2019
Comparing intake adequacy and dietary diversity between adolescent schoolgirls with normal nutritional status (NG) and undernutrition (UG) based on BMI-for-age (BAZ) living in urban slums in Central Jakarta
Rika Rachmalina1,2, Helda Khusun3*, Luluk Basri Salim2, Luh Ade Ari Wiradnyani3 & Drupadi HS Dillon2,3
1Center for Public Health Research and Development, National Institute of Health Research and Development, Indonesian Ministry of Health, Jakarta; 2Community Nutrition Study Program, Faculty of Medicine Universitas Indonesia; 3SEAMEO Regional Center for Food and Nutrition (RECFON)/Pusat Kajian Gizi Regional Universitas Indonesia (PKGR), Jakarta
ABSTRACT
Introduction: Undernutrition among adolescent girls is an important concern due to their rapid growth velocity that requires adequate intake of energy and nutrients. This study compared intake adequacy and dietary diversity between adolescent public schoolgirls from slum areas in Central Jakarta who had normal and poor nutritional status. Methods: A total of 220 eligible girls aged 14–18 years were recruited, with an equal proportion in the normal group (NG) [-1 to +1 SD body mass index-for-age z-score (BAZ)], and undernutrition group (UG) (BAZ < -1SD). Dietary intake was assessed using two non-consecutive 24-hour recalls. Dietary diversity scores (DDS) were determined with reference to the intake of 13 food groups with a minimum daily intake of 15 gram/food group. Receiver operating curve analysis was performed to obtain the DDS cut-off. The Mann–Whitney test was performed to compare DDS between the NG and UG. Logistic regression analysis was conducted to examine the likelihood of potential factors in predicting nutritional status outcome. Results: Overall, almost half of the girls’ daily food intake showed low dietary diversity based on DDS cut-off <5, with no significant difference between NG and UG adolescents. Protein intake inadequacy showed significant unlikelihood of a NG outcome (OR=0.4; 95% CI: 0.2-0.8), while low socioeconomic status (SES) showed a strong likelihood of an UG (OR=2.7; 95% CI: 1.3-5.5) compared to high SES. Conclusions: Low dietary intake and DDS were common among adolescent schoolgirls in slum areas in Jakarta. Nutrition interventions promoting appropriate dietary intake among adolescent girls are recommended.
Keywords: Adolescent girls, dietary diversity, nutrient adequacy, undernutrition, Jakarta slums
__________________________
*Corresponding author: Helda KhusunSEAMEO Regional Center for Food and Nutrition (RECFON)–PKGR Universitas Indonesia, Jakarta, SEAMEO RECFON Building, Jl. Salemba Raya No. 4, JakartaTelephone no.: +622131930205; Fax no.: +62213913933E-mail: [email protected]; [email protected]

Rachmalina R, Khusun H, Salim LB et al.S20
INTRODUCTION
Adolescence is a critical period of physical growth and development. Undernutrition among adolescents is a public health concern in Asian countries with prevalence of > 20% underweight (Cappa et al., 2012). In Jakarta, the prevalence of undernutrition in the form of thinness among adolescents was approximately 11.2% in 2010 (MOH Indonesia, 2013), indicating that adolescent undernutrition is at an unsatisfactory level (WHO, 2010).
Undernutrition during adolescence is of significance given that 50% of the adult weight and skeletal mass and 20% of the adult height are gained during this period. As the rapid growth velocity requires adequate intake of energy and nutrients, adolescents become vulnerable to nutrient deficiencies (Stang & Story, 2005). Adolescent girls in low and middle income countries (LMIC) are often reported to have a monotonous cereal based diet consisting of low nutrient-dense foods, resulting in an inadequate intake of energy and nutrients (USAID & SPRING, 2015). As a consequence, poor nutrition during adolescence affects the ability to learn, reduces work productivity, results in a failure to attain potential height and gain optimal bone mass in adulthood, and delays the onset and progression of puberty.
Several factors are known to lead to undernutrition. These include household food insecurity, intra-household allocation of food that does not meet dietary needs, livelihood insecurity, and poor knowledge of nutrition (WHO, 2005). Poor diet quality could be due to a lack of dietary diversity, which indicates consumption of a low variety of food. This condition has been shown to be associated with micronutrient inadequacy among children and
adolescents (Korkalo et al., 2017; Zhao et al., 2017). A higher household dietary diversity was reported to be associated with a lower likelihood of child stunting (Lee & Ryu, 2018; Mahmudiono, Sumarmi & Rosenkranz, 2017).
Studies determining dietary diversity among Indonesian adolescents in relation to undernutrition are few. This study was aimed at comparing the dietary intake adequacy and dietary diversity between adolescent schoolgirls with normal and poor nutritional status living in urban slum areas in Central Jakarta, Indonesia.
MATERIALS AND METHODS
Study design and subjects This cross-sectional study was conducted in Central Jakarta. A list of schools was obtained from the Education Office of Central Jakarta, from which five high schools located in slum areas were randomly selected.
Sample sizeAs studies on dietary diversity of Indonesian adolescent girls are lacking, the sample size for this study was computed based on the results reported by Jayawardena et al. (2013), that underweight female (BMI≤18.5 kg/m2) had lower mean dietary diversity (5.69±1.52) than those whose nutritional status was normal (BMI >18.5 - ≤22.9kg/m2) (6.52±1.47). Based on 80% power and a 95% confidence interval, a minimum sample size of 220 was estimated with an equal number for each group, that is 110 for the undernutrition group and another 110 for the normal nutritional status group.
The study inclusion criteria for selecting the participants were girls aged 14-18 years, who were post menarche and apparently healthy. A total of 1,073 schoolgirls from the public schools who

Low dietary diversity among adolescent schoolgirls S21
had met the study criteria were selected, and were invited for anthropometric screening.
Nutritional statusAnthropometric measurements were conducted following standard procedures (Gibson, 2005). Height was measured using the ShorrBoard (Weigh and Measure, LLC, USA), and weight was measured using an electronic SECA no. 876 weighing scale (Seca, Germany). The average of two consecutive measurements was used to calculate the body mass index-for-age z-score (BAZ) using WHO AnthroPlus software (WHO, 2009). The girls were classified into two groups based nutritional status. These were the normal group (NG) (BAZ: –1SD ≤ BAZ ≤ +1SD) and the undernutrition group (UG) (BAZ < -1SD) (Thomaz, et al., 2010). The 110 schoolgirls whose BAZ status was (BAZ < -1SD) agreed, on a voluntary basis to participate, and were classified to the UG. The other 110 schoolgirls with BAZ status (-1SD ≤ BAZ ≤ +1SD) were placed in the NG.
Data collection All the eligible participants were interviewed by five trained enumerators, to collect data on dietary diversity, food consumption, morbidity (history of diarrhoea and upper respiratory tract infection in the previous one month), physical activity (PA), household food security, working and education status of mother, and household socioeconomic status (SES). The questionnaires on food consumption and dietary diversity were pre-tested on several adolescent girls from a public high school located in the study area. After pretesting, the questionnaires were revised to improve clarity.
Food consumptionDietary intake was assessed using two non-consecutive 24-hour (24-h) food
recall periods, comprising one weekday and one day of a weekend. A four-stage multiple-pass interviewing technique was used in the 24-h recall method (Gibson & Ferguson, 2008). The national standardised food photograph book was used for the estimation of portion size (MOH Indonesia, 2014a). The daily nutrient intake was determined using the Indonesian food composition database and calculated by NutriSurvey for Windows, version 2007 (Erhardt, 2007). Energy and protein requirements were calculated by using an estimated energy requirement and protein requirement to specific body weight (FAO, WHO & UNU, 2001; WHO, FAO & UNU, 2007). Fat and carbohydrate adequacy were taken as meeting at least 77% of the Indonesian recommended dietary allowance (RDA) (MOH Decree, 2013). The estimated average requirement was used to evaluate micronutrient adequacy (WHO & FAO, 2006). A dietary intake that was above these requirements was classified as energy and nutrient adequacy.
Dietary diversityA standardised individual dietary diversity questionnaire was used to obtain the dietary diversity score (DDS) (Arimond et al., 2008). The DDS consisted of 13 food groups, namely starchy staples, legumes and nuts, dairy products, organ meats, eggs, small fish eaten with bone, meat (“flesh foods”) and animal protein, vitamin A-rich deep yellow/orange/red vegetables, vitamin A-rich deep green leafy vegetables, vitamin A-rich fruits, vitamin C-rich fruits, vitamin C-rich vegetables, and lastly other fruits and vegetables.
Morbidity (upper respiratory tract infection and diarrhoea)Participants with upper respiratory tract infection were identified based on medical diagnosis or reports of fever, sore throat, and cough in the previous one
Rachmalina R, Khusun H, Salim LB et al.S22
month. Participants with diarrhoea were identified based on doctor’s diagnosis or had experienced passing liquid or loose stools three or more times in the previous one month.
Physical activityA short form of the international PA questionnaire (IPAQ) was used to determine PA during the past seven days (IPAQ, 2005).
Household food securityHousehold food security status was determined by using the food security survey module for children aged ≥ 12 years. The nine questions in the module about food situation at home during the past one month were answered by participants. Response to the questions were assumed to be an indication of the food security status of the children, as perceived by the family (Connell et al., 2004).
Socioeconomic statusThe SES of the household was determined based on ownership of assets consisting of the sources of drinking water, electricity and cooking fuel, ownership of toilet, type of latrine, final faecal disposal, ownership of a motorcycle, television, air-conditioner, water heater, 12 kg cooking gas cylinder, refrigerator, and car (MOH Indonesia, 2013).
Data analysis The DDS was computed by assigning a score of one (1) for the consumption of at least 15g/day of a food group, and zero (0) score for intake < 15g/day. The total score for the entire food groups ranged from 0-13. The receiver operating characteristic (ROC) curve was plotted to obtain the DDS cut-off corresponding to the nutritional status of the schoolgirls. For this purpose, we contrasted the DDS with the composite score for the
intake adequacy of energy and protein. The procedure yielded a DDS of 5 as the cut-off for dietary diversity with the area under the curve (AUC) of 0.65, sensitivity of 60%, and specificity of 64% (p= 0.002). This cut-off was also used in examining the relationship between the DDS and nutritional status.
PA was analysed according to the IPAQ guidelines. The subjects were requested to recall the duration of usual their PA in a week. The duration of these activities was then converted into metabolic equivalent (MET) – minutes per week and categorised into high, moderate, and low PA based on the IPAQ guidelines (IPAQ, 2005).
Household food security status was categorised as food-secure or food-insecure, based on the responses to the nine questions in the module. We examined under- and over- reporting of energy intake to check for potential bias in participant’s dietary intake (McCrory et al., 2002).
SES was constructed based on 13 variables that were used to indicate the wealth index (MOH Indonesia, 2013). By using principal component analysis (PCA), a reliability analysis was first conducted, yielding ten variables, which were screened providing a Cronbach’s alpha of 0.686. The PCA yielded a correlation score of > 0.6 for the SES variables. The scores were then ranked into tertiles, where tertile one was the lowest and tertile three the highest SES.
The independent t-test was used to compare the differences in height and body weight between the two nutritional status groups (NG vs UG). The Mann–Whitney test was used to compare the differences in dietary intake and DDS between these two groups. The chi-square test was used to examine the independence between DDS (cut-off < 5 and ≥ 5 food groups) and nutritional status (NG vs UG). Logistic regression

Low dietary diversity among adolescent schoolgirls S23
analysis was undertaken to assess the relationship between the categorical potential predictive factors: DDS, intake adequacy (energy and protein adequacy), morbidity status (history of diarrhoea and upper respiratory tract infection in the previous one month), household food security status, and SES, in predicting the categorical outcome: normal nutritional status versus undernutrition. The potential predictors were selected according to the conceptual framework of nutritional problems and causal factors during adolescence; dietary inadequacies and infectious diseases are immediate cause of undernutrition in adolescence (WHO, 2005). The results of the logistic regression were expressed as the odds ratio and 95% confidence interval. Statistical analyses were performed using SPSS (version 20). P values <0.05 were considered statistically significant.
Ethical approvalThe study protocol was approved by the Research Ethics Committee of the Medical Faculty of Universitas Indonesia in Jakarta (reference number 206/UN.2.F1/ETIK/2015, dated 16 March 2015). The subjects provided written consent prior to data collection.
RESULTS
The study was conducted from March to April in 2015. Out of a total of 220 eligible participants who were selected, 25 were excluded from data analysis due to under- or over-reporting of energy intake. The final analysis was performed on 195 participants, consisting of 100 adolescents in the UG and 95 in the NG.
The mean body weight and height were significantly different between the NG and UG. The mean body weight of the NG (49.3±5.1kg) was significantly higher than that of the UG (40.8±4.0kg)
(Table 1). However, the mean height of the NG at 1.53±0.06m was significantly less than that of the UG at 1.56±0.06m. This indicates that on average, the UG was thinner but somewhat taller than the NG. In line with this, the proportion of stunting was significantly higher in the NG compared to the UG (24.4% vs 12.0%, respectively; p=0.029).
The SES of the UG was worse off than that of the NG, with the former having a significantly higher proportion with low SES (50.0% vs 31.6%, respectively) (Table 1). Overall (i.e. NG and UG), more than half of the adolescent schoolgirls (55.4%) reported having upper respiratory tract infection while a lower proportion (12.3%) had diarrhoea in the previous month. There were no statistically significant differences in the morbidity status between the NG and UG. There was also no significant difference between the two groups in terms of the prevalence of household food insecurity (UG 60.0% vs NG 50.5%), and the proportion of working mothers (UG 25.5% vs 37.6% NG).
The median daily intake of energy, protein, and fat were approximately 1,500 kcal, 49 g, and 62g, respectively; these figures were 72.0%, 83.0% and 87.0%, respectively, of the Indonesian RDA (Table 2). There were no statistically significant differences in the intake of energy, macro- and micro- nutrients between the UG and NG.
Table 3 shows that, overall, <10.0% of the adolescents had adequate energy intake and >60.0% of them attained adequate intake of protein, fat, vitamin A and vitamin B6. Nonetheless, very low proportions of the adolescents had adequate intakes of folate, calcium and zinc. There were no significant differences in energy and nutrient intake adequacy between the UG and NG, except for protein intake adequacy at 83.0% vs 65.3%, respectively.
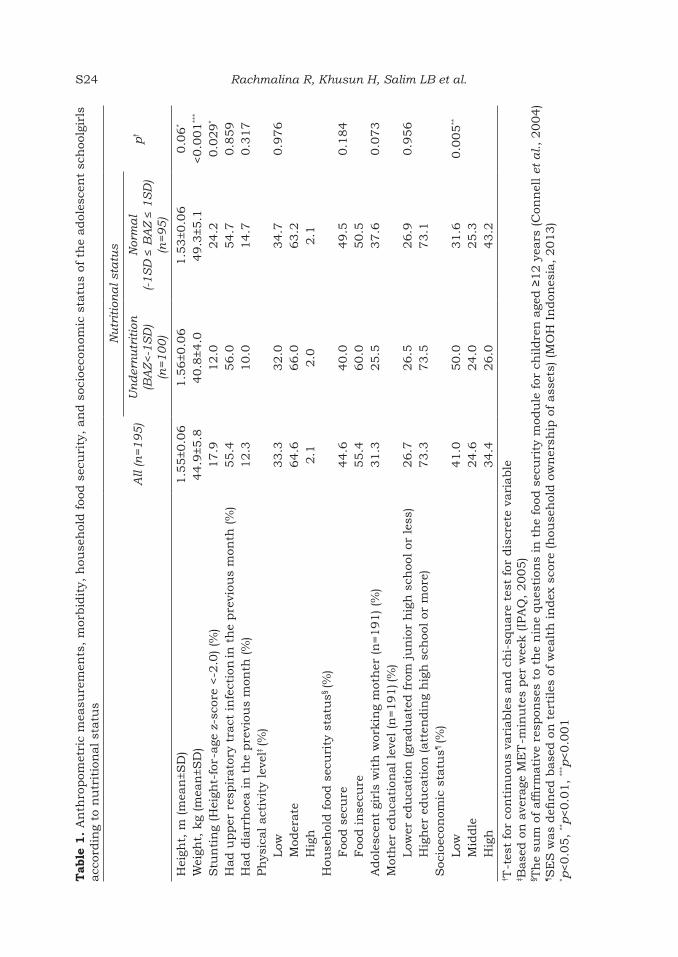
Rachmalina R, Khusun H, Salim LB et al.S24T
able
1.
An
thro
pom
etri
c m
easu
rem
ents
, m
orbid
ity,
hou
seh
old f
ood s
ecu
rity
, an
d s
ocio
econ
omic
sta
tus
of t
he
adol
esce
nt
sch
oolg
irls
acc
ordin
g to
nu
trit
ion
al st
atu
s
All
(n=1
95
)
Nu
trit
ion
al st
atu
s
p†
Un
der
nu
trit
ion
(BA
Z<-1
SD
) (n
=1
00
)
Nor
ma
l(-1
SD
≤ B
AZ ≤
1S
D)
(n=
95
)
Hei
ght,
m (m
ean
±SD
)1.5
5±0
.06
1.5
6±0
.06
1.5
3±0
.06
0.0
6*
Wei
ght,
kg
(mea
n±S
D)
44.9
±5.8
40.8
±4.0
49.3
±5.1
<0.0
01
***
Stu
nti
ng
(Hei
ght-
for-
age
z-s
core
<-2
.0) (%
)17.9
12.0
24.2
0.0
29
*
Had u
pper
res
pir
ato
ry t
ract
in
fect
ion
in t
he
pre
viou
s m
onth
(%
)55.4
56.0
54.7
0.8
59
Had d
iarr
hoe
a in
th
e pre
viou
s m
onth
(%
)12.3
10.0
14.7
0.3
17
Ph
ysic
al act
ivit
y le
vel‡
(%)
Low
33.3
32.0
34.7
0.9
76
Mod
erate
64.6
66.0
63.2
Hig
h2.1
2.0
2.1
Hou
seh
old foo
d s
ecu
rity
sta
tus§
(%)
Foo
d s
ecu
re44.6
40.0
49.5
0.1
84
Foo
d in
secu
re55.4
60.0
50.5
Adol
esce
nt
girl
s w
ith
wor
kin
g m
oth
er (n
=191) (%
) 31.3
25.5
37.6
0.0
73
Mot
her
edu
cati
onal le
vel (n
=191) (%
)Low
er e
du
cati
on (gr
adu
ate
d f
rom
ju
nio
r h
igh
sch
ool or
les
s)26.7
26.5
26.9
0.9
56
Hig
her
edu
cati
on (att
endin
g h
igh
sch
ool or
mor
e)73.3
73.5
73.1
Soc
ioec
onom
ic s
tatu
s¶ (%
)Low
41.0
50.0
31.6
0.0
05
**
Mid
dle
24.6
24.0
25.3
Hig
h
34.4
26.0
43.2
† T-t
est
for
con
tin
uou
s va
riable
s an
d c
hi-
squ
are
tes
t fo
r dis
cret
e va
riable
‡ Base
d o
n a
vera
ge M
ET
-min
ute
s per
wee
k (IP
AQ
, 2005)
§ Th
e su
m o
f affi
rmati
ve r
espon
ses
to t
he
nin
e qu
esti
ons
in t
he
food
sec
uri
ty m
odu
le for
ch
ildre
n a
ged ≥
12 y
ears
(C
onn
ell
et a
l., 2004)
¶S
ES
was
defi
ned
base
d o
n t
erti
les
of w
ealt
h in
dex
sco
re (h
ouse
hol
d o
wn
ersh
ip o
f ass
ets)
(M
OH
In
don
esia
, 2013)
* p<0.0
5,
**p<0.0
1,
*** p
<0.0
01
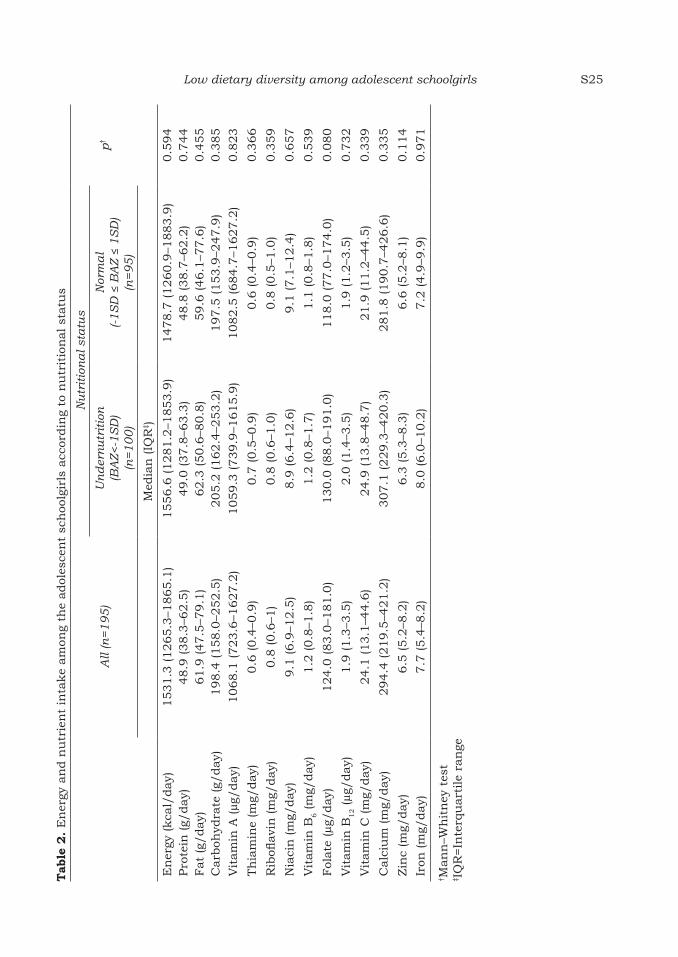
Low dietary diversity among adolescent schoolgirls S25
Tab
le 2
. E
ner
gy a
nd n
utr
ien
t in
take
am
ong
the
adol
esce
nt
sch
oolg
irls
acc
ordin
g to
nu
trit
ion
al st
atu
s
All
(n=1
95
)
Nu
trit
ion
al st
atu
s
p†
Un
der
nu
trit
ion
(BA
Z<-1
SD
)(n
=1
00
)
Nor
ma
l(-1
SD
≤ B
AZ ≤
1S
D)
(n=9
5)
Med
ian
(IQ
R‡ )
En
ergy
(kca
l/day)
1531.3
(1265.3
–1865.1
)1556.6
(1281.2
–1853.9
)1478.7
(1260.9
–1883.9
)0.5
94
Pro
tein
(g/
day)
48.9
(38.3
–62.5
)49.0
(37.8
–63.3
)48.8
(38.7
–62.2
)0.7
44
Fat
(g/day)
61.9
(47.5
–79.1
)62.3
(50.6
–80.8
)59.6
(46.1
–77.6
)0.4
55
Carb
ohyd
rate
(g/
day)
198.4
(158.0
–252.5
)205.2
(162.4
–253.2
)197.5
(153.9
–247.9
)0.3
85
Vit
am
in A
(µg/
day)
1068.1
(723.6
–1627.2
)1059.3
(739.9
–1615.9
)1082.5
(684.7
–1627.2
)0.8
23
Th
iam
ine
(mg/
day)
0.6
(0.4
–0.9
)0.7
(0.5
–0.9
)0.6
(0.4
–0.9
)0.3
66
Rib
oflavi
n (m
g/day)
0.8
(0.6
–1)
0.8
(0.6
–1.0
)0.8
(0.5
–1.0
)0.3
59
Nia
cin
(m
g/day)
9.1
(6.9
–12.5
)8.9
(6.4
–12.6
)9.1
(7.1
–12.4
)0.6
57
Vit
am
in B
6 (m
g/day)
1.2
(0.8
–1.8
)1.2
(0.8
–1.7
)1.1
(0.8
–1.8
)0.5
39
Fol
ate
(µg/
day)
124.0
(83.0
–181.0
)130.0
(88.0
–191.0
)118.0
(77.0
–174.0
)0.0
80
Vit
am
in B
12 (µg/
day)
1.9
(1.3
–3.5
)2.0
(1.4
–3.5
)1.9
(1.2
–3.5
)0.7
32
Vit
am
in C
(m
g/day)
24.1
(13.1
–44.6
)24.9
(13.8
–48.7
)21.9
(11.2
–44.5
)0.3
39
Calc
ium
(m
g/day)
294.4
(219.5
–421.2
)307.1
(229.3
–420.3
)281.8
(190.7
–426.6
)0.3
35
Zin
c (m
g/day)
6.5
(5.2
–8.2
)6.3
(5.3
–8.3
)6.6
(5.2
–8.1
)0.1
14
Iron
(m
g/day)
7.7
(5.4
–8.2
)8.0
(6.0
–10.2
)7.2
(4.9
–9.9
)0.9
71
† Man
n–W
hit
ney
tes
t‡ I
QR
=In
terq
uart
ile
ran
ge

Rachmalina R, Khusun H, Salim LB et al.S26
Based on a DDS cut-off of <5, almost half of all the girls (46.2%) daily consumed a low diversity of foods, with no significant difference between the NG and UG (Table 4). The food groups consumed by the majority of all the adolescents on a daily basis were starchy staples (100%), flesh foods and animal protein (85.1%), legumes and nuts (55.9%) and egg (54.4%). They consumed a low percentage of fruits, only about one-third reported taking vegetables, on a daily basis. Significant differences were observed for the daily intake of legumes and nuts (NG 42.1% vs UG 69.0%), and vitamin C-rich vegetables (NG 14.7% vs UG 28.0%). Higher intake of legumes and nuts by the UG may explain the finding of significant
difference of protein intake adequacy between this group and the NG, as shown in Table 3. Daily consumption of the other food groups did not show significant differences between the NG and UG girls.
The logistic regression analysis showed that among the factors studied, two were found to have significant influence on the nutritional status outcome of the adolescent schoolgirls living in the slum areas of Jakarta. Household SES and protein intake adequacy were significantly associated with the nutritional status of the schoolgirls (Table 5). Protein intake inadequacy was associated with a less likelihood of attaining normal nutritional status (OR=0.4; 95% CI: 0.2-0.8;
Table 3. Percentage of the adolescent schoolgirls according to nutritional status meeting energy and nutrient intake adequacy†
All (n=195)
Nutritional status
p‡Undernutrition(BAZ<-1SD)
(n=100)
Normal(-1SD ≤ BAZ ≤ 1SD)
(n=95)
Energy 9.7 12.0 7.4 0.276Protein 74.4 83.0 65.3 0.005**
Fat 63.1 66.0 60.0 0.386Carbohydrate 34.9 38.0 31.6 0.347Vitamin A 92.8 95.0 90.5 0.226Thiamine 22.6 25.0 20.0 0.404Riboflavin 17.4 20.0 14.7 0.333Niacin 47.7 47.0 48.4 0.843Vitamin B
6 61.0 63.0 58.9 0.562Folate 6.2 7.0 5.3 0.614Vitamin B12 49.2 50.0 48.4 0.826Vitamin C 19.0 20.0 17.9 0.708Calcium 0.5 1.0 0.0 0.328Zinc 4.6 6.0 3.2 0.344
†Energy and protein requirements were calculated by using estimated energy requirement and protein requirement to specific body weight (FAO, WHO & UNU, 2001; WHO, FAO & UNU, 2007). Fat and carbohydrate adequacy were taken as meeting at least 77% of the Indonesian RDA (MOH Decree, 2013). Estimated average requirement was used to evaluate micronutrient adequacy (WHO & FAO, 2006). Dietary intake above these requirements was classified as energy and nutrient adequacy.‡Chi-square test**p<0.01

Low dietary diversity among adolescent schoolgirls S27
Tab
le 4
. D
istr
ibu
tion
(%
) of
die
tary
div
ersi
ty s
core
s (D
DS
) an
d f
ood g
rou
ps
con
sum
ed b
y th
e adol
esce
nt
sch
oolg
irls
acc
ordin
g to
n
utr
itio
nal st
atu
s
All
(n=1
95
)
Nu
trit
ion
al st
atu
s
p†
Un
der
nu
trit
ion
(BA
Z<-1
SD
) (n
=1
00
)
Nor
ma
l(-1
SD
≤BA
Z≤1
SD
) (n
=9
5)
Die
tary
div
ersi
ty s
core
, m
edia
n (IQ
R)
5.0
(4.0
–6.0
)5.0
(3.0
–6.0
)5.0
(4.0
–6.0
)0.1
13
DD
S <
5 (%
)46.2
43.0
49.5
0.3
65
DD
S ≥
5 (%
)53.8
57.0
50.5
Foo
d g
rou
ps
(%)
Sta
rch
y st
aple
s100.0
100.0
100.0
1.0
00
Leg
um
es a
nd n
uts
55.9
69.0
42.1
<0.0
1**
Dair
y pro
du
cts
42.1
41.0
43.2
0.7
61
Org
an
mea
ts5.1
6.0
4.2
0.5
72
Egg
s 54.4
57.0
51.6
0.4
49
Sm
all fi
sh e
ate
n w
ith
bon
e4.6
3.0
6.3
0.2
71
Fle
sh foo
ds
an
d a
nim
al pro
tein
85.1
81.0
89.5
0.0
97
Vit
am
in A
-ric
h d
eep y
ello
w/or
an
ge/re
d v
eget
able
s33.8
33.0
34.7
0.7
98
Vit
am
in A
-ric
h d
eep g
reen
lea
fy v
eget
able
s23.1
22.0
24.2
0.7
15
Vit
am
in A
-ric
h f
ruit
s6.2
5.0
7.4
0.4
93
Vit
am
in C
-ric
h v
eget
able
s21.5
28.0
14.7
0.0
25
*
Vit
am
in C
-ric
h f
ruit
s15.4
58.0
63.2
0.1
52
Oth
er fru
its
an
d v
eget
able
s39.5
42.0
36.8
0.4
63
† Ch
i-sq
uare
tes
t; M
an
n–W
hit
ney
tes
t fo
r die
tary
div
ersi
ty s
core
* p<0.0
5**p<0.0
1

Rachmalina R, Khusun H, Salim LB et al.S28
p=0.006). Schoolgirls from households with low SES were 2.7 times more likely to be undernourished than those from households with high SES (OR=2.7; 95% CI: 1.3-5.5; p=0.006). The other factors that were studied including DDS, energy intake, morbidity status, and household food security were not found to exert a significant influence on the nutritional status outcome of the adolescent schoolgirls.
DISCUSSION
Data on dietary intake and dietary diversity among adolescents are limited
in Indonesia. Interventions to improve the dietary intake of adolescents are also lacking. The results of this study provide some insights into the quality and variety of food consumed by adolescent schoolgirls from slum areas in Central Jakarta.
On the average, Indonesian adolescents showed a lower DDS (less than five food groups) than some other countries. By comparison, Iranian adolescent girls consumed an average of approximately six food groups (range 5–14 food groups) (Akbari & Azadbakht, 2014). and the mean DDS was 5.76 for
Table 5. Logistic regression analysis in predicting nutritional status of the adolescent girls (n=195) according to potential factors
Normal nutritional status vs undernutrition†
Potential factors OR 95% CI p
Dietary diversity score (DDS)DDS ≥5 (reference)DDS <5
Dietary intake
1.1 0.6-2.0 0.805
Energy intake adequacy (reference)Energy intake inadequacy
0.7 0.3-1.9 0.494
Protein intake adequacy (reference)Protein intake inadequacy
Morbidity status
0.4 0.2-0.8 0.006**
Had upper respiratory tract infection Without upper respiratory tract infection (reference)
1.0 0.6-1.9 0.899
Had diarrhoeaWithout diarrhoea (reference) 0.6 0.3-1.6 0.328
Household food securityFood secure (reference)Food insecure
Socioeconomic status
1.3 0.7-2.4 0.405
High SES (reference)Middle SES
1.5 0.7-3.2 0.323
Low SES 2.7 1.3-5.5 0.006**
†Normal BMI-for-age score or BAZ: (–1SD ≤ BAZ ≤ +1SD) as reference vs undernutrition (BAZ < -1SD)**p<0.01

Low dietary diversity among adolescent schoolgirls S29
urban adolescent schoolgirls in Ethiopia with 76% of them having adequate dietary diversity (Birru, Tariku & Belew, 2018).
The diet of the adolescent schoolgirls in this study was predominantly based on starchy staples. More than half of the girls reported taking animal protein foods and legumes and nuts. A low percentage of them consumed fruit and vegetables on a daily basis, when compared to the finding of the national survey in Indonesia, which reported vegetable consumption among Indonesian adolescents aged 13–18 years at 94.7% (Hermina & Prihartini, 2016). In studies on adolescents conducted in Africa and Canada, low energy and nutrient intake were generally found in adolescents from households with low SES and food insecurity (Kirkpatrick & Tarasuk, 2008; Dapi et al., 2010). In low income households, common barriers to low fruit and vegetable intake were the unavailability and poor access to affordable types of fruit and vegetables, a lack of knowledge about healthy foods, the poor quality of the produce, and budgetary constraints (Huang, Edirisinghe & Burton-Freeman, 2016). A poor knowledge of nutrition among adolescent school girls was reported by a study conducted in 12 districts of Indonesia, which showed that less than half of adolescents aged 10-19 years were aware of health benefits of fruits (43.7%) and vegetables (36.2%) (Sudirman & Jahari, 2012). Therefore, disseminating knowledge of the health benefits of fruits and vegetables is essential. The public sector should enable people to have better access to reduce retail prices so that a wider variety of foods is affordable to all socioeconomic strata in a community (Nair, Augustine & Konapur, 2016).
Several studies have revealed that dietary diversity is consistently
associated with micronutrient adequacy in children and adolescents (Korkalo et al., 2017; Zhao et al., 2017). Women of reproductive age in five developing countries reported that dietary diversity consistently predicts micronutrient adequacy (Arimond et al., 2010).
This study showed that the adolescents had low nutrient intake, particularly of vitamin B1, vitamin B2, folate, vitamin C, calcium, and zinc. Macronutrient intake, except for fat, was below the national requirements for Indonesian adolescents aged 14–18 (MOH Indonesia, 2014b). The latest Indonesian dietary survey revealed that the highest proportion of energy inadequacy was among adolescents aged 13–18 (MOH Indonesia, 2014b). This is consistent with the literature regarding dietary intake among adolescents in developing countries, which has highlighted the poor diet quality in this age group (Ochola & Masibo, 2014). Their diets are known to be limited in diversity, particularly in the fruit and vegetable food groups (Zhao et al., 2017). Further, energy and micronutrient intake were found to be inadequate in the majority of adolescents in developing countries (Ochola & Masibo, 2014). These findings indicate that nutrition policies and programmes are important to improve the food intake of adolescents for growth, cognition, and educational achievements (Ochola & Masibo, 2014).
This study found that low household SES had a strong influence on the nutritional status of the adolescents. This is consistent with findings elsewhere in other groups such as that of a study of pregnant women in Kenya, which reported that socioeconomic factors including employment status, household assets, and land ownership influenced dietary diversity in pregnant women (Kiboi, Kimiywe & Chege, 2017).

Rachmalina R, Khusun H, Salim LB et al.S30
CONCLUSION
The diet of adolescent schoolgirls living in slum areas in Jakarta was inadequate in terms of dietary adequacy and diversity. The Indonesian Ministry of Health issued dietary guidelines in the 2014 on principles of a balanced diet. However, these guidelines may not be well disseminated, and key elements of it, including “consume a variety of foods”, are not widely known or understood. Interventions directed at promoting good diets through dietary diversification among adolescent schoolgirls, are recommended for schools and the community at large.
Acknowledgements
The authors are grateful to all the investigators and adolescent schoolgirls who took part in this study.
Authors’ contributions
RR, designed research, carried out data collection, analysed and interpreted the data, and developed manuscript; HK, designed research, interpreted the data and critically reviewed the manuscript; LBS, carried out data collection; LAAW, critically reviewed the manuscript; DHSD, designed research and critically reviewed the manuscript. All authors have seen and approved the final manuscript.
Conflict of interest
The authors declare no conflict of interest.
References
Akbari F & Azadbakht L (2014). A systematic review on diet quality among Iranian Youth: Focusing on reports from Tehran and Isfahan. Archives of Iranian Medicine 17(8):574–584. https://doi.org/014178/aim.0010.
Arimond M, Elin L, Wiesmann D, Joseph M & Carriquiry A (2008). Dietary Diversity as a Measure of Women’s Diet Quality in Resource-Poor Areas: Results from rural Bangladesh site. Food and Nutrition Technical Assistance (FANTA) Project/Academy for Educational Development (AED), Washington DC.
Arimond M, Wiesmann D, Becquey E, Carriquiry A, Daniels MC, Deitchler M, Fanou-Fogny N, Joseph ML, Kennedy G, Martin-Prevel Y & Torheim LE (2010). Simple Food Group Diversity Indicators Predict Micronutrient Adequacy of Women ’ s Diets in, 2059–2069. J Nutr 140(11):2059S–2069S. https://doi.org/10.3945/jn.110.123414.2059S.
Birru SM, Tariku A & Belew AK (2018). Improved dietary diversity of school adolescent girls in the context of urban Northwest Ethiopia: 2017. Italian Journal of Pediatrics 44(1):48. https://doi.org/10.1186/s13052-018-0490-0.
Cappa C, Wardlaw T, Langevin-Falcon C & Diers J (2012). Progress for Children - A report card on adolescents. United Nations publication, New York.
Connell CL, Nord M, Lofton KL & Yadrick K (2004). Food security of older children can be assessed using a standardized survey instrument. The Journal of Nutrition 134(10):2566–2572.
Dapi LN, Hörnell A, Janlert U, Stenlund H & Larsson C (2010). Energy and nutrient intakes in relation to sex and socio-economic status among school adolescents in urban Cameroon, Africa. Public Health Nutrition 14(5): 904–913. https://doi.org/10.1017/S1368980010003150.
Erhardt J (2007). Nutrition surveys and calculations. From http://www.nutrisurvey.de/. [Retrieved February 4 2015].
FAO, WHO & UNU (2001). Human energy requirements. Scientific background papers from the Joint FAO/WHO/UNU Expert Consultation. From http://www.ncbi.nlm.nih.gov/pubmed/16277811. [Retrieved January 12 2015].
Gibson RS (2005). Principles of nutritional assessment. Oxford University Press, New York.
Gibson RS & Ferguson EL (2008). An interactive 24-hour recall for assessing the adequacy of iron and zinc intakes in developing countries (Vol. 8). HarvestPlus Technical Monograph 8, Washington DC. https://doi.org/10.1007/BF02927624.
Hermina & Prihartini S (2016). Fruits and vegetables consumption of Indonesian population in the context of balanced nutrition: a further analysis of Individual Food Consumption Survey (SKMl) 2014. From https://media.neliti.com/media/publications/67991-ID-gambaran-konsumsi-sayur-dan-buah-pendudu.pdf. [Retrieved January 26 2019].

Low dietary diversity among adolescent schoolgirls S31
Huang Y, Edirisinghe I & Burton-Freeman BM (2016). Low-income shoppers and fruit and vegetables: What do they think? Nutrition Today 51(5):242–250. https://doi.org/10.1097/NT.0000000000000176.
IPAQ (2005). Guidelines for Data Processing and Analysis of the International Physical Activity Questionnaire (IPAQ) – Short and Long Forms Questionnaire. From https://sites.google.com/site/theipaq/scoring-protocol. [Retrieved May 28 2015].
Jayawardena R, Byrne NM, Soares MJ, Katulanda P, Yadav B & Hills AP (2013). High dietary diversity is associated with obesity in Sri Lankan adults: an evaluation of three dietary scores. BMC Public Health 13:314. https://doi.org/10.1186/1471-2458-13-314.
Kiboi W, Kimiywe J & Chege P (2017). Determinants of dietary diversity among pregnant women in Laikipia County, Kenya: a cross-sectional study. BMC Nutrition 3(1):12. https://doi.org/10.1186/s40795-017-0126-6.
Kirkpatrick SI & Tarasuk V (2008). Food insecurity is associated with nutrient inadequacies among Canadian adults and adolescents. The Journal of Nutrition 138(3):604–612.
Korkalo L, Erkkola M, Heinonen AE, Freese R, Selvester K & Mutanen M (2017). Associations of dietary diversity scores and micronutrient status in adolescent Mozambican girls. European Journal of Nutrition 56(3):1179–1189. https://doi.org/10.1007/s00394-016-1167-3.
Lee SJ & Ryu HK (2018). Relationship between dietary intakes and the double burden of malnutrition in adults of Malang, Indonesia: An exploratory study. Nutrition Research and Practice 12(5):426–435. https://doi.org/10.4162/nrp.2018.12.5.426.
Mahmudiono T, Sumarmi S & Rosenkranz RR (2017). Household dietary diversity and child stunting in East Java, Indonesia. Asia Pacific Journal of Clinical Nutrition 26(2):317–325.https://doi.org/10.6133/apjcn.012016.01.
McCrory MA, McCrory MA, Hajduk CL & Roberts SB (2002). Procedures for screening out inaccurate reports of dietary energy intake. Public Health Nutrition 5(6A): 873–882. https://doi.org/10.1079/PHN2002387.
MOH Decree (2013). Angka Kecukupan Gizi Yang Dianjurkan Bagi Bangsa Indonesia, Pub. L. No. Nomor 75 Tahun 2013. Menteri Kesehatan Republik Indonesia, Jakarta.
MOH Indonesia (2013). Basic Health Research 2013. NIHRD Press, Jakarta.
MOH Indonesia (2014a). Food photograph book: Individual food consumption survey. NIHRD Press, Jakarta.
MOH Indonesia (2014b). Individual food consumption survey Indonesia 2014. NIHRD Press, Jakarta.
Nair MK, Augustine LF & Konapur A (2016). Food-Based Interventions to Modify Diet Quality and Diversity to Address Multiple Micronutrient Deficiency. Frontiers in Public Health 3(January):1–14. https://doi.org/10.3389/fpubh.2015.00277.
Ochola S & Masibo PK (2014). Dietary Intake of Schoolchildren and Adolescents in Developing Countries. Annals of Nutrition and Metabolism 64(s2):24–40. https://doi.org/10.1159/000365125.
Stang J & Story M (2005). Guidelines for Adolescent Nutrition Services. University of Minnesota, Minneapolis.
Sudirman H & Jahari AB (2012). Pengetahuan, sikap dan perilaku remaja tentang keluarga sadar gizi (Kadarzi): dengan perhatian khusus terhadap pantauan berat badan dan mengonsumsi makanan beragam. Media Penelitian dan Pengembangan Kesehatan 22(2):93-105. From http://ejournal.litbang.depkes.go. id/index.php/MPK/art ic le/view/2632/615. [Retrieved January 26 2019].
Thomaz EBAF, Cangussu MCT, da Silva AAM & Assis AMO (2010). Is malnutrition associated with crowding in permanent dentition? International Journal of Environmental Research and Public Health 7(9):3531–3544. https://doi.org/10.3390/ijerph7093531.
USAID & SPRING (2015). Nutrition of Adolescent Girls and Women of Reproductive Age in Low- and Middle-Income Countries: Current Context and Scientific Basis for Moving Forward. From www.spring-nutrition.org. [Retrieved September 27 2018].
WHO (2005). Nutrition in adolescence – Issues and Challenges for the Health Sector. WHO Library Cataloguing, Ganeva.
WHO (2009). World Health Organization. AnthroPlus for Personal Computers. Manual: Software for assessing growth of the world’s children. From http://www.who.int/growthref/tools/en/. [Retrieved November 15 2016].

Rachmalina R, Khusun H, Salim LB et al.S32
WHO (2010). Nutritional Landscape Information System: Country Profile Indicators: Interpretation Guide. WHO Press, Geneva.
WHO & FAO (2006). Guidelines on food fortification with micronutrients. In L Allen, B De Benoist, O Dary & R Hurrell (Eds.). WHO, Geneva.
WHO, FAO & UNU (2007). Protein and amino acid requirements in human nutrition. From http://www.ncbi.nlm.nih.gov/pubmed/18330140. [Retrieved January 12 2015].
Zhao W, Yu K, Tan S, Zheng Y, Zhao A, Wang P & Zhang Y (2017). Dietary diversity scores: An indicator of micronutrient inadequacy instead of obesity for Chinese children. BMC Public Health 17(1):1–11. https://doi.org/10.1186/s12889-017-4381-x.

Mal J Nutr 25 (Supplement): 33-46, 2019
__________________________
*Corresponding author: Dr. Judhiastuty FebruhartantySEAMEO RECFON, Jl. Salemba Raya 6, Central Jakarta, 10430, Indonesia.Tel: +628129260634, Fax: +62-21 3913933Email: [email protected]; [email protected]
Food purchasing behaviour among urban slum women in East Jakarta: a qualitative study
Dian Sufyan1,2, Judhiastuty Februhartanty2*, Saptawati Bardosono1, Helda Khusun2, Evi Ermayani2, Purnawati Hustina Rachman2 & Anthony Worsley3
1Nutrition Department, Faculty of Medicine, Universitas Indonesia/Dr Cipto Mangunkusumo General Hospital, Jakarta, Indonesia; 2 Southeast Asian Ministers of Education Organization Regional Centre for Food and Nutrition (SEAMEO RECFON)/Pusat Kajian Gizi Regional (PKGR) Universitas Indonesia, Jakarta, Indonesia; 3Institute of Physical Activity and Nutrition, School of Exercise and Nutrition Sciences, Deakin University, Melbourne, Australia.
ABSTRACT
Introduction: Urbanisation in Indonesia has been associated with a transition in nutrition which has been, in part, marked by an increased purchasing of ready-to-eat, energy-dense, nutrient-poor foods. Women are responsible for purchasing and preparing food for the family. Their purchasing behaviours differ in various environments and population groups. This qualitative study was undertaken to explore the food environmental factors that influenced food purchasing behaviour of women who were the household food gatekeepers. Methods: The study was conducted in a slum area in East Jakarta. Eighteen overweight-obese and non-obese women who fulfilled the study’s inclusion criteria were recruited for interviews that used a semi-structured questionnaire. Emic observations were conducted in order to identify typical food purchasing activities. The data were coded and categorised using qualitative data analysis and research software (Atlas.ti 7 for Windows). Results: Most of the women purchased ready-to-eat foods rather than cook at home, either for the family or their own consumption. Several food environmental factors influenced women’s purchasing behaviour, including time and cost efficiency, food availability, family, exposure to ready-to-eat foods and food store marketing strategies. These factors led to the consumption of unhealthy foods that were high in fat, carbohydrate, sugar and salt that some of which may cause obesity. Conclusion: Purchasing unhealthy food was observed to be strongly linked with food-related environmental factors. This study provides an understanding of women’s food purchasing behaviour and highlight potential ways to foster healthier purchasing behaviour among urban slum dwellers.
Keywords: Food purchasing behaviour, food environment, food stores, urban slum women, Indonesia
INTRODUCTION
Overnutrition results in being overweight and obese. Its related consequences are a major concern worldwide (Center
for Chronic Disease Prevention, 2010; Abraham, Miruts & Shumye, 2015), including Southeast Asia (Ramachandran et al., 2012). The Indonesian basic health surveys of

Sufyan D, Februhartanty J, Bardosono S et al.S34
2007, 2010, 2013 and 2018 recorded substantial increases in the prevalence of overweight and obesity of 19.1%; 26.9%; 33.0% and 35.4%, respectively, among adult women, especially those living in urban slums (Kemenkes RI, 2008; Kemenkes RI, 2010; Kemenkes RI, 2013a; Kemenkes RI, 2018). Meanwhile, the prevalence of thinness among adult women has decreased from 14.8% to 10.1% between 2007 and 2013 (Kemenkes RI, 2008; Kemenkes RI, 2010; Kemenkes RI, 2013a). The increasing trend of overweight and obesity among adult women is expected to persist as migration from rural to urban areas in Indonesia is projected to rise (United Nations, 2014). The city of Jakarta being the most desired destination of poor migrants (Harahap, 2013), has a higher prevalence of overweight and obesity among women (40.8%) than the national average (33.0%) (Kemenkes RI, 2013b).
Urbanisation is associated with a change of nutritional practices that is marked by an increase in the consumption of energy-dense foods (Kac & Pérez-Escamilla, 2013; Ramachandran et al., 2012). It has been reported that low income inhabitants in urban slums, consume more convenience foods rather than fresh foods (Smil, 2000). This problem may be exacerbated among women who were unable to select healthier foods for their family within their limited budgets, especially in areas where food diversity is restricted (Akter, 2009; Kimani-Murage et al., 2014). In addition, neighbourhood food stores in urban slums offer mainly low-quality foods to match the low purchasing power of these women (Mikkelsen & Chehimi, 2007). Food insecurity and undernutrition in urban slums often arise from lack of access, availability and diversity of healthier foods (Mohiddin, Phelps & Walters, 2012).
The food purchasing behaviour of women are influenced by household and
environmental factors, such as family income, food price, food availability and practicality (Kimani-Murage et al., 2014; Antin & Hunt, 2012). A study among low income Spanish families revealed that food purchasing without proper nutrition knowledge and skill led them purchased calorie-dense, low fibre, and high in fat and carbohydrate foods. (Cortés et al., 2013). This is reasonable, since energy density and energy cost are inversely linked, and “obesity-promoting” foods offer more dietary energy at reduced cost (Drewnowski & Specter, 2004). Foods high in fats and carbohydrates are rendered more palatable as they provide more sensory enjoyment and delay satiety (Johnson & Wardle, 2014). Unfortunately, these are the types of foods that low income families can afford.
Living in an environment where affordable, ready-to-eat foods are available, and where the time for food preparation is limited, women tend to seek alternatives to cook at home (Vabø & Hansen, 2014; Worsley et al., 2014). In view of a paucity of studies investigating the factors that influence food purchasing behaviour in Indonesia, the present qualitative study is aimed at investigating the association between the food environment in an urban slum setting and women’s food purchasing behaviour.
MATERIALS AND METHODS
Study settingEast Jakarta is the most desired destination for Indonesians who migrate from rural to urban areas (Hasudungan, Antokida & Dewi, 2018). The Jakarta District (DKI Jakarta, “Special Capital District”) had the third highest adult overweight and obese prevalence among the provinces in Indonesia (Kemenkes RI, 2013b). Kampung Melayu was purposively selected among the villages

Food shopping behaviours of women in Jakarta Indonesia S35
in the area, since it had the highest social vulnerability index in the district, indicating that Kampung Melayu was at high risk of poverty, health, social and economic problems (Badan Pusat Statistik Provinsi DKI Jakarta, 2014).
Study participants and recruitmentEligible participants were women aged 19–60 years, residing in Kampung Melayu, in apparently good health and who were not pregnant or disabled. The recruitment of participants was based on the following criteria: level of education (elementary/junior/senior high school/diploma), working status (yes/no), self-reported body mass index (BMI) categories (non-obese/overweight-obese) and whether they had children (<5 years old/older). Differences in the BMI status were noted in order to investigate different weight manifestations within the same food environment. A female community health volunteer (FCHV) who was actively involved in communal activities was approached to help recruit the targeted participants. Recruitment was stopped when thematic saturation was achieved, that is, when no new insights emerged from the interviews. A total of 18 women, 12 non-obese and six overweight/obese, were recruited and all of them completed the study.
Ethical considerationsThe research proposal was fully
approved by the Health Research Ethics Committee of the Faculty of Medicine, Universitas Indonesia (approval number 143/UN2.FI/ETIK/2015). Written informed consent was obtained from each participant prior to data collection.
Data collectionData were collected using in-depth interviews of the participants. All interviews were conducted in the Indonesian language (Bahasa Indonesia). A semi-structured questionnaire was developed by the first author, in consultation with the second and third authors. The questionnaire was pilot tested in another nearby village to ensure the reliability and consistency of the questions. Table 1 shows the semi-structured questionnaire that was used in the interviews.
The first author spent one month, from November to December, 2015, staying in Kampung Melayu village for data collection. Data collection commenced with a transect walk to map out the physical setting of the area, as well as engaging with key persons, such as the FCHV and the community leader. In-depth interviews were conducted face-to-face with the selected 18 women. Participants were individually interviewed for approximately one hour. All interviews were audio-taped with the permission of the participants, and field notes were taken by a research assistant
Table 1. Semi-structured question guide used in in-depth interview of the participants (n=18)
Item Question
1. Based on your experience as food gatekeeper, what do you do to prepare food at home for breakfast/lunch/dinner?
2. How often do you buy outside food to provide food at home? What kind of food do you usually buy and why?
3. What are the factors that influence you to buy food rather than to cook at home?
4. What do you purchase when your household have or does not have enough money?
5. Based on the figure scale, which figure represents your body?

Sufyan D, Februhartanty J, Bardosono S et al.S36
to capture unspoken information such as actions. Interviews took place at the residence of either the participants or FCHV. No interview was repeated.
Each informant was requested to choose a rating scale of photographic figures (Figure 1) that she perceived was closest to her own body weight (Mutale et al., 2016). Each response was then cross-checked with her self-reported body weight and height, and physical appearance.
In addition to the interviews, the first author was involved in gaining an emic perspective of the residents’ norms, beliefs and way of life, including how they interacted with each other and with their surroundings. Specifically, by staying within the community, the researcher gained access to the food purchasing activities of the residents, which took place around the clock every day, enabling the researcher to assess the extent to which the food environment provided the needs of the community.
Data analysisThe verbatim transcripts from the interviews served as raw data. They were analysed using a thematic analysis that allowed the identification of categories
or themes within the qualitative data (Maguire & Delahunt, 2017). Observation notes, videos and pictures were used to complement the transcription. The entire process was summarised into five steps. The first step transcribed the recorded interview to produce a ready-to-import-file for input into the software. In the second step, the authors read repeatedly the transcripts in order to be familiar with the data. The third step attached labels to the data to identify codes and categories using Atlas.ti 7 for Windows. Similar codes and categories were grouped to identify themes for the fourth step. Gathering the codes led to a comprehensive view of information. In the last step the authors repeatedly reviewed the data to identify the flow for final analysis.
RESULTS
The 18 participants were aged 28-51 years. Most were senior high school graduates, not working and had under five children (Table 2). Among the participants, 12 were non-obese and six were overweight/obese based on self-reported body weight and height estimations. Purchasing food from nearby
Figure 1. Photographic figure rating scale: bodies 1-3 are underweight, bodies 4-6 are in the normal BMI and bodies 7-9 are overweight/obese (Mutale et al., 2016)†
†Notes: In this study bodies 1-6 were classified as non-obese
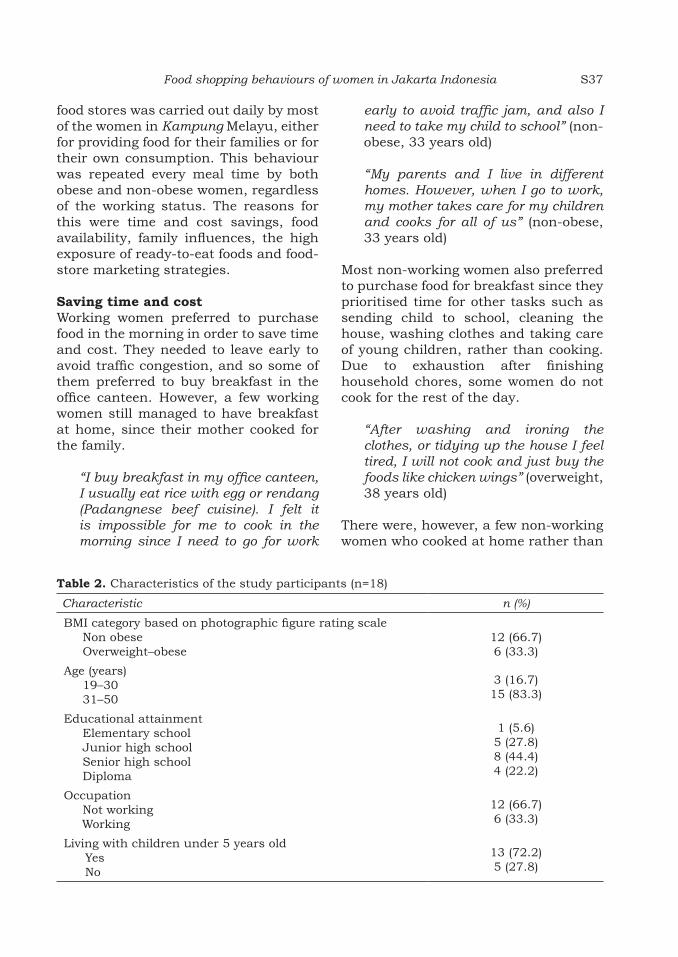
Food shopping behaviours of women in Jakarta Indonesia S37
food stores was carried out daily by most of the women in Kampung Melayu, either for providing food for their families or for their own consumption. This behaviour was repeated every meal time by both obese and non-obese women, regardless of the working status. The reasons for this were time and cost savings, food availability, family influences, the high exposure of ready-to-eat foods and food-store marketing strategies.
Saving time and cost Working women preferred to purchase food in the morning in order to save time and cost. They needed to leave early to avoid traffic congestion, and so some of them preferred to buy breakfast in the office canteen. However, a few working women still managed to have breakfast at home, since their mother cooked for the family.
“I buy breakfast in my office canteen, I usually eat rice with egg or rendang (Padangnese beef cuisine). I felt it is impossible for me to cook in the morning since I need to go for work
early to avoid traffic jam, and also I need to take my child to school” (non-obese, 33 years old)
“My parents and I live in different homes. However, when I go to work, my mother takes care for my children and cooks for all of us” (non-obese, 33 years old)
Most non-working women also preferred to purchase food for breakfast since they prioritised time for other tasks such as sending child to school, cleaning the house, washing clothes and taking care of young children, rather than cooking. Due to exhaustion after finishing household chores, some women do not cook for the rest of the day.
“After washing and ironing the clothes, or tidying up the house I feel tired, I will not cook and just buy the foods like chicken wings” (overweight, 38 years old)
There were, however, a few non-working women who cooked at home rather than
Table 2. Characteristics of the study participants (n=18)
Characteristic n (%)
BMI category based on photographic figure rating scaleNon obeseOverweight–obese
12 (66.7)6 (33.3)
Age (years)19–3031–50
3 (16.7)15 (83.3)
Educational attainmentElementary schoolJunior high schoolSenior high schoolDiploma
1 (5.6)5 (27.8)8 (44.4)4 (22.2)
OccupationNot workingWorking
12 (66.7)6 (33.3)
Living with children under 5 years oldYesNo
13 (72.2)5 (27.8)

Sufyan D, Februhartanty J, Bardosono S et al.S38
purchase outside food, out of concern for hygiene. By cooking at home, they could ensure the cleanliness of the food that was consumed.
“I don’t like buying ready-to-eat-foods. I am sorry but it is sometimes smelly, the chilli smells uncooked or spoilt and isn’t tasty. I don’t mean to be conceited, but the seller also uses too much oil. As such, it is better to cook at home. We know the quality of the ingredients and it is cleaner” (obese, 33 years old)
Cost was another factor mentioned by the participants. Most of the women believed that cooking at home cost them more than purchasing ready-to-eat foods. However, there were a few women who said contrary, that cooking at home was less expensive when considering the number of family members needed to be fed. They had more than two children and felt it would cost them more if they purchased food from outside and therefore preferred to cook at home.
“…I visit the traditional market only once in a while because I rarely cook at home. I spend almost IDR 85000 (USD 6) a day if I cook, but I spend only IDR 50000 (USD 3) if I purchase foods” (obese, 32 years old)
Time and cost factors were linked to each other and to the type of food purchased. Those working women who perceived that spending money for purchasing foods was cost-effective did so as long as they could save more time to attend to other matters.
“Well, I realize that my time is tight. Any means of saving more time is important, including buying ready-to-eat-foods, so that I can do other things” (non-obese, 33 years old)
With a limited food budget, women tried to buy foods that matched their demands for inexpensive, tasty and foods that make them feel full. An example of such food was “Kerongkongan” (fried chicken flank with minimal flesh and marinated with seasonings) that regarded as cheap, tasty, affordable and which could be shared within family. Chicken thighs and breasts that contained less skin were less preferred because they were more expensive and not as tasty as chicken wings and chicken feet. Seafood and beef were less preferred because they were expensive. Beef was only consumed at the annual Muslim celebration of Eid, and they had to save money for a year to be able to afford it.
“The chicken wings only cost IDR 3000 (~ USD 0.23 ) and IDR 2500 (~ USD 0.19) for chicken’s head, but chicken breast and thigh are more expensive. They also prefer to buy kerongkongan because it costs only IDR 5000 (~ USD 0.38) for a whole chicken, not pieces, so then they can share it with other family members“ (43-year-old FCHV)
Food availabilityMost of the women who did not cook, purchased vegetable dishes at neighbourhood food stalls. The preferred vegetables were mostly stir-fried because they were tastier and readily available. Vegetables in the meals were visibly soaked in cooking oil. Clear vegetable soup was less often consumed as it was considered tasteless due to its low fat content, and regarded as a meal for sick people. Those who liked clear soup had little choice as sellers had only one or two types of soups, that sold for IDR 2,000 or ~USD 0.15.
“I prefer stir-fried vegetable rather than clear vegetable soup like spinach soup, because it tastier. For instance,

Food shopping behaviours of women in Jakarta Indonesia S39
I like long beans stir-fried mixed with sprouts” (non-obese, 30 years old)
“I feel that stir-fried vegetables are tastier and more flavourful. Clear soup just makes me feel like a sick person (laughing). It is cold and tasteless” (obese, 28 years old)
One obese woman admitted that she never consumed vegetables as it made her feel bloated. Only two overweight women reported daily consumption of vegetables. However, their vegetable consumption was driven by the wishes of their mothers during lactation and a feeling of guilt about discarding leftovers.
“I don’t eat vegetables. I don’t like it, but my children do. I don’t feel satisfied eating vegetables; my tummy feels bloated” (obese, 32 years old)
“I started to eat vegetables after giving birth. Before that, I only liked stir-fried side dishes, such as prawns. After giving birth, my mother suggested to me to eat vegetables like spinach soup, so that I could produce more breastmilk” (overweight, 29 years old)
“Actually, I like to eat dried meals (without vegetables). In other words, I cook vegetable dishes only for my children because they like it. If there is any left-over after my children have eaten, then I will finish it as I just don’t want to throw away edible foods” (overweight, 48 years old)
Fruit consumption was infrequent among the women because they considered it expensive. Few women consumed fruits daily. One overweight woman consumed fruits only when she had enough money and bought low-quality fruits at cheaper prices. She was used to buy buah busuk
(BS), which is half-rotten fruits sold cheaper than fresh fruits. BS is usually sold by sellers who bought sorted-out and poor-quality fruits, such as mangos, melons and oranges, at cheap prices from the market.
“My husband usually buys BS four times a week because the children like to eat fruits. Yesterday, he paid IDR 7000 (~ USD 0.52) for eight big-sized mango” (overweight, 32 years old)
Family influenceFamily played a significant role in the purchasing behaviour of many of the women. As mothers, most of the women tried to satisfy their children. The children usually longed for different foods at every meal time and disliked frequently having to consume the same dishes. However, the mothers could not afford to cook different dishes for every meal. If the mother was forced to cook and serve the same menu for a whole day, the children would not eat it and in the end the food would be discarded.
“I rarely cook, because having many children made cooking at home complicated as they want different dishes. One child wants to eat fish while another one wants to eat chicken, and so on. So, I just cook rice and buy the side dishes” (overweight, 29 years old)
The eating habits of husbands also influenced women’s purchasing behaviour. Women whose husbands went to work very early, such as before 5 am, buy food from warung subuh (food stores that open at 3-7 am). This helps the working wives to prepare food in the early morning. Meanwhile, husbands who returned from work late in the evening, purchased foods for supper

Sufyan D, Februhartanty J, Bardosono S et al.S40
from mobile food stalls and, often the wife joined the husband in late night eating to keep them company.
“My husband is usually back from work at 10 pm and I keep him company as he eats and have a conversation. If there is no foods at home, my husband will ask me to buy fried rice or other foods. I then join him in eating although I have had dinner already” (obese, 38 years old)
Living with extended family members exerted an influence on some women, as cooking became more complicated and more expensive.
“…it was complicated to cook and share in such crowded home and limited kitchen space and I do not want to do it. Therefore I just bought
the cooked foods for my own family” (non-obese, 40 years old)
In contrast, a few women revealed that living with an extended family was beneficial when they shared the same pot. Most of the time, the women’s mothers cooked for the whole family and took care of the children, when the women left for work.
“I am lucky that my mother takes care of my children when I go to work. She cooks for all of us, so that I am not confused as to what I have to eat each day” (non-obese, 33 years old)
High exposure of ready-to-eat foodsReady-to-eat foods were abundantly available in the food stores of Kampung Melayu for 24 hours a day. Figure 2 shows the density of food stores in
Figure 2. Distribution of food stores in Kampung Melayu 1: convenience store; 2: food stall; 3: grocery store; 4: snack shop; 5: market; 6: mobile food stall; 7: non-food store also selling food.

Food shopping behaviours of women in Jakarta Indonesia S41
Tab
le 3
. F
ood s
hop
s /st
ores
in
Ka
mpu
ng
Mel
ayu
Ty
pe
Pro
du
cts
sold
Cu
stom
ers
Oper
ati
ng
hou
rsPri
ce r
an
geM
ode
of p
ay
men
tM
ark
etin
g te
chn
iqu
e
Foo
d s
talls
Coo
ked
mea
ls
(ric
e, v
eget
able
s si
de
dis
hes
)
Wom
enO
pen
at
11 a
.m.,
so
me
open
for
24 h
IDR
1,0
00–8
,000
(appro
xim
ate
ly
US
D 0
.07–
0.5
9)
Cash
an
d c
redit
Wor
d o
f m
outh
Gro
cery
st
ores
ow
ned
by
loca
ls
Day-
to-d
ay
food
s,
snack
s, o
ther
non
-fo
od ite
ms,
sm
aller
pro
du
cts
or m
ore
econ
omic
al si
zes
or
sach
ets
Wom
en,
men
, ch
ildre
n
6 a
.m.–
10 p
.m.
IDR
1,0
00–3
0,0
00
(appro
xim
ate
ly
US
D 0
.07–2
.23)
Cash
an
d c
redit
Rew
ard
sys
tem
in
h
olid
ay
seaso
ns
Mob
ile
food
st
alls
Sw
eete
ned
bev
erage
s,
hom
emade
frit
ters
, ot
her
sn
ack
s, loc
al
mea
tball s
oup
(ba
kso
), o
ther
loc
al
dis
hes
su
ch a
s so
to (ch
icken
sou
p
wit
h v
erm
icel
li)
Wom
en,
childre
n8 a
.m.
un
til past
m
idn
igh
tID
R 1
,000–1
0,0
00
(appro
xim
ate
ly
US
D 0
.07–0
.74)
Cash
Noi
se s
ign
al
Mark
etR
aw
foo
ds
(veg
etable
s,
fru
its,
mea
t),
man
ufa
ctu
red
item
s, n
on-f
ood
item
s
Wom
en5 a
.m.–
1 p
.m.
Sta
rts
at
ID
R 1
,000
Cash
an
d c
redit
Init
iate
con
tact
Con
ven
ien
ce
stor
e lo
cate
d
on m
ain
ro
ads
Man
ufa
ctu
red
food
s, s
nack
s,
dri
nks
an
d d
ay-
to-
day
food
s, s
elec
ted
fru
its,
non
-foo
d
item
s
Wom
en,
men
, ch
ildre
n
7 a
.m.–
10 p
.m.
Sta
rts
at
IDR
2,5
00
(appro
xim
ate
ly
US
D 0
.19)
Cash
Dis
cou
nt,
bu
ndlin
g of
goo
ds,
fre
e it
ems
an
d d
oor-
to-d
oor
pro
mot
ion

Sufyan D, Februhartanty J, Bardosono S et al.S42
the area, and Table 3 shows further information of each store. The map figure shows that food stores were densely located at street intersections. The major type of food store was the food stall that provided cooked food, which sold for prices that ranged from IDR 1000-8000 (USD 0.07-0.59). Another major type were the grocery stores that provided snacks, other foods and non-food products. Non-working women tend to gather to chit-chat over snacks such as fritters and sweetened beverages.
“…when I am alone I may just drink 1 cup of ice tea, but when I gathered with other women I would buy another portion again when my last portion was finished. I just feel comfortable with the togetherness…” (non-obese, 34 years old)
The nearest traditional market was situated 10 minutes away from the residential area. It provided more varieties of both fresh and cooked foods. The market was mainly visited by food sellers and those who cooked at home. Those who did not cook regularly went to the market only when they wanted to purchase items that were not available in food stores nearby their residence.
“I used to visit traditional market after taking my child to school, only for purchasing kue pancong (Jakarta traditional cake)” (non-obese, 33 years old)
Food store marketing strategies The food stores used several promotion strategies in Kampung Melayu, to encourage consumer loyalty. Convenience stores often sold commonly consumed foods such as cooking oil, sugar, biscuits and other foods that were bundled together at reduced prices or with free gifts. Women were often interested in purchasing items that were
being promoted that met the needs of their families such as milk and diapers. Grocery stores also used rewards in the form of clothing and food gifts given during Muslim celebrations. Food stalls also offered credit to retain the women as regular customers for their daily food purchases. The repayment of the credit was done on a monthly basis after receiving money from their husbands.
“I have been buying items for my daily needs for 2 years from that grocery store. Usually, I buy rice and pay later. The seller allows me to pay on credit. He also gives me biscuits or cookies and syrup near Muslim celebration” (non-obese, 32 years old)
DISCUSSION
This qualitative study provides some insights into the food purchasing behaviour of women in an urban slum setting. To the best of our knowledge, this study topic was one of the few that had been conducted in Indonesia using an ethnographic approach. Previous studies had reported that various factors such as family income, food price, food availability and practicality influenced the food purchasing behaviour of women in urban slums (Antin & Hunt, 2012; Kimani-Murage et al., 2014). However, our study also highlighted the importance of understanding other factors that influenced the food purchasing behaviour of women in urban slums, such as time constraints faced by working women, nuclear versus extended family members and the presence of neighbourhood food stores.
The low-income urban residents in this study mostly relied on purchasing ready-to-eat foods from neighbourhood food stalls. Therefore, the daily food consumption for breakfast and the rest of the day, was driven by the availability of food that was sold in the vicinity.
Food shopping behaviours of women in Jakarta Indonesia S43
Many working and non-working women purchased ready-to-eat foods due to time constraints. This was consistent with the results of a study in India where women reported that their business and work demands, discouraged them from preparing food at home, and lead them to purchase ready-to-eat foods (Salomi & Revathy, 2014). Cooking at home takes time and a study in Australia estimated an average of 66 minutes was required for preparing a meal for the family; working women could not afford such time on working days (Worsley et al., 2014).
The cost of food was an important factor that influenced the food purchasing decisions of women. Women with ≥ 2 children considered purchasing foods was costlier than cooking at home. For women with fewer family members, they reported that purchasing food was less costly since the food offered by nearby stores could be shared. However, with limited budgets, they tended to purchase outside foods that were high in energy (e.g. fried foods) and had poor nutrient content (e.g. fewer fruits and vegetables) (Drewnowski & Specter, 2004). As a result, women and their families were exposed to consuming obesogenic foods (Bray & Popkin, 1998). The situation in the Jakarta slum highlights the need for women to be provided with the knowledge and skills to select healthy foods within their meagre budgets.
The results of the present study were consistent with previous research (Inglis, Ball & Crawford, 2005; Lupton, 2000), which suggested that for many women, their food preferences came second after their husband or children. Children influenced their mothers by expressing their preferences, negotiating, persuading, making demands and refusing to eat the foods that their mothers served (Alm, Olsen & Honkanen,
2014). Clearly, family support for healthy consumption is an important influence on women’s purchasing behaviour.
Late night eating by obese women, reflected impulsive buying. Although the reason for having a late supper initially came from the husband, a previous study has shown that sensory cues like good smell of food, attractive food displays and appealing sounds from food preparation done by food sellers were a positive stimuli for impulsive food purchasing (Choi, 2016).
The purchasing behaviour of the women was found to be influenced by the availability of the foods in the local stores. Food purchasing behaviour could be formed by repeated exposure towards ready-to-eat foods. Economists suggest that either supply or demand factors or both could cause variations in what and where food stores are available (Ploeg, 2010). The neighbourhood may lack fresh food if the demand is low. Abundance of food stores leads to competition to attract customers. Marketing strategies, particularly in grocery and convenience stores, were aimed at retaining customers. In this study, several stores gave gifts during the Eid al-Fitr (a Muslim celebration) and allowed purchasing on credit. A US study conducted among thousands of household heads revealed the reasons for patronage. These included free gifts and special deals that were offered, preference for the payment method and proximity to the homes of customers (Moschis, Curasi & Bellenger, 2004). Financial benefits in the form of rewards or special discounts to loyal buyers was a common form of attracting customers. This finding was consistent with that of Ashman (2000) who studied American loyalty reward programmes. The strategy required customers to spend a fixed amount of money over a period of time
Sufyan D, Februhartanty J, Bardosono S et al.S44
in order to receive a free gift, such as a Thanksgiving turkey or an Easter ham, when they reach a required spending threshold.
Health promotion programmes that target healthy food purchasing behaviour should aim to motivate and educate individuals to choose healthier foods that match their budgets. This is one of the few qualitative studies that has applied an ethnographic approach to investigate the environmental influences on the food purchasing behaviour of women in an urban slum setting of Indonesia.
Overall, this study raises important implications for the government and the private sector. It highlights the need to increase the awareness of healthy food purchasing. It also underlines the importance of empowering women as the household food gatekeepers in preparing meals at home and in introducing affordable food pricing and diversity policies into government’s agenda. Appropriate collaborative interventions that address urban slum food environmental influences should be undertaken. It should be aimed at modifying the skills and motivation of both food sellers and women to provide and purchase healthier foods, respectively. In the longer term, the effort may help to reduce the prevalence of obesity and malnutrition.
CONCLUSION
The present study provides a contextual understanding of the factors involved in the food purchasing behaviour of women in the urban slum of Kampung Melayu, East Jakarta. The factors that were identified included time and cost efficiency, family influences, food availability, high exposure of ready-to-eat foods, and proximity and marketing strategies of food stores. At the micro-level, qualitative data and information
that is generated should be useful for the government, the health services and the private sector organisations who will need to collaborate on policy matters such as pricing strategies to promote the purchase of healthier foods.
Acknowledgements We would like to thank all the participants in Kampung Melayu who took part in this research. We also thank the Institute of Physical Activity and Nutrition at Deakin University Melbourne Australia and SEAMEO RECFON Jakarta Indonesia for financially supporting the research.
Authors’ contributions
DS, contributed to the conception and design of the work, conducted data collection and data analysis, compiled the first draft of the manuscript; JF, contributed to the conception and design of the work, conducted data collection and data analysis, revised and approved the final draft; SB, contributed to the conception and design of the work, revised and approved the final draft; HK, contributed to the conception and design of the work, revised and approved the final draft; EE, contributed to the conception and design of the work, revised and approved the final draft; PHR, contributed to the conception and design of the work, revised and approved the final draft; AW, contributed to the conception and design of the work, revised and approved the final draft.
Conflict of interest
All authors declared no potential conflicts of interest with respect to the research, authorship and/or publication of this article.
References
Abraham S, Miruts G & Shumye A (2015). Magnitude of chronic energy deficiency and its associated factors among women of reproductive age in the Kunama population, Tigray, Ethiopia, in 2014. BMC Nutrition 1:12.
Akter T (2009). Migration and living conditions in urban slums: implications for food security. From http://www.unnayan.org/reports. [Retrieved September 25 2015].
Alm S, Olsen SO & Honkanen P (2014). The role of family communication and parents’ feeding practices in children’s food preferences. Appetite 89:112–121.
Antin TMJ & Hunt G (2012). Food choice as a multidimensional experience: A qualitative study with young African American women. Appetite 58:856–863.

Food shopping behaviours of women in Jakarta Indonesia S45
Ashman SM (2000). Grocery store buying behavior: evidence from loyalty program data shopper identification/customer loyalty cards. J Food Distribution Research 31(1):1–8.
Badan Pusat Statistik Provinsi DKI Jakarta (2014). Indeks potensi kerawanan sosial (IPKS) di DKI Jakarta 2013. Badan Pusat Statistik Provinsi DKI Jakarta, Jakarta.
Bray G & Popkin B (1998). Dietary fat intake does affect obesity!. Am J Clin Nutr 68(6):1157–1173.
Center for Chronic Disease Prevention (2010). CDC vital signs: adult obesity. From https://www.cdc.gov/vitalsigns/adultobesity/index.html. [Retrieved September 20 2015].
Choi J (2016). Consumer impulse buying of food at festival and events: understanding the role of sensory cues. Kansas State University. Manhattan, Kansas.
Cortés DE, Millán-Ferro A, Schneider K, Vega RR & Caballero AE (2013). Food purchasing selection among low-Income, Spanish-speaking Latinos. Am J Prev Med 44:S267–S273.
Drewnowski A & Specter S (2004). Poverty and obesity: the role of energy density and energy cost. Am J Clin Nutr 79(1):6–16.
Harahap FR (2013). Dampak urbanisasi bagi perkembangan kota di Indonesia. J Society I(1):35–45.
Hasudungan RG, Antokida Y & Dewi RS (2018). Statistik Daerah Provinsi DKI Jakarta 2018. Badan Pusat Statistik DKI Jakarta.
Inglis V, Ball K & Crawford D (2005). Why do women of low socioeconomic status have poorer dietary behaviours than women of higher socioeconomic status? A qualitative exploration. Appetite 45(3):334–343.
Johnson F & Wardle J (2014). Variety, palatability, and obesity. Adv Nutr 5(6):851–859.
Kac G & Pérez-Escamilla R (2013). Nutrition transition and obesity prevention through the life-course. Int J Obes Suppl 3:S6–S8.
Kemenkes RI (2008). Riset Kesehatan Dasar (Riskesdas) 2007. Lembaga Penerbitan dan Pengembangan Kesehatan Kementerian Kesehatan Republik Indonesia (Kemenkes RI), Jakarta.
Kemenkes RI (2010). Riset Kesehatan Dasar (Riskesdas) 2010. Lembaga Penerbitan dan Pengembangan Kesehatan Kementerian Kesehatan Republik Indonesia (Kemenkes RI), Jakarta.
Kemenkes RI (2013a). Riset Kesehatan Dasar (Riskesdas) 2013. Lembaga Penerbitan dan Pengembangan Kementerian Kesehatan Republik Indonesia (Kemenkes RI), Jakarta.
Kemenkes RI (2013b). Riskesdas dalam Angka Provinsi DKI Jakarta 2013 (Vol. 7). Lembaga Penerbitan dan Pengembangan Kementerian Kesehatan Republik Indonesia (Kemenkes RI), Jakarta.
Kemenkes RI (2018). Riset Kesehatan Dasar (Riskesdas) 2018. Lembaga Penerbitan dan Pengembangan Kesehatan Kementerian Kesehatan Republik Indonesia (Kemenkes RI), Jakarta.
Kimani-Murage EW, Schofield L, Wekesah F, Mohamed S, Mberu B, Ettarh R & Ezeh A (2014). Vulnerability to food insecurity in urban slums: experiences from Nairobi, Kenya. J of Urban Health 91(6):1098–1113.
Lupton D (2000). The heart of the meal: Food preferences and habits among rural Australian couples. Sociol Health Illn 22(1), 94–109.
Maguire M & Delahunt B (2017). Doing a thematic analysis: a practical, step-by-step guide for learning and teaching scholars. AISHE-J 3(3):3351–33514.
Mikkelsen & Chehimi S (2007). The links between the neigborhood food environment and childhood nutrition. Robert Wood Johnson Foundation, New Jersey. From http://www.rwjf.org/files/research/foodenvironment.pdf. [Retrieved August 20 2015].
Mohiddin L, Phelps L & Walters T (2012). Urban malnutrition : a review of food security and nutrition among the urban poor. From http://www.nutritionworks.org.uk/our-publications/programme-review-and-evaluation/2011/153-urban-malnutrition-a-review-of-food-security-and-nutr i t i on-among- the-urban-poor [Retrieved September 22 2015].
Moschis G, Curasi C & Bellenger D (2004). Patronage motives of mature consumers in the selection of food and grocery stores. J Consum Mark 21(2–3):123–133.
Mutale GJ, Dunn A, Larkin R, Mutale G, Dunn A & Stiller J (2016). Development of a body dissatisfaction scale assessment tool. New School Psychol Bull 13(2):47–57.
Ploeg M Ver (2010). Food environment, food store access, consumer behavior and diet. Agriculture and Applied Economics Association 25(3):0–4.

Sufyan D, Februhartanty J, Bardosono S et al.S46
Ramachandran A, Chamukuttan S, Shetty AS, Arun N & Susairaj P (2012). Obesity in Asia — is it different from rest of the world. Diabetes Metab Res Rev 28:1–5.
Salomi RS & Revathy B (2014). A study on the preference of working women towards readymade food in Tirunelveli District. IOSR-JHSS 19(6):61–70.
Smil V (2000). Feeding the World-A Challange for the Twenty-First Century. The MIT Press, Massachusetts and London, England.
United Nations (2014). In: World Urbanization Prospects: The 2014 Revision, Highlights (ST/ESA/SER.A/352). From https://esa.un.org/unpd/wup/publications/files/wup2014-highlights.pdf [Retrieved December 20 2015].
Vabø M & Hansen H (2014). The relationship between food preferences and food choice: a theoretical discussion. Int J Bus Soc Sci 5(7):145–157.
Worsley A, Wang W, Ismail S & Ridley S (2014). Consumers’ interest in learning about cooking: the influence of age, gender and education. Int
J Consum Stud 38(3):258–264.

Mal J Nutr 25 (Supplement): 47-62, 2019
__________________________
*Corresponding author: Helda Khusun PhD,South East Asian Ministers of Education Organization Regional Centre for Food and Nutrition, JL. Salemba Raya, No. 6 Central JakartaTelephone no.: +622131930205; Fax no.: +62213913933E-mail: [email protected]; [email protected]
Exposure and approval of food marketing strategies: a mixed methods study among household food providers in Jakarta
Selma Avianty1,2, Helda Khusun1*, Saptawati Bardosono2 Judhiastuty Februhartanty1 & Anthony Worsley3
1South East Asian Ministers of Education Organization Regional Centre for Food and Nutrition (SEAMEO RECFON)/Pusat Kajian Gizi Regional (PKGR) Universitas Indonesia, Jakarta, Indonesia; 2Nutrition Department, Faculty of Medicine, Universitas Indonesia, Jakarta, Indonesia; 3Centre for Physical Activity and Nutrition Research, School of Nutrition and Exercise Sciences, Deakin University, Melbourne, Australia
ABSTRACT
Introduction: Food marketing influences consumers’ food choices leading to unplanned food purchasing. Methods: This study used a mixed methods approach to investigate the association between food marketing exposure and approval of food marketing strategies among household food providers in Jakarta. Responses from 279 survey participants to questions on exposure and their approval of marketing strategies were analysed. An additional 16 informants who fulfilled the inclusion criteria were recruited for the in-depth interview. Logistic regression was conducted to assess the relationship between the categorical predictor variable (“exposure to active or passive marketing”) and the categorical outcome variable (“approval response to food marketing strategies”). Results: Almost half of the respondents reported not having exposure to active marketing in the past month, whereas approximately one-third had experienced such exposure 1-2 times. Most of the respondents disapproved the marketing of fast foods and sugar-sweetened foods. The highest disapproval was for the placement of vending machines carrying such foods in schools (69.9%). Respondents who were exposed to active marketing at least once in the previous month were 1.99 times more likely (AOR; 95% CI: 1.07-3.73) to approve the marketing of unhealthy foods. Conclusion: Exposure to food marketing promotion appeared to influence approval of marketing strategies among household food providers in Jakarta. In-depth interviews provided supportive evidence for the quantitative results. A mixed methods approach is suggested for larger studies to confirm these findings.
Keywords: Food marketing exposure, approval of food marketing, household food providers, Indonesia

Avianty S, Khusun H, Bardosono S et al.S48
INTRODUCTION
The concept of nutrition transition with implications for health, developed by Popkin (2002), described the shifts in diet and lifestyle that paralleled urbanisation and industrialisation. One of the major dietary shifts is the increased consumption of energy-dense, nutrient-poor food, especially in developing country (Hawkes, 2007). This phenomenon is associated with the increased availability and accessibility of processed food, which are accompanied by sophisticated marketing systems (Swinburn et al., 2004). The media is used in many sectors, including the marketing of food products, to create brand awareness and induce purchasing (Nielsen, 2010).
Food marketing uses multiple channels to reach consumers. They may be broadcast and non-broadcast channels, online games and social media, to make consumers aware of a product and persuade them to try it (WHO, 2013, Colby et al., 2010). Food marketing is known to influence a consumer’s food preference (Kirkpatrick, Reedy & McKinnon 2010) leading to unplanned food purchases (Scully et al., 2012).
Indonesia is a rapidly developing nation that is undergoing the nutrition transition. According to an international survey, Indonesia has the highest rate of unhealthy food marketing exposure in the Asia-Pacific region. A reason for this is the lack of government regulations (Harris, Bargh & Brownell, 2009; Susyanty et al., 2013). The situation indicates a highly unfavourable food environment and could be an important driver of the rising prevalence of obesity in Indonesia, from 15.4% in 2010 to 19.7% in 2013 (Center for Health Research and Development, 2010; Center for Health Research and Development, 2013). The prevalence of obesity was comparatively higher in urban than in
the rural areas, and among those with higher educational attainment, and higher expenditures (Center for Health Research and Development, 2010).
Jakarta is also known to be the city most connected to the internet, in Indonesia (PusKaKom & APJII, 2014), exposing its residents a sophisticated integrated food marketing system. Evidence that active food marketing is associated with promoting obesity indicates the need for measures to regulate it (Umberger et al., 2014, Gustafson et al., 2014; Moodie et al., 2013).
At the household level, decisions on food purchasing are commonly made by the housewife, in her role as the household food provider. Her reasons for selection of food for the family are important (International Chamber of Commerce, 2012). Studies that examine how food marketing influences household food providers are lacking (Institute of Medicine, 2006). According to the Stimulus Response Theory, the link between food marketing exposure and food shopping, in an individual, could be explored by understanding the approval in the decision-making process (Sobur, 2003).
This study investigated the association between exposure and approval for marketing strategies among household food providers. Its findings could be useful in addressing the issue of obesity among adults in Indonesia.
MATERIALS AND METHODS
The study used a mixed methods approach, where a qualitative study was conducted to further explore findings obtained from a quantitative analysis. The quantitative study was the International Study of the Families and Food Survey, an online survey conducted by Deakin University in several countries including Indonesia in 2014. The survey

Exposure and approval of food marketing strategies among gatekeeper in Jakarta S49
determined the association between food marketing exposure experienced by household food providers and their response to the marketing strategies. The qualitative study comprised an in-depth interview of informants in Jakarta, to understand their perceptions of food marketing exposure and their response to food marketing strategies, as well as to understand the reasons for their decisions.
Quantitative online survey The 2014 International Study of the Families and Food Survey was an online survey conducted by Deakin University simultaneously in Indonesia, Melbourne, Shanghai, Singapore and Vietnam. This study used only the data collected from the Indonesian respondents. The eligible respondents were women aged 19–49 years, married and were the primary household food providers. A total of 279 respondents who fulfilled the inclusion criteria was included in this analysis. This sample size was estimated to be sufficient, based on the minimum sample calculation to estimate exposure to food marketing with anticipated prevalence of 50%, an estimated deviation of 5% and an alpha of 95%.
Questionnaire point scale The respondents were requested to provide information on their socio-demographic characteristics including age, educational attainment, marital status1, and wealth status. They were also asked to complete a ten-item questionnaire on food marketing exposure, and a twelve-item questionnaire on approval/disapproval for food marketing strategies. For the food marketing exposure questionnaire, the respondents were asked to rate the
frequency of exposure in the past one month of each item on a 5-point scale. The lowest point (which was a score of 1) referred to zero exposure, while the highest score of 5 referred to ≥ 3 times exposure. For the questionnaire on approval of food marketing practices, participants were asked to rate their opinion of each item on a 5-point scale. The scores ranged from 1 to 5, where lowest score (1) meant “strongly disapprove” and highest (5) “strongly approve”.
Quantitative survey data analysisAll responses to the questionnaires were grouped using the exploratory factor analysis. Factor analysis was conducted using the principal component analysis with varimax rotation. Assumptions for the factor analysis were fulfilled with the Kaiser-Mayer-Olkin (KMO) > 0.5 and the significant result of Bartlet’s test of sphericity (p<0.01) (Pett, Lackey & Sullivan, 2003).
Descriptive data were presented as frequencies and percentages. Logistic regression was conducted to assess the relationship between the categorical predictor variable (“exposure to active or passive marketing”) and the categorical outcome variable (“approval response to food marketing strategies”). Adjusted odds ratio (AOR) was computed after adjusting for the socio-demographic factors of the respondents. All statistical analyses were conducted using IBM Statistical Package for Social Sciences (SPSS) software version 20.0.0.
Qualitative study: in-depth interviewSelection of informantsThe principal investigator assisted by a research assistant, conducted the interviews with 16 informants enrolled
__________________________
1 number of electronic communication (e.g., smartphones, tablets, and computers) and entertainment devices (e.g., TVs, DVD players, games, etc.) in their households as indicator of wealth (Worsley et al., 2017)

Avianty S, Khusun H, Bardosono S et al.S50
in the study. The informants were the main household food providers. The first informant was selected based on the inclusion criteria, while the remaining ones were selected via the snowball sampling technique.
The number of informants was defined by the study objectives, the variation of information that was essential, and the saturation of answers given by the informants. The important variables for the selection of the subjects considered to yield maximum variation of responses in this study were their working status (working vs housewife), the number of children (no children, or having children aged less than 5 years or older) and marketing exposure (low, medium and high) (Scully et al., 2012; Sharma & Sonwaney, 2014; Devine et al., 2009; Bianchi & Raley, 2005; Wang et al., 2014). Marketing exposure was screened using the same questionnaire on food marketing exposure that was used in the on-line survey. Their answers were categorised as low exposure (not exposed to any channel of marketing media in the past one month), medium exposure (on 2-3 times exposure) and high exposure (> 4 times).
In-depth interview guideThe questions addressed perceptions about food marketing exposure and the responses were approval/disapproval. Prior to usage, the interview guide was pre-tested with two purposively chosen women in the area having characteristics that were similar to the informants recruited for the interview. The pre-testing was done to clarify issues that related to the flow of the questions, the approach to take in posing certain questions, to know whether the questions could gather the data we wanted to address, and to ascertain the tools that were needed to stimulate the help of informants in data collection. The questions of the in-
depth interview allowed informants to relate their experiences and perceptions pertaining to the topics in question. Two informants were interviewed each day and each interview lasted 60–90 mins. The research assistant audio recorded and transcribed the answers verbatim for analysis. Overall quality assurance was conducted by (1) ensuring questionnaire understanding by pre-testing, (2) having standardised data collection using guidelines and pictures to stimulate the informant’s answers, (3) ensuring that all informants were interviewed by the same researcher assisted by the same research assistant, (4) making field notes and on-field analysis immediately after each interview.
In-depth interview analysisAt the end of the interviews, the responses were transcribed verbatim, and themes were extracted. The informants were differentiated based on the variations to provide a clear pattern. Finally, the findings of the quantitative study were compared with those of the qualitative study (Thomas et al., 2015). All of the processes were documented using Micorsoft Word and Microsoft Excel.
Ethical approval and letter of permissionPermission was obtained from the principal investigator of the 2014 International Study of the Families and Food Survey online survey. The ethical committee of the Faculty of Medicine, University of Indonesia gave approval for the present study (approval no. 068/UN2.F1/ETIK/2015), which was conducted from 7 December 2015 to 7 December 2016. Additional approvals were given by the Provincial government of Daerah Khusus Ibukota (DKI) Jakarta and the Ministry of Internal Affairs for the conduct of the study in Jakarta and its surrounding areas.

Exposure and approval of food marketing strategies among gatekeeper in Jakarta S51
RESULTS
Socio-demographic characteristicsQuantitative online survey respondentsThe main inclusion criteria for the online quantitative survey was that the respondents had to be the main decision makers who were responsible for planning and procuring food provisions for the family. Out of 279 respondents from Indonesia, the majority were married (90.7%) aged 30-49 years (74.2%) and with university education (93.5%) (Table 1). Among those with children, about half (54.5%) had children < 5 years old, while about
half (50.5%) had children aged ≥ 5 years old. Most of the respondents (83.9%) were responsible for preparing the main meals for the family. As for household economic status, 26.2% were in the low category, while 39.1% and 34.8% were in the medium and high categories, respectively.
In-depth interview informants The informants (n=16) were demographically similar to the on-line survey respondents. Like the latter, the informants were recruited because they were the main household food providers
Table 1. Socioeconomic characteristic of the online participants (N=279)
Characteristics n (%)
Age (years)19-29 30-49
72 (25.8)207 (74.2)
Marital StatusNot married (separated/divorced/widowed)Married
26 (9.3)253 (90.7)
Educational BackgroundHigh school or lowerUniversity
18 (6.5)261 (93.5)
Have childrenYesNo
226 (81)53 (19)
Have children aged below 5 yearsYesNo
152 (54.5)127 (45.5)
Have children aged 5 years and aboveYesNo
141 (50.5)138 (49.5)
Economic status†
Low Medium High
73 (26.2)109 (39.1)97 (34.8)
Person who prepares the main meals in householdRespondentRespondent’s partner/spouseServant/cookOthers
234 (83.9)20 (7.2)15 (5.4)10 (3.6)
†Number of electronic communication (e.g., smartphones, tablets, and computers) and entertainment devices (e.g., TVs, DVD players, games, etc.) in their households as indicator of wealth (Worsley et al., 2017)

Avianty S, Khusun H, Bardosono S et al.S52T
able
2.
Dis
trib
uti
on o
f th
e on
lin
e re
spon
den
ts (%
) acc
ordin
g to
fre
qu
ency
of
act
ive
an
d p
ass
ive
mark
etin
g ex
pos
ure
in
th
e past
on
e m
onth
(N
=279)
Ma
rket
ing
exp
osu
re†
Non
e1
-2
tim
es>
3
tim
esC
ron
ba
ch’s
a
lph
a%
Exp
osu
re t
o act
ive
mark
etin
g
Exp
osu
re t
o m
edia
0.8
05
On
pu
blic
tran
spor
t (e
.g. bu
s, t
rain
)47.3
34.4
18.3
In s
choo
l (e
.g.
can
teen
, sp
orts
eve
nt)
53.0
33.7
13.3
Maga
zin
es a
nd o
ther
pri
nt
mate
rials
34.8
45.9
19.4
Mes
sage
s re
ceiv
ed v
ia S
MS
46.6
36.2
17.2
Mes
sage
s re
ceiv
ed v
ia e
46.6
26.9
26.5
Exp
osu
re t
o pass
ive
mark
etin
g
Exp
osu
re t
o su
per
mark
et-r
elate
d p
rom
otio
n0.7
01
Joi
nin
g co
mpet
itio
n t
hat
was
pro
mot
ed o
n f
ood o
r dri
nkin
g pack
agi
ng
68.1
27.6
4.3
Pla
yin
g ga
me
on t
he
inte
rnet
th
at
was
ass
ocia
ted w
ith
a f
ood o
r dri
nk p
rodu
ct65.9
28.3
5.7
Bu
yin
g fo
od/dri
nks
from
ven
din
g m
ach
ines
63.1
32.3
4.7
Bu
yin
g ex
tra f
ood/dri
nk p
rodu
cts
on d
ispla
y at
the
super
mar
ket
ch
eck-o
ut
cou
nte
r29.0
52.0
19.0
Rec
eivi
ng
free
sam
ple
s of
a f
ood/dri
nk p
rodu
ct a
t tr
ain
sta
tion
/sh
oppin
g ce
ntr
e/su
per
mark
et49.1
42.3
8.6
† Fact
or a
naly
sis
of t
he
qu
an
tita
tive
on
lin
e su
rvey
res
pon
se g
ener
ate
d t
wo
fact
ors,
nam
ely
expos
ure
to
act
ive
mark
etin
g an
d e
xpos
ure
to
pass
ive
mark
etin
g

Exposure and approval of food marketing strategies among gatekeeper in Jakarta S53
and aged 19-49 years. All the informants had university education. Out of 12 informants with children, five of them had children < 5 years old, while seven had children aged ≥ 5 years old. All the informants had experienced marketing promotion/advertisements in the past one month, with the majority (75.0%) reporting medium exposure (2-3 times exposure to food product advertisements in the past month).
Factor analysis of quantitative survey responseFood marketing exposureResults of the factor analysis generated two factors on food marketing exposure. These factors were labelled based on their components, namely (i) exposure to active marketing, consisting of exposure to marketing media from public transport, at school, in a magazine, messages received via short messaging services (SMS) and via electronic mail (e-mail), and (ii) exposure to passive marketing, e.g. competitions promoting food or drinks, internet games associated with food or drink products, food/drink vending machines, supermarket displays at check-out counters and free samples of food/drink products at train stations/shopping centres. Reliability of these indices were good, with Cronbach’s alpha ranging from 0.70-0.81.
In general, almost half of the respondents reported not having exposure to active marketing in the past month, whereas approximately one-third experienced such exposure 1-2 times, particularly in magazines and other print materials (Table 2). Receiving food advertising information via e-mails > 3 times in the past month ranked highest (26.5%) among the active marketing items that the respondents were frequently exposed to.
As for exposure to passive marketing, Table 2 shows that, in general, more
than half of the respondents were not exposed to such marketing practices in the past month. It is noted that “buying additional food or drink product at the check-out counter” was reported 1-2 times and > 3 times in the past month by 52.0% and 19.0% of the respondents, respectively. Exposure to competitions and games promoted on food products and the internet was not widely reported by the respondents.
Marketing strategiesTwo factors were revealed in the factor analysis on food marketing strategies. These were: (i) the marketing of fast foods and foods high in sugar. These consisted of advertising of foods and drinks with high sugar on television/radio, the promotion of confectioneries/soft drinks in supermarkets, and two-for-one pricing/upsizing of fast foods and drinks; (ii) the marketing of healthy foods, consisting of marketing of fresh meat, promotion of water to children, and the marketing of fruit and vegetables. The responses to all the questions in each category were then made into an index by averaging the response scales. Reliability of the indices was good with Cronbach’s alpha ranging from 0.69-0.84.
Table 3 shows that most of the respondents disapproved the marketing of fast foods and foods with high sugar content. The highest disapproval was for placing vending machines that carried such foods in schools (69.9%), followed by advertising foods and drinks containing high sugar on television/radio (66.3%). Nutrition education in schools or on television provided by soft drinks/fast food companies was not as widely disapproved (13.6%); in fact they were given approval by more than half of the respondents (64.5%). The majority of the respondents approved the marketing of healthy foods, especially promotion of

Avianty S, Khusun H, Bardosono S et al.S54T
able
3.
Dis
trib
uti
on o
f th
e on
lin
e re
spon
den
ts (%
) acc
ordin
g to
res
pon
den
t appro
val/
dis
appro
val of
mark
etin
g st
rate
gies
(N
=279)
Ma
rket
ing
stra
tegi
es†
Dis
appro
veN
eith
er a
ppro
ve
nor
dis
appro
veA
pp
rove
Cro
nb
ach
’s
alp
ha
%
Mark
etin
g of
fast
foo
d a
nd f
oods
wit
h h
igh
su
gar
con
ten
t (u
nh
ealt
hy
food
s)0.8
39
Adve
rtis
ing
of foo
ds
an
d d
rin
ks
that
con
tain
hig
h s
uga
r on
TV
/ra
dio
66.3
26.2
7.5
Pro
mot
ion
of co
nfe
ctio
ner
y/so
ft d
rin
ks
in s
uper
mark
ets
19.0
47.0
34.1
Tw
o-fo
r-on
e pri
cin
g/u
psi
zin
g of
fast
foo
ds
an
d d
rin
ks
36.9
38.4
24.7
Ven
din
g m
ach
ines
(w
ith
su
gar
swee
ten
ed b
ever
age
s/co
nfe
ctio
ner
y)
in s
choo
ls69.9
22.2
7.9
Sof
t dri
nk a
dve
rtis
ing
that
targ
ets
childre
n63.1
22.6
14.3
Pos
itio
nin
g of
fast
foo
d o
utl
ets
nea
r sc
hoo
ls52.3
31.2
16.5
Fast
foo
d c
ompan
ies’
spon
sors
hip
of
childre
n’s
web
site
s53.0
32.3
14.7
Fast
foo
d c
ompan
ies’
spon
sors
hip
of
childre
n’s
spor
ts/ed
uca
tion
al
pro
gram
mes
39.1
37.3
23.7
Nu
trit
ion
edu
cati
on in
sch
ools
or
on T
V p
rovi
ded
by
soft
dri
nk/
fast
foo
d c
ompan
ies
13.6
21.9
64.5
Mark
etin
g of
hea
lth
y fo
ods
0.6
93
Mark
etin
g of
fre
sh m
eat
1.4
12.9
85.7
Pro
mot
ion
of w
ate
r to
ch
ildre
n0.4
3.6
96.1
Mark
etin
g of
fru
it a
nd v
eget
able
s0.7
5.0
94.3
† Fact
or a
naly
sis
of t
he
qu
an
tita
tive
on
lin
e su
rvey
res
pon
se g
ener
ate
d t
wo
fact
ors,
nam
ely
mark
etin
g of
un
hea
lth
y fo
ods
an
d
mark
etin
g of
hea
lth
y fo
ods

Exposure and approval of food marketing strategies among gatekeeper in Jakarta S55
drinking water to children (96.1%) and the marketing of fruits and vegetables (94.3%).
In-depth interviews Food marketing exposureIn general, several of the interview informants experienced exposure to active marketing, especially via social media including SMS blasts and e-mails. They felt disturbed by the intensive marketing exposures.
“I got a lot…I thought they were emergency messages. In fact, they were just promotions. The pop-up advertisements on internet were also disturbing when I browse for something” (Working mother with < 5 years old child, frequent exposure)
The informants mentioned that ironically, exposure to passive marketing stimulated a greater desire to buy than exposure to active marketing, because they were directly faced with the products. Half of the informants (n=8) mentioned that products displayed near the cashier increased their desire to make purchases. Passive marketing exposure that involved competitions and free food samples also encouraged purchasing.
“Giving a tester (also known as received free-food-sample) and promotion in a competition is a direct promotion for reaching consumers. It was good because I could directly try it. The tester sells the taste not merely the image” (Housewife with no children, low exposure)
Marketing strategiesThe most common reason for disapproving marketing strategies was when they affected health, the social life of children, and the school environment.
The ‘Health’ theme emerged particularly among informants with children aged < 5 years old, housewives, and those whose husband suffered from a disease. Informants with older children (> 5 years old) expressed more concerns about the negative effects brought about by marketing efforts in the school environment.
“I am afraid that all the unhealthy food drink marketing could easily brainwash children, and people with low education will be easily influenced without considering health effects” (Housewife with child > 5 years old, medium exposure)
“Environment has a big influence and we can’t control what the children consume outside the home. This kind of unhealthy outlets will make our children over-consume, especially foods high in fat, leading to obesity and heart attack. Schools should provide a healthy image, and permit the selling of only healthy products” (Housewife with child > 5 years old, medium exposure)
Meat and fruit were perceived as healthy but expensive foods.
“Prices of fruit and meat are quite expensive. If there are promotions for fruit and meat promotion, of course, it would stimulate people to buy. Since my husband got a heart attack, we prefer to eat home-cooked food, rather than eat outside. I make fresh mixed fruit-vegetables juice for him” (Housewife with child < 5 years old, husband suffered from heart attack)
The informants expressed concern for the freshness and quality of perishable foods such as meat and fruit.

Avianty S, Khusun H, Bardosono S et al.S56
“We have to be careful in choosing promotional meat or fruit. We need to be aware of meat’s quality and the freshness of the fruits and vegetables. Those which are on promotion tend to have low quality” (Housewife with child > 5 years old).
Most of the informants said that they realised the lure of marketing promotions but usually they kept to their purchasing to the needs of the family, which was also the most common reason for approving marketing strategies.
“I’d like to buy at the supermarket because there are so many promotions. However, it doesn’t mean that I buy all the products promoted. I buy because I need them, not because of the promotion. But if there is a promotion on things listed on my shopping list, then I buy” (Working mother with child < 5 years old, high exposure)
“I have had experience with promotions. If there was a promotion which said, “Buy 500 g and get 500 g free”, I will buy the item, even though I only needed 300 g. But I bought 500 g so that I could keep the rest of it for future use” (Housewife with < 5 years-old child, medium exposure)
Informants generally approved nutrition education provided by soft drinks or fast foods companies as they felt consumers benefited from the nutrition information, and as long as the companies were not promoting their products.
“It was a really brilliant idea of marketing through education. People take the benefit of the information. However, there would be a misunderstanding especially if the company also gave out samples of the products. The education itself
was good, but the food provided by promoter was not” (Housewife with < 5 years-old child, high exposure)
The preferences of the family, especially that of the children, were the driving factor for making purchases of the family food provisions. Informants with children > 5 years old, mentioned that their children’s preferences were influenced by social media, SMS blasts, and friends.
“She (informant’s daughter) usually has many messages from SMS blasts, offering items such as buy six donuts get six more for free. I usually ignore the messages because it’s quite disturbing. Anyway, I sometimes follow what she wants when we go out, but not too often because buying items such as donuts will make her fat” (Housewife with > 5 years-old child, medium exposure)
The informants also realised that advanced technology is emerging in Indonesia and that it could influence family preferences.
“Go Food® which charges only 10.000 for each delivery, helps us when there is no food at home or no time to buy. There are also many recommended restaurants that use their delivery service. This facility is the best option for food purchases, in situations such as traffic jam, on a rainy days and if we are too lazy to go out” (Working mother with no children)
Logistic regression of quantitative survey responseResults from the logistic regression analysis of the online survey data showed that exposure to marketing, whether active or passive, had an influence on the respondents’ approval of the marketing strategies. Respondents who were

Exposure and approval of food marketing strategies among gatekeeper in Jakarta S57T
able
4.
Log
isti
c re
gres
sion
an
aly
sis
of t
he
onlin
e re
spon
den
t appro
val
for
mark
etin
g st
rate
gies
acc
ordin
g to
exp
osu
re t
o act
ive
or
pass
ive
mark
etin
g (N
=279)
Dep
end
ent
vari
able
n (%
)A
ppro
val fo
r m
ark
etin
g of
u
nh
ealt
hy f
ood
sA
ppro
val fo
r m
ark
etin
g of
h
ealt
hy f
ood
s
Ap
pro
val of
in
du
stry
-sp
onso
red
ch
ildre
n
edu
cati
on a
ctiv
itie
s
pA
OR
† (9
5%
CI)
pA
OR
(9
5%
CI)
pA
OR
(9
5%
CI)
Exp
osu
re fro
m p
ass
ive
mark
etin
gN
ot in
last
mon
th137 (49.1
)1
11
At
least
on
ce in
last
mon
th
142 (50.9
)0.3
75
1.3
2 (0.7
2-2
.43)
0.1
52
0.5
2 (0.2
1-1
.28)
0.9
63
1.0
1 (0.5
8-1
.75)
Exp
osu
re fro
m a
ctiv
e m
ark
etin
g
Not
I t
he
last
mon
th183 (65.6
)1
11
At
least
on
ce in
last
mon
th
96 (34.4
)0.0
30
1.9
9 (1.0
7-3
.73)
0.3
22
1.6
2 (0.6
2-4
.21)
0.0
21
2.0
2 (1.1
1-3
.69)
† AO
R (9
5%
con
fiden
tial i
nte
rval): A
dju
sted
odds
rati
o co
mpu
ted a
fter
adju
stin
g fo
r so
cio-
dem
ogra
ph
ic c
hara
cter
isti
cs o
f th
e re
spon
den
ts,
nam
ely
age
, m
ari
tal
statu
s, e
du
cati
onal
back
grou
nd,
havi
ng
childre
n,
havi
ng
childre
n b
elow
5 y
ears
, h
avi
ng
childre
n a
bov
e 5 y
ears
an
d w
ealt
h s
tatu
s

Avianty S, Khusun H, Bardosono S et al.S58
exposed to active marketing at least once in the month prior to the survey, were 1.99 times more likely (AOR; 95% CI: 1.07-3.73) to approve marketing of unhealthy foods (Table 4). This category of respondents was also more likely to approve marketing of healthy foods (AOR: 1.62; 95% CI: 0.62-4.21) and industry-sponsored children nutrition education (AOR: 2.02; 95% CI: 1.11-3.69). In contrast, the respondents who were exposed to passive marketing were unlikely to approve the marketing of healthy foods or nutrition education for children by industry, compared to those who had no exposure at all.
DISCUSSION
The majority of respondents to the online survey were from Jakarta, had university education, and were categorised as having middle to high economic status. Rising income in Indonesia has been shown to be associated with changing dietary habits towards the increasing consumption of processed food products (Dyck, Woolverton & Rangkuti, 2012), especially in urban populations (Hawkes, 2007; Dyck et al., 2012; Umberger et al., 2014), owing to the need to save time, or because of convenience, variety, and pleasure (Agriculture & Agri-Food Canada, 2014).
The quantitative survey showed that active food marketing exposure was significantly associated with the approval of unhealthy food (p=0.030), as well as for the approval of industry-sponsored educational activities for children (p=0.021). Marketing increases the appeal of products to consumers, and processed food are among the most actively marketed products (Umberger et al., 2014; Phipps et al., 2014; Scully et al., 2012; Bernhardt et al., 2013; Lesser, Zimmerman & Cohen, 2013; Boyland et al., 2011; Harris et al., 2009). The informants of the in-depth interview said
that they bought additional promotional food products only when they thought that the family needed it.
While the online survey respondents received a high number of marketing exposures from emails, the qualitative study informants stated that they were exposed to marketing via the social media and SMS blasts. The exposure to online marketing depends on the degree of intensity of internet usage. In Indonesia, the number of internet users increased from 5.9 million in 2014 to 7.4 million in 2015 (PusKaKom & APJII, 2014), indicating the rapidly rising marketing opportunities for businesses. Companies are able to communicate directly with consumers with little time or location barriers (Haghirian, Madlberger & Tanuskova, 2005). Both the online survey and qualitative study participants approved the marketing of healthy food including fruit and vegetables. Studies have shown that supermarkets and grocery stores that had advertisements of healthy foods did manage to influence customers towards making more purchases of such foods (Escaron et al., 2013; Glanz, Bader & Iyer, 2012). Likewise, the informants in this study considered freshness and quality of perishable foods to be important.
Disapproval of the marketing of unhealthy foods, i.e. fast foods and high sugar content foods, was shown to be high among the survey respondents and the subjects of the interviews. The latter group with school-going children expressed concerns on the marketing of unhealthy foods nearby the school compound. Food companies are known to increasingly use integrated marketing campaigns to target children and youth since they are easily influenced, do not have enough knowledge to choose healthy foods, and because of their influence over family spending (WHO,

Exposure and approval of food marketing strategies among gatekeeper in Jakarta S59
2013; Boyland et al., 2011; Sharma & Sonwaney, 2014). Children in developing countries may be more vulnerable to food promotions as they are potentially less critical than children in developed countries (Hastings et al., 2006). In Indonesia, students purchase food and drinks in and around the schools. This creates an unhealthy food environment that has implications for obesity (Handayani et al., 2015).
Children’s educational activities that are sponsored by the industry received approval from more than half of the respondents (64.5%), even when the activity was sponsored by soft drinks/fast foods companies. The informants assumed nutrition education would benefit children “as long as the soft drinks or fast foods company did not promote their products”. This point to a low awareness about subtle unhealthy food marketing among Indonesian consumers. Sponsorships provided by food industry include the provision of research grants, support for the publication of paper, travel grants for the attendance of conferences and support of various educational activities (Nestle, 2001; Nestle, 2006; Ludwig & Nestle, 2008). However, the benefits of such support remain debatable. A very strong opinion in an article in the Lancet from Moodie et al. (2013), stated that any support by suppliers of unhealthy foods for research, education and other programs should not be accepted. Nonetheless, given that sponsorships by food company is not going to disappear, the challenge lies in trying to control them rather than act to prevent them. It will be crucial to recognise potential conflicts of interest that may arise, take steps to minimize them, and keep public health at the forefront of professional activities (Nestle, 2001). However, in Indonesia, there are as yet no clear regulations, authoritative bodies or restrictions that
deal with the marketing and advertising practices, especially of food and beverages (Susyanty et al., 2013). Given the findings of this study, public health authorities are urged to regulate food-marketing ethics, especially for foods that are targeted directly at children.
When addressing the influence of food marketing promotions, all interview informants emphasised the lure of promotion on their daily needs, especially promotion in the form of discounted products. Urban shoppers were interested in price reductions of healthy foods (Vukmirovic, 2015; Cohen & Babey, 2012; Glanz et al., 2012). They took advantage of sales to stock up on essential items (Phipps et al., 2014), and mentioned health considerations as the main factor for their decision for buying additional foods on promotion. This may indicate that price might not be a sensitive issue among highly educated people living urban areas. One explanation might be that consumers with higher education were more likely to have better knowledge of nutrition. Some studies have shown that in developed countries, the highly-educated were more likely to buy fruit and vegetables, while those with lower education attainment mentioned that price was more important than health and nutrition benefits (MacFarlane et al., 2007; Ward et al., 2012). Children with educated mothers had more healthy diets while children of the least educated consumed more foods that were convenient (Campbell et al., 2002).
The strength of this study was the use of mixed methods that showed the association between exposure and approval of food marketing promotion among household food providers. Among the limitations is the reliance on self-reported questionnaires, that could have been affected by memory recalls. The findings of the online survey cannot be
Avianty S, Khusun H, Bardosono S et al.S60
generalised to the broader Indonesian population since the selected sample comprised respondents with university education and middle-high income.
CONCLUSION
The present study showed that, among university educated people living in an urban area, exposure to food marketing did influence their approval for marketing strategies including marketing of unhealthy foods. This has serious implications especially in regard to marketing efforts that are aimed at children and household food providers without knowledge of health and nutrition. There is an urgent need for efforts to regulate unhealthy food marketing. In addition, industry should act responsibly in their marketing efforts to consumers. The government should independently and objectively monitor these efforts. While this study was conducted in a highly educated urban population, future studies should be undertaken among consumers with lower socio-economic status, to gain insight on the impact of food marketing exposure in that segment of the population.
Acknowledgements
This project was supported by a grant from Centre for Physical Activity and Nutrition Research, Deakin University, Melbourne, Australia. Data from online survey were obtained from AW.
Authors’ contributions
SA, designed the current study and carried out qualitative data collection, analysed and interpreted the data, and developed the first draft of the manuscript; HK, designed the current study, interpreted the data, conduct re-nalysis of the data, critically reviewed the first draft manuscript and drafting the subsequent draft of the manuscript until the current version; SB, designed the current study, interpreted the data, and critically reviewed the first draft manuscript; JF, involved in the online study of marketing exposures conducted by Centre for Physical Activity and Nutrition Research (Deakin University, Melbourne, Australia); AW lead the online study of marketing exposures conducted by Centre for Physical Activity and
Nutrition Research (Deakin University, Melbourne, Australia), and critically reviewed the manuscript. All authors have seen and approved the final manuscript.
Conflict of interest
The authors declare no conflict of interest.
References
Agriculture & Agri-Food Canada (2014). Global analysis report: market overview Indonesia. Global Analysis Division, Agriculture and Agri-Food Canada, Ottawa, Canada.
Bernhardt AM, Wilking C, Adachi-Mejia AM, Bergamini E, Marijnissen J & Sargent JD (2013). How television fast food marketing aimed at children compares with adult advertisements. PLoS ONE 8(8):e72479.
Bianchi SM & Raley SB (2005). Mahwah Time allocation in families. In SM Bianchi, LM Casper & RB King (eds). Work, family, health and wellbeing (pp. 21-42). Lawrence Earbaum Associates, Mahwah, NJ.
Boyland EJ, Harrold JA, Kirkham TC, Corker C, Cuddy J, Evans D, Dovey TM, Lawton CL, Blundell JE & Halford JC (2011). Food commercials increase preference for energy-dense foods, particularly in children who watch more television. Pediatrics 128:e93-100.
Campbell K, Crawford D, Jackson M, Cashel K, Worsley A, Gibbons K, Birch LL (2002). Family food environments of 5-6-year-old-children: Does socioeconomic status make a difference? Asia Pac J Clin Nutr 11:S553-S561.
Center for Health Research and Development (2010). Indonesia Basic Health Survey Report. Health and Research Department, Ministry of Health Republic of Indonesia.
Center for Health Research and Development (2013). Indonesia Basic Health Survey Report. Health and Research Department, Ministry of Health Republic of Indonesia.
Cohen DA & Babey SH (2012). Contextual influences on eating behaviours: Heuristic processing and dietary choices. Obes Rev 13:766-79.
Colby SE, Johnson L, Scheet A & Hoverson B (2010). Nutrition Marketing on Food Label. J Nutr Edu Behav 42:92-98.
Devine CM, Farrell TJ, Blake CE, Jastran M, Wethington E & Bisogni CA (2009). Work conditions and the food choice coping strategies of employed parents. J Nutr Educ Behav 41:365-370.

Exposure and approval of food marketing strategies among gatekeeper in Jakarta S61
Dyck J, Woolverton AE & Rangkuti FY (2012). Indonesia’s Modern Retail Sector: Interaction with changing food consumption and trade patterns. Econ Info Bull-97, US Department of Agriculture, Economic Research Service.
Escaron LA, Meinen MA, Nitzke AS & Martinez-Donate PA (2013). Supermarket and grocery store-based interventions to promote healthful food choice and eating practices: A systematic review. Prev Chr Dis 10:120156.
Glanz K, Bader MD & Iyer S (2012). Retail grocery store marketing strategies and obesity: an integrative review. Am J Prev Med 42:503-512.
Gustafson A, Wu Q, Spees C, Putnam N, Adams I, Harp D, Bush H & Taylor C (2014). How adolescents and parents food shopping patterns and social interaction when shopping is associated with dietary outcomes in rural communities. J Obes Weight Loss Ther 4:214.
Haghirian P, Madlberger M & Tanuskova A (2005). Increasing advertising value of mobile marketing—An empirical study of antecedents. Proceedings of the 38th Hawaii International Conference on System Sciences.
Handayani OWK, Rahayu T, Budiono I, Windraswara R, Fauzi L, Siyam N, Macdonald D & Cuaig L (2015). Health Promotion models to reduce childhood obesity in elementary school: A Comparison Study between Indonesia and Australia. JSRR 7:1-10.
Harris JL, Bargh JA & Brownell KD (2009). Priming effects of television food advertising on eating behavior. Hlth Psychol 28:404-413.
Hastings G, McDermott L, Angus K, Stead M & Thomson S (2006). The extent, nature and effects of food promotion to children: A review of the evidence. Technical Paper prepared for the World Health Organization. World Health Organisation.
Hawkes C (2007). WHO Commission on Social Determinants of Health: Globalization, Food and Nutrition Transitions. Globalization and Health Knowledge Network: Research Papers.
Institute of Medicine (2006). Food marketing to children and youth. Threat or opportunity? The National Academies Press, Washington DC.
International Chamber of Commerce (2012). Framework for responsible food and Baverage marketing Communication 2012. ICC Commision. The World Bussiness Organization.
Kirkpatrick S, Reedy J & McKinnon R (2010). Web-based compilation: Measures of the food environment. United States Department of Health and Human Service.
Lesser LI, Zimmerman FJ & Cohen DA (2013). Outdoor advertising, obesity, and soda consumption: a cross-sectional study. BMC Publ Hlth 13.
Ludwig DS & Nestle M (2008). Can the Food Industry Play a Constructive Role in the Obesity Epidemic? JAMA 300(15):1808-1811.
MacFarlane A, Crawford D, Ball K, Savige G & Worsley A (2007). Adolescent home food environments and socioeconomic position. Asia Pac J Clin Nutr 16:748-756.
Moodie R, Stuckler D, Monteiro C, Sheron N, Neal B, Thamarangsi T, Lincoln P & Casswell S (2013). Profits and pandemics: Prevention of harmful effects of tobacco, alcohol, and ultra-processed food and drink industries. Lancet 381:670-679.
Nestle M (2001). Food company sponsorship of nutrition research and professional activities: a conflict of interest? Publ Hlth Nutr 4:1015-1022.
Nestle M (2006). Food Marketing and Childhood Obesity: a matter of policy. N Engl J Med 354:2527-2529.
Nielsen (2010). Advertising effectiveness: Understanding the value of a social media impression. New York.
Pett M, Lackey NR & Sullivan JJ (2003). Making sense of factor analysis: The use of factor analysis for instrument development in health care research. SAGE Publication Inc., Thousand Oaks.
Phipps EJ, Kumanyika SK, Stites SD, Singletary SB, Cooblall C & DiSantis KI (2014). Buying food on sale: A Mixed Methods Study with shoppers at an urban supermarket, Philadelphia, Pennsylvania, 2010-2012. Prev Chronic Dis 11:(E151).
Popkin BM (2002). An overview on the nutrition transition and its health implications: the Bellagio meeting. Public Health Nutrition 5:93-103.
PusKaKom & APJII (2014). Profile of Internet User in Indonesia 2014. Indonesian Internet Service Provider Association (PusKaKom) Information research center, University of Indonesia (APJII).
Scully M, Wakefield M, Niven P, Chapman K, Crawford D, Pratt IS, Baur LA, Flood V, Morley B & NaSSDA Study Team (2012). Association between food marketing exposure and adolescents’ food choices and eating behaviors. Appetite 58:1-5.

Avianty S, Khusun H, Bardosono S et al.S62
Sharma A & Sonwaney V (2014). Theoretical modeling of influence of children on family purchase decision making. Sci Direct 133:38-46.
Sobur A (2003). Psikologi Umum dalam Lintasan Sejarah: Persepsi. CV Pustaka Setia, Jakarta.
Susyanty AL, Supardi S, Handayani RS, Herman M & Raharni (2013). Policy Control for Advertising of Processed Food in Indonesia. Public Health Center of Technology and Intervention, Health and Research Department, Ministry of Health Republic of Indonesia.
Swinburn B, Caterson I, Seidell J & James W (2004). Diet, nutrition and the prevention of excess weight gain and obesity. Publ Hlth Nutr 7:123-146.
Thomas F, Mark P, Jaime P & Rob A (2015). What affects authors and editors use of reporting Guidlines? Findings from an online survey and Qualiative interviews. PLoS One 10(4):e0121585.
Umberger WJ, He X, Minotc N & Toiba H (2014). Examining the relationship between the use of supermarkets and over-nutrition in Indonesia. AAEA Annual Meetings. Minneapolis, USA.
Vukmirovic M (2015). The effects of food advertising on food-related behaviours and perceptions in adults: A review. Food Res Int 75:13-19.
Wang MC, Naidoo N, Ferzacca S, Reddy G & Van Dam RM (2014). The role of women in food provision and food choice decision-making in Singapore: A case study. Ecol Food Nutr 53:658-677.
Ward PR, Mamerow L, Henderson J, Taylor AW, Meyer SB & Coveney J (2012). The social determinants of food purchasing practices: Who chooses price-before-health, taste-before-price or organic foods in Australia? Food Nutr Sci 3:461-470.
WHO (2013). Marketing of foods high in fat, salt, and sugar to children: Update 2012-2013. World Health Organization Regional Office for Europe.
Worsley A, Wang W, Sarmugam R, Pham Quynh, Februhartanty J & Ridley S (2017). Family food providers’ perceptions of the causes of obesity and effectiveness of weight control strategies in five countries in the Asia Pacific region: a cross-sectional survey. Nutrients 9:78. doi:10.3390/nu9010078.

Mal J Nutr 25 (Supplement): 63-73, 2019
__________________________
*Corresponding author: Dr. Judhiastuty FebruhartantySEAMEO RECFON, Jl. Salemba Raya 6, Central Jakarta, 10430, Indonesia.Tel: +628129260634, Fax: +62-21 3913933Email: [email protected]; [email protected]
Association between food marketing exposure and consumption of confectioneries among pre-school children in Jakarta
Maria Meilan Y Fernandez1,2, Judhiastuty Februhartanty2* & Saptawati Bardosono1
1Nutrition Department, Faculty of Medicine, Universitas Indonesia/Dr Cipto Mangunkusumo General Hospital, Jakarta, Indonesia; 2 Southeast Asian Ministers of Education Organization Regional Centre for Food and Nutrition (SEAMEO RECFON)/Pusat Kajian Gizi Regional (PKGR) Universitas Indonesia, Jakarta, Indonesia
ABSTRACT
Introduction: Prevalence of obesity among pre-school children in Indonesia is increasing. Since food advertisements reach all age groups, this study was conducted to assess the association between food marketing exposure and children’s consumption of confectioneries at home. Methods: Two hundred and forty caregivers of children aged 3-5 years attending 25 early childhood education centres in Central Jakarta, were interviewed in this cross-sectional study. A structured food frequency questionnaire was used to determine food marketing exposure and child dietary consumption. Chi-square tests compared consumption of confectioneries with different levels of marketing exposure. Results: Out of a total 240 caregivers, most were mothers of the study children (79.2%) and other family members (19.2%). The majority of the caregivers did not work (81.7%), and <15.0% had graduated from university, while 42.0% lived with extended family members. The top ten confectioneries consumed by the children included chocolate wafer crisp, chocolate stick and soft candy. Among the most common food marketing practices were as advertisements on public transport, print and electronic media. The significant associations between four food marketing practices and consumption of eight types of confectioneries were key findings of this study. Receiving food promotion through short message service (SMS) was not significantly associated with consumption of the top ten confectioneries. Conclusion: A positive association was found between food marketing practices and consumption of confectioneries by pre-school children in Central Jakarta. An appropriate policy on food advertisements that targets children combined with parental food education is recommended for improving food consumption habits of young children.
Keywords: Dietary consumption, food marketing, preschoolers, sugar and confectionery products, Indonesia

Fernandez MMY, Februhartanty J & Bardosono SS64
INTRODUCTION
The prevalence of overweight and obesity among children worldwide has increased in the past two decades. The World Health Organization (WHO) stated that in 2013, the number of overweight children who were < 5 years of age was estimated to be over 42 million globally. Many were from developing countries (WHO, 2016a). De Onis, Blossner & Borghi (2010) described an increasing trend of overweight-obesity prevalence among pre-school children that accounted for 3.2% in 1990, 4.9% in 2010, and is estimated will be 6.8% in 2020 in Asia alone. The Indonesian Basic Health Research (Riskesdas) has revealed a similar trend of increasing prevalence of overweight among under-fives from 3.9% in 2007 to 5.1% in 2013 (NIHRD, 2013). Childhood obesity is a strong predictor of obesity in adulthood. WHO (2016b) and Gatineau & Mathrani (2011) have noted that the consequences of childhood obesity include non-communicable diseases (NCDs), such as type 2 diabetes, cardiovascular diseases, metabolic syndrome, osteoarthritis and cancer in young adulthood.
Current social environment unconsciously encourages weight gain and obesity among children. The WHO (2016b) reported of changes in food availability and types, and decline in physical activity in terms of transport and playing among children, lead to energy imbalances. Whiney & Rolfes (2008) showed that children live in environments that expose them to an abundance of high-calorie and high-fat foods that are readily available, relatively inexpensive, heavily advertised, and reasonably tasty. This situation is described as being in an ‘obesogenic environment’ (Swinburn, Egger & Raza, 1999).
Obesity in children is increasing due to their preferences for foods such as instant foods that are energy-dense, high
in fat and sugars but low in vitamins, minerals and other micronutrients (WHO, 2016c; de Lira-Garcia, Bacardi-Gascon & Jiménez-Cruz, 2012). Research suggests that children naturally prefer sweet and savory foods and generally reject sour and bitter tastes. Taste preferences are developed from early childhood experience and through repeated exposures (Liem, 2004). Children appear to prefer foods that are energy dense due to their high sugar and fat contents (Brown et al., 2011). Over consumption of foods which are energy dense but poor in micronutrient content contribute to child adiposity (Zhou & Zhang, 2014). The high consumption of sugar-sweetened beverages has been associated with obesity as a result of the replacement of more nutrient dense foods. High sugar consumption also adversely affects dental health (Scafida & Chambers, 2017).
The foods that are considered confectioneries are candy, syrup, chocolate, chocolate chip/morsel, jelly, gelatin, and honey (Siswanto, 2014). Sweet, salty and high fat content foods are included in many widely advertised foods (Kelly et al., 2010). According to Worsley & Ridley (2014), exposure to food marketing is defined as the frequency that one sees food advertisements in a period of time. These include special offers, competitions, and giveaways of food/drink products. The high intake of energy dense food among children has been shown to be stimulated by food advertisements through television, the Internet, promotional campaigns and retail environments (Sonntag et al., 2015).
Young children are more susceptible to the effects of marketing than adults (Story & French, 2004). Child-directed advertisements are more likely to feature appeals of fun, taste, humor, fantasy, action/adventure, desirability, and mystery (Edmund et al., 2015). Marketers

Food marketing and child’s consumption of confectioneries S65
target children, in part, because of their ‘pester power’ and subsequent influence on food purchases by the family (Pettigrew & Roberts, 2007). Children are also direct consumers (Sharma & Dasgupta, 2009). “Children’s desires” (e.g. food likes) and health needs were among the top motives in the selection of foods and drinks by parents for their children (Russell, Worsley & Liem, 2014; Rigo et al., 2018).
There is a lack of studies in Indonesia on food marketing exposure and dietary consumption of young children. The capital city, Jakarta provides an appropriate setting for investigating the role of food marketing exposure as children are frequently exposed to the high volume of food advertisements in the city. The aim of this study is to determine the association between food marketing exposure and consumption of confectioneries among pre-school children in Central Jakarta.
MATERIALS AND METHODS
Study design and sampling procedureThis cross-sectional study was conducted in Jakarta in May 2017. The respondents were caregivers of pre-school children, with apparently healthy children aged 3-5 years, who attended pre-school in Central Jakarta. Children and/or caregivers who had physical disability or suffered from serious illness were excluded. The sample size needed was 240 children. This figure was calculated based on an estimate of 45% of children exposed to food advertising (Harris, Bargh & Brownell, 2009) with 95% confidence interval, 10% absolute precision, and a design effect of 2.5 to anticipate the variations between the centres/schools as the sampling unit. Out of a total of 321 centres/schools that provided early childhood education for children aged 3-5 years across eight sub-districts in Central Jakarta
(Ministry of Education and Culture, 2017), 25 were randomly selected, using a software called ENA for Smart version 2011 (Nutrisurvey, Germany). The data from the online source consisted of the number and name of the centres/schools, address and whether they were private or national (government owned) schools.
Before conducting the study, the researcher visited the selected centres/schools, and explained to the headmaster/principal the purpose of the study and the criteria for the selection of the respondents and their children.Children who appeared healthy and aged 3-5 years were included in the study. The number of eligible children who were included in the study was between 11-15 per centre/school. None of the respondents screened was excluded. Informed consent was obtained from the respondents before the interview.
Instrument development and data collection procedureData collected included the:(i) frequency intake of confectioneries
at home among the children, using a structured Food Frequency Questionnaire (FFQ);
(ii) demographic characteristics of the family such as child’s sex, respondent’s educational background, occupation, household socioeconomic status obtained from possession of assets and housing condition.
(iii) frequency of the food marketing exposure of the respondent and/or the child by way of special offers, competitions, or giveaway food/drink products in the past week through various media (television, game-internet, short message service blast, billboards, school competitions, magazines, supermarket toys, etc.), as adapted from Worsley & Ridley (2014).

Fernandez MMY, Februhartanty J & Bardosono SS66
The list of confectioneries used in this study FFQ was adapted from the Indonesian Total Diet Survey (TDS) by Siswanto (2014). The confectioneries included were candy, syrup, chocolate, chocolate chip/morsel, jelly, gelatin, and honey (Siswanto, 2014). These types of confectioneries were commonly seen advertised in various media outlets such as television, internet based social media i.e. e-mail, Facebook® and Instagram®, short message service (SMS), on transportation vehicles, print media i.e. brochures, flyers, etc., which were sold in the market places such as street stall/kiosks, mini market, supermarket, fast food restaurants. The researchers conducted observations in nearby markets, stalls, small shops, traditional markets, and other food retailers, to further verify that these confectioneries were available on the premises of the study. The final list of confectioneries used is shown in Table 2. In addition, a booklet containing photographs of the confectioneries listed in the FFQ was used to assist the respondents in recalling which confectioneries their children had consumed in the past one month.
The FFQ and other questionnaires were pretested before data collection. The interview was conducted after school hours when the caregivers picked up their children from school.
Data analysisThe data was analysed using SPSS version 20 for univariate and bivariate analysis with 95% confidence interval. Household socioeconomic status was defined as 1st – 3rd tertiles obtained from making a composite variable based on household assets and housing condition. The frequency of food consumption was defined as ‘ever consumed in the last month’ by the children. A total of 26 confectionery categories was included in the FFQ, and the response was arranged
from the most frequently consumed confectionery by the children to the least frequently consumed. Only the top ten commonly consumed products were included in the bivariate analysis.
The types of food marketing exposures in this study were categorized into (i) exposure from the media, and (ii) exposure from supermarket related promotion, based on Avianty (2016). Exposure from the media consisted of advertisements (i) seen on public transport, (ii) seen in a magazine/newspaper, (iii) received via email, social media, television, (iv) seen at school, and (v) received via SMS. Meanwhile food marketing exposure from supermarket-related promotions included (i) food or drinks purchased from vending machines, (ii) buying extra food or drinks on display at the supermarket checkout, (iii) receiving free food/drink sample at the train station, shopping centres, supermarket, etc., (iv) playing a game or entering a competition in the internet, and (v) entering a competition seen on food or drink packaging.
Out of these ten types of exposure, only the top five highest responses that were recorded in this study were entered in the bivariate analysis. The chi-square test was used to assess the association between the types of food marketing exposure with consumption of commonly consumed confectioneries.
Ethical considerationThis research proposal was approved by the Health Research Ethics Committee of the Faculty of Medicine, of Universitas Indonesia (approval number 342/UN2.FI/ETIK/2017). Written informed consent was obtained from each participant prior to data collection.
RESULTS
Out of a total of 240 respondents in the study, nearly 80.0% were mothers of the
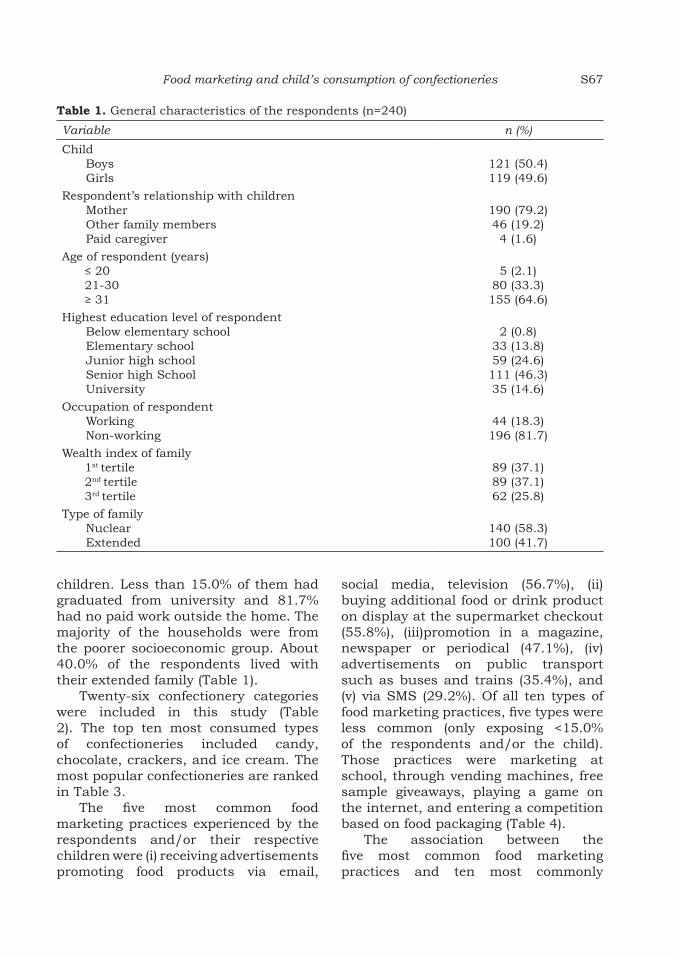
Food marketing and child’s consumption of confectioneries S67
children. Less than 15.0% of them had graduated from university and 81.7% had no paid work outside the home. The majority of the households were from the poorer socioeconomic group. About 40.0% of the respondents lived with their extended family (Table 1).
Twenty-six confectionery categories were included in this study (Table 2). The top ten most consumed types of confectioneries included candy, chocolate, crackers, and ice cream. The most popular confectioneries are ranked in Table 3.
The five most common food marketing practices experienced by the respondents and/or their respective children were (i) receiving advertisements promoting food products via email,
social media, television (56.7%), (ii) buying additional food or drink product on display at the supermarket checkout (55.8%), (iii)promotion in a magazine, newspaper or periodical (47.1%), (iv) advertisements on public transport such as buses and trains (35.4%), and (v) via SMS (29.2%). Of all ten types of food marketing practices, five types were less common (only exposing <15.0% of the respondents and/or the child). Those practices were marketing at school, through vending machines, free sample giveaways, playing a game on the internet, and entering a competition based on food packaging (Table 4).
The association between the five most common food marketing practices and ten most commonly
Table 1. General characteristics of the respondents (n=240)
Variable n (%)
ChildBoysGirls
121 (50.4)119 (49.6)
Respondent’s relationship with childrenMotherOther family membersPaid caregiver
190 (79.2)46 (19.2)4 (1.6)
Age of respondent (years)≤ 20 21-30≥ 31
5 (2.1)80 (33.3)155 (64.6)
Highest education level of respondent Below elementary schoolElementary schoolJunior high schoolSenior high SchoolUniversity
2 (0.8)33 (13.8)59 (24.6)111 (46.3)35 (14.6)
Occupation of respondentWorkingNon-working
44 (18.3)196 (81.7)
Wealth index of family1st tertile2nd tertile3rd tertile
89 (37.1)89 (37.1)62 (25.8)
Type of familyNuclearExtended
140 (58.3)100 (41.7)

Fernandez MMY, Februhartanty J & Bardosono SS68
consumed confectioneries is presented in Table 5. Food marketing exposure to magazines, newspapers and other print media was significantly associated with the consumption of the top six confectioneries, namely, Beng-beng, Choki-choki, Yupi, Milkita, Silverqueen, and Hot hot pop. This was followed by food marketing through e-mails, social media, and television which were associated with consumption of four of the confectioneries, namely, Yupi, Cha-cha, Milkita, and Silverqueen. Food advertisement on public transport and supermarket displays were each associated with two products, namely Beng-beng and Walls, and, Cha-cha and Silverqueen, respectively. Most of the confectioneries were associated with more than one marketing practice. In contrast, receiving promotion through SMS was the only marketing practice that was not significantly associated with children’s consumption of any of the top ten confectioneries.
Consumption of the confectioneries, Better and Kinderjoy, was not found to show significant association with any of the food marketing practices.
DISCUSSION
This study identified the top ten confectioneries consumed by pre-school children in Jakarta. The five most common food marketing practices were also found to have significant association with the consumption of several of the popular types of confectioneries. The present findings concur with reports of food marketing that targets young children (Huang, Mehta & Wong, 2011; Kelly et al., 2010; Sonntag et al., 2015). The caregivers and/or the children identified candy and chocolate wafer products through exposure to more than one type of marketing promotion technique. Children are fond of sweet foods and this preference may have been inculcated from an early age through
Table 2. List of confectioneries listed in the FFQ
Biscuits/cakes Candy Chocolate/wafer Jelly/pudding Ice cream
1) Better crackers with cream and chocolate coated
5) Big Babol bubble gum
13) Beng-Beng wafer crisp covered with chocolate
20) Milna toddler pudding
22) Campina ice cream
2) Better soft cake 6) Chupachups candy stick
14) Cha-cha choco biscuit candy
21) Okky jelly drink
23) Aice corn ice cream
3) Gerry choco roll crackers
7) Hot hot pop candy stick
15) Choki-choki chocolate stick
24) Magnum Classic ice cream
4) Momogi biscuit choco filling
8) Kiss candy 16) Chunky chocolate bar
25) Paddle Pop ice cream
9) Mentos candy 17) Kinderjoy chocolate candy
26) Walls ice cream cup
10) Milkita milk lollipop
18) KitKat wafer chocolate bar
11) Relaxa candy 19) Silverqueen chocolate bar
12) Yupi soft candy

Food marketing and child’s consumption of confectioneries S69
repeated exposures (Liem, 2004). The present study found that multiple food marketing techniques could potentially intensify a child’s taste preference. Advertisements with fun appeal and those which were adventure-driven were more likely to capture the attention of children (Edmund et al., 2015). The potential influence of children on their parents in making purchases is the aim of marketers in targeting children (Pettigrew & Roberts, 2007; Sharma & Dasgupta, 2009). Marketing practices also target parents or caregivers as they have the responsibility for purchasing for their children (Edmund et al., 2015).
Previous studies have reported the intensive use of television for marketing
various food products (Huang, Mehta & Wong, 2011; Kelly et al., 2010), as the television affords access to children at much earlier ages than other media (Ali et al., 2012). In contrast, the present study found that the print media, including magazines and newspapers, were associated with the consumption of confectioneries that were highly preferred by the pre-school children. Byrum (2014) has suggested that the printed media such as flyers, brochures, newspapers and magazines may have a stronger impact on brand awareness compared to television.
A strength of this study is that the types of confectioneries listed in the FFQ incorporates a review on the
Table 3. Confectioneries consumed at least once during in the past one month (n=240)
No. Food product n %
1. Beng-Beng wafer crisp covered with chocolate 138 57.52. Choki-choki chocolate stick 116 48.33. Yupi soft candy 105 43.84. Better crackers with cream and chocolate coated 101 42.15. Kinderjoy chocolate candy 75 31.36. Chacha biscuit choco ball 68 28.97. Milkita milk lollipop 55 22.98. Silverqueen (chocolate) 48 20.09. Hot hot pop stick candy 32 13.310. Walls ice cream cup 25 10.411. Big Babol bubble gum 24 10.012. Magnum classic ice cream 24 10.013. Kitkat wafer chocolate bar 20 8.314. Okky jelly drink 11 4.615. Campina ice cream 8 3.016. ChupaChups candy stick 8 3.417. Momogi biscuit choco filling 7 2.918. Gerry choco roll crackers 7 2.919. Paddle pop ice cream 6 2.520. Aice corn ice cream 4 1.621. Milna toddler pudding 3 1.222. Chunky chocolate bar 1 0.423. Mentos candy 1 0.424. Kiss candy 1 0.425. Better soft cake 1 0.426. Relaxa candy 1 0.4

Fernandez MMY, Februhartanty J & Bardosono SS70
marketing mode used by the food producers, as well as the availability of these products in the local market places. In this way, the confectioneries are those that are and widely sold and commonly consumed by the children in the study setting. Indonesia is considered the largest foodservice market among ASEAN countries (Chen, 2016). The top three growth drivers for Indonesia’s foodservice market are full-service restaurants, fast foods and street stalls/kiosks. In urban areas like Jakarta, street stalls/kiosks and mini markets may be regarded the most popular foodservice outlets since they provide affordable products (Chen, 2016). About 56.0% of the respondents and/or their children were exposed to marketing associated with product displays at supermarket checkouts. Sonntag et al. (2015) reported that to forge a long-lasting relationship with children and create brand loyalty in the short and long run, the food industry uses persuasive marketing techniques,
such as providing attractive and emotional-appeal product packing, and using toys as giveaways.
Children are unable to understand the intent of the advertisements. Moreover, they cannot distinguish healthy and unhealthy foods by themselves (Story & French, 2004). Therefore, a restricted policy for food advertising that is targeted at children is one of the strategies strongly recommended for combating the double-burden of malnutrition and unhealthy food intake in Indonesia (World Bank Indonesia, 2012). In Indonesia, legislation on the restriction of food advertisement targeting children should be implemented and followed up with monitoring measures. Such a policy on food marketing should include internet based and social media platforms since they are able to reach children. In addition, food education for parents should focus on increasing their knowledge in providing a healthier food environment at home (Februhartanty & Khusun, 2018).
Table 4. Marketing practices as experienced at least once by the respondents and/or children in the previous week (n=240)
Food marketing practices n (%)
Exposure from mediaOn public transport (e.g. bus, train) 85 (35.4)In a magazine, newspaper, printed media 113 (47.1)Received via email, social media, televsion 136 (56.7)At school (e.g. canteen, sports event)† 30 (12.5)Received via SMS 70 (29.2)
Exposure from supermarket related promotionsBuy food or drinks from a vending machine† 29 (12.1)Buy an extra food or drink product on display at the supermarket
checkout134 (55.8)
Receive a free sample of a food or drink product at a train station, shopping centre, supermarket†
36 (15.0)
Play a game or enter a competition on the internet that was related to a food or drink product†
6 (2.5)
Enter a competition you saw on food or drink packaging† 5 (2.1)†Excluded later in bivariate analysis
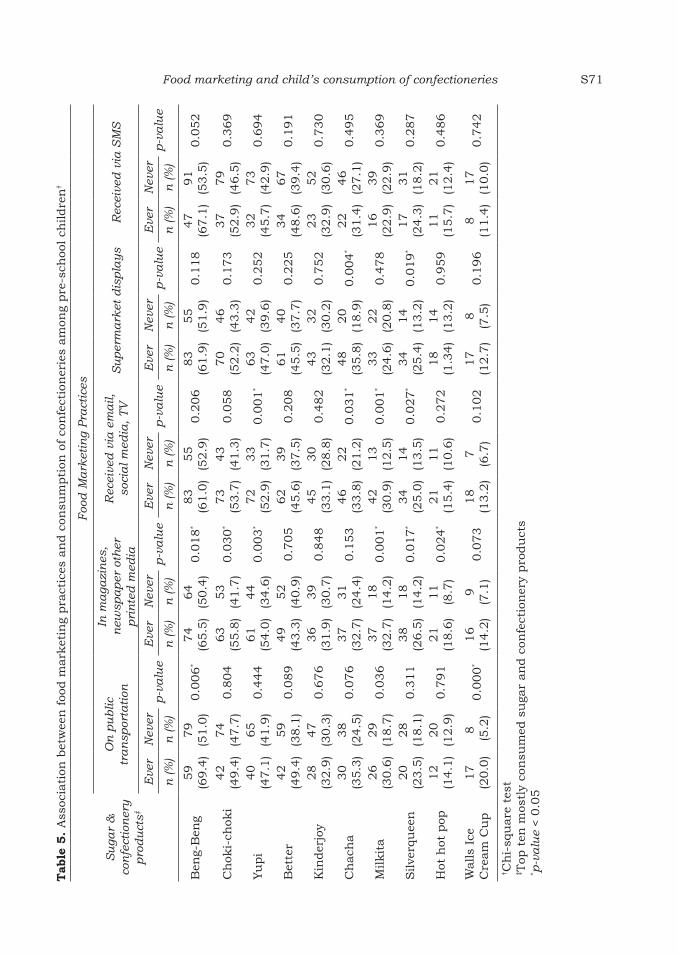
Food marketing and child’s consumption of confectioneries S71
Tab
le 5
. A
ssoc
iati
on b
etw
een
foo
d m
ark
etin
g pra
ctic
es a
nd c
onsu
mpti
on o
f co
nfe
ctio
ner
ies
am
ong
pre
-sch
ool ch
ildre
n†
Su
gar
&
con
fect
ion
ery
p
rod
uct
s‡
Foo
d M
ark
etin
g Pra
ctic
es
On
pu
blic
tr
an
spor
tati
on
In m
aga
zin
es,
new
spa
per
oth
er
pri
nte
d m
edia
Rec
eive
d v
ia e
ma
il,
soci
al m
edia
, TV
Su
per
ma
rket
dis
pla
ys
Rec
eive
d v
ia S
MS
Eve
rN
ever
p-v
alu
eE
ver
Nev
erp-v
alu
eE
ver
Nev
erp-v
alu
eE
ver
Nev
erp-v
alu
eE
ver
Nev
erp
-va
lue
n (%
)n
(%
)n
(%
)n
(%
)n
(%
)n
(%
)n
(%
)n
(%
)n
(%
)n
(%
)
Ben
g-B
eng
59
(69.4
)79
(51.0
)0.0
06
*74
(65.5
)64
(50.4
)0.0
18
*83
(61.0
)55
(52.9
)0.2
06
83
(61.9
)55
(51.9
)0.1
18
47
(67.1
)91
(53.5
)0.0
52
Ch
oki-
chok
i42
(49.4
)74
(47.7
)0.8
04
63
(55.8
)53
(41.7
)0.0
30
*73
(53.7
)43
(41.3
)0.0
58
70
(52.2
)46
(43.3
)0.1
73
37
(52.9
)79
(46.5
)0.3
69
Yu
pi
40
(47.1
)65
(41.9
)0.4
44
61
(54.0
)44
(34.6
)0.0
03
*72
(52.9
)33
(31.7
)0.0
01
*63
(47.0
)42
(39.6
)0.2
52
32
(45.7
)73
(42.9
)0.6
94
Bet
ter
42
(49.4
)59
(38.1
)0.0
89
49
(43.3
)52
(40.9
)0.7
05
62
(45.6
)39
(37.5
)0.2
08
61
(45.5
)40
(37.7
)0.2
25
34
(48.6
)67
(39.4
)0.1
91
Kin
der
joy
28
(32.9
)47
(30.3
)0.6
76
36
(31.9
)39
(30.7
)0.8
48
45
(33.1
)30
(28.8
)0.4
82
43
(32.1
)32
(30.2
)0.7
52
23
(32.9
)52
(30.6
)0.7
30
Ch
ach
a30
(35.3
)38
(24.5
)0.0
76
37
(32.7
)31
(24.4
)0.1
53
46
(33.8
)22
(21.2
)0.0
31
*48
(35.8
)20
(18.9
)0.0
04
*22
(31.4
)46
(27.1
)0.4
95
Milkit
a26
(30.6
)29
(18.7
)0.0
36
37
(32.7
)18
(14.2
)0.0
01
*42
(30.9
)13
(12.5
)0.0
01
*33
(24.6
)22
(20.8
)0.4
78
16
(22.9
)39
(22.9
)0.3
69
Silve
rqu
een
20
(23.5
)28
(18.1
)0.3
11
38
(26.5
)18
(14.2
)0.0
17
*34
(25.0
)14
(13.5
)0.0
27
*34
(25.4
)14
(13.2
)0.0
19
*17
(24.3
)31
(18.2
)0.2
87
Hot
hot
pop
12
(14.1
)20
(12.9
)0.7
91
21
(18.6
)11
(8.7
)0.0
24
*21
(15.4
)11
(10.6
)0.2
72
18
(1.3
4)
14
(13.2
)0.9
59
11
(15.7
)21
(12.4
)0.4
86
Walls
Ice
Cre
am
Cu
p17
(20.0
)8
(5.2
)0.0
00
*16
(14.2
)9
(7.1
)0.0
73
18
(13.2
)7
(6.7
)0.1
02
17
(12.7
)8
(7.5
)0.1
96
8
(11.4
)17
(10.0
)0.7
42
† Ch
i-sq
uare
tes
t‡ T
op t
en m
ostl
y co
nsu
med
su
gar
an
d c
onfe
ctio
ner
y pro
du
cts
* p-v
alu
e < 0
.05

Fernandez MMY, Februhartanty J & Bardosono SS72
Limitations of studyIn the present study, advertisements via e-mails, social media, and television were combined in the same category of marketing practice. Hence, the influence of these media individually could not be determined.
CONCLUSION
The study determined the association between popular food marketing practices and the consumption of confectioneries preferred by pre-school children in Jakarta. Policy restrictions of food advertisements that target children should be put in place. Providing education on healthier food choices to parents/care givers can contribute to the improvement of the home food environment for children.
Acknowledgement
We would like to thank all the participants and the schools participated in this study. We also thank the Institute of Physical Activity and Nutrition at Deakin University Melbourne Australia and SEAMEO RECFON Jakarta Indonesia for financially supporting the research.
Authors’ contributions
FMMY, contributed to the conception and design of the work, was involved in the acquisition and analysis of the data and compiled the first draft of the manuscript; FJ, contributed to the conception and design of the work, was involved in the acquisition and analysis of the data, the critical revision of the draft and approved the final draft; BS, contributed to the conception and design of the work, was involved in data interpretation, the critical revision of the draft and also approved the final draft.
Conflict of interest
All authors declared no potential conflicts of interest with respect to the research, authorship and/or publication of this article.
References
Ali A, Batra DK, Ravichandran N, Mustafa Z & Rehman SU (2012). Consumer socialization of children: a conceptual framework. International Journal of Scientific and Research Publications 2(1):1-5. From http://www.ijsrp.org/research_paper_jan2012/i jsrp- jan-2012-23.pdf . [Retrieved May 18 2018].
Avianty S (2016). Perception of food marketing and food practices: a mixed method approach among household food providers in Indonesia. Thesis. Universitas Indonesia, Jakarta.
Brown JE, Isaacs JS, Krinke UB, Lechtenberg E, Murtaugh MA, Sharbaugh C, Splett P, Stang J & Wooldridge N (2011). Nutrition through the life cycle. Wadsworth, Cengage Learning, Belmont.
Byrum KL (2014). A comparison of the source, media format, and sentiment in generating source credibility, information credibility, corporate brand reputation, purchase intention, and social media engagement in a Corporate Social Responsibility campaign presented via social media. Clemson University, Clemson.
Chen M (2016). Foodservice profile: Indonesia. Market Access Secretariat, Global Analysis Report, Agriculture and Agri-food Canada, Minister of Agriculture and Agri-Food, Ottawa.
de Lira-Gracia C, Bacardi-Gascon M & Jiménez-Cruz A (2012). Preferences of healthy and unhealthy foods among 3 to 4 years old in Mexico. Asia Pac J Clin Nutr 21(1):57-63.
de Onis M, Blossner M & Borghi E (2010). Global prevalence and trends of overweight and obesity among preschool children. Am J Clin Nutr 92:1257-1264.
Edmund JA, Smith ME, Mathur SJ, Sargent JD & Gilbert-Diamond D (2015). Children’s food and beverage promotion on television to parents. Pediatrics 136:1096-1102. doi: 10.1542/peds.2015-2853.
Februhartanty J & Khusun H (2018). Towards healthy eating: A resource for food and nutrition education with Southeast Asian context. SEAMEO RECFON, Jakarta.
Gatineau M & Mathrani S (2011). Obesity and ethnicity. National Obesity Observatory, Oxford.
Harris JL, Bargh JA & Brownell KD (2009). Priming effects of television food advertising on eating behavior. Health Psychol 28(4):404-413. doi:10.1037/a0014399.
Huang L, Mehta K & Wong ML (2011). Television food advertising in Singapore: the nature and extent of children’s exposure. Health Prom Int 27(2):187-196. doi:10.1093/heapro/dar021.
Kelly B, Halford JCG, Boyland EJ, Chapman K, Bautista-Castano I, Berg C, Caroti M, Cook B, Coutinho JG, Effertz T, Grammatikaki E, Keller K, Leung R, Manios Y, Monteiro R, Pedley C, Prell H, Raine K, Recine E, Serra-Majem L, Singh S & Summerbell C (2010). Television food advertising to children: a global perspective. American J Publ Hlth 100(9):1730-6.

Food marketing and child’s consumption of confectioneries S73
Liem DG (2004). Sweet and sour taste preferences of children. Thesis. Wageningen University, Wageningen. ISBN 90-8504-105-8.
Ministry of Education and Culture (2017). Data Referensi: Jumlah Data Satuan Pendidikan (Sekolah) Anak Usia Dini per Provinsi. From http://referensi.data.kemdikbud.go.id/index21.php [Retreived April 13 2017].
NIHRD (2013). Riset Kesehatan Dasar. Ministry of Health, Jakarta.
Pettigrew S & Roberts M (2007). Mothers’ perceptions of their control over their children’s diets. In F Gavan & M Vicki (eds). Advances in Consumer Research. Association for Consumer Research, Duluth.
Rigo M, Willcox J, Spence A & Worsley A (2018). Mothers’ Perceptions of Toddler Beverages. Nutrients 10(374):1-15. doi: 10.3390/nu1003074.
Russell CG, Worsley A & Liem DG (2014). Parents’ food choice motives and their associations with children’s food preferences. Publ Health Nutr 18(6):1018-27.
Scafida V & Chambers S (2017). Positive association between sugar consumption and dental decay prevalence independent of oral hygiene in pre-school children: a longitudinal prospective study. J Publ Health 40(3):275-83.
Sharma RW & Dasgupta P (2009). Marketing to children: a planning framework. Young Consumers 10:8.
Siswanto (2014). Buku Studi Diet Total: Survei Konsumsi Makanan Individu Indonesia 2014. Lembaga Penerbitan Badan Penelitian dan Pengembangan Kesehatan Kementerian Kesehatan Republik Indonesia, Jakarta.
Sonntag D, Schneider S, Mdege N, Ali S & Schmidt B (2015). Beyond food promotion: a systematic review on the influence of the food industry on obesity-related dietary behaviour among children. Nutrients 7:8565-8576. doi:10.3390/nu7105414.
Story M & French S (2004). Food advertising and marketing directed at children and adolescents in the US. Int J Behav Nutr Physical Activity 1:3.
Swinburn B, Egger G & Raza F (1999). Dissecting obesogenic environments: the development and application of a framework for identifying and prioritizing environmental interventions for obesity. Prev Med 29:563-570.
Whiney E & Rolfes SR (2008). Understanding Nutrition (11th ed). Thomson Higher Education, Belmont.
WHO (2016a). Childhood overweight and obesity. World Health Organization, Geneva. From www.who.int/dietphysicalactivity/childhood/en. [Retrieved May 19 2016].
WHO (2016b). Report of the Commission on Ending Childhood Obesity. World Health Organization, Geneva.
WHO (2016c). Tackling food marketing to children in a digital world: trans-disciplinary perspectives. Children’s rights, evidence of impact, methodological challenges, regulatory options and policy implications for the WHO European Region. World Health Organization Regional Office for Europe, Copenhagen.
World Bank Indonesia (2012). Indonesia: Facing up the double burden of malnutrition: Menghadapi Beban Ganda Malnutrisi. Indonesia Health Sector Review: policy and discusion notes. World Bank, Washington, DC. From http://documents.worldbank.org/curated/en/278471468258284433/pdf/NonAsciiFileName0.pdf [Retrieved March 20, 2019].
Worsley T & Ridley MS (2014). The Five Country Study 2014, Report 1: Food Marketing and Communication, Preliminary Findings. Centre for Physical Activity and Nutrition Research, Deakin University, Melbourne.
Zhou X & Zhang L (2014). The influence of dietary energy density on childhood obesity. Iranian J Publ Hlth 43(11):1587-88).


Mal J Nutr 25 (Supplement): 75-85, 2019
__________________________
*Corresponding author: Intan Yusuf HabibieNutrition Science Department, Brawijaya University, Jl. Veteran, Malang, East Java, IndonesiaTel: +6281297967490; E-mail: [email protected]
Eating behaviour of young female workers with low socioeconomic status in Malang City, East Java: a qualitative study
Intan Yusuf Habibie1,2*, Inge Brouwer2 & Judhiastuty Februhartanty3
1Nutrition Science Department, Brawijaya University, East Java Province, Malang, Indonesia; 2Division of Human Nutrition, Wageningen University, Wageningen, the Netherlands; 3Southeast Asian Ministers of Education Organization Regional Centre for Food and Nutrition (SEAMEO RECFON)/Pusat Kajian Gizi Regional (PKGR) Universitas Indonesia, Jakarta, Indonesia
ABSTRACT
Introduction: Eating behaviour is one of the important factors affecting nutritional status that has been widely investigated. However, there are few studies on the eating behaviour of young female workers in Indonesia. This study aimed at investigating the factors affecting eating behaviour of young female workers of low socioeconomic status in Malang, East Java province, Indonesia. Methods: Participants were recruited using purposive sampling from low-income families living in Malang City. The eligibility criteria were based on demographic information, including monthly household income and expenses. The participants recruited comprised 21 women aged 18-22 years who were employed outside their homes, unmarried and living with their parents. A qualitative methodology was used to understand the meaning and context of the eating behaviour of these women. In-depth interviews and focus group discussions were used as the primary data collection methods. Results: Two primary themes emerged as the main influences of the participants’ eating behaviour: individual attributes (food preferences, healthy eating knowledge and self-efficacy), and socio-environmental factors (peer influence, mother’s role and food availability). In general, the participants had some knowledge about healthy eating behaviour; however, they lacked self-efficacy to practise such behaviour. Conclusion: Individual motivations and socio-environmental factors were found to mediate the eating behaviour of young working women from poor households. These factors should be considered when designing nutrition programmes for achieving healthier eating behaviour among young working women.
Keywords: Young female workers, eating behaviour, qualitative study, low socioeconomic status, Indonesia
INTRODUCTION
The literature review by Andreyeva et al. (2012) emphasised the importance of healthy eating among women of reproductive age, especially those who worked outside the home. Healthy eating
among working women can become a challenge owing to several socioeconomic and environmental factors, including lack of access to healthy foods and time constraints due to long working hours. Unhealthy eating leads to nutrient

Habibie IY, Brouwer I & Februhartanty JS76
deficiencies. Women of reproductive age are particularly vulnerable to iron deficiency (Pala & Dundar, 2008). Underweight hinders productivity at work. In Asia, an estimated 20-40 per cent of women are underweight (WHO, 2010). Malnutrition in women leads to economic losses for not only the family but also the country.
Malnutrition among women is one of the major public health problems in Indonesia. Based on the Indonesian National Basic Health Research (Riset Kesehatan Dasar or Riskesdas), the prevalence rate of chronic energy deficiency in non-pregnant women of reproductive age was 13.6% in 2007 and 20.8% in 2013 (MOH RI 2007; MOH RI 2013). Riskesdas data in 2010 indicated that 40.7% and 37.4% of women of reproductive age (19-55 years) had energy and protein consumptions that were below the minimum requirements (MOH RI 2010). The prevalence rate of anaemia was 14.8% in 2007 and rose to 21.7% in 2013. According to World Health Organization (WHO) classification, this means that Indonesia is a country where anaemia is a moderate public health problem (WHO, 2011).
In order to develop effective strategies for the improvement of eating habits, it is important to identify the factors that influence eating behaviour. Various theories have been put forward to understand eating behaviour. The social-cognitive theory of Bandura is commonly used to support intervention programmes that promote healthy eating. The theory emphasises the interaction of three main factors that operate at the personal, behavioural and social levels, that can explain the health behaviours of people, including their eating habits (Bandura, 1989; Rinderknecht & Smith, 2004). The physical environment in which individuals interact in different settings is a critical force that may restrict or increase the motivation
of people towards making healthy eating decisions (Belon et al., 2016). Investigation of eating behaviour and its determinants may give us a better understanding of how and why eating behaviour can be influenced. Based on these factors, prevention strategies and interventions can be established to improve eating habits, particularly among vulnerable individuals, such as young female workers. The present study was aimed at determining the social and environmental factors that affect the eating behaviour of working women.
MATERIALS AND METHODS
Participants were recruited using purposive sampling from low-income families living in Malang City. The eligibility criteria were based on demographic information: women aged 18-22 years who were working outside the home, unmarried, and living with their parents. During the screening, the researchers inquired about monthly household income and expenses, in order to confirm that the household belonged to the low economic status category (Nielsen, 2010). A total of 21 working women, aged 18-22 years, was recruited. The purpose of the study was explained to the participants, all of whom signed the informed consent form. They were requested to minimise changes in their eating behaviour during the study period.
A qualitative study design was used to collect information on the eating behaviour and associated beliefs of the informants. Focus group discussions (FGDs) followed by in-depth interviews were both utilized sequentially. Two FGD sessions involving six different participants in each discussion session were conducted (Figure 1). The purpose of the FGDs was to gather information on their daily living routine and typical eating habits.

Determinants of eating behaviour in young female Indonesian workers S77
The FGDs and interviews were performed according to a prepared semi-structured question format (Table 1). A set of questions was used to guide the researchers during the interview. However, time was also provided for spontaneous questions on relevant topics that were not part of the interview questions. The guidelines for interviewing the female workers included topics related to their current eating behaviours, factors influencing their eating practices, and their perceptions about healthy eating. Meanwhile, the guidelines for the mothers of the female workers included topics related to the role of mothers in determining the eating behaviour of these women and their
perceptions about healthy eating. As for the job supervisors, a semi-structured interview was conducted where they were asked about regulations and employee programmes implemented at the workplace. Each FGD lasted about 40–50 minutes, whereas the in-depth interviews lasted for about 50–70 minutes. The topics serving as guidelines for the FGDs and in-depth interviews are shown in Table 1.
Ethical considerationsThe study protocols were approved by the Institute of Research and Community Service, Universitas Katolik Indonesia, Atma Jaya (No. 772/III/LPPM-PM.10.08/15/2014).
In-Depth Interview :1. Selected subjects from two selected districts and four villages
2. Selected subjects and informant were young female workers (n=9), three were fromKedungkandang districts and six were from Sukun, mothers (n=5), and supervisor
from department stores (n=1)
Focus Group Discussion :1. Two selected department stores in Malang city
2. Key subjects are young female workers (n=12), two sessions of Focus Group Discussion
Malang Cityn = 5 districts
Selected two densely populated districts
District 2Sukun
n = 11 villages
Village 1Tlogowaru
n = 2 young female workersn = 1 mother
Village 2Arjowinangun
n = 1 young female workern = 1 mother
Village 3Bandulan
n = 3 young female workersn = 1 mother
Village 4Tanjungrejo
n = 3 young female workern = 2 mothers
District 1Kedungkandangn = 12 villages
Selected two densely populated villages
Figure 1. Protocol for the sampling for subjects

Habibie IY, Brouwer I & Februhartanty JS78
Data analysisThematic content analysis was conducted to identify themes and patterns from the information that was collected. The primary steps were transcription of the audio information, generation of initial coding, search and review for themes (Braun & Clarke, 2006). The audio files of the participants who spoke in the Indonesian language during the interviews and FGDs were transcribed verbatim. The transcripts were examined several times before coding was carried out. Each phrase was provided with a code, and related codes
were categorised. Each category was assigned to one of the following primary themes: eating behaviour and factors associated with eating behaviour. The theme was coded using ATLAS.ti version 7 (Berlin, Germany). A summary of the participant’s opinions was provided. The major and contrasting opinions were described and illustrated as quotes from the transcripts.
RESULTS
The socioeconomic characteristics of young female workers and their mothers
Table 1. Topics for the focus group discussions and in-depth interviews
Focus Group Discussion In-Depth Interview
Focus group discussions among female workers1. What are your favourite foods?
Why do you like them?2. Who are the people who influence
your daily eating?3. Where do you usually eat?4. What do you think about healthy
eating?
In-depth interview of female workers1. Please describe your current daily eating
patterns?2. What are the factors that influence your daily
eating?3. Do you like to eat out? If so, why?4. What do you think about your own daily eating
habits?5. What do you know about healthy eating? 6. Do you think it is difficult to practise healthy
eating? If so, why?
In-depth interview of mothers of female workers1. Do you often eat together with your family?2. Do you give any information to your family
about healthy eating?3. Do you think mothers should play an important
role in informing their daughters about healthy eating? Could you elaborate on that?
4. What do you think about your daughter’s daily eating behaviour? Is it healthy enough?
In-depth interview among job supervisors of female workers
1. Based on your observation, where do the female workers have lunch?
2. What do the female workers usually eat during lunch or during their break?
3. Is there any nutrition education in your workplace?
4. What do you think about the female workers’ eating habits? Is it healthy enough?

Determinants of eating behaviour in young female Indonesian workers S79
Table 2. Socioeconomic characteristics of young female workers and their mothers
Characteristics n
In-depth interview
Young female workersAge (years)
19 20
Father’s education Elementary school Junior high school Senior high school
Mother’s education Elementary school Junior high school Senior high school
Monthly household income†
Rp 700,000–1,000,000 Rp 1,000,000–1,500,000
Mothers Age (years)
35–45 46–55
Level of education Elementary school Junior high school
Occupation Working Not working
Focus group discussion Age (years) 17.0-17.9 18.0-18.9 19.0-19.9 20.0 and aboveFather’s education
Elementary school Junior high school Senior high school
Mother’s education Elementary school Junior high school Senior high school
Monthly household income†
Rp 700,000–1,000,000 Rp 1,000,000–1,500,000
9
54
621
621
72
5
41
32
32
12
1254
615
615
57
†Low socioeconomic strata with monthly household expenses ranging from Rp 700.000 to Rp 2.000.000 based on Nielsen’s classification (Nielsen, 2010); Rp 14,000 = USD 1

Habibie IY, Brouwer I & Februhartanty JS80
are presented in Table 2. Based on observations, numerous food stalls were available in the living areas of the participants. These street vendors typically sell deep fat fried and calorie-dense foods. These nutrient-poor foods are appealing to the working women, especially when they did not bring home-cooked meals to work, and thus depended on street food. Local dishes were the typical foods that were frequently consumed. These included bakso (savoury meatball soup with noodles), fritters and cilok (boiled starchy balls) coupled with sambal (a spicy condiment made of pounded chilli). A majority of the working women liked spicy foods, and they often added sambal to increase the flavour of the food.
Two themes emerged, namely, individual and socio-environmental, were associated with the eating behaviours of the female workers in this study. The individual factors correlated with food sensory attributes, healthy eating awareness, and lack of self-efficacy. The role of mothers, food-related social facilitation, and food environment were the significantly associated socio-environmental factors.
Individual factorsIndividual factors may be categorised as (i) food sensory attributes, (ii) healthy eating awareness, and (iii) lack of self-efficacy.
Food sensory attributesThe interviews revealed that sensory features of foods namely the taste and appearance of food, were the most common factors affecting food choices.
“My first consideration in choosing food is taste. Price and appearance of food are secondary considerations. If it tastes bad, why should I eat?” (FGD 1-Young female worker 4)
The tastes of food, such as sweet, salty, and spicy, were frequently mentioned. Most participants preferred spicy foods. A pleasant taste had a powerful influence in the decision-making that is related to food consumption.
“I love bakso very much. Not only because the taste is good, but it is also cheap. Couple bakso and sambal, and it brings an intense flavour that is really delicious” (In-depth interview-Young female worker 2)
Healthy eating awareness The female workers indicated that they were aware of the benefits and positive health results of healthy eating habits. The term ‘healthy eating’ was constantly associated with ‘vegetables’, ‘fruits’ and ‘family meals’. A majority of the young women discussed the benefits of healthy eating, and their statements included phrases/terms such as ‘strong’, ‘keeping body fit’ and ‘stay slim’.
“...eating healthily makes us stronger and reduces the chance of getting sick” (In-depth interview-Young female worker 5)
Some of these young women also suggested that healthy eating practices should be based on ‘4 sehat 5 sempurna’, which means ‘four basic five excellent’ in English. This is an Indonesian nutrition slogan that was promoted from 1955 to 1999. The campaign on this slogan promoted four food groups based on the essential nutrients they contained; these were staple foods, side dishes (plant- and animal-based protein source foods), vegetables and fruits as well as milk for enhancement. Therefore, the consumption of all the four food groups with milk as the fifth were considered to be the perfect diet.

Determinants of eating behaviour in young female Indonesian workers S81
“4 sehat 5 sempurna is truly the best definition of healthy eating, because you will get food full of nutrients” (FGD 2-Young female worker 5)
Lack of self-efficacyA gap was observed between nutrition awareness and the difficulties experienced in putting this knowledge into daily practice. Despite their awareness about healthy eating habits, there appeared a lack of self-control when it came to choosing food for consumption. The taste of the food strongly determined their preferences and selections.
“I can’t resist eating spicy food. It feel tasteless if I don’t eat spicy foods” (FGD 2-Young female worker 6)
In a few cases, although the female workers became ill owing to a poor choice of food, it did not prevent them from changing their eating behaviour. The lack of self-control appeared to lead to poor food eating habits.
“I know that I have a gastric problem. My mother has always warned me before about it, but I just can’t resist the food” (In-depth interview-Young female worker 3)
Socio-environmental factorsSocio-environmental factors may be categorised as (i) role of mothers, (ii) food-related social facilitation, and (iii) food environment.
Role of mothers The mothers were important in influencing the eating behaviour of young female workers. According to the workers, the influence of parents was more significant than that of their workmates.
“I feel that our parents determine our eating habits more than our friends do. They know much more about their children because they have been living with their children since the children were born” (In-depth interview-Young female worker 9)
Some mothers also confirmed that they were confident of their role and influence in their families, particularly when it came to planning the family meal, which was important. Mothers identified family meals as an important influence on young women when selecting foods.
“I feel that my role as a mother to provide food has shaped my daughter’s food behaviour and I am sure I am giving the best meal to my family as well” (In-depth interview-Mother 3)
Mothers influenced the eating behaviour of their children by teaching them about healthy food consumption. In particular, they tried to prohibit the female workers from eating spicy foods and encourage them to have breakfast before going to work.
“My mother does not allow me to go to work if I do not have my breakfast. She also does not want me to eat spicy food” (In-depth interview-Young female worker 2)
Food-related social facilitation The participants claimed that besides their parents, their peers at the workplace had a significant influence on their eating habits. For example, eating with their peers tended to lead to increased food intake, and they mentioned feeling comfortable eating with peers.
“I like eating out with my workmates because it is much more fun compared to eating alone. We can eat and

Habibie IY, Brouwer I & Februhartanty JS82
talk about a lot of things” (In-depth interview-Young female worker 9)
In most events where food-related social facilitation was practised, there tended to be higher consumption of less healthy foods.
“I saw my friends eat spicy food and they wanted me to eat it as well. At first, I did not really like it, but they kept telling me to do so. Now I prefer to eat spicy foods” (FGD 2-Young female worker 1)
Food environmentA significant factor in influencing the food consumption behaviour of the participants was the availability of less healthy foods in the workplace and social settings where they lived. Increased access to money and the freedom they enjoyed influenced their food shopping behaviours.
“...today I will eat that sweet snacks on the first floor of our department store, and tomorrow probably I am going to eat the spicy snacks on the third floor…” (FGD 2-Young female worker 6)
A small number of the participants preferred to bring their lunch from home.
“I always bring my lunchbox from home. Because when it comes to break or lunch time, there are no food stalls nearby. So, I prefer to bring my own lunchbox here” (In-depth interview-Young female worker 6)
DISCUSSION
According to the socio-cognitive theory of Bandura (1989), personal and socio-environmental factors, such as social support, can directly and indirectly influence behaviour, including self-
efficacy, which is “an individual’s belief in their own ability to perform a particular behaviour and is considered a determinant of certain behaviours”. Specifically, “dietary self-efficacy refers to the extent of an individual’s ability to perform dietary behaviours and consider how people personally respond to barriers”. A lack of dietary self-efficacy would result in unhealthy eating behaviours. A study of young individuals showed that higher dietary self-efficacy correlated with higher intakes of fruits and vegetables (Bere & Klepp, 2004) and lower intakes of fatty foods (Frenn, Malin & Bansal, 2003).
The present study identified several issues pertaining to the eating behaviours of a sample of young female workers of low economic status in Malang City. The most pertinent finding that emerged from the FGDs and in-depth interviews was that while they may have been aware about healthy eating, they felt that they lacked self-efficacy to practise it owing to several challenges in their living and work environments. The majority of the female workers were unable to resist the temptations of eating unhealthy foods that were easily available and affordable.
The majority of the working participants stated that they considered the taste of food as a priority, rather than the nutrient content, when making food choices. The sensory properties of a food played a most important determinant in food choices in the absence of economic and availability constraints (IFIC, 2014). Affordability and accessibility of food items have been well documented as important drivers of food choice (Kourouniotis et al., 2016). It has been postulated that the influence of taste on decision-making is more compatible with factors such as cost and convenience, but less compatible with factors like nutrition. A knowledge of nutrition is necessary but is not
Determinants of eating behaviour in young female Indonesian workers S83
sufficient for encouraging changes in food choice behaviours and hence may not be the primary motivation for food choice (Worsley, 2002). A systematic literature review by Vaitkeviciute, Ball & Harris (2014) suggested the term ‘food literacy’, to indicate not only the individual’s understanding of basic information about food and nutrition, but also his/her ability to practise this knowledge in daily life.
This study found that peers, such as friends or workmates, strongly influenced the eating behaviour of the female workers primarily because of the significant amount of time they spent together. The participants claimed that their peers had a more significant influence on their eating behaviour than their parents. Several studies have shown that peers affect food intake through social facilitation. Social facilitation increased food intake when eating occured in the presence of others, as compared to when they eat alone (Herman, 2014). The presence of others directly increased the amount of food that was consumed and indirectly extended the duration of the meal (Herman, Roth & Polivy, 2003). Herman (2017) also opined that individuals preferred to experience the joy of eating in the company of friends, even to the extent of indulging in calorie-rich foods. In this study, the young workers were more likely to eat out during non-working days and tended to indulge in eating snacks and spicy foods while in the company of their peers.
The results from the in-depth interviews with the mothers of participants highlighted the importance of the roles of the mothers at home which were the procurement and preparation of food. The mothers showed their food preferences and played an important role in making food choices for their families. The mothers said they
influenced their daughter’s food choices, firstly, by determining the types of food available at home, and, secondly, by providing general information about food and health. The mothers typically chose to provide vegetables, tofu and tempeh (fermented soy bean) on a daily basis. They explained how they selected and purchased nutritious foods and this gave them confidence as mothers. Our findings support those of other researchers that mothers considered feeding responsibilities, such as providing family meals, as part of their identity as mothers (Chapman & Ogden, 2009). In addition, mothers in this study often warned their daughters that spicy foods were unhealthy. In general, our study did not find the mothers encouraging their daughters to make positive changes in their dietary behaviour. This may be related to their limited knowledge on the importance of food and health. Previous research has suggested that mothers with higher levels of health and nutrition knowledge provide healthier food to their daughters, compared to those who have lower levels of nutrition knowledge (Johnson et al., 2011).
Previous studies have also shown that the physical environment has important effects on consumers making food choices (Sallis & Glanz, 2009; Contento, 2008). Based on observations and statements of the participants, the living and working neighborhoods of the working participants may be described as being “obesogenic food environments”. An obesogenic environment refers to the influences of physical environments, opportunities and any conditions that may promote obesity in an individual or in populations (Lake & Townshend, 2006). The easy access to affordable foods available in various locations, including street vendors and mobile trucks, is an important influence of eating behaviour.
Habibie IY, Brouwer I & Februhartanty JS84
The ease of availability, reasonable prices and good taste were the reasons why the young women preferred to consume foods from street vendors.
Limitations of studyThe sample size of this study was relatively small and the results are hence not generalizable. In addition, it did not include quantitative measurements of potentially important characteristics, such as body mass index and quantitative of food consumed.
.CONCLUSION
Individual and environmental factors influenced the eating habits of young female workers from poor households in Malang City, East Java. These factors should be taken into consideration when designing nutrition intervention programmes to improve eating behaviour among the young women working outside the home. Nutrition education in the work area combined with changes to produce a healthier food environment maybe beneficial in changing their eating behaviour there.
Acknowledgement
The author would like to thank Ravi Menon, Aang Sutisna and Agnes Mallipu from Global Alliance for Improved Nutrition (GAIN), Indonesia for assisting in the preparation of fieldwork and actively providing important feedback during the study. The authors would also like to acknowledge Mulia Sondari, Dwi Yuwono Kristanto, Lavrencia Annashopy, Nur Paramita and Gusti Anjar for assisting in data collection as well as all informants who willingly participated in the study. This research was fully funded by GAIN.
Authors’ contributions
IYH, involved in the recruitment of participants, field work planning, data collection and writing of the first draft of the manuscript; IB, contributed to data interpretation; JF, contributed to data analysis. All authors participated in the conceptualisation and design of the study, critical revision of the draft and final version of the manuscript.
Conflict of interest
All authors declare no potential conflicts of interest with respect to the research, authorship and/or publication of this article.
References
Andreyeva T, Luedicke J, Middleton AE, Long MW & Schwartz MB (2012). Positive influence of the revised special supplemental nutrition program for women, infants, and children food packages on access to healthy foods. J Acad Nutr Diet 112(6):850-858.
Bandura A (1989). Human agency in social cognitive theory. Am Psycho 44(9):1175-1184.
Belon AP, Nieuewendyk LM, Vallianatos H & Nykiforuk CIJ (2016). Perceived community environmental influences on eating behaviors: A photovoice analysis. Soc Sci & Med 171:18-29.
Bere E & Klepp KI (2004). Correlates of fruit and vegetable intake among Norwegian school children: parental and self-reports. Publ Hlth Nutr 7(8): 991-998.
Braun V & Clarke V (2006). Using thematic analysis in psychology. Qualitative Res in Psychol 3(2):77-101.
Chapman K & Ogden J (2009). A qualitative study exploring how mothers manage their teenage children’s diets. Vulnerable Child Youth Stud 4(1):90-100.
Contento I (2008). Review of nutrition education research in the Journal of Nutrition Education and Behaviour 1998 to 2007. J Nutr Edu Behav 40(6):331-340.
Frenn M, Malin S & Bansal NK (2003). Stage-based interventions for low-fat diet with middle school students. J Pediatr Nurs 18(1):36-45.
Herman CP (2014). The social facilitation of eating. A review. Appetite 86:61-73.
Herman CP (2017). The social facilitation of eating or the facilitation of social eating? J Eating Disorder 5:16.
Herman CP, Roth DA & Polivy J (2003). Effects of the presence of others on food intake: a normative interpretation. Psychol Bull 129:873–886.
IFIC (2014). Food & Health Survey: Consumer Attitudes toward Food Safety, Nutrition, and Health. International Food Information Council Foundation, Washington, DC.
Johnson CM, Sharkey JR, Dean WR, McIntosh WA & Kubena KS (2011). It’s who I am and what we eat. Mothers’ food-related identities in family food choice. Appetite 57(1):220-228.

Determinants of eating behaviour in young female Indonesian workers S85
Kourouniotis S, Keast RSJ, Riddell LJ, Lacy K, Thorpe MG & Cicerale S (2016). The importance of taste on dietary choice, behaviour and intake in a group of young adults. Appetite 103:1-7.
Lake A & Townshend T (2006). Obesogenic environments: exploring the built and food environments. J Roy Soc for Prom Hlth 126(6):262-7.
MOH RI (2007). Report of the National Basic Health Research (RISKESDAS) 2007. Agency for Health Research and Development, Ministry of Health Republic of Indonesia, Jakarta.
MOH RI (2010). Report of the National Basic Health Research (RISKESDAS) 2010. Agency for Health Research and Development, Ministry of Health Republic of Indonesia, Jakarta.
MOH RI (2013). Report of the National Basic Health Research (RISKESDAS) 2013. Agency for Health Research and Development, Ministry of Health Republic of Indonesia, Jakarta.
Nielsen AC (2010). SES (Socio-Economic Status) Indonesia. From http://vidinur.net/2010/11/04/ses-socio-economic-status-ndonesia/. [Retrieved July 9 2019].
Pala K & Dundar N (2008). Prevalence and risk factors of anaemia among women of reproductive age in Bursa, Turkey. Indian J of Med Res 128(3):282-6.
Rinderknecht K & Smith C (2004). Social cognitive theory in an after-school nutrition intervention for urban Native American youth. J Nutr Educ Behav 36(6):298-304.
Sallis JF & Glanz K (2009). Physical activity and food environments: solutions to the obesity epidemic. Milbank Q 87(1):123-154.
Vaitkeviciute R, Ball LE & Harris N (2014). The relationship between food literacy and dietary intake in adolescents: a systematic review. Pub Hlth Nutr 18(4):1-10.
WHO (2010). Health inequities in the South-East Asia region: selected country case studies. World Health Organization Regional Office for South-East Asia.
WHO (2011). Haemoglobin concentrations for the diagnosis of anaemia and assessment of severity. Vitamin and Mineral Nutrition Information System. Geneva, World Health Organization. From (http://www.who.int/vmnis/indicators/haemoglobin.pdf. [Retrieved July 9 2019].
Worsley A (2002). Nutrition knowledge and food consumption: can nutrition knowledge change food behaviour? Asia Pac J Clin Nutr 11(S3):S579-S585.


Mal J Nutr 25 (Supplement): 87-96, 2019
__________________________
*Corresponding author: Mulia SondariDirectorate of Processed Food Registration, National Agency of Drug and Food ControlMinistry of Health Republic of Indonesia, Jl. Percetakan Negara No 23, Jakarta, Indonesia. Tel: +6289687554782, Fax : +62-21 4245267; Email: [email protected]
Eating behaviour of adolescent schoolgirls in Malang, East Java: a qualitative study
Mulia Sondari1,2*, Inge Brouwer2 & Judhiastuty Februhartanty3
1National Agency of Drug and Food Control, Ministry of Health Republic of Indonesia, Jakarta, Indonesia; 2 Division of Human Nutrition, Wageningen University, Netherlands; 3 Southeast Asian Ministers of Education Organization Regional Centre for Food and Nutrition (SEAMEO RECFON)/Pusat Kajian Gizi Regional (PKGR), Universitas Indonesia, Jakarta, Indonesia
ABSTRACT
Introduction: Poor eating behaviour is known to lead to nutritional deficiency among adolescents. At the same time, poor eating behaviour characterised by dietary excesses could lead to overweight and obesity. The present study aimed to explore the eating behaviour of adolescent schoolgirls in Malang, East Java Province, Indonesia, and to determine the factors that influenced their eating behaviour. Methods: This was a qualitative study, guided by the Social Cognitive Theory (SCT), which focused on individual and environmental influences to better understand health-related behaviours, such as eating behaviour. Triangulation was applied to the study subjects (adolescent girls, their mothers, and school staff). The methods used included individual in-depth interviews and focus group discussions. Qualitative data analyses were performed using Atlas.ti 7. Results: Most participants showed poor eating behaviour that was characterised by skipping breakfast, frequent consumption of fast foods and the consumption of local food with low nutrient content. Their eating behaviour was influenced by individual factors including personal preferences, the price of the food, and by environmental factors, such as the family, school and neighbourhood. Conclusion: Our findings showed that adolescent girls in Malang appeared to be aware of healthy eating but they showed unsatisfactory eating practices. Interventions are suggested to improve the poor eating behaviour of the adolescents toward avoiding malnutrition consequences.
Keywords: Eating behaviour, adolescent schoolgirls, Malang, Indonesia
INTRODUCTION
As adolescence is a critical stage of physical and psychological growth and development, healthy dietary behaviour during this period is important. A previous study has reported that adolescents are prone to poor eating, with a tendency to a high consumption
of energy-dense foods, sugar-sweetened beverages, and a low intake of fruits and vegetables (Rathi, Riddell & Worsley, 2017). Adolescents, particularly girls, are prone to nutritional deficiencies owing to poor intake of nutrients that are needed to support the growth spurt and the body’s demand for iron during

Sondari M, Brouwer I & Februhartanty JS88
menstruation (Mesias et al., 2013). On the other hand, dietary excesses during adolescence may lead to overweight and obesity (Sahoo et al., 2015). Poor eating habits formed during adolescence may persist into adulthood (Craigie et al., 2011). Therefore, establishing a healthy eating behavior during adolescence has both short- and long-term health benefits.
In Indonesia, a study found that low socioeconomic status (SES) is associated with iron deficiency among adolescent girls (Sumarlan, Windiastuti & Gunardi, 2018). In East Java, the prevalence of chronic energy deficiency in women of reproductive age (15–49 years) was higher than the national rate, while the prevalence of stunting among adolescents was comparable to the national rate (MOH Indonesia, 2013).
Several qualitative studies have reported that adolescent food choice behaviour was influenced by the SES (Maulida et al., 2016), food preferences, familial factors (home food environment, parental style), food accessibility and availability (Fitzgerald et al., 2010). However, there are currently few qualitative studies on the eating behaviour of Indonesian adolescents and its associated factors.
The aim of the study was to explore the eating behaviour of adolescent girls (aged 15-18 years) from low SES backgrounds in Malang, East Java Province, Indonesia and to identify the factors that drove their eating behaviour. The study used a qualitative research approach and was guided by the Social Cognitive Theory (SCT) (Bandura, 1998). The SCT is a widely used theory applied in interventions to promote healthy eating among adolescents (Fitzgerald et al., 2010; Hall, Chai & Albrecht, 2016). This theory focuses on the interactions among individuals, and their social and physical environment to explain health-related behaviour such as eating practices.
MATERIALS AND METHODS
The primary subjects were adolescent schoolgirls while the secondary subjects were mothers and school staff as informants to validate the opinions of the girls. The study was conducted in three public high schools in Malang. Malang is the second largest city in the East Java Province. According to the National Socioeconomic Survey (Central Bureau of Statistic Indonesia, 2013), it has the highest proportion (16%) of adolescent girls aged 15-18 years within the total number of women aged 15-49 years.
The triangulation technique was used in validating the interpretation of the data collected from different sources. In this study, the triangulation sources used were different subjects (girls, mothers, and school staff), as well as different methods (individual interviews and focus group discussions [FDGs]). The FGD approach provides a relaxed atmosphere as the subjects are in the company of their peers (Daley, 2013). Therefore the FGDs were done at their schools at the beginning of the data collection stage to gain a preliminary understanding of the general situation of the eating behaviour of the adolescents and their lifestyles. Following this first stage of understanding, individual interviews of the girls and their mothers were done separately at home, in order to obtain more insightful responses. The interviews with the school staff were conducted at the schools.
The FGD and interview questions to the girls were similar because the two methods were used to different girls as a way to triangulate communal perception. However, we started the interview by asking about the daily routine and daily eating practices of the participants. The FGD started with a discussion of similar and/or different eating habits among the participants. Examples of the questions posed to the girls are stated in Table 1.

Qualitative study on adolescents’ eating behaviours in Malang, Indonesia S89
Table 1. Sample questions for adolescent girls
No. Sample questions
1.
2.
3.
4.
5.
Tell me about your daily eating routine during weekdays and weekends?What kinds of food do you like to eat? Why do you like them?What does a healthy eating mean to you? Tell us about the places in your neighbourhood where you can get food. What do you think about the food available in your school?
ParticipantsOur study focused on adolescent girls aged 15-18 years, from low-income families who were enrolled in a public high school or public vocational school in Malang. The girls who were selected were mostly of low SES and attended public schools which charged school fees that were reasonably affordable to them. In addition, the SES level was determined based on demographic information gained during the screening process and their monthly household income range IDR 700,000–2,000,000 IDR (US$47.51–135.75) which was categorized as C and D classes based on Nielsen’s classification in 2010 (Table 2). The girls were excluded from selection if they had difficulty in communicating, mental illness and/or learning disability.
The mothers of the adolescent girls (aged 15-18 years) that fulfilled the inclusion criteria above were selected for triangulation. The school staff members who were selected were employed at one of the selected schools and were willing to participate on the day of data collection.
Purposive sampling was used to recruit mother and girl (daughter) pairs for the interviews. Participants were selected from two of the most highly populated sub-districts in Malang, namely Kedungkandang (43,666 households) and Sukun (45,666 households) (Central Bureau of Statistic Indonesia, 2013). The screening process involved visiting the homes of the girls and asking them and their mothers about the household income and expenditure.
Participants for the FGD were selected from the three public schools that were willing to participate in the study. At each school, the staff selected 10-20 female students who received school fee subsidy. The researcher then invited the selected students to complete a demographic information form to screen the parental income so as to ensure it met the requirements for low socioeconomic level. Out of the 45 adolescent girls from three schools, 25 were eligible. A total of 19 girls were included in the FGDs as the rest were
Table 2. The Nielsen’s classification of the Indonesian socioeconomic segments†
SegmentMonthly household expenditure(Indonesian Rupiah /month)‡
Proportion (%)
A ≥ 3,000,000 13
B 2,000,000 – 3,000,000 27
C1 1,500,000 – 2,000,000 28
C2 1,000,000 – 1,500,000 21
D 700,000 – 1,000,000 8
E ≤ 700,000 3†Nielsen (2010)‡The expenses included daily food, electricity, water and monthly rent and excluded paid yearly rent, installment payment, furniture and irregular expenses.

Sondari M, Brouwer I & Februhartanty JS90
absent or because the discussion times conflicted with their examinations.
Each FGD involved 6-7 students per school. The staff members at the schools were recruited for the FGD by convenience sampling. Two of the three staff who were selected had worked in the school for 15-20 years. One was a teacher and the others were student counsellors.
No specific criteria were applied when selecting the schools except that they had to be public schools located in the study area and were willing to participate in the study.
ProcedureThe study was approved by the Ethical Committee of Atmajaya Catholic University (approval number: 771/III/LPPM-PM.10.05/08/2014). The estimated point of saturation was observed after interviewing nine adolescent girls, their mothers, and conducting three group discussions with 19 adolescent girls.
Data collection took place between September to October 2014. All the participants gave written consent prior to each FGD and interview. The researcher facilitated the FGDs and interviews with a note-taker, and the discussions were also audio-recorded with the consent of the participants. The questions in the FGD and in the interview guidelines were similar. The objective of the FGDs, which were conducted at the beginning of the data collection, was to become familiar with the daily activities and food practices of the girls. Topics such as the eating behaviour of the girls were addressed in-depth during the interviews. The FGD sessions lasted for about 40-50 min, while in-depth interviews lasted for about 50-70 min. Mothers and girls were interviewed separately, after which all the participants were interviewed together.
Data were analysed using the inductive thematic analysis approach, moving from specific to more general
conclusions. Recordings of the FGDs and interviews were transcribed verbatim and the field notes were documented. Each individual transcript was repeatedly reread and re-examined to ensure reliability. The key concepts were identified by coding the data and then by categorising the codes. Coding and categorising were carried out using qualitative data analysis software Atlas.ti version 7. When all the data were categorised, similar categories were grouped into themes.
RESULTS
The two themes that emerged in relation to the eating habits of the girls were the skipping of breakfast and the consumption of fast foods. The factors that influenced the eating habits of the girls are presented below according to individual and environmental influences. Examples of quotes are shown below to illustrate each theme.
Adolescent girls’ eating behaviourTheme 1: Breakfast skippingDuring the weekdays, the majority of the adolescent girls from low socioeconomic background in Malang skipped breakfast.
“The food was not ready in the morning; anyway, I don’t have time to eat food” (Girl–FGD 1)
“I’m not used to eating breakfast since I was a child; my stomach feels queasy if I have breakfast” (Girl-FGD 3)
“I must hurry to go to school, so I have no time for breakfast, but then I’ll bring a lunch box” (Girl–FGD 2)
Although the mothers and school staff were aware of this behaviour, they did not mention during the FGD whether they encouraged the girls to have breakfast.

Qualitative study on adolescents’ eating behaviours in Malang, Indonesia S91
“She wasn’t used to having breakfast, but usually she brings a lunch box to school” (Mother 2)
“Most of them don’t have breakfast; when they get sick or have a headache, they come to us asking for medicine and when we ask whether they had breakfast most of them reply that they had not” (School staff 2)
Theme 2: Fast food and locally available food consumptionThe majority of the girls in this study reported that they liked to consume fast foods and local foods, because of the taste and its availability in many places in the neighbourhood, such from street food vendors and in the school canteen.
“I like bakso (meatball soup; meatball consisting usually a small quantity of meat and a lot of flour, or without any meat completely made with flour); it’s tasty, cheap and available everywhere” (Girl 4–Interview)
“I like cilok (fried-small bakso served with peanut spicy sauce), it’s tasty” (Girl 2–Interview)
“I like eating burgers, it’s tasty” (Girl 6-Interview)
“Where do you buy it?” (Interviewer) “From the street vendors, it’s cheaper than from the fast food restaurants” (Girl 6-Interview)
The school staff confirmed this behaviour.
“I have observed that high schoolgirls love to eat something that tastes savory. If you observe them at the canteen, they like to eat bakso and noodles with a lot of spicy sauce” (School staff 2)
Factors influencing the eating behaviour of adolescent girls The eating behaviour of girls’ is influenced by individual and environmental factors.
Theme 1: Individual influences (i) Knowledge and awarenessThe girls discussed healthy eating and mentioned that it meant eating specific foods such as vegetables, fruits and foods containing nutrients. Healthy eating was also defined by the girls as consuming food that was prepared at home, as they believed that the cleanliness was superior and the ingredients were known. One girl in a FGD defined eating on time as part of healthy eating.
“I don’t know exactly, but I think healthy eating is eating vegetables and fruit” (Girl 3–Interview)
“Consuming food containing carbohydrate, protein, vitamins” (Girl–FGD 2)
“Having meals on time and not skipping meals” (Girl–FGD 1)
“Eating home-made food is healthy because we know how it was cooked; we are also sure of the cleanliness of the processing of the food” (Girl-FGD 2)
The majority of girls reported that they were aware of the general benefits of healthy eating such as providing support for body growth and immunity.
“Healthy eating makes us strong and as a result it is not easy to get sick” (Girl–FGD 1)
“Healthy eating will support our body growth” (Girl 1–Interview)
Mothers perceived healthy eating as the consumption of food prepared at home

Sondari M, Brouwer I & Februhartanty JS92
and which were healthy foods such as vegetables, tofu and tempeh.
(ii) Food preferencesThe adolescent girls stated that the taste of food was the most important factor that influenced their decisions on the choice of foods. Overall, the girls were enthusiastic when talking about savory, sweet or spicy foods. On the other hand, vegetables were associated with unpleasant and negative taste experiences.
“Taste of the food is important. I like savory food because it’s tasty” (Girl–FGD 2)
“I like eating snacks because it tastes good” (Girl-FGD 3)
“Vegetables? I don’t eat it very much because it’s tasteless” (Girl 4–Interview)
“I don’t like cabbage because it’s bitter” (Girl 2-Interview)
Mothers and school staff also reported that taste preferences influenced the girls when making food choices. Mothers understood that healthy foods such as vegetables were good for their children and which were often available at home. But they often compromised with their children and did not put pressure on them to eat vegetables.
“It’s hard to tell my daughter to eat vegetables. She said vegetables are not tasty” (Mother 6)
“If I force her to eat vegetables, she won’t eat the food at all. So, I let her eat what she wants” (Mother 1)
“Mostly the students only consider the taste of the food without considering whether it is healthy or not” (School staff 1)
(iii) Price of the food Most of the girls indicated that they often preferred foods that were cheaper and easy to buy even though they are not healthy.
“Unhealthy food, like bakso, is cheap, and the bakso seller is easy to find near the house” (Girl 4–Interview)
“I don’t have enough pocket money, so most of the time I only buy snacks at school” (Girl 6-Interview)
“The food sold by street vendors or school canteen is cheaper than that sold in the mall. This is because the facilities to make the food are not good and the ingredients are cheaper” (Girl–FGD 2)
School staff believed that the girls preferred tasty and cheap foods over healthy food.
“They will consider taste and price for food choice. The canteen in this school sells cheap meals like bakso. They’re likely to buy this kind of food instead of healthy food” (School staff 2)
Theme 2: Environmental influences (i) School and neighbourhoodThe availability and accessibility of fast foods and local foods in the school canteen and the neighbourhood, such as from street vendors or casual shops, was the most frequent reason expressed by the adolescent girls for deciding on their food choices.
“I often buy savory snacks and cold sweet drinks at the school canteen” (Girl 2–Interview)
“I like eating bakso but sometimes I didn’t eat bakso in a week, if the bakso seller in the canteen was away” (Girl 7-Interview)
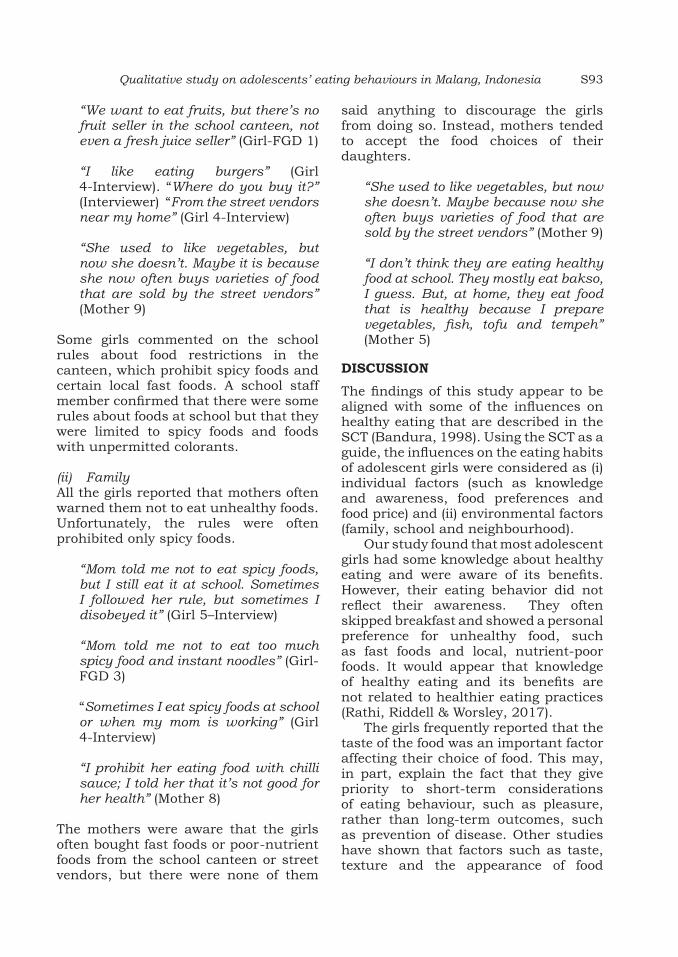
Qualitative study on adolescents’ eating behaviours in Malang, Indonesia S93
“We want to eat fruits, but there’s no fruit seller in the school canteen, not even a fresh juice seller” (Girl-FGD 1)
“I like eating burgers” (Girl 4-Interview). “Where do you buy it?” (Interviewer) “From the street vendors near my home” (Girl 4-Interview)
“She used to like vegetables, but now she doesn’t. Maybe it is because she now often buys varieties of food that are sold by the street vendors” (Mother 9)
Some girls commented on the school rules about food restrictions in the canteen, which prohibit spicy foods and certain local fast foods. A school staff member confirmed that there were some rules about foods at school but that they were limited to spicy foods and foods with unpermitted colorants.
(ii) Family All the girls reported that mothers often warned them not to eat unhealthy foods. Unfortunately, the rules were often prohibited only spicy foods.
“Mom told me not to eat spicy foods, but I still eat it at school. Sometimes I followed her rule, but sometimes I disobeyed it” (Girl 5–Interview)
“Mom told me not to eat too much spicy food and instant noodles” (Girl-FGD 3)
“Sometimes I eat spicy foods at school or when my mom is working” (Girl 4-Interview)
“I prohibit her eating food with chilli sauce; I told her that it’s not good for her health” (Mother 8)
The mothers were aware that the girls often bought fast foods or poor-nutrient foods from the school canteen or street vendors, but there were none of them
said anything to discourage the girls from doing so. Instead, mothers tended to accept the food choices of their daughters.
“She used to like vegetables, but now she doesn’t. Maybe because now she often buys varieties of food that are sold by the street vendors” (Mother 9)
“I don’t think they are eating healthy food at school. They mostly eat bakso, I guess. But, at home, they eat food that is healthy because I prepare vegetables, fish, tofu and tempeh” (Mother 5)
DISCUSSION
The findings of this study appear to be aligned with some of the influences on healthy eating that are described in the SCT (Bandura, 1998). Using the SCT as a guide, the influences on the eating habits of adolescent girls were considered as (i) individual factors (such as knowledge and awareness, food preferences and food price) and (ii) environmental factors (family, school and neighbourhood).
Our study found that most adolescent girls had some knowledge about healthy eating and were aware of its benefits. However, their eating behavior did not reflect their awareness. They often skipped breakfast and showed a personal preference for unhealthy food, such as fast foods and local, nutrient-poor foods. It would appear that knowledge of healthy eating and its benefits are not related to healthier eating practices (Rathi, Riddell & Worsley, 2017).
The girls frequently reported that the taste of the food was an important factor affecting their choice of food. This may, in part, explain the fact that they give priority to short-term considerations of eating behaviour, such as pleasure, rather than long-term outcomes, such as prevention of disease. Other studies have shown that factors such as taste, texture and the appearance of food

Sondari M, Brouwer I & Februhartanty JS94
were more important than knowledge of healthy eating among adolescents (Fitzgerald et al., 2010).
The main reason given by the girls for their preference for fast foods and local foods is that they were affordable and readily accessible. The girls mentioned several times that unhealthy foods, i.e. fast foods, nutrient-poor foods, and foods sold by street vendors, were cheaper than healthy foods. The girls in the present study came from low SES households and had limited pocket money for purchasing food. Therefore, cost was a determinant in choosing food. This is in line with other studies on students from low income families who chose foods based on convenience and affordability (Maulida et al., 2016). A study among Chinese adolescents similarly reported that unhealthy foods were cheaper and popular among them (Chan et al., 2016).
The SCT describes the importance of socio-environmental factors in influencing eating behaviours (Bandura, 1998). The lack of school rules and ease of availability of food were revealed as key factors that influenced the eating behaviours of the girls in this study. Mothers of the girls and school staff members expressed concerns about their easy access to fast foods and local nutrient-poor foods in the school canteens. Some schools had no rules to restrict unhealthy foods. The school staff members confirmed that the school rules were guided by food hygiene and safety rather than nutritional quality. Other qualitative studies have also reported that the availability of food at schools was a factor that influenced the food consumption habits of adolescents (Naidoo et al., 2017; Verstraeten et al., 2014). As school meals can contribute 30-40% of daily calorie intake of students (Osowski et al., 2015; Nathan et al., 2016), it is imperative for schools to promote healthy food consumption (Bevans et al., 2012).
Parents, especially mothers, play an
important role in influencing the food behaviour consumption of their children (Pearson, Ball & Crawford, 2012). The mothers in this study recognised that their daughters practised unhealthy eating habits. However, both girls and their mothers did not mention any strict rules regarding eating practices, beyond warnings not to consume spicy foods. The mothers believed that it was difficult to expect their children to eat healthily if they (the parents) did not do so themselves.
Based on the SCT, socio-environmental factors, such as parental and societal support, can influence the food intake behavior seen among adolescents (Salvy et al., 2011; Story, Neumark-Sztainer & French, 2002). Parental knowledge has been associated with healthy eating habits in children (Grosso et al., 2012; Ansem et al., 2014). Nevertheless, the role of mothers may be limited only to the provision of healthy food at home. Mothers in this study stated that the healthy food they usually prepared were simple dishes such as fish, vegetable, tofu and tempeh.
This study only examined adolescent girls from Malang and thus our findings may not apply to all adolescent girls in Java Province, much less throughout Indonesia.
CONCLUSION
A sample of adolescent girls from low SES in Malang, Indonesia showed some knowledge about healthy eating but did not show healthy eating practices, in skipping breakfast and consuming fast food and nutrient-poor foods. The factors influencing the adolescent girls’ eating behaviours were driven by individual preferences as well as by the environmental factors. Future interventions should not only target adolescents, but also schools, the community and their family members as well. School breakfast and healthy school canteen programmes, nutrition

Qualitative study on adolescents’ eating behaviours in Malang, Indonesia S95
education for parents, price subsidy (to decrease the cost of healthier items) should be considered for future research.
Acknowledgement
This study was funded by GAIN (Global Alliance for Improved Nutrition). The authors are grateful to the GAIN team, Ravi Menon, Mart van Liere, Aang Sutrisna, and Agnes Mallipu for their help during the study and to the field team members, namely, Yusuf Habibie Intan, Dwi Yuwono Kristanto, Paramita Nur Anugerah, Lavrencia Annashopy, and Gusti Anjar for their participation in data collection and processing. Special gratitude is extended to the schools, teachers and other staff, pupils, adolescent girl and mothers involved in the study.
Authors’ contributions
MS, undertook data collection and wrote the manuscript; IB, provided expertise on data interpretation and writing input; JF, provided expertise on the study design and data analysis. All authors approved the final draft of the manuscript.
Conflict of interest
The authors declare that there are no conflicts of interest.
References
Ansem WJCV, Schrijvers CTM, Rodenburg G & Mheen DVD (2014). Maternal educational level and children’s healthy eating behaviour: role of the home food environment (cross-sectional results from the INPACT study). Int J Behav Nutr Phys Act 11:113.
Bandura A (1998). Health promotion from the perspective of social cognitive theory. Psychology & Health 13:623–649.
Bevans KB, Sanchez B, Teneralli R & Forrest CB (2012). Children’s eating behavior: the importance of nutrition standards for foods in schools. J Sch Health 81(7):424–429.
Chan K, Tse T, Tam D & Huang A (2016). Perception of healthy and unhealthy food among Chinese. Young Consumers 1(17):32–45.
Central Bureau of Statistic Indonesia (2013). National Socio-economic Survey in East Java. Statistic Office of East Java Province, Surabaya.
Craigie AM, Lake AA, Kelly SA, Adamson AJ & Mathers JC (2011). Tracking of obesity-related behaviours from childhood to adulthood: A systematic review. Maturitas 70(3):266–284.
Daley AM (2013). Adolescent-friendly remedies for the challenges of focus group research. West J Nurs Res 35(8):1043-1059.
Fitzgerald A, Heary C, Nixon E & Kelly C (2010). Factors influencing the food choices of Irish children and adolescents: a qualitative investigation. Health Promot Int 25(3):289–298.
Grosso G, Mistretta A, Turconi G, Cena H, Roggi C & Galvano F (2012). Nutrition knowledge and other determinants of food intake and lifestyle habits in children and young adolescents living in a rural area of Sicily, South Italy. Public Health Nutr 16(10):1827–1836.
Hall E, Chai W & Albrecht JA (2016). Relationships between nutrition-related knowledge, self-efficacy, and behavior for fifth grade students attending Title I and non-Title I schools. Appetite 96:245–253.
Maulida R, Nanishi K, Green J, Shibanuma A & Jimba M (2016). Food-choice motives of adolescents in Jakarta, Indonesia: the roles of gender and family income. Public Health Nutr 19(15):2760–2768.
Mesias M, National S, Seiquer I, National S & National S (2013). Iron Nutrition in Adolescence. Crit Rev Food Sci Nutr 53(11):1226-1237.
MOH Indonesia (2013). Riset Kesehatan Dasar 2013 (Indonesia Basic Health Research 2013). National Institute of Health Research and Development, Ministry of Health of Indonesia, Jakarta.
Naidoo N, Van Dam RM, Ng S, Tan CS, Chen S, Lim JY, Chan MF, Chew L & Rebello SA (2017). Determinants of eating at local and western fast-food venues in an urban Asian population : a mixed methods approach. Int J Behav Nutr Phys Act 14(1):69.
Nathan N, Yoong SL, Sutherland R, Reilly K, Delaney T, Janssen L, Robertson K, Reynolds R, Chai LK, Lecathelinais C, Wiggers J & Wolfende L (2016). Effectiveness of a multicomponent intervention to enhance implementation of a healthy canteen policy in Australian primary schools : a randomised controlled trial. Int J Behav Nutr and Phys Act 13(1):106.
Nielsen AC (2010). The Nielsen’s classification of the Indonesian socioeconomic segments. From https://vidinur.net/2010/11/04/ses-socio-economic-status-ndonesia/ [Retrieved July 9, 2019].
Osowski CP, Lindroos AK, Arbieri HE & Becker W (2015). The contribution of school meals to energy and nutrient intake of Swedish children in relation to dietary guidelines. Food Nutr Res 59:10.
Pearson N, Ball K & Crawford D (2012). Parental influences on adolescent fruit consumption: the role of adolescent self-efficacy. Health Educ

Sondari M, Brouwer I & Februhartanty JS96
Res 27(1):14–23.
Rathi N, Riddell L & Worsley A (2017). Food consumption patterns of adolescents aged 14 – 16 years in Kolkata, India. Nutr J 16(1):50.
Sahoo K, Sahoo B, Choudhury AK, Sofi NY, Kumar R & Bhadoria AS (2015). Childhood obesity: causes and consequences. J of Family Med and Prim Care 4(2):187-92.
Salvy SJ, Elmo A, Nitecki LA, Kluczynski MA & Roemmich JN (2011). Influence of parents and friends on children’s and adolescents’ food intake and food selection 1 – 3. Am J Clin Nutr 93(1):87–92.
Story M, Neumark-Sztainer D & French S (2002). Individual and environmental influences on adolescent eating behaviors. J Am Diet Assoc
102(3 suppl):S40-51.
Sumarlan ES, Windiastuti E & Gunardi H (2018). Iron status, prevalence and risk factors of iron deficiency anemia among 12- to 15-year-old adolescent girls from different socioeconomic status in Indonesia. Makara J. Health Res 22(1):46–52.
Verstraeten R, Van Royen K, Ochoa-Avilés A, Penafiel D, Holdsworth M, Donoso S & Kolsteren P (2014). A conceptual framework for healthy eating behavior in Ecuadorian adolescents: a qualitative study. PLoS One 9(1):e87183.

Mal J Nutr 25 (Supplement): 97-109, 2019
Perceptions of the causes of obesity among normal weight, overweight and obese Indonesian women: a mixed methods approach
Ismi Irfiyanti Fachruddin1,2, Judhiastuty Februhartanty2*, Saptawati Bardosono 1, Helda Khusun2 & Anthony Worsley3
1Nutrition Department, Faculty of Medicine, Universitas Indonesia/Dr Cipto Mangunkusumo General Hospital, Jakarta, Indonesia; 2Southeast Asian Ministers of Education Organization Regional Centre for Food and Nutrition (SEAMEO RECFON)/Pusat Kajian Gizi Regional (PKGR) Universitas Indonesia, Jakarta, Indonesia; 3Institute of Physical Activity and Nutrition, School of Exercise and Nutrition Sciences, Deakin University, Melbourne, Australia.
ABSTRACT
Introduction: Overweight and obesity (OW/OB) among adults is a public health concern in Indonesia. While OW/OB is generally attributed to consumption in excess of expended energy, understanding the perceptions of the causes of obesity among OW/OB individuals may provide insights for developing appropriate obesity-reduction interventions. Methods: This study used a mixed methods approach, comprising a quantitative online survey and in-depth interviews. The online “International Families and Food Survey” was conducted in 2014 by Global Market Insite (GMI) to elicit response of Indonesian women to 12 likely causes of obesity, based on a 5-point rating ranging from ‘definitely disagree’ to ‘definitely agree’. A total of 377 respondents aged 18-49 years from Jakarta participated, comprising 221 normal weight (NW) and 156 OW/OB based on World Health Organization (WHO) cut-offs. Additional 16 informants who fulfilled the inclusion criteria were recruited for in-depth interviews to gather further insights on causes of obesity. Logistic regression was conducted to assess the likelihood of socioeconomic factors in predicting “agreement on the likely causes of obesity”. Results: The online survey showed that the NW and OW/OB respondents provided quite similar rating response to each of the likely causes of obesity. Unmarried and middle socioeconomic status (SES) respondents were significantly more likely to agree on the perceived causes of obesity, compared to married and high SES. In-depth interviews revealed OW/OB informants attributed obesity to environmental factors, compared to individual factors attributed by NW informants. Conclusion: Use of mixed methods approach provided insights for the development of obesity-reduction interventions among Indonesian adult women.
Keywords: Indonesia, obesity, overweight, women, perception on obesity causes
INTRODUCTION
The prevalence of overweight and obesity (OW/OB) has escalated worldwide. In 2014, more than 1.9 billion adults, aged
18 years and older, were overweight with higher prevalence in women (15.0% women versus 11.0% men) (WHO, 2015). Of these, over 600 million were obese.
__________________________
*Corresponding author: Dr. Judhiastuty FebruhartantySEAMEO RECFON, Jl. Salemba Raya 6, Central Jakarta, 10430, Indonesia.Tel: +628129260634, Fax: +62-21 3913933Email: [email protected]; [email protected]

Fachruddin II, Februhartanty J, Bardosono S et al.S98
The worldwide prevalence of obesity more than doubled between 1980 and 2014 (WHO, 2015).
Asian countries have also experienced increases in OW/OB prevalence. The increase in prevalence in China over the last 20 years was 400% (Asia Pacific Cohort Studies Collaboration, 2007). Malaysia experienced a three-fold increase in obesity prevalence among adults, from 4.4% in 1996 to 14.0% in 2006 (Khor, 2012). Likewise, OW/OB prevalence among adults in Vietnam more than doubled from 1992 to 2002 (2.0% to 5.7%) (Tuan, Tuong & Popkin, 2008). In Indonesia, OW/OB among adults have become a serious public health problem (Kemenkes RI, 2007; Kemenkes RI, 2010; Kemenkes RI, 2013). The National Basic Health Survey reported that approximately 13.5% of adults (ages ≥18 years) were overweight and 15.4% were obese, with the prevalence being higher among women in urban areas, and in individuals with higher education (Kemenkes RI, 2013). This situation is likely to worsen considerably unless preventive measures are taken.
Being OW/OB is the consequence of consumption of energy in excess of expenditure (Kazaks & Stern, 2013). This imbalance between food consumption and physical activity is influenced by an individual’s health behaviour and environmental factors (Kazaks & Stern, 2013). An individual’s health behaviour is, in turn, affected by psychological and physical capabilities that include having the necessary knowledge and skills (Michie, van Stralen & West, 2011). People’s thoughts (or cognitions) have a direct influence on behaviour (Kazaks & Stern, 2013). As part of individual’s cognition, perception plays an important role. Perception is a “process by which individuals organise and interpret their sensory impressions in order to give meaning to their environment” (Robbins & Judge, 2013). According to Passer & Smith (2009), “how people perceive a situation determines a different
reaction and each reaction creates a different outcome”. Understanding the perceptions of OW/OB people themselves about the factors leading to obesity may increase our understanding on how they may respond to weight-reduction interventions.
The rapid increase in the prevalence of OW/OB among adults has led to the development of large-scale prevention strategies (Aronne et al., 2009). However, for population-level prevention strategies to be effective, they need to be accepted and supported by the general population, which, in turn, requires an understanding of the perceptions, beliefs and attitudes held within the affected community (Lombard, Deeks & Teede, 2009).
Several studies have investigated people’s perceptions of the causes of OW/OB (Dryer & Ware, 2014; Jiménez-Cruz et al., 2012; McFerran & Mukhopadhyay, 2013). Some have reported that people’s perceptions about obesity are associated with their own body mass index (BMI), and OW/OB individuals tend to be more aware of the likely causes of obesity (Oksel, Gündüzoglu & Topçu, 2015; Wang & Coups, 2010). However, psychological factors, such as the perceived control of body weight (Jiménez-Cruz et al., 2012) and personal and social influences, have been less extensively studied. Few studies have compared the perceptions about the cause of obesity between OW/OB and normal weight (NW) subjects (Dryer & Ware, 2014; Oksel et al., 2015; Wang & Coups, 2010). Such comparisons are useful for designing appropriate obesity-reduction intervention programmes that provide a comprehensive understanding of an individual’s views regarding obesity (Nissen & Holm, 2015).
The present study comprised two objectives, namely (1) to analyse data obtained from the International Food and Families (IFF) online survey conducted in 2014 by Global Market Insite (GMI) on the perceptions of the causes of obesity

Perceptions on causes of obesity among Indonesian women S99
among Indonesian women with NW and OW/OB; and (2) to interview in-depth, eligible women in order to obtain further insights on women’s perceptions of the causes of obesity.
MATERIALS AND METHODS
This study employed a mixed methods study design, in which the quantitative on-line survey preceded the qualitative study.
On-line surveyStudy design and respondentsThe data from the IFF online survey conducted in 2014 by GMI was used in this study. The GMI is an online market research company that carried out the IFF survey in Australia, China, Singapore, Vietnam and Indonesia for Deakin University, Australia. A large number of questions were posed in The Families and Food Survey (FFS) (Worsley et al., 2017). The FFS database provided a convenient sample of volunteers who fulfilled the inclusion criteria of being adults aged 18–64 years who were the main household food providers. The latter was ascertained via a screening question “Who does the food shopping in your household?”. Respondents who did not self-identify as food providers were excluded from the survey. Potential respondents were sent an email inviting them to participate (Worsley & Ridley, 2014a; Worsley & Ridley, 2014b). The FFS data was used with permission of the principal investigator of the online survey (Professor Tony Worsley).
This report focused on the findings of the perceptions of the Indonesian respondents on the causes of obesity. The online survey included 377 Indonesian women from Jakarta and West Java, aged 18–49 years. Out of the total, 221 women had NW while 156 women were classified as OW/OB based on BMI derived from self-reported height and weight. The BMI categories were based on the Asia Pacific Classification System
(NW: 18.5–22.9 kg/m2; OW/OB: ≥23.0 kg/m2) (WHO Expert Consultation, 2004). All respondents had access to the Internet and were predominantly university graduates.
The respondents were asked to provide information on demographic characteristics, including age, education, marital status and household income, as well as their current body weight and height. The respondents were also requested to provide their ratings on a list of 12 likely causes of obesity. They were asked to rate their perceptions as to whether they agreed or disagreed with each of the items on a 5-point scale, ranging from 1 = Definitely not a cause of obesity; 2 = Not a cause of obesity; 3 = Not sure/neutral; 4 = A cause of obesity; 5 = Definitely a cause of obesity.
Data analysisSPSS for windows version 20 was used to analyse the response from the online participants. The 5-point scale reliability was determined by using Cronbach’s alpha to measure the internal consistency, that is, how closely related the items were as a group. The Cronbach’s alpha for the likely causes of obesity was acceptable at 0.721. The logistic regression was conducted to assess the likelihood of the socioeconomic factors of the respondents in predicting the outcome of obtaining ratings of “1-3” and “4-5”, namely “disagree” and “agree” with the likely causes of obesity provided.
In-depth interviewsInformants and conduct of interviewsThe informants were recruited from among women aged 18–49 years who were studying or working in Universitas Indonesia and living in Jakarta or its surrounding areas. Jakarta was chosen out of convenience as the study site for the face-to-face interviews. The first informant was knowingly selected while the rest were recruited using the snowball sampling technique. A total

Fachruddin II, Februhartanty J, Bardosono S et al.S100
of eight OW/OB and eight NW subjects were recruited. The interviews were held in a place with minimum noise. The interviews were audio-recorded with the permission of the informants. Each interview lasted approximately 60 mins. Two informants with some incomplete information were contacted via short message service and phone calls for additional interviews for clarification of their responses.
The in-depth interviews were focused on exploring the women’s perceptions of the causes of obesity. The questions covered included concerns about their body weight and the steps they took to control their weight. Each interview commenced with the introduction of the researcher to the participants followed by an explanation about the study aims and activities. All the participants gave their consent to be included in the interview. Pictures related to the causes of obesity were used as interview tools.
Data analysis A thematic data analysis of the interview data was performed according to Ulin & Robinson (2005). A preliminary analysis was conducted in the field during data collection for each interview. All the recorded in-depth interviews were transcribed verbatim. Repeated readings of the transcripts and listening to audio recordings by the researcher achieved data familiarisation. Development of codes and arrangement of the initial codes into a provisional set of themes was performed, followed by discussions with the research team to check for potential themes within the data against coded extracts and the complete dataset. The themes were refined to ensure that they accurately discriminated each other and conveyed the key messages from the interviews. Finally, the themes that emerged between the NW and OW/OB groups were compared. All processes were documented on Microsoft Word and Microsoft Excel.
Ethical considerationsThis study was conducted according to the guidelines laid down in the Declaration of Helsinki. All procedures involving human subjects were approved by the Deakin University HEAG-H (Online Survey) and Ethical Committee of the Faculty of Medicine Universitas Indonesia (Qualitative study - Number 1069/UN2.F1/ETIK/2015). Written informed consent was obtained from all subjects.
RESULTS
Characteristics of respondents and informantsThe sociodemographic characteristics of the online respondents (N=377) and in-depth interview informants (n=16) are shown in Table 1. There were 156 NW/OB and 221 NW respondents with no significant differences in their sociodemographic characteristics. Almost all the respondents (92.8%) had university level education (bachelor degree or higher), while more than half of them were married and ranged in age from 30-49 years.
The in-depth interview informants comprised 16 Indonesian women, of whom eight were NW and eight OW/OB. These informants were recruited because they had similar socioeconomic characteristics as the online respondents who were aged 19-49 years and mostly had university level education.
Online survey analysisRespondents’ ratings of the likely causes of obesity
The ratings of the respondents for the 12 likely causes of obesity are shown in Table 2. Based on the 5-point scale, a high proportion (exceeding 80.0%) of the respondents, regardless of their BMI status, rated either a 4 or 5, thereby perceived to “agree” or “definitely agree”, with each of the following likely causes of obesity: eating oversized servings of foods; lack of physical activity

Perceptions on causes of obesity among Indonesian women S101
opportunities; people did not exercise enough; over-consumption of sugar sweetened drinks; regular consumption of fast foods; people were not aware of the dangers of obesity.
In contrast, ratings of either 1 or 2, indicating agreement with “definitely not a cause or not a cause of obesity” were accorded by at least 30.0% of the respondents, regardless of their BMI to: lack of safe cycling and walking paths. There was a sizable percentage (about 25.0-35.0%) of both NW and OW/OB respondents who expressed “not sure” (rating=3) for these likely causes of obesity: modern technology; lack of safe cycling and walking paths; promotion
of unhealthy foods and low prices of unhealthy foods.
Logistic regression analysis
The logistic regression analysis showed that among the socioeconomic factors included in the study, two were significant with ratings of “4-5”, that is “agree” with the likely causes of obesity provided (Table 3). First, being unmarried was 1.77 times significantly more likely (95% CI: 1.10-2.83; p=0.018) than being married for rating agreement with the causes of obesity. Also, respondents from the middle socioeconomic status (SES) were 1.84 times more likely
Table 1. Socioeconomic characteristics of the online survey respondents (N=377) and in-depth interview informants (n=16), who were classified according to body mass index (BMI)†
Characteristics
Online respondents In-depth interview
informants
Total (n = 377)
Normal weight
(n = 221)
Overweight/Obese
(n = 221)p‡
Normal weight(n = 8)
Overweight/Obese (n = 8)
% n
Age 0.45119–29 years 41.4 43.0 39.1 4 4
30–49 years 58.6 57.0 60.9 4 4
Education level 0.252school university
7.292.8
5.994.1
9.091.0 8 8
Marital status 0.428
not married 40.8 42.5 38.5 4 4
married 59.2 57.5 61.5 4 4Socioeconomic status (SES)§ 0.095
low 34.5 33.5 35.9
middle 34.0 30.8 38.5
high 31.6 35.7 25.6
Working status
not working 6 1
working 2 7†Body mass index (BMI) categorised as normal weight (NW: 18·5–22.9 kg/m2); overweight and obese (OW/OB: >23.0 kg/m2) based on WHO Expert Consultation (2004) ‡Chi-square test; significance p<0.05 §SES was defined based on tertiles of wealth index score (household ownership of assets) (MOH Indonesia, 2013)
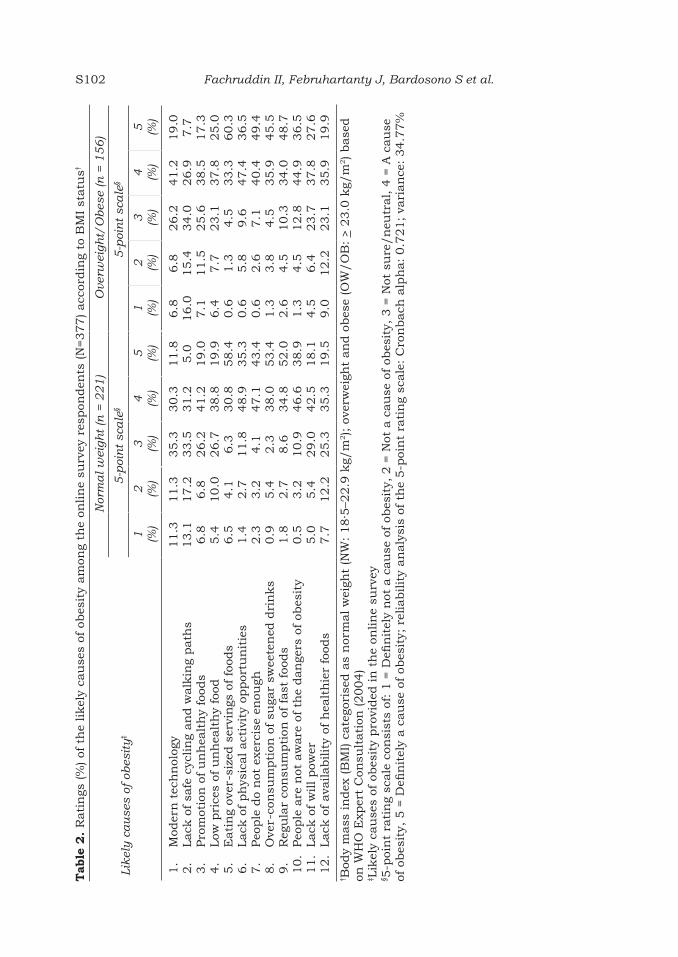
Fachruddin II, Februhartanty J, Bardosono S et al.S102T
able
2.
Rati
ngs
(%
) of
th
e likel
y ca
use
s of
obes
ity
am
ong
the
onlin
e su
rvey
res
pon
den
ts (N
=377) acc
ordin
g to
BM
I st
atu
s†
Lik
ely
ca
use
s of
obes
ity
‡
Nor
ma
l w
eigh
t (n
= 2
21
)O
verw
eigh
t/O
bes
e (n
= 1
56
)
5-p
oin
t sc
ale
§5
-poi
nt
sca
le§
1 (%)
2 (%)
3 (%)
4 (%)
5 (%)
1 (%)
2 (%)
3 (%)
4 (%)
5 (%)
1.
Mod
ern
tec
hn
olog
y2.
Lack
of sa
fe c
yclin
g an
d w
alk
ing
path
s3.
Pro
mot
ion
of
un
hea
lth
y fo
ods
4.
Low
pri
ces
of u
nh
ealt
hy
food
5.
Eati
ng
over
-siz
ed s
ervi
ngs
of
food
s6.
Lack
of ph
ysic
al act
ivit
y op
por
tun
itie
s7.
Peo
ple
do
not
exe
rcis
e en
ough
8.
Ove
r-co
nsu
mpti
on o
f su
gar
swee
ten
ed d
rin
ks
9.
Reg
ula
r co
nsu
mpti
on o
f fa
st f
oods
10.
Peo
ple
are
not
aw
are
of
the
dan
gers
of
obes
ity
11.
Lack
of w
ill pow
er12.
Lack
of ava
ilabilit
y of
hea
lth
ier
food
s
11.3
13.1
6.8
5.4
6.5
1.4
2.3
0.9
1.8
0.5
5.0
7.7
11.3
17.2
6.8
10.0
4.1
2.7
3.2
5.4
2.7
3.2
5.4
12.2
35.3
33.5
26.2
26.7
6.3
11.8
4.1
2.3
8.6
10.9
29.0
25.3
30.3
31.2
41.2
38.8
30.8
48.9
47.1
38.0
34.8
46.6
42.5
35.3
11.8
5.0
19.0
19.9
58.4
35.3
43.4
53.4
52.0
38.9
18.1
19.5
6.8
16.0
7.1
6.4
0.6
0.6
0.6
1.3
2.6
1.3
4.5
9.0
6.8
15.4
11.5
7.7
1.3
5.8
2.6
3.8
4.5
4.5
6.4
12.2
26.2
34.0
25.6
23.1
4.5
9.6
7.1
4.5
10.3
12.8
23.7
23.1
41.2
26.9
38.5
37.8
33.3
47.4
40.4
35.9
34.0
44.9
37.8
35.9
19.0
7.7
17.3
25.0
60.3
36.5
49.4
45.5
48.7
36.5
27.6
19.9
† Bod
y m
ass
in
dex
(B
MI) c
ate
gori
sed a
s n
orm
al w
eigh
t (N
W:
18·5
–22.9
kg/
m2); o
verw
eigh
t an
d o
bes
e (O
W/O
B: > 2
3.0
kg/
m2) base
d
on W
HO
Exp
ert
Con
sult
ati
on (2004)
‡ Lik
ely
cau
ses
of o
bes
ity
pro
vided
in
th
e on
lin
e su
rvey
§ 5-p
oin
t ra
tin
g sc
ale
con
sist
s of
: 1 =
Defi
nit
ely
not
a c
au
se o
f ob
esit
y, 2
= N
ot a
cau
se o
f ob
esit
y, 3
= N
ot s
ure
/n
eutr
al, 4
= A
cau
se
of o
bes
ity,
5 =
Defi
nit
ely
a c
au
se o
f ob
esit
y; r
elia
bilit
y an
aly
sis
of t
he
5-p
oin
t ra
tin
g sc
ale
: C
ron
bach
alp
ha:
0.7
21;
vari
an
ce:
34.7
7%

Perceptions on causes of obesity among Indonesian women S103
(95% CI: 1.10-3.07; p=0.019) of rating agreement with the causes of obesity, than the high SES counterparts. The logistic regression analysis revealed that, compared to the NW, the OW/OB women showed no significant difference in rating agreement with the causes of obesity.
Individual vs environmental causes of obesity
Out of the 12 likely causes of obesity provided to the online respondents, seven were arbitrarily classified as “individual factors”, indicating that these are actions or conditions that empower an individual to act in combating obesity. The remaining five causes of obesity were classified as “environmental factors” indicating they were beyond
an individual’s control, being more influenced or driven by industry, the government or other external parties.
Figure 1a and Figure 1b portray the perception response of the NW and OW/OB respondents towards the individual and environmental factors, respectively, as the likely causes of obesity. Overall, the NW and OW/OB respondents showed similar responses towards each of the individual and environmental factors as likely causes of obesity. The individual factor “over-consumption of sugar sweetened drinks” was ranked by most of the NW (91.4%) and OW/OB (90.4%) respondents as the most likely cause of obesity. Consuming “over-sized servings of foods” was also highly perceived as an individual level factor of obesity (89.1% NW and 93.6% OW/
Table 3. Logistic regression analysis showing the likelihood (odds ratio) of socioeconomic factors in predicting “agreement with the likely causes of obesity” among the online respondents (N=377)
Socioeconomic factorsAgreement with the likely causes of obesity†
Odds ratio 95% CI p
Body mass index0.91
0.91
0.679
1.77
1.051.84
0.59–1.39
0.57–1.45
0.29–1.56
1.10–2.83
0.61–1.821.10–3.07
0.682
0.701
0.363
0.018*
0.8440.019*
Overweight/obeseNormal weight (Reference)
Age19–29 years 30–49 years (Reference)
EducationSchoolUniversity (Reference)
Marital statusNot MarriedMarried (Reference)
Socioeconomic status (SES)‡
LowMiddleHigh (Reference)
†Based on the respondents’ ratings, whereby ratings were recoded as “disagree” (1-3) and “agree” (4-5) with the 12 likely causes of obesity based on the 5-point rating scale: 1 = Definitely not a cause of obesity, 2 = Not a cause of obesity, 3 = Not sure/neutral, 4 = A cause of obesity, 5 = Definitely a cause of obesity‡SES was defined based on tertiles of wealth index score (household ownership of assets) (MOH Indonesia, 2013) *p<0.05

Fachruddin II, Februhartanty J, Bardosono S et al.S104
OB). Physical inactivity and the lack of opportunities for the conduct of physical activity were also perceived by NW and OW/OB as important individual factors leading to obesity.
In general, lower percentages of the NW and OW/OB respondents attributed obesity to environmental factors. Among
the environmental factors, “promotion of unhealthy foods” ranked high as a cause of obesity (60.2% NW and 55.6% OW/OB), while “low prices of unhealthy food” was also perceived as an important environmental factor leading to obesity (57.9% NW and 62.8% OW/OB).
(a)
(b)
Figure 1. (a) Distribution (%) of response to individual factors and (b) environmental factors as likely causes of obesity, among the online respondents (n=377) according to NW vs OW/OB status

Perceptions on causes of obesity among Indonesian women S105
Analysis of in-depth interviews Perceived causes of obesity The factors identified by the informants as the probable causes of obesity were classified as individual level and environmental causes of obesity. NW informants identified more individual factors whilst OW/OB informants tended to attribute obesity to environmental factors (Table 4). NW informants said that consuming more sugary and fatty foods, over-consumption of food and eating larger portions of food were causes of obesity of individuals.
“The composition of food is not really good. For example, the fat is too much because there is too much meat or there are less vitamins and fibre. Also, there are less vegetables and
fruits” (NW, 25 years old, married, working)
“The types of food consist more of fat, especially fast food which is high calorie and high fat, which certainly will cause obesity” (NW, 29 years old, unmarried, working)
Metabolic factors and stress were also stated as the causes of obesity.
“The metabolism in each person is different, for example although my physical activity is less, my food consumption is also less, but if I eat certain foods like chocolate or milk, tomorrow my body weight will increase” (NW, 26 years old, unmarried, working)
Table 4. Individual and environmental factors perceived as causes of obesity by informants of in-depth interviews
Individual Factors Environmental Factors
Normal Weight Group
• Over-consumption of fatty food, salty food, high calorie food, fast food, soda, junk food, sweet beverages, sugar, sweet food
• Over-consumption of calories• Over-consumption of meat, less
vitamins and fibre• Skipping breakfast• Regular snacking habit• Extreme dieting• Lack of physical activity• Too much sitting• Stress• Lack of willpower• Genetic factors
• Lack of availability of healthy food
• Frequent hanging out with friends
Overweight/Obese Group
• Over-consumption of food• Consumption of sweet food,
sugar, junk food, sweet beverages
• Regular snacking habit• Unhealthy eating patterns such
as eating late after 10 pm• Lack of physical activity• Stress • Lack of willpower• Too much sleeping• Metabolic factors • Genetic factors
• Lack of availability of healthy foods
• Frequent meetings with clients at cafés
• Frequent hanging out with friends
• Lack of support from friends • Use of modern technology

Fachruddin II, Februhartanty J, Bardosono S et al.S106
“Stress could also, lead to obesity; sometimes if we feel stressed we eat too much and it can make us obese” (OW/OB, 31 years old, unmarried, working)
NW women stated that extreme dieting and snacking habits might cause obesity.
“Going on extreme diets by drastically reducing the portion of food consumed triggers severe hunger pangs, which causes one to consume more food than previously, leading to an increase in body weight” (NW; 28 years old, married, unemployed)
“Always snacking. Like snacking while watching TV, if we run out a snack we then take another snack” (NW, 24 years old, unmarried, working)
Skipping breakfast and a lack of physical activity may cause obesity.
“Breakfast could cause obesity if too much is eaten. Sometimes, I avoid breakfast and I only drink milk” (NW, 25 years old, married, working)
“Eating patterns and a lack of physical activity also can lead to obesity; it happens if we are too lazy to move but we eat too much” (NW, 37 years old, unmarried, working)
“What we eat and what we do physically is not balanced. We eat too much food, but we do not do enough physical activity” (OW/OB, 29 years old, unmarried, unemployed)
When shown a set of pictures of street filled with fast food restaurants, predominantly individual factors were considered to be important by NW women.
“If an individual wants to be on a diet, they can and not be influenced by their environment” (NW, 22 years old, unmarried, unemployed)
“If we sit too much for too long. Such as if we sit in front of computer. I do not think this is good as we can become fatter” (NW, 31 years old, married, working)
Compared with NW women, their OW/OB counterparts identified more environmental factors as causes of obesity. Some of these were not mentioned by the NW women, such as frequent meeting with clients at cafés, no support from friends and modern technology.
“One of my friends said because she often had meetings at hotel, the variation of food is less. It is difficult to find healthy food, and it can influence our body weight later” (OW/OB, 27 years old, married, working)
One overweight woman stated that the increasing prevalence of obesity was the result of modern technology.
“One impact of current technology is that we are not required to move physically. As a result, people become fatter because they are becoming lazier to move” (OW/OB, 21 years old, unmarried, working)
Several overweight women also remarked that their friends did not support them and that their working environment contributed to their obesity.
“For instance, she has a friend named XX, and they always hang out and eat together. Suddenly, she wants to be on a diet, but XX says you do it by yourself. Even then, XX still always asks her to hang out together and have

Perceptions on causes of obesity among Indonesian women S107
lunch or dinner together, although XX knows that she is on a diet. This kind of friend has a great influence and does not offer support. This makes it difficult to diet” (OB/OB, 25 years old, unmarried, working)
“We cannot avoid meetings. Nowadays, meetings always take place at coffee shops, and they take a long time. We often drink something sweet and we stay out longer” (OW/OB, 27 years old, married, working)
One item that was not included in the options for causes of obesity in the online survey, was provided by married NW women and an overweight woman. This was the influence of children in the selection of foods. It was mentioned in the in-depth interviews of the older, married NW and the overweight women. A married, obese woman commented:
“For example, when my children want to eat at a fast food restaurant, and I am compelled to follow my children’s wishes, even though I know that this food causes me to gain body weight” (OW/OB, 34 years old, married, unemployed)
The results of the interview from both the groups revealed that most sources of obesity information came from the Internet. Experiences of friends and information from personal trainers were also mentioned as other sources of information about obesity.
“...from my personal trainer. At that time, there was a nutritionist from the fitness centre where I took the programme. He told me everything: which foods to avoid or eat in limited amount, the portions that needed to be decreased, and the alternatives” (OW/OB, 28 years old, unmarried, working)
“If we are asked to hang out, by boyfriend or friend, we cannot refuse. Of course if we go out, it is impossible not to eat outside” (NW, 30 years old, married, working)
DISCUSSION
The online response regarding the likely causes of obesity showed close similarities between NW and OW/OB respondents. Both groups recorded high ratings of agreement for several likely causes of obesity. In contrast, findings from the in-depth interviews showed qualitative differences, in that NW informants identified more individual factors as causes of obesity, compared to OW/OB informants, who tended to attribute obesity to environmental factors.
Obese people tended to believe that societal responsibility, such as high cost of food, had contributed to the increased prevalence of obesity (Brady, 2016; Dryer & Ware, 2014; Okonkwo & While, 2010). This study also indicates that the perceived causes of obesity described by the informants were more complex than simply a ‘dietary’ versus ‘exercise’ theory. The lack of willpower and of support from friends, frequent meeting with clients at café, hanging out with friends and modern technology were also perceived as causes of obesity. Several other factors are also known to contribute to a person’s weight, including family history and genetics, the metabolism of the individual, as well as behaviour and habits (Kazaks & Stern, 2013; Dryer & Ware, 2014).
The in-depth interviews raised the influence of children in the selection of food among older and married NW and OW/OB informants. This is consistent with the finding among Australian parents (Venn et al., 2007). While the informants were aware that the consumption of fast foods was a cause of obesity, they could not resist the pressures resulting from the dietary
Fachruddin II, Februhartanty J, Bardosono S et al.S108
preferences of their children (Michie et al., 2011).
Several factors are important in “shaping up of, and sometimes distorting, common perceptions” about obesity. These include the sources of information related to obesity, such as the Internet, (which is the main source of information), followed by the individual’s own history of being obese, the experiences of friends and previous weight-reduction practices. (Covic, Roufeil & Dziurawiec, 2007; Robbins & Judge, 2013).
Limitations of studySince this study relied on self-reported information, body weight and height might be wrongly estimated, rendering computation of NW, OW/OB incorrect. The anonymous nature of the questionnaire might have assisted in reducing this bias. The use of pictures as a tool in the in-depth interview to stimulate recall might have biased or influenced the responses of the subjects. Finally, the respondents of the online survey and the informants for the in-depth interviews were recruited from different locations, although the inclusion criteria in both studies were similar.
CONCLUSION
The study revealed that Indonesian women with NW and OW/OB attributed obesity to different factors. While NW women identified individual factors, OW/OB subjects tended to attribute obesity to environmental factors. The results of this study may be used for drawing up weight-management strategies or obesity-control programmes. Such interventions should include increasing the awareness and the empowerment of Indonesian women who seek information about obesity. The knowledge of how individual and environmental factors
interact with each other may stimulate changes in the eating behaviour of OW/OB women, which is important in weight-management programmes. Future research should also cover wider geographical, social and cultural contexts, especially among Indonesian women of the low economic status, in order to gauge perceptions on the causes of obesity across a wide spectrum of the Indonesian society.
Acknowledgements We would like to thank all the Indonesian women who participated in the online survey and in-depth interviews. This study was partly supported by the Institute of Physical Activity and Nutrition at Deakin University Melbourne Australia.
Authors’ contributions
FII, contributed to the conception and design of the work, obtained and analysed the data, compiled the first draft of the manuscript, was involved in the critical revision of the draft and approved the final draft; FJ, BS, KH and WA all contributed to the conception and design of the work, obtained and analysed the data, were involved in the critical revision of the draft and approved the final draft.
Conflict of interest
All authors declared no potential conflicts of interest with respect to the research, authorship and/or publication of this article.
References
Aronne LJ, Wadden T, Isoldi KK & Woodworth KA (2009). When prevention fails: obesity treatment strategies. Am J Med 122(4 Suppl 1):S24-S32.
Asia Pacific Cohort Studies Collaboration (2007). The burden of overweight and obesity in the Asia–Pacific region. Obes Rev 8(3):191-196.
Brady C (2016). Decreasing obesity and obesity stigma: socio-demographic differences in beliefs about causes of and responsibility for obesity. Soc Sci 5(1):12.
Covic T, Roufeil L & Dziurawiec S (2007). Community beliefs about childhood obesity: Its causes, consequences and potential solutions. J Publ Hlth (Bangkok) 29(2):123-131.
Dryer R & Ware N (2014). Beliefs about causes of weight gain, effective weight gain prevention strategies, and barriers to weight management in the Australian population. Hlth Psych Behav Med 2:37-41.

Perceptions on causes of obesity among Indonesian women S109
Jiménez-Cruz A, De Escobar-Aznar YM, Castillo-Ruiz O, Gonzalez-Ramirez R & Bacardí-Gascón M (2012). Beliefs about causes and consequences of obesity among women in two Mexican cities. J Hlth Popul Nutr 30(3):311-316.
Kazaks AG & Stern JS (2013). Nutrition and Obesity: Assessment, Management & Prevention. Jones and Bartlett Learning, Burlington, Massachusetts.
Kemenkes RI (2007). Riset Kesehatan Dasar (Riskesdas) 2007. Badan Penelitian dan Pengembangan Kesehatan, Kementerian Kesehatan Republik Indonesia. Jakarta.
Kemenkes RI (2010). Riset Kesehatan Dasar (Riskesdas) 2010. Badan Penelitian dan Pengembangan Kesehatan, Kementrian Kesehatan Republik Indonesia. Jakarta.
Kemenkes RI (2013). Riset Kesehatan Dasar (Riskesdas) 2013. Badan Penelitian dan Pengembangan Kesehatan, Kementrian Kesehatan Republik Indonesia. Jakarta.
Khor GL (2012). Food availability and the rising obesity prevalence in Malaysia. Int e-Journal of Sci, Med & Edu 6(Suppl 1):61-68.
Lombard CB, Deeks AA & Teede HJ (2009). A systematic review of interventions aimed at the prevention of weight gain in adults. Publ Hlth Nutr 12(11):2236-2246.
McFerran B & Mukhopadhyay A (2013). Lay theories of obesity predict actual body mass. Psycho Sci 24(8):1428-1436.
Michie S, van Stralen MM & West R (2011). The behaviour change wheel: A new method for characterising and designing behaviour change interventions. Implement Sci 6(1):42.
Nissen NK & Holm L (2015). Literature review: perceptions and management of body size among normal weight and moderately overweight people. Obes Rev 16(2):150-160.
Okonkwo O & While A (2010). University students’ views of obesity and weight management strategies. Hlth Edu J 69(2):192-199.
Oksel E, Gündüzoglu NÇ & Topçu S (2015). The perception of obese persons. Holist Nurs Pract 29(4):225-231.
Passer WM & Smith R (2009). Psychology: The science of mind and behavior (4th Ed). McGraw-Hill, Inc., New York.
Robbins SP & Judge TA (2013). Organizational Behavior (15th Ed). Pearson Education, Inc., New Jersey.
Tuan NT, Tuong PD & Popkin BM (2008). Body mass index (BMI) dynamics in Vietnam. Eur J Clin Nutr 62(1):78-86.
Ulin PR & Robinson ET (2005). Qualitative Methods in Public Health. 1st ed. Jossey-Bass A Wiley Imprint, San Francisco, CA.
Venn AJ, Thomson RJ, Schmidt MD, Cleland VJ, Curry BA, Gennat HC & Dwyer T (2007). Overweight and obesity from childhood to adulthood: a follow-up of participants in the 1985 Australian Schools Health and Fitness Survey. Med J Aust 186(9):458-460.
Wang C & Coups EJ (2010). Causal beliefs about obesity and associated health behaviors: results from a population-based survey. Int J Behav Nutr Phys Act 7:19.
WHO Expert Consultation (2004). Appropriate body-mass index for Asian populations and its implications for policy and intervention strategies. Lancet 363(9403):157-163.
WHO (2015). Obesity and Overweight. World Health Organization media center. From http://www.who.int/mediacentre/factsheets/fs311/en/. [Retrieved July 16 2015].
Worsley A, Wang W, Sarmugam R, Pham Q, Februhartanty J & Ridley S (2017). Family food providers’ perceptions of the causes of obesity and effectiveness of weight control strategies in five countries in the Asia Pacific region: A cross-sectional survey. Nutrients 9: 78, doi:10.3390/nu9010078. From https://www.mdpi.com/2072-6643/9/1/78. [Retrieved July 1 2019].
Worsley T & Ridley S (2014a). The five country study 2014. Report 1: food marketing and communication preliminary findings. Deakin University, Melbourne, Australia.
Worsley T & Ridley S (2014b). The five-country study 2014. Report 2: perceptions of weight control and the causes of obesity preliminary findings. Deakin University, Melbourne, Australia.


Mal J Nutr 25 (Supplement): 111-122, 2019
A qualitative study comparing the coping strategies between food secure and food insecure households of Kaluppini indigenous people in South Sulawesi
Nurbaya1,3,4, Aria Kekalih2* & Judhiastuty Februhartanty3
1Nutrition Department, Faculty of Medicine Universitas Indonesia, Jakarta, Indonesia; 2Community Medicine Department, Faculty of Medicine, Universitas Indonesia, Central Jakarta, Indonesia; 3Southeast Asian Ministers of Education Organization Regional Centre for Food and Nutrition (SEAMEO RECFON)/Pusat Kajian Gizi Regional Universitas Indonesia (PKGR), Jakarta, Indonesia; 4Politeknik Kesehatan Kementerian Kesehatan Mamuju, Sulawesi Barat, Indonesia
ABSTRACT
Introduction: Food insecurity remains a global challenge, especially among vulnerable indigenous populations. Coping strategies to maintain food security among indigenous groups can be unique and complex, being influenced by cultures. This study aimed to explore the coping strategies employed by food secure and food insecure households in times of food insufficiency, in the Kaluppini indigenous population of South Sulawesi, Indonesia. Methods: The study recruited mothers of children aged below 5 years, who agreed to participate in the study’s focus group discussions (FGDs) and in-depth interviews. All information was recorded, transcribed verbatim and analysed. Results: A total of 61 mothers participated in 22 in-depth interviews and six FGDs. Five coping strategies were used by the Kaluppini people i.e. additional income generation, dietary alteration, access to alternative food sources, access to alternative cash sources, and, traditional ways of coping. Both food insecure and secure households reported making dietary changes, such as reducing consumption or substituting foods, borrowing food or money, and practising traditional coping strategies, such as food sharing after performing rituals. In order to generate income, food insecure households reported seeking additional work in the neighbourhood areas, while food secure households migrated in search of work to the other islands or other countries. Conclusion: Food insecure and food secure households changed their diets, borrowed food or money from relatives and relied on traditional coping mechanisms such as food sharing. It is suggested that food insecure Kaluppini households be encouraged to grow essential foods in their gardens to enhance food security.
Keywords: Food security, coping strategies, indigenous people, Indonesia
INTRODUCTION
The second goal of the Sustainable Development Goals of the United Nations is to end hunger, achieve food security and improve nutrition and promote sustainable agriculture, by
2030 (Charlton, 2016). Globally, millions experience food insecurity which is the situation when the availability of nutritionally adequate and safe foods is limited or uncertain (Parnell & Gray, 2014). A marker of food insecurity is
__________________________
*Corresponding author: Aria Kekalih Community Medicine Department, Faculty of Medicine, Universitas IndonesiaJl. Pegansaan Timur no. 16 Cikini, Central Jakarta, 10320, IndonesiaTel: +62 21 3141066; Mobile: +628129984449; E-mail: [email protected]

Nurbaya, Kekalih A & Februhartanty JS112
the prevalence of malnutrition among children younger than 5 years of age (Ghattas, 2014). The most recent data estimated that global hunger increased in 2016 and affected 815 million people, leading to stunting in one out of four children below the age of 5 years (FAO, 2017).
A growing body of research has shown that household food insecurity has adverse health consequences for children (Jackson & Vaughn, 2017). Inadequate intake of nutritious foods lead to malnutrition and poor development outcomes such as deficits in academic achievement, social developmental delays and poorer interpersonal relations (Hannum, Liu & Frongilo, 2014; Wight et al., 2014).
The burden of food insecurity tends to be higher among indigenous peoples than among other people in a given country or region (Egeland et al., 2011). The World Bank reported that indigenous populations are the most marginalised peoples, making them particularly vulnerable to food insecurity (Perry et al., 2006; Montenegro & Stephens, 2006). Studies in New Zealand (McKerchar et al., 2014) and Brazil (Ferreira et al., 2012), reported that indigenous children had higher rates of food insecurity and undernutrition compared with their non-indigenous peers. Similarly, more than one third of the indigenous communities in Malaysia experienced food insecurity that lead to malnutrition (Pei, Appannah & Sulaiman, 2018). In order to survive, food insecure households are known to adopt coping strategies (Usfar, Fahmida, & Februhartanty, 2007). Coping strategies are carried out when people do not have access to enough food, and to escape from food shortages and crises (Schrimpf & Feil, 2012). Strategies that are used to maintain food security among indigenous populations can be unique and complex, often being influenced by customary laws, cultures, and beliefs.
The indigenous population of Indonesia comprises 40–50 million
people (Bappenas RI, 2013). There are few reports on how the indigenous people cope with food insecurity. A study among Ciptagelar people, an indigenous group from West Java, reported that the 31.2% stunting in young children was associated with decreased food availability. A coping strategy implemented by tribes of this population was to build leuit (store for food reserves) (Khomsan, Riyadi & Marliyati, 2013).
The Kaluppini people are an indigenous group comprising about 4,000 inhabitants who live in a remote and mountainous area around Mt. Latimojong, in South Sulawesi province, Indonesia. They have retained their traditional culture, and they live on customary land called as Tana ongko sa'pulo tallu (the 13 selected areas), which consists of forests and farms. The forests serve as their economic and food reserves, and also for conducting customary ceremonies (AMAN Sulawesi Selatan, 2016). Little is known about how this population copes with food insecurity.
Cultures and traditions play important roles in determining food production among indigenous peoples, and this can have a significant impact on food security and nutritional status (Ezeomah & Farag, 2016). Indigenous peoples face complex challenges in food availability due to their remote and isolated locations (Skinner et al., 2013). Gaining a greater understanding of indigenous peoples and their traditional foods and livelihoods can help address undernutrition by targeting appropriate interventions to them. Specifically, by improving the understanding on how the Kaluppini indigenous population copes with food security, the Indonesian government may be able to improve their well-being through culturally appropriate food and agricultural programmes.
This study aimed to explore the coping strategies adopted by food secure and food insecure households in the Kaluppini indigenous population.

Food security and coping strategies among Kaluppini indigenous people S113
MATERIALS AND METHODS
Study designThis qualitative comparative study was conducted among the indigenous people living in Kaluppini in the Enrekang District, in South Sulawesi, Indonesia. Data collection took place from February 2017 to April 2017.
Data collectionThe participants were mothers with < 5 children, and their ages ranged 17-49 years. During recruitment, we collected information on the nutritional status of children below 5 years of age, the caregivers, the household residents (i.e. nuclear or extended family), the number of people in the household, the birth order, the children’s age and sex. The inclusion criteria of the participants were self-identification as Kaluppini people who were living in the Kaluppini area during the data collection period.
The first informant for this study was selected by asking the local midwife, customary leader, or head of village. The next informant candidate was selected by snowball sampling, after asking the previous informants and learning of certain variations and criteria that they had. Each characteristic and variation of the informants were checked so that they
met all selection criteria. Using purposive sampling, the researcher screened and categorised informants into food secure and food insecure households based on their responses to the U.S. Household Food Security Survey Module (US-HFSSM) questionnaire. The informants were then categorised based on the US-HFSSM into food secure (score 0-2) and food insecure without hunger (score 3-7), food insecure with hunger (score 8-12), and food insecure with severe hunger (score 13-18) (Bickel et al., 2000).
Data collection was undertaken through focus group discussions (FGDs) and in-depth interviews (IDIs), using a semi-structured questionnaire (Table 1). The participants chose the location for the interview that was convenient to them and where they felt comfortable. Most interviews were held in the homes of the participants to make them feel more relaxed during the interview. It also allowed them (i.e. the mothers and carers) to look after their children. The participants were interviewed about their household coping strategies when facing food shortage. Each session was conducted both in Bahasa Indonesia (the Indonesian language) and Bahasa Endekang (the Kaluppini language) and lasted for 60-90 minutes. We conducted
Table 1. List of interview questions
In-depth interviews (IDIs) Focus group discussions (FGDs)
1. What is your opinion about food availability at your home?
1. What is your opinion about food availability at your home?
2. Do you feel a lack of food at your home in the last 3 months?
2. If there is not enough food at home, what do Kaluppini people do to get enough food to eat?
3. If there is not enough food at your home, what do you do to get enough food to eat?
3. Are there any other ways that Kaluppini people could try to help their families to access more food?
4. Are there any other ways that you could try to help your family to access more food?
4. What do you think can be done to make it easier for Kaluppini people to get enough food
5. Does your husband or other family member help to address food shortage at your home? If so, in what ways?
Nurbaya, Kekalih A & Februhartanty JS114
FGD for each group of households separately. For example, the first FGD was held only among informants from food secure households and the following FGD was only for informants from food insecure households. All interviews were recorded using a digital voice recorder.
Ethical considerationsEthical approval for this study was granted by the Health Research Ethics Committee of the Faculty of Medicine, University of Indonesia (number 77/UN2.F1/ETIK/2017). Participation was voluntary, and all the informants gave their signed informed consent before data collection.
Data analysisPreliminary analysis was conducted during data collection after each IDI and FGD was completed. This helped the researcher to ensure the completeness of the information gathered and highlighted any issues that needed to be clarified during further data collection (Creswell, 2013). The recorded FGDs and IDIs were transcribed verbatim and imported to Microsoft Word for the content analysis, where the researcher checked all the transcript files to ensure their completeness. Data analysis was then conducted in three steps: data coding, data reduction, and the drawing of conclusion(s) or verification. The data were analysed both manually and by the Dedoose 7.6.6 computer software.
RESULTS
A total 61 mothers participated in this study (22 mothers in the IDSs while 41 mothers in the six FGDs). Out of the total participants, about half (52.5%) were from food secure households and half (47.5%) from food insecure households. Among the latter, majority (72.4%) were identified as food insecure without hunger, while 24.1% were with hunger and 3.4% with severe hunger.
The characteristics of the participants are summarised in Table 2.
Emerging themesOverall, the Kaluppini people used five themes emerged as common strategies to cope when food became insufficient. They undertook alternative/additional income generation work, made dietary alterations, accessed alternative food sources during periods of insufficiency, accessed alternative cash sources during critical periods and used traditional ways of coping. Table 3 shows the similarities and differences in coping, indicating that food insecure households applied more coping strategies.
Additional income generationMost Kaluppini people were farmers. In times of food insufficiency, household members (e.g. husband) took up additional, different jobs to generate income. Food insecure and food secure households reported different ways of generating additional income. Food insecure households would seek additional work in the town or neighbouring areas to cope with the food scarcity situation.
“My husband sometimes looks for an additional job as a carpenter besides cultivating maize and peanuts” (Mother, 33 years old, wasting and underweight child, extended family, food insecure, IDI)
In contrast, husbands from food secure households did Ma’sompa to obtain a better income. Ma’sompa means migrating from the village and going out of the country or moving to another island to get a new job. Most of them went to the islands of Papua or Kalimantan as the main destination of Ma'sompa, but some also went to work in neighbouring Malaysia.

Food security and coping strategies among Kaluppini indigenous people S115
“My husband went to Sendakan in Malaysia. He has been away for 2 years because of our economic problems” (Mother, 34 years old, normal child, extended family, food secure, IDI)
“I would go abroad if I had less income to support my family’s needs. I could join a company in the logging industry if I migrated to the Papua island” (Husband, food secure, 37 years old)
Food insecure households acted differently to generate income when money became insufficient as explained by one of the informants.
“My husband did ma'sompa before we were married. But now not anymore because there is not enough money to go abroad. If there is money, it's better to just buy food” (Mother, 33 years old, wasting and stunting child, extended family, food insecure, IDI)
Dietary alterationsSome households made alterations to their diet by reducing the amount of food consumed or substituting the usual type of food consumed for cheaper varieties. This involved being frugal, purchasing cheaper food, eating plain rice, processed flour, and cooking nande
Table 2. Characteristics of participants and study children
CharacteristicsFood Secure HH
(n = 32)Food Insecure HH
(n = 29)
Nutritional status of the children, n (%)
Normal 22 (68.7) 9 (31.0)
Wasting 1 (3.1) 2 (6.9)
Underweight 2 (6.3) 7 (24.1)
Stunting 7 (21.9) 11 (37.9)
Caregiver age (years), n (%)
17–35 23 (71.9) 13 (44.8)
36–50 9 (28.1) 16 (55.2)
Type of family, n (%)
Nuclear 14 (43.8) 16 (55.2)
Extended 18 (56.2) 13 (44.8)
Birth order, n (%)
1st child 9 (28.1) 4 (13.8)
Not 1st child 23 (71.9) 25 (86.2)
Child age, n (%)
0–23 months 24 (75.0) 17 (58.6)
24–59 months 8 (25.0) 12 (41.4)
Child sex, n (%)
Male 21 (65.6) 14 (48.3)
Female 11 (34.4) 15 (51.7)
Number of family member, n (%)
≤ 5 14 (43.8) 6 (20.7)
≥ 6 18 (56.2) 23 (79.3)

Nurbaya, Kekalih A & Februhartanty JS116T
able
3.
Sim
ilari
ties
an
d d
iffe
ren
ces
in c
opin
g st
rate
gies
bet
wee
n f
ood s
ecu
re a
nd f
ood in
secu
re h
ouse
hol
ds
No
Ty
pe
of c
opin
g st
rate
gies
Sim
ilari
ties
Dif
fere
nce
s
Foo
d in
secu
re h
ouse
hol
ds
Foo
d s
ecu
re h
ouse
hol
ds
1A
ddit
ion
al in
com
e ge
ner
ati
onS
eek a
ddit
ion
al w
ork
Lef
t fr
om s
choo
l fo
r w
orkin
gM
a’s
omp
a (m
igra
tion
)
2D
ieta
ry a
lter
ati
onE
ati
ng
pla
in f
ood,
Na
nd
e d
alle
/N
an
de
bet
taw
e (r
ice
cook
ed m
ixed
wit
h m
aiz
e/ca
ssava
)
Pu
rch
ase
ch
eaper
foo
dPro
cess
ing
flou
rB
ein
g fr
uga
l life
styl
e
3A
cces
s to
alt
ern
ati
ve
food
sou
rces
Pro
cess
th
e ga
ba
h s
tock
Loo
kin
g fo
r fo
od a
t th
e fo
rest
Ch
ildre
n e
at
at
rela
tive
’s
hou
seTakin
g fo
od f
rom
ow
n s
tall
4A
cces
s to
alt
ern
ati
ve
cash
sou
rces
Bor
row
mon
ey f
rom
fam
ily
Sel
l th
e pea
nu
ts/m
aiz
e st
ock
Dra
w m
oney
fro
m s
avi
ng
5T
radit
ion
al co
pin
g m
eth
ods
Na
nd
e se
sa (ri
ce w
ith
a s
ide
dis
h o
f ch
icken
or
mea
t an
d c
over
ed b
y te
ak lea
ves)
Su
ma
ro (an
act
ivit
y w
her
e peo
ple
hel
p
harv
esti
ng
an
d t
hey
will ge
t paym
ent)
Sto
ckin
g ga
ba
h/pea
nu
ts/m
aiz
e
Ma
’ka
mbi (liv
esto
ck b
reed
er)
Ma
’ta
na
n u
ma
sa
’de
bol
a
(hom
e ga
rden
)

Food security and coping strategies among Kaluppini indigenous people S117
dalle (rice cooked with maize) or nande bettawe (rice with cassava). Different coping ways were adopted by the food secure and food insecure households. In general, the food secure households would be more frugal and would calculate their food expenditure for a month. Food insecure households would purchase cheaper foods.
“We buy cheaper food that is enough for our family; we buy cheaper instant noodles. It is enough for our family for one meal. I want to buy the better one, but the money was not enough” (Mother, 34 years old, stunting child, extended family, food insecure, IDI)
In general, they ate simple foods, where the food insecure households consumed only plain rice, while food secure households consumed rice and vegetables. However, the coping strategy that was used by all the Kaluppini participants usually involved cooking nande dalle or nande bettawe so that their rice stores did not run out quickly.
“Sometimes I cook nande dalle. So that our rice doesn’t run out fast” (Mother, underweight and stunting child, 40 years old, nuclear family, food insecure, IDI)
“Well, we just eat plain rice. It is hard to say. If we say it was not enough but just made it enough. Therefore, I do not cook too much” (Mother, 28 years old, underweight and stunting child, nuclear family, food secure, IDI)
When the food insecure households did not have any rice to cook, they would process flour into a traditional cake to feed their children. This coping strategy was only found among food insecure households.
Access to food during insufficient periodsThe Kaluppini people used coping ways to obtain food during critical periods of food insufficiency, such as grinding gabah (unhulled rice) stock, borrowing rice from relatives, having children eat at a relative’s home, looking for food in the forest or taking food from their own stalls. Both food secure and food insecure households would grind their unhulled rice stock. It was notable that Kaluppini people had a tradition of not selling their rice, which they would store as unhulled rice and grind it when their reserves had decreased. The unhulled rice was stored in their ceilings.
“We do not grind our gabah. We purchase rice first. We save our gabah and later when there is no more money, we will grind the gabah” (Mother, 28 years old, underweight and stunting child, extended family, food secure, IDI)
They sometimes borrowed rice from relatives and paid it back later as rice; however, they only borrowed rice from relatives (mainly parents) to avoid damaging their Siri’ (pride; personal honour or self-esteem). Sometimes, when there was no more food at home, children would go to a relative’s house (mainly grandparents) to eat, but they would never go to other houses. Another strategy used by food insecure households was to take food from their own stalls.
“So, if we borrow rice, we will return it in the form of rice as well” (Mother, stunting child, 40 years old, nuclear family, food insecure, FGD)
Access to cash during critical periodsWhen to cash was needed during critical periods of food insufficiency, the Kaluppini people would borrow money
Nurbaya, Kekalih A & Februhartanty JS118
from family members (mainly parents), sell their stored peanuts/maize or draw money from their savings. They would not borrow money or rice from outsiders or from food stalls.
“We never borrow from other people. We only borrow from relatives. We maintain our Siri’ (self-esteem; pride) and do not borrow from our neighbours” (Mother, 33 years old, wasting and underweight child, extended family, food insecure, IDI)
“We usually borrow money, but we do not borrow rice because if we borrow money, we can buy fish or other needs” (Mother, 21 years old, normal child, extended family, food insecure, FGD)
Selling surplus peanuts and maize that are stored is a common coping strategy. After harvesting, people would store these commodities without peeling and store them in their homes or in their ceilings where it would stay warm and remain of good quality.
Traditional coping methodsThe traditional methods of coping with insufficient food of the Kaluppini people were related to rituals and seasons. These included consuming nande sesa (a food dish), performing the sumaro (helping with harvesting), undertaking ma’kambi (livestock breeding), and storing gabah (unhulled rice), maize or peanuts. When a ritual was performed, people would gather in one place and would donate foodstuffs such as rice and chickens, according to their ability. They would cook and eat the food together. After the rituals, everyone would take a pack of rice with a side dish of meat or chicken covered by daun jati (teak leaves). This was called nande sesa. Kaluppini people believed that covering the food with teak leaves would prevent the food from getting stale quickly.
Both food secure and insecure households stored unhulled rice, maize and peanuts was mainly related to the need for immediate access to food and cash. The unhulled rice stock was used for immediate access to food while the sale of maize and peanuts provided immediate access to money.
Food secure and insecure households would both take home the nande sesa, and this could help them save rice for up to 2 days. In order to enable the rice to last longer, food insecure households would dry it out and later fry it into crackers.
“If there was a ritual, we sometimes bring home a pack of rice with meat covered by teak leaves. Sometimes it is enough to eat for two up to three times” (Mother, 30 years old, normal child, extended family, food secure, FGD)
Sumaro was a traditional coping strategy that was applied by both food secure and insecure households. This involved helping someone to harvest in return for a part of the harvest crop as a fee. The harvest was divided as six parts to the owner and one part for sumaro.
“Sometimes my husband goes for sumaro or works as a bricklayer outside Kaluppini. If we think that our food stocks are decreasing, then we will look for sumaro as an additional source of income” (Mother, 33 years old, wasting and underweight child, extended family, food insecure, IDI)
By contrast, ma’kambi was only used by food insecure households, who would breed the cows of the relatives or other people who had cows. However, because they had to take care the cows and wait for them to breed to produce calves, this was a long-term option.

Food security and coping strategies among Kaluppini indigenous people S119
“Sometimes we also breed cows. If the cow has calves, we will share the calves. If there are two calves then we will share it equally, one for me and one for the cow owner. But if it is only one, we will divide the result equally” (Mother, 41 years old, wasting child, extended family, food insecure, IDI)
“Sometimes we also raise livestock, take care our relative's cows. But it needs a long time ago to develop” (Husband, food secure, 37 years old).
Besides the traditional coping strategies, mattanan uma sa’de bola (growing vegetables in the home garden) was also used by food insecure households. This was mostly used to fulfil their daily needs.
“I intentionally plant vegetables to add food at home and also so that our vegetables are varied” (Mother, 33 years old, wasting and underweight child, extended family, food insecure, IDI)
“I plant vegetables, tomatoes or anything that we can plant ... I plant just for daily consumption” (Mother, 34 years old, stunting child, nuclear family, food insecure, IDI)
By contrast, the food secure households fulfil their vegetable needs by buying from the market.
“I don't plant vegetables. Sometimes we ask vegetables from neighbours. But I usually buy vegetables at the market” (Mother, 28 years old, wasting and underweight child, extended family, food secure, IDI)
DISCUSSION
Households apply different coping strategies to manage food shortages and crises (Balta & Tessema, 2015), but these tend to be modified at both
the household and the individual levels. Coping strategies vary in each community based on their culture and geographical differences (Farzana et al., 2017). The coping strategies applied by indigenous mothers in food secure and food insecure Kaluppini households were consistent with their cultures and traditional beliefs.
In general, husbands played the key role in generating additional income. Husbands from food insecure households would seek additional work from the local area (village), while husbands from food secure households would do ma’sompa or abandon the village to work on other islands or even outside the country. The husbands still had the most responsibility for household incomes (Smith et al., 2003). In Zambia, women were responsible for generating additional income by collecting firewood and selling it to townspeople (Schrimpf & Feil, 2012). This became a burden to them and increased their workload, as they were then required not only to take care of their children but also to generate more income to cope with food shortages.
Most households stored their harvest yields in their own homes, as gabah, together with maize and peanuts. This finding was consistent with that of other studies in Indonesia, though with differences in where food was stored. Whereas the Kaluppini indigenous people tended to store their reserves hung from the ceilings, the Ciptagelar indigenous people stored their unhulled rice collectively in a warehouse of food reserves called a leuit. Their food security status was indicated by the amount of unhulled rice in the leuit (Khomsan et al., 2013). People from rural East Nusa Tenggara province stored maize in a rumah bulat, a separate house used for food storage and as a kitchen (Fatmaningrum, Roshita & Februhartanty, 2016).
Food storage was important to ensure food availability during shortages

Nurbaya, Kekalih A & Februhartanty JS120
or droughts (Dweba & Mearns, 2011). If they had sufficient money, the Kaluppini people preserved their unhulled rice and purchased rice from the market for daily consumption. They would only grind their unhulled rice stock if they did not have enough money to buy rice. When food insufficiency became more dire, or there was no money or food to eat, people tended to borrow money or rice from relatives. This practice has been reported among other rural populations, who borrow rice from neighbours (Fatmaningrum et al., 2016). By contrast, the Kaluppini households borrowed only from relatives (because of Siri’).
The tradition of sharing is important to many indigenous peoples. According to most traditions, food should be shared rather than sold (Damman, Eide & Kuhnlein, 2008). This sharing tradition is still practised among the Kaluppini people. Every time they performed rituals, they would offer a lot of food that would be shared among those attending. Social networks and food sharing in community feasts enhanced health and well-being among indigenous peoples (Kuhnlein, Erasmus & Spigelski, 2009). This food-sharing practice ensures food availability at home (Chege, Kimiywe & Ndungu, 2015). Skinner et. al (2013) reported similar findings in Fort Albany, Canada, where food sharing between families and the among the community was a key coping strategy for food insecurity.
Another coping strategy was mattanan uma sa’de bola, or home gardening. This was a positive practice among the food insecure Kaluppini households. They would plant vegetables in their home gardens to meet their daily needs. Many studies have found that home production for family consumption was an important food source in many rural areas (United Nations, 2012). Another benefit of home gardening is that it can ensure continuity of agricultural diversity and can provide a good place for farmers to experiment with domesticating wild plants (FAO,
2015). Therefore, both food secure and food insecure Kaluppini households should be encouraged to establish home gardening to add their available food stocks and to ensure a broader vegetable availability (e.g. eating tubers when food stocks run out or when food prices are high).
Limitations of studyThis study involved a large number of informants who participated in both the IDIs and FGDs. They were willing to describe their experiences of times when food was insufficient, something which was a sensitive matter. Another limitation of the study was that the study was conducted during the rainy season, and hence we did not observe food security related practices during the dry season.
CONCLUSION
Both food secure and food insecure households in the Kaluppini indigenous population experienced low food availability, with similarities and differences in how each group coped with these food shortages. The main similarities were in changing their diets, borrowing food or money from relatives and relying on various traditional coping mechanisms. It is suggested that food insecure Kaluppini households should be encouraged to grow essential foods in their gardens to enhance their food security. Public and private agencies should offer appropriate programmes to address the food insecurity problems of the Kaluppini people.
Acknowledgement
The authors would like to thank all Kaluppini people who participated in this study. This research was supported by a USAID-PRESTASI Scholarship.
Authors’ contributions
N, compiled the first draft of the manuscript; KA, involved in the critical revision of the draft and approved the final draft; FJ, involved in the critical revision of the draft and approved the final

Food security and coping strategies among Kaluppini indigenous people S121
draft. All authors contributed to the conception and design of the work, were involved in the acquisition and analysis of the data as well as in data interpretation.
Conflict of interest
All authors declare that they have no potential conflicts of interest with respect to the research, authorship and/or publication of this article.
References
AMAN Sulawesi Selatan (2016). Profil Masyarakat Adat Kaluppini Kabupaten Enrekang. Aliansi Masyarakat Adat Nusantara (AMAN) Sulawesi Selatan, Makassar.
Balta A & Tessema A (2015). Assessment of household food security and coping strategies in Wolaita Zone: The case of Sodo Zuria Woreda. JIPD 18:23-40.
Bappenas RI (2013). Masyarakat Adat di Indonesia: Menuju Perlindungan Sosial yang Inklusif (1st ed.). Badan Perencanaan Pembangunan Nasional Republik Indonesia, Jakarta.
Bickel G, Nord M, Price C, Hamilton W & Cook J (2000). Guide to Measuring Household Food Security. USDA, Alexandria VA.
Charlton KE (2016). Food security, food systems and food sovereignty in the 21st Century: a new paradigm required to meet sustainable development goals. Nutr Diet 73(1):3-12.
Chege PM, Kimiywe JO & Ndungu ZW (2015). Influence of culture on dietary practices of children under five years among Maasai Pastoralists in Kajiado, Kenya. Int J Behav Nutr Phys Act 12(1):131.
Creswell JW (2013). Research Design: Qualitative, Quantitative, and Mixed Methods Approaches. Sage, California.
Damman S, Eide WB & Kuhnlein HV (2008). Indigenous peoples’ nutrition transition in a right to food perspective. J Food Pol 33(2008):135-155.
Dweba TP & Mearns MA (2011). Conserving indigenous knowledge as the key to the current and future use of traditional vegetables. Int J Inf Manage 31(2011):564-571.
Egeland GM, Johnson-Down L, Cao ZR, Sheikh N & Weiler H (2011). Food insecurity and nutrition transition combine to affect nutrient intakes in Canadian Arctic Communities. J Nutr 141(9):1746-1753.
Ezeomah B & Farag K (2016). Effects of development on indigenous dietary pattern: a Nigerian case study. Appetite 107(2016):59-68.
FAO (2015). Shifting Cultivation, Livelihood and Food Security: New and Old Challenges for Indigenous Peoples in Asia. Erni C (ed.). Food and Agriculture Organization, Bangkok.
FAO (2017). The State of Food Security and Nutrition in the World 2017. Food and Agriculture Organization, Rome.
Farzana FD, Rahman AS, Sultana S, Raihan MJ, Haque MA, Waid JL, Choudhury N & Ahmed T (2017). Coping strategies related to food insecurity at household level in Bangladesh. PloS One 12(4):e0171411.
Fatmaningrum D, Roshita A & Februhartanty J (2016). Coping strategies for food insecurity among adolescent girls during the lean season in East Nusa Tenggara, Indonesia: a qualitative study. Br J Nutr 116(S1): S42-48.
Ferreira AA, Welch JR, Santos RV, Gugelmin SA & Coimbra Jr CE (2012). Nutritional status and growth of indigenous Xavante children, Central Brazil. Nutr J 11(1):3.
Ghattas H (2014). Food Security and Nutrition in The Context of the Global Nutrition Transition. Food and Agriculture Organization, Rome.
Hannum E, Liu J & Frongillo EA (2014). Poverty, food insecurity and nutrition deprivation in rural China: implication for children's literacy achievement. Int J of Educ Dev 34(2014):90-97.
Jackson DB & Vaughn MG (2017). Household food insecurity during childhood and adolescent misconduct. Prev Med 96(2017):113-117.
Khomsan A, Riyadi H & Marliyati SA (2013). Food security and nutrition and coping mechanism in Ciptagelar tradition community in West Java. JIPI 18(3):186-193.
Kuhnlein HV, Erasmus B & Spigelski D (2009). Indigenous Peoples’ Food Systems: the Many Dimensions of Culture, Diversity and Environment for Nutrition and Health. Food and Agriculture Organization, Centre for Indigenous Peoples' Nutrition and Environment (CINE), Rome.
McKerchar C, Bowers S, Heta C, Signal L & Matoe L (2014). Enhancing Maori food security using traditional Kai. Glob Health Promot 22(3):5-24.
Montenegro RA & Stephens C (2006). Indigenous health in Latin America and the Caribbean. Lancet 367(9525):1859-1869.
Parnell WR & Gray AR (2014). Development of a food security measurement tool for New Zealand households. Br J Nutr 112(8):1393-1401.

Nurbaya, Kekalih A & Februhartanty JS122
Pei CS, Appannah G & Sulaiman N (2018). Household food insecurity, diet quality, and weight status among indigenous women (Mah meri) in Peninsular Malaysia. Nutr Res Pract 12(2):135-142.
Perry GE, Arias OS, Lópes JH, Maloney WF & Servén L (2006). Poverty Reduction and Growth: Virtuous and Vicious Circles. World Bank Report. The World Bank, Washington, DC.
Schrimpf B & Feil P (2012). Traditional Food Crisis Coping Mechanisms: A Regional Perspective from Southern Africa. Diakonie Werk der EKD, Germany.
Skinner K, Hanning RM, Desjardins E & Tsuji LJS (2013). Giving voice to food insecurity in a remote indigenous community in subarctic Ontario, Canada: traditional ways, ways to cope, ways forward. BMC Public Health 13(1):427.
Smith LC, Ramakrishnan U, Ndiaye A, Haddad L & Martorell R (2003). The Importance of Women’s Status for Child Nutrition in Developing Countries. International Food Policy Research Institute (IFPRI), Washington, DC.
United Nations (2012). Baseline Nutrition and Food Security Survey 2012. United Nations, Tirana.
Usfar AA, Fahmida U & Februhartanty J (2007). Household food security status measured by the US-Household Food Security/Hunger Survey Module (US-FSSM) is in line with coping strategy indicators found in urban and rural Indonesia. Asia Pac J Clin Nutr 16(2):368-374.
Wight V, Kaushal N, Waldfogel J & Garfinkel I (2014). Understanding the link between poverty and food insecurity among children: does the definition of poverty matter? J Child Poverty 20(1):1-20.

Mal J Nutr 25 (Supplement): 123-137, 2019
Early development process of drama and storytelling scripts as media for nutrition education on balanced diets among elementary school children
Suci Destriatania1*, Fenny Etrawati2 & Judhiastuty Februhartanty3
1Nutrition Department, Public Health Faculty, Sriwijaya University, South Sumatera, Indonesia; 2Health Promotion Department, Public Health Faculty, Sriwijaya University, South Sumatera, Indonesia; 3Southeast Asian Ministers of Education Organization Regional Centre for Food and Nutrition (SEAMEO RECFON)/Pusat Kajian Gizi Regional (PKGR) Universitas Indonesia, Jakarta, Indonesia
ABSTRACT
Introduction: The Indonesian Guide on Balanced Nutrition endorsed in 2014, needs to be more widely publicised. One way is to use fun learning methods such as drama and storytelling, especially in schools. This study aimed to develop drama and storytelling scripts for educating students on balanced nutrition. Methods: Sixteen focus group discussions (FDGs) with thematic activities were conducted among 96 mother-child pairs in four elementary schools. The mothers’ age ranged from 30-50 years and the children 9-13 years. In-depth interviews were conducted with eight teachers (two from each participating school). The FGDs and interviews were designed to elicit information on knowledge and implementation of balanced nutrition guidelines at three levels, namely intrapersonal (students), family (mother) and environment (school teacher). Content analysis was used to identify relevant themes, which were developed into scripts for drama and storytelling. Results: The students, mothers, and teachers were not familiar with the general guidelines for balanced nutrition. The lack of variety of the food provided at home was reported. The draft scripts were discussed and modified for accuracy of the nutrition messages that were applied in character dialogues, song lyrics, dramas and storytelling. Conclusion: Storytelling and drama are effective for use by teachers and mothers for delivering nutrition messages in schools and the home.
Keywords: Drama, storytelling, nutrition education, elementary school students, Indonesia
INTRODUCTION
The rising prevalence of obesity in children and adolescents has become a critical global health challenge (Wijlaars et al., 2011). In Indonesia, the double burden of obesity and malnutrition are challenging important public health
issues. While undernutrition still exists, the prevalence of childhood and adolescent obesity has emerged as a health concern. It was estimated that among children aged 5-12 years, 10.8% were overweight and 8.8% obese (MOH Republic of Indonesia, 2013).
__________________________
*Corresponding author: Suci Destriatania, MKesNutrition Department, Public Health Faculty, Sriwijaya University, Gedung Fakultas Kesehatan Masyarakat, Kampus Unsri Indralaya, Jalan Palembang-Prabumulih KM.32 Indralaya, Ogan ilir 30662, South Sumatera, IndonesiaTel: +62 8127863317; Email: [email protected]; [email protected]
Destriatania S, Etrawati F & Februhartanty JS124
Dietary practices and physical activity are key modifiable risk factors that are related to the development of non-communicable diseases. Poor food choices and physical inactivity contribute to problems during childhood and adolescence, such as behavioral problems at school, emotional problems, low academic performance, as well as short-term and long-term health problems (Sahoo et al., 2015). Type 2 diabetes (Bacha & Gidding, 2016), heart diseases (Cote et al., 2013), and psycological health (Beck, 2016) are becoming more common in younger adults as a result of the rise in obesity and overweight.
Schools are a proven effective and efficient environment in which to reach out to most children of school-going age from diverse ethnic and various socioeconomic backgrounds (Van Cauwenberghe et al., 2010). Since schools have the potential to reach and interact with children intensively and continuously, educators and health professionals have identified schools and teachers as having important roles in public health education and health promotion interventions for the prevention of obesity (Calvert, Robert & Rachel, 2019). In addition, Institute of Medicine (IOM) (2012), USA, has suggested five critical areas where schools can act as agents of change. Schools could be the focal point of activities for the mitigation of obesity among children. They may do so by providing physical education and opportunities for physical activities, by ensuring healthy nutritional standards for all food and beverages that are sold or provided there and by providing education in nutrition.
Nutrition education should become an integral part of the school curriculum for elementary school children. Implementing nutrition education is a convenient strategy for influencing children’s knowledge of nutrition and
eating practices (Evans et al., 2016). The provision of specific nutrition education has been shown to have multiple benefits, such as the increased likelihood of children having healthy habits at an early age (Wall et al., 2012). These included a decreased risk of obesity among elementary students (Fairclough et al., 2013), an improved cognitive development with a potential to decrease behavioral outbursts in an educational setting (Ickovics et al., 2014), an increased knowledge of nutrition, and decreased body mass index (BMI) and waist circumference amongst elementary students (Fairclough et al., 2013, Evans et al., 2016, Jarpe-Ratner et al., 2016, Wall et al., 2012).
Indonesia has had a variety of programmes for school called the Schools Health and Nutrition programmes (SCN). These have included the Usaha Kesehatan Sekolah (UKS, Schools Health Initiative), programmes for water and sanitation at school, basic health center (puskesmas), feeding in schools, and other school-based health services provided by non-government organization (Del Rosso & Rina, 2009). Indonesia has had dietary guidelines for the general population, including children. The publication of nutrition messages started in 1950s with the slogan “Four Healthy Five Perfect” (locally known as “empat sehat lima sempurna”), which promoted the consumption of staple foods, protein-source foods, vegetables, and fruits, as the “four healthy” food items, and drinking milk for the “five perfect”. A study covering 132 elementary school children found that 90% stated that a balanced diet was the “Four Healthy Five Perfect” guideline (Achadi et al., 2010). Over time, new knowledge and facts in nutrition led to the Indonesian government to publish the “Guide to Balanced Diet” in 2014 (MOH Republic of Indonesia, 2014). This publication

Drama and storytelling for nutrition education S125
included following messages: consume a variety of food, keep clean, exercise regularly, and monitor body weight.
Campaigns on balanced nutrition for children can be delivered through various educational media. However, the challenge is to identify the most effective methods to promote healthy lifestyles to children. The use of storytelling drama, theatre and role-playing are useful methods for health promotion and education. These methods stimulate creativity and critical thinking (Sanchez, Zam & Lambert, 2009). Educational drama emphasizes learning through the dialectics between actual and fictional contexts (Joronen, Rankin & Astedt-Kurki, 2008). This study describes the process used for identifying themes and developing scripts for drama and storytelling for educating elementary school children on balanced nutrition.
MATERIALS AND METHODS
Data collection and proceduresA qualitative research strategy, called phenomenology, was used to gain insight and understanding about the knowledge and practice of balanced nutrition. “Phenomenology attempts to understand the emotions, attitudes, thoughts, meanings, perceptions, and bodily experiences of people, as or after they have experienced a phenomenon” (Harris et al., 2009). Focus group discussions (FGDs) were used to elicit the personal perceptions of a defined area of interest of the respondents through carefully planned, semi-structured and interactive discussion (Flynn, Lauren & Shannon, 2018). Following the ecological model for promoting healthy eating habits in children, the focus groups were organised at three levels that influence the eating behaviour of children, namely, the individual (school children), the family (mother), and the school (school teacher). This approach was
important for developing comprehensive promotional and educational materials (Parvanta et al., 2011).
Four elementary schools of which two were private and two governments were chosen for their sociodemographic diversity. One each of the private and government schools were located in Palembang City, while the remaining private and urban government schools were located in a rural area, called the Pemulutan and Ogan Ilir Regency.
The FGD participants were mother-child pairs. They were selected using a classroom student list to yield a purposeful sample. Access to the boys and girls in the fourth and fifth grades and their mothers, was facilitated by the teachers and the school principal. The participants who were chosen represented a range of sociodemographic backgrounds with respect to age, education level, and occupation of the mothers. Additionally, an in-depth interview was conducted with eight relevant classroom teachers; they were two from each participating school, one from fourth grade and one from fifth grade classroom teacher.
The FDGs and in-depth interviews were conducted at each school based on schedules agreed among school teachers, mothers, and study investigators. The FGDs among children and the mothers were held on the same day in different rooms, and were each led by a member of the research team. The FGD sessions for fourth grade children and their mothers were held in the morning while that for fifth grade children and their mothers after lunchtime. Each FDG lasted approximately 45-60 minutes.
The FGDs were conducted in a manner that allowed spontaneous discussion among students with the study investigators acting as observers and facilitators. They were designed as a thematic activity. The theme for

Destriatania S, Etrawati F & Februhartanty JS126
each activity was intended to explore the knowledge and practice of balanced nutrition, physical activity, learning methods, and hobbies of the students (Table 1).
In order to facilitate sharing during the FGD, photographic prints of foods and activities taken at various locations, and a Styrofoam board and pins, were given to each student. The photographs of snack foods were obtained after face-to-face surveys of the school canteen and food vendors around the schools. Those of staple foods, animal proteins, vegetables, and fruits were obtained from traditional markets and food vendors around the schools. The photographs of outdoor activities, such as traditional games, were obtained from interviews
with community members around the school while those of indoor activities were obtained from interviews with students of other elementary schools with similar characteristics. Students were asked to choose photographs of food and activities based on the FGD theme, pin them on the Styrofoam board and, then, to continue with discussion. Similar FGDs with the mothers were conducted, as described in Table 2.
In-depth interviews with classroom teachers were also conducted in each school after school hours. Teachers were asked about their knowledge of the balanced nutrition guide, the school’s efforts to support healthy lifestyle among students, and the school’s commitment to implementing a healthy environment
Table 1. Activities during focus group discussions among elementary school students
Sequence of activity Description
First activity: Setting my food plate photograph
Students were asked to (i) arrange food photographs of what they ate for breakfast, lunch, and dinner one day before the FGD; (ii) to discuss their eating habits, including breakfast habits, fruit and vegetable consumption, and (iii) hygiene practices.
Second activity: Grouping photographs based on like and dislike
Students were asked to explain why they liked or disliked certain foods.
Third activity: Grouping photographs based on healthy and unhealthy foods
In this activity, students were asked to explain their rationale for grouping the photographs and the effect(s) of such foods on their health.
Fourth activity: Collection of photographs of activities performed and grouping them as often- or seldom-performed.
Students were asked to explain the reasons for performing some activities more frequently than others. During this session, the learning methods, hobbies, and favourite cartoon characters of the students were also identified.
Fifth activity: Grouping the photographs based on activity levels, as active or inactive, and providing the rationale for their choices.
In this activity, students were also asked to group the photographs as active or inactive and explain the reason(s) for their choice.
Sixth activity:Sharing their thoughts on a given picture
In this activity, students were shown an illustration of a fat boy watching television while consuming unhealthy snack. They were asked to describe what they saw in the picture and how it related to a healthy lifestyle.

Drama and storytelling for nutrition education S127
(Table 3). Trained personnel transcribed all the recorded data in verbatim.
Data analysesA content analysis approach was used to evaluate the data collected from FGDs and in-depth interviews. The field notes of the investigators, from the FGDs with the children and their mothers were collated. Some terms in the local language were translated into Bahasa Indonesia
(the Indonesian language) and were identified by footnotes in the transcript. We did not use specific qualitative data analysis software but were aided by Microsoft excel when analysing patterns found in each transcript. The first and second authors independently read the transcript and discussed the codes for all the comments in the FDG transcripts and grouped those that showed similar contents. Themes were extracted from
Table 2. Activities during focus group discussions (FGDs) among mothers of the students
Sequence of activity Description
First activity: Setting my child’s food plate photograph
In this activity, mothers were asked to group photographs of foods consumed by their children for breakfast, lunch, and dinner, one day before the FGD. In addition, the researchers explored the mothers’ perception of the composition of food consumed by their children, including the habit for having breakfast, as well as the consumption of animal protein, vegetables, and fruits.
Second activity: Choosing photographs of foods liked and disliked by their children.
In this activity, mothers were asked to choose photographs of which foods were liked and disliked by their children. In this session, mothers were also encouraged to discuss the reasons of their preferences.
Third activity: Choosing photographs of physical activity
In this activity, mothers were asked to choose photographs of physical activities based on the frequency of their children’s activities, i.e. how often or seldom were they performed.
Fourth activity: Discussion
In this activity, mothers were encouraged to discuss their perception and opinions of the school’s roles in creating a healthy school environment and shaping their children’s healthy behaviours.
Table 3. In-depth Interview guide used to stimulate discussion with the classroom teachers
No. Questions
1. What do you know regarding current nutrition guidelines that are used in Indonesia?
2. Based on your opinion, explain how the schools support students to practise healthier lifestyles. What is the school’s role in developing a healthier school environment that encourages the implementation of balanced nutrition among the students?
3. What do you think schools and parents can do to encourage healthier behaviours among students?
4. How do the teachers and school staff support the achievement of healthy school?
5. What is the commitment of teacher and school staff in order to achieve healthy school?

Destriatania S, Etrawati F & Februhartanty JS128
these groupings, which represented the main message(s) conveyed by the focus groups. Potential themes were manually generated from the coded data, reviewed, and then labelled by the first and second authors of the study. The review process was repeated until no new themes emerged and a consensus on them was reached.
Script preparation processThe input of the students and mothers that were obtained during the FGDs and the perceptions of the respective teachers through interview were used to identify preceived needs and barriers to healthy dietary behaviour.
The research team consulted a performance expert who was a linguistics professor at the Universitas Sriwijaya (UNSRI) and who was well known for her involvement in many traditional and cultural performances in Palembang. In addition, she was an adviser of the UNSRI theatrical community, called Garda Anak Bangsa Indonesia (GABI), which consisted of UNSRI students from its various faculties. The UNSRI also had professional storytellers, who were students of the Faculty of Public Health with experience in performing for children throughout Palembang. Both GABI and the storytelling teams agreed to collaborate in the study by developing scripts and subsequently performing them.
The performance expert suggested that the characters that were developed for the drama should centre around the daily lives of the children, as they were the intended audience. Based on her past experiences, she suggested that for storytelling, the use of a mythical approach for developing the plot, would be preferred by the children. She explained that listening to or watching mythical tales would create an enthusiasm among young audiences which would transform
the moral(s) of the stories into life values and the possible adoption of healthy habits. The research team discussed these suggestions from the performance expert and the themes with GABI and storytelling teams.
Ethical approvalThe study was conducted according to the International Ethical Guidelines for health-related research involving humans (CIOMS, 2016). The Ethics Committee of the Faculty of Medicine, Sriwijaya University approved the study. The local authorities and the Ministry of Education also gave written approvals which were then forwarded to selected schools. Written informed consent was obtained from parents (mothers) and teachers before the conduct of the study.
RESULTS
Between April-May 2017, the research team conducted eight FGD sessions with 96 mothers, eight FGD sessions with 96 students, and in-depth interviews with eight teachers. Each FGD comprised six participants. Table 4 shows the characteristics of the participants. The FGDs and in-depth interviews were conducted in the local language and were recorded after written consent from all the participants. The findings from these activities are reported under the following major topics. In addition, we also describe the development and production of drama and storytelling. Findings from the exploratory studyNutrition knowledge In all the FGDs, the most of the children from urban areas could identify and distinguish, with an explanation, between healthy and unhealthy foods, by grouping the pictures provided by the research team.

Drama and storytelling for nutrition education S129
“Colourful ice is not healthy because it contains artificial colour and sugar” (Grade 4, Government school, urban area)
“It contains high amount of sugar” (Grade 5, private school, urban area), and “Fruits and vegetables
are healthy because they contain vitamins” (Grade 4, government school, urban area)
Some students could name the vitamins contained in fruits and vegetables but could not explain their benefits.
Table 4. Description of the characteristics of the FGDs participants.
Description Rural setting Urban setting
Private school 1
Government school 1
Private school 2
Government school 2
StudentsNumber of FGDs held 2 2 2 2Size of each FGD, n 6 6 6 6Age, n
9 years 0 4 4 410 years 6 6 3 211 years 5 2 4 612 years 1 0 0 013 years 0 0 1 0
Sex, nfemale 8 10 6 6male 4 2 6 6
Mothers Number of FGDs held 2 2 2 2Size of each FGD, 6 6 6 6Age range,
30-35 years 1 4 0 536-40 years 3 3 8 641-45 years 5 4 4 146-50 years 3 1 0 0
Educational attainment, Elementary 0 8 0 0Junior high 0 3 1 0Senior high 2 1 6 2Diploma 1 0 1 3Bachelor degree 0 0 3 6Postgraduate degree 0 0 0 1
Occupation, Housewife 5 6 10 8government officer 4 0 1 1Others 3 6 1 3

Destriatania S, Etrawati F & Februhartanty JS130
“Orange contains vitamin C and carrot contains vitamin A” (Grade 5, government school, urban area)
“I don’t know for sure what the function of vitamin C is” (Grade 5, government school, urban area)
Many children also mentioned that unhealthy foods could affect their health.
“Eating colourful ice and oily food can cause cough” (Grade 4, government school, urban area)
In contrast, many children in the rural area schools provided confusing responses in attempting to distinguish between healthy and unhealthy foods.
“Tango (brand name of chocolate wafer) is healthy food because it contains milk...milk is a healthy food”
Many children also mentioned that unhealthy foods could affect their health.
“Don’t eat candies and chocolate too much...it can cause toothache” (Grade 5, private school, rural area)
The slogan “Four Healthy Five Perfect” was widely known and continues to be remembered by most mothers from both urban and rural areas. However, many were unaware of the latest Indonesian guidelines for balanced nutrition.
“I just remember slogan Four Healthy Five Perfect” (mother, urban area)
“I am not familiar with the new guidelines” (mother, rural area)
The nutrition knowledge many mothers was still based on the old slogan.
Food varietyEven though the students could differentiate between healthy and unhealthy foods, the food-plate pictures showed that, in practice, most children ate unhealthy foods quite regularly, both at school and at home. When asked to name their favourite food, the majority mentioned snacks such as chips, ice cream, chocolates, fried meatballs, sausages, and other snacks, because they tasted good and were savoury.
“I bought pop ice and choclolatos at school (pop ice is an instant drink that comes in multiple flavours and contains an artificial sweetener; ‘chocolatos’ is sugary snack in a form of chocolate roll stick)” (Grade 4, government school, rural area)
Many children reported that their daily meals consisted of carbohydrate and protein as the main items while fruits and vegetables were often absent.
“I ate white rice, milk, and squid for lunch” (Grade 5, private school, urban area)
“My mom only cooked rice and fish for breakfast” (Grade 4, private school, rural area)
“I ate rice with instant noodles and eggs for dinner (Grade 5, government school, urban area)”
“Last night I ate rice and fried chicken” (Grade 5, government school, urban area)
In FGDs held in the rural areas, most mothers mentioned the limited availability of fruits and vegetables, and to find more variety, they had to go to fresh-food markets which were located quite far from their home.

Drama and storytelling for nutrition education S131
“I buy fruits and vegetables from the seller who comes to our village every day by motorcycle but fruits and vegetables that he brings are limited” (household mother, rural area)
“Rice is the first food that I buy before fish or vegetables” (government officer, rural area)
“My children only like certain vegetables like carrots and spinach” (lecturer, urban area)
Some mothers in the urban areas said that they preferred preferred simple dishes in the morning for breakfast;
“Instant noodle and pempek (savoury fishcake delicacy, originally from Palembang, made of fish and tapioca served with a rich sweet and sour sauce called cuko) are our favorite breakfast” (government officer, urban area)
Access to foodAll the children in the urban and rural areas said that they had access to school stores, canteens, and food vendors outside schools, all of which offered items that were low in nutrients but high in fat, salt and sugar. They received a daily pocket money from their parents, which varied from 5000 - 25000 rupiahs (15,000 rupiahs = US$1). Most of this money was spent on buying food sold around their schools or near their homes. The foods they bought were usually sweet or sugary snacks/drinks for example:
“I often buy potato chips and iced tea outside school during the first break” (grade 4, rural area)
“I like to eat grilled sausages and pop ice” (grade 5, urban area)
Most mothers agreed that it was difficult to control what their children ate outside the home. They also agreed that schools should have an influence on what their children eat while at school.
“The school should be a part of what’s going on, and teachers should act as parents at school”
“Teachers should educate students on which food should be consumed and which should be avoided” (mother in rural area)
Physical activityAlmost all the students from middle and upper income families reported that they frequently spent their leisure time in sedentary activities, such as watching television and playing games using gadgets.
“I love playing games on my tablet, my favourite is Craft and Attack on Titan” (Grade 5, private school, urban area)
Some of them said that they had personal gadgets such as android mobile phones or tablets. Private school students also mentioned spending a lot of time on screen-based activities.
“I have a Facebook account. Chatting on the phone and updating my status on Facebook make me inactive” (grade 4, private school, urban area)
They preferred to play at home rather than to participate in outdoor activities. The structure of the school system and academic workload were frequently mentioned as barriers to activity among private school students.
“After I arrive home in the afternoon, I am too tired to do sports” (grade 5, private school, rural area)

Destriatania S, Etrawati F & Februhartanty JS132
Students from the low income families reported spending more time doing outdoor activities, such as playing soccer, cycling, fishing, and climbing trees.
“I don’t have a smartphone, so after school I play soccer with my friends” (grade 4, goverment school, rural area)
The schools offered only a single sport education class a week and limited physical activities after school. The lack of opportunities for engaging in physical activities at school, was a common reason mentioned in all the FGDs among the students. Limited sport facilities, the lack of qualified sports teachers/coaches (only one sports teacher in school), and lack of role models were other reasons for the lack of physical activity. The girls felt that they had fewer physical activity options available at school compared to the boys.
Ability to provide foodNon-working mothers in rural areas stated that rice was the main staple food but revealed that the food they provided lacked variety. The reason was financial, and other foods such as animal protein and fruits could only be bought after they had received their earnings from weaving fabric. The major sources of protein were eggs, tempe (fermented soybean cake), tofu, and fish (either caught or bought). The majority of mothers usually bought animal products, vegetables, and fruits from mobile vegetable vendors who visited the village regularly. This was an advantage as they did not need to go to markets which located far from their home, and also they could buy in smaller quantities. However, because of the limited variety of food items sold by the mobile vegetable vendors, this resulted in a lack of variety in the foods prepared at home. In contrast, working mothers
from middle and upper socioeconomic status were able to provide animal products, vegetables, and fruits, without problems.
School policy and teacher’s roleBased on in-depth interviews with the teachers, it was found that two participating public schools did not have their own school canteen. The teachers revealed that the schools could not prevent their students from buying snacks from vendors outside the school.
“Students often buy snacks outside school because we don’t have a canteen” (teachers, government school)
They said that, at best, they could only remind the students not to buy snacks from outside the school. Importantly, a majority of the teachers were unfamiliar with the latest government guidelines for balanced nutrition. On the other hand, all the private schools had their own school canteen, and their students were not allowed to buy snacks outside the school. However, the schools did not control the foods and beverages that were sold in the school canteen. We found that the canteens sold packaged foods and beverages, such as flavoured powdered drinks, chips, wafers, and chocolates. The schools also admitted that they had not been able to monitor the food and drinks that were sold in the school canteen.
Script development and productionBased on the results of the FGDs and in-depth interviews, the drama and storytelling scripts were drafted by the GABI team and the story-telling team, respectively.
A drama titled “POLISI” (an acronym for Pola Hidup Sehat dan Makanan Bergizi, which translates to “Healthy Lifestyle and Nutritious Food) and a
Drama and storytelling for nutrition education S133
story titled “Nino and the Magical Tree” were finalised. The synopses for the story and drama are provided in Table 5. The content of the scripts was developed based on themes that emerged from the FGDs and in-depth interviews. For example, based on FGDs with children, we found that they lacked of physical activity and eat unhealthy food that they bought in the school environment. We created a story plot to describe that situation and give recommendations to change it. The research team also added key nutritional behaviours on balanced nutrition that were packaged as 10 messages. These were behaviours that were found wanting during the exploratory study, such as the consumption of a variety of foods, plenty of vegetables and fruits, having a regular breakfast, the need for proper hand-washing, and undertaking regular physical activity. These guidelines were used to replace the older guidelines of “Four Healthy Five Perfect” (empat sehat lima sempurna).
Taking into consideration the attention span of the school children, who were the main targets of the drama and storytelling sessions, both the performing teams decided that the drama should last for about 50 minutes and that the storytelling session for about 30 minutes (including an interactive session with the audience). The performances of these two nutrition education media were scheduled for one weekend at the GABI Theatre Room in Palembang. Prior to that, regular rehearsals were conducted twice a week for three weeks and daily intensive rehearsals were conducted for five days prior to the show. The impressions of the audiences of two media events for nutrition education will be presented as a separate paper.
DISCUSSION
Health communication strategies have been used to inform and influence individual and community decisions to enhance health (Parvanta et al., 2011). Increasingly, however, health communication developers are turning to narrative forms of communication like entertainment education, storytelling, and testimonials to help achieve these same objectives. Narrative is a key communication strategy as human beings are all storytellers (Gray, 2009). Storytelling has been a method for human beings to organise experience and ideas, communicate and create understanding with the purpose of educating and inspiring the cause-effect relationship between events in particular time. Storytelling has a power to explain a condition, topic or problem to attract and sustain interest, and to form meaningful connections with audiences (Sundin, Karolin & Robert, 2018). This type of education is realistic and applicable to classroom teaching.
Changes in health and nutrition behaviour may be achieved through education within the school setting (Lee, 2009). School-based nutrition education should take into consideration the needs and interests of the students, teachers and the school, be culturally appropriate and be delivered in ways that the children can understand healthy eating habits (Wilson, 2009). Based on the ecology theory (Parvanta et al., 2011), there are three domains that influence the eating behavior of children. These are at the levels of the individual (children), the family (mother) and the environment (represented by school teacher). An important element in the early stages of preparing nutrition messages through drama and storytelling was the identification of their perceived needs and barriers in the implementation of

Destriatania S, Etrawati F & Februhartanty JS134S134
balanced nutrition by FGD. The FGD results have provided information on the knowledge among young school children of balanced nutrition guidelines and how their environments (i.e. their mothers, the schools, and teachers) have influenced the eating practices of the children.
Studies in Australia have revealed that parents are not always capable of choosing healthier foods because they lack adequate knowledge and also because they are misled by the information provided through the marketing practices of food companies (Jones, Robinson & Kervin, 2011). We found a number of consistent themes among mothers and students both in rural and urban areas. In general, mothers in rural and urban areas were not familiar with the latest public guidelines on balanced nutrition that were published in 2014. Instead, the “Four Healthy Five Perfect” slogan that was introduced in 1952, was still the predominant guideline referred to by the general public. That slogan had stated that milk was the perfect food that could compensate for non-consumption of all other foods. This was strongly believed by mothers. The fundamental differences between the “Four Healthy Five Perfect” slogan and the new guidelines on balanced nutrition lie in the four new principles, which are food diversity, personal hygiene, physical activity, and control of body weight (MOH Republic of Indonesia, 2014).
The present study found that the intake of fruit and vegetables by students at mealtime is inadequate. The choice of food that is consumed is influenced by factors such as
tastes, colours and textures. Sugary snacks and drinks were preferred by the children. Such foods are easily available at school or from food vendors around their home. They easily access such foods as they are given daily pocket money by their parents.
Schools should be part of the solution of this issue. Providing regular nutrition education and nutritious and balanced meals through a school meal programme has been shown to enhance the knowledge and desire of students to choose right foods for their health (Park, Je-Hyuk & Myung-Hee, 2015). The role of the schools can be improved through the UKS “School Health Programme”, wherein one of three pillars is health education on nutritious foods for the students. Unfortunately, the implementation of the UKS has been unsatisfactory. As a result, the government has transformed the UKS programme to create a healthy school environment. This, in turn, can help to prevent non-communicable diseases in children from an early age.
School policy should be backed with proper resources to address health and nutrition behaviour. Such policies would be more effective if they were disseminated by educators with experience in the field. Schools should also be permitted to investigate the foods and beverages that are available to students at canteens or food vendors located near the schools and take appropriate action if they are deemed unsuitable.
Schools should be provided with adequate time and other resources to develop health promotion tools to carry out changes. However, the resources

Drama and storytelling for nutrition education S135
Table 5. The synopses of drama and storytelling
Type Synopsis
Drama Gita has a mother who cares about the health of the family. Her mother always serves homemade food for Gita and her father. Gita’s mother is a role model for other mothers in the neighbourhood. She often shares information with her friends on how to apply the concept of balanced nutrition in the family’s diet, increase the variety of the food that is provided, counsel children who do not like vegetables, and choose healthy snacks.
Gita has several close friends in school who have different lifestyles. Shinta is an obese girl who likes eating candies, ice cream, chips, and other snacks a lot, while Lala is a lazy girl who likes to buy unhealthy snacks that are sold around the school every day. Bimo loves to play with gadgets. Gita often advices her friends about healthy eating habits and an active lifestyle.
One day Gita invites her friends to bring their own lunchboxes to school. Gita asks her friends to open their lunch box together. Surprisingly, most of the foods inside the lunch box were unhealthy. Gita explains that they should eat a variety of foods, vegetables and fruits because they contain a lot of nutritious substances. Gita discusses with her friends that consuming too much high-energy foods, combined with sedentary lifestyles, may result in excessive weight gain. The teacher hears their discussion, approaches Gita and her friends, and brings along big poster of the Indonesian food pyramid called “Tumpeng Gizi Seimbang” on balanced nutrition guidelines. She concludes the show by articulating all 10 messages in the nutrition guide that include what and how much we should eat every day, and the need for having an active, healthy lifestyle.
Storytelling The Mikimo village is inhabited by magical dwarves who speak and live like humans. They are unique in their own way and are endowed with certain blessings that will remain with them only if they do not violate the rules of the Gods. The Mikimo village is famous for its fertile vegetable and fruit plantations and the habits of its people who follow a healthy lifestyle. They have a varied diet and love the vegetables and fruits that they consume every day. They also do not forget to have breakfast before gardening or doing other activities. Washing of hands is obligatory before and after meals.
One day, a small dwarf named Nino missed his breakfast because he was in a hurry to go to Uncle Maden’s carrot garden. Suddenly, Nino got a warning from God. At the time of pulling the carrots, he is swallowed into the ground. He then sees the old banyan tree that turns out to be the God Nirvana. God Nirvana then reminded Nino not to skip his breakfast again.
In ancient times, the dwarves used their magical powers arbitrarily. They created so much cake, candies, chips, chocolate, that they overate and became too lazy to work. They did not like to have breakfast or eat fruits and vegetables, and so they became fatter, and finally died. They also never washed their hands before and after meals so they were often infected with diseases. Therefore, God Nirvana and the Chief of the tribe drew up some rules. These were to always eat nutritious foods, consume fruits and vegetables, have breakfast, and wash hands before and after meals.
Nino regretted what he had done and promised to obey God Nirvana’s rules so as to continuously maintain a healthy lifestyle.

Destriatania S, Etrawati F & Februhartanty JS136
for developing and sustainably enacting these performances on nutrition education for school children need to be expanded as a variation of interactive nutrition education tool. The use of the performances arts such as drama and storytelling has the potential for conflict with the duties of the teachers. However, its short duration fits with the limited time teachers are provided for nutrition education.
Finally, although models of health-behaviour change like social cognitive theory, precaution adoption process model, and the theory of reasoned action have been applied and evaluated more extensively in health-behaviour research, their application to communication by narrative means has been limited. Most research on narrative effects has been conducted in the fields of communication and psychology, not in health-behaviour research, let alone nutrition behaviour.
CONCLUSION
This study showed that drama and storytelling performance should be based on the assessment of the eating environment of the children. Drama and storytelling are appropriate due to its relatively short duration, which fits with the limited time that school teachers are provided for nutrition education. Storytelling also applicable for parents because it is a simple method of delivering nutrition messages in a home setting. Future research should be conducted to collect data at baseline, during and post-intervention to confirm the effectiveness of these tools.
Acknowledgments
The study was supported by South East Asian Ministers of Education Organization Regional Centre for Food and Nutrition (SEAMEO RECFON). We acknowledge the cooperation of students and their mothers, teachers and principals of the schools who participated in this study.
Authors’ contributions
DS, led the data collection and compiled the first draft of the manuscript; EF, led the data collection. All authors contributed to the conception and design of the work, were involved in the acquisition, analysis and interpretation of the data, critically revised the draft and approved the final draft.
Conflict of interest
We declare no conflicts of interest.
References
Achadi E, Pujonarti SA, Sudiarti T, Rahmawati, Kusharisupeni, Mardatillah & Putra WK (2010). Sekolah Dasar sebagai pintu masuk perbaikan pengetahuan, sikap, dan perilaku gizi seimbang masyarakat (Primary school as entry point for improving knowledge, attitude, and behavior on balance diet). Jurnal Kesehatan Masyarakat 5:42-8.
Bacha F & Gidding SS (2016). Cardiac abnormalities in youth with obesity and type 2 diabetes. C urrent Diabetes Reports 16(7): 62.
Beck AR (2016). Psychosocial aspects of obesity. NASN School Nurse 31(1):23–27.
Calvert S, Robert CD & Rachel P (2019). Delivering in school interventions to improve dietary behaviours amongst 11 to 16 year-olds: A systematic review. Obesity Reviews 20(4):543-553.
CIOMS (2016). International Ethical Guidelines for Health Related Research Involving Humans. Council for International Organizations on Medical Sciences, Geneva.
Cote AT, Harris KC, Panagiotopoulos C, Sandor GGS & Devlin AM (2013). Childhood obesity and cardiovascular dysfunction. Journal of the American College of Cardiology 62(15):1309–1319.
Del Rosso JM & Rina A (2009). Investing in School Health and Nutrition in Indonesia. Basic Education Capacity Trust Fund. Human Development Sector, World Bank Office, Jakarta.
Evans A, Ranjit N, Hoelscher D, Jovanovic C, Lopez M, McIntosh A, Ory M, Whittlesey L, McKyer L, Kirk A, Smith C, Walton C, Heredia NI & Warren J (2016). Impact of school based vegetable garden and physical activity coordinated health interventions on weight status and weight related behaviors of ethnically diverse, low income students: Study design and baseline data of the Texas, Grow! Eat! Go! (TGEG) cluster randomized controlled trial. BMC Public Health 16:973.
Drama and storytelling for nutrition education S137
Fairclough SJ, Allan FH, Ian GD, Rebecca G, Kelly AM, Genevieve LW, Gareth S, Esther MF & Lynne MB (2013). Promoting healthy weight in primary school children through physical activity and nutrition education: a pragmatic evaluation of the CHANGE! randomised intervention study. BMC Public Health 13:626.
Flynn R, Lauren A & Shannon DS (2018). Two approaches to focus group data collection for qualitative health research: maximizing resources and data quality. International Journal of Qualitative Methods 17:1–9.
Gray JB (2009). The power of storytelling: Using narrative in the healthcare context. Journal of Communication in Healthcare 2(3):258–273.
Harris JE, Philip MG, Patricia MS, Carol B, Judith AB & Fada B (2009). An Introduction to qualitative research for food and nutrition professionals. Journal of The American Dietetic Association 109(1):80-90.
Ickovics JR, Carroll-Scott A, Peters SM, Schwartz M, Gilstad-Hayden K & McCaslin C (2014). Health and academic achievement: cumulative effects of health assets on standardized test scores among urban youth in the United States. J Sch Health 84(1):40-8.
Institute of Medicine (2012). Accelerating Progress in Obesity Prevention: Solving the Weight of the Nation. The National Academies Press, Institute of Medicine, Washington DC.
Jarpe-Ratner E, Folkens S, Sharma S, Daro D & Edens NK (2016). An experiential cooking and nutrition education program increases cooking self efficacy and vegetable consumption in children in grades 3-8. J Nutr Educ Behav 48(10):697-705.
Jones SC, Robinson L & Kervin L (2011). Who do parents perceive is pressuring them to buy unhealthy (and healthy) foods? In: Australia New Zealand Marketing Academy Conference 2011: pp 1-7.
Joronen K, Rankin SH & Astedt-Kurki P (2008). School-based drama interventions in health promotion for children and adolescents: Systematic review. J. Adv. Nurs 63:116–131.
Lee A (2009). Health-promoting schools: evidence for a holistic approach to promoting health and improving health literacy. Appl Health Econ Health Policy 7(1):11-17.
MOH Republic of Indonesia (2013). Basic Health Reseach Report 2013. Health Research and development Agency, Ministry of Health Republic of Indonesia, Jakarta.
MOH Republic of Indonesia (2014). Guide for Balanced Nutrition. Ministry of Health Republic of indonesia, Jakarta.
Park E, Je-Hyuk L & Myung-Hee K (2015). Eating habits and food preferences of elementary school students in urban and suburban areas of Daejeon. Clin Nutr Res 4:190-200.
Parvanta CV, David EN, Sarah AP & Richard NH (2011). Essentials of Public health Communication. Jones & Bartlett Learning, Massachusetts.
Sahoo K, Ashok KC, Nighat YS, Raman K & Ajeet SB (2015). Childhood obesity: causes and consequences. J Family Med Prim Care 4(2):187–192.
Sanchez T, Zam G & Lambert J (2009). Story-telling as an effective strategy in teaching character education in middlegrade social studies. Journal for the Liberal Arts and Sciences 13(2):14-23.
Sundin A, Karolin A & Robert W (2018). Rethinking communication: integrating storytelling for increased stakeholder engagement in environmental evidence synthesis. Environ Evid 7:6.
Van Cauwenberghe E, Maes L, Spittaels H, van Lenthe FJ, Brug J, Oppert JM & De Bourdeaudhuij I (2010). Effectiveness of school based interventions in Europe to promote healthy nutrition in children and adolescents: Systematic review of published and ‘grey’ literature. British Journal of Nutrition 103(6):781-797.
Wall DE, Least C, Gromis J & Lohse B (2012). Nutrition education intervention improves vegetable related attitude, self efficacy, preference, and knowledge of fourth grade students. J Sch Health 82(1):37-43.
Wijlaars LP, Johnson L, van Jaarsveld CH & Wardle J (2011). Socioeconomic status and weight gain in early infancy. Int J Obes (Lond). 35:963-970.
Wilson DK (2009). New perspectives on health disparities and obesity interventions in youth. Journal of Pediatric Psychology 34(3):231–244.


S139
ACKNOWLEDGEMENTS
Appreciation is recorded to the following for their contributions towards the publication of the Malaysian Journal of Nutrition Supplement for the SEAMEO Regional Centre for Food and Nutrition (RECFON), Indonesia
Guest Editor, Dr. Jane Wilcox, La Trobe University, Australia
Reviewers:
1. Dr. Airin Roshita, UNICEF Indonesia2. Prof. Allan de Guzman, University of Santo Tomas, Philippines3. Dr. Avita Aliza Usfar, Researcher and Sakanti Consultant, Indonesia4. Dr David Rea, Swansea University, Wales5. Dr. Dono Indarto, Universitas Sebelas Maret, Indonesia6. Ms Fatimah Sulong, Ministry of Health, Malaysia7. Dr. Gan Wan Ying, Universiti Putra Malaysia8. Dr. Ira Nurmala, Airlangga University Indonesia9. Dr. Herqutanto, Universitas Indonesia10. Dr Hery Tolba, Brawijaya University, Indonesia11. Prof. Jean Pierre Poulain, Taylor’s University Malaysia12. Dr. Lina Rospita, Food and Agriculture Organization, Rome13. Dr. Martha Irene Katasurya, Universitas Diponegoro, Indonesia14. Dr. Rachael Dryer, Charles Stuart University, Australia15. Dr. Rahayu Indriasari, University of Hasanuddin, Indonesia16. Dr. Risantiati Kolopaking, Islamic State University Syarif Hidayatullah
Jakarta, Indonesia17. Prof. Ruzita Talib, Universiti Kebangsaan Malaysia18. Dr. Sarina Sariman, Management and Science University, Malaysia19. Dr. Siti Muslimatun, Indonesia International Institute for Life
Sciences20. Dr. Siti Rohaiza Ahmad, Universiti Brunei Darussalam21. Dr. Sueppong Gowachirapani, Mahidol University, Thailand22. Dr. Tengku Alina Tengku Ismail, Universiti Sains Malaysia23. Prof. Tony Worsley, Deakin University, Australia24. Prof. Wan Manan Wan Muda, Universiti Sains Malaysia25. Dr. Wan Puteri Elena Wan Dali, Universiti Sains Malaysia 26. Dr. Wong Jyh Eiin, Universiti Kebangsaan Malaysia27. Dr. Yi Yi Lee, United Nations University, International Institute for
Global Health, Malaysia