Maize residue decomposition measurement using soil surface carbon dioxide fluxes and natural...
12
Maize Residue Decomposition Measurement Using Soil Surface Carbon Dioxide Fluxes and Natural Abundance of Carbon-13 Philippe Rochette,* Denis A. Angers, and Lawrence B. Flanagan ABSTRACT the amount of residue-derived C remaining in the soil after a given period. This technique provides precise The decomposition rate of crop residues in soils directly impacts estimates of decomposition rates. However, the infor- organic matter content and nutrient cycling. We hypothesized that mation obtained is mostly relevant to aboveground crop natural abundance 13 C analyses could be used with soil CO 2 flux measurements to quantify the short-term decomposition rates of residues. The natural abundance of 13 C has also been maize (Zea mays L.) residues under undisturbed field conditions. For used to study C transformation in soils where the C this purpose, maize was grown in a sandy loam (Umbric Dystrochrept) isotope ratio of the crop was contrasting with that of that developed under C3 vegetation. Residues were returned to the the soil C (Cerri et al., 1985). This technique was success- field at the end of the growing season. During the following snowfree fully used to determine the medium-term (5–30 yr) dy- period (May to November), the maize residue decomposition rate namics of soil organic matter and its various fractions was calculated for plots that were either under no-till or moldboard under different soil and management conditions (Bales- plowed, using the C isotope ratio ( 13 C/ 12 C) of the soil CO 2 , the C dent et al., 1990; Angers and Giroux, 1996; Gregorich isotope ratio of the plant and soil substrates, and the soil respiration et al., 1996). One of the major advantages of the use of rate. The incorporation of residue-derived C into the soil microbial the natural abundance of 13 C compared with the incor- biomass was also evaluated. Maize residue decomposition increased the C isotope ratio of the soil CO 2 by 2 to 7‰ relative to unamended poration of prelabeled residues, is that the above- and control plots. Decomposition rates peaked in June (2–3 g C m 22 d 21 ) belowground crop residues are incorporated into the and were low at both the beginning and end of the growing season soil via natural crop growth and typical agricultural man- (,0.5 g C m 22 d 21 ). For a given soil temperature, the decomposition agement practices. was more active early than late in the season because of decreased An alternative to the monitoring of the disappearance substrate availability as decomposition proceeded. The decomposition of the residues in soil is the measurement of the rate at rate of maize-derived C correlated with the fraction of the microbial which the CO 2 is produced during the decomposition of biomass derived from maize residues. This active pool represented the crop residues. Respiration rates provide quantitative 9% of microbial biomass and showed a high level of specific activity. information on the short-term dynamics of the decom- The total maize residue-C losses during the study corresponded with position processes. Decomposition rates of residues 35% of the added residue C under no-till plots and 40% with mold- board plowing. Natural abundance 13 C analyses may be successfully have been determined in the laboratory, where soil sam- used with respiration measurements to quantify crop residue decom- ples amended with residues were incubated under con- position rates under undisturbed field conditions. trolled conditions. The CO 2 –C originating from the resi- dues was then measured using either isotope techniques (Broadbent and Nakashima, 1974; Wu et al., 1993) or S oil organic matter is central to soil functioning and by comparison with unamended control plots (Rein- the maintenance of soil quality. Its role in determin- ertsen et al., 1984; Recous et al., 1995). There are few ing soil structural processes, erosion control and nutrient reports of the use of respiration-based techniques for supply is well established. Soil organic matter is also a measuring the decomposition of specific C sources un- significant pool of biospheric C, and changes in soil C der field conditions. The rate of decomposition of ma- content directly affects the atmospheric CO 2 (Buyanov- nure (Gregorich et al., 1998; Rochette and Gregorich, sky and Wagner, 1998). Crop residues are the major 1998) and crop residues (Jensen et al., 1997) has been and often the only input of C in agricultural soils. It is measured using the difference in total soil respiration therefore essential to understand the dynamics of their rates between amended and control plots, while Aita decomposition in soils in order to predict the effects of (1996) used an isotope technique to quantify the decom- soil and crop management on soil C content. position rate of artificially 13 C-labeled wheat (Triticum The decomposition rate of 14 C- or 13 C-labeled crop aestivum L.) residues. Rochette and Flanagan (1997) residues has been studied under laboratory and field and Rochette et al. (1999) used the difference in C conditions (e.g., Jenkinson, 1977; Broadbent and Naka- isotope ratio between C3 and C4 plants to separate shima, 1974; Voroney et al., 1989; Aita et al., 1997). the total soil respiration into root and soil components Essentially, the methodology consisted of incorporating under undisturbed field conditions. They estimated the previously labeled residues into the soil and determining instantaneous decomposition rates of native soil organic C at regular intervals during the growing season. In this study, we hypothesized that natural abundance Philippe Rochette and Denis A. Angers, Soils and Crops Research 13 C analyses could be used with soil CO 2 flux measure- and Development Centre, Agriculture and Agri-Food Canada, 2560 ments to quantify the short-term decomposition rates Hochelaga Blvd., Ste-Foy, QC, Canada, G1V 2J3. Lawrence B. Flana- gan, Dep. of Biological Sciences, Univ. of Lethbridge, 4401 University of above- and belowground maize crop residues under Dr., Lethbridge, AB, Canada, T1K 3M4. Received 21 Aug. 1998. undisturbed field conditions. *Corresponding author ([email protected]). Abbreviations: DM, dry matter; MBC, microbial biomass C. Published in Soil Sci. Soc. Am. J. 63:1385–1396 (1999). 1385 Published September, 1999
-
Upload
independent -
Category
Documents
-
view
4 -
download
0
Transcript of Maize residue decomposition measurement using soil surface carbon dioxide fluxes and natural...

Maize Residue Decomposition Measurement Using Soil Surface Carbon Dioxide Fluxesand Natural Abundance of Carbon-13
Philippe Rochette,* Denis A. Angers, and Lawrence B. Flanagan
ABSTRACT the amount of residue-derived C remaining in the soilafter a given period. This technique provides preciseThe decomposition rate of crop residues in soils directly impactsestimates of decomposition rates. However, the infor-organic matter content and nutrient cycling. We hypothesized thatmation obtained is mostly relevant to aboveground cropnatural abundance 13C analyses could be used with soil CO2 flux
measurements to quantify the short-term decomposition rates of residues. The natural abundance of 13C has also beenmaize (Zea mays L.) residues under undisturbed field conditions. For used to study C transformation in soils where the Cthis purpose, maize was grown in a sandy loam (Umbric Dystrochrept) isotope ratio of the crop was contrasting with that ofthat developed under C3 vegetation. Residues were returned to the the soil C (Cerri et al., 1985). This technique was success-field at the end of the growing season. During the following snowfree fully used to determine the medium-term (5–30 yr) dy-period (May to November), the maize residue decomposition rate namics of soil organic matter and its various fractionswas calculated for plots that were either under no-till or moldboard
under different soil and management conditions (Bales-plowed, using the C isotope ratio (13C/12C) of the soil CO2, the Cdent et al., 1990; Angers and Giroux, 1996; Gregorichisotope ratio of the plant and soil substrates, and the soil respirationet al., 1996). One of the major advantages of the use ofrate. The incorporation of residue-derived C into the soil microbialthe natural abundance of 13C compared with the incor-biomass was also evaluated. Maize residue decomposition increased
the C isotope ratio of the soil CO2 by 2 to 7‰ relative to unamended poration of prelabeled residues, is that the above- andcontrol plots. Decomposition rates peaked in June (2–3 g C m22 d21) belowground crop residues are incorporated into theand were low at both the beginning and end of the growing season soil via natural crop growth and typical agricultural man-(,0.5 g C m22 d21). For a given soil temperature, the decomposition agement practices.was more active early than late in the season because of decreased An alternative to the monitoring of the disappearancesubstrate availability as decomposition proceeded. The decomposition of the residues in soil is the measurement of the rate atrate of maize-derived C correlated with the fraction of the microbial
which the CO2 is produced during the decomposition ofbiomass derived from maize residues. This active pool representedthe crop residues. Respiration rates provide quantitative9% of microbial biomass and showed a high level of specific activity.information on the short-term dynamics of the decom-The total maize residue-C losses during the study corresponded withposition processes. Decomposition rates of residues35% of the added residue C under no-till plots and 40% with mold-
board plowing. Natural abundance 13C analyses may be successfully have been determined in the laboratory, where soil sam-used with respiration measurements to quantify crop residue decom- ples amended with residues were incubated under con-position rates under undisturbed field conditions. trolled conditions. The CO2–C originating from the resi-
dues was then measured using either isotope techniques(Broadbent and Nakashima, 1974; Wu et al., 1993) or
Soil organic matter is central to soil functioning and by comparison with unamended control plots (Rein-the maintenance of soil quality. Its role in determin- ertsen et al., 1984; Recous et al., 1995). There are few
ing soil structural processes, erosion control and nutrient reports of the use of respiration-based techniques forsupply is well established. Soil organic matter is also a measuring the decomposition of specific C sources un-significant pool of biospheric C, and changes in soil C der field conditions. The rate of decomposition of ma-content directly affects the atmospheric CO2 (Buyanov- nure (Gregorich et al., 1998; Rochette and Gregorich,sky and Wagner, 1998). Crop residues are the major 1998) and crop residues (Jensen et al., 1997) has beenand often the only input of C in agricultural soils. It is measured using the difference in total soil respirationtherefore essential to understand the dynamics of their rates between amended and control plots, while Aitadecomposition in soils in order to predict the effects of (1996) used an isotope technique to quantify the decom-soil and crop management on soil C content. position rate of artificially 13C-labeled wheat (Triticum
The decomposition rate of 14C- or 13C-labeled crop aestivum L.) residues. Rochette and Flanagan (1997)residues has been studied under laboratory and field and Rochette et al. (1999) used the difference in Cconditions (e.g., Jenkinson, 1977; Broadbent and Naka- isotope ratio between C3 and C4 plants to separateshima, 1974; Voroney et al., 1989; Aita et al., 1997). the total soil respiration into root and soil componentsEssentially, the methodology consisted of incorporating under undisturbed field conditions. They estimated thepreviously labeled residues into the soil and determining instantaneous decomposition rates of native soil organic
C at regular intervals during the growing season.In this study, we hypothesized that natural abundance
Philippe Rochette and Denis A. Angers, Soils and Crops Research 13C analyses could be used with soil CO2 flux measure-and Development Centre, Agriculture and Agri-Food Canada, 2560ments to quantify the short-term decomposition ratesHochelaga Blvd., Ste-Foy, QC, Canada, G1V 2J3. Lawrence B. Flana-
gan, Dep. of Biological Sciences, Univ. of Lethbridge, 4401 University of above- and belowground maize crop residues underDr., Lethbridge, AB, Canada, T1K 3M4. Received 21 Aug. 1998. undisturbed field conditions.*Corresponding author ([email protected]).
Abbreviations: DM, dry matter; MBC, microbial biomass C.Published in Soil Sci. Soc. Am. J. 63:1385–1396 (1999).
1385
Published September, 1999

1386 SOIL SCI. SOC. AM. J., VOL. 63, SEPTEMBER–OCTOBER 1999
season. Instrument malfunction prevented the measurementMATERIALS AND METHODSof soil moisture in Repetitions 1, 3 and 4, and prior to Day 172.
Study Site and Description of the Experiment
The study site was located at the Chapais Experimental Carbon Isotope Ratio of Soil Carbon DioxideFarm, Levis, Quebec in a 0.4-ha field with 5% slope facing and Organic Substratesnorthwest. The soil was a St-Pacome sandy loam (Umbric
Soil air samples were taken at the soil surface inside enclo-Dystrochrept) with 0.70 g g21 sand, 0.11 g g21 silt, and 0.19 gsures. One enclosure, consisting of a collar identical to thoseg21 clay, a pHH2O of 6.5 6 0.1 and average C and N contentsused for measuring respiration, was installed in each plot. Thisof 19.9 6 2.0 g kg21 and 1.78 6 0.19 g kg21, respectively. Thecollar was inserted 14 cm deep so that the top of the collaraverage bulk density prior to tillage was 1.31 6 0.09 g cm23.was even with the soil surface. Twenty four hours beforeBarley (Hordeum vulgare L.) was grown in this field from 1993sampling, an acrylic lid (thickness 6.35 mm) was sealed to theto 1995 under conventional tillage practices (fall moldboardcollar with vinyl tape (thickness 0.013 cm, width 7.5 cm). Whenplowing). To our knowledge, no C4 plants have ever beentested under lab conditions, the vinyl tape kept leaks belowgrown in the field.2.5% for periods of 6 d. The absence of a headspace keptThe experimental design was a randomized complete blockcontamination of samples with atmospheric CO2 to a mini-with four replicates. The treatments consisted of (i) maizemum. Sampling of air in soil surface enclosures was chosenfollowed by barley under fall moldboard plowing (mold-as an alternative to direct sampling of soil air to account forboard), (ii) maize followed by barley under no-till (no-till),the CO2 produced by the decomposition of the residues at theand (iii) bare soil control (control). The study was carried outsurface of the no-till soil. At the time of sampling, air wasacross 2 yr on 7 by 11 m plots. In 1996, maize was grown onremoved from the enclosures via a plastic tube (Bev-A-Linethe total surface of the field except for the four control plots,IV, Labcor, Anjou, Quebec) connected through the lid to anwhich were kept free of vegetation by manual weeding. Onevacuated 250-mL glass gas sampling bulb (Kontes, Vineland,Day 278 in 1996, the maize crop was cut and the abovegroundNJ). Before collecting the soil air sample, 10 mL of air wasresidues (10.83 Mg dry matter [DM] ha21; 431.0 g C kg21 DM;removed from the tube and discarded to account for the dead9.4 g N kg21 DM) were left on the soil surface. Moldboardvolume of the tube. After collecting the air sample, the bulbsplowing to a depth of 0.20 m was performed on Day 299 inwere returned to a lab for cryogenic extraction of the CO21996, while the no-till plots were left untouched. The fouraccording to the technique described by Rochette and Flana-control plots were also kept bare in 1997 by regularly removinggan (1997). The purified CO2 was analyzed on a gas isotopevegetation by hand and by one rototillage on Day 167. Inratio mass spectrometer (Sira 12, VG Isotech, Middlewich,1997, barley was seeded at a rate of 156 kg ha21 on Day 132Cheshire, UK) at the Ottawa-Carleton Stable Isotope Facility.on the plots in which maize was grown in 1996. Fertilizers
Maize and barley plants were collected from the field. Thewere applied prior to planting according to soil tests. Followingplants were washed and subsamples of leaves and roots wereharvest (Day 217), barley crop residues were left undisturbedtaken from a range of positions on the plant. The subsampleson the soil surface for the rest of the season.were combined for an individual plant, and the material wasdried at 658C, and ground to a fine powder with a tissueTotal Soil Respiration grinder. Prior to the experiment, soil samples were taken fromthe 20-cm surface layer and dried in an oven at 608C for 24Four rectangular acrylic collars (100 cm long by 15 cm wideh. Roots from the previous vegetation were removed fromby 14 cm high with a wall thickness of 6.35 mm) were insertedthe samples, and the soil was ground to a fine powder with ato a depth of 10 cm on each of the 12 plots on Day 122 inmortar and pestle. Plant and soil samples were analyzed on1997. The collars were left in the soil for the duration of thean isotope ratio mass spectrometer interfaced with a Robo-experiment except for a brief period in May to allow forPrep Sample Converter (Europa Scientific, Crewe, UK) atplanting. Total soil respiration (Rt) was measured with a dy-the Stable Isotope Facility of the Department of Soil Sciencenamic closed-chamber system described by Rochette et al.at the University of Saskatchewan.(1997). The system consisted of a rectangular acrylic chamber
Isotopic compositions are expressed using delta notation:(100 cm long by 15 cm wide by 15 cm high with a wall thicknessof 6.35 mm) connected to a portable CO2 analyzer (LI-6200,
d13 5 [(13C/12Csample)/(13C/12Cstandard)] 2 1 [1]Li-Cor, Lincoln, NE). At the time of measurement, the cham-ber was attached to the acrylic collars by clamps for a period The international standard for CO2 samples is CO2 from Peeof ≈2 min during which the rate of increase of CO2 concentra- Dee Belemnite (PDB) limestone (Ehleringer and Osmond,tion was monitored in four successive periods of 20 s. The 1989). The values are presented in parts per thousand (‰).respiration rate was calculated for each 20-s period and the Isotope ratios in soil CO2 samples were corrected for thefour values were averaged for the flux estimate (Rochette presence of N2O by the procedure described by Friedli andand Angers, 1999). On each sampling day, Rt was measured Siegenthaler (1988).successively on all 48 collars between 1000 and 1400 h. Mea-surements of Rt began on Day 125 and were repeated weekly
Maize Residue Decomposition Rates(21 times) until Day 307.Soil temperature at 10 cm was measured inside each soil A mass balance approach was used to calculate the contri-
respiration collar at the time of respiration measurement using bution of maize residue decomposition to the total soil surfacecopper-constantan thermocouples. The thermocouples were CO2 flux (Rresid,frac). This approach is similar to that proposedinstalled at the same time as the respiration collars and were by Mary et al. (1992) after simplification by assuming thatleft in place for the duration of the experiment. They were there was no contamination of soil air by atmospheric CO2:read with digital thermometers (model HH23, Omega Inc.,
Rresid,frac 5 Rresid/Rt 5 (d13CO2 cn 2 dCO2 ctl)Stamford, CT and model 600-2820, Barnant Co., Barrington,IL). Soil moisture in the 5- to 25-cm layer of plots in Repetition /(d13Ccn 2 d13Csoil) [2]2 was measured using time domain reflectometry probes(Topp et al., 1984) on 17 d from Day 172 to the end of the where Rresid is the emission rate of the CO2 produced by the
ROCHETTE ET AL.: MEASURING RESIDUE DECOMPOSITION WITH CO2 FLUXES AND 13C NATURAL ABUNDANCE 1387
decomposition of the maize residues, d13CO2 cn and d13CO2 ctl freeze-dried and analyzed on an isotope ratio mass spectrome-ter interfaced with a Robo-Prep Sample Converter (Europaare the d13C of the soil CO2 in the maize and control plots,
respectively, and d13Ccn and d13Csoil are the d13C of the maize Scientific, Crewe, UK) at the Stable Isotope Facility of theSoil Science Department at the University of Saskatchewan.C and soil C, respectively. This approach assumes that the
d13C of the soil C and of the barley C are the same and that The d13C of the microbial biomass C (d13CMBC) was calculatedusing the formula:there is no isotopic fractionation during respiration processes.
Mary et al. (1992) reported a fractionation of several perd13CMBC 5 {[d13CFUM(CFUM)] 2 [d13CNF(CNF)]}thousand when various substrates were incubated in the labo-
ratory. On the other hand, Lin and Ehleringer (1997) showed /(CFUM 2 CNF) [4]that there is little fractionation during dark respiration pro-
where CFUM and CNF are the amounts of C extracted fromcesses in plants. It was also observed that the CO2 respiredthe fumigated and nonfumigated samples, respectively, andby the roots of young wheat plants had the same d13C as thed13CFUM and d13CNF are the corresponding isotope ratios.root tissues (Cheng, 1996), and that the d13C of soil CO2, once
corrected for the slower diffusion of the heavier 13C isotope,was identical to the d13C of soil C (Cerling et al., 1991). We Statistical Analysisfeel justified, therefore, in making the assumption that no A separate analysis of variance using a randomized com-fractionation occurred during respiration processes. plete block design was performed at each sampling date forThe decomposition rates of maize residues were calculated the parameters related to CO2 emissions as these were mea-as the product of the total soil respiration by the contribution sured at the same location (fixed chamber) throughout theof residues to the total respiration: experiment. For parameters related to microbial biomass,
pooled samples were obtained from various locations in eachRresid 5 RtRresid,frac [3]plot at each sampling date and a split-plot analysis was used
Cumulative estimates of C loss from maize decomposition with treatments as the main-plot treatment and sampling timewere made by linearly interpolating between sampling dates. as the subplot treatment. Contrast analysis was used to com-Soil respiration measurements made between 1000 and 1400 pare the means (Snedecor and Cochran, 1980). All statisticalh were assumed to be representative of average daily values. analyses were performed using the SAS GLM procedure (SASIn Eastern Canada, soil respiration is largely controlled by Inst., 1989).temperature (Rochette and Gregorich, 1998), and for thisassumption to be valid, soil temperature between 1000 and1400 h has to be similar to the daily average. Measurementsof soil temperature at 10 cm made in the field between Days185 and 195 in 1998, showed that mean values between 1000and 1400 h varied from 0.98C cooler to 0.78C warmer than thedaily average.
Microbial Biomass Carbon and its d13C
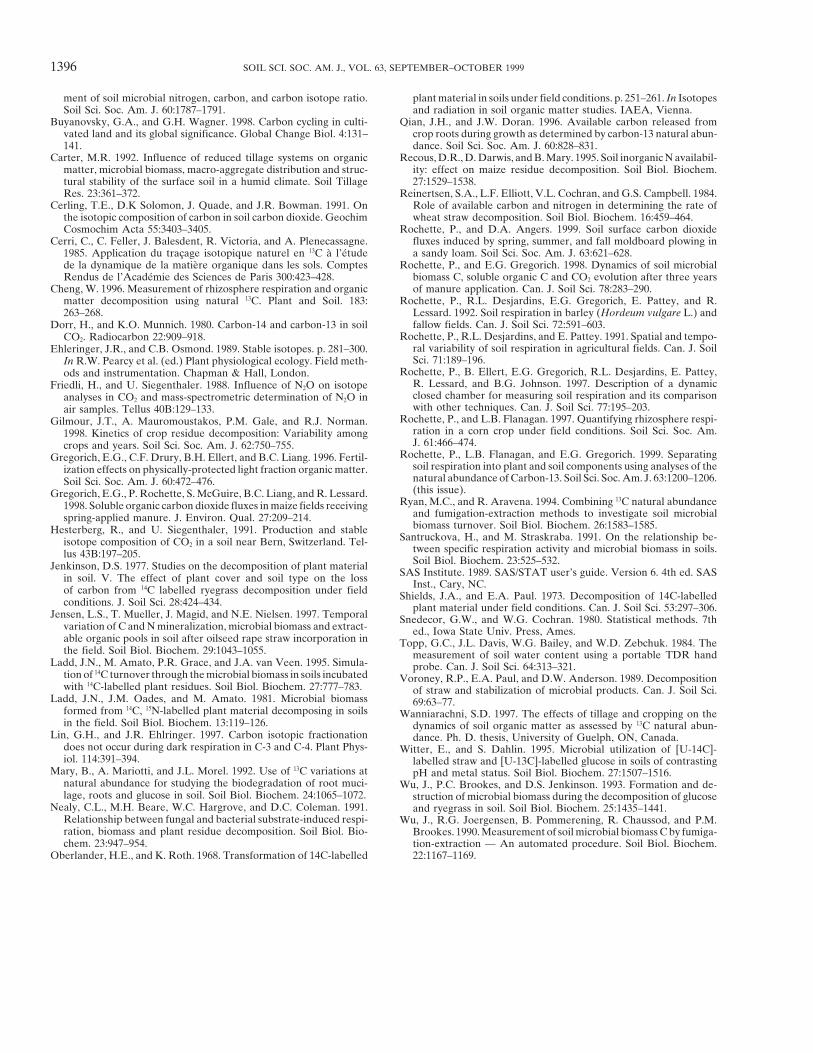
Soil samples were collected from the 15-cm surface soillayer 19 times during the experiment. Samples were sieved inthe field at 6 mm and stored immediately at 38C. Soil microbialbiomass C measurements were carried out within 24 h ofsampling using the chloroform-fumigation extraction tech-nique (Wu et al., 1990). Two 50-g subsamples of field-moistsoils were placed in 100-mL beakers. One subsample wasfumigated for 24 h in a vacuum desiccator containing 25 mLof CHCl3. The other subsample was kept in the dark at 38Cfor 24 h. Both fumigated and nonfumigated soils were ex-tracted with 100 mL of 0.25 M K2SO4. After shaking for 1 hon an oscillating shaker, the suspensions were centrifuged at1000 g and filtered. The organic C content of the extracts wasdetermined by UV-persulfate oxidation on a DC-180 CarbonAnalyzer (Dohrmann Co., Santa Clara, CA). An extractionefficiency (Kec factor) of 0.45 was used to calculate the micro-bial biomass C (Wu et al., 1990). Microbial biomass C wasexpressed in g C m22 using a 15-cm sampling depth and bulkdensities. For that purpose, soil bulk density was measuredin each plot once in August 1997 using cylindrical soil cores(3 cm high 3 6 cm i.d.). Average values (6 standard deviation)were 1.30 (0.07), 1.39 (0.03), and 1.30 (0.04) g cm23 for themoldboard, no-till, and control treatments, respectively. Theapproach to determine the d13C of the K2SO4 extracts wasadapted from Wanniarachni (1997). The K2SO4 extracts of thesamples from four sampling dates (Day 141,168, 210, and 253)were dialyzed using 11.5-mm-diameter dialysis tubing with a Fig. 1. (a) Soil temperature at 10 cm and (b) soil water content inmolecular weight cutoff of 3500 (Spectra/Por 3500, Spectrum the 5- to 25-cm layer during the 1997 growing season in control,Laboratories, Laguna Hills, CA) in distilled water first for 16 no-till, and moldboard-plowed plots. Error bars indicate standard
deviations (n 5 4).h followed by an additional 4 h. The dialyzed extracts were

1388 SOIL SCI. SOC. AM. J., VOL. 63, SEPTEMBER–OCTOBER 1999
RESULTS AND DISCUSSION Total Soil RespirationTotal soil respiration rates in cropped plots variedSoil Temperature and Soil Water Content
between 1 and 7 g C m22 d21 during the experimentThe first soil air samples and CO2 flux measurements (Fig. 2). These respiration rates are similar to thosewere taken 5 d after snowmelt when soil temperatures reported for other soils under continuous cropping inat 10 cm were between 6 and 88C (Day 125) (Fig. 1a). eastern Canada (Rochette et al., 1991, 1992). Respira-Maximum temperatures (20–248C) were reached tion in cropped treatments followed a similar patternaround Day 180 and were followed by a gradual de- early and late in the season (Fig. 2). Significant differ-crease to reach 88C on Day 307. Temperature in the ences (P # 0.05) were observed only on Day 155 andcropped plots was lower (P # 0.05) than in control plot 162, resulting from the relatively high variability of Rt.between Days 147 and 211, as a result of the shading The absence of both root respiration and decompositionof the soil by the barley crop. The insulating effect of of previous-year crop residues resulted in significantlythe maize residues on the surface of the no-till soil lower respiration (P # 0.05) in the control plots thanresulted in lower (P # 0.05) temperature in the no-till in cropped plots on all days except Days 155, 162, 170,than in the plowed soil early in the season (Day 147– and 178.162). Maize residues had no effect (P . 0.43) on soil Soil respiration in cool and moist climates is mostlytemperature after canopy closure (Day 180) and there controlled by soil temperature. Variations in soil tem-were no significant (P . 0.35) differences in temper- perature have been shown to explain as much as 95%ature among treatments after harvest (following of the variation in soil respiration when other factorsDay 217). such as moisture and substrates were not limiting (Ro-
At the time of maximum crop vegetative development chette and Gregorich, 1998). In our study, only 19 to(Day 170–180), soil water content fluctuated between 46% of the variation in respiration was explained by0.2 and 0.3 m3 m23 (Fig. 1b). Evapotranspiration coupled temperature (Fig. 3). However, the respiration–with low rainfall (29 mm between Day 185 and 224) temperature relationships can be used to identify peri-decreased soil water content in cropped soils to levels ods when factors other that temperature affected soilbelow 0.15 m3 m23 between Day 200 and 225. Abundant respiration. In the control plots, two events increasedrain between Day 225 and 234 (135 mm) raised soil respiration rates well above the levels predicted by themoisture to levels .0.25 m3 m23. Soil moisture remained respiration–temperature curve (Fig. 2 and 3). Roto-high after harvest due to frequent rainfall and the ab- tillage of the plots on Day 167 had a strong stimulatingsence of crop transpiration. No-till soil had a tendency effect on decomposition and resulted in high respirationto be wetter than plowed soil during most of the season, rates in the following two sampling dates. Respirationwhile soil moisture in the control was less affected by on Day 237 was also higher than expected. This probablythe mid-season dry period, thereby highlighting the criti- reflected a period of high but short-lived respiration
observed following rewetting of the soil after a dry pe-cal role of crop transpiration on soil moisture dynamics.
Fig. 2. Total soil respiration during the 1997 growing season in control, no-till, and moldboard-plowed plots. Error bars indicate standarddeviations (n 5 4).

ROCHETTE ET AL.: MEASURING RESIDUE DECOMPOSITION WITH CO2 FLUXES AND 13C NATURAL ABUNDANCE 1389
Carbon Isotope Ratio of Soil Carbon Dioxideriod in August (Rochette et al., 1991). In the plowedsoil, the only period during which a factor other than The C isotope ratio of soil CO2 in cropped plots wastemperature appeared to have a strong influence on significantly (P # 0.01) enriched in 13C on all samplingrespiration was the midsummer drought (Fig. 3b). Dur- dates but Day 304. The d13C values were maximuming that period (Day 200–230), respiration rates were (215‰) at the beginning of the season and decreasedwell below the respiration–temperature curve, indicat- linearly to about 220‰ on Day 260 (Fig. 4). The isotopeing that soil moisture was limiting respiration. In the ratio of soil CO2–C in no-till was significantly differentno-till soil, the midsummer drought had a lower effect (P # 0.05) than in plowed plots only on Day 189. Theon respiration than in plowed soil (Fig. 3c). Respiration d13C values of the CO2 in the control plots fluctuatedin no-till plots was unusually high on Day 279 when between 222 and 224‰ during most of the experimentmeasurements were made during a warm spell in the (Fig. 4). These soil CO2 isotope ratios are 4 to 6‰ higher
than the d13C value of the native soil C (228.2‰), whichfall (Fig. 1a and 2).
Fig. 3. Total soil respiration as a function of soil temperature at 10 cm in (a) control, (b) no-till, and (c) moldboard-plowed plots. Open squaresindicate the measurements made during the 2 wk following rototillage of the control plots on Day 167. Open triangles indicate measurementsmade during the period when soil water content was below 0.15 m3 m23 (Day 200–225).

1390 SOIL SCI. SOC. AM. J., VOL. 63, SEPTEMBER–OCTOBER 1999
Fig. 4. Carbon isotope ratio of soil CO2. Error bars indicate standard deviations (n 5 4).
is the presumed source of respired soil CO2–C. This Estimates of instantaneous decomposition rates ofdifference between the d13C value of the soil CO2 and the maize residues were made by multiplying the totalthe source respired CO2 was consistent with the 4.4‰ respiration rates by the relative contributions of maizevalue predicted by models based on the slower diffusion residues to soil CO2 (Eq. [3]). An estimate was producedof heavier 13CO2 molecules than that of the 12CO2 mole- for each day when respiration was measured by using thecules (Dorr and Munnich, 1980; Cerling et al., 1991). nearest estimate of residue contribution to respiration.
The d13C value of soil CO2 in the control plots was Decomposition rates were significantly greater thanhigher than 222‰ for the first and the last sampling zero (P # 0.05) at all sampling dates except Days 125,dates. Similar increases in d13C of the soil CO2 in control 253, and 307, and rates were larger (P # 0.05) in mold-plots (Rochette and Flanagan, 1997) and under grass board than in no-till plots on Days 162 and 189 (Fig.(Hesterberg and Siegenthaler, 1991) late in the season 6). Decomposition rates were low in May, peaked inhave been previously reported. They are probably the June at 2.2 g C m22 d21 for no-till and 3.0 for moldboard,result of the changes in the concentration of CO2 within and gradually decreased from early July to the end ofthe soil air space that are caused by low respiration rates the season. These values are in agreement with decom-following frost, and potential contamination of the soil position rates (1–2 g C m22 d21) of wheat straw artifi-air by atmospheric CO2 by convective transfer associ- cially labeled with 13C measured from the emitted 13C–ated with the air being cooler than soil. In the absence CO2 under field conditions (Aita, 1996).of a reliable measurement of the d13C of the soil CO2 Examination of the decomposition–temperature graphson Day 304, the d13C measured on Day 284 was used provides information on the decomposition during thein the decomposition calculations for Day 304. experiment. Measurements made early in the season
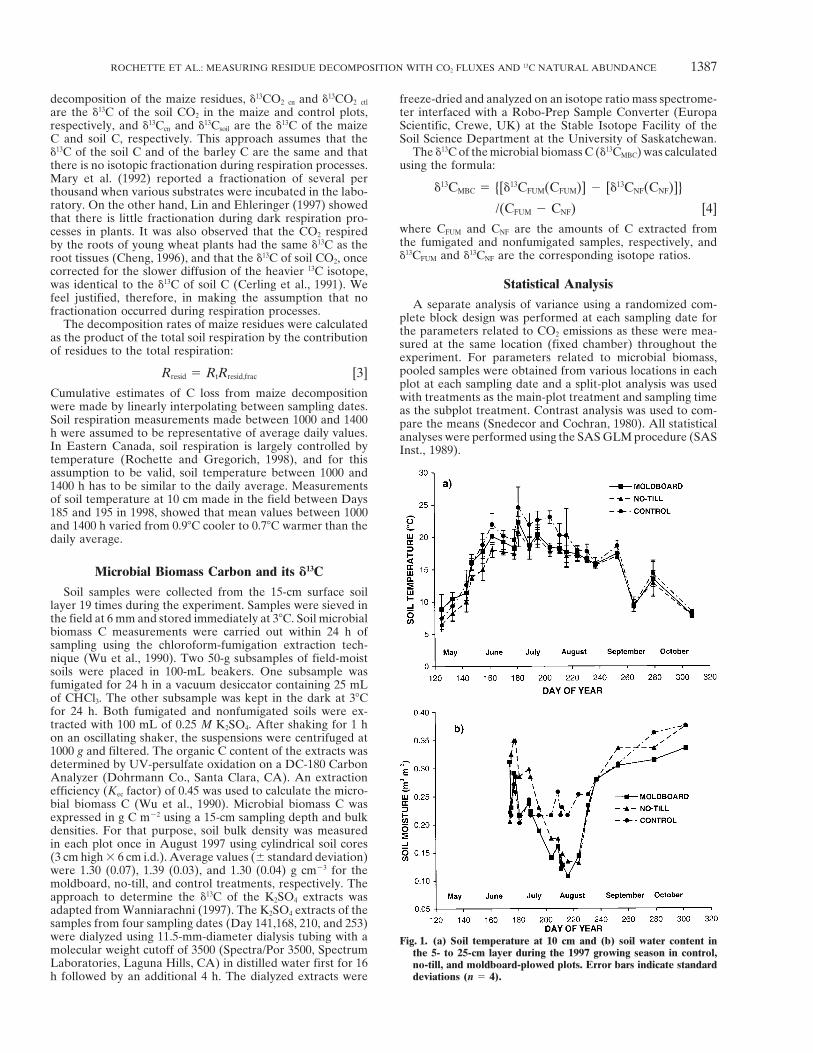
produced greater decomposition rates at a given tem-Decomposition Rates of the Maize Residues perature than measurements made later in the season,
as indicated by different (P , 0.05) linear relationshipsThe C isotope ratio of the substrates for respirationbefore and after Day 156 (Fig. 7). As the season pro-was –12.0‰ 6 0.3 for the maize tissues, –28.2‰ 6 0.1gressed, decomposition slowed, in part due to propor-for the native soil C and –28.3‰ 6 0.1 for the barleytionally more resistant maize-C compounds undergoingtissues. These values were used in Eq. [2] to calculatedecomposition with time. The larger slope in no-till (0.18the contribution of the decomposition of maize residuesg C m22 d21 C21) than in the plowed plots (0.13 g C m22to total soil respiration. The contribution of residuesd21 C21) early in the season (Fig. 7a and 7b) may haveincreased in May, peaked at almost 50% in early Junebeen due to less decomposition in these plots prior toand decreased gradually to ,20% at the end of theDay 125. This observation has practical importanceseason (Fig. 5). The contribution of residues was similarsince it suggests that decomposition in no-till soils canin no-till and plowed plots except for the period frombe as high as in plowed soils early in the year despiteDay 160 to 189 when values were lower in no-till. How-cooler soil temperature due to the insulating effect ofever, the difference was significant (P # 0.05) only for
Day 189. the residues at the soil surface of the no-till soil. Also,

ROCHETTE ET AL.: MEASURING RESIDUE DECOMPOSITION WITH CO2 FLUXES AND 13C NATURAL ABUNDANCE 1391
Fig. 5. Contribution of the decomposition of maize crop residues to the total soil respiration during the 1997 growing season in no-till andmoldboard-plowed plots. Error bars indicate standard deviations (n 5 4).
during the mid-season drought, the decomposition rates layer on the soil surface. Finally, when sampling datesduring spring and drought are removed, the responsein the plowed plots were well below the decomposition–
temperature curve, while the decomposition in no-till of decomposition of maize residues to temperature wasnearly identical in both treatments (moldboard:was apparently not limited by low soil moisture (Fig.
7a and 7b). This lower sensitivity of decomposition to decomposition 5 0.113Ts – 0.75, r 2 5 0.87, n 5 10; no-till: decomposition 5 0.115Ts – 0.76, r 2 5 0.69, n 5 12),dry conditions in no-till than in plowed soils may be
explained by the buffering of the extreme environmen- where Ts is soil temperature (Fig. 7a and 7b). This similarresponse of decomposition to changes in temperaturetal conditions (temperature and moisture) by the residue
Fig. 6. Decomposition rates of the maize residues during the 1997 growing season in no-till and moldboard-plowed plots. Error bars indicatestandard deviations (n 5 4).
1392 SOIL SCI. SOC. AM. J., VOL. 63, SEPTEMBER–OCTOBER 1999
in both treatments in summer and fall when soil mois- 1995). We estimated that between 350 and 500 soil de-gree days (.08C) accumulated between harvest of theture was not limiting suggests that similar maize-C com-
pounds were being decomposed in both treatments dur- maize crop and the initiation of the CO2 flux measure-ments. Gilmour et al. (1998) observed that ≈20% of theing that part of the season.
Cumulative estimates of C loss from maize decompo- maize residues was decomposed when incubated underequivalent heat accumulation.sition were made by linearly interpolating between sam-
pling dates. Cumulated residue-C losses for the seasonwere 208 g C m22 in the plowed soil and 183 g C m22
Microbial Biomass Carbonin the no-till soil (Fig. 8). These values represent 40 and
Microbial biomass C contents varied from 17 to 53 g35% of the amount of maize residues returned to theC m22 during this study (Fig. 9) which is in the rangesoil, respectively. Field studies of the decompositionof values reported for Eastern Canadian soils (e.g., Bol-rate of 14C-labeled crop residues reported disappearanceinder et al., 1999). The analysis of variance showed thatof 45 to 70% of the residues during the growing seasonboth the effects of cropping and tillage were statisticallyfollowing incorporation (Oberlander and Roth, 1968;significant (P , 0.05) with average values of 22.5 g CShields and Paul, 1973; Jenkinson, 1977; Amato et al.,m22 for the control, 34.1 g C m22 for the plowed soil,1987; Wu et al., 1993). The lower estimates of decompo-and 38.9 g C m22 for the no-till soil. The higher valuessition in our study may be partly explained by the exclu-for the no-till and plowed soils relative to the controlsion of the losses that occurred in late fall of 1996 andare due to the input of maize and barley residues (above-during the 1996-1997 winter when a large fraction ofand belowground residues) during the 2 yr of the experi-the labile C may have been respired. Indeed, incubationsment. Similar rapid and persistent effects of crop residuein the laboratory have shown that the decompositionincorporation on MBC have been reported previouslyrates of residues are highest shortly after the incorpora-(Jensen et al., 1997). The higher values in the no-tilltion of the residues because of the decomposition of
readily decomposable compounds (Broadbent and Na- soil than in the plowed soil is in line with previousstudies in Eastern Canada (e.g., Carter, 1992; Angerskashima, 1974; Reinertsen et al., 1984; Recous et al.,
Fig. 7. Decomposition rate of the maize residues as a function of soil temperature at 10 cm in (a) no-till and (b) moldboard-plowed plots. Opentriangles indicate measurements made during the period when soil water content was below 0.15 m3 m23 (Day 200–225).

ROCHETTE ET AL.: MEASURING RESIDUE DECOMPOSITION WITH CO2 FLUXES AND 13C NATURAL ABUNDANCE 1393
Fig. 8. Cumulative decomposition of maize residues during the 1997 growing season in no-till and moldboard-plowed plots. A total of 520 g m22
of residue C was returned to the field in the fall of 1996. Error bars indicate standard deviations (n 5 4).
et al., 1993) and further illustrate that MBC responds reflects the contribution of the maize-derived C to themicrobial biomass (Table 1). On average, 8 and 10%very rapidly to changes in tillage practices. Only small
temporal variations were observed with, for example, a of MBC was of maize origin for the plowed and no-till soils, respectively. Using the same stable isotopehigh at Day 158 to 160 in the cropped plots, which
coincides with the highest values of crop residue decom- technique, Ryan and Aravena (1994) found that 30 to55% of the MBC was derived from C4 plants after 5 yrposition (Fig. 6).
The d13C value of the microbial biomass was greater of continuous grain maize, while Angers et al. (1995)reported a contribution of 35% after 11 yr of silagein the cropped soil than in the control, which clearly
Fig. 9. Microbial biomass C in the 15-cm surface soil layer during the 1997 growing season in control, no-till, and moldboard-plowed plots. Errorbars indicate standard deviations (n 5 4).

1394 SOIL SCI. SOC. AM. J., VOL. 63, SEPTEMBER–OCTOBER 1999
Table 1. Carbon isotope ratio (d13C value), quantity, and origin The amount of MBC derived from C4 material variedof microbial biomass carbon (MBC) as affected by the treat- from 2 to 7 g C m22, which represents from 0.4 to 1.4%ments on four sampling dates in 1997.
of the estimated initial C4 inputs. Using natural abun-Treatments Isotope ratio MBC-C4 MBC MBC-C4 dance of 13C under controlled conditions, Qian and
‰ % g m22 Doran (1996) estimated this incorporation to be 1.5Day 141 to 3.5% after 42 d of maize growth. Studies on theNo-till 221.18 8.8 40.1 3.5 decomposition of 14C-labeled plant residues have shownPlowing 221.61 5.9 29.1 1.7 that right after the incorporation of the residues, and forControl 222.58 0 21.4 0
a period of a few weeks, the proportion of the residue-CDay 168
input recovered in the microbial biomass can range fromNo-till 223.85 11.0 32.2 3.6 5 to 20% (Ladd et al., 1981; Bremer and van Kessel,Plowing 223.40 13.9 36.3 5.0Control 225.63 0 17.5 0 1992; Wu et al., 1993; Witter and Dahlin, 1995). How-Day 210 ever, Ladd et al. (1981) observed that this proportion
decreased rapidly after 32 wk and stabilized to valuesNo-till 223.90 8.7 36.9 3.2Plowing 223.81 6.8 32.3 2.2 approaching 1%. (Ladd et al., 1981). The values ob-Control 224.90 0 24.5 0 served in our study and their relative stability with timeDay 253 confirm that, at or near equilibrium, ≈1% of the CNo-till 223.77 12.2 54.0 6.6 input is recovered in the microbial biomass. However,Plowing 224.78 5.9 41.4 2.4
comparisons of the rate of incorporation of residue-Control 225.73 0 27.6 0derived C in the microbial biomass between studiesANOVA P values†should be made with caution. Differences can be dueDate ,0.01 0.69 0.01 0.46
Date 3 treatment 0.85 0.85 0.40 0.42 to the methods used to measure MBC — mainly fumiga-Treatment 0.01 0.01 0.01 0.01 tion-extraction vs. fumigation-incubation — but also toResidue vs. control ,0.01 ,0.01 ,0.01 ,0.01
variations in the extraction efficiency factor (Kec) usedNo-till vs. plowing 0.57 0.44 0.05 0.13CV (%) 6 127 30 129 in the various experiments (Wu et al., 1993). Significant
uncertainty is also associated with the estimation of the† ANOVA, analysis of variance.total C inputs in field studies, especially the be-
maize. The much higher values in these studies than in lowground portion. Under field conditions, the depthour study are explained by the fact that maize-derived or amount of soil considered in measuring microbialC was supplied for many years prior to soil sampling in biomass should also be kept in mind; in this study, theaddition to the supply of root-derived C during the top 0- to 15-cm layer was considered.current season. The contribution of the growing plant Attempts to relate soil respiration measured undercan be significant. In a field study, Bruulsema and Dux- field conditions to soil microbial biomass have beenbury (1996) found that 23% of MBC was from C4 after relatively unsuccessful (Jensen et al., 1997; Gregoricha single year of maize, whereas values ranging from 1 et al., 1998; Rochette and Gregorich, 1998). In theseto 11% were found after 42 d of maize growth in a pot three studies, total soil respiration was mainly a function
of soil temperature and moisture. The relationship be-study (Qian and Doran, 1996).
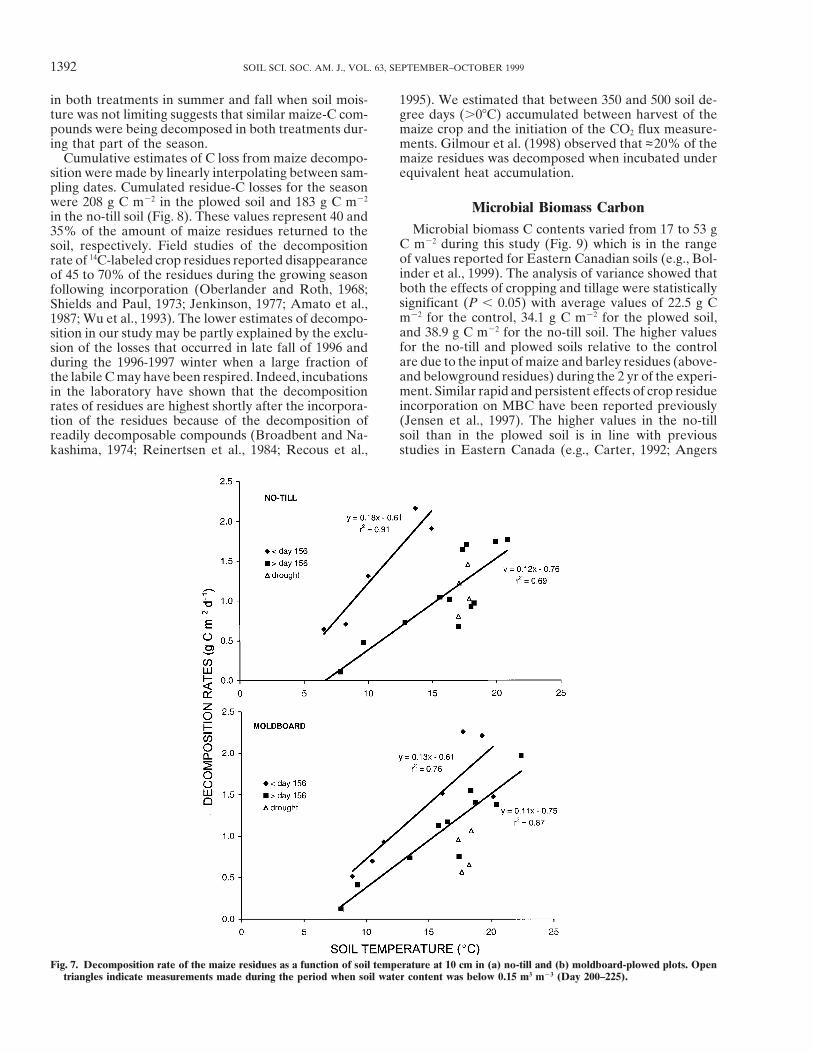
Fig. 10. Decomposition rate of the maize residues as a function of the microbial biomass C derived from maize. The regression equation doesnot include the data point for no-till Day 253.
ROCHETTE ET AL.: MEASURING RESIDUE DECOMPOSITION WITH CO2 FLUXES AND 13C NATURAL ABUNDANCE 1395
tween MBC and either soil respiration or maize residue microbial biomass derived from maize residues but notto the total biomass. This fraction, although represent-decomposition was not significant in our study either
(data not shown). It has been hypothesized that the soil ing only 6 to 14% of the total MBC, showed a high levelof specific activity, thereby indicating that this fractionmicrobial biomass is not uniform and that it is composed
of various fractions, each having different levels of activ- was very active compared with the rest of the micro-bial biomass.ity and turnover times (e.g., Ladd et al., 1995). One of
these fractions would be formed from the decomposi- The results obtained in this study suggest that mea-surements of the natural abundance of 13C in soil CO2tion of fresh residues and have a rapid turnover (Ladd
et al., 1995). This hypothesis is difficult to test experi- can be successfully used to quantify the decompositionrates of crop residues. The techniques based on thementally, especially under field conditions. Nealy et al.
(1991) found a close relationship between substrate- disappearance of prelabeled incorporated residues arerobust and less labor-intensive than the technique pro-induced respiration — a measure of the active microbial
biomass — and residue decomposition rate as measured posed in this study. However, the combined use of natu-ral abundance of 13C and CO2 emissions allowed forusing litter bag loss. In our study, the fraction of the
microbial biomass involved in the decomposition of rel- (i) study of the decomposition of residues that wereincorporated into the soil via natural root growth andatively fresh maize-derived C has been quantified and
can be considered as an active fraction. We tested the typical agricultural practices and (ii) measurement ofinstantaneous decomposition rates, which provided in-hypothesis that the quantity of MBC derived from maize
was related to the decomposition of maize residues. formation on the same time scale as changes of thevariables that modulate decomposition of residues inExcept for one data point (no-till at Day 253), the rela-
tionship was linear and highly significant (Fig. 10). The soils (e.g., soil temperature and soil moisture). More-over, the approach allowed us to relate an active micro-slope of the relationship, which represents an estimate
of the specific activity of the biomass fraction decompos- bial biomass C fraction to residue decomposition rates.ing the maize-derived C, was constant at 0.45 g CO2–Cg21 MBC d21. The specific activity was much lower (0.10 ACKNOWLEDGMENTSg CO2–C g21 MBC d21) for the no-till treatment at Day This work was supported by the AAFC PERD program.253 due to a very low total MBC value at that particular We thank Nicole Bissonnette for her assistance in the statisti-date. Our values, which were obtained from field soil cal analysis, and Francois Gagne, Patrice Jolicoeur, Philipperespiration measurements, are in the high range of those Drouin, and Rene Baillargeon for assistance in soil respiration
measurements, sample collection, laboratory analyses, andreported in the literature for laboratory respiration ex-plot preparation and maintenance.periments (Santruckova and Straskraba, 1991). How-
ever, in those studies, the specific activities were deter-REFERENCESmined from total MBC, whereas in our study, we were
concerned with a much smaller fraction representing Aita, C. 1996. Couplage des cycles du carbone et de l’azote dans lessols cultives: Etude au champ des processus de decomposition apresfrom 6 to 14% of the total MBC. The 13C approach wasapport de matiere organique fraıche. These de doctorat. Universite-therefore successful at relating an active soil biologicalParis VI.fraction to residue decomposition rates measured di- Aita, C., D.A. Angers, and S. Recous. 1997. Short-term kinetics of
rectly in the field. residual wheat straw C and N under field conditions: Characteriza-tion by 13C15N tracing and soil particle size fractionation. Eur. J.Soil Sci. 48:283–294.
Amato, M., J.N. Ladd, A. Ellington, G. Ford, J.E. Maloney, A.C.CONCLUSIONSTaylor, and D. Walsgott. 1987. Decomposition of plant material
The purpose of this study was to use the natural abun- in Australian soils. IV. Decomposition in situ of 14C- and 15N-labelled legume and wheat materials in a range of southern Austra-dance of 13C and the soil surface CO2 fluxes to measurelian soils. Aust. J. Soil Res. 25:95–105.the decomposition rate of maize residues under undis-
Angers, D.A., N. Bissonnette, A. Legere, and N. Samson. 1993. Micro-turbed field conditions. The decomposition of maizebial and biochemical changes induced by rotation and tillage in a
residues during the year following their return to the soil under barley production. Can. J. Soil Sci. 73:39–50.soil significantly increased the C isotope ratio of the soil Angers, D.A., and M. Giroux. 1996. Recently deposited organic matter
in soil water-stable aggregates. Soil Sci. Soc. Am. J. 60:1547–1551.CO2 relative to the unamended control plots. Decompo-Angers, D.A., R.P. Voroney, and D. Cote. 1995. Dynamics of soilsition rates peaked in June (2–3 g C m22 d21) and were
organic matter and corn residues as affected by tillage practices.lowest at both ends of the season (,0.5 g C m22 d21). Soil Sci. Soc. Am. J. 59:1311–1315.For a given soil temperature, the decomposition was Balesdent, J., A. Mariotti, and D. Boisgontier. 1990. Effect of tillage
on soil organic carbon mineralization estimated from 13C abundancemore active earlier than later in the season, possibly asin maize fields. J. Soil Sci. 41:587–596.a result of differences in substrate availability as the
Bolinder, M.A., D.A. Angers, E.G. Gregorich, and M.R. Carter. 1999.decomposition proceeded. The decomposition of theThe sensitivity of soil quality indicators to conservation manage-
residues was also more affected by low soil water con- ment. Can. J. Soil Sci. 79:37–45.tent in the moldboard plow than in the no-till plots. The Bremer, E., and C. van Kessel. 1992. Seasonal microbial biomass
dynamics after addition of lentil and wheat residues. Soil Sci. Soc.total maize residue–C losses during the study corre-Am. J. 56:1141–1146.sponded with 35% of the added residue–C in the
Broadbent, F.E., and T. Nakashima. 1974. Mineralization of carbonno-till plots and 40% in the moldboard-plowed plots. and nitrogen in soil amended with 13C and 15N labelled plantExcept for one data point, the decomposition rate of material. Soil Sci. Soc. Am. J. 38:313–315.
Bruulsema, T.W., and J.M. Duxbury. 1996. Simultaneous measure-maize-derived C was proportional to the fraction of the
1396 SOIL SCI. SOC. AM. J., VOL. 63, SEPTEMBER–OCTOBER 1999
ment of soil microbial nitrogen, carbon, and carbon isotope ratio. plant material in soils under field conditions. p. 251–261. In Isotopesand radiation in soil organic matter studies. IAEA, Vienna.Soil Sci. Soc. Am. J. 60:1787–1791.
Buyanovsky, G.A., and G.H. Wagner. 1998. Carbon cycling in culti- Qian, J.H., and J.W. Doran. 1996. Available carbon released fromcrop roots during growth as determined by carbon-13 natural abun-vated land and its global significance. Global Change Biol. 4:131–
141. dance. Soil Sci. Soc. Am. J. 60:828–831.Recous, D.R., D. Darwis, and B. Mary. 1995. Soil inorganic N availabil-Carter, M.R. 1992. Influence of reduced tillage systems on organic
matter, microbial biomass, macro-aggregate distribution and struc- ity: effect on maize residue decomposition. Soil Biol. Biochem.27:1529–1538.tural stability of the surface soil in a humid climate. Soil Tillage
Res. 23:361–372. Reinertsen, S.A., L.F. Elliott, V.L. Cochran, and G.S. Campbell. 1984.Role of available carbon and nitrogen in determining the rate ofCerling, T.E., D.K Solomon, J. Quade, and J.R. Bowman. 1991. On
the isotopic composition of carbon in soil carbon dioxide. Geochim wheat straw decomposition. Soil Biol. Biochem. 16:459–464.Rochette, P., and D.A. Angers. 1999. Soil surface carbon dioxideCosmochim Acta 55:3403–3405.
Cerri, C., C. Feller, J. Balesdent, R. Victoria, and A. Plenecassagne. fluxes induced by spring, summer, and fall moldboard plowing ina sandy loam. Soil Sci. Soc. Am. J. 63:621–628.1985. Application du tracage isotopique naturel en 13C a l’etude
de la dynamique de la matiere organique dans les sols. Comptes Rochette, P., and E.G. Gregorich. 1998. Dynamics of soil microbialbiomass C, soluble organic C and CO2 evolution after three yearsRendus de l’Academie des Sciences de Paris 300:423–428.
Cheng, W. 1996. Measurement of rhizosphere respiration and organic of manure application. Can. J. Soil Sci. 78:283–290.Rochette, P., R.L. Desjardins, E.G. Gregorich, E. Pattey, and R.matter decomposition using natural 13C. Plant and Soil. 183:
263–268. Lessard. 1992. Soil respiration in barley (Hordeum vulgare L.) andfallow fields. Can. J. Soil Sci. 72:591–603.Dorr, H., and K.O. Munnich. 1980. Carbon-14 and carbon-13 in soil
Rochette, P., R.L. Desjardins, and E. Pattey. 1991. Spatial and tempo-CO2. Radiocarbon 22:909–918.ral variability of soil respiration in agricultural fields. Can. J. SoilEhleringer, J.R., and C.B. Osmond. 1989. Stable isotopes. p. 281–300.Sci. 71:189–196.In R.W. Pearcy et al. (ed.) Plant physiological ecology. Field meth-
Rochette, P., B. Ellert, E.G. Gregorich, R.L. Desjardins, E. Pattey,ods and instrumentation. Chapman & Hall, London.R. Lessard, and B.G. Johnson. 1997. Description of a dynamicFriedli, H., and U. Siegenthaler. 1988. Influence of N2O on isotopeclosed chamber for measuring soil respiration and its comparisonanalyses in CO2 and mass-spectrometric determination of N2O inwith other techniques. Can. J. Soil Sci. 77:195–203.air samples. Tellus 40B:129–133.
Rochette, P., and L.B. Flanagan. 1997. Quantifying rhizosphere respi-Gilmour, J.T., A. Mauromoustakos, P.M. Gale, and R.J. Norman.ration in a corn crop under field conditions. Soil Sci. Soc. Am.1998. Kinetics of crop residue decomposition: Variability amongJ. 61:466–474.crops and years. Soil Sci. Soc. Am. J. 62:750–755.
Rochette, P., L.B. Flanagan, and E.G. Gregorich. 1999. SeparatingGregorich, E.G., C.F. Drury, B.H. Ellert, and B.C. Liang. 1996. Fertil-soil respiration into plant and soil components using analyses of theization effects on physically-protected light fraction organic matter.natural abundance of Carbon-13. Soil Sci. Soc. Am. J. 63:1200–1206.Soil Sci. Soc. Am. J. 60:472–476.(this issue).Gregorich, E.G., P. Rochette, S. McGuire, B.C. Liang, and R. Lessard.
Ryan, M.C., and R. Aravena. 1994. Combining 13C natural abundance1998. Soluble organic carbon dioxide fluxes in maize fields receivingand fumigation-extraction methods to investigate soil microbialspring-applied manure. J. Environ. Qual. 27:209–214.biomass turnover. Soil Biol. Biochem. 26:1583–1585.Hesterberg, R., and U. Siegenthaler, 1991. Production and stable
Santruckova, H., and M. Straskraba. 1991. On the relationship be-isotope composition of CO2 in a soil near Bern, Switzerland. Tel-tween specific respiration activity and microbial biomass in soils.lus 43B:197–205.Soil Biol. Biochem. 23:525–532.Jenkinson, D.S. 1977. Studies on the decomposition of plant material
SAS Institute. 1989. SAS/STAT user’s guide. Version 6. 4th ed. SASin soil. V. The effect of plant cover and soil type on the loss Inst., Cary, NC.of carbon from 14C labelled ryegrass decomposition under field Shields, J.A., and E.A. Paul. 1973. Decomposition of 14C-labelledconditions. J. Soil Sci. 28:424–434. plant material under field conditions. Can. J. Soil Sci. 53:297–306.Jensen, L.S., T. Mueller, J. Magid, and N.E. Nielsen. 1997. Temporal Snedecor, G.W., and W.G. Cochran. 1980. Statistical methods. 7th
variation of C and N mineralization, microbial biomass and extract- ed., Iowa State Univ. Press, Ames.able organic pools in soil after oilseed rape straw incorporation in Topp, G.C., J.L. Davis, W.G. Bailey, and W.D. Zebchuk. 1984. Thethe field. Soil Biol. Biochem. 29:1043–1055. measurement of soil water content using a portable TDR hand
Ladd, J.N., M. Amato, P.R. Grace, and J.A. van Veen. 1995. Simula- probe. Can. J. Soil Sci. 64:313–321.tion of 14C turnover through the microbial biomass in soils incubated Voroney, R.P., E.A. Paul, and D.W. Anderson. 1989. Decompositionwith 14C-labelled plant residues. Soil Biol. Biochem. 27:777–783. of straw and stabilization of microbial products. Can. J. Soil Sci.
Ladd, J.N., J.M. Oades, and M. Amato. 1981. Microbial biomass 69:63–77.formed from 14C, 15N-labelled plant material decomposing in soils Wanniarachni, S.D. 1997. The effects of tillage and cropping on thein the field. Soil Biol. Biochem. 13:119–126. dynamics of soil organic matter as assessed by 13C natural abun-
Lin, G.H., and J.R. Ehlringer. 1997. Carbon isotopic fractionation dance. Ph. D. thesis, University of Guelph, ON, Canada.does not occur during dark respiration in C-3 and C-4. Plant Phys- Witter, E., and S. Dahlin. 1995. Microbial utilization of [U-14C]-iol. 114:391–394. labelled straw and [U-13C]-labelled glucose in soils of contrasting
Mary, B., A. Mariotti, and J.L. Morel. 1992. Use of 13C variations at pH and metal status. Soil Biol. Biochem. 27:1507–1516.natural abundance for studying the biodegradation of root muci- Wu, J., P.C. Brookes, and D.S. Jenkinson. 1993. Formation and de-lage, roots and glucose in soil. Soil Biol. Biochem. 24:1065–1072. struction of microbial biomass during the decomposition of glucose
Nealy, C.L., M.H. Beare, W.C. Hargrove, and D.C. Coleman. 1991. and ryegrass in soil. Soil Biol. Biochem. 25:1435–1441.Relationship between fungal and bacterial substrate-induced respi- Wu, J., R.G. Joergensen, B. Pommerening, R. Chaussod, and P.M.ration, biomass and plant residue decomposition. Soil Biol. Bio- Brookes. 1990. Measurement of soil microbial biomass C by fumiga-chem. 23:947–954. tion-extraction — An automated procedure. Soil Biol. Biochem.
22:1167–1169.Oberlander, H.E., and K. Roth. 1968. Transformation of 14C-labelled