Development of New Solderability Test Fluxes
22
NPL Report MATC(A)122 Development of New Solderability Test Fluxes Alan Brewin, Ling Zou & Christopher Hunt. September 2002
-
Upload
khangminh22 -
Category
Documents
-
view
1 -
download
0
Transcript of Development of New Solderability Test Fluxes

NPL Report MATC(A)122
Development of New Solderability Test Fluxes Alan Brewin, Ling Zou & Christopher Hunt. September 2002


NPL Report MATC(A)122
September 2002
Development of New Solderability Test Fluxes
Alan Brewin, Ling Zou & Christopher Hunt Materials Centre
National Physical Laboratory Teddington, Middlesex
UK. TW11 0LW ABSTRACT The wetting balance test is a well-established method of measuring the solderability of component leads and board finishes. It measures the forces as solder wets the sample under test. Currently a test flux based on a high percentage of rosin with a halide activator is specified in IEC68000 series for use on the sample and solder globule. This flux technology does not represent the wide spread usage of flux formulations based on weak organic acids, which are now used commonly in co-clean and water based fluxes. Hence there is a need to provide new standard test flux formulations that represent these new flux formulations. This report describes the development and validation of two new organic acid based solderability test fluxes. Wetting balance trials were performed on a range of trial formulations with SnPb, Pd and Sn component finishes. SnPb and SnAgCu solder alloys were used. New test flux formulations are proposed which provide good differentiation for aged components, are lead-free compatible, represent alcohol and water based systems, and detect compatibility issues relevant for modern flux users.

NPL Report MACT(A)122
© Crown copyright 2002 Reproduced by permission of the Controller of HMSO
ISSN 1473-2734
National Physical Laboratory Teddington, Middlesex, UK. TW11 0LW
Extracts from this report may be reproduced provided the source is acknowledged and the extract is not taken out of context.
Approved on behalf of Managing Director, NPL, by Dr C Lea, Head, Materials Centre
NPL Report MATC(A)122
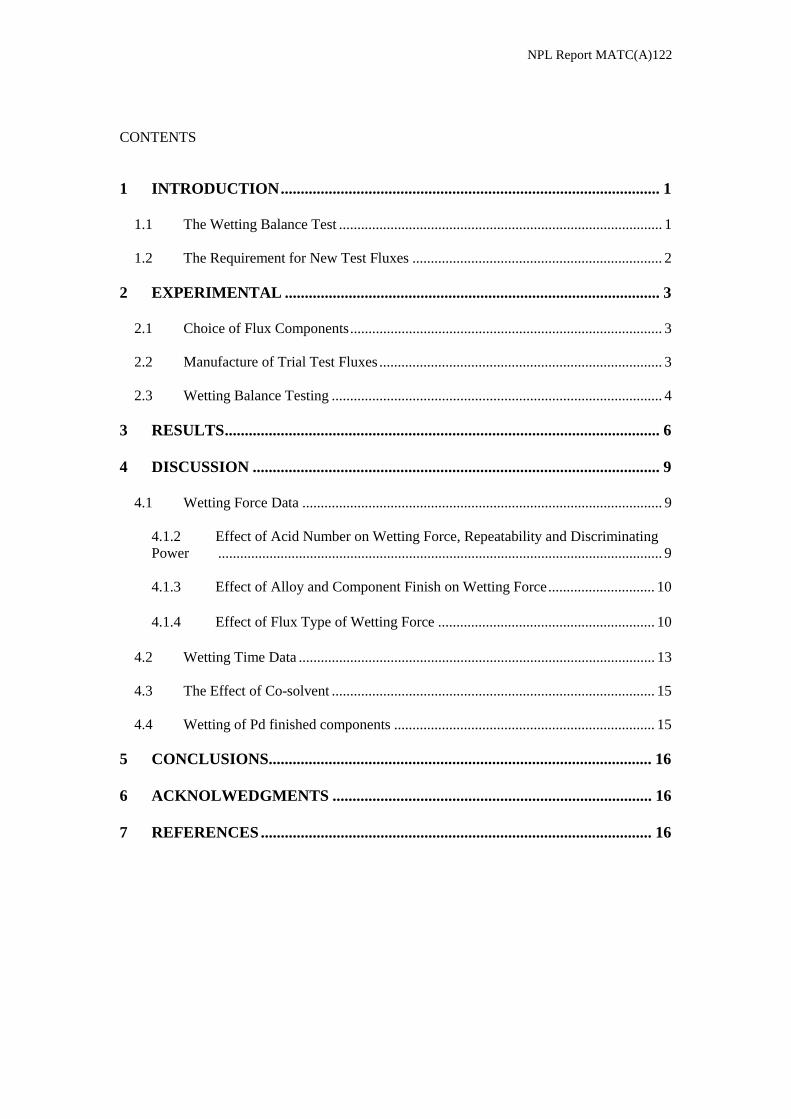
CONTENTS
1 INTRODUCTION............................................................................................... 1
1.1 The Wetting Balance Test ........................................................................................ 1
1.2 The Requirement for New Test Fluxes .................................................................... 2
2 EXPERIMENTAL .............................................................................................. 3
2.1 Choice of Flux Components..................................................................................... 3
2.2 Manufacture of Trial Test Fluxes ............................................................................. 3
2.3 Wetting Balance Testing .......................................................................................... 4
3 RESULTS............................................................................................................. 6 4 DISCUSSION ...................................................................................................... 9
4.1 Wetting Force Data .................................................................................................. 9
4.1.2 Effect of Acid Number on Wetting Force, Repeatability and Discriminating Power ......................................................................................................................... 9
4.1.3 Effect of Alloy and Component Finish on Wetting Force............................. 10
4.1.4 Effect of Flux Type of Wetting Force ........................................................... 10
4.2 Wetting Time Data ................................................................................................. 13
4.3 The Effect of Co-solvent ........................................................................................ 15
4.4 Wetting of Pd finished components ....................................................................... 15
5 CONCLUSIONS................................................................................................ 16 6 ACKNOLWEDGMENTS ................................................................................ 16 7 REFERENCES.................................................................................................. 16


NPL Report MATC(A)122
1
1 INTRODUCTION
1.1 The Wetting Balance Test Using molten solder either in bath or a globule. In this work we have used the globle mode, as this is more applicable from an instrument point of view, and the globule can be used on a greater range of components. Solderability testing can be performed on solder pads or component leads. A wetting balance is used to measure the forces involved when a globule of molten solder wets the sample surface. This gives a measure of the quality of the surface in terms of the ability of solder to wet it. Two values are normally quoted, peak wetting force, and wetting time (defined as the time to 2/3rds of the final wetting force). A simple schematic is shown in Figure 1 that outlines the key components in the instrument design. In Figure 2 the wetting response is illustrated, in terms of the sample position during the test and the idealised wetting response with various sample positions annotated.
Figure 1. Schematic of wetting balance system
Figure 2. Schematic of a typical wetting balance test
Common applications for the test are as a quality assessment tool for component batches, assessing near end date component batches for suitability for use in production, and performance ranking of lead plating, solderable surface finishes, fluxes and alloys. The wetting balance test is well established and NPL have already enhanced the method to account for sample geometry [1]. It is a tool widely used in research and industry alike.
NPL Report MATC(A) 122
2
1.2 The Requirement for New Test Fluxes During the test procedure a flux must be applied to the component lead and solder globule. The standard test flux is based upon an alcohol carrier solvent with a high solids content of rosin (25%) and 0.5% halide activator. There are three levels of activator identified in IEC68000-2-20, but the globule the 0.5% activated flux is recommended in IEC68000-2-69. This flux technology has not been representative of the vast majority of flux and paste formulations used in production for several years. This has driven an increasing trend for users to specify their own current flux for use in the test. While this is valid for in house testing, comparison between test sites is no longer generally applicable with different fluxes being used. Therefore this trend away from the standard flux introduces problems when comparing data, and there is a need to introduce a new standard test flux, or fluxes, which represent modern flux chemistry and can be agreed by the whole industry. This report outlines work to achieve this, and makes recommendations for new test fluxes. The requirements for a new solderability test flux are as follows:
• It must represent the current industrial flux technology ��Acid No. range 15-45 ��The main activators should be a mixture of carboxylic acids (‘no-clean’) ��Alcohol and Water based versions
• It must be Lead-free compatible ��Active and stable at SnAgCu superheat temperatures
• It must be able to maintain an oxide free surface on the solder globule ��Repeatable results, no degradation through a sequence of tests
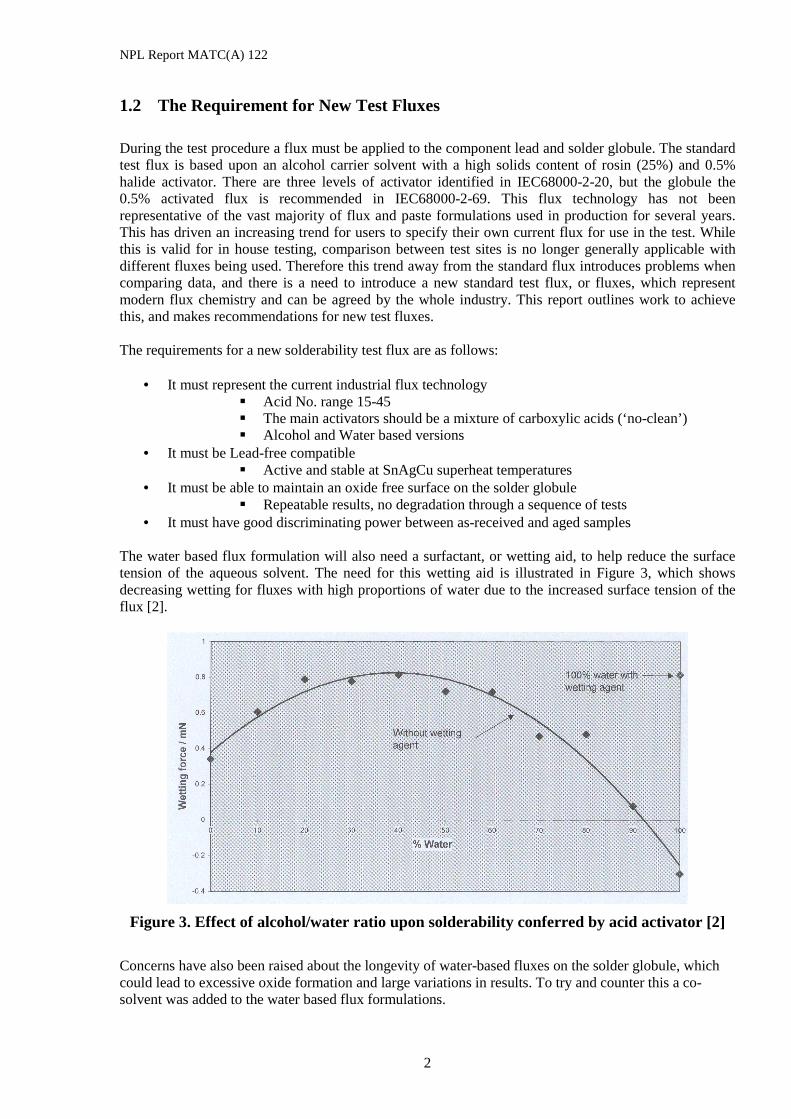
• It must have good discriminating power between as-received and aged samples The water based flux formulation will also need a surfactant, or wetting aid, to help reduce the surface tension of the aqueous solvent. The need for this wetting aid is illustrated in Figure 3, which shows decreasing wetting for fluxes with high proportions of water due to the increased surface tension of the flux [2].
Figure 3. Effect of alcohol/water ratio upon solderability conferred by acid activator [2]
Concerns have also been raised about the longevity of water-based fluxes on the solder globule, which could lead to excessive oxide formation and large variations in results. To try and counter this a co-solvent was added to the water based flux formulations.

NPL Report MATC(A)122
3
2 EXPERIMENTAL
2.1 Choice of Flux Components NPL consulted widely with industry, and specifically with flux manufacturers, to formulate appropriate starting points for the development of the fluxes. The following organic carboxylic acids were identified as generic representative constituents of modern soldering fluxes. They have a range of boiling points to facilitate gradual loss of material during heating. Synonyms: Hexanedioic acid; Adipic acid Molecular Formula: C6H10O4 Formula Weight: 146.14 Registry number: 124-04-9 Boiling point: 265 °C Synonyms: 1,5-Pentanedioic acid; Glutaric acid Molecular Formula: C5H8O4 Formula Weight: 132.11 Registry number: 110-94-1 Boiling point: 302 °C Synonyms: Butanedioic acid; Succinic acid Molecular Formula: C4H6O4 Formula Weight: 118.08 Registry number: 110-15-6 Boiling point: 235 °C De-ionised water was used for water-based fluxes, and IPA was used for solvent based fluxes. The surfactant used is an alcohol ethoxylate (CAS no 68131-39-5) and the co-solvent is a glycol ester (CAS no 34590-94-8).
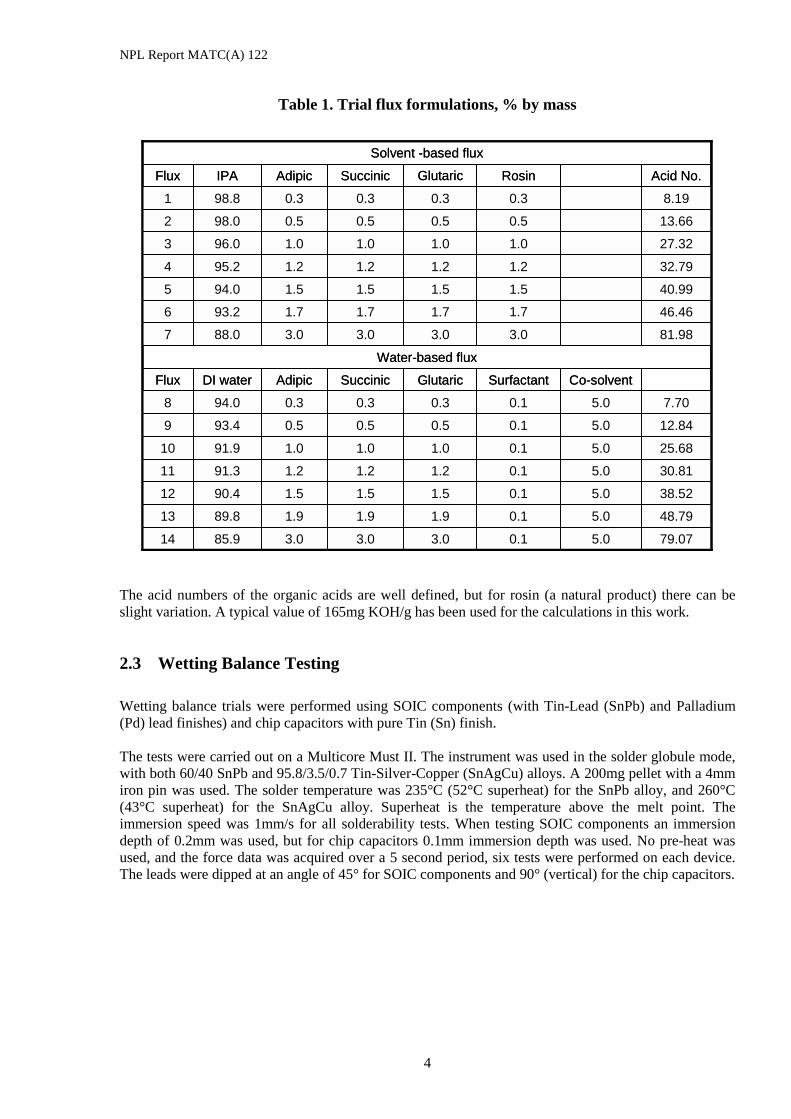
2.2 Manufacture of Trial Test Fluxes Trial fluxes were prepared with the formulations detailed in Table 1. In all cases the three acids were added in a 1:1:1 ration. The fluxes were prepared by mixing in a conical flask; no heating or ultrasonic agitation was required to facilitate dissolution of the components. The fluxes highlighted in yellow are alcohol (propan-2-ol IPA) based; those in blue are water based. The Acid Number of a flux (a widely used industry benchmark) is defined as the amount of potassium hydroxide (KOH) needed to neutralise 1g of flux, normally given in the units of mgKOH/g. Those fluxes within the current typical industrial acid number range for fluxes are in white in the ‘Acid No.’ column of Table 1. Generally a flux with a higher Acid Number is a stronger flux, more capable of removing oxide and improving wetting.
NPL Report MATC(A) 122
4
Table 1. Trial flux formulations, % by mass
Water-based flux
Solvent -based flux
46.461.71.71.71.793.26
48.795.00.11.91.91.989.813
79.075.00.13.03.03.085.914
38.525.00.11.51.51.590.41230.815.00.11.21.21.291.31125.685.00.11.01.01.091.910
12.845.00.10.50.50.593.497.705.00.10.30.30.394.08
Co-solventSurfactantGlutaricSuccinicAdipicDI waterFlux
81.983.03.03.03.088.07
40.991.51.51.51.594.0532.791.21.21.21.295.24
27.321.01.01.01.096.0313.660.50.50.50.598.028.190.30.30.30.398.81
Acid No.RosinGlutaricSuccinicAdipicIPAFlux
The acid numbers of the organic acids are well defined, but for rosin (a natural product) there can be slight variation. A typical value of 165mg KOH/g has been used for the calculations in this work.
2.3 Wetting Balance Testing Wetting balance trials were performed using SOIC components (with Tin-Lead (SnPb) and Palladium (Pd) lead finishes) and chip capacitors with pure Tin (Sn) finish. The tests were carried out on a Multicore Must II. The instrument was used in the solder globule mode, with both 60/40 SnPb and 95.8/3.5/0.7 Tin-Silver-Copper (SnAgCu) alloys. A 200mg pellet with a 4mm iron pin was used. The solder temperature was 235°C (52°C superheat) for the SnPb alloy, and 260°C (43°C superheat) for the SnAgCu alloy. Superheat is the temperature above the melt point. The immersion speed was 1mm/s for all solderability tests. When testing SOIC components an immersion depth of 0.2mm was used, but for chip capacitors 0.1mm immersion depth was used. No pre-heat was used, and the force data was acquired over a 5 second period, six tests were performed on each device. The leads were dipped at an angle of 45° for SOIC components and 90° (vertical) for the chip capacitors.
NPL Report MATC(A)122
5
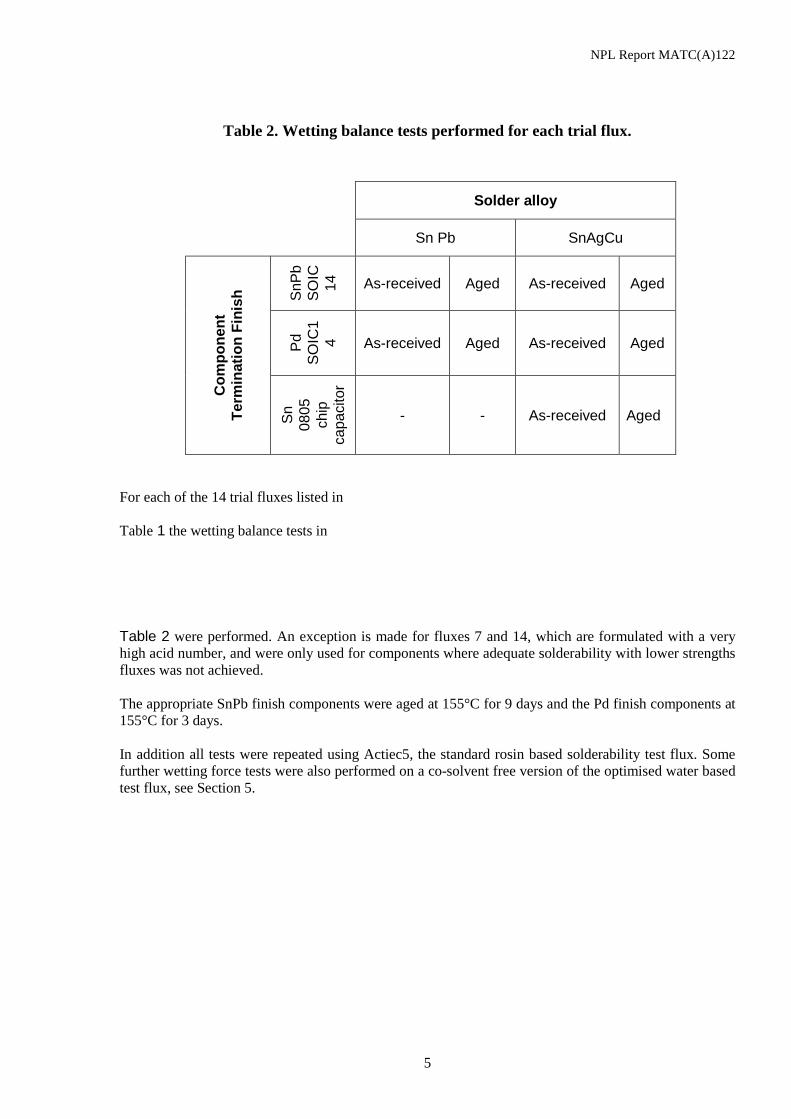
Table 2. Wetting balance tests performed for each trial flux.
Solder alloy
Sn Pb SnAgCu
SnPb
SO
IC14
As-received Aged As-received Aged Pd
SO
IC1
4 As-received Aged As-received Aged
Com
pone
nt
Term
inat
ion
Fini
sh
Sn
0805
ch
ip
capa
cito
r
- - As-received Aged
For each of the 14 trial fluxes listed in Table 1 the wetting balance tests in Table 2 were performed. An exception is made for fluxes 7 and 14, which are formulated with a very high acid number, and were only used for components where adequate solderability with lower strengths fluxes was not achieved. The appropriate SnPb finish components were aged at 155°C for 9 days and the Pd finish components at 155°C for 3 days. In addition all tests were repeated using Actiec5, the standard rosin based solderability test flux. Some further wetting force tests were also performed on a co-solvent free version of the optimised water based test flux, see Section 5.

NPL Report MATC(A) 122
6
3 RESULTS The results in Table 3 thorough to Table 6 are the average of 6 wetting tests performed on leads of the same component. The standard deviation given is for these 6 results.
Table 3. Wetting force and time for SnPb finish SOICs and SnPb alloy
Flux Force St.Dev. Time St.Dev. Force St.Dev. Time St.Dev.1 0.24 0.19 1.37 2.11 0.18 0.13 1.17 1.752 0.41 0.04 0.19 0.11 0.11 0.12 1.44 1.513 0.43 0.03 0.16 0.01 0.29 0.07 0.16 0.014 0.44 0.02 0.15 0.01 0.32 0.04 0.15 0.035 0.46 0.01 0.16 0.01 0.33 0.05 0.21 0.076 0.46 0.01 0.16 0.01 0.32 0.04 0.16 0.047
8 0.13 0.14 1.57 1.63 -0.03 0.11 3.9 1.79 0.36 0.02 0.17 0.04 0.21 0.22 1.87 1.5610 0.43 0.03 0.16 0.02 0.23 0.09 0.89 0.7411 0.44 0.02 0.16 0.02 0.34 0.04 0.3 0.2512 0.48 0.01 0.16 0.01 0.34 0.05 0.33 0.1413 0.48 0.02 0.17 0.01 0.35 0.04 0.31 0.1414
Acitec 5 0.42 0.01 0.18 0.01 0.31 0.01 0.22 0.03
As Received Components Aged Components
Table 4. Wetting force and time for SnPb finish SOICs and SnAgCu alloy
Flux Force St.Dev. Time St.Dev. Force St.Dev. Time St.Dev.1 0.17 0.28 2.62 2.4 0.08 0.04 4.2 1.062 0.46 0.05 0.15 0.02 0.08 0.14 2.15 2.063 0.49 0.03 0.15 0.02 0.23 0.17 1.35 1.744 0.51 0.02 0.14 0.01 0.26 0.18 1.28 1.835 0.53 0.01 0.15 0 0.32 0.05 0.23 0.126 0.54 0.01 0.15 0.01 0.44 0.04 0.21 0.047
8 -0.06 0.05 4.2 1.7 -0.07 0.07 3.51 2.159 0.49 0.06 0.18 0.06 0.22 0.13 1.2 1.71
10 0.5 0.03 0.15 0.02 0.34 0.11 0.63 0.7811 0.52 0.02 0.14 0.01 0.42 0.06 0.19 0.0412 0.54 0.02 0.15 0 0.42 0.04 0.16 0.0213 0.56 0.01 0.15 0 0.48 0.02 0.17 0.0214
Acitec 5 0.52 0.01 0.16 0.01 0.38 0.06 0.2 0.06
As Received Components Aged Components

NPL Report MATC(A)122
7
Table 5. Wetting force and time for Pd finish SOICs and SnPb alloy
Flux Force St.Dev. Time St.Dev. Force St.Dev. Time St.Dev.1 0.25 0.08 0.37 0.08 0.04 0.16 2.43 2.12 0.21 0.07 0.39 0.07 0.03 0.07 2.56 1.83 0.39 0.05 0.22 0.07 0.11 0.07 1.08 1.314 0.42 0.04 0.19 0.05 0.24 0.08 0.48 0.315 0.49 0.02 0.2 0.04 0.28 0.1 0.34 0.276 0.49 0.02 0.19 0.04 0.34 0.04 0.21 0.0478 -0.05 0.06 4.39 1.43 0.01 0.17 3.6 2.039 0.28 0.17 0.8 0.61 0.16 0.13 1.58 1.56
10 0.47 0.07 0.37 0.16 0.26 0.11 0.6 0.2911 0.47 0.04 0.22 0.08 0.39 0.08 0.39 0.0612 0.47 0.04 0.23 0.05 0.41 0.04 0.29 0.3113 0.47 0.03 0.16 0.02 0.45 0.03 0.24 0.114
Acitec 5 0.49 0.03 0.22 0.05 0.45 0.04 0.34 0.14
As Received Components Aged Components
Table 6. Wetting force and time for Pd finish SOICs and SnAgCu alloy
Flux Force St.Dev. Time St.Dev. Force St.Dev. Time St.Dev.1 -0.17 0.05 5 0 -0.22 0.04 5 02 -0.06 0.07 2.14 2.09 -0.22 0.02 5 03 0.1 0.03 0.41 0.02 -0.13 0.03 5 04 0.18 0.04 0.38 0.04 -0.02 0.09 3.47 2.195 0.26 0.03 0.35 0.03 0.04 0.03 0.38 0.036 0.34 0.05 0.31 0.04 0.14 0.05 0.45 0.037 0.31 0.06 0.24 0.06 0.24 0.06 0.31 0.08
8 -0.03 0.11 3.9 2.14 -0.28 0.06 5 09 -0.02 0.17 3.5 2.14 -0.08 0.18 2.05 2.05
10 0.07 0.22 1.94 2.18 0.11 0.16 1.94 2.111 0.1 0.19 1.4 1.4 0.03 0.09 1.88 2.2212 0.29 0.09 0.41 0.13 0.19 0.17 0.51 0.0513 0.34 0.07 0.38 0.08 0.25 0.05 0.34 0.0314 0.37 0.06 0.21 0.05 0.41 0.05 0.27 0.03
Acitec 5 0.47 0.02 0.21 0.06 0.35 0.14 0.42 0.14
As Received Components Aged Components
Table 7. Wetting force and time for pure Sn finish chip capacitors and SnAgCu alloy
Flux Force St.Dev. Time St.Dev. Force St.Dev. Time St.Dev.1 0.11 0.11 2.4 1.63 0 0.2 2.7 2.332 0.2 0.06 1.02 0.14 -0.25 0.1 5 03 0.6 0.33 0.55 0.41 0.18 0.56 2.74 2.334 0.81 0.27 0.27 0.01 0.27 0.15 1.51 1.085 0.73 0.04 0.15 0.02 0.62 0.17 0.82 0.36 0.71 0.02 0.15 0.01 0.6 0.04 0.33 0.117
8 0.07 0.6 3.45 2.24 -0.35 0.04 5 09 0.35 0.53 1.89 2.22 -0.21 0.07 5 0
10 0.76 0.38 0.06 0.12 -0.1 0.34 3.53 2.111 0.77 0.29 0.06 0.03 0.54 0.56 1.73 1.912 0.78 0.01 0.16 0.01 0.68 0.1 0.25 0.0213 0.76 0 0.15 0.01 0.68 0.02 0.22 0.0814
Acitec 5 0.7 0.04 0.19 0.02 0.6 0.11 0.28 0.11
As Received Components Aged Components

NPL Report MATC(A) 122
8
Table 8. Wetting balance data for co-solvent/no co-solvent comparison
Pd fresh (SnPb) Pd aged (SnPb) Pd fresh (SnPb) Pd aged (SnPb)
Co-solvent 0.47±0.04 0.41±0.04 0.23±0.05 0.29±0.30No Co-solvent 0.46±0.04 0.42±0.06 0.19±0.05 0.24±0.08
Pd fresh (SnAgCu)
Pd aged (SnAgCu)
Pd fresh (SnAgCu)
Pd aged (SnAgCu)
Co-solvent 0.29±0.09 0.19±0.17 0.41±0.13 0.50±0.05No Co-solvent 0.33±0.12 0.26±0.07 0.40±0.08 0.38±0.03
SnPb fresh (SnPb)
SnPb aged (SnPb)
SnPb fresh (SnPb)
SnPb aged (SnPb)
Co-solvent 0.48±0.01 0.34±0.05 0.16±0.01 0.33±0.14No Co-solvent 0.46±0.02 0.28±0.06 0.18±0.02 0.26±0.06
SnPb fresh (SnAgCu)
SnPb aged (SnAgCu)
SnPb fresh (SnAgCu)
SnPb aged (SnAgCu)
Co-solvent 0.54±0.02 0.42±0.04 0.15±0.00 0.16±0.04No Co-solvent 0.51±0.01 0.41±0.05 0.15±0.01 0.21±0.03
Wetting Force Wetting Time
Results for additional trials for the investigation of the effect of co-solvent in the water-based flux are given in Table 8.

NPL Report MATC(A)122
9
4 DISCUSSION The requirement of the test flux to provide good differentiation means that the acid no. of the flux must not be too high. If this were so all components, as received and aged, may solder well when tested. If the flux is too weak, however, then even as-received and adequately prepared components may fail, producing poor wetting.
4.1 Wetting Force Data
4.1.2 Effect of Acid Number on Wetting Force, Repeatability and Discriminating Power To examine the effect of flux strength on wetting, wetting force is plotted against Acid No, as in Figure 4. For as-received components the flux should be strong enough to allow efficient wetting without having superfluous activator, which might reduce discriminating ability. This optimum acid number is shown by the red dot in Figure 4.
0
0.2
0.4
0.6
0 20 40 60
Flux acid No
Wet
ting
forc
e (m
N)
Optimum acid number
Figure 4. Schematic of the effect of flux strength on wetting
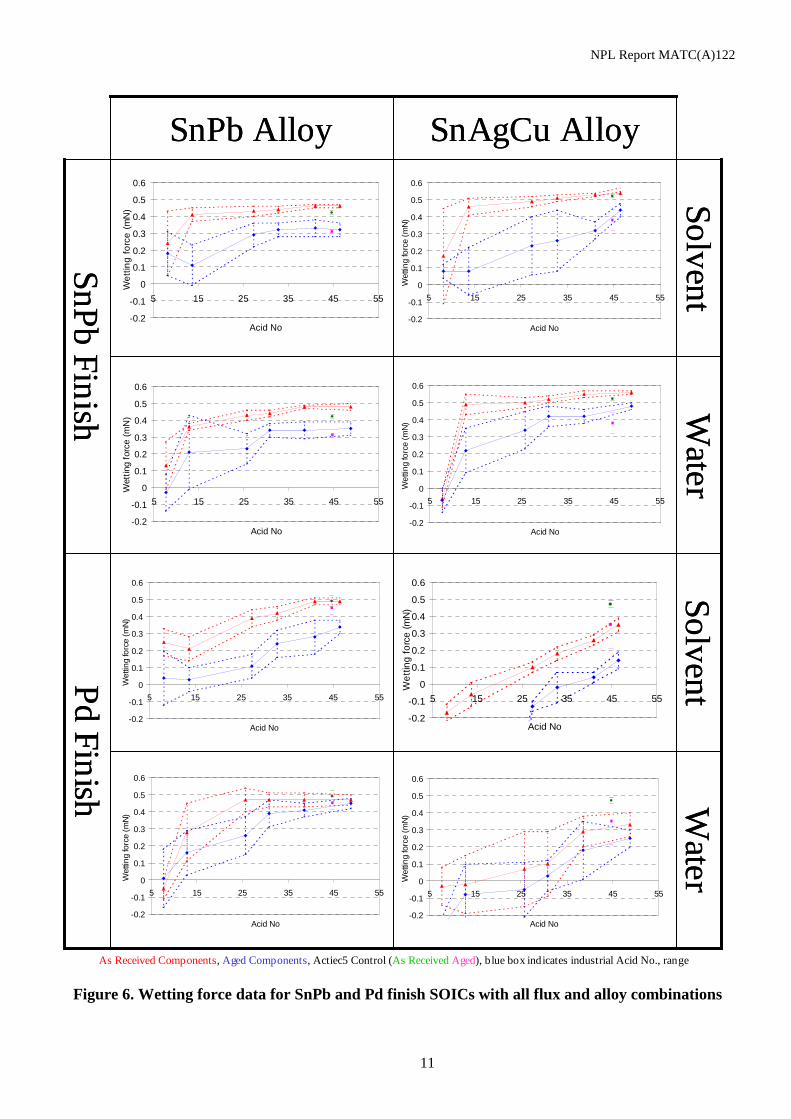
The results when displayed in this way show an increasing wetting force with increasing acid number, an example from the data is given in Figure 5. The red line represents as-received components, blue aged components, and the standard deviation is also shown with the broken lines. The green and purple dots represent the control tests performed with Actiec5 for as received and aged components. The trend that wetting force and repeatability increase with acid number is evident in all the trials performed (see Figure 6). The standard deviation in results is generally higher for aged components. The acid number cannot be too high as the discriminating power of the flux is reduced. This is demonstrated by the convergence of the results for the as-received and aged components for higher strength fluxes.

NPL Report MATC(A) 122
10
-0.2
-0.1
0
0.1
0.2
0.3
0.4
0.5
0.6
5 15 25 35 45 55
Acid No
Wet
ting
forc
e (m
N)
As-recieved
Aged
Figure 5. Wetting forces for SnPb finish components in the as received and aged
condition, for SnPb solder alloy and solvent based flux
4.1.3 Effect of Alloy and Component Finish on Wetting Force
One might expect a poorer wetting performance for the SAC alloy due to the lower superheat of the test, and the inherently lower surface tension. Nevertheless for the SnPb finish components, wetting forces were quite consistent for both the lead containing and lead-free alloys. The Pd finish, as seen in Figure 6, showed a slightly reduced performance with the lower activity fluxes used with SnPb alloy. The results with the SAC alloy were drastically reduced, however. There is a definite reduction is wetting performance for the SAC/Pd combination, see also Section 4.1.4. The absolute forces measured with the pure Sn finish chip capacitors cannot be directly compared with the forces from the SOIC components. The data is valuable to demonstrate that the same trends are evident and applicable for these components, and the weak organic acid fluxes are suitable for pure Sn finish components used with the lead-free solder.
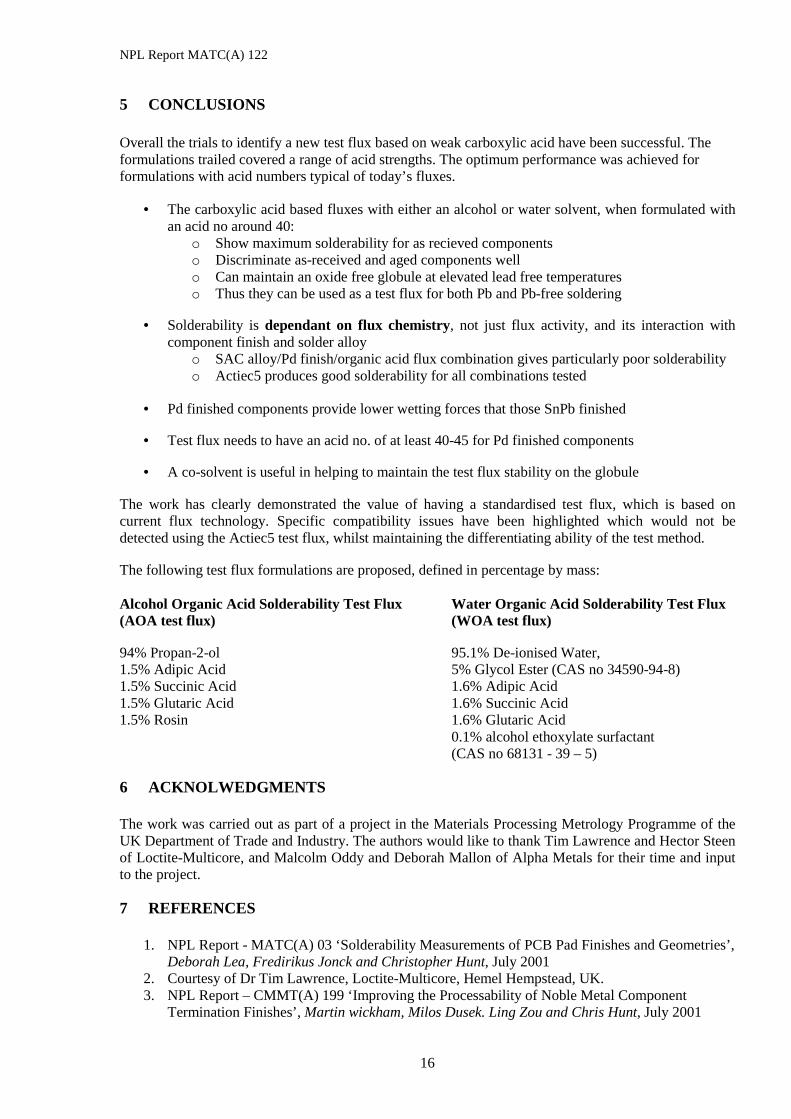
4.1.4 Effect of Flux Type of Wetting Force For the carboxylic acid based fluxes the dissociation of the acids into their ionic active form will be much greater in the water-based versions. This has translated into a slight increase in wetting forces for an aqueous based flux compared to an alcohol flux with the same acid number (Figure 6). Important differences are seen between the carboxylic acid based fluxes and the high content rosin Actiec5, however. For Pd components soldered with lead-free alloy the trial fluxes could not produce high wetting forces at strength of 40-50 mgKOH/g. In fact the acid number of the ‘no-clean’ style carboxylic acid fluxes was increased to 80mgKOH/g to try and promote wetting but still the levels could not be achieved, as with Actiec5. In contrast the rosin and halide based Actiec5 produced high wetting forces at an activity level of 45mgKOH/g (Figure 8 and Figure 9).
NPL Report MATC(A)122
11
Water
SolventPd Finish
Water
Solvent
SnPb Finish
SnAgCu AlloySnPb AlloyW
aterSolventPd Finish
Water
Solvent
SnPb Finish
SnAgCu AlloySnPb Alloy
As Received Components, Aged Components, Actiec5 Control (As Received Aged), blue box indicates industrial Acid No., range
-0.2
-0.1
0
0.1
0.2
0.3
0.4
0.5
0.6
5 15 25 35 45 55
Acid No
Wet
ting
forc
e (m
N)
-0.2
-0.1
0
0.1
0.2
0.3
0.4
0.5
0.6
5 15 25 35 45 55
Acid No
Wet
ting
forc
e (m
N)
-0.2
-0.1
0
0.1
0.2
0.3
0.4
0.5
0.6
5 15 25 35 45 55
Acid No
Wet
ting
forc
e (m
N)
-0.2
-0.1
0
0.1
0.2
0.3
0.4
0.5
0.6
5 15 25 35 45 55
Acid No
Wet
ting
forc
e (m
N)
-0.2
-0.1
0
0.1
0.2
0.3
0.4
0.5
0.6
5 15 25 35 45 55
Acid No
Wet
ting
forc
e (m
N)
-0.2
-0.1
0
0.1
0.2
0.3
0.4
0.5
0.6
5 15 25 35 45 55
Acid No
Wet
ting
forc
e (m
N)
-0.2
-0.1
0
0.1
0.2
0.3
0.4
0.5
0.6
5 15 25 35 45 55
Acid No
Wet
ting
forc
e (m
N)
-0.2
-0.1
0
0.1
0.2
0.3
0.4
0.5
0.6
5 15 25 35 45 55
Acid No
Wet
ting
forc
e (m
N)
Figure 6. Wetting force data for SnPb and Pd finish SOICs with all flux and alloy combinations
NPL Report MATC(A) 122
12
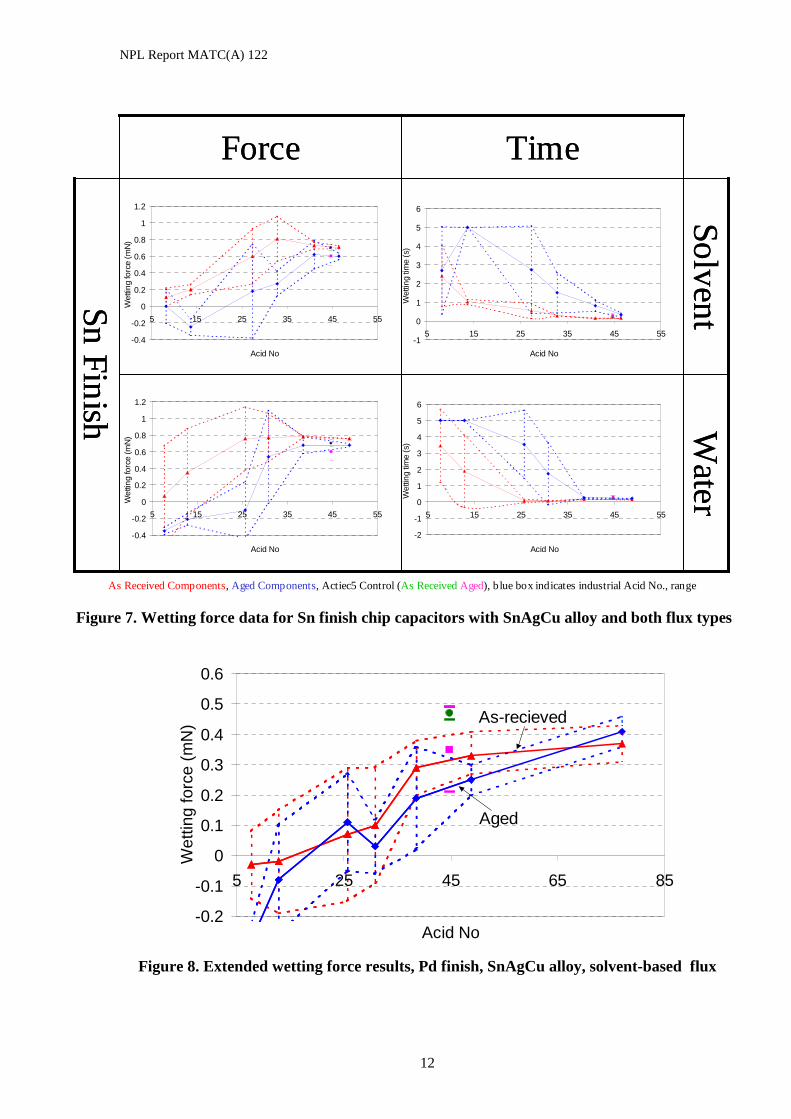
W
aterSolventSn
Finish
TimeForce
Water
SolventSnFinish
TimeForce
As Received Components, Aged Components, Actiec5 Control (As Received Aged), blue box indicates industrial Acid No., range
-0.4
-0.2
0
0.2
0.4
0.6
0.8
1
1.2
5 15 25 35 45 55
Acid No
Wet
ting
forc
e (m
N)
-0.4
-0.2
0
0.2
0.4
0.6
0.8
1
1.2
5 15 25 35 45 55
Acid No
Wet
ting
forc
e (m
N)
-1
0
1
2
3
4
5
6
5 15 25 35 45 55
Acid No
Wet
ting
time
(s)
-2
-1
0
1
2
3
4
5
6
5 15 25 35 45 55
Acid No
Wet
ting
time
(s)
Figure 7. Wetting force data for Sn finish chip capacitors with SnAgCu alloy and both flux types
-0.2
-0.1
0
0.1
0.2
0.3
0.4
0.5
0.6
5 25 45 65 85
Acid No
Wet
ting
forc
e (m
N) As-recieved
Aged
Figure 8. Extended wetting force results, Pd finish, SnAgCu alloy, solvent-based flux

NPL Report MATC(A)122
13
-0.2
-0.1
0
0.1
0.2
0.3
0.4
0.5
0.6
5 25 45 65 85
Acid No
Wet
ting
forc
e (m
N)
Aged
As-recieved
Figure 9. Extended wetting force results, Pd finish, SnAgCu alloy, water-based flux
The repeatability in these results is very good suggesting that the reduced solderability is not due to any oxide build-up on the globule (also all tests with organic acid flux would then be affected by this mechanism). With the SAC/Pd/organic acid flux combination, even at acid numbers as high as 80, the wetting is lower than for Actiec5. This is an important result showing that the chemistry of a flux is important, as well as strength, and that there are compatibility issues between flux, alloy and component finish. The Acitiec5 did not show these effects. For a user intending to use these Pd components in their lead-free process with organic acid based flux these results highlight this important concern.
4.2 Wetting Time Data The force-time curves can be translated into wetting time data, where wetting time is defined as the time taken to reach two thirds of the peak wetting force. However, this has proven to be less sensitive to changes in solderability than using the peak wetting force value itself. Moderate reductions in solderability do not produce significant changes in wetting times which remain very quick. Only in cases where solderability is very poor does wetting time begin to increase. The data show the poor differentiating ability of the test method when wetting time is used (convergence of the lines representing as-received and aged components). For completeness the wetting time data is plotted in Figure 10, however the wetting force provides much better differentiation.

NPL Report MATC(A) 122
14
W
aterSolventPd Finish
Water
Solvent
SnPb Finish
SnAgCu AlloySnPb Alloy
Water
SolventPd Finish
Water
Solvent
SnPb Finish
SnAgCu AlloySnPb Alloy
As Received Components, Aged Components, Actiec5 Control (As Received Aged), blue box indicates industrial Acid No., range
-1
0
1
2
3
4
5
6
5 15 25 35 45 55
Acid No
Wet
ting
time
(s)
-1
0
1
2
3
4
5
6
5 15 25 35 45 55
Acid No
Wet
ting
time
(s)
-1
0
1
2
3
4
5
6
5 15 25 35 45 55
Acid No
Wet
ting
time
(s)
-1
0
1
2
3
4
5
6
5 15 25 35 45 55
Acid No
Wet
ting
time
(s)
-1
0
1
2
3
4
5
6
5 15 25 35 45 55
Acid No
Wet
ting
time
(s)
-1
0
1
2
3
4
5
6
5 15 25 35 45 55
Acid No
Wet
ting
time
(s)
-1
0
1
2
3
4
5
6
5 15 25 35 45 55
Acid No.
Wet
ting
time
(s)
-1
0
1
2
3
4
5
6
5 15 25 35 45 55
Acid No.
Wet
ting
time
(s)
Figure 10. Wetting time data for SnPb and Pd finish SOICs with all flux and alloy combinations

NPL Report MATC(A)122
15
4.3 The Effect of Co-solvent The longevity of the water based flux materials on the solder globule was not seen to be an issue in wetting balance trials. In order for any proposed water based test flux formulation to be as simple as possible additional trials were performed to determine if the co-solvent was actually necessary. Figure 11 shows a comparison of wetting forces measured using the water-based flux formulation No12, with and without the co-solvent component. The data shows no clear effect for the co-solvent, and suggests it is not necessary in a test flux formulation.
0.00
0.10
0.20
0.30
0.40
0.50
0.60
0.70
0.80
1 2 3 4 5 6 7 8
Wet
ting
Forc
e (m
N)
Co-solvent
No Co-solvent
Sample Finish Alloy Age1 Pd SnPb Fresh2 Pd SAC Fresh3 SnPb SnPb Fresh4 SnPb SAC Fresh5 Pd SnPb Aged6 Pd SAC Aged7 SnPb SnPb Aged8 SnPb SAC Aged
Figure 11. Comparison of wetting forces data with and without co-solvent (optimised
water based flux) Although the wetting force results do not show any clear effect of the co-solvent, it was observed that the presence of the co-solvent increased the time the flux remained active on the globule (from 30 seconds to 60 seconds approximately). This is important when devices with multiple terminations are being tested. Hence the recommendation is that the co-solvent be included in the formulation.
4.4 Wetting of Pd finished components These data highlight a potential for the future, where a flux based on weak carboxylic acids using a lead free solder will exhibit poor solderability. The results with SnPb solder show acceptable wetting with fluxes, and representative of today’s soldering. Hence, this finish, which is already know to exhibit poor spreading, will be even worse with lead-free solder. Earlier studies looking at various Pd-Au finishes support these conclusions [3], and there the low solderability of Pd in lead-free alloys was discussed. The lower efficiency of the WOA flux is likely due to its lower boiling point to the rosin, and the weaker concentration in the flux. Hence at wetting front, which progresses slowly due to dissolution control, the WOA expires prematurely compared to the resin flux.
NPL Report MATC(A) 122
16
5 CONCLUSIONS Overall the trials to identify a new test flux based on weak carboxylic acid have been successful. The formulations trailed covered a range of acid strengths. The optimum performance was achieved for formulations with acid numbers typical of today’s fluxes.
• The carboxylic acid based fluxes with either an alcohol or water solvent, when formulated with an acid no around 40:
o Show maximum solderability for as recieved components o Discriminate as-received and aged components well o Can maintain an oxide free globule at elevated lead free temperatures o Thus they can be used as a test flux for both Pb and Pb-free soldering
• Solderability is dependant on flux chemistry, not just flux activity, and its interaction with component finish and solder alloy
o SAC alloy/Pd finish/organic acid flux combination gives particularly poor solderability o Actiec5 produces good solderability for all combinations tested
• Pd finished components provide lower wetting forces that those SnPb finished • Test flux needs to have an acid no. of at least 40-45 for Pd finished components
• A co-solvent is useful in helping to maintain the test flux stability on the globule
The work has clearly demonstrated the value of having a standardised test flux, which is based on current flux technology. Specific compatibility issues have been highlighted which would not be detected using the Actiec5 test flux, whilst maintaining the differentiating ability of the test method. The following test flux formulations are proposed, defined in percentage by mass: Alcohol Organic Acid Solderability Test Flux (AOA test flux) 94% Propan-2-ol 1.5% Adipic Acid 1.5% Succinic Acid 1.5% Glutaric Acid 1.5% Rosin
Water Organic Acid Solderability Test Flux (WOA test flux) 95.1% De-ionised Water, 5% Glycol Ester (CAS no 34590-94-8) 1.6% Adipic Acid 1.6% Succinic Acid 1.6% Glutaric Acid 0.1% alcohol ethoxylate surfactant (CAS no 68131 - 39 – 5)
6 ACKNOLWEDGMENTS The work was carried out as part of a project in the Materials Processing Metrology Programme of the UK Department of Trade and Industry. The authors would like to thank Tim Lawrence and Hector Steen of Loctite-Multicore, and Malcolm Oddy and Deborah Mallon of Alpha Metals for their time and input to the project.
7 REFERENCES
1. NPL Report - MATC(A) 03 ‘Solderability Measurements of PCB Pad Finishes and Geometries’, Deborah Lea, Fredirikus Jonck and Christopher Hunt, July 2001
2. Courtesy of Dr Tim Lawrence, Loctite-Multicore, Hemel Hempstead, UK. 3. NPL Report – CMMT(A) 199 ‘Improving the Processability of Noble Metal Component
Termination Finishes’, Martin wickham, Milos Dusek. Ling Zou and Chris Hunt, July 2001