Test, demonstration and further development of the ARP ...
60
Test, demonstration and further development of the ARP process in China Environmental Project No. 1555, 2014
-
Upload
khangminh22 -
Category
Documents
-
view
3 -
download
0
Transcript of Test, demonstration and further development of the ARP ...
Test, demonstration and further development of the ARP process in China Environmental Project No. 1555, 2014
2 Test, demonstration and further development of the ARP process in China
Title:
Test, demonstration and further development of the ARP process in China
Editing:
Mette Risum Mikkelsen, Envidan A/S Jeanette Agertved Madsen, Envidan A/S
Published by:
The Danish Environmental Protection Agency Strandgade 29 1401 Copenhagen K Denmark www.mst.dk/english
Year:
2014
ISBN no.
978-87-93178-25-0
Disclaimer:
When the occasion arises, the Danish Environmental Protection Agency will publish reports and papers concerning research and development projects within the environmental sector, financed by study grants provided by the Danish Environmental Protection Agency. It should be noted that such publications do not necessarily reflect the position or opinion of the Danish Environmental Protection Agency. However, publication does indicate that, in the opinion of the Danish Environmental Protection Agency, the content represents an important contribution to the debate surrounding Danish environmental policy. Sources must be acknowledged.
Test, demonstration and further development of the ARP process in China 3
Contents
Foreword .................................................................................................................. 5
Summary and conclusion .......................................................................................... 6
Sammenfatning og konklusion .................................................................................. 8
1. Introduction ..................................................................................................... 10 1.1 Project goal ............................................................................................................................ 11 1.2 Project time and schedule .................................................................................................... 11
2. Theory .............................................................................................................. 13 2.1 Adsorption ............................................................................................................................. 13 2.2 Hydrolysis ............................................................................................................................. 13 2.3 The activated Return Sludge Process (ARP) ........................................................................ 14
3. Wangjiashan wastewater treatment plant before retrofitting ............................ 16 3.1 Description of Wangjiashan wastewater treatment plant ................................................... 16 3.2 Load, effluent concentrations and operation, Wangjiashan wastewater treatment
plant ....................................................................................................................................... 17 3.3 Problems identified during current operation.................................................................... 22
3.3.1 Problems with nitrogen removal .......................................................................... 22 3.3.2 Problems with phosphorus removal .................................................................... 24
4. Retrofitting of Wangjiashan wastewater treatment plant .................................. 25 4.1 Capacity ................................................................................................................................ 25 4.2 Improvement of nitrogen and phosphorus removal .......................................................... 26
4.2.1 Improvement of nitrogen removal by implementing internal recirculation .......................................................................................................... 26
4.2.2 Capacity increase by ARP and SSH ...................................................................... 27 4.3 Increased control of the biological processes by online control ........................................ 27
5. Wangjiashan wastewater treatment plant after retrofitting (Phase 2) ............... 28 5.1 Load, effluent concentrations and operation, Wangjiashan wastewater treatment
plant (Phase 2) ..................................................................................................................... 28 5.2 Operation of Wangjiashan wastewater treatment plant (Phase 2) ..................................... 31
6. Wangjiashan wastewater treatment plant after retrofitting (Phase 3) ............... 32 6.1 Load, effluent concentrations and operation, Wangjiashan wastewater treatment
plant (Phase 3) ..................................................................................................................... 32 6.2 Operation of Wangjiashan wastewater treatment plant (Phase 3) .................................... 35
7. Technical specifications for the development of a combined ARP/SSH process ............................................................................................................. 36 7.1 Quantification of the hydrolysis process ............................................................................. 36 7.2 Analysis of the hydrolysis products..................................................................................... 38 7.3 Total mass balance for COD and Phosphorus .................................................................... 38
7.3.1 Mass balance for COD ........................................................................................... 38 7.3.2 Mass balance for phosphorus ............................................................................... 39
4 Test, demonstration and further development of the ARP process in China
8. Technical specifications for the test and demonstration of the ARP process in China ............................................................................................................ 40 8.1 Sludge activity ...................................................................................................................... 40
8.1.1 Phase 1 ................................................................................................................... 40 8.1.2 Phase 3 ................................................................................................................... 47
8.2 Total mass balance for Nitrogen ......................................................................................... 49 8.3 Energy consumption ............................................................................................................ 50
9. Discussion ........................................................................................................ 52 9.1 Process results ...................................................................................................................... 52 9.2 Operation ............................................................................................................................. 53 9.3 Commercial .......................................................................................................................... 53 9.4 Cultural aspects .................................................................................................................... 53 9.5 Future in China .................................................................................................................... 54 9.6 Learning points .................................................................................................................... 54
10. Conclusions ...................................................................................................... 55
11. Dissemination .................................................................................................. 56
12. References ....................................................................................................... 57
Appendix 1: Articles .......................................................................................... 58
Test, demonstration and further development of the ARP process in China 5
Foreword
China is developing rapidly within the water and wastewater area. Especially the development in wastewater treatments plant is remarkable. China has, until a few years ago, had the same requirements for the treated wastewater as Denmark had 20-30 years ago. New Chinese standards have been implemented with regards to effluent concentrations and now the Chinese wastewater must meet requirements similar to Danish and European. The stricter requirements are partly due to an increased environmental awareness in China as well as an increased pressure on the water resources due to population growth. The Chinese authorities now face the massive challenge that the existing wastewater treatment plants must be upgraded from performing nitrification and COD removal to include denitrification and phosphorus removal. This requires additional volume for carrying out the denitrification and hydrolysis to promote the biological phosphorus removal. Another challenge is that the Chinese wastewater has a low COD/T-N ratio, which can cause problems for the total nitrogen removal as organic matter is used for denitrification. The Danish Engineering company EnviDan has developed a new product called Activated Return Sludge Process (ARP) which can be used for extending the capacity at waste water treatment plants. The ARP process takes place on a side stream of the return sludge where the concentration of microorganisms is high. In the tank, aeration equipment is installed allowing alternating process conditions (aerobic, anoxic and anaerobic) supporting both biological nitrogen and phosphorous removal. Compared to conventional treatment technologies the ARP process require less process volume. In year 2010, EnviDan and the Chinese partner Capital Aihua Municipal & Environmental Engineering Co. Ltd (Aihua) initiated a project to test, demonstrate and further develop the combined ARP and sidestream hydrolysis (SSH) at the Chinese wastewater treatment plant Wangjiashan, situated in Ma’anshan, Anhui Province. The test and demonstration has been performed for a total period of nearly 2½ years of which the last 10 months has been adjustment and operation of the retrofitted plant. Lund University, the University in Tianjin, as well as the local environmental authority in Ma’anshan, have contributed to the work. The project was subsidised by the Danish Environmental Protecting Agency, Ecoinnovation programme (MUDP). The report reflects the authors views and opinion, but not necessarily the views of the Danish Environmental Protection Agency.
6 Test, demonstration and further development of the ARP process in China
Summary and conclusion
This report is the final report in the joined development and research project between EnviDan and Aihua. The following has been investigated in the project:
1. Development of the combined ARP/SSH processes in full scale. 2. Retrofitting of the reference plant to implement ARP/SSH in full scale. 3. Test and demonstration of the potential of the ARP/SSH processes in China and with
Chinese composed wastewater. This development project includes corporation with Lund University, the University in Tianjin, the operators at the Wangjiashan wastewater treatment plant as well as the local environmental authority in Ma’anshan. The combined activated return sludge process (ARP) and sidestream hydrolysis (SSH) developed by EnviDan, Denmark, has been implemented at Wangjiashan wastewater treatment plant in order to reduce effluent pollutant concentrations and to comply with the highest standard set for Chinese wastewater treatment plants. The purpose of the implementation of ARP/SSH is to increase the biological treatment capacity as well as at to introduce production of volatile fatty acids via hydrolysis to promote biological phosphorus and nitrogen removal. In addition, online meters for measuring nitrogen has been installed in the combined ARP/SSH and in the Orbal ditches for controlling the different periods with or without aeration. In the Orbal ditches internal recirculation pumps has been installed. In this project the performance of Wangjiashan wastewater treatment plant has been evaluated before and after the implementation of the ARP/SSH processes in order to evaluate the potential of the ARP/SSH process. A master student from Lund University in Sweden has carried out some of the test at the plant and performed laboratory test, at Aihua and at the University in Tianjin, in order to establish a baseline describing the performance prior to installing the ARP/SSH process. Based on data from 2010 the plant did fulfil the Class B1 requirements (20 mg T_N/l and 1.5 mg T-P/l) using the average values of 17.9 mg T-N/l and 1.2 mg T-P/l. In the future the plant must comply with the Class A1 requirements of 15 mg T-N/l and 1.0 mg T-P/l. Retrofitting the plant and installing new equipment were carried out during spring 2012 with commissioning ultimo April 2012. In connection with this a process engineering from EnviDan visited the plant several times for educating the operators in the new process, meeting the local environmental authority and supporting the process commissioning. In the summer of 2012, the first indication of the potential for the combined ARP/SSH process where achieved. During this period the concentration of total nitrogen in the effluent decreased and the average for the period primo May to ultimo September was 14 mg N/l. In the autumn of 2012 a number of mechanical problems occurred at the plant amongst other break down of the internal recirculation pumps and problems with the online measuring equipment. The latest results from the plant show a significant decrease in the amount of organic matter in the plant influent. The average COD/T-N ratio for the period from ultimo July 2012 to ultimo February 2013 was 3.7, which in very low and below theoretically value normally used for evaluating the possibility for performing full biological nitrogen removal. As a consequence the plant has
Test, demonstration and further development of the ARP process in China 7
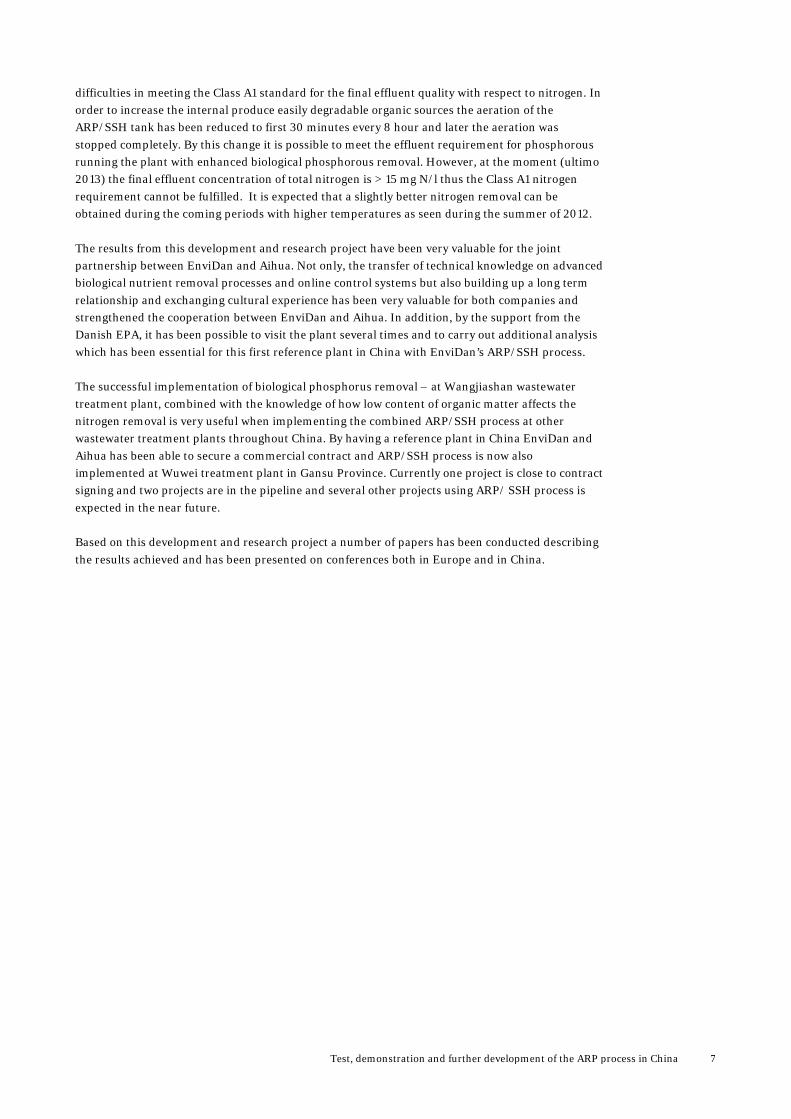
difficulties in meeting the Class A1 standard for the final effluent quality with respect to nitrogen. In order to increase the internal produce easily degradable organic sources the aeration of the ARP/SSH tank has been reduced to first 30 minutes every 8 hour and later the aeration was stopped completely. By this change it is possible to meet the effluent requirement for phosphorous running the plant with enhanced biological phosphorous removal. However, at the moment (ultimo 2013) the final effluent concentration of total nitrogen is > 15 mg N/l thus the Class A1 nitrogen requirement cannot be fulfilled. It is expected that a slightly better nitrogen removal can be obtained during the coming periods with higher temperatures as seen during the summer of 2012. The results from this development and research project have been very valuable for the joint partnership between EnviDan and Aihua. Not only, the transfer of technical knowledge on advanced biological nutrient removal processes and online control systems but also building up a long term relationship and exchanging cultural experience has been very valuable for both companies and strengthened the cooperation between EnviDan and Aihua. In addition, by the support from the Danish EPA, it has been possible to visit the plant several times and to carry out additional analysis which has been essential for this first reference plant in China with EnviDan’s ARP/SSH process. The successful implementation of biological phosphorus removal – at Wangjiashan wastewater treatment plant, combined with the knowledge of how low content of organic matter affects the nitrogen removal is very useful when implementing the combined ARP/SSH process at other wastewater treatment plants throughout China. By having a reference plant in China EnviDan and Aihua has been able to secure a commercial contract and ARP/SSH process is now also implemented at Wuwei treatment plant in Gansu Province. Currently one project is close to contract signing and two projects are in the pipeline and several other projects using ARP/ SSH process is expected in the near future. Based on this development and research project a number of papers has been conducted describing the results achieved and has been presented on conferences both in Europe and in China.
8 Test, demonstration and further development of the ARP process in China
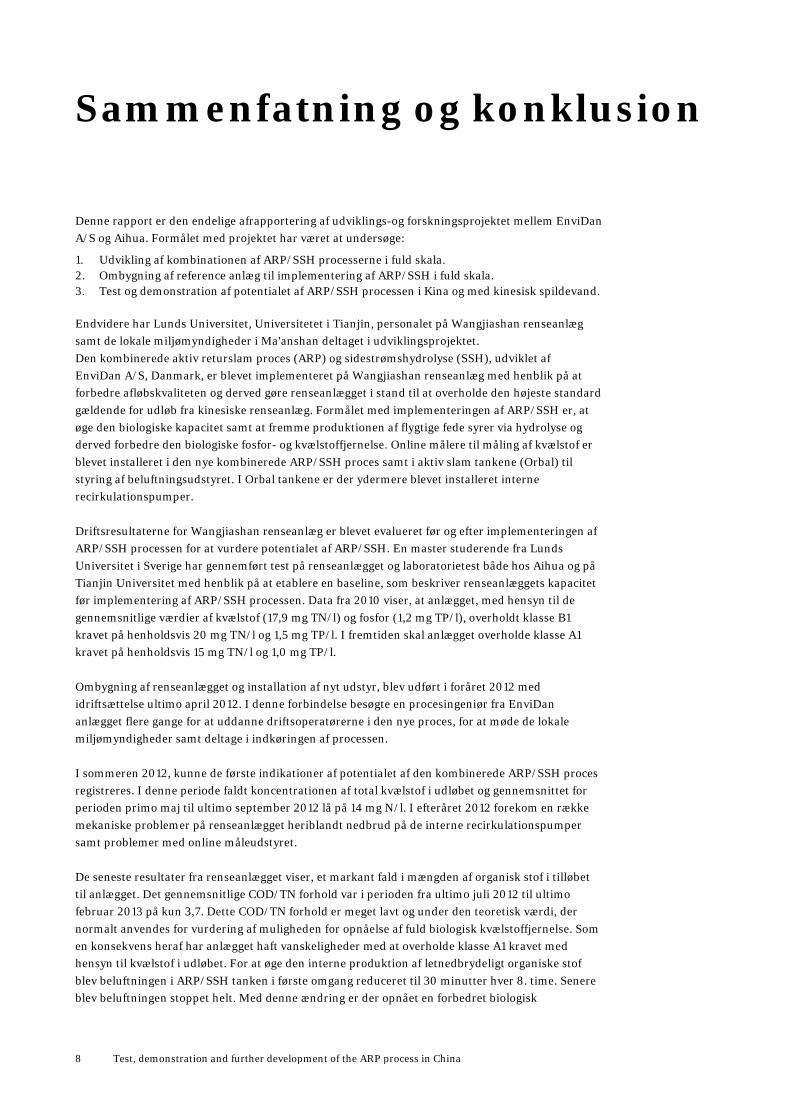
Sammenfatning og konklusion
Denne rapport er den endelige afrapportering af udviklings-og forskningsprojektet mellem EnviDan A/S og Aihua. Formålet med projektet har været at undersøge:
1. Udvikling af kombinationen af ARP/SSH processerne i fuld skala. 2. Ombygning af reference anlæg til implementering af ARP/SSH i fuld skala. 3. Test og demonstration af potentialet af ARP/SSH processen i Kina og med kinesisk spildevand.
Endvidere har Lunds Universitet, Universitetet i Tianjin, personalet på Wangjiashan renseanlæg samt de lokale miljømyndigheder i Ma'anshan deltaget i udviklingsprojektet. Den kombinerede aktiv returslam proces (ARP) og sidestrømshydrolyse (SSH), udviklet af EnviDan A/S, Danmark, er blevet implementeret på Wangjiashan renseanlæg med henblik på at forbedre afløbskvaliteten og derved gøre renseanlægget i stand til at overholde den højeste standard gældende for udløb fra kinesiske renseanlæg. Formålet med implementeringen af ARP/SSH er, at øge den biologiske kapacitet samt at fremme produktionen af flygtige fede syrer via hydrolyse og derved forbedre den biologiske fosfor- og kvælstoffjernelse. Online målere til måling af kvælstof er blevet installeret i den nye kombinerede ARP/SSH proces samt i aktiv slam tankene (Orbal) til styring af beluftningsudstyret. I Orbal tankene er der ydermere blevet installeret interne recirkulationspumper. Driftsresultaterne for Wangjiashan renseanlæg er blevet evalueret før og efter implementeringen af ARP/SSH processen for at vurdere potentialet af ARP/SSH. En master studerende fra Lunds Universitet i Sverige har gennemført test på renseanlægget og laboratorietest både hos Aihua og på Tianjin Universitet med henblik på at etablere en baseline, som beskriver renseanlæggets kapacitet før implementering af ARP/SSH processen. Data fra 2010 viser, at anlægget, med hensyn til de gennemsnitlige værdier af kvælstof (17,9 mg TN/l) og fosfor (1,2 mg TP/l), overholdt klasse B1 kravet på henholdsvis 20 mg TN/l og 1,5 mg TP/l. I fremtiden skal anlægget overholde klasse A1 kravet på henholdsvis 15 mg TN/l og 1,0 mg TP/l. Ombygning af renseanlægget og installation af nyt udstyr, blev udført i foråret 2012 med idriftsættelse ultimo april 2012. I denne forbindelse besøgte en procesingeniør fra EnviDan anlægget flere gange for at uddanne driftsoperatørerne i den nye proces, for at møde de lokale miljømyndigheder samt deltage i indkøringen af processen. I sommeren 2012, kunne de første indikationer af potentialet af den kombinerede ARP/SSH proces registreres. I denne periode faldt koncentrationen af total kvælstof i udløbet og gennemsnittet for perioden primo maj til ultimo september 2012 lå på 14 mg N/l. I efteråret 2012 forekom en række mekaniske problemer på renseanlægget heriblandt nedbrud på de interne recirkulationspumper samt problemer med online måleudstyret. De seneste resultater fra renseanlægget viser, et markant fald i mængden af organisk stof i tilløbet til anlægget. Det gennemsnitlige COD/TN forhold var i perioden fra ultimo juli 2012 til ultimo februar 2013 på kun 3,7. Dette COD/TN forhold er meget lavt og under den teoretisk værdi, der normalt anvendes for vurdering af muligheden for opnåelse af fuld biologisk kvælstoffjernelse. Som en konsekvens heraf har anlægget haft vanskeligheder med at overholde klasse A1 kravet med hensyn til kvælstof i udløbet. For at øge den interne produktion af letnedbrydeligt organiske stof blev beluftningen i ARP/SSH tanken i første omgang reduceret til 30 minutter hver 8. time. Senere blev beluftningen stoppet helt. Med denne ændring er der opnået en forbedret biologisk
Test, demonstration and further development of the ARP process in China 9
fosforfjernelse og derved er det muligt at overholde udløbskravet til fosfor. I øjeblikket (ultimo 2013) er koncentrationen af total kvælstof i udløbet > 15 mg N/l og dermed er kvælstof kravet i henhold til klasse A1 standarden ikke opfyldt. Det forventes, at der i de kommende perioder, kan opnås en lidt bedre kvælstoffjernelse med højere temperaturer, tilsvarende sommeren 2012. Resultaterne fra dette udviklingsprojekt har været meget værdifulde for det fælles partnerskab mellem EnviDan og Aihua. Ikke blot har overførslen af teknisk viden om avancerede biologiske processer til næringsstoffjernelse og online kontrolsystemer, men også opbygningen af et langsigtet forhold og udveksling af kulturelle erfaringer haft stor værdi for begge selskaber og styrket samarbejdet mellem EnviDan og Aihua. Hertil kommer, at det med støtte fra den danske Miljøstyrelse, har det været muligt at besøge renseanlægget flere gange samt at gennemføre supplerende analyser og yderligere undersøgelser, som har været afgørende for funktionen af dette første referenceanlæg med EnviDan’s ARP/SSH proces i Kina. Den vellykkede implementering af biologisk fosforfjernelse - på Wangjiashan renseanlæg, kombineret med viden om, hvordan et lavt indhold af organisk stof påvirker kvælstoffjernelse, er meget nyttig i forbindelse med implementeringen af den kombinerede ARP/SSH proces på andre renseanlæg i Kina. Ved at have et referenceanlæg i Kina har EnviDan og Aihua været i stand til at sikre en kommerciel kontrakt, og ARP/SSH proces er nu også implementeret på Wuwei rensningsanlæg i Gansu provinsen. I øjeblikket er yderligere et projekt tæt på kontraktunderskrivelse og to projekter er i støbeskeen. I den nærmeste fremtid forventes flere projekter med ARP / SSH processen. Med udgangspunkt i dette udviklingsprojekt er udarbejdet en række artikler, som beskriver de opnåede resultater, og disse er blevet præsenteret på konferencer i både Europa og Kina.
10 Test, demonstration and further development of the ARP process in China
1. Introduction
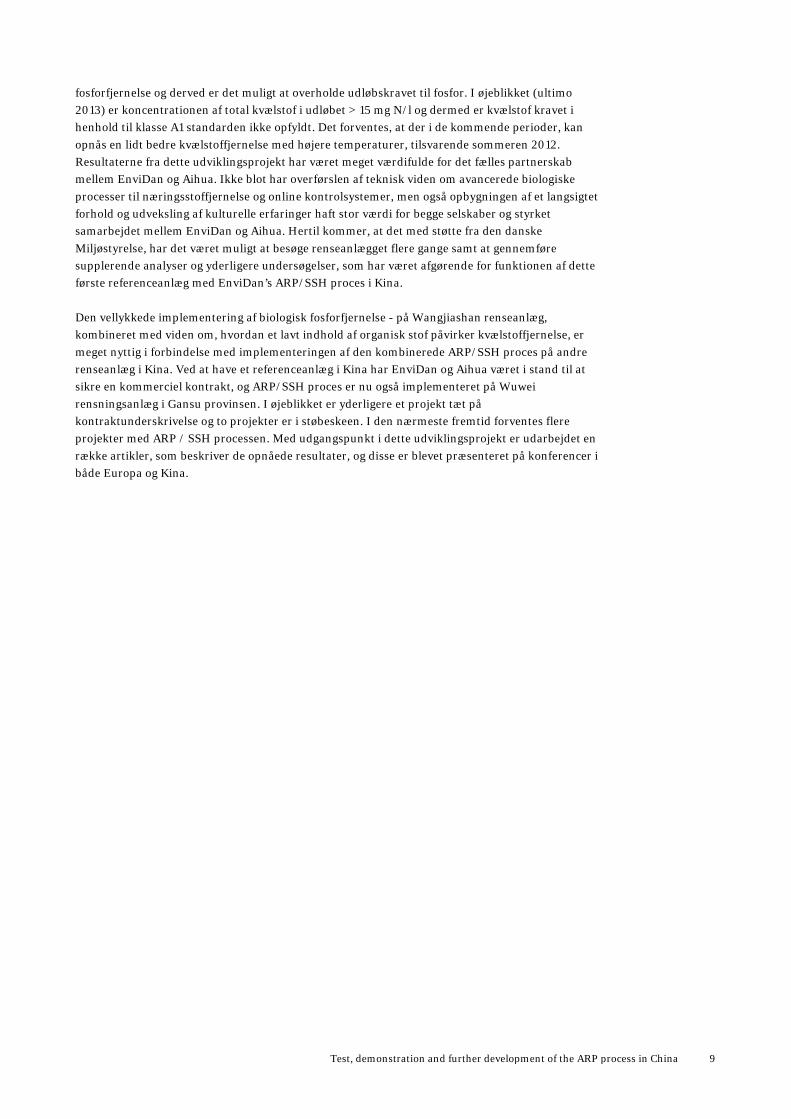
This report is the final report in the joined development and research project between EnviDan and Aihua, supported by the Danish Environmental Protection Agency (EPA). The project has originally been divided into two projects; A development project in which, two of EnviDan’s processes have been joined in full scale operation. This has entailed that the Activated Return sludge Process (ARP) and Side Stream Hydrolysis (SSH) has been combined in a full scale plant. The ARP technology is used for capacity increase of existing wastewater treatment plants, whereas the SSH technology is used for enhanced biological phosphorus removal. A test and demonstration project where the effect of the ARP process and the SSH process has been demonstrated on Chinese wastewater. The effect of both processes is known on Danish wastewater treatment plants. However, the composition of the Chinese wastewater differs from the Danish since Chinese wastewater has low COD/T-N ratio, which can affect the denitrification in a negative way. The production of soluble COD from the ARP/SSH process can have a positive influence on the denitrification at Chinese wastewater treatment plant and this should be documented in the test and demonstration project. The project has been carried out at the Chinese wastewater treatment plant Wangjiashan in the city of Ma’anshan in the province of Nanjing. The geographical placement of the treatment plant can be seen from Figure 1.
FIGURE 1: GEOGRAPHICAL PLACEMENT OF WANGJIASHAN WASTEWATER TREATMENT PLANT
The project implementation has been done by a large group of stakeholders, which all has been involved in the project to a smaller or larger extend. An overview of the stakeholders involved in the project can be seen from Table 1.
Test, demonstration and further development of the ARP process in China 11
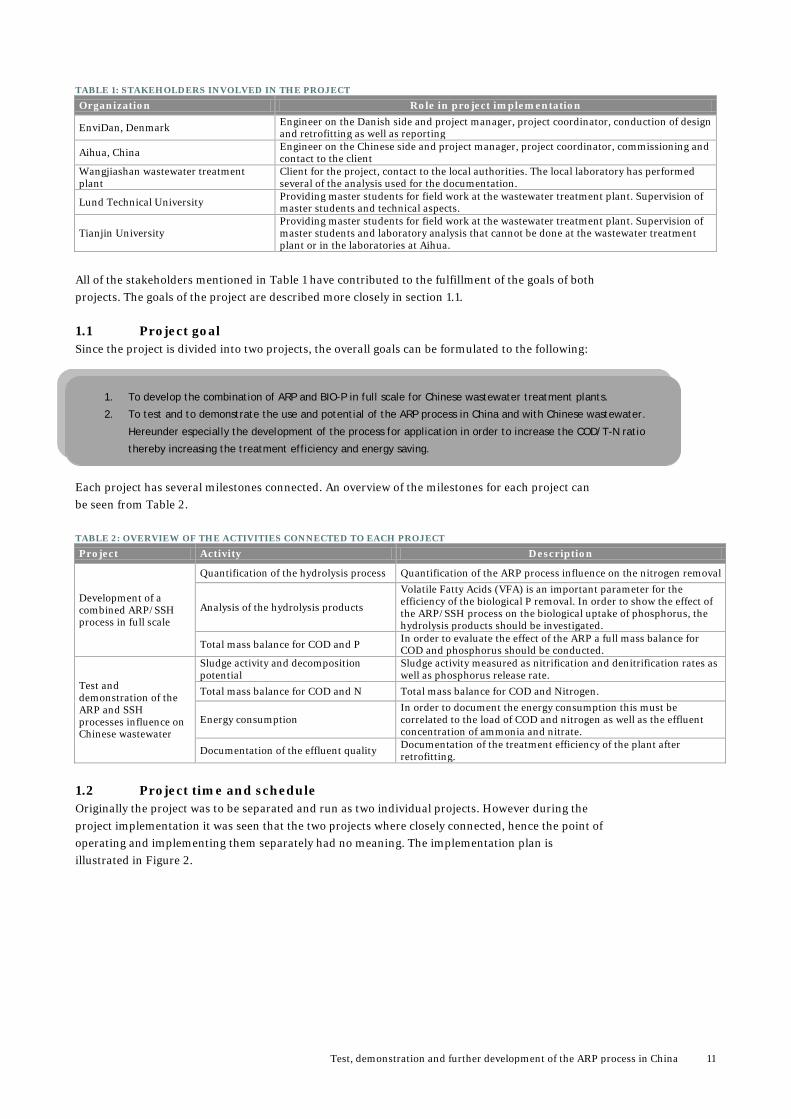
TABLE 1: STAKEHOLDERS INVOLVED IN THE PROJECT
Organization Role in project implementation
EnviDan, Denmark Engineer on the Danish side and project manager, project coordinator, conduction of design and retrofitting as well as reporting
Aihua, China Engineer on the Chinese side and project manager, project coordinator, commissioning and contact to the client
Wangjiashan wastewater treatment plant
Client for the project, contact to the local authorities. The local laboratory has performed several of the analysis used for the documentation.
Lund Technical University Providing master students for field work at the wastewater treatment plant. Supervision of master students and technical aspects.
Tianjin University Providing master students for field work at the wastewater treatment plant. Supervision of master students and laboratory analysis that cannot be done at the wastewater treatment plant or in the laboratories at Aihua.
All of the stakeholders mentioned in Table 1 have contributed to the fulfillment of the goals of both projects. The goals of the project are described more closely in section 1.1. 1.1 Project goal Since the project is divided into two projects, the overall goals can be formulated to the following: Each project has several milestones connected. An overview of the milestones for each project can be seen from Table 2.
TABLE 2: OVERVIEW OF THE ACTIVITIES CONNECTED TO EACH PROJECT
Project Activity Description
Development of a combined ARP/SSH process in full scale
Quantification of the hydrolysis process Quantification of the ARP process influence on the nitrogen removal
Analysis of the hydrolysis products
Volatile Fatty Acids (VFA) is an important parameter for the efficiency of the biological P removal. In order to show the effect of the ARP/SSH process on the biological uptake of phosphorus, the hydrolysis products should be investigated.
Total mass balance for COD and P In order to evaluate the effect of the ARP a full mass balance for COD and phosphorus should be conducted.
Test and demonstration of the ARP and SSH processes influence on Chinese wastewater
Sludge activity and decomposition potential
Sludge activity measured as nitrification and denitrification rates as well as phosphorus release rate.
Total mass balance for COD and N Total mass balance for COD and Nitrogen.
Energy consumption In order to document the energy consumption this must be correlated to the load of COD and nitrogen as well as the effluent concentration of ammonia and nitrate.
Documentation of the effluent quality Documentation of the treatment efficiency of the plant after retrofitting.
1.2 Project time and schedule Originally the project was to be separated and run as two individual projects. However during the project implementation it was seen that the two projects where closely connected, hence the point of operating and implementing them separately had no meaning. The implementation plan is illustrated in Figure 2.
1. To develop the combination of ARP and BIO-P in full scale for Chinese wastewater treatment plants.
2. To test and to demonstrate the use and potential of the ARP process in China and with Chinese wastewater.
Hereunder especially the development of the process for application in order to increase the COD/T-N ratio
thereby increasing the treatment efficiency and energy saving.
12 Test, demonstration and further development of the ARP process in China
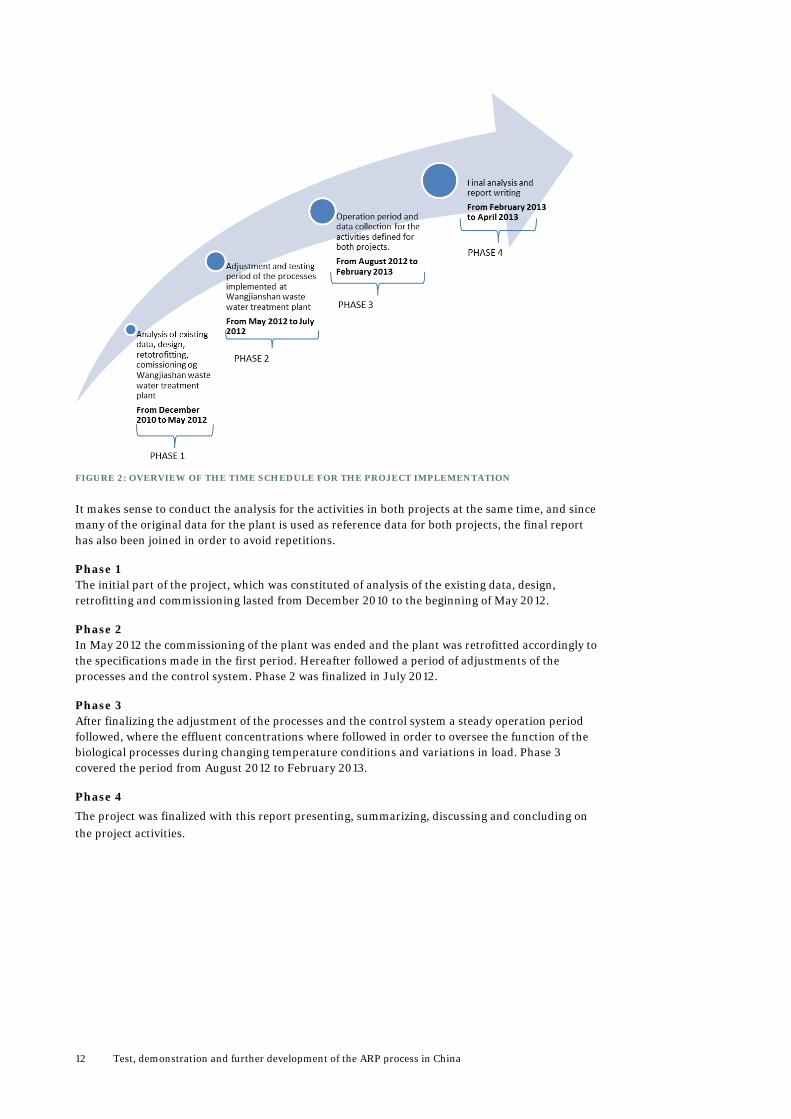
FIGURE 2: OVERVIEW OF THE TIME SCHEDULE FOR THE PROJECT IMPLEMENTATION
It makes sense to conduct the analysis for the activities in both projects at the same time, and since many of the original data for the plant is used as reference data for both projects, the final report has also been joined in order to avoid repetitions.
Phase 1 The initial part of the project, which was constituted of analysis of the existing data, design, retrofitting and commissioning lasted from December 2010 to the beginning of May 2012.
Phase 2 In May 2012 the commissioning of the plant was ended and the plant was retrofitted accordingly to the specifications made in the first period. Hereafter followed a period of adjustments of the processes and the control system. Phase 2 was finalized in July 2012.
Phase 3 After finalizing the adjustment of the processes and the control system a steady operation period followed, where the effluent concentrations where followed in order to oversee the function of the biological processes during changing temperature conditions and variations in load. Phase 3 covered the period from August 2012 to February 2013.
Phase 4 The project was finalized with this report presenting, summarizing, discussing and concluding on the project activities.
Test, demonstration and further development of the ARP process in China 13
2. Theory
The ARP process is built on two well-known processes within wastewater treatment:
1. Adsorption of COD onto activated sludge 2. Sludge hydrolysis
In the sections below, both these processes are shortly described. 2.1 Adsorption Adsorption is a process that describes the adsorption of COD (soluble and suspended) on the activated sludge flocks. In the further wastewater treatment process, COD is transported around in the WWTP, being decomposed during a full sludge age. Under normal operation conditions approximately 50 % of the COD will be removed from the WWTP by the surplus sludge; hence the surplus sludge holds a great potential for COD production. [4] The COD in the surplus sludge is for example used during anaerobic digestion, where it is converted into biogas. It can also be used during the ARP process, where the COD is used for biological phosphorus removal and denitrification. 2.2 Hydrolysis The main fraction of organic compounds in wastewater cannot be used directly by the microorganisms in the activated sludge. Initially, the organic compounds are hydrolyzed and the slowly degradable organic compounds in the wastewater are transferred into easily biodegradable organic compounds. The hydrolysis process is slower than processes for biological growth, thus the hydrolysis rates are regularly the limiting factor in regards to wastewater treatment processes [2]. The hydrolysis occurs continuously throughout the plant at all times, under anaerobic conditions it is often expressed as the decomposition of biomass into acetic acid as below:
C5H7NO2 + 3H2O → 2.5 CH3COOH + NH3
It is well known that sludge hydrolysis is facilitated by microorganisms which excrete extracellular enzymes capable of decomposing larger particulate organic compounds thus generating easily degradable soluble organic compounds like Volatile Fatty Acids (VFAs). The main part of VFA (60-80%) is acetate but also propionate, isobutyrate, butyrate and many more short chain organic compounds can be produced [1] and [3]. The sludge hydrolysis rate is proportional to the sludge concentration and the temperature. As a consequence, the efficiency of the hydrolysis process expressed as transformed amount of COD pr. m3 increases proportionally to the sludge concentration in the hydrolysis tank. In 2009, experiments carried out at the Technical University of Denmark, DTU was performed to investigate the hydrolysis rates under different redox conditions. The results obtained showed that the hydrolysis rate expressed as production of soluble COD can be accelerated by introducing intermittent aerobic or anoxic conditions compared to strict anaerobic conditions [5]. The yield of soluble COD was 60 to 85% higher adding nitrate or oxygen intermittent during the batch tests compared to strict anaerobic hydrolysis.
14 Test, demonstration and further development of the ARP process in China
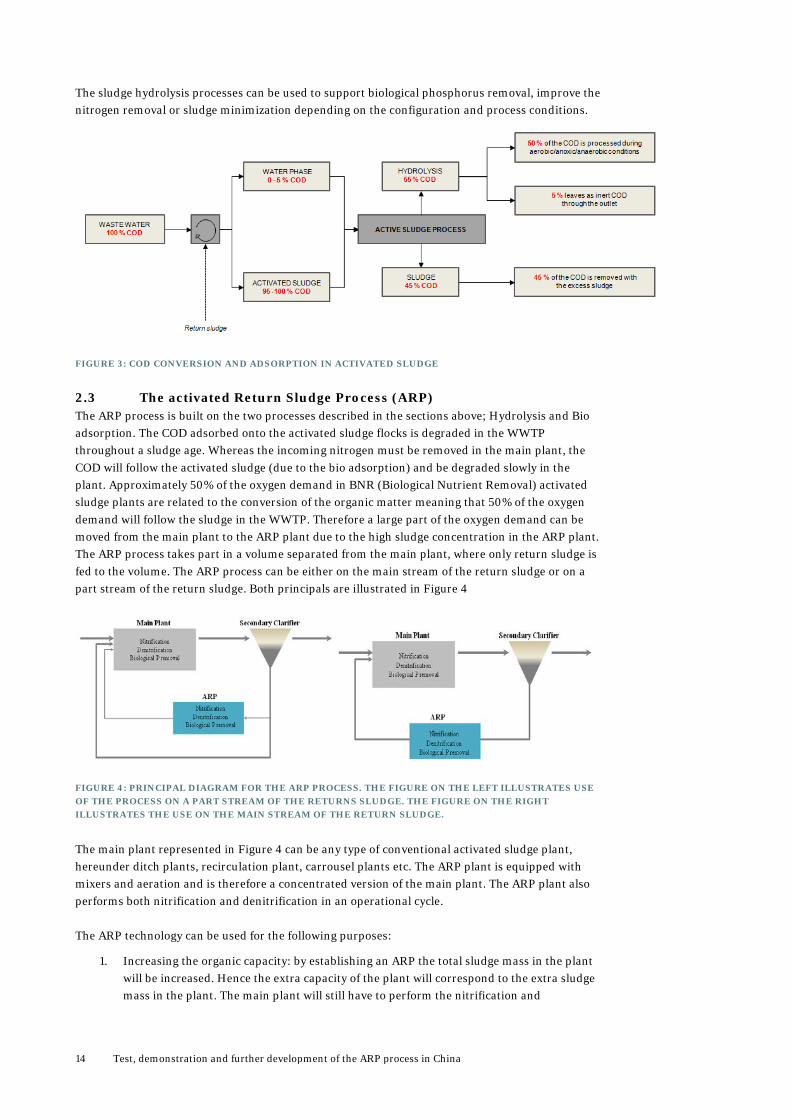
The sludge hydrolysis processes can be used to support biological phosphorus removal, improve the nitrogen removal or sludge minimization depending on the configuration and process conditions.
FIGURE 3: COD CONVERSION AND ADSORPTION IN ACTIVATED SLUDGE
2.3 The activated Return Sludge Process (ARP) The ARP process is built on the two processes described in the sections above; Hydrolysis and Bio adsorption. The COD adsorbed onto the activated sludge flocks is degraded in the WWTP throughout a sludge age. Whereas the incoming nitrogen must be removed in the main plant, the COD will follow the activated sludge (due to the bio adsorption) and be degraded slowly in the plant. Approximately 50% of the oxygen demand in BNR (Biological Nutrient Removal) activated sludge plants are related to the conversion of the organic matter meaning that 50% of the oxygen demand will follow the sludge in the WWTP. Therefore a large part of the oxygen demand can be moved from the main plant to the ARP plant due to the high sludge concentration in the ARP plant. The ARP process takes part in a volume separated from the main plant, where only return sludge is fed to the volume. The ARP process can be either on the main stream of the return sludge or on a part stream of the return sludge. Both principals are illustrated in Figure 4
FIGURE 4: PRINCIPAL DIAGRAM FOR THE ARP PROCESS. THE FIGURE ON THE LEFT ILLUSTRATES USE OF THE PROCESS ON A PART STREAM OF THE RETURNS SLUDGE. THE FIGURE ON THE RIGHT ILLUSTRATES THE USE ON THE MAIN STREAM OF THE RETURN SLUDGE.
The main plant represented in Figure 4 can be any type of conventional activated sludge plant, hereunder ditch plants, recirculation plant, carrousel plants etc. The ARP plant is equipped with mixers and aeration and is therefore a concentrated version of the main plant. The ARP plant also performs both nitrification and denitrification in an operational cycle. The ARP technology can be used for the following purposes:
1. Increasing the organic capacity: by establishing an ARP the total sludge mass in the plant will be increased. Hence the extra capacity of the plant will correspond to the extra sludge mass in the plant. The main plant will still have to perform the nitrification and
Test, demonstration and further development of the ARP process in China 15
denitrification, but the removal of COD will be moved to the ARP plant, thereby increasing the total capacity of the plant. Ammonia produced by the hydrolysis will be removed by nitrification and denitrification in the ARP.
2. Increasing the hydraulic capacity of the secondary clarifiers: By implementing the ARP process in an existing WWTP the hydraulic capacity of the secondary clarifiers can be increased. This is due to the fact that a part of the sludge mass in the plant is moved to the ARP tank (thereby sustaining the total sludge amount in the plant). By moving a part of the sludge to the ARP tank, the MLSS concentration in the main plant can be decreased, thereby decreasing the sludge load to the secondary clarifiers.
3. Biological phosphorus removal: The ARP tank can be used for enhanced biological phosphorus removal because the tank produces easily degradable COD. The Phosphorus Accumulating Organisms (PAO) needs soluble COD and anaerobic conditions followed by aerobic or anoxic conditions in order to perform biological phosphorus removal. In the ARP tank the conditions will change between aerobic, anoxic and anaerobic which gives the right conditions and produces sufficient soluble COD for biological phosphorus removal.
4. Minimizing surplus sludge: Since a larger amount of sludge is aerated and the total sludge age in the WWTP is increased, a larger amount of endogenous respiration will take place, thereby decreasing the surplus sludge.
5. Leveling of highly concentrated wastewater: The ARP process can be used for leveling out highly concentrated wastewater streams in order to decrease the load of the main plant. This could be reject water from sludge dewatering, sludge from septic tanks or small, though concentrated wastewater streams from industries.
The utilization of the ARP process can be combined in order to obtain some of the above mentioned purposes or the focus can be on one or two of the purposes.
16 Test, demonstration and further development of the ARP process in China
3. Wangjiashan wastewater treatment plant before retrofitting
This section includes a description of the operation of Wangjiashan wastewater treatment plant before the retrofitting (Phase 1 according to Figure 2). This includes a description of the treatment plant and the relevant operation parameters as well as an overview of the load and the effluent concentrations from the plant. All is described in the sections below. The data used in this section is the data received from the wastewater treatment plant from the year of 2010.
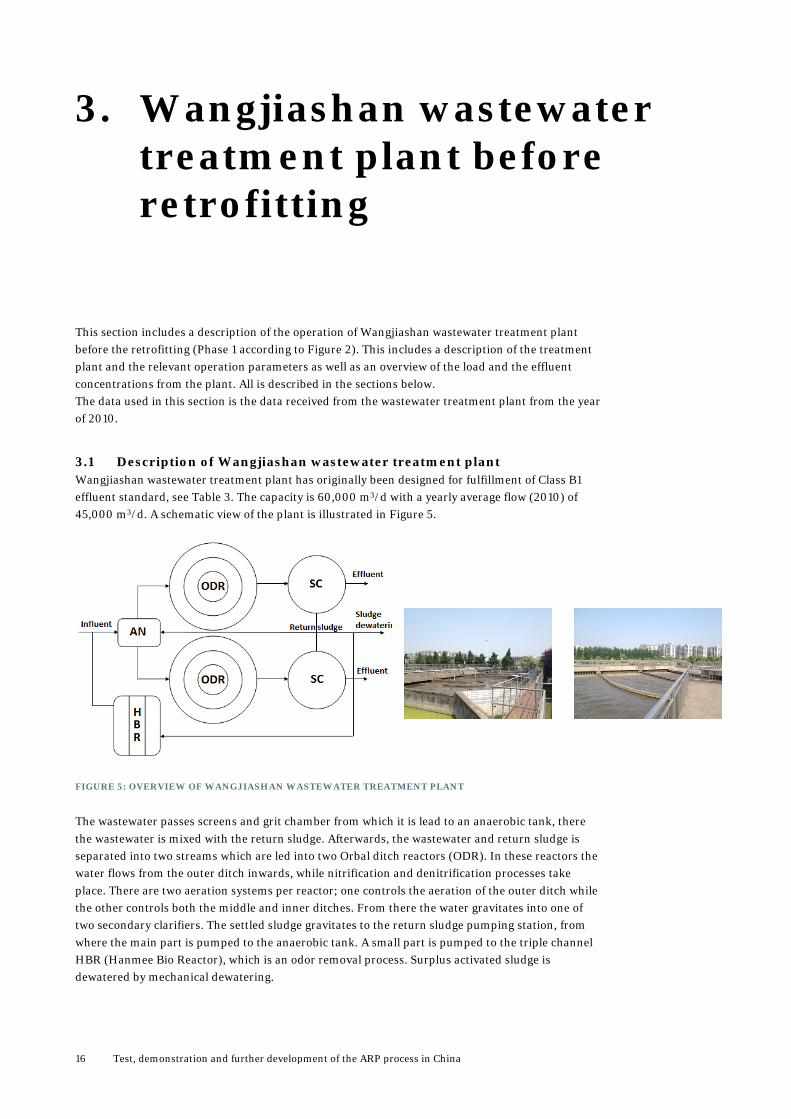
3.1 Description of Wangjiashan wastewater treatment plant Wangjiashan wastewater treatment plant has originally been designed for fulfillment of Class B1 effluent standard, see Table 3. The capacity is 60,000 m3/d with a yearly average flow (2010) of 45,000 m3/d. A schematic view of the plant is illustrated in Figure 5.
FIGURE 5: OVERVIEW OF WANGJIASHAN WASTEWATER TREATMENT PLANT
The wastewater passes screens and grit chamber from which it is lead to an anaerobic tank, there the wastewater is mixed with the return sludge. Afterwards, the wastewater and return sludge is separated into two streams which are led into two Orbal ditch reactors (ODR). In these reactors the water flows from the outer ditch inwards, while nitrification and denitrification processes take place. There are two aeration systems per reactor; one controls the aeration of the outer ditch while the other controls both the middle and inner ditches. From there the water gravitates into one of two secondary clarifiers. The settled sludge gravitates to the return sludge pumping station, from where the main part is pumped to the anaerobic tank. A small part is pumped to the triple channel HBR (Hanmee Bio Reactor), which is an odor removal process. Surplus activated sludge is dewatered by mechanical dewatering.
Test, demonstration and further development of the ARP process in China 17
The effluent standards are displayed in Table 3.
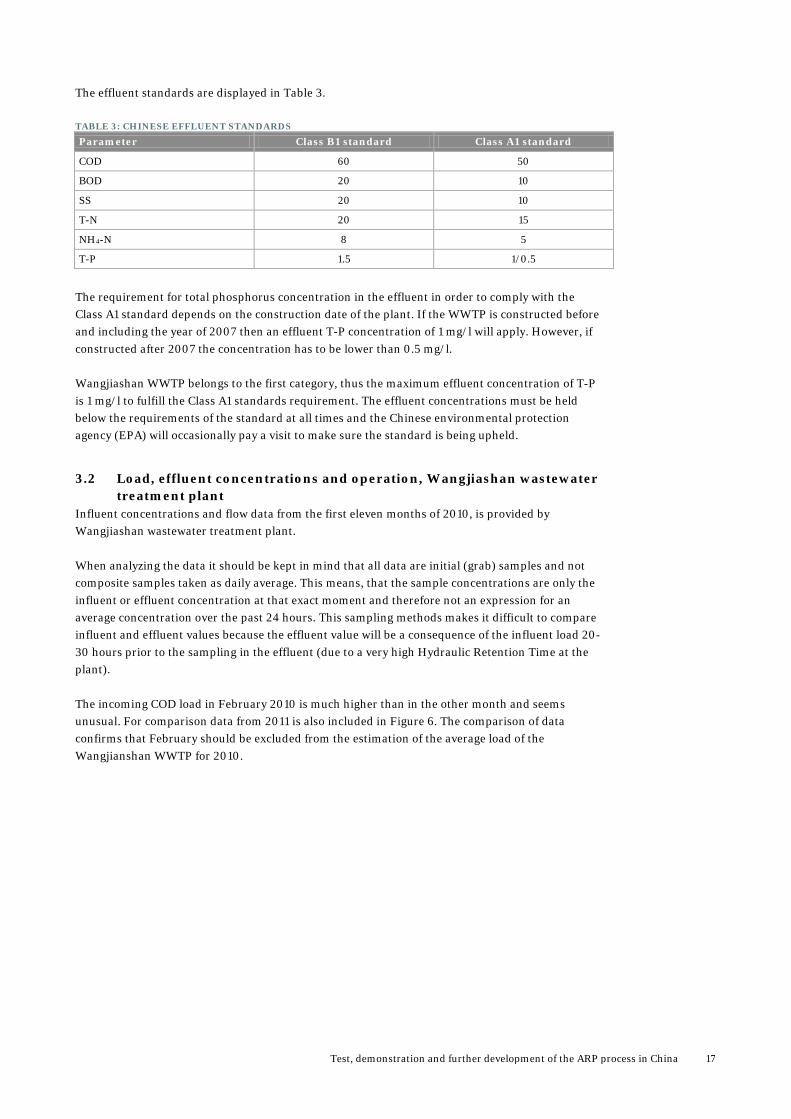
TABLE 3: CHINESE EFFLUENT STANDARDS
Parameter Class B1 standard Class A1 standard
COD 60 50
BOD 20 10
SS 20 10
T-N 20 15
NH4-N 8 5
T-P 1.5 1/0.5
The requirement for total phosphorus concentration in the effluent in order to comply with the Class A1 standard depends on the construction date of the plant. If the WWTP is constructed before and including the year of 2007 then an effluent T-P concentration of 1 mg/l will apply. However, if constructed after 2007 the concentration has to be lower than 0.5 mg/l. Wangjiashan WWTP belongs to the first category, thus the maximum effluent concentration of T-P is 1 mg/l to fulfill the Class A1 standards requirement. The effluent concentrations must be held below the requirements of the standard at all times and the Chinese environmental protection agency (EPA) will occasionally pay a visit to make sure the standard is being upheld.
3.2 Load, effluent concentrations and operation, Wangjiashan wastewater treatment plant
Influent concentrations and flow data from the first eleven months of 2010, is provided by Wangjiashan wastewater treatment plant. When analyzing the data it should be kept in mind that all data are initial (grab) samples and not composite samples taken as daily average. This means, that the sample concentrations are only the influent or effluent concentration at that exact moment and therefore not an expression for an average concentration over the past 24 hours. This sampling methods makes it difficult to compare influent and effluent values because the effluent value will be a consequence of the influent load 20-30 hours prior to the sampling in the effluent (due to a very high Hydraulic Retention Time at the plant). The incoming COD load in February 2010 is much higher than in the other month and seems unusual. For comparison data from 2011 is also included in Figure 6. The comparison of data confirms that February should be excluded from the estimation of the average load of the Wangjianshan WWTP for 2010.
18 Test, demonstration and further development of the ARP process in China
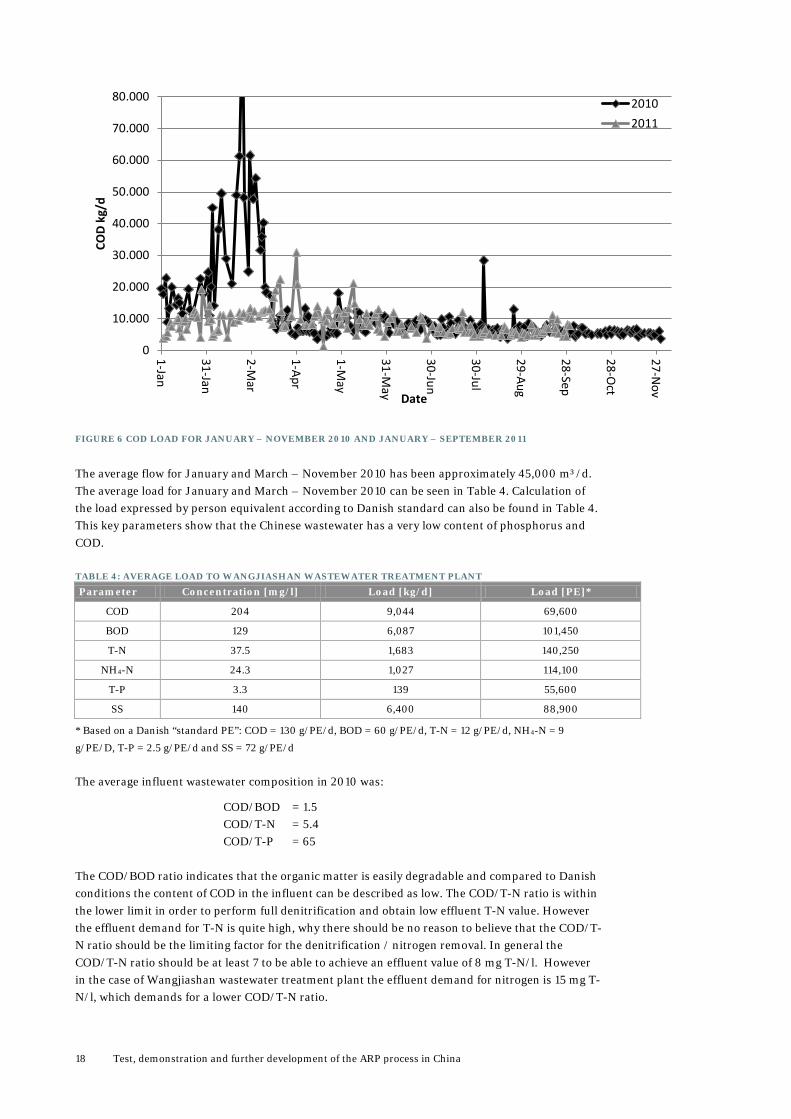
FIGURE 6 COD LOAD FOR JANUARY – NOVEMBER 2010 AND JANUARY – SEPTEMBER 2011
The average flow for January and March – November 2010 has been approximately 45,000 m³/d. The average load for January and March – November 2010 can be seen in Table 4. Calculation of the load expressed by person equivalent according to Danish standard can also be found in Table 4. This key parameters show that the Chinese wastewater has a very low content of phosphorus and COD.
TABLE 4: AVERAGE LOAD TO WANGJIASHAN WASTEWATER TREATMENT PLANT
Parameter Concentration [mg/l] Load [kg/d] Load [PE]*
COD 204 9,044 69,600
BOD 129 6,087 101,450
T-N 37.5 1,683 140,250
NH4-N 24.3 1,027 114,100
T-P 3.3 139 55,600
SS 140 6,400 88,900
* Based on a Danish “standard PE”: COD = 130 g/PE/d, BOD = 60 g/PE/d, T-N = 12 g/PE/d, NH4-N = 9
g/PE/D, T-P = 2.5 g/PE/d and SS = 72 g/PE/d
The average influent wastewater composition in 2010 was:
COD/BOD = 1.5 COD/T-N = 5.4 COD/T-P = 65
The COD/BOD ratio indicates that the organic matter is easily degradable and compared to Danish conditions the content of COD in the influent can be described as low. The COD/T-N ratio is within the lower limit in order to perform full denitrification and obtain low effluent T-N value. However the effluent demand for T-N is quite high, why there should be no reason to believe that the COD/T-N ratio should be the limiting factor for the denitrification / nitrogen removal. In general the COD/T-N ratio should be at least 7 to be able to achieve an effluent value of 8 mg T-N/l. However in the case of Wangjiashan wastewater treatment plant the effluent demand for nitrogen is 15 mg T-N/l, which demands for a lower COD/T-N ratio.
0
10.000
20.000
30.000
40.000
50.000
60.000
70.000
80.000
1-Jan
31-Jan
2-Mar
1-Apr
1-May
31-May
30-Jun
30-Jul
29-Aug
28-Sep
28-Oct
27-Nov
COD
kg/d
Date
20102011
Test, demonstration and further development of the ARP process in China 19
From experience is known that approximately 9.5 g COD is needed in the raw wastewater in order to denitrify 1 g N. For Wangjiashan wastewater treatment plant the following balance can be made for nitrogen:
T-N in : 1,683 kg/d T-N out : 675 kg/d T-N in Bio sludge* : 222 kg/d
* Calculated from the following: 3,700 kg BIO-SS/d x 6 % N in BIO-SS = 222 kg N in BIO-SS/d. BIO-SS
calculated with yield factor γCOD = 0.41 kg BIO-SS / kg COD
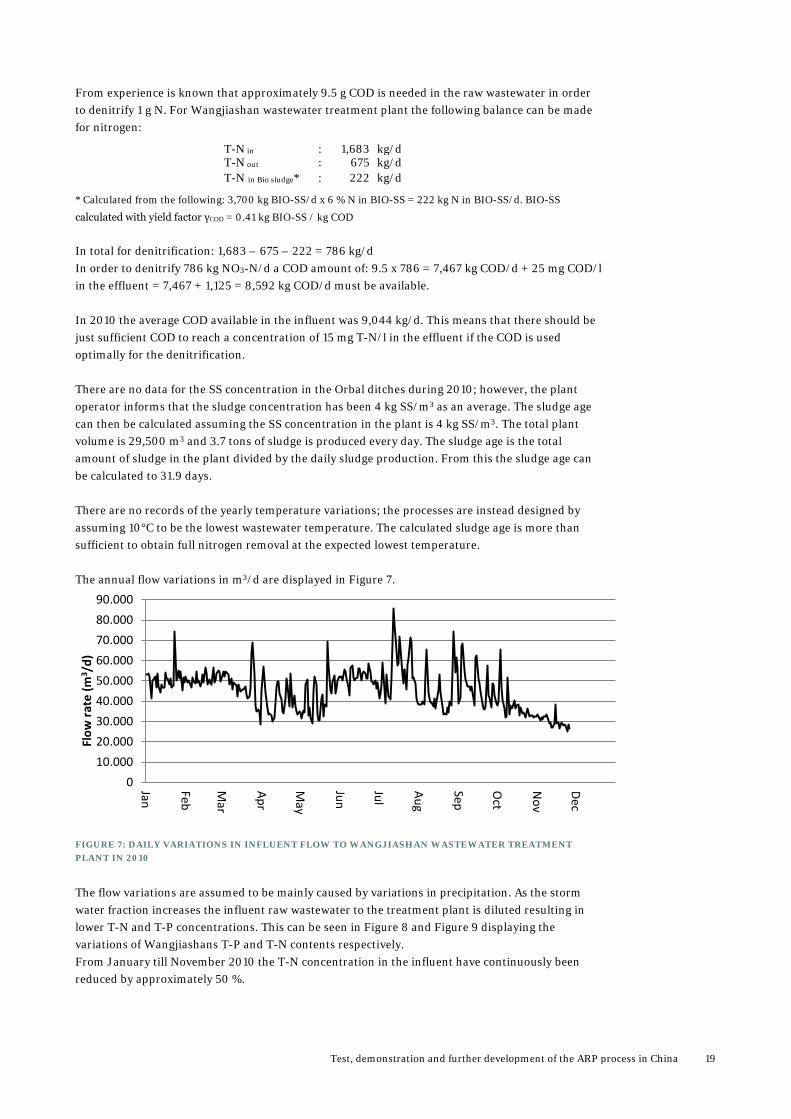
In total for denitrification: 1,683 – 675 – 222 = 786 kg/d In order to denitrify 786 kg NO3-N/d a COD amount of: 9.5 x 786 = 7,467 kg COD/d + 25 mg COD/l in the effluent = 7,467 + 1,125 = 8,592 kg COD/d must be available. In 2010 the average COD available in the influent was 9,044 kg/d. This means that there should be just sufficient COD to reach a concentration of 15 mg T-N/l in the effluent if the COD is used optimally for the denitrification. There are no data for the SS concentration in the Orbal ditches during 2010; however, the plant operator informs that the sludge concentration has been 4 kg SS/m3 as an average. The sludge age can then be calculated assuming the SS concentration in the plant is 4 kg SS/m3. The total plant volume is 29,500 m3 and 3.7 tons of sludge is produced every day. The sludge age is the total amount of sludge in the plant divided by the daily sludge production. From this the sludge age can be calculated to 31.9 days. There are no records of the yearly temperature variations; the processes are instead designed by assuming 10°C to be the lowest wastewater temperature. The calculated sludge age is more than sufficient to obtain full nitrogen removal at the expected lowest temperature. The annual flow variations in m3/d are displayed in Figure 7.
FIGURE 7: DAILY VARIATIONS IN INFLUENT FLOW TO WANGJIASHAN WASTEWATER TREATMENT PLANT IN 2010
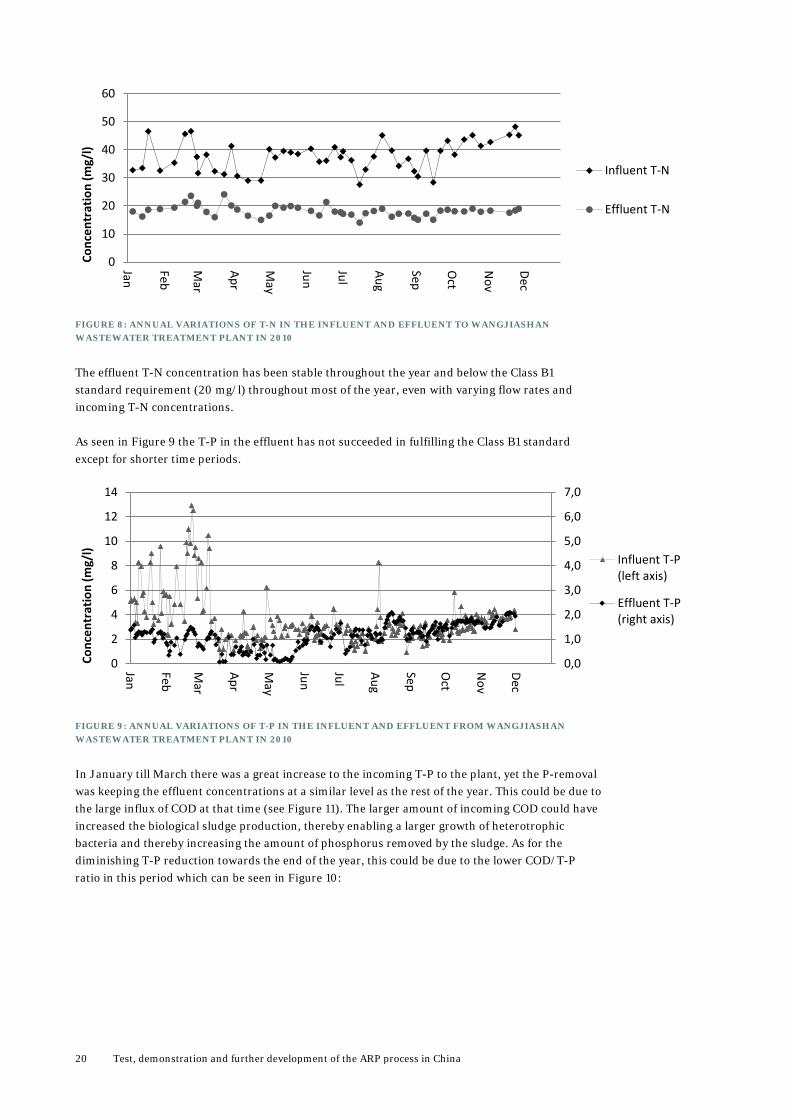
The flow variations are assumed to be mainly caused by variations in precipitation. As the storm water fraction increases the influent raw wastewater to the treatment plant is diluted resulting in lower T-N and T-P concentrations. This can be seen in Figure 8 and Figure 9 displaying the variations of Wangjiashans T-P and T-N contents respectively. From January till November 2010 the T-N concentration in the influent have continuously been reduced by approximately 50 %.
010.00020.00030.00040.00050.00060.00070.00080.00090.000
Jan
Feb
Mar
Apr
May
Jun
Jul
Aug
Sep
Oct
Nov
Dec
Flow
rate
(m3 /
d)
20 Test, demonstration and further development of the ARP process in China
FIGURE 8: ANNUAL VARIATIONS OF T-N IN THE INFLUENT AND EFFLUENT TO WANGJIASHAN WASTEWATER TREATMENT PLANT IN 2010
The effluent T-N concentration has been stable throughout the year and below the Class B1 standard requirement (20 mg/l) throughout most of the year, even with varying flow rates and incoming T-N concentrations. As seen in Figure 9 the T-P in the effluent has not succeeded in fulfilling the Class B1 standard except for shorter time periods.
FIGURE 9: ANNUAL VARIATIONS OF T-P IN THE INFLUENT AND EFFLUENT FROM WANGJIASHAN WASTEWATER TREATMENT PLANT IN 2010
In January till March there was a great increase to the incoming T-P to the plant, yet the P-removal was keeping the effluent concentrations at a similar level as the rest of the year. This could be due to the large influx of COD at that time (see Figure 11). The larger amount of incoming COD could have increased the biological sludge production, thereby enabling a larger growth of heterotrophic bacteria and thereby increasing the amount of phosphorus removed by the sludge. As for the diminishing T-P reduction towards the end of the year, this could be due to the lower COD/T-P ratio in this period which can be seen in Figure 10:
0
10
20
30
40
50
60
Jan
Feb
Mar
Apr
May
Jun
Jul
Aug
Sep
Oct
Nov
Dec
Conc
entr
atio
n (m
g/l)
Influent T-N
Effluent T-N
0,0
1,0
2,0
3,0
4,0
5,0
6,0
7,0
0
2
4
6
8
10
12
14
Jan
Feb
Mar
Apr
May
Jun
Jul
Aug
Sep
Oct
Nov
Dec
Conc
entr
atio
n (m
g/l)
Influent T-P(left axis)
Effluent T-P(right axis)
Test, demonstration and further development of the ARP process in China 21
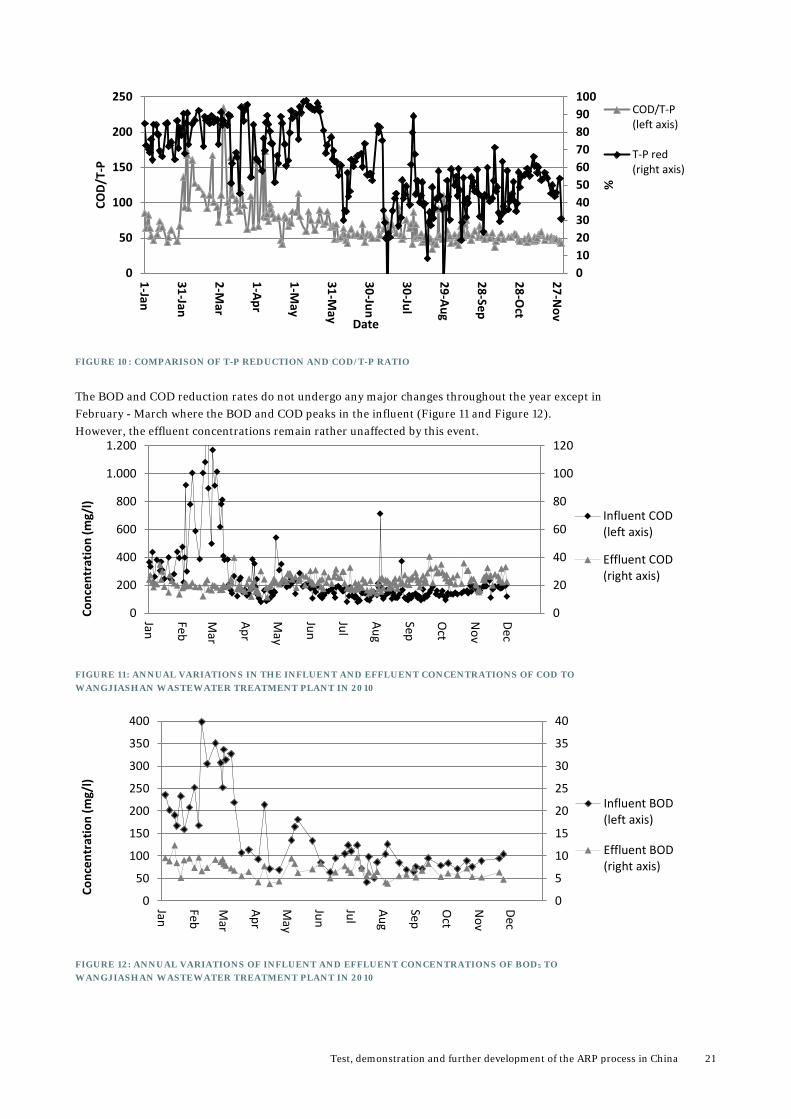
FIGURE 10: COMPARISON OF T-P REDUCTION AND COD/T-P RATIO
The BOD and COD reduction rates do not undergo any major changes throughout the year except in February - March where the BOD and COD peaks in the influent (Figure 11 and Figure 12). However, the effluent concentrations remain rather unaffected by this event.
FIGURE 11: ANNUAL VARIATIONS IN THE INFLUENT AND EFFLUENT CONCENTRATIONS OF COD TO WANGJIASHAN WASTEWATER TREATMENT PLANT IN 2010
FIGURE 12: ANNUAL VARIATIONS OF INFLUENT AND EFFLUENT CONCENTRATIONS OF BOD5 TO WANGJIASHAN WASTEWATER TREATMENT PLANT IN 2010
0102030405060708090100
0
50
100
150
200
250
1-Jan
31-Jan
2-Mar
1-Apr
1-May
31-May
30-Jun
30-Jul
29-Aug
28-Sep
28-Oct
27-Nov
%
COD/
T-P
Date
COD/T-P(left axis)
T-P red(right axis)
0
20
40
60
80
100
120
0
200
400
600
800
1.000
1.200
Jan
Feb
Mar
Apr
May
Jun
Jul
Aug
Sep
Oct
Nov
Dec
Conc
entr
atio
n (m
g/l)
Influent COD(left axis)
Effluent COD(right axis)
0
5
10
15
20
25
30
35
40
0
50
100
150
200
250
300
350
400
Jan
Feb
Mar
Apr
May
Jun
Jul
Aug
Sep
Oct
Nov
Dec
Conc
entr
atio
n (m
g/l)
Influent BOD(left axis)
Effluent BOD(right axis)
22 Test, demonstration and further development of the ARP process in China
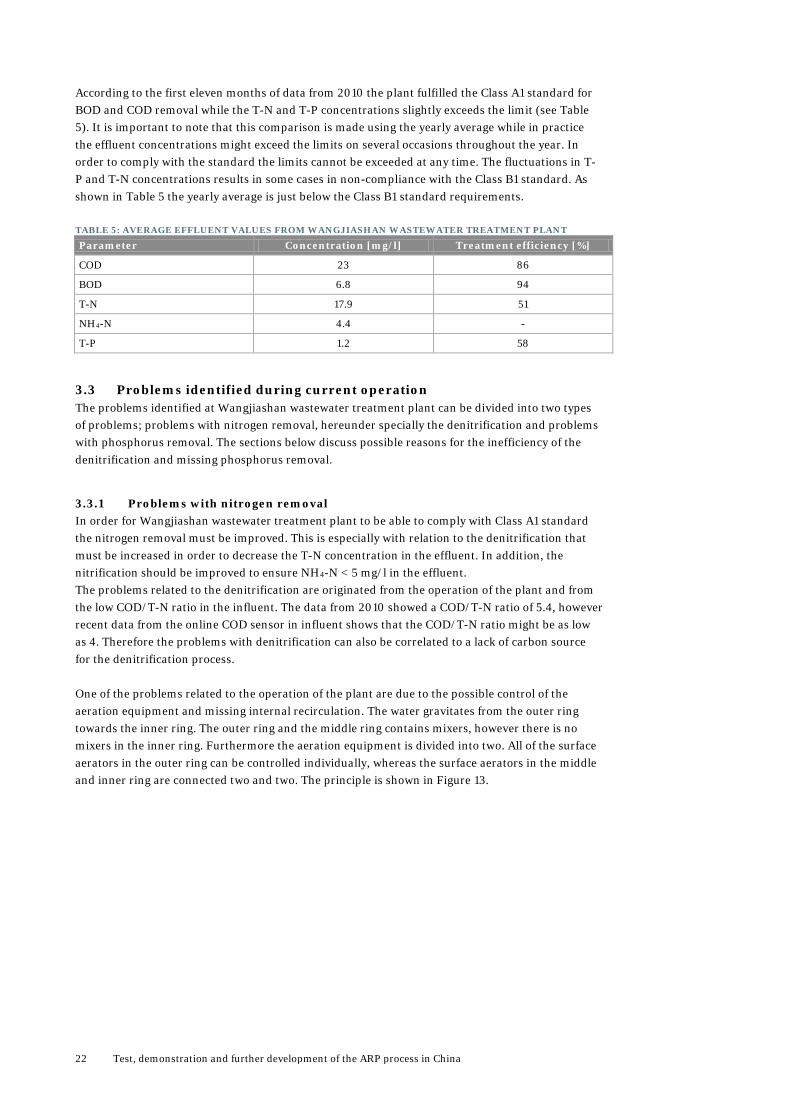
According to the first eleven months of data from 2010 the plant fulfilled the Class A1 standard for BOD and COD removal while the T-N and T-P concentrations slightly exceeds the limit (see Table 5). It is important to note that this comparison is made using the yearly average while in practice the effluent concentrations might exceed the limits on several occasions throughout the year. In order to comply with the standard the limits cannot be exceeded at any time. The fluctuations in T-P and T-N concentrations results in some cases in non-compliance with the Class B1 standard. As shown in Table 5 the yearly average is just below the Class B1 standard requirements.
TABLE 5: AVERAGE EFFLUENT VALUES FROM WANGJIASHAN WASTEWATER TREATMENT PLANT
Parameter Concentration [mg/l] Treatment efficiency [%]
COD 23 86
BOD 6.8 94
T-N 17.9 51
NH4-N 4.4 -
T-P 1.2 58
3.3 Problems identified during current operation The problems identified at Wangjiashan wastewater treatment plant can be divided into two types of problems; problems with nitrogen removal, hereunder specially the denitrification and problems with phosphorus removal. The sections below discuss possible reasons for the inefficiency of the denitrification and missing phosphorus removal.
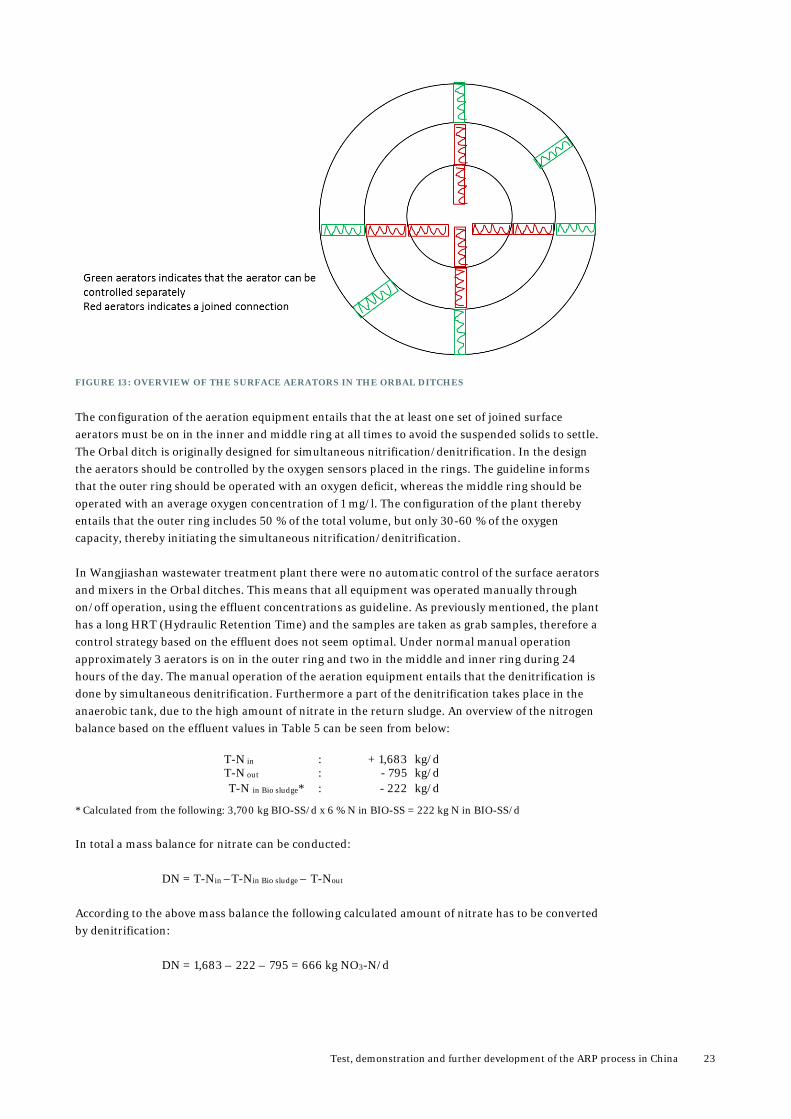
3.3.1 Problems with nitrogen removal In order for Wangjiashan wastewater treatment plant to be able to comply with Class A1 standard the nitrogen removal must be improved. This is especially with relation to the denitrification that must be increased in order to decrease the T-N concentration in the effluent. In addition, the nitrification should be improved to ensure NH4-N < 5 mg/l in the effluent. The problems related to the denitrification are originated from the operation of the plant and from the low COD/T-N ratio in the influent. The data from 2010 showed a COD/T-N ratio of 5.4, however recent data from the online COD sensor in influent shows that the COD/T-N ratio might be as low as 4. Therefore the problems with denitrification can also be correlated to a lack of carbon source for the denitrification process. One of the problems related to the operation of the plant are due to the possible control of the aeration equipment and missing internal recirculation. The water gravitates from the outer ring towards the inner ring. The outer ring and the middle ring contains mixers, however there is no mixers in the inner ring. Furthermore the aeration equipment is divided into two. All of the surface aerators in the outer ring can be controlled individually, whereas the surface aerators in the middle and inner ring are connected two and two. The principle is shown in Figure 13.
Test, demonstration and further development of the ARP process in China 23
FIGURE 13: OVERVIEW OF THE SURFACE AERATORS IN THE ORBAL DITCHES
The configuration of the aeration equipment entails that the at least one set of joined surface aerators must be on in the inner and middle ring at all times to avoid the suspended solids to settle. The Orbal ditch is originally designed for simultaneous nitrification/denitrification. In the design the aerators should be controlled by the oxygen sensors placed in the rings. The guideline informs that the outer ring should be operated with an oxygen deficit, whereas the middle ring should be operated with an average oxygen concentration of 1 mg/l. The configuration of the plant thereby entails that the outer ring includes 50 % of the total volume, but only 30-60 % of the oxygen capacity, thereby initiating the simultaneous nitrification/denitrification. In Wangjiashan wastewater treatment plant there were no automatic control of the surface aerators and mixers in the Orbal ditches. This means that all equipment was operated manually through on/off operation, using the effluent concentrations as guideline. As previously mentioned, the plant has a long HRT (Hydraulic Retention Time) and the samples are taken as grab samples, therefore a control strategy based on the effluent does not seem optimal. Under normal manual operation approximately 3 aerators is on in the outer ring and two in the middle and inner ring during 24 hours of the day. The manual operation of the aeration equipment entails that the denitrification is done by simultaneous denitrification. Furthermore a part of the denitrification takes place in the anaerobic tank, due to the high amount of nitrate in the return sludge. An overview of the nitrogen balance based on the effluent values in Table 5 can be seen from below:
T-N in : + 1,683 kg/d T-N out : - 795 kg/d T-N in Bio sludge* : - 222 kg/d
* Calculated from the following: 3,700 kg BIO-SS/d x 6 % N in BIO-SS = 222 kg N in BIO-SS/d
In total a mass balance for nitrate can be conducted:
DN = T-Nin –T-Nin Bio sludge – T-Nout
According to the above mass balance the following calculated amount of nitrate has to be converted by denitrification:
DN = 1,683 – 222 – 795 = 666 kg NO3-N/d
24 Test, demonstration and further development of the ARP process in China
The necessary denitrification volume depends on the denitrification rate at the current temperature, MLSS and % VSS. The theoretical denitrification rate at 12°C is 1.87 g NO3-N/kgVSS * h. At 4.0 kg MLSS/m³ and 75 % VSS the required anaerobic volume to convert 666 kg NO3-N/d is 4,950 m³. The nitrate concentration in the return sludge is assumed to be 11 mg/l, which corresponds to 332 kg/d at 45,000 m³/d and 67% return sludge ratio. The anaerobic tank is 3,400 m3. At 12°C it corresponds to a removal of 458 kg NO3-N/d, which is much more than the nitrate in the return sludge. Hence the anaerobic tank functions as a combined pre-denitrification tank that removes the nitrate in the return sludge and anaerobic BIO-P tank. The volume needed for denitrification (666 – 332 = 334 kg NO3-N/d) in the Orbal ditches is approximately 2,500 m3, which only corresponds to approximately 9 % of the total volume of the ditches. From the above calculation it can be concluded that it is possible to obtain some denitrification in the Orbal ditches despite the constant aeration. However, when the plant has to comply with the Class A1 standard, the plant operation must be changed in order to create better conditions for the denitrification. This is described in section 4. The total aeration capacity installed is 946 kg O2/h. During manual control only half of the equipment in each ring has been in operation. The available aeration capacity fits quite well with the influent and effluent data. The nitrification could be improved by increasing aeration in the aerated phases.
3.3.2 Problems with phosphorus removal In order for Wangjiashan wastewater treatment plant to comply with Class A1 standard the biological phosphorus removal must be improved. As shown by the calculations in the above section, the anaerobic tank is not strictly anaerobic, but mainly anoxic due to the high concentration of nitrate in the return sludge. This means that the right condition is not available in order to promote enhanced biological phosphorus removal. Without enhanced biological phosphorus removal the P content in SS will be approximately 1.5%. With a sludge production of 3,700 kg SS/d the result is that only 56 kg P/d will be built into the sludge. According to Table 4 the average phosphorus load is 158 kg P/l. If only 56 kg P/d is built into the sludge the result would be that 102 kg P/d is not removed, corresponding to 2.3 mg P/l in the effluent. Based on the receive data T-P in the effluent for 2010 has been < 2.1 mg P/l at all time and the average has been 1.2 mg P/l. This indicates that some biological phosphorus removal has taken place.
Test, demonstration and further development of the ARP process in China 25
4. Retrofitting of Wangjiashan wastewater treatment plant
Based on the analysis of the existing data and the existing plant configuration described in the previous section a plan for upgrading of Wangjiashan wastewater treatment plant has been conducted. These activities have taken place in EnviDan’s office in Denmark, at plant visits in Ma’anshan and at a design review meeting in Aihua’s office in Tianjin, China. All calculations are based on the data presented in section 3.2.
4.1 Capacity From the influent and effluent data presented in section 3.2 the capacity of the Wangjiashan wastewater treatment plant can be calculated to: 183,500 PE (on BOD) This is based on the following assumptions: ASA: 10.1 d rDN: 1.5 g N*kg VSS*h Volume: 29,500 m3 Temp: 10°C MLSS: 4 kg SS/m3
In the future the plant has to comply with Class A1 standard, hence the volume capacity will decrease compared to the reference situation with the effluent concentrations described in section 3. The capacity of the Wangjiashan wastewater treatment plant can be calculated to the following: 170,000 PE (on BOD) This is based on the following: ASA: 10.1 d rDN: 1.5 g N*kg VSS*h
Volume: 29,500 m3 Temp: 10°C MLSS: 4 kg MLSS/m3 The plant has sufficient capacity to reach an effluent standard of Class A1 without extension of volumes. However the aeration system has to be operated in a different way in order to increase nitrogen removal. Furthermore some of the nitrate produced in the middle ring must be brought to the outer ring for denitrification and the utilization of the incoming COD must be optimized.
26 Test, demonstration and further development of the ARP process in China
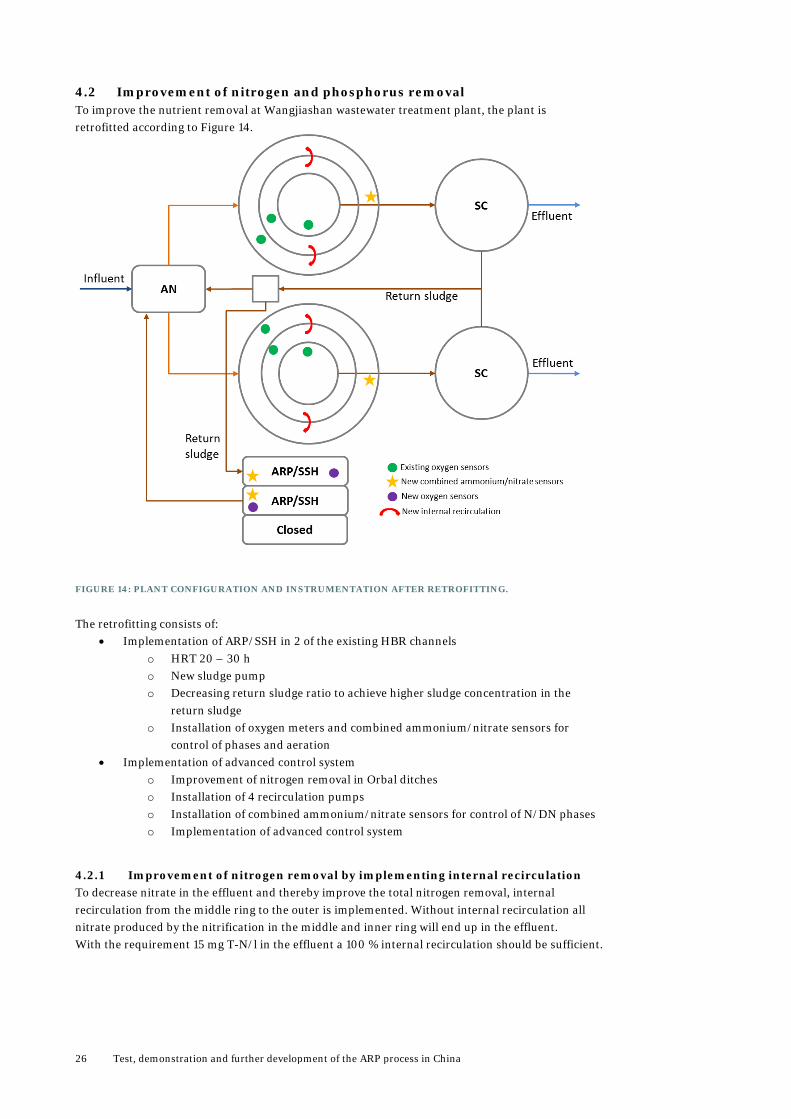
4.2 Improvement of nitrogen and phosphorus removal To improve the nutrient removal at Wangjiashan wastewater treatment plant, the plant is retrofitted according to Figure 14.
FIGURE 14: PLANT CONFIGURATION AND INSTRUMENTATION AFTER RETROFITTING.
The retrofitting consists of: • Implementation of ARP/SSH in 2 of the existing HBR channels
o HRT 20 – 30 h o New sludge pump o Decreasing return sludge ratio to achieve higher sludge concentration in the
return sludge o Installation of oxygen meters and combined ammonium/nitrate sensors for
control of phases and aeration • Implementation of advanced control system
o Improvement of nitrogen removal in Orbal ditches o Installation of 4 recirculation pumps o Installation of combined ammonium/nitrate sensors for control of N/DN phases o Implementation of advanced control system
4.2.1 Improvement of nitrogen removal by implementing internal recirculation To decrease nitrate in the effluent and thereby improve the total nitrogen removal, internal recirculation from the middle ring to the outer is implemented. Without internal recirculation all nitrate produced by the nitrification in the middle and inner ring will end up in the effluent. With the requirement 15 mg T-N/l in the effluent a 100 % internal recirculation should be sufficient.
Test, demonstration and further development of the ARP process in China 27
4.2.2 Capacity increase by ARP and SSH Wangjiashan wastewater treatment plant is upgraded by using EnviDan’s ARP and SSH concept. The ARP concept entails that a part of the sludge is moved from the main plant to the ARP tank, thereby decreasing the required capacity and aeration demand in the main plant for COD removal. The SSH concept entails that a sufficient amount of easily degradable COD can be produced, through hydrolysis, for the enhanced biological phosphorus removal. The hydrolysis process can probably produce easily degradable COD in excess which can be used for the denitrification in the main plant. This project aims at combining the two processes. The HBR ditches are equipped with both brush aerators and diffused air. The aeration capacity of the ditches is approximately 250 kg O2/h. By conducting an ARP in the ditches a part of the aeration demand in the main plant can be moved to the triple ditches, thereby enabling that the aeration equipment in the main plant can be operated as off for a longer period. This will increase the strict anoxic phases and thereby improve the conditions for denitrification. The following overview of the sludge can be done:
MLSS in main plant : 118 t MLSS MLSS in ARP/SSH : 60 t MLSS MLSS in anaerobic tank : 13.6 t MLSS
The volume in the combined ARP/SSH is predicted to be divided by 75% to ARP and 25% to SSH. As the ARP withholds approximately 27 % of the total sludge mass that is aerobic and anoxic, approximately 27 % of the total aeration demand for COD removal should be moved to the ARP. This corresponds to approximately 15 % of the total oxygen demand.
4.3 Increased control of the biological processes by online control A semi advanced control system is implemented in order to control the nitrogen removal as well as the biological phosphorus removal. The nitrogen removal is controlled by ammonia sensors placed in the outer ring. The ammonia sensors control the aeration equipment in the outer ring as on/off aeration between two set-points. If the ammonia concentration is high, the aeration equipment in the outer ring will be on, whereas if the ammonia concentration is low, only the mixers in the outer ring are on. The aeration in the inner and middle ring can only be controlled together. As the inner ring has no mixers the aeration must, as a minimum, be on once in a while, in order to keep the sludge suspended. The biological phosphorus removal in the Orbal ditches will not be controlled. The conditions in the inner ring on the way to the secondary clarifier will always be either aerobic or anoxic; hence there is no risk of a phosphorus release from the sludge to the water phase due to anaerobic conditions. In the combined ARP/SSH the biological phosphorus will be controlled in such a way that the amount of soluble COD produced is controlled by the amount of aeration in the tank.
The return sludge flow shall be controlled by the return sludge pumps. One pump is equipped with a frequency convertor. The pump with the frequency convertor will be in operation most of the time, unless the influent flow is below a defined set-point. In this case the pump with the frequency convertor operates on/off. If the necessary return sludge flow is higher than the flow from one pump, a pump without frequency convertor will be put into operation and operates together with the frequency controlled pump.
28 Test, demonstration and further development of the ARP process in China
5. Wangjiashan wastewater treatment plant after retrofitting (Phase 2)
This section includes a description of the operations of Wangjiashan wastewater treatment plant just after retrofitting (Phase 2 according to Figure 2). This includes a description and discussion of the influent and effluent data in the phase just after retrofitting (Phase 2). The data used in this section is the data received from the wastewater treatment plant for the period 7/5-25/7 2012. After the 25/7 the third phase (Phase 3 according to Figure 2) is initiated, the results from phase 3 are described in section Fejl! Henvisningskilde ikke fundet..
5.1 Load, effluent concentrations and operation, Wangjiashan wastewater treatment plant (Phase 2)
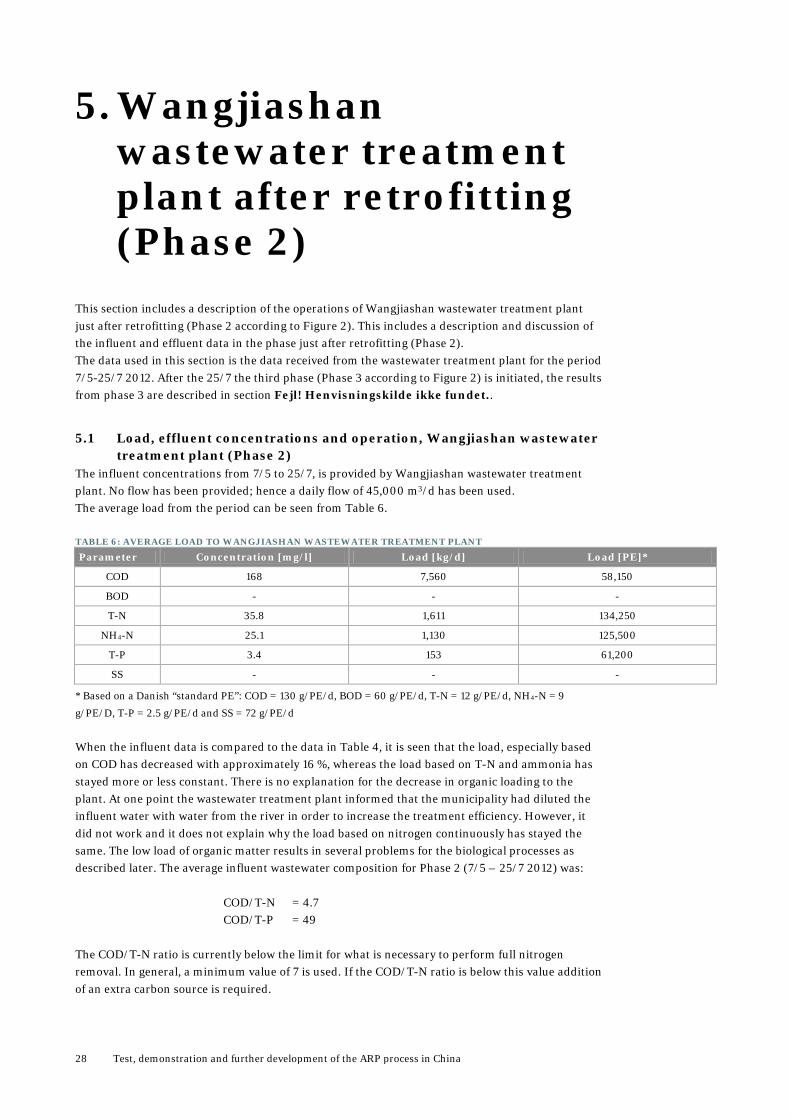
The influent concentrations from 7/5 to 25/7, is provided by Wangjiashan wastewater treatment plant. No flow has been provided; hence a daily flow of 45,000 m3/d has been used. The average load from the period can be seen from Table 6.
TABLE 6: AVERAGE LOAD TO WANGJIASHAN WASTEWATER TREATMENT PLANT
Parameter Concentration [mg/l] Load [kg/d] Load [PE]*
COD 168 7,560 58,150
BOD - - -
T-N 35.8 1,611 134,250
NH4-N 25.1 1,130 125,500
T-P 3.4 153 61,200
SS - - -
* Based on a Danish “standard PE”: COD = 130 g/PE/d, BOD = 60 g/PE/d, T-N = 12 g/PE/d, NH4-N = 9
g/PE/D, T-P = 2.5 g/PE/d and SS = 72 g/PE/d
When the influent data is compared to the data in Table 4, it is seen that the load, especially based on COD has decreased with approximately 16 %, whereas the load based on T-N and ammonia has stayed more or less constant. There is no explanation for the decrease in organic loading to the plant. At one point the wastewater treatment plant informed that the municipality had diluted the influent water with water from the river in order to increase the treatment efficiency. However, it did not work and it does not explain why the load based on nitrogen continuously has stayed the same. The low load of organic matter results in several problems for the biological processes as described later. The average influent wastewater composition for Phase 2 (7/5 – 25/7 2012) was:
COD/T-N = 4.7 COD/T-P = 49
The COD/T-N ratio is currently below the limit for what is necessary to perform full nitrogen removal. In general, a minimum value of 7 is used. If the COD/T-N ratio is below this value addition of an extra carbon source is required.
Test, demonstration and further development of the ARP process in China 29
For Wangjiashan wastewater treatment plant the following nitrogen balance can be made for phase 2:
T-N in : 1,611 kg/d T-N out (15 mg/l) : 608 kg/d T-N in Bio sludge* : 186 kg/d
* Calculated from the following: 3,100 kg BIO-SS/d x 6 % N in BIO-SS = 186 kg N in BIO-SS/d. γCOD = 0.41 kg
BIO-SS/kg COD
In total for denitrification: 1,611 – 608 – 186 = 817 kg/d From experience is known that approximately 9.5 g COD is needed in the raw wastewater in order to denitrify 1 g N. In order to denitrify 817 kg NO3-N/d a COD amount of: 9.5 x 817 = 7,762 kg COD/d + 17 mg COD/l in the effluent = 7,762 + 765 = 8,527 kg COD/d must be available. In phase 2 the average COD available in the influent was 7,560 kg/d. This means that there have been insufficient COD to reach a concentration of 15 mg T-N/l in the effluent. But as seen in Table 7 the average effluent T-N has been below 15 mg/l. This could be due to several reasons like the high wastewater temperature and the combined ARP and SSH processes, which produce easily degradable COD by hydrolysis of sludge. The COD/T-P ratio is still within the normal range and in theory it would be possible to perform biological phosphorus removal at the plant if anaerobic conditions are present. However, since there is too little organic matter for the denitrification, this process will be prioritized before the Phosphorus Accumulating Organisms (PAO) bacteria, hence there will be no organic matter left for the PAO bacteria. It should be kept in mind that the origin of the COD analyses is not known. The wastewater treatment plant has an online COD sensor in the influent and the data could have been from this sensor, just noted at any time during the day. The laboratory at the wastewater treatment plant also performs COD analysis and the data could also have been from the laboratory analysis. No matter the origin of the data, the data is based on initial samples taken directly from the influent; hence the sample represents the concentration at that moment and not the average concentration over the past 24 hours. For that matter, the actual COD concentration and load could be higher than stated in Table 6. There are no data for the sludge production during the period; the theoretical sludge production can be calculated using a yield factor estimated based on COD, BOD and SS. Since there are no BOD and SS samples for the influent in the current data set the ratio COD/BOD and COD/SS for 2010 is used to estimate the BOD and SS concentrations for the current period. A yield factor of 0.41 kg SS/kg COD can then be estimated. This gives a sludge production of 3,100 kg BIO-SS/d, which is 16% smaller than the sludge production in 2010. The small sludge production results in problem related to nutrient removal, because less nitrogen and phosphorus can be incorporated into the biological sludge. Also the sludge age will be much longer than in 2010, which will affect the biological activity (this will be discussed in section 8.1). The average SS concentration in the Orbal ditches during 2012 has been 4.2 kg SS/m3. The total plant volume is 29,500 m3 and 3.1 tons of sludge is produced every day. The sludge age is the total amount of sludge in the plant divided by the daily, produced sludge. From this the sludge age is calculated to be 39.5 days. The sludge age of 39.5 days only takes the sludge from the Orbal ditches into account; if the sludge in the ARP tank (2,500 m³) is included the total sludge age is increased to 47.0 days (with an average SS concentration in the ARP of 8.8 kg SS/m3).
30 Test, demonstration and further development of the ARP process in China
Microscopic examination of the sludge in the microscope confirms the long sludge age. The flocks are very small, there are hardly any larger organic fragments in and the activity from larger microorganisms is very limited. The sludge however, seems to settle nicely. The average effluent values from the first period after retrofitting the plant can be seen from Table 7.
TABLE 7: AVERAGE EFFLUENT VALUES FROM WANGJIASHAN WASTEWATER TREATMENT PLANT
Parameter Concentration [mg/l] Treatment efficiency [%]
COD 16.9 89
BOD - -
T-N 13.5 62
NH4-N 1.9 92
T-P 1.6 53
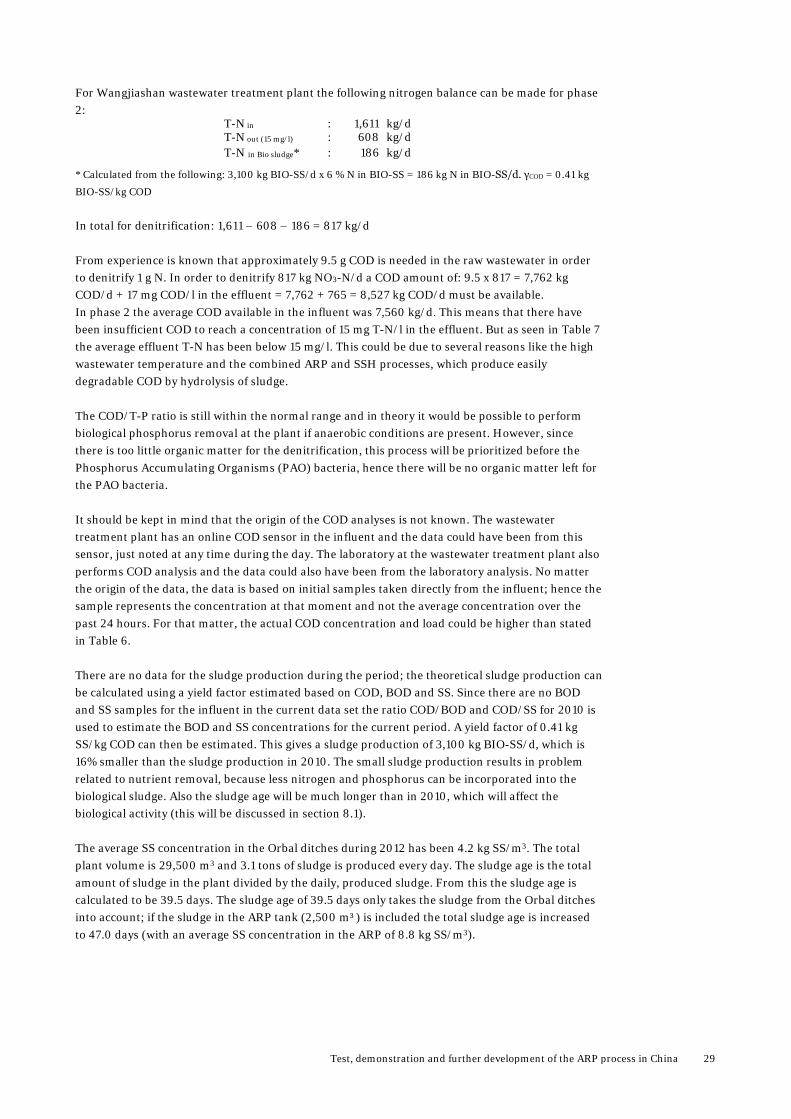
From Table 7 it can be seen that the treatment efficiency for COD is similar to the treatment efficiency in the first phase, before retrofitting. This was, however, expected. Most of the COD has previously been converted using air, whereas a greater part will be converted using nitrate in the current situation (due to the lower T-N concentration in the effluent). The treatment efficiency for T-N has increased from 51 % in the first phase to 62 % in this phase. This is due to the lower ammonia concentration in the effluent, which has decreased from 4.4 to 1.9 mg/l but also the denitrification has been improved. With regards to phosphorus the treatment efficiency has decreased, when comparing the data from Table 5 and Table 7. This is somehow expected due to the decrease in COD/T-P ratio. However it is difficult to compare the average effluent values due to the fact that this phase contains large deviations of the phosphorus concentration in the effluent. This can be seen from Figure 15.
FIGURE 15: EFFLUENT CONCENTRATIONS OF PO4-P FROM THE TWO ORBAL DITCHES IN PHASE 2
In the figure it can be seen that concentration of orthophosphate from the two ditches varies between 2.5 mg/l and 0.37 mg/l. This variation with high concentrations, especially in the beginning of the period, can be due to the fact that the bacteria for biological phosphorus removal have to increase in numbers. In the previous phase there were no strict anaerobic volumes; hence the PAO bacteria have been low in numbers compared to the heterotrophic bacteria. After operation
Change in ARP/SSH aeration
Test, demonstration and further development of the ARP process in China 31
time of approximately one month (more or less one sludge age) and a change in the aeration strategy in the ARP/SSH (see section 7.1), the concentration starts to decrease and stabilizes around 0.5-1 mg/l. From the graph in Figure 15 it must be concluded that the treatment efficiency has increased with regards to phosphorus.
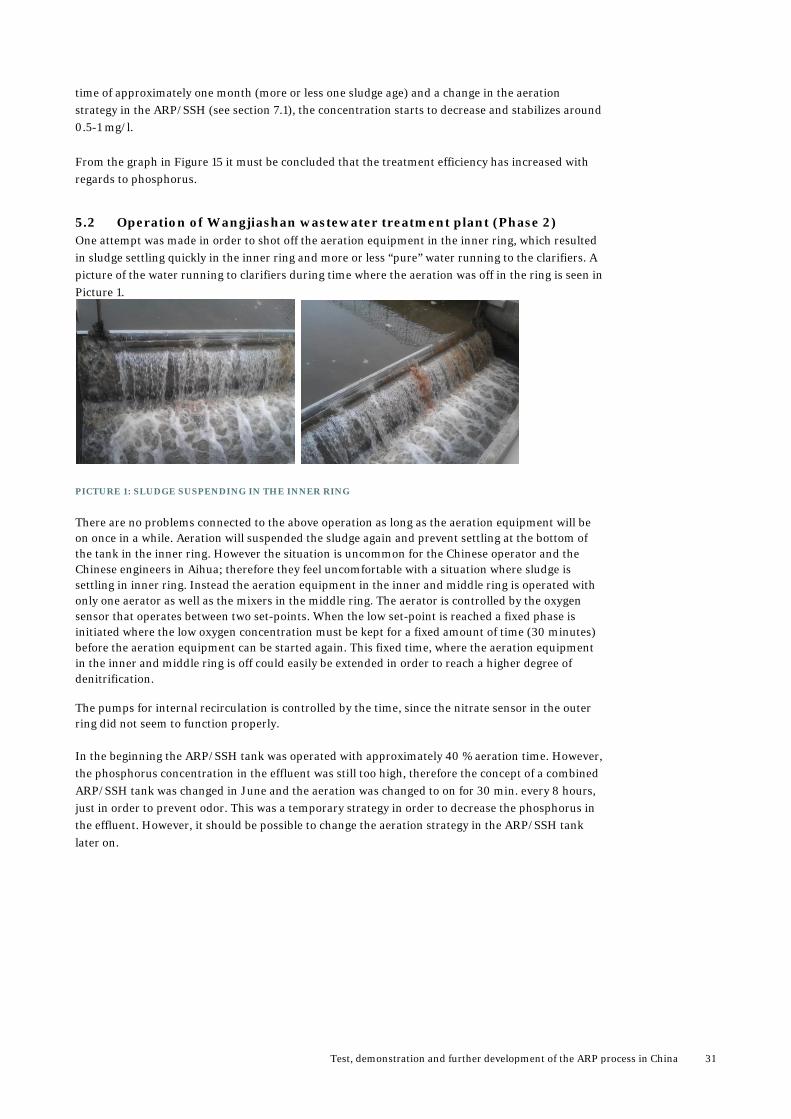
5.2 Operation of Wangjiashan wastewater treatment plant (Phase 2) One attempt was made in order to shot off the aeration equipment in the inner ring, which resulted in sludge settling quickly in the inner ring and more or less “pure” water running to the clarifiers. A picture of the water running to clarifiers during time where the aeration was off in the ring is seen in Picture 1.
PICTURE 1: SLUDGE SUSPENDING IN THE INNER RING
There are no problems connected to the above operation as long as the aeration equipment will be on once in a while. Aeration will suspended the sludge again and prevent settling at the bottom of the tank in the inner ring. However the situation is uncommon for the Chinese operator and the Chinese engineers in Aihua; therefore they feel uncomfortable with a situation where sludge is settling in inner ring. Instead the aeration equipment in the inner and middle ring is operated with only one aerator as well as the mixers in the middle ring. The aerator is controlled by the oxygen sensor that operates between two set-points. When the low set-point is reached a fixed phase is initiated where the low oxygen concentration must be kept for a fixed amount of time (30 minutes) before the aeration equipment can be started again. This fixed time, where the aeration equipment in the inner and middle ring is off could easily be extended in order to reach a higher degree of denitrification.
The pumps for internal recirculation is controlled by the time, since the nitrate sensor in the outer ring did not seem to function properly.
In the beginning the ARP/SSH tank was operated with approximately 40 % aeration time. However, the phosphorus concentration in the effluent was still too high, therefore the concept of a combined ARP/SSH tank was changed in June and the aeration was changed to on for 30 min. every 8 hours, just in order to prevent odor. This was a temporary strategy in order to decrease the phosphorus in the effluent. However, it should be possible to change the aeration strategy in the ARP/SSH tank later on.
32 Test, demonstration and further development of the ARP process in China
6. Wangjiashan wastewater treatment plant after retrofitting (Phase 3)
This section includes a description of the operations of Wangjiashan wastewater treatment plant in the second phase after retrofitting (Phase 3 according to Figure 2). This includes a description and discussion of the influent and effluent data in this phase. The data used in this section is the data received from the wastewater treatment plant for the period 25/7 2012 – 12/3 2013.
6.1 Load, effluent concentrations and operation, Wangjiashan wastewater treatment plant (Phase 3)
The influent concentrations from 26/7 2012 to 12/3 2013, is provided by Wangjiashan wastewater treatment plant. No flow has been provided. A daily average flow of 45,000 m3/d is assumed.
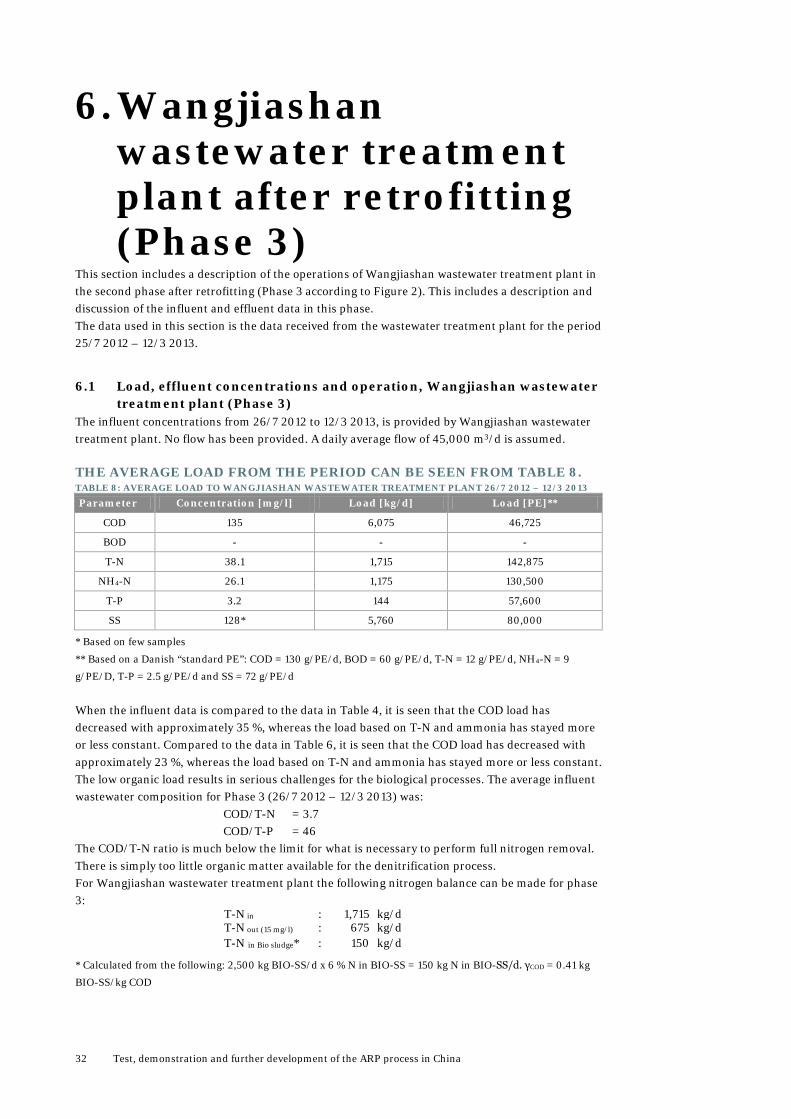
THE AVERAGE LOAD FROM THE PERIOD CAN BE SEEN FROM TABLE 8. TABLE 8: AVERAGE LOAD TO WANGJIASHAN WASTEWATER TREATMENT PLANT 26/7 2012 – 12/3 2013
Parameter Concentration [mg/l] Load [kg/d] Load [PE]**
COD 135 6,075 46,725
BOD - - -
T-N 38.1 1,715 142,875
NH4-N 26.1 1,175 130,500
T-P 3.2 144 57,600
SS 128* 5,760 80,000
* Based on few samples
** Based on a Danish “standard PE”: COD = 130 g/PE/d, BOD = 60 g/PE/d, T-N = 12 g/PE/d, NH4-N = 9
g/PE/D, T-P = 2.5 g/PE/d and SS = 72 g/PE/d
When the influent data is compared to the data in Table 4, it is seen that the COD load has decreased with approximately 35 %, whereas the load based on T-N and ammonia has stayed more or less constant. Compared to the data in Table 6, it is seen that the COD load has decreased with approximately 23 %, whereas the load based on T-N and ammonia has stayed more or less constant. The low organic load results in serious challenges for the biological processes. The average influent wastewater composition for Phase 3 (26/7 2012 – 12/3 2013) was:
COD/T-N = 3.7 COD/T-P = 46
The COD/T-N ratio is much below the limit for what is necessary to perform full nitrogen removal. There is simply too little organic matter available for the denitrification process. For Wangjiashan wastewater treatment plant the following nitrogen balance can be made for phase 3:
T-N in : 1,715 kg/d T-N out (15 mg/l) : 675 kg/d T-N in Bio sludge* : 150 kg/d
* Calculated from the following: 2,500 kg BIO-SS/d x 6 % N in BIO-SS = 150 kg N in BIO-SS/d. γCOD = 0.41 kg
BIO-SS/kg COD
Test, demonstration and further development of the ARP process in China 33
In total for denitrification: 1,715 – 675 – 145 = 890 kg/d From experience is known that approximately 9.5 g COD is needed in the raw wastewater in order to denitrify 1 g N. In order to denitrify 890 kg NO3-N/d a COD amount of: 9.5 x 890 = 8,455 kg COD/d + 21 mg COD/l in the effluent = 8,455 + 945 = 9,400 kg COD/d must be available. In phase 3 the average COD available in the influent was 6,075 kg/d. This means that there have been insufficient COD to reach a concentration of 15 mg T-N/l in the effluent. The reverse calculation can be made to estimate the possible denitrification and thereby the possible T-N in effluent can be estimated. COD available for denitrification: 6,075 kg/d – 945 kg/d = 5,130 kg/d Possible N to be denitrified: 5,130 kg/d / 9.5 kg/kg = 540 kg/d T-Nout = 1,715 kg/d – 150 kg/d – 540 kg/d = 1,025 kg/d => 22.8 mg/l at 45,000 m³/d.
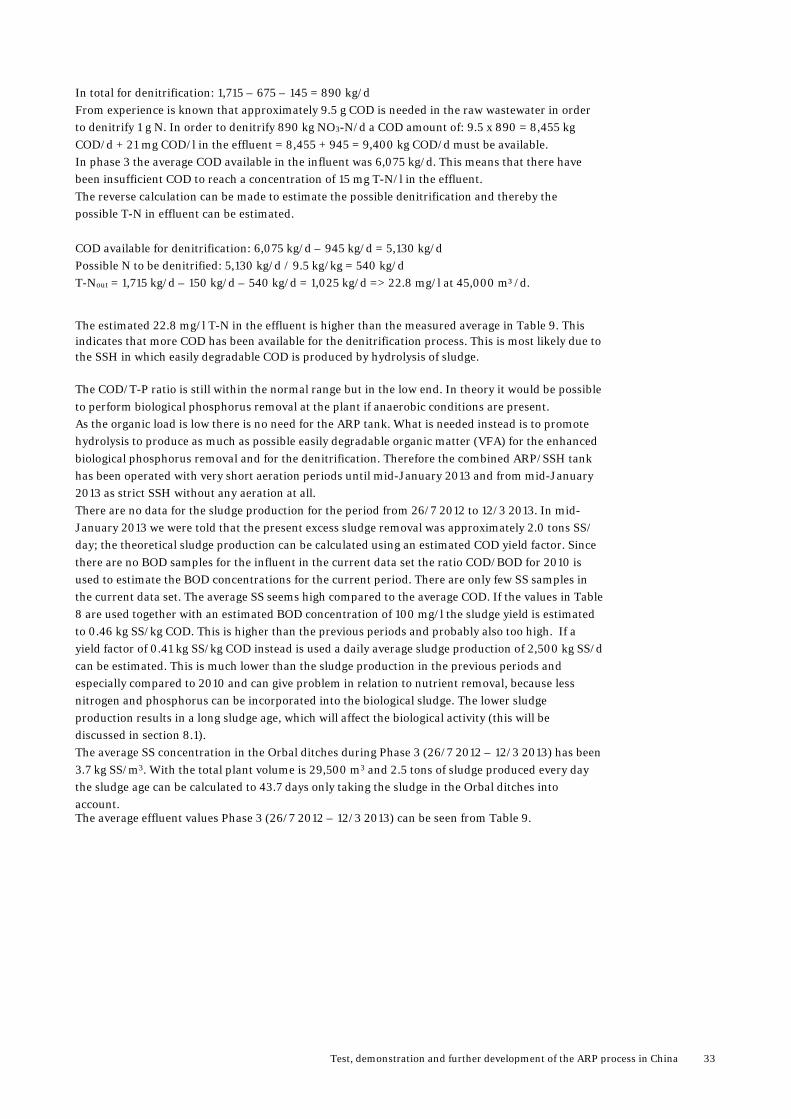
The estimated 22.8 mg/l T-N in the effluent is higher than the measured average in Table 9. This indicates that more COD has been available for the denitrification process. This is most likely due to the SSH in which easily degradable COD is produced by hydrolysis of sludge.
The COD/T-P ratio is still within the normal range but in the low end. In theory it would be possible to perform biological phosphorus removal at the plant if anaerobic conditions are present. As the organic load is low there is no need for the ARP tank. What is needed instead is to promote hydrolysis to produce as much as possible easily degradable organic matter (VFA) for the enhanced biological phosphorus removal and for the denitrification. Therefore the combined ARP/SSH tank has been operated with very short aeration periods until mid-January 2013 and from mid-January 2013 as strict SSH without any aeration at all. There are no data for the sludge production for the period from 26/7 2012 to 12/3 2013. In mid-January 2013 we were told that the present excess sludge removal was approximately 2.0 tons SS/ day; the theoretical sludge production can be calculated using an estimated COD yield factor. Since there are no BOD samples for the influent in the current data set the ratio COD/BOD for 2010 is used to estimate the BOD concentrations for the current period. There are only few SS samples in the current data set. The average SS seems high compared to the average COD. If the values in Table 8 are used together with an estimated BOD concentration of 100 mg/l the sludge yield is estimated to 0.46 kg SS/kg COD. This is higher than the previous periods and probably also too high. If a yield factor of 0.41 kg SS/kg COD instead is used a daily average sludge production of 2,500 kg SS/d can be estimated. This is much lower than the sludge production in the previous periods and especially compared to 2010 and can give problem in relation to nutrient removal, because less nitrogen and phosphorus can be incorporated into the biological sludge. The lower sludge production results in a long sludge age, which will affect the biological activity (this will be discussed in section 8.1). The average SS concentration in the Orbal ditches during Phase 3 (26/7 2012 – 12/3 2013) has been 3.7 kg SS/m3. With the total plant volume is 29,500 m3 and 2.5 tons of sludge produced every day the sludge age can be calculated to 43.7 days only taking the sludge in the Orbal ditches into account. The average effluent values Phase 3 (26/7 2012 – 12/3 2013) can be seen from Table 9.
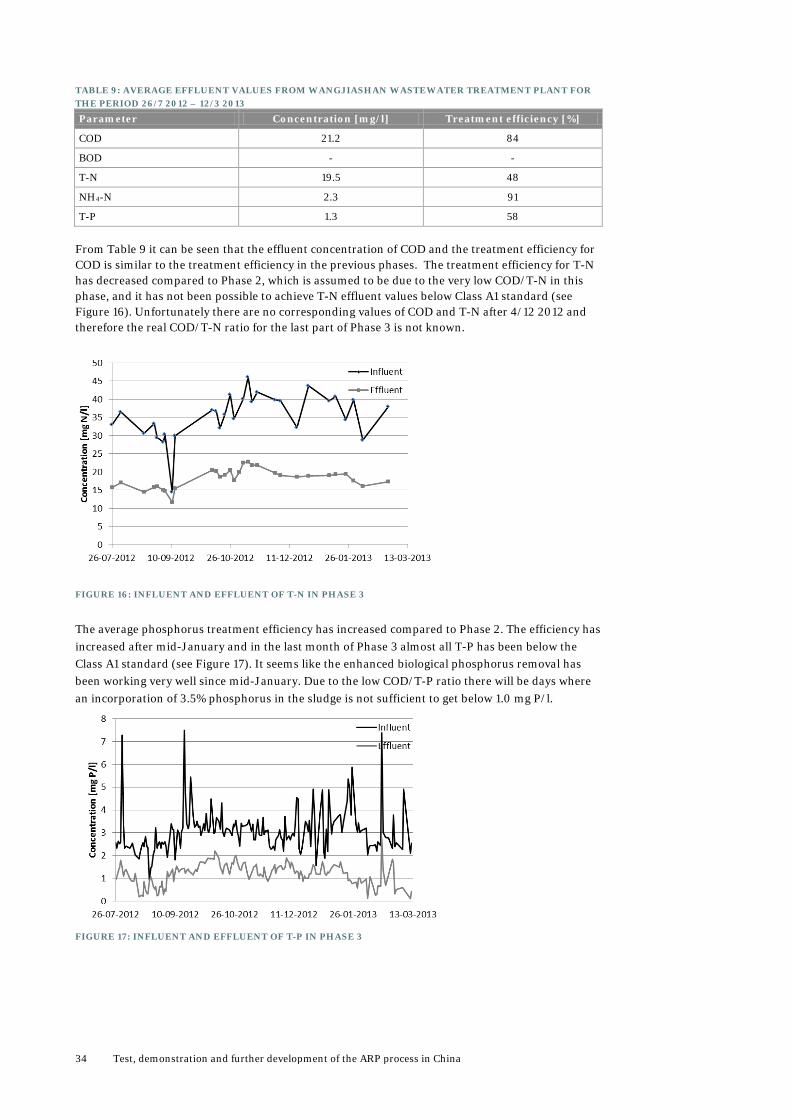
34 Test, demonstration and further development of the ARP process in China
TABLE 9: AVERAGE EFFLUENT VALUES FROM WANGJIASHAN WASTEWATER TREATMENT PLANT FOR THE PERIOD 26/7 2012 – 12/3 2013
Parameter Concentration [mg/l] Treatment efficiency [%]
COD 21.2 84
BOD - -
T-N 19.5 48
NH4-N 2.3 91
T-P 1.3 58
From Table 9 it can be seen that the effluent concentration of COD and the treatment efficiency for COD is similar to the treatment efficiency in the previous phases. The treatment efficiency for T-N has decreased compared to Phase 2, which is assumed to be due to the very low COD/T-N in this phase, and it has not been possible to achieve T-N effluent values below Class A1 standard (see Figure 16). Unfortunately there are no corresponding values of COD and T-N after 4/12 2012 and therefore the real COD/T-N ratio for the last part of Phase 3 is not known.
FIGURE 16: INFLUENT AND EFFLUENT OF T-N IN PHASE 3
The average phosphorus treatment efficiency has increased compared to Phase 2. The efficiency has increased after mid-January and in the last month of Phase 3 almost all T-P has been below the Class A1 standard (see Figure 17). It seems like the enhanced biological phosphorus removal has been working very well since mid-January. Due to the low COD/T-P ratio there will be days where an incorporation of 3.5% phosphorus in the sludge is not sufficient to get below 1.0 mg P/l.
FIGURE 17: INFLUENT AND EFFLUENT OF T-P IN PHASE 3
Test, demonstration and further development of the ARP process in China 35
6.2 Operation of Wangjiashan wastewater treatment plant (Phase 3) The operation of the plant has not been stable as several incidents with mechanical equipment and instruments have occurred during the period.
Amongst other has there been a problem with the on-line combined ammonia / nitrate sensors. It seems like the lifetime for the cartridge is much shorter than stated by the supplier. It meant that new cartridges had to be delivered. Due to delivery time the plant was without the ammonia control for a longer period.
None of the oxygen meters has shown correct results and has therefore not been used in the control of the aeration equipment.
Concerning the mechanical equipment the internal recirculation has been operated with three out of four pumps as one pump has been damaged. This means that one of the Orbal ditches has been operated with only one pump. Furthermore the pumps has, until 9/1 2013, been operated 16 h/d. After this day the operation time was increased to 20 h/d. The intention was continuously operation 24 h/d but Aihuas engineer at the plant was of that view that the pumps need pauses due to the quality of the pump.
It was foreseen and recommended to have four disc aerators in operation in the N phases in each outer ring. Of these four aerators it was only possible to operate three in automatic. Due to this, one aerator was in operation all the time (both in N and DN phases) and three aerators was turned on and off according to the control. In mid-January 2013 the aerator, which could not operate in automatic, was stopped and the operation continued with three aerators in operation in N phases. This decision was made to achieve strict anoxic condition in the DN phases and thereby improve the denitrification.
Until mid-January 2013 the combined ARP/SSH tank was operated with 30 min aeration every 8th hour. After mid-January the combined ARP/SSH was operated without any aeration at all.
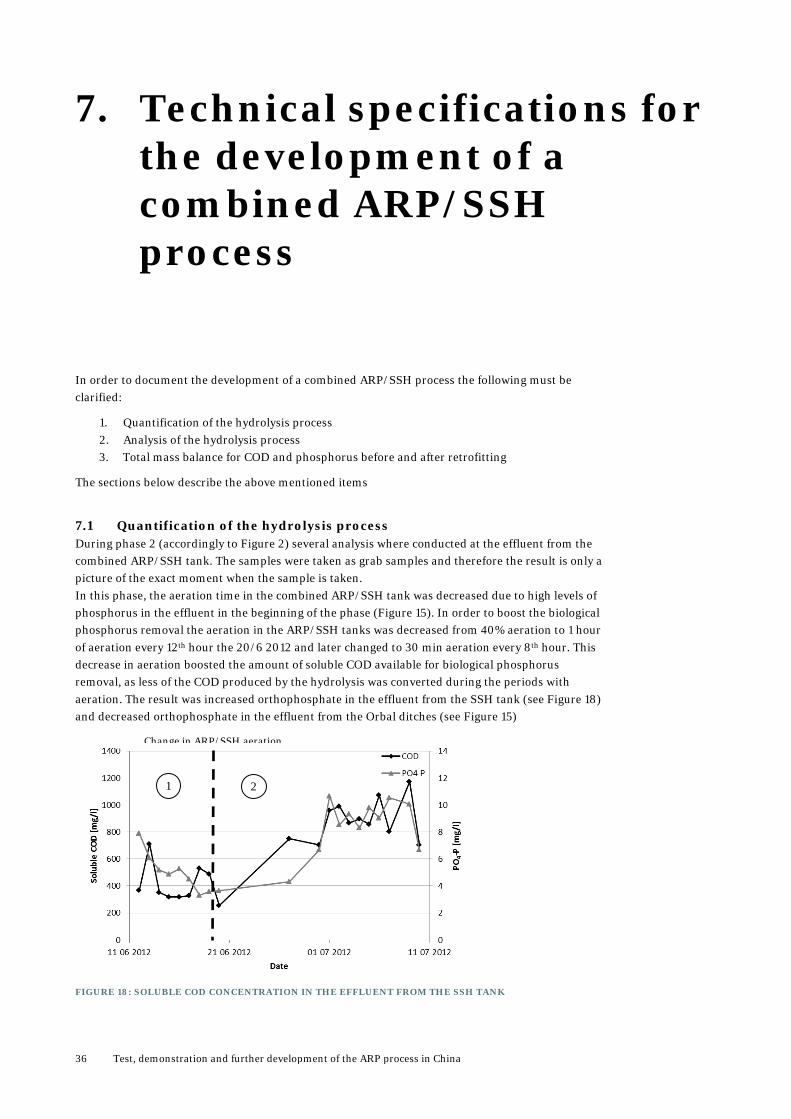
36 Test, demonstration and further development of the ARP process in China
7. Technical specifications for the development of a combined ARP/SSH process
In order to document the development of a combined ARP/SSH process the following must be clarified:
1. Quantification of the hydrolysis process 2. Analysis of the hydrolysis process 3. Total mass balance for COD and phosphorus before and after retrofitting
The sections below describe the above mentioned items
7.1 Quantification of the hydrolysis process During phase 2 (accordingly to Figure 2) several analysis where conducted at the effluent from the combined ARP/SSH tank. The samples were taken as grab samples and therefore the result is only a picture of the exact moment when the sample is taken. In this phase, the aeration time in the combined ARP/SSH tank was decreased due to high levels of phosphorus in the effluent in the beginning of the phase (Figure 15). In order to boost the biological phosphorus removal the aeration in the ARP/SSH tanks was decreased from 40% aeration to 1 hour of aeration every 12th hour the 20/6 2012 and later changed to 30 min aeration every 8th hour. This decrease in aeration boosted the amount of soluble COD available for biological phosphorus removal, as less of the COD produced by the hydrolysis was converted during the periods with aeration. The result was increased orthophosphate in the effluent from the SSH tank (see Figure 18) and decreased orthophosphate in the effluent from the Orbal ditches (see Figure 15)
FIGURE 18: SOLUBLE COD CONCENTRATION IN THE EFFLUENT FROM THE SSH TANK
Change in ARP/SSH aeration
1 2
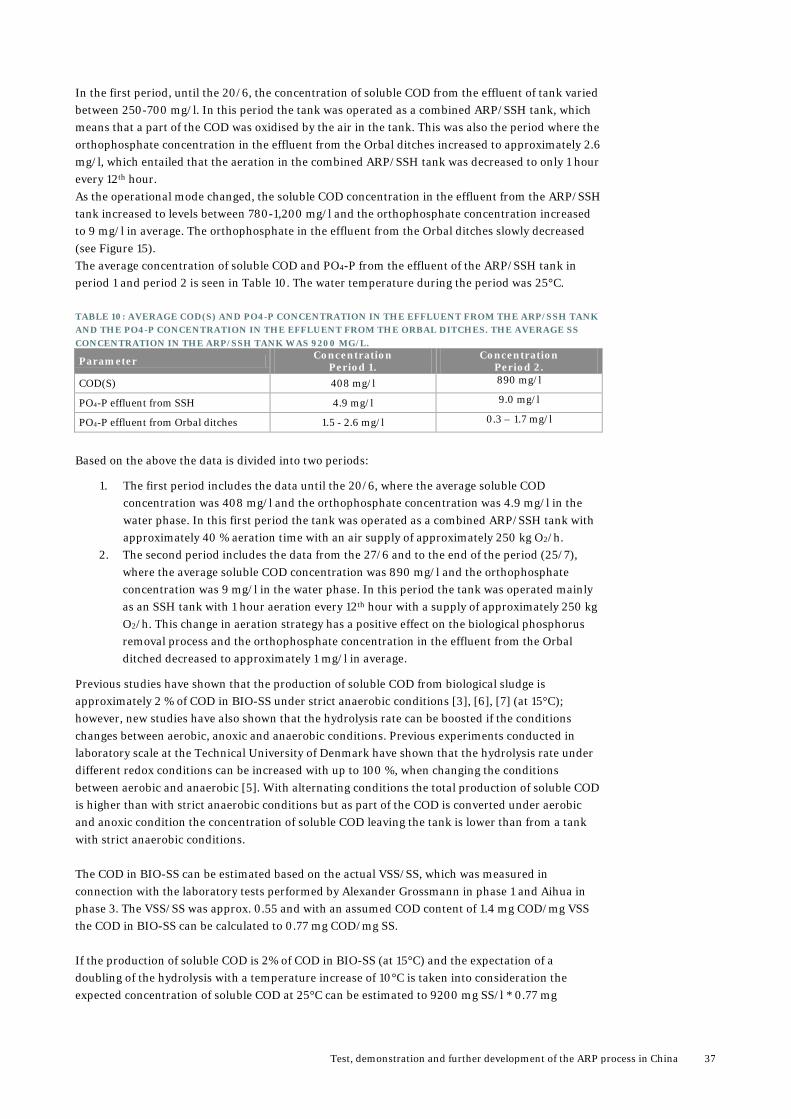
Test, demonstration and further development of the ARP process in China 37
In the first period, until the 20/6, the concentration of soluble COD from the effluent of tank varied between 250-700 mg/l. In this period the tank was operated as a combined ARP/SSH tank, which means that a part of the COD was oxidised by the air in the tank. This was also the period where the orthophosphate concentration in the effluent from the Orbal ditches increased to approximately 2.6 mg/l, which entailed that the aeration in the combined ARP/SSH tank was decreased to only 1 hour every 12th hour. As the operational mode changed, the soluble COD concentration in the effluent from the ARP/SSH tank increased to levels between 780-1,200 mg/l and the orthophosphate concentration increased to 9 mg/l in average. The orthophosphate in the effluent from the Orbal ditches slowly decreased (see Figure 15). The average concentration of soluble COD and PO4-P from the effluent of the ARP/SSH tank in period 1 and period 2 is seen in Table 10. The water temperature during the period was 25°C.
TABLE 10: AVERAGE COD(S) AND PO4-P CONCENTRATION IN THE EFFLUENT FROM THE ARP/SSH TANK AND THE PO4-P CONCENTRATION IN THE EFFLUENT FROM THE ORBAL DITCHES. THE AVERAGE SS CONCENTRATION IN THE ARP/SSH TANK WAS 9200 MG/L.
Parameter Concentration Period 1.
Concentration Period 2.
COD(S) 408 mg/l 890 mg/l
PO4-P effluent from SSH 4.9 mg/l 9.0 mg/l
PO4-P effluent from Orbal ditches 1.5 - 2.6 mg/l 0.3 – 1.7 mg/l
Based on the above the data is divided into two periods:
1. The first period includes the data until the 20/6, where the average soluble COD concentration was 408 mg/l and the orthophosphate concentration was 4.9 mg/l in the water phase. In this first period the tank was operated as a combined ARP/SSH tank with approximately 40 % aeration time with an air supply of approximately 250 kg O2/h.
2. The second period includes the data from the 27/6 and to the end of the period (25/7), where the average soluble COD concentration was 890 mg/l and the orthophosphate concentration was 9 mg/l in the water phase. In this period the tank was operated mainly as an SSH tank with 1 hour aeration every 12th hour with a supply of approximately 250 kg O2/h. This change in aeration strategy has a positive effect on the biological phosphorus removal process and the orthophosphate concentration in the effluent from the Orbal ditched decreased to approximately 1 mg/l in average.
Previous studies have shown that the production of soluble COD from biological sludge is approximately 2 % of COD in BIO-SS under strict anaerobic conditions [3], [6], [7] (at 15°C); however, new studies have also shown that the hydrolysis rate can be boosted if the conditions changes between aerobic, anoxic and anaerobic conditions. Previous experiments conducted in laboratory scale at the Technical University of Denmark have shown that the hydrolysis rate under different redox conditions can be increased with up to 100 %, when changing the conditions between aerobic and anaerobic [5]. With alternating conditions the total production of soluble COD is higher than with strict anaerobic conditions but as part of the COD is converted under aerobic and anoxic condition the concentration of soluble COD leaving the tank is lower than from a tank with strict anaerobic conditions. The COD in BIO-SS can be estimated based on the actual VSS/SS, which was measured in connection with the laboratory tests performed by Alexander Grossmann in phase 1 and Aihua in phase 3. The VSS/SS was approx. 0.55 and with an assumed COD content of 1.4 mg COD/mg VSS the COD in BIO-SS can be calculated to 0.77 mg COD/mg SS. If the production of soluble COD is 2% of COD in BIO-SS (at 15°C) and the expectation of a doubling of the hydrolysis with a temperature increase of 10°C is taken into consideration the expected concentration of soluble COD at 25°C can be estimated to 9200 mg SS/l * 0.77 mg
38 Test, demonstration and further development of the ARP process in China
COD/mg SS * 2% * 2 = 283 mg/l. A quite higher concentration of soluble COD is measured especially for the period with less aeration in the ARP/SSH. There are several possible errors that could have taken place during the analysis of the soluble COD, some are mentioned below:
1. The time where the samples was taken. This is especially important in relation to the first operational mode. If the sample has been taken right after an aerobic or an anoxic phase, the concentration of soluble COD will be lower than if the sample was taken in the end of anaerobic phase.
2. The filtration of the sample. The samples were not filtrated, but where left in a bottle to settle, where after the supernatant was used for the analysis. The sample could therefore contain some particulate COD.
3. COD analysis. The COD analysis itself contains some standard deviations, which could influence the results.
4. VSS analysis. If the VSS is measured too low the COD in the sludge is estimated too low too.
7.2 Analysis of the hydrolysis products During the first phase (accordingly to Figure 2) attempts were made to clarify the products from the hydrolysis. During experiments at lower temperatures (15 ºC) test have found that the hydrolysis products mainly consist of short chained fatty acids. However the fermentation process changes accordingly to the temperature; hence it would have been interesting to analyze the hydrolysis products under higher temperatures and in full scale. VFA has to be analyzed on a gas chromatograph, which is not available at Wangjiashan wastewater treatment plant or in the laboratories at Aihua. Therefore the analysis of the products from the hydrolysis took place in the laboratories at Tianjin University. The analysis went wrong in the execution; hence there are no results from the analysis of the hydrolysis products during phase 1. It was decided not to carry out these tests in phase 3 as no references were available.
7.3 Total mass balance for COD and Phosphorus In order to see if a greater part of the COD is being converted due to the extra aeration in the ARP/SSH tank mass balances for COD are conducted for all phases of the project (accordingly to Figure 2). Furthermore full mass balances for phosphorus have been conducted in order to verify the uptake of phosphorus into the biological sludge and thereby evaluate if the efficiency of the biological phosphorus removal has been improved throughout the project phases. 7.3.1 Mass balance for COD Wangjiashan wastewater treatment plant constitutes of one-stage wastewater treatment without primary clarifiers and without digestion of the sludge; hence the following mass balance can be conducted for the plant: COD in = COD out + COD Sludge + COD converted
An overview of the mass balances conducted for phase 1, phase 2 and phase 3 can be seen in Table 11.
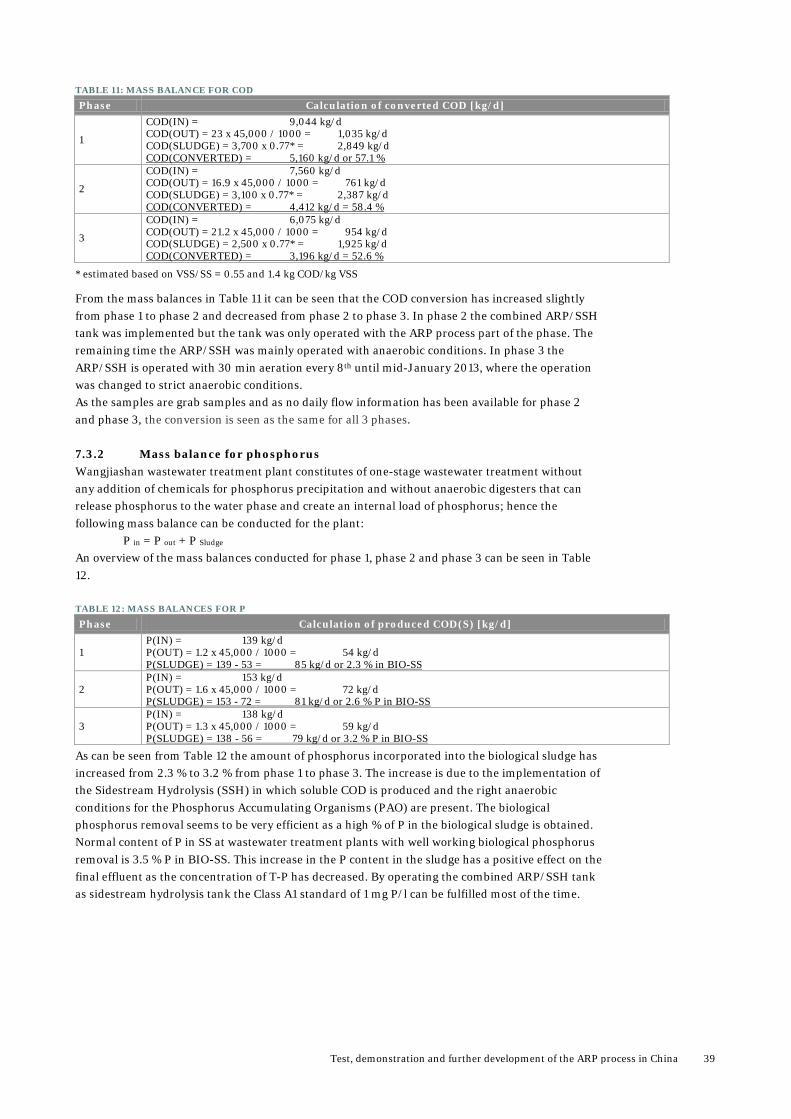
Test, demonstration and further development of the ARP process in China 39
TABLE 11: MASS BALANCE FOR COD
Phase Calculation of converted COD [kg/d]
1
COD(IN) = 9,044 kg/d COD(OUT) = 23 x 45,000 / 1000 = 1,035 kg/d COD(SLUDGE) = 3,700 x 0.77* = 2,849 kg/d COD(CONVERTED) = 5,160 kg/d or 57.1 %
2
COD(IN) = 7,560 kg/d COD(OUT) = 16.9 x 45,000 / 1000 = 761 kg/d COD(SLUDGE) = 3,100 x 0.77* = 2,387 kg/d COD(CONVERTED) = 4,412 kg/d = 58.4 %
3
COD(IN) = 6,075 kg/d COD(OUT) = 21.2 x 45,000 / 1000 = 954 kg/d COD(SLUDGE) = 2,500 x 0.77* = 1,925 kg/d COD(CONVERTED) = 3,196 kg/d = 52.6 %
* estimated based on VSS/SS = 0.55 and 1.4 kg COD/kg VSS
From the mass balances in Table 11 it can be seen that the COD conversion has increased slightly from phase 1 to phase 2 and decreased from phase 2 to phase 3. In phase 2 the combined ARP/SSH tank was implemented but the tank was only operated with the ARP process part of the phase. The remaining time the ARP/SSH was mainly operated with anaerobic conditions. In phase 3 the ARP/SSH is operated with 30 min aeration every 8th until mid-January 2013, where the operation was changed to strict anaerobic conditions. As the samples are grab samples and as no daily flow information has been available for phase 2 and phase 3, the conversion is seen as the same for all 3 phases. 7.3.2 Mass balance for phosphorus Wangjiashan wastewater treatment plant constitutes of one-stage wastewater treatment without any addition of chemicals for phosphorus precipitation and without anaerobic digesters that can release phosphorus to the water phase and create an internal load of phosphorus; hence the following mass balance can be conducted for the plant: P in = P out + P Sludge
An overview of the mass balances conducted for phase 1, phase 2 and phase 3 can be seen in Table 12.
TABLE 12: MASS BALANCES FOR P
Phase Calculation of produced COD(S) [kg/d]
1 P(IN) = 139 kg/d P(OUT) = 1.2 x 45,000 / 1000 = 54 kg/d P(SLUDGE) = 139 - 53 = 85 kg/d or 2.3 % in BIO-SS
2 P(IN) = 153 kg/d P(OUT) = 1.6 x 45,000 / 1000 = 72 kg/d P(SLUDGE) = 153 - 72 = 81 kg/d or 2.6 % P in BIO-SS
3 P(IN) = 138 kg/d P(OUT) = 1.3 x 45,000 / 1000 = 59 kg/d P(SLUDGE) = 138 - 56 = 79 kg/d or 3.2 % P in BIO-SS
As can be seen from Table 12 the amount of phosphorus incorporated into the biological sludge has increased from 2.3 % to 3.2 % from phase 1 to phase 3. The increase is due to the implementation of the Sidestream Hydrolysis (SSH) in which soluble COD is produced and the right anaerobic conditions for the Phosphorus Accumulating Organisms (PAO) are present. The biological phosphorus removal seems to be very efficient as a high % of P in the biological sludge is obtained. Normal content of P in SS at wastewater treatment plants with well working biological phosphorus removal is 3.5 % P in BIO-SS. This increase in the P content in the sludge has a positive effect on the final effluent as the concentration of T-P has decreased. By operating the combined ARP/SSH tank as sidestream hydrolysis tank the Class A1 standard of 1 mg P/l can be fulfilled most of the time.
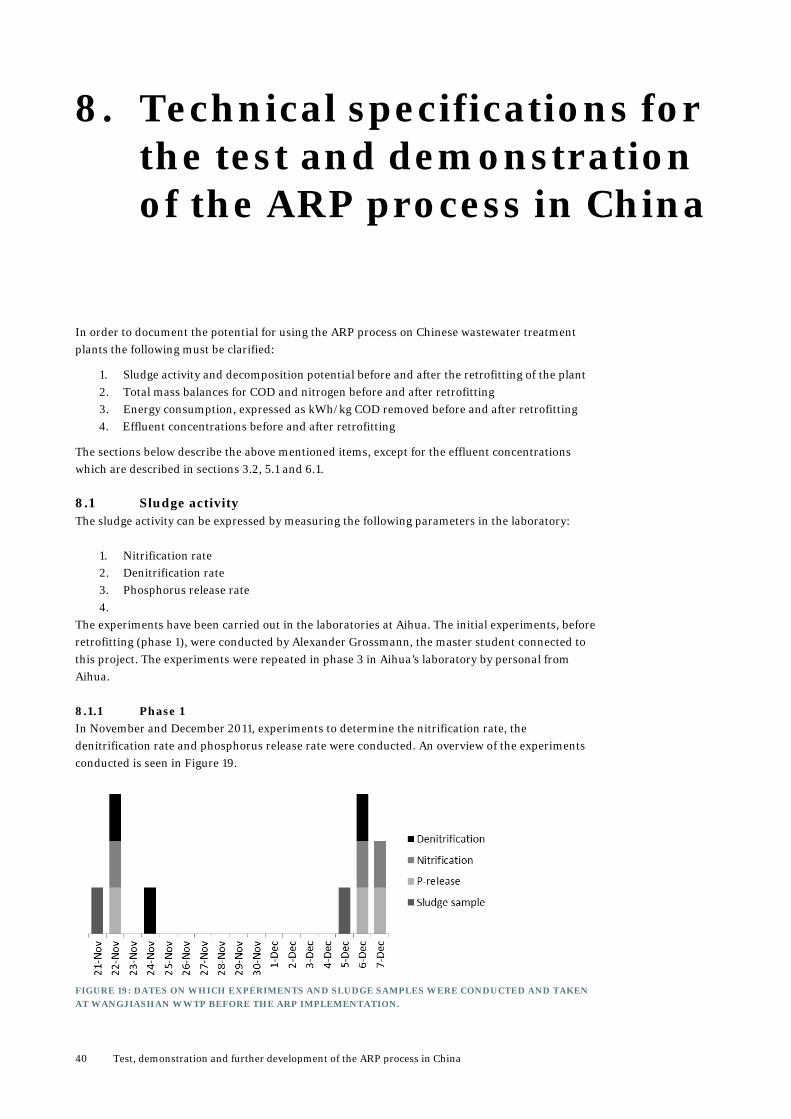
40 Test, demonstration and further development of the ARP process in China
8. Technical specifications for the test and demonstration of the ARP process in China
In order to document the potential for using the ARP process on Chinese wastewater treatment plants the following must be clarified:
1. Sludge activity and decomposition potential before and after the retrofitting of the plant 2. Total mass balances for COD and nitrogen before and after retrofitting 3. Energy consumption, expressed as kWh/kg COD removed before and after retrofitting 4. Effluent concentrations before and after retrofitting
The sections below describe the above mentioned items, except for the effluent concentrations which are described in sections 3.2, 5.1 and 6.1. 8.1 Sludge activity The sludge activity can be expressed by measuring the following parameters in the laboratory:
1. Nitrification rate 2. Denitrification rate 3. Phosphorus release rate 4.
The experiments have been carried out in the laboratories at Aihua. The initial experiments, before retrofitting (phase 1), were conducted by Alexander Grossmann, the master student connected to this project. The experiments were repeated in phase 3 in Aihua’s laboratory by personal from Aihua. 8.1.1 Phase 1 In November and December 2011, experiments to determine the nitrification rate, the denitrification rate and phosphorus release rate were conducted. An overview of the experiments conducted is seen in Figure 19.
FIGURE 19: DATES ON WHICH EXPERIMENTS AND SLUDGE SAMPLES WERE CONDUCTED AND TAKEN AT WANGJIASHAN WWTP BEFORE THE ARP IMPLEMENTATION.
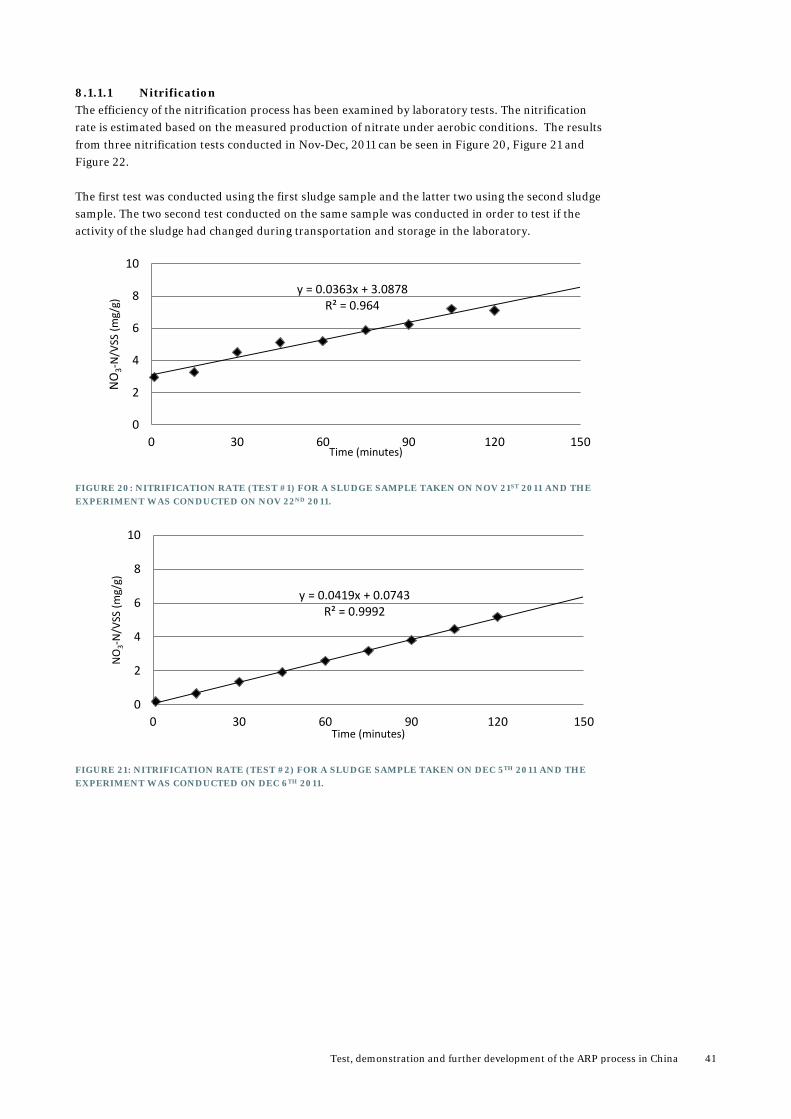
Test, demonstration and further development of the ARP process in China 41
8.1.1.1 Nitrification The efficiency of the nitrification process has been examined by laboratory tests. The nitrification rate is estimated based on the measured production of nitrate under aerobic conditions. The results from three nitrification tests conducted in Nov-Dec, 2011 can be seen in Figure 20, Figure 21 and Figure 22. The first test was conducted using the first sludge sample and the latter two using the second sludge sample. The two second test conducted on the same sample was conducted in order to test if the activity of the sludge had changed during transportation and storage in the laboratory.
FIGURE 20: NITRIFICATION RATE (TEST #1) FOR A SLUDGE SAMPLE TAKEN ON NOV 21ST 2011 AND THE EXPERIMENT WAS CONDUCTED ON NOV 22ND 2011.
FIGURE 21: NITRIFICATION RATE (TEST #2) FOR A SLUDGE SAMPLE TAKEN ON DEC 5TH 2011 AND THE EXPERIMENT WAS CONDUCTED ON DEC 6TH 2011.
y = 0.0363x + 3.0878 R² = 0.964
0
2
4
6
8
10
0 30 60 90 120 150
NO
3-N
/VSS
(mg/
g)
Time (minutes)
y = 0.0419x + 0.0743 R² = 0.9992
0
2
4
6
8
10
0 30 60 90 120 150
NO
3-N
/VSS
(mg/
g)
Time (minutes)
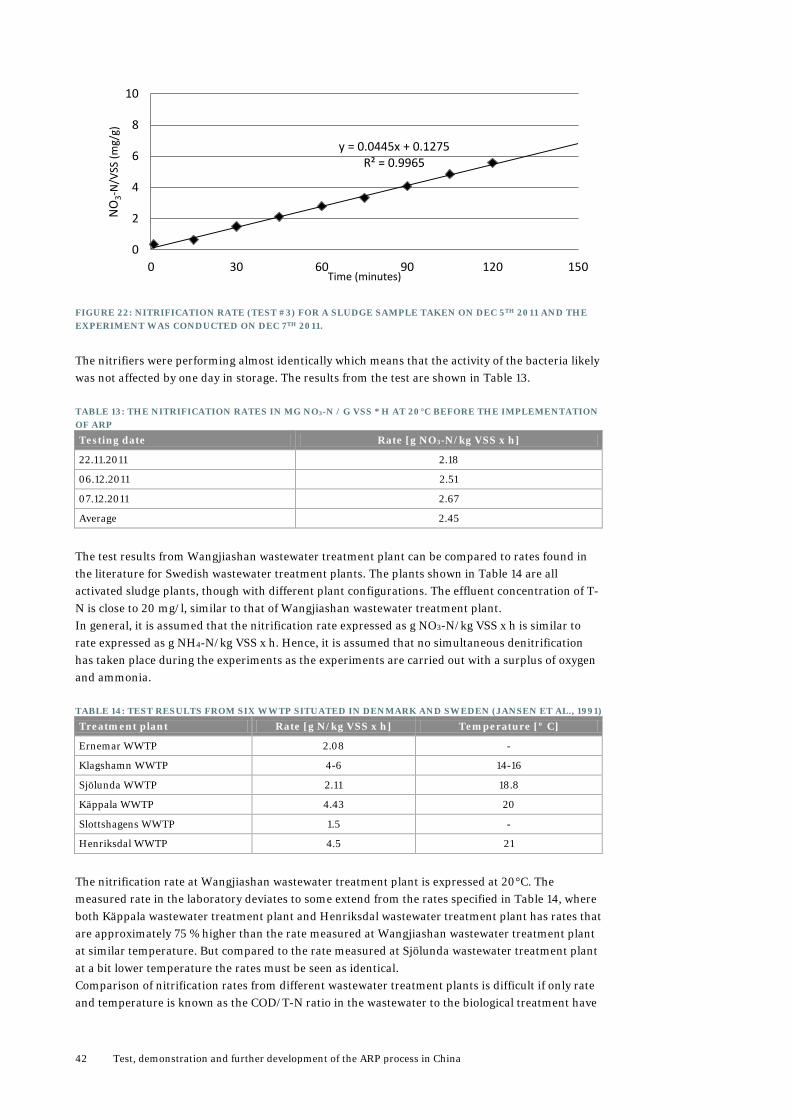
42 Test, demonstration and further development of the ARP process in China
FIGURE 22: NITRIFICATION RATE (TEST #3) FOR A SLUDGE SAMPLE TAKEN ON DEC 5TH 2011 AND THE EXPERIMENT WAS CONDUCTED ON DEC 7TH 2011.
The nitrifiers were performing almost identically which means that the activity of the bacteria likely was not affected by one day in storage. The results from the test are shown in Table 13.
TABLE 13: THE NITRIFICATION RATES IN MG NO3-N / G VSS * H AT 20°C BEFORE THE IMPLEMENTATION OF ARP
Testing date Rate [g NO3-N/kg VSS x h]
22.11.2011 2.18
06.12.2011 2.51
07.12.2011 2.67
Average 2.45
The test results from Wangjiashan wastewater treatment plant can be compared to rates found in the literature for Swedish wastewater treatment plants. The plants shown in Table 14 are all activated sludge plants, though with different plant configurations. The effluent concentration of T-N is close to 20 mg/l, similar to that of Wangjiashan wastewater treatment plant. In general, it is assumed that the nitrification rate expressed as g NO3-N/kg VSS x h is similar to rate expressed as g NH4-N/kg VSS x h. Hence, it is assumed that no simultaneous denitrification has taken place during the experiments as the experiments are carried out with a surplus of oxygen and ammonia.
TABLE 14: TEST RESULTS FROM SIX WWTP SITUATED IN DENMARK AND SWEDEN (JANSEN ET AL., 1991)
Treatment plant Rate [g N/kg VSS x h] Temperature [º C]
Ernemar WWTP 2.08 -
Klagshamn WWTP 4-6 14-16
Sjölunda WWTP 2.11 18.8
Käppala WWTP 4.43 20
Slottshagens WWTP 1.5 -
Henriksdal WWTP 4.5 21
The nitrification rate at Wangjiashan wastewater treatment plant is expressed at 20°C. The measured rate in the laboratory deviates to some extend from the rates specified in Table 14, where both Käppala wastewater treatment plant and Henriksdal wastewater treatment plant has rates that are approximately 75 % higher than the rate measured at Wangjiashan wastewater treatment plant at similar temperature. But compared to the rate measured at Sjölunda wastewater treatment plant at a bit lower temperature the rates must be seen as identical. Comparison of nitrification rates from different wastewater treatment plants is difficult if only rate and temperature is known as the COD/T-N ratio in the wastewater to the biological treatment have
y = 0.0445x + 0.1275 R² = 0.9965
0
2
4
6
8
10
0 30 60 90 120 150
NO
3-N
/VSS
(mg/
g)
Time (minutes)
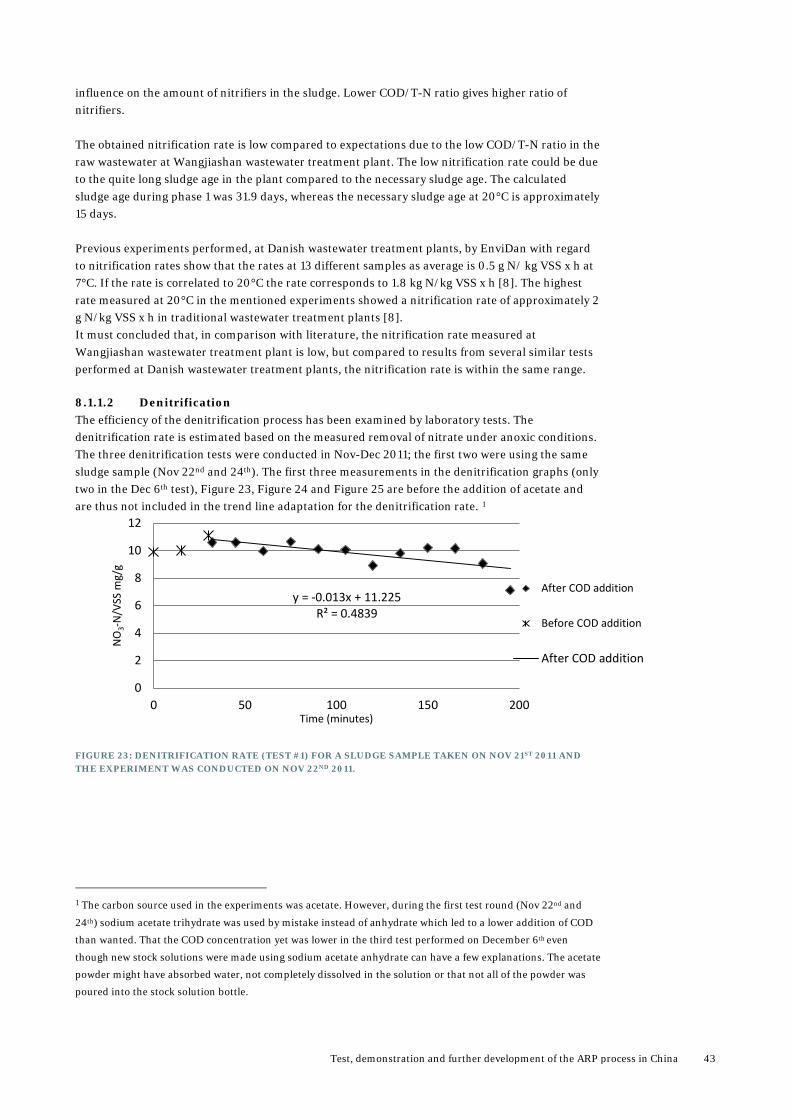
Test, demonstration and further development of the ARP process in China 43
influence on the amount of nitrifiers in the sludge. Lower COD/T-N ratio gives higher ratio of nitrifiers. The obtained nitrification rate is low compared to expectations due to the low COD/T-N ratio in the raw wastewater at Wangjiashan wastewater treatment plant. The low nitrification rate could be due to the quite long sludge age in the plant compared to the necessary sludge age. The calculated sludge age during phase 1 was 31.9 days, whereas the necessary sludge age at 20°C is approximately 15 days. Previous experiments performed, at Danish wastewater treatment plants, by EnviDan with regard to nitrification rates show that the rates at 13 different samples as average is 0.5 g N/ kg VSS x h at 7°C. If the rate is correlated to 20°C the rate corresponds to 1.8 kg N/kg VSS x h [8]. The highest rate measured at 20°C in the mentioned experiments showed a nitrification rate of approximately 2 g N/kg VSS x h in traditional wastewater treatment plants [8]. It must concluded that, in comparison with literature, the nitrification rate measured at Wangjiashan wastewater treatment plant is low, but compared to results from several similar tests performed at Danish wastewater treatment plants, the nitrification rate is within the same range.
8.1.1.2 Denitrification The efficiency of the denitrification process has been examined by laboratory tests. The denitrification rate is estimated based on the measured removal of nitrate under anoxic conditions. The three denitrification tests were conducted in Nov-Dec 2011; the first two were using the same sludge sample (Nov 22nd and 24th). The first three measurements in the denitrification graphs (only two in the Dec 6th test), Figure 23, Figure 24 and Figure 25 are before the addition of acetate and are thus not included in the trend line adaptation for the denitrification rate. 1
FIGURE 23: DENITRIFICATION RATE (TEST #1) FOR A SLUDGE SAMPLE TAKEN ON NOV 21ST 2011 AND THE EXPERIMENT WAS CONDUCTED ON NOV 22ND 2011.
1 The carbon source used in the experiments was acetate. However, during the first test round (Nov 22nd and
24th) sodium acetate trihydrate was used by mistake instead of anhydrate which led to a lower addition of COD
than wanted. That the COD concentration yet was lower in the third test performed on December 6th even
though new stock solutions were made using sodium acetate anhydrate can have a few explanations. The acetate
powder might have absorbed water, not completely dissolved in the solution or that not all of the powder was
poured into the stock solution bottle.
y = -0.013x + 11.225 R² = 0.4839
0
2
4
6
8
10
12
0 50 100 150 200
NO
3-N
/VSS
mg/
g
Time (minutes)
After COD addition
Before COD addition
After COD addition
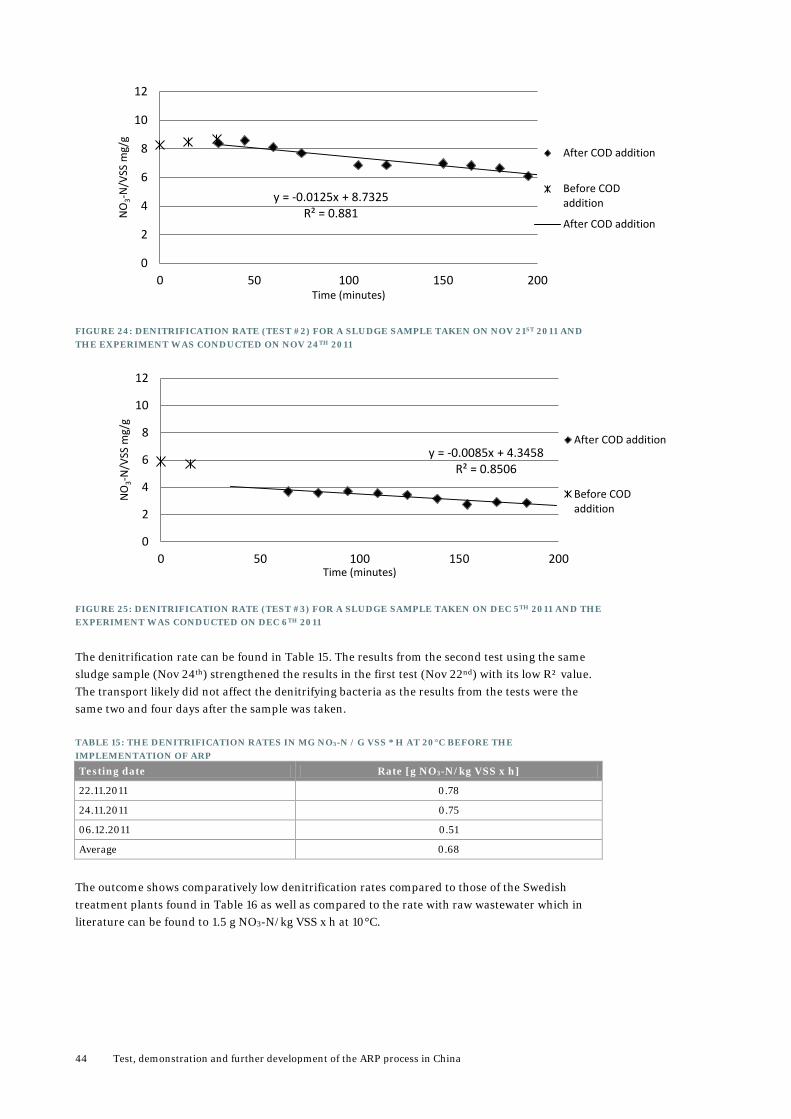
44 Test, demonstration and further development of the ARP process in China
FIGURE 24: DENITRIFICATION RATE (TEST #2) FOR A SLUDGE SAMPLE TAKEN ON NOV 21ST 2011 AND THE EXPERIMENT WAS CONDUCTED ON NOV 24TH 2011
FIGURE 25: DENITRIFICATION RATE (TEST #3) FOR A SLUDGE SAMPLE TAKEN ON DEC 5TH 2011 AND THE EXPERIMENT WAS CONDUCTED ON DEC 6TH 2011
The denitrification rate can be found in Table 15. The results from the second test using the same sludge sample (Nov 24th) strengthened the results in the first test (Nov 22nd) with its low R² value. The transport likely did not affect the denitrifying bacteria as the results from the tests were the same two and four days after the sample was taken.
TABLE 15: THE DENITRIFICATION RATES IN MG NO3-N / G VSS * H AT 20°C BEFORE THE IMPLEMENTATION OF ARP
Testing date Rate [g NO3-N/kg VSS x h]
22.11.2011 0.78
24.11.2011 0.75
06.12.2011 0.51
Average 0.68
The outcome shows comparatively low denitrification rates compared to those of the Swedish treatment plants found in Table 16 as well as compared to the rate with raw wastewater which in literature can be found to 1.5 g NO3-N/kg VSS x h at 10°C.
y = -0.0125x + 8.7325 R² = 0.881
0
2
4
6
8
10
12
0 50 100 150 200
NO
3-N
/VSS
mg/
g
Time (minutes)
After COD addition
Before CODaddition
After COD addition
y = -0.0085x + 4.3458 R² = 0.8506
0
2
4
6
8
10
12
0 50 100 150 200
NO
3-N
/VSS
mg/
g
Time (minutes)
After COD addition
Before CODaddition
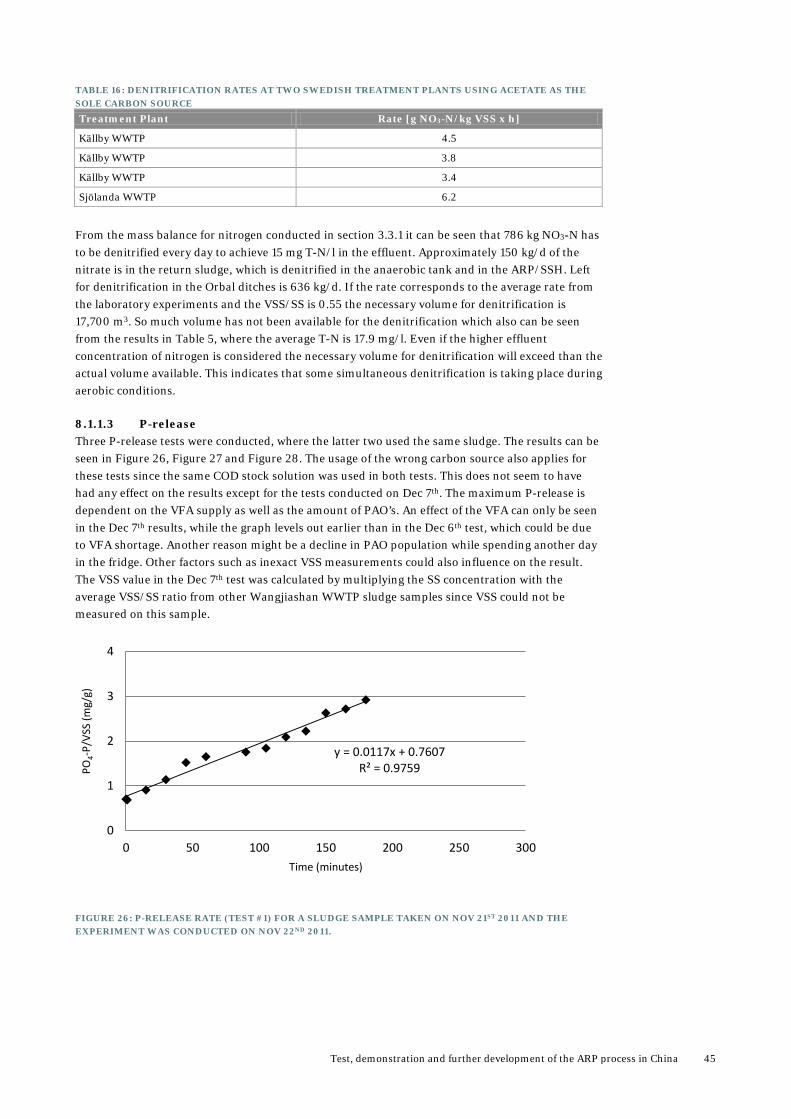
Test, demonstration and further development of the ARP process in China 45
TABLE 16: DENITRIFICATION RATES AT TWO SWEDISH TREATMENT PLANTS USING ACETATE AS THE SOLE CARBON SOURCE
Treatment Plant Rate [g NO3-N/kg VSS x h]
Källby WWTP 4.5
Källby WWTP 3.8
Källby WWTP 3.4
Sjölanda WWTP 6.2
From the mass balance for nitrogen conducted in section 3.3.1 it can be seen that 786 kg NO3-N has to be denitrified every day to achieve 15 mg T-N/l in the effluent. Approximately 150 kg/d of the nitrate is in the return sludge, which is denitrified in the anaerobic tank and in the ARP/SSH. Left for denitrification in the Orbal ditches is 636 kg/d. If the rate corresponds to the average rate from the laboratory experiments and the VSS/SS is 0.55 the necessary volume for denitrification is 17,700 m3. So much volume has not been available for the denitrification which also can be seen from the results in Table 5, where the average T-N is 17.9 mg/l. Even if the higher effluent concentration of nitrogen is considered the necessary volume for denitrification will exceed than the actual volume available. This indicates that some simultaneous denitrification is taking place during aerobic conditions.
8.1.1.3 P-release Three P-release tests were conducted, where the latter two used the same sludge. The results can be seen in Figure 26, Figure 27 and Figure 28. The usage of the wrong carbon source also applies for these tests since the same COD stock solution was used in both tests. This does not seem to have had any effect on the results except for the tests conducted on Dec 7th. The maximum P-release is dependent on the VFA supply as well as the amount of PAO’s. An effect of the VFA can only be seen in the Dec 7th results, while the graph levels out earlier than in the Dec 6th test, which could be due to VFA shortage. Another reason might be a decline in PAO population while spending another day in the fridge. Other factors such as inexact VSS measurements could also influence on the result. The VSS value in the Dec 7th test was calculated by multiplying the SS concentration with the average VSS/SS ratio from other Wangjiashan WWTP sludge samples since VSS could not be measured on this sample.
FIGURE 26: P-RELEASE RATE (TEST #1) FOR A SLUDGE SAMPLE TAKEN ON NOV 21ST 2011 AND THE EXPERIMENT WAS CONDUCTED ON NOV 22ND 2011.
y = 0.0117x + 0.7607 R² = 0.9759
0
1
2
3
4
0 50 100 150 200 250 300
PO4-
P/VS
S (m
g/g)
Time (minutes)
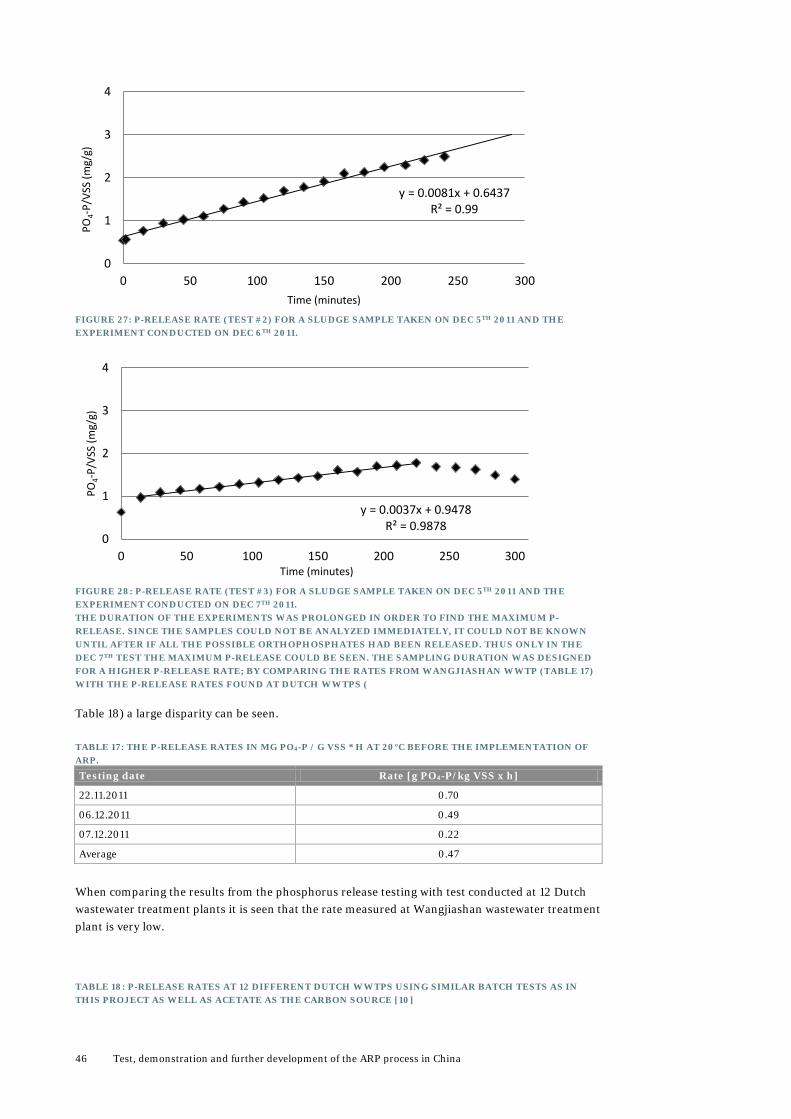
46 Test, demonstration and further development of the ARP process in China
FIGURE 27: P-RELEASE RATE (TEST #2) FOR A SLUDGE SAMPLE TAKEN ON DEC 5TH 2011 AND THE EXPERIMENT CONDUCTED ON DEC 6TH 2011.
FIGURE 28: P-RELEASE RATE (TEST #3) FOR A SLUDGE SAMPLE TAKEN ON DEC 5TH 2011 AND THE EXPERIMENT CONDUCTED ON DEC 7TH 2011. THE DURATION OF THE EXPERIMENTS WAS PROLONGED IN ORDER TO FIND THE MAXIMUM P-RELEASE. SINCE THE SAMPLES COULD NOT BE ANALYZED IMMEDIATELY, IT COULD NOT BE KNOWN UNTIL AFTER IF ALL THE POSSIBLE ORTHOPHOSPHATES HAD BEEN RELEASED. THUS ONLY IN THE DEC 7TH TEST THE MAXIMUM P-RELEASE COULD BE SEEN. THE SAMPLING DURATION WAS DESIGNED FOR A HIGHER P-RELEASE RATE; BY COMPARING THE RATES FROM WANGJIASHAN WWTP (TABLE 17) WITH THE P-RELEASE RATES FOUND AT DUTCH WWTPS (
Table 18) a large disparity can be seen.
TABLE 17: THE P-RELEASE RATES IN MG PO4-P / G VSS * H AT 20°C BEFORE THE IMPLEMENTATION OF ARP.
Testing date Rate [g PO4-P/kg VSS x h]
22.11.2011 0.70
06.12.2011 0.49
07.12.2011 0.22
Average 0.47
When comparing the results from the phosphorus release testing with test conducted at 12 Dutch wastewater treatment plants it is seen that the rate measured at Wangjiashan wastewater treatment plant is very low.
TABLE 18: P-RELEASE RATES AT 12 DIFFERENT DUTCH WWTPS USING SIMILAR BATCH TESTS AS IN THIS PROJECT AS WELL AS ACETATE AS THE CARBON SOURCE [10]
y = 0.0081x + 0.6437 R² = 0.99
0
1
2
3
4
0 50 100 150 200 250 300
PO4-
P/VS
S (m
g/g)
Time (minutes)
y = 0.0037x + 0.9478 R² = 0.9878
0
1
2
3
4
0 50 100 150 200 250 300
PO4-
P/VS
S (m
g/g)
Time (minutes)
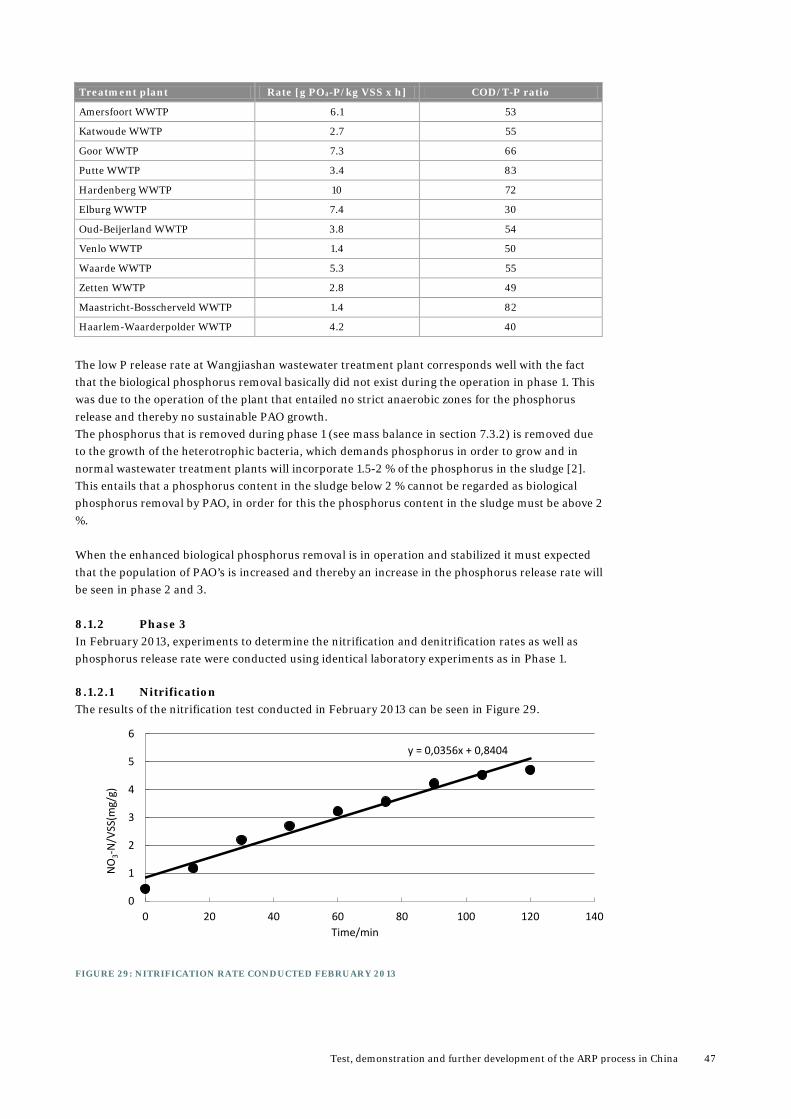
Test, demonstration and further development of the ARP process in China 47
Treatment plant Rate [g PO4-P/kg VSS x h] COD/T-P ratio
Amersfoort WWTP 6.1 53
Katwoude WWTP 2.7 55
Goor WWTP 7.3 66
Putte WWTP 3.4 83
Hardenberg WWTP 10 72
Elburg WWTP 7.4 30
Oud-Beijerland WWTP 3.8 54
Venlo WWTP 1.4 50
Waarde WWTP 5.3 55
Zetten WWTP 2.8 49
Maastricht-Bosscherveld WWTP 1.4 82
Haarlem-Waarderpolder WWTP 4.2 40
The low P release rate at Wangjiashan wastewater treatment plant corresponds well with the fact that the biological phosphorus removal basically did not exist during the operation in phase 1. This was due to the operation of the plant that entailed no strict anaerobic zones for the phosphorus release and thereby no sustainable PAO growth. The phosphorus that is removed during phase 1 (see mass balance in section 7.3.2) is removed due to the growth of the heterotrophic bacteria, which demands phosphorus in order to grow and in normal wastewater treatment plants will incorporate 1.5-2 % of the phosphorus in the sludge [2]. This entails that a phosphorus content in the sludge below 2 % cannot be regarded as biological phosphorus removal by PAO, in order for this the phosphorus content in the sludge must be above 2 %. When the enhanced biological phosphorus removal is in operation and stabilized it must expected that the population of PAO’s is increased and thereby an increase in the phosphorus release rate will be seen in phase 2 and 3. 8.1.2 Phase 3 In February 2013, experiments to determine the nitrification and denitrification rates as well as phosphorus release rate were conducted using identical laboratory experiments as in Phase 1.
8.1.2.1 Nitrification The results of the nitrification test conducted in February 2013 can be seen in Figure 29.
FIGURE 29: NITRIFICATION RATE CONDUCTED FEBRUARY 2013
y = 0,0356x + 0,8404
0
1
2
3
4
5
6
0 20 40 60 80 100 120 140
NO
3-N
/VSS
(mg/
g)
Time/min
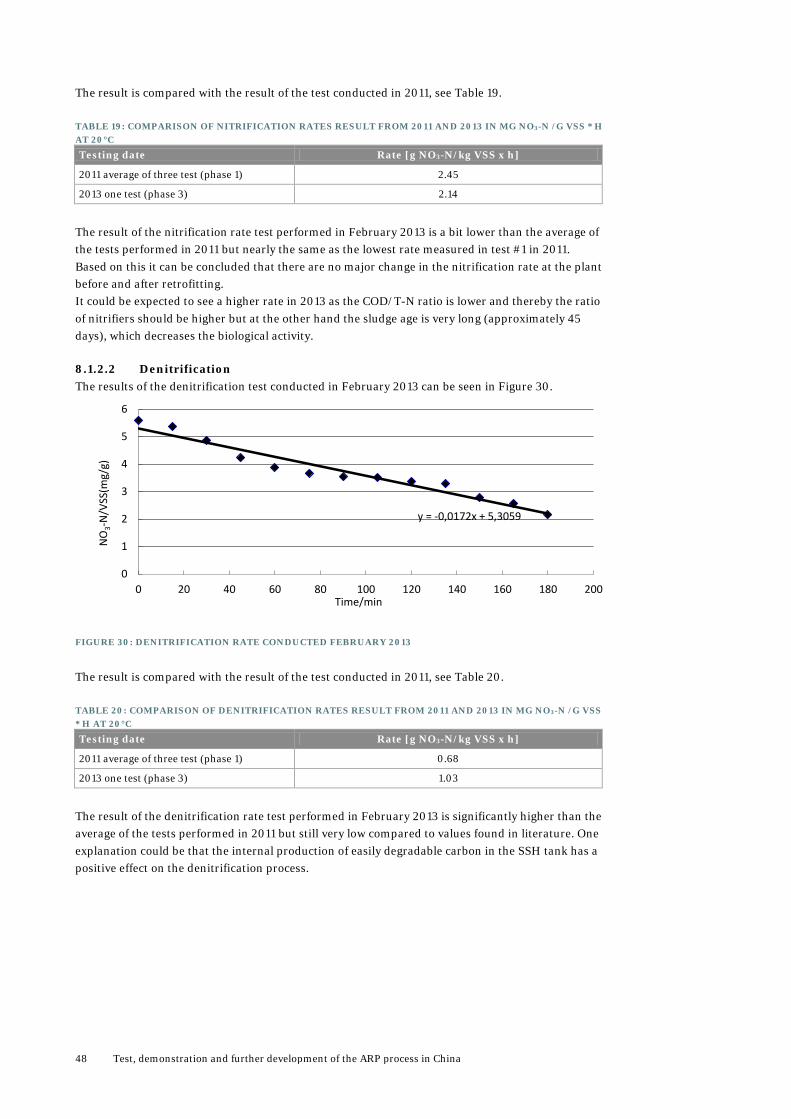
48 Test, demonstration and further development of the ARP process in China
The result is compared with the result of the test conducted in 2011, see Table 19.
TABLE 19: COMPARISON OF NITRIFICATION RATES RESULT FROM 2011 AND 2013 IN MG NO3-N /G VSS * H AT 20°C
Testing date Rate [g NO3-N/kg VSS x h]
2011 average of three test (phase 1) 2.45
2013 one test (phase 3) 2.14
The result of the nitrification rate test performed in February 2013 is a bit lower than the average of the tests performed in 2011 but nearly the same as the lowest rate measured in test #1 in 2011. Based on this it can be concluded that there are no major change in the nitrification rate at the plant before and after retrofitting. It could be expected to see a higher rate in 2013 as the COD/T-N ratio is lower and thereby the ratio of nitrifiers should be higher but at the other hand the sludge age is very long (approximately 45 days), which decreases the biological activity.
8.1.2.2 Denitrification The results of the denitrification test conducted in February 2013 can be seen in Figure 30.
FIGURE 30: DENITRIFICATION RATE CONDUCTED FEBRUARY 2013
The result is compared with the result of the test conducted in 2011, see Table 20.
TABLE 20: COMPARISON OF DENITRIFICATION RATES RESULT FROM 2011 AND 2013 IN MG NO3-N /G VSS * H AT 20°C
Testing date Rate [g NO3-N/kg VSS x h]
2011 average of three test (phase 1) 0.68
2013 one test (phase 3) 1.03
The result of the denitrification rate test performed in February 2013 is significantly higher than the average of the tests performed in 2011 but still very low compared to values found in literature. One explanation could be that the internal production of easily degradable carbon in the SSH tank has a positive effect on the denitrification process.
y = -0,0172x + 5,3059
0
1
2
3
4
5
6
0 20 40 60 80 100 120 140 160 180 200
NO
3-N
/VSS
(mg/
g)
Time/min
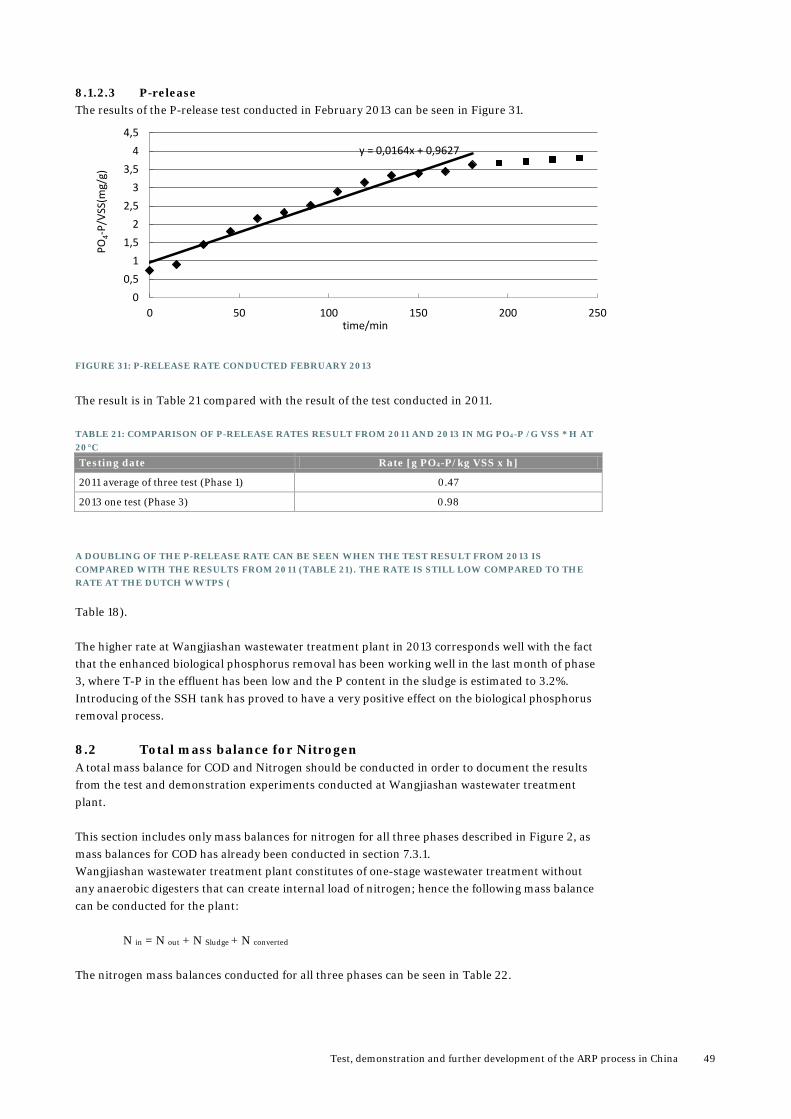
Test, demonstration and further development of the ARP process in China 49
8.1.2.3 P-release The results of the P-release test conducted in February 2013 can be seen in Figure 31.
FIGURE 31: P-RELEASE RATE CONDUCTED FEBRUARY 2013
The result is in Table 21 compared with the result of the test conducted in 2011.
TABLE 21: COMPARISON OF P-RELEASE RATES RESULT FROM 2011 AND 2013 IN MG PO4-P /G VSS * H AT 20°C
Testing date Rate [g PO4-P/kg VSS x h]
2011 average of three test (Phase 1) 0.47
2013 one test (Phase 3) 0.98
A DOUBLING OF THE P-RELEASE RATE CAN BE SEEN WHEN THE TEST RESULT FROM 2013 IS COMPARED WITH THE RESULTS FROM 2011 (TABLE 21). THE RATE IS STILL LOW COMPARED TO THE RATE AT THE DUTCH WWTPS (
Table 18). The higher rate at Wangjiashan wastewater treatment plant in 2013 corresponds well with the fact that the enhanced biological phosphorus removal has been working well in the last month of phase 3, where T-P in the effluent has been low and the P content in the sludge is estimated to 3.2%. Introducing of the SSH tank has proved to have a very positive effect on the biological phosphorus removal process. 8.2 Total mass balance for Nitrogen A total mass balance for COD and Nitrogen should be conducted in order to document the results from the test and demonstration experiments conducted at Wangjiashan wastewater treatment plant. This section includes only mass balances for nitrogen for all three phases described in Figure 2, as mass balances for COD has already been conducted in section 7.3.1. Wangjiashan wastewater treatment plant constitutes of one-stage wastewater treatment without any anaerobic digesters that can create internal load of nitrogen; hence the following mass balance can be conducted for the plant: N in = N out + N Sludge + N converted
The nitrogen mass balances conducted for all three phases can be seen in Table 22.
y = 0,0164x + 0,9627
00,5
11,5
22,5
33,5
44,5
0 50 100 150 200 250
PO4-
P/VS
S(m
g/g)
time/min
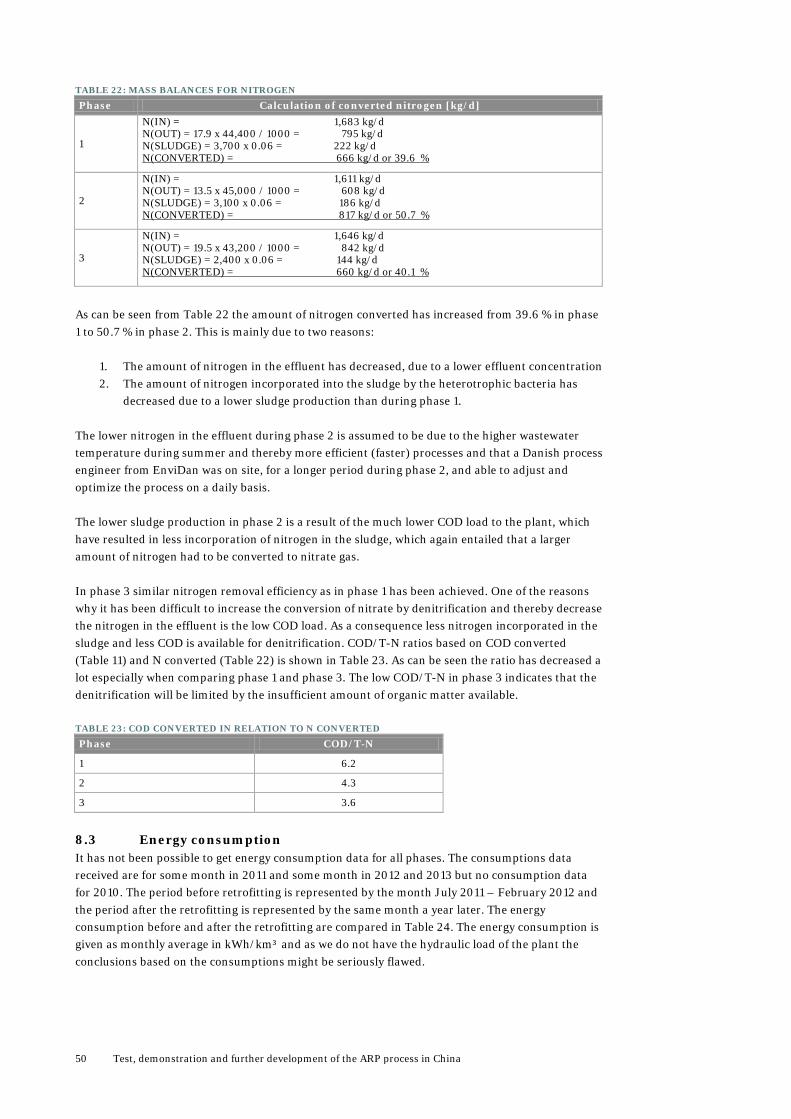
50 Test, demonstration and further development of the ARP process in China
TABLE 22: MASS BALANCES FOR NITROGEN
Phase Calculation of converted nitrogen [kg/d]
1
N(IN) = 1,683 kg/d N(OUT) = 17.9 x 44,400 / 1000 = 795 kg/d N(SLUDGE) = 3,700 x 0.06 = 222 kg/d N(CONVERTED) = 666 kg/d or 39.6 %
2
N(IN) = 1,611 kg/d N(OUT) = 13.5 x 45,000 / 1000 = 608 kg/d N(SLUDGE) = 3,100 x 0.06 = 186 kg/d N(CONVERTED) = 817 kg/d or 50.7 %
3
N(IN) = 1,646 kg/d N(OUT) = 19.5 x 43,200 / 1000 = 842 kg/d N(SLUDGE) = 2,400 x 0.06 = 144 kg/d N(CONVERTED) = 660 kg/d or 40.1 %
As can be seen from Table 22 the amount of nitrogen converted has increased from 39.6 % in phase 1 to 50.7 % in phase 2. This is mainly due to two reasons:
1. The amount of nitrogen in the effluent has decreased, due to a lower effluent concentration 2. The amount of nitrogen incorporated into the sludge by the heterotrophic bacteria has
decreased due to a lower sludge production than during phase 1.
The lower nitrogen in the effluent during phase 2 is assumed to be due to the higher wastewater temperature during summer and thereby more efficient (faster) processes and that a Danish process engineer from EnviDan was on site, for a longer period during phase 2, and able to adjust and optimize the process on a daily basis. The lower sludge production in phase 2 is a result of the much lower COD load to the plant, which have resulted in less incorporation of nitrogen in the sludge, which again entailed that a larger amount of nitrogen had to be converted to nitrate gas. In phase 3 similar nitrogen removal efficiency as in phase 1 has been achieved. One of the reasons why it has been difficult to increase the conversion of nitrate by denitrification and thereby decrease the nitrogen in the effluent is the low COD load. As a consequence less nitrogen incorporated in the sludge and less COD is available for denitrification. COD/T-N ratios based on COD converted (Table 11) and N converted (Table 22) is shown in Table 23. As can be seen the ratio has decreased a lot especially when comparing phase 1 and phase 3. The low COD/T-N in phase 3 indicates that the denitrification will be limited by the insufficient amount of organic matter available.
TABLE 23: COD CONVERTED IN RELATION TO N CONVERTED
Phase COD/T-N
1 6.2
2 4.3
3 3.6
8.3 Energy consumption It has not been possible to get energy consumption data for all phases. The consumptions data received are for some month in 2011 and some month in 2012 and 2013 but no consumption data for 2010. The period before retrofitting is represented by the month July 2011 – February 2012 and the period after the retrofitting is represented by the same month a year later. The energy consumption before and after the retrofitting are compared in Table 24. The energy consumption is given as monthly average in kWh/km³ and as we do not have the hydraulic load of the plant the conclusions based on the consumptions might be seriously flawed.
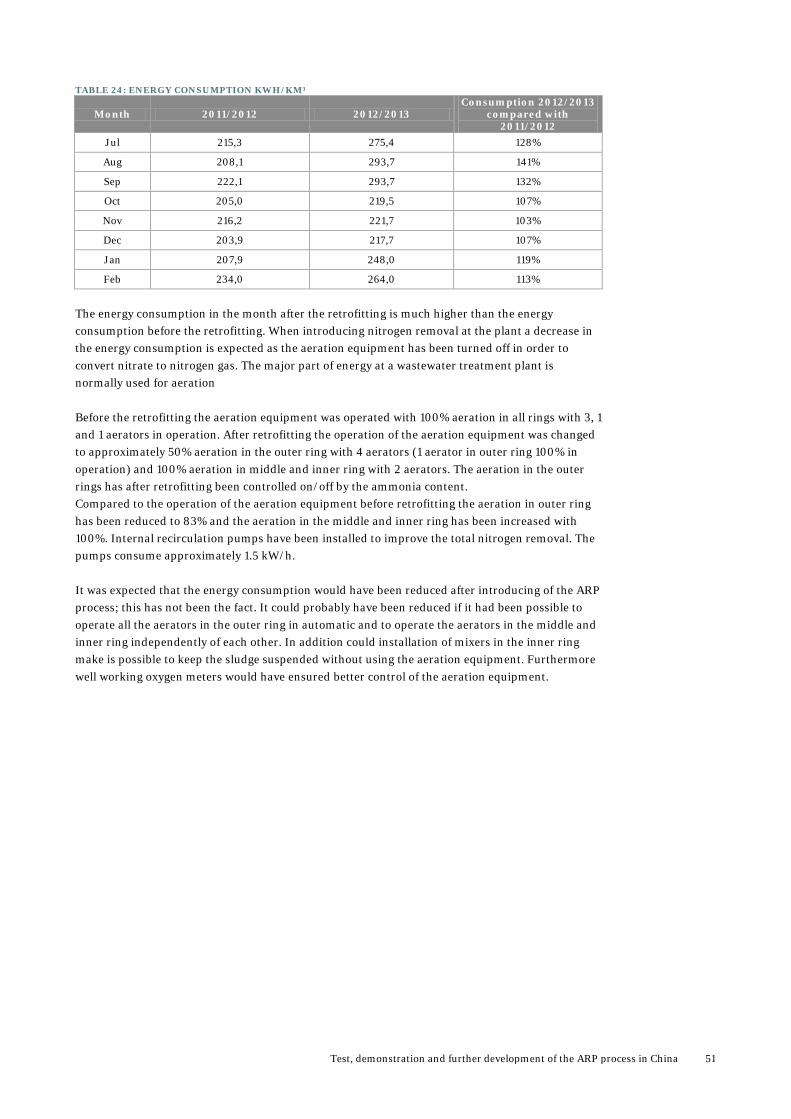
Test, demonstration and further development of the ARP process in China 51
TABLE 24: ENERGY CONSUMPTION KWH/KM³
Month 2011/2012 2012/2013 Consumption 2012/2013
compared with 2011/2012
Jul 215,3 275,4 128%
Aug 208,1 293,7 141%
Sep 222,1 293,7 132%
Oct 205,0 219,5 107%
Nov 216,2 221,7 103%
Dec 203,9 217,7 107%
Jan 207,9 248,0 119%
Feb 234,0 264,0 113%
The energy consumption in the month after the retrofitting is much higher than the energy consumption before the retrofitting. When introducing nitrogen removal at the plant a decrease in the energy consumption is expected as the aeration equipment has been turned off in order to convert nitrate to nitrogen gas. The major part of energy at a wastewater treatment plant is normally used for aeration Before the retrofitting the aeration equipment was operated with 100% aeration in all rings with 3, 1 and 1 aerators in operation. After retrofitting the operation of the aeration equipment was changed to approximately 50% aeration in the outer ring with 4 aerators (1 aerator in outer ring 100% in operation) and 100% aeration in middle and inner ring with 2 aerators. The aeration in the outer rings has after retrofitting been controlled on/off by the ammonia content. Compared to the operation of the aeration equipment before retrofitting the aeration in outer ring has been reduced to 83% and the aeration in the middle and inner ring has been increased with 100%. Internal recirculation pumps have been installed to improve the total nitrogen removal. The pumps consume approximately 1.5 kW/h. It was expected that the energy consumption would have been reduced after introducing of the ARP process; this has not been the fact. It could probably have been reduced if it had been possible to operate all the aerators in the outer ring in automatic and to operate the aerators in the middle and inner ring independently of each other. In addition could installation of mixers in the inner ring make is possible to keep the sludge suspended without using the aeration equipment. Furthermore well working oxygen meters would have ensured better control of the aeration equipment.
52 Test, demonstration and further development of the ARP process in China
9. Discussion
9.1 Process results In phase 2 EnviDan managed, together with Aihua, to fulfill the Class A1 requirement for total nitrogen even though the COD/T-N ratio in the influent was rather low. Phase 2 took places during summer 2012 with high temperatures, faster processes and lower volume requirement. With excess volume it is possible to operate the plant with longer denitrification phases and thereby utilize that some nitrate is denitrified using endogenous carbon when no more easily degradable carbon is available. With a Danish process engineer from EnviDan at the plant for a longer period in phase 2 it was also possible to adjust the process on a daily basis improving the overall treatment efficiency. During phase 2 the enhanced biological phosphorus removal was improved after the aeration of the combined ARP/SSH tank was decreased considerable. The COD/T-N ratio in the incoming wastewater has decreased through the phases from 5.4 in phase 1 to 4.7 in phase 2 and to 3.7 in phase 3 having a significant influence in the possibility to achieve full nitrogen removal. It has not been possible to achieve total nitrogen effluent results below Class A1 standard in phase 3, which is due to the very low COD/T-N ratio in the incoming wastewater. After site visit in the first part of January, 2013 a minor improvement in the nitrogen removal was obtained but the total nitrogen concentration in the final effluent was still too high. It is expected that the treatment efficiency will improve during the coming period due to higher temperature. The COD/T-P ratio has decreased in a similar way from 65 in phase 1 to 46 in phase 3 but the ratio has still been sufficient for obtaining enhanced biological phosphorus removal. The change in the aeration strategy of the combined ARP/SSH tank from 40% aeration to zero aeration improved the enhanced biological phosphorus removal. The phosphorus balance for phase 3 gave an estimation of 3.2 % P in BIO-SS, which indicates an effective and well working biological phosphorus removal. From mid-January 2013 the average effluent T-P has been < 1.0 mg P/l and thereby the Class A1 requirement has been fulfilled. When the sampling is based on grab sampling it is very difficult to make an estimation of the incoming load at the plant and to document the treatment results. The huge difference in especially the COD load from phase 1 to phase 3 raises the question if the COD in phase 1 is incorrect. This issue should be investigated in the coming period. A number of biological tests have been made in Aihua’s laboratory in phase 1 and phase 3 in order to determine the sludge activity prior to and after implementation of the ARP/SSH process. The results showed identical low nitrification rates in phase 1 and 3, respectively. It was expected to see higher nitrification rate in phase 3 as low COD/T-N ratio should results in a higher ratio of nitrifers in the sludge. The measured denitrification rate in phase 3 was higher than the one measured in phase 1 but still very low compared to dentrification rates found in literature. The phosphorus release rate increased to double rate in phase 3. It was expected as implementation of SSH promoted the growth of the Phosphorus Accumulating Organisms (PAO’s). In connection with the laboratory tests the content of VSS in the suspended solid was measured to approximately 55% which is very low. Normally, the percentage is 70-75%. The low content could be a result of extended mineralization due to the long sludge age in the plant but could also be a general analysis mistake. The low content of VSS results in lower capacity than expected. In future
Test, demonstration and further development of the ARP process in China 53
Chinese projects it is important to know the % VSS before the design is made to avoid design mistakes. Supplementary analysis of the VSS content is recommended.
9.2 Operation EnviDan and Aihua have faced many challenges during the project execution and especially during implementation of the ARP/SSH process. Amongst others, malfunction of mechanical equipment due to damage or lack of possibility to control the equipment in the right way has influenced the operation of the plant. In addition, the installed on-line meters were not working correctly and at other times delay on wear parts delivering made the equipment not useable for automatic control. It was expected that the energy consumption would have been reduced after introducing of the ARP/SSH process; based on the received data this has not been the fact. The energy consumption can be reduced if it is possible to operate all the aerators in the outer ring in automatic and operate the aerators in the middle and inner ring independently of each other. In addition, installation of mixers in the inner ring to keep the sludge suspended without using the aeration equipment may reduce the energy consumption as well as improve the overall nitrogen removal efficiency. Furthermore, well working oxygen meters can provide better control of the aeration equipment also reducing the energy consumption and likely also improve the final effluent quality with respect to nitrogen.
9.3 Commercial The results from this project have been very valuable for the joint partnership between EnviDan and Aihua. By execution the project a closer cooperation between the two companies has been established. EnviDan has transferred technical knowledge on advanced biological nutrient removal and advanced online control. The ARP process (Active Return Sludge Process), our SSH process (Sidestream Hydrolysis) and advanced online control has been implemented, the Chinese operators have been trained at the treatment plant in the Danish way to operate wastewater treatment plants. Subsequently, the joint partnership has succeeded in a commercial contract in China and another is close to signing. In addition, two contracts are in the pipeline. It has been absolutely essential to demonstrate the function of the ARP/SSH process at a wastewater treatment plant in China and to get the first reference plant.
9.4 Cultural aspects There is a huge difference in the way that Danish and Chinese sees the biological wastewater treatment and what is important in the operation and optimization of the process and which measurements and analysis are important for the optimization. Our Chinese partner Aihua has done their best to get the plant operational in the right way and to support us. But understanding of the importance of correct sampling and analyzing are essential. In Denmark, all samples at wastewater treatment plants are taken as flow proportional sampling, which gives the best possible way to document both the incoming load and the obtained treatment results. In China almost all samples are taken as grab samples which only give a picture of the situation at the plant “here and now”. It has been difficult to get the analysis parameter and flow information we have asked for. Extra analysis should be approved by the plant manager. The analysis capacity in the plant laboratory was limited due to the analysis methods. They performed all analyzes from scratch instead of using pre-fabricated test kit as we are used to in Denmark.
54 Test, demonstration and further development of the ARP process in China
9.5 Future in China Many wastewater treatment plants in China are in the same situation as the Wangjiashan plant in Ma’anshan and must comply with new more strength Class A1 standard. A massive investment in new technology and equipment will thus take places over the coming years. This project has shown that implementation of ARP and SSH in combination with smaller change in main plant operation and implementation of advanced control makes it possible to improve the biological nitrogen and phosphorus removal. It is expected that at many other plants a volume which can be converted to ARP and SSH is available so the nutrient removal can be improved without extension with extra volumes and thereby be implemented for relative low investment cost.
9.6 Learning points Based on the experience of this project that have been running for 2 ½ year a number of learning points has been collected and some are presented below and can be used in connection with execution of future projects in China:
• Require that mechanical equipment is in working conditions • Require that on-line meters is in working conditions • Automatic samplers must be installed in both influent and effluent • Test kit and spectrophotometer must be available when EnviDan are at site for
commissioning and optimization • Check of %VSS to have the right design basis. • Make a measuring campaign on the incoming wastewater to have the right design basis. • Prepare for external carbon dosing if low COD/T-N • Prepare for coagulant dosing if low COD/T-P • If equipment is very important for the operation of the plant it must be of European
standard
Test, demonstration and further development of the ARP process in China 55
10. Conclusions
The retrofitting of Wangjiashan WWTP with the combined ARP/SSH processes has not been a “straightforward” project. EnviDan and Aihua have faced many technical and cultural challenges throughout the project execution and process commissioning which amongst other has resulted in a prolonged project period. We have shown that implementation of the combined ARP/SSH process in combination with implementation of advanced online control improves the nutrient removal. With the low COD/T-N ratio the ARP process has limited usability whereas the SSH process has been found to be very beneficial not only for the enhanced biological phosphorus removal but also for supplement of easily degradable COD for the denitrification. In this project it has been shown that it is possible to achieve good and stable enhanced biological phosphorus removal in spite of an unfavorable COD/T-N ratio. For the moment the plant cannot fulfill the Class A1 standard for nitrogen. However, it is expected that the nitrogen removal will improve during the summer with higher operating temperature. In addition, a number of parameters that can be implemented at the plant to improve the current operation have been identified. Combination of the B2B project supported by Ministry of Foreign Affairs and this R&D project supported by the Danish EPA has been essential for execution of the project. The long term relation, trust and building up process knowledge at our Chinese partner have taken place during the B2B project. Based on this EnviDan has given advanced courses in biological wastewater treatment, laboratory test, setting up sampling and analysis program that are essential to operate plants to meet the stricter Class A1 requirements. The Danish EPA support of the project has given EnviDan the possibility to carry out additional analysis which has been essential for this first reference plant in China. In addition, it has been possible to visit the plant more often.

56 Test, demonstration and further development of the ARP process in China
11. Dissemination
The results of this project have been presented in several articles and in oral presentations at conferences in Europe and in China. A list of articles and conferences as well as the articles can be found in appendix: Articles. In addition, Aihua has prepared two Chinese articles.
Test, demonstration and further development of the ARP process in China 57
12. References
[1]: J. L. Bernard and K. Abraham, “Key features of succesful BNR operation”, Nutrient Management in wastewater treatment processes and recycle streams”, Krakow, 2005 [2]: M. Henze, P. Harremoës, J. L. C. Jansen and E. Arvin, “Wastewater treatment, Biological and chemical processes”, 3rd ed. Springer, 2000, pp.285-299 [3]: J. Vollertsen, G. Petersen and V. R. Borregaard, “Hydrolysis and fermentation of activated sludge to enhance biological phosphorus removal”, Nutrient Management in wastewater treatment processes and recycle streams”, Krakow, 2005 [4]: M. Henze, C. P. L. Grady, W. Gujer, G. V. R. Marais and T. Matsuo, “Activated sludge model No. 1” IAWPRC London, 1987 [5]: Jensen, T.R. (2009) Comparison of sludge hydrolysis rates and P release/uptake rates under different redox conditions. Special course performed at the Department of Environmental Engineering, Technical University of Denmark. [6]: Jönsson, K. and Jansen, J. la C. (2006) Hydrolysis of return sludge for production of easily biodegradable carbon – Effect of pre-treatment, sludge age and temperature. Wat. Sci. Tech., Vol. 53, No. 12, pp. 47-54. [7]: Kristensen, G. H., Jørgensen, P. E. (1992) Pre-precipitation followed by biological denitrification supported by addition of biological or thermal/chemical hydrolysis products. Published in Chemical Water and Wastewater Treatment II. Klute & Hahn (eds.), pp. 313-328. Springer-Verlag Berlin Heidelberg. ISBN 3-540-55982-5 / ISBN 0-387-55982-5. [8]: Johansen, R., and Petersen, G., Test og videreudvikling af ARP (Aktiv Returslam Proces) BLST-403-00143, EnviDan 2012 [9]: Janssen, P.M.J., Meinema, K., van der Roest, H.F., 2002. Biological Phosphorusus Removal. ISBN: 1 84339 012 4
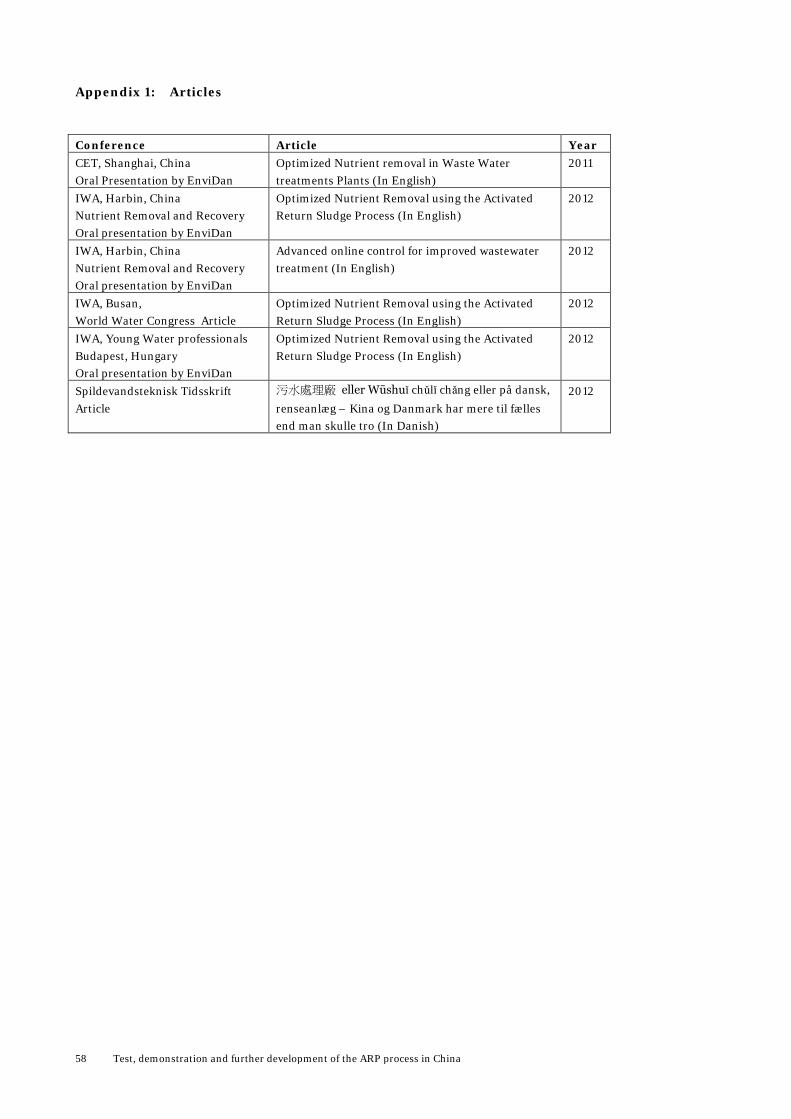
58 Test, demonstration and further development of the ARP process in China
Appendix 1: Articles
Conference Article Year CET, Shanghai, China Oral Presentation by EnviDan
Optimized Nutrient removal in Waste Water treatments Plants (In English)
2011
IWA, Harbin, China Nutrient Removal and Recovery Oral presentation by EnviDan
Optimized Nutrient Removal using the Activated Return Sludge Process (In English)
2012
IWA, Harbin, China Nutrient Removal and Recovery Oral presentation by EnviDan
Advanced online control for improved wastewater treatment (In English)
2012
IWA, Busan, World Water Congress Article
Optimized Nutrient Removal using the Activated Return Sludge Process (In English)
2012
IWA, Young Water professionals Budapest, Hungary Oral presentation by EnviDan
Optimized Nutrient Removal using the Activated Return Sludge Process (In English)
2012
Spildevandsteknisk Tidsskrift Article
污水處理廠 eller Wūshuǐ chǔlǐ chǎng eller på dansk,
renseanlæg – Kina og Danmark har mere til fælles end man skulle tro (In Danish)
2012

Test, demonstration and further development of the ARP process in China 59
Strandgade 29 1401 Copenhagen K, Denmark Tel.: (+45) 72 54 40 00
www.mst.dk
Test, demonstration and further development of the ARP process in China China is developing rapidly within the water and wastewater area. New Chinese standards have been implemented with regards to effluent concentrations and now the Chinese wastewater must meet requirements similar to Danish and European. The Chinese authorities are facing a massive challenge as the existing wastewater treatment plants must be upgraded from performing nitrification and COD removal to include denitrification and phosphorus removal. With support from the Danish EPA, EnviDan A/S has, in corporation with the Chinese partner Capital Aihua Municipal & Environmental Engineering Co. Ltd (Aihua), carried out a research and development project at the Chinese wastewater treatment plant Wangjiashan, situated in Ma’anshan, Anhui Province. Here EnviDan’s ARP/SSH process was implemented together with advanced online control of the activated sludge tanks. These changes have improved the nutrient removal at the Wangjiashan wastewater treatment plant especially with respect to phosphorus. By having a reference plant in China EnviDan A/S and Aihua has been able to secure commercial contracts and ARP/SSH process is already implemented at Wuwei treatment plant in Gansu Province. Not only, the transfer of technical knowledge on advanced biological nutrient removal processes and online control systems but also building up a long term relationship and exchanging cultural experience has been very valuable for both companies and strengthened the cooperation between EnviDan A/S and Aihua