Spatial and seasonal dynamics of riverine carbon fluxes of the Brantas catchment in East Java
13
Spatial and seasonal dynamics of riverine carbon fluxes of the Brantas catchment in East Java Edvin Aldrian, 1,2 Chen-Tung Arthur Chen, 3 Seno Adi, 1 Prihartanto, 1 Nana Sudiana, 1 and Sutopo Purwo Nugroho 1 Received 19 October 2007; revised 6 May 2008; accepted 25 June 2008; published 30 August 2008. [1] Dissolved and particulate organic and inorganic carbon concentrations and flux were measured from July 2005 to June 2006 in the Brantas River basin, a midsized tropical mountainous river and the second largest in Java. There were large seasonal differences in carbon fluxes. Dissolved inorganic carbon (DIC) fluxes were 9.3 times greater and dissolved organic carbon (DOC) fluxes were 532 times greater in the wet season (October to April) than in the dry season. These large contrasts in concentration lead to large differences in load between dry and wet months. In the wet season between January and April, DIC and DOC fluxes are 66% and 87%, respectively, of the total annual fluxes. Most of the annual fluxes of total suspended solids (2.7 106 t a 1 ), total dissolved solids (2.3 106 t a 1 ), DIC (0.26 106 t a 1 ), and DOC (0.2 106 t a 1 ) are transported into the Madura Strait. Accordingly, the Brantas River ranks number 17 among the top 20 rivers that originate at elevations above 3000 m. The concentration of DIC is consistently high all yearlong due to carbonate weathering in the river basin, except in the middle part of the basin, whereas the concentration of DOC is highly seasonal because of variations in biological activities. The total inorganic carbon concentration substantially exceeded the total organic carbon concentration, but the differences decreased from January to April when DOC increased sharply. The carbon budget indicates that the upstream river is a carbon source, and the middle sections of the river are a carbon sink. No carbon trapping was observed by the several impoundments over the basin while sediment trapping was obvious. Citation: Aldrian, E., C.-T. A. Chen, S. Adi, Prihartanto, N. Sudiana, and S. P. Nugroho (2008), Spatial and seasonal dynamics of riverine carbon fluxes of the Brantas catchment in East Java, J. Geophys. Res., 113, G03029, doi:10.1029/2007JG000626. 1. Introduction [2] The flux of terrestrial carbon from continents to the ocean by river runoff and wetland discharge is an important component of the global organic carbon cycle [Hedges et al., 1992]. For example, an estimated 0.25–0.4 10 15 g of dissolved organic carbon (DOC) is discharged to the oceans by the world’s rivers each year [Meybeck, 1982; Chen, 2004]. Rivers deliver both particulate and dissolved organic matter to coastal regions via estuaries. Erosion and delivery of sediment are a function of river runoff, basin morphol- ogy, tectonics, bedrock lithology, basin area and human activities such as damming. Because of their erosive ability, small drainage basin areas, high topographic relief, relatively young and erodible rocks, and heavy tropical rainfall, small mountain rivers that drain the highstanding islands of the East Indies transport a disproportionately large amount of sediment to the ocean. For instance, Milliman and Syvitski [1992] showed that small and midsized rivers can carry a sediment load that is one to two orders of magnitude larger than that carried by major river systems. East Indies rivers, according to Milliman and Syvitski [1992], may discharge as much as 9 10 9 t annually, or about half of the total sediment flux to the ocean. Milliman and Meade [1983] had previously esti- mated that more than 70% of the sediment that enters the oceans come from rivers that drain southern Asia and Oceania, as a result of mountainous terrain, erodible strata often impacted by human activities such as deforestation and agriculture [e.g., Milliman et al., 1987; Douglas, 1996], and seasonally heavy rainfall. Milliman et al. [1999] estimated that rivers in Java may discharge about 0.33 10 9 ta 1 of sediment. Interestingly, they also estimated that although small mountainous islands such as Java deliver a small amount of sediment annually, the rough terrain results in sediment yields of three times from that of large islands in the East Indies. [3] Estimates of the riverine carbon flux to the coast vary greatly in part because of a lack of quantitative estimates JOURNAL OF GEOPHYSICAL RESEARCH, VOL. 113, G03029, doi:10.1029/2007JG000626, 2008 Click Here for Full Articl e 1 Agency for the Assessment and Application of Technology, Jakarta, Indonesia. 2 Marine Study Program, Faculty of Mathematics and Natural Science, University of Indonesia, Jakarta, Indonesia. 3 Institute of Marine Geology and Chemistry, National Sun Yat-Sen University, Kaohsiung, Taiwan. Copyright 2008 by the American Geophysical Union. 0148-0227/08/2007JG000626$09.00 G03029 1 of 13
-
Upload
independent -
Category
Documents
-
view
2 -
download
0
Transcript of Spatial and seasonal dynamics of riverine carbon fluxes of the Brantas catchment in East Java

Spatial and seasonal dynamics of riverine carbon fluxes of the Brantas
catchment in East Java
Edvin Aldrian,1,2 Chen-Tung Arthur Chen,3 Seno Adi,1 Prihartanto,1 Nana Sudiana,1
and Sutopo Purwo Nugroho1
Received 19 October 2007; revised 6 May 2008; accepted 25 June 2008; published 30 August 2008.
[1] Dissolved and particulate organic and inorganic carbon concentrations and flux weremeasured from July 2005 to June 2006 in the Brantas River basin, a midsized tropicalmountainous river and the second largest in Java. There were large seasonal differences incarbon fluxes. Dissolved inorganic carbon (DIC) fluxes were 9.3 times greater anddissolved organic carbon (DOC) fluxes were 532 times greater in the wet season (Octoberto April) than in the dry season. These large contrasts in concentration lead to largedifferences in load between dry and wet months. In the wet season between January andApril, DIC and DOC fluxes are 66% and 87%, respectively, of the total annual fluxes.Most of the annual fluxes of total suspended solids (2.7 � 106 t a�1), total dissolvedsolids (2.3 � 106 t a�1), DIC (0.26 � 106 t a�1), and DOC (0.2 � 106 t a�1) aretransported into the Madura Strait. Accordingly, the Brantas River ranks number 17among the top 20 rivers that originate at elevations above 3000 m. The concentration ofDIC is consistently high all yearlong due to carbonate weathering in the river basin,except in the middle part of the basin, whereas the concentration of DOC is highlyseasonal because of variations in biological activities. The total inorganic carbonconcentration substantially exceeded the total organic carbon concentration, but thedifferences decreased from January to April when DOC increased sharply. The carbonbudget indicates that the upstream river is a carbon source, and the middle sections ofthe river are a carbon sink. No carbon trapping was observed by the severalimpoundments over the basin while sediment trapping was obvious.
Citation: Aldrian, E., C.-T. A. Chen, S. Adi, Prihartanto, N. Sudiana, and S. P. Nugroho (2008), Spatial and seasonal dynamics of
riverine carbon fluxes of the Brantas catchment in East Java, J. Geophys. Res., 113, G03029, doi:10.1029/2007JG000626.
1. Introduction
[2] The flux of terrestrial carbon from continents to theocean by river runoff and wetland discharge is an importantcomponent of the global organic carbon cycle [Hedges etal., 1992]. For example, an estimated 0.25–0.4 � 1015 g ofdissolved organic carbon (DOC) is discharged to the oceansby the world’s rivers each year [Meybeck, 1982; Chen,2004]. Rivers deliver both particulate and dissolved organicmatter to coastal regions via estuaries. Erosion and deliveryof sediment are a function of river runoff, basin morphol-ogy, tectonics, bedrock lithology, basin area and humanactivities such as damming. Because of their erosiveability, small drainage basin areas, high topographic relief,relatively young and erodible rocks, and heavy tropicalrainfall, small mountain rivers that drain the highstanding
islands of the East Indies transport a disproportionatelylarge amount of sediment to the ocean. For instance,Milliman and Syvitski [1992] showed that small andmidsized rivers can carry a sediment load that is one totwo orders of magnitude larger than that carried by majorriver systems. East Indies rivers, according to Milliman andSyvitski [1992], may discharge as much as 9 � 109 tannually, or about half of the total sediment flux to theocean. Milliman and Meade [1983] had previously esti-mated that more than 70% of the sediment that enters theoceans come from rivers that drain southern Asia andOceania, as a result of mountainous terrain, erodible strataoften impacted by human activities such as deforestationand agriculture [e.g., Milliman et al., 1987; Douglas,1996], and seasonally heavy rainfall. Milliman et al.[1999] estimated that rivers in Java may discharge about0.33 � 109 t a�1 of sediment. Interestingly, they alsoestimated that although small mountainous islands suchas Java deliver a small amount of sediment annually, therough terrain results in sediment yields of three times fromthat of large islands in the East Indies.[3] Estimates of the riverine carbon flux to the coast vary
greatly in part because of a lack of quantitative estimates
JOURNAL OF GEOPHYSICAL RESEARCH, VOL. 113, G03029, doi:10.1029/2007JG000626, 2008ClickHere
for
FullArticle
1Agency for the Assessment and Application of Technology, Jakarta,Indonesia.
2Marine Study Program, Faculty of Mathematics and Natural Science,University of Indonesia, Jakarta, Indonesia.
3Institute of Marine Geology and Chemistry, National Sun Yat-SenUniversity, Kaohsiung, Taiwan.
Copyright 2008 by the American Geophysical Union.0148-0227/08/2007JG000626$09.00
G03029 1 of 13

from much of the world [McKee, 2003]. However, asexplained above, small mountainous rivers may be a muchmore important source of organic carbon to the ocean thanpreviously thought [Kao and Liu, 1996, 1997; Lyons et al.,2002; Blair et al., 2003; Gomez et al., 2003; Komada et al.,2004]. The total organic carbon (TOC) flux from smallmountainous rivers in Asia-Oceania alone has been estimatedto be 21–38% of the total oceanic input [Schlunz andSchneider, 2000], but this range is very wide. The TOC fluxfrom rivers to the marine environments is estimated to beabout 55% in the dissolved form (DOC) [Ludwig et al., 1996;Chen, 2004]. Baum et al. [2007] suggested a total IndonesianDOC export of�21 Tg a�1, representing�10% of the globalriverine DOC input to the ocean. The TOC flux may begreatly affected in the future by changes in the climate[Tranvik and Jansson, 2002].[4] Flowing riverine water constitutes an important link
in global biogeochemical cycles. This water transportsorganic matter from terrestrial sources and generates organicmaterial within aquatic environments [Hedges et al., 2000].The hydro-meteorological pattern from the rainfall and riverhydrology is important to understanding better the biogeo-chemical processes that occur in the rivers down to theestuary. The Brantas River is one of Indonesia’s mostimportant catchments for the ‘‘rice bowl’’ of Java and isimportant to the nation’s industrial activity. Severalresearchers have assessed the water quality of the BrantasRiver basin. Hart et al. [2001] and Sudaryanti et al. [2001]introduced and evaluated the use of the biological assess-ment of the condition of the Brantas River using theAustralian River Assessment System (AUSRIVAS). TheBrantas River authority (Perum Jasa Tirta I) has a well-established integrated catchment management system[Booth et al., 2001] that has been used to collect andmaintain a long record of hydrometeorological and water-quality data by online monitoring system [Marini andWeilguni, 2003]. Jennerjahn et al. [2004] established thebiogeochemistry at the mouth of the Brantas River, and theWonokromo and Porong rivers during the dry season andsuggested that the fluvial export of dissolved substancesover one of the mouths of the Brantas River was largerduring the rainy season than at other times of the year. Inspite of this, the inner catchment area from upstream todownstream and the spatial and temporal distributions of thesediment and carbon fluxes that contribute to the coastalprocesses have not yet been established.[5] The purpose of this study is to establish the spatio-
temporal pattern of the sediment and carbon fluxes over theBrantas catchment that could be used for the broaderpatterns of carbon fluxes in the region. The contributionof the 12 regulated reservoirs and the way in whichdamming works in a tropical, monsoonal, mountainousmidsize river [Vorosmarty et al., 1997; Chen, 2002], willalso be investigated. This study involves intensive samplingand measurements between July 2005 and June 2006 at sitesfrom upstream to downstream. The spatiotemporal carbonbudget is established from dissolved organic carbon, dis-solved inorganic carbon, particulate organic carbon andparticulate inorganic carbon concentrations, which herein-after are denoted DOC, DIC, POC and PIC, respectively. Toour knowledge, this is the first time seasonal carbonate
chemistry and fluxes for any river basin are studied inIndonesia, if not in the entire tropical Southeast Asia.
2. Material and Methods
2.1. Study Area
[6] The Brantas catchment covers about 11050 km2 orapproximately 35% of the area of East Java Province(Figure 1), extending approximately from 111�300E to112�450E and 7�200S to 8�200S. The total length of the mainriver stream is 320 km, which is the second largest in Java.The annual average rainfall reaches 2330 mm (averagebetween 1991 and 2005) and about 80% falls during therainy months. The total potency of surface water reaches12 billion m3, while the total dam capacity in the area ofinterest is only 2.6–3 billion m3 annually. Major dams andreservoirs were built in the 1970s and 1980s, mainly forpower generation, irrigation and flood control. Twelvedams, the largest of which is the Karang Kates Dam, werebuilt along the mainstream and tributaries of the BrantasRiver and they have been managed by a special authority;the Perum Jasa Tirta I (PJT I). The number of residents inthe Brantas basin was around 13.7 million in 1994 and15.5 million in 2003 (about 16 million nowadays) orapproximately 43.2% of the total population of East Java.The population density over the basin area is about 1.5 timesthe provincial average. Rapid demographic changes andpressure from the population in the 20th century havealtered Java’s landscape and ecology. Over the last twodecades, the average yearly per capita water consumptionhas doubled from 400 to 800 m3, predominantly because ofthe agricultural sector, which uses about three quarters ofthe available water. Almost all of the available water isconsumed during the dry season. However, nearly 500industries directly discharge their effluents, contributing aBOD load of approximately 125 t d�1 [Binnie & Partners(Overseas) Ltd, 1999]. Most discharge comes from the pulpand paper mills and sugarcane processing plants, monoso-dium-glutamate production, tanneries and dyes, coconut-oiland metal-fabrication industries. Industry is responsible for80% of the pollution of the river, despite the heavydischarge of domestic waste [Marini and Weilguni, 2003].Other human activities such as deforestation, intensiveagriculture (mainly rice cultivation), urban and industrialwaste disposal, the formation of levees and sand andlimestone minings in the downstream portion, river diver-sion and the conversion of the estuarine mangroves toaquaculture ponds alter the flow regime and the amountand composition of substances that are transported by theriver and discharged into the Madura Strait.[7] The Brantas River originates near the volcano Arjuno,
streams southward, westward, northward and finally divertsinto three branches in the coastal lowlands (Figure 1) closeto the provincial capital Surabaya. The source of Brantasis surrounded by high mountains, Mt. Kelud, Mt. Arjuna,Mt. Anjasmoro, Mt. Semeru and Mt. Bromo with heights1731 m, 3339 m, 2277 m, 3675 m and 2392 m, respectively.The first and the last mountains are still active volcanoes.In the middle stream is Mt. Wilis, with a height of 2552 m.On the slopes within the river channels of Mt. Semeru andunder a humid climate, erosion rates rank among the
G03029 ALDRIAN ET AL.: CARBON FLUXES OF THE BRANTAS CATCHMENT
2 of 13
G03029

highest (105–106 m3 km�2 a�1) recorded anywhere in theworld [Lavigne, 2004].[8] Sediment yields are dominated by rain-triggered
lahars, which occur every rainy season extending fromOctober to April in several drainage basins of Mt. Semeru[Lavigne, 2004]. The Porong River and the WonokromoRiver are the two major branches that divert at approxi-mately 40 km before Surabaya and discharge into theMadura Strait, while the smaller Kali Mas River divertsfrom the Wonokromo River at about 10 km beforeSurabaya into the narrowest part of the Madura Straitnorth of the city after it passes the city. The mouth ofWonokromo River is 30 km north of the Porong River,which is the major branch that transports water andsediment. During the wet season, when almost 80% ofthe water supplied by the Brantas is diverted to thePorong, its average discharge can be around 600 m3 s�1,and may rise to 1200 m3 s�1 in extremely wet years[Hoekstra et al., 1989]. In El Nino years, however, thedischarge can be much lower because precipitation isreduced. High sediment loads, particularly in the wetseason cause the Porong River to have a strongly prograd-ing delta. During the dry season, most of the flow ismainly diverted to the town of Surabaya and the dischargeof the Porong is extremely low [Hoekstra, 1989]. Themonsoons dominate the climate, such that eastern Javaexperiences only one wet season from October to April,which is also the period of peak river discharge, which wasabout 217 m3 s�1 (1991–1996 annual average [Jennerjahnet al., 2004]).
2.2. Sampling and Preparation of Samples
[9] Rainfall, hydrology and water quality data for theBrantas River were collected and managed by the PerumJasa Tirta I (PJT I) as the catchment regional authority.Hydrometeorological data for the Brantas River are the bestyet collected for any catchment in Indonesia. Daily rainfalldata have been available since 1955, while hydrological andwater quality data have been available since 1991. More-over, since 1991, the local authority has modernized datacollection using an integrated automatic telemetry system[Marini and Weilguni, 2003]. Hydrology or discharge dataare available at many check points - especially at dam inlets,dam outlets and irrigation stations. Seven primary samplinglocations were used from July 2005 until June 2006 torepresent different regions from upstream to downstream(Table 1). These locations were at Gadang, Karang KatesDam, Lodoyo Dam, Mrican Dam, Lengkong Dam, Porongand Gunung Sari, which are marked by crossed circles inFigure 1. The latter two are stations over two majorbranches of Brantas that flow to the coast. Daily rainfalldata from 26 rain gauge stations throughout the catchmentarea were also used herein.[10] Water samples were collected once per month from
July 2005 to June 2006 using a water sampler device. Theywere collected from the midlayers at about 70–80% riverdepth or at the point of maximum velocity in the middle ofthe river and at the left and right river banks (compositesamples) at all stations. Temperature, salinity (conductivity),dissolved oxygen and pH were measured in situ. Filtrationwas performed only after the pH had been determined. The
Figure 1. The Brantas River basin in East Java, Indonesia. Rain gauge stations (squares), as well asdischarge and carbon sampling stations (crossed circles) are marked.
G03029 ALDRIAN ET AL.: CARBON FLUXES OF THE BRANTAS CATCHMENT
3 of 13
G03029

samples were kept in fully filled narrow-necked and sealedglass bottles and stored in the dark at 4�C to minimize theerror associated with CO2 degassing prior to analysis. DOwas measured in situ using a portable DO meter aftercalibration with an oxygen zero and by using titration.[11] Water samples were filtered through 0.45 mm glass
fiber filters into glass bottles, preserved with mercurychloride (HgCl2) solution (20 gl�1) until the final concen-tration reached 10 mg/L, and kept frozen at �20�C untilanalysis. Water samples for total suspended matter (TSM)filtration were taken from PE tanks, cooled and stored in thedark until filtration. The TSS values were derived using agravimetric analyzer. Samples were filtered over precom-busted (5 h, 450�C) Whatman GF/F filters and dried at40�C.
2.3. Analyses
[12] Water samples were analyzed in the Water QualityLaboratory of the Ministry of Public Works in Surabaya fordissolved and particulate carbon. Although data up to June2006 were obtained and analyzed, the TOC analyzer did notfunction well after April. Therefore data for carbon param-eters were obtained only up to April 2006, while nutrientand sediment parameters were obtained up to June 2006.The carbon contents were analyzed using a Shimadzu TOC5000 Analyzer with a combustion temperature of 680�C.TOC and DOC standardizations were conducted usingpotassium hydrogen petalat C8H5KO4, while TIC and DIC
standardization were conducted using sodium carbonateNa2CO3 and sodium bicarbonate NaHCO3. The organicand inorganic carbon contents of the total and dissolvedcarbon were measured. Then, the particulate carbon wasdetermined from their differences. pCO2 was calculatedfrom pH and total dissolved inorganic carbon (DIC)[Frankignoulle and Borges, 2001].[13] Elementary and isotopic analyses were conducted at
a laboratory of the Zentrum fur Marine Tropenokologie inBremen, Germany. Parameters measured in that laboratoryincluded particulate inorganic carbon (PIC) and particulateorganic carbon (POC) of the residue of filtered papers.Actual measurements were conducted in Bremen with aFinnigan Delta Plus gas isotope ratio mass spectrometer [seeJennerjahn et al., 2004], and these measurement valueswere compared to calculated particulate carbon from theShimadzu results.
3. Results
3.1. Hydrologic System
[14] The climate over the Brantas catchment is domi-nated by a strong monsoonal system with a large contrastbetween the dry and rainy seasons and is stronglymodulated by El Nino Southern Oscillation [Aldrianand Susanto, 2003]. During the last five decades, thiscatchment has experienced the impact of global climatechange by some prolonged dry periods and a persistent
Table 1. Water Quality Sampling Locations From July 2005 to June 2006
Longitude (East) Latitude (South) Station Name Remarks
112.632 8.024 Gadang upstream112.434 8.157 Karang Kates Dam upstream112.182 8.149 Lodoyo Dam middle stream112.024 7.765 Mricam Dam middle stream112.459 7.446 Lengkong Dam middle stream112.698 7.543 Porong downstream112.719 7.307 Gunung Sari downstream112.506 8.191 Karang Kates inlet Jan–Apr 2006112.464 8.173 Karang Kates middle Jan–Apr 2006112.248 8.142 Wlingi inlet Jan–Apr 2006112.197 8.146 Lodoyo inlet Jan–Apr 2006
Figure 2. (a) Annual rainfall patterns of 26 rain gauge stations from July 2005 to June 2006 withaverage (solid thick lines) and monthly averages over 15 years from 1991 to 2005 (open squares) and(b) river discharges from upstream (thick black lines), through middle stream (thin lines) to downstream(thick gray lines).
G03029 ALDRIAN ET AL.: CARBON FLUXES OF THE BRANTAS CATCHMENT
4 of 13
G03029
reduction of the annual precipitation [Aldrian and Djamil,2008]. Observations made during the study period revealthat the dry season is between June and September whilethe rainy season is between October and April, as pre-sented in Figure 2. The largest peak is observed in January,while the second largest, in April, is associated with atransitional period. The sampling period herein, which isfrom July 2005 to June 2006, is regarded as a normal year,based on a comparison with the recent 15 year average,but with much more rainfall in December than its monthlyaverage.[15] The water discharge patterns over the Brantas River
do not exactly follow the rainfall pattern. The existence of12 dams in various locations may to some extent contributeto the actual pattern. During the period of this study, thedischarge was maximum in April instead of in Decemberconsistently from the upstream to the downstream samplingsites. A comparison with inflows and outflows of respectivedams reveal that the patterns are consistent with theaforementioned annual pattern. Accordingly, the presenceof the cascading dams along the Brantas River does notaffect the upstream to downstream flows. In fact, all of thedams, except for the Karang Kates Dam, are daily con-trolled, such that the daily outflow directly follows the dailyinflow. Hence, the pattern is homogenous, as presented in
Figure 2b. Another pattern is the increase of discharge fromupstream to downstream locations.
3.2. Temporal TOC and TIC Variations
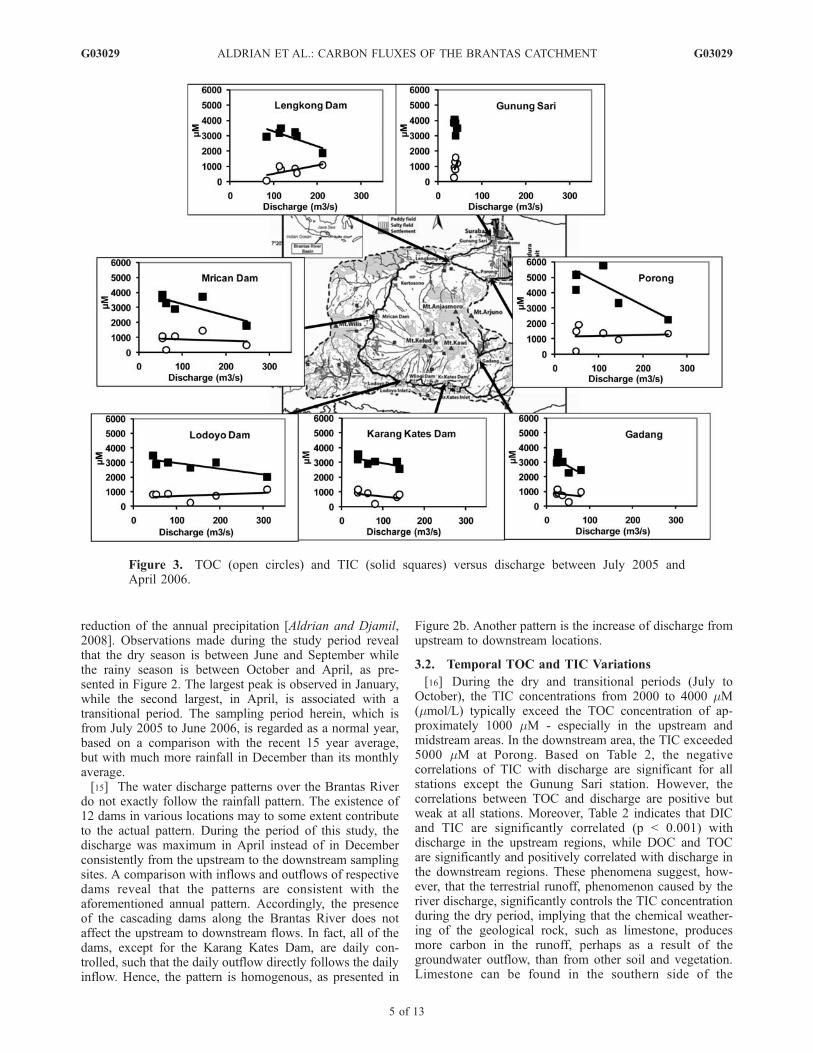
[16] During the dry and transitional periods (July toOctober), the TIC concentrations from 2000 to 4000 mM(mmol/L) typically exceed the TOC concentration of ap-proximately 1000 mM - especially in the upstream andmidstream areas. In the downstream area, the TIC exceeded5000 mM at Porong. Based on Table 2, the negativecorrelations of TIC with discharge are significant for allstations except the Gunung Sari station. However, thecorrelations between TOC and discharge are positive butweak at all stations. Moreover, Table 2 indicates that DICand TIC are significantly correlated (p < 0.001) withdischarge in the upstream regions, while DOC and TOCare significantly and positively correlated with discharge inthe downstream regions. These phenomena suggest, how-ever, that the terrestrial runoff, phenomenon caused by theriver discharge, significantly controls the TIC concentrationduring the dry period, implying that the chemical weather-ing of the geological rock, such as limestone, producesmore carbon in the runoff, perhaps as a result of thegroundwater outflow, than from other soil and vegetation.Limestone can be found in the southern side of the
Figure 3. TOC (open circles) and TIC (solid squares) versus discharge between July 2005 andApril 2006.
G03029 ALDRIAN ET AL.: CARBON FLUXES OF THE BRANTAS CATCHMENT
5 of 13
G03029

upstream region up to the Lodoyo Dam and in the northernside of the downstream region from the Kertosono gaugestation to the Kali Mas branch near Surabaya city. Figure 3demonstrates that TIC concentrations typically decreaseduring the period of ascending discharge between Julyand December, while the TOC concentrations increasebecause DOC in the soil starts to leach out. In the periodof high discharge between January and April, TOC valuesexceed TIC values.[17] There is a large contrast between the TOC concen-
trations in the dry and wet seasons, while less contrast forTIC in both seasons. In contrast to the TOC, higherconcentrations of TIC occur in the dry period while lowerconcentrations in the wet period due to the dilution effect.In fact, TIC is inversely related to discharge (Figure 3) asthe result of the dilution effect by the rain. All sites revealthis dilution effect except at Lengkong Dam, where prob-ably the water is drained greatly for agricultural use in themidstream region. The dilution relationship is inferredfrom the correlation between the TIC and DIC, whosecorrelations at all sites and all months are significantlystrong (Table 2). This implies that a higher inorganiccontent is associated with a higher dissolved portion.Accordingly, during the high discharge period, discrepan-cies from this relationship are due to the nondilution effect(nonphysical effect) of TOC or may be due to biologicalactivity.
3.3. Temporal DOC and DIC Variations
[18] The DOC and DIC dominate the TOC and TIC,respectively, in their proportions and temporal variations(Table 2) at all stations. The average DIC/TIC ratio wasmuch higher than the DOC/TOC ratio. As shown inFigure 4, the DOC was generally below 1000 mM in thedry period and between 2000 and 3000 mM in the wetperiod. However, the DIC concentration varied from about2000 to 4000 mM, except at Porong Bridge, which recordedover 6000 mM. The higher DIC concentrations over Porong
were due to the contribution of a large marble factory in itstributary at about 5 km up-stream from the sampling station.From July to December DIC was mostly two to three timeshigher than DOC in the entire basin except at Porong, wherethe magnitude of DIC was up to four times that recorded inSeptember suggesting that the DOC concentration tends toincrease, but the DIC concentration tends to decrease duringthe wet period. This phenomenon was identified at allsampling stations. The differences between DOC and DICthen gradually diminished to the range of 2000 to 3000s mMbetween January and April. The comparisons of temporaldistributions of DOC and DIC imply that the solutes do nothave similar controls and their transformation follow similarmechanisms.[19] The situation for particulate carbon is rather different
than for dissolved as neither PIC nor POC follows acommon seasonal pattern. POC is typically much higherthan the PIC. The POC concentrations range from 6.3 to1425 mM: the value was highest in Gunung Sari in March2006. Table 2 presents POC as a percentage of totalsuspended matter, which has ranges between 0.02 to 1.99%.[20] Particulate matter, unlike dissolved carbon, does not
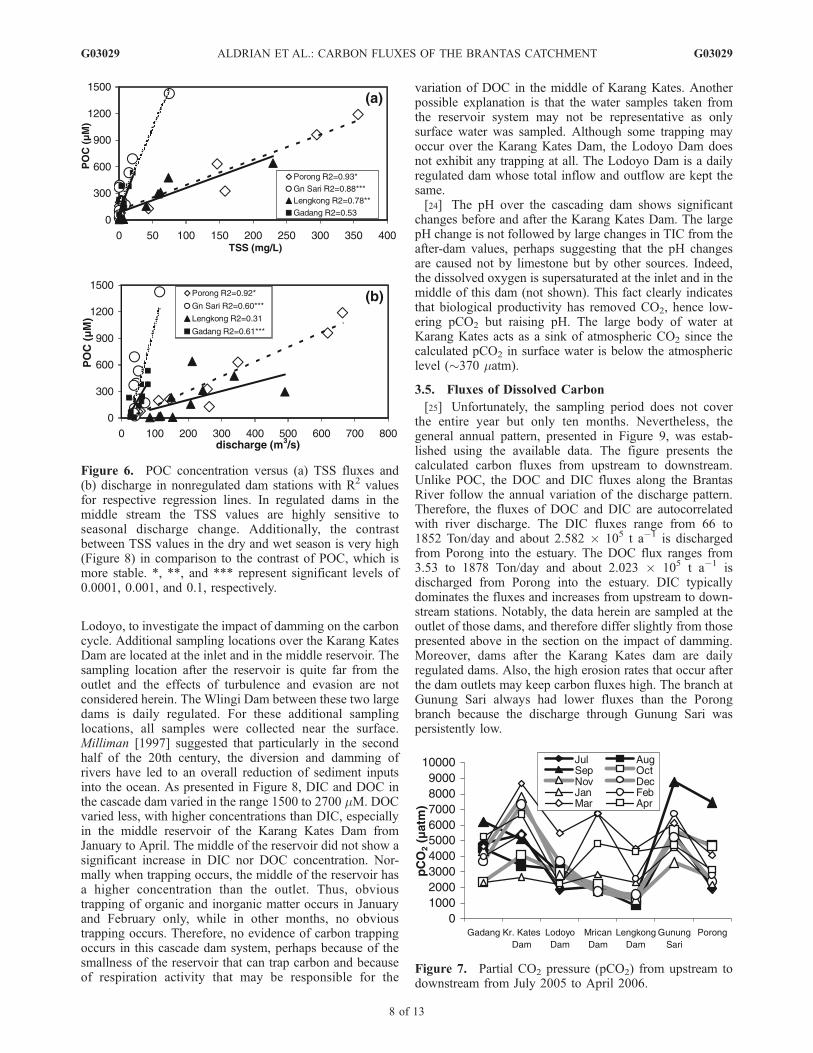
exhibit a seasonal trend because of terrestrial agriculturalwaste output. d13C*POC signatures were examined to deter-mine the source of the particulate organic matter. All of theisotope data from the 80 POC samples collected from allstations between August 2005 and March 2006 revealterrestrial sources of POC, with d13C*POC from �32.77%to �19.67%. Most values show two clusters rangingbetween �29% and �26% and between �25% and�23% (Figure 5).[21] From Figure 6, POC over the Brantas River has a
strong dependency to the erosion factor such as totalsuspended sediment (TSS) and the discharge. Althoughthe correlations do not apply for all sampling stations, theyapply well in nonregulated dam stations such as Porong,Gunung Sari, Gadang and Lengkong. Figure 6 plots therelationships between some POC concentrations and TSS
Table 2. Correlations Among Carbon Parameters and Discharge (Q), Fractions of Dissolved Carbon, and Percentage Ratio of Particulatea
GadangKr. KatesDam
LodoyoDam
MricanDam
LengkongDam
GunungSari Porong
Various correlations DOC–TOC (a) 0.991 (a) 0.995 (a) 0.994 (a) 0.980 (a) 0.988 (a) 0.954 (a) 0.962DIC–TIC (a) 0.963 (a) 0.995 (a) 0.993 (a) 0.932 (a) 0.994 (a) 0.983 (a) 0.992POC–TOC 0.590 0.382 0.300 0.436 0.471 0.564 (b) 0.803PIC–TIC 0.293 0.406 (b) 0.612 0.411 �0.158 0.177 �0.214POC–TDS (c) 0.738 �0.241 0.556 0.583 0.497 (c) 0.656 (a) 0.906POC–TSS (c) 0.728 0.533 (c) 0.719 0.435 (a) 0.884 (a) 0.937 (a) 0.963TOC–Q 0.546 0.492 0.542 (c) 0.735 (a) 0.909 (b) 0.778 (b) 0.847TIC–Q (b) �0.774 (b) �0.801 (b) �0.793 �0.417 0.004 �0.451 �0.624DOC–Q 0.467 0.535 0.489 (c) 0.674 (a) 0.876 0.621 (c) 0.687DIC–Q (c) �0.696 (b) �0.775 (c) �0.786 �0.420 �0.018 �0.531 (c) �0.688POC–Q (b) 0.782 �0.221 0.578 0.533 0.553 (b) 0.773 (a) 0.957PIC–Q �0.401 �0.529 �0.494 �0.093 0.207 0.392 (c) 0.677
Average ratio of dissolved tototal
DOC/TOC 0.818 0.827 0.860 0.779 0.854 0.790 0.805DIC/TIC 0.976 0.967 0.938 0.917 0.968 0.958 0.938
Percentage ratio POC to totalsuspended matter
max (%) 1.66 1.48 1.01 1.91 1.03 1.75 1.74avg (%) 0.72 0.80 0.57 0.78 0.45 0.80 0.71min (%) 0.02 0.09 0.03 0.14 0.02 0.06 0.15
Percentage ratio PIC to totalsuspended matter
max (%) 1.44 1.05 1.00 2.84 0.56 1.08 0.96avg (%) 0.37 0.35 0.39 0.86 0.21 0.35 0.34min (%) 0.05 0.08 0.06 0.01 0.04 0.07 0.04
aA negative correlation between a carbon parameter and Q indicates a dilution effect. Here (a), (b), and (c) represent significant levels of 0.001, 0.05, and0.1, respectively.
G03029 ALDRIAN ET AL.: CARBON FLUXES OF THE BRANTAS CATCHMENT
6 of 13
G03029

fluxes. Notably, at stations with high discharge, such as inLengkong and in Porong, the correlations are significant,while for the Gunung Sari and Gadang with low dischargeflow, as occurs in most of the world’s river [Ittekkot, 1988],POC contributes more to TSS. A similar relationship hasbeen reported in Parana River, Argentina [Depetris andGaiero, 1998]. Significant correlations exist between POCand discharge (Figure 6b) in Gadang, Gunung Sari andPorong.
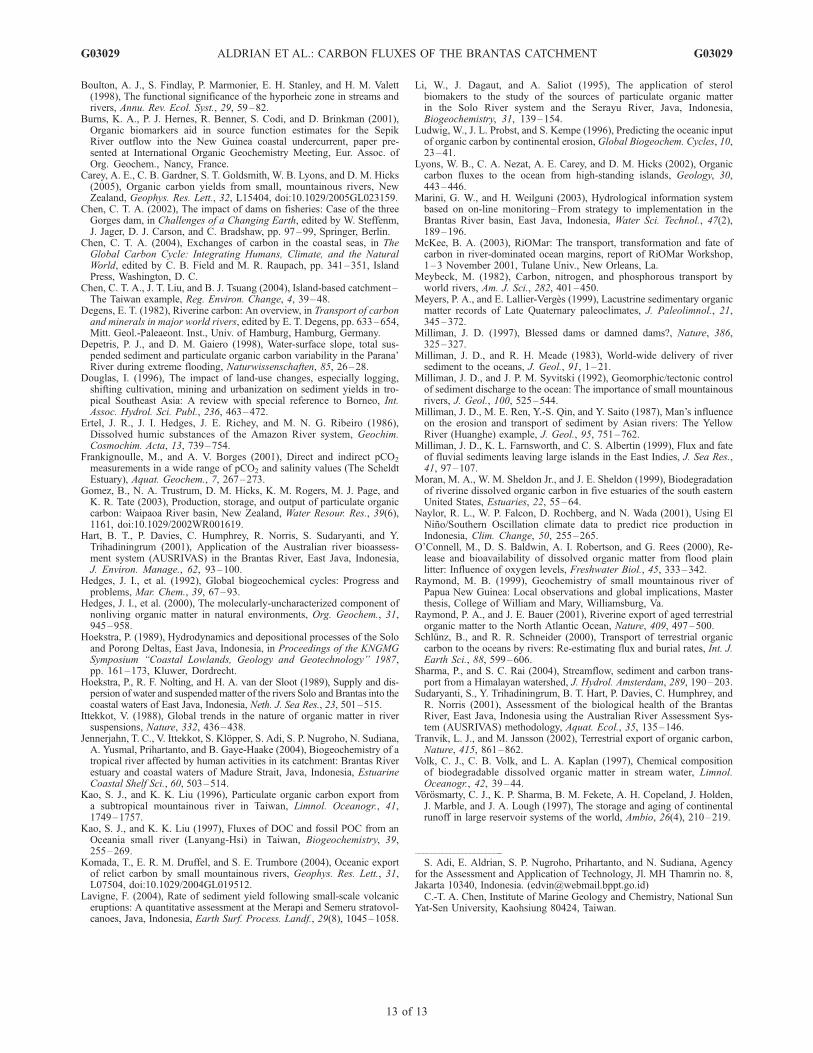
[22] Figure 7 plots the CO2 partial pressure (pCO2) fromthe Brantas River, and shows net CO2 fluxes to theatmosphere all yearlong at almost all sampling stations.Although exact data for the fluxes are not known due to alack of wind data, all values except those for August inPorong and for February in Gunung Sari, exceed theatmospheric level (�370 matm). The values range from126 to 8776 matm. The pattern is regular during theascending period along the Brantas River, where the sourceof carbonate weathering is obviously in the upper anddownstream areas, while in midstream, pCO2 is relativelylow. For the subsequent four months or during high dis-charge, this regularity fails and the midstream exhibits astrong increase in pCO2 as the middle stream starts to act asthe carbon source in January and reaches its peak in March.This period coincides with the period of strong erosion orcarbonate weathering. Additionally, a significant relation-ship (p < 0.0001) exists between pCO2 and acidity, but notbetween DIC and pCO2 (R2 of only 0.056). The isotopiccomposition of DIC therefore depends not only on therelative proportions of silicate and carbonate minerals thatare being weathered but also on the source of acidity.
3.4. Carbon and Impact of Damming
[23] Since January 2006, more sampling stations havebeen added over the two largest dams, Karang Kates andFigure 5. Histogram of d13C*POC for all stations.
Figure 4. Spatio- and temporal-variabilities of DOC (solid circles), DIC (open squares), POC (solidtriangles), and PIC (open circles) for the Brantas River basin from July 2005 to April 2006.
G03029 ALDRIAN ET AL.: CARBON FLUXES OF THE BRANTAS CATCHMENT
7 of 13
G03029
Lodoyo, to investigate the impact of damming on the carboncycle. Additional sampling locations over the Karang KatesDam are located at the inlet and in the middle reservoir. Thesampling location after the reservoir is quite far from theoutlet and the effects of turbulence and evasion are notconsidered herein. The Wlingi Dam between these two largedams is daily regulated. For these additional samplinglocations, all samples were collected near the surface.Milliman [1997] suggested that particularly in the secondhalf of the 20th century, the diversion and damming ofrivers have led to an overall reduction of sediment inputsinto the ocean. As presented in Figure 8, DIC and DOC inthe cascade dam varied in the range 1500 to 2700 mM. DOCvaried less, with higher concentrations than DIC, especiallyin the middle reservoir of the Karang Kates Dam fromJanuary to April. The middle of the reservoir did not show asignificant increase in DIC nor DOC concentration. Nor-mally when trapping occurs, the middle of the reservoir hasa higher concentration than the outlet. Thus, obvioustrapping of organic and inorganic matter occurs in Januaryand February only, while in other months, no obvioustrapping occurs. Therefore, no evidence of carbon trappingoccurs in this cascade dam system, perhaps because of thesmallness of the reservoir that can trap carbon and becauseof respiration activity that may be responsible for the
variation of DOC in the middle of Karang Kates. Anotherpossible explanation is that the water samples taken fromthe reservoir system may not be representative as onlysurface water was sampled. Although some trapping mayoccur over the Karang Kates Dam, the Lodoyo Dam doesnot exhibit any trapping at all. The Lodoyo Dam is a dailyregulated dam whose total inflow and outflow are kept thesame.[24] The pH over the cascading dam shows significant
changes before and after the Karang Kates Dam. The largepH change is not followed by large changes in TIC from theafter-dam values, perhaps suggesting that the pH changesare caused not by limestone but by other sources. Indeed,the dissolved oxygen is supersaturated at the inlet and in themiddle of this dam (not shown). This fact clearly indicatesthat biological productivity has removed CO2, hence low-ering pCO2 but raising pH. The large body of water atKarang Kates acts as a sink of atmospheric CO2 since thecalculated pCO2 in surface water is below the atmosphericlevel (�370 matm).
3.5. Fluxes of Dissolved Carbon
[25] Unfortunately, the sampling period does not coverthe entire year but only ten months. Nevertheless, thegeneral annual pattern, presented in Figure 9, was estab-lished using the available data. The figure presents thecalculated carbon fluxes from upstream to downstream.Unlike POC, the DOC and DIC fluxes along the BrantasRiver follow the annual variation of the discharge pattern.Therefore, the fluxes of DOC and DIC are autocorrelatedwith river discharge. The DIC fluxes range from 66 to1852 Ton/day and about 2.582 � 105 t a�1 is dischargedfrom Porong into the estuary. The DOC flux ranges from3.53 to 1878 Ton/day and about 2.023 � 105 t a�1 isdischarged from Porong into the estuary. DIC typicallydominates the fluxes and increases from upstream to down-stream stations. Notably, the data herein are sampled at theoutlet of those dams, and therefore differ slightly from thosepresented above in the section on the impact of damming.Moreover, dams after the Karang Kates dam are dailyregulated dams. Also, the high erosion rates that occur afterthe dam outlets may keep carbon fluxes high. The branch atGunung Sari always had lower fluxes than the Porongbranch because the discharge through Gunung Sari waspersistently low.
Figure 7. Partial CO2 pressure (pCO2) from upstream todownstream from July 2005 to April 2006.
Figure 6. POC concentration versus (a) TSS fluxes and(b) discharge in nonregulated dam stations with R2 valuesfor respective regression lines. In regulated dams in themiddle stream the TSS values are highly sensitive toseasonal discharge change. Additionally, the contrastbetween TSS values in the dry and wet season is very high(Figure 8) in comparison to the contrast of POC, which ismore stable. *, **, and *** represent significant levels of0.0001, 0.001, and 0.1, respectively.
G03029 ALDRIAN ET AL.: CARBON FLUXES OF THE BRANTAS CATCHMENT
8 of 13
G03029

[26] Like the temporal variations of DIC and DOC con-centrations, carbon fluxes are dominated by DIC during thedry season and less dominant during the wet season. InNovember (Figure 9), all fluxes are low because the surfacerunoff recedes, and the groundwater discharge has not yetstarted. During the peak of groundwater discharge in April,both DIC and DOC fluxes increase rapidly. The differencebetween the fluxes in the dry and wet seasons is large at allstations. At each particular station, the DIC varies betweenhigh discharge and low discharge by a factor of 3 to 9.3(highest at Porong) from upstream to downstream. Thefactor for DOC varies between 32 and 532 (highest at theLengkong Dam). The fluxes in only four months betweenJanuary and April comprised 66% and 87% of the totalannual fluxes of DIC and DOC, respectively. The datademonstrate that the estimated annual water discharge fromthe Porong outlet is about 7.523 km3 a�1 and through theGunung Sari outlet is 1.6 km3 a�1.
4. Discussion
[27] The hydrology data herein show that the maximumdischarge in April, and not in December, is caused by the
groundwater outflow after the period of subsurface accu-mulation/retention in the catchment. Thus, the requiredretention time from maximum rainfall to maximum dis-charge is approximately four months. Also, at the peak ofthe rainy season, between October and December, theunderground soil water holding capacity may not have beensaturated. Accordingly, rainfall during this period does notcontribute directly to the surface runoff, as evidenced by thelow runoff in November. Hence, the runoff peak in Aprilwas caused by groundwater outflow. A third possibilityinvolves the control or regulation of dam outflow, since thewater that was partially retained during the rainy season,especially over the Karang Kates Dam was released inApril. However, the more downstream, the peak flow inApril gets larger as the consequence of accumulated dis-charge from tributaries. Furthermore, secondary data fromPJT 1 show that the surface water retention time from theKarang Kates Dam outlet to the estuary is only about 28 h.If in April the release of discharge was controlled solely bythe Karang Kates outlet, such a short water travel timewould not take place. In other words, the first two possi-bilities are quite convincing.
Figure 8. Effect of damming on carbon budget in upstream dams at an additional four sampling stationsfrom January to April 2006.
G03029 ALDRIAN ET AL.: CARBON FLUXES OF THE BRANTAS CATCHMENT
9 of 13
G03029

[28] The increase in DOC during the rainy season at allstations is associated with biological activity. For example,rice planting patterns in Java follow the marked seasonalityof rainfall [Naylor et al., 2001]. For each month (notshown), the differences among DOC data from all stationsare not very large, but the variation among DIC data arelarge because carbonate weathering is unevenly distributed.The DIC and TIC at Porong during the dry season is muchhigher than at other sites because of the contribution from amarble factory, as mentioned above. The DOC concentra-tion values of 2000–3000 mM during the rainy season andbelow 1000 mM during the dry season are comparable tothose over the Siak River in central Sumatera, which arebetween 560 and 2594 mM [Baum et al., 2007]. RiverineDOC is produced primarily by the leaching of leaf litterwithin the stream, and by groundwater inflows that infil-trated through organic rich areas of the soil [Boulton et al.,1998]. Such DOC is composed of primarily humic sub-stances [Ertel et al., 1986] with lesser amounts of polysac-charide carbohydrates and amino acids [Volk et al., 1997].Part of this material can be taken up by bacteria [O’Connell
et al., 2000] and up to only about 10% of riverine DOC canbe respired as it passes through the estuary [Moran et al.,1999].[29] As for the comparison of the particulate carbon from
other studies, POC concentrations in this study (between 6.3to 1425 mM) is comparable to other Javanese rivers’, whichare between 175 and 511 mM in the Solo River and 393 mMin the Serayu River [Li et al., 1995]. Meanwhile, percen-tages of POC to total suspended matter recorded in thatstudy were between 1.28 and 1.48% for the Solo River and1.29% for the Serayu River, which is comparable to valuesin this study (between 0.02 to 1.99%).[30] According to Meyers and Lallier-Verges [1999] the
range of d13C*POC in this study is related to C3 land plants.For a detailed investigation of the source of POC, usuallythe isotope method is associated with some amino acidmeasurements or 15N isotope data. Here, we utilize second-ary sources of information from other measurements madein the estuary of the Brantas River. According to Jennerjahnet al. [2004], the range of isotopes herein corresponds to theagricultural waste from rice plants and rice soil. The value
Figure 9. Annual pattern of DIC, DOC, PIC, POC, TSS, and TDS fluxes.
G03029 ALDRIAN ET AL.: CARBON FLUXES OF THE BRANTAS CATCHMENT
10 of 13
G03029

of �19.67% from one sample is associated with sugarcanesoil. Values below �29% for seven samples correspond tothe near estuary sources such as Avicennia and SonneratiaAlba leaves [Jennerjahn et al., 2004]. From the comparisonof other d13C*POC signatures as shown in Table 3 the valuesin this study are similar to those of small mountainous riversof Papua New Guinea [Raymond, 1999].[31] The organic geochemical processes of the Brantas
River, unlike its inorganic hydrochemistry, are still poorlyunderstood. The source of riverine organic carbon can bedivided into three categories [Degens, 1982]; an allochtho-nous pool derived from terrestrial organic matter, an autoch-othonous pool originated from in situ biological productionand the anthropogenous pool derived from industrial, do-mestic and agricultural wastes. According to Figure 9, theDOC flux variability between stations was smaller than theDIC variability, suggesting that the dominant source of DICis associated with carbonate weathering. Moreover, DOCfluxes differ greatly between the dry and wet periods, butthe DIC fluxes differ less. Agricultural waste and otherbiological products in the wet season are important sourcesof this DOC contrast. The variation of DIC over thoseperiods is driven primarily by the large contrast of dischargevalues. In the case of DOC concentration, large seasonaldifferences are due to high biological activity. In fact, theDO values over the Brantas catchment (Table 5) varyseasonally, as an indicator of biological activity in the wetperiod and eutrophication in the dry season. That table alsoindicates that oxygen seems to be undersaturated in theriver. Probably, another source of inorganic carbon is therespiration within the water column or the sediments.Imported organics (e.g., from agriculture) will to a certainextent be metabolized by aquatic heterotrophs, consumingO2 and producing CO2. Additionally, Figure 9 also indi-cates a strong increase in DIC and DOC carbon sources inthe middle stream in March and April, while this area actsas a sink for carbon by the end of the dry period (look atFigure 10). Like DIC distribution, Gunung Sari becomes asinking place for DOC, where concentrations are higherthan other sampling stations are detected.[32] The calculations herein yield TSS flux values
(Table 4) of about 3.0 � 106 t a�1 from the Brantas tothe estuary. This number is within the range of observedvalues that had been measured by Perum Jasa Tirta I(PJT I) at Lengkong from 1991 to 1997, which was from0.43 � 106 t a�1 during El Nino in 1997 to 3.82 � 106 t a�1
in 1995. The TSS flux in this study, 3.0 � 106 t a�1, istypical of a normal year. Since the Brantas River basin is atypical Java River basin, TSS and TDS fluxes for thewhole Java can be estimated based on the data provided inTable 4. The calculation based on the Brantas River catch-
ment area of 11050 km2 or approximately 8.7% of the areaof Java, yields extrapolated TSS and TDS fluxes over Javaof 3.45 � 107 and 3.25 � 107 t a�1, respectively. Notably,this extrapolation does not take into account variety of basinlocation (e.g., east versus west coast) as well as theinfluence of the dams in other basins. Milliman et al.[1999], however, estimated that fluxes from Java may reach3.3 � 108 t a�1 or ten times larger than the value extrap-olated value of this study, which is 3.45 � 107 t a�1. Thediscrepancies may come from intensive irrigation systemthat was built in mid 1980s and 1990s. Thus there aresignificant differences on loading patterns of sediment andcarbon during Hoekstra’s [1989] study and the presentstudy. In the present study, the carbon and sediment fluxesthat leak out from the main river stream may eventuallyreach the estuary through small tributaries other than mainoutlets through Porong and Gunung Sari.
Table 3. Comparison of d13C*POC Signatures From Several
Rivers Around the World
River d13C*POC (%) Source
York �28.2 to �30.0 Raymond and Bauer [2001]Parker �30.0 to �33.7 Raymond and Bauer [2001]Small mountainous,Papua New Guninea
�22.3 to �32.6 Raymond [1999]
Amazon �26.6 Raymond and Bauer [2001]Brantas �32.77 to �19.67 this paper
Figure 10. (top) DIC and (bottom) DOC fluxes from (top)upstream to (bottom) downstream. The diagram wascalculated using the different fluxes between the respectivesampling site and the upstream site. The spatial fluxes forPorong and Gunung Sari were calculated using thedifferences between their values and those at LengkongDam.
Table 4. Estimated Sediment and Carbon Loads From Brantas to
the Estuary and Catchment Yields
ParameterPorong Load(103 t a�1)
Gunung Sari Load(103 t a�1)
Brantas Yield(t km�2 a�1)
DIC 258.2 60.7 28.86DOC 202.3 37.2 21.67PIC 15.5 4.0 1.77POC 37.9 9.5 4.29TSS 2661.7 345.6 272.15TDS 2288.0 544.6 256.34
G03029 ALDRIAN ET AL.: CARBON FLUXES OF THE BRANTAS CATCHMENT
11 of 13
G03029

[33] In comparison to other small mountainous rivers,the carbon yields for POC and DOC over Brantas aresimilar to those of the Sepik River in Papua New Guinea[Burns et al., 2001], which has POC and DOC yields of15.5 and 5.8 t km�1 a�1, respectively. Results of thisstudy are much higher than most of small mountainousrivers in New Zealand as reported by Carey et al. [2005].However, the values in this study are smaller than themountainous Sikkim River, Himalaya with POC and DOCyield values of 28 and 67 t km�1 a�1, respectively[Sharma and Rai, 2004]. The total sediment yield fromthe Brantas River at about 272 t km�2 a�1 is similar tothat of the Ganges River (530 t km�2 a�1), which ranksnumber 17 among the top 20 rivers that originate atelevations above 3000 m [Chen et al., 2004] and above thoseof the Indus (260 t km�2 a�1), Yangtze (250 t km�2 a�1) andAmazon River (190 t km�2 a�1).[34] Another way to illustrate the carbon fluxes is to
present the spatial and temporal trend from upstream todownstream (Figure 10). The net changes of carbon fluxesis an indication of source if the number is positive and anindication of sink if the number is negative. In most cases,the whole river basin is the source of carbon except in themiddle stream between Mrican Dam and Gunung Sari fromOctober to January and between Lengkong Dam andGunung Sari in March. Although the period betweenOctober and January is in the middle of rainy season anddischarge is not at the minimum, carbon is removed duringthis time of the year. The most likely cause is the highintensity of irrigation and the uptake of carbon associatedwith the paddy fields during this period in the middle anddownstream areas. In the midstream, carbon and sedimentloadings within the mainstream of Brantas are redistributedinto smaller irrigation channels and flows to tributaries intothe coast. Moreover, this area exhibits low carbonateweathering as explained above. The removal of both DICand DOC at midstream between October and Januarysuggests the uptake of DIC and the decomposition ofDOC, perhaps by heterotrophic microbes. The high DOcontent (Table 5) and high discharge multiply the rates ofbiological uptake and excretion in the rainy season. TheDIC and DOC fluxes peak occurs in April or when theriverine discharge peaks. DO is a good indicator of biolog-ical activity. In general, the DIC and DOC flux analysesindicate that the upstream river is a carbon source, themiddle stream is a carbon sink and the downstream is a netsource.
5. Conclusions
[35] Small mountainous river discharge into the oceansalong with sediment material within is important for globalbiogeochemical cycle. Little is known about the carbon andsediment fluxes from a small mountainous tropical river.
Assessments of the contribution of such a small river to theglobal budget are sometimes misleading due to less knowl-edge on seasonal basis. The Brantas River basin is a goodexample for closing the information gap on this issue.Moreover, the volcanic activity in the upstream region,ever changing climate and anthropogenic activities providea good estimates for representing similar river type in theregion. Regarding this, large contrasts between wet and dryseasons were described and how the carbon and sedimentconcentration as well as their respective fluxes behave wereelucidated.[36] TIC concentration was much higher than TOC,
although the gap got closer from January onward. Carbonflux was dominated by TIC especially in the source regionduring the dry season and in the midstream. The upstream isa carbon source, and the middle stream is a carbon sink.Damming traps organic carbon rather than inorganic carbon.The high inorganic carbon is derived from chemical weath-ering of the limestone. The upstream cascade dam exhibitedvarying carbon dynamic on monthly basis. DIC concen-trations were persistently high throughout the year becauseof carbonate weathering in the upstream and downstream,whereas DOC concentrations were highly seasonal becauseof biological activity.
[37] Acknowledgments. The authors would like to thank the SARCSproject 94/01/CW and the National Science Council of the Republic ofChina, Taiwan (NSC 95-2621-Z-ID-005), for financially supporting thisresearch. The authors offer special thanks to Didik Agus Wijanarko and hisstaff at the Water Quality Laboratory in Surabaya for support in the field,the Jasa Tirta Public Corporation (PJT I) for support in the field and incompiling discharge and rainfall data, and Yudha Setiawan Djamil for dataprocessing and illustrations. The authors are very grateful to V. Ittekkot,Tim Jennerjhan, Dorothee Dasbach, and Matthias Birkicht from Zentrumfur Marine Tropenokologie (ZMT), Bremen, Germany, for laboratoryequipment and assistance. Two reviewers provided a positive and detailedreview which greatly enhanced the quality of the manuscript. The finalversion of the manuscript was prepared while E. Aldrian was a visitingscholar, supported by the Aim for the Top University Plan (94C030200), atNational Sun Yat-Sen University, Taiwan. The editor is appreciated for hiseditorial assistance.
ReferencesAldrian, E., and Y. S. Djamil (2008), Spatio-temporal climatic change ofrainfall in East Java Indonesia, Int. J. Climatol., 28, 435–448.
Aldrian, E., and R. D. Susanto (2003), Identification of three dominantrainfall regions within Indonesia and their relationship to sea surfacetemperature, Int. J. Climatol., 23, 1435–1452.
Baum, A., T. Rixen, and J. Samiaji (2007), Relevance of peat drainingrivers in central Sumatra for the riverine input of dissolved organic car-bon into the ocean, Estuarine Coastal Shelf Sci., 73, 563–570.
Binnie & Partners (Overseas) Ltd (1999), Surabaya River pollution controlaction plan study, vol. 2, Main report, Redhill, UK.
Blair, N. E., E. L. Leithold, S. T. Ford, K. A. Peeler, J. C. Holmes, andD. W. Perkey (2003), The persistence of memory: The fate of ancientsedimentary organic carbon in a modern sedimentary system, Geochim.Cosmochim. Acta, 67, 63–74.
Booth, C. A., A. Warianti, and T. Wrigley (2001), Establishing an Inte-grated Catchment Management (ICM) program in East Java, Indonesia,Water Sci. Technol., 43(9), 227–234.
Table 5. Dissolved Oxygen Concentration at Sampling Stations in Dry (July) and Rainy Seasons (January)a
Month
Sampling Locations
Gadang Kr. Kates Dam Lodoyo Dam Mrican Dam Lengkong Dam Gunung Sari Porong
Jul 4.54 1.51 5.70 5.35 6.74 2.23 5.64Jan 7.40 5.00 7.97 6.77 6.57 3.78 7.17aUnits are in mg/L.
G03029 ALDRIAN ET AL.: CARBON FLUXES OF THE BRANTAS CATCHMENT
12 of 13
G03029
Boulton, A. J., S. Findlay, P. Marmonier, E. H. Stanley, and H. M. Valett(1998), The functional significance of the hyporheic zone in streams andrivers, Annu. Rev. Ecol. Syst., 29, 59–82.
Burns, K. A., P. J. Hernes, R. Benner, S. Codi, and D. Brinkman (2001),Organic biomarkers aid in source function estimates for the SepikRiver outflow into the New Guinea coastal undercurrent, paper pre-sented at International Organic Geochemistry Meeting, Eur. Assoc. ofOrg. Geochem., Nancy, France.
Carey, A. E., C. B. Gardner, S. T. Goldsmith, W. B. Lyons, and D. M. Hicks(2005), Organic carbon yields from small, mountainous rivers, NewZealand, Geophys. Res. Lett., 32, L15404, doi:10.1029/2005GL023159.
Chen, C. T. A. (2002), The impact of dams on fisheries: Case of the threeGorges dam, in Challenges of a Changing Earth, edited by W. Steffenm,J. Jager, D. J. Carson, and C. Bradshaw, pp. 97–99, Springer, Berlin.
Chen, C. T. A. (2004), Exchanges of carbon in the coastal seas, in TheGlobal Carbon Cycle: Integrating Humans, Climate, and the NaturalWorld, edited by C. B. Field and M. R. Raupach, pp. 341–351, IslandPress, Washington, D. C.
Chen, C. T. A., J. T. Liu, and B. J. Tsuang (2004), Island-based catchment–The Taiwan example, Reg. Environ. Change, 4, 39–48.
Degens, E. T. (1982), Riverine carbon: An overview, in Transport of carbonand minerals in major world rivers, edited by E. T. Degens, pp. 633–654,Mitt. Geol.-Paleaeont. Inst., Univ. of Hamburg, Hamburg, Germany.
Depetris, P. J., and D. M. Gaiero (1998), Water-surface slope, total sus-pended sediment and particulate organic carbon variability in the Parana’River during extreme flooding, Naturwissenschaften, 85, 26–28.
Douglas, I. (1996), The impact of land-use changes, especially logging,shifting cultivation, mining and urbanization on sediment yields in tro-pical Southeast Asia: A review with special reference to Borneo, Int.Assoc. Hydrol. Sci. Publ., 236, 463–472.
Ertel, J. R., J. I. Hedges, J. E. Richey, and M. N. G. Ribeiro (1986),Dissolved humic substances of the Amazon River system, Geochim.Cosmochim. Acta, 13, 739–754.
Frankignoulle, M., and A. V. Borges (2001), Direct and indirect pCO2
measurements in a wide range of pCO2 and salinity values (The ScheldtEstuary), Aquat. Geochem., 7, 267–273.
Gomez, B., N. A. Trustrum, D. M. Hicks, K. M. Rogers, M. J. Page, andK. R. Tate (2003), Production, storage, and output of particulate organiccarbon: Waipaoa River basin, New Zealand, Water Resour. Res., 39(6),1161, doi:10.1029/2002WR001619.
Hart, B. T., P. Davies, C. Humphrey, R. Norris, S. Sudaryanti, and Y.Trihadiningrum (2001), Application of the Australian river bioassess-ment system (AUSRIVAS) in the Brantas River, East Java, Indonesia,J. Environ. Manage., 62, 93–100.
Hedges, J. I., et al. (1992), Global biogeochemical cycles: Progress andproblems, Mar. Chem., 39, 67–93.
Hedges, J. I., et al. (2000), The molecularly-uncharacterized component ofnonliving organic matter in natural environments, Org. Geochem., 31,945–958.
Hoekstra, P. (1989), Hydrodynamics and depositional processes of the Soloand Porong Deltas, East Java, Indonesia, in Proceedings of the KNGMGSymposium ‘‘Coastal Lowlands, Geology and Geotechnology’’ 1987,pp. 161–173, Kluwer, Dordrecht.
Hoekstra, P., R. F. Nolting, and H. A. van der Sloot (1989), Supply and dis-persion of water and suspendedmatter of the rivers Solo and Brantas into thecoastal waters of East Java, Indonesia, Neth. J. Sea Res., 23, 501–515.
Ittekkot, V. (1988), Global trends in the nature of organic matter in riversuspensions, Nature, 332, 436–438.
Jennerjahn, T. C., V. Ittekkot, S. Klopper, S. Adi, S. P. Nugroho, N. Sudiana,A. Yusmal, Prihartanto, and B. Gaye-Haake (2004), Biogeochemistry of atropical river affected by human activities in its catchment: Brantas Riverestuary and coastal waters of Madure Strait, Java, Indonesia, EstuarineCoastal Shelf Sci., 60, 503–514.
Kao, S. J., and K. K. Liu (1996), Particulate organic carbon export froma subtropical mountainous river in Taiwan, Limnol. Oceanogr., 41,1749–1757.
Kao, S. J., and K. K. Liu (1997), Fluxes of DOC and fossil POC from anOceania small river (Lanyang-Hsi) in Taiwan, Biogeochemistry, 39,255–269.
Komada, T., E. R. M. Druffel, and S. E. Trumbore (2004), Oceanic exportof relict carbon by small mountainous rivers, Geophys. Res. Lett., 31,L07504, doi:10.1029/2004GL019512.
Lavigne, F. (2004), Rate of sediment yield following small-scale volcaniceruptions: A quantitative assessment at the Merapi and Semeru stratovol-canoes, Java, Indonesia, Earth Surf. Process. Landf., 29(8), 1045–1058.
Li, W., J. Dagaut, and A. Saliot (1995), The application of sterolbiomakers to the study of the sources of particulate organic matterin the Solo River system and the Serayu River, Java, Indonesia,Biogeochemistry, 31, 139–154.
Ludwig, W., J. L. Probst, and S. Kempe (1996), Predicting the oceanic inputof organic carbon by continental erosion, Global Biogeochem. Cycles, 10,23–41.
Lyons, W. B., C. A. Nezat, A. E. Carey, and D. M. Hicks (2002), Organiccarbon fluxes to the ocean from high-standing islands, Geology, 30,443–446.
Marini, G. W., and H. Weilguni (2003), Hydrological information systembased on on-line monitoring–From strategy to implementation in theBrantas River basin, East Java, Indonesia, Water Sci. Technol., 47(2),189–196.
McKee, B. A. (2003), RiOMar: The transport, transformation and fate ofcarbon in river-dominated ocean margins, report of RiOMar Workshop,1–3 November 2001, Tulane Univ., New Orleans, La.
Meybeck, M. (1982), Carbon, nitrogen, and phosphorous transport byworld rivers, Am. J. Sci., 282, 401–450.
Meyers, P. A., and E. Lallier-Verges (1999), Lacustrine sedimentary organicmatter records of Late Quaternary paleoclimates, J. Paleolimnol., 21,345–372.
Milliman, J. D. (1997), Blessed dams or damned dams?, Nature, 386,325–327.
Milliman, J. D., and R. H. Meade (1983), World-wide delivery of riversediment to the oceans, J. Geol., 91, 1–21.
Milliman, J. D., and J. P. M. Syvitski (1992), Geomorphic/tectonic controlof sediment discharge to the ocean: The importance of small mountainousrivers, J. Geol., 100, 525–544.
Milliman, J. D., M. E. Ren, Y.-S. Qin, and Y. Saito (1987), Man’s influenceon the erosion and transport of sediment by Asian rivers: The YellowRiver (Huanghe) example, J. Geol., 95, 751–762.
Milliman, J. D., K. L. Farnsworth, and C. S. Albertin (1999), Flux and fateof fluvial sediments leaving large islands in the East Indies, J. Sea Res.,41, 97–107.
Moran, M. A., W. M. Sheldon Jr., and J. E. Sheldon (1999), Biodegradationof riverine dissolved organic carbon in five estuaries of the south easternUnited States, Estuaries, 22, 55–64.
Naylor, R. L., W. P. Falcon, D. Rochberg, and N. Wada (2001), Using ElNino/Southern Oscillation climate data to predict rice production inIndonesia, Clim. Change, 50, 255–265.
O’Connell, M., D. S. Baldwin, A. I. Robertson, and G. Rees (2000), Re-lease and bioavailability of dissolved organic matter from flood plainlitter: Influence of oxygen levels, Freshwater Biol., 45, 333–342.
Raymond, M. B. (1999), Geochemistry of small mountainous river ofPapua New Guinea: Local observations and global implications, Masterthesis, College of William and Mary, Williamsburg, Va.
Raymond, P. A., and J. E. Bauer (2001), Riverine export of aged terrestrialorganic matter to the North Atlantic Ocean, Nature, 409, 497–500.
Schlunz, B., and R. R. Schneider (2000), Transport of terrestrial organiccarbon to the oceans by rivers: Re-estimating flux and burial rates, Int. J.Earth Sci., 88, 599–606.
Sharma, P., and S. C. Rai (2004), Streamflow, sediment and carbon trans-port from a Himalayan watershed, J. Hydrol. Amsterdam, 289, 190–203.
Sudaryanti, S., Y. Trihadiningrum, B. T. Hart, P. Davies, C. Humphrey, andR. Norris (2001), Assessment of the biological health of the BrantasRiver, East Java, Indonesia using the Australian River Assessment Sys-tem (AUSRIVAS) methodology, Aquat. Ecol., 35, 135–146.
Tranvik, L. J., and M. Jansson (2002), Terrestrial export of organic carbon,Nature, 415, 861–862.
Volk, C. J., C. B. Volk, and L. A. Kaplan (1997), Chemical compositionof biodegradable dissolved organic matter in stream water, Limnol.Oceanogr., 42, 39–44.
Vorosmarty, C. J., K. P. Sharma, B. M. Fekete, A. H. Copeland, J. Holden,J. Marble, and J. A. Lough (1997), The storage and aging of continentalrunoff in large reservoir systems of the world, Ambio, 26(4), 210–219.
�����������������������S. Adi, E. Aldrian, S. P. Nugroho, Prihartanto, and N. Sudiana, Agency
for the Assessment and Application of Technology, Jl. MH Thamrin no. 8,Jakarta 10340, Indonesia. ([email protected])C.-T. A. Chen, Institute of Marine Geology and Chemistry, National Sun
Yat-Sen University, Kaohsiung 80424, Taiwan.
G03029 ALDRIAN ET AL.: CARBON FLUXES OF THE BRANTAS CATCHMENT
13 of 13
G03029