Different contributions of riverine and oceanic nutrient fluxes supporting primary production in...
11
Research papers Different contributions of riverine and oceanic nutrient fluxes supporting primary production in Ishikari Bay Julius I. Agboola a,b,n , Isao Kudo a,c a Graduate School of Environmental Science, Hokkaido University, Kita 10 Nishi 5, Sapporo 060-0810, Japan b Department of Fisheries and Centre for Environment and Science Education (CESE), Lagos State University, Ojo, Lagos, Nigeria c Graduate School of Fisheries Sciences, Hokkaido University, Hakodate 041-8611, Japan article info Article history: Received 26 December 2013 Received in revised form 18 July 2014 Accepted 25 July 2014 Available online 5 August 2014 Keywords: Nutrients Oligotrophic Primary production Coastal Estuarine circulation. abstract We computed a ratio of riverine nutrient flux (RNF) to bottom nutrient flux (BNF) to determine the relative importance of oceanic and riverine nutrient fluxes on primary production dynamics in Ishikari Bay, which is composed of oligotrophic subarctic coastal water. Across spring, summer and autumn, the RNF:BNF ratio (R:B ratio) was significantly greater than 1.0, especially in spring and autumn for DIN and Si(OH) 4 , suggesting that riverine nutrients mostly supported primary production. A strong inverse relationship (r ¼0.927) between Chl a and salinity in autumn and a corresponding increase in the apparent utilization of DIN and primary production indicated that the contribution of DIN from the Ishikari River on primary production was maximal in autumn. However the R:B ratio for PO 4 was significantly less than 1.0, especially in summer (0.1) and autumn (0.3), suggesting a larger contribution of bottom upwelling nutrient sources. In spring, when the ratio was close to 1 (0.8), PO 4 supply from both bottom (upwelling) and surface (river) was equivalent, since PO 4 concentration of river end- member was the lowest. Although riverine nutrient fluxes were a major source of DIN and Si(OH) 4 nutrient supply in the bay, oceanic nutrient contribution from bottom upwelling and horizontal advection was a major source of PO 4 . While riverine nutrients significantly fuel primary production, the estuarine circulation process may contribute significantly to compensating for the inadequate supply of riverine PO 4 in an oligotrophic system like Ishikari Bay. Also, unlike the usual estuarine system in which nutrient concentration at a deeper layer is high due to the regeneration of nutrients at depth, concentration in Ishikari Bay was very low due to an influence of oligotrophic waters. We conclude that riverine nutrient flux contributes a large portion of the total flux in Ishikari Bay. & 2014 Elsevier Ltd. All rights reserved. 1. Introduction Primary production is dependent on the presence of the appropriate combination of nutrients to support and sustain their activity (Brzezinski, 1985; Barber et al., 2001; Kristiansen and Hoell., 2002; Kudo et al., 2005). Rivers are a critical link in the global cycling of elements, and dissolved inorganic nutrients from rivers to ocean system are obviously of great importance in a discussion of the interactions of these compounds in estuarine and adjacent coastal zones. Also, massive transport of nutrients from the deeper nutrient-rich layers to the impoverished euphotic zone occurs when intense vertical mixing or upwelling processes are observed. Such short and cataclysmic events have a pronounced influence on the biogeochemical fluxes in the ocean because they accelerate the completion of nutrient transport to upper layers, which would take much longer under “ordinary” conditions. However, it is difficult to evaluate these fluxes due to significant seasonal fluctuations and human activities that perturb the natural fluxes. One of the objectives in this study is to determine the possible sources of nutrients, and ultimately the fate of nutrients that are drawn from the Ishikari River into the adjacent shelf of Ishikari Bay, the northwestern North Pacific, Japan (Fig. 1). Unlike the Pacific coastal region, which is influenced by the subarctic ocean current (Oyashio) with its high nutrients, Ishikari Bay receives few nutrient fluxes from oligotrophic subtropical (Tsushima) warm currents (Yoshida et al., 1977) and receives a nutrient flux from the Ishikari River, the second largest river in the catchment area in Japan. Thus, the bay is characterized as an oligotrophic subarctic coastal water with a considerable influence of riverine discharge from the Ishikari River (Agboola et al., 2010). Earlier studies on the seasonal change in riverine nutrients and distribution of chlorophyll a at 26 gridded sampling stations in Ishikari Bay have been reported (Agboola et al., 2009, 2010). Also, Contents lists available at ScienceDirect journal homepage: www.elsevier.com/locate/csr Continental Shelf Research http://dx.doi.org/10.1016/j.csr.2014.07.013 0278-4343/& 2014 Elsevier Ltd. All rights reserved. n Corresponding author at: Department of Fisheries and Centre for Environment and Science Education (CESE), Lagos State University, Ojo, Lagos, Nigeria. Tel.: þ234 8052242886. E-mail address: [email protected] (J.I. Agboola). Continental Shelf Research 88 (2014) 140–150
Transcript of Different contributions of riverine and oceanic nutrient fluxes supporting primary production in...
Research papers
Different contributions of riverine and oceanic nutrient fluxessupporting primary production in Ishikari Bay
Julius I. Agboola a,b,n, Isao Kudo a,c
a Graduate School of Environmental Science, Hokkaido University, Kita 10 Nishi 5, Sapporo 060-0810, Japanb Department of Fisheries and Centre for Environment and Science Education (CESE), Lagos State University, Ojo, Lagos, Nigeriac Graduate School of Fisheries Sciences, Hokkaido University, Hakodate 041-8611, Japan
a r t i c l e i n f o
Article history:Received 26 December 2013Received in revised form18 July 2014Accepted 25 July 2014Available online 5 August 2014
Keywords:NutrientsOligotrophicPrimary productionCoastalEstuarine circulation.
a b s t r a c t
We computed a ratio of riverine nutrient flux (RNF) to bottom nutrient flux (BNF) to determine therelative importance of oceanic and riverine nutrient fluxes on primary production dynamics in IshikariBay, which is composed of oligotrophic subarctic coastal water. Across spring, summer and autumn, theRNF:BNF ratio (R:B ratio) was significantly greater than 1.0, especially in spring and autumn for DIN andSi(OH)4, suggesting that riverine nutrients mostly supported primary production. A strong inverserelationship (r¼�0.927) between Chl a and salinity in autumn and a corresponding increase in theapparent utilization of DIN and primary production indicated that the contribution of DIN from theIshikari River on primary production was maximal in autumn. However the R:B ratio for PO4 wassignificantly less than 1.0, especially in summer (0.1) and autumn (0.3), suggesting a larger contributionof bottom upwelling nutrient sources. In spring, when the ratio was close to 1 (0.8), PO4 supply fromboth bottom (upwelling) and surface (river) was equivalent, since PO4 concentration of river end-member was the lowest. Although riverine nutrient fluxes were a major source of DIN and Si(OH)4nutrient supply in the bay, oceanic nutrient contribution from bottom upwelling and horizontaladvection was a major source of PO4. While riverine nutrients significantly fuel primary production,the estuarine circulation process may contribute significantly to compensating for the inadequate supplyof riverine PO4 in an oligotrophic system like Ishikari Bay. Also, unlike the usual estuarine system inwhich nutrient concentration at a deeper layer is high due to the regeneration of nutrients at depth,concentration in Ishikari Bay was very low due to an influence of oligotrophic waters. We conclude thatriverine nutrient flux contributes a large portion of the total flux in Ishikari Bay.
& 2014 Elsevier Ltd. All rights reserved.
1. Introduction
Primary production is dependent on the presence of theappropriate combination of nutrients to support and sustain theiractivity (Brzezinski, 1985; Barber et al., 2001; Kristiansen andHoell., 2002; Kudo et al., 2005). Rivers are a critical link in theglobal cycling of elements, and dissolved inorganic nutrients fromrivers to ocean system are obviously of great importance in adiscussion of the interactions of these compounds in estuarine andadjacent coastal zones. Also, massive transport of nutrients fromthe deeper nutrient-rich layers to the impoverished euphotic zoneoccurs when intense vertical mixing or upwelling processes areobserved. Such short and cataclysmic events have a pronouncedinfluence on the biogeochemical fluxes in the ocean because they
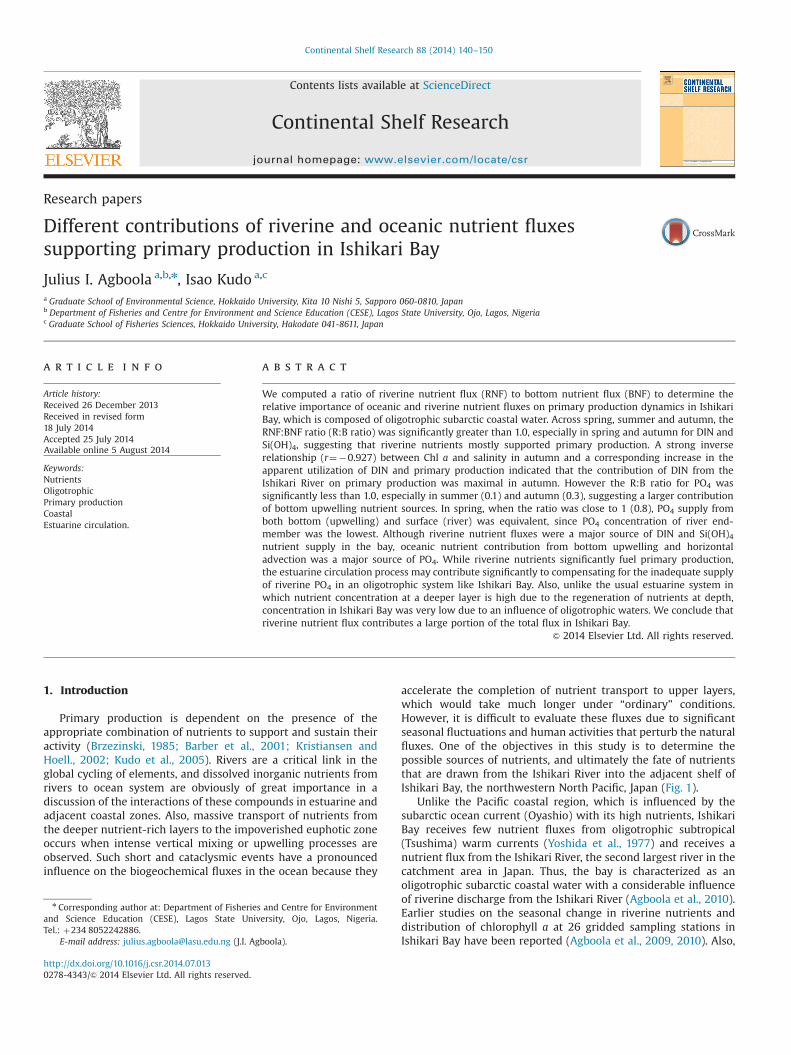
accelerate the completion of nutrient transport to upper layers,which would take much longer under “ordinary” conditions.However, it is difficult to evaluate these fluxes due to significantseasonal fluctuations and human activities that perturb the naturalfluxes. One of the objectives in this study is to determine thepossible sources of nutrients, and ultimately the fate of nutrientsthat are drawn from the Ishikari River into the adjacent shelf ofIshikari Bay, the northwestern North Pacific, Japan (Fig. 1).
Unlike the Pacific coastal region, which is influenced by thesubarctic ocean current (Oyashio) with its high nutrients, IshikariBay receives few nutrient fluxes from oligotrophic subtropical(Tsushima) warm currents (Yoshida et al., 1977) and receives anutrient flux from the Ishikari River, the second largest river in thecatchment area in Japan. Thus, the bay is characterized as anoligotrophic subarctic coastal water with a considerable influenceof riverine discharge from the Ishikari River (Agboola et al., 2010).Earlier studies on the seasonal change in riverine nutrients anddistribution of chlorophyll a at 26 gridded sampling stations inIshikari Bay have been reported (Agboola et al., 2009, 2010). Also,
Contents lists available at ScienceDirect
journal homepage: www.elsevier.com/locate/csr
Continental Shelf Research
http://dx.doi.org/10.1016/j.csr.2014.07.0130278-4343/& 2014 Elsevier Ltd. All rights reserved.
n Corresponding author at: Department of Fisheries and Centre for Environmentand Science Education (CESE), Lagos State University, Ojo, Lagos, Nigeria.Tel.: þ234 8052242886.
E-mail address: [email protected] (J.I. Agboola).
Continental Shelf Research 88 (2014) 140–150
Agboola et al. (2013) reported on a 16-month time-series study onseasonality and the environmental drivers of biological productiv-ity (primary productivity and chlorophyll biomass) in Ishikari Bay.However, studies on influence of estuarine circulation and oceanicnutrient fluxes as well as coupled riverine nutrient flux onphytoplankton biomass and production dynamics are scarce inthis region of the Pacific. The present study is the first attempt todocument the dynamics of nutrients and phytoplankton biomassand productivity in Ishikari Bay. We further quantified the relativecontribution of bottom nutrient (upwelling) flux through estuar-ine circulation and horizontal advection from the oceanic regioninto Ishikari Bay.
Lastly, this paper aims to provide the answers to somehypothetical questions. Firstly, can the Ishikari River dischargesupply the required nutrients for phytoplankton biomass andproduction build-up in Ishikari Bay oligotrophic system? Secondly,in considering the relative importance of estuarine circulation, isthere any significant bottom nutrient upwelling flux to theeuphotic zone which could possibly fuel primary production inthe bay? Analysis of seasonal and inter-annual variations in theriver Plume and Out-Plume areas (see Agboola et al., 2009) willnot only help to establish possible relationships between thesevariables, but will also test and validate our hypothesis that theIshikari River discharge contains nutrients to significantly fuelprimary production in Ishikari Bay. If it does, and assuming asteady state, then the river Plume area receiving a higher nutrientflux should have a higher production, and this will enable us topredict the major source of nutrients and other possible factorsfueling or limiting production in this oligotrophic system.
2. Materials and methods
Eight cruises were carried out in Ishikari Bay on board the TSOshoro-Maru and the TS Ushio-Maru of Hokkaido University inspring (April, May), summer (July, August) and autumn (October,November) of 2006 and 2007. The study area, approximately4370 km2, lies between 431100N and 441000N and stretchesbetween 1401000E and 1411220E (Fig. 1). Ishikari Bay is located inthe northwest coast of Hokkaido within the subarctic regions,
which is defined as a vertical 34.0 isohaline from the surface to�200 or 400 m in summer and autumn (Dodimead et al., 1963;Dodimead, 1967). The boundary is located around 421N in theNorth Pacific Ocean and divides the ocean roughly into thesubtropical and subarctic regions.
2.1. Sampling
Routine samplings for nutrients and chlorophyll a were carriedout at all 26 gridded sampling stations using a Sea Bird 911 CTDsystem equipped with a carrousel multi-sampler of 12 2.5-L Niskinbottles to collect discrete samples for macronutrients, Chl a andother biogeochemical variables in the water column (down to 5 mabove the sea floor) at each sampling station. Six stations (repre-sentative stations of Plume and Out-Plume areas) were assignedfor a detailed observation of nutrient and phytoplankton biomassand productivity.
2.2. Nutrients
Sub-samples for nutrients (NO3� , NH4
þ , PO4� and Si(OH)4) were
collected in duplicate in 10 ml spit tubes and were stored frozen at�30 1C until laboratory analysis (Parsons et al., 1984). Concentra-tions of the dissolved inorganic nutrients were determined using acontinuous flow analyzer (QuAAtro, BRANþLUEBBE). Detectionlimits were estimated at around 0.01 mM based on three times thestandard deviation of the lowest concentration of samples.
2.3. Quantification of nutrient fluxes
In order to determine the nutrient fluxes to the bay weconsidered the influence of Ishikari River nutrient discharge andbottom nutrient upwelling through estuarine circulation usingvertical and spatial profile data of salinity and nutrients. Thesedistinct perspectives were deployed and related to phytoplanktonbiomass and productivity across space and time to determine thesource and fluxes of the nutrients fueling primary production inthis oligotrophic system.
I-36 I-36
I-14 I-14
2006 2007
Fig. 1. Sampling stations in Ishikari Bay indicating boarder of Plume for 2006 and 2007. Bold line, spring; broken line, summer; and dashed line, autumn.
J.I. Agboola, I. Kudo / Continental Shelf Research 88 (2014) 140–150 141
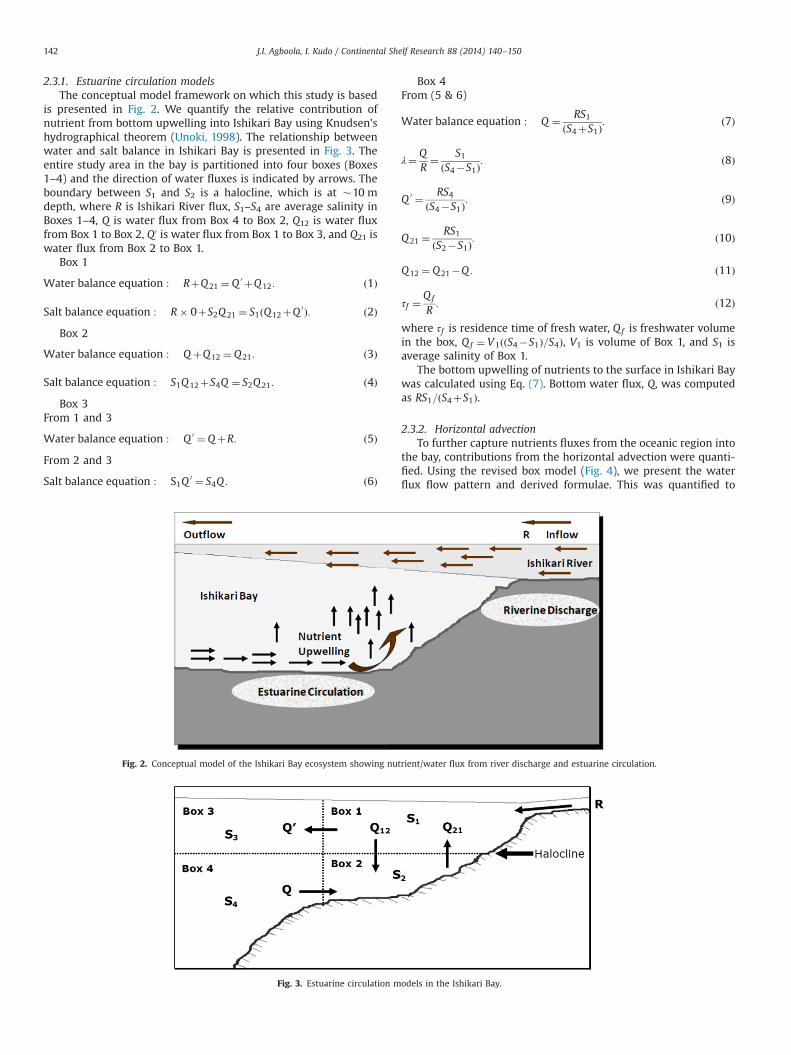
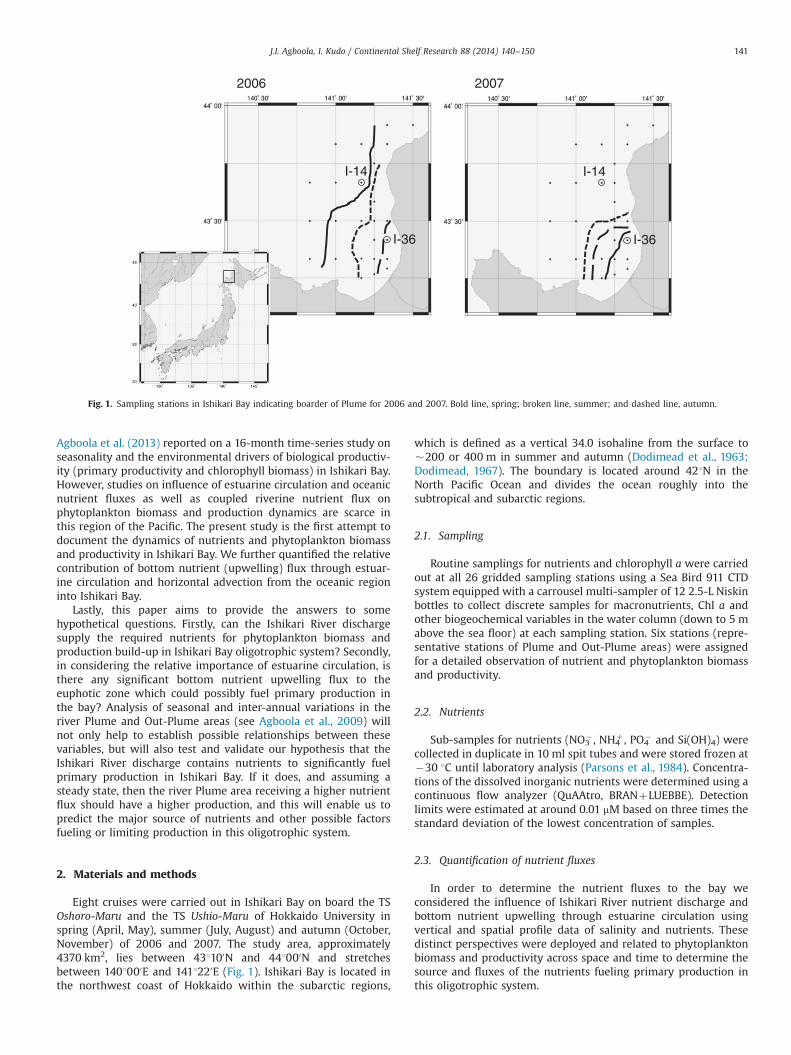
2.3.1. Estuarine circulation modelsThe conceptual model framework on which this study is based
is presented in Fig. 2. We quantify the relative contribution ofnutrient from bottom upwelling into Ishikari Bay using Knudsen'shydrographical theorem (Unoki, 1998). The relationship betweenwater and salt balance in Ishikari Bay is presented in Fig. 3. Theentire study area in the bay is partitioned into four boxes (Boxes1–4) and the direction of water fluxes is indicated by arrows. Theboundary between S1 and S2 is a halocline, which is at �10 mdepth, where R is Ishikari River flux, S1–S4 are average salinity inBoxes 1–4, Q is water flux from Box 4 to Box 2, Q12 is water fluxfrom Box 1 to Box 2, Q0 is water flux from Box 1 to Box 3, and Q21 iswater flux from Box 2 to Box 1.
Box 1
Water balance equation : RþQ21 ¼ Q 0 þQ12: ð1Þ
Salt balance equation : R� 0þS2Q21 ¼ S1ðQ12þQ 0Þ: ð2ÞBox 2
Water balance equation : QþQ12 ¼ Q21: ð3Þ
Salt balance equation : S1Q12þS4Q ¼ S2Q21: ð4ÞBox 3
From 1 and 3
Water balance equation : Q 0 ¼QþR: ð5ÞFrom 2 and 3
Salt balance equation : S1Q0 ¼ S4Q : ð6Þ
Box 4From (5 & 6)
Water balance equation : Q ¼ RS1ðS4þS1Þ
: ð7Þ
λ¼ QR¼ S1ðS4�S1Þ
: ð8Þ
Q 0 ¼ RS4ðS4�S1Þ
: ð9Þ
Q21 ¼RS1
ðS2�S1Þ: ð10Þ
Q12 ¼ Q21�Q : ð11Þ
τf ¼Qf
R: ð12Þ
where τf is residence time of fresh water, Qf is freshwater volumein the box, Qf ¼ V1ððS4�S1Þ=S4Þ, V1 is volume of Box 1, and S1 isaverage salinity of Box 1.
The bottom upwelling of nutrients to the surface in Ishikari Baywas calculated using Eq. (7). Bottom water flux, Q, was computedas RS1=ðS4þS1Þ.
2.3.2. Horizontal advectionTo further capture nutrients fluxes from the oceanic region into
the bay, contributions from the horizontal advection were quanti-fied. Using the revised box model (Fig. 4), we present the waterflux flow pattern and derived formulae. This was quantified to
Fig. 2. Conceptual model of the Ishikari Bay ecosystem showing nutrient/water flux from river discharge and estuarine circulation.
Fig. 3. Estuarine circulation models in the Ishikari Bay.
J.I. Agboola, I. Kudo / Continental Shelf Research 88 (2014) 140–150142
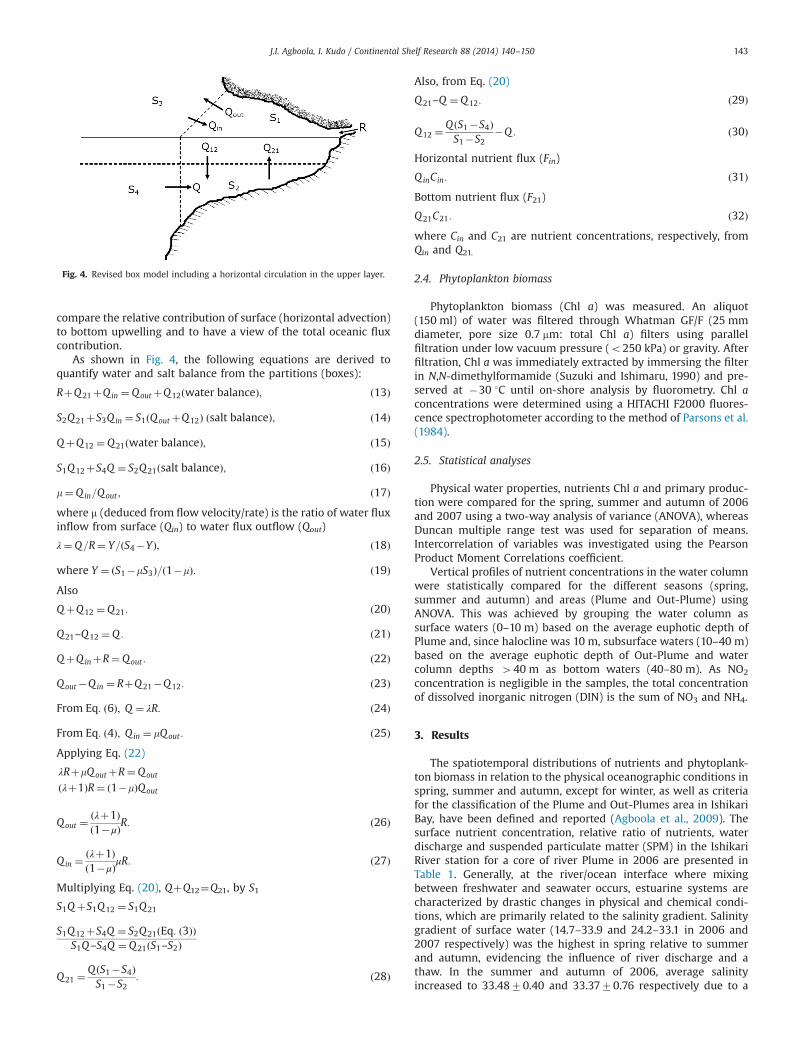
compare the relative contribution of surface (horizontal advection)to bottom upwelling and to have a view of the total oceanic fluxcontribution.
As shown in Fig. 4, the following equations are derived toquantify water and salt balance from the partitions (boxes):
RþQ21þQin ¼ QoutþQ12ðwater balanceÞ; ð13Þ
S2Q21þS3Qin ¼ S1ðQoutþQ12Þ ðsalt balanceÞ; ð14Þ
QþQ12 ¼Q21ðwater balanceÞ; ð15Þ
S1Q12þS4Q ¼ S2Q21ðsalt balanceÞ; ð16Þ
m¼Qin=Qout ; ð17Þwhere m (deduced from flow velocity/rate) is the ratio of water fluxinflow from surface (Qin) to water flux outflow (Qout)
λ¼Q=R¼ Y=ðS4�YÞ; ð18Þ
where Y ¼ ðS1�mS3Þ=ð1�mÞ: ð19ÞAlso
QþQ12 ¼Q21: ð20Þ
Q21–Q12 ¼Q : ð21Þ
QþQinþR¼ Qout : ð22Þ
Qout�Qin ¼ RþQ21�Q12: ð23Þ
From Eq: ð6Þ; Q ¼ λR: ð24Þ
From Eq: ð4Þ; Qin ¼ mQout : ð25ÞApplying Eq. (22)
λRþmQoutþR¼Qout
ðλþ1ÞR¼ ð1�mÞQout
Qout ¼ðλþ1Þð1�μÞR: ð26Þ
Qin ¼ðλþ1Þð1�μÞμR: ð27Þ
Multiplying Eq. (20), QþQ12¼Q21, by S1
S1QþS1Q12 ¼ S1Q21
S1Q12þS4Q ¼ S2Q21ðEq: ð3ÞÞS1Q–S4Q ¼Q21ðS1–S2Þ
Q21 ¼Q ðS1�S4ÞS1�S2
: ð28Þ
Also, from Eq. (20)
Q21–Q ¼Q12: ð29Þ
Q12 ¼Q ðS1�S4ÞS1�S2
�Q : ð30Þ
Horizontal nutrient flux (Fin)
QinCin: ð31ÞBottom nutrient flux (F21)
Q21C21: ð32Þwhere Cin and C21 are nutrient concentrations, respectively, fromQin and Q21.
2.4. Phytoplankton biomass
Phytoplankton biomass (Chl a) was measured. An aliquot(150 ml) of water was filtered through Whatman GF/F (25 mmdiameter, pore size 0.7 mm: total Chl a) filters using parallelfiltration under low vacuum pressure (o250 kPa) or gravity. Afterfiltration, Chl a was immediately extracted by immersing the filterin N,N-dimethylformamide (Suzuki and Ishimaru, 1990) and pre-served at �30 1C until on-shore analysis by fluorometry. Chl aconcentrations were determined using a HITACHI F2000 fluores-cence spectrophotometer according to the method of Parsons et al.(1984).
2.5. Statistical analyses
Physical water properties, nutrients Chl a and primary produc-tion were compared for the spring, summer and autumn of 2006and 2007 using a two-way analysis of variance (ANOVA), whereasDuncan multiple range test was used for separation of means.Intercorrelation of variables was investigated using the PearsonProduct Moment Correlations coefficient.
Vertical profiles of nutrient concentrations in the water columnwere statistically compared for the different seasons (spring,summer and autumn) and areas (Plume and Out-Plume) usingANOVA. This was achieved by grouping the water column assurface waters (0–10 m) based on the average euphotic depth ofPlume and, since halocline was 10 m, subsurface waters (10–40 m)based on the average euphotic depth of Out-Plume and watercolumn depths 440 m as bottom waters (40–80 m). As NO2
concentration is negligible in the samples, the total concentrationof dissolved inorganic nitrogen (DIN) is the sum of NO3 and NH4.
3. Results
The spatiotemporal distributions of nutrients and phytoplank-ton biomass in relation to the physical oceanographic conditions inspring, summer and autumn, except for winter, as well as criteriafor the classification of the Plume and Out-Plumes area in IshikariBay, have been defined and reported (Agboola et al., 2009). Thesurface nutrient concentration, relative ratio of nutrients, waterdischarge and suspended particulate matter (SPM) in the IshikariRiver station for a core of river Plume in 2006 are presented inTable 1. Generally, at the river/ocean interface where mixingbetween freshwater and seawater occurs, estuarine systems arecharacterized by drastic changes in physical and chemical condi-tions, which are primarily related to the salinity gradient. Salinitygradient of surface water (14.7–33.9 and 24.2–33.1 in 2006 and2007 respectively) was the highest in spring relative to summerand autumn, evidencing the influence of river discharge and athaw. In the summer and autumn of 2006, average salinityincreased to 33.4870.40 and 33.3770.76 respectively due to a
Fig. 4. Revised box model including a horizontal circulation in the upper layer.
J.I. Agboola, I. Kudo / Continental Shelf Research 88 (2014) 140–150 143
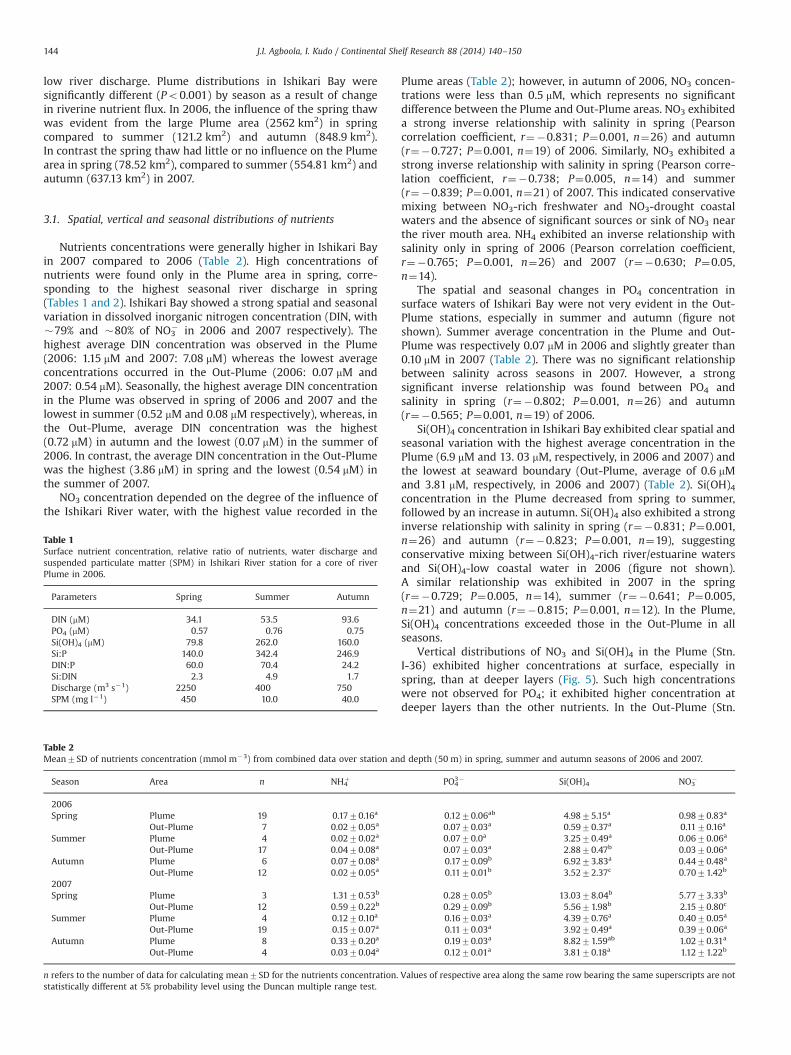
low river discharge. Plume distributions in Ishikari Bay weresignificantly different (Po0.001) by season as a result of changein riverine nutrient flux. In 2006, the influence of the spring thawwas evident from the large Plume area (2562 km2) in springcompared to summer (121.2 km2) and autumn (848.9 km2).In contrast the spring thaw had little or no influence on the Plumearea in spring (78.52 km2), compared to summer (554.81 km2) andautumn (637.13 km2) in 2007.
3.1. Spatial, vertical and seasonal distributions of nutrients
Nutrients concentrations were generally higher in Ishikari Bayin 2007 compared to 2006 (Table 2). High concentrations ofnutrients were found only in the Plume area in spring, corre-sponding to the highest seasonal river discharge in spring(Tables 1 and 2). Ishikari Bay showed a strong spatial and seasonalvariation in dissolved inorganic nitrogen concentration (DIN, with�79% and �80% of NO3
� in 2006 and 2007 respectively). Thehighest average DIN concentration was observed in the Plume(2006: 1.15 mM and 2007: 7.08 mM) whereas the lowest averageconcentrations occurred in the Out-Plume (2006: 0.07 mM and2007: 0.54 mM). Seasonally, the highest average DIN concentrationin the Plume was observed in spring of 2006 and 2007 and thelowest in summer (0.52 mM and 0.08 mM respectively), whereas, inthe Out-Plume, average DIN concentration was the highest(0.72 mM) in autumn and the lowest (0.07 mM) in the summer of2006. In contrast, the average DIN concentration in the Out-Plumewas the highest (3.86 mM) in spring and the lowest (0.54 mM) inthe summer of 2007.
NO3 concentration depended on the degree of the influence ofthe Ishikari River water, with the highest value recorded in the
Plume areas (Table 2); however, in autumn of 2006, NO3 concen-trations were less than 0.5 mM, which represents no significantdifference between the Plume and Out-Plume areas. NO3 exhibiteda strong inverse relationship with salinity in spring (Pearsoncorrelation coefficient, r¼�0.831; P¼0.001, n¼26) and autumn(r¼�0.727; P¼0.001, n¼19) of 2006. Similarly, NO3 exhibited astrong inverse relationship with salinity in spring (Pearson corre-lation coefficient, r¼�0.738; P¼0.005, n¼14) and summer(r¼�0.839; P¼0.001, n¼21) of 2007. This indicated conservativemixing between NO3-rich freshwater and NO3-drought coastalwaters and the absence of significant sources or sink of NO3 nearthe river mouth area. NH4 exhibited an inverse relationship withsalinity only in spring of 2006 (Pearson correlation coefficient,r¼�0.765; P¼0.001, n¼26) and 2007 (r¼�0.630; P¼0.05,n¼14).
The spatial and seasonal changes in PO4 concentration insurface waters of Ishikari Bay were not very evident in the Out-Plume stations, especially in summer and autumn (figure notshown). Summer average concentration in the Plume and Out-Plume was respectively 0.07 mM in 2006 and slightly greater than0.10 mM in 2007 (Table 2). There was no significant relationshipbetween salinity across seasons in 2007. However, a strongsignificant inverse relationship was found between PO4 andsalinity in spring (r¼�0.802; P¼0.001, n¼26) and autumn(r¼�0.565; P¼0.001, n¼19) of 2006.
Si(OH)4 concentration in Ishikari Bay exhibited clear spatial andseasonal variation with the highest average concentration in thePlume (6.9 mM and 13. 03 mM, respectively, in 2006 and 2007) andthe lowest at seaward boundary (Out-Plume, average of 0.6 mMand 3.81 mM, respectively, in 2006 and 2007) (Table 2). Si(OH)4concentration in the Plume decreased from spring to summer,followed by an increase in autumn. Si(OH)4 also exhibited a stronginverse relationship with salinity in spring (r¼�0.831; P¼0.001,n¼26) and autumn (r¼�0.823; P¼0.001, n¼19), suggestingconservative mixing between Si(OH)4-rich river/estuarine watersand Si(OH)4-low coastal water in 2006 (figure not shown).A similar relationship was exhibited in 2007 in the spring(r¼�0.729; P¼0.005, n¼14), summer (r¼�0.641; P¼0.005,n¼21) and autumn (r¼�0.815; P¼0.001, n¼12). In the Plume,Si(OH)4 concentrations exceeded those in the Out-Plume in allseasons.
Vertical distributions of NO3 and Si(OH)4 in the Plume (Stn.I-36) exhibited higher concentrations at surface, especially inspring, than at deeper layers (Fig. 5). Such high concentrationswere not observed for PO4; it exhibited higher concentration atdeeper layers than the other nutrients. In the Out-Plume (Stn.
Table 1Surface nutrient concentration, relative ratio of nutrients, water discharge andsuspended particulate matter (SPM) in Ishikari River station for a core of riverPlume in 2006.
Parameters Spring Summer Autumn
DIN (mM) 34.1 53.5 93.6PO4 (mM) 0.57 0.76 0.75Si(OH)4 (mM) 79.8 262.0 160.0Si:P 140.0 342.4 246.9DIN:P 60.0 70.4 24.2Si:DIN 2.3 4.9 1.7Discharge (m3 s�1) 2250 400 750SPM (mg l�1) 450 10.0 40.0
Table 2Mean7SD of nutrients concentration (mmol m�3) from combined data over station and depth (50 m) in spring, summer and autumn seasons of 2006 and 2007.
Season Area n NH4þ PO4
3� Si(OH)4 NO3�
2006Spring Plume 19 0.1770.16a 0.1270.06ab 4.9875.15a 0.9870.83a
Out-Plume 7 0.0270.05a 0.0770.03a 0.5970.37a 0.1170.16a
Summer Plume 4 0.0270.02a 0.0770.0a 3.2570.49a 0.0670.06a
Out-Plume 17 0.0470.08a 0.0770.03a 2.8870.47b 0.0370.06a
Autumn Plume 6 0.0770.08a 0.1770.09b 6.9273.83a 0.4470.48a
Out-Plume 12 0.0270.05a 0.1170.01b 3.5272.37c 0.7071.42b
2007Spring Plume 3 1.3170.53b 0.2870.05b 13.0378.04b 5.7773.33b
Out-Plume 12 0.5970.22b 0.2970.09b 5.5671.98b 2.1570.80c
Summer Plume 4 0.1270.10a 0.1670.03a 4.3970.76a 0.4070.05a
Out-Plume 19 0.1570.07a 0.1170.03a 3.9270.49a 0.3970.06a
Autumn Plume 8 0.3370.20a 0.1970.03a 8.8271.59ab 1.0270.31a
Out-Plume 4 0.0370.04a 0.1270.01a 3.8170.18a 1.1271.22b
n refers to the number of data for calculating mean7SD for the nutrients concentration. Values of respective area along the same row bearing the same superscripts are notstatistically different at 5% probability level using the Duncan multiple range test.
J.I. Agboola, I. Kudo / Continental Shelf Research 88 (2014) 140–150144
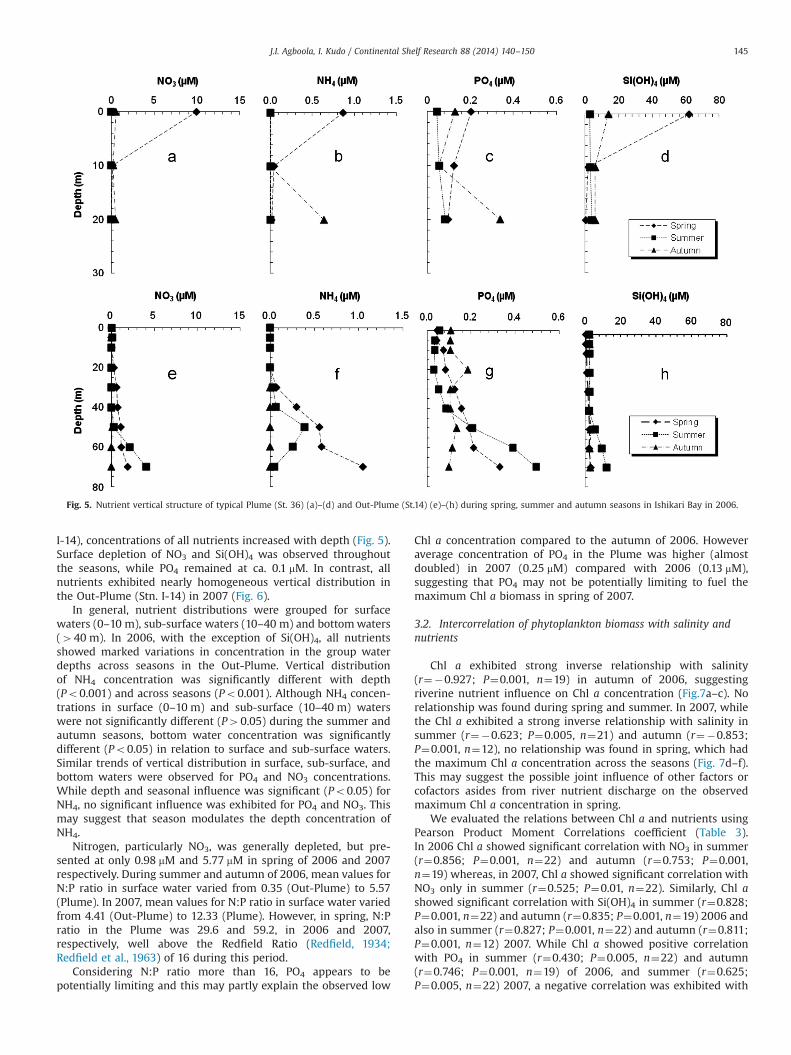
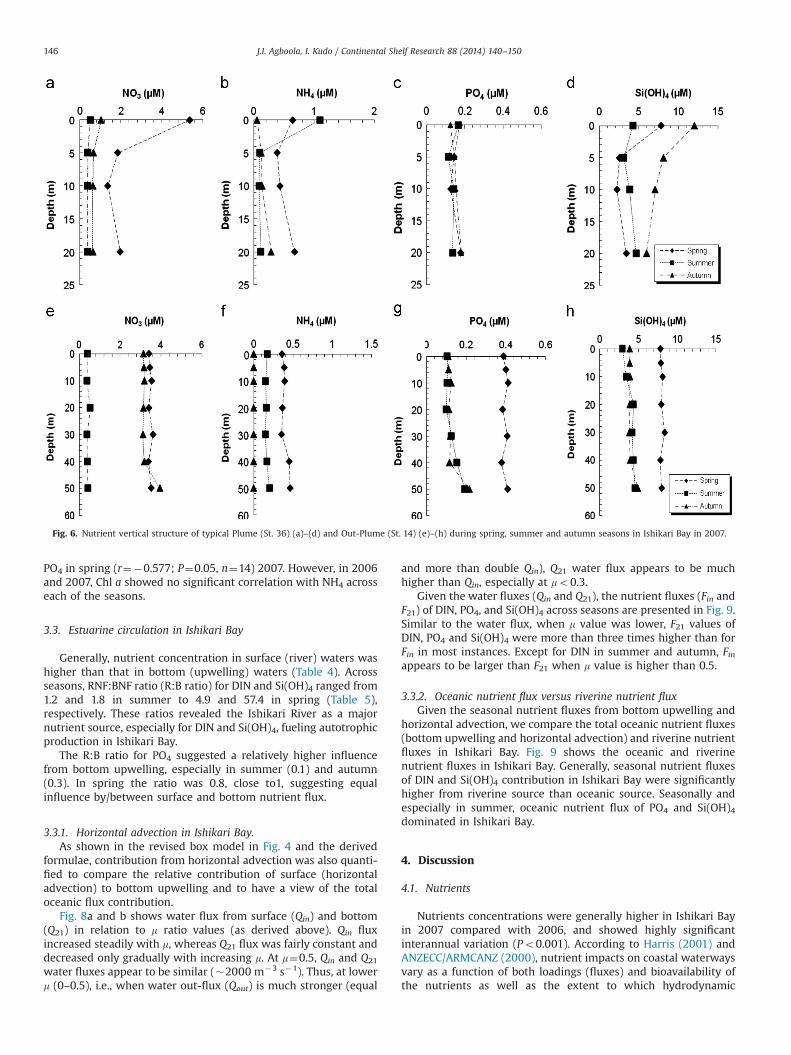
I-14), concentrations of all nutrients increased with depth (Fig. 5).Surface depletion of NO3 and Si(OH)4 was observed throughoutthe seasons, while PO4 remained at ca. 0.1 mM. In contrast, allnutrients exhibited nearly homogeneous vertical distribution inthe Out-Plume (Stn. I-14) in 2007 (Fig. 6).
In general, nutrient distributions were grouped for surfacewaters (0–10 m), sub-surface waters (10–40 m) and bottomwaters(440 m). In 2006, with the exception of Si(OH)4, all nutrientsshowed marked variations in concentration in the group waterdepths across seasons in the Out-Plume. Vertical distributionof NH4 concentration was significantly different with depth(Po0.001) and across seasons (Po0.001). Although NH4 concen-trations in surface (0–10 m) and sub-surface (10–40 m) waterswere not significantly different (P40.05) during the summer andautumn seasons, bottom water concentration was significantlydifferent (Po0.05) in relation to surface and sub-surface waters.Similar trends of vertical distribution in surface, sub-surface, andbottom waters were observed for PO4 and NO3 concentrations.While depth and seasonal influence was significant (Po0.05) forNH4, no significant influence was exhibited for PO4 and NO3. Thismay suggest that season modulates the depth concentration ofNH4.
Nitrogen, particularly NO3, was generally depleted, but pre-sented at only 0.98 mM and 5.77 mM in spring of 2006 and 2007respectively. During summer and autumn of 2006, mean values forN:P ratio in surface water varied from 0.35 (Out-Plume) to 5.57(Plume). In 2007, mean values for N:P ratio in surface water variedfrom 4.41 (Out-Plume) to 12.33 (Plume). However, in spring, N:Pratio in the Plume was 29.6 and 59.2, in 2006 and 2007,respectively, well above the Redfield Ratio (Redfield, 1934;Redfield et al., 1963) of 16 during this period.
Considering N:P ratio more than 16, PO4 appears to bepotentially limiting and this may partly explain the observed low
Chl a concentration compared to the autumn of 2006. Howeveraverage concentration of PO4 in the Plume was higher (almostdoubled) in 2007 (0.25 mM) compared with 2006 (0.13 mM),suggesting that PO4 may not be potentially limiting to fuel themaximum Chl a biomass in spring of 2007.
3.2. Intercorrelation of phytoplankton biomass with salinity andnutrients
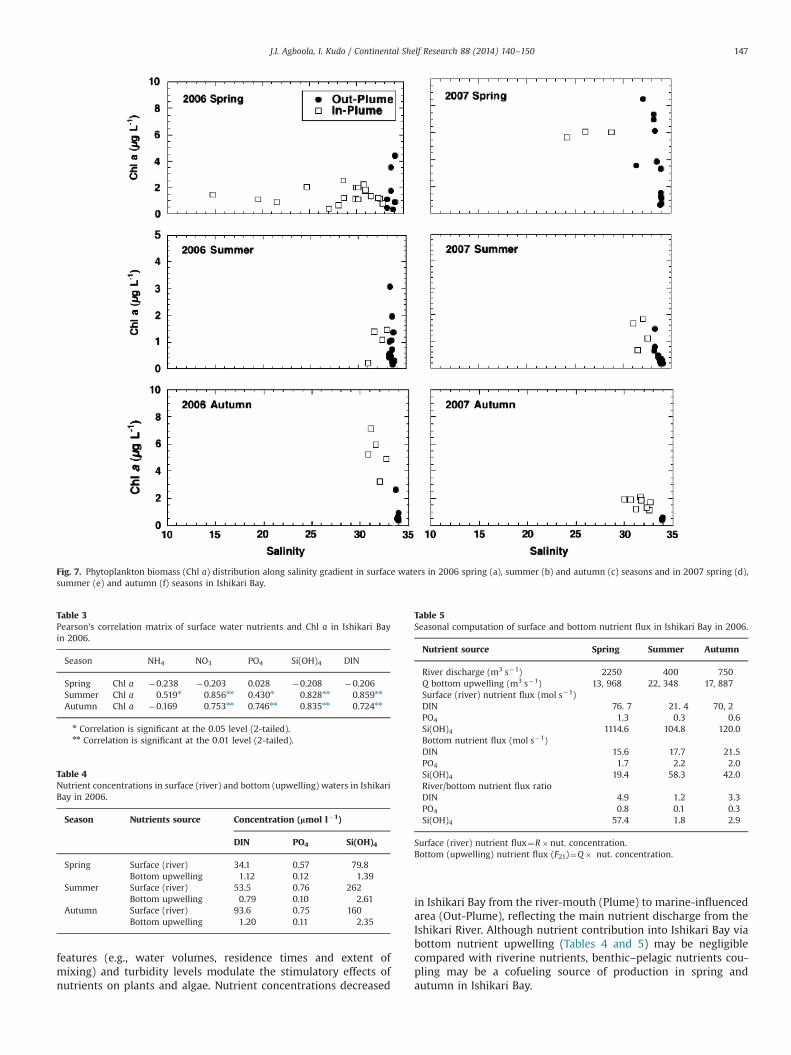
Chl a exhibited strong inverse relationship with salinity(r¼�0.927; P¼0.001, n¼19) in autumn of 2006, suggestingriverine nutrient influence on Chl a concentration (Fig.7a–c). Norelationship was found during spring and summer. In 2007, whilethe Chl a exhibited a strong inverse relationship with salinity insummer (r¼�0.623; P¼0.005, n¼21) and autumn (r¼�0.853;P¼0.001, n¼12), no relationship was found in spring, which hadthe maximum Chl a concentration across the seasons (Fig. 7d–f).This may suggest the possible joint influence of other factors orcofactors asides from river nutrient discharge on the observedmaximum Chl a concentration in spring.
We evaluated the relations between Chl a and nutrients usingPearson Product Moment Correlations coefficient (Table 3).In 2006 Chl a showed significant correlation with NO3 in summer(r¼0.856; P¼0.001, n¼22) and autumn (r¼0.753; P¼0.001,n¼19) whereas, in 2007, Chl a showed significant correlation withNO3 only in summer (r¼0.525; P¼0.01, n¼22). Similarly, Chl ashowed significant correlation with Si(OH)4 in summer (r¼0.828;P¼0.001, n¼22) and autumn (r¼0.835; P¼0.001, n¼19) 2006 andalso in summer (r¼0.827; P¼0.001, n¼22) and autumn (r¼0.811;P¼0.001, n¼12) 2007. While Chl a showed positive correlationwith PO4 in summer (r¼0.430; P¼0.005, n¼22) and autumn(r¼0.746; P¼0.001, n¼19) of 2006, and summer (r¼0.625;P¼0.005, n¼22) 2007, a negative correlation was exhibited with
Fig. 5. Nutrient vertical structure of typical Plume (St. 36) (a)–(d) and Out-Plume (St.14) (e)–(h) during spring, summer and autumn seasons in Ishikari Bay in 2006.
J.I. Agboola, I. Kudo / Continental Shelf Research 88 (2014) 140–150 145
PO4 in spring (r¼�0.577; P¼0.05, n¼14) 2007. However, in 2006and 2007, Chl a showed no significant correlation with NH4 acrosseach of the seasons.
3.3. Estuarine circulation in Ishikari Bay
Generally, nutrient concentration in surface (river) waters washigher than that in bottom (upwelling) waters (Table 4). Acrossseasons, RNF:BNF ratio (R:B ratio) for DIN and Si(OH)4 ranged from1.2 and 1.8 in summer to 4.9 and 57.4 in spring (Table 5),respectively. These ratios revealed the Ishikari River as a majornutrient source, especially for DIN and Si(OH)4, fueling autotrophicproduction in Ishikari Bay.
The R:B ratio for PO4 suggested a relatively higher influencefrom bottom upwelling, especially in summer (0.1) and autumn(0.3). In spring the ratio was 0.8, close to1, suggesting equalinfluence by/between surface and bottom nutrient flux.
3.3.1. Horizontal advection in Ishikari Bay.As shown in the revised box model in Fig. 4 and the derived
formulae, contribution from horizontal advection was also quanti-fied to compare the relative contribution of surface (horizontaladvection) to bottom upwelling and to have a view of the totaloceanic flux contribution.
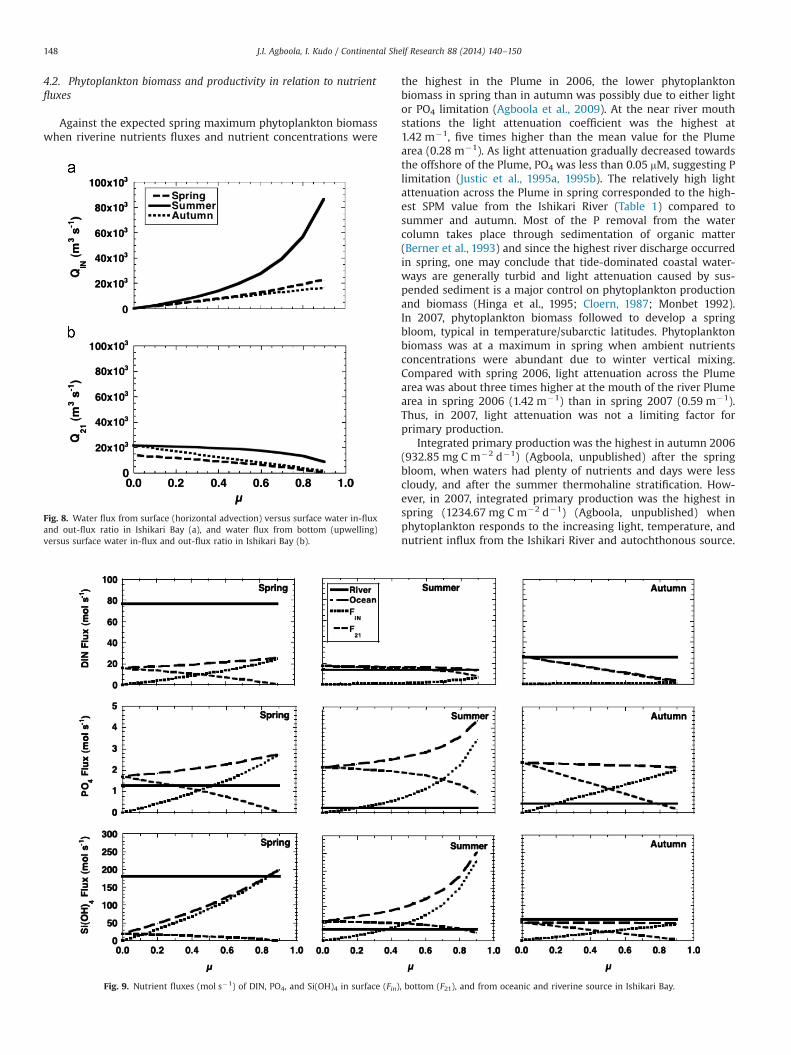
Fig. 8a and b shows water flux from surface (Qin) and bottom(Q21) in relation to m ratio values (as derived above). Qin fluxincreased steadily with m, whereas Q21 flux was fairly constant anddecreased only gradually with increasing m. At m¼0.5, Qin and Q21
water fluxes appear to be similar (�2000 m�3 s�1). Thus, at lowerm (0–0.5), i.e., when water out-flux (Qout) is much stronger (equal
and more than double Qin), Q21 water flux appears to be muchhigher than Qin, especially at mo0.3.
Given the water fluxes (Qin and Q21), the nutrient fluxes (Fin andF21) of DIN, PO4, and Si(OH)4 across seasons are presented in Fig. 9.Similar to the water flux, when m value was lower, F21 values ofDIN, PO4 and Si(OH)4 were more than three times higher than forFin in most instances. Except for DIN in summer and autumn, Finappears to be larger than F21 when m value is higher than 0.5.
3.3.2. Oceanic nutrient flux versus riverine nutrient fluxGiven the seasonal nutrient fluxes from bottom upwelling and
horizontal advection, we compare the total oceanic nutrient fluxes(bottom upwelling and horizontal advection) and riverine nutrientfluxes in Ishikari Bay. Fig. 9 shows the oceanic and riverinenutrient fluxes in Ishikari Bay. Generally, seasonal nutrient fluxesof DIN and Si(OH)4 contribution in Ishikari Bay were significantlyhigher from riverine source than oceanic source. Seasonally andespecially in summer, oceanic nutrient flux of PO4 and Si(OH)4dominated in Ishikari Bay.
4. Discussion
4.1. Nutrients
Nutrients concentrations were generally higher in Ishikari Bayin 2007 compared with 2006, and showed highly significantinterannual variation (Po0.001). According to Harris (2001) andANZECC/ARMCANZ (2000), nutrient impacts on coastal waterwaysvary as a function of both loadings (fluxes) and bioavailability ofthe nutrients as well as the extent to which hydrodynamic
Fig. 6. Nutrient vertical structure of typical Plume (St. 36) (a)–(d) and Out-Plume (St. 14) (e)–(h) during spring, summer and autumn seasons in Ishikari Bay in 2007.
J.I. Agboola, I. Kudo / Continental Shelf Research 88 (2014) 140–150146
features (e.g., water volumes, residence times and extent ofmixing) and turbidity levels modulate the stimulatory effects ofnutrients on plants and algae. Nutrient concentrations decreased
in Ishikari Bay from the river-mouth (Plume) to marine-influencedarea (Out-Plume), reflecting the main nutrient discharge from theIshikari River. Although nutrient contribution into Ishikari Bay viabottom nutrient upwelling (Tables 4 and 5) may be negligiblecompared with riverine nutrients, benthic–pelagic nutrients cou-pling may be a cofueling source of production in spring andautumn in Ishikari Bay.
Fig. 7. Phytoplankton biomass (Chl a) distribution along salinity gradient in surface waters in 2006 spring (a), summer (b) and autumn (c) seasons and in 2007 spring (d),summer (e) and autumn (f) seasons in Ishikari Bay.
Table 3Pearson's correlation matrix of surface water nutrients and Chl a in Ishikari Bayin 2006.
Season NH4 NO3 PO4 Si(OH)4 DIN
Spring Chl a �0.238 �0.203 0.028 �0.208 �0.206Summer Chl a 0.519n 0.856nn 0.430n 0.828nn 0.859nn
Autumn Chl a �0.169 0.753nn 0.746nn 0.835nn 0.724nn
n Correlation is significant at the 0.05 level (2-tailed).nn Correlation is significant at the 0.01 level (2-tailed).
Table 4Nutrient concentrations in surface (river) and bottom (upwelling) waters in IshikariBay in 2006.
Season Nutrients source Concentration (lmol l�1)
DIN PO4 Si(OH)4
Spring Surface (river) 34.1 0.57 79.8Bottom upwelling 1.12 0.12 1.39
Summer Surface (river) 53.5 0.76 262Bottom upwelling 0.79 0.10 2.61
Autumn Surface (river) 93.6 0.75 160Bottom upwelling 1.20 0.11 2.35
Table 5Seasonal computation of surface and bottom nutrient flux in Ishikari Bay in 2006.
Nutrient source Spring Summer Autumn
River discharge (m3 s�1) 2250 400 750Q bottom upwelling (m3 s�1) 13, 968 22, 348 17, 887Surface (river) nutrient flux (mol s�1)DIN 76. 7 21. 4 70, 2PO4 1.3 0.3 0.6Si(OH)4 1114.6 104.8 120.0Bottom nutrient flux (mol s�1)DIN 15.6 17.7 21.5PO4 1.7 2.2 2.0Si(OH)4 19.4 58.3 42.0River/bottom nutrient flux ratioDIN 4.9 1.2 3.3PO4 0.8 0.1 0.3Si(OH)4 57.4 1.8 2.9
Surface (river) nutrient flux¼R�nut. concentration.Bottom (upwelling) nutrient flux (F21)¼Q� nut. concentration.
J.I. Agboola, I. Kudo / Continental Shelf Research 88 (2014) 140–150 147
4.2. Phytoplankton biomass and productivity in relation to nutrientfluxes
Against the expected spring maximum phytoplankton biomasswhen riverine nutrients fluxes and nutrient concentrations were
the highest in the Plume in 2006, the lower phytoplanktonbiomass in spring than in autumn was possibly due to either lightor PO4 limitation (Agboola et al., 2009). At the near river mouthstations the light attenuation coefficient was the highest at1.42 m�1, five times higher than the mean value for the Plumearea (0.28 m�1). As light attenuation gradually decreased towardsthe offshore of the Plume, PO4 was less than 0.05 mM, suggesting Plimitation (Justic et al., 1995a, 1995b). The relatively high lightattenuation across the Plume in spring corresponded to the high-est SPM value from the Ishikari River (Table 1) compared tosummer and autumn. Most of the P removal from the watercolumn takes place through sedimentation of organic matter(Berner et al., 1993) and since the highest river discharge occurredin spring, one may conclude that tide-dominated coastal water-ways are generally turbid and light attenuation caused by sus-pended sediment is a major control on phytoplankton productionand biomass (Hinga et al., 1995; Cloern, 1987; Monbet 1992).In 2007, phytoplankton biomass followed to develop a springbloom, typical in temperature/subarctic latitudes. Phytoplanktonbiomass was at a maximum in spring when ambient nutrientsconcentrations were abundant due to winter vertical mixing.Compared with spring 2006, light attenuation across the Plumearea was about three times higher at the mouth of the river Plumearea in spring 2006 (1.42 m�1) than in spring 2007 (0.59 m�1).Thus, in 2007, light attenuation was not a limiting factor forprimary production.
Integrated primary production was the highest in autumn 2006(932.85 mg C m�2 d�1) (Agboola, unpublished) after the springbloom, when waters had plenty of nutrients and days were lesscloudy, and after the summer thermohaline stratification. How-ever, in 2007, integrated primary production was the highest inspring (1234.67 mg C m�2 d�1) (Agboola, unpublished) whenphytoplankton responds to the increasing light, temperature, andnutrient influx from the Ishikari River and autochthonous source.
Fig. 8. Water flux from surface (horizontal advection) versus surface water in-fluxand out-flux ratio in Ishikari Bay (a), and water flux from bottom (upwelling)versus surface water in-flux and out-flux ratio in Ishikari Bay (b).
Fig. 9. Nutrient fluxes (mol s�1) of DIN, PO4, and Si(OH)4 in surface (Fin), bottom (F21), and from oceanic and riverine source in Ishikari Bay.
J.I. Agboola, I. Kudo / Continental Shelf Research 88 (2014) 140–150148
According to Henríquez et al. (2007), the primary factors that affectthe abundance and distribution of Chl a and primary production levelsin the coastal zone are the physical forces that transport not onlyphytoplankton but also nutrients to the euphotic zone (i.e. upwellingfronts). Short residence time of nutrients in the river Plume area mayhave impacted on the low phytoplankton biomass and productivityobserved in spring of 2006. Unlike 2006, primary productivity inspring of 2007 was neither limited by light nor P as light attenuationacross the Plume area was relatively lower and ambient nutrientswere in excess of apparent utilization.
4.3. Relative fluxes of nutrients in relation to river discharge versusestuarine circulation
On the assumption that bottom nutrient upwelling may be animportant source of nutrient fueling primary production in Ishi-kari Bay, bottom nutrient flux was quantified. The computation ofbottom nutrient flux (see Eq. (7) and Table 5) through estuarinecirculation in Ishikari Bay has finally confirmed our assumptionthat bottom nutrient flux (especially PO4) significantly fuelsautotrophic production in Ishikari Bay. Unlike the usual estuarinesystem, in which nutrient concentration at deeper layer is highdue to the regeneration of nutrients at depth, concentration inIshikari Bay is very low due to an influence of oligotrophic (lowproductivity) water. In the estuarine system where the nutrientprofile is typical (i.e., it gradually increases with depth), nutrientflux from upwelling should contribute greater to the surfaceprimary production than in Ishikari Bay. This is one of the reasonswhy riverine flux contributes a large portion of the total flux inIshikari Bay.
Flux ratios of river nutrient (RNF) and bottom nutrient (BNF)(i.e. R:B ratio) across the examined seasons were significantly41.0 for DIN and Si (OH)4 nutrients, especially in spring andautumn. In summer, ratios were close to 1 for DIN (1.2) and Si(OH)4 (1.8) due to lower river discharge compared to spring andautumn (Table 1). The R:B ratio suggested a significant contribu-tion of PO4 supply from bottom upwelling, especially in summerand autumn when values were 0.1 and 0.3, respectively. In spring,when the ratio was close to 1 (0.8), coupling of bottom (upwelling)and surface (river) occurred since PO4 concentration of river end-member was the lowest and SPM concentration highest acrossseason. Most of the P removal from the water column takes placethrough sedimentation of organic matter (Berner et al., 1993), thusreducing the contribution from surface (river).
The results obtained from this study clearly suggested that therelative contribution of nutrient flux through horizontal advectioninto Ishikari Bay depended upon m value, the ratio of Qin to Qout. Theincrease in m implied the increase in relative contribution ofhorizontal advection to the total discharge from Box 1. The degreeof the increase in the nutrient flux differed by DIN, PO4 and Si(OH)4and season. Across the seasons, when m value increased, there was acorresponding increase in horizontal nutrient flux (Fin). Also it seemsthat Si(OH)4 horizontal nutrient fluxes (Fin) are more important inspring and summer at m40.5 whereas, for PO4, horizontal nutrientflux contribution is important across seasons. However, it wasimpossible to determine m by solving Eq. (13)–(16).
A comparison of total oceanic nutrient fluxes (bottom upwel-ling and horizontal advection) to riverine nutrient fluxes sug-gested that the Ishikari River is a major source of DIN and Si(OH)4supply in the bay, whereas oceanic nutrient contribution frombottom upwelling and horizontal advection is a major source ofPO4. While the influence of riverine nutrient fluxes significantlyfuels autotrophic production in the Ishikari Bay, information onthe importance of estuarine circulation in buffering the supply ofPO4 that is not adequate in riverine nutrient is a significant insightin this study.
The ratios of river nutrient flux (RNF) and bottom (upwelling)nutrient (BNF) were significantly greater than 1.0 for DIN and Si(OH)4, confirming our hypothesis that river nutrient significantlyfueled autotrophic production in Ishikari Bay oligotrophic waters.However the ratios for PO4 were significantly less than 1.0,especially in summer and autumn, suggesting possible bottomupwelling as a driver. Furthermore, in spring when the ratio wasclose to 1 (0.8), coupling between bottom and river nutrient ishypothesized since river end-member concentration was thelowest for PO4 and the highest for SPM compared to other seasons.
5. Conclusion
Oceanographically Ishikari Bay could be considered as a transi-tional marine system influenced by oceanic (high salinity and lownutrients) and fresh waters (low salinity and high nutrients),modulating phytoplankton biomass and primary productiondynamics on a seasonal scale.
Generally, water mixing, biological consumption, and possiblevertical convection were the three major factors controlling thenutrient distribution across the seasons: water mixing explains thegradual decrease of nutrient content offshore, biological consump-tion leads to noticeable removal of nutrients across the Plumewater, and possible vertical convection carries nutrients upwardsfrom bottom to the surface waters.
This study discussed the Ishikari River as a main source ofnutrients fueling primary production in the Ishikari Bay. For example,a strong inverse relationship (r¼�0.927) between Chl a and salinityin autumn 2006 suggests that DIN from the Ishikari River producedthe primary production maxima in autumn. In this season, anincrease in the apparent utilization of DIN gave a correspondingincrease in phytoplankton production. Also, the relatively high lightattenuation across the Plume area in spring corresponded with thehighest SPM value from the Ishikari River (Table 1). When riverinenutrients and nutrients fluxes were the highest in the Plume, thelower phytoplankton biomass of spring than autumn was possiblydue to light and PO4 limitation (Agboola et al., 2009).
In 2007 nutrient concentrations in spring and autumn were inexcess of apparent utilization of DIN and PO4, corresponding to theobserved maximum primary production in spring.
This study successfully underscored the relative importance ofriverine nutrient discharge against estuarine circulation in fuelingautotrophic biomass and production in the Ishikari Bay. Also, fromthe results obtained, flux ratios of river nutrient (RNF) and bottomnutrient (BNF) (i.e. RNF:BNF) across the examined seasons weresignificantly 41.0 for DIN and Si (OH)4 nutrients, especially inspring and autumn. Nutrient flux ratio only suggests the signifi-cant contribution of PO4 nutrient from bottom upwelling, espe-cially in summer and autumn. Thus, unlike other estuaries, therelative importance of estuarine circulation in fueling autotrophicproduction is relatively minimal in the Ishikari Bay.
Acknowledgments
We thank the Captain and crews of TS Ushio-Maru and Oshoro-Maru, and colleagues at the laboratory for their assistance insampling during the cruises.
References
Agboola, J.I., Uchimiya, M., Kudo, I., Kido, K., Osawa, M., 2013. Seasonality andenvironmental drivers of biological productivity on the western Hokkaidocoast, Ishikari Bay, Japan. Estuar. Coast. Shelf S. 127, 12–23. http://dx.doi.org/10.1016/j.ecss.2013.03.008.
J.I. Agboola, I. Kudo / Continental Shelf Research 88 (2014) 140–150 149
Agboola, J.I., Uchimiya, M., Kudo, I., Kido, K., Osawa, M., 2010. Dynamics of pelagicvariables in two contrasting coastal systems in the western Hokkaido coast offOtaru port, Japan. Estuar. Coast. Shelf S. 86 (3), 477–484.
Agboola, J.I., Yoshi, S., Kudo, I., 2009. Seasonal change of riverine nutrients anddistribution of chlorophyll a in Ishikari Bay, subarctic oligotrophic coastalenvironment of Japan. Jpn.—Fr. Oceanogr. Soc. J., La Mer 47, 33–49.
ANZECC/ARMCANZ, 2000. Australian and New Zealand Guidelines for Fresh andMarine Water Quality. ⟨www.ea.gov.au/water/quality/nwqms/#quality⟩.
Barber, R.T., Marra, J., Bidigare, R.C., Codispoti, L.A., Halpern, D., Johnson, Z., Latasa, M.,Goericke, R., Smith, S.L., 2001. Primary productivity and its regulation in the ArabiaSea during 1995. Deep-Sea Res. II 48, 1127–1172.
Berner, R.A., Ruttenberg, K.C., Ingall, E.D., Rao, J.L., 1993. The nature of phosphorusburial in modern marine sediments. In: Wollast, R., Mackenzie, F.T., Chou, L.(Eds.), Interactions of C, N, P and S Biogeochemical Cycles and Global Change,(Eds.) Springer-Verlag, New York, pp. 365–378.
Brzezinski, M.A., 1985. The Si: C: N ratio of marine diatoms: interspecific variabilityand the effect of some environmental variables. J. Phycol. 21, 347–357.
Cloern, J.E., 1987. Turbidity as a control on phytoplankton biomass and productivityin estuaries. Cont. Shelf Res. 7, 1367–1381.
Dodimead, A.J., Favorite, A.E., Hirano, T., 1963. Salmon of the North Pacific Ocean,Part II: Review of Oceanography of the Subarctic Pacific Region. Bulletin of theInternational North Pacific Fisheries Commission, No. 13, 195 pp.
Dodimead, A.J., 1967. Autumn Oceanographic onditions in the Central SubarcticPacific. International North Pacific Commission Document 999, pp. 1–14.
Harris, G.P., 2001. Biogeochemistry of nitrogen and phosphorous in Australiancatchments, rivers and estuaries: effects of land use and flow regulation andcomparisons with global patterns. Mar. Freshw. Res. 52, 139–149.
Henríquez, L.A., Daneri, G., Mũnoz, C.A., Montero, P., Veas, R., Palma, A.T., 2007.Primary production and phytoplanktonic biomass in shallow marine
environments of central Chile: effect of coastal geomorphology. Estuar. Coast.Shelf Sci. 73, 137–147.
Justic, D., Rabalais, N.N., Turner, R.E., 1995a. Stoichiometric nutrient balance andorigin of coastal eutrophication. Mar. Poll. Bull. 30, 41–46.
Justic, D., Rabalais, N.N., Turner, R.E., Dortch, Q., 1995b. Changes in nutrientstructure of river-dominated coastal waters, stoichiometric nutrient balanceand its consequences. Estuar. Coast. Shelf Sci. 40, 339–356.
Kristiansen, S., Hoell, E.E., 2002. The importance of silicon for marine production.Hydrobiologia 484, 21–31.
Kudo, I., Noiri, Y., Imai, K., Nojiri, Y., Nishioka, J., Tsuda, T., 2005. Primaryproductivity and nitrogenous nutrient assimilation dynamics during the Sub-arctic Pacific Iron Experiment for Ecosystem Dynamics Study. Prog. Oceanogr.64, 207–221.
Parsons, T.R., Maita, Y., Lalli, C.M., 1984. A Manual of Chemical and BiologicalMethods for Seawater Analysis. Pergamon Press, New York.
Redfield, A.C., 1934. On the proportions of organic derivatives in sea water and theirrelation to the composition of plankton. In: Daniel, R.J. (Ed.), James JohnstoneMemorial Volume. University of Liverpool Press, Liverpool, UK, pp. 176–192.
Redfield, A.C., Ketchum, B.H., Richards, F., 1963. The influence of organisms on thecomposition of seawater. In: Hill, M.N. (Ed.), The Sea, vol. 2. John Wiley, NewYork, pp. 26–77.
Unoki, S., 1998. Relation between the transport of gravitational circulation and theriver discharge in bays (In Japanese with English abstract). Umi no Kenkyu 7,283–292.
Yoshida, K., Domon, K., Watanabe, T., 1977. Physical and chemical environment inIshikari Bay (in Japanese with English abstract). Sci. Rep. Hokkaido Fish. Exp.Stn. 34, 1–6.
J.I. Agboola, I. Kudo / Continental Shelf Research 88 (2014) 140–150150