Carbon Stocks and Fluxes in Rangelands of the Río de la Plata Basin
16
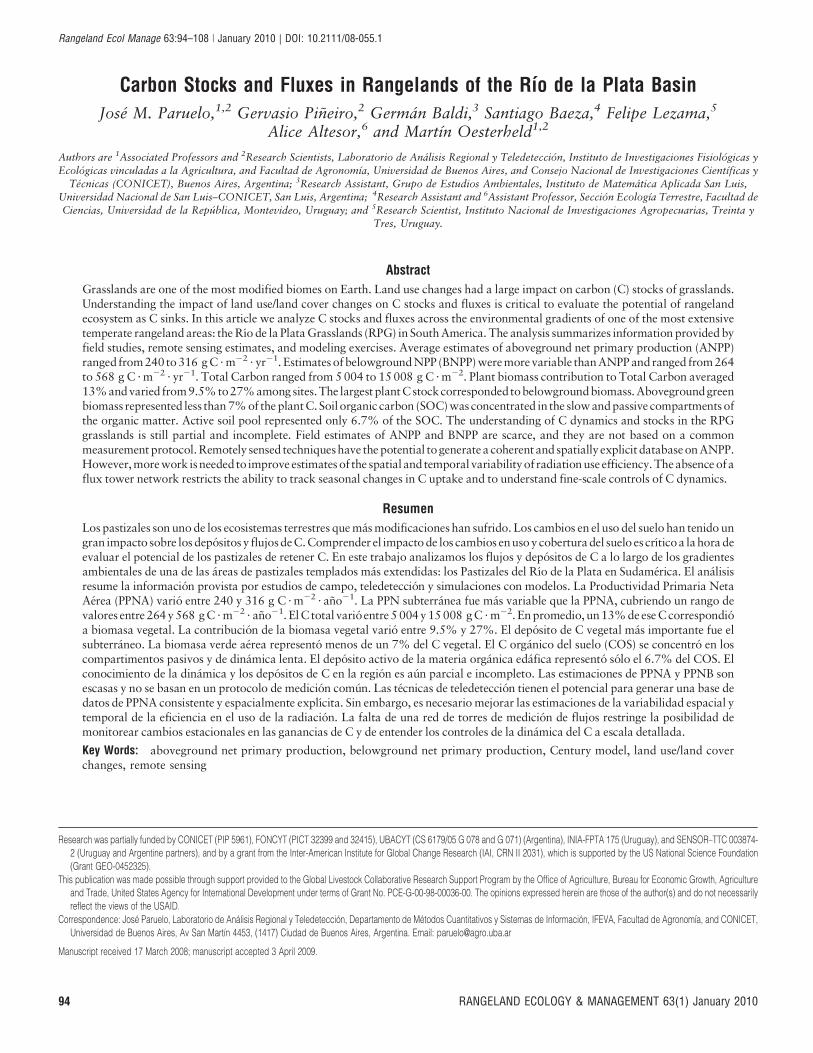
BioOne sees sustainable scholarly publishing as an inherently collaborative enterprise connecting authors, nonprofit publishers, academic institutions, research libraries, and research funders in the common goal of maximizing access to critical research. Carbon Stocks and Fluxes in Rangelands of the Río de la Plata Basin Author(s): José M. Paruelo, Gervasio Piñeiro, Germán Baldi, Santiago Baeza, Felipe Lezama, Alice Altesor, and Martín Oesterheld Source: Rangeland Ecology & Management, 63(1):94-108. 2010. Published By: Society for Range Management DOI: http://dx.doi.org/10.2111/08-055.1 URL: http://www.bioone.org/doi/full/10.2111/08-055.1 BioOne (www.bioone.org ) is a nonprofit, online aggregation of core research in the biological, ecological, and environmental sciences. BioOne provides a sustainable online platform for over 170 journals and books published by nonprofit societies, associations, museums, institutions, and presses. Your use of this PDF, the BioOne Web site, and all posted and associated content indicates your acceptance of BioOne’s Terms of Use, available at www.bioone.org/page/terms_of_use . Usage of BioOne content is strictly limited to personal, educational, and non-commercial use. Commercial inquiries or rights and permissions requests should be directed to the individual publisher as copyright holder.
Transcript of Carbon Stocks and Fluxes in Rangelands of the Río de la Plata Basin
BioOne sees sustainable scholarly publishing as an inherently collaborative enterprise connecting authors, nonprofit publishers, academic institutions, researchlibraries, and research funders in the common goal of maximizing access to critical research.
Carbon Stocks and Fluxes in Rangelands of the Río de la Plata BasinAuthor(s): José M. Paruelo, Gervasio Piñeiro, Germán Baldi, Santiago Baeza, Felipe Lezama, AliceAltesor, and Martín OesterheldSource: Rangeland Ecology & Management, 63(1):94-108. 2010.Published By: Society for Range ManagementDOI: http://dx.doi.org/10.2111/08-055.1URL: http://www.bioone.org/doi/full/10.2111/08-055.1
BioOne (www.bioone.org) is a nonprofit, online aggregation of core research in the biological, ecological, andenvironmental sciences. BioOne provides a sustainable online platform for over 170 journals and books publishedby nonprofit societies, associations, museums, institutions, and presses.
Your use of this PDF, the BioOne Web site, and all posted and associated content indicates your acceptance ofBioOne’s Terms of Use, available at www.bioone.org/page/terms_of_use.
Usage of BioOne content is strictly limited to personal, educational, and non-commercial use. Commercial inquiriesor rights and permissions requests should be directed to the individual publisher as copyright holder.
Carbon Stocks and Fluxes in Rangelands of the Rıo de la Plata BasinJose M. Paruelo,1,2 Gervasio Pineiro,2 German Baldi,3 Santiago Baeza,4 Felipe Lezama,5
Alice Altesor,6 and Martın Oesterheld1,2
Authors are 1Associated Professors and 2Research Scientists, Laboratorio de Analisis Regional y Teledeteccion, Instituto de Investigaciones Fisiologicas yEcologicas vinculadas a la Agricultura, and Facultad de Agronomıa, Universidad de Buenos Aires, and Consejo Nacional de Investigaciones Cientıficas y
Tecnicas (CONICET), Buenos Aires, Argentina; 3Research Assistant, Grupo de Estudios Ambientales, Instituto de Matematica Aplicada San Luis,Universidad Nacional de San Luis–CONICET, San Luis, Argentina; 4Research Assistant and 6Assistant Professor, Seccion Ecologıa Terrestre, Facultad deCiencias, Universidad de la Republica, Montevideo, Uruguay; and 5Research Scientist, Instituto Nacional de Investigaciones Agropecuarias, Treinta y
Tres, Uruguay.
Abstract
Grasslands are one of the most modified biomes on Earth. Land use changes had a large impact on carbon (C) stocks of grasslands.Understanding the impact of land use/land cover changes on C stocks and fluxes is critical to evaluate the potential of rangelandecosystem as C sinks. In this article we analyze C stocks and fluxes across the environmental gradients of one of the most extensivetemperate rangeland areas: the Rıo de la Plata Grasslands (RPG) in South America. The analysis summarizes information provided byfield studies, remote sensing estimates, and modeling exercises. Average estimates of aboveground net primary production (ANPP)ranged from240 to316 g C ? m22 ? yr21. Estimates ofbelowground NPP (BNPP) weremorevariable thanANPP and ranged from264to 568 g C ? m22 ? yr21. Total Carbon ranged from 5 004 to 15 008 g C ? m22. Plant biomass contribution to Total Carbon averaged13%andvaried from9.5%to27%amongsites.The largestplantCstockcorrespondedtobelowgroundbiomass.Abovegroundgreenbiomass represented less than 7% of the plantC.Soil organic carbon (SOC) was concentrated in the slowandpassive compartments ofthe organic matter. Active soil pool represented only 6.7% of the SOC. The understanding of C dynamics and stocks in the RPGgrasslands is still partial and incomplete. Field estimates of ANPP and BNPP are scarce, and they are not based on a commonmeasurement protocol.Remotely sensed techniqueshave the potential togeneratea coherent and spatially explicit databaseon ANPP.However,morework isneeded to improve estimatesof the spatial and temporal variabilityof radiation use efficiency. Theabsence ofaflux tower network restricts the ability to track seasonal changes in C uptake and to understand fine-scale controls of C dynamics.
Resumen
Los pastizales son uno de los ecosistemas terrestres que mas modificaciones han sufrido. Los cambios en el uso del suelo han tenido ungran impacto sobre losdepositos y flujosdeC.Comprender el impacto de los cambios enuso y coberturadel suelo es crıticoa lahora deevaluar el potencial de los pastizales de retener C. En este trabajo analizamos los flujos y depositos de C a lo largo de los gradientesambientales de una de las areas de pastizales templados mas extendidas: los Pastizales del Rıo de la Plata en Sudamerica. El analisisresume la informacion provista por estudios de campo, teledeteccion y simulaciones con modelos. La Productividad Primaria NetaAerea (PPNA) vario entre 240 y 316 g C ? m22 ? ano21. La PPN subterranea fue mas variable que la PPNA, cubriendo un rango devalores entre 264 y 568 gC ? m22 ? ano21. El C total vario entre 5 004y 15 008 gC ? m22. En promedio, un13%deese C correspondioa biomasa vegetal. La contribucion de la biomasa vegetal vario entre 9.5% y 27%. El deposito de C vegetal mas importante fue elsubterraneo. La biomasa verde aerea represento menos de un 7% del C vegetal. El C organico del suelo (COS) se concentro en loscompartimentos pasivos y de dinamica lenta. El deposito activo de la materia organica edafica represento solo el 6.7% del COS. Elconocimiento de la dinamica y los depositos de C en la region es aun parcial e incompleto. Las estimaciones de PPNA y PPNB sonescasas y no se basan en un protocolo de medicion comun. Las tecnicas de teledeteccion tienen el potencial para generar una base dedatos de PPNA consistente y espacialmente explıcita. Sin embargo, es necesario mejorar las estimaciones de la variabilidad espacial ytemporal de la eficiencia en el uso de la radiacion. La falta de una red de torres de medicion de flujos restringe la posibilidad demonitorear cambios estacionales en las ganancias de C y de entender los controles de la dinamica del C a escala detallada.
Key Words: aboveground net primary production, belowground net primary production, Century model, land use/land coverchanges, remote sensing
Research was partially funded by CONICET (PIP 5961), FONCYT (PICT 32399 and 32415), UBACYT (CS 6179/05 G 078 and G 071) (Argentina), INIA-FPTA 175 (Uruguay), and SENSOR–TTC 003874-
2 (Uruguay and Argentine partners), and by a grant from the Inter-American Institute for Global Change Research (IAI, CRN II 2031), which is supported by the US National Science Foundation
(Grant GEO-0452325).
This publication was made possible through support provided to the Global Livestock Collaborative Research Support Program by the Office of Agriculture, Bureau for Economic Growth, Agriculture
and Trade, United States Agency for International Development under terms of Grant No. PCE-G-00-98-00036-00. The opinions expressed herein are those of the author(s) and do not necessarily
reflect the views of the USAID.
Manuscript received 17 March 2008; manuscript accepted 3 April 2009.
Correspondence: Jose Paruelo, Laboratorio de Analisis Regional y Teledeteccion, Departamento de Metodos Cuantitativos y Sistemas de Informacion, IFEVA, Facultad de Agronomıa, and CONICET,
Universidad de Buenos Aires, Av San Martın 4453, (1417) Ciudad de Buenos Aires, Argentina. Email: [email protected]
Rangeland Ecol Manage 63:94–108 | January 2010 | DOI: 10.2111/08-055.1
94 RANGELAND ECOLOGY & MANAGEMENT 63(1) January 2010
INTRODUCTION
The broad range of environmental conditions where grasslandscan be found determines important spatial differences inecosystem structure and functioning. Differences in structureare mainly associated with changes in the relative abundance ofplant functional types, particularly the proportion of C3 and C4
grasses (Paruelo and Lauenroth 1996) or changes in the size ofcarbon (C) and nitrogen (N) pools (Burke et al. 1989).Functional differences derive from different patterns ofexchange of matter and energy between the biota and theatmosphere. Carbon dynamics is an integrative descriptor ofecosystem functioning, the main determinant of the energyavailable for the trophic web, and a major control of theirutilization by humans.
Grasslands are one of the most modified biomes on Earth,because a large portion of them has been replaced by crop fieldsor is subject to livestock grazing (Hannah et al. 1995). Land usechanges include the replacement of the original cover by annualor perennial crops and the intensification of biomass removalby domestic herbivores (Meyer and Turner 1994). Bothchanges had a large impact on C stocks (Burke et al. 1989;Milchunas and Lauenroth 1993; Alvarez et al. 1998; Alvarez2001; Pineiro et al. 2006b, 2009) and C gains (Oesterheld et al.1999; Paruelo et al. 2000; Guerschman and Paruelo 2005).Understanding the impact of land use and land cover changeson C stocks and fluxes is critical to evaluate the potential ofrangeland ecosystem as C sinks (Lal 2004).
Soil organic carbon (SOC) and net primary production (NPP)are two key attributes of the grassland C cycle and energy flux.NPP is a major determinant of SOC, and, conversely, SOC maydetermine NPP both in the mid- and the long term through itslink with nutrient pools. The recalcitrant forms of Ccompounds in grasslands soils are an effective way for Csequestration (Lal 2004). Resource allocation between above-and belowground organs and the vertical distribution ofbelowground biomass are the main determinants of SOCdistribution in the profile (Jobbagy and Jackson 2000).
A better understanding of the spatial patterns and environ-mental controls of C stocks and fluxes in South Americangrasslands would not only improve our regional understandingof C dynamics but also explore the behavior of C fluxes underenvironmental conditions not present in Northern Hemispheregrasslands. Paruelo et al. (1998) found that for some ecosystemattributes (plant functional traits, relative abundance, NPP,SOC stocks, carbon gain dynamics) the environmental controlswere similar in biogeographically unrelated areas of North andSouth America. The study suggested the existence of animportant degree of convergence at regional scales in bothfunctional and structural attributes. It also pointed outdifferences and biases in the regional patterns of someattributes that require further analyses. For example, SouthAmerican grasslands differ from North American ones in someclimatic features (e.g., thermal amplitude; Paruelo et al. 1995;Lauenroth et al. 2004) and in the evolutionary history ofgrazing (Milchunas et al. 1988). A description of ecosystemprocesses in a broader range of environmental conditionsbecomes particularly important in a context of global changesbecause it provides a basis on which to forecast theconsequences of environmental change.
In this article we analyze patterns of C fluxes and stocksalong the environmental gradients of one of the most extensivetemperate rangeland areas: the Rıo de la Plata Grasslands(RPG) in South America. We characterized C fluxes (particu-larly net primary production) and C stocks across environmen-tal gradients using a combination of field studies, modeling(Century), databases, and remote sensing approaches. We alsoanalyzed the environmental controls of C stocks and gains andthe impact of disturbance on them. Our analysis summarizespublished data and generates new estimates for some processesover the entire region to elaborate a regional C balance. Suchbalance provides a reference situation to evaluate the extentand quality of our regional knowledge on C dynamics and theimpact of management practices on it.
MATERIALS AND METHODS
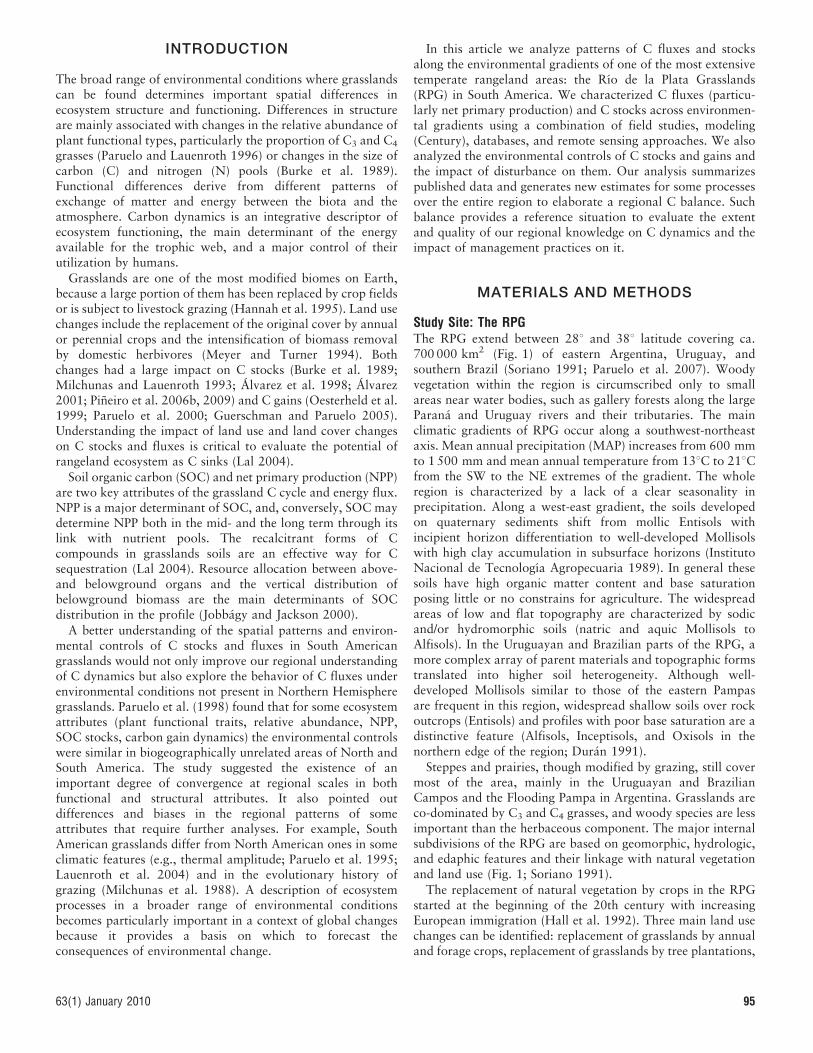
Study Site: The RPGThe RPG extend between 28u and 38u latitude covering ca.700 000 km2 (Fig. 1) of eastern Argentina, Uruguay, andsouthern Brazil (Soriano 1991; Paruelo et al. 2007). Woodyvegetation within the region is circumscribed only to smallareas near water bodies, such as gallery forests along the largeParana and Uruguay rivers and their tributaries. The mainclimatic gradients of RPG occur along a southwest-northeastaxis. Mean annual precipitation (MAP) increases from 600 mmto 1 500 mm and mean annual temperature from 13uC to 21uCfrom the SW to the NE extremes of the gradient. The wholeregion is characterized by a lack of a clear seasonality inprecipitation. Along a west-east gradient, the soils developedon quaternary sediments shift from mollic Entisols withincipient horizon differentiation to well-developed Mollisolswith high clay accumulation in subsurface horizons (InstitutoNacional de Tecnologıa Agropecuaria 1989). In general thesesoils have high organic matter content and base saturationposing little or no constrains for agriculture. The widespreadareas of low and flat topography are characterized by sodicand/or hydromorphic soils (natric and aquic Mollisols toAlfisols). In the Uruguayan and Brazilian parts of the RPG, amore complex array of parent materials and topographic formstranslated into higher soil heterogeneity. Although well-developed Mollisols similar to those of the eastern Pampasare frequent in this region, widespread shallow soils over rockoutcrops (Entisols) and profiles with poor base saturation are adistinctive feature (Alfisols, Inceptisols, and Oxisols in thenorthern edge of the region; Duran 1991).
Steppes and prairies, though modified by grazing, still covermost of the area, mainly in the Uruguayan and BrazilianCampos and the Flooding Pampa in Argentina. Grasslands areco-dominated by C3 and C4 grasses, and woody species are lessimportant than the herbaceous component. The major internalsubdivisions of the RPG are based on geomorphic, hydrologic,and edaphic features and their linkage with natural vegetationand land use (Fig. 1; Soriano 1991).
The replacement of natural vegetation by crops in the RPGstarted at the beginning of the 20th century with increasingEuropean immigration (Hall et al. 1992). Three main land usechanges can be identified: replacement of grasslands by annualand forage crops, replacement of grasslands by tree plantations,
63(1) January 2010 95
and intensification of grazing in native prairies. The spatialvariability of cropped area is associated with soil restrictions.For example, sodicity and hydromorphism constrain agricul-ture in the Flooding Pampa, whereas soil depth becomeslimiting in parts of the Uruguayan Campos. Agriculture hasstrongly impacted the Rolling, Inland, and Southern Pampas insuch a way that natural vegetation is unknown and probablypoorly represented in what might be considered relict areas.Afforestation of some of the most productive native grasslandsof the continent is already increasing rapidly and will probablybe reinforced by the prospective carbon sequestration market(Jobbagy et al. 2005). Grazing is the main cause of vegetationchanges in nonagricultural areas. Domestic herbivores, intro-duced in the 16th century, profoundly modified the structure
and functioning of the grasslands (Rusch and Oesterheld 1997;Rodrıguez et al. 2003; Altesor et al. 2005, 2006; Pineiro et al.2006b; see article by Pineiro et al. in this issue).
In a recent study, Baldi and Paruelo (2008) performed adetailed land use and land cover characterization based onLandsat Thematic Mapper and Enhanced Thematic MapperPlus images for eight pilot areas along the RPG (Fig. 2) and forthe first years of the century (2000–2004). The study includedapproximately 265 000 km2 of the 750 000 km2 of thegrassland system, incorporating its physical and ecologicalinternal heterogeneity. The results indicated that rangelands,including sown pastures, covered 61.4% of the territory andannual crops 25.9%. The spatial patterns of land use and landcover were closely related to a few edaphic and topographic
Figure 1. Rıo de la Plata grasslands and their main phytogeographic units. Stars correspond to the sites included in the simulation analysis. SAindicates Salto; TA, Tacuarembo; TT, Treintra y Tres; CA, Canelones; CO, Colonia; PG, Pergamino, DO, Dolores; PH, Pehuajo; PI, Pigue; 3A, TresArroyos; and AS, Ascasubi.
96 Rangeland Ecology & Management

characteristics, including drainage conditions, soil depth, orterrain slope (Baldi et al. 2006; Baldi 2007).
Field Estimates of Carbon GainsC gains may be estimated from biomass data taken in the field.In general, field studies provide estimates of aboveground NPP(ANPP; mass of C or dry matter accumulated per unit of areaand time). We compiled a dataset of site specific ANPPestimates derived from biomass harvesting for the wholeregion. Data were obtained from published articles andtechnical reports (Table 1).
The most common approach to estimate belowground NPP(BNPP) is based on belowground biomass sampling and onadding positive changes in biomass through time. Data onBNPP based on this approach were compiled for the wholeregion.
Remote Sensing Estimates of C GainsWe estimated ANPP over the entire region using the Monteith(1972) model. This model states that the NPP (or ANPP) of acanopy is positively and linearly related to the total amount ofphotosynthetic active radiation (PAR; MJ) absorbed by greentissues (APAR) during the growing season:
ANPP~
ðAPAR:e:
The proportionality constant (e) is a measure of the radiationuse efficiency (RUE; mass C or DM ? MJ21). APAR results fromthe product of the incoming radiation (PAR) and the fraction ofPAR absorbed by green tissues (fAPAR). fAPAR is positivelyrelated to spectral indices derived from the reflectance in thered and infrared portion of the electromagnetic spectrum, such
as the Normalized Difference Vegetation Index (NDVI; Rouseet al. 1973) or the Enhanced Vegetation Index (EVI; Asrar et al.1984; Sellers et al. 1992; Huete et al. 2002).
For the eight phytogeographic subunits of the RPG weestimated the fraction of the PAR absorbed by the green canopy(fAPAR), the total amount of PAR absorbed (APAR), and theANPP of rangelands (native grasslands and implanted perennialpastures). Rangelands were identified using the land covermaps generated by Baldi et al. (2006) and Baldi and Paruelo(2008; Fig. 2). In each subunit we selected 25 polygonscorresponding to rangelands. Each polygon was superimposedon temporal series of EVI images provided by the MODISsensor. EVI is an improved spectral index similar to the NDVI,but with lower saturation at high levels of leaf area index andless sensitivity to the soil signal (Justice et al. 2002). The‘‘MODIS Land Science Team’’ (http://modis-land.gsfc.nasa.gov) generates EVI images every 16 days with a spatialresolution of 250 3 250 m. We used data from two MODISscenes (h12v12 y h13v12) for the 2000–2006 period. Eachpolygon included 12–14 MODIS pixels. For each subunit of theRPG we extracted approximately 350 MODIS pixels. ANPPwas estimated using the Monteith (1972) model (see above),and PAR data were obtained from http://www.ntsg.umt.edu/cgi-bin/show_good_ncdc_stations.pl. fPAR was calculatedfrom EVI using a linear model (Ruimy et al. 1994; Pineiro etal. 2006a). Radiation use effciency (ea) for each month wasestimated from the empirical values provided by Pineiro et al.(2006a) for rangelands of the region.
Modeling Estimates of C Fluxes and Stocks: The Century ModelIn grassland areas simulation approaches have been dominatedby the use of a biogeochemical model developed specifically forgrassland areas: Century (Parton et al. 1987). Soil organicmatter is divided in the Century model into three differentpools: active, slow, and passive (recalcitrant organic matter),with turnover times of 1–5 yr, 20–40 yr, and 100–1 000 yr,respectively. Surface microbial activity is simulated, and litter isdivided into belowground and surface pools as well as intostructural and metabolic components (Parton et al. 1987). Soilfluxes are controlled by environmental variables (temperature,water, and texture) and by lignin:N and C:N ratios. Above andbelowground plant production is simulated based on water,nutrient, and shading factors. The Century model may simulatedifferent episodic events such as fire, fertilizations, grazing,plowing, or irrigation. The model simulates carbon, N, water,phosphorus, and sulfur dynamics.
We used Century model simulation results generated byPineiro et al. (2006b). The model was calibrated and evaluatedfor 11 sites distributed across the main environmental gradientof the region (Fig. 2). The simulation, planned to evaluate theimpact of grazing on the grasslands, incorporated a number ofassumptions. They simulated 8 000 yr of grazing by nativeherbivores followed by 370 yr of grazing by domesticherbivores. The first 8 000 yr served to stabilize soil organicmatter pools at each site and provided a reference to contrastwith the following 370 yr. This simulation had the followingassumptions:
1) Stable vegetation structure and species compositionduring the simulation period
Figure 2. Land use/land cover distribution (annual crops, rangelands,and forest + afforestations) in eight Landsat scenes. Based on Baldi(2007) and Baldi and Paruelo (2008) for 2000–2004. The pie chartpresents the relative proportion of the different units within the scenes.
63(1) January 2010 97
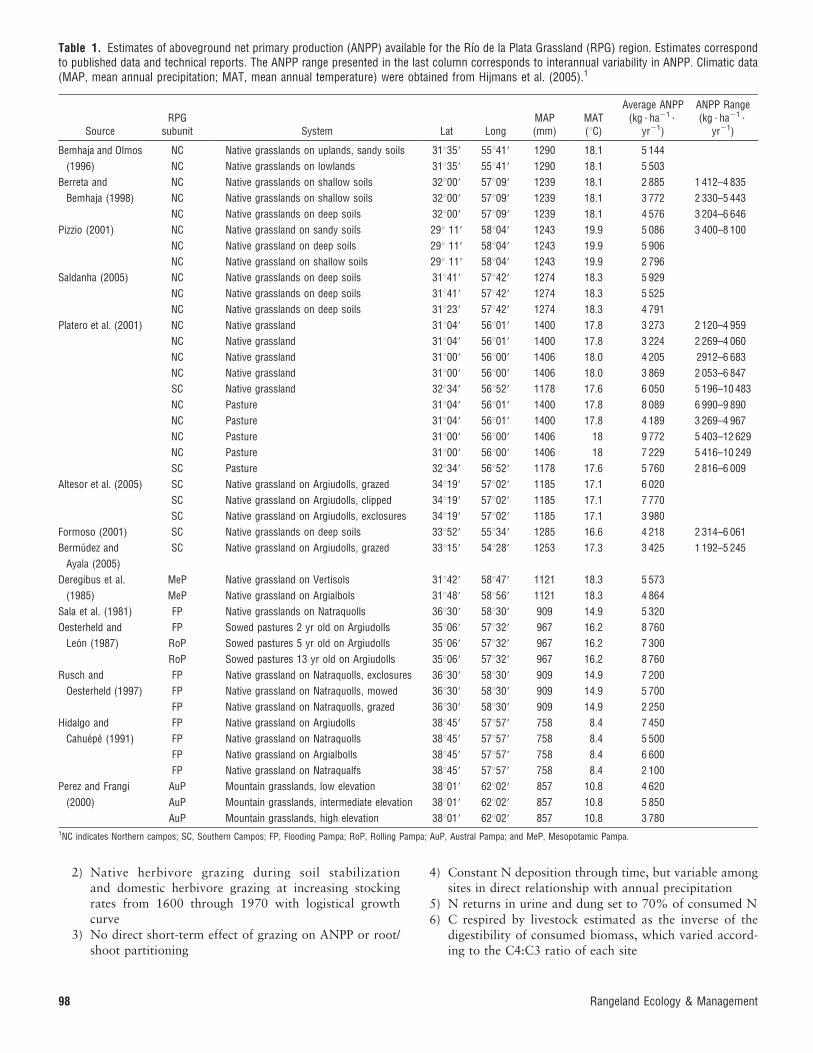
2) Native herbivore grazing during soil stabilizationand domestic herbivore grazing at increasing stockingrates from 1600 through 1970 with logistical growthcurve
3) No direct short-term effect of grazing on ANPP or root/shoot partitioning
4) Constant N deposition through time, but variable amongsites in direct relationship with annual precipitation
5) N returns in urine and dung set to 70% of consumed N
6) C respired by livestock estimated as the inverse of thedigestibility of consumed biomass, which varied accord-ing to the C4:C3 ratio of each site
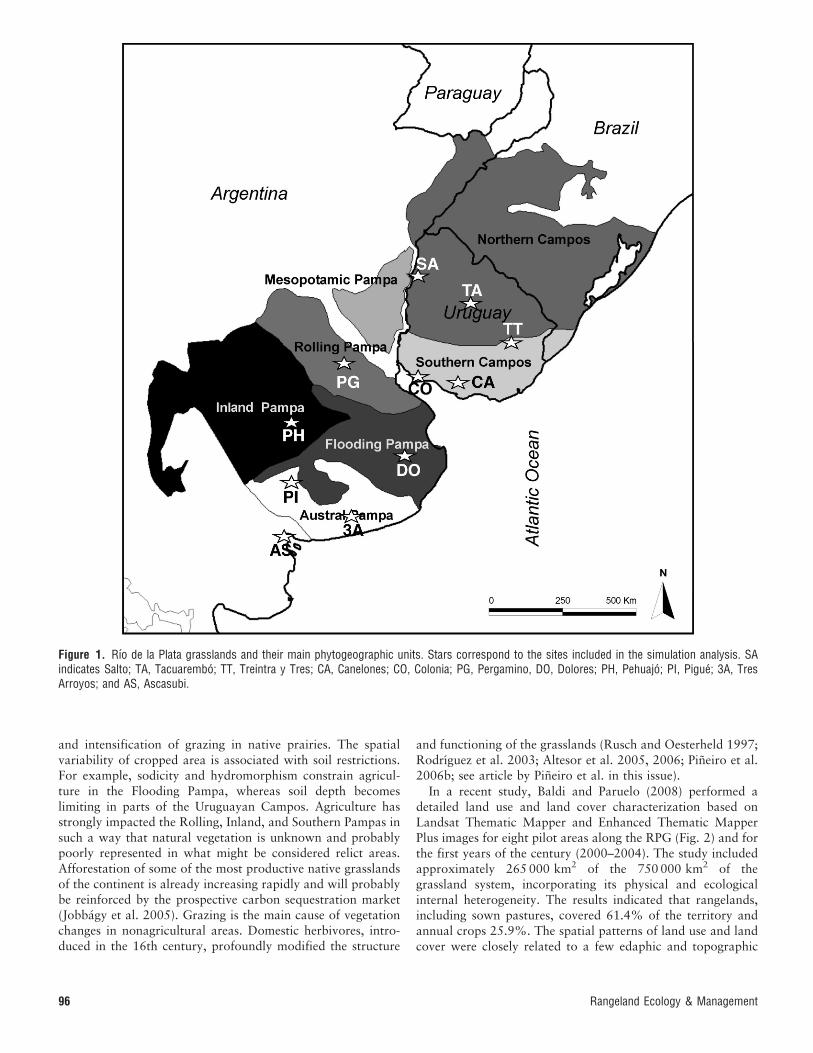
Table 1. Estimates of aboveground net primary production (ANPP) available for the Rıo de la Plata Grassland (RPG) region. Estimates correspondto published data and technical reports. The ANPP range presented in the last column corresponds to interannual variability in ANPP. Climatic data(MAP, mean annual precipitation; MAT, mean annual temperature) were obtained from Hijmans et al. (2005).1
SourceRPG
subunit System Lat LongMAP(mm)
MAT(uC)
Average ANPP(kg ? ha21 ?
yr21)
ANPP Range(kg ? ha21 ?
yr21)
Bemhaja and Olmos
(1996)
NC Native grasslands on uplands, sandy soils 31u359 55u419 1290 18.1 5 144
NC Native grasslands on lowlands 31u359 55u419 1290 18.1 5 503
Berreta and
Bemhaja (1998)
NC Native grasslands on shallow soils 32u009 57u099 1239 18.1 2 885 1 412–4 835
NC Native grasslands on shallow soils 32u009 57u099 1239 18.1 3 772 2 330–5 443
NC Native grasslands on deep soils 32u009 57u099 1239 18.1 4 576 3 204–6 646
Pizzio (2001) NC Native grassland on sandy soils 29u 119 58u049 1243 19.9 5 086 3 400–8 100
NC Native grassland on deep soils 29u 119 58u049 1243 19.9 5 906
NC Native grassland on shallow soils 29u 119 58u049 1243 19.9 2 796
Saldanha (2005) NC Native grasslands on deep soils 31u419 57u429 1274 18.3 5 929
NC Native grasslands on deep soils 31u419 57u429 1274 18.3 5 525
NC Native grasslands on deep soils 31u239 57u429 1274 18.3 4 791
Platero et al. (2001) NC Native grassland 31u049 56u019 1400 17.8 3 273 2 120–4 959
NC Native grassland 31u049 56u019 1400 17.8 3 224 2 269–4 060
NC Native grassland 31u009 56u009 1406 18.0 4 205 2912–6 683
NC Native grassland 31u009 56u009 1406 18.0 3 869 2 053–6 847
SC Native grassland 32u349 56u529 1178 17.6 6 050 5 196–10 483
NC Pasture 31u049 56u019 1400 17.8 8 089 6 990–9 890
NC Pasture 31u049 56u019 1400 17.8 4 189 3 269–4 967
NC Pasture 31u009 56u009 1406 18 9 772 5 403–12 629
NC Pasture 31u009 56u009 1406 18 7 229 5 416–10 249
SC Pasture 32u349 56u529 1178 17.6 5 760 2 816–6 009
Altesor et al. (2005) SC Native grassland on Argiudolls, grazed 34u199 57u029 1185 17.1 6 020
SC Native grassland on Argiudolls, clipped 34u199 57u029 1185 17.1 7 770
SC Native grassland on Argiudolls, exclosures 34u199 57u029 1185 17.1 3 980
Formoso (2001) SC Native grasslands on deep soils 33u529 55u349 1285 16.6 4 218 2 314–6 061
Bermudez and
Ayala (2005)
SC Native grassland on Argiudolls, grazed 33u159 54u289 1253 17.3 3 425 1 192–5 245
Deregibus et al.
(1985)
MeP Native grassland on Vertisols 31u429 58u479 1121 18.3 5 573
MeP Native grassland on Argialbols 31u489 58u569 1121 18.3 4 864
Sala et al. (1981) FP Native grasslands on Natraquolls 36u309 58u309 909 14.9 5 320
Oesterheld and
Leon (1987)
FP Sowed pastures 2 yr old on Argiudolls 35u069 57u329 967 16.2 8 760
RoP Sowed pastures 5 yr old on Argiudolls 35u069 57u329 967 16.2 7 300
RoP Sowed pastures 13 yr old on Argiudolls 35u069 57u329 967 16.2 8 760
Rusch and
Oesterheld (1997)
FP Native grassland on Natraquolls, exclosures 36u309 58u309 909 14.9 7 200
FP Native grassland on Natraquolls, mowed 36u309 58u309 909 14.9 5 700
FP Native grassland on Natraquolls, grazed 36u309 58u309 909 14.9 2 250
Hidalgo and
Cahuepe (1991)
FP Native grassland on Argiudolls 38u459 57u579 758 8.4 7 450
FP Native grassland on Natraquolls 38u459 57u579 758 8.4 5 500
FP Native grassland on Argialbolls 38u459 57u579 758 8.4 6 600
FP Native grassland on Natraqualfs 38u459 57u579 758 8.4 2 100
Perez and Frangi
(2000)
AuP Mountain grasslands, low elevation 38u019 62u029 857 10.8 4 620
AuP Mountain grasslands, intermediate elevation 38u019 62u029 857 10.8 5 850
AuP Mountain grasslands, high elevation 38u019 62u029 857 10.8 3 7801NC indicates Northern campos; SC, Southern Campos; FP, Flooding Pampa; RoP, Rolling Pampa; AuP, Austral Pampa; and MeP, Mesopotamic Pampa.
98 Rangeland Ecology & Management
7) Constant atmospheric CO2 concentration (, 300 ppm)
8) No fire events either before or after herbivore introduction
9) Constant climate (present conditions based on records ofapproximately the last 60 yr).
RESULTS AND DISCUSSION
Carbon Fluxes and Stocks
C Gains: Field Data. ANPP estimates based on harvestedbiomass data are scarce, probably because of the amount ofwork involved in collecting and processing the data. For theentire region we were able to compile a database of only 14studies that estimate ANPP from harvest data for 41 sites/systems (Table 1). The estimates covered in general 1–3 yr. Thesite with the longest record was located in the NorthernCampos (Mercedes, Corrientes, Argentina) and covered aperiod of 19 yr. Average estimates of ANPP ranged from2 100 kg ? ha21 ? yr21 to 9 772 kg ? ha21 ? yr21 (average ANPPfor all the available sites/situations 5 5 347 6 1 794 kg ? ha21 ?
yr21). Assuming a C proportion of 0.45 for herbaceousbiomass, average ANPP would be 241 g C ? m22 ? yr21. Thosesites with more than 1 yr of data showed important interannualvariability in ANPP. On average the observed range of ANPP(maximum – minimum values) was equivalent to 80% of themean production of the site.
The use of biomass data (a state variable) to infer ANPP (aflux) is far from straightforward and strongly relies onassuming that all biomass produced during a given periodmay be accounted for by one or more biomass harvests (e.g.,herbivory and decay is negligible; Oesterheld and McNaughton2000; Sala and Austin 2000). There is a large diversity ofapproaches to deal with cases where this sort of assumption isquestionable (e.g., sequential harvests, sorting material byspecies and compartments, enclosures or moving cages), whichresults in different estimates of ANPP depending on the chosenapproach (McNaughton et al. 1996; Scurlock et al. 2002). Theoften high variability of biomass within plant communitiesincreases the number of replicate samples required to reachreasonable accuracy (Eckblad 1991). Several of the approachesmentioned in the previous paragraph to deal with theunaccounted loss of biomass between harvests require morefrequent sampling and the sampling of different compartments,whose variability is usually larger than the variability of thewhole. As a result, several double-sampling techniques havebeen developed (‘t Mannetje and Haydock 1963; Tucker 1980)and considered in some of the studies included in our analysis.Additionally, the various available approaches to calculateANPP from biomass compartments may produce widelydifferent estimates based on the same harvest (Scurlock et al.2002). The exclusion of herbivores to deal with the loss ofbiomass that would alter the estimates modifies the structure ofthe canopy whose productivity is being estimated. As grazingaffects ANPP, its exclusion for methodological reasons mayoften result in a poor estimate of the productivity of the grazedsituation that needs to be evaluated (McNaughton et al. 1996;Oesterheld and McNaughton 2000).
BNPP data are even scarcer. Three experimental studiespresented data for the Flooding and the Austral Pampa: Doll
(1991), 3 800–8 200 kg ? ha21 ? yr21; de Wysiecky and Perez(1994), 5 600–5 650 kg ? ha21 ? yr21; and Perez and Frangi(2000), 6 690–7 790 kg ? ha21 ? yr21. These showed, as havemany others in temperate grasslands (Gill et al. 2002; Puchetaet al. 2004; Hui and Jackson 2005), that BNPP is, in general,higher than ANPP (BNPP / NPP 5 0.47–0.87, Hui and Jackson2005). BNPP is one of the poorest understood attributes of theecosystem (Milchunas and Lauenroth 1992). Estimates of theBNPP:NPP ratios varied widely, and a large proportion of suchvariation is due to methodological issues (Lauenroth 2000). Nodirect approach allows us to estimate BNPP in the field. BNPPin a given time interval includes the biomass accumulated, theherbivore consumption, the biomass lost as exudation, anddeath. In grassland ecosystems the absence of large woodyroots makes it simpler than in forests to estimate BNPP.However, to discriminate between live and dead tissues, toexclude or quantify herbivore consumption, or to quantify rootexudates represent major challenges to quantify root biomass.Ingrowth cores, isotopic analyses (based on 14C dilution),minirhizotrons, and C balances are some of the alternativesused to estimate BNPP (Lauenroth 2000).
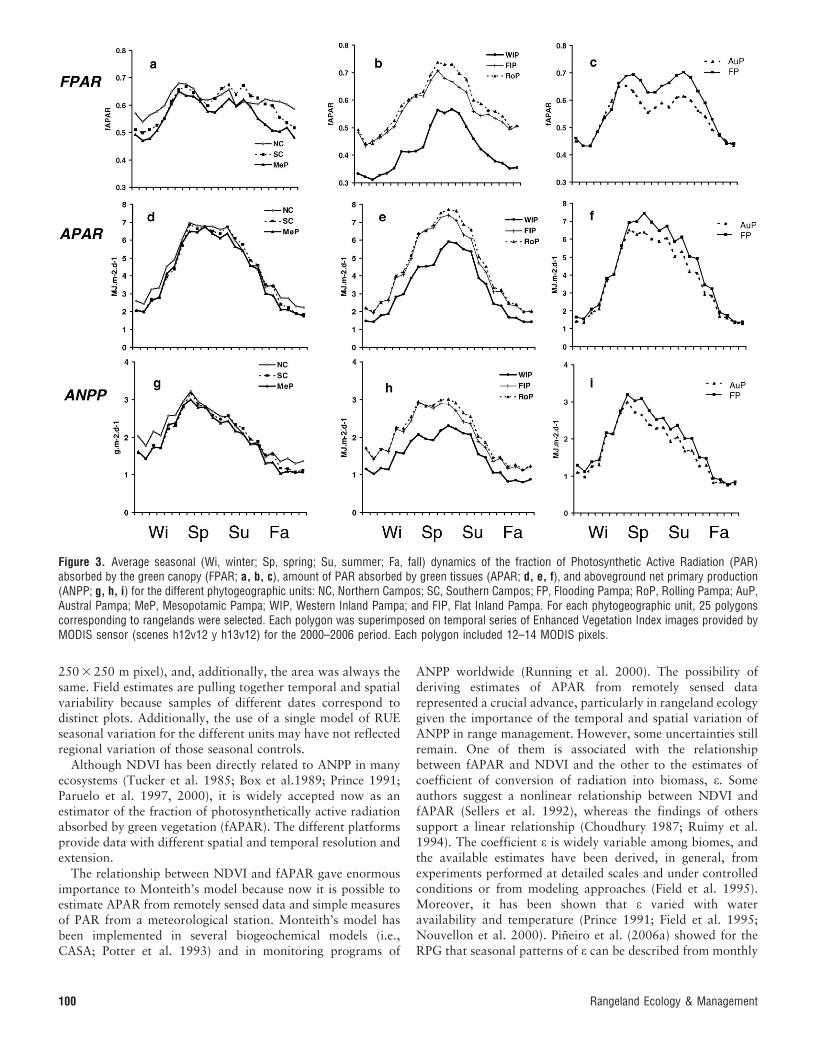
C Gains: Remotely Sensed Data. The rangelands of thedifferent subunits of the RPG showed three general patterns ofseasonal change of fAPAR (Fig. 3a, b, c). The northernmostsubunits (Northern and Southern Campos and MesopotamicPampa) showed a relatively low intra-annual variability offAPAR (Fig. 3a). These subunits presented the lowest differencebetween maximum and minimum fAPAR. A spring peak offAPAR was evident in the three subunits. The Rolling Pampaand both Inland Pampas presented a higher intra-annualvariability and a well-defined summer peak (Fig. 3b). Thesouthernmost subunits (Flooding Pampa and Austral Pampa)were highly variable throughout the year and presented twoclear peaks of fAPAR (Fig. 3c).
The dynamics of PAR, with a clear peak in December,determine that the two peaks of some of the subunits disappearwhen APAR is calculated (Fig. 3d, e, f). Except for the Rollingand Inland Pampas, with a peak of APAR in December,maximum radiation absorption occurs in November. Radiationuse efficiency (ea) varied across precipitation gradients (Parueloet al. 1997) and throughout the season (Pineiro et al. 2006a).Empirical estimates of ea showed that in the RPG thiscoefficient presented minima in summer and maxima in winter(Fig. 4). The seasonal dynamics of ea determined a reduction inthe contrast of ANPP throughout the year (Fig. 3g, h, i). Theratio between maximum and minimum APAR ranged between5.45 and 3.12 and between 4.12 and 2.47 for ANPP.
Average ANPP for the period studied ranged from 5 200 kgDM ? ha21 ? yr21 (West Inland Pampa) to 7 860 kg DM ?
ha21 ? yr21 (Northern Campos; Table 2; 260 g C ? m22 ?
yr21 and 293 g C ? m22 ? yr21, respectively). Estimates basedon remotely sensed data produced figures within the range ofvalues observed in field studies (Table 1). However, thevariability observed during the period studied was, in general,lower than for biomass-based data: the range of ANPP(maximum – minimum values) varied between 11% and 65%of the mean value of the site (Table 2). The lower interannualvariability may result from several factors. Remote sensingestimates considered a larger area to generate the estimate (a
63(1) January 2010 99
250 3 250 m pixel), and, additionally, the area was always thesame. Field estimates are pulling together temporal and spatialvariability because samples of different dates correspond todistinct plots. Additionally, the use of a single model of RUEseasonal variation for the different units may have not reflectedregional variation of those seasonal controls.
Although NDVI has been directly related to ANPP in manyecosystems (Tucker et al. 1985; Box et al.1989; Prince 1991;Paruelo et al. 1997, 2000), it is widely accepted now as anestimator of the fraction of photosynthetically active radiationabsorbed by green vegetation (fAPAR). The different platformsprovide data with different spatial and temporal resolution andextension.
The relationship between NDVI and fAPAR gave enormousimportance to Monteith’s model because now it is possible toestimate APAR from remotely sensed data and simple measuresof PAR from a meteorological station. Monteith’s model hasbeen implemented in several biogeochemical models (i.e.,CASA; Potter et al. 1993) and in monitoring programs of
ANPP worldwide (Running et al. 2000). The possibility ofderiving estimates of APAR from remotely sensed datarepresented a crucial advance, particularly in rangeland ecologygiven the importance of the temporal and spatial variation ofANPP in range management. However, some uncertainties stillremain. One of them is associated with the relationshipbetween fAPAR and NDVI and the other to the estimates ofcoefficient of conversion of radiation into biomass, e. Someauthors suggest a nonlinear relationship between NDVI andfAPAR (Sellers et al. 1992), whereas the findings of otherssupport a linear relationship (Choudhury 1987; Ruimy et al.1994). The coefficient e is widely variable among biomes, andthe available estimates have been derived, in general, fromexperiments performed at detailed scales and under controlledconditions or from modeling approaches (Field et al. 1995).Moreover, it has been shown that e varied with wateravailability and temperature (Prince 1991; Field et al. 1995;Nouvellon et al. 2000). Pineiro et al. (2006a) showed for theRPG that seasonal patterns of e can be described from monthly
Figure 3. Average seasonal (Wi, winter; Sp, spring; Su, summer; Fa, fall) dynamics of the fraction of Photosynthetic Active Radiation (PAR)absorbed by the green canopy (FPAR; a, b, c), amount of PAR absorbed by green tissues (APAR; d, e, f), and aboveground net primary production(ANPP; g, h, i) for the different phytogeographic units: NC, Northern Campos; SC, Southern Campos; FP, Flooding Pampa; RoP, Rolling Pampa; AuP,Austral Pampa; MeP, Mesopotamic Pampa; WIP, Western Inland Pampa; and FIP, Flat Inland Pampa. For each phytogeographic unit, 25 polygonscorresponding to rangelands were selected. Each polygon was superimposed on temporal series of Enhanced Vegetation Index images provided byMODIS sensor (scenes h12v12 y h13v12) for the 2000–2006 period. Each polygon included 12–14 MODIS pixels.
100 Rangeland Ecology & Management
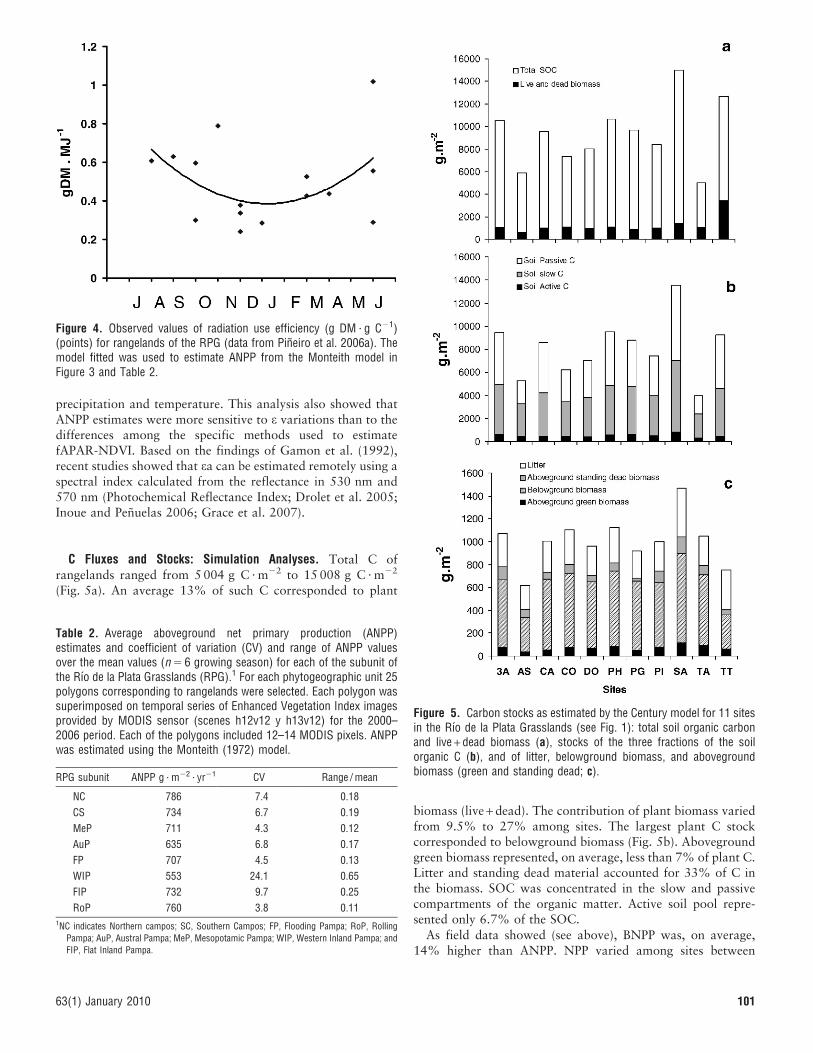
precipitation and temperature. This analysis also showed thatANPP estimates were more sensitive to e variations than to thedifferences among the specific methods used to estimatefAPAR-NDVI. Based on the findings of Gamon et al. (1992),recent studies showed that ea can be estimated remotely using aspectral index calculated from the reflectance in 530 nm and570 nm (Photochemical Reflectance Index; Drolet et al. 2005;Inoue and Penuelas 2006; Grace et al. 2007).
C Fluxes and Stocks: Simulation Analyses. Total C ofrangelands ranged from 5 004 g C ? m22 to 15 008 g C ? m22
(Fig. 5a). An average 13% of such C corresponded to plant
biomass (live + dead). The contribution of plant biomass variedfrom 9.5% to 27% among sites. The largest plant C stockcorresponded to belowground biomass (Fig. 5b). Abovegroundgreen biomass represented, on average, less than 7% of plant C.Litter and standing dead material accounted for 33% of C inthe biomass. SOC was concentrated in the slow and passivecompartments of the organic matter. Active soil pool repre-sented only 6.7% of the SOC.
As field data showed (see above), BNPP was, on average,14% higher than ANPP. NPP varied among sites between
Table 2. Average aboveground net primary production (ANPP)estimates and coefficient of variation (CV) and range of ANPP valuesover the mean values (n 5 6 growing season) for each of the subunit ofthe Rıo de la Plata Grasslands (RPG).1 For each phytogeographic unit 25polygons corresponding to rangelands were selected. Each polygon wassuperimposed on temporal series of Enhanced Vegetation Index imagesprovided by MODIS sensor (scenes h12v12 y h13v12) for the 2000–2006 period. Each of the polygons included 12–14 MODIS pixels. ANPPwas estimated using the Monteith (1972) model.
RPG subunit ANPP g ? m22 ? yr21 CV Range / mean
NC 786 7.4 0.18
CS 734 6.7 0.19
MeP 711 4.3 0.12
AuP 635 6.8 0.17
FP 707 4.5 0.13
WIP 553 24.1 0.65
FIP 732 9.7 0.25
RoP 760 3.8 0.111NC indicates Northern campos; SC, Southern Campos; FP, Flooding Pampa; RoP, Rolling
Pampa; AuP, Austral Pampa; MeP, Mesopotamic Pampa; WIP, Western Inland Pampa; andFIP, Flat Inland Pampa.
Figure 4. Observed values of radiation use efficiency (g DM ? g C21)(points) for rangelands of the RPG (data from Pineiro et al. 2006a). Themodel fitted was used to estimate ANPP from the Monteith model inFigure 3 and Table 2.
Figure 5. Carbon stocks as estimated by the Century model for 11 sitesin the Rıo de la Plata Grasslands (see Fig. 1): total soil organic carbonand live + dead biomass (a), stocks of the three fractions of the soilorganic C (b), and of litter, belowground biomass, and abovegroundbiomass (green and standing dead; c).
63(1) January 2010 101
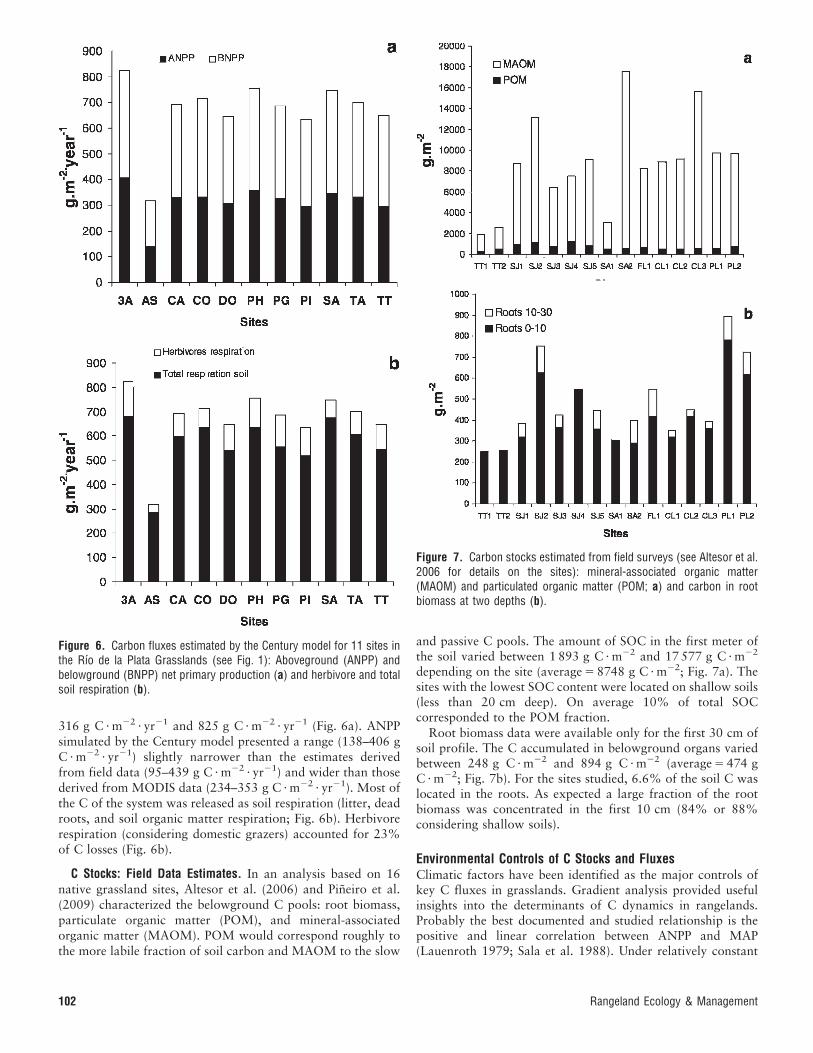
316 g C ? m22 ? yr21 and 825 g C ? m22 ? yr21 (Fig. 6a). ANPPsimulated by the Century model presented a range (138–406 gC ? m22 ? yr21) slightly narrower than the estimates derivedfrom field data (95–439 g C ? m22 ? yr21) and wider than thosederived from MODIS data (234–353 g C ? m22 ? yr21). Most ofthe C of the system was released as soil respiration (litter, deadroots, and soil organic matter respiration; Fig. 6b). Herbivorerespiration (considering domestic grazers) accounted for 23%of C losses (Fig. 6b).
C Stocks: Field Data Estimates. In an analysis based on 16native grassland sites, Altesor et al. (2006) and Pineiro et al.(2009) characterized the belowground C pools: root biomass,particulate organic matter (POM), and mineral-associatedorganic matter (MAOM). POM would correspond roughly tothe more labile fraction of soil carbon and MAOM to the slow
and passive C pools. The amount of SOC in the first meter ofthe soil varied between 1 893 g C ? m22 and 17 577 g C ? m22
depending on the site (average 5 8748 g C ? m22; Fig. 7a). Thesites with the lowest SOC content were located on shallow soils(less than 20 cm deep). On average 10% of total SOCcorresponded to the POM fraction.
Root biomass data were available only for the first 30 cm ofsoil profile. The C accumulated in belowground organs variedbetween 248 g C ? m22 and 894 g C ? m22 (average 5 474 gC ? m22; Fig. 7b). For the sites studied, 6.6% of the soil C waslocated in the roots. As expected a large fraction of the rootbiomass was concentrated in the first 10 cm (84% or 88%considering shallow soils).
Environmental Controls of C Stocks and FluxesClimatic factors have been identified as the major controls ofkey C fluxes in grasslands. Gradient analysis provided usefulinsights into the determinants of C dynamics in rangelands.Probably the best documented and studied relationship is thepositive and linear correlation between ANPP and MAP(Lauenroth 1979; Sala et al. 1988). Under relatively constant
Figure 6. Carbon fluxes estimated by the Century model for 11 sites inthe Rıo de la Plata Grasslands (see Fig. 1): Aboveground (ANPP) andbelowground (BNPP) net primary production (a) and herbivore and totalsoil respiration (b).
Figure 7. Carbon stocks estimated from field surveys (see Altesor et al.2006 for details on the sites): mineral-associated organic matter(MAOM) and particulated organic matter (POM; a) and carbon in rootbiomass at two depths (b).
102 Rangeland Ecology & Management
precipitation, ANPP showed also a positive relationship withtemperature (Epstein et al. 1997). Carbon stocks in grasslandsare largely determined by abiotic factors too (Burke et al.1989); they increase with precipitation mainly as a result ofincreased primary production (input) and decrease withincreasing temperature as a result of increased decomposition(output; McDaniel and Munn 1985). Soil characteristics play acritical role in determining C stocks and fluxes at the landscapescale, though their influence is, in general, less important thanclimatic factors at the regional scale. Sala et al. (1988) andEpstein et al. (1997) showed that soil texture, through itseffects on water holding capacity, is a major control of C gains.Silt and clay content increase the carbon content of rangelandsoils (Burke et al. 1989). Inertia or ‘‘system memory’’ effectshave been identified as a major determinant of interannualchanges of C gains (Oesterheld et al. 2001; Wiegand et al.2004).
How well do the ANPP data compiled for the RPG fit thesegeneral patterns? For field ANPP data, differences were notassociated with geographical or climatic gradients. Severalreasons may contribute to this. On the one hand, most of theavailable studies corresponded to the more humid portion ofthe RPG restricting the range of the data. Management andedaphic factors (not always recorded) seem to be the majorcontrols of the spatial variability in ANPP in this dataset: thehighest values of ANPP were associated with deep soil and withthe introduction of cultivated species (generally associated withfertilization practices). On the other hand, ANPP was estimatedusing several approaches, and this introduces an additionalsource of variation that may mask general patterns.
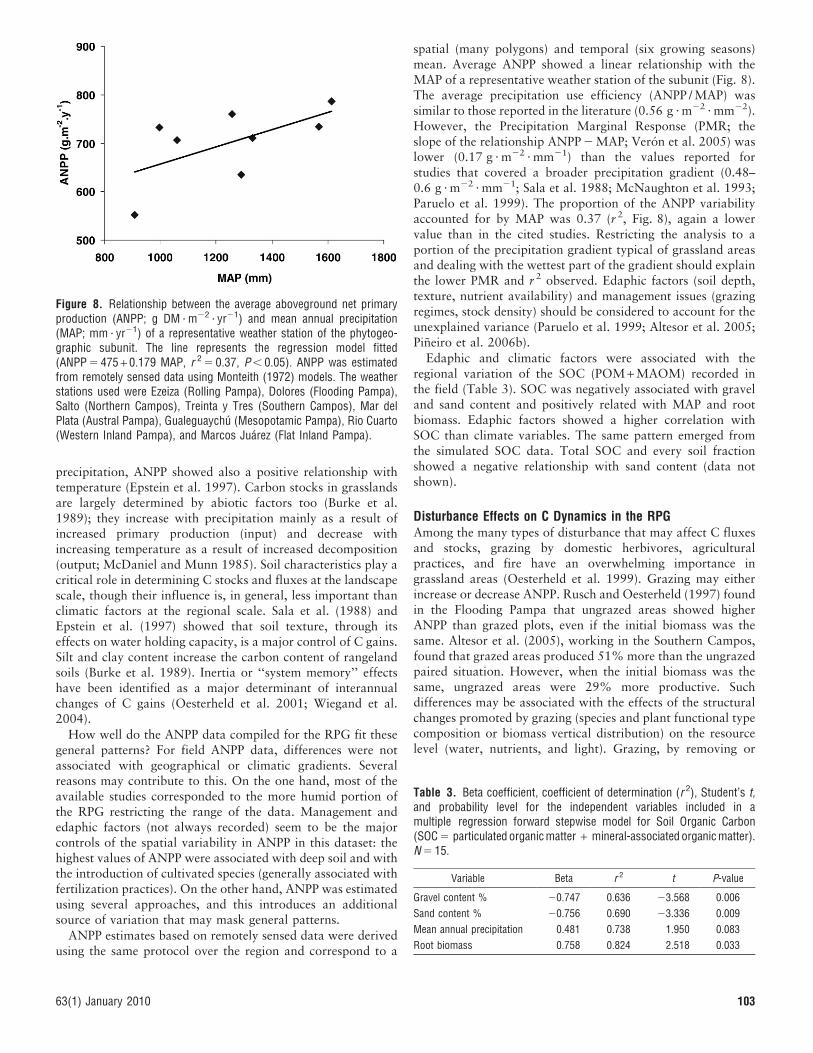
ANPP estimates based on remotely sensed data were derivedusing the same protocol over the region and correspond to a
spatial (many polygons) and temporal (six growing seasons)mean. Average ANPP showed a linear relationship with theMAP of a representative weather station of the subunit (Fig. 8).The average precipitation use efficiency (ANPP / MAP) wassimilar to those reported in the literature (0.56 g ? m22 ? mm22).However, the Precipitation Marginal Response (PMR; theslope of the relationship ANPP 2 MAP; Veron et al. 2005) waslower (0.17 g ? m22 ? mm21) than the values reported forstudies that covered a broader precipitation gradient (0.48–0.6 g ? m22 ? mm21; Sala et al. 1988; McNaughton et al. 1993;Paruelo et al. 1999). The proportion of the ANPP variabilityaccounted for by MAP was 0.37 (r 2, Fig. 8), again a lowervalue than in the cited studies. Restricting the analysis to aportion of the precipitation gradient typical of grassland areasand dealing with the wettest part of the gradient should explainthe lower PMR and r 2 observed. Edaphic factors (soil depth,texture, nutrient availability) and management issues (grazingregimes, stock density) should be considered to account for theunexplained variance (Paruelo et al. 1999; Altesor et al. 2005;Pineiro et al. 2006b).
Edaphic and climatic factors were associated with theregional variation of the SOC (POM + MAOM) recorded inthe field (Table 3). SOC was negatively associated with graveland sand content and positively related with MAP and rootbiomass. Edaphic factors showed a higher correlation withSOC than climate variables. The same pattern emerged fromthe simulated SOC data. Total SOC and every soil fractionshowed a negative relationship with sand content (data notshown).
Disturbance Effects on C Dynamics in the RPGAmong the many types of disturbance that may affect C fluxesand stocks, grazing by domestic herbivores, agriculturalpractices, and fire have an overwhelming importance ingrassland areas (Oesterheld et al. 1999). Grazing may eitherincrease or decrease ANPP. Rusch and Oesterheld (1997) foundin the Flooding Pampa that ungrazed areas showed higherANPP than grazed plots, even if the initial biomass was thesame. Altesor et al. (2005), working in the Southern Campos,found that grazed areas produced 51% more than the ungrazedpaired situation. However, when the initial biomass was thesame, ungrazed areas were 29% more productive. Suchdifferences may be associated with the effects of the structuralchanges promoted by grazing (species and plant functional typecomposition or biomass vertical distribution) on the resourcelevel (water, nutrients, and light). Grazing, by removing or
Figure 8. Relationship between the average aboveground net primaryproduction (ANPP; g DM ? m22 ? yr21) and mean annual precipitation(MAP; mm ? yr21) of a representative weather station of the phytogeo-graphic subunit. The line represents the regression model fitted(ANPP 5 475 + 0.179 MAP, r 2 5 0.37, P , 0.05). ANPP was estimatedfrom remotely sensed data using Monteith (1972) models. The weatherstations used were Ezeiza (Rolling Pampa), Dolores (Flooding Pampa),Salto (Northern Campos), Treinta y Tres (Southern Campos), Mar delPlata (Austral Pampa), Gualeguaychu (Mesopotamic Pampa), Rio Cuarto(Western Inland Pampa), and Marcos Juarez (Flat Inland Pampa).
Table 3. Beta coefficient, coefficient of determination (r 2), Student’s t,and probability level for the independent variables included in amultiple regression forward stepwise model for Soil Organic Carbon(SOC 5 particulated organic matter + mineral-associated organic matter).N 5 15.
Variable Beta r 2 t P-value
Gravel content % 20.747 0.636 23.568 0.006
Sand content % 20.756 0.690 23.336 0.009
Mean annual precipitation 0.481 0.738 1.950 0.083
Root biomass 0.758 0.824 2.518 0.033
63(1) January 2010 103
avoiding the accumulation of senescent material, may increaseradiation interception. As long as light was the limiting factor,grazing would increase ANPP.
Altesor et al. (2006) analyzed the effect of grazing regime onC stocks in a network of grazed sites and herbivore exclusionslocated in the Southern Campos. Although no changes weredetected in total soil C among grazing treatments, a differentialeffect on the labile and recalcitrant fraction of the soil organicmatter was evident. Soil carbon was higher under grazing in theupper layer, probably because of the higher biomass ofbelowground organs. The pattern changed with depth: Cstocks were higher in ungrazed sites because of an increase inthe more recalcitrant organic matter pool. At least in the shortterm, the dynamics of SOC seems to be influenced in a complexway by changes in C inputs and vertical distribution, in Navailability, and in plant functional types composition. In thelong term (decades or centuries), grazing effects seems to differ.Modeling studies with Century (Pineiro et al. 2006b) suggesteda reduction in C stocks mainly to higher N outputs that openedthe N cycle and constrained C accumulation in soils, reducingSOC by 22%.
Crop expansion in the RPG had a significant effect on theseasonality of carbon gains and almost no effect on total amountfixed (Guerschman et al. 2003). As a matter of fact, Guerschman(2005) estimated that the NPP of agricultural systems was 15%lower than of the native grasslands. Agriculture basicallymodifies the shape of the seasonal curve of primary productionbut not the area underneath. An increase in croplands alsoreduced the interannual variability of the seasonal patterns ofcarbon gains (Guerschman and Paruelo 2005). The introductionof double cropping systems during the last two decades (wheat-soybean) generated a double peak in the seasonal curve of ANPPand an increase in C gains (Guerschman and Paruelo 2005).Guerschman (2005) estimated that the human appropriation ofNPP in the Argentine portion of the RPG varied between 19%and 45%. The average was substantially higher than the averageappropriation estimated by Vitousek et al. (1997) for the wholeplanet (15.2%).
Tree plantations (mainly Pinus and Eucalyptus species) havethe potential of increasing C gains. Jobbagy et al. (2006)showed, based on a remote sensing analysis, that afforestationin the Mesopotamic Pampa and in the Uruguayan Camposintercepted 22% more radiation than the rangelands that theyreplaced. Field-based estimates of ANPP showed the samepattern (Jobbagy et al. 2006).
Large quantities of C sequestered in grassland soils aretransferred into the atmosphere when grasslands are ploughedand converted into annual or perennial crops (Davidson andAckerman 1993). Tillage increases soil organic matter decom-position and decreases carbon stocks mainly as a result ofbreaking up soil aggregates and exposing residues to decom-posers (Elliot 1986). Burke et al. (1989) estimated, for theCentral Plains of the United States, C losses of 40% of theoriginal values because of cultivation. C stocks after plowingdecreased significantly and very rapidly (Cole et al. 1989), butafter 50 yr of abandonment stocks had not yet reached thelevels of native soils (Burke et al. 1995; Ihori et al. 1995).Alvarez et al. (1998), Andriulo et al. (1999), and Alvarez(2001) documented the C losses due to annual croplands for the
RPG. Preliminary data suggest that afforestation also increasesC losses (Carrasco-Letelier et al. 2004).
The agricultural transformation of grasslands also affects thedynamics of other trace gases such as methane and nitrous oxide.Field experiments comparing native grasslands and adjacentcultivated plots have shown that cultivation decreases the uptakeof methane and increases the emissions of nitrous oxide,contributing to the increasing concentrations of these gases inthe atmosphere (Mosier et al. 1991). No data on methane uptakeor N oxide production are available for the RPG.
Fire is another potential disturbance in the humid grasslands.In a meta-analysis, Oesterheld et al. (1999) showed that firetended to increase ANPP in subhumid and humid grasslands. Inthe RPG fire is now restricted to the Campos subdivisions andsmall patches in the Mesopotamic Pampa and the FloodingPampa. Fires are usually started by ranchers to eliminate low-quality forage and favor the regrowth of a more palatable andnutritious biomass. Agricultural use significantly reduced firefrequency in the RPG (Di Bella et al. 2006). Pineiro et al.(2006b), based on simulation analyses, showed that firefrequencies and intensities interact with the grazing regimedetermining long-term C dynamics and stocks.
MANAGEMENT IMPLICATIONS
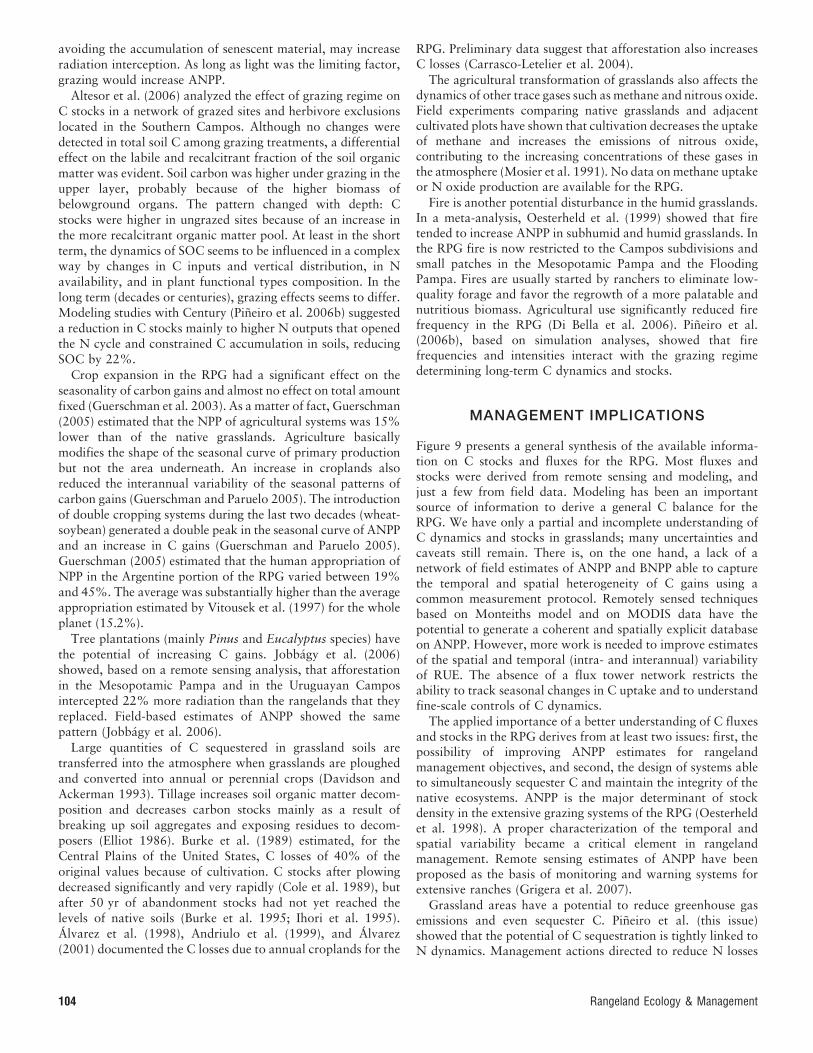
Figure 9 presents a general synthesis of the available informa-tion on C stocks and fluxes for the RPG. Most fluxes andstocks were derived from remote sensing and modeling, andjust a few from field data. Modeling has been an importantsource of information to derive a general C balance for theRPG. We have only a partial and incomplete understanding ofC dynamics and stocks in grasslands; many uncertainties andcaveats still remain. There is, on the one hand, a lack of anetwork of field estimates of ANPP and BNPP able to capturethe temporal and spatial heterogeneity of C gains using acommon measurement protocol. Remotely sensed techniquesbased on Monteiths model and on MODIS data have thepotential to generate a coherent and spatially explicit databaseon ANPP. However, more work is needed to improve estimatesof the spatial and temporal (intra- and interannual) variabilityof RUE. The absence of a flux tower network restricts theability to track seasonal changes in C uptake and to understandfine-scale controls of C dynamics.
The applied importance of a better understanding of C fluxesand stocks in the RPG derives from at least two issues: first, thepossibility of improving ANPP estimates for rangelandmanagement objectives, and second, the design of systems ableto simultaneously sequester C and maintain the integrity of thenative ecosystems. ANPP is the major determinant of stockdensity in the extensive grazing systems of the RPG (Oesterheldet al. 1998). A proper characterization of the temporal andspatial variability became a critical element in rangelandmanagement. Remote sensing estimates of ANPP have beenproposed as the basis of monitoring and warning systems forextensive ranches (Grigera et al. 2007).
Grassland areas have a potential to reduce greenhouse gasemissions and even sequester C. Pineiro et al. (this issue)showed that the potential of C sequestration is tightly linked toN dynamics. Management actions directed to reduce N losses
104 Rangeland Ecology & Management
or to increase N inputs may increase C accumulation in highlyrecalcitrant pools. Such alternatives, not yet studied in depth,include different grazing rotational schemes, fertilization, andlegume introduction, among others.
The RPGs are experiencing a particular land cover change,the conversion of native grasslands to tree plantations.Afforestation of grasslands will probably be reinforced by theprospective carbon sequestration market. Federal laws pro-moting afforestation with fast-growing tree species expandedtree plantations over vast areas of the RPG. The processes,originally attached to national investment and often integratedwith local industrial processing (Jobbagy et al. 2005), are nowdriven by multinational companies that channel most of theproduction overseas. Highly productive grasslands in whichcrop production was usually not feasible (rocky or sandy soils,steep slopes, etc.) hosted most of these plantations (Jobbagy etal. 2005). C sequestration is often presented as one of thepotential benefits of afforestation. However, it is not clear thatthe higher ANPP of tree plantations with respect to rangelandareas would result in higher C accumulation and storage in thesystem. Regarding the soil component, local evidence (Jobbagyand Jackson 2003; Delgado et al. 2006) and a global synthesis(Paul et al. 2002) showed that grassland soils would notincrease C contents once forested and that in the more humidsystems (Northern and Southern Campos) soils may lose C(Jackson et al. 2002; Kirschbaum et al. 2008). An analysis ofthe potential of afforestation of grassland areas for C
sequestration must take into account the residence time of Cin the ecosystem. Moreover, it would be important to considerthe stability of the C storage pools (aboveground biomass vs.soil organic matter). Afforestation, on the other hand, had alarge impact on different ecological dimensions. Soils undereucalyptus plantations acidified most likely because of highrates of calcium cycling following tree establishment (Jobbagyand Jackson 2003). In addition, the establishment of treeplantations had striking effects on evapotranspiration, increas-ing it up to 80% (Nosetto et al. 2005). Depending on thehydraulic properties of the soils and aquifers, tree plantationcan also affect groundwater hydrology and salt dynamics,resulting in groundwater consumption of up to 300 mm ? yr21
and large accumulations of salts in soils and aquifers (Jobbagyand Jackson 2004; Nosetto et al. 2005).
LITERATURE CITED
ALTESOR, A. I., M. OESTERHELD, E. LEONI, F. LEZAMA, AND C. RODRıGUEZ. 2005. Effect of
grazing on community structure and productivity of a Uruguayan grassland.Plant Ecology 179:83–91.
ALTESOR, A. I., G. PINEIRO, F. LEZAMA, R. D. JACKSON, M. SARASOLA, AND J. M. PARUELO.2006. Ecosystem changes associated with grazing removal in sub-humid
grasslands of South America. Journal of Vegetation Science 17:323–332.
ALVAREZ, R. 2001. Estimation of carbon losses by cultivation from soils of the
Argentine Pampa using the Century model. Soil Use and Management17:62–66.
Figure 9. Carbon balance for the Rıo de la Plata rangelands. Estimates based on modeling (M), field studies (F), and remote sensing techniques (R)are presented. The values are expressed in g C ? m22 (stocks) and g C ? m22 ? yr21 (fluxes). Values in parentheses corresponded to the range ofobserved/simulated values. Abbreviations: ANPP, aboveground net primary production; BNPP, belowground net primary production; POM,particulated organic matter; and MAOM, mineral-associated organic matter.
63(1) January 2010 105
ALVAREZ, R., M. E. RUSSO, P. PRYSTUPA, J. D. SCHEINER, AND L. BLOTTA. 1998. Soilcarbon pools under conventional and no-tillage systems in the ArgentineRolling Pampa. Agronomy Journal 90:138–143.
ANDRIULO, A., J. GUERIF, AND B. MARY. 1999. Evolution of soil carbon withvarious cropping sequences on the rolling pampas. Determination of carbonorigin using variations in natural 13C abundances. Agronomie 19:349–364.
ASRAR, G., M. FUCHS, E. T. KANEMASU, AND J. L. HATFIELD. 1984. Estimating absorbedphotosynthetic radiation and leaf area index from spectral reflectance inwheat. Agronomy Journal 76:300–306.
BALDI, G. 2007. Cambios en la estructura del paisaje en la region de los Pastizalesdel Rıo de la Plata (perıodo 1985–2005) [thesis]. Buenos Aires, Argentina:Universidad de Buenos Aires, Facultad de Agronomıa. 89 p.
BALDI, G., J. P. GUERSCHMAN, AND J. M. PARUELO. 2006. Characterizing fragmentationin temperate South America grasslands. Agriculture, Ecosystems &Environment 116:197–208.
BALDI, G., AND J. M. PARUELO. 2008. Land use and land cover dynamics in SouthAmerican temperate grasslands. Ecology and Society 13(2):6.
BEMHAJA, M., AND F. OLMOS. 1996. Produccion de pasturas en suelos arenosos.Montevideo, Uruguay, Serie Tecnica INIA 80. 78 p.
BERMUDEZ, R., AND W. AYALA. 2005. Produccion de forraje de un campo natural de lazona de lomadas del este. Montevideo, Uruguay. Serie Tecnica INIA 151. 78 p.
BERRETA, E. J., AND M. BEMHAJA. 1998. Produccion estacional de comunidadesnaturales sobre suelos de basalto de la unidad Queguay Chico. Montevideo,Uruguay. Serie Tecnica INIA 102. 78 p.
BOX, E. O., B. N. HOLBEN, AND V. KALB. 1989. Accuracy of the AVHRR vegetationindex as a predictor of biomass, primary productivity and net CO2 flux.Vegetatio 80:71–89.
BURKE, I. C., W. K. LAUENROTH, AND D. P. COFFIN. 1995. Soil organic matter recovery insemiarid grasslands: implications for the conservation reserve program.Ecological Applications 5:793–801.
BURKE, I. C., C. M. YOMKER, W. J. PARTON, C. V. COLE, K. FLACH, AND D. S. SCHIMEL.1989. Texture, climate and cultivation effects on soil organic content in U.S.grassland soils. Soil Science Society of America Journal 53:800–805.
CARRASCO-LETELIER, L., G. EGUREN, C. CASTINEIRA, O. PARRA, AND D. PANARIO. 2004.Preliminary study of prairies forested with eucalyptus sp. at the northwesternUruguayan soils. Environmental Pollution 125:49–55.
CHOUDHURY, B. 1987. Relationships between vegetation indices, radiationabsorption and net photosynthesis evaluated by a sensitivity analysis. RemoteSensing of Environment 22:209–233.
COLE, C. V., I. C. BURKE, W. J. PARTON, D. S. SCHIMEL, AND J. W. B. STEWART. 1989.Analysis of historical changes in soil fertility and organic matter levels of theNorth American Great Plains. In: P. W. Unger, T. V. Sneed, and R. W. Jensens[EDS.]. Proceedings of the International Conference on Dryland Farming.College Station, TX, USA: Texas A&M University. p. 436–438.
DAVIDSON, E. A., AND I. L. ACKERMAN. 1993. Changes in soil carbon inventoriesfollowing cultivation of previously untilled soils. Biogeochemistry 20:161–193.
DELGADO, S., F. ALLIAUME, F. GARCıA PRECHAC, AND J. HERNANDEZ. 2006. Efecto de lasplantaciones de Eucalyptus sp. sobre el recurso suelo en Uruguay.Agrociencias 10:95–107.
DEREGIBUS, V. A., M. OESTERHELD, R. BOCO, J. ARANGUREN, AND M. LANDI. 1985.Produccion forrajera y de carne en pastizales naturales de la Provincia deEntre Rıos pastoreados en forma alternativa y planificada. Buenos Aires,Argentina: Asociacion Argentina de Consorcios Regionales de Experimenta-cion Agricola. p. 63–70.
DE WYSIECKY, M. L., AND C. PEREZ. 1994. Produccion de raıces de dos pastizalespastoreados de la Sierras de la Ventana, Provincia de Buenos Aires, Argentina.Ecologıa Austral 4:95–99.
DI BELLA, C. M., E. G. JOBBAGY, J. M. PARUELO, AND S. PINNOCK. 2006. Environmentaland land use controls of fire density in South America. Global Ecology andBiogeography 15:192–199.
DOLL, U. M. 1991. C-14 translocation to the below ground subsystem in atemperate humid grassland (Argentina). In: B. L. McMichael and H. Persson[EDS.]. Plant roots and their environment. Amsterdam, the Netherlands:Elsevier Science Publishers. p. 350–358.
DROLET, G. G., K. F. HUEMMRICH, F. G. HALL, E. M. MIDDLETON, T. A. BLACK, A. G. BARR,AND H. A. MARGOLIS. 2005. A MODIS-derived photochemical reflectance index todetect inter-annual variations in the photosynthetic light-use efficiency of aboreal deciduous forest. Remote Sensing of Environment 98:212–224.
DURAN, A. 1991. Los suelos del Uruguay. Montevideo, Uruguay: Hemisferio Sur.398 p.
ECKBLAD, J. W. 1991. How many samples should be taken? Bioscience41:346–348.
ELLIOT, E. T. 1986. Aggregate structure and carbon, nitrogen and phosphorus innative and cultivated soils. Soil Science Society of America Journal50:627–632.
EPSTEIN, H. E., W. K. LAUENROTH, I. C. BURKE, AND D. P. COFFIN. 1997. Regionalproductivity patterns of C3 and C4 functional types in the US Great Plains.Ecology 78:722–731.
FIELD, C. B., J. T. RANDERSON, AND C. M. MALMSTROM. 1995. Global net primaryproduction: combining ecology and remote Sensing. Remote Sensing ofEnvironment 51:74–88.
FORMOSO, D. 2001. Produccion y valor nutritivo del campo natural y mejoramientosextensivos. In: Utilizacion y Manejo de Mejoramientos Extensivos con Ovinos.Montevideo, Uruguay: Secretariado Uruguayo de la Lana. p. 7–24.
GAMON, J. A., J. PENUELAS, AND C. B. FIELD. 1992. A narrow-waveband spectral indexthat tracks diurnal changes in photosynthetic efficiency. Remote Sensing ofEnvironment 41:35–44.
GILL, R. A., R. H. KELLY, W. J. PARTON, K. A. DAY, R. B. JACKSON, J. A. MORGAN,J. M. O. SCURLOCK, L. L. TIESZEN, J. V. CASTLE, D. S. OJIMA, AND X. S. ZHANG. 2002.Using simple environmental variables to estimate below-ground productivityin grasslands. Global Ecology and Biogeography 11:79–86.
GRACE, J., C. NICHOL, M. DISNEY, P. LEWIS, T. QUAIFE, AND P. BOWYER. 2007. Can wemeasure terrestrial photosynthesis from space directly, using spectralreflectance and fluorescence? Global Change Biology 13:1484–1497.
GRIGERA, G., M. OESTERHELD, AND F. PACIN. 2007. Monitoring forage production forfarmers’ decision making. Agricultural Systems 94:637–648.
GUERSCHMAN, J. P. 2005. Analisis regional de impacto de los cambios del uso de latierra sobre el funcionamiento de los ecosistemas en la region pampeana(Argentina) [thesis]. Buenos Aires, Argentina: Universidad de Buenos Aires,Facultad de Agronomıa. 172 p.
GUERSCHMAN, J. P., AND J. M. PARUELO. 2005. Agricultural impacts on ecosystemfunctioning in temperate areas of North and South America. Global andPlanetary Change 47:170–180.
GUERSCHMAN, J. P., J. M. PARUELO, AND I. BURKE. 2003. Land use impacts on thenormalized difference vegetation index in temperate Argentina. EcologicalApplications 13:616–628.
HALL, A. J., C. M. REBELLA, C. M. GHERSA, AND J.-P. CULOT. 1992. Field crop systemsof the Pampas. In: C. J. Pearson [ED.]. Field crop ecosystems. Amsterdam, theNetherlands: Elsevier. p. 413–450.
HANNAH, L., J. L. CARR, AND A. LANKERANI. 1995. Human disturbance and naturalhabitat: a biome analysis of a global data set. Biodiversity and Conservation4:128–155.
HIDALGO, L. G., AND M. CAUHEPE. 1991. Produccion de forraje de comunidadesforrajeras de la Pampa Deprimida. Revista CREA 149:58–62.
HIJMANS, R. J., S. E. CAMERON, J. L. PARRA, P. G. JONES, AND A. JARVIS. 2005. Very highresolution interpolated climate surfaces for global land areas. InternationalJournal of Climatology 25:1965–1978.
HUETE, A., K. DIDAN, T. MIURA, E. P. RODRIGUEZ, X. GAO, AND L. G. FERREIRA. 2002.Overview of the radiometric and biophysical performance of the MODISvegetation indices. Remote Sensing of Enviroment 83:195–213.
HUI, D., AND R. B. JACKSON. 2006. Geographical and interannual variability inbiomass partitioning in grassland ecosystems: a synthesis of field data. NewPhytologist 169:85–93.
IHORI, T., I. C. BURKE, W. K. LAUENROTH, AND D. P. COFFIN. 1995. Effect of cultivationand abandonment on soil organic matter in northeastern Colorado. SoilScience Society of America Journal 59:1112–1119.
INOUE, Y., AND J. PENUELAS. 2006. Relationship between light use efficiency andphotochemical reflectance index in soybean leaves as affected by soil watercontent. International Journal of Remote Sensing 27:5109–5114.
106 Rangeland Ecology & Management
INSTITUTO NACIONAL DE TECNOLOGıA AGROPECUARIA. 1989. Mapa de suelos de la provinciade Buenos Aires—Escala 1:500.000. Buenos Aires, Argentina: InstitutoNacional de Tecnologıa Agropecuaria. 513 p.
JACKSON, R. B., J. L. BANNER, E. G. JOBBAGY, W. T. POCKMAN, AND D. H. WALL. 2002.Ecosystem carbon loss with woody plant invasion of grasslands. Nature418:623–626.
JOBBAGY, E. G., AND R. JACKSON. 2000. The vertical distribution of soil organic carbonand its relation to climate and vegetation. Ecological Applications 10:423–436.
JOBBAGY, E. G., AND R. JACKSON. 2003. Patterns and mechanisms of soil acidifi-cation in the conversion of grasslands to forests. Biogeochemistry 54:205–229.
JOBBAGY, E. G., AND R. JACKSON. 2004. Groundwater use and salinization withgrassland a forestation. Global Change Biology 10:1299–1312.
JOBBAGY, E. G., J. M. PARUELO, G. PINEIRO, D. PINEIRO, M. CARAMBULA, V. MORENA,V. SARLI, AND A. ALTESOR. 2005. Climate and land-use controls on ecosystemfunctioning: challenges and insights from the South. In: Annual report 2003–2004. San Jose dos Campos, Brazil: Inter-American Institute for GlobalChange. p. 47–61.
JOBBAGY, E. G., M. VASALLO, K. A. FARLEY, G. PINEIRO, M. F. GARBULSKY, M. D. NOSETTO,R. B. JACKSON, AND J. M. PARUELO. 2006. Forestacion en pastizales: hacia unavision integral de sus oportunidades y costos ecologicos. Agrociencias10:109–124.
JUSTICE, C. O., J. R. G. TOWNSHEND, E. F. VERMOTE, E. MASUOKA, R. E. WOLFE, N. SALEOUS,D. P. ROY, AND J. T. MORISETTE. 2002. An overview of MODIS Land dataprocessing and product status. Remote Sensing of Environment 83:3–15.
KIRSCHBAUM, M. U. F., L. B. GUO, AND R. M. GIFFORD. 2008. Observed and modelledsoil carbon and nitrogen changes after planting a Pinus radiata stand ontoformer pasture. Soil Biology and Biochemistry 40:247–257.
LAL, R. 2004. Soil carbon sequestration to mitigate climate change. Geoderma123:1–22.
LAUENROTH, W. K. 1979. Grassland primary production: North American grasslandsin perspective. In: N. R. French [ED.]. Perspectives in grassland ecology.Ecological studies, volume 32. New York, NY, USA: Springer-Verlag. p. 3–24.
LAUENROTH, W. K. 2000. Methods of estimating belowground net primaryproduction. In: O. E. Sala [ED.]. Methods in ecosystem science. New York,NY, USA: Springer-Verlag. p. 58–71.
LAUENROTH, W. K., H. E. EPSTEIN, J. M. PARUELO, I. C. BURKE, M. R. AGUIAR, AND
O. E. SALA. 2004. Potential effects of climate change on the temperate zones ofNorth and South America. Revista Chilena de Historia Natural 77:439–453.
MCDANIEL, P. A., AND L. C. MUNN. 1985. Effect of temperature on organic carbon-texture relationships in Mollisols and Aridisols. Soil Science Society ofAmerica Journal 49:1486–1489.
MCNAUGHTON, S. J., D. G. MILCHUNAS, AND D. A. FRANK. 1996. How can net primaryproductivity be measured in grazing ecosystems? Ecology 77:974–977.
MCNAUGHTON, S. J., O. E. SALA, AND M. OESTERHELD. 1993. Comparative ecology ofAfrican and South American arid to subhumid ecosystems. In: P. Goldbarat[ED.]. Biological relationships between Africa and South America. New Haven,CT, USA: Yale University Press. p. 548–567.
MEYER, W. B., AND B. L. TURNER. 1994. Changes in land use and land cover: aglobal perspective. Cambridge, United Kingdom: University of CambridgePress. 513 p.
MILCHUNAS, D. G., AND W. K. LAUENROTH. 1992. Carbon dynamics and estimates ofprimary production by harvest, C14 dilution and C14 turnover. Ecology73:593–607.
MILCHUNAS, D. G., AND W. K. LAUENROTH. 1993. Quantitative effects of grazing onvegetation and soils over a global range of environments. EcologicalMonographs 63:327–366.
MILCHUNAS, D. G., O. E. SALA, AND W. K. LAUENROTH. 1988. A generalized model of theeffects of grazing by large herbivores on grassland community structure.American Naturalist 132:87–106.
MONTEITH, J. L. 1972. Solar radiation and productivity in tropical ecosystems.Journal of Applied Ecology 9:747–766.
MOSIER, A., D. SCHIMEL, D. VALENTINE, K. BRONSON, AND W. J. PARTON. 1991. Methaneand nitrous oxide fluxes in native, fertilized and cultivated grasslands. Nature350:330–332.
NOSETTO, M. D., E. G. JOBBAGY, AND J. M. PARUELO. 2005. Land-use change and waterlosses: the case of grassland afforestation across a soil textural gradient incentral Argentina. Global Change Biology 11:1101–1117.
NOUVELLON, Y., D. LO SEEN, S. RAMBAL, A. BEGUE, M. S. MORAN, Y. KERR, AND J. QI.2000. Time course of radiation use efficiency in a shortgrass ecosystem:consequences for remotely sensed estimation of primary production. RemoteSensing of Environment 71:43–55.
OESTERHELD, M., C. DI BELLA, AND K. KERDILES. 1998. Relation between NOAA-AVHRRsatellite data and stocking rate of rangelands. Ecological Applications8:207–212.
OESTERHELD, M., AND R. J. LEON. 1987. El envejecimiento de las PasturasImplantadas: su efecto en la productividad primaria. Turrialba 37:29–35.
OESTERHELD, M., J. LORETI, M. SEMMARTIN, AND J. PARUELO. 1999. Grazing, fire andclimate effects on primary productivity of grasslands and savannas. In:L. Walker [ED.]. Ecosystems of disturbed ground. Amsterdam, the Nether-lands: Elsevier. p. 287–306.
OESTERHELD, M., J. LORETI, M. SEMMARTIN, AND O. E. SALA. 2001. Inter-annual variationin primary production of a semi-arid grassland related to previous-yearproduction. Journal of Vegetation Science 12:137–142.
OESTERHELD, M., AND S. J. MCNAUGHTON. 2000. Herbivory in terrestrial ecosystems.In: O. E. Sala, R. B. Jackson, H. A. Mooney, and R. W. Howarth [EDS.].Methods in ecosystem science. New York, NY, USA: Springer. p. 151–157.
OESTERHELD, M., O. SALA, AND S. J. MCNAUGHTON. 1992. Effect of animal husbandry onherbivore-carrying capacity at a regional scale. Nature 356:234–236.
PARTON, W. J., D. S. SCHIMEL, AND C. V. COLE. 1987. Analysis of factors controllingsoil organic matter levels in Great Plains Grasslands. Soil Science Society ofAmerican Journal 51:1173–1179.
PARUELO, J. M., H. E. EPSTEIN, W. K. LAUENROTH, AND I. C. BURKE. 1997. ANPPestimates from NDVI for the central grassland region of the United States.Ecology 78:953–958.
PARUELO, J. M., E. G. JOBBAGY, M. OESTERHELD, R. A. GOLLUSCIO, AND M. R. AGUIAR.2007. The grasslands and steppes of Patagonia and the Rıo de la Plataplains. In: T. Veblen and K. Young [EDS.]. The physical geography ofSouth America. Oxford, United Kingdom: Oxford University Press. p. 232–249.
PARUELO, J. M., E. JOBBAGY, O. E. SALA, W. K. LAUENROTH, AND I. C. BURKE. 1998.Functional and structural convergence of temperate grassland and shrublandecosystems. Ecological Applications 8:194–206.
PARUELO, J. M., AND W. K. LAUENROTH. 1996. Relative abundance of plant form typesin grasslands and shrublands of North America. Ecological Applications6:1212–1224.
PARUELO, J. M., W. K. LAUENROTH, I. C. BURKE, AND O. E. SALA. 1999. Grasslandprecipitation use efficiency varies across a resource gradient. Ecosystems2:64–68.
PARUELO, J. M., W. K. LAUENROTH, H. EPSTEIN, I. BURKE, M. R. AGUIAR, AND O. E. SALA.1995. Regional climatic similarities in the temperate zones of North and SouthAmerica. Journal of Biogeography 22:2689–2699.
PARUELO, J. M., M. OESTERHELD, C. M. DI BELLA, M. ARZADUM, J. LAFONTAINE, M. CAHUEPE,AND C. M. REBELLA. 2000. Estimation of primary production of subhumidrangelands from remote sensing data. Applied Vegetation Science 3:189–195.
PAUL, K. I., P. J. POLGLASE, N. J. NYAKUENGAMA, AND P. K. KHANNA. 2002. Change in soilcarbon following afforestation. Forest Ecology and Management154:395–407.
PEREZ, C. A., AND J. L. FRANGI. 2000. Grassland biomass dynamics along analtitudinal gradient in the Pampa. Journal of Range Management 53:518–528.
PINEIRO, G., M. OESTERHELD, AND J. M. PARUELO. 2006a. Seasonal variation inaboveground production and radiation use efficiency of temperate rangelandsestimated through remote sensing. Ecosystems 9:357–373.
PINEIRO, G., J. M. PARUELO, E. JOBBAGY, R. JACKSON, AND M. OESTERHELD. 2009. Grazingeffects on belowground C and N stocks along a gradient of cattle exclosures intemperate and subtropical grasslands of South America. Global Biogeochem-ical Cycles 23 (in press).
PINEIRO, G., J. M. PARUELO, AND M. OESTERHELD. 2006b. Potential long-term impactsof livestock introduction on carbon and nitrogen cycling in grasslands ofSouthern South America. Global Change Biology 12:1267–1284.
63(1) January 2010 107
PIZZIO, R. M. 2001. Caracterizacion y uso del recurso forrajero de la unidadexperimental de crıa vacuna de la EEA Mercedes. In: Dıa de Campo: 10 anos,Unidad Experimental de Crıa Vacuna (1990–2000). Corrientes, Argentina:Instituto Nacional de Tecnologıa Agropecuaria, Estacion ExperimentalAgropecuaria Mercedes. 113 p.
PLATERO, H., J. OTERO, J. AGUERRE, R. AGELAGUET, AND M. ERRAMIN. 2001.Caracterizacion de la produccion de mejoramientos extensivos con LotusRincon en campos de Basalto. In: Utilizacion y Manejo de MejoramientosExtensivos con Ovinos. Montevideo, Uruguay: Secretariado Uruguayo de laLana. p. 42–56.
POTTER, C. S., J. T. RANDERSON, C. B. FIELD, P. A. MATSON, P. M. VITOUSEK, H. A. MOONEY,AND S. A. KLOOSTER. 1993. Terrestrial ecosystem production: a process modelbased on global satellite and surface data. Global Biogeochemical Cycles7:811–841.
PRINCE, S. D. 1991. A model of regional primary production for use with coarseresolution satellite data. International Journal of Remote Sensing 12:1313–1330.
PUCHETA, E., I. BONAMICI, M. CABIDO, AND S. DIAZ. 2004. Below-ground biomass andproductivity of a grazed site and a neighboring ungrazed exclosure in agrassland in central Argentina. Austral Ecology 29:201–208.
RODRIGUEZ, C., E. LEONI, F. LEZAMA, AND A. ALTESOR. 2003. Temporal trends in speciescomposition and plant traits in natural grasslands of Uruguay. Journal ofVegetation Science 14:433–440.
ROUSE, J. W., JR., R. H. HAAS, J. A. SCHELL, AND D. W. DEERING. 1973. Monitoringvegetation systems in the great plains with ERTS. In: Proceedings of the 3rdERTS Symposium, NASA SP-351 1. Washington, DC, USA: US GovernmentPrinting Office. p. 309–317.
RUIMY, A., B. SAUGIER, AND G. DEDIEU. 1994. Methodology for the estimation ofterrestrial net primary production from remotely sensed data. Journal ofGeophysical Research 99:5263–5283.
RUNNING, S., P. THORNTON, R. NEMANI, AND J. GLASSY. 2000. Global terrestrial grossand net primary productivity from the Earth Observing System. In: O. E. Sala,R. B. Jackson, H. A. Mooney, and R. W. Howarth [EDS.]. Methods in ecosystemscience. New York, NY, USA: Springer. p. 44–57.
RUSCH, G. M., AND M. OESTERHELD. 1997. Relationship between productivity andspecies and functional group diversity in grazed and non-grazed Pampasgrasslands. Oikos 78:519–526.
SALA, O. E., AND A. T. AUSTIN. 2000. Methods of estimating aboveground net primaryproductivity. In: O. E. Sala, R. B. Jackson, H. A. Mooney, and R. W. Howarth [EDS.].Methods in ecosystem science. New York, NY, USA: Springer. p. 31–43.
SALA, O. E., V. A. DEREGIBUS, T. SCHLICHTER, AND H. ALIPPE. 1981. Productivitydynamics of a native temperate grassland in Argentina. Journal of RangeManagement 34:48–51.
SALA, O. E., W. PARTON, L. JOYCE, AND W. LAUENROTH. 1988. Primary production of thecentral grassland region of the United States. Ecology 69:40–45.
SALDANHA, S. 2005. Manejo del pastoreo en Campos naturales sobre suelos mediosde basalto y suelos arenosos de cretacico. In: Seminario de actualizaciontecnica en manejo de campo natural, Montevideo. Montevideo, Uruguay. SerieTecnica INIA 151. p. 75–84.
SCURLOCK, J. M. O., K. JOHNSON, AND R. J. OLSON. 2002. Estimating net primaryproductivity from grassland biomass dynamics measurements. Global ChangeBiology 8:736–753.
SELLERS, P. J., J. A. BERRY, G. J. COLLATZ, C. B. FIELD, AND F. G. HALL. 1992. Canopyreflectance, photosynthesis and transpiration III. A reanalysis using improvedleaf models and a new canopy integration scheme. Remote Sensing ofEnvironment 42:187–216.
SORIANO, A. 1991. Rıo de la Plata Grasslands. In: R. T. Coupland [ED.]. Naturalgrasslands: introduction and Western Hemisphere. Amsterdam, the Nether-lands: Elsevier. p. 367–407.
‘t MANNETJE, L., AND K. P. HAYDOCK. 1963. The dry-weight-rank method for the botanicalanalysis of pasture. Journal of the British Grassland Society 18:268–275.
TUCKER, C. J. 1980. A critical review of remote sensing and other methods for non-destructive estimation of standing crop biomass. Grass and Forage Science35:177–182.
TUCKER, C. J., J. R. G. TOWNSHEND, AND T. E. GOFF. 1985. African land-coverclassification using satellite data. Science 227:369–375.
VERON, S. R., M. OESTERHELD, AND J. M. PARUELO. 2005. Production as a function ofresource availability: slopes and efficiencies are different. Journal ofVegetation Science 16:351–354.
VITOUSEK, P. M., H. A. MOONEY, J. LUBCHENCO, AND J. M. MELILLO. 1997. Humandomination of Earth’s ecosystems. Science 277:494–499.
WIEGAND, T., H. A. SNYMAN, K. KELLNER, AND J. M. PARUELO. 2004. Do grasslands havea memory: modeling phytomass production of a semiarid South Africangrassland. Ecosystems 7:243–258.
108 Rangeland Ecology & Management