Magnetic manipulation of nanostructures - Radboud Repository
173
PDF hosted at the Radboud Repository of the Radboud University Nijmegen The following full text is a publisher's version. For additional information about this publication click this link. http://hdl.handle.net/2066/141373 Please be advised that this information was generated on 2022-07-24 and may be subject to change.
-
Upload
khangminh22 -
Category
Documents
-
view
0 -
download
0
Transcript of Magnetic manipulation of nanostructures - Radboud Repository

PDF hosted at the Radboud Repository of the Radboud University
Nijmegen
The following full text is a publisher's version.
For additional information about this publication click this link.
http://hdl.handle.net/2066/141373
Please be advised that this information was generated on 2022-07-24 and may be subject to
change.

Magnetic manipulation of nanostructures
P.G. (Peter) van Rhee

Magnetic manipulation of nanostructuresP.G. van RheeThesis Radboud Universiteit Nijmegen - IllustratedWith references - With summary in DutchCover: Artist’s impression of two rotated vials, containingdispersed nanostructures, situated in a magnetic field.Design by Hans Engelkamp, edited by the author.

Magnetic manipulation of nanostructures
Proefschrift
ter verkrijging van de graad van doctoraan de Radboud Universiteit Nijmegen
op gezag van de rector magnificus prof. dr. Th.L.M. Engelen,volgens besluit van het college van decanen
in het openbaar te verdedigen op vrijdag 19 juni 2015,om 16:30 uur precies
door
Petrus Gerardus van Rhee
geboren op 4 januari 1986te Boxmeer (Nederland)

Promotoren: Prof. dr. ir. J. C. Maan
Prof. dr. P.C.M. Christianen
Copromotor: Dr. H. Engelkamp
Manuscriptcommissie: Prof. dr. E. Vlieg
Prof. dr. R.J.M. Nolte
Prof. dr. L. Monsu Scolaro(Universita di Messina, Italy)
Het werk beschreven in dit proefschrift is uitgevoerd aan de Faculteit der Natuurwetenschap-
pen, Wiskunde en Informatica van de Radboud Universiteit Nijmegen en maakt deel uit van
het onderzoekprogramma van de Stichting voor Fundamenteel Onderzoek der Materie (FOM),
die deel uitmaakt van de Nederlandse Organisatie voor Wetenschappelijk Onderzoek (NWO).

Aan mijn familie
De hemel geeft,wie vangt die heeft.Toon Hermans

vi

Contents
1 Introduction 1
References . . . . . . . . . . . . . . . . . . . . . . . . . . . . . . . . . . 5
2 Optically probing of magnetic manipulation: theory and appli-cation. 7
2.1 Introduction . . . . . . . . . . . . . . . . . . . . . . . . . . . . . . 8
2.2 Magnetism . . . . . . . . . . . . . . . . . . . . . . . . . . . . . . 8
2.3 Magnetic field-induced levitation . . . . . . . . . . . . . . . . . . 10
2.4 Magnetic field-induced alignment . . . . . . . . . . . . . . . . . . 13
2.5 Magnetic order parameter . . . . . . . . . . . . . . . . . . . . . . 16
2.6 Depolarization of nano-sized objects . . . . . . . . . . . . . . . . 17
2.7 Demagnetization . . . . . . . . . . . . . . . . . . . . . . . . . . . 21
2.8 Depolarization example: optical properties of colloidal gold . . . 24
2.9 Experimental setup: rotation experiments . . . . . . . . . . . . . 29
2.10 Experimental setup: magnetic field induced alignment . . . . . . 33
References . . . . . . . . . . . . . . . . . . . . . . . . . . . . . . . . . . 42
3 Selection of supramolecular chirality by rotational and mag-netic forces 47
3.1 Introduction . . . . . . . . . . . . . . . . . . . . . . . . . . . . . . 48
3.2 True and false chirality . . . . . . . . . . . . . . . . . . . . . . . . 49
3.3 Experimental methods . . . . . . . . . . . . . . . . . . . . . . . . 51
3.4 Chiral selection . . . . . . . . . . . . . . . . . . . . . . . . . . . . 56
3.5 Magnetic alignment . . . . . . . . . . . . . . . . . . . . . . . . . 59
3.6 Discussion . . . . . . . . . . . . . . . . . . . . . . . . . . . . . . . 60
3.7 Conclusion . . . . . . . . . . . . . . . . . . . . . . . . . . . . . . 63
References . . . . . . . . . . . . . . . . . . . . . . . . . . . . . . . . . . 63
vii

4 Robustness of supramolecular enantioselection and its scalingwith the chiral force 67
4.1 Introduction . . . . . . . . . . . . . . . . . . . . . . . . . . . . . . 68
4.2 Sample preparation and experimental set-up . . . . . . . . . . . . 69
4.3 Evolution of the CD spectrum towards thermodynamic equilibrium 70
4.4 Chiral selection . . . . . . . . . . . . . . . . . . . . . . . . . . . . 73
4.5 Temperature influences . . . . . . . . . . . . . . . . . . . . . . . . 75
4.6 Kinetic control of chirality . . . . . . . . . . . . . . . . . . . . . . 78
4.7 Rotation frequency dependence . . . . . . . . . . . . . . . . . . . 80
4.8 Magnetic scaling of chiral selection . . . . . . . . . . . . . . . . . 83
4.9 Discussion . . . . . . . . . . . . . . . . . . . . . . . . . . . . . . . 85
4.10 Conclusion . . . . . . . . . . . . . . . . . . . . . . . . . . . . . . 87
References . . . . . . . . . . . . . . . . . . . . . . . . . . . . . . . . . . 88
5 Unraveling the effect of the distinct forces within the selectionof supramolecular chirality 91
5.1 Introduction . . . . . . . . . . . . . . . . . . . . . . . . . . . . . . 92
5.2 Experimental details . . . . . . . . . . . . . . . . . . . . . . . . . 93
5.3 The influence of rotation in the absence of a magnetic field . . . 97
5.4 Chiral selection and the effect of field time . . . . . . . . . . . . . 98
5.5 Delayed application of magnetic field . . . . . . . . . . . . . . . . 101
5.6 Delayed application of magnetic field and rotation . . . . . . . . 102
5.7 Discussion . . . . . . . . . . . . . . . . . . . . . . . . . . . . . . . 104
5.8 Conclusion . . . . . . . . . . . . . . . . . . . . . . . . . . . . . . 107
References . . . . . . . . . . . . . . . . . . . . . . . . . . . . . . . . . . 107
6 Polymersome magneto-valves for reversible capture and releaseof nanoparticles 111
6.1 Introduction . . . . . . . . . . . . . . . . . . . . . . . . . . . . . . 112
6.2 Sample preparation and experimental set-up . . . . . . . . . . . . 114
6.3 Magnetic deformation of empty stomatocytes . . . . . . . . . . . 115
6.4 Mechanism of the magnetic valve. . . . . . . . . . . . . . . . . . . 118
6.5 Remote capture and release with the magnetic valve . . . . . . . 120
6.6 Discussion: future application . . . . . . . . . . . . . . . . . . . . 124
6.7 Conclusion . . . . . . . . . . . . . . . . . . . . . . . . . . . . . . 125
References . . . . . . . . . . . . . . . . . . . . . . . . . . . . . . . . . . 125
7 Giant magnetic susceptibility of gold nanorods 129
7.1 Introduction . . . . . . . . . . . . . . . . . . . . . . . . . . . . . . 130
7.2 Samples and experimental details . . . . . . . . . . . . . . . . . . 131
viii

7.3 Experimental results . . . . . . . . . . . . . . . . . . . . . . . . . 1347.4 Discussion . . . . . . . . . . . . . . . . . . . . . . . . . . . . . . . 1427.5 Conclusion . . . . . . . . . . . . . . . . . . . . . . . . . . . . . . 143References . . . . . . . . . . . . . . . . . . . . . . . . . . . . . . . . . . 144
Summary 147
Summary 151
List of Publications 159
Curriculum Vitae 161
ix

x

Chapter 1
Introduction
Manipulation on a nanoscale
‘There is plenty of room at the bottom’; this was the title of a talk in 1959 givenby Richard Feynmann [1]. He gave a speech about the enormous potential ofmanipulating and controlling objects on a small, i.e. nanometer, scale. Moststriking was his prediction of miniaturising the known visible world into the yetundiscovered nanoworld. Some of his predictions turned out quite successful,including the visualisation and placement of single atoms on a surface [2] and thecontinuous miniaturization of the computer (chips) by an exponential increasein transistor density in time, which was later described by Moore’s law [3].However, the most intriguing predictions for future applications were foreseenin organic compounds. Nature itself is capable of performing extremely complextasks: a cell, for instance, is like a microfactory, able to complete complicatedtasks and even reproduce itself. The interior of cells consists of a great varietyof (nano) objects with very specific functionalities. A natural biomotor forinstance, is a widely studied nanostructure. Such natural components serveas an inspiration to make new artificial functionalities by using a bottom-upapproach. Current applications already show proof-of-principle demonstrationsof different types of artificial biomotors [4], as a first step towards an artificialmicrofactory.
To manipulate such structures during and after their fabrication, externalforces can play a crucial role. On a fundamental level, four forces can be dis-tinguished: strong nuclear forces (sub-atomic interactions), weak nuclear forces(mainly involved in radioactive decay), gravitational forces, and electromag-netic forces (due to electric and magnetic fields). The first two act on a rathershort length scale (< 1 nm) and mainly play a role within and in betweenatoms. The latter two forces are dominant on much larger length scales. Grav-
1

1 Introduction
ity is a long-range force, which is present everywhere on Earth. It acts on verylarge objects (planets), but can also have an influence on a microscopic scale.Magnetic and electric fields are widely present, both on a large scale (Earth’smagnetic field and electrical lighting) and on a nanoscale (magnetic data stor-age and electronics). Together they are the driving force behind the moderndigital world.
Magnetic manipulation of nanostructures
Magnetic fields and gravity are special when compared to electric fields andelectromagnetic radiation. Both provide homogeneous forces, which are ther-modynamically stable and typically non-destructive giving rise to reversibleeffects. Whereas gravity is hard to modify and quite weak on a molecular scale,a magnetic field can be tuned in strength, place, direction and time. Magneticfield effects are commonly connected to ferromagnetic materials, which can havepermanent magnetic fields. However, all materials have also a weak diamag-netic component. Magnetic fields induce a relatively small opposing magneticmoment in diamagnetic materials, which results in a repelling force. In highmagnetic fields, these forces can be significant and can be used to manipulateall kinds of materials that are usually considered non-magnetic. Smart com-binations of magnetic fields and diamagnetic materials have shown numerousmagnetic field-induced effects including levitation [5,6], material separation [7],triaxial alignment [8], and recently even exact triaxial positioning [9]. Theseexamples relate to macroscopic properties, which are easily visualized in situ,employing structures much larger (> 1 µm) than the wavelength of visible light.More challenging is the characterization of structures which are no longer visiblewith normal microscopes, i.e. structures on a nanoscale (< 1 µm).
Magnetic alignment is a useful tool to characterize and manipulate the prop-erties of rigid nanostructures, i.e. structures which do not deform under theinfluence of a magnetic field. Liquid crystals for instance, are easily alignedwith a magnetic field [10]. Moreover, by polymerizing magnetically alignedliquid crystals, special optical or electrical structures can be made. Some ex-amples include strongly polarized crystals [11] and functionalized field-effecttransistors [12].
The review of Maret and Dransfeld in 1985 provided the first extensiveoverview on the magnetic alignment of biomaterials, which consist of a widevariety of anisotropic molecular components [13]. Since then, magnetic orien-tation is well known for many materials and is commonly detected by theiranisotropic optical properties. Over the past ten years research at the HFMLhas focused on a relatively new area, i.e. the magnetic orientation and manip-
2

ulation of molecular aggregates [14,15].
Single molecules are too small for magnetic alignment due to the dominantBrownian motion. Large molecular aggregates in contrast, which have a largermagnetic moment, can be aligned easily. Molecular aggregates are held togetherby a complex interplay of intermolecular interactions like van der Waals forcesand hydrogen bonds. These forces are strong enough to make molecules self-assemble, but can be weak enough to be influenced by an external force.
For relatively rigid molecular aggregates, a careful investigation of magneticalignment by using the known (or estimated) optical properties gives usefulinformation on the size or structure of such molecular aggregates [16]. Moreover,it provides an in situ tool to probe the size or shape changes of molecularaggregates [17, 18]. On the other hand, if the nanostructures have a fixed sizeand structure, magnetic alignment provides a tool to determine the anisotropicmagnetization.
Dynamic molecular aggregates in contrast, can be modified by a magneticfield. Successful examples include the rigidification of thiacyanine fibers [15],and the deformation of spherical sexithiophene aggregates [19]. These examplesshow that the magnetic field rearranges the molecules inside the structure.This opens up the possibility of designing functionalized membranes, with ahigh magnetic anisotropy, that can reversibly deform. Moreover, in the self-assembly or nucleation stage of a delicate chemical self-assembly, a magneticfield can direct the growth to a different structure. This would be the ultimateexample of using external forces, to control and manipulate objects on a small(nano) scale.
Aim and outline of this thesis
In this work we manipulate nanostructures using high magnetic fields. We showthat magnetic forces can have a large impact on a nanoscale. To this end, weuse materials with a large magnetic anisotropy in shape or in structure. Theseproperties give rise to multiple magnetic manipulation techniques. Magneticfields are able to align nano-objects. When size and structure are preciselyknown, the magnetic moment can be determined. Field-induced alignment ofmetallic nanorods highlights the important role of shape-induced effects in suchcolloids.
The properties of small molecular aggregates, however, are dominated by theanisotropy of the constituent molecules. Self-assembled anisotropic molecules,like flat disks or long polymers, show magnetic alignment inside a high mag-netic field. Therefore, magnetic fields can align and bend membranes, whichconsist out of long anisotropic polymers. This property is successfully used to
3

1 Introduction
show the use of external forces to reversibly control and modify functionalizedvalves. Furthermore, we show that magnetic manipulation can influence the(irreversible) aggregation or nucleation of molecular aggregates. By employingmagnetic fields (only) at the start of a self-assembly process, small energy dif-ferences can lead to strongly amplified properties; an excellent example of theuse of external forces to control and manipulate the nucleation of a molecularassembly.
This thesis starts with the theory of levitation- and orientation forces onnano-objects (chapter 2). The anisotropy in shape and internal structure ofnanostructures influences both the optical and magnetic properties. The mag-netic alignment is sensitively measured by optical techniques, such as linear bire-fringence and linear dichroism, which are extensively described. Gold nanorods– which have a strong depolarization and demagnetization – are used as a modelsystem.
The aim of this thesis is the fundamental understanding of the influencethat magnetic fields can have on growing molecular assemblies, which is shownin chapters 3-5. Porphyrins are relatively flat disk-like molecules that canstack into large aggregates with a specific structure. We will show that thesupramolecular aggregation of porphyrins into either left-handed or right-handednanostructures, can be directed by using rotation inside a high magnetic field.In this system, supramolecular chirality is determined by the relative directionsof rotation and magnetically tuned effective gravity, but the magnetic orien-tation of the aggregates is also essential. During the molecular aggregationof porphyrins, small energy differences result in different growth trajectoriesresulting in different types of aggregates. This shows how external forces canmanipulate objects on a nanoscale.
In chapter 6 we show the successful manipulation of self-assembled mem-branes into a functionalized ‘magneto-valve’. These membranes consist outof long magnetically anisotropic polymers and self-assemble into nanocapsuleswith a small opening. High magnetic fields deform such a membrane, whichresults in a reversible opening and closing of the opening. With this ‘magneto-valve’ we demonstrate the huge potential that magnetic fields have to offer withrespect to functionalized membranes.
Finally, in chapter 7 we demonstrate that magnetic alignment is a sensi-tive technique to measure the magnetic moment of metallic colloids. Due tothe unique shape properties, which are caused by the confined electrons on thesurface, the average orientation can be determined. Since the shape and sizeare exactly known from electron microscopy images, the magnetic susceptibil-ity is accurately determined. This method is sensitive for low concentrationsand gives unique information about the anisotropic magnetic properties of sus-
4

References
pended metallic colloids.
References
[1] R. Feynman J. Microelectromech. Syst. 1, 60–66 (1992).
[2] D. M. Eigler and E. K. Schweizer Nature 344, 524–526 (1990).
[3] G. Moore Electronics 38, 114–117 (1965).
[4] M. G. L. van den Heuvel and C. Dekker Science 317, 333–336 (2007).
[5] M. V. Berry and A. K. Geim Eur. J. Phys. 18, 307 (1997).
[6] E. Beaugnon and R. Tournier Nature 349, 470–470 (1991).
[7] Y. Ikezoe, N. Hirota, J. Nakagawa, and K. Kitazawa Nature 393, 749–750(1998).
[8] T. Kimura, M. Yoshino, T. Yamane, M. Yamato, and M. Tobita Langmuir20, 5669–5672 (2004).
[9] A. B. Subramaniam, D. Yang, H.-D. Yu, A. Nemiroski, S. Tricard, A. K.Ellerbee, S. Soh, and G. M. Whitesides PNAS 111, 12980–12985 (2014).
[10] P. G. de Gennes, The Physics of Liquid crystals. Oxford University Press,Oxford (1974).
[11] M. I. Boamfa, K. Viertler, A. Wewerka, F. Stelzer, P. C. M. Christianen,and J. C. Maan Phys. Rev. Lett. 90, 025501 (2003).
[12] I. O. Shklyarevskiy, P. Jonkheijm, N. Stutzmann, D. Wasserberg, H. J.Wondergem, P. C. M. Christianen, A. P. H. J. Schenning, D. M. de Leeuw,Z. Tomovic, J. Wu, K. Mllen, and J. C. Maan J. Am. Chem. Soc. 127,16233–16237 (2005).
[13] G. Maret and K. Dransfeld, Strong and ultrastrong magnetic fields andtheir applications Ch. 3. Berlin: Springer-Verlag (1985).
[14] I. O. Shklyarevskiy, Deformation and ordering of molecular assemblies inhigh magnetic fields. PhD thesis, Radboud University Nijmegen (2005).
[15] J. C. Gielen, Supramolecular aggregates in high magnetic fields. PhD thesis,Radboud University Nijmegen (2010).
5

1 Introduction
[16] J. C. Gielen, I. O. Shklyarevskiy, A. P. H. J. Schenning, P. C. M. Chris-tianen, and J. C. Maan Sci. Technol. Adv. Mater. 10, 014601 (2009).
[17] J. C. Gielen, I. O. Shklyarevskiy, A. P. H. J. Schenning, P. C. M. Chris-tianen, and J. C. Maan Sci. Technol. Adv. Mater. 10, 014601 (2009).
[18] R. S. M. Rikken, H. H. M. Kerkenaar, R. J. M. Nolte, J. C. Maan, J. C.M. v. Hest, P. C. M. Christianen, and D. A. Wilson Chem. Commun. 50,5394–5396 (2014).
[19] I. O. Shklyarevskiy, P. Jonkheijm, P. C. M. Christianen, A. P. H. J.Schenning, E. W. Meijer, O. Henze, A. F. M. Kilbinger, W. J. Feast,A. Del Guerzo, J.-P. Desvergne, and J. C. Maan J. Am. Chem. Soc. 127,1112–1113 (2005).
6
Chapter 2
Optically probing of magneticmanipulation: theory andapplication.
Abstract
Diamagnetic materials can be manipulated using high magneticfields. In this chapter it is shown that a magnetic field gradient cre-ates levitation forces on diamagnetic materials. Orientation forcesresult in magnetic alignment, which is measured in a homogeneousmagnetic field (in absence of levitation). A theoretical and exper-imental overview of the basic electric and magnetic properties ofnanostructures is given. These properties are dominated by shape-and composition contributions. Optical techniques are used to vi-sualize and probe the magnetic manipulation. Gold nanorods willbe used as an example, which permits us to compare the differentoptical techniques.
7

2 Optically probing of magnetic manipulation: theory and application.
2.1 Introduction
Isotropic objects in a gradient magnetic field experience a magnetic force, whicheither attracts or repels the object with respect to regions of high magnetic field.An example is magnetic levitation, which was shown to levitate water dropletsand frogs [1, 2]. This is a powerful illustration of the fact that all matter hasmagnetic properties. Anisotropic (shaped or structured) objects also experiencemagnetic field induced orientation forces [3]. These alignment properties arestudied in a homogeneous magnetic field, in the absence of a magnetic fieldgradient, i.e. in absence of levitation forces. Magnetic alignment can be welldescribed by a magnetic order parameter, which can be probed with opticaltechniques.
Our method of optically probing magnetic field-induced alignment uses theanisotropy in either the structure and/or shape of the object. Molecular aggre-gates, for instance, are often build from anisotropic molecules, which results instrongly anisotropic optical (polarization) and magnetic (magnetization) prop-erties. Here, the magnetic anisotropy causes field-induced alignment, whichcan often be measured measured by its optical anisotropy [3–8]. However, forisotropic materials, overall shape factors can be become dominant in the opticaland/or magnetic properties [9, 10].
The optical probing of field induced alignment uses the anisotropy in eitherthe real or complex part of the refractive index. The simplest optical method forprobing alignment is polarized absorbance, which is a straightforward technique,when the absorbance changes are large. More sensitive techniques use a phase-modulator, which results in a better signal to noise due to the use of an intensityindependent signal [11]. It is used to probe either the differential refractiveindex (linear birefringence) or the differential absorbance (linear dichroism).This chapter concludes with a short discussion on these techniques highlightingtheir pros and cons.
2.2 Magnetism
Using (high) magnetic fields, all matter can be magnetically manipulated, evenweakly magnetic materials. A distinction can be made between induced andpermanent magnetization. The induced magnetization M is related to the totalmagnetic field B and the applied magnetic field H as:
B
µ0= M + H, (2.1)
8

2.2 Magnetism
with µ0 the vacuum permeability. The total magnetic field B thus dependson the applied, externally generated, magnetic field in combination with aninduced magnetization. The magnetization M is given by: M = χH, with χthe magnetic volume susceptibility of the material. Materials with a permanentmagnetization (M = 0 in absence of H) typically exhibit a strong magnetizationand can be either ferromagnetic, anti-ferromagnetic or ferrimagnetic. Thesematerials do not require high magnetic fields and are beyond the scope of thisthesis.
All matter shows weak (dia)magnetism in a magnetic field, caused by atiny distortion of the electron orbits in atoms or molecules. This quantummechanical distortion induces magnetic dipoles, which are opposing the exter-nal magnetic field. The result is a weak, temperature independent, negativemagnetic susceptibility (χ < 0 and |χ| ≪ 1), also known as Langevin dia-magnetism [12]. For completely filled closed shell atoms and molecules, noadditional magnetism is expected from localized electrons. In the electronicground state (J = 0), field-induced electronic transitions contribute to an ad-ditional temperature-independent paramagnetic term, which is known as VanVleck paramagnetism (χ > 0). In general, this contribution is very weak andonly marginally competes with the Langevin diamagnetism.
Localized unpaired electrons have a net magnetization due to their ‘spin’,which results in magnetic moments pointing in random directions. If all electronspins (within the atomic and molecular orbits) are paired and localized, thediamagnetic contribution is dominant. However, if an external field is applied onunpaired electrons, the unpaired spins will align with increasing magnetic field,which is known as (Brillouin) paramagnetism (χ > 0). This effect competeswith thermal motion which counteracts the alignment. In low temperaturesand high magnetic fields all magnetic moments can typically align and thetotal induced magnetization M will saturate. However at room temperature,paramagnetic materials often display a linear increase in magnetization withmagnetic field, pointing to a constant magnetic susceptibility χ.
Metals are a special case due to their non-localized conduction electrons,which have different magnetic components. Most metals are well described bya free electron gas which has both positive and negative magnetic susceptibilitycomponents. The Lorentz force induces (quantum) core-electron distortionsresulting in an opposing magnetic field and is known as Landau diamagnetism.This effect is in a balance with Pauli paramagnetism, which can be interpretedas the magnetization component on (almost) non-localized electrons (close toFermi energy). Both types of magnetism are basically temperature independentup to room temperature, because of the very high Fermi temperature of metals.
This thesis covers the manipulation of weakly magnetic materials at room
9

2 Optically probing of magnetic manipulation: theory and application.
temperature (|χ| ≪ 1), with a constant χ in high magnetic fields. An isotropicobject in an applied magnetic field B exhibits a magnetic moment m:
m =V χ
µ0B, (2.2)
with V being the volume of the object. The magnetic energy Em of a magneticmoment inside a magnetic field is equal to:
Em = −∫ B
0m · dB = −χV B2
2µ0. (2.3)
The sign of the energy is determined by the magnetic susceptibility, with χ > 0for paramagnets and χ < 0 for diamagnets. Therefore, a paramagnetic momenthas an energy minimum at maximal magnetic field and a diamagnetic momenthas an energy minimum at minimal magnetic field. High magnetic fields gener-ally have large field gradients, giving rise to large magnetic energy differences.Therefore, paramagnetic and diamagnetic materials can feel strong attractingof repelling forces, also known as levitation forces.
2.3 Magnetic field-induced levitation
Stable magnetic levitation is possible in a sufficiently strong magnetic fieldgradient in a high magnetic field. A typical field profile of a 33 T HFML Bittermagnet is sketched in Fig. 2.1(a,b) (experimental profile in Fig. 2.2). Thefield is directed along the z-axis and is maximum at the centre (z = 0) of thecylindrical bore [dashed line in Fig 2.1(b)]. It decreases towards the edges ofthe bore opening. This field leads to a magnetic force FB directed towards thefield center for a paramagnetic substance [χp > 0, Fig. 2.1(a)], because theenergy of a paramagnet decreases with field (high field seeker). In contrast, adiamagnetic material experiences a magnetic force FB directed away from thefield center [χd < 0, Fig. 2.1(a)] with the energy of a diamagnet increasingwith field (low field seeker). Although diamagnetic forces are weak in general,in high magnetic fields they are of the same order as gravitational forces. Ithas been shown that it is possible to levitate water and all kinds of organicspecies [1, 2]. Figure 2.1(c) shows a levitating frog and beer droplet inside amagnetic field. Horizontal and vertical stability is guaranteed when the totalforce F on the object goes towards a force minimum ∇ · F (r) < 0, which canbe realized for diamagnetic materials inside a cylindrical symmetric magnet offinite length [1]. Here, the total force equals F = FB(r) + FG, with FG thegravitational force and FB(r) the magnetic force which equals:
10

2.3 Magnetic field-induced levitation
FB
Fg
z
Bz
χp>0
χd<0
a) b) c)
χd<0
χp>0
Figure 2.1: (a) Sketch of the magnetic field profile. Objects with a dia-magnetic (χd) and paramagnetic (χp) susceptibility are respectively repelledfrom and attracted to the magnetic field center. (b) A diamagnetic object
can levitate above the field centre due to a balance of the magnetic (FB) and
gravitational (Fg) forces (side view). (c) Pictures of a levitating frog and beerdroplet (top view).
FB = −∇Em =V χ
µ0B(r)∇B(r), (2.4)
with B(r) = |B(r)|. The vertical levitation condition can be easily deducedwith a force balance between the magnetic force FB and the gravitational forceFG = −V ρGn, with ρ the density of the object and Gn the normal gravitationalacceleration. If FB + FG = 0 a force balance is reached, which gives:
BzdBz
dz=
ρµ0Gn
χ, (2.5)
This equation has two solutions out of which one position (the one with largestz) results in stable levitation (object levitates in a local vertical and lateralminimum: ∇ · F (r) < 0). It shows that levitation is independent of size withboth forces ∝ V , which is the case in a small volume (with constant dBz/dz).Therefore, mainly the density and the magnetic susceptibility are essential. For
11

2 Optically probing of magnetic manipulation: theory and application.
water one can calculate the levitation condition that corresponds to BzdBzdz =
−1360 T2/m, which is reached around 15 T in a 33 T Florida-Bitter magnet atthe HFML. Figure 2.2a shows the corresponding magnetic field profile Bz, aswell as Bz
dBzdz . At the stable levitation point, which is at an increasing distance
z from the field center with increasing field, the effective gravity is zero. Thisis in contrast to the magnetic field centre where the effective gravity is 1 dueto the absence of a magnetic force. The effective gravity Geff can be defined asthe normal gravity Gn plus the magnetic induced gravity GB [equal to Gn inequation (2.5)], which gives:
Geff = Gn + GB = Gn
(1−Bz
dBz
dz
χ
Gnµ0ρ
). (2.6)
-80
-60
-40
-20
0
20
40
60
80
0 5 10 15 20 25 30 35
-8000 -4000 0 4000 8000
-6 -4 -2 0 2 4 6
Magnetic Field (T)
Ver
tica
l po
sition
z (
mm
)
Bz dB
z/dz (T2/m)
15 T25 T
Effective Gravity (Gn)
33 T
a) b)
Figure 2.2: (a) The magnetic field profile (Bz, red line) as a function of thevertical position. The top scale shows the corresponding field times the fieldgradient (BzdBz/dz, blue line). (b) The effective gravity for different appliedmagnetic field as a function of the vertical position, which can vary up to 6times and down to -4 times the normal gravity in this magnet.
12

2.4 Magnetic field-induced alignment
The result is shown in Fig. 2.2(b). It shows that at 15 T the levitation positionis at about 60 mm above the magnetic field center. Increasing the field to 25T changes the levitation position towards 95 mm. A negative effective gravityis now visible around 60 mm. At 33 T the effective gravity can be enhancedup to 6 times normal gravity, and down to -4 times the normal gravity. Notethat these numbers are valid for vacuum conditions (air shows similar results).For nano materials dispersed in a relatively dense and/or magnetic mediumequation (2.6) changes to:
Geff = Gn
(1−Bz
dBz
dz
χ− χm
Gnµ0(ρ− ρm)
), (2.7)
with χm the magnetic susceptibility of the medium and ρm the density of themedium. The oxygen in air contributes to a small change in Geff (4 %). Forparamagnetic media such as pressurized oxygen [13] or liquid oxygen [14], thisresults in an enhanced magnetic force on the particles, with a force proportionalto the relative properties of χ and ρ. This effect, which is called the magneto-archimedes effect, results in levitation at much lower fields, which was shownin a 10 T superconducting magnet [13]. Furthermore, it can separate mate-rials each at their own levitation positions, thus providing a material specificseparation [14,15].
The diamagnetic levitation described in this section gives the unique oppor-tunity to study the influence of gravity on the self-assembly of aggregates. Wewill utilise this property to our advantage in chapters 3-5.
2.4 Magnetic field-induced alignment
Besides levitation, anisotropic objects also can align themselves along magneticfield lines. In this section we consider orientation forces in a homogeneousmagnetic field (at the center of the magnet) where levitation forces are absent(dBz/dz = 0). Consider an anisotropic composed object with volume V thatpossesses a magnetic moment m given by m = V
µ0χ · B. For a homogeneous
sample, the magnetic volume susceptibility tensor χ can be diagonalized as:
χ =
χxx 0 00 χyy 00 0 χzz
, (2.8)
with χii being the volume susceptibility along one principal axis. The magneticmoment of the object now depends on its orientation relative to the magnetic
13
2 Optically probing of magnetic manipulation: theory and application.
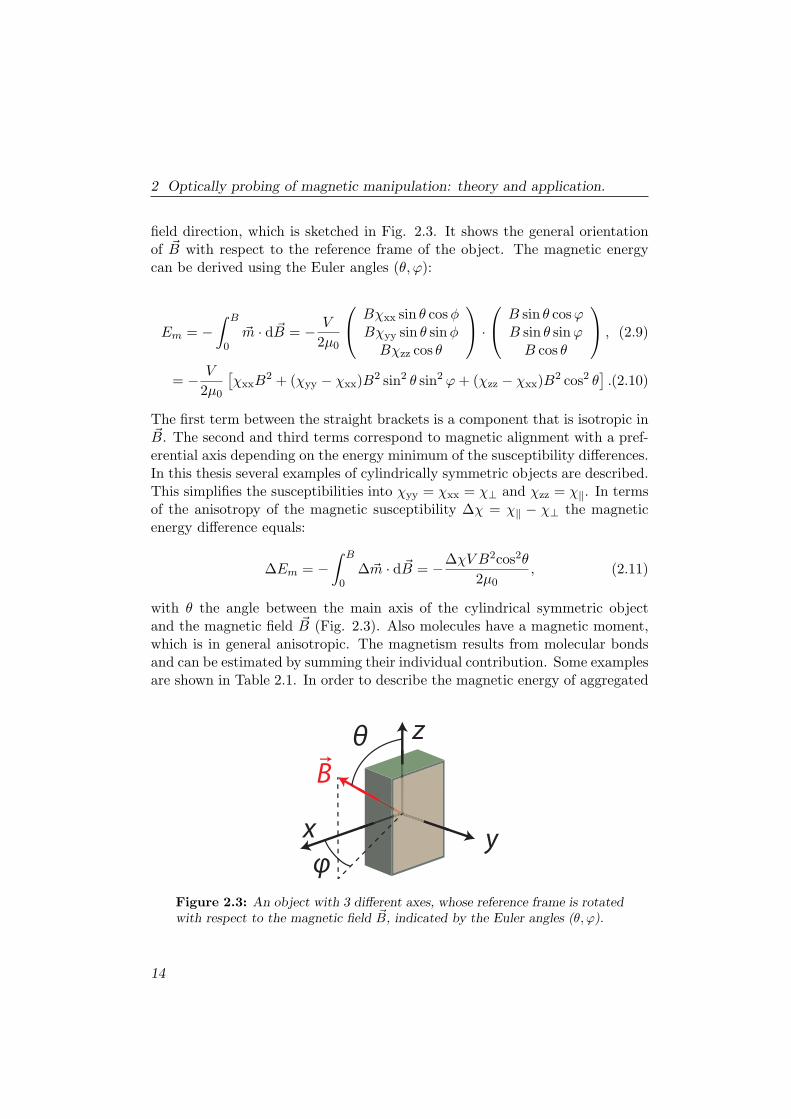
field direction, which is sketched in Fig. 2.3. It shows the general orientationof B with respect to the reference frame of the object. The magnetic energycan be derived using the Euler angles (θ, φ):
Em = −∫ B
0m · dB = − V
2µ0
Bχxx sin θ cosϕBχyy sin θ sinϕ
Bχzz cos θ
·
B sin θ cosφB sin θ sinφ
B cos θ
, (2.9)
= − V
2µ0
[χxxB
2 + (χyy − χxx)B2 sin2 θ sin2 φ+ (χzz − χxx)B
2 cos2 θ].(2.10)
The first term between the straight brackets is a component that is isotropic inB. The second and third terms correspond to magnetic alignment with a pref-erential axis depending on the energy minimum of the susceptibility differences.In this thesis several examples of cylindrically symmetric objects are described.This simplifies the susceptibilities into χyy = χxx = χ⊥ and χzz = χ∥. In termsof the anisotropy of the magnetic susceptibility ∆χ = χ∥ − χ⊥ the magneticenergy difference equals:
∆Em = −∫ B
0∆m · dB = −∆χV B2cos2θ
2µ0, (2.11)
with θ the angle between the main axis of the cylindrical symmetric objectand the magnetic field B (Fig. 2.3). Also molecules have a magnetic moment,which is in general anisotropic. The magnetism results from molecular bondsand can be estimated by summing their individual contribution. Some examplesare shown in Table 2.1. In order to describe the magnetic energy of aggregated
z
yx
B
θ
φFigure 2.3: An object with 3 different axes, whose reference frame is rotatedwith respect to the magnetic field B, indicated by the Euler angles (θ, φ).
14

2.4 Magnetic field-induced alignment
molecules it is convenient to use the molar magnetic susceptibility χm(m3/mol).
A useful substitution is: χvV = χm/NA, with NA Avogadro’s number. For onemolecule, this results in the following orientational magnetic energy:
∆Em = −∆χmB2cos2θ
2µ0NA. (2.12)
In order to magnetically align a single molecule, the magnetic energy dif-ference ∆Em should be at least of the same order as the randomizing ther-mal energy kBT . Currently, in high magnetic field installations around theworld, static magnetic fields are available up to 45 T. For strongly anisotropicmolecules such as benzene (∆χm = −750 · 10−12 m3/mol, Table 2.1) this is anorder of 104 too small to be able to align single molecules. Porphyrins are largeflat molecules which are highly anisotropic [Fig. 3.2(a)]. In comparison withbenzene molecules the magnetic anisotropy is 10 times stronger [16, 17], whichresults in a 3 orders of magnitude difference too small for alignment. There-fore an assembly of 10-100 stacked porphyrins should feel a partial alignmentforce in 25 T. Such an influence can already manipulate the self-assembly ofporphyrins (see chapters 3-5 and [18]). Saturating alignment is possible if theaggregate consists out of sufficient molecules: NEm ≥ kBT , with N the numberof molecules.
Another interesting example of magnetic manipulation is the alignmentand deformation of membranes consisting out of a large array of long poly-mers [19,20]. Chapter 6 shows the successful deformation of such a membrane.
Type of ∆χm∆EmkBT
bond/molecule 10−12 m3/mol (T=300K, B=25 T)
C-C -16.4 -3.3·10−6
C=C +103 2.0·10−5
C=O +82.9 1.7·10−5
Benzene -750 -1.5·10−4
Porphyrine -7500 -1.5·10−3
Table 2.1: A few examples of the anisotropic susceptibility (∆χm) of somemolecular bonds and molecules [3, 16,17].
15

2 Optically probing of magnetic manipulation: theory and application.
The resulting alignment and deformation will be described in the next sectionutilizing a suitable order parameter.
2.5 Magnetic order parameter
For the description of magnetic alignment and its related order parameter, weconsider objects that are dispersed in a fluid. In the absence of a magnetic fieldthese objects are randomly oriented [Fig. 2.4(a)]. When the orientational mag-netic energy ∆Em becomes comparable to the thermal energy kBT , alignmentis induced which can be optically measured (see section 2.10) by either linearbirefringence (LB) and/or linear dichroism (LD). The magnetic alignment fol-lows a Maxwell-Boltzmann distribution. Properly normalised, the distributionfunction f(θ, φ) equals:
f(θ, φ) =exp (−∆Em/kBT )∫∫
exp (−∆Em/kBT ) sin θdθdφ. (2.13)
The distribution function f(θ, φ) sin θdθdφ gives the probability of the objectto be oriented along the given Euler angles (Fig. 2.3). This distribution givesrise to an average orientation which can be measured and described by a generalorder parameter Sij, which equals [21,22]:
Sij = 1/2 < 3 cos θi cos θj − δij >, (2.14)
with i, j = x, y, z the generic cartesian axes of an object, δij the Kronecker deltafunction, and θi the angle between the applied field and the corresponding axis.If a proper reference frame is chosen (see Fig. 2.3), only diagonal terms exist.The averaged term cos2 θii ranges from 0 to 1, with cos2 θxx+cos2 θyy+cos2 θzz =1. This shows that Sxx + Syy + Szz = 0, with Sii ranging from -1/2 to 1.This order parameter can properly describe the polarizability tensor (αij), thedielectric constant tensor (ϵij), or other analogous spectroscopic properties [22].The general order parameter S of a cylindrical symmetric object equals:
S =3 < cos2 θ > −1
2=
∫∫ (3 cos2 θ − 1
2
)f(θ) sin θdθdφ, (2.15)
with θ the angle between the main axis and the magnetic field (Fig. 2.3).Figure 2.4(b) shows the order parameter for saturating magnetic alignment.S is positive (negative) for alignment along (perpendicular to) the magneticfield, where |S| ∝ B2 at low fields (because ∆Em ∝ B2) until it saturates athigh fields in case of complete alignment [Fig. 2.4(c)]. S = 1 for complete
16

2.6 Depolarization of nano-sized objects
B = 0 T B = 25 T a) b) c)
Figure 2.4: (a) Schematic representation of rods dispersed in water randomlyoriented in the absence of magnetic field. (b) The simulated order parametersfor positive and negative susceptibility differences (∆χ = ±7.5 · 10−4), whichrespectively saturate at 1 and -0.5. The inset shows the quadratic dependence(S ∝ B2) for low fields. (c) Rod alignment where the blue (red) rods alignparallel (perpendicular) for a positive (negative) ∆χ.
alignment along the field (∆χ > 0), S = 0 without alignment, and S = -0.5for complete alignment perpendicular to the field (∆χ < 0). Figure 2.4(c)shows that perpendicular aligned rods have one orientational freedom aroundthe B-axis, which results in an order parameter of one half.
The principles behind magnetic orientation are extensively described in pre-vious work [3–5] and PhD theses [23–25] (both theoretically and experimen-tally). Magnetic alignment can be used to obtain information about the sizeand/or structure of molecular matter [3–8] using the (estimated) magnetic mo-ments of the individual molecules. If the size and structure of the material isexactly known, the magnetic properties of the material can be optically deter-mined, which was shown for a large range of molecules [3]. However, to ourknowledge, this technique was never used for colloidal particles. In chapter7 we will show the precise determination of the magnetic moment of metallicnanoparticles [26].
2.6 Depolarization of nano-sized objects
Magnetic alignment of a large range of nanostructures was observed using op-tical techniques [3–8, 26]. In this thesis the degree of magnetic alignment is
17

2 Optically probing of magnetic manipulation: theory and application.
aE0
εm
P
++
+
+
-- -
--
Ed
ε
a) b) c)
d)as
Ei
E0
Figure 2.5: (a) A sphere with radius a and dielectric constant ϵ is placed in a
medium with dielectric constant ϵm with an electric field E0. (b) The electricfield lines in- and outside a homogenously applied electric field. Note thatthe field inside Ei is constant, and discontinuous at the surface. (c) Induced
polarization P . (d) Depolarization field Ed, directed opposite to P , due toinduced surface poles at the top and bottom of the sphere.
measured optically, through the magnetic field-induced linear dichroism (LD)and birefringence (LB). These optical properties depend on the anisotropic po-larizability of the material (like e.g. anisotropic molecules) [27, 29], and of thedepolarization resulting from the size and shape dependent properties of nano-sized objects [28]. For homogeneous anisotropic shaped nanostructures the de-polarization dominates the optical response. In general, this can be analyticallydetermined using the following description.
Consider a sphere with radius a made of a dielectricum with dielectric con-stant ϵ in a medium with dielectric constant ϵm placed in an initially uniformelectric field E0 [Fig. 2.5(a)]. Both inside and outside the sphere there areno free charges, so the problem of finding the electric field in- and outsidethe sphere amounts to solving the Laplace equation with the proper boundaryconditions at r = a and r = ∞ [30].
With regard to the symmetry of the problem it is best to use spherical
18

2.6 Depolarization of nano-sized objects
coordinates and Legendre polynomials. The boundary conditions at r = a areset by continuous E∥ (to surface) and D⊥ and a finite solution at r = ∞. Acomplete derivation is available in standard text books [30, 31]. Surprisingly,this leads to an electric field Ei within the sphere that is constant and anelectric field E outside the sphere that is the sum of E0 and the field of anelectric dipole p at the origin of the sphere oriented in the direction of E0 [Fig.2.5(b)]. This electric dipole is the result of the induced polarization within thesphere. Consequently, the electric field lines are not continues at the surfacedue to an induced electric surface charge (depolarization). This is in contrastto the electric displacement field D, which exhibits continuous field lines insideand outside the sphere. The electric field and the polarisation inside the sphereare respectively equal to
Ei =3ϵm
ϵ+ 2ϵmE0 and P =
3(ϵ− ϵm)
ϵ+ 2ϵmϵ0E0. (2.16)
When ϵ > ϵm, the electric field inside the sphere is smaller than the appliedfield (|Ei| < |E0|). The polarization P of the sphere [Fig. 2.5(c)] creates adepolarizing field Ed [Fig. 2.5(d)]. The depolarizing field reduces the electricfield inside the sphere Ei, which is equal to
Ei = E0 + Ed = E0 −LP
ϵ0. (2.17)
with L being the depolarization factor. Substituting equations (2.16) in equa-tion (2.17) yields L = 1/3 for a sphere. This is expected since the depolarizingfactors should sum up to unity (Lx + Ly + Lz = 1) and there is no preferentialaxis for a sphere.
Consider now a dielectric ellipsoid in a uniform electric field. The treatmentis the same but now we have to use elliptical coordinates, which is much morecumbersome. Essentially the result is that also in this case the electric fieldinside the ellipsoid is constant, but reduced with a factor L with respect to theapplied field. However, the factor L depends on the orientation of the ellipsoidwith respect to E0, which is reasonable because the local surface polarizationcharges depend on the local curvature of the object’s surface (Fig. 2.6). If thetop curvature is large a low depolarization is present [Fig. 2.6(a)], simultane-ously the edge curvature is lower and results in a strong depolarization [Fig.2.6(b)]. These depolarizing factors are known analytically for spheroids. Forprolate ellipsoids these are equal to [32]:
19

2 Optically probing of magnetic manipulation: theory and application.
aE
0 ε
b,c
+
--- -- -
++
+++
+ + + +
-- - -
a
b,c
Ed=L
zP
iε
mEd=L
x,yP
i
Hd=L
zM
iH
d=L
x,yM
i
µ
ε
µm
εm
+
-µm
µH
0
E0
H0
a) b)
Figure 2.6: Prolate ellipsoid within either an electric field E0 or magneticfield H0. The applied field induces surface poles at the surface along the fieldlines. Parallel to the major axis (a) the depolarization/demagnetization Li issmaller compared to a field along the minor axis (b), which is explained bythe smaller surface curvature were pole charges are generated.
L∥ =1− e2
e2
(−1 +
1
2eln1 + e
1− e
), L⊥ =
1− L∥
2, (2.18)
with e =√
1− c2/a2 the eccentricity. Figure 2.7 shows the depolarization asfunction of the aspect ratio (a/c) and eccentricity. The limiting cases give thevalues for spheres (a = b = c) and needles (a ≫ b = c). A summary of thedepolarization factors L is shown in Table 2.2. The electric field and polarisationwithin the rod depend on orientation. We can derive the analytical expressionfor P , induced by the electric field Ei [equation (2.17)] inside the rod:
ϵmP = (ϵ− ϵm)ϵ0Ei = (ϵ− ϵm)ϵ0(E0 −LP
ϵ0), (2.19)
P =ϵ− ϵm
ϵm + L(ϵ− ϵm)ϵ0E0. (2.20)
If L = 1/3 this equals formula (2.16) for the polarization of a sphere. A similarreasoning applies to the magnetic case. Figure 2.6 indicates the similarities tothe electric properties and the magnetic properties. The next section will coverthe demagnetization properties of spheroids.
20
2.7 Demagnetization
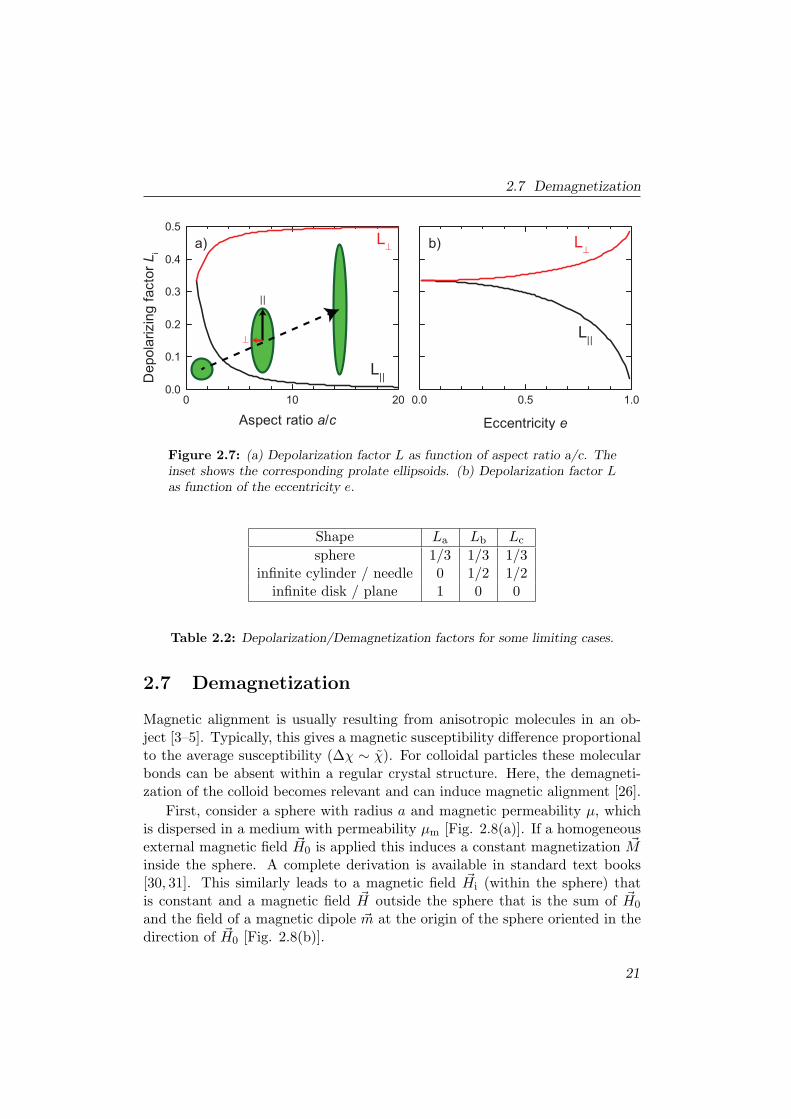
Figure 2.7: (a) Depolarization factor L as function of aspect ratio a/c. Theinset shows the corresponding prolate ellipsoids. (b) Depolarization factor Las function of the eccentricity e.
Shape La Lb Lc
sphere 1/3 1/3 1/3infinite cylinder / needle 0 1/2 1/2
infinite disk / plane 1 0 0
Table 2.2: Depolarization/Demagnetization factors for some limiting cases.
2.7 Demagnetization
Magnetic alignment is usually resulting from anisotropic molecules in an ob-ject [3–5]. Typically, this gives a magnetic susceptibility difference proportionalto the average susceptibility (∆χ ∼ χ). For colloidal particles these molecularbonds can be absent within a regular crystal structure. Here, the demagneti-zation of the colloid becomes relevant and can induce magnetic alignment [26].
First, consider a sphere with radius a and magnetic permeability µ, whichis dispersed in a medium with permeability µm [Fig. 2.8(a)]. If a homogeneousexternal magnetic field H0 is applied this induces a constant magnetization Minside the sphere. A complete derivation is available in standard text books[30, 31]. This similarly leads to a magnetic field Hi (within the sphere) thatis constant and a magnetic field H outside the sphere that is the sum of H0
and the field of a magnetic dipole m at the origin of the sphere oriented in thedirection of H0 [Fig. 2.8(b)].
21

2 Optically probing of magnetic manipulation: theory and application.
Considering the previous section this is no surprise due to the symmetry inthe Maxwell equations. The following substitutions can be made:
ϵ0E ⇒ H, P ⇒ M, D ⇒ B
µ0, ϵ ⇒ µ. (2.21)
Here, the electric surface charges are similar to the magnetic surface charges.The picture sketched in Fig. 2.5 is analogous to that of Fig. 2.8. The field linesof B are continuous in contrast to the field lines of H [Fig. 2.8(b)], due to in-duced magnetic surface charges. The origin of these charges can be interpretedas the summation the individual magnetic moments within the material [Fig.2.8(c,d)]. This summation results in one magnetic dipole with magnetic poles(anti-)parallel to the applied field H0. Paramagnetic materials have a magneti-sation parallel to the magnetic field, with a demagnetization in the oppositedirection, similar to the electric case [Fig. 2.8(d)]. Diamagnetism however, hasa magnetization anti-parallel to the magnetic field due to a negative magneticsusceptibility, and the demagnetization is parallel to the magnetic field [Fig.2.8(d)]. The resulting magnetic field inside a spheroid (Fig. 2.6) is given by:
Hi = H0 + Hd = H0 − LM. (2.22)
The field is reduced as a consequence of the demagnetization field Hd whichis proportional to the demagnetization factor L (analogues to depolarization),some examples are shown in Table 2.2. Taking into consideration that the fieldinside the object is constant and is directed along the applied field, we canderive the analytical expression for the magnetization M . It is induced by theapparent magnetic field inside the rod Hi [equation (2.22)], which equals:
µmM = (µ− µm)Hi = (µ− µm)(H0 − LM), (2.23)
M =µ− µm
µm + L(µ− µm)H0, (2.24)
where the magnetic permeability is related to the magnetic susceptibility of theobject by µ = 1+χ, and the medium µm = 1+χm. Using M = χH we can findan expression for the induced magnetic susceptibility difference ∆χ = χ∥−χ⊥:
∆χ =χV − χm
1 + χm + L∥(χV − χm)− χV − χm
1 + χm + L⊥(χV − χm)(2.25)
=(L⊥ − L∥)(χV − χm)2
[1 + χm + L∥(χV − χm)][1 + χm + L⊥(χV − χm)](2.26)
22

2.7 Demagnetization
H0
Hi
SSS
NNNNN
SS
M Hd
H0
SSS
NNNNN
SS
Hi
paramagneticdiamagnetic
aH
0
μm
μ
a) c) d)b)
Hi
M Hd
Figure 2.8: (a) Sphere with radius a and magnetic permeability µ in a
medium with permeability µm in a magnetic field H0. (b) The magneticfield lines in- and outside a homogenously applied magnetic field. Note thatthe field is constant within the sphere and discontinuous at the surface. (c)Diamagnetic materials induce small magnetic moments on a molecular scale.These sum up to a constant magnetization M , anti-parallel to the internal fieldHi, with surface poles in the opposite direction inducing a demagnetizationfield Hd parallel to Hi. (d) Paramagnetic materials have magnetic moments
parallel to the internal field Hi, resulting in a parallel magnetization M and aanti-parallel demagnetization field Hd.
Usually, the magnetic (volume) susceptibilities of the medium χm and the ob-ject χV are small: |χm|, |χV | ≪ 1. Therefore, we find a simple second orderdependency of ∆χ, which is given by:
∆χ ≈ (L⊥ − L∥) (χV − χm)2 . (2.27)
In summary, we have found that the shown demagnetization effects scale as∆χ ∝ χ2, in contrast to the anisotropic magnetic moment of molecular bondsthat scale as ∆χ ∝ χ. However, in the absence of molecular anisotropy, suchas in metallic colloids, demagnetization can be significant. Its contribution willbe shown in chapter 7 [26].
23

2 Optically probing of magnetic manipulation: theory and application.
2.8 Depolarization example: optical properties ofcolloidal gold
Section 2.6 showed an analytical expression for the depolarization of ellipsoids.These equations can be used to model the optical response of gold nanorods,which have the shape of spherical-capped cylindrical nanorods (Fig. 7.2). Thesenanorods exhibit a surface plasmon resonance due to collective oscillation modesof the conduction electrons. In chapter 6 we will show that these can be (par-tially) aligned using a magnetic field. The optical properties for this kind ofrods can be understood in terms of Mie-Gans theory [33], which is an extensionof the classical Mie theory of spheres [34] into spheroids. Using this formalism,we will derive an analytical expression for the optical response.
Polarizability
The gold rods that we take as an example are spherically capped. In this caseno analytical depolarisation factors are available but we assume here that thespheroid gives a good approximation for its main features. The electric dipolemoment p of such a rod inside an electric field E can be expressed as: p = α · E.The polarizability α is a second rank tensor, which can be diagonalized forcylindrical symmetric rods:
α =
α⊥ 0 00 α⊥ 00 0 α∥
, (2.28)
with α∥ the longitudinal polarizability and α⊥ is the transverse polarizability,both relative to the long rod axis. The theory for optically measuring nano-sized particles was developed by Gans and includes depolarization effects [33].Within this approximation the particles should be much smaller than the prob-ing wavelength, because for large particles the depolarization effects disappear.Similar to equation (2.19), the complex polarizability component αi is given by:
αi(λ) = Vϵ(λ)− ϵm
ϵm + Li(ϵ(λ)− ϵm), (2.29)
with ϵ(λ) the complex dielectric function of bulk gold, ϵm the dielectric functionof the surrounding medium, and Li the depolarisation factor. The dielectricfunction of gold is available in a wide range of experimental and theoreticalpapers, where the values measured by Johnson and Christy [35] are most widelyused in connection to data on gold nanoparticles. They measured a thin gold
24

2.8 Depolarization example: optical properties of colloidal gold
b,c
a
Figure 2.9: (a) The real [Re(ϵ)] and imaginary [Im(ϵ)] parts of the dielectricfunction of Au as a function of wavelength (adapted from [35]). (b) Thecalculated real [Re(α∥)] and imaginary [Im(α∥)] parts of the polarizability ofa gold nanorod dispersed in water. (a = 30 nm and b,c = 10 nm).
film under high vacuum conditions, with which they extracted the real andimaginary parts of the complex dielectric function, which are shown in Fig.2.9(a). Figure 2.9(b) shows the resulting complex parallel polarizability α∥ foran ellipsoid with semi-major axis length of a = 30 nm and a semi-minor axislength of b, c = 10 nm.
Cross section
From the complex polarizability the extinction cross section σe = σa + σs ofdispersed nanorods can be estimated, where σa is the absorbance cross sectionand σs the scattering cross section, which are equal to [10]:
σa = k Im(αi), (2.30)
σs =k4
6π|αi|2, (2.31)
with k = 2π√ϵm/λ the wave number. Depending on the volume and the depo-
larisation factors, the amplitude and position of the spectrum changes. As anexample we use a spheroid with a = 30 nm and b = 10 nm. The scattering inthis regime is rather low. For larger particles its contribution to the extinctionwill increase, whereas here it is mainly defined by the absorbance [Fig. 2.10(a)].An oriented spheroid has distinctive depolarisation factors along the differentaxes; the long axis has a larger and red-shifted component in comparison to the
25

2 Optically probing of magnetic manipulation: theory and application.
b,c
a
Figure 2.10: Calculated spectra of gold spheroids dispersed in water (a = 30nm; b,c = 10 nm)(a) The scattering, absorbance and extinction cross section asa function of wavelength. (b) The simulated cross section for parallel and per-pendicular alignment of the rod with respect to the probing light highlightingthe strong dependence on orientation.
short axis [Fig. 2.10(b)].
The peak position is dependent on the depolarization factor Li, which isclosely related to the aspect ratio. This causes a the shifting resonance conditionin the denominator in equation (2.29). Increasing the volume only slightlychanges the total extinction [Fig. 2.11(a)], and mainly affects the amplitude ofthe resonance. Changing the aspect ratio however, strongly changes the peakposition. With increasing aspect ratio the peak shows a strong red-shift [Fig.2.11(b)].
Experimental optical properties
The previous analytical expressions showed the optical properties for metallicspheroids. However, experimentally often shapes like spherically capped rodsare present, which changes the effective depolarization of the objects. Numericalsolutions exist like the discrete dipole approximation (DDA), which consists of anumerical integration over any shape [36]. This method can be used to obtaincorrected depolarization factors [37]. Besides the depolarization factor, thedielectric function is a crucial parameter. A spread in experimental dielectricvalues is reported in literature due to different experimental configurations. Thedependence on many parameters makes it very hard to conclusively model the
26

2.8 Depolarization example: optical properties of colloidal gold
500 600
0
20
40
500 600 700 800
0
20
40
AR=1
40
30
20
R=10 nm
Cro
ss s
ectio
n (1
0-15 m
3 )
Wavelength(nm)
50 a)
Cro
ss s
ectio
n (1
0-15 m
3 )
Wavelength(nm)
5
4
32
b)
Figure 2.11: (a) The calculated cross section of spheres, with a radius from10 to 50 nm. (b) The cross section for spheroids with a constant short axis(b,c = 10 nm) and an increasing aspect ratio (AR=a/b). The amplitude andresonance wavelength increase with increasing aspect ratio.
optical response [38,39]. A correct description of the confined electronic surfaceproperties is crucial in obtaining the final optical response. With respect to thelongitudinal plasmon resonance along the major axis, it has been shown that theline width broadens relative to the bulk value (Γbulk=75 meV). This broadeningis mainly due to electron surface scattering (Γsurface), and radiation damping(Γradiation) [40]. To show these effects it is most convenient to introduce theLorentz distribution function which takes into account the line width Γ. Thenormalized Lorentzian Z(ω) as a function of the radial frequency ω(= 2πc/λ)is given by:
Z(ω) =1
π
Γ/2
(ω − ω0)2 + (Γ2 )2, (2.32)
with ω0 the resonance frequency and Γ = Γbulk + Γsurface + Γradiation ≈ 110meV (aspect ratio 2-4) [40]. As an example we use sample H (chapter 6, Table7.1), which has a semi-major length of a =36.5 nm and a semi-minor length ofb =15.5 nm. Figure. 2.12 shows the normalized extinction of this sample, show-ing two distinct peaks. The peak around 540 nm corresponds to the transversalresonance (along b, c), the peak around 735 nm corresponds to the longitudinalresonance (along a). Two Lorentzian functions are fitted with the longitudi-nal component. Both Γ (=110 meV) and Γbulk (=75 meV) show a resonancewhich is too narrow in comparison with the measured extinction. Additionally,
27

2 Optically probing of magnetic manipulation: theory and application.
500 600 700 8000.0
0.5
1.0
Ext
inct
ion
(nor
mal
ised
)
Wavelength (nm)
experimental data
gaussian
bulk
Figure 2.12: Simulated absorbance spectra plotted against a normalizedexperimental spectrum (black line, with a = 36.5; b,c = 15.5 nm). The mostnarrow distributions are Lorentzian spectra with Γ = 110 meV (purple line)and Γbulk = 75 meV (blue line). The Gaussian is a convolution of Z(ω) withan average of 1.69 eV (735 nm) with a standard deviation of 0.09 eV (≈ 40nm) (red line).
one also needs to take into consideration a spread in sizes when measuring anensemble of dispersed rods which can be done using a Gaussian distributionG(ω) with average µ and standard deviation σ. The total extinction I(ω) ofthe convolution of the Lorentzian function with a Gaussian spread equals:
I(ω) =
∫Z(ω)G(ω)dω =
∫1
π
Γ/2
(ω − µ)2 + (Γ2 )2
1
σ√2π
e−12(ω−µ
σ)2dω (2.33)
Figure 2.12 shows the gaussian convolution I(ω) with a mean value of µ=1.69eV (735 nm) and a standard deviation of σ =0.09 eV (∼ 40 nm).
Kramers-Kronig relation
The previous simulations where focused on the extinction of the rods, which isproportional to the imaginary part of αi. Figure 2.9(b) shows that the imaginaryand real parts of the polarizability have quite distinct properties. The real partis similarly connected to the refractive index of the medium [ni ∝ Re(αi)]. Wecan relate Re(αi) and Im(αi) with the Kramers-Kronig transformation (also
28

2.9 Experimental setup: rotation experiments
known as Hilbert transformation) and thus acquire complementary information.These spectra can be interrelated without any additional parameter [10]:
Re[∆α(ω)] =2
πP
∫ ∞
0
ω′ · Im[∆α(ω′)]
ω′2 − ω2dω′, (2.34)
with P the Cauchy principal value and ω′ the radial frequency. A similarexpression exists for the inverted transformation.
2.9 Experimental setup: rotation experiments
Chapters 3-5 show the magnetic manipulation of supramolecular chirality ina rotating vial. Imaging the solution and measuring the absorbance in themagnet as function of time require specific homebuild experimental setups.These measurements require light properties perpendicular to the field, allowinga maximum pathlength of 50 mm.
Imaging of a rotating solution
A rotating vial inside a high magnetic field is visualized using mirrors withinthe small (50 mm) magnetic bore. This allows a study on the effect of magneticlevitation forces onto a rotating solution. Figure 2.13 shows the insert, whichis used to visualize the fluid in a strong magnetic field gradient.
In a typical experiment, the vial is rotated at a fixed frequency (15 Hz).The vessel is mounted at the point of maximum B(z)dB/dz, which is locatedat 82 mm above the field centre of a 50 mm bore 31 T Florida-Bitter magnet.Using two mirrors and a zoom lens the image was taken by a charge-coupleddevice (ccd) video camera. When the field is increased from 0 to 25 T, theeffective gravity decreases and inverts above 16 T (see section 2.3). Figure 2.13shows images of a non-rotated vial and a rotated vial with a negative effectivegravity.
Absorbance of a rotating solution
The absorbance of a solution of circular cross section can be simply measuredoutside the magnetic field on a table setup. A solution with an absorbanceA(λ) depends on the intensity ratio of the probing light I0 with respect to thetransmitted light I, which equals:
A(λ) = log10
(I
I0
). (2.35)
29

2 Optically probing of magnetic manipulation: theory and application.
CCD
Motor
B
Vial
Figure 2.13: A ccd camera in combination with a light source is coupled bytwo mirrors to image the side of a rotating vial in the magnetic field bore. Thevial is positioned above the field center in the maximum field gradient, whichresults in a negative effective gravity at high magnetic fields.
Measuring the transmitted light is straightforward for a parallel light beamonto a straight surface (like a squared cuvette). However, we are interestedin measuring the absorbance inside a vial. With the vial being cylindrical,the incident light is not perpendicular to the vial surface at all positions ofthe light spot, resulting in refraction of the incident light from air to glassand from glass to the sample solution. The double refraction results in a non-circular spot of the transmitted light with a shifted position. Therefore, thevial rotates in water contained in a glass cuvette, which is essential to reducethe scattering and refraction from the vial surface. The transmitted light spotwill shift less and stays in shape, which is crucial for rotating vials because anysmall precession of the vial causes the transmitted light spot to move out of thedetector range [41,42].
To follow the kinetic trace of the aggregate formation a setup capable ofmeasuring the absorbance of a rotating solution is built which is shown in Fig.2.14. A halogen light source (Avantes AvaLightHal) couples light into an opticalfiber. A fiber lens together with a pinhole focuses the light as a circular spot(1.5 mm in diameter) on the middle of a sample vial inside the sample holder.A mechanical shutter is placed to prevent illumination of the sample while no
30

2.9 Experimental setup: rotation experiments
USB2000+ Spectrometer
NI output board
Halogen light
source
Sample holder
Labview opera!ng PC
Pinhole
Filter
Shu"er
Water circulator
Sample
Vial
Rotator
X⁰C
Sample holder
Copper Cuvette
Temperature Bath
Figure 2.14: The experimental setup for absorbance measurements of a ro-tating vial. A schematic view of the total setup is given (left side) with anadditional view of the sample holder (right side).
measurement is done. After the sample, the transmitted light passes througha combination of filters and is fiber-coupled into a spectrometer (Ocean OpticsUSB2000+). The filtered light source provides light with a spectrum rangingfrom 400-560 nm, which increases the sensitivity for typical porphyrin spectra.A homebuild Labview script controls the shutter and records the spectra.
The sample is put into a clear glass screw top vial which is held by the capby a Teflon cylinder connected to a rotator, which can rotate upto 33 Hz in bothclockwise (CW) and anticlockwise (ACW) direction. For temperature controlthe vial is put into a temperature bath which consists of a 20·20·30 mm glasscuvette filled with water, surrounded by a copper housing. A water circulator,set at a specific temperature, circulates water through the copper bottom for aprecise temperature control.
Absorbance of a rotating solution inside a high magnetic field
To measure the absorbance of a rotating vial in a magnetic field a similarsetup (compared to Fig. 2.14) is built to fit inside a 50 mm bore of a 31T Bitter magnet at the HFML. An ‘insert’ was mounted in a double-walledmetallic holder tube with a thermostat that fitted into the polar expansion ofthe magnet. The insert consists of two separate parts, the upper part which
31

2 Optically probing of magnetic manipulation: theory and application.
rotates the vial and the lower part which is used for the actual absorbancemeasurements. These parts have no mechanical connection to prevent motionof the absorbance measurement part. Figure 2.15(a-c) shows the design of theinsert at several levels.
8
4
5
6
3
7
9
a) b) c)
Legend
1. Top of second
extension tube.
2. Temperature tube
(transparent) with
connections to the
water circulator
3. Bottom of second
extension tube, with
bearings.
4. Aluminum connector
5. Mirror platform
6. Pinhole flange
7. Collecting optical fiber
8. Optical fiber lens
flange
9. Emitting optical fiber
10. Nylon vial holder
11. Cuvette (filled with
water)
12. Sample vial
13. Mirrors
14. Fiber lens
7
5
6 14
11
13
4
10
3
13
12
1
2
3
Figure 2.15: The experimental setup for absorbance measurements of a ro-tating vial inside a magnetic field. The insert consist of two separate parts,an upper part for the rotation of the vial and a lower part for the absorbancemeasurements. The part inside the magnet is shown in (a) with a close-up (b)and a cross-section (c) including the light path (yellow).
A rotator is put about half a meter above the magnet on an optical tableand is connected to the vial via two extension tubes. The first extension tubetransfers the rotation from the rotator to the top of the temperature tube whereit is fixed to another extension tube. This second extension tube (nr. 1) hasbearings at the bottom (nr. 3) and will transfer the rotation to an aluminumconnector (nr. 4). This aluminum connector holds a nylon tube (nr. 10) inwhich the vial (nr. 12) is secured by the sides of the glass, to minimize anyprecession. The length of the nylon tube and extension tube are such that thebottom of the vial is 10 mm below the center of the magnetic field. Since thefield center is constant (within 1 %) over about 20 mm, the entire solution in
32

2.10 Experimental setup: magnetic field induced alignment
the vial experiences normal gravity (for a similar magnetic field profile see Fig.2.2).
The lower part of the insert (Fig 2.15) consists of a platform (nr. 5) onwhich a glass cuvette filled with water (nr. 11) is mounted, which reduces thescattering and refraction of the incident light on the surface of the vial. Thelight (400-560 nm) is produced as described in the previous section. Two fibersare mounted in the insert to collect and emit light, respectively nr. 7 and nr.9 [Fig. 2.15(c)]. The emitting fiber lens is connected to a flange (nr. 8). Thepath of the light is shown as a yellow line [Fig. 2.15(c)]. The light passes apinhole (nr. 15) resulting in a 0.5 mm diameter spot, and is then reflected bya mirror (nr. 13). The light passes through the water and the sample (nr.12) horizontally (perpendicular to the magnetic field). The transmitted light isreflected downwards by the second mirror and collected by a fiber lens (nr. 14),into the fiber (nr. 7). The light is collected on a spectrometer (USB2000+),which is operated by a homebuilt Labview program that controls the shutterand measures the spectra.
2.10 Experimental setup: magnetic field induced align-ment
This thesis covers the magnetic manipulation of different suspended nano-structures. The optical properties of nanostructures inside a magnetic fieldgive information about its average orientation and/or deformation. For theporphyrin molecules in chapters 3-5, we will use linear dichroism (LD) measure-ments to probe the alignment. In contrast, chapter 6 shows linear birefringence(LB) measurements on stomatocytes. In both cases only one of these tech-niques (LB or LD) provided a sensitive measurement of the induced alignment.However, in chapter 7 we show that both LD and LB measurements are ableto measure the alignment of gold nanorods. The optical and magnetic responseis large and therefore simple polarized absorbance techniques can already showthe magnetic alignment. Before introducing sensitive phase modulated tech-niques for absorbance (LD) and refractive index (LB) measurements, we willfirst describe polarized absorbance on gold nanorods as it clearly shows thecorrelation between the order parameter and the measured spectra. Moreoverit provides a calibration for the LD measurements.
33

2 Optically probing of magnetic manipulation: theory and application.
Magnetic field induced polarized absorbance
Gold colloids dispersed in water are randomly oriented in a cuvette. As anexample we will again use sample H (chapter 7, Table 7.1), which has a semi-major length of 36.5 nm and a semi-minor length of 16.5 nm. Figure 2.16(b)shows the extinction spectrum A(0T) which consists at zero magnetic field,out of two resonance peaks (black curve). One corresponds to the longitudinalresonance (725 nm) and the other to the transversal resonance (530 nm). Thetotal equals:
A(0T) =crodd
ln(10)
(σe,l3
+2 σe,t3
), (2.36)
with crod the rod concentration, d the optical path length (cuvette thickness),σe,t the transversal extinction cross section along the minor axis, and σe,l thelongitudinal extinction cross section along the major axis. The different wave-
a
b,c
Figure 2.16: Polarized absorbance measurements on gold nanorods (a =36.5; b,c = 16.5 nm). (a) Parallel and perpendicular absorbance as a functionof the applied magnetic field at 725 nm. (b) Polarized absorbance at 0 and32 T, showing changes around the longitudinal (725 nm) and transversal (530nm) resonances. (c) Differential polarized absorbance spectra as function ofmagnetic field with ∆Ai(B) = Ai(B)−A(0 T ) and ∆A(B) = A∥(B)−A⊥(B).The black thin line indicates phase-modulated LD measurements. (d) Differ-ential polarized absorbance as function of wavelength at 32 T. The black dotswith small error bars indicate the phase-modulated LD measurements.
34

2.10 Experimental setup: magnetic field induced alignment
length regions thus can give information about the orientation of the rod, inparticulary when the rods align themselves in a magnetic field [4]. Figure2.16(a) shows the absorbance at 725 nm, for two different directions of a linearpolarizer in the detection path. The parallel component (A∥) increases, whereasthe perpendicular component (A⊥) decreases with an increasing magnetic field.This indicates that the rods align with their major axis parallel to the magneticfield. At maximum field (here 32 T) the overall spectrum [Fig. 2.16(b)] showsclear differences for the two orthogonal angles of the polarizer: the longitudinalcomponent (σe,l, around 735 nm) shows an increase in the parallel compo-nent (blue line) and a decrease in the perpendicular component (red line), thetransversal component (σe,t, around 530 nm) however, shows a decrease in theparallel component (blue line) and an increase in the perpendicular component(red line). This effect is more pronounced if A(0T) is subtracted, which isshown in Fig. 2.16(c,d). This differential absorbance ∆A = Ai − A(0T) (withi =∥,⊥) is directly related to the order parameter which is described in section2.5. Compare Fig. 2.16(c) to Fig. 2.4, these traces are identical when properlynormalised. Figure 2.16(d) clearly shows the field-induced contributions of thetransversal (σe,t, around 530 nm) and longitudinal component (σe,l, around 735nm) of the partially aligned rods.
The magnetic field-induced polarized absorbance in this sample is ratherlarge. For smaller absorbance changes, a phase modulation technique givesmuch more precise results. Typically, polarised absorbance is sensitive upto 0.01 absorbance units. Magnetic induced linear dichroism (LD) by phase-modulation, which measures the differential value ∆A, is much more sensitivedepending on the optical components [43]. In our case we have a 10 times bet-ter sensitivity (∼ 0.001). Figure 2.16(c) shows the field dependent trace (blackcurve) with an improved signal to noise ratio, and Fig. 2.16(d) shows the LDmeasurements (black symbols) with error bars much smaller than the spreadin polarized absorbance. The principle behind this more sensitive technique isexplained in the next section.
Phase modulated polarization experiments
Standard polarized absorbance measurements generally are limited by the op-tical stability of the transmitted light. In particular the stability of the lightsource and displacement of the magnet limit the stability of the backgroundabsorbance A(0 T) with respect to the field induced absorbance A(B). Botheffects have short- and long-term fluctuations which decrease the sensitivity. Tothis end an intensity independent technique produces much more sensitive mea-surements. Kemp introduced a photo-elastic modulator (PEM), which has a
35

2 Optically probing of magnetic manipulation: theory and application.
polarized crystal oscillating at 50 kHz [11]. The transmitted light is modulatedinto a complex circularly polarised signal at 50 kHz, with multiple higher ordercomponents. This results in an intensity independent signal, with a relativelyhigh signal to noise ratio. In this section we will show techniques which measurethe differential values of linear birefringence (LB, refractive index), and lineardichroism (LD, absorbance).
All measurements in this thesis are generally performed in either a 20 TDuplex Bitter magnet or a 33 T Florida-Bitter magnet at the High Field Mag-net Laboratory (HFML) in Nijmegen. These magnets have a cylindrical boreparallel along the field with a diameter of 32 mm. Figure 2.17 shows a sketchof the setup used for LD and LB measurements. The solutions are containedinside a 1-10 mm thick optical cell C (Hellma). The sample holder is placedwithin a double wall thermostat which is connected to a water circulator witha temperature control that ranges from 5-80 C with a precision of ±0.1 C.
For the most precise measurements a single laser line was used, typically aHeNe laser (1.5 mW, 632.8 nm), or a wavelength tuneable optically pumpedTi:Sa laser (here 700-850 nm). For a larger wavelength range, a Xenon lightsource was used in combination with a monochromator (Acton 2300i), whichproduces much lower intensities with a linewidth of 5 nm. The advantage of this
lock-in 1
lock-in 2
Light source
P
Photodiode
multimode
!ber
L
M
F
A
MM
L
C
PEM
B
Figure 2.17: Schematic representation of the LB and LD setup. A lightsource is guided through: (L) lens, (M) mirror, (P) polarizer, (PEM) photo-elastic modulator, (C) cuvette mounted in a (B) Bitter magnet, (A) analyser,and (F) fiber lens. The light is transferred to a Si photodiode by a multimodefiber, which is read out in referenced lock-ins.
36

2.10 Experimental setup: magnetic field induced alignment
source is the tunability over the full visible wavelength range (with standardoptics: 350-900 nm). A series of lenses was used, forming a telescope guid-ing the light beam through a linear polarizer and a PEM, situated outside themagnet. The light enters the magnet in a roughly parallel, slightly converging,path. Using two mirrors the light is guided perpendicular to B through thesample solution, which permits to measure both the parallel and perpendicularcomponent (to the field direction). Finally the light enters a fibre lens (with anadded plastic polarizer in case of LB), which focusses the light on a multimodefiber. This fiber is connected to a silicon photodiode, which gives a voltageoutput proportional to the light intensity. The induced ac-voltages are mea-sured with frequency-referenced lock-in amplifiers. A home-written LabVIEWprogram collects the lock-in data, steers the PEM and monochromator, andmonitors the applied magnetic field and temperature.
In the next paragraphs we will show the two individual techniques (LD andLB) with the specific settings and requirements to obtain the desired opticalproperties.
Magnetic field induced linear dichroism
We have shown that, using polarized absorbance measurements, magnetic align-ment can be probed by detection of orthogonal polarization components. Asmentioned, the phase-modulated technique is much more sensitive [43]. Figure2.17 outlines the setup. The first linear polarizer is set to 0 degrees with re-spect to the magnetic field and the PEM modulation axis is set to +45 degrees.Effectively, the PEM changes the linear polarization between 0 and 90 degreesat a frequency of twice the modulation frequency f (2f = 2 ·50 kHz). It can beshown that the measured intensities relate to the differential absorbance ∆Aas [11,43]:
Iac,2fIdc
=Vac,2f
Vdc= Copt tanh(1.1515∆A), (2.37)
∆A =1
1.1515arctanh
(Vac,2f
VdcCopt
), (2.38)
with Copt an optical calibration constant, Ii the light intensity on the detector,which is proportional to the voltage Vi, and ∆A(= A∥−A⊥) the magnetic fieldinduced differential absorbance. For ∆A < 0.1 this can be approximated withina 1 % accuracy as:
∆A ≈ C ′opt
Vac,2f
Vdc. (2.39)
37

2 Optically probing of magnetic manipulation: theory and application.
In order to measure the dc intensity, a chopper is used as a tool to simplysubtract the background voltage of the detector. This results in a block-wavevoltage which is measured as an ac signal by the lock-in. The optical constantC ′opt takes into account the optical and electronic influences, and is calibrated
by using polarized absorbance measurements. The calibrated result is shown inFig. 2.16(c,d). Both the field- and wavelength-dependent measurement showsa very large signal-to-noise ratio compared to the polarized absorbance mea-surements (black line/dots vs. green lines).
Using the absorption cross-section σe from equation (2.30), an expressioncan be derived for the differential absorbance. Consider a cylindrical symmetricrod which has an absorption cross section σz along the z-axis and σr alongthe radial axis (x, y). The total absorbance parallel and perpendicular to themagnetic field is equal to:
A∥ =crodd
ln(10)
∫∫f(θ)(σz cos
2 θ + σr sin2 θ sin2 φ) sin θdθdφ, (2.40)
A⊥ =crodd
ln(10)
∫∫f(θ)(σz sin
2 θ sin2 φ+ σr cos2 θ) sin θdθdφ. (2.41)
with d the optical path length, and crod the rod concentration. The differentialvalue ∆A = A∥ −A⊥, which is optically measured, is equal to:
∆A =
[∫∫ (3 cos2 θ − 1
2
)f(θ) sin θdθdφ
]crodd(σz − σr)
ln(10). (2.42)
The left part of this equation equals the order parameter S(B) (section 2.5) andthe right part equals the maximum absorbance difference ∆Amax at a saturatingalignment, which is equal to
∆A(B, λ) = S(B) ·∆Amax(λ), (2.43)
∆A(B, λ) = S(B) · 2π nm crodd
λ ln(10)· Im[α∥(λ)− α⊥(λ)], (2.44)
with nm being the refractive index of the medium, λ the probing wavelength,and αi the complex polarizability along one symmetry axis (∥,⊥). Dependingon the alignment direction and symmetry, the maximum reachable absorbancedifference can be up to 3 times the average absorbance for a parallel align-ment of cylindrical rods [equation (2.36)]. The advantage is that ∆Amax canbe determined by the sign and average absorbance [26]. Therefore the orderparameter S(B) is known, and the magnetic susceptibility difference ∆χ of therods can be accurately determined without any assumptions on concentration
38
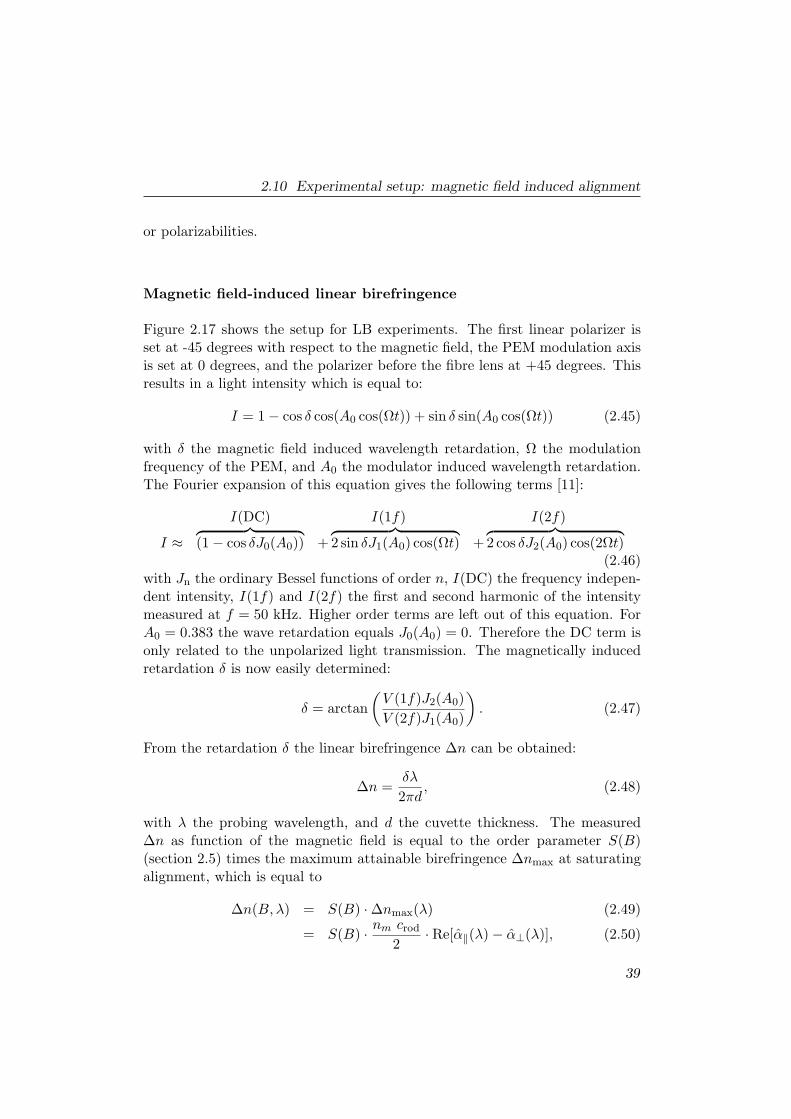
2.10 Experimental setup: magnetic field induced alignment
or polarizabilities.
Magnetic field-induced linear birefringence
Figure 2.17 shows the setup for LB experiments. The first linear polarizer isset at -45 degrees with respect to the magnetic field, the PEM modulation axisis set at 0 degrees, and the polarizer before the fibre lens at +45 degrees. Thisresults in a light intensity which is equal to:
I = 1− cos δ cos(A0 cos(Ωt)) + sin δ sin(A0 cos(Ωt)) (2.45)
with δ the magnetic field induced wavelength retardation, Ω the modulationfrequency of the PEM, and A0 the modulator induced wavelength retardation.The Fourier expansion of this equation gives the following terms [11]:
I(DC) I(1f) I(2f)
I ≈︷ ︸︸ ︷(1− cos δJ0(A0)) +
︷ ︸︸ ︷2 sin δJ1(A0) cos(Ωt) +
︷ ︸︸ ︷2 cos δJ2(A0) cos(2Ωt)
(2.46)with Jn the ordinary Bessel functions of order n, I(DC) the frequency indepen-dent intensity, I(1f) and I(2f) the first and second harmonic of the intensitymeasured at f = 50 kHz. Higher order terms are left out of this equation. ForA0 = 0.383 the wave retardation equals J0(A0) = 0. Therefore the DC term isonly related to the unpolarized light transmission. The magnetically inducedretardation δ is now easily determined:
δ = arctan
(V (1f)J2(A0)
V (2f)J1(A0)
). (2.47)
From the retardation δ the linear birefringence ∆n can be obtained:
∆n =δλ
2πd, (2.48)
with λ the probing wavelength, and d the cuvette thickness. The measured∆n as function of the magnetic field is equal to the order parameter S(B)(section 2.5) times the maximum attainable birefringence ∆nmax at saturatingalignment, which is equal to
∆n(B, λ) = S(B) ·∆nmax(λ) (2.49)
= S(B) · nm crod2
· Re[α∥(λ)− α⊥(λ)], (2.50)
39

2 Optically probing of magnetic manipulation: theory and application.
with nm the refractive index of the medium, crod the rod concentration, and αi
the complex polarizability along one symmetry axis (∥,⊥). Unlike LD, ∆nmax
can only be determined theoretically, which is a disadvantage of LB with respectto LD. The sign of the measured signal in combination with the calculatedpolarizabilities from literature can give sufficient information to determine thealignment properties [5].
Discussion: LD vs LB
LD and LB both measure the magnetic induced alignment, but with totallydifferent wavelength-dependent sensitivities. To illustrate the differences andthe correlations gold nanorods are taken as a model system. Figure 2.18(a,b)shows the LD of sample O (a = 54 nm b, c = 28.3 nm, also see chapter 7, Table7.1). The absorbance at 0 T has two resonance maxima of the longitudinal (700nm) and transversal (540 nm) resonances [red line, Fig. 2.18(b)]. A strongalignment as function of field is seen at 700 and 540 nm [Fig. 2.18(a)] with∆A ∝ B2. With an applied field of 30 T, the induced differential absorbance asfunction of wavelength is similar to the polarized absorbance measurements inFig. 2.16(d). The longitudinal peak (700 nm) increases, whereas the transversal(540 nm) decreases, pointing to rods aligning with their major axis along thefield.
LB measurements on the other hand, show a completely different wavelengthdependence. Figure 2.18(c) shows alignment curves at different wavelengthswith ∆n ∝ B2. In contrast to LD, LB has maximum amplitudes at differentwavelengths due to the derivative like shape with respect to the absorbance[Fig. 2.18(d)]. The large longitudinal resonance around 700 nm, results inlarge positive LB for a longer wavelength, and a negative contribution for ashorter wavelength. The transversal resonance around 540 nm, shows a smallmodulation with respect to the strong negative longitudinal resonance, which isopposite in sign corresponding to the negative LD around 540 nm. Therefore,the transversal component has a positive modulation at shorter wavelengths,and a negative modulation at longer wavelengths.
The measured retardation δ [using equations (2.48) and (2.50)] has, com-pared to the measured LD [equation (2.44)], almost identical formulas:
δ =2πd
λ∆n =
2πd
λ
nm crod2
Re[∆α(λ)], (2.51)
∆A =2πd nm crodλ ln(10)
Im[∆α(λ)]. (2.52)
The main difference is the part of the complex differential polarizability ∆α
40

2.10 Experimental setup: magnetic field induced alignment
a) b)
d)c)
Figure 2.18: Magnetic alignment of gold nanorods in water (a = 54 nm;b,c= 27.9 nm). (a) LD measurements as function of magnetic field, measuredaround the longitudinal (700 nm) and transversal (540 nm) resonance peaks.(b) LD measurement: squares give ∆A(30 T) with error bars showing thestandard deviation. It roughly follows A(0 T), the extinction spectrum at 0T. (c) LB measurements as function of magnetic field, measured at differentwavelengths. (d) LB measurement: squares give ∆n(30 T) with error barsshowing the standard deviation. It is a roughly derivate like spectrum withrespect to ∆A(30 T).
which is taken into account. Therefore, without any added information, the LBand LD measurements (at constant B) can be interrelated with the Kramers-Kronig transformation [equation (2.34)] between Re[∆αi(λ)] and Im[∆αi(λ)].The LD measurements [∆A(30 T), black dots in Fig. 2.18(b)] are Kramers-Kronig transformed into the LB measurements [∆nkk, blue line in Fig. 2.18(d)].The transformed LB curve is roughly similar to the measured LB, including itssign and the overall shape. The difference points to either a relatively reduced∆A or an enhanced ∆n. This difference can be explained by the discrepancybetween extinction and absorption which was shown in Fig. 2.10(a). For large
41

2 Optically probing of magnetic manipulation: theory and application.
samples, the scattering term becomes significant and the total extinction is nolonger proportional to Im(∆α) [see equations (2.31) and (2.30)]. This effect ismost dominant at lower wavelengths (∝ 1/λ4), which is in full agreement withthe deviation seen in Fig. 2.18(d).
For samples with either a very low absorbance and/or a high scattering am-plitude, linear birefringence is often the only possibility to measure the inducedalignment. This is usually at higher wavelengths where scattering terms arerather low. In contrast to the absorbance resonance, LB has a significant sig-nal on the red-shifted side of the absorbance [around 900 nm in Fig. 2.18(d)].LB can be measured with one laser at a fixed wavelength. This is ideal toquickly screen samples. However, it is really difficult to quantify the LB signaland to disentangle different contributions to the signal in a single wavelengthexperiment. In that case it is better to measure the LB spectrum, but thenLD is much more easy to interpret. For low absorbance LB is most sensitiveon the steepest part of the absorbance trace, while LD is most sensitive onthe absorbance maximum. Past experiences with other colloids and aggregatesmake us conclude that up to an absorbance of 3 at the probing wavelength(measured intensity I = 10−3I0), LD and LB show comparable signal to noise.For a stronger light absorbance, lower concentrations and/or thinner cuvettesare necessary. Here, the signal to noise decreases due to a low intensity on thedetector.
References
[1] M. V. Berry and A. K. Geim Eur. J. Phys. 18, 307 (1997).
[2] E. Beaugnon and R. Tournier Nature 349, 470–470 (1991).
[3] G. Maret and K. Dransfeld, Biomolecules and Polymers in High SteadyMagnetic Fields. In Strong and Ultrastrong Magnetic Fields and TheirApplications. Springer-Verlag, Berlin/New York (1985).
[4] I. O. Shklyarevskiy, P. C. M. Christianen, E. Aret, H. Meekes, E. Vlieg,G. Deroover, P. Callant, L. van Meervelt, and J. C. Maan J. Phys. Chem.B 108, 16386–16391 (2004).
[5] J. C. Gielen, I. O. Shklyarevskiy, A. P. H. J. Schenning, P. C. M. Chris-tianen, and J. C. Maan Sci. Technol. Adv. Mater 10, 14601 (2009).
[6] J. C. Gielen, M. Wolffs, G. Portale, W. Bras, O. Henze, A. F. M. Kilbinger,W. J. Feast, J. C. Maan, A. P. H. J. Schenning, and P. C. M. ChristianenLangmuir 25, 12721276 (2009).
42

References
[7] D. W. P. M. Lowik, I. O. Shklyarevskiy, L. Ruizendaal, P. C. M. Chris-tianen, J. C. Maan, and J. C. M. van Hest Adv. Mater. 19, 11911195(2007).
[8] M. Liebi, P. G. van Rhee, P. C. M. Christianen, J. Kohlbrecher, P. Fischer,P. Walde, and E. J. Windhab Langmuir 29, 3467–3473 (2013).
[9] U. Kreibig and L. Genzel Surface Science 156, 678–700 (1985).
[10] C. Bohren and D. Huffman, Absorption and Scattering of Light by SmallParticles. New York: Wiley (1998).
[11] J. C. Kemp, Polarized Light and its Interaction with Modulated Devices.HINDS International, Hillsboro (1987).
[12] C. Kittel, Introduction to Solid State Physics (8th edition). New York:Wiley (2005).
[13] Y. Ikezoe, N. Hirota, J. Nakagawa, and K. Kitazawa Nature 393, 749–750(1998).
[14] A. T. Catherall, L. Eaves, P. J. King, and S. R. Booth Nature 422, 579–579(2003).
[15] N. Hirota, M. Kurashige, M. Iwasaka, M. Ikehata, H. Uetake, T. Takayama,H. Nakamura, Y. Ikezoe, S. Ueno, and K. Kitazawa Physica B: CondensedMatter 346347, 267 – 271 (2004). Proceedings of the 7th InternationalSymposium on Research in High Magnetic Fields.
[16] Y. Kitahama, Y. Kimura, and K. Takazawa Langmuir 22, 7600–7604(2006).
[17] A. A. Bothner-By, C. Gayathri, P. C. M. van Zijl, C. MacLean, J.-J. Lai,and K. M. Smith Magn. Reson. Chem. 23, 935–938 (1985).
[18] N. Micali, H. Engelkamp, P. G. v. Rhee, P. C. M. Christianen, L. M.Scolaro, and J. C. Maan Nat. Chem. 4, 201–207 (2012).
[19] I. O. Shklyarevskiy, P. Jonkheijm, P. C. M. Christianen, A. P. H. J.Schenning, E. W. Meijer, O. Henze, A. F. M. Kilbinger, W. J. Feast,A. Del Guerzo, J.-P. Desvergne, and J. C. Maan J. Am. Chem. Soc. 127,1112–1113 (2005).
43

2 Optically probing of magnetic manipulation: theory and application.
[20] P. G. van Rhee, R. S. M. Rikken, L. K. E. A. Abdelmohsen, J. C. Maan,R. J. M. Nolte, J. C. M. van Hest, P. C. M. Christianen, and D. A. WilsonNat. Commun. 5, 5010 (2014).
[21] A. Saupe Z. Naturfors. A 19, 161 (1964).
[22] J. Seelig Q. Rev. Biophys. 10, 353–418 (1977).
[23] J. C. Gielen, Supramolecular aggregates in high magnetic fields. PhD thesis,Radboud University Nijmegen (2010).
[24] I. O. Shklyarevskiy, Deformation and ordering of molecular assemblies inhigh magnetic fields. PhD thesis, Radboud University Nijmegen (2005).
[25] M. I. Boamfa, Manipulation of molecular structures with magnetic fields.PhD thesis, Radboud University Nijmegen (2003).
[26] P. G. van Rhee, P. Zijlstra, T. G. A. Verhagen, J. Aarts, M. I. Katsnelson,J. C. Maan, M. Orrit, and P. C. M. Christianen Phys. Rev. Lett. 111,127202 (2013).
[27] A. D. Buckingham and J. A. Pople Proceedings of the Physical Society.Section B 69, 1133 (1956).
[28] W. L. Bragg and A. B. Pippard Acta Crystallographica 6, 865–867 (1953).
[29] C. Bosshard, J. Hulliger, M. Florsheimer, and P. Gunter, Organic Materi-als for Nonlinear Optics. Academic, New York (1987).
[30] J. D. Jackson, Classical Electrodynamics (3rd edition). New York: Wiley(1998).
[31] D. Griffiths, Introduction to Electrodynamics (4th edition). Boston:Addison-Wesley (2012).
[32] D. Craig, Magnetism. Principles and Applications. New York: Wiley(1995).
[33] R. Gans Ann. Phys. 342, 881900 (1912).
[34] G. Mie Ann. Phys. 330, 377–445 (1908).
[35] P. B. Johnson and R. W. Christy Phys. Rev. B 6, 4370–4379 (1972).
[36] B. T. Draine and P. J. Flatau J. Opt. Soc. Am. A 11, 1491–1499 (1994).
44

References
[37] S. Prescott and P. Mulvaney J. Appl. Phys. 99, 123504 (2006).
[38] E. S. Kooij and B. Poelsema Phys. Chem. Chem. Phys. 8, 3349–3357(2006).
[39] C. Ungureanu, R. G. Rayavarapu, S. Manohar, and T. G. v. LeeuwenJournal of Applied Physics 105, 102032 (2009).
[40] C. Novo, D. Gomez, J. Prez-Juste, Z. Y. Zhang, H. Petrova, M. Reismann,P. Mulvaney, and G. V. Hartland Phys. Chem. Chem. Phys. 8, 3540–3546(2006).
[41] L. Drost, Solid-Body Rotation of a Fluid under inuence of Gravity andSurface Tension. Bachelor thesis, Radboud University Nijmegen (2012).
[42] F. de Graaf, Aggregation kinetics in a chiral selection process. Masterthesis, Radboud University Nijmegen (2013).
[43] A. F. Drake J. Phys. E: Sci. Instrum. 19, 170 (1986).
45


Chapter 3
Selection of supramolecularchirality by rotational andmagnetic forces
Abstract
Many essential biological molecules exist only in one of two pos-sible mirror-image structures, either because they possess a chiralcenter or through their structure (helices, for example, are intrin-sically chiral), but so far the origin of this homochirality has notbeen unraveled. Here we demonstrate that the handedness of heli-cal supramolecular aggregates formed by achiral molecules can bedirected by applying rotational, gravitational and orienting forcesduring the self-assembly process. In this system, supramolecularchirality is determined by the relative directions of rotation andmagnetically tuned effective gravity, but the magnetic orientationof the aggregates is also essential. Applying these external forcesonly during the nucleation step of the aggregation is sufficient toachieve chiral selection. This result shows that an almost instanta-neous chiral perturbation can be transferred and amplified in grow-ing supramolecular self-assemblies, and provides evidence that afalsely chiral influence is able to induce absolute enantioselection.
Part of this work has been published in:N. Micali, H. Engelkamp, P.G. van Rhee, P.C.M. Christianen, L. Monsu Scolaro, J.C.Maan, Nature Chemistry 4, 201-207 (2012).
47

3 Selection of supramolecular chirality by rotational and magnetic forces
3.1 Introduction
Most essential biological molecules exist only in one of the two possible enan-tiomers (mirror-image structures) and are either left- or right-handed. Theorigin of this single handedness (homochirality) in biological systems is un-known, despite its importance for the emergence of life itself [1, 2]. The questto unravel this mystery has triggered an intense search to identify possible ex-ternal influences that are able to cause enantioselection [3], such as circularlypolarized light [4–6], the electroweak interaction [7, 8], vortex motion [9], stir-ring [10–13], catalysis at prochiral crystal surfaces [14,15] and combinations ofexternal fields [16, 17]. However, external forces can account only for a tinyenantiomeric excess [18] and an additional mechanism is required for the chi-rality to be amplified into homochiral systems [6, 15,19–25].
To date, the combined enantioselection by purely physical fields and sub-sequent amplification of chirality, in the absence of these fields, has not beenshown. Here we demonstrate that the application of rotational and magnetic(both levitating and orientating) forces only during the initial stage of the self-assembly of achiral molecules in solution leads to selection of chirality in thenucleation phase, which is subsequently amplified in the growing assemblies.Using this particular set of physical forces (rotation, levitation – also referredto as ‘effective’ gravitation – and orientation) to create a hydrodynamic chiralflow in solution has several advantages. First, all forces are tuneable in size anddirection: the gravitational and alignment forces are controlled by applyinghigh magnetic fields, through magnetic levitation [26, 27] and magnetic orien-tation [28–31], respectively. This permits us to investigate the separate effectsof each of these forces on the chiral selection process. Second, the chiral signof the flow can be chosen freely by the relative directions of the rotation andthe effective gravity; that is, the chiral sign is inverted by inverting the effectivegravity, without changing the rotation sense [32]. Third, this approach makesit very easy to impose the physical chiral bias only at the very beginning ofthe self-assembly process (the nucleation phase) and remove the bias duringthe subsequent growth step. This allows us to disentangle the chiral selectionand propagation steps, which is very difficult (although possible) with the morecommonly used chemical chiral templates, for which disentanglement requirestheir complete removal prior to the growth step [15]. Fourth, the supramolec-ular chirality is measured ex situ by circular dichroism (CD) at the very endof the self-assembly process, in the absence of the external physical forces. Asa result, solely the chirality of the aggregates at rest is measured, and any CDsignals that may be present only during the rotation are avoided [33–35].
Using this approach we find that the handedness of the aggregates is di-
48
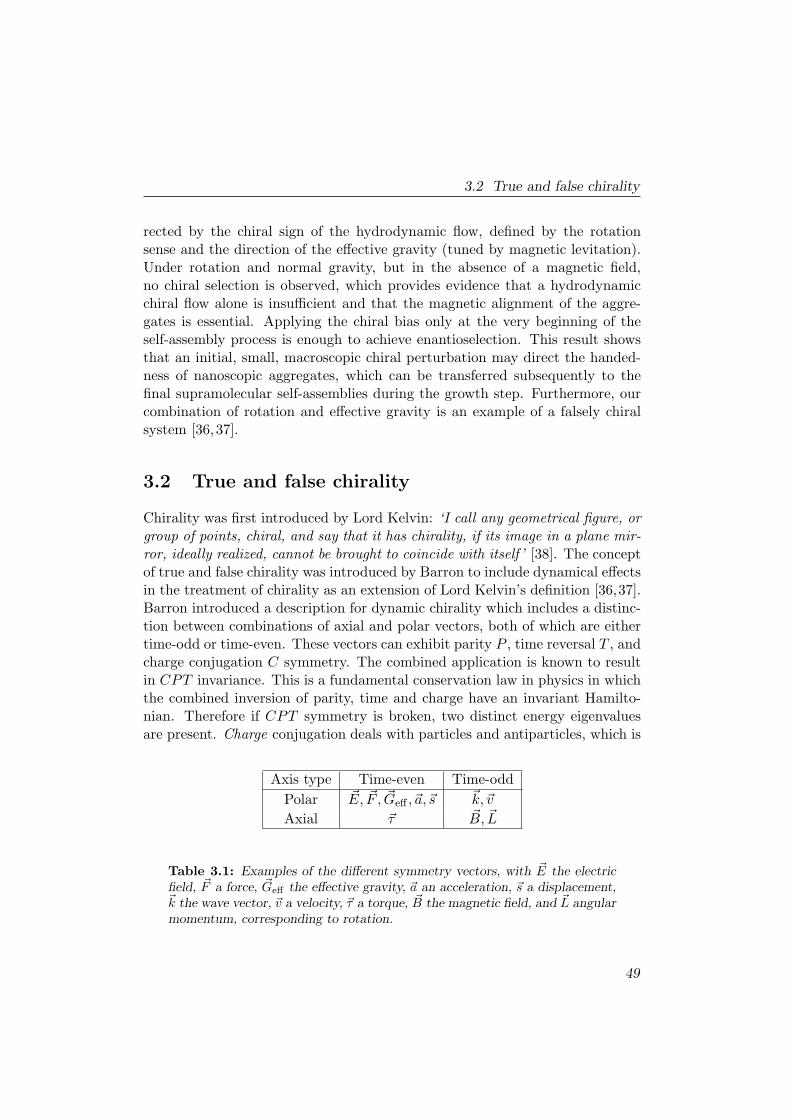
3.2 True and false chirality
rected by the chiral sign of the hydrodynamic flow, defined by the rotationsense and the direction of the effective gravity (tuned by magnetic levitation).Under rotation and normal gravity, but in the absence of a magnetic field,no chiral selection is observed, which provides evidence that a hydrodynamicchiral flow alone is insufficient and that the magnetic alignment of the aggre-gates is essential. Applying the chiral bias only at the very beginning of theself-assembly process is enough to achieve enantioselection. This result showsthat an initial, small, macroscopic chiral perturbation may direct the handed-ness of nanoscopic aggregates, which can be transferred subsequently to thefinal supramolecular self-assemblies during the growth step. Furthermore, ourcombination of rotation and effective gravity is an example of a falsely chiralsystem [36,37].
3.2 True and false chirality
Chirality was first introduced by Lord Kelvin: ‘I call any geometrical figure, orgroup of points, chiral, and say that it has chirality, if its image in a plane mir-ror, ideally realized, cannot be brought to coincide with itself ’ [38]. The conceptof true and false chirality was introduced by Barron to include dynamical effectsin the treatment of chirality as an extension of Lord Kelvin’s definition [36,37].Barron introduced a description for dynamic chirality which includes a distinc-tion between combinations of axial and polar vectors, both of which are eithertime-odd or time-even. These vectors can exhibit parity P , time reversal T , andcharge conjugation C symmetry. The combined application is known to resultin CPT invariance. This is a fundamental conservation law in physics in whichthe combined inversion of parity, time and charge have an invariant Hamilto-nian. Therefore if CPT symmetry is broken, two distinct energy eigenvaluesare present. Charge conjugation deals with particles and antiparticles, which is
Axis type Time-even Time-odd
Polar E, F , Geff , a, s k, v
Axial τ B, L
Table 3.1: Examples of the different symmetry vectors, with E the electricfield, F a force, Geff the effective gravity, a an acceleration, s a displacement,k the wave vector, v a velocity, τ a torque, B the magnetic field, and L angularmomentum, corresponding to rotation.
49
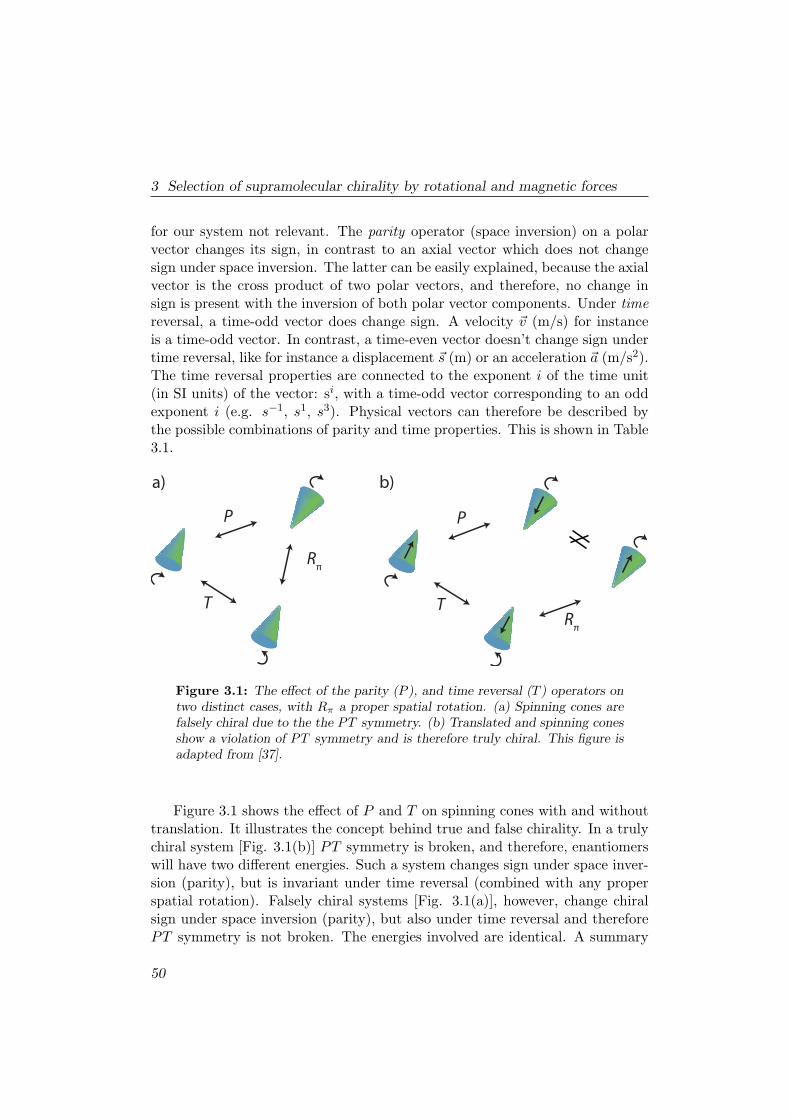
3 Selection of supramolecular chirality by rotational and magnetic forces
for our system not relevant. The parity operator (space inversion) on a polarvector changes its sign, in contrast to an axial vector which does not changesign under space inversion. The latter can be easily explained, because the axialvector is the cross product of two polar vectors, and therefore, no change insign is present with the inversion of both polar vector components. Under timereversal, a time-odd vector does change sign. A velocity v (m/s) for instanceis a time-odd vector. In contrast, a time-even vector doesn’t change sign undertime reversal, like for instance a displacement s (m) or an acceleration a (m/s2).The time reversal properties are connected to the exponent i of the time unit(in SI units) of the vector: si, with a time-odd vector corresponding to an oddexponent i (e.g. s−1, s1, s3). Physical vectors can therefore be described bythe possible combinations of parity and time properties. This is shown in Table3.1.
a)
T
P
Rπ
b)
T
P
Rπ
Figure 3.1: The effect of the parity (P ), and time reversal (T ) operators ontwo distinct cases, with Rπ a proper spatial rotation. (a) Spinning cones arefalsely chiral due to the the PT symmetry. (b) Translated and spinning conesshow a violation of PT symmetry and is therefore truly chiral. This figure isadapted from [37].
Figure 3.1 shows the effect of P and T on spinning cones with and withouttranslation. It illustrates the concept behind true and false chirality. In a trulychiral system [Fig. 3.1(b)] PT symmetry is broken, and therefore, enantiomerswill have two different energies. Such a system changes sign under space inver-sion (parity), but is invariant under time reversal (combined with any properspatial rotation). Falsely chiral systems [Fig. 3.1(a)], however, change chiralsign under space inversion (parity), but also under time reversal and thereforePT symmetry is not broken. The energies involved are identical. A summary
50

3.3 Experimental methods
of the possible chiral vector combinations is shown in Table 3.2.
Axis type Time-even axial Time-odd axial
Time-even polar True FalseTime-odd polar False True
Table 3.2: Type of chirality for two combined forces. Note that a combinationof only axial or only polar vectors is achiral.
In this work the two distinct enantiomeric states of the physical forces areinterconverted by both space inversion and time reversal. In the case of ther-modynamic equilibrium such a falsely chiral influence should not lead to enan-tioselection, because the two enantiomeric states are isoenergetic. However, inour case the chiral selection occurs in the nucleation phase of the self-assemblyprocess and therefore provides insight into how a falsely chiral influence that isunder kinetic control and far from equilibrium is able to induce absolute enan-tioselection. It thereby confirms a long-standing theoretical prediction that afalsely chiral influence can induce absolute enantioselection [17,36,37].
3.3 Experimental methods
As a spectroscopic probe, we used the J-aggregates of an achiral molecularbuilding block, tris-(4-sulfonatophenyl)phenylporphyrin (TPPS3) [Fig. 3.2(a)].The TPPS3 molecules aggregate into assemblies through an interplay of elec-trostatic and π-stacking interactions, and it is reported that stirring TPPS3solutions can cause mirror-symmetry breaking in their supramolecular helicalassemblies [10–12]. Aggregation is triggered in an aqueous solution by loweringthe pH and increasing the ionic strength. Immediately after preparation (upto two hours) the aggregates are very small (< 40 nm), as evidenced by a verylow light-scattering intensity. The full aggregation process requires three daysto complete. The final equilibrated aggregates exhibit an absorption band at490 nm [Fig. 3.2(c)] and their chirality is revealed by exciton-split CD bands[Fig. 3.2(b)] [39]. Elastic and quasi-elastic light-scattering data also show thatthese final TPPS3 aggregates remain relatively small (gyration radius ≤ 0.1 µm,hydrodynamic radius ≤ 0.8 µm) [Fig. 3.3] and are much smaller than the struc-tures investigated in previous studies [10–12]. These nanosize aggregates aretoo small to sediment and therefore do not align under the influence of nor-mal gravity. Moreover, within these previous studies, orientation/alignmentwithin laminar flows is only reached for sufficiently large aggregates which can
51
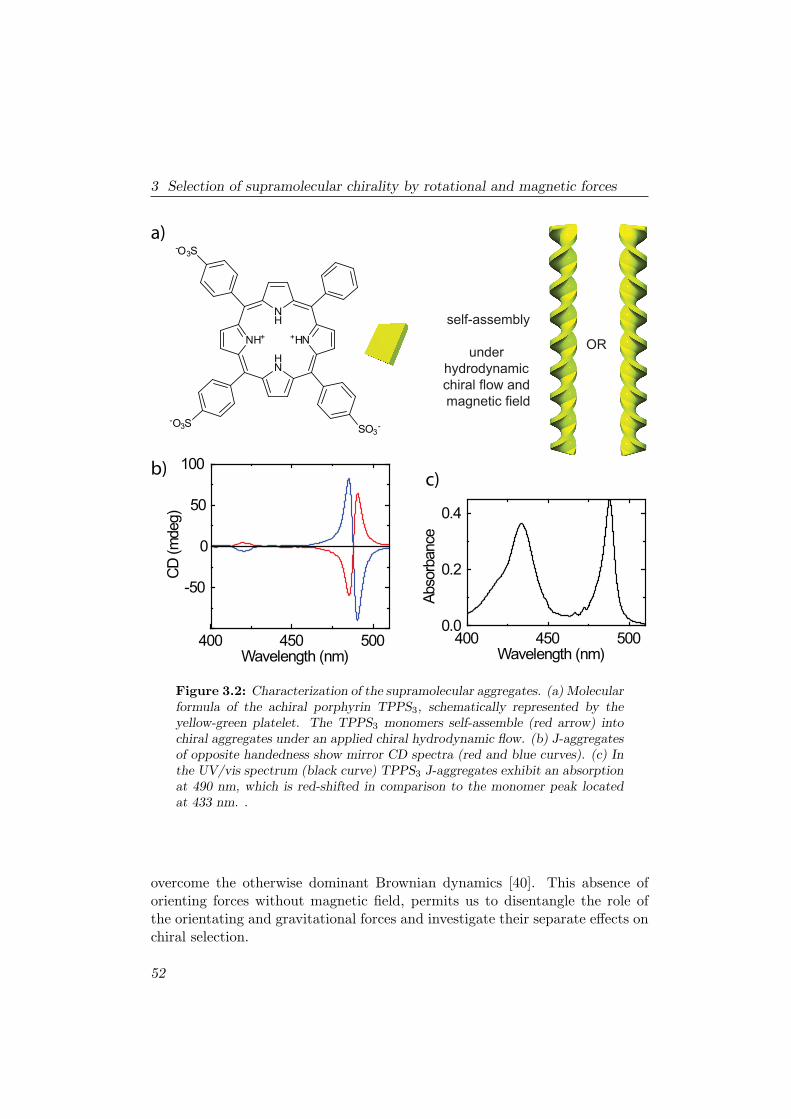
3 Selection of supramolecular chirality by rotational and magnetic forces
OR
self-assembly
under
hydrodynamic
chiral flow and
magnetic field
NH
+HN
HN
NH+
SO3-
-O3S
-O3S
400 450 500
CD
(m
deg)
Wavelength (nm)
-50
0
50
100
400 450 500
0.0
0.2
0.4
Abso
rbance
Wavelength (nm)
a)
b)c)
Figure 3.2: Characterization of the supramolecular aggregates. (a) Molecularformula of the achiral porphyrin TPPS3, schematically represented by theyellow-green platelet. The TPPS3 monomers self-assemble (red arrow) intochiral aggregates under an applied chiral hydrodynamic flow. (b) J-aggregatesof opposite handedness show mirror CD spectra (red and blue curves). (c) Inthe UV/vis spectrum (black curve) TPPS3 J-aggregates exhibit an absorptionat 490 nm, which is red-shifted in comparison to the monomer peak locatedat 433 nm. .
overcome the otherwise dominant Brownian dynamics [40]. This absence oforienting forces without magnetic field, permits us to disentangle the role ofthe orientating and gravitational forces and investigate their separate effects onchiral selection.
52

3.3 Experimental methods
0 500 1000103
104
105
0.1 110-4
10-3
10-2
10-1
100
10-3
10-2
10-1
100b)
I(Q) (
coun
ts)
Q2 ( m-2)
a)
Spec
tral a
mpl
itude
RH ( m)
Num
ber concentration
Figure 3.3: Elastic (ELS) and quasi-elastic (QELS) light-scattering exper-iments were performed at small and wide angles using an HeNe laser andcustom-made apparatus [41]. The particle-size analysis was performed onequilibrated samples three days after preparation, using a method describedin the literature [41, 42]. (a) ELS measurements (blue symbols) on TPPS3 J-aggregates. The red line is the regression of the data according to the Guinierlaw. (b) Size distribution obtained by the CONTIN analysis of QELS measure-ments on the same samples (red line). The blue line shows the number con-centration distribution calculated by taking into account the non-normalizedform factor of scatterers through the Mie theory [41,42]. ELS and QELS datareveal the presence of small aggregates (Rg ≥ 0.1 µm; RH ≤ 0.8 µm) evenafter a month from mixing the reagents.
Sample preparation
In a typical run, a 3 µM solution of TPPS3 (Midcentury, sodium salt) wasacidified with aqueous H2SO4 (98%, Fluka) to a final concentration of 0.0133M (pH 1.9) and eventually aggregation was triggered by adding a 3 M solutionof NaCl (SigmaUltra) up to a concentration of 0.1 M in a total volume of 7 mL(water used for preparing stock solutions and for diluting samples was high-purity doubly distilled from Galenica Senese). This stock solution was quicklydivided into various aliquots (0.9 ml) in small 2 ml vials with screw caps andTeflon septa.
53

3 Selection of supramolecular chirality by rotational and magnetic forces
33
33
33
46
33
24
7
6
5
4
3
2
1
spacing (mm)
vial #
ω
B
-100
0
50
100
-150
-100
-50
0
50
100
150
10 15 20 25
-2 -1 0 1 2 3 4
Magnetic Field (T)
Vertic
al p
osi
tion z
(m
m)
Geff (Gn )
enhanced
eff. gravity
inverted
eff. gravity
normal
gravity
near
levitation
-50
z (
mm
)
a) b) c)
Figure 3.4: (a) The set-up consists of a tube that holds seven vials each withan aggregating TPPS3 solution (shown in green). These vials were placed atdifferent positions z (black scale) inside the magnet and rotated (orange arrow,f = 15 Hz) for time periods from t = 30 to t = 120 minutes. The magnetic
field was oriented vertically (B, red arrow). The local effective gravity Geff
experienced by the samples is shown by blue (enhanced positive Geff), black(normal gravity), red (inverted Geff) and green (near zero Geff or levitation)arrows. (b) Magnetic field profile (black line) and Geff(z) for water (red line)as a function of the position z. The black and red vertical arrows indicatethat the bottom and top scales correspond, respectively, to B(z) and Geff(z).The position of the samples is indicated by dots: blue, positive Geff (vials 1-3);black, normal gravity Gn (vial 4); red, negative Geff (vials 5,6); green, nearzero Geff(vial 7). (c) Schematic representation of the liquids within the vialsusing the same vertical position scale. The liquid is sketched in green with ablack screw cap on top.
Experimental procedure
The experiment is outlined in Fig. 3.4(a). Seven cylindrical vessels were placedat different positions (z) inside a magnet (Bcentre = 0, 16 or 25 T) and rotated at
54

3.3 Experimental methods
fixed frequency (15 Hz) for a period t, which ranged from 30 to 120 minutes, ata temperature of 23 C [Fig. 3.4(a)]. Such rotation of cylindrical vessels resultsin a solid-body rotation or rotational vortex motion of the solution [43], andso avoids the creation of pseudovortices. Clockwise and anticlockwise (viewingfrom the top) rotation was used [Fig. 3.4(a)]. The alignment force was deter-mined by the strength B(z) of the applied magnetic field and results from theanisotropy in the magnetic susceptibility χ along the different molecular axesof the porphyrin [Fig 3.4(b)] [28–31]. Solutions in the vessels at different verti-cal positions (along the z-axis) inside the magnet experience different magneticfield strengths B(z) and field gradients dB(z)/dz [Fig 3.4(b), black line]. Thisleads to a magnetic levitation force proportional to χB(z)dB(z)/dz, as well asa z-dependent effective gravity Geff(z)(= |Geff(z)|):
Geff(z) = Gn
(1 +B(z)
dB
dz
|χ|Gnµ0ρ
)(3.1)
with ρ being the density of the material, µ0 the magnetic constant and Gn
normal gravity [32] (see section 2.3 for more details on levitation and effectivegravity). When Bcentre = 25 T, the vessel at z = 0 does not experience an extramagnetic force [Geff = Gn, Fig. 3.4(b), vial 4]; the three vessels with z < 0undergo an enhanced effective gravity [Geff > Gn, Fig. 3.4(b), vials 1-3]; thevessels with z > 0 experience an inverted effective gravity [Geff < 0, Fig. 3.4(b),vials 5,6], with the very top vessel located close to the magnetic levitation point[Geff = 0, Fig. 3.4(b), vial 7], where the magnetic force upwards cancels thegravitational force downwards.
The paraboloidal shape of the solution at various values of Geff is illustratedin Fig. 3.5. A vial was rotated in the levitation position, with an increasingmagnetic field, imaged by the experimental setup described in Fig. 2.13. Thecurvature increases with decreasing Geff, is maximal around Geff = 0 whenall the solution resides at the wall and is inverted for negative Geff. Blankexperiments with Geff = Gn were performed on rotating samples, in the sameexperimental set-up, but at B = 0.
After each experiment the samples were extracted from the magnet andallowed to stand for three days at 23 C. After this period each solution wastransferred from the vessel to a quartz cell (Hellma, 1 cm path length) for theultraviolet-visible (UV/vis) absorbance (spectrophotometer Varian Cary 50)and CD measurements (spectropolarimeter Jasco model J-810 and J-815), aprocedure that avoids any artefacts that may arise from the material sticking tothe wall of the vessels [11] and that measures the true supramolecular chiralityof the formed TPPS3 aggregates at rest.
55

3 Selection of supramolecular chirality by rotational and magnetic forces
(1.00±0.00)Gn (0.67±0.02)Gn (0.26±0.05)Gn
(0.05±0.06)Gn (-0.32±0.09)Gn (-0.67±0.11)Gn (-1.06±0.14)Gn
(0.92±0.01)Gn
5 mm
Figure 3.5: Photographs showing the influence of effective gravity Geff (de-creasing from top left to bottom right) on the surface of spinning water (15Hz). The images are taken at the levitation point with an increasing magneticfield resulting in a decreasing Geff.
3.4 Chiral selection
Figure 3.6 summarizes the correlations between the different external forces andthe observed chirality, showing typical CD spectra for different chiral signs ofthe hydrodynamic flow. Without a magnetic field (left panels), both clockwiseand anticlockwise rotations led to CD spectra that exhibited relatively lowintensities and signs that are not correlated to the rotation sense. In a magneticfield (middle and right panels), the CD intensity increased drastically, and thehandedness was determined by the relative directions of spinning and effectivegravity.
In chapters 4 and 5 we will quantify the sign and magnitude of the supramolec-ular chirality by the dissymmetry factor ∆g = g(491 nm) - g(486 nm), where gis the ratio of the CD to the conventional absorption (g = ∆A/A, where A is theabsorbance of the sample and ∆A = AL−AR, with AL and AR the absorbanceof left- and right-handed circular polarized light, respectively) [39]. The sign of∆g for almost all samples prepared in a magnetic field (156 out of 166, 94%)correlated with the chiral sign of the flow (see also Fig. 4.3). ∆g was negativefor clockwise rotation with Geff > 0 and it was still negative for anticlockwiserotation with Geff < 0; vice versa, ∆g was positive for anticlockwise rotation
56

3.4 Chiral selection
Δg<0
Δg>0
Δg<0
Δg>0
B=0T, Geff
=Gn
B>0T, Geff
>0 B>0T, Geff
<0
Figure 3.6: Typical CD spectra showing the correlation between the hand-edness (chirality) and the spinning directions (clockwise (CW), upper panels,and anticlockwise (ACW), lower panels) and effective gravity (Geff > 0, middlepanels, and Geff < 0, right panels), with (middle and right panels) and without(left panels) a magnetic field, with B = 0 (left panels) and B > 0 (middle andright panels). Without a magnetic field, no correlation between rotation andhandedness was observed (left panels). With a magnetic field, the handednesswas inverted by inverting the rotation direction under the same gravity or byinverting the effective gravity under the same rotation sense. The full statisticson ∆g are shown in Fig. 4.3.
with Geff > 0 and for clockwise rotation with Geff < 0. Thus, the sign of ∆g waschanged by inverting the direction of either the rotation sense or the effectivegravity. Inverting both leaves the chiral sign unchanged. The handedness ofthe aggregates is, therefore, determined exclusively by the relative directions ofthe rotational and gravitational forces applied, which is shown schematically inFig. 3.7. The rotation is characterized by angular momentum L, whose direc-tion is set by clockwise or anticlockwise rotation (viewed from the top). Thedirection of the effective gravity vector Geff is varied by the magnetic levitation.Antiparallel L and Geff (Fig. 3.7, red box) leads to one handedness and parallelL and Geff (Fig. 3.7, blue box) results in the opposite handedness. This finding
57

3 Selection of supramolecular chirality by rotational and magnetic forces
Δg < 0
Δg > 0
OR
TPPS 3
480 500
-50
0
50
CD
(m
deg)
CD
(m
deg)
Wavelength (nm)
-50
0
50
OR
L Geff L Geff
L Geff L Geff
Figure 3.7: TPPS3 (yellow-green platelet) self-assembles in the presence ofan initial external chiral influence generated by rotational and magnetic forces.The rotation is characterized by the angular momentum (L), the direction ofwhich is set by clockwise or anticlockwise rotation (viewing from the top). The
effective gravity (Geff) is tuned by a magnetic levitation force. Depending onthe symmetry of the combined forces the system grows into left-handed orright-handed aggregates, identified by their CD spectra (yellow helices, shownhere for illustrative purposes; the handedness corresponding to each set offorces has not been determined). In particular, a parallel arrangement of
L and Geff (blue box), achieved by clockwise rotation and Geff > 0 or by
anticlockwise rotation and Geff < 0, leads to negative CD signals (blue curve,
lower right panel); vice versa, an antiparallel arrangement of L and Geff (red
box), achieved by anticlockwise rotation and Geff > 0 or by clockwise rotation
and Geff < 0, leads to positive CD signals (red curve, upper right panel).
is a unique example where supramolecular chirality is proved to be influencedby gravity, and one of the very few cases [44, 45] in which gravity is shown toaffect a chemical process at all.
At B = 0 and Geff = Gn small values of ∆g were observed, with a biastowards positive ∆g for both rotation directions [Fig. 4.3]. This is probablycaused by a small, unidentified chemical chiral contamination in the startingmaterials. This bias, however, was overruled completely by the applied falselychiral set of physical forces, which underlines the efficiency of our experimentalapproach.
58
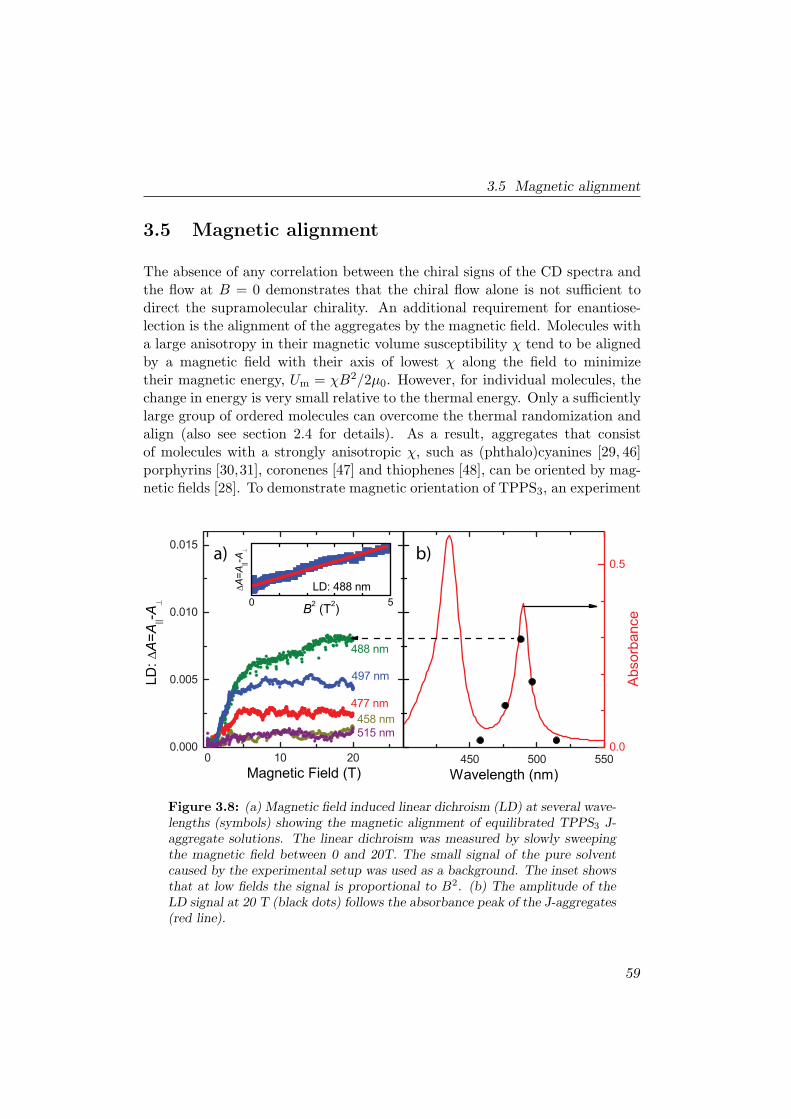
3.5 Magnetic alignment
3.5 Magnetic alignment
The absence of any correlation between the chiral signs of the CD spectra andthe flow at B = 0 demonstrates that the chiral flow alone is not sufficient todirect the supramolecular chirality. An additional requirement for enantiose-lection is the alignment of the aggregates by the magnetic field. Molecules witha large anisotropy in their magnetic volume susceptibility χ tend to be alignedby a magnetic field with their axis of lowest χ along the field to minimizetheir magnetic energy, Um = χB2/2µ0. However, for individual molecules, thechange in energy is very small relative to the thermal energy. Only a sufficientlylarge group of ordered molecules can overcome the thermal randomization andalign (also see section 2.4 for details). As a result, aggregates that consistof molecules with a strongly anisotropic χ, such as (phthalo)cyanines [29, 46]porphyrins [30,31], coronenes [47] and thiophenes [48], can be oriented by mag-netic fields [28]. To demonstrate magnetic orientation of TPPS3, an experiment
a) b)
Figure 3.8: (a) Magnetic field induced linear dichroism (LD) at several wave-lengths (symbols) showing the magnetic alignment of equilibrated TPPS3 J-aggregate solutions. The linear dichroism was measured by slowly sweepingthe magnetic field between 0 and 20T. The small signal of the pure solventcaused by the experimental setup was used as a background. The inset showsthat at low fields the signal is proportional to B2. (b) The amplitude of theLD signal at 20 T (black dots) follows the absorbance peak of the J-aggregates(red line).
59

3 Selection of supramolecular chirality by rotational and magnetic forces
was performed on an equilibrated TPPS3 aggregate solution, which consists offull-grown aggregates. The solution is contained in a 5 mm thick optical cell(Hellma), positioned in the temperature controlled (23 ± 0.1C) centre of themagnet. Using magnetic field-induced linear dichroism (LD) alignment can bemeasured (for more details see section 2.10). LD is sensitive around the aggre-gate absorbance and measures the differential absorbance: ∆A = A∥−A⊥, withA∥ and A⊥ the parallel and perpendicular absorbance respectively. The mea-sured curve exhibits the typical magnetic alignment behaviour [see Fig. 3.8(a)],which is most pronounced at the absorbance maximum of the aggregate [Fig.3.8(b), close to 488 nm]. At low fields the LD signal (proportional to the degreeof orientation) increases with B2, which saturates at higher fields when thealignment is complete [29,30,46].
3.6 Discussion
The direction of B does not influence the results for chiral selection. In thiscontext it is important to note that the magnetic field itself does not play afundamental role [49], as opposed to, for example, magnetochiral photochem-istry [16] and magnetochiral dichroism [50, 51], where the chiral sign dependson the absolute orientation of the field with respect to the light propagation.In our study, the magnetic field orientation relative to the directions of rota-tion and effective gravity is not relevant. The magnetic field merely providesthe tunable levitation and alignment forces, which both are proportional to B2.Levitation and alignment created by any other means are expected to lead to anidentical chiral selection process. Previous studies [10–12] on stirring/rotatedvortices showed alignment for sufficiently large aggregates within laminar flowsand normal gravity [40].
It is crucial that absorption-, CD-, and light scattering-signals of the ag-gregates are not or barely detectable immediately after removing the chiralperturbation. These signals are measured after three days, when the solution isequilibrated (Fig. 3.9). Considering the experimental evidence (see also chap-ters 4 and 5), we propose the following schematic model for the enantioselectionmechanism. In the nucleation period preceding the growth of the aggregates,nanoassemblies form in solution. At this stage the hydrodynamic flow givesa chiral twist to the nuclei. The magnetic field orients the nuclei along therotation axis, and thereby decreases the influence of the randomizing Brownianmotion that tends to destroy the chirality. Once the chiral seeds are formed,they serve as templates for chiral growth, even after the chiral influence isremoved, which leads to amplification of the supramolecular chirality.
60

3.6 Discussion
101
102
103
104
105
0.05
0.10
Abso
rbance
at 490 n
m
Time (s)
rotation + magnetic
levitation and alignment
chiral selection
during nucleation
chiral amplification
during growth
Figure 3.9: Proposed model for the chiral selection and amplification. Thechiral perturbation (rotation and magnetic alignment and levitation) is appliedduring the early stage of the aggregation process (blue arrow). At this stage,the achiral TPPS3 monomers (yellowgreen platelets) self-assemble into smallnanoassemblies (short yellow helices), which within a couple of days grow intolarger chiral structures (yellow helices). The plot shows a typical kinetic ab-sorbance trace (at 490 nm, black dots), fitted by a single exponential functionas a guide to the eye (red line).
Within this model, the ∆g values obtained are expected to depend stronglyon the experimental conditions such as rotation speed, size of Geff, degree ofmagnetic orientation, the dimensions of the vessels and the exposure time t.The rotation speed and vial dimensions were constant in our experiments. Themagnetic orientation and Geff were varied simultaneously, because the differentvessels in the magnet experienced different field strengths and field gradients(Fig. 3.4).
Chapter 4 shows the crucial dependence on magnetic field and effectivegravity. Furthermore it shows the full analysis on the standard experiment, with
61
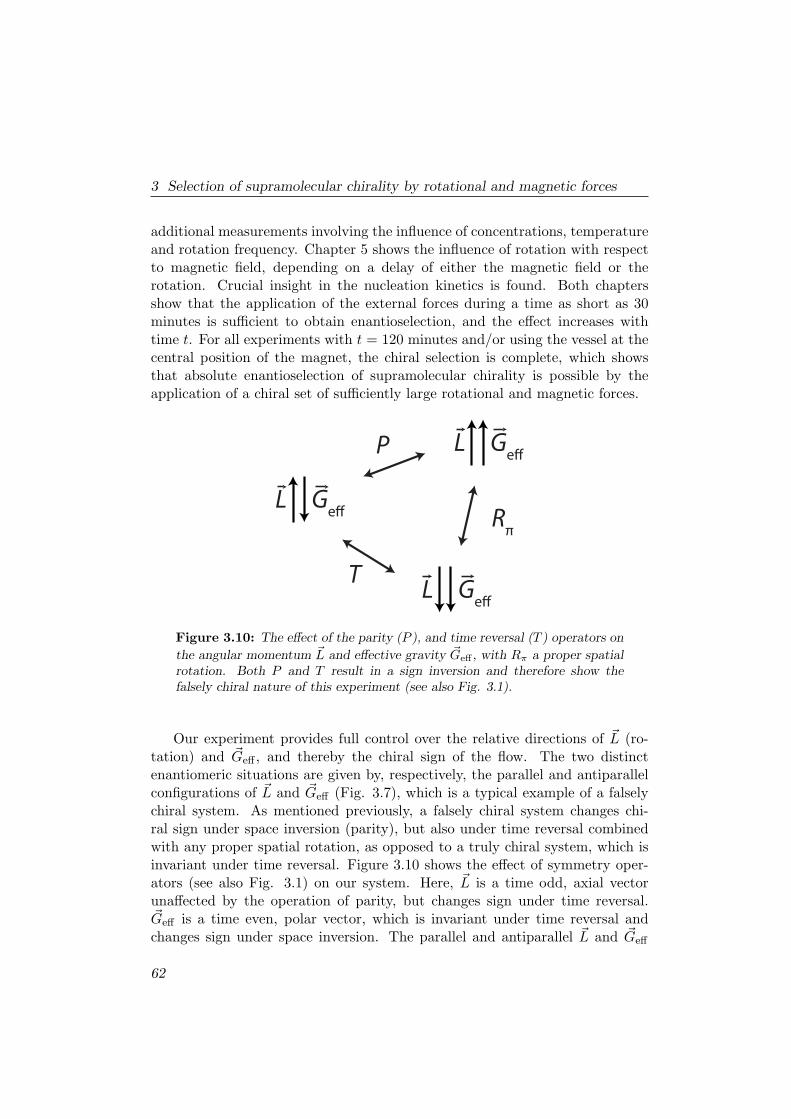
3 Selection of supramolecular chirality by rotational and magnetic forces
additional measurements involving the influence of concentrations, temperatureand rotation frequency. Chapter 5 shows the influence of rotation with respectto magnetic field, depending on a delay of either the magnetic field or therotation. Crucial insight in the nucleation kinetics is found. Both chaptersshow that the application of the external forces during a time as short as 30minutes is sufficient to obtain enantioselection, and the effect increases withtime t. For all experiments with t = 120 minutes and/or using the vessel at thecentral position of the magnet, the chiral selection is complete, which showsthat absolute enantioselection of supramolecular chirality is possible by theapplication of a chiral set of sufficiently large rotational and magnetic forces.
T
P
Rπ
L Ge
L Ge
L Ge
Figure 3.10: The effect of the parity (P ), and time reversal (T ) operators on
the angular momentum L and effective gravity Geff , with Rπ a proper spatialrotation. Both P and T result in a sign inversion and therefore show thefalsely chiral nature of this experiment (see also Fig. 3.1).
Our experiment provides full control over the relative directions of L (ro-tation) and Geff , and thereby the chiral sign of the flow. The two distinctenantiomeric situations are given by, respectively, the parallel and antiparallelconfigurations of L and Geff (Fig. 3.7), which is a typical example of a falselychiral system. As mentioned previously, a falsely chiral system changes chi-ral sign under space inversion (parity), but also under time reversal combinedwith any proper spatial rotation, as opposed to a truly chiral system, which isinvariant under time reversal. Figure 3.10 shows the effect of symmetry oper-ators (see also Fig. 3.1) on our system. Here, L is a time odd, axial vectorunaffected by the operation of parity, but changes sign under time reversal.Geff is a time even, polar vector, which is invariant under time reversal andchanges sign under space inversion. The parallel and antiparallel L and Geff
62

References
are, therefore, interconnected by both space inversion and time reversal, whichmakes it a falsely chiral system that, under thermodynamic equilibrium, shouldnot lead to enantioselection [36,37]. However, because here the chiral selectionoccurs during the nucleation phase of the self-assembly process, the system isunder kinetic control, far from equilibrium, and time-reversal symmetry is bro-ken. Under such conditions it has been predicted that a falsely chiral influencemight lead to absolute enantioselection [17,36,37,49].
3.7 Conclusion
In summary we exploited a combination of physical forces to generate a macro-scopic hydrodynamic chiral flow that directs the handedness of nanoscale aggre-gates. We show that orientation of the aggregates is indispensable to activatethe mechanism for chiral mirror-symmetry breaking. The results presented hereprovide insight into how an extremely small [18] falsely chiral [17, 36, 37] influ-ence can be expressed and amplified in a supramolecular system. These resultsprovide experimental support for the hypothesis on the important role of vor-tices for full enantioselection. Whether these external influences are involvedin prebiotic chemistry – with relation to the onset of the homochirality of life– remains an open question.
References
[1] G. H. Wagniere, On Chirality and the Universal Asymmetry: Reflectionson Image and Mirror Image. Wiley-VCH Verlag (2007).
[2] P. L. Luisi, The Emergence of Life: From Chemical Origins to SyntheticBiology. Cambridge University Press (2006).
[3] S. F. Mason Nature 311, 19–23 (1984).
[4] J. J. Flores, W. A. Bonner, and G. A. Massey J. Am. Chem. Soc. 99,3622–3625 (1977).
[5] J. Bailey, A. Chrysostomou, J. H. Hough, T. M. Gledhill, A. McCall,S. Clark, F. Mnard, and M. Tamura Science 281, 672–674 (1998).
[6] W. L. Noorduin, A. A. C. Bode, M. van der Meijden, H. Meekes, A. F. vanEtteger, W. J. P. van Enckevort, P. C. M. Christianen, B. Kaptein, R. M.Kellogg, T. Rasing, and E. Vlieg Nat. Chem. 1, 729–732 (2009).
63

3 Selection of supramolecular chirality by rotational and magnetic forces
[7] R. Berger and M. Quack ChemPhysChem 1, 57–60 (2000).
[8] D. K. Kondepudi and G. W. Nelson Nature 314, 438–441 (1985).
[9] V. Aquilanti and G. S. Maciel Orig Life Evol Biosph 36, 435–441 (2006).
[10] J. M. Ribo, J. Crusats, F. Sagus, J. Claret, and R. Rubires Science 292,2063–2066 (2001).
[11] A. D’Urso, R. Randazzo, L. LoFaro, and R. Purrello Angewandte Chemie122, 112–116 (2010).
[12] C. Escudero, J. Crusats, I. Dez-Prez, Z. El-Hachemi, and J. M. RiboAngew. Chem. Int. Ed. 118, 8200–8203 (2006).
[13] O. Arteaga, A. Canillas, J. Crusats, Z. El-Hachemi, J. Llorens, E. Sac-ristan, and J. M. Ribo ChemPhysChem 11, 35113516 (2010).
[14] A. Kuhn and P. Fischer Ang. Chem. Int. Ed. 48, 6857–6860 (2009).
[15] T. Kawasaki, S. Kamimura, A. Amihara, K. Suzuki, and K. Soai Angew.Chem. Int. Ed. 50, 6796–6798 (2011).
[16] G. L. J. A. Rikken and E. Raupach Nature 405, 932–935 (2000).
[17] M. Avalos, R. Babiano, P. Cintas, J. L. Jimnez, J. C. Palacios, and L. D.Barron Chem. Rev. 98, 2391–2404 (1998).
[18] C. A. Mead and A. Moscowitz J. Am. Chem. Soc. 102, 7301–7302 (1980).
[19] C. Viedma Phys. Rev. Lett. 94, 065504 (2005).
[20] A. Palmans and E. W. Meijer Angew. Chem. Int. Ed. 46, 8948–8968 (2007).
[21] R. Randazzo, A. Mammana, A. D’Urso, R. Lauceri, and R. Purrello Angew.Chem. Int. Ed. 47, 9879–9882 (2008).
[22] R. Lauceri, A. Raudino, L. M. Scolaro, N. Micali, and R. Purrello J. Am.Chem. Soc. 124, 894–895 (2002).
[23] H. Onouchi, T. Miyagawa, K. Morino, and E. Yashima Angew. Chem. Int.Ed. 45, 2381–2384 (2006).
[24] R. F. Pasternack, A. Giannetto, P. Pagano, and E. J. Gibbs J. Am. Chem.Soc. 113, 7799–7800 (1991).
64
References
[25] E. Bellacchio, R. Lauceri, S. Gurrieri, L. M. Scolaro, A. Romeo, andR. Purrello J. Am. Chem. Soc. 120, 12353–12354 (1998).
[26] E. Beaugnon and R. Tournier Nature 349, 470–470 (1991).
[27] M. V. Berry and A. K. Geim Eur. J. Phys. 18, 307 (1997).
[28] G. Maret and K. Dransfeld, Strong and ultrastrong magnetic fields andtheir applications Ch. 3. Berlin: Springer-Verlag (1985).
[29] M. I. Boamfa, P. C. M. Christianen, H. Engelkamp, R. J. M. Nolte, andJ. C. Maan Adv. Funct. Mater. 14, 261–265 (2004).
[30] F. Helmich, C. Lee, M. Nieuwenhuizen, J. Gielen, P. Christianen,A. Larsen, G. Fytas, P. Leclre, A. Schenning, and E. W. Meijer Angew.Chem. Int. Ed. 49, 3939–3942 (2010).
[31] Y. Kitahama, Y. Kimura, and K. Takazawa Langmuir 22, 7600–7604(2006).
[32] M. C. R. Heijna, P. W. G. Poodt, K. Tsukamoto, W. J. d. Grip, P. C. M.Christianen, J. C. Maan, J. L. A. Hendrix, W. J. P. v. Enckevort, andE. Vlieg Appl. Phys. Lett. 90, 264105 (2007).
[33] A. Tsuda, M. Alam, T. Harada, T. Yamaguchi, N. Ishii, and T. AidaAngew. Chem. Int. Ed. 46, 8198–8202 (2007).
[34] M. Wolffs, S. George, e. Tomovi, S. Meskers, A. Schenning, and E. W.Meijer Angew. Chem. Int. Ed. 46, 8203–8205 (2007).
[35] J. Crusats, Z. El-Hachemi, and J. M. Ribo Chem. Soc. Rev. 39, 569 (2010).
[36] L. D. Barron Chem. Phys. Lett. 135, 1–8 (1987).
[37] L. D. Barron J. Am. Chem. Soc. 108, 5539–5542 (1986).
[38] W. T. Kelvin Baltimore lectures (1888).
[39] N. Berova, K. Nakanishi, and R. Woody, Circular Dichroism: Principlesand Applications. John Wiley & Sons (2000).
[40] J. M. Ribo, Z. El-Hachemi, and J. Crusats Rend. Fis. Acc. Lincei 24,197–211 (2013).
[41] V. Villari and N. Micali J. Pharm. Sci. 97, 1703–1730 (2008).
65

3 Selection of supramolecular chirality by rotational and magnetic forces
[42] N. Micali, V. Villari, G. M. L. Consoli, F. Cunsolo, and C. Geraci Phys.Rev. E 73, 051904 (2006).
[43] I. M. Cohen and P. K. Kundu, Fluid Mechanics. Academic Press (2008).
[44] J. Tabony and D. Job PNAS 89, 6948–6952 (1992).
[45] N. Glade, E. Beaugnon, and J. Tabony Biophysical Chemistry 121, 1–6(2006).
[46] I. O. Shklyarevskiy, P. C. M. Christianen, E. Aret, H. Meekes, E. Vlieg,G. Deroover, P. Callant, L. van Meervelt, and J. C. Maan J. Phys. Chem.B 108, 16386–16391 (2004).
[47] I. O. Shklyarevskiy, P. Jonkheijm, N. Stutzmann, D. Wasserberg, H. J.Wondergem, P. C. M. Christianen, A. P. H. J. Schenning, D. M. de Leeuw,e. Tomovi, J. Wu, K. Mllen, and J. C. Maan J. Am. Chem. Soc. 127,16233–16237 (2005).
[48] I. O. Shklyarevskiy, P. Jonkheijm, P. C. M. Christianen, A. P. H. J.Schenning, E. W. Meijer, O. Henze, A. F. M. Kilbinger, W. J. Feast,A. Del Guerzo, J.-P. Desvergne, and J. C. Maan J. Am. Chem. Soc. 127,1112–1113 (2005).
[49] L. D. Barron Science 266, 1491–1492 (1994).
[50] G. L. J. A. Rikken and E. Raupach Nature 390, 493–494 (1997).
[51] Y. Kitagawa, H. Segawa, and K. Ishii Angew. Chem. Int. Ed. 50, 9133–9136 (2011).
66

Chapter 4
Robustness of supramolecularenantioselection and itsscaling with the chiral force
Abstract
In the previous chapter we have qualitatively demonstrated thatthe handedness of supramolecular aggregates can be directed byapplying rotational, gravitational and orienting forces during theself-assembly of achiral porphyrin molecules. Here we quantita-tively show that the induced enantioselection can be achieved withina broad range of the relevant experimental parameters, includingtemperature, monomer and salt concentrations, rotation frequency,and magnetic field strength and profile. Although the enantiose-lection itself is strong and robust, the amplitude of the selection isclosely related to the application time, the aggregation speed andthe strength of the external forces. The dominant forces are deter-mined by the magnetic field induced properties – effective gravityGeff and magnetic field amplitude B – which result in a B2/Geff
dependence. These results provide further insight into how a shortchiral perturbation can be expressed and amplified in a supramolec-ular system.
Part of this work has been published in:N. Micali, H. Engelkamp, P.G. van Rhee, P.C.M. Christianen, L. Monsu Scolaro, J.C.Maan, Nature Chemistry 4, 201-207 (2012).And a manuscript is in preparation: P.G. van Rhee, I. Occhiuto, N. Micali, F. de Graaf,H. Engelkamp, J.C. Maan, L. Monsu Scolaro, P.C.M. Christianen
67

Robustness of supramolecular enantioselection and its scaling with . . .
4.1 Introduction
Most essential biological molecules exist only in one of the two possible enan-tiomers (mirror image structures) and are either left- or right-handed. Theorigin of this single handedness (homochirality) in biological systems is un-known [1, 2] and has triggered an intense search to identify possible externalinfluences that are able to cause enantioselection [3]. However, external forcescan account only for a tiny enantiomeric excess [4] and an additional mecha-nism is required for the chirality to be amplified into homochiral systems [5–13].In order to induce enantioselection using external forces (or chiral bias), it iscrucial to understand and use the transfer of chirality into a growing assembly.
Porphyrin aggregates are widely studied in a quest to unravel the influ-ence of external forces on supramolecular chirality. Successful examples includevortex motion [14], a stirring vortex [15], and stirring [16–18]. We have demon-strated that rotation combined with magnetic (both levitating and orientating)forces only during the initial stage of the self-assembly of achiral molecules insolution leads to selection of chirality in the initial aggregation phase, which issubsequently amplified in the growing assemblies [19] (chapter 3). The com-bination of rotational, gravitational and alignment forces gives a falsely chiralinfluence, which leads to full enantioselection, i.e. each vial has an enantiomericexcess (ee) of one particular enantiomer. A falsely chiral system changes chiralsign under space inversion (parity), similar to a ‘usual’ truly chiral system, butalso under time reversal (also see section 3.2). In the case of a thermodynamicequilibrium such a falsely chiral influence should not lead to enantioselection,because the two enantiomers are isoenergetic. However, here the chiral selectionoccurs at the very beginning of the self-assembly process [20,21].
This approach makes it very easy to impose a physical chiral bias only withinthe initial aggregation phase and to remove the bias during the subsequentgrowth step. Consequently, this allows us to disentangle the chiral selectionand propagation steps. The enantioselection is measured ex situ by circulardichroism (CD) at the very end of the self-assembly, in the absence of theexternal physical forces. As a result, solely the chirality of the aggregates atrest is measured, and any CD signals that may be present only during therotation are avoided [22–24].
The basic experiment (chapter 3) is the result of an optimized set of ex-perimental conditions [19]. In this chapter, we show that the experimentalconditions during the initial aggregation are critical to the success and strengthof the enantioselection. These conditions include magnetic field strength andprofile, temperature, application time, rotation frequency, ionic strength of thesolution, the monomer concentration, and the porphyrin batch & treatment.
68

4.2 Sample preparation and experimental set-up
The basic experiment is optimised for room temperature to prevent any heat(gradient) effects during the experiment [19]. Kinetic control is crucial in asense that the aggregation should not be too fast or too slow, compared toreasonable magnetic field application times (‘field times’). The concentration-and frequency-dependence is related to the kinetics [25]. Therefore, the kineticcontrol of our experiment is crucial in the selection process.
By varying the experimental conditions we find that variations in concen-tration and rotation frequency, only play a minor role on the presence of anenantiomeric excess (ee) in each vial. The size of the enantioselection withinone vial however is a delicate balance between several experimental conditions.The combined set of experiments provide a quantitative and qualitative insightinto how a falsely chiral influence that is under kinetic control and far fromequilibrium is able to induce absolute enantioselection.
4.2 Sample preparation and experimental set-up
The sample preparation was extensively described in section 3.3. The experi-ments in this chapter were performed with commercially available TPPS3 (Mid-century, sodium salt), and home-synthesised TPPS3, which gave identical ex-perimental results. The stock solutions (1.2 mM) were tested with HPLC mea-surements in order to exclude the presence of contaminants like meso-tetrakis(4-sulfonato phenyl) porphyrin (TPPS4). Moreover, 0, 1 or 2 hour of boiling (inreflux mode) of the batch was part of the stock preparation. Typically, a 3 µMsolution of TPPS3 was acidified with aqueous H2SO4 to a final concentration of0.0133 M (pH 1.9) and eventually aggregation was triggered with 0.1 M NaCl ina total volume of 7 ml. This stock solution was quickly divided into 7 aliquots(0.9-1 ml) in small 2 ml vials with screw caps and Teflon septa. These vialswere contained inside a stainless steel tube which was placed inside a cylindricalmagnetic field bore (Florida Bitter magnet) and rotated with a constant speed(15 Hz) at constant magnetic field (Bcentre = 25 T). Both clockwise (CW) andanticlockwise (ACW) rotation is used (viewing from the top). Figure 4.1(a)shows a sketched side-view of the vial positioning inside a magnetic field. Thesequentially labeled vials each experience a different magnetic field B(z), andmagnetic field gradient dB(z)/dz. The magnetic force experienced by a fluid(or object) inside a magnetic field is proportional to both B(z) and dB(z)/dzand results in a magnetic field-induced effective gravity Geff [see equation (2.6)and Fig 3.4(b), red line]. This results in a strong vertical position dependencewith an enhanced, reduced or even inverted effective gravity [fluid positionsare sketched in Fig. 4.1(a)]. More details on levitation and effective gravity
69

Robustness of supramolecular enantioselection and its scaling with . . .
were shown in sections 2.3 and 3.3. Depending on the vertical position, theeffective gravity can be between -2 and +4 times the normal gravity Gn. Thecentral vial experiences no change in its effective gravity, vials 1-3 experiencean enhanced effective gravity and vials 5 and 6 show inverted effective gravity[Fig. 4.1(a)]. Vial number 7 is positioned at the levitation position, where theeffective gravity is close to 0.
Additional experiments were performed in a duplex Bitter magnet, withan applied magnetic field Bcentre = 16 T. In this condition all vials experiencea positive effective gravity, except for vial 5 which is close to the levitationposition. Here, the field profile is similar to Bcentre = 15 T in Fig. 2.2.
Chiral quantification using circular dichroism
After the combination of rotation and magnetic field was applied, the sam-ples were extracted from the magnet and allowed to stand for three days at 23C. After this period each solution was transferred from the vessel to a quartzcell (Hellma, 1 cm path length) for the ultraviolet-visible (UV/vis) absorbance(spectrophotometer Varian Cary 50) and CD measurements (spectropolarime-ter Jasco model J-810 and J-815), a procedure that avoids any artifacts thatmay arise from the material sticking to the wall of the vessels [16].
The sign and magnitude of the supramolecular chirality is quantified by thedissymmetry factor: ∆g = gright − gleft, where g is the ratio of the CD to theconventional absorption: g = ∆A/A, where A is the absorbance of the sampleand ∆A = AL −AR, with AL and AR the absorbance of left- and right-handedcircular polarized light, respectively [26]. The maximum and minimum CDvalues of the bisignate spectrum were determined and are situated around 491and 486 nm. The sign determines the presence of enantioselection which weuse to define a global ‘enantiomeric excess’ (ee). Here, it is defined as the abso-lute percentage difference between the vials with and without enantioselection.Therefore, 0 % corresponds to random chiral selection, and 100% to enantios-election in each vial. The enantiomeric excess is plotted with error bars whichequal the step size: 200%/N , with N the number of performed experiments.
4.3 Evolution of the CD spectrum towards thermo-dynamic equilibrium
The absorbance as function of time showed a thermal equilibrium after 2-3 days(Fig. 3.9). The amplitude of the CD signal however, doesn’t necessarily followthe absorbance equilibrium. Figure 4.1 shows the CD spectra as function of
70

4.3 Evolution of the CD spectrum towards thermodynamic equilibrium
33
33
33
46
33
247
6
5
4
3
2
1
spacing (mm)
B vial #
a)
B
Figure 4.1: (a) Sketched side view of set-up: 7 vials are contained in anrotating aluminium tube. The central vial 4 is mounted in the magnetic fieldcenter (for more details see section 3.3). (b,c) The magnetic field is appliedfor 1 hour combined with clockwise (CW) rotation, the CD spectrum wasmeasured after an indicated time with respect to the start of the aggregationin a cleaned cuvette. The CD spectra for the central vial 4 is shown in (b) withan asymmetric shape evolving into a symmetric shape. (c) The resulting∆g foreach vial is plotted for different times. (d) The CD normalized spectrum g(λ)as a function of time for a rotated sample. The solution was kept inside thecuvette throughout the measurement showing a change from an asymmetrictowards a symmetric signal. (e) The dissymmetry factor ∆g as a function oftime.
time in two distinct cases: in one case the solution is stored within the vial(this involves multiple solution transfers for each optical experiment). In theother case the solution is stored within the measurement cuvette after the firstCD measurement (this involves one solution transfer after 6 hours).
First, the basic magnetic field experiment (B = 25 T, clockwise rotation at15 Hz) was performed and measured in a separate cuvette which was cleanedafter each measurement. Figure 4.1(b) shows that after 6 hours an asymmetricsignal is present which grows into a symmetric signal after 12 hours. Between 25
71

Robustness of supramolecular enantioselection and its scaling with . . .
0.1 1 100.0
0.1
0.2
0.3
Abs
orba
nce
at 4
89 n
m
Time (h)
0.000
0.002
0.004
g (m
deg)
Magnetic field + Rotation
Figure 4.2: The absorbance (489 nm) as function of time shows a rapidlyincreasing absorbance, both during rotation (first hour, red line) and after-wards (green line). However, the dissymmetry factor ∆g, which is the averageover the 6 vials [Fig. 4.1(c)] is increasing much more slowly, which proves theabsence of large chiral aggregates directly after turning off the magnet.
and 52 hours the signal stabilizes and finally decreases. The decrease in CD is aresult of the partial degradation of the solution after multiple transfers betweenthe cuvette and the vial. Since some porphyrin aggregates stick to the cuvettewall, these aggregates are removed after each measurement. The corresponding∆g shown in Fig 4.1(c) and shows a steady increase as function of time upto 25 h, with a final lower value at 52 h. This is explained by the successfulformation of chiral structures, which are slightly reduced (size and/or number)after 52 h due to a decrease in both monomer and aggregate absorbance. Theresults clearly shows the transformation from asymmetric to symmetric spectrain equilibrium.
Second, we have performed measurements without transferring the solutionout of the measurement cuvette after the first measurement. Figure 4.1(d)shows the evolution from an asymmetric signal towards a symmetric one, nor-malised on the total absorbance. The signal is quite stable after about 47 hours,with an optimum after 72 hours. Unfortunately, we cannot exclude artifactsfrom porphyrins self-assembling on the cuvette walls. Nevertheless the con-stant ∆g [Fig 4.1(e)] at later times proves the thermal equilibrium after 47-72hours. The combination of both measurements show that after 47 hours ther-mal equilibrium sets in, which after 72 hours is completely stable. Therefore,measuring the samples after 2 days is a minimum requirement. Optimally, themeasurement should be done after 3 days.
72

4.4 Chiral selection
Comparing the averaged CD results with the absorbance as a function oftime, shows some remarkable differences (Fig. 4.2). The aggregate absorbance(at 489 nm) was measured during and after 1 hour rotation outside the magneticfield. The red curve corresponds to the increasing aggregate absorbance duringrotation (the setup is shown in Fig. 2.14 [27]). After 1 hour the rotation isturned off, after which equilibrium is reached after about 10 hours (green line).Preliminary absorbance measurements with an applied magnetic field of 25 Tfor one hour indicates – on average – no change in aggregation speed comparedto the measurements in absence of magnetic field [27].
The dissymmetry factor ∆g rises on a different time scale and shows a re-tarded response relative to the increase in absorbance (Fig. 4.2). Depending onthe preparation protocol, different kinetics are possible. Work on similar por-phyrins showed for instance a close correlation between absorbance and ∆g, incontrast to our results. [25]. The initial absence of the CD signal highlights thecrucial role of an initial perturbation which amplifies over time in the absenceof chiral forces.
4.4 Chiral selection
The standard experiment (section 4.2) results in chiral selection, as was shownby the distinctive CD traces (see section 3.4 and [19]). Here we report anextensive study at B = 0, 16 and 25 T for both CW and ACW rotation, withdifferent field times [Fig. 4.3]. Without the application of a magnetic field, andwith a rotation of 60 minutes, no chiral selection is visible, as is evident fromthe small ∆g with random signs for all vials [left panel Fig. 4.3]. With thecombined application of a magnetic field and rotation, different vial positionsgave distinct chiral selection properties as is shown by the amplitudes and signsfor ∆g. For B = 25 T vials 1-4 (positive Geff) give a positive (negative) sign foranticlockwise (clockwise) rotation. For negative effective gravity, an inversion ofthe sign is measured for the same rotation sense. Vials 5 and 6 gave a negative(positive) sign for anticlockwise (clockwise) rotation.
Since each vial experiences a different magnetic field B and effective gravityGeff, the effect on the final chiral selection within each vial is different, which isreflected by the amplitude of ∆g. Except for vial 7 (corresponding to the levita-tion position) all vials show a strong reproducible chiral selection for Bcentre =25 T: vials 3 and 4 show the strongest response (correct sign for 41 out of 42,ee = 96 %); vials 5,6 a slightly weaker response (correct sign for 38 out of 41,ee = 86 %); and vials 1 and 2 show the weakest response (correct sign for 35out of 41, ee = 70 %).
73

Robustness of supramolecular enantioselection and its scaling with . . .
vials
1-4,6,7
∆g:
∆g:
vials 3,4 (central)all vials vials 5,6
vials 1,2 (edge)
Geff
> 0, B = 25 T G
eff>0,
B=16TG
eff<0, B=25 T G
eff = 1, B = 0
B
Figure 4.3: The chirality parameter ∆g measured for clockwise (CW, lowerpanels) and anticlockwise (ACW, upper panels) rotation; with Bcentre = 0 (leftpanels, black bars) and B > 0 (middle and right panels, Bcentre = 25 T for blueand pink bars, Bcentre = 16 T for green bars), under positive (middle panels,blue and green bars) and negative (right panels, pink bars) effective gravityconditions. Without a magnetic field, no correlation between rotation andhandedness was observed (left panels). With a magnetic field, the handednesswas inverted by inverting the rotation direction under the same gravity (forexample, for Geff > 0, compare the upper and lower middle panels) or byinverting the effective gravity under the same rotation sense (for example, forclockwise rotation compare the upper middle and right panels). The datataken at 16 T includes vials 1-4,6,7 with Geff > 0.
The handedness of the aggregates is, therefore, determined exclusively bythe relative directions of the rotational and gravitational forces applied (see Fig.3.7). The rotation is characterized by angular momentum L, the direction ofwhich is set by clockwise or anticlockwise rotation (viewed from the top). Thedirection of the effective gravity vector Geff is varied by the magnetic levitation.Antiparallel L and Geff leads to one handedness and parallel L and Geff resultsin the opposite handedness.
74

4.5 Temperature influences
Surprisingly, the application of 16 T during 2 hours, shows 100 % selection(42 experiments). In this case all vials (except vial 5 which is at the levitationposition, see Fig. 2.2) experience a positive Geff. This is shown in green in Fig.4.3. In section 5.4 it is shown that an increase of the total application timeresults in a gradually improved chiral selection for each vial (Fig. 5.6) whichexplains the 100 % selection for 2 hours application time.
Summarizing, we have seen a preferential enantioselection of 88 % (156out of 166 experiments) for an application time of 30-120 minutes. For thebasic chiral selection experiment with Bcentre = 25 T, the vial positions canbe ordered in two distinct categories: the central vials, which include centralvials 3-6 with a relative large chiral selection (ee = 90 %); and the edge vials1,2, with a weaker chiral selection (ee = 70 %) which is more often biased(∆g > 0) due to a weaker perturbation. This bias is (most probably) caused byan unidentified chemical chiral contamination within the starting materials [28].In the following the different dependencies are exploited to judge the stabilityof the chiral selection process under different circumstances.
4.5 Temperature influences
The chiral selection process is an amplification process over 3 days and dependson a falsely chiral influence acting during the initial aggregation. To preventheat differences between different vials and convection within one vial, everyexperiment was performed at room temperature. The final equilibrium dependson several parameters out of which temperature is an essential one. In thenucleation, growth and the final equilibrium, temperature can play a large rolefor the final enantioselection.
Influence of heat on monomer solution
The basic protocol includes dissolving TPPS3 powder in water which is keptas a stock solution. Additionally, we have boiled (refluxed) the concentratedTPPS3 stock (1.2 mM) for 1 and 2 hours. Figure 4.4(a) shows the dependence ofthe chiral selection with respect to the boiling time. The combined applicationof rotation and magnetic field was applied for either 30 or 60 minutes. Theselection percentages [Fig. 4.4(b)] are pointing both to a full selection foreither no or 1 hour boiling, whereas in case of 2 hours boiling a slight decreaseis visible. The average amplitude of ∆g shows a slightly decreasing trend withincreasing boiling time [Fig. 4.4(c)]. We conclude that boiling the stock solutiondoesn’t significantly change the chiral selection process.
75

Robustness of supramolecular enantioselection and its scaling with . . .
Figure 4.4: Variation in boiling of the monomer stock solution. (a) Thestandard protocol includes no boiling (0 h), and shows a strong chiral selection.The other panels show the introduction of pre-boiling the monomer solutionfor 1 or 2 hours. (b) Chiral selectivity as function of boiling time. A slightdecrease in the average selection is visible for an increased boiling time. Forvial 4 no change is visible. (c) Amplitude ∆g as a function of boiling time. Aslight decrease in amplitude is visible with increasing boiling time (with largespread), both for the average vial and the central vial 4.
Thermodynamic equilibrium
The temperature of the solution during the nucleation, the growth, and the finalequilibration can influence the outcome of the chiral selection. The aggregationprocess and the final thermal equilibrium depend on the applied temperature.Figure 4.5(a) shows the dependence of chiral selection with respect to the ap-plied temperature (20 C, 23 C, 26 C) during the chiral perturbation (sowith a variation of ±3 C relative to the standard experiment). No significantchange is visible in the selection results. Though the number of measurementsis limited, we can conclude that slightly varying temperature shows no drasticchanges for the chiral selection process.
However, larger temperature differences do lead to different equilibria as isshown in Fig. 4.5(b-d). With an increase in temperature less and/or smaller ag-gregates are measured, indicated by a reduced CD [Fig. 4.5(c)] and absorbance[Fig. 4.5(d)] peaks around 490 nm. The decrease in aggregates lead to a pro-portional increase in monomers shown by the isobestic points at 422 nm and
76

4.5 Temperature influences
Figure 4.5: Temperature dependence. (a) The standard protocol is per-formed at a temperature of 23 degrees. A small variation of ± 3 degreesdoesn’t show a substantial difference. (b) The dissymmetry factor ∆g as func-tion of temperature, which is stable up to 40 C despite a continuous decreasein both CD and absorbance with increasing temperature. (c) CD spectra ofa heated (rotated) sample from 20 towards 60 C, out of which the first andthe last spectra are in thermal equilibrium. (d) The corresponding absorbancespectra. Increasing the temperature increases the amount of monomers anddecreases the amount of aggregates. The change between 20 and 30 C isrelatively small.
455 nm. Interestingly the decrease in both the aggregate absorbance and CDamplitude is gradual, but the size of the dissymmetry factor ∆g only startschanging from 50 C onwards. This shows that up to 50 C the structure ofthe aggregates remains stable, only the number reduces. A small redshift inthe absorbance is visible at higher temperatures, which is most likely explainedby either larger aggregates surviving, or due to possible surface effects on thequartz cuvette.
It can be concluded that the effect on the structural properties of tempera-ture variations of a few degrees is very small, with a very stable ∆g. Moreover,the aggregate absorbance is most pronounced at lower temperatures due to theincrease in the number and/or size of the aggregates. Therefore, room tem-perature is the best and most convenient option for the basic chiral selectionprotocol.
77

Robustness of supramolecular enantioselection and its scaling with . . .
4.6 Kinetic control of chirality
The aggregation rate is optimised in order to have a large overlap of the nu-cleation time with reasonable magnetic field times at room temperature. TheTPPS3 and NaCl concentrations are specifically adjusted for this purpose. Byvarying these concentrations, the aggregation rate changes. Within the stan-dard experiment (30-60 minutes at 25 T) changing these parameters can giveinformation on the succes rate of the chiral selection with respect to the aggre-gation rate.
Influence of TPPS3 concentration
Figure 4.6(a) shows the dependence of the chiral selection with respect to theconcentration of TPPS3. The magnetic field and rotation were applied for ei-ther 30 or 60 minutes. The selection percentages [Fig. 4.6(a)] are pointing to
Figure 4.6: Variation in TPPS3 concentration. (a) The standard protocolincludes a TPPS3 concentration of 3 µM, and shows a strong chiral selection(90 %). The other panels show the result of an increasing concentration, witha similar selectivity. (b) Amplitude ∆g as function of TPPS3 concentration.A slight decrease in amplitude is visible with increasing concentration, bothfor the average vial and the central vial 4. (c) The absorbance of the monomer(top solid curves, at 435 nm) and the aggregates (bottom dashed curves, at 489nm) as function of time for non-rotated aggregation. With increasing TPPS3concentration the aggregation rate increases.
78

4.6 Kinetic control of chirality
full chiral selection for all concentrations. The size of the chiral selection ∆gis roughly constant. only the average amplitude of ∆g [Fig. 4.6(b)] is smallerfor the highest concentration of 5 µM. Although the effect is barely significant,this is in agreement with work on similar porphyrins where a reduction in thedissymmetry factor was connected to an increasing porphyrin concentration,which was connected to a faster aggregation rate [25]. We have performedadditional experiments to probe the aggregation rate with respect to the por-phyrin concentration. The aggregate absorbance (at 489 nm) and the monomerabsorbance (at 435 nm) was measured without rotation outside the magneticfield (the setup is shown in Fig. 2.14). Figure 4.6(c) shows that indeed for ahigher TPPS3 concentration, the aggregation speed increases. Therefore, thisdecreasing chiral selection trend could be related to an increase in TPPS3 con-centration and aggregation speed. More measurements on higher concentrationscould verify this trend.
Influence of salt concentration
Figure 4.7 shows the influence of varying the NaCl concentration. The chiralselection shows normal selection percentages but the amplitude is largely af-fected. The average amplitude of ∆g is decreasing with an increase in NaClconcentration [Fig. 4.7(b)]. Additional experiments were performed to probethe aggregation rate with respect to the NaCl concentration. The monomer ab-sorbance (at 435 nm) was measured in absence of rotation and magnetic field(the setup is shown in Fig. 2.14). Figure 4.7(c) shows an increase in aggregationspeed with the increase in NaCl concentration. The significance of the decreasein ∆g is limited, but a similar connection to the speed of the aggregation ispresent. Despite some quite significant changes in aggregation rate the chiralselection is still present.
We conclude that small changes in NaCl and TPPS3 concentration have nosignificant effect on the chiral selection percentage, and only marginally in theamplitude. This highlights the strong stability of the selection process.
79

Robustness of supramolecular enantioselection and its scaling with . . .
Figure 4.7: Variation in the NaCl concentration. (a) The standard protocolincludes a NaCl concentration of 100 mM, and shows a strong chiral selection(94 %). Increasing or decreasing the concentration still shows chiral selectionbut with a different average amplitude. (b) The amplitude of ∆g shows onaverage a decrease with increasing NaCl concentration. (c) The monomerabsorbance [at 435 nm, M(TPPS3) = 5µM] as function of time. Increasingthe NaCl concentration results in a faster aggregation.
4.7 Rotation frequency dependence
The chiral sign of the enantioselection was shown to depend on the relativedirection of rotation and the effective gravity inside a magnetic field (Figs. 4.3and 3.7). To further test the influence of rotation on the selection processthe standard experiment was performed using different rotation speeds. Figure4.8 shows the resulting chiral selection. From 1-5 Hz no chiral selection wasmeasured, which is apparent by the absence of correlation with the sign of∆g and the relative directions of L and G. In addition these solutions show anasymmetric bisignate CD signal (not shown). A frequency in the 8-10 Hz regionshowed a strong chiral selection for the central vials (14 out of 15 correct, 86 %)but a strongly biased selection for the edge vials which all show a positive sign(4 out of 8 correct, 0 %). For 15 and 25 Hz usual chiral selection was shown(88 and 100%).
The frequency-dependence highlights the importance of a sufficient rotationspeed for the chiral selection experiment. The shape of the surface of the rotatedfluids changes with rotation speed and is connected to fluid motion. Using the
80

4.7 Rotation frequency dependence
Figure 4.8: The chiral selection as a function of the rotation frequency. Upto 5 Hz no chiral selection is present, accompanied by an asymmetric bisignateCD spectrum. Between 8 and 10 Hz selection is strongly present in the centralvials, but with a positive bias for the edge vials. A rotation of 15 and 25 Hzshows a normal chiral selection.
experimental setup, which was described in Fig. 2.13, the rotating solutionwas imaged. The curvature increases with increasing rotation frequency, as isshown in Fig. 4.9(a). The curvature is determined by fitting the surface witha parabolic function: z(r)− z0 = αr2 with z and r the position in terms of theheight and radial distance, z0 the vertex height, and α the curvature index [Fig.4.9(b)]. At low frequencies (≤ 5 Hz) only a small variation in curvature withincreasing f is visible. From 10 Hz onwards the curvature is strongly increasingand roughly follows a f2 dependence expected for a rotating solution undernormal gravity (Fig. 4.9(c), [29, 30]). Within a magnetic field the effectivegravity Geff is altered. The surface of a rotating solution, inside a magneticfield, was shown for various values of Geff in Fig. 3.5. Its curvature increaseswith decreasing Geff, is maximal around Geff = 0 when all the solution residesat the wall and is inverted for negative Geff. An extensive study on the scalingof the curvature as function of rotation frequency ω and Geff showed a roughlyω2/Geff dependence [30]. The deviation from this dependence [Fig. 4.9(c)] ismainly explained by the large surface tension of water in combination with the
81

Robustness of supramolecular enantioselection and its scaling with . . .
adhesion of water on the wall [30].
c)
1.7 5 10 15 21.7
Frequency (Hz):
r
z0
z(r)
b)
Figure 4.9: (a) Photographs of spinning vials (1 mL water) with differentrotation frequencies. (b) The parabolic surface inside the vial is describedby z(r) − z0 = αr2. (c) The fitted parabolic parameter α as function of thesquared frequency f , which is approximately linear.
400 440 480 520-20
-10
0
10
20
Wavelength (nm)
CD
(mde
g)
Figure 4.10: The chiral selection for completely filled vials shows an asym-metric sign for all vials (1-6), with Bcentre = 25T and anticlockwise rotation.Both for positive Geff (blue lines) and negative Geff (pink lines) no chiral se-lection is present.
In an attempt to understand the role of the surface shape in the chiralselection, an additional standard selection experiment (1 hour rotation in 25T) was performed with completely filled vials. Figure 4.10 shows the chiralselection for clockwise rotation with Geff > 0 (blue lines) and Geff < 0 (pink
82

4.8 Magnetic scaling of chiral selection
lines). Chiral selection is absent in this experiment, which is apparent by theabsence of correlation with the sign of ∆g and the relative directions of L and G.Most surprisingly, the shape of the CD resembles the asymmetric shape typicalfor standing or slowly rotated solutions (Fig. 4.10). This effect is similar tovial 7 which is within the levitation position (Geff = 0, with water against thesidewall), and consequently also shows asymmetric shapes. This result showsthat the fluid dynamics are fundamentally different within completely filledvials. The surface and/or fluid dynamics are crucial in the chiral selectionprocess.
4.8 Magnetic scaling of chiral selection
We have shown a robust procedure that doesn’t depend strongly on parameterslike frequency, temperature, concentrations and preparation. However, the ∆gof different vial positions, strongly varies due to large differences in B and Geff
[Fig. 3.4(a,b)]. Moreover, the fluid dynamics have proven to be important: arotation below 10 Hz or within completely filled vials gave asymmetric signalswithout enantioselection. A strongly curved surface is therefore an indicatorof chiral selection with its curvature proportional to ω2/Geff. If the polarity ofthe magnetic field was inverted, no experimental difference is measured whichshows that only the amplitude of the magnetic field is important. The magneticfield provides the tunable levitation and alignment forces, which both scale withB2 (see sections 2.3 and 2.4 respectively).
To account for both scaling effects, we plotted ∆g as a function ofB2(z)/Geff(z)(Fig. 4.11), which is the master curve (using the data out of Fig. 4.3). All thedata points roughly follow a linear trend, with a slope determined by the spin-ning sense, as indicated by the red lines that correspond to the t = 60 minutesdata. The error bars with respect to the amplitude show the stochastic natureof the process. Application of the external forces during a time as short as 30minutes (Fig. 4.11, green triangles) is sufficient to obtain enantioselection, andthe effect increases with time t slightly modifying the slopes (see also Fig. 5.6).
We attribute the 1/Geff dependence to the influence of the actual chiralhydrodynamic flow, because the paraboloidal surface of a spinning liquid isinversely proportional to gravity (Fig 4.9) [29, 30]. If the macroscopic chiralhydrodynamic flow was responsible for sculpting the aligned growing aggregates,this would lead to a 1/Geff dependence. The absence of a parabolic surfacecoincides with an absence of chiral selection (Fig. 4.10). Therefore the presenceof a surface with sufficient parabolic curvature is linked to chiral selection.
The B2-dependence suggests a crucial role of the magnetic alignment of the
83

Robustness of supramolecular enantioselection and its scaling with . . .
-300 0 300 600
-0.02
0.00
0.02
-300 0 300 600
-0.02
0.00
0.02
5 6
B2/Geff(T2s2/m)
71,2
g: C
W ro
tatio
n
30 min (25T)60 min (25T)60 min (12-20T)120 min (16T)
5 6 1,23 7
4 34
vial # (25 T):
g: A
CW
rota
tion
B2/Geff (T2s2/m)
Figure 4.11: ∆g measured for both clockwise (upper panel) and anticlockwise(lower panel) rotation as a function of B2(z)/Geff(z). The standard experimentat 25 T is shown with green triangles (t = 30 minutes) and red circles (t = 60minutes). Additional measurements include the light blue diamonds (t =60 minutes, 12-20 T); and the dark blue squares (t = 120 minutes, 16 T).The individual points are shown on the left, and the averaged value with itsstandard deviation (with a minimum of 3 samples) for each vial position isshown on the right. Red lines are linear fits to the data points for t = 60minutes and B = 25 T.
aggregates and explains the low ∆g values and the absence of chiral selection atB = 0. It extends through the magnetic field range up to 25 T, because in thenucleation phase the aggregates are too small to be aligned completely [31–35],in contrast to the larger final aggregates after three days, which exhibit fullalignment around 10 T (Fig. 3.8). Ideally, one should measure the B2 depen-dence for the central vial only (in the absence of levitation forces, Geff = Gn).However, this procedure would involve a rather large magnet time investment,with only one datapoint per 30+ magnet-minutes measured (in contrast to 7datapoints per run).
Figure 4.11 provides an indication as to why, in some of the experiments, thechiral sign of the aggregates did not match the sign of the chiral flow: either theB2/Geff value is low (B2/Geff = 9 T2s2/m) or the variation of Geff within thevessel is large [B2/Geff = 23 T2s2/m, Fig. 3.4(b)], which, in combination withthe statistical spread in the data, explains the deviation. For all experimentswith t = 120 minutes and/or using central vial 4, where B and B2/Geff are large,
84

4.9 Discussion
the chiral selection is complete. Moreover, two regimes can be distinguished:the central vials 3-6 show a very strong chiral selection (95 %); the edge vials 1,2show a much weaker chiral selection (85 %) which is due to the small values ofB2/Geff (≤ 10). Essentially, these are a result of the low magnetic fields far fromthe magnetic field center. The open question remains, wether full saturation isreached in the enantioselection. With measured values up to ∆g = 0.03, higheraverage amplitudes are expected with the application of even higher magneticfields. This suggests that 100% enantioselectivity of supramolecular chiralityis possible by the application of a chiral set of sufficiently large rotational andmagnetic forces.
4.9 Discussion
Typically, rotation of cylindrical vessels results in a solid-body rotation or rota-tional vortex motion of the solution [29]. In an attempt to understand the in-fluence of the fluid dynamics several dependencies were shown. We have shownthat only the relative direction of rotation and effective gravity is essential forthe final chiral sign. Taking into consideration that no large contributions ofCD (Fig. 4.1) or elastic light scattering (Fig. 3.3) are present directly afterthe presence of magnetic field, shows that the chiral selection acts on the chiralseeds, which subsequently propagate into larger structures during a relativelyslow process (Fig. 4.2).
Chiral selection conditions
The selection conditions are a result of a racemic aggregation at room tem-perature, where the initial aggregation largely overlaps with the magnetic fieldapplication. This seems like quite a delicate balance. But most interestinglythe enantioselection is robust over a large range of variations. Temperaturewas crucial for the final thermodynamic equilibrium that is reached, but didnot change the chiral selection. The concentration of the monomers and saltalters the efficiency of the chiral selection, but the enantioselection remainedsteadily present. The frequency drastically changes the diffusion of particlesand therefore the growth, but only a small change in selectivity is visible. Thelatter two effects do however show a decrease in the amplitude of ∆g withan increasing monomer/salt concentration or rotation frequency. We speculatethat this decrease is related to the increased aggregation rate (in line with workon similar porphyrins [25]). A comparable dependence on amplitude, but noton the selection percentage was seen with an increase in field time (see alsochapter 5). A longer application time resulted in an enhanced dissymmetry
85

Robustness of supramolecular enantioselection and its scaling with . . .
factor ∆g. Although the enantioselection is very robust, the amplitude tells usthat optimizing the application of the perturbation with respect to the initialaggregation is crucial for the final efficiency.
Rotation influence on aggregate
The exact position where preferential chiral growth is microscopically presentremains an open question. In chapter 5 it will be shown that rotation enhancesthe nucleation speed, caused by an enhanced mixing of the particles. The finalaggregates show distinct properties as a result of the applied rotation: the non-rotated samples always show an asymmetric bisignate CD spectrum, in contrastto the rotated samples which show a symmetric CD shape. The symmetricbisignate signal is reported to result from an intrinsically chiral packing ofthe building blocks [36] in combination with a higher order mesoscopic chiralitywith a frozen spiral structure [17,18]. Conversely, the asymmetric sign indicatessubstantial differential scattering with respect to the differential absorbance[37], this corresponds to a larger and/or less defined structure. The latter is inagreement with large, randomly folded-like structures as were reported in AFMmeasurements [17].
Chiral sign comparison
Previous research by several groups indicated that using only rotational forcescan result in chiral selection [14–18]. Despite the fact that we employ additionalmagnetic orientational forces on smaller final aggregates, a comparison to theresults gives some relevant insights [Fig. 4.12(a-c)]. Ribo et al. showed for thefirst time the enantioselection of TPPS3 using rotary evaporation (300 rpm, 1,5hour) [15]. This method results in a negative ∆g with clockwise rotation [Fig.4.12(a)]. They reported that the enantioselection of a racemic mixture resultsfrom imperfect mixing (laminar flows). The significant flow is the downwardprogress of the fluid in the final stages of the evaporation process. Escudero etal. showed an opposite chiral sign for stirring in a constant volume [17] insidea squared cuvette. A magnetic stirrer was used in combination with a constantTPPS3 concentration [Fig. 4.12(b)]. For low stirring speed (50 rpm, 24 hours)no selection was found, for a higher speed (300 rpm, 24 hours) a positive ∆gwas found for clockwise stirring. In this case large hydrodynamic gradientsare present along the wall, resulting in upward laminar flows. Therefore, thedominant flow is the upward flow of the liquid along the wall.
Comparing our experiment to these findings, a positive ∆g would be ex-pected for fast rotated samples, with a possible dominant upward flow with
86

4.10 Conclusion
a) b) c)
∆g<0 ∆g>0
?
∆g<0
B
top view
side view
Figure 4.12: Sign comparison of ∆g for distinct chiral selection experimentswith clockwise rotation (viewed from top, indicated with red arrows). (a)A rotary evaporator results in a negative ∆g due to a downward spiral fluidtrajectory (blue arrow) [15]. (b) A stirring bar within a squared cuvette resultsin a positive ∆g caused by an upward spiral fluid trajectory along the wallof the cuvette (blue arrows) [17]. (c) A combination of magnetic field B androtation results in a negative ∆g, which is related to a combination of the fluidtrajectory and magnetic alignment. The exact fluid trajectories are unknown(blue arrow shows a suggestion).
rotation [Fig. 4.12(c)]. However, no chiral sign is observed for rotation only.Interestingly, the chiral selection inside a magnetic field has a negative ∆g fora positive effective gravity and clockwise rotation. Microscopically, multipleexplanations are possible, any small effect might be sufficient to shift the bal-ance of the critical nucleation process. Taking into account either a solid-bodyrotation, or a macroscopic vortex flow, multiple explanations can contribute.We attribute the chiral selection to magnetic alignment, the (partial) alignmentof small clusters within a rotating flow gives a preferential growth of one enan-tiomer. Additional contributions might result from the magnetic Lorentz force,which can induce complicated trajectories on the charged molecules. Note, thatan inverted magnetic field did not affect the chiral selection. Therefore, it ex-cludes an explanation only involving the cross product of the magnetic fieldand vortex motion [38].
4.10 Conclusion
In conclusion, we have shown that variations of concentrations, temperature,and frequency only play a minor role on the chiral selection efficiency. The
87

Robustness of supramolecular enantioselection and its scaling with . . .
amplitude however – the chiral balance in a single vial – is a delicate balancebetween all kinds of parameters. The main criterium for a large amplitude isa large overlap between the initial aggregation period, and the application ofthe rotation and magnetic field. Moreover a strong correlation is found withrespect to the applied magnetic field and effective rotation. This leads to aB2/Geff dependence. For the central vial and/or 2 hour application a 100 %chiral selection efficiency was found. The exact mechanism on the nanoscaleremains an interesting open question, our results provide a different mechanismcompared to selection by laminar flows [39]. The results presented here providefurther insight into how an extremely small [4] falsely chiral [20,21,40] influencecan be expressed and amplified in a supramolecular system.
References
[1] G. H. Wagniere, On Chirality and the Universal Asymmetry: Reflectionson Image and Mirror Image. Wiley-VCH Verlag (2007).
[2] P. L. Luisi, The Emergence of Life: From Chemical Origins to SyntheticBiology. Cambridge University Press (2006).
[3] S. F. Mason Nature 311, 19–23 (1984).
[4] C. A. Mead and A. Moscowitz J. Am. Chem. Soc. 102, 7301–7302 (1980).
[5] W. L. Noorduin, A. A. C. Bode, M. van der Meijden, H. Meekes, A. F. vanEtteger, W. J. P. van Enckevort, P. C. M. Christianen, B. Kaptein, R. M.Kellogg, T. Rasing, and E. Vlieg Nat. Chem. 1, 729–732 (2009).
[6] T. Kawasaki, S. Kamimura, A. Amihara, K. Suzuki, and K. Soai Angew.Chem. Int. Ed. 50, 6796–6798 (2011).
[7] C. Viedma Phys. Rev. Lett. 94, 065504 (2005).
[8] A. Palmans and E. W. Meijer Angew. Chem. Int. Ed. 46, 8948–8968 (2007).
[9] R. Randazzo, A. Mammana, A. D’Urso, R. Lauceri, and R. Purrello Angew.Chem. Int. Ed. 47, 9879–9882 (2008).
[10] R. Lauceri, A. Raudino, L. M. Scolaro, N. Micali, and R. Purrello J. Am.Chem. Soc. 124, 894–895 (2002).
[11] H. Onouchi, T. Miyagawa, K. Morino, and E. Yashima Angew. Chem. Int.Ed. 45, 2381–2384 (2006).
88

References
[12] R. F. Pasternack, A. Giannetto, P. Pagano, and E. J. Gibbs J. Am. Chem.Soc. 113, 7799–7800 (1991).
[13] E. Bellacchio, R. Lauceri, S. Gurrieri, L. M. Scolaro, A. Romeo, andR. Purrello J. Am. Chem. Soc. 120, 12353–12354 (1998).
[14] V. Aquilanti and G. S. Maciel Orig Life Evol Biosph 36, 435–441 (2006).
[15] J. M. Ribo, J. Crusats, F. Sagus, J. Claret, and R. Rubires Science 292,2063–2066 (2001).
[16] A. D’Urso, R. Randazzo, L. LoFaro, and R. Purrello Angewandte Chemie122, 112–116 (2010).
[17] C. Escudero, J. Crusats, I. Dez-Prez, Z. El-Hachemi, and J. M. RiboAngew. Chem. Int. Ed. 118, 8200–8203 (2006).
[18] O. Arteaga, A. Canillas, J. Crusats, Z. El-Hachemi, J. Llorens, E. Sac-ristan, and J. M. Ribo ChemPhysChem 11, 35113516 (2010).
[19] N. Micali, H. Engelkamp, P. G. v. Rhee, P. C. M. Christianen, L. M.Scolaro, and J. C. Maan Nat. Chem. 4, 201–207 (2012).
[20] L. D. Barron Chem. Phys. Lett. 135, 1–8 (1987).
[21] L. D. Barron J. Am. Chem. Soc. 108, 5539–5542 (1986).
[22] A. Tsuda, M. Alam, T. Harada, T. Yamaguchi, N. Ishii, and T. AidaAngew. Chem. Int. Ed. 46, 8198–8202 (2007).
[23] M. Wolffs, S. George, e. Tomovi, S. Meskers, A. Schenning, and E. W.Meijer Angew. Chem. Int. Ed. 46, 8203–8205 (2007).
[24] J. Crusats, Z. El-Hachemi, and J. M. Ribo Chem. Soc. Rev. 39, 569 (2010).
[25] A. Romeo, M. A. Castriciano, I. Occhiuto, R. Zagami, R. F. Pasternack,and L. M. Scolaro J. Am. Chem. Soc. 136, 40–43 (2014).
[26] N. Berova, K. Nakanishi, and R. Woody, Circular Dichroism: Principlesand Applications. John Wiley & Sons (2000).
[27] F. de Graaf, Aggregation kinetics in a chiral selection process. Masterthesis, Radboud University Nijmegen (2013).
89

Robustness of supramolecular enantioselection and its scaling with . . .
[28] Z. El-Hachemi, C. Escudero, O. Arteaga, A. Canillas, J. Crusats,G. Mancini, R. Purrello, A. Sorrenti, A. D’Urso, and J. M. Ribo Chirality21, 408412 (2009).
[29] I. M. Cohen and P. K. Kundu, Fluid Mechanics. Academic Press (2008).
[30] L. Drost, Solid-Body Rotation of a Fluid under inuence of Gravity andSurface Tension. Bachelor thesis, Radboud University Nijmegen (2012).
[31] G. Maret and K. Dransfeld, Strong and ultrastrong magnetic fields andtheir applications Ch. 3. Berlin: Springer-Verlag (1985).
[32] M. I. Boamfa, P. C. M. Christianen, H. Engelkamp, R. J. M. Nolte, andJ. C. Maan Adv. Funct. Mater. 14, 261–265 (2004).
[33] F. Helmich, C. Lee, M. Nieuwenhuizen, J. Gielen, P. Christianen,A. Larsen, G. Fytas, P. Leclre, A. Schenning, and E. W. Meijer Angew.Chem. Int. Ed. 49, 3939–3942 (2010).
[34] Y. Kitahama, Y. Kimura, and K. Takazawa Langmuir 22, 7600–7604(2006).
[35] I. O. Shklyarevskiy, P. C. M. Christianen, E. Aret, H. Meekes, E. Vlieg,G. Deroover, P. Callant, L. van Meervelt, and J. C. Maan J. Phys. Chem.B 108, 16386–16391 (2004).
[36] Z. El-Hachemi, C. Escudero, F. Acosta-Reyes, M. T. Casas, V. Altoe,S. Aloni, G. Oncins, A. Sorrenti, J. Crusats, J. L. Campos, and J. M. RiboJournal of Materials Chemistry C 1, 3337 (2013).
[37] R. Rubires, J.-A. Farrera, and J. M. Ribo Chem. Eur. J. 7, 436–446 (2001).
[38] A. Kendl Physics of Plasmas 19, 112301 (2012).
[39] J. M. Ribo, Z. El-Hachemi, and J. Crusats Rend. Fis. Acc. Lincei 24,197–211 (2013).
[40] M. Avalos, R. Babiano, P. Cintas, J. L. Jimnez, J. C. Palacios, and L. D.Barron Chem. Rev. 98, 2391–2404 (1998).
90

Chapter 5
Unraveling the effect of thedistinct forces within theselection of supramolecularchirality
Abstract
The ability to steer the handedness of supramolecular aggregatesby applying rotational and magnetic forces during the self-assemblyof achiral monomers, provides us a method to switch on and offthe chiral influence at will and to investigate the effects of the in-dividual forces on the enantioselection. By delaying the magneticfield application we show that enantioselection takes place duringthe nucleation phase, which corresponds to 1 % of the total aggre-gation time. The application of the magnetic field in the nucleationphase is enough to determine the chirality. Moreover, a magneticfield delay shows that we uniquely deal with a falsely chiral system,which excludes truly chiral influences during the initiation of ro-tation. Furthermore, the applied hydrodynamical flow sculpts theaggregates, in contrast to experiments without rotation or with alarge delay in the applied rotation. These results show that thefalsely chiral influence of our set of forces affects the growth stageof the initial aggregation process.
A manuscript about this work is in preparation:P.G. van Rhee, I. Occhiuto, N. Micali, F. de Graaf, H. Engelkamp, J.C. Maan, L.Monsu Scolaro, P.C.M. Christianen
91

Unraveling the effect of the distinct forces within the selection of . . .
5.1 Introduction
Most biomolecules exist only in one handedness. Despite its importance for theemergency of life itself, the origin of this homochirality is still unknown [1, 2].This question fuels an intense search for external forces and fields that cancause chiral selection [3]. Besides the influence of chiral chemical agents, sev-eral external influences have shown to give enantioselection, such as circularlypolarized light [4–6], the electroweak interaction [7, 8], vortex motion [9], stir-ring [10–13], catalysis at prochiral crystal surfaces [14, 15] and combinationsof external fields [16–18]. Crucial in these experiments is the question how tocreate a chiral bias and how to transfer and amplify it into growing aggregates.
We focus on applying external forces during the aggregation of achiralmonomers into chiral aggregates. Vortex stirring is a popular test system forchiral selection [9–13]. Ribo et al. showed for the first time the enantioselectionof porphyrin aggregates using a rotary evaporation (300 rpm, 1,5 hour) [10].Escudero et al. showed enantioselection for stirring porphyrin aggregates (300rpm, 24 hours) in a constant volume [12] inside a squared cuvette. Both ex-amples show the creation of hydrodynamic forces close to the surface due tolaminar flows (imperfect mixing), which are stronger than the randomizingBrownian motion [19].
Vortex stirring is an example of a truly chiral system (also see section 3.2),which is invariant under time reversal, but changes its chiral sign under im-proper spatial rotation. A falsely chiral system also changes sign under timereversal and results in isoenergetic enantiomers. This mirror-symmetry is bro-ken if the falsely chiral set of forces is applied within the initial stage of theaggregation. We have shown that spinning reaction vessels in a high magneticfield results in the successful enantioselection by a falsely chiral set of forces (seealso chapters 3 and 4). Magnetic fields give rise to gravitational and alignmentforces through magnetic levitation [20,21] and magnetic orientation [16,22,23]respectively, which are crucial in our experiments as the formed J-aggregatesare too small to show chiral selection by rotational and gravitational forcesalone. A magnetic field provides a unique tool which can be varied in strengthand gradient. It allows us to switch on and off the chiral influence at willwithout affecting the rest of the process, which is very hard to do with otherchiral influences; this uniquely enables us to determine at which stage of theself-assembly process the chiral influence takes effect. Moreover, it provides uswith a test system to investigate the influence of each of the three differentforces (rotation, gravity and alignment) on the enantioselection process.
We find that it is essential to apply the rotation during the nucleation stageof the aggregation. A field application time of less than 1% of the time it
92

5.2 Experimental details
takes to reach equilibrium is sufficient to induce absolute enantioselection. Thehydrodynamic flow sculpts the aggregates, leading to an increased aggregationrate, but the flow alone is insufficient to select chirality without additionalgravitational and alignment forces. Furtermore, we provide experimental provethat our system is a unique example of a falsely chiral system, as is evidenced bythe enantioselection found using a delayed field application. The only momentwere truly chiral forces are present – when the solution is spinned up or sloweddown at the start and the end of the rotation experiment – do not play a rolefor the final enantioselection. Combining these results leads us to conclude thatthe falsely chiral influence of our set of forces affects the growth stage of theinitial aggregation process.
5.2 Experimental details
Sample preparation
The sample preparation was extensively described in section 3.3. The experi-ments in this chapter were performed with commercially available TPPS3 (Mid-century, sodium salt), and home-synthesised TPPS3, which gave identical ex-perimental results. A 3 µM solution of TPPS3 was acidified with aqueousH2SO4 to a final concentration of 0.0133 M (pH 1.9) and eventually aggrega-tion was triggered with 0.1 M NaCl. A fresh solution shows an absorbancearound 435 nm attributed to free TPPS3. The resulting aggregates show aredshifted absorbance peak around 489 nm [Fig. 5.1(a)]. Our solutions havea relatively low TPPS3 concentration (3 µM), resulting in the formation ofsmall aggregates (hydrodynamic radius ≤ 0.8 µM) unaffected by gravity [Fig.3.3]. After 2-3 days, the equilibrated CD spectrum is measured ex situ in aseparate quartz cuvette, to avoid linear dichroism signals arising from surfaceartifacts [11, 24, 25]. The porphyrin aggregates display strong circular dichro-ism (CD), with characteristic bisignate CD curves, due to the exciton couplingbetween the monomers [Fig. 5.1(b,c)].
The fresh solutions are used in experiments with and without rotation, insideor outside a magnetic field. We have rotated the vials at a fixed frequency of 15Hz, for a variable time ranging from 30 to 150 minutes. Such rotation resultsin either solid-body rotation or rotational vortex motion of the solution [26].Using a home-built setup (see section 2.9) the absorbance as function of timewas measured at the center of the fluid in absence of magnetic field.
93

Unraveling the effect of the distinct forces within the selection of . . .
Figure 5.1: Growth characterization in absence of magnetic field. (a) Ab-sorption spectra of a freshly prepared TPPS3 solution (t=0, blue) and anequilibrated solution after 48 hours (red). (b) CD spectrum after 48 hours ofnon-rotated growth. (c) CD spectrum after 48 hours, for rotated (1 h, 15 Hz)growth.
Combined application of rotation and magnetic field
Figure 5.2(a) shows the standard experiment, in which 7 vials rotate within ahigh field magnet. It was shown (chapters 3 and 4) that a combined applicationof rotation and magnetic field for a ‘field time’ of tB = 30-120 minutes is suf-ficient to achieve chiral selection [16]. The magnetic field changes the effectivegravity that is experienced by the water in the vials. Depending on the verticalposition, the amplitude of the effective gravity Geff varies between -2 and 4times that of the normal gravity Gn (details see section 2.3). The central vialis in the field maximum, and experiences no change in its effective gravity asthe field gradient is zero. Vials 1-3 experience an enhanced effective gravity[Fig. 5.2(a,c,f)] and vials 5 and 6 feel inverted effective gravity [Fig. 5.2(a,b,e)].Vial number 7 is positioned at the levitation position, where the magnetic fieldexactly balances the gravitational force.
The magnets used for the experiments were a 32 mm bore 20 T duplexBitter magnet and a 32 mm bore 33 T Florida-Bitter magnet at the High FieldMagnet Laboratory at the Radboud University Nijmegen. The 20 T magnetwas only used for a field time tB = 120 minutes. The standard experiment wasperformed by switching on the rotation immediately after the magnetic fieldwas applied. In this experiment both the delay of rotation (rotation delay) andthe delay in field application (field delay) was zero. The field was applied for
94

5.2 Experimental details
-50
0
50
100
CD
(md
eg
)
470 490 510
a)
d) g)
Wavelength (nm)
Δg>0
Δg<0
a)b)
c) f)
e)
470 490 510Wavelength (nm)
-50
0
50
100C
D(m
de
g)
G=0
6: G-
5: G-
4: Gn
3: G+
2: G+
1: G+
L Ge"L Ge"
L Ge" L Ge"
Figure 5.2: Chiral selection experiment in a high magnetic field. (a) Sketchof 7 vials, which are mounted in a rotating (15 Hz) tube inside the cylindricalmagnet bore. The magnetic field is oriented vertically, and affects the effectivegravity Geff that the TPPS3 solution experiences due to diamagnetic forces(details see section 2.3). Vial 4, which is in the field center where the field
gradient is close to zero, has an unaltered effective gravity (Geff = Gn), vials
1-3 experience enhanced Geff , vials 5 and 6 have an inverted Geff , and vial 7is near levitation (Geff = 0) because here the magnetic and gravitational forceexactly balance. The ‘edge vials’ 1-2 experience relative low magnetic fields,and the ‘central vials’ 3-6 experience relatively high magnetic fields. (b,c) The
chiral selection depends on the relative direction of the effective gravity Geff
and the angular momentum L. Either a clockwise rotation combined withGeff < 0, or an anticlockwise rotation combined with Geff > 0 results in a(d) positive CD spectrum (∆g > 0). (e,f) Conversely, a clockwise rotation
combined with Geff > 0, or an anticlockwise rotation combined with Geff < 0results in a (g) negative CD spectrum, (∆g < 0).
95

Unraveling the effect of the distinct forces within the selection of . . .
a time (field time) tB after which the magnetic field was swept down to 0 T at100 mT/s and the rotation was stopped.
In addition we have performed several different experiments. In the fielddelay experiments, the rotation is applied immediately, but the magnetic fieldis applied after a certain delay time ∆tB, ranging from 0 to 120 minutes. Inthe rotation/field delay experiments, the application of both the field and therotation was delayed by time ∆tBL ranging from 2 to 145 minutes. In all cases,after the described delay the magnetic field was swept to 16 T or 25 T at 70mT/s. In all those cases the magnetic field was swept (100 mT/s) down to 0 Tafter tB = 30 minutes, and at 0 T the rotation was stopped. When the rotationwas finished, the samples were extracted from the magnet and from the holderand allowed to stand for 2-3 days at room temperature in the dark.
The magnetic field experiment results in a positive CD signal for an anti-parallel configuration of the rotation L and effective gravity Geff [Fig. 5.2(b-d)]and a negative CD signal for a parallel configuration of L and Geff [Fig. 5.2(e-g)]. Inverting either the rotation direction or the direction of the effectivegravity resulted in a sign reversal of the CD signal [16]. Inverting the magneticfield direction has no effect on the chiral selection. If no rotation is applied, anasymmetric signal is measured [similar to Fig. 5.1(b)], regardless the presenceof a magnetic field.
Chiral Quantification
In order to quantify the efficiency of the chiral selection the dissymmetry factor∆g is used, which is the differential value of the absorbance-normalized CDspectra defined by ∆g = gright − gleft, where g is the ratio of the CD to theconventional absorption: g = ∆A/A, where A is the absorbance of the sampleand ∆A = AL −AR, with AL and AR the absorbance of left- and right-handedcircular polarized light, respectively [27]. The maximum and minimum CDvalues of the bisignate spectrum were determined and are situated around 491and 486 nm. The sign of ∆g was used as the selection criterium. When noclear bisignate signal could be determined (CD: ∆A < 0.5 mdeg) no sign wasassigned and an amplitude of ∆g = 0 was used (with |∆g| < 5 · 10−4).
In order to quantify our results obtained during different experiments wedefine a global ‘enantiomeric excess’ (ee), which is defined as the absolute valueof the difference in the percentage of vials that show and do not show enantios-election. Therefore, 0 % corresponds to random chiral selection on average overall vials, and 100% to enantioselection in each vial. The enantiomeric excess isplotted with error bars, which are equal to the step size: 200%/N , with N thenumber of performed experiments.
96

5.3 The influence of rotation in the absence of a magnetic field
5.3 The influence of rotation in the absence of a mag-netic field
The influence of 60 minutes of rotation (15 Hz) on the aggregation rate wasmeasured by measuring the absorbance. Figure 5.3 shows that the monomerpeak at 435 nm gradually decreases to less than half its starting value whilethe aggregate peak at 489 nm increases. Typically after approximately 48hours, thermodynamic equilibrium is reached [Fig. 5.1(a)]. The final values ofthe monomer and aggregate absorbance in the time-resolved experiment corre-sponds to the spectrum shown in Fig. 5.1(a) and shows slight variations fromexperiment to experiment. To take into account these stochastic fluctuations wehave performed each experiment at least three times. Without rotation (greenlines) the growth of the aggregate peak is much slower than with rotation (pur-ple lines, 15 Hz). The rotation experiment results in a lower (higher) aggregate(monomer) absorbance. This points to a different monomer vs. aggregatesratio, which is indicative of a modification of the aggregation process and theresulting aggregates. These observations have been confirmed by an extensivestudy performed at higher TPPS3 concentration (5 µM), demonstrating a con-sistent acceleration of the aggregation when the solution is spun [28]. We notethat the application of a magnetic field has no effect on the overall aggregation
Monomer:
Aggregate:
Figure 5.3: Aggregate growth as shown by the absorbance at 435 nm(monomer) and 489 nm (aggregate) as function of time, with (15 Hz, pur-ple traces) and without (0 Hz, green traces) rotation of the vessel.
97

Unraveling the effect of the distinct forces within the selection of . . .
rate; preliminary time-resolved absorbance measurements in the magnet (onehour in 25 T) show – on average - no change in aggregation rate as comparedto measurements with the same set-up without field applied [28].
The enhanced aggregation rate with rotation suggests that spinning thevials gives rise to an enhanced particle mixing compared to normal Brownianmotion in standing solutions, with a particle motion which is not necessarilyrelated to the fluid trajectories. The final equilibrated aggregates obtainedafter rotation show distinct properties: the rotated samples always show asymmetric CD shape [Fig. 5.1(c)], in contrast to the non-rotated samples whichshow an asymmetric bisignate CD spectrum [Fig. 5.1(b)]. An asymmetricbisignate spectrum indicates a substantial differential scattering with respectto the differential absorbance [29], which corresponds to a larger and/or lessdefined structure compared to a symmetric bisignate spectrum. It agrees withlarge, randomly folded-like structures as were reported in AFM measurements[12]. The rotated aggregates consist of an intrinsically chiral packing of thebuilding blocks [30] in combination with a higher order mesoscopic chiralitywith a frozen spiral structure [12, 31]. The resulting CD shape is thereforeused as an indicator for proper chiral selection. Experimentally, we found aminimum rotation time of 30 minutes in order to obtain a symmetric CD.
5.4 Chiral selection and the effect of field time
We have determined the dissymmetry factor ∆g as function of the time tB dur-ing which the magnetic field is applied (‘field time’), for parallel and anti-parallelconfigurations of Geff and L [Fig. 5.2(e,f) and Fig. 5.2(b,c) respectively]. Here,the magnetic field and the rotation were applied simultaneously. However, forshort field times the rotation was extended to 30 minutes to ensure that sym-metric CD spectra were obtained (see above). The results in Fig. 5.4 show thatno chiral selection is observed in the absence of a magnetic field, as evidencedby an almost random enantioselection of ee = 16% (dashed area in Fig. 5.4).The small enantiomeric excess is attributed to an inherent chiral contamina-tion [16,32]. A field time of tB = 8 minutes does not yet overcome this inherentchemical bias. After tB = 15 minutes, a significant selection trend (14/18, ee= 56%) becomes visible, with 100% selection (3/3) for vial 4. The edge vials(light-blue bar, vials 1, 2), which are positioned far from the field center, areless responsive to the chiral influence, as compared to the central vials (darkblue bar, vials 3-6), indicating the importance of the magnetic field strengthitself (B2 dependence). From tB = 30 minutes onwards almost complete selec-tion is visible (ee ≥ 80%) for all vials, again with a slightly positive chemical
98

5.4 Chiral selection and the effect of field time
Figure 5.4: Variation of the field time, the time during which the magneticfield B is applied. (a) Dissymmetry factor ∆g for various field times, for anti-parallel (upper panel) and parallel (lower panel) configurations of effectivegravity (Geff) and rotation (L). The vials were rotated during the same timeas the magnetic field, with a minimum rotation of tL = 30 minutes (see text).On increasing the field times tB, a change from no selection (positively biaseddue to an unknown contaminant) towards full selection is visible. The lightblue bars correspond to the edge vials [1 and 2 in Fig. 5.2(a)] and the darkblue bars to the central vials [3-6 in Fig. 5.2(a)].
bias, indicated by the fact that the wrong signs are mostly positive (10/11).The experiments performed for tB = 120 minutes show a 100% selection rate.
The ∆g-values in Fig. 5.4 show considerably variations, which is caused bythe fact that the chiral selection roughly scales with B2/Geff and that both Band Geff vary with position (see also section 4.8). To remove this dependence,Fig. 5.5 shows the data of Fig. 5.4 grouped by vial position. The amplitude of∆g in each vial is gradually increasing with increasing interaction time (fromtB = 0 to 120 minutes). For the selection percentage per vial also some cleartrends are visible. A field time of tB = 15 minutes is sufficient for a strong
99

Unraveling the effect of the distinct forces within the selection of . . .
Figure 5.5: Same data as Fig. 5.4 but now grouped by vial position [Fig.5.2(a)] and field time. The upper panel shows the average amplitude |∆g|per vial, for field times of tB = 0, 8, 15, 30, 60 and 120 minutes. The lowerpanel shows the selection percentage per vial for respectively tB = 15, 30, 60and 120 minutes. Vial 4 shows the strongest selection both in amplitude andpercentage. The combined central vials (3-6) show a large selection percentage,in contrast to the edge vials (1,2) which show a gradual increase with increasingtime up to tB = 120 minutes.
selection for the central vials only, in contrast to the edge vials, which have noselection. The edge vials need a much longer application time to obtain a largeselection percentage. In particular vial 4 shows the largest chiral selection. Thisvial experiences the maximum magnetic field (25 T). Figures 5.6(a) and 5.6(b)show how vial 4 compares to the average amplitude and selection percentage
a) b)
Figure 5.6: (a) Average selection percentage versus field time for all vials(black) and vial 4 (red). (b) Average |∆g| as a function of field time tB for allvials (black) and vial 4 (red).
100

5.5 Delayed application of magnetic field
of all vials (1-6). Vial 4 always has the highest selection percentage and thelargest amplitude. For this vial a field time of tB = 15 minutes is sufficient toobtain a 100 % chiral selection and a significant |∆g|, which only marginallyincreases for longer field times. This corresponds to less than 0.5 % of the totalequilibration time (< 48 hours, see also Figs. 4.1 and 4.2).
5.5 Delayed application of magnetic field
A field time of tB = 0 (no field) shows no chiral selection (Fig. 5.4), whichproves that a magnetic field is necessary to obtain chiral selection. Delayingthe start of the magnetic field will give more insight in the contribution of themagnetic force to the overall chiral force. To this end, we started the rotationimmediately after mixing of the ingredients, and we delayed the magnetic field
Figure 5.7: Delayed application of the magnetic field B. The dissymmetryfactor ∆g as a function of the delay time, for anti-parallel orientation of theeffective gravity Geff and the rotation vector L (upper panel) and parallelorientation (lower panel). The rotation is started instantaneously; after adelay of ∆tB = 0 to 120 minutes, the magnetic field is switched on for tB =30 minutes after which both the rotation and the magnetic field are stopped.
101

Unraveling the effect of the distinct forces within the selection of . . .
a) b)
Figure 5.8: Delayed application of the magnetic field B. (a) The selectionpercentage as a function of field delay time ∆tB for all vials (black) and thecentral vial 4 (red). Note the larger spread for ∆tB = 90 and 120 minutesdue to a limited amount of measurements. (b) Average |∆g| as a function ofdelay time ∆tB for all vials (black) and vials 4 (red). The average amplitudeof ∆g remains significant up to ∆tB = 40 minutes, after which it drasticallydecreases. A similar trend is visible for the central vial.
application with a time ranging from ∆tB = 2 to 120 minutes. A field time of30 minutes was chosen to limit the experimental time and because 30 minutesis the minimal time that still leads to a significant chiral selection (ee ≥ 80 %)for all vials (Fig. 5.6). After a field time of tB = 30 minutes (with combinedmagnetic field and rotation), the field was swept down again after which therotation is stopped. Figure 5.7 shows the result of this experiment. Up to adelay of ∆tB = 40 minutes (partial) chiral selection is visible, indicated by theconsiderable amplitude of ∆g. In particular the central vials have a relativelyhigh selectivity compared to the edge vials. After ∆tB = 90 and 120 minutesthere is a clear cutoff in both amplitude and percentage, and no chiral selectionis present anymore. Figure 5.8(a) shows that there is no clear transition betweencomplete selection and no selection for the average of all vials. Vial 4 indicatesselection up to ∆tB = 120 minutes delay, albeit with a large error. Figure 5.8(b)shows that the amplitude of ∆g remains on average around 0.003 up to ∆tB =40 minutes; a longer delay completely removes the effect. The combination ofamplitude and selectivity shows that up to ∆tB = 40 minutes chiral selectionis still strongly present, most prominently in the central vial.
5.6 Delayed application of magnetic field and rota-tion
In the experiments described above, the rotation was always started immedi-ately after the preparation of the samples. Delaying the rotation together with
102

5.6 Delayed application of magnetic field and rotation
Figure 5.9: Dissymmetry factor ∆g as a function of the time delay ∆tBL
between sample preparation and the application of the rotation and the mag-netic field, for central (dark blue) and edge vials (light blue). B and L aredelayed up to ∆tBL = 145 minutes, after which they are applied for tB =30 minutes. The grey bars indicate asymmetric CD spectra, indicative of adifferent aggregate structure without chiral selection (shaded area).
the magnetic field might give more information on the growth mechanism. Aswas already shown in Fig. 5.1(b), the aggregation rate depends strongly on therotation.
Figure 5.9 shows the results of resting the vials for ∆tBL = 2 to 145 minutesprior to a field time of tB = 30 minutes. Up to ∆tBL = 40 minutes of delay, only3 experiments (out of the total of 41) showed a wrong sign or asymmetric shapeof the CD spectrum. Vial 4, located at the field maximum even shows 100 %selection. A delay of ∆tBL = 82 or 145 minutes leads to positive, asymmetricCD spectra for all vials. The observation of assymmetric CD spectra in absenceof chiral selection, is similar to no rotation, which indicates that between ∆tBL
= 40 and 82 minutes a transition in the growth trajectory takes place. Therefore
103
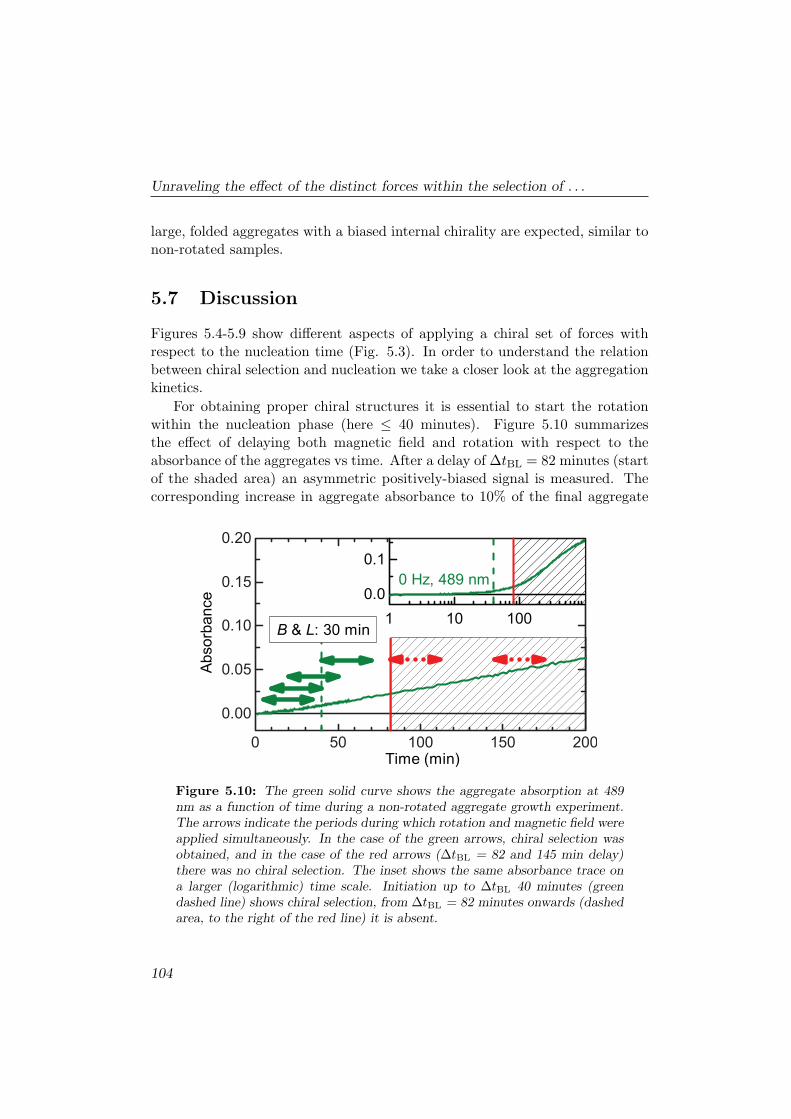
Unraveling the effect of the distinct forces within the selection of . . .
large, folded aggregates with a biased internal chirality are expected, similar tonon-rotated samples.
5.7 Discussion
Figures 5.4-5.9 show different aspects of applying a chiral set of forces withrespect to the nucleation time (Fig. 5.3). In order to understand the relationbetween chiral selection and nucleation we take a closer look at the aggregationkinetics.
For obtaining proper chiral structures it is essential to start the rotationwithin the nucleation phase (here ≤ 40 minutes). Figure 5.10 summarizesthe effect of delaying both magnetic field and rotation with respect to theabsorbance of the aggregates vs time. After a delay of ∆tBL = 82 minutes (startof the shaded area) an asymmetric positively-biased signal is measured. Thecorresponding increase in aggregate absorbance to 10% of the final aggregate
Figure 5.10: The green solid curve shows the aggregate absorption at 489nm as a function of time during a non-rotated aggregate growth experiment.The arrows indicate the periods during which rotation and magnetic field wereapplied simultaneously. In the case of the green arrows, chiral selection wasobtained, and in the case of the red arrows (∆tBL = 82 and 145 min delay)there was no chiral selection. The inset shows the same absorbance trace ona larger (logarithmic) time scale. Initiation up to ∆tBL 40 minutes (greendashed line) shows chiral selection, from ∆tBL = 82 minutes onwards (dashedarea, to the right of the red line) it is absent.
104

5.7 Discussion
absorbance (with an absorbance of 0.02 for non-rotated samples), can be viewedas an experimental threshold for chiral selection. If the application of rotationis delayed to ∆tBL = 80 minutes, the aggregates lack a proper chiral structuredspace group [30, 33], which cannot grow into aggregates, whose chirality canbe selected by our chiral influence. Within the cooperative growth model thisimplies a transition from the nucleation towards the growth phase, where thecrucial chiral seeds are mainly formed during the nucleation phase, i.e. within82 minutes after the sample preparation (without rotation).
Figure 5.11 summarizes the result of delaying only the magnetic field B(from Fig. 5.8). An instantaneous rotation and a field delay up to ∆tB = 40minutes (green dotted line and 15 Hz trace), shows (partial) chiral selection. Atthis time, the self-assembly has passed the nucleation phase and is in the growthstage. After ∆tB = 90 minutes (shaded area) the chiral selection disappearscompletely and the aggregation is in its final stage (saturating regime of thegrowth curve). The chiral selection of the racemic mixture therefore is taking
Figure 5.11: Aggregate absorption at 489 nm (60 minutes rotation, B = 0T) as a function of time. The black solid arrows indicate the periods duringwhich the samples were rotated; the colored arrows indicate the field times. Inthe case of the green dashed arrows, strong chiral selection was obtained. Themaximal delay ∆tB is indicated with the green dashed line. The red dottedarrows (∆tB = 90 and 120 min delay) indicate experiments where no chiralselection could be detected (from Fig. 5.8), highlighted by the dashed area.The orange arrow indicates the partial selection that was obtained when Bwas applied for only tB = 15 minutes (from Fig. 5.6).
105

Unraveling the effect of the distinct forces within the selection of . . .
place in the nucleation period and at the start of the growth period, which is at10% of the final aggregate absorbance. For the exact statistics on the inflectionpoint (between ∆tB = 40-90 minutes) more data is needed, but the general trendis clear (Figs. 5.8, 5.11). As long as there is no chiral equilibrium, the balancecan still shift towards absolute enantioselection, with maximum efficiency for aminimum delay.
In the standard experiment (Fig. 5.4) the rotation is started after the vialswere mounted in an applied magnetic field, in contrast to the delayed magneticfield experiment (Fig. 5.7). The experiment with the delay of magnetic fieldshows that the order in which the magnetic field and the rotation are appliedis not crucial to obtain chiral selection. Starting the rotation leads to a fluidthat slowly spins up inside a magnetic field, which corrsponds to a truly chiralforce, which might lead to the formation of chiral nuclei that grow out into chiralaggregates. In this regard, vial 4 is a special case, which can distinguish betweentruly and falsely chiral influences, because it is located at the field center, wherethe field gradient is zero and where there is no additional effective gravitationalforce. Ramping up the magnetic field has no influence on the fluid surface inthe central vial, but since the field is essential in the chiral selection processthe field delay experiment can provide insight whether the spin-up period ofthe solution plays an important role. The spin-up time of the liquid (the timeuntil the parabolic surface is stable) was visualized (see Fig. 3.5) and takes justa few seconds. However, before a steady state rotation of the fluid is reachedand all pseudovortex motions have disappeared, an additional stabilization timeneeds to be taken into consideration. In a simplified case this corresponds tothe viscous diffusion time of vorticity T : [34]
T =r2
ν=
0.52 cm2
0.01 cm2/s= 25 s, (5.1)
where r is the typical length scale (the vial radius), and ν the viscosity ofwater at room temperature. After about 25 seconds the vortex motion, whichis truly chiral, is absent and we are only left with a falsely chiral set of forces.The successful delay of the magnetic field up to 40 minutes (Fig. 5.7), withuninfluenced fluid dynamics in vial 4, is definite proof that only the falsely chiralforce is responsible for the enantioselection. The absence of chiral selection whenthe magnetic field is instantaneously applied for only 8 minutes (Fig. 5.4) alsoshows that possibly dominant start-up effects do not play a role. The exactmotion of the individual aggregates in a rotating fluid within a magnetic fieldmight be more complicated; this remains the subject of future research.
106

References
5.8 Conclusion
We have demonstrated that a combination of falsely chiral forces can select thehandedness of small aggregates, which gave several new insights. First, it isessential to apply the rotation during the nucleation phase of the cooperativegrowth. The hydrodynamic flow sculpts the aggregates, shows an increased ag-gregation speed, but is insufficient to select chirality without additional forces.Second, a field time of less than 1% of the total time it takes to reach ther-modynamic equilibrium is sufficient to induce absolute enantioselection. Thestrength of this chiral selection depends heavily on the total field time, thestrength of the magnetic field and the effective gravity experienced by the solu-tion. Third, a delay of the magnetic field still shows chiral selection, as long assufficient monomers are available that can contribute. Fourth, the initiation ofthe rotation has no influence on the chiral selection. Combining these resultsleads us to conclude that the (falsely) chiral influence of our set of forces affectsthe growth stage of the initial aggregation process. Therefore, a short chiralperturbation, sufficiently applied, is able to induce supramolecular chirality thatcan be transferred and amplified into the distinct enantiomers.
References
[1] G. H. Wagniere, On Chirality and the Universal Asymmetry: Reflectionson Image and Mirror Image. Wiley-VCH Verlag (2007).
[2] P. L. Luisi, The Emergence of Life: From Chemical Origins to SyntheticBiology. Cambridge University Press (2006).
[3] S. F. Mason Nature 311, 19–23 (1984).
[4] J. J. Flores, W. A. Bonner, and G. A. Massey J. Am. Chem. Soc. 99,3622–3625 (1977).
[5] J. Bailey, A. Chrysostomou, J. H. Hough, T. M. Gledhill, A. McCall,S. Clark, F. Mnard, and M. Tamura Science 281, 672–674 (1998).
[6] W. L. Noorduin, A. A. C. Bode, M. van der Meijden, H. Meekes, A. F. vanEtteger, W. J. P. van Enckevort, P. C. M. Christianen, B. Kaptein, R. M.Kellogg, T. Rasing, and E. Vlieg Nat. Chem. 1, 729–732 (2009).
[7] R. Berger and M. Quack ChemPhysChem 1, 57–60 (2000).
[8] D. K. Kondepudi and G. W. Nelson Nature 314, 438–441 (1985).
107

Unraveling the effect of the distinct forces within the selection of . . .
[9] V. Aquilanti and G. S. Maciel Orig Life Evol Biosph 36, 435–441 (2006).
[10] J. M. Ribo, J. Crusats, F. Sagus, J. Claret, and R. Rubires Science 292,2063–2066 (2001).
[11] A. D’Urso, R. Randazzo, L. LoFaro, and R. Purrello Angewandte Chemie122, 112–116 (2010).
[12] C. Escudero, J. Crusats, I. Dez-Prez, Z. El-Hachemi, and J. M. RiboAngew. Chem. Int. Ed. 118, 8200–8203 (2006).
[13] O. Arteaga, A. Canillas, J. Crusats, Z. El-Hachemi, J. Llorens, E. Sac-ristan, and J. M. Ribo ChemPhysChem 11, 35113516 (2010).
[14] A. Kuhn and P. Fischer Ang. Chem. Int. Ed. 48, 6857–6860 (2009).
[15] T. Kawasaki, S. Kamimura, A. Amihara, K. Suzuki, and K. Soai Angew.Chem. Int. Ed. 50, 6796–6798 (2011).
[16] N. Micali, H. Engelkamp, P. G. v. Rhee, P. C. M. Christianen, L. M.Scolaro, and J. C. Maan Nat. Chem. 4, 201–207 (2012).
[17] G. L. J. A. Rikken and E. Raupach Nature 405, 932–935 (2000).
[18] M. Avalos, R. Babiano, P. Cintas, J. L. Jimnez, J. C. Palacios, and L. D.Barron Chem. Rev. 98, 2391–2404 (1998).
[19] J. M. Ribo, Z. El-Hachemi, and J. Crusats Rend. Fis. Acc. Lincei 24,197–211 (2013).
[20] E. Beaugnon and R. Tournier Nature 349, 470–470 (1991).
[21] M. V. Berry and A. K. Geim Eur. J. Phys. 18, 307 (1997).
[22] G. Maret and K. Dransfeld, Strong and ultrastrong magnetic fields andtheir applications Ch. 3. Berlin: Springer-Verlag (1985).
[23] Y. Kitahama, Y. Kimura, and K. Takazawa Langmuir 22, 7600–7604(2006).
[24] O. Arteaga, Z. El-Hachemi, and A. Canillas Phys. Status Solidi A 205,797 (2008).
[25] J. Crusats, Z. El-Hachemi, and J. M. Ribo Chem. Soc. Rev. 39, 569 (2010).
[26] I. M. Cohen and P. K. Kundu, Fluid Mechanics. Academic Press (2008).
108

References
[27] N. Berova, K. Nakanishi, and R. Woody, Circular Dichroism: Principlesand Applications. John Wiley & Sons (2000).
[28] F. de Graaf, Aggregation kinetics in a chiral selection process. Masterthesis, Radboud University Nijmegen (2013).
[29] R. Rubires, J.-A. Farrera, and J. M. Ribo Chem. Eur. J. 7, 436–446 (2001).
[30] Z. El-Hachemi, C. Escudero, F. Acosta-Reyes, M. T. Casas, V. Altoe,S. Aloni, G. Oncins, A. Sorrenti, J. Crusats, J. L. Campos, and J. M. RiboJournal of Materials Chemistry C 1, 3337 (2013).
[31] O. Arteaga, C. Escudero, G. Oncins, Z. El-Hachemi, J. Llorens, J. Crusats,A. Canillas, and J. M. Ribo Chem. Asian J. 4, 1687 (2009).
[32] Z. El-Hachemi, C. Escudero, O. Arteaga, A. Canillas, J. Crusats,G. Mancini, R. Purrello, A. Sorrenti, A. D’Urso, and J. M. Ribo Chirality21, 408412 (2009).
[33] J. M. Short, J. A. Berriman, C. Kbel, Z. El-Hachemi, J.-V. Naubron, andT. S. Balaban ChemPhysChem 14, 3209–3214 (2013).
[34] H. P. Greenspan and L. N. Howard Journal of Fluid Mechanics 17, 385–404(1963).
109


Chapter 6
Polymersome magneto-valvesfor reversible capture andrelease of nanoparticles
Abstract
Stomatocytes are polymersomes with an infolded bowl-shaped archi-tecture. This internal cavity is connected to the outside environmentvia a small ”mouth” region. Stomatocytes are assembled from dia-magnetic, amphiphilic block-copolymers with a highly anisotropicmagnetic susceptibility, which permits to magnetically align anddeform the polymeric self-assemblies. Here we show the reversibleopening and closing of the mouth region of stomatocytes in homo-geneous magnetic fields. The control over the size of the openingyields magneto-responsive supramolecular valves that are able toreversibly capture and release cargo. Furthermore, the increase inthe size of the opening is gradual and starts at fields below 10 T,which opens the possibility of using these structures for delivery andnanoreactor applications.
This chapter is based on work published in:P. G. van Rhee, R. S. M. Rikken, L. K. E. A. Abdelmohsen, J. C. Maan, R. J. M.Nolte, J. C. M. van Hest, P. C. M. Christianen, D. A. Wilson Nature Communications5, 5010 (2014).
111

Polymersome magneto-valves for reversible capture and release of . . .
6.1 Introduction
Magnetic manipulation of materials has found many applications in the med-ical field due to its non-invasive nature [1–5]. Some of the most promisingapplications are the use of magnetic fields as external stimuli in drug delivery(magnetically triggered drug release system) [6–11], magnetic steering and/orpropulsion [12–20] or in imaging applications through magnetic resonance imag-ing [16,21–23]. Most of the studies on manipulation of matter in magnetic fieldshave been focused on ferro- and paramagnetic materials, mainly due to theirrelatively strong response in the magnetic field, while diamagnetic materialshave been less explored.
Polymersomes, which are bilayer vesicles assembled from amphiphilic block-copolymers have been shown to entrap drugs, proteins, peptides, catalysts orenzymes for a wide range of delivery applications. They also act as biocatalyticnanoreactors and as simple mimics of the eukaryotic cell [24–30]. The innernanocavity of the polymersome is not only important for encapsulation butalso provides a physical barrier to protect sensitive encapsulated compoundsfrom degradation in analogy to natural biological systems [24].
From polymersomes towards quenched stomatocytes
Previously, it was shown that the vesicular structure of polymersomes can befurther transformed into bowl-shaped polymer stomatocytes by a controlledfolding process driven by differences in the osmotic pressure [31–36]. Polymer-somes assembled from high glass transition temperature block copolymers weremade flexible and responsive to external stimuli in the presence of organic sol-vent [top right, Fig. 6.1(a)]. Dialysis of such structures in pure water induced adifference in the osmotic pressure over the membrane, and a subsequent changeof morphology into stomatocytes [top left, Fig. 6.1(a)]. This process contin-ued until the plasticizing solvent was removed, and the folded structure waskinetically trapped. The shape transformation into these hollow bowl-shapedstructures generated an extra cavity with high degree of control of the size ofthe opening, which was used for catalyst entrapment and nanomotor assem-bly [34–36]. Furthermore, stomatocytes were reversibly plasticised and madeflexible when dialysed in a mixture of organic solvent and water [33,37]. Whenexposed for a short time to the organic solvent mixture, the structures retainedtheir morphology with a slight increase in membrane flexibility, while longer ex-posure times were shown to change completely their morphology [33]. Additionof water quenched the effect of the organic solvent and vitrified the membraneback into the rigid form [Fig. 6.1(a)]. Details of the chemical structure and the
112

6.1 Introduction
packing of the amphiphile within the membrane are provided in Fig. 6.1(b).
B (T)dialysis
loading
unloadingpolymersome stomatocyte
rigid !exible
= water = organic solvent
dialysis
dialysis
water
a)
b)
c)
:
Short Exposure
OO
O
O
44
Brn
Figure 6.1: (a) Schematic representation of stomatocyte formation and re-versible change in its membrane flexibility from glassy to plasticised state inthe presence of organic solvent. The stomatocyte formation takes place un-der dialysis in pure water (blue spheres). The change in the flexibility of themembrane of stomatocytes from glassy to flexible take place under reversedialysis conditions in a mixture of water (blue spheres) and organic solvent(red spheres). (b) Representation of the amphiphilic block copolymer assem-bly in a bilayer and its chemical structure. (c) Schematic representation ofthe reversible and controlled capture and release of particles via opening andclosing of polymeric stomatocytes in the magnetic field. The stomatocyteswere obtained by dialysis from diamagnetic polymersomes.
113

Polymersome magneto-valves for reversible capture and release of . . .
Stimuli responsive valves
Bowl-shaped polymersomes with strict control over the opening were obtainedvia a kinetically driven process that does not allow a subsequent remote changein the size of the opening under external stimuli [34]. However, bowl-shapedpolymersomes capable of reversibly changing the size of their opening underexternal stimuli are highly desirable. Such an opening/closing movement ef-fect would allow these supramolecular structures to act in both capture andrelease mode for their payloads in a reversible and controlled manner, act-ing as a supramolecular valve system [Fig. 6.1(c)]. The amphiphilic block-copolymers used for the self-assembly of polymersomes are diamagnetic in na-ture and possess a highly anisotropic magnetic susceptibility [37,38]. Recently,it was demonstrated that morphological changes in polymersomes via osmoticstress can be easily optically detected with magnetic birefringence due to theanisotropy in the polarizability of the polymers [37]. Polymersome supramolec-ular asssemblies are able to respond to a magnetic field via alignment and pos-sibly also deformation to reversibly generate new conformations and shapes.Although magnetic deformation of vesicles assembled from phospholipids (li-posomes) [39–43] and sexitiophene capsules [44] has been previously demon-strated, no work has been done on the magnetic manipulation of assemblies ofpolymers and complex bilayer supramolecular structures such as bowl-shapedpolymersomes.
This chapter shows a polymersome magneto-valve system involving the re-versible opening and closing of stomatocytes in a magnetic field. The effects ofmagnetic fields up to 20 T on the morphology of plasticised stomatocytes assem-bled from poly(ethylene glycol)-polystyrene amphiphilic block-copolymers andthe capture of these morphologies at different magnetic strengths are presented.The size of the opening can be strictly controlled by the strength of the mag-netic field B, with a concomitant deformation of the bowl-shaped polymersomesfrom an overall spherical stomatocyte morphology into a prolate morphology.Furthermore, the transformation is completely reversible and allows for bothcontrolled capture and release of particles in the magnetic field [Fig. 6.1(c)].
6.2 Sample preparation and experimental set-up
The used stomatocytes were all made with protocols and materials extensivelydescribed in several papers [33–37], and more specific for this work in [45]. Thenext paragraphs describe the main sample handling before, during and aftermagnetic field exposure.
114

6.3 Magnetic deformation of empty stomatocytes
Sample preparation
Rigid (glassy) stomatocytes were prepared via dialysis-induced shape transfor-mation. The block copolymer poly(ethylene glycol)44-b-polystyrene177 (20 mg)was dissolved in a 2 ml mixture of THF/dioxane (1.6 ml THF and 0.4 ml diox-ane) in a 15 ml capped vial equipped with a magnetic stirrer and closed witha rubber septum. After 30 min of stirring at room temperature 2 ml of MilliQwater (with vigorous stirring at 900 rpm) was added to the organic phase viaa syringe pump using a 5 ml syringe equipped with a steel needle. The syringepump was set to an addition rate of 1 ml/h. The solution turned cloudy afterthe addition of 0.5 ml of water. After the addition of water was complete, thecolloidal mixture was transferred in a dialysis bag and dialysed against water for48 h to form glassy rigid stomatocytes (final concentration: 10 mg/ml). Theirstructure was verified by both TEM, SEM and cryo-SEM techniques, demon-strating their overall spherical, bowl-shaped morphology [Fig. 6.3(b,c)]. Addi-tion of a plasticizing organic solvent (THF-dioxane) made the block-copolymermembrane susceptible to manipulation by magnetic fields. This was achievedby reversely dialyzing the stomatocyte solution for a short period of 20 min ina mixture of 1:1 (v/v) organic solvent:water, which made the membrane of thepolymeric stomatocytes flexible without affecting the shape and the size of thestructures [Fig. 6.3(d,e)]. The reversed dialysis is performed a few hours be-fore quenching and vitrifying these samples by water addition with or withoutmagnetic field.
Magnetic field measurements
Magnetically induced linear birefringence (LB) was measured in a 20 T DuplexBitter magnet with a setup which is extensively described in section 2.10. Thesample of interest was contained inside a 5 mm cuvette (Hellma) in a tempera-ture controlled environment at room temperature (23.0 ± 0.1 C). The sampleswere quenched in the magnet at 20 T by addition of water using a plastic trans-fer tube. This typically involves a 100 µl solution of flexible stomatocytes whichare quenched with 1.5 ml water. The quenched samples were further analysedby ex situ TEM, (cryo-) SEM and DLS.
6.3 Magnetic deformation of empty stomatocytes
In situ birefringence measurements of flexible stomatocytes showed an increasein the birefringence with the magnetic field strength, which is shown in Fig.6.2(a,b)]. This increase was fully reversible and independent of the sweep rate
115

Polymersome magneto-valves for reversible capture and release of . . .
(standard 80 mT/s, tested from 40 up to 200 mT/s). As expected, controlexperiments on the solvent mixture used for the reverse dialysis did not showany change in the birefringence due to the magnetic field.
Bire
frin
ge
nce
Δn
/1
0-6
Bire
frin
ge
nce
Δn
/1
0-6
a) b)
B
Figure 6.2: (a) In situ linear birefringence measurements on flexible bowl-shaped stomatocytes filled with (green line) and without (green line) Ptnanoparticles as function of magnetic field. Shown are both up- and down-sweeps (80 mT/s) of the field. The water solvent mixture (blue line) showsno field dependence. (b) Birefringence as a function of the square of the fieldstrength B2 (T2).
To probe possible deformation of the stomatocytes in a magnetic field, elec-tron microscopy was used. For this ex situ technique to be valid, the mor-phology at different magnetic fields was preserved by quenching and vitrifyingthe structures in the magnet by the addition of water. In this way we couldinvestigate the possibly induced deformation of the stomatocytes and the sizeof the stomatocyte opening [Fig. 6.3(a)]. Both (cryo-) SEM and TEM allowedfor the visualisation of the stomatocytes before, during and after magnetic fieldapplication. When flexible stomatocytes were placed in the magnet, and ex-posed to a magnetic field from 0 to 20 T, and vitrified at 20 T, both TEM andcryo-SEM images clearly showed the deformation of the flexible stomatocytesfrom a spherical overall shape into a prolate shape morphology, all induced bythe magnetic field [Fig. 6.3(f,g)]. This in contrast to the roughly sphericalstomatocytes quenched at 0 T before [Fig. 6.3(b,c)] and after [Fig. 6.3(d,e)]magnetic field exposure.
Furthermore, an average increase in the size of the opening of the stoma-tocyte was observed from closed at 0 T to approximately 39 ± 12 nm at 10T (measured on 19 stomatocytes) and further increase to 147 ± 20 nm at 20
116

6.3 Magnetic deformation of empty stomatocytes
c)
g)
e)
b)a)
d)
f)
Glassy
0T
Flexible
0
Glassy
Flexible
20T
20T
No Fieldo F
0-20T80 mT/s
B(T)
plasticiser
quencher (water)
Figure 6.3: (a) Schematic representation of the deformation in a high mag-netic field of spherical narrow-opening stomatocytes into prolate wide openingstructures and their fixation via membrane quenching. (b) TEM and (c) cryo-SEM of polymer stomatocytes before induced flexibility by reverse dialysis andin the absence of magnetic field. (d) TEM and (e) cryo-SEM of stomatocytesafter 20 min reverse dialysis and magnetic field exposure at 20 T after whichit is vitrified at 0 T for visualization. (f) TEM and (g) cryo-SEM of polymerstomatocytes vitrified at 20 T by water addition for visualization.
T [measured on 17 stomatocytes, Fig. 6.3(f,g)]. However, once the field wasremoved, TEM and cryo-TEM images showed that the stomatocytes recoveredtheir original overall spherical shape, diameter and the narrow size of the open-ing [compare Fig. 6.3(b,c) and 6.3(d,e)]. These electron microscopy imagesare in full agreement with the magnetic birefringence signals in Fig. 6.2(a,b),which are identical for both the up- and down-sweeps of the magnetic field. This
117

Polymersome magneto-valves for reversible capture and release of . . .
demonstrates the reversible deformation of spherical stomatocytes (no birefrin-gence) into prolate stomatocytes with open mouths (large birefringence).
6.4 Mechanism of the magnetic valve.
Both magnetic birefringence measurements and electron microscopy techniquesdemonstrated the deformation of the structures from a closed-opening spheri-cal stomatocyte into a wide-opening ellipsoidal structure. To understand themechanism of deformation in the presence of a magnetic field, we analysedthe anisotropy of the magnetic susceptibility of the PEG-PS amphiphile. Thisis done by calculating the contributions of each molecular unit within the am-phiphile taking into account its orientation in x, y and z coordinates. In contrastto the cylindrically symmetric gold rods in chapter 7, all three fundamental axescontribute significant to the alignment per molecule, due to different positionsof the phenyl molecule in polysterene. By averaging out the individual contribu-tion of each phenyl molecule, the molar magnetic susceptibility parallel (χ∥) andperpendicular (χ⊥) to the block copolymer backbone can be determined [45].This resulted in ∆χ = χ∥ − χ⊥ = −380.2 · 10−12 m3/mol for maximally ex-tended polymers. Here, |χ∥| > |χ⊥| with both the PS and PEG componentsnegative. In reality, the polymer chain will not be fully extended but rather berandomly coiled to some extent, which results in a smaller amplitude of ∆χ. Ina homogeneous magnetic field B, the magnetic energy ∆E of such a polymeris given by (see section 2.4)
∆E =∆χB2 cos2 θ
2µ0NA, (6.1)
with µ0 the magnetic permeability of vacuum, θ the angle between the polymerbackbone and the applied magnetic field, and NA the Avogadro number. Sincethe polymers have a negative magnetic anisotropy (∆χ < 0), their magneticenergy is lowest when oriented perpendicular to the magnetic field. Initially,the magnetic field will align the stomatocyte, since the structure as a whole hasan anisotropic diamagnetic susceptibility due to the lack of spherical symmetry.The distribution of individual polymer orientations is slightly biased towards aperpendicular orientation with respect to the stomatocyte opening. Therefore,the stomatocyte will align in a magnetic field as shown in Fig. 6.4(a) and6.4(b) [37]. After alignment of the stomatocyte, the alignment of the polymersthat constitute the membrane can decrease the magnetic energy even further.However, the change in magnetic energy for one single polymer is rather small,compared to the thermal energy kBT , with kB the Boltzmann constant and T
118

6.4 Mechanism of the magnetic valve.
bilayer arangement
in magnetic eld
OO
O
O
44
Br
n
a) b)
c)
B (T)
B (T)
0 T 20 T
Figure 6.4: (a) Representation of the mechanism of magnetic deformationof the stomatocytes and the magnetic forces applied onto the membrane (redarrows). Yellow arrows show the net orientation of the individual polymerchains inside the bilayer to reach the preferred perpendicular orientation tothe magnetic field (purple arrow). (b) Preferential perpendicular orientationof the bilayer in a magnetic field B and the chemical structure of the am-phiphiles assembled into the bilayer. (c) High magnetic field deformation ofthe stomatocytes from spherical at 0 T into the prolate morphology at 20 Tand the resulting increase in the size of the stomatocyte opening at high fieldas a result of the magnetic forces on the membrane.
the temperature. A fully extended block-copolymer leads to a relative magneticenergy of ∆E/kBT = 0.0047 which is 2 to 3 orders of magnitude too small forsignificant alignment. One needs a total of at least 200 polymers to obtaina magnetic energy large enough for (partial) magnetic alignment. Therefore,a small patch of membrane consisting of many identically oriented polymerswill be able to compete with the thermal energy, leading to their collectivealignment in a magnetic field.
The alignment of the polymers in the membrane leads to a deformation ofthe stomatocyte as shown in Fig 6.4(c) and the observation of a large mag-netic birefringence signal [Fig. 6.2(a,b)]. While in the equatorial position thestomatocyte bilayer is already in the preferred orientation, at the rim of thestomatocyte opening, the magnetic field will force the amphiphiles to reorient
119

Polymersome magneto-valves for reversible capture and release of . . .
perpendicular to the field and consequently deform and elongate the structure.At the same time, this results in an increase in the size of the opening with theincrease of the magnetic field. Since an increase in deformation will also lead toan increase in bending energy, which counteracts the deformation, the extentof deformation is expected to increase at higher magnetic fields. The formationof the prolate shape stomatocyte morphology and the increase in the size of theopening is therefore due to the collective preferential perpendicular orientationof the block copolymers in the magnetic field (Fig. 6.4).
6.5 Remote capture and release with the magneticvalve
The remote reversible change of the stomatocyte opening in a magnetic fieldgives rise to a magneto-valve nanosystem and the potential to use this dynamicstimulus responsive behaviour for entrapment and delivery applications in areversible and controlled manner (Fig. 6.5). This means that nanoparticlescan be entrapped via diffusion during the transition from the large openingstomatocytes at 20 T to closed structures at 0 T (route A, closing the valve) orreleased in the same way via a diffusive mechanism during the opening of thestomatocyte valve at 20 T (Fig. 6.5).
To demonstrate the ability of these structures to reversibly entrap and re-lease loads, platinum nanoparticles of different sizes (40, 60 and 80 nm in diam-eter) were synthesized according to a previously reported procedure [35,36,46].These particles were added to the open stomatocytes at high field and entrappedduring the reversible closing of the valve at zero field (Fig. 6.5, route A). Addi-tionally, nanoparticles-filled stomatocytes were allowed to release their contentat high field by opening the magnetic valve in the field at 20 T and keepingthe field stable at 20 T for 1 min (Fig. 6.5, route B). Furthermore, by quench-ing their morphology inside the magnet at different magnetic field strengthswe were able to detect both open and closed states of the magneto-valve, andobserve the entrapment and release processes.
Release of nanoparticles
When exposed to the magnetic field, the loaded bowl-shaped morphology ex-hibited a similar reversible increase of the birefringence with respect to themagnetic field showing no influence of the loaded nanoparticles. TEM analysisof the vitrified samples at 0 T, before and after applying the magnetic fieldshowed a complete recovery of the overall spherical morphology, and a release
120
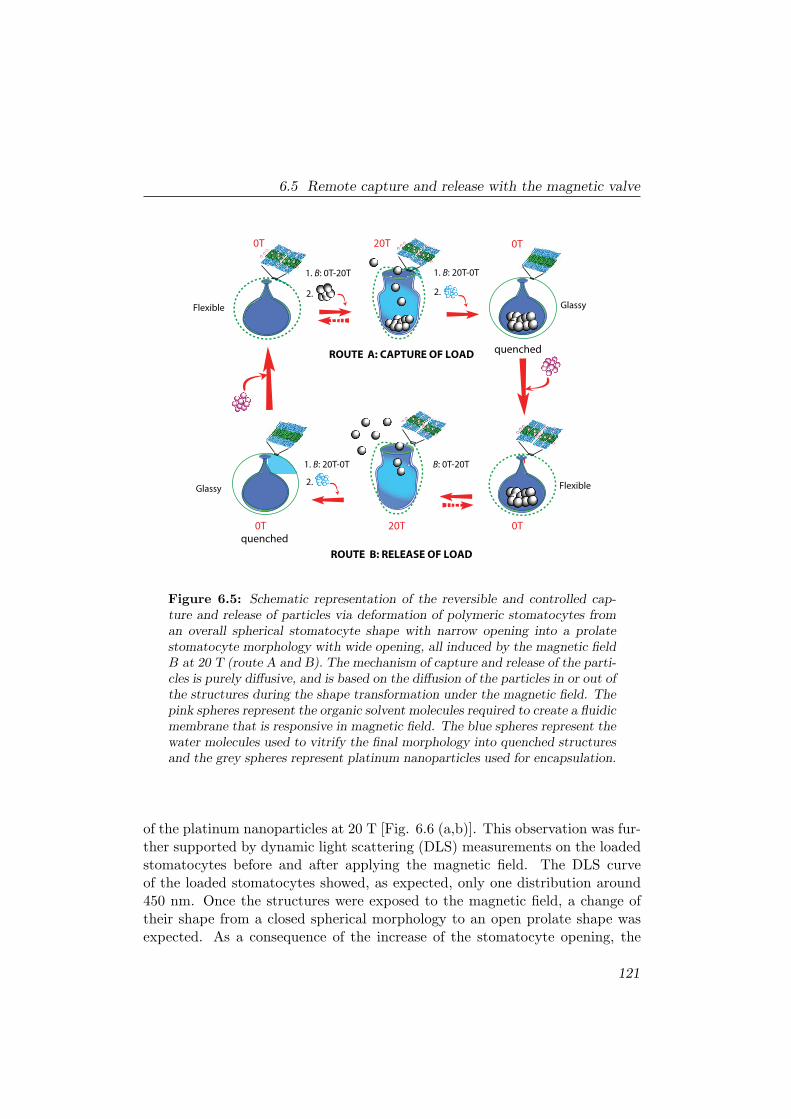
6.5 Remote capture and release with the magnetic valve
Glassy
0T
0T
Flexible
quenched
20T
20T
Glassy
quenched
0T
0T
Flexible
1. B: 0T-20T
B: 0T-20T
1. B: 20T-0T
1. B: 20T-0T
ROUTE A: CAPTURE OF LOAD
ROUTE B: RELEASE OF LOAD
2.
2.
2.
0T
Figure 6.5: Schematic representation of the reversible and controlled cap-ture and release of particles via deformation of polymeric stomatocytes froman overall spherical stomatocyte shape with narrow opening into a prolatestomatocyte morphology with wide opening, all induced by the magnetic fieldB at 20 T (route A and B). The mechanism of capture and release of the parti-cles is purely diffusive, and is based on the diffusion of the particles in or out ofthe structures during the shape transformation under the magnetic field. Thepink spheres represent the organic solvent molecules required to create a fluidicmembrane that is responsive in magnetic field. The blue spheres represent thewater molecules used to vitrify the final morphology into quenched structuresand the grey spheres represent platinum nanoparticles used for encapsulation.
of the platinum nanoparticles at 20 T [Fig. 6.6 (a,b)]. This observation was fur-ther supported by dynamic light scattering (DLS) measurements on the loadedstomatocytes before and after applying the magnetic field. The DLS curveof the loaded stomatocytes showed, as expected, only one distribution around450 nm. Once the structures were exposed to the magnetic field, a change oftheir shape from a closed spherical morphology to an open prolate shape wasexpected. As a consequence of the increase of the stomatocyte opening, the
121

Polymersome magneto-valves for reversible capture and release of . . .
entrapped particles were released, and an extra peak appeared in the DLS [Fig.6.6(c)]. This is in agreement with the TEM observation of particle release fromthe stomatocyte cavity [Fig. 6.6(a,b), yellow arrows]. When the structureswere quenched in the magnet at 20 T a slight increase in the size of the releasedplatinum nanoparticles was observed by DLS, possibly due to some clusteringinduced by the magnetic field [Fig. 6.6(c)]. Furthermore, the size of the open-ing of the loaded stomatocytes was found to gradually increase with increasingthe intensity of the magnetic field [Fig. 6.6(f)]. This shows that the stoma-tocyte magneto-valve can generate differently sized openings depending on thestrength of the magnetic field, while the captured particle can be released atdifferent intensities of the field depending on particle size.
Capture of nanoparticles
In a similar manner we envisaged that nanoparticles could be entrapped (Fig.6.5, route A). Flexible empty stomatocytes were exposed to an increasing mag-netic field from 0 to 20 T to generate the wide-open valve morphology whilenanoparticles of different sizes were added to the mixture inside the magnet.The samples were kept in the magnet at 20 T for 60 s after which the field wasswept back to 0 T and followed by the sample quenching at zero field. TEMimages of the quenched structures at zero field showed the capture of platinumnanoparticles during the transition from the open prolate shape at 20 T to theclosed spherical form at 0 T [Fig. 6.6(d,e)]. These images show their localiza-tion close to the inner membrane of the stomatocyte stomach [yellow arrows,Fig. 6.6(e)]. All of the stomatocytes in the TEM showed the presence of 40nm PtNP entrapped inside their nanocavities, however with a different loadingefficiency [Figure 6.6(d,e)] while, as expected, the encapsulation efficiency waslower for larger particles of 60 and 80 nm [Fig 6.7(a)].
Capture efficiency
Additional experiments were performed to analyse more quantitatively theamount of platinum entrapped inside of the structures by using the combi-nation of asymmetric field-flow fractionation coupled to quasi-elastic light scat-tering (FFF-QELS) and inductively coupled plasma-mass spectrometry (ICP-MS) [45]. The FFF-QELS technique allowed for a highly efficient fractionationof the stomatocyte sample obtained during the capture experiment and simul-taneous detection of the size of the components even at very low concentrations[Fig. 6.7(b)] [47]. The purified samples containing only the stomatocytes en-trapping nanoparticles [Fig. 6.7(b), bottom line] were then analysed by ICP-MS
122

6.5 Remote capture and release with the magnetic valve
e)
d)
b)
00
10
40
80
120
160
15 205Magnetic Field (T)
Siz
e o
f th
e o
pe
nin
g (
nm
)
f)
a)
c)
Size (nm)
Inte
nsi
ty D
istr
ibu
tio
n (a
.u.)
100.1 100 1000
Before magnet, quench
0T-20T-0T, 0T quench
0T-20T, 20T quench
Figure 6.6: TEM images of stomatocytes containing platinum nanoparticles(a) before and (b) after exposure to a magnetic field of 20 T and back to 0T (40 mT/s); note the release of the platinum nanoparticles in the medium(marked with yellow arrows). (c) Dynamic light scattering measurements ofstomatocytes entrapping platinum nanoparticles before and after deformationin a magnetic field; the release of platinum nanoparticles during the deforma-tion into the wide opening prolate morphology is shown. (d,e) TEM images ofthe stomatocytes entrapping 40 nm platinum nanoparticles at different mag-nifications. (f) Size of the opening of the stomatocytes at 0 T, 10 T and 20 Tand their TEM images demonstrating the gradual opening and developmentof shape asymmetry of the objects during the process.
123

Polymersome magneto-valves for reversible capture and release of . . .
b)
Ab
sorb
an
ce
28
0 n
m (
a.u
.)
a) 0o -45o
10Time (min)
PtNPStoma before purifStoma after purif
+
+
15 20 25
+45o
Figure 6.7: (a) cryo TEM images of stomatocytes entrapping 60 nm platinumnanoparticles at different angles demonstrating the presence of the particlesinside of the structures. The scale bar for the cryo-TEM images is 100 nm.(b) Asymmetric field-flow fractionation chromatogram of the 60 nm platinumnanoparticles used in the capture experiment, stomatocytes after capture ofparticles in the magnetic field and after their purification via spin filteringto remove the free platinum nanoparticles. Note the chromatogram after spinfiltering shows complete removal of free PtNP. The samples were then used forquantification of the amount of platinum inside of the structures via ICP-MSshowing the presence of 2.43 ± 0.11 mg of Platinum / 10 mg polymer (1 mL).
to determine the amount of platinum entrapped. The results showed the pres-ence of 2.43 ± 0.11 mg of Platinum / 10 mg polymer (1 mL) for stomatocytesentrapping 60 nm PtNP. Furthermore, additional Cryo-TEM and TEM mea-surements of stomatocytes entrapping nanoparticles in the magnetic field atdifferent tilt angles provided further proof that the particles were entrappedinside of the structures [Fig 6.7(a)].
6.6 Discussion: future application
To our knowledge, this is the first example of bowl-shaped structures that func-tion as reversible supramolecular magneto-valves and it provides a new conceptof magnetic manipulation of diamagnetic materials. The gradual increase in thesize of the opening, which starts at fields lower than 10 T, opens the possibilityof using these structures for delivery and nanoreactor applications. The use ofsuch structures for delivery applications and magnetic resonance imaging how-ever requires even lower magnetic fields. Nevertheless current modern clinicalMRI systems are employing now much higher fields; some operating at 3 T to 7T and even at 10 T. Such high fields raised questions regarding their potentialphysiological effects on humans, although recent studies showed no evidence
124

References
of safety issues when using high field and even gradients. [48]. However, sincemost of the routine MRIs operate at lower fields, and these high field clinicalinstruments are still under scrutiny and debate for safe use in humans, theimmediate medical applicability of our stomatocyte valve system is as for nowlimited. Our concept is in its infancy and is taking advantage of the stoma-tocyte’s double compartmentalized morphology, and its responsiveness in themagnetic field. This dual compartmental design of the stomatocyte introducesa second mechanism of cargo release in addition to the traditional release mech-anisms specific to polymersomes, i.e. by chemically changing the permeabilityof the membrane.
6.7 Conclusion
In conclusion, we have shown the remote and fully reversible entrapment andrelease of cargo from stomatocytes via magnetic deformation. Here, seeminglynon-magnetic molecules can be made responsive in magnetic fields to generatedynamic functional assemblies opening more possibilities for a large variety ofdiamagnetic materials. Future possible research includes the manipulation withmagnetic fields of other diamagnetic materials as well as on designing polymerswith higher magnetic susceptibility where this new concept can have a greatpotential for delivery applications at much lower fields, in particular when thestructures are responsive to multiple stimuli and not only to a magnetic field.
References
[1] M. W. Freeman, A. Arrott, and J. H. L. Watson J. Appl. Phys. 31, S404–S405 (1960).
[2] N. Pamme Lab Chip 6, 24–38 (2006).
[3] J. Thvenot, H. Oliveira, O. Sandre, and S. Lecommandoux Chem. Soc.Rev. 42, 7099–7116 (2013).
[4] M. Motwani, A. Kidambi, B. A. Herzog, A. Uddin, J. P. Greenwood, andS. Plein Radiology 268, 26–43 (2013).
[5] S. Bucak, D. A. Jones, P. E. Laibinis, and T. A. Hatton Biotechnol. Prog.19, 477–484 (2003).
[6] Q. A. Pankhurst, J. Connolly, S. K. Jones, and J. Dobson J. Phys. D:Appl. Phys. 36, R167–R181 (2003).
125

Polymersome magneto-valves for reversible capture and release of . . .
[7] W.-L. Chiang, C.-J. Ke, Z.-X. Liao, S.-Y. Chen, F.-R. Chen, C.-Y. Tsai,Y. Xia, and H.-W. Sung Small 8, 3584–3588 (2012).
[8] C. R. Thomas, D. P. Ferris, J.-H. Lee, E. Choi, M. H. Cho, E. S. Kim,J. F. Stoddart, J.-S. Shin, J. Cheon, and J. I. Zink J. Am. Chem. Soc.132, 10623–10625 (2010).
[9] H. Oliveira, E. Prez-Andrs, J. Thevenot, O. Sandre, E. Berra, andS. Lecommandoux J. Control. Release 169, 165–170 (2013).
[10] P. Bilalis, A. Chatzipavlidis, L.-A. Tziveleka, N. Boukos, and G. KordasJ. Mater. Chem. 22, 13451–13454 (2012).
[11] A. Riedinger, P. Guardia, A. Curcio, M. A. Garcia, R. Cingolani,L. Manna, and T. Pellegrino Nano Lett. 13, 2399–2406 (2013).
[12] L. Zhang, J. J. Abbott, L. Dong, B. E. Kratochvil, D. Bell, and B. J.Nelson Appl. Phys. Lett. 94, 064107 (2009).
[13] A. Ghosh and P. Fischer Nano Lett. 9, 2243–2245 (2009).
[14] K. M. Manesh, S. Campuzano, W. Gao, M. J. Lobo-Castan, I. Shitanda,K. Kiantaj, and J. Wang Nanoscale 5, 1310–1314 (2013).
[15] S. Ahmed, W. Wang, L. O. Mair, R. D. Fraleigh, S. Li, L. A. Castro,M. Hoyos, T. J. Huang, and T. E. Mallouk Langmuir 29, 16113–16118(2013).
[16] T. Neuberger, B. Schpf, H. Hofmann, M. Hofmann, and B. von RechenbergJ. Magn. Magn. Mater. 293, 483–496 (2005).
[17] S. Nishijima, S.-I. Takeda, F. Mishima, Y. Tabata, M. Yamamoto, J. Joh,H. Iseki, Y. Muragaki, A. Sasaki, K. Jun, and N. Saho IEEE Transactionson Applied Superconductivity 18, 874–877 (2008).
[18] P. Fischer and A. Ghosh Nanoscale 3, 557–563 (2011).
[19] R. S. M. Rikken, R. J. M. Nolte, J. C. Maan, J. C. M. van Hest, D. A.Wilson, and P. C. M. Christianen Soft Matter 10, 1295–1308 (2014).
[20] L. K. E. A. Abdelmohsen, F. Peng, Y. Tu, and D. A. Wilson J. Mater.Chem. B 2, 2395–2408 (2014).
[21] X. Gao, Y. Cui, R. M. Levenson, L. W. K. Chung, and S. Nie Nat. Biotech.22, 969–976 (2004).
126

References
[22] K. S. Caldemeyer and K. A. Buckwalter J. Am. Acad. Derm. 41, 768–771(1999).
[23] J. W. M. Bulte and D. L. Kraitchman NMR in Biomed. 17, 484–499 (2004).
[24] B. M. Discher, Y.-Y. Won, D. S. Ege, J. C.-M. Lee, F. S. Bates, D. E.Discher, and D. A. Hammer Science 284, 1143–1146 (1999).
[25] D. E. Discher and A. Eisenberg Science 297, 967–973 (2002).
[26] B. M. Rosen, C. J. Wilson, D. A. Wilson, M. Peterca, M. R. Imam, andV. Percec Chem. Rev. 109, 6275–6540 (2009).
[27] R. J. R. W. Peters, M. Marguet, S. Marais, M. W. Fraaije, J. C. M.vanHest, and S. Lecommandoux Ang. Chem. Int. Ed. 53, 146–150 (2014).
[28] F. Meng, Z. Zhong, and J. Feijen Biomacromolecules 10, 197–209 (2009).
[29] K. Kita-Tokarczyk, J. Grumelard, T. Haefele, and W. Meier Polymer 46,3540–3563 (2005).
[30] A. Blanazs, S. P. Armes, and A. J. Ryan Macromol. Rapid Commun. 30,267–277 (2009).
[31] Y. Yu and A. Eisenberg J. Am. Chem. Soc. 119, 8383–8384 (1997).
[32] K. T. Kim, J. Zhu, S. A. Meeuwissen, J. J. L. M. Cornelissen, D. J. Pochan,R. J. M. Nolte, and J. C. M. van Hest J. Am. Chem. Soc. 132, 12522–12524(2010).
[33] S. A. Meeuwissen, K. T. Kim, Y. Chen, D. J. Pochan, and J. C. M. vanHest Ang. Chem. Int. Ed. 50, 7070–7073 (2011).
[34] D. A. Wilson, R. J. M. Nolte, and J. C. M. van Hest Nat. Chem. 4, 268–274(2012).
[35] D. A. Wilson, R. J. M. Nolte, and J. C. M. van Hest J. Am. Chem. Soc.134, 9894–9897 (2012).
[36] D. A. Wilson, B. d. Nijs, A. v. Blaaderen, R. J. M. Nolte, and J. C. M. v.Hest Nanoscale 5, 1315–1318 (2013).
[37] R. S. M. Rikken, H. H. M. Kerkenaar, R. J. M. Nolte, J. C. Maan, J. C.M. v. Hest, P. C. M. Christianen, and D. A. Wilson Chem. Commun.,5394–5396 (2014).
127

Polymersome magneto-valves for reversible capture and release of . . .
[38] G. Kustler Rev. Roum. Sci. Tech.-El. 52, 265–282 (2007).
[39] G. Maret and K. Dransfeld, Strong and ultrastrong magnetic fields andtheir applications Ch. 3. Berlin: Springer-Verlag (1985).
[40] T. S. Tenforde and R. P. Liburdy J. Theor. Biol. 133, 385–396 (1988).
[41] A. Sakaguchi, A. Hamasaki, and S. Ozeki Chem. Lett. 41, 342–348 (2012).
[42] C. Tan, B. M. Fung, and G. Cho J. Am. Chem. Soc. 124, 11827–11832(2002).
[43] M. Liebi, P. G. van Rhee, P. C. M. Christianen, J. Kohlbrecher, P. Fischer,P. Walde, and E. J. Windhab Langmuir 29, 3467–3473 (2013).
[44] I. O. Shklyarevskiy, P. Jonkheijm, P. C. M. Christianen, A. P. H. J.Schenning, E. W. Meijer, O. Henze, A. F. M. Kilbinger, W. J. Feast,A. Del Guerzo, J.-P. Desvergne, and J. C. Maan J. Am. Chem. Soc. 127,1112–1113 (2005).
[45] P. G. van Rhee, R. S. M. Rikken, L. K. E. A. Abdelmohsen, J. C. Maan,R. J. M. Nolte, J. C. M. van Hest, P. C. M. Christianen, and D. A. WilsonNat. Commun. 5, 5010 (2014).
[46] L. Wang and Y. Yamauchi J. Am. Chem. Soc. 131, 9152–9153 (2009).
[47] J. Giddings Science 260, 1456–1465 (1993).
[48] J. Dobson, R. Bowtell, A. Garcia-Prieto, and Q. Pankhurst PLoS ONE 4,e5431 (2009).
128

Chapter 7
Giant magnetic susceptibilityof gold nanorods
Abstract
We have determined the magnetic properties of single-crystallineAu nanorods in solution using optically-detected magnetic align-ment techniques. The rods exhibit a large anisotropy in the mag-netic volume susceptibility (∆χV ). ∆χV increases with decreasingrod size and increasing aspect ratio and corresponds to an averagevolume susceptibility (χV ), which is drastically enhanced relativeto bulk Au. This high value of χV is confirmed by SQUID magne-tometry and is temperature independent (between 5-300 K). Giventhis peculiar size-, shape- and temperature-dependence we specu-late that the enhanced χV is the result of orbital magnetism due tomesoscopic electron trajectories within the nanorods.
This work has been published in:P. G. van Rhee, P. Zijlstra, T. G. A. Verhagen, J. Aarts, M. I. Katsnelson, J. C. Maan,M. Orrit, P. C. M. Christianen, Physical Review Letters 111, 127202 (2013).
129

7 Giant magnetic susceptibility of gold nanorods
7.1 Introduction
Bulk Au is a diamagnetic material, i.e., one with a negative volume magneticsusceptibility χAu. Recently, it was reported that Au nanoparticles (NPs), withfunctionalized surfaces, show a broad range of magnetic behaviour, ranging from(enhanced) diamagnetic [1,2], to (super)paramagnetic [3–5] and even ferromag-netic up to room temperature [6,7]. The size of the NP and the type of cappingmolecules that are strongly binding to or weakly interacting with Au, appearto influence the magnetic response. Several explanations were suggested, suchas competing magnetic contributions of the NP core and surface [3], the for-mation of a magnetic moment due to the exchange of charges at the Au-ligandinterface [5, 6, 8], the creation of large orbital moments due to electron motionwithin surface clusters [9] and the occurrence of persistent currents in the Aucore [2]. However, so far the origin of this unexpected magnetism and why itdiffers strongly between different types of NPs is not yet understood [2,10,11].
We employ a novel magnetic alignment technique to measure the magneticproperties of rod-shaped Au NPs in solution. We focus on relatively large NPs(all dimensions > 7 nm) that are single-crystalline. The degree of alignmentis measured optically, through the magnetic field-induced linear dichroism andbirefringence, across the Au surface plasmon resonance (SPR) that arises fromcollective oscillation modes of the conduction electrons [12, 13]. We find anenhanced (dia)magnetic behaviour, which does not depend on temperature (inthe range 5-300 K). We speculate that this enhanced magnetism is an orbitaleffect, resulting from mesoscopic electron trajectories within the NPs [2, 14].
Optically probed magnetic alignment
The optically-detected magnetic alignment technique relies on the anisotropyof both the optical and magnetic properties of the Au nanorods. Due to theirshape, the rods exhibit an anisotropic optical response, determined by their lon-gitudinal (α∥) and transverse (α⊥) polarizabilities. Polarized light, therefore,provides a sensitive tool to determine the alignment of rods [15–18] (see section2.8). In this chapter, rod alignment is induced by a magnetic field (B) becauseof the difference in the magnetic susceptibility parallel (χ∥) and perpendicular(χ⊥) to the long rod axis. This leads to an magnetic energy that depends on the
angle (θ) of the rod axis relative to the field direction: ∆Em = −∆χV V B2 cos2 θ2µ0
,with ∆χV = χ∥ − χ⊥, V the NP volume and µ0 the magnetic constant. When∆Em is of the order of the thermal energy kBT , this will result in alignment,which follows a Boltzmann distribution function ∼ exp(−∆Em(θ)/kBT ) andwhich can be characterized by an order parameter S quantifying the degree
130
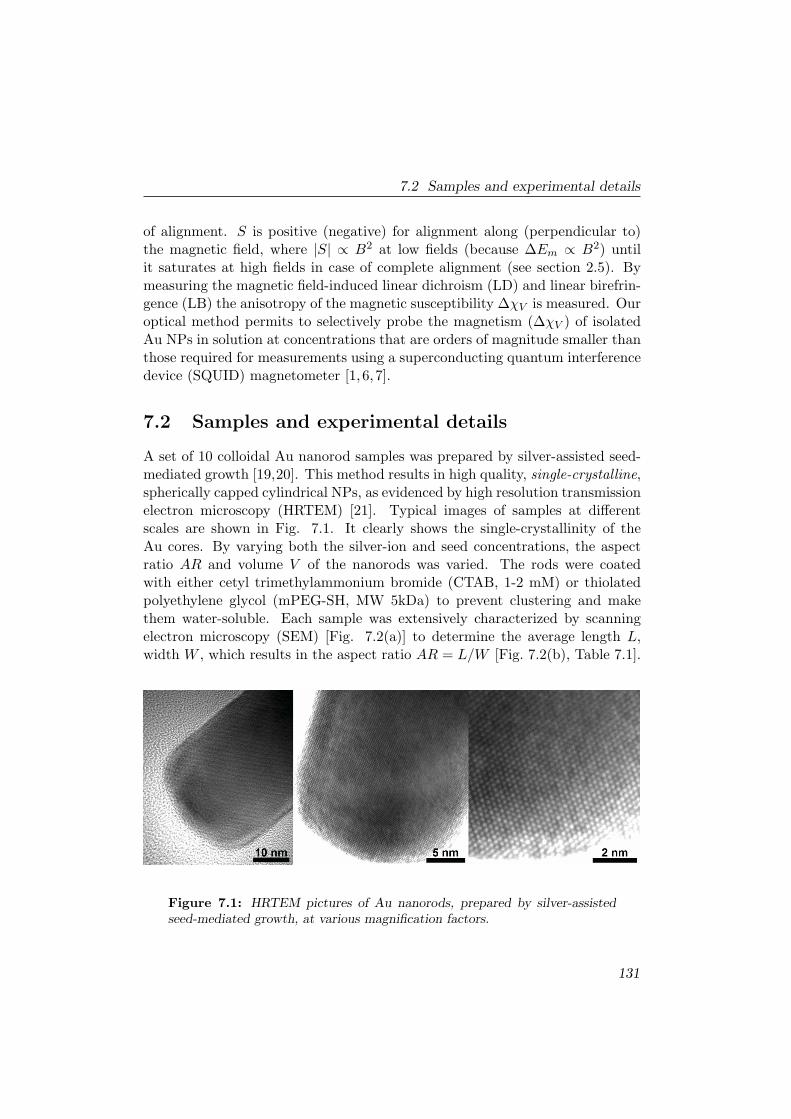
7.2 Samples and experimental details
of alignment. S is positive (negative) for alignment along (perpendicular to)the magnetic field, where |S| ∝ B2 at low fields (because ∆Em ∝ B2) untilit saturates at high fields in case of complete alignment (see section 2.5). Bymeasuring the magnetic field-induced linear dichroism (LD) and linear birefrin-gence (LB) the anisotropy of the magnetic susceptibility ∆χV is measured. Ouroptical method permits to selectively probe the magnetism (∆χV ) of isolatedAu NPs in solution at concentrations that are orders of magnitude smaller thanthose required for measurements using a superconducting quantum interferencedevice (SQUID) magnetometer [1, 6, 7].
7.2 Samples and experimental details
A set of 10 colloidal Au nanorod samples was prepared by silver-assisted seed-mediated growth [19,20]. This method results in high quality, single-crystalline,spherically capped cylindrical NPs, as evidenced by high resolution transmissionelectron microscopy (HRTEM) [21]. Typical images of samples at differentscales are shown in Fig. 7.1. It clearly shows the single-crystallinity of theAu cores. By varying both the silver-ion and seed concentrations, the aspectratio AR and volume V of the nanorods was varied. The rods were coatedwith either cetyl trimethylammonium bromide (CTAB, 1-2 mM) or thiolatedpolyethylene glycol (mPEG-SH, MW 5kDa) to prevent clustering and makethem water-soluble. Each sample was extensively characterized by scanningelectron microscopy (SEM) [Fig. 7.2(a)] to determine the average length L,width W , which results in the aspect ratio AR = L/W [Fig. 7.2(b), Table 7.1].
Figure 7.1: HRTEM pictures of Au nanorods, prepared by silver-assistedseed-mediated growth, at various magnification factors.
131

7 Giant magnetic susceptibility of gold nanorods
600 800 10000
1
Sample GSample B
L
50nm 50nm
A B G
Extin
ctio
n
Wavelength (nm)
50nm
c)
a)
b)
LW
Sample A
Au
CTAB
Figure 7.2: (a) SEM images of Au nanorod samples A, B and G. The imageswere obtained after dropcasting a 2 µl droplet of a 0.1 nM nanorod/watersolution on a conducting Si substrate. (b) Schematic drawing of a cylindri-cal CTAB-capped Au nanorod with length L and width W . (c) Normalizedextinction spectra of samples A, B and G.
The NPs used are relatively large (all dimensions in the range of 7-73 nm, butstill smaller than or in the range of the mean free path of bulk Au at roomtemperature (∼60 nm [22, 23]). The nanorod concentration crod (see Table7.1) was estimated by interpolating previously reported extinction values [24].These extinction spectra of aqueous rod solutions exhibit well-defined SPRpeaks, consisting of a transversal peak (collective electron motion along W )around 520 nm and a longitudinal peak (collective electron motion along L)that shifts towards longer wavelengths with increasing AR [Fig. 7.2(c)] [12,13].The selectivity of our optically-detected magnetic alignment technique is basedon this wavelength and orientation dependence of the SPR (see section 2.8).
132

7.2 Samples and experimental details
We measure S(B), and thereby ∆χV , by LD and LB on aqueous Au rodsuspensions in an optical cuvette, positioned in a 33 T Florida-Bitter magnet.The measured LD signal is given by the difference in the extinction of lightpolarized parallel and perpendicular to the field direction, which is proportionalto (for full expression see equation 2.44)
∆A(B, λ) = A∥ −A⊥ ∝ S(B) · Im[α∥(λ)− α⊥(λ)]. (7.1)
Similarly, LB measures the difference in the refractive index of light polarizedparallel and perpendicular to B, which is proportional to (for full expressionsee equation 2.50)
∆n(B, λ) = n∥ − n⊥ ∝ S(B) · Re[α∥(λ)− α⊥(λ)]. (7.2)
# L W AR V crod S(32T) ∆χV
nm nm 103nm3 nM 10−8
A 35±3 7±1 5.0 1.2±0.5 1.60 0.015 92B 33±6 9±2 3.7 2.0±0.8 0.96 0.017 68C 31±5 12±2 2.6 3.1±1.5 1.17 0.011 28D 44±7 15±3 3.0 6.5±3.7 0.44 0.013 16E 52±5 18±3 2.8 12±5 0.26 0.048 29F 60±6 22±4 2.7 20±9 0.17 0.036 13G 60±6 25±4 2.5 26±11 0.15 0.034 10H 73±8 31±5 2.4 48±21 0.08 0.081 12
I 40±8 15±5 2.7 6±3 0.65 0.032 39JP 40±8 15±5 2.7 6±3 0.65 0.026 32
K 26±4 9±1 2.9 1.4±0.5 4.87 0.011 64L 50±4 16±3 3.1 9.1±3.9 0.57 0.038 31M 51±5 17±3 2.9 11±4 0.58 0.022 16N 109±13 46±4 2.4 153±48 0.04 0.16 7.9O 108±7 56±5 1.9 219±54 0.03 0.13 4.5
Table 7.1: Sample properties: length L, width W , aspect ratio AR = L/W ,volume V = 4πW 3/3+ (L−W )πW 2, rod concentration crod, measured orderparameter S(32 T) and the corresponding calculated susceptibility difference∆χV (using equation 2.15). All samples have a CTAB coating except sampleJP , which has a mPEG-SH coating.
133

7 Giant magnetic susceptibility of gold nanorods
7.3 Experimental results
Magnetic alignment measurements
We use sample H (Table 7.1) to illustrate the typical results. Figure 7.3(a) showsthe ∆A(B) signal for several wavelengths. All curves display a B2 dependenceup to the highest field used. The up- and down-sweeps lead to identical curves,without hysteresis, independent of sweep rate and light intensity. The size ofthe LD signal at 30 T [symbols in Fig. 7.3(b)] roughly follows A(0, λ), shownby the red-dashed line. For wavelengths that overlap with the longitudinal SPRthe LD signal is positive (A∥ > A⊥), whereas at the transverse SPR, the signalis negative (A∥ < A⊥). This clearly demonstrates that the rods align with theirlong axis along the field. The longitudinal part dominates the alignment around
500 600 700 800-8
0
8
0.0
0.3
0 10 20 30 400.0
0.1
0
1
A (0
T)0.0
0.3Sample: H
A(30T) A-calc A(0T)
A (3
0T)
540 nm
633 nm
671nm
700 nm
Sample: H n(30T) n-calc
d)
n/10
-6(3
0T)
Wavelength (nm)
Sample:
Sample: H A(B, )
CDGFE
Hc)
b)
S
A
a)
Magnetic Field (T)
Figure 7.3: (a) ∆A(B) of sample H for different wavelengths. (b) LD mea-surement: squares give ∆A(λ) at 30 T. It roughly follows A(0, λ), the extinc-tion spectrum at 0 T, indicated by the red dashed line. The solid blue lineshows the calculated longitudinal absorption A∥ (c) S(B) for 6 different sam-ples (Table 7.1). (d) LB measurement: Black squares give ∆n(λ) at 30 T andthe solid blue line shows the calculated longitudinal birefringence n∥.
134

7.3 Experimental results
730 nm. Figure 7.3(b) shows the calculated longitudinal absorbance (solid blueline) taking into account the line broadening [25], and a gaussian distributionin sizes. The corresponding procedure was shown in section 2.8 (Fig. 2.12).
The LB amplitude at 30 T [symbols in Fig. 7.3(d)] changes sign whencrossing the SPR maximum, indicating the derivative-like spectrum of the re-fractive index. To determine the degree of magnetic alignment of the rods wetake into account the wavelength and concentration dependence of the signalby defining the order parameter as S(B) = ∆A(B, λ)/∆Amax(λ). ∆Amax(λ) isthe maximum ∆A at a given wavelength, which is reached in the case of fullalignment. For the longitudinal case it is given by ∆Amax(λ) ≈ 3 ·A(0, λ) [26].The resulting S(B) thus reflects the magnetic alignment of the rods and doesnot depend on the rod concentration or the wavelength used.
Figure 7.3(c) shows the resulting S(B) for several samples. In all casesS > 0, indicating rods aligning parallel to the field. S increases quadraticallywith B with a maximum (at 32 T) that is sample-dependent [see results inTable 7.1 and Fig. 7.4(a)], but which never reaches complete alignment (thisis the case for S = 1). Sample H reaches an order parameter of S= 0.071 at30 T. Inserting this value in eqs. (7.1) and (7.2) leads to the full description ofthe LD and LB response at 30 T. The LD and LB curves are interrelated bya Kramers-Kronig transformation [see equation (2.34)] without any adjustableparameter [solid blue lines in Figs. 7.3(b) and 7.3(d)], which illustrates theinternal consistency of our optical methods. Figure 2.18 shows extensive LDand LB measurements on sample O which are fully consistent with sampleH. The full spectrum shows only the change in the absorption spectrum ofthe two modes, with no scattering contribution to the LD measurements. Weconclude that the magnetic moment linearly increases with B up to 32 T,without hysteresis, indicative of a dia- or paramagnetic moment.
The symbols in Fig. 7.4(a) summarize the experimental results, revealing amaximum order parameter [S(32 T)] that increases with the rod volume. SinceS(32 T) ∝ ∆χV V [right axis Fig. 7.4(a)] we can use these results to obtain∆χV as a function of V [symbols Fig. 7.4(b)] and AR [symbols Fig. 7.4(c)]. Wefind ∆χV values of the order of 10−6 - 10−7 and ∆χV increases with decreasingV and increasing AR.
135

7 Giant magnetic susceptibility of gold nanorods
103 104 105
10-3
10-2
103 104 105
10-9
10-8
10-7
10-6
AR:1.9-2.5AR:2.5-3.1AR:3.5-5.0
AR:2.0-2.5AR:2.5-3.0AR:3.5-5.0
µV squidV
V V
c)b)
µV -2/3
squid
Au
VV
(nm
3 )
Volume (nm3)
a)
Volume (nm3)
2 3 4 5
10-9
10-8
10-7
10-6
Aspect Ratio
0.01
0.1
S(3
2T)
Figure 7.4: (a) S(32 T) (and ∆χV V ) as functions of V for the nanorodsamples. The dashed black line indicates S ∝ V 1/3. (b) ∆χV as a function ofV . The dashed black line indicates∆χV ∝ V −2/3 (c)∆χV as a function of AR.In all panels: Three different regimes of the AR are labelled by the squares,circles and triangles. The solid blue and dash-dotted green lines are calculatedwith eq. (7.5), using respectively the measured SQUID susceptibility χsquid ofsample H (#:H) and the susceptibility χAu of bulk Au.
Experimental influence of capping molecules
To investigate the influence of capping molecules, we have measured sample Has a function of the concentration of nanorods and CTAB. Since with increasingnanorod density the extinction of the solution becomes too high to be measured,we have used linear birefringence instead of linear dichroism. The linear bire-fringence signal ∆n(B) scales linearly with the concentration of nanorods, asis shown in Fig. 7.5. It proves that the magnetic field induces alignment ofisolated rods, without any trace of rod aggregation, up to the highest rod con-
136

7.3 Experimental results
0 200 4000
2
4crod=
320 M 160 M 80 M ** 80 M
crod= 320 M 160 M 80 M ** 80 M
0 10 200
2
4
6
Magnetic Field (T)
n/c ro
d /1
04 (L/
mol
)
B2(T2)
b)
n /1
0-6
a)
Figure 7.5: (a) ∆n(B) at λ = 633 nm, for different nanorod concentra-tions. (b) The linear birefringence normalized to the nanorod concentration∆n(B2)/crod. All curves collapse on a single linear curve, indicative of themagnetic alignment of isolated rods. The red curves (**) correspond to a highCTAB concentration of 11.6 mM.
centrations used. Raising the CTAB concentration from 0.3 mM to 11.6 mM,leads to identical linear birefringence signals (compare the red and black curvesin Fig. 7.5). Only a reduction of the signal to noise ratio is seen, because oflight scattering. Even the highest CTAB concentration is too low to form aliquid crystalline phase that could be magnetically aligned [16,27].
In order to exclude experimentally a significant magnetic contribution fromthe capping molecules, we have also performed magnetic alignment (LD) ex-periments on nanorods coated with thiolated polyethylene glycol (mPEG-SH)molecules to compare them with identical particles but capped with CTAB(see Table I in main text). The gold nanorods (synthesis as described in section7.2, L = 40±8 nm, W = 15±3 nm), were split up in two batches and in onebatch the CTAB was exchanged for a mPEG-SH layer. After the surface treat-ment the remaining CTAB in solution was diluted by 3 orders of magnitude bycentrifugation. The resulting two measurements are shown in Fig. 7.6. ThemPEG-SH particles exhibit a 20% lower alignment (and order parameter) com-pared to the CTAB coated sample. Taking into account Table 7.2, we concludethat this difference is most likely caused by the CTAB contribution to the totalalignment. It also shows that both capping molecules behave similarly and thatthe magnetic properties of the Au core are dominant.
Previously, Crespo et al. showed that thiol bonds (with strong Au-S bonds)can influence the magnetic properties of Au nanoparticles (NPs) [6]. In thiscase the SPR completely disappeared for small (1.4 nm in diameter) spher-
137

7 Giant magnetic susceptibility of gold nanorods
500 600 700 8000.0
0.5
1.0
1.5
2.0
0.00
0.05
0.10
0.15
0.20A
(30T
)
A (30T) Ic
A (30T) Jp
A (0
T)
A (0T) Ic
A (0T) Jp
Wavelength (nm)
Figure 7.6: LD measurement: squares give ∆A(30 T) for the CTAB coatedsamples (Ic). The signal roughly follows the extinction A(0 T), indicatedby the solid line. Similarly, the circles indicate ∆A(30 T) of the mPEG-SHcoated samples (Jp) which roughly follows the extinction A(0 T), indicated bythe dashed line. For the mPEG-SH coated NPs, the magnetic alignment is20% reduced compared to the CTAB coated NPs.
ical Au NPs. A previous study, by Zijlstra et al. on the influence of thiolbonds on relatively large gold nanorods (L = 37 nm, W = 9 nm) has showna slight broadening of the SPR, corresponding to a small (1.5 %) reduction inthe concentration of free electrons [28]. Since this effect is highly dependent onthe amount of surface bonds and taking into account the much smaller surfaceto volume ratio for our rods, these results are in agreement with the findingsof Crespo. In addition, in the present case the effect is expected to be evensmaller since the chain length of the mPEG-SH used here is much longer (∼ 50nm) than the thiols measured before (1.5 nm) [28]. This results in a estimatedreduction in the free electron concentration of at most 1%.
Theoretical estimation of the upper limit of the CTAB contribution
We want to estimate an absolute upper limit of the contribution of the CTABcoating molecules to the total magnetic alignment. The contribution of CTABis mainly determined by the anisotropic molar susceptibility of the C-C bond:
138

7.3 Experimental results
∆χm,C-C = χ∥ − χ⊥ = −16.4 · 10−12 m3/mol with χ∥ along the C-C chain [29].If we take into account a chain of NCC=15 C-C bonds with an angle of 108
between the bonds, and the total chain perpendicular to the NP surface, we getan effective total susceptibility anisotropy [30] ∆χm,CTAB = NCC/2 · (sin2(θ)−cos2(θ)) ·∆χm,C-C = −3.8 · 10−11 m3/mol
The area one CTAB head occupies on average is [31] ACTAB = 0.64 nm2.For the estimation of the number of CTAB molecules NCTAB we assume cylin-drical particles with spherical end caps. To determine the total anisotropicsusceptibility, we need to sum over all CTAB molecules, with the main axisperpendicular to the NP surface. The total contribution from the spherical endcaps to the anisotropic susceptibility is zero, the cylindrical surface contributionof CTAB molecules NCTAB in a bilayer is given by:
NCTAB =Abilayer
ACTAB=
2π(rin + rout)(L−W )
ACTAB, (7.3)
with Abilayer the surface of both sides of the bilayer on the cylindrical part,rin = W/2 and rout = W/2+3.9 nm the radii of the inner and outer surface ofthe bilayer and L−W the corresponding length. We are interested in the totalvolume susceptibility difference ∆χbi. In order to compare it to the measuredorder parameter [see Fig. 7.4) we multiply it with the corresponding volumeVbi. This combination equals:
∆χbiVbi(m3) = −NCTAB ·
∆χm,CTAB(m3/mol)
NA(1/mol), (7.4)
with NA the Avogadro number. The minus sign takes into account the per-pendicular alignment of the CTAB compared to the long axis of the nanorods.It gives an upper limit to the total magnetic susceptibility difference, since weuse a perfectly ordered and fully packed CTAB surface. Table 7.2 summarisesthe measured and calculated magnetic susceptibilities along the long axis of thenanorods, and it gives the ratio of the CTAB contribution. The upper limit ison average 15-20 % of the measured order parameter (S ∝ ∆χiVi); this provesthat the main contribution is not caused by the CTAB stacking.
139

7 Giant magnetic susceptibility of gold nanorods
Table 7.2: Sample properties: measured susceptibility difference ∆χV , NPvolume V , calculated CTAB bilayer susceptibility difference ∆χbi and volumeCTAB bilayer Vbi. The ratios are the CTAB contribution compared to thetotal signal of both ∆χ and χ. The ratio of χ is calculated using equation(7.5).
Sample ∆χmeasV ∆χbiVbi Ratio Ratio/nm3 /nm3 ∆χV χV
A 1.15 · 10−3 1.88 · 10−4 0.17 0.09B 1.30 · 10−3 1.91 · 10−4 0.15 0.08C 8.63 · 10−4 1.89 · 10−4 0.22 0.12D 1.01 · 10−3 3.32 · 10−4 0.33 0.18E 3.53 · 10−3 4.56 · 10−4 0.13 0.07F 2.64 · 10−3 6.07 · 10−4 0.23 0.12G 2.47 · 10−3 6.24 · 10−4 0.25 0.13H 5.86 · 10−3 9.11 · 10−4 0.16 0.08I 2.39 · 10−3 2.91 · 10−4 0.12 0.06
SQUID measurements
The previous results showed the anisotropy of the magnetic susceptibility. Theaverage magnetisation χV can be measured by using a SQUID magnetome-ter. The sample contained a high concentration (185 nM) nanorods of sampleH (large volume and magnetic moment), dispersed into a PVA matrix (1.2gr/mL). We also made a PVA sample without the nanorods; both samples(0.05-0.06 g) were inserted in the same sample holder (a transparent plasticstraw). Fig. 7.7 shows the resulting magnetic moments as a function of mag-netic field and temperature. Subtracting the weight-corrected values with andwithout rods from each other, with an estimated rod concentration crod, resultsin the magnetic moment per rod mrod. The magnetic moment was found to beindependent of temperature (between 5 and 300 K) and linear with B, with anegative slope, showing no trace of saturation, demonstrating that the rods arediamagnetic with a magnetic susceptibility of χV = (−4.9± 1.2) · 10−4, i.e. 14(±4) times χAu.
The outcome of the SQUID experiment demonstrates that the enhancedmagnetism is not due to any paramagnetic impurities in the sample. Mostimportantly, it proves that the overall (bulk) magnetic susceptibility of sampleH is enhanced over χAu by more than one order of magnitude. In chapter 2we have derived the demagnetization of nanostructures inside a magnetic field.
140

7.3 Experimental results
0 150 300
-0.8
-0.4
0.0
0 100 200 300-6
0
-4 -2 0 2 4
-2
0
2
4
-5 0 5-10
0
10
straw + PVA straw + PVA + NPs
m (1
0-6 J/
T)
Temperature (K)
B = 2 Tsingle rod
mro
d (10-2
0 J/T
)
Temperature (K)
b)
straw straw + PVA straw + PVA + NPs
m (1
0-6 J/
T)
Magnetic Field (T)
a) T = 300 Ksingle rod
mro
d (10-2
0 J/T
)
Magnetic Field (T)
Figure 7.7: Measured SQUID magnetisation, with visible error bars if theerror is larger than the symbol. (a) Magnetisation vs. magnetic field at 300 K.The inset shows the background corrected magnetisation for one single rod.The field dependence was measured four times, which resulted in an averagesusceptibility of χV = (−4.9± 1.2) · 10−4. (b) Magnetisation vs. temperatureat 2 T. The inset shows the background corrected magnetisation for one singlerod.
For the nanorods with |χV | ≪ 1, ∆χV is given by [see equation (2.25)]:
∆χV = (D⊥ −D∥) (χV − χm)2 . (7.5)
with D⊥ and D∥, the demagnetisation factors perpendicular and parallel tothe rod axis, respectively, and χm is the susceptibility of the medium (χm =−8.8·10−6 for water [22]). Taking the demagnetization factors for ellipsoids [seeequation (2.18)] and inserting the bulk Au susceptibility (χV = χAu = −3.4 ·10−5 [22]), we find a ∆χV value of about 10−10, which is 3 orders of magnitudetoo small compared to the data [dash-dotted green lines Fig. 7.4(b),(c)]. Thisexcludes that the bulk Au susceptibility contributes to the magnetic anisotropy.
Inserting the measured χV value in eq. (7.5) leads to a ∆χV value forsample H that is consistent with the outcome of the magnetic alignment ex-periment [solid blue curves in Fig. 7.4]. The enhanced magnetism of sampleH is, therefore, a bulk effect and not the result of Au surface states [32, 33] orother geometrical effects [14,34,35]. It should be noted, however, that eq. (7.5)underestimates the strong V and AR dependencies of the ∆χV data [solid bluecurves in Fig. 7.4(b),(c)]. Finally, the SQUID experiment rules out that the
141

7 Giant magnetic susceptibility of gold nanorods
alignment is due to the intrinsic anisotropy of the magnetic susceptibility ofthe CTAB capping molecules [27], because in that case ∆χV ∝ χV [26,36,37].
7.4 Discussion
We have shown that solutions with varying CTAB concentrations, but the sameAu cores, lead to identical LB signals (Fig. 7.5). Furthermore, samples I andJP , which are identical and have only different capping molecules show a verysimilar LD signal (Fig. 7.6). The relative insensitivity of the signal to thecapping molecules, together with the SQUID results, prove that the degree ofalignment is predominantly due to the Au cores.
Enhanced magnetism
To understand the enhanced magnetism of the Au nanorods we first discusssample H of which we have a full set of experimental data. It exhibits ananomalous temperature-independent, diamagnetic response (Fig. 7.7), which iscompatible with the magnetic alignment signal that does not show any hystere-sis and saturation, even at 32 T (Fig. 7.4). The dimensions of these nanorodsare much larger than the particles for which para- or ferromagnetism have beenobserved (typically smaller than 5 nm). Furthermore, most ferro- and paramag-netic NPs are capped by strongly interacting molecules, such as thiols, formingstrong Au-S bonds, leading to a reduction of the free electron density andeventually to the disappearance of the SPR [6]. In our case, both CTAB and(thiolated) mPEG-SH cappings left the electronic surface properties virtuallyunchanged (reduction in free electron density < 1%) and resulted in a similarmagnetic response. This rules out most of the previously suggested mecha-nisms, involving Au-ligand interactions, to explain the enhanced diamagnetismobserved here. Therefore, we are convinced that the enhanced diamagnetism isof orbital nature [2, 11].
Orbital magnetism in nanorods
The dimensions of the sample H nanorods (W = 31 nm, L = 73 nm) arecomparable to the room temperature elastic mean free path le (∼60 nm [22,
23]) and thermal length LT =~vf
πkBT (∼ 10 nm) of bulk Au (~ is Planck’sconstant, vf is the electron Fermi-velocity) and much smaller than le and LT atlow temperature (5 K). The temperature-independent χV measured by SQUIDthus strongly suggests that even the sample H rods (our largest) are in themesoscopic (R < LT ), ballistic (R < le) regime up to room temperature, where
142
References
R = V 1/3 is the characteristic size of the rods. Mesoscopic fluctuations ofthe orbital magnetic susceptibility of finite size metallic systems can be verylarge, and has been the subject of quite intensive theoretical investigations[14, 35]. For an individual metallic nanostructure the magnetic susceptibilitycan oscillate between negative and positive values, as a function of kFR (kFis the Fermi-wavevector), exhibiting very large values of up to 100 times theLandau susceptibility of a bulk free electron gas. For an ensemble consistingof non-identical nanosystems, as we consider here, where the variations in kFRare large (> 10%) these oscillations disappear, but the susceptibility does notaverage out to zero. The remaining ensemble susceptibility χV can still besubstantial and is typically paramagnetic, both in the diffusive [35] and theballistic [14] regimes.
Experimental evidence for this enhanced paramagnetic susceptibility hasbeen found for micrometer sized GaAs squares [38]. It is, therefore, likely thatorbital magnetism in high quality single crystalline metallic nanoparticles canbe quite significant, although a full calculation is not available in literatureyet. Such a calculation should include several new ingredients to explain ourresults. First of all, it should take into account spin-orbit coupling, whichis known to be strong in Au [39, 40] and which may result in a change ofsign of the orbital magnetism (from para- to diamagnetic) analogous to thechange of sign of the magneto-conductance under the influence of spin-orbitcoupling [41]. Secondly, the possible effects of surface states should be taken intoaccount [32, 33], especially when considering smaller NPs. Thirdly, the actualgeometry of the nanoparticles plays an important role in their final orbitalmagnetism, because of the contributions of the different electron trajectories,which can be either regular or chaotic [14,34,35,42]. Most probably, the lattertwo points are crucial in order to understand the increasing value of ∆χV withdecreasing volume and increasing aspect ratio, because for those samples thesurface/volume ratio increases [dashed black line in Fig. 7.4(b)].
7.5 Conclusion
In conclusion, we have observed a giant magnetic susceptibility of Au nanorodsin solution, using an optically-detected magnetic alignment technique. We spec-ulate that this enhanced magnetism results from orbital magnetism of the freeelectrons in the Au core. We anticipate that single-crystalline metal NPs pro-vide a versatile experimental system to better understand mesoscopic fluctu-ations in the orbital magnetic susceptibility of confined electron systems indifferent quantum transport regimes.
143

7 Giant magnetic susceptibility of gold nanorods
References
[1] E. Guerrero, M. A. Munoz Marquez, M. A. Garcıa, P. Crespo,E. Fernandez-Pinel, A. Hernando, and A. Fernandez Nanotechnology 19,175701 (2008).
[2] R. Greget, G. L. Nealon, B. Vileno, P. Turek, C. Meny, F. Ott, A. Derory,E. Voirin, E. Riviere, A. Rogalev, F. Wilhelm, L. Joly, W. Knafo, G. Bal-lon, E. Terazzi, J.-P. Kappler, B. Donnio, and J.-L. Gallani Chem. Phys.Chem. 13, 3092–3097 (2012).
[3] Y. Yamamoto, T. Miura, M. Suzuki, N. Kawamura, H. Miyagawa, T. Naka-mura, K. Kobayashi, T. Teranishi, and H. Hori Phys. Rev. Lett. 93, 116801(2004).
[4] Y. Negishi, H. Tsunoyama, M. Suzuki, N. Kawamura, M. M. Matsushita,K. Maruyama, T. Sugawara, T. Yokoyama, and T. Tsukuda J. Am. Chem.Soc. 128, 12034–12035 (2006).
[5] J. Bartolome, F. Bartolome, L. M. Garcıa, A. I. Figueroa, A. Repolles,M. J. Martınez, F. Luis, C. Magen, S. Selenska-Pobell, F. Pobell, T. Reitz,R. Schonemann, T. Herrmansdorfer, M. Merroun, A. Geissler, F. Wilhelm,and A. Rogalev Phys. Rev. Lett. 109, 247203 (2012).
[6] P. Crespo, R. Litran, T. C. Rojas, M. Multigner, J. M. de la Fuente, J. C.Sanchez-Lopez, M. A. Garcıa, A. Hernando, S. Penades, and A. FernandezPhys. Rev. Lett. 93, 087204 (2004).
[7] J. S. Garitaonandia, M. Insausti, E. Goikolea, M. Suzuki, J. D. Cashion,N. Kawamura, H. Ohsawa, I. Gil de Muro, K. Suzuki, F. Plazaola, andT. Rojo Nano Lett. 8, 661–667 (2008).
[8] M. Suda, N. Kameyama, M. Suzuki, N. Kawamura, and Y. Einaga Angew.Chem. Int. Ed. 47, 160–163 (2008).
[9] A. Hernando, P. Crespo, and M. A. Garcıa Phys. Rev. Lett. 96, 057206(2006).
[10] S. Trudel Gold Bull. 44, 3–13 (2011).
[11] G. L. Nealon, B. Donnio, R. Greget, J.-P. Kappler, E. Terazzi, and J.-L.Gallani Nanoscale 4, 5244 (2012).
144

References
[12] U. Kreibig and M. Vollmer, Optical Properties of Metal Clusters. Berlin:Springer (1995).
[13] C. Bohren and D. Huffman, Absorption and Scattering of Light by SmallParticles. New York: Wiley (1998).
[14] K. Richter, D. Ullmo, and R. A. Jalabert Phys. Rep. 276, 1–83 (1996).
[15] C. Sonnichsen and A. P. Alivisatos Nano Lett. 5, 301–304 (2004).
[16] Q. Liu, Y. Cui, D. Gardner, X. Li, S. He, and I. I. Smalyukh Nano Lett.10, 1347–1353 (2010).
[17] P. V. Ruijgrok, N. R. Verhart, P. Zijlstra, A. L. Tchebotareva, and M. OrritPhys. Rev. Lett. 107, 037401 (2011).
[18] P. Zijlstra, M. van Stee, N. Verhart, Z. Gu, and M. Orrit Phys. Chem.Chem. Phys. 14, 4584–4588 (2012).
[19] P. Zijlstra, C. Bullen, J. Chon, and M. Gu J. Phys. Chem. B 110, 19315–18(2007).
[20] B. Nikoobakht and M. El-Sayed Chem. Mater. 15, 1957 (2003).
[21] P. Zijlstra and M. Orrit Rep. Prog. Phys. 74, 106401 (2011).
[22] R. R. Gupta, Diamagnetic susceptibility (Landolt Bornstein vol. 16).Springer-Verlag, Berlin Heidelberg (1986).
[23] S. Vonsovsky and M. Katsnelson, Quantum Solid State Physics. Berlin:Springer Series in Solid-State Sciences (1989).
[24] C. J. Orendorff and C. J. Murphy J. Phys. Chem. B 110, 3990–3994 (2006).
[25] C. Novo, D. Gomez, J. Prez-Juste, Z. Y. Zhang, H. Petrova, M. Reismann,P. Mulvaney, and G. V. Hartland Phys. Chem. Chem. Phys. 8, 3540–3546(2006).
[26] I. O. Shklyarevskiy, P. C. M. Christianen, E. Aret, H. Meekes, E. Vlieg,G. Deroover, P. Callant, L. van Meervelt, and J. C. Maan J. Phys. Chem.B 108, 16386–16391 (2004).
[27] H. Yonemura, S. Natsuko, J. Suyama, and S. Yamada J. Photochem. Pho-tobiol. A 220, 179–187 (2011).
145

7 Giant magnetic susceptibility of gold nanorods
[28] P. Zijlstra, P. M. R. Paulo, K. Yu, Q.-H. Xu, and M. Orrit Angew. Chem.Int. Ed. 51, 8352–8355 (2012).
[29] G. Maret and K. Dransfeld, Biomolecules and Polymers in High SteadyMagnetic Fields. In Strong and Ultrastrong Magnetic Fields and TheirApplications. Springer-Verlag, Berlin/New York (1985).
[30] Y. Yamauchi, A. Sawada, A. Sugiyama, T. Osaka, Y. Sakka, andK. Kuroda Chem. Asian J. 2, 1505–1512 (2007).
[31] T. Tanford, The Hydrophobic Effect. New York: Wiley (1980).
[32] P. Avouris and I.-W. Lyo Science 264, 942–945 (1994).
[33] F. Reinert, G. Nicolay, S. Schmidt, D. Ehm, and S. Hufner Phys. Rev. B63, 115415 (2001).
[34] J. Ma and K. Nakamura Phys. Rev. B 60, 10676–10679 (1999).
[35] B. L. Altshuler, Y. Gefen, Y. Imry, and G. Montambaux Phys. Rev. B 47,10335–10341 (1993).
[36] J. S. Clawson, G. P. Holland, and T. M. Alam Phys. Chem. Chem. Phys.8, 2635–2641 (2006).
[37] T. M. Alam and S. K. McIntyre Langmuir 24, 13890–13896 (2008).
[38] L. P. Levy, G. Dolan, J. Dunsmuir, and H. Bouchiat Phys. Rev. Lett. 64,2074–2077 (1990).
[39] S. LaShell, B. A. McDougall, and E. Jensen Phys. Rev. Lett. 77, 3419–3422(1996).
[40] M. Hoesch, M. Muntwiler, V. N. Petrov, M. Hengsberger, L. Patthey,M. Shi, M. Falub, T. Greber, and J. Osterwalder Phys. Rev. B 69, 241401(2004).
[41] C. W. J. Beenakker Rev. of Mod. Phys. 69, 731–808 (1997).
[42] W. P. Halperin Rev. of Mod. Phys. 58, 533–606 (1986).
146

Summary
The creation and manipulation of things on a very small, i.e. nanometer, scale,is of great importance for many applications. The interior of natural cells forinstance, which are the building blocks of living species, consists out of a greatvariety of (nano) objects with very specific functionalities. Therefore nature canbe used as an inspiration to create artificial nano-applications. Magnetic fieldsprovide a unique tool to manipulate the properties on a nanoscale. Magnetism isusually associated with ferromagnetic materials. All matter, however, exhibits(dia)magnetism. Magnetic fields induce a small opposing magnetic moment indiamagnetic materials, which can lead to orientational and levitational forces.These orientation forces result from anisotropically shaped or constructed nano-objects, which can be probed by using anisotropic optical properties.
The anisotropic properties can be magnetically manipulated in multipleways. Firstly, magnetic fields are able to align nano-objects. By probing theiralignment, more information about the size and/or structure can be deter-mined. Conversely, when the size and structure are precisely known, the exactmagnetic moment can be determined. Secondly, magnetic fields can bend nano-structures by aligning the anisotropic molecules, they are composed of. Thisgives the possibility of using external forces to reversibly control and modifynano-objects. Finally, magnetic fields can influence the (irreversible) aggrega-tion or nucleation of molecular aggregates. By employing magnetic fields (only)at the start of a delicate self-assembly process, small energy differences can leadto strongly amplified effects.
This thesis starts with a general introduction and motivation in chapter1. In chapter 2 the theory of magnetic field-induced orientation and levitationis described. These magnetic forces affect anisotropically shaped or composedmaterials, which can be optically probed. By probing either the anisotropyin refractive index (linear birefringence) or in absorbance (linear dichroism)the magnetically induced alignment is measured. Moreover, the overlap anddifferences of these optical techniques are extensively discussed, each having itsown advantages.
147

Chapters 3-5 show the selection of supramolecular chirality by rotationaland magnetic forces. Most essential biological molecules exist only in one of thetwo possible enantiomers (mirror-image structures) and are either left- or right-handed, either because they possess a chiral center or through their structure(helices, for example, are intrinsically chiral). The origin of this homochiralityhas not yet been unraveled. Efforts towards understanding this phenomenonultimately have to rely on the effect of a chiral, external influence that, atsome point during the evolution, has driven certain systems towards specificchiralities. We show that an almost instantaneous, falsely chiral perturbationcan be transferred and amplified in growing supramolecular structures. Thisprovides evidence that even a falsely chiral influence is able to induce absoluteenantioselection, which was thought to be impossible for energetic reasons fora long time.
Chapter 3 starts with a qualitative description of the field-induced chiralselection. True and false chirality are introduced to show the concept of chiralforces, which both can lead to absolute enantioselection. We demonstrate thatthe handedness of supramolecular aggregates formed from achiral molecules canbe directed by applying a combination of rotational, gravitational and orientingforces during the self-assembly process. In this system, supramolecular chiralityis determined by the relative directions of rotation and magnetically tunedeffective gravity, but the magnetic orientation of the aggregates is also essential.This system is a rare example in which gravity is shown to influence the outcomeof a chemical process. Our ability to tune the direction and magnitude of theeffective gravity by means of diamagnetic levitation, which affects the totalhydrodynamic flow, is therefore crucial.
In order to determine the robustness of the chiral selection, chapter 4 givesa quantitative description as function of temperature, monomer and salt con-centrations, rotation frequency, the magnetic field strength and profile, and thetime during which the different external forces are present. Although the enan-tioselection itself is strong and robust, the efficiency of the selection dependson the duration and strength of the external forces, and the aggregation speed.
Chapter 5 describes the effect of the individual forces on the chiral selection.By delaying the magnetic field or the rotation, or both, with respect to the startof the aggregation, we prove that the enantioselection takes place during theinitial aggration (1 % of the total aggregation time). The delay of the magneticfield also shows that the start of the rotation itself, which due to the frictionforces is truly chiral, has no effect on the final enantioselection. Moreover, weshow that the hydrodynamic flow sculpts the aggregates, which is not the casefor experiments without rotation or with a large delay in rotation.
Chapter 6 shows the magnetic manipulation of the shape of artificial stom-
atocytes, which look like minuscule, indented balloons. These almost sphericalassemblies have an internal cavity, which is connected to the outside worldvia a small ’mouth’. Magnetic alignment and deformation of the stomatocyteslead to well-controlled and reversible opening and closing of the mouth region,which provides an interesting capture and release mechanism. This is the firstexample of bowl-shaped structures that function as reversible supramolecularmagneto-valves. It opens the possibility for (drug) delivery and nanoreactorapplications.
Finally, chapter 7 shows a that magnetic alignment is capable of determin-ing the magnetic properties of nanorods at concentrations that are orders ofmagnitude lower than those required for conventional SQUID magnetometry.We found a diamagnetic signal that is 14 times larger than that of bulk gold.The magnetic moment of the rods was found to increase with decreasing rodsize and increasing aspect ratio. This behaviour can be explained by the spe-cific trajectories the free electrons have to follow within the nanorods, whichwere theoretically predicted to give a novel type of orbital magnetism that wasnever observed in metallic nanorods.


Samenvatting
Het ontwikkelen en manipuleren van objecten op een hele kleine (nanometer)schaal, is van grote waarde voor vele toepassingen. Bijvoorbeeld het binnen-ste van cellen, de bouwstenen van het leven, bestaat uit een breed spectrumvan ingredienten met heel specifieke (nano) functies. De natuur kan zodoendeals inspiratie dienen voor het maken van nieuwe (nano) toepassingen. Voor hetmanipuleren op een nanoschaal zijn magneetvelden uitermate geschikt. Magne-tisme wordt meestal gerelateerd aan ferromagnetische materialen. Echter, allematerialen zijn (dia)magnetisch. Een magneetveld induceert namelijk kleinekringstroompjes in diamagnetische materialen met orientatie en levitatie krach-ten als gevolg. Daarnaast zorgt de anisotrope vorm of structuur van zo’n nano-object, voor sterk anistrope magnetische en optische eigenschappen.
De anisotrope eigenschappen van (nano) objecten maken hen uitermate ge-schikt voor magnetische manipulatie. Ten eerste kunnen magneetvelden nano-objecten uitlijnen. Deze uitlijning geeft informatie over de grootte of de struc-tuur van zo’n object. Bovendien, als zowel grootte en structuur bekend zijn, kanhet magnetische moment bepaald worden. Ten tweede kunnen magneetveldennanostructuren ook vervormen indien het opgebouwd is uit sterk uitgelijndemoleculen. Deze vervorming kan gebruikt worden voor het reversibel vervor-men en manipuleren van nano-objecten. Ten slotte kan een magneetveld de(irreversibele) aggregatie of nucleatie van moleculen manipuleren. Aan het be-gin van zo’n reactie kunnen kleine magneet geınduceerde energie verschillenleiden tot een versterkt permanent effect op de eindstructuur.
Dit proefschrift start met een algemene introductie en motivatie in hoofd-stuk 1. Vervolgens introduceren we in hoofdstuk 2 de theorie van magnetischeorientatie en levitatie. Zulke magnetische krachten kunnen materialen met eenanisotrope vorm en/of structuur sterk beınvloeden. De uitlijning van mate-rialen wordt gemeten door verschillen in de brekingsindex of in de absorptiete meten. Daarnaast bespreken we uitvoerig de verschillen en overeenkomstentussen deze technieken, waarbij elke techniek zijn eigen voordelen heeft.
De hoofdstukken 3 t/m 5 laten de selectie van supramoleculaire chiraliteit
151
zien met behulp van rotationele en magnetische krachten. De meeste essentielebiomoleculen bestaan slechts uit een type enantiomeer, die ofwel links- danwelrechtshandig is. Deze spiegel symmetrie is een gevolg van een chiraal centrumof een chirale structuur (bijv. de draairichting van een helix). De oorsprongvan deze homochiraliteit van het leven is echter nog onbekend. Het onderzoeknaar deze oorzaak is voornamelijk gericht op het gebruik van externe krachten.Deze krachten kunnen gedurende de evolutie achirale systemen in de richtingvan specifiek chirale systemen leiden. We laten zien dat we met een korte,instantane ‘vals’ chirale verstoring, groeiende structuren kunnen beınvloeden.Dit bewijst dat volledige enantioselectie mogelijk is door het gebruik van ‘vals’chirale invloeden, dit was tot op heden nog als onmogelijk geacht.
Hoofdstuk 3 start met een kwalitatieve beschrijving van de magnetischgeınduceerde chirale selectie. Hiervoor maken we een onderscheid tussen ‘vals’en ‘echt’ chirale krachtencombinaties. Beide combinaties kunnen namelijk lei-den tot volledige enantioselectie. Door rotatie, gravitatie en orientatie te gebrui-ken, laten we de succesvolle supramoleculaire assemblage van achirale moleculenin chirale structuren zien. Deze selectie wordt experimenteel beınvloed door derelatieve richting van de rotatie en de effectieve zwaartekracht, waarbij ook deinvloed van magnetische uitlijning belangrijk is. Dit systeem is een bijzondervoorbeeld van de invloed van de zwaartekracht op de uitkomst van een zelf-assemblage proces. Magnetische levitatie is hierbij van cruciaal belang voor hetbeınvloeden van de effectieve zwaartekracht en resulteert in een veranderendevloeistof stroming.
De kwantitatieve beschrijving van de chirale selectie wordt in hoofdstuk 4gegeven. We laten zien dat de selectie robuust is ten op zichte van verande-ringen in temperatuur, monomeer en zout concentraties, rotatie frequentie, desterkte en het profiel van het magneetveld, en de totale tijdsduur. De effectivi-teit daarentegen, hangt sterk samen met de tijsduur en sterkte van de externekrachten, maar ook de snelheid van de reactie.
In hoofdstuk 5 beschrijven we het effect van de individuele krachten ophet chirale selectie proces. Door de toepassing van magneetveld of rotatie tevertragen, ten opzichte van het begin van de aggregatie, laten we zien dat deenantioselectie alleen plaatsvindt aan het begin van de aggregatie (1 % van detotale aggregatie tijd). De vertaging van het magneetveld laat ook zien dathet initieren van een rotatie – wrijving veroorzaakt een ‘echt’ chirale kracht– geen invloed heeft op het totale proces. Daarnaast tonen we aan dat devloeistofstroming de aggregaten een unieke vorm geeft. In de afwezigheid vanrotatie, of de vertaging daarvan, ontbreekt de enantioselectie namelijk.
Hoofdstuk 6 laat de magnetische vervorming van kunstmatig gevormde na-noblaasjes zien, die net lijken op miniscule geımplodeerde ballonnen. Deze

bolvormige structuren hebben een afgesloten compartiment dat via een kleineopening verbonden is met de buitenkant. Doordat het magneetveld zorgt vooruitlijning en vervorming van de wand, opent en sluit het nanoblaasje als geheel.Dit leidt tot een mechanisme waarbij de nanoblaasjes op een reversibele manierandere deeltjes op kunnen nemen en los kunnen laten. Hiermee laten we voorhet eerst zien dat nanoblaasjes kunnen dienen als een reversibele, door een mag-neet geopende, capsule. Dit is onder meer interessant voor toepassingen metnanoreactoren en medicijn transport.
Ten slotte laten we in hoofdstuk 7 zien dat magnetische uitlijning een nieuwemethode voor magnetisatiemetingen vormt die ordes van grootte gevoeliger isdan conventionele technieken (zoals bijvoorbeeld SQUID metingen). Deze me-tingen laten zien dat goud nanorods 14 keer sterker diamagnetisch zijn dannormaal (bulk) goud. Het magnetische moment neemt af voor kleinere rods,maar neemt toe voor een meer asymmetrische verhouding. Deze versterkingverklaren we door de typische orbitalen van electronen in nanorods in beschou-wing te nemen. Deze eigenschap is theoretisch voorspeld, maar was tot opheden nog nooit experimenteel waargenomen.

Nawoord
Het is nu een paar maanden geleden sinds het werk aan dit proefschrift erop zit.Aangezien een dankwoord meestal het best gelezen onderdeel is, en een PhDmeer is dan alleen een proefschrift, zou het niet meer dan logisch zijn om hiergenoeg ruimte voor te reserveren. In het bijzonder wil ik hier alle personen vanhet High Field Magnet Laboratory bedanken. Om af te wijken van een langlijstje namen, of het woord bedankt veelvuldig te herhalen, zeg ik op deze plek:Bedankt! Daarvoor in de plaats mix ik de belangrijkste personen met enkelepersoonlijke ervaringen.
Toen ik 5 jaar geleden het HFML binnenstapte voor een masterstage kon iknog niet vermoeden hoe het lab er vandaag de dag bij zou staan. Destijds teldehet lab ongeveer 25 werknemers die samen 1000 magneeturen aan onderzoekmogelijk maakten, tegenover het dubbele nu! Vanuit een leuk afstudeerjaar ophet HFML kreeg ik de vrijheid van mijn promotor Jan-Kees Maan om mijnPHD traject zelf in te delen en vorm te geven. Met Peter Christianen als (co-)promotor ging ik het avontuur aan om gouddeeltjes en de groei van chiralemoleculen in hoge magneetvelden te bestuderen. Al snel liet ik zien dat por-fyrines uitlijnden in een magneetveld, echter naast progressie zijn er ook altijdtegenvallers, zo lukte het maar niet om het originele experiment te reproduce-ren. Door de zuiverheid van het materiaal te meten, kwamen we er na een jaarachter dat het chiraal vervuild was. It was in this period that I had the opportu-nity to start working alongside Luigi Monsu Scolaro, Norberto Micali and IlariaOcchiuto. It was a plessure to unravel all kind of new insights why chiral selec-tion can take place inside magnetic fields. Ilaria, I will always remember youreither enthousiastic/disappointed reaction after each new CD trace. Norbertoand Luigi, most traces in chapters 3-5 were measured, analysed and discussedtogether with you. You were a great help and inspiration for this thesis.
Naast de vele metingen aan chirale structuren, vormden de gouden nano-deeltjes een leuk tweede project. Samen met Michel Orrit en Peter Zijlstrawaren we verbaasd door het gigantische magnetische signaal wat herhaaldelijkgemeten werd. Peter, jou experimentele handigheid heeft me laten zien dat jein korte tijd veel kunt meten, maar ook kunt repareren. Als ik het me goed
155

herinner hebben we in een dag 3 verschillende apparaten gerepareerd of ver-vangen en nog steeds bruikbare metingen geproduceerd. Michel, your to thepoint questions and suggestions led to the successful publication of this work.Together with the theoretical support of Mikhail Katsnelson, we were able to(partly) solve the mystery behind this giant diamagnetism.
Naast wetenschappers had ik ook het genoegen om met verschillende we-tenschapper in spe te kunnen werken. Lyckle, wat begon als speels onderzoeknaar de invloed van de zwaartekracht op roterende vloeistof, monde uit in eenmooie bachelorscriptie. Esther, ik vond het leuk een nieuwe opstelling te zienonstaan waarmee met licht, magnetisme te meten is. Voor ons beiden was diteen mooi leertraject, waarbij bleek dat experimentele natuurkunde vele veras-singen in petto kan hebben. Verrassingen kwamen ook naar voren bij Frank’smasterstage. Ondanks de vele aanvankelijke teleurstellingen in de metingen,zijn verschillende figuren gebruikt in deze thesis. Ik vond het dan ook mooi omte zien dat we na twee intense (∼ 340 MWh) weken — waarin we ook nog naar2 wedstrijden, 3 trainingen en een feestje gingen — een fantastisch resultaatsamen neergezet hebben! Dat reproduceren soms behoorlijk pittig kan zijn,kwam ik later in het chiraliteitsproject achter. Andre, je hebt veel werk verzeten veel teleurstellingen moeten overwinnen om tot de conclusie te komen datwe eigenlijk de hele tijd aan (min of meer) vervuild materiaal gemeten hebben.In mijn geheugen gegrifd staat de grafiek waarin je 400 meetpunten liet zien,waarbij elk punt stond voor 1 uur rotatie.
Het leuke aan wetenschap is dat je afentoe ook leuke verrassingen tegen-komt. Een zo’n moment beleefde ik samen met Daniela Wilson. Het liet hetme zien dat uniek origineel onderzoek zich niet laat voorspellen, en slechts af-hanelijk is van goede wetenschappers, creatieve ideeen en simpelweg heel veelproberen. Daniela, despite the lack of proper chemical tools in the lab, I wasamazed by how much you can do in a few days of work. In the short amountof time we measured together, you showed me how much work you can do ifyou really like your work. It is nice to see that you are starting your own groupnow, including the promising work in magnetic fields with Roger.
Ook zijn er veel ideeen geprobeerd die niet altijd direct resultaat hadden.Soms een testje van een half uur, soms een hele meetweek. Maar door nieuwedingen te blijven proberen, bleven er verrassingen op mijn pad komen. Togetherwith Andres I was able to see some surprising alignment of semiconductor ma-terial made by Francesca Pietra. Francesca, I won’t forget our day round mea-surements, your enthusiasm was an important factor here. First it didn’t makesense at all, but after more measurements, and with the help of Freddy Rabouw,we were able to make some sense out of it. Francesca, to use your words, atthe end we made it!

Next to work on in-house research, I had the chance to work with a diverseselection of scientists from all over Europe. Marianne Liebi, together we learntthe (im)possibilities of measuring birefringence in magnetic fields, which resul-ted in one nice paper. After developing MCD measurements with Esther, I hadthe opportunity to work with some experienced MCD scientists from Firenze.Giulio, you were always hungry for more, I really liked your enthusiasm in im-proving the setup, this was the essential work for the latter successes. Valentina,Francesco, we had a really nice time in- and outside the lab. It included thesuccessful measurements of many samples. From Poland, Marceli Koralewskivisited to measure the alignment of all kind of splines. Marceli, it was fun ha-ving you around for measurements, you even made into our lab’s promotionalvideo. Finally, I like to mention the chemists from Namur: Davide, Luca, An-toinne and Dario. The diversity of cultures, personalities, samples and resultsmade up for a very interesting week, were I could forget all my troubles I hadat home. Despite the lack of reproducing previous results, many new projectswere started.
De tijd in het lab kenmerkt zich tot meer dan alleen wetenschap. Door tweejaar deel te zijn van de IMM bestuursvergaderingen heb ik een hele andere kantvan de wetenschap gezien, daarnaast was het ook een fijne afwisseling van hetlabwerk. Mijn kantoorgenoten in het altijd zonnige zuid-kantoor zorgden voorzowel een productieve sfeer als ook voor vele gezellige, iets minder productieveuurtjes. Veerendra, ik leerde je kennen in het zuid kantoor van de oude stempel:productief maar ook regelmatig tijd voor een (on)zinnig praatje. Ik ben blij datik bij ASML nog steeds afentoe een goed gesprek met je kan hebben, dit heb ikaltijd erg gewaardeerd in het lab. Bhawana, we started almost simultaneously,both having our ups and downs, you were a good friend all along. Francesca,met jou was het altijd gezellig, voor zowel serieuze als minder serieuze zaken konik altijd bij je terecht. Over afleiding op het lab gesproken, gezellig waren ookde vele borrels die ik samen met Veerendra, Laurens en Thomas georganiseerdheb. De magneetlaars is daar een mooie herinnering aan.
Dan het afronden van mijn proefschrift, hiervoor wil ik nog twee personenin het bijzonder bedanken die een grote invloed hebben gehad op het succesvolafronden van het hele traject naar dit boekje. Allereerst Peter Christianen voorde ontelbare correcties in dit proefschrift en de publicaties, deze waren cruciaalvoor zowel het begrip als voor een goede formulering van onze bevindingen.Verder heb ik veel gehad aan de vele discussies over de nieuwste resultaten enideeen om het nog beter te doen. Het was een plezier om 4 jaar met je samente werken. Daarnaast wil ik ook Hans Engelkamp bedanken voor de vele in-teressante discussies mbt chiraliteit, als vraagbak voor alle chemische vragen,als creatief brein achter vele illustraties en voor het zorgvuldig inhoudelijk en
tekstueel corrigeren van mijn proefschrift.Ten slotte wil ik hier ook ook mijn familie en vrienden bedanken voor hun
steun de afgelopen jaren. In het bijzonder de vele (Heyendaal) vrienden benik erkentelijk voor de vele avonturen binnen en buiten het volleybalveld. Thuisben ik van jongs af gestimuleerd om te doen wat ik leuk vindt, en dat doe ik totop de dag van vandaag. Papa, je niet aflatende optimisme is me altijd bijgeble-ven, ik herinner me je altijd als de enthousiaste, gedreven, motiverende vaderdie je was. Mama, jij stond altijd klaar voor me, jouw open en geınteresseerdehouding is een voorbeeld voor me. Van jou herinner ik me zowel de disciplineals de vrijheid in al mijn keuzes die je me bijbracht. Beiden hadden jullie ophet laatst de wens uitgesproken om mijn volgende uitreiking bij te wonen, hetmocht niet zo zijn, maar in gedachten zijn jullie altijd bij me. Sjaak, samenhebben we veel doorgemaakt. Hoewel we behoorlijk verschillend zijn, heb ik al-tijd steun en plezier thuis gevonden. Hopelijk gaan we nog veel beleven samen,te beginnen in de VS deze zomer. Henk, vanaf dag een dat ik je leerde kennenwas je een grote steun voor mij. Samen hebben we heel wat geklust en gekletst,ik hoop dat we dit nog vele jaren kunnen doen. Maria, hoewel we uiteindelijkuit elkaar groeiden, kijk ik terug op vele mooie herinneringen. Vera, jij was dezonneschijn in mijn leven op een moment dat ik het heel hard nodig had, ikhad de tijd met jou niet willen missen. De laatste loodjes wegen het zwaarst,en dat was hier ook zeker het geval. Terugkijkend waren de laastse maandenvan mijn PhD het meest productief en intensief. Gery, aan het eind van eenlange dag schrijven werd ik door jou weer vrolijk. Altijd luister je, vind je hetleuk dat ik zo’n nerd ben en stimuleer je me tot meer, bedankt hiervoor. Metvele bijzondere herinneringen kijk ik uit naar een mooie toekomst.
Peter van Rheeapril 2015.

List of Publications
1. P.G. van Rhee, I. Occhiuto, N. Micali, F. de Graaf, H. Engelkamp, J.C.Maan, L. Monsu Scolaro, P.C.M. Christianen, Robustness of supramolec-ular enantioselection and its scaling with the chiral force, in preparation.
2. P.G. van Rhee, I. Occhiuto, N. Micali, F. de Graaf, H. Engelkamp, J.C.Maan, L. Monsu Scolaro, P.C.M. Christianen, Unraveling the effect of thedistinct forces within the selection of supramolecular chirality, in prepa-ration.
3. P.G. van Rhee, R.S.M. Rikken, J.C. Maan, R.J.M. Nolte, J.C.M. van Hest,P.C.M. Christianen, and D.A. Wilson, Polymersome Magneto-Valves: Re-versible Capture and Release of Nanoparticles, Nature Communications5 5010 (2014).
4. F. Pietra, F.T. Rabouw, P.G. van Rhee, J. van Rijssel, A.V. Petukhov,B.H. Erne, P.C.M. Christianen, C. Donega de Mello, D. Vanmaekelbergh,In-situ study of magnetically aligned CdSe/CdS nanorod sheets in thebulk suspension, ACS Nano xxx (2014).
5. A.I. Coldea, L. Seabra, A. McCollam, A. Carrington, L. Malone, A.F.Bangura, D. Vignolles, P.G. van Rhee, R.D. McDonald, T. Sorgel, M.Jansen, N. Shannon, and R. Coldea Cascade of field-induced magnetictransitions in a frustrated antiferromagnetic metal, Physical Review B90, 020401 (2014).
6. P.G. van Rhee, P. Zijlstra, T.G.A. Verhagen, J. Aarts, M.I. Katsnelson,J.C. Maan, M. Orrit, and P.C.M. Christianen, Giant magnetic suscepti-bility of gold nanorods detected by magnetic alignment, Physical ReviewLetters 111, 127202 (2013).
7. M. Liebi, P.G. van Rhee, P.C.M. Christianen, J. Kohlbrecher, P. Fis-cher, P. Walde, and E.J. Windhab, Alignment of Bicelles Studied with
159

High-Field Magnetic Birefringence and Small-Angle Neutron ScatteringMeasurements, Langmuir 4, 3467-3473 (2013).
8. N. Micali, H. Engelkamp, P.G. van Rhee, P. C. M. Christianen, L. MonsuScolaro, and J.C. Maan, Selection of supramolecular chirality by appli-cation of rotational and magnetic forces, Nature Chemistry 4, 201-207(2012).
9. A. McCollam, P.G. van Rhee, J. Rook, E. Kampert, U. Zeitler, and J.C.Maan, High sensitivity magnetometer for measuring the isotropic andanisotropic magnetisation of small samples, Review of Scientific Instru-ments 82, 053909 (2011).

Curriculum Vitae
Peter was born on the 4th of January 1986 in Boxmeer. He went to the se-condary school in Boxmeer at the Elzendaalcollege, where he graduated fromthe VWO in 2004. He studied physics at the Radboud University in Nijme-gen from 2004 to 2010. His graduation work was conducted at the High FieldMagnet Laboratory which resulted in the master thesis ’High sensitivity micro-cantilever magnetometer – Developing and using a new type of magnetometer’.
Since 2010 he was employed by the ”Stichting voor Fundamenteel Onder-zoek der Materie” as a PhD-student at the High Field Magnet Laboratoryof Radboud University Nijmegen, under the supervision of Prof. dr. P.C.M.Christianen, dr. H. Engelkamp and Prof. dr. ir. J. C. Maan. The main area ofhis research was the manipulation of soft matter in high magnetic fields. Thisincludes influencing the chirality of self-assembling supramolecular aggregates,deforming supramolecular aggregates, and measuring magnetic properties withoptically-detected alignment. The main results he obtained during his PhD aredescribed in this thesis. Since October 2014 he is employed as a design engineerin the Applications department at ASML.
161