Macroeconomic stability and economic growth - Repositorio ...
Upload
independentCategory
view
4download
0
IJMIE Volume 5, Issue 4 ISSN: 2249-0558 _________________________________________________________
A Monthly Double-Blind Peer Reviewed Refereed Open Access International e-Journal - Included in the International Serial Directories Indexed & Listed at: Ulrich's Periodicals Directory ©, U.S.A., Open J-Gage as well as in Cabell’s Directories of Publishing Opportunities, U.S.A.
International Journal of Management, IT and Engineering http://www.ijmra.us
257
April 2015
MACROECONOMIC PERFORMANCE UNDER SMALL-
SCALE AGRICULTURE IN AFRICA: THE CASE ETHIOPIA
Melkamu Mada*
Abstract
This paper analyzes macro economic performance of small-scale based agrarian economy in
Ethiopian. The study used secondary data and focuses on four key macro economic factors
namely poverty reduction, economic growth, unemployment and Inflation. In the country
incidence of poverty has declined significantly between 1995/96 and 2010/11 from 46% to
29.6% respectively. After averaging the economic growth the country achieved 7.03 percent per
year in the fifteen years between 1992 and 2006/7 and in the last five years (2004/5-2008/09) the
double digit growth was seen. In the country unemployment rate has been declining and almost
constant for one decade. Ethiopian economy faced galloping or hyperinflation type of inflation,
serious type of inflation to the economy in the past time. The analysis suggests that regional,
rural and urban based poverty line would better estimate the poverty situation than single
poverty line. The trade-off between inflation and economic growth can be avoided if an economy
is able to increase potential output by improving their supply-side performance and domestic
saving.
Key word:-Ethiopia, Poverty, Small-Scale Agriculture
* PhD Scholar (Agricultural Economics), College of Agriculture, SK. Rajasthan Agricultural
University, Bikaner- India.
IJMIE Volume 5, Issue 4 ISSN: 2249-0558 _________________________________________________________
A Monthly Double-Blind Peer Reviewed Refereed Open Access International e-Journal - Included in the International Serial Directories Indexed & Listed at: Ulrich's Periodicals Directory ©, U.S.A., Open J-Gage as well as in Cabell’s Directories of Publishing Opportunities, U.S.A.
International Journal of Management, IT and Engineering http://www.ijmra.us
258
April 2015
1. Introduction
The new government was established by ousting the previous socialist dictatorship by military
force early 1990s. This government has also come up with the Agricultural Development Led
Industrialization (ADLI) strategy, which emphasizes raising the productivity of smallholder
agriculture and the importance of labor intensive industrialization. The policy toward the small-
scale farmers (who produce nearly all the agricultural produce) is to provide appropriate
incentive structures using agricultural extension as a vehicle. The Sustainable Development and
Poverty Reduction Program (SDPRP) 2002/03–2004/05, which further realized the ADLI
strategy, was prepared and implemented. The following development plan, Under the Plan for
Accelerated and Sustained Development to End Poverty (PASDEP), was implemented in the
country from 2005/06 to 2009/10. In the first three years of the PASDEP implementation period
of 2005/06–2009/10, good performance was recorded in agricultural and industrial production as
well as export. Subsequently, however, the Ethiopian economy experienced a slowdown
accompanied by inflation, balance-of-payments pressure, and a severe shortage of foreign
exchange. Ethiopia achieved rapid economic growth and laid a foundation for future growth by
making substantial investments in infrastructure and human capital. Ethiopia’s five-year Growth
and Transformation Plan (GTP), which was approved by the Ethiopian Parliament in November
2010 and is currently in its fourth year, is largely driving Ethiopia’s openness to foreign
investment. The Growth and Transformation Plan (GTP) for 2010/11–2014/15, Ethiopia’s new
five year plan, sets even higher growth and investment targets.
In this paper, we investigate Ethiopia’s small-scale based agriculture contribution for
macroeconomic performance since early 1990s. The study focused on the analysis of four key
macro economic factors namely poverty reduction, economic growth, unemployment and
Inflation.
Poverty Reduction
Poverty reduction is the core objective of the Ethiopian government (MoFED, 2012). The
Ethiopian government recognises that, without realistic and practical development policies, it is
impossible to achieve poverty reduction objective. The government focused on pro-poor
IJMIE Volume 5, Issue 4 ISSN: 2249-0558 _________________________________________________________
A Monthly Double-Blind Peer Reviewed Refereed Open Access International e-Journal - Included in the International Serial Directories Indexed & Listed at: Ulrich's Periodicals Directory ©, U.S.A., Open J-Gage as well as in Cabell’s Directories of Publishing Opportunities, U.S.A.
International Journal of Management, IT and Engineering http://www.ijmra.us
259
April 2015
development polices and strategies that have been implemented in rural primarily focused on
small-scale agriculture and urban areas. Analysing trends in poverty is extremely useful for
assessing effectiveness of on-going policies and strategies on poverty reduction. The government
of Ethiopia has formulated pro-poor and pro-growth development policies and strategies through
public participation to ensure overall economic development and eradicate multidimensional
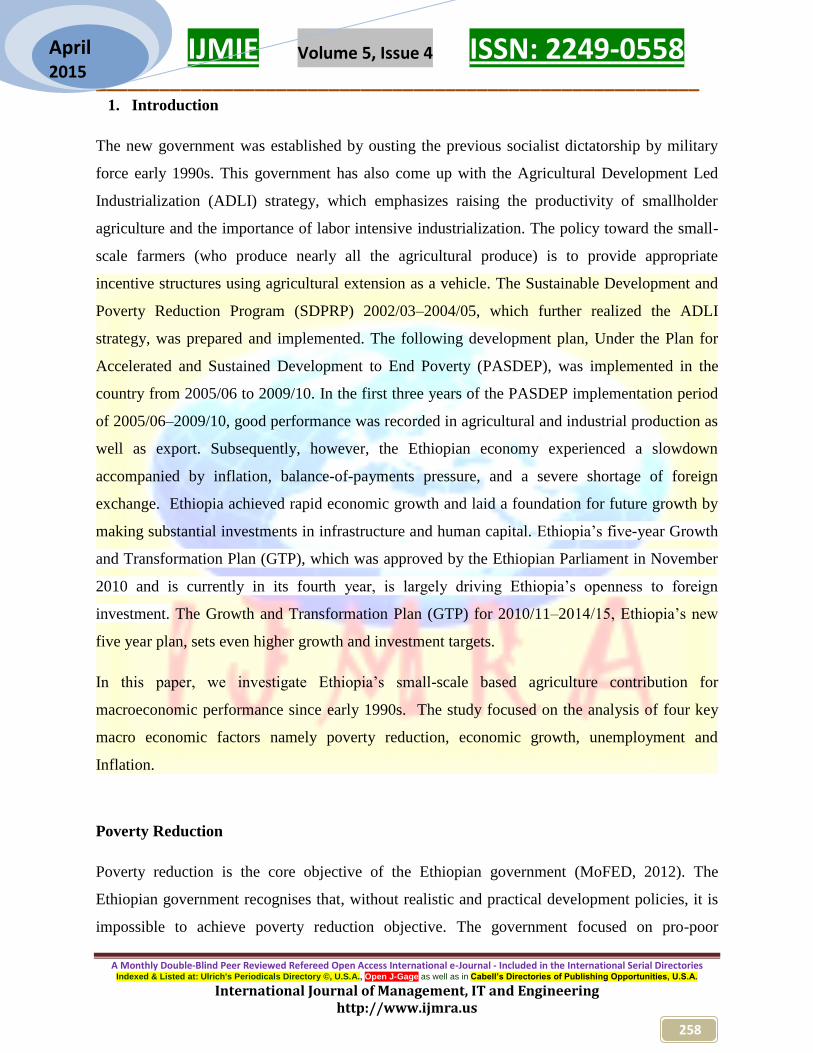
poverty. The data reveals that incidence of poverty has further declined markedly between
1995/96 and 2010/11 from 46% to 29.6% respectively. The significant decline of 16.4% in
poverty in the last one and half decade indicates that Ethiopia is applying appropriate
macroeconomic policy. According Ethiopian government report economic growth has been the
prime driving factor that resulted in the reduction of poverty.
Table 1 :- Poverty trend in Ethiopia
Year 1995/96 1999/2000 2004/05 2010/11
Poverty Trend in % 46 44 38.7 29.6
Source:- MoFED (2013)
Economic Growth
Economic growth is the principal yardstick of macroeconomic performance. By this standard, almost two
decades since 1994 - 2013 have been better than previous Ethiopian economic performance (Table 2).
After averaging the economic growth 7.03 percent per year in the fifteen years between 1992 and 2006/7,
GDP growth accelerated to 28 per cent in the averaged even higher at 52 percent in the past five years
0
5
10
15
20
25
30
35
40
45
50
1995/96 1999/2000 2004/05 2010/11
Fig 1. Poverty Trend in %
IJMIE Volume 5, Issue 4 ISSN: 2249-0558 _________________________________________________________
A Monthly Double-Blind Peer Reviewed Refereed Open Access International e-Journal - Included in the International Serial Directories Indexed & Listed at: Ulrich's Periodicals Directory ©, U.S.A., Open J-Gage as well as in Cabell’s Directories of Publishing Opportunities, U.S.A.
International Journal of Management, IT and Engineering http://www.ijmra.us
260
April 2015
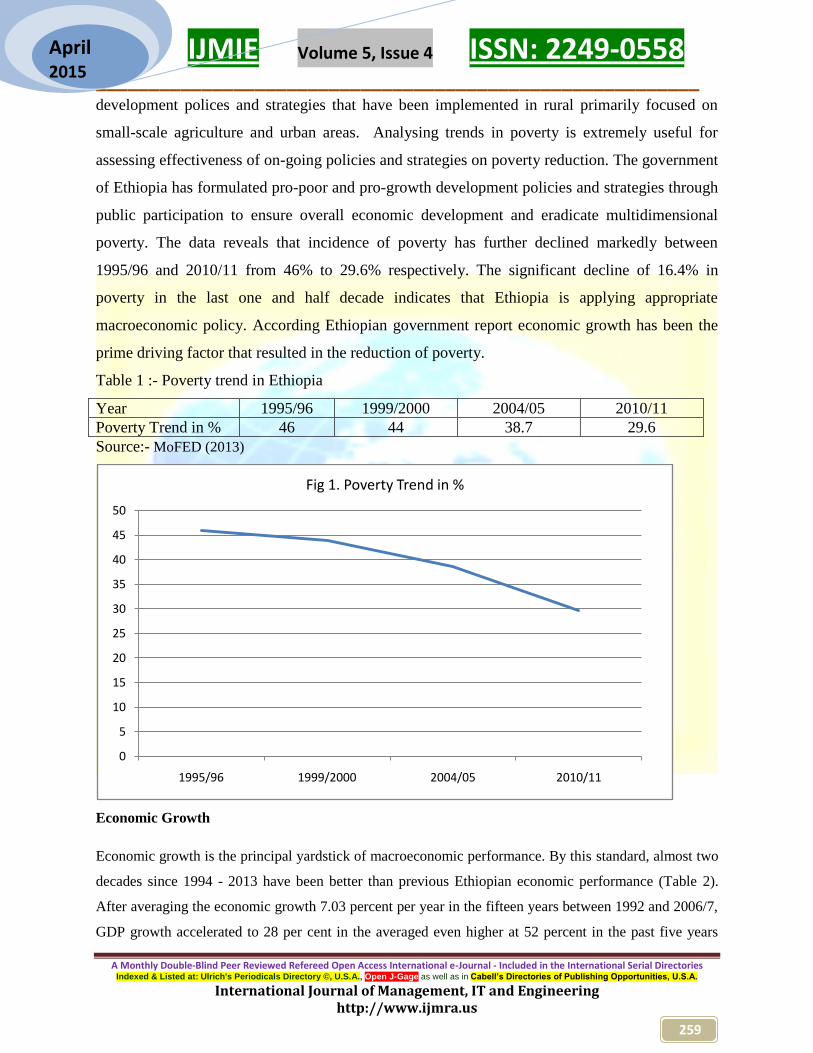
2004/05-2008/9 than previous regimes average. Furthermore, the growth performance of the last fifteen
years was best performance. In the last five years (2004/5-2008/09) the double digit growth clearly show
that, this has been a golden decade (almost) of growth for Ethiopia. The trend in one and half decade
growth rates indicates that, even better when we look at per capita GDP growth, which accelerated from -
1.4 percent in the previous regimes to 8.46 percent in the last five years. This shows that there is relatively
70 percent increase in per capita GDP. This analysis indicates that per capita GDP as a rough proxy for
average living standards of Ethiopia’s population, the last two decades have shown welcome
improvement.
Table2. Average growth of real GDP over 30 years (%)
Indicators Years (%)
1983/84-1993/94
average
1994/95-
1998/99
1999/00-
2003/04
2004/05-
2008/09
2009/10-
2013/14
Real GDP growth rate 1.86 5.86 4.48 11.56 10.2
Agriculture 0.98 2.82 3.54 9.54 8.2
Industry 1.89 5.48 4.82 9.8 15.44
Service 3.82 7.5 5.56 14.28 11.9
GDP Per capita (birr) -1.4 2.08 1.34 8.46 15.3
Sources: Global Economy(2013) and own calculation
-4
-2
0
2
4
6
8
10
12
14
16
18
Real GDP growth rate
GDP Per capita
IJMIE Volume 5, Issue 4 ISSN: 2249-0558 _________________________________________________________
A Monthly Double-Blind Peer Reviewed Refereed Open Access International e-Journal - Included in the International Serial Directories Indexed & Listed at: Ulrich's Periodicals Directory ©, U.S.A., Open J-Gage as well as in Cabell’s Directories of Publishing Opportunities, U.S.A.
International Journal of Management, IT and Engineering http://www.ijmra.us
261
April 2015
Growth rate by main Sectors
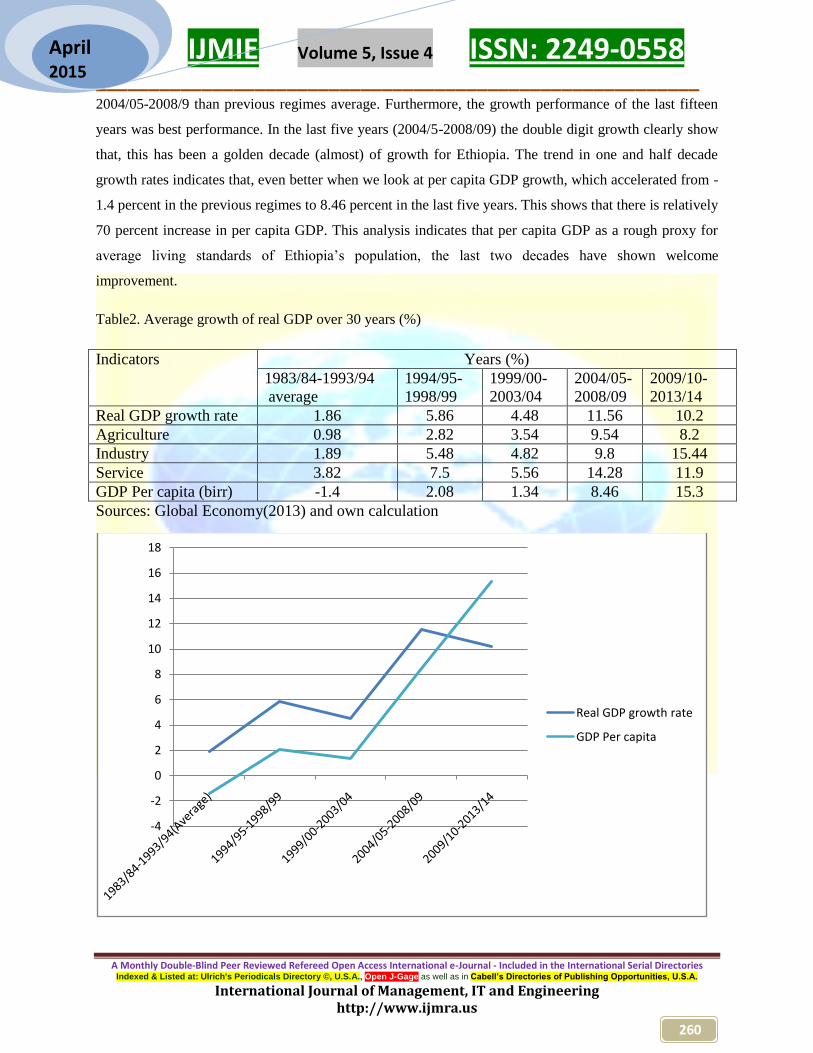
From table 2 we can see that in the last ten years the share of agriculture, industry and services sectors in
total GDP growth were 41.5%, 10.9% and 47.7% respectively .This indicates that services sector is
dominants which contributes about half of the total GDP growth, followed by agriculture but it
contradicts with country’s economic policy (i.e. ADLI).The unusual increment in the share of services in
Ethiopia’s economic growth may be due to rise in non -value adding services. Even in the last fifteen
years the share of services sector increased from time to time which accounts nearly half of GDP growth.
Furthermore, a part of the services sector growth in the last five years was ―miracle‖ in the sense that it is
result of recently implemented business processing re-engineering (BPR).
The above analysis shows the existence of much higher differences between potential and actual growth
in the past regimes and recent government of EPRDF (Ethiopian People's Revolutionary Democratic
Front) policy preparation and implementation. Although the study is not conclusive, it does suggest that
macroeconomic policy has had greater success in attaining the economy’s output potential in the last
decade than in any previous period .Generally, the growth tend performance shows that EPRDF
economic policy seem on the right track to achieve worldwide millennium development goal.
0
5
10
15
20
25
30
35
40
Service
Industry
Agriculture
IJMIE Volume 5, Issue 4 ISSN: 2249-0558 _________________________________________________________
A Monthly Double-Blind Peer Reviewed Refereed Open Access International e-Journal - Included in the International Serial Directories Indexed & Listed at: Ulrich's Periodicals Directory ©, U.S.A., Open J-Gage as well as in Cabell’s Directories of Publishing Opportunities, U.S.A.
International Journal of Management, IT and Engineering http://www.ijmra.us
262
April 2015
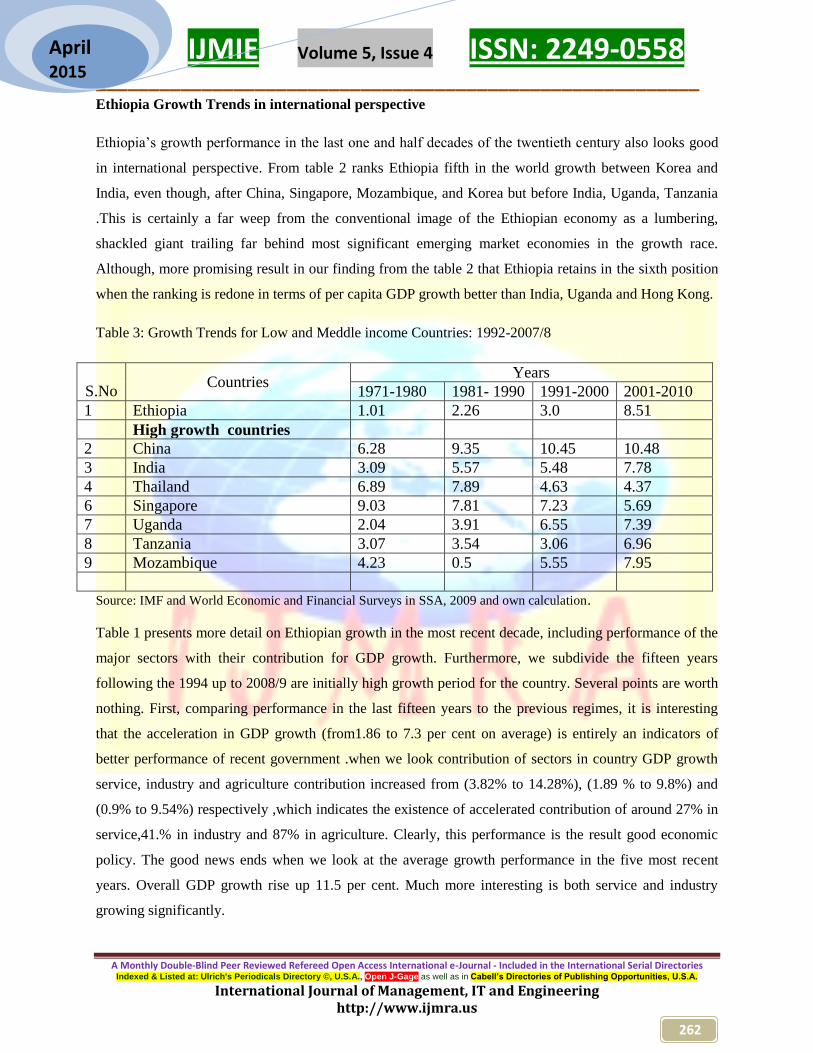
Ethiopia Growth Trends in international perspective
Ethiopia’s growth performance in the last one and half decades of the twentieth century also looks good
in international perspective. From table 2 ranks Ethiopia fifth in the world growth between Korea and
India, even though, after China, Singapore, Mozambique, and Korea but before India, Uganda, Tanzania
.This is certainly a far weep from the conventional image of the Ethiopian economy as a lumbering,
shackled giant trailing far behind most significant emerging market economies in the growth race.
Although, more promising result in our finding from the table 2 that Ethiopia retains in the sixth position
when the ranking is redone in terms of per capita GDP growth better than India, Uganda and Hong Kong.
Table 3: Growth Trends for Low and Meddle income Countries: 1992-2007/8
S.No Countries
Years
1971-1980 1981- 1990 1991-2000 2001-2010
1 Ethiopia 1.01 2.26 3.0 8.51
High growth countries
2 China 6.28 9.35 10.45 10.48
3 India 3.09 5.57 5.48 7.78
4 Thailand 6.89 7.89 4.63 4.37
6 Singapore 9.03 7.81 7.23 5.69
7 Uganda 2.04 3.91 6.55 7.39
8 Tanzania 3.07 3.54 3.06 6.96
9 Mozambique 4.23 0.5 5.55 7.95
Source: IMF and World Economic and Financial Surveys in SSA, 2009 and own calculation.
Table 1 presents more detail on Ethiopian growth in the most recent decade, including performance of the
major sectors with their contribution for GDP growth. Furthermore, we subdivide the fifteen years
following the 1994 up to 2008/9 are initially high growth period for the country. Several points are worth
nothing. First, comparing performance in the last fifteen years to the previous regimes, it is interesting
that the acceleration in GDP growth (from1.86 to 7.3 per cent on average) is entirely an indicators of
better performance of recent government .when we look contribution of sectors in country GDP growth
service, industry and agriculture contribution increased from (3.82% to 14.28%), (1.89 % to 9.8%) and
(0.9% to 9.54%) respectively ,which indicates the existence of accelerated contribution of around 27% in
service,41.% in industry and 87% in agriculture. Clearly, this performance is the result good economic
policy. The good news ends when we look at the average growth performance in the five most recent
years. Overall GDP growth rise up 11.5 per cent. Much more interesting is both service and industry
growing significantly.
IJMIE Volume 5, Issue 4 ISSN: 2249-0558 _________________________________________________________
A Monthly Double-Blind Peer Reviewed Refereed Open Access International e-Journal - Included in the International Serial Directories Indexed & Listed at: Ulrich's Periodicals Directory ©, U.S.A., Open J-Gage as well as in Cabell’s Directories of Publishing Opportunities, U.S.A.
International Journal of Management, IT and Engineering http://www.ijmra.us
263
April 2015
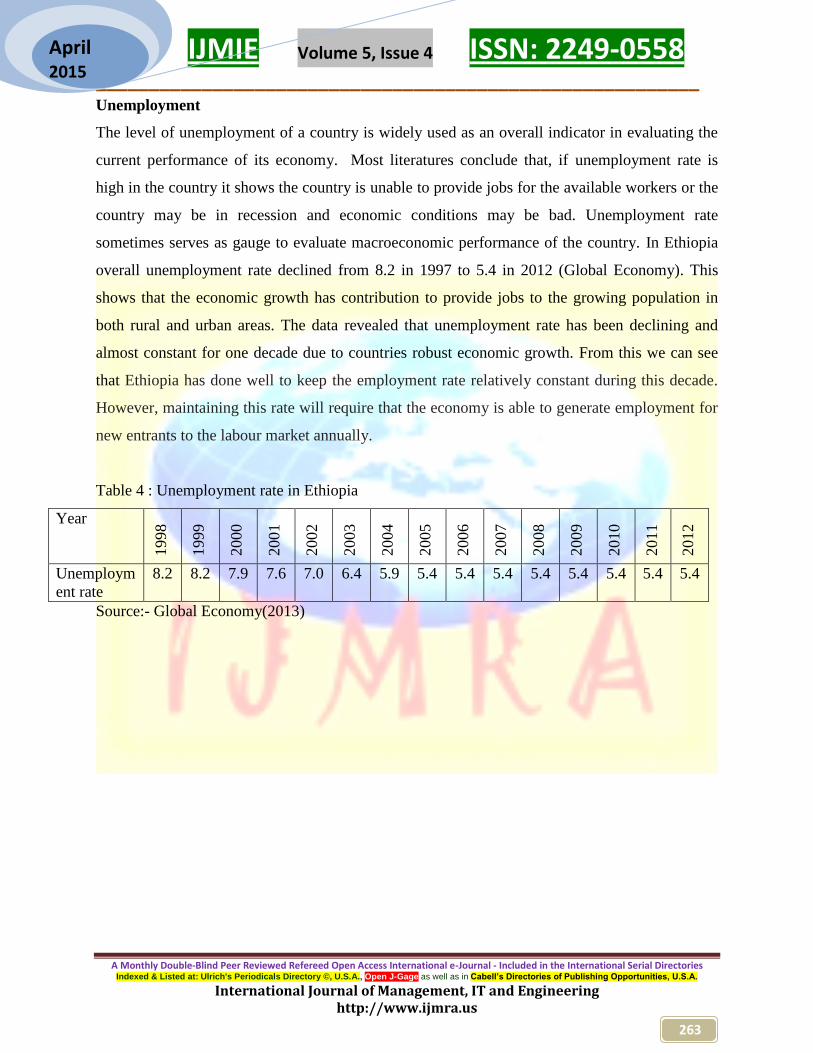
Unemployment
The level of unemployment of a country is widely used as an overall indicator in evaluating the
current performance of its economy. Most literatures conclude that, if unemployment rate is
high in the country it shows the country is unable to provide jobs for the available workers or the
country may be in recession and economic conditions may be bad. Unemployment rate
sometimes serves as gauge to evaluate macroeconomic performance of the country. In Ethiopia
overall unemployment rate declined from 8.2 in 1997 to 5.4 in 2012 (Global Economy). This
shows that the economic growth has contribution to provide jobs to the growing population in
both rural and urban areas. The data revealed that unemployment rate has been declining and
almost constant for one decade due to countries robust economic growth. From this we can see
that Ethiopia has done well to keep the employment rate relatively constant during this decade.
However, maintaining this rate will require that the economy is able to generate employment for
new entrants to the labour market annually.
Table 4 : Unemployment rate in Ethiopia
Year
1998
1999
2000
2001
2002
2003
2004
2005
2006
2007
2008
2009
2010
2011
2012
Unemploym
ent rate
8.2 8.2 7.9 7.6 7.0 6.4 5.9 5.4 5.4 5.4 5.4 5.4 5.4 5.4 5.4
Source:- Global Economy(2013)

IJMIE Volume 5, Issue 4 ISSN: 2249-0558 _________________________________________________________
A Monthly Double-Blind Peer Reviewed Refereed Open Access International e-Journal - Included in the International Serial Directories Indexed & Listed at: Ulrich's Periodicals Directory ©, U.S.A., Open J-Gage as well as in Cabell’s Directories of Publishing Opportunities, U.S.A.
International Journal of Management, IT and Engineering http://www.ijmra.us
264
April 2015
Fiscal and Monetary Policy
The fiscal sector showed a positive development during the period. Ethiopia’s current fiscal policy
objective is to achieve public debt sustainability and make the most of the efficient use of highly
concessional resources for poverty reduction related activities by using medium and long term
macroeconomic plan. The country fiscal policy stresses on two main objectives: (i) the re-orientation of
budgetary resources away from defence toward poverty alleviation outlays; and (ii) tax reforms aimed at
improving revenue.
Table 5: General Government Operation indicators in percentage (2008/9-2013/14)
Item Years
2008/9 2009/10 2010/11 2011/12 2012/13 2013/14
Revenue 11.7 14.2 13.7 14 13.2 13.3
Grant 3.6 3.3 3.3 1.7 2.0 1.6
Total expenditure 17.7 18.8 18.5 16.9 18 17.9 Poverty reduction expenditure 12.9 12.5 12.3 11.9 11.9 11.9
Defence expenditure 1.1 1.1 0.9 0.9 0.7 0.7 Gross domestic government debt 14.6 14 10.5 7.7 8 8.5
Fiscal balance including grant -2.3 -1.9 -1.7 -0.7 -2.3 -2.2 Sources: IMF Country Report No. 13/308 (2013)
0
1
2
3
4
5
6
7
8
9
Unemployment Rate
Unemployment rate
IJMIE Volume 5, Issue 4 ISSN: 2249-0558 _________________________________________________________
A Monthly Double-Blind Peer Reviewed Refereed Open Access International e-Journal - Included in the International Serial Directories Indexed & Listed at: Ulrich's Periodicals Directory ©, U.S.A., Open J-Gage as well as in Cabell’s Directories of Publishing Opportunities, U.S.A.
International Journal of Management, IT and Engineering http://www.ijmra.us
265
April 2015
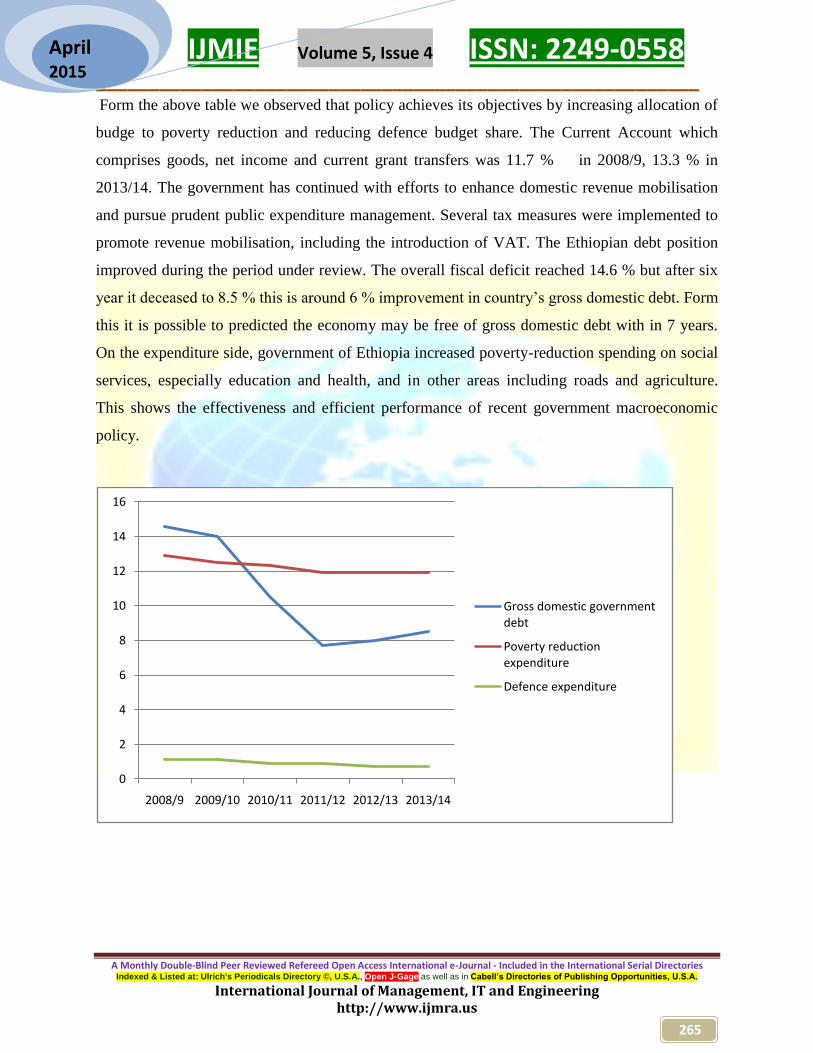
Form the above table we observed that policy achieves its objectives by increasing allocation of
budge to poverty reduction and reducing defence budget share. The Current Account which
comprises goods, net income and current grant transfers was 11.7 % in 2008/9, 13.3 % in
2013/14. The government has continued with efforts to enhance domestic revenue mobilisation
and pursue prudent public expenditure management. Several tax measures were implemented to
promote revenue mobilisation, including the introduction of VAT. The Ethiopian debt position
improved during the period under review. The overall fiscal deficit reached 14.6 % but after six
year it deceased to 8.5 % this is around 6 % improvement in country’s gross domestic debt. Form
this it is possible to predicted the economy may be free of gross domestic debt with in 7 years.
On the expenditure side, government of Ethiopia increased poverty-reduction spending on social
services, especially education and health, and in other areas including roads and agriculture.
This shows the effectiveness and efficient performance of recent government macroeconomic
policy.
0
2
4
6
8
10
12
14
16
2008/9 2009/10 2010/11 2011/12 2012/13 2013/14
Gross domestic government debt
Poverty reduction expenditure
Defence expenditure
IJMIE Volume 5, Issue 4 ISSN: 2249-0558 _________________________________________________________
A Monthly Double-Blind Peer Reviewed Refereed Open Access International e-Journal - Included in the International Serial Directories Indexed & Listed at: Ulrich's Periodicals Directory ©, U.S.A., Open J-Gage as well as in Cabell’s Directories of Publishing Opportunities, U.S.A.
International Journal of Management, IT and Engineering http://www.ijmra.us
266
April 2015
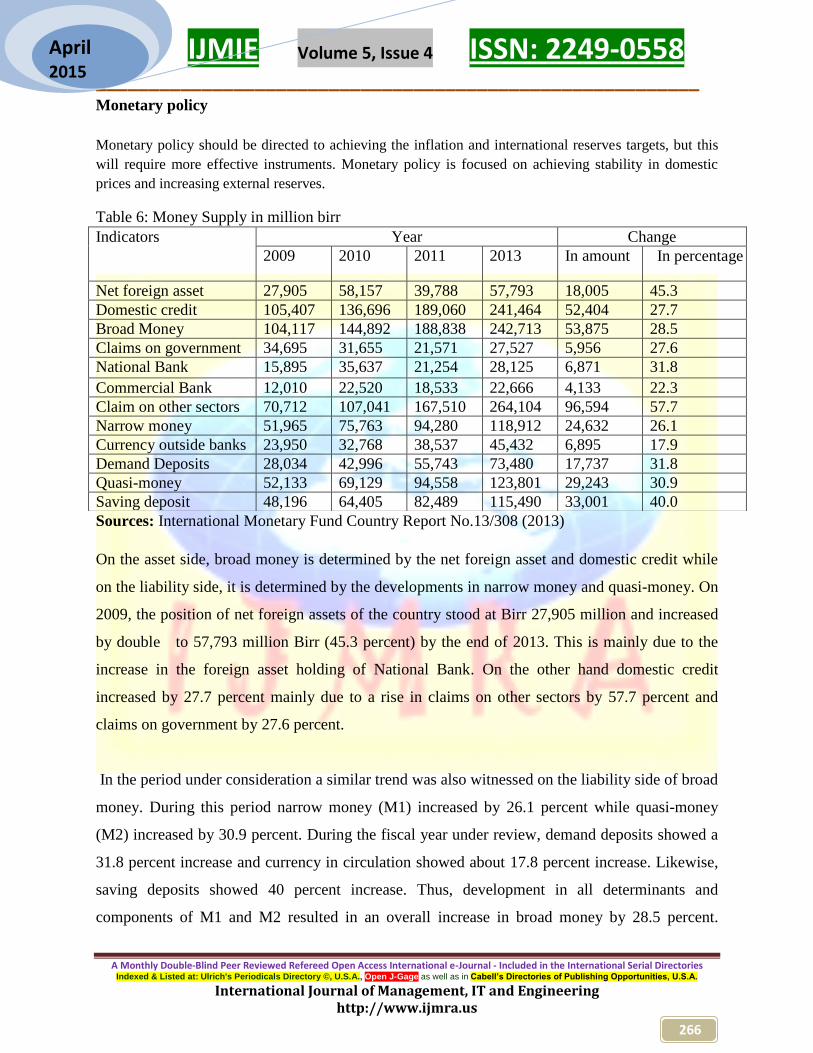
Monetary policy
Monetary policy should be directed to achieving the inflation and international reserves targets, but this
will require more effective instruments. Monetary policy is focused on achieving stability in domestic
prices and increasing external reserves.
Table 6: Money Supply in million birr
Sources: International Monetary Fund Country Report No.13/308 (2013)
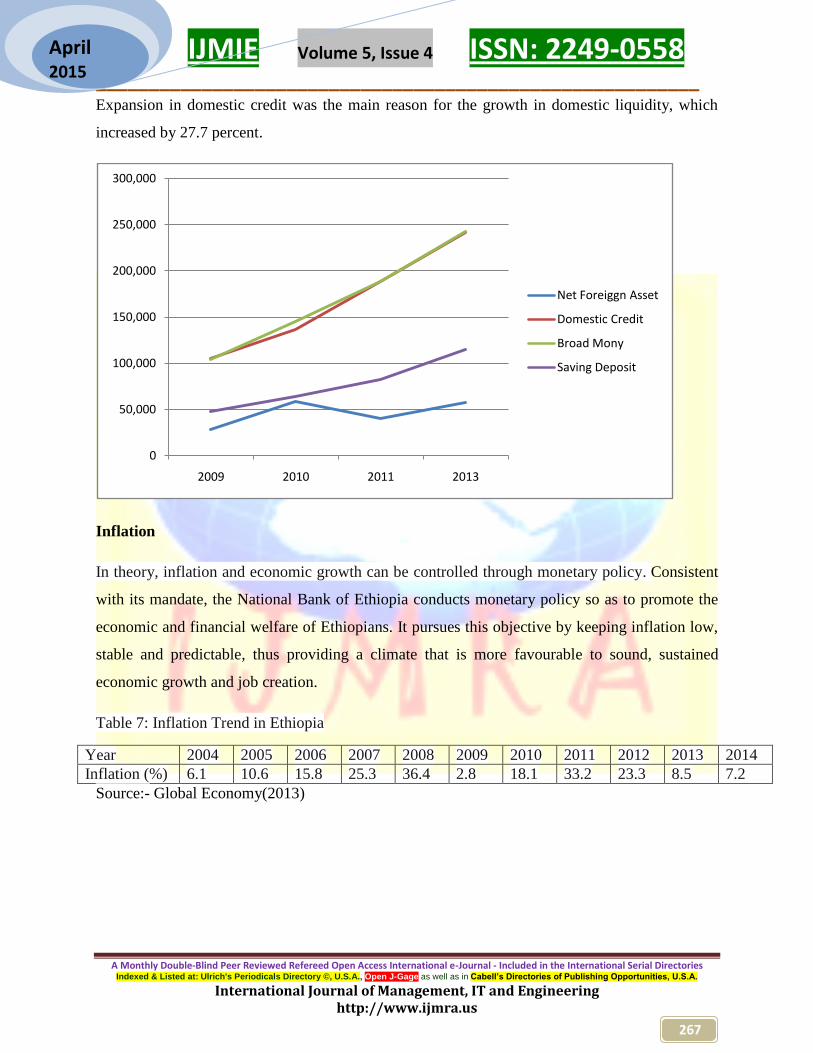
On the asset side, broad money is determined by the net foreign asset and domestic credit while
on the liability side, it is determined by the developments in narrow money and quasi-money. On
2009, the position of net foreign assets of the country stood at Birr 27,905 million and increased
by double to 57,793 million Birr (45.3 percent) by the end of 2013. This is mainly due to the
increase in the foreign asset holding of National Bank. On the other hand domestic credit
increased by 27.7 percent mainly due to a rise in claims on other sectors by 57.7 percent and
claims on government by 27.6 percent.
In the period under consideration a similar trend was also witnessed on the liability side of broad
money. During this period narrow money (M1) increased by 26.1 percent while quasi-money
(M2) increased by 30.9 percent. During the fiscal year under review, demand deposits showed a
31.8 percent increase and currency in circulation showed about 17.8 percent increase. Likewise,
saving deposits showed 40 percent increase. Thus, development in all determinants and
components of M1 and M2 resulted in an overall increase in broad money by 28.5 percent.
Indicators Year Change
2009 2010 2011 2013 In amount In percentage
Net foreign asset 27,905 58,157 39,788 57,793 18,005 45.3
Domestic credit 105,407 136,696 189,060 241,464 52,404 27.7
Broad Money 104,117 144,892 188,838 242,713 53,875 28.5
Claims on government 34,695 31,655 21,571 27,527 5,956 27.6
National Bank 15,895 35,637 21,254 28,125 6,871 31.8
Commercial Bank 12,010 22,520 18,533 22,666 4,133 22.3
Claim on other sectors 70,712 107,041 167,510 264,104 96,594 57.7
Narrow money 51,965 75,763 94,280 118,912 24,632 26.1
Currency outside banks 23,950 32,768 38,537 45,432 6,895 17.9
Demand Deposits 28,034 42,996 55,743 73,480 17,737 31.8
Quasi-money 52,133 69,129 94,558 123,801 29,243 30.9
Saving deposit 48,196 64,405 82,489 115,490 33,001 40.0
IJMIE Volume 5, Issue 4 ISSN: 2249-0558 _________________________________________________________
A Monthly Double-Blind Peer Reviewed Refereed Open Access International e-Journal - Included in the International Serial Directories Indexed & Listed at: Ulrich's Periodicals Directory ©, U.S.A., Open J-Gage as well as in Cabell’s Directories of Publishing Opportunities, U.S.A.
International Journal of Management, IT and Engineering http://www.ijmra.us
267
April 2015
Expansion in domestic credit was the main reason for the growth in domestic liquidity, which
increased by 27.7 percent.
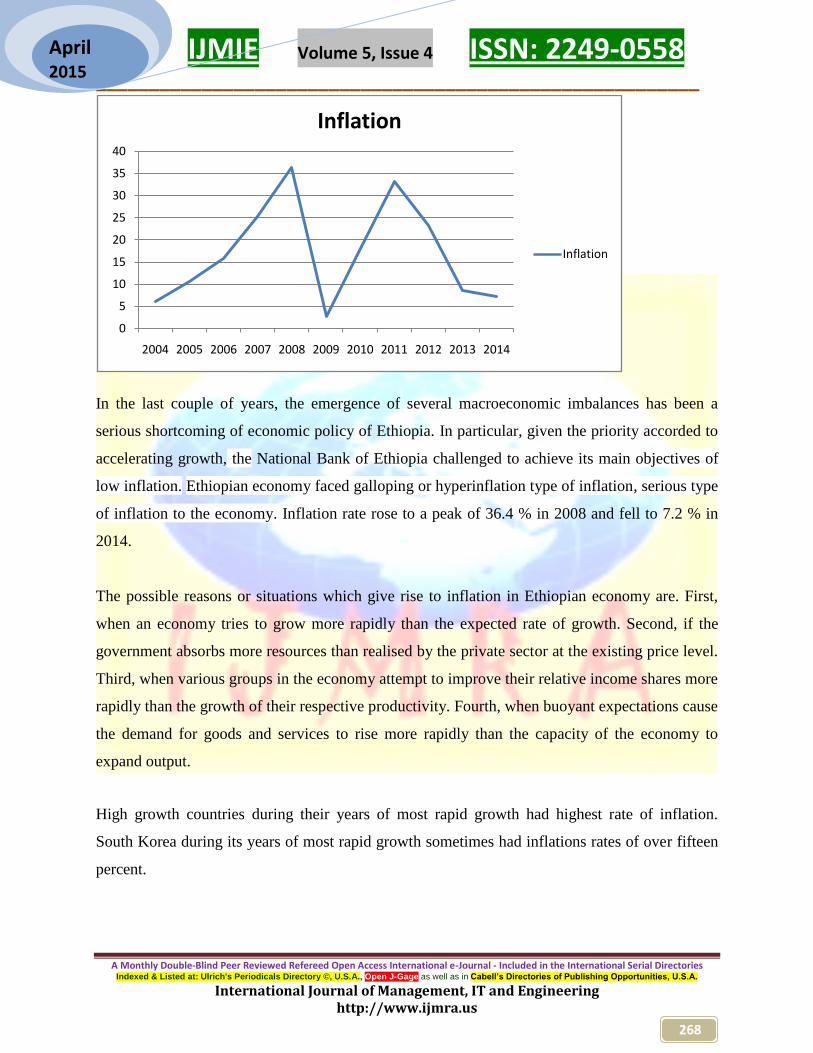
Inflation
In theory, inflation and economic growth can be controlled through monetary policy. Consistent
with its mandate, the National Bank of Ethiopia conducts monetary policy so as to promote the
economic and financial welfare of Ethiopians. It pursues this objective by keeping inflation low,
stable and predictable, thus providing a climate that is more favourable to sound, sustained
economic growth and job creation.
Table 7: Inflation Trend in Ethiopia
Year 2004 2005 2006 2007 2008 2009 2010 2011 2012 2013 2014
Inflation (%) 6.1 10.6 15.8 25.3 36.4 2.8 18.1 33.2 23.3 8.5 7.2
Source:- Global Economy(2013)
0
50,000
100,000
150,000
200,000
250,000
300,000
2009 2010 2011 2013
Net Foreiggn Asset
Domestic Credit
Broad Mony
Saving Deposit
IJMIE Volume 5, Issue 4 ISSN: 2249-0558 _________________________________________________________
A Monthly Double-Blind Peer Reviewed Refereed Open Access International e-Journal - Included in the International Serial Directories Indexed & Listed at: Ulrich's Periodicals Directory ©, U.S.A., Open J-Gage as well as in Cabell’s Directories of Publishing Opportunities, U.S.A.
International Journal of Management, IT and Engineering http://www.ijmra.us
268
April 2015
In the last couple of years, the emergence of several macroeconomic imbalances has been a
serious shortcoming of economic policy of Ethiopia. In particular, given the priority accorded to
accelerating growth, the National Bank of Ethiopia challenged to achieve its main objectives of
low inflation. Ethiopian economy faced galloping or hyperinflation type of inflation, serious type
of inflation to the economy. Inflation rate rose to a peak of 36.4 % in 2008 and fell to 7.2 % in
2014.
The possible reasons or situations which give rise to inflation in Ethiopian economy are. First,
when an economy tries to grow more rapidly than the expected rate of growth. Second, if the
government absorbs more resources than realised by the private sector at the existing price level.
Third, when various groups in the economy attempt to improve their relative income shares more
rapidly than the growth of their respective productivity. Fourth, when buoyant expectations cause
the demand for goods and services to rise more rapidly than the capacity of the economy to
expand output.
High growth countries during their years of most rapid growth had highest rate of inflation.
South Korea during its years of most rapid growth sometimes had inflations rates of over fifteen
percent.
0
5
10
15
20
25
30
35
40
2004 2005 2006 2007 2008 2009 2010 2011 2012 2013 2014
Inflation
Inflation

IJMIE Volume 5, Issue 4 ISSN: 2249-0558 _________________________________________________________
A Monthly Double-Blind Peer Reviewed Refereed Open Access International e-Journal - Included in the International Serial Directories Indexed & Listed at: Ulrich's Periodicals Directory ©, U.S.A., Open J-Gage as well as in Cabell’s Directories of Publishing Opportunities, U.S.A.
International Journal of Management, IT and Engineering http://www.ijmra.us
269
April 2015
Table 8:- Economic growth and inflation trend world wide comparison
Countries Growth Inflation Reserved
Ethiopia (2004-2012) 10.9 18 2.5
High growth countries average 7.8 5.4 6.1
Botswana(1960-2005) 9.6 10 18.7
Chain (1961-2005) 8.8 6.8 7
Indonesia (1966-97) 6.6 11.7 2.7
Korea (1960-2001) 7.9 6.4 2.6
Average 7.8 5.4 6.1
Other high growth countries
India (1992-2007) 6.6 6.6 7.4
Mozambique(1993-2007) 8.3 19.7 -15.7
Uganda (1986-2007) 6.4 39.3 -4.6
Vietnam (1986-2007) 7 24 -3.5
Average 6.5 17.4 -5.4 Sources: IMF (2012) and own calculation
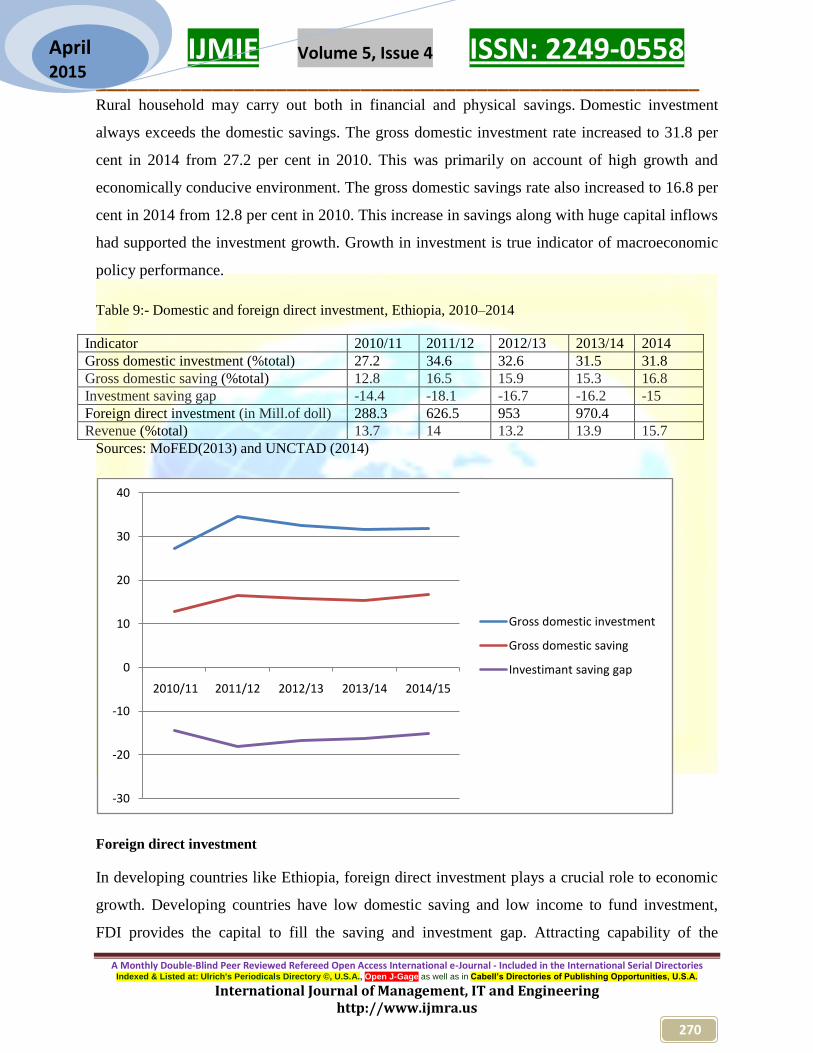
Gross domestic saving and Gross domestic investment
Saving is one of the main factors to economic growth. Accumulated saving can be believed as
the sources of capital stock. Capital stock plays a crucial role in creating investment, production,
and employment. This clearly shows that, saving is the backbone of investment. Higher savings
lead to higher investment and to higher economic growth. In agriculture based economies like
Ethiopia, household savings generally constitute the largest share in aggregate domestic savings.
05
1015202530354045
Growth
Inflation
IJMIE Volume 5, Issue 4 ISSN: 2249-0558 _________________________________________________________
A Monthly Double-Blind Peer Reviewed Refereed Open Access International e-Journal - Included in the International Serial Directories Indexed & Listed at: Ulrich's Periodicals Directory ©, U.S.A., Open J-Gage as well as in Cabell’s Directories of Publishing Opportunities, U.S.A.
International Journal of Management, IT and Engineering http://www.ijmra.us
270
April 2015
Rural household may carry out both in financial and physical savings. Domestic investment
always exceeds the domestic savings. The gross domestic investment rate increased to 31.8 per
cent in 2014 from 27.2 per cent in 2010. This was primarily on account of high growth and
economically conducive environment. The gross domestic savings rate also increased to 16.8 per
cent in 2014 from 12.8 per cent in 2010. This increase in savings along with huge capital inflows
had supported the investment growth. Growth in investment is true indicator of macroeconomic
policy performance.
Table 9:- Domestic and foreign direct investment, Ethiopia, 2010–2014
Indicator 2010/11 2011/12 2012/13 2013/14 2014
Gross domestic investment (%total) 27.2 34.6 32.6 31.5 31.8
Gross domestic saving (%total) 12.8 16.5 15.9 15.3 16.8
Investment saving gap -14.4 -18.1 -16.7 -16.2 -15
Foreign direct investment (in Mill.of doll) 288.3 626.5 953 970.4
Revenue (%total) 13.7 14 13.2 13.9 15.7
Sources: MoFED(2013) and UNCTAD (2014)
Foreign direct investment
In developing countries like Ethiopia, foreign direct investment plays a crucial role to economic
growth. Developing countries have low domestic saving and low income to fund investment,
FDI provides the capital to fill the saving and investment gap. Attracting capability of the
-30
-20
-10
0
10
20
30
40
2010/11 2011/12 2012/13 2013/14 2014/15
Gross domestic investment
Gross domestic saving
Investimant saving gap

IJMIE Volume 5, Issue 4 ISSN: 2249-0558 _________________________________________________________
A Monthly Double-Blind Peer Reviewed Refereed Open Access International e-Journal - Included in the International Serial Directories Indexed & Listed at: Ulrich's Periodicals Directory ©, U.S.A., Open J-Gage as well as in Cabell’s Directories of Publishing Opportunities, U.S.A.
International Journal of Management, IT and Engineering http://www.ijmra.us
271
April 2015
country to foreign direct investment is an indicator of the strength of macroeconomic policy of
the country. To attract foreign direct investment, Ethiopia made structural reforms and presented
investment incentives. The above table shows that foreign direct investment (FDI) flows into
Ethiopia have gradually increased. FDI data in the balance of payments suggest actual inflows rose
from $288.3 million in 2010/11 to $970.4 million in 2013/14 as shown in table 9.
Conclusion and Recommendation
Poverty reduction is the core objective of the Ethiopian government. Poverty reduction
ensures that the benefits of growth accrue to all sections of the society. In Ethiopia
incidence of poverty has further declined markedly between 1995/96 and 2010/11 from
46% to 29.6% respectively. The significant decline of 16.4% in poverty in the last one
and half decade indicates that Ethiopia is applying appropriate macroeconomic policy.
After averaging the economic growth the country achieved 7.03 percent per year in the
fifteen years between 1992 and 2006/7. In the last five years (2004/5-2008/09) the
double digit growth clearly show that, this has been a golden decade (almost) of growth
for Ethiopia. The trend in one and half decade growth rates indicates that, even better
when we look at per capita GDP growth, which accelerated from -1.4 percent in the
previous regimes to 8.46 percent in the last five years. This shows that there is relatively
0
200
400
600
800
1000
1200
2010/11 2011/12 2012/13 2013/14
Foreign Direct Investment (in Mill.of dollars)
Foreign Direct Investment (in Mill.of dollars)
IJMIE Volume 5, Issue 4 ISSN: 2249-0558 _________________________________________________________
A Monthly Double-Blind Peer Reviewed Refereed Open Access International e-Journal - Included in the International Serial Directories Indexed & Listed at: Ulrich's Periodicals Directory ©, U.S.A., Open J-Gage as well as in Cabell’s Directories of Publishing Opportunities, U.S.A.
International Journal of Management, IT and Engineering http://www.ijmra.us
272
April 2015
70 percent increase in per capita GDP. Economic growth performance of Ethiopia for the
last fifteen years was best performance.
Unemployment rate sometimes serves as gauge to evaluate macroeconomic performance
of the country. The data revealed that unemployment rate has been declining and almost
constant for one decade due to countries robust economic growth. In Ethiopia, economic
growth has contribution to provide jobs to the growing population in both rural and urban
areas.
In the last couple of years, given the priority accorded to accelerating growth, the
National Bank of Ethiopia challenged to achieve its main objectives of low inflation.
Ethiopian economy faced galloping or hyperinflation type of inflation, serious type of
inflation to the economy. Inflation rate rose to a peak of 36.4 % in 2008 and fell to 7.2 %
in 2014.
Application of a single poverty line for the whole country implicitly and dubiously
assumes absence of price differential across the regions. The estimate of poverty based on
this methodology also assumed a fixed consumption basket of the poor overtime, and a
uniform consumption basket for all the regions in the country. Regional and rural and
urban based poverty line would better estimate the poverty situation than single poverty
line.
The trade-off between economic growth and inflation can be avoided if an economy is
able to increase potential output by improving their supply-side performance and saving
is unquestionably an important part for sustainable economic performance.
IJMIE Volume 5, Issue 4 ISSN: 2249-0558 _________________________________________________________
A Monthly Double-Blind Peer Reviewed Refereed Open Access International e-Journal - Included in the International Serial Directories Indexed & Listed at: Ulrich's Periodicals Directory ©, U.S.A., Open J-Gage as well as in Cabell’s Directories of Publishing Opportunities, U.S.A.
International Journal of Management, IT and Engineering http://www.ijmra.us
273
April 2015
References
Brian A. ,Ward B. ,Shanta D. and Alejandro I.(2001) .Macroeconomic Policy and Poverty
Reduction IMF and World Bank.
Federal Democratic Republic of Ethiopia: Poverty Reduction Strategy Paper—2003/04
Annual Progress Report
Global Economy (2013):www.TradingEconomics.com
IMF (2013): The Federal Democratic Republic of Ethiopia. Country Report No.
13/308(2013)
IMF (2012): World Economic and Financial Surveys World Economic Outlook Database
MEDaC (2011) Poverty Situation in Ethiopia,Welfare Monitoring Unit, Addis Ababa
MOFED (2012). Ethiopia’s Progress towards Eradicating Poverty: An Interim Report on
Poverty Analysis Study (2010/11). Ministry of Finance and Economic
Development, MOFED. Addis Ababa, Ethiopia.
MoFED (2013) Development and Poverty in Ethiopia 1995/96-2010/11
MOFED (Ministry of Finance and Economic Development) (2002): Ethiopia: Sustainable
Development and Poverty Reduction. Draft. Addis Ababa.
Shankar Acharya, India’s Macroeconomic Preformance, November, 9, Colombo.
National Bank of Ethiopia publication, 2008.
United Nations Conference on trade and Development (UNCTAD): Country Fact Sheets 2014
Copyright © 2022 FDOKUMEN