Are Rural Youth in Ethiopia Abandoning Agriculture?
14
Are Rural Youth in Ethiopia Abandoning Agriculture? SOSINA BEZU and STEIN HOLDEN * Norwegian University of Life Sciences, Aas, Norway Summary. — This study examines current land access and livelihood choices of rural youth in Southern Ethiopia. We found that youth in rural south have limited access to agricultural land because of land scarcity and land market restrictions. We hypothesize that this forces the youth to abandon agriculture in search of other livelihoods. Our study shows that only 9% of the rural youth plan to pursue agriculture as their livelihood. We also found a sharp increase in youth outmigration in the past six years. Our econometric analyses confirm that lack of land access is forcing the youth away from an agricultural livelihood. Ó 2014 The Authors. Published by Elsevier Ltd. This is an open access article under the CC BY-NC-SA license (http://creativecommons.org/ licenses/by-nc-sa/3.0/). Key words — youth livelihood choice, land access, non-farm employment, migration, Ethiopia, Africa 1. INTRODUCTION Youth unemployment has become a major global concern following the global economic crisis of 20–09, an event that triggered a sharp rise in youth unemployment. The current global youth unemployment rate is estimated to be 12.6% and is expected to remain high for the next five years (ILO, 2013). The political and social consequences of youth unem- ployment can be extensive, as evidenced in the recent political unrest in North African and Middle Eastern countries. The youth have been at the forefront of large demonstrations that have demanded reform and employment in the North African, Middle Eastern, and some European countries. The majority of the youth in Ethiopia live in rural areas where farming has been traditionally the main livelihood of the people. As the state owns all land in Ethiopia, rural resi- dents have been guaranteed access to land through a law that grants them a right to obtain agricultural land for free. How- ever, it has become increasingly more difficult to fulfill this right for the young generation. Ethiopia currently faces severe land scarcity in parts of the highlands where population den- sities have become very high and farm sizes have become very small. As a result, land as a safety net is eroding and landless- ness is emerging among the youth who are unable to stay on their parents’ land. This is particularly true in parts of Southern Ethiopia where the majority of farmers cultivate less than one hectare of land. In a country where there are restrictions on land markets and where there are virtually no large farms that can provide farm wage employment, having farmland is the most impor- tant factor that determines whether a rural resident can depend on an agricultural livelihood. In this study, we exam- ine youth livelihood choices in rural Ethiopia using primary data collected in 2013 with supplementary data from a related survey of the same households in 2007. We believe that this is the first study to perform a careful assessment of land access and livelihood strategies of rural youth in Africa. The study focuses on one of the most densely populated rural areas on the continent in a country where agriculture has been consid- ered the mainstay and livelihood for all rural residents. Devel- opment strategies and policies in Ethiopia, including the recent growth and transformation plan, implicitly assume that all rural residents are farmers who have access to agricultural land. Assessing the actual access to agricultural land and youth livelihood choice therefore has important policy impli- cations. To link the current individual endowment of youth to their own choice of employment strategy, we used youth planned livelihood strategy rather than their current participa- tion in the agricultural or non-agricultural sector, which may be largely driven by their parents’ decisions and priorities. The paper also examines the extent of youth migration from the rural South. Our panel data from 2007 and 2013 enabled us to test the migration aspect of youth livelihood choice by examining the extent and determinants of youth migration in the past six years. We provide novel evidence that youth in Southern Ethiopia have limited access to agricultural land in spite of their consti- tutional right that guarantees provision of agricultural land to all rural residents. Land cannot be bought in the market nor can it be rented on a long-term basis from other farmers. Local authorities that have been the traditional source of farmland have limited capacity to accommodate new farmers as all ara- ble land is already occupied in these areas. As a result, while parents are now the major source of farmland, the land that can be obtained from parents through inheritance or gift is too small to establish a livelihood for a rapidly growing num- ber of land-poor households. Thus, the youth are looking toward employment options other than agriculture, and the econometric analysis that examines determinants of livelihood choice strengthens this supposition. The results from a multi- nomial model indicate that larger land holdings by parents decrease the likelihood of youth choosing non-farm employ- ment over farming. A 1% reduction in household’s farm size is associated with a decline of 0.05 in the probability of a youth from that household choosing farming as a livelihood. A probit model estimation of migration decisions shows that youth migration within the last six years is negatively corre- lated with parents’ farm size. From the livelihood choice analysis, we learn that young people choose unskilled, off-farm wage employment as a result * This research has been funded by GLTN - UNHABITAT and Norwegian University of Life Sciences. We would like to thank Toril Iren Pedersen and two anonymous reviewers for useful comments. We appreciate the cooperation and information we received from the Land Administration offices in the Oromiya and SNNP regions and districts where we carried out the survey. Final revision accepted: June 10, 2014. World Development Vol. 64, pp. 259–272, 2014 0305-750X/Ó 2014 The Authors. Published by Elsevier Ltd. This is an open access article under the CC BY-NC-SA license (http://creativecommons.org/licenses/by-nc-sa/3.0/). www.elsevier.com/locate/worlddev http://dx.doi.org/10.1016/j.worlddev.2014.06.013 259
Transcript of Are Rural Youth in Ethiopia Abandoning Agriculture?

World Development Vol. 64, pp. 259–272, 20140305-750X/� 2014 The Authors. Published by Elsevier Ltd.
This is an open access article under the CC BY-NC-SA license(http://creativecommons.org/licenses/by-nc-sa/3.0/).
www.elsevier.com/locate/worlddevhttp://dx.doi.org/10.1016/j.worlddev.2014.06.013
Are Rural Youth in Ethiopia Abandoning Agriculture?
SOSINA BEZU and STEIN HOLDEN*
Norwegian University of Life Sciences, Aas, Norway
Summary. — This study examines current land access and livelihood choices of rural youth in Southern Ethiopia. We found that youthin rural south have limited access to agricultural land because of land scarcity and land market restrictions. We hypothesize that thisforces the youth to abandon agriculture in search of other livelihoods. Our study shows that only 9% of the rural youth plan to pursueagriculture as their livelihood. We also found a sharp increase in youth outmigration in the past six years. Our econometric analysesconfirm that lack of land access is forcing the youth away from an agricultural livelihood.� 2014 The Authors. Published by Elsevier Ltd. This is an open access article under the CC BY-NC-SA license (http://creativecommons.org/licenses/by-nc-sa/3.0/).
Key words — youth livelihood choice, land access, non-farm employment, migration, Ethiopia, Africa
* This research has been funded by GLTN - UNHABITAT and
Norwegian University of Life Sciences. We would like to thank Toril
Iren Pedersen and two anonymous reviewers for useful comments. We
appreciate the cooperation and information we received from the Land
Administration offices in the Oromiya and SNNP regions and districts
1. INTRODUCTION
Youth unemployment has become a major global concernfollowing the global economic crisis of 20–09, an event thattriggered a sharp rise in youth unemployment. The currentglobal youth unemployment rate is estimated to be 12.6%and is expected to remain high for the next five years (ILO,2013). The political and social consequences of youth unem-ployment can be extensive, as evidenced in the recent politicalunrest in North African and Middle Eastern countries. Theyouth have been at the forefront of large demonstrations thathave demanded reform and employment in the North African,Middle Eastern, and some European countries.
The majority of the youth in Ethiopia live in rural areaswhere farming has been traditionally the main livelihood ofthe people. As the state owns all land in Ethiopia, rural resi-dents have been guaranteed access to land through a law thatgrants them a right to obtain agricultural land for free. How-ever, it has become increasingly more difficult to fulfill thisright for the young generation. Ethiopia currently faces severeland scarcity in parts of the highlands where population den-sities have become very high and farm sizes have become verysmall. As a result, land as a safety net is eroding and landless-ness is emerging among the youth who are unable to stay ontheir parents’ land. This is particularly true in parts ofSouthern Ethiopia where the majority of farmers cultivate lessthan one hectare of land.
In a country where there are restrictions on land marketsand where there are virtually no large farms that can providefarm wage employment, having farmland is the most impor-tant factor that determines whether a rural resident candepend on an agricultural livelihood. In this study, we exam-ine youth livelihood choices in rural Ethiopia using primarydata collected in 2013 with supplementary data from a relatedsurvey of the same households in 2007. We believe that this isthe first study to perform a careful assessment of land accessand livelihood strategies of rural youth in Africa. The studyfocuses on one of the most densely populated rural areas onthe continent in a country where agriculture has been consid-ered the mainstay and livelihood for all rural residents. Devel-opment strategies and policies in Ethiopia, including the recentgrowth and transformation plan, implicitly assume that allrural residents are farmers who have access to agriculturalland. Assessing the actual access to agricultural land and
259
youth livelihood choice therefore has important policy impli-cations. To link the current individual endowment of youthto their own choice of employment strategy, we used youthplanned livelihood strategy rather than their current participa-tion in the agricultural or non-agricultural sector, which maybe largely driven by their parents’ decisions and priorities.The paper also examines the extent of youth migration fromthe rural South. Our panel data from 2007 and 2013 enabledus to test the migration aspect of youth livelihood choice byexamining the extent and determinants of youth migrationin the past six years.
We provide novel evidence that youth in Southern Ethiopiahave limited access to agricultural land in spite of their consti-tutional right that guarantees provision of agricultural land toall rural residents. Land cannot be bought in the market norcan it be rented on a long-term basis from other farmers. Localauthorities that have been the traditional source of farmlandhave limited capacity to accommodate new farmers as all ara-ble land is already occupied in these areas. As a result, whileparents are now the major source of farmland, the land thatcan be obtained from parents through inheritance or gift istoo small to establish a livelihood for a rapidly growing num-ber of land-poor households. Thus, the youth are lookingtoward employment options other than agriculture, and theeconometric analysis that examines determinants of livelihoodchoice strengthens this supposition. The results from a multi-nomial model indicate that larger land holdings by parentsdecrease the likelihood of youth choosing non-farm employ-ment over farming. A 1% reduction in household’s farm sizeis associated with a decline of 0.05 in the probability of ayouth from that household choosing farming as a livelihood.A probit model estimation of migration decisions shows thatyouth migration within the last six years is negatively corre-lated with parents’ farm size.
From the livelihood choice analysis, we learn that youngpeople choose unskilled, off-farm wage employment as a result
where we carried out the survey. Final revision accepted: June 10, 2014.

260 WORLD DEVELOPMENT
of desperation due to a lack of land access and viable liveli-hood opportunities (push factors) and that urban salariedemployment seems an attractive opportunity for those withthe resources, education, and flexibility to explore such oppor-tunities (pull factors). Choices of the youth from land-poorhouseholds are driven by push factors while land-rich house-holds are more able to afford to educate their children whotherefore may be able to obtain better paying jobs.
This paper is organized as follows. Section 2 presents a con-ceptual framework and discusses empirical literature on liveli-hood diversification. Section 3 provides background on landlaws in Ethiopia and discusses data sources. Section 4 reportsdescriptive statistics while Sections 5 and 6 present empiricalapproach and econometric analyses, respectively. The finalsection presents concluding remarks.
2. CONCEPTUAL FRAMEWORK AND LITERATURE
(a) Drivers of livelihood diversification in rural areas
A proliferation of research on rural livelihoods in the lasttwo decades has produced ample evidence that rural residentsare not solely dependent on agriculture. There are significantlevels of non-farm activities that provide either an additionalsource of income to farmers or serve as the only source oflivelihood to landless rural residents (Ellis, 1998, 2000;Lanjouw & Lanjouw, 2001; Reardon, 1997; Reardon,Berdegue, & Escobar, 2001). Some have even argued thatthere is a trend toward ‘deagrarianization’ of rural areas,including rural areas in Africa (Bryceson, 1996, 2002;Bryceson & Jamal, 1997; Rigg, 2006).
In light of strong evidence of diversified livelihoods in ruralareas, we conceptualize resource allocation decisions of ruralresidents as a constrained optimization problem where theexisting set of incentives signals the relative returns from thediverse farm and non-farm activities and where the amountof owned and otherwise accessed resources determine thecapacity to engage in these activities. In the context of employ-ment in the non-farm sector, the incentives can be categorizedinto two groups: push and pull factors. One group of push fac-tors is related to performance of agriculture. This includes thebasic production potential given available technologies andagro-ecological characteristics as well as risk factors thatmay cause inter-seasonal and other transitory drops in farmincome, chronic food insufficiency, and fluctuations in farmincome (Reardon, Berdegue, Barrett, & Stamoulis, 2007).Another source of push factors are incomplete markets forfactors, including, but not limited to, missing or incompleteland, credit, and insurance markets (Binswanger &Rosenzweig, 1986). In the absence of financial markets, indi-viduals and households diversify their sources of income toself-insure themselves and provide working capital (Barrett,Reardon, & Webb, 2001). Rural residents who do not ownagricultural land in the face of missing land markets experi-ence the ultimate push factor. However, farmers who haveland to cultivate but face frequent weather shocks may beforced to diversify into the non-farm sector as ex ante riskmanagement and/or ex post risk-coping mechanism.
The pull factors emerge if earnings from non-agriculturalemployments are assessed to be higher than earnings fromfarm employment. The higher the returns to labor and capitalin non-agricultural employment, the more attractive suchemployment will be compared to farming. If there is a strongand vibrant non-farm sector in the rural areas, efficient alloca-tion of resources implies that rural residents diversify into the
sector while also engaging in farming. Some of the residentscould also engage fully in the non-farm sector if the returnsfrom the non-farm sector dominate the returns from agricul-ture at all levels of labor and capital. However, rural areaswith strong push factors but little local non-farm employmentopportunity may experience high levels of outmigration, espe-cially if they are not located within a commuting distance toother sources of employment.
The push and pull factors represent the incentives that moti-vate employment or investment in the non-farm sector.Whether and to what extent rural residents engage in thenon-farm sector also depends on the capacity of the residents.The capacity represents not only the individual’s resources butalso the relevant household and community resources thatshe/he has access to. While the main capacity indicators inrelation to non-farm employment are the human, physicaland financial capitals, the physical and financial constraintsare less of a problem in a well-functioning market economybecause one can finance a business by borrowing. However,when markets are functioning poorly, one’s human, physicaland financial capitals are not easy to augment and can becomebinding constraints. This can lead to different outcomes fordifferent individuals facing the same incentives but differentconstraints. This capacity limitation restricts resource-poorindividuals and households to a few low paying activities, asevidenced in many African countries (Reardon, 1997).
(b) Livelihood diversification in rural Africa
Although rural areas of Africa have been typically associ-ated with agriculture, the non-farm sector is an importantsource of employment and income. When considering nationalemployment statistics, it does not seem very significantbecause national statistics report only primary employment.On average, rural non-farm employment accounts for 10%of full-time employment in Africa (Haggblade, Hazell, &Reardon, 2007). However, many farmers engage in non-farmactivities as an additional source of income. A study thatreports both primary and secondary employment shows anon-farm sector participation rate of 93% for Malawi and75% for Ghana (Winters et al., 2009). The share of incomethat rural households obtain from the non-farm economymay, therefore, give a better indication of the importance ofnon-farm activities to rural households. On average, the shareof rural non-farm income to household total income isreported to be approximately 35% in Africa (Reardon et al.,2007). There are, of course, variations across countries. Theshare ranges from 6% in Southern Mali to 93% in the unfavor-able climate zones of Namibia (Reardon et al., 2007).
(c) Livelihood diversification in rural Ethiopia
According to a national survey by Ethiopia’s statisticalagency, only 10% of economically active individuals in ruralareas are employed in the non-agricultural sector (CSA,2012b). However, similar to many national statistics onemployment, this one also refers to primary occupation ofindividuals, and thus, the statistics regarding non-farmemployment were much lower than those reported by theempirical studies on income diversification in rural areas.These studies show that the proportion of rural householdswho participate in non-farm employment ranges from 25%in Oromia (van den Berg & Kumbi, 2006) to 81% in Tigray(Woldenhanna & Oskam, 2001). Similarly, the share of non-farm income to total income is 35% in Tigray (Woldenhanna& Oskam, 2001), 20% in Hararghe (Tefera, Perret, &

ARE RURAL YOUTH IN ETHIOPIA ABANDONING AGRICULTURE? 261
Kirsten, 2005), 13% in central and southern regions of Ethio-pia (Matsumoto, Kijima, & Yamano, 2006), and 8% inOromia (van den Berg & Kumbi, 2006). Most of the non-farmactivity in rural Ethiopia is self-employment. With the excep-tion of Tigray, the majority of the households in the abovestudies engage in self-employment. The high level of wageemployment in Tigray is a result of food-for-work and cash-for-work programs provided by the government. For example,58% of those engaged in wage employment were engaged infood-for-work/cash-for-work programs. The study by Bezu,Barrett, and Holden (2012) uses panel data from a more rep-resentative sample that includes more than 1,400 householdsin 15 villages in Ethiopia and shows a household non-farmparticipation rate of 48%. The study further shows that themajority of households (70%) engage in non-farm self-employ-ment activities.
(d) Household income diversification versus individual livelihoodchoice
Conceptually, the labor allocation decision in the contextof utility maximization has been modeled either as an indi-vidual utility maximization problem, such as in the migrationmodel of Todaro (Todaro, 1969), or as a household utilitymaximization problem, as in the spirit of Becker’s familylabor allocation model (Becker, 1965). More recent literaturechallenges the unitary household model in favor of a collec-tive model that allows for intra-household bargaining, as inco-operative and non-cooperative bargaining models(Lundberg & Pollak, 1993; Manser & Brown, 1980;McElroy & Horney, 1981). Studying livelihood choice specif-ically for the youth population is challenging because theyouth in rural areas often live with their parents in a house-hold where they may have only limited influence on theirown labor allocation. However, they are also at an age whenthey have to think about and prepare for their own indepen-dent life separate from their current household. Hence, theinterests of the household and the individual members maynot always overlap, especially with regard to the long-termlivelihood decisions of youth members. For some of theyouth, their social and legal position as minors may effec-tively block their exit options, unlike the case for marriedcouples, who may each use the threat of divorce or non-cooperation to strengthen their bargaining power. It is, there-fore, tricky to use the current employment participation ofyouth as an indicator of their individual chosen livelihoodor occupation. This is because their current employmentmay be a result of the household maximization decision,the individuals’ own long-term maximization decision, or acompromise of the two.
Land is an important determinant of livelihood in ruralareas. As population increases and land scarcity becomes crit-ical, non-farm activity and migration may become the onlyway out of poverty for land poor farmers as well as primarysource of livelihood for the new generation of rural resident.It has been argued that the de-linking of rural livelihood fromfarming has been on the rise for the past few decades in Africa(Bryceson, 1996, 2002, Rigg, 2006). If land-scarce farm house-holds participated in the non-farm sector to diversify incomeand cope with shocks in the past, non-farm employmentmay now become the only source of employment for the chil-dren from such farm households. This situation is further rein-forced by changes in youth aspirations fueled by increasedinformation and improved access to roads, which reducestransaction costs.
3. BACKGROUND AND DATA
(a) Agricultural land access in Ethiopia
The socialist Derg regime that came into power in 1975through a military coup abolished the feudal system in Ethio-pia and declared all land, rural or urban, to be the property ofthe state. All of the residents in the rural communities in Ethi-opia who do not have alternative livelihood opportunitieswere then granted a constitutional right to obtain land as abasis for their livelihood. Although the market system andthe political leadership changed in 1991, the land is still ownedby the state, and the rural residents still have a constitutionalright to obtain agricultural land for their livelihood. The 2005Rural Land Administration and Land Use Proclamationincludes the following articles to ensure this right (FDRE,2005):
Peasant farmers/pastoralists engaged in agriculture for a liv-ing shall be given rural land free of charge (FDRE, 2005,Section 5, No. 1-A)
Any citizen of the country who is 18 years of age or aboveand wants to engage in agriculture for a living shall havethe right to use rural land; children who lost their mothersand fathers due to death or other situation shall have the rightto use rural land through legal guardians until they attain18 years of age (FDRE, 2005, Section 5, No. 1-B).
This “land as a safety net” right is the basis for the prohibi-tion of land sales in the country. This constitutional rightwas provided to youth through repeated land redistributionsthat aimed to maintain an egalitarian distribution of theland. Households accessed land based on their subsistenceneeds (family size) and the production potential (land qualityclasses) of the land (Holden & Yohannes, 2002). Increasingly,these redistributions had to be carried out by reallocatingland from more land-rich to land-poor households, a situa-tion that created tenure insecurity as the land redistributiongame became a zero-sum game (Zewde & Pausewang,2002). It was this tenure insecurity and weak land rights ofindividual households that undermined investments in landand created a demand for more secure land rights that ulti-mately led to the halting of the land redistributions and tothe recent land registration and certification reform that aimsto provide more secure land rights (Deininger & Jin, 2006).This implies, however, that Ethiopia has created conflictinglegal rights in favor of current owners and occupiers of theland while the growing land-poor or landless youth popula-tion could not rely on their constitutional right to land beingprovided by the state.
With the abolition of the redistribution policy and due tothe increase in land scarcity, it has become increasingly moredifficult for youth to access land. Most rural communitieshave a long waiting list of youth who have applied to receiveland from the authorities. In many places, the authoritieshave begun giving them small plots for building a housebut too small to be used for farming purposes. As land salesare prohibited and there are restrictions on land renting, landinheritance is the main source of access to agricultural landand agricultural livelihood for rural youth. However, mosthouseholds have small land holdings and large families.More than half of the households in Ethiopia currentlycultivate less than one hectare of land, while the averagehousehold size is approximately five members (CSA, 2012a,2012b).

Table 1. Main characteristics of youth sample
Male Female All
Sample size 353 246 599Percentage
Live with parents 95 93 94Attended school at least once 98 97 97Currently student 62 73 66Dropped out of school at least once 48 35 43Married 13 11 12Involved in farming activity 89 67 80
Average (mean)
Age of respondent 19.28 18 18.76Highest grade completed by respondent 7.36 6.55 7.19Highest grade attained by any memberin the household
9.4 8.78 9.42
Number of respondents’ brothers 3.64 3.62 3.63Number of respondents’ sisters 3.5 3.34 3.44
Source: Own survey data.
262 WORLD DEVELOPMENT
(b) Land policies, migration, and non-farm activities in ruralEthiopia
Although current land holders have in theory perpetual userrights which they can also transfer to their children, theirrights are in fact conditional on their continued residence inthe village where their farm is located. The recent federal landuse law indicated that the land of those households who stayedoutside of the locality for extended period will be redistributedto the landless and land poor (FDRE, 2005). The implementa-tion and interpretation of this law may have local variationsbut one important common effect is to discourage temporaryor permanent migration among current land holders. In addi-tion, farmers who have not cultivated their land for two con-secutive years will lose their land user right even if they werelocal residents. This may create a disincentive for farmers toengage in non-farm activities as low-intensity farming maybe construed as ‘abandonment’ by local authorities (WB,2011). These restrictions are a continuation of the policiesunder the Derg regime which had even stronger controls onlabor movement. Over time, such policies have contributedto a rural economy that has very little diversification andlow migration (Little, Stone, Mogues, Castro, & Negatu,2006; Rahmato, 1984).
(c) Data
This study is based on a household and youth survey con-ducted in February and March 2013. We built on a baselinestudy of 615 households that were surveyed in 2007. Of theoriginal 615 households, 580 were surveyed again in 2013and a new sample of 40 households was added. The locationsand households that were included in the study were identifiedusing stratified random sampling based on variations in agro-ecosystems, market access, and population density (urbanexpansion pressure). The study was carried out in sixteen vil-lages spread out among five districts in Southern Ethiopia.Three of the districts were located in the Oromia region (Shas-hemene, Arsi Negelle, and Wondo Oromia), and two werelocated in the Southern Nations, Nationalities and Peoples(SNNP) region (Wondo Genet in the Sidama zone and DamotSore in the Wollaita zone). The sample included three majorethnic groups with different languages. Households in the Oro-mia districts had larger farm sizes than those in the SNNP.Shashemene and Wondo Genet are located quite close toAwassa, the largest town in this part of Ethiopia and theadministrative center of the SNNP region. Located along themain road between Awassa and Addis Ababa, Arsi Negelleand Shashemene have very good market access for theirannual crop production (cereals). The cash crop producingarea, Wondo Genet, has irrigation access, is located close toShashemene and has good roads that facilitate market-oriented perennial cash crop production (sugarcane, chat, cof-fee). The Damot Sore district in the Wollaita zone is located ina more remote rural setting with poorer market access and,therefore, is characterized by more traditional subsistence-oriented production with perennials (enset). Further descrip-tions of the survey areas are given in Table 15.
We surveyed household heads and their sons or daughterswho are 15–29 years of age. 1 All household heads in the sam-ple were surveyed, but only youth who were current membersof the households or who lived in the same village wereincluded in the youth sample. 2 Each youth and householdhead were interviewed separately for the survey. The house-hold heads were typically the fathers; however, in some cases,the head of household was a female. We collected information
for each member of the household that was a resident in 2007,including detailed information regarding members who hadleft the household since 2007. 3 Household heads were askedabout land gifts and inheritances to children, schooling deci-sions for children as well as land holdings and land certifica-tions. The youth sample consisted of 600 individuals selectedfrom 266 households that had one or two pairs of youth sib-lings. The youth survey addressed youth involvement in agri-culture, land inheritance expectations, livelihood choices, andtrust and cooperation issues.
4. DESCRIPTIVE STATISTICS
Table 1 provides basic overview statistics of the youth sam-ple. We have more male youth in our sample than female. Wefound that 94% of the youth in our sample lived with their par-ents and the majority are students. School enrollment appearshigh with 97% having been registered in a school at least oncein their lifetime. However, the temporary or permanent schooldropout rate is also high with 43% stating that they havedropped out of school at least once. On average, the youthin our sample have completed seven years of education. Wehave proportionately more female students than male studentsand we also have proportionately less female drop out thanmale drop out in this sample. However, this may not bebecause of low drop out among female students in the village.Rather, it may be because most female students drop out dueto marriage and we may not have them in our sample as mar-ried women typically move to their husband’s village. Thefemale youth in our sample are on average one year youngerthan the male youth.
(a) Agricultural land holding
The national level land use survey shows that the averagehousehold farm size in Ethiopia is 1.22 hectares, but 57% ofthe households have farm sizes less than one hectare (CSA,2012a). The mean farm sizes in our sample are reported inTable 2. The mean farm size is 0.86 hectares, which sustainsan average household size of 7 people. Half of these house-holds cultivate 0.5 hectares or less, but there is a significantvariation across survey areas. The households in the Oromiadistricts have larger farms, while the majority of households

Table 3. Willingness of parents to hand over farm land to their children intheir life time
District Parents plan tohand over farmland while alive
(% of respondents)
Land size to begiven (% of
current holding)
N
Shashemene 90 47 102Arsi Negelle 82 46 144Wondo Oromia 93 42 40Wondo Genet 87 47 125Damot Sore, Wollaita 90 46 197All 88 46 608
Source: Own survey data.
Table 2. Farm size and demographic characteristics of sample households, by district
Oromia region SNNP region Total
Shashemene Arsi Negelle Wondo Oromia Wondo Genet Damot Sore, Wollaita
Average land holding (in hectares) 1.15 1.38 0.84 0.55 0.52 0.86Households with land holding 6 0.5 hectare (%) 26 18 43 71 76 51Households with land holding 6 1 hectare (%) 58 45 75 88 95 74Household size (current members) 7.9 7.5 7.2 7.3 6.1 7.1Number of own children currently living with thehousehold
5.7 5.5 4.9 5.0 3.9 4.9
Number of own children alive (including currentlynon-resident)
7.3 7.3 5.5 6.6 6.3 6.7
Number of observations 103 145 40 126 199 613
Source: Own survey data.
ARE RURAL YOUTH IN ETHIOPIA ABANDONING AGRICULTURE? 263
in the SNNP cultivate very small farms. Particularly striking isthe farm size in Damot Sore (Wollaita), where 95% of thehouseholds cultivate less than one hectare of land. Wondo-Oromia district in the Oromia region is geographically closeto the Wondo Genet district in the SNNP and has a signifi-cantly smaller average farm size than the two Oromia districts;however, it is still higher than our sample from the SNNP dis-tricts.
(b) Current youth land holding
Currently, Ethiopia’s population is estimated to be morethan 86 million (CSA, 2013a). A recent nationally representa-tive survey in Ethiopia shows that the majority of the popula-tion is young with the youth and adolescent populations aloneaccounting for 41% the total population in 2011 (CSA & ICF,2012). Furthermore, according to the 2007 census, 84% of thepopulation in Ethiopia lives in rural areas (FDRE, 2008).Thus, the majority of the youth in Ethiopia live in rural areas.However, the majority of young people in rural Ethiopia donot have their own farmland despite their constitutional rightto access land in the community in which they live. The 2012national level land use survey shows that the youth(18–29 years of age, in this case) accounts for 21% of the rurallandholders in Ethiopia. The average age of the householdheads in our sample is 44, while 16% of them are younger than30. 4 Consistent with the land scarcity differences, proportion-ately, more youth in Oromia are able to obtain land and estab-lish a family with an agricultural livelihood than the youth inthe SNNP. Of the households in our Oromia sample, 25% areyouth, while in the SNNP, the rate is only 6%.
(c) Youth land access options
(i) Land allocation from authoritiesSince 1975, youth in rural areas of Ethiopia have been
obtaining agricultural land from village administrative author-ities in their community or from their parents. Currently, how-ever, land administrators in the highlands of Ethiopia havelimited capacity to accommodate the young rural residents.A total of 95 youth in our sample reported to have securedsome type of individual access to farm land. However, only6 obtained land from the land administrative authorities. Thisdemonstrates that land access from the government no longerserves as a safety net for youth.
(ii) Youth land access through gift and inheritance from parentsAs land cannot be bought or sold in Ethiopia and because
there are also restrictions on land rental markets, particularlyon long-term rentals, inheritance and donations from parents
have become the main source of land access for the new gen-eration. As previously indicated, the average farm size for oursample households is 0.86 hectares. This is barely sufficient tosustain a family under the current agricultural production sys-tem. The majority of parents, however, recognize that theirfarm is the main source of land access for their children andbelieve that they need to hand down at least part of their farmbefore they die. In response to questions regarding land trans-fer to children, 90% of the household heads in our samplereported that they are willing to transfer at least part of theircurrent farm to their children while they are still alive. Onaverage, they intend to transfer 46% of their current holdings.With the new legal restrictions on farm sizes (see below), thismay imply only informal land transfers to children in the caseof very small farm sizes (Table 3).
Parents do not necessarily give their children their lessdesired part of the farm. In fact, proportionately, more peopleintend to hand over the land closer to the homestead (40%)than the land farther away from the homestead (30%). Only3% of household heads indicated that they will transfer the lessfertile land as opposed to 13% who reported the intention totransfer the more fertile land. It appears that parents holdon to their land to maintain their family and then transfer partof their land to their children as the need arises.
(iii) Small farms, many inheritorsAs farm sizes in our study areas are small relative to the
household sizes, allocating parents’ land among children is achallenge. An estimate based on current land holdings of par-ents in our sample shows that if parents were to allocate theirland to all sons and daughters, each would receive, on average,0.22 hectares (see Table 4). This is such a small amount of landthat it cannot even be formally registered as a new separatefarm unit. According to the 2005 Land Use Law , “where rural

Table 4. Land holding of parents (in hectares) in relation to potential inheritors, by region
SNNP Oromia Total
Mean, ha N Mean, ha N Mean, ha N
Farm size/household size 0.09 322 0.20 287 0.14 609Farm size/Own children living with the household 0.14 298 0.30 278 0.22 576Farm size/Male offspring living with the household 0.25 280 0.53 266 0.39 546
Source: Own survey data.
264 WORLD DEVELOPMENT
land is transferred by succession, it shall be made in such a waythat the size of the land to be transferred is not less than the min-imum size holding” (FDRE, 2005, Section 11-2). The minimumsize referred to is 0.5 hectares in the annual cropping systemsand 0.25 hectares in the perennial zones. Even if farmers are tobequeath all land only to their sons, the average land that eachreceives would still be below the minimum size for a largeshare of the households. More importantly, such farm sizesare too small to be the basis of a single source of livelihoodunder the current agricultural system.
Under these circumstances and legal restrictions, one optionfor maintaining formal land access for all children is a co-man-agement strategy among siblings and/or parents. This doesnot, however, solve the concern for household food securityunless supplementary sources of income can be found.Another option is for some of the inheritors to willingly forfeittheir inheritance right or for parents to select inheritors fromamong their children. The risk in this case is conflict amongsiblings. Alternatively, as is common in many other countries,one of the inheritors may compensate the others for their shareand keep the land. We have no evidence of this type ofarrangement among our sample households, and it is not clearif this could be considered as land sale, which is prohibited. Asthese land transfer issues are increasingly pressing, some formof regulation may help to reduce possible sibling competitionand within-household conflicts. About 30% of the householdheads in our sample believe that there is competition for landamong their children. Better off-farm employment opportuni-ties due to rapid economic growth in the country may alsoreduce the pressure and facilitate youth access to other liveli-hood opportunities outside the family farm.
Table 5. Households who intend to bequeath land to daughters
District Percentage
Shashemene (Oromia) 34.7Arsi Negelle (Oromia) 43.8Wondo Oromia (Oromia) 42.5Wondo Genet (Sidama) 30.9Damot Sore (Wollaita) 6.1All households 27.2
Source: Own survey data.
Table 6. Household characteristics and the de
Household character Wi
No
Education of household head (years) 2.80Age of household head 43.44Per capita land holding (hectares) 0.13Household have land certificate 0.82
Source: Own survey data. Significance level: ****: 0.1%.
(iv) Female youth land accessCurrently, only 3% of all landholders in Ethiopia are young
women (CSA, 2012a) even though the Ethiopian land lawsprovide equal land acquisition and use rights to male andfemale citizens. Whether young women practically have equalaccess to land depends on their ability to obtain land fromtheir parents, who are now the main source of land access.One question in our survey for household heads on this issuereveals that most girls and women will not be inheriting landfrom their parents (Table 5). Three-fourths of the householdheads in our sample admit that none of their daughters willever inherit land from them. In Damot Sore, where farm sizesare very small, only 6% of household heads have any intentionof bequeathing land to their daughters. The main source ofaccess to land for young women must then be throughmarriage to a young man with land access, according to theEthiopian tradition of women moving to the homestead oftheir husband upon marriage.
We expected that the recently introduced land registrationwould increase the probability of daughters inheriting landfrom parents as their names are typically registered in relationto household land holdings and land certificates. However,this does not seem to make any difference in the areas studied.The proportion of household heads who intend to bequeathland to their daughters does not differ based on land registra-tion or certification status. It seems, however, that educationhas a stronger correlation with land inheritance by daughters.Household heads who intend to bequeath land to their daugh-ters have, on average, four years of education while those whodo not intend to do so have an average of 2.8 years of educa-tion; the difference is statistically significant at a 1% level ofsignificance. Those who bequeath land to their daughters alsohave a higher per capita land holding, thus indicating thatland scarcity contributes to the decision to exclude daughtersfrom inheriting land (Table 6)
A parallel question for the youth exploring their expectationof land inheritance shows that young women have a lowerexpectation of land inheritance than young men, though theirexpectation is certainly higher than that for which their par-ents are prepared. While 74% of young men expect to inheritland, only 41% of the young women expect to do so.
Parents’ expectations with regard to youth’s economic activ-ity and responsibility may differ across different cultures,which may in turn influence their decision about engaging
cision to bequeath land to female children
ll daughters inherit? Significance test
Yes Total
4.10 3.16 ****
44.30 43.670.18 0.14 ****
0.84 0.83

ARE RURAL YOUTH IN ETHIOPIA ABANDONING AGRICULTURE? 265
their children in farming and on their land bequeathal deci-sion. Table 7 summarizes land transfer and related decisionsfor the three main ethnic groups in our sample.
In general, getting married seems the surest way of receivingland from parents. Close to 60% of all households believe thatthe most appropriate time to transfer land to children is whenthey get married. It is most important for farmers in the Sid-ama ethnic group where the figure is 80%. This may haveimplication on how marriage and livelihood choice are related.Those who want to delay marriage know that they have lesslikelihood of accessing land from their parents and may thuschoose to migrate or engage in non-farm activities. Adultyouth from the Oromo ethnic group have a better chance ofgetting land than adult youth from other ethnic groups evenif they are not married. One-third of the parents in the Oromoethnic group indicates that the best time to transfer land to achild is when he or she becomes an adult. Young women havebetter chance of inheriting land in the Oromo communitiesand least chance of inheriting land in the Wollaita commu-nity. 5 It appears that children in Oromo households havemore equal opportunity among themselves than in other eth-nic groups that prioritize married children or male childrenfor land transfer. The risk with such an egalitarian system isthat when land inheritance or transfer is expected by all ofthe children, increased land scarcity may result in land-relatedconflicts. Our data show that 40 % of household heads in theOromo ethnic group believe that there is competition for landamong their children while only 15% of the Wollaita house-hold heads have similar expectation, although the Wollaitahouseholds in our sample have much smaller land holdings.
(d) Youth livelihood strategies
(i) Choice of livelihood/occupationTable 8 shows the current occupations of the youth in our
sample. The majority are students, thus indicating that they
Table 7. Land-related expectations and decisio
Female children will not inherit
When to transfer land to childrenAt marriageWhen son/daughter becomes adultWhen both parents dieOther
Land relation and competitionOwn children work on parents landHousehold head believes there is competition for land among his/her chSons/daughters informed whether they inherit
Source: Own survey data.
Table 8. Main occupation of you
Shashemene Arsi Negelle
Student 68 61Farmer 24 19Engaged in Off-farm wage employment 2 2Engaged in business 0 5Unemployed 6 13
Source: Own survey data.
are primarily engaged in developing their human capital. Pro-portionately, more youth in the Wondo Genet district, thecash cropping area, reported education as their primary occu-pation, while the highest percentage of youth who reportedfarming as their primary occupation is registered in theWondo Oromia district, an area to which more people havemigrated recently due to its high agricultural potential. Whilethe youth unemployment rate is 7% for the sample, the rate isdouble that for the youth in Arsi Negelle.
As previously noted, 94% of the youth in our sample livewith their parents and are perhaps dependent on their parentsfor their current sustenance as well as their education oppor-tunities. In addition, 41% are minors (younger than 18 yearsof age). Thus, while the youth may be participating in thehousehold’s farm or non-farm activities, current youth partic-ipation in any productive activity may not be reflective offuture livelihood strategies or occupational choices. As arguedin section two, current employment in these situations mayreflect the labor allocation decision of parents, of the youthor both. Nonetheless, the youth should be able to identify theirfuture livelihood strategies based on their current preferences,skills, expected human and physical capital accumulation, andincentives from the market. Therefore, to understand the live-lihood they are likely to choose, we asked youth respondentswhat their ‘planned future livelihood/occupation’ is. Weemphasized the ‘planned’ aspect of the question during thesurvey by probing for concrete answers because we want tomake sure that respondents do not report aspirations andwishes. Table 9 reports youth livelihood choices.
We found that a surprisingly small percentage (9%) of theserural youth chose agriculture as their future livelihood. Therest choose non-farm local wage employment, business, orurban salaried employment. Most of those who intend toengage in farming either plan to take over the farm from theirparents or farm jointly with their parents. Although agricul-tural resettlement has been considered a way out of the land
ns by ethnic groups of sample households
Oromo (%) Sidama (%) Wollaita (%) All (%)
60 75 92 72
42 81 70 5735 9 16 2514 4 4 109 6 10 9
73 83 53 67ildren 40 30 15 29
59 28 34 46
th respondents (percentages)
Wondo Oromia Wondo Genet Damot Sore Total
52 81 59 6633 6 13 166 6 11 59 4 13 60 3 5 7

Table 9. Summary of preferred livelihood/occupation choice as reported byyouth
Livelihood choice Maleyouth %
Femaleyouth %
Allyouth %
Farming 11.7 6.2 9.4Off-farm wage employment 3.7 1.7 2.9Self-employment/Business 32.5 26 29.9Urban salaried employment 52.1 66.1 57.8Total (Observation) 100(351) 100(242) 100(593)
Source: Own survey data.
266 WORLD DEVELOPMENT
scarcity problem, particularly in the SNNP, only one person inour sample plans such resettlement. Off-farm wage employ-ment constitutes wage employment in the village, while busi-ness could be in the village or away from the village. Urbansalaried employment includes those who want to work in gov-ernment offices or private companies. Approximately, half ofthose who chose urban salaried employment plan to first pur-sue higher education before seeking employment.
Table 10 displays the characteristics of youth who choseeach livelihood strategy. Compared to other livelihood types,those who chose farming were older, more likely to be mar-ried, had farming experience, and expected to inherit land.We see proportionately more students among those who choseurban salaried employment than in the other livelihood. Acomparison of assets across households shows that youthwho chose off-farm wage employment came from poorerhouseholds and households who have a larger number of chil-dren, which is indicative of a push factor as an incentive. Theyouth characteristics reinforce this finding. Youth who expectto inherit land are less likely to choose off-farm wage employ-ment compared to other livelihood strategies. These statisticsseem to be consistent with earlier studies with respect tonon-farm employment in Ethiopia where unskilled off-farmwage employment is shown to be the least well-paying of thenon-farm employment opportunities and seems to attract themost desperate job seekers due to lower entry barriers (Bezuet al., 2012; Woldenhanna & Oskam, 2001). However, entrybarriers may exist even for unskilled off-farm wage employ-ment in Ethiopia due to search costs, seasonal work, andrisk/uncertainty related to finding such employment(Holden, Shiferaw, & Pender, 2004). A detailed econometricanalysis is provided in the next section.
Table 10. Youth and household cha
Farming
Mean Std.Dev M
Individual characteristics
Age of youth 20 3.88Highest grade completed 6 3.15Married youtha 0.30 0.46Studenta 0.39 0.49Youth with farming experiencea 0.89 0.31Youth expect to inherit landa 0.69 0.47
Household characteristics
Number of children in the household 6.02 2.65Livestock owned (in tlu) 3.48 3.65Value of non-livestock assets (in ‘000 EB) 6.17 27.79Land holding (hectares) 1.29 0.92
Source: Own survey data.a The figures refer to proportion in each livelihood choice. For example 39% o
(ii) The migration angle of livelihood choiceThe urban salaried employment chosen by 58% of the rural
youth, as reported in Table 9, suggest significant urban migra-tion in the next few years. 6 However, a follow up study wouldbe required to determine how much of the planned activity willactually occur and, eventually, how the youth respond to anexpanded, local, non-farm employment opportunities.
To have some evidence on past migration among the ruralyouth, we collected information on the whereabouts of house-hold members that were registered in 2007 survey. The compileddata give us information on migration in the periods 2007–13,which is reported in Table 11. We found that 15% of the youthand adolescent population in 2007 had migrated by 2013.
Damot Sore in Wollaita has the largest migration rate(31%). While this area resembled a prototype Malthusian pov-erty trap in 2007, it still had very little outmigration. However,from 2007 to 2013, there was a drastic change in the employ-ment strategies of the youth in this area. From informal dis-cussions in urban areas, we learned that youth fromWollaita have, in the recent years, ‘taken over the shoe shinermarket’ in Addis Ababa, thus indicating that the high level ofmigration in our sample is not an exception. This is a remark-able change in a few years, thus suggesting that this type ofmigration can really explode when the internal populationpressure in a subsistence community has reached a levelbeyond its carrying capacity. With the continued rural popu-lation growth, increasingly more rural communities will soonreach similar and comparable situations for their youth popu-lations. Data from an intercensal survey in Ethiopia also showsimilar pattern at the national level. From evaluation of theorigins of migrants, it is evident that historically there is morerural to rural migration than rural to urban migration but itseems to have changed in recent years. Among all migrants,the rural to rural migrants account for 37% of migrants whilethe rural to urban migrants account for 33%. However, amongrecent migrants (since 2007) rural to urban migrants accountfor 39% of all migrants while rural to rural migrants accountfor only 27% (CSA, 2013b).
While the push factors in the rural areas such as populationpressure, land scarcity, lack of alternative livelihoods, andweather shocks can be major incentives for youth to migrateto urban areas, the pull factors are also as much important.The rapid economic growth Ethiopia experienced in recentyears 7 created several employment opportunities in the
racteristics by livelihood choice
Type of livelihood the youth chose
Off-farm wageemployment
Business Urban salariedemployment
ean Std.Dev Mean Std.Dev Mean Std.Dev
18 2.67 20 3.65 18 2.956 3.54 7 3.40 8 2.52
0.12 0.33 0.18 0.38 0.06 0.230.65 0.49 0.38 0.49 0.86 0.350.82 0.39 0.79 0.41 0.80 0.400.50 0.52 0.57 0.50 0.61 0.49
7.00 3.64 6.34 2.93 6.64 3.082.95 2.23 3.22 4.23 4.00 5.310.94 1.02 6.07 23.60 3.46 6.760.84 0.88 1.02 0.80 1.11 0.88
f those who chose farming are students.

Table 11. Youth migration in Ethiopia
District name Migration by destination (% of youth who migrated)
Abroad Addis Ababa Other towns Other Rural Areas All N
Shashemene 1.2 0 1.2 2.1 4.6 241Arsi Negelle 2.5 1.2 6.2 1.2 11.2 401Wondo Oromia 0 0 1.6 0 1.6 64Wondo Genet 0.6 2.5 3.4 0 6.5 325Damot Sore 0.2 5.1 21.6 4.4 31.3 450Total 1.1 2.4 9.3 2 14.8 1481
Note: Percentage of youth and adolescents (10–30 years old) who migrated during 2007–13.Source: Own data.
ARE RURAL YOUTH IN ETHIOPIA ABANDONING AGRICULTURE? 267
construction and service sector and to some extent in the man-ufacturing sector in urban areas. Success of relatives, friends,and other networks that have already migrated to the urbanareas typically serve as a strong positive signal for potentialmigrants. Moreover, a massive expansion in infrastructure,technology, and education in the last two decades also makethe cities increasingly more appealing to rural residents andparticularly to youth who may be more exposed to this infor-mation through the media and school. The expansion of well-serviced roads to district centers and in some cases to villagesas well as the absence of restrictions on labor movement, thatwere in place in previous regime, all contribute toward higherinterest and ability to migrate to urban areas now than before.
5. EMPIRICAL APPROACH
To analyze the determinants of livelihood choice, weestimated a multinomial logit model based on the familiarrandom utility framework (Maddala, 1983). The responseprobabilities for our multinomial logit model with four alter-natives can be given as,
prðy ¼ j=xÞ ¼expðXbjÞ
1þP4
j¼1 expðXbjÞh i ; j ¼ 1; . . . 4
where j denotes the alternative livelihoods that include: Agri-culture; Off-farm wage employment; Off-farm self employ-ment; and Urban salaried employment. X is a vector thatdenotes factors that influence the livelihood choice of youth.The coefficients on these explanatory variables differ for eachalternative. The factors that are expected to influence liveli-hood choice of the youth include both individual level factorsand household level factors. The individual level factors arecharacteristics of youth (age, gender, marital status, birthrank, whether the youth is a student), and endowment of theyouth. Endowment of the youth include own human capitalsuch as education as well as networks such as having relativesin the non-agricultural livelihood. The household factorsinclude land holdings, wealth, age, and education of thehousehold head, and demographics. In addition we includeddistrict dummies to control for local variations in availableopportunities and constraints. These local variations includedifferences in agro-ecology, population pressure, and accessto infrastructure and information. The main hypothesis wewant to test is whether land access influence livelihood choiceof youth. As the law prohibits the sale and purchase of landand restricts land rent, the most important source of landaccess is parents’ land which may be inherited or shared.Potential land access is captured by the variable ‘householdland holding per own child’. 8 We hypothesize that youthwho have good land access are more likely to choose agricul-tural livelihood.
To analyze migration among the youth and adolescent, weestimated a probit model of migration outcome. We have dataon all youth and adolescents who were 10–30 years in 2007.We then have another set of data from 2013 that reports whichof these young people have migrated in the six years. The pro-bit model estimates the probability of migration and exploresfactors that explain the migration outcome. We use the 2007data to estimate the model. The dependent variable is a binaryvariable that takes the value one if the youth migrated (basedon information from the 2013 survey) and zero otherwise. Theexplanatory variables are largely similar to those in the multi-nomial model of livelihood choice but we did not include indi-viduals’ network as such data were not collected in 2007. Ourmain hypothesis in this migration model is that youth whobelong to households with larger land holdings are less likelyto migrate than those youth from land poor households.
6. RESULTS AND DISCUSSION
(a) Livelihood choice
We estimated two models to assess the correlations betweenindividual and household characteristics and livelihoodchoices. The first model includes individual characteristics ofthe youth, farm holdings, and household characteristics. Thesefactors are expected to influence the relative return from andpreference for agricultural and non-agricultural livelihoods.The second model includes additional variables that show sib-lings’ involvement in local non-agricultural activities andmigration as these also may affect the youth information, net-work, experience, and motivation. The second model alsoincludes district dummies to test if livelihood choice differsby place of residence in rural areas. The district dummies alsocontrol for different access to infrastructure, information, andagro-ecological conditions. Because we have more than oneyouth per household, the standard errors are corrected forclustering at the household level. Table 12 reports the resultsfrom the models. Agriculture is the reference livelihood cate-gory in the reported model. The likelihood statistics show thatthe inclusion of the additional factors in the second modelimproves the explanatory power of the models. The resultsare otherwise largely consistent across the two models.
The coefficients in a multinomial model are calculated andreported in relation to the base outcome and thus not easyto interpret directly like the linear models (Wooldridge,2002). However, the signs are informative and, in addition,average marginal effects can be predicted, which also provideuseful insights. Farm size has a consistently negative and sta-tistically significant correlation with choice of livelihood out-side of agriculture. An increase in parent farm size decreasesthe likelihood of young men and women choosing a livelihoodoutside of agriculture relative to farming. This indicates that

Table 12. Multinomial models of determinants of livelihood choice by female and male youth in Southern Ethiopia
Off-farm wage employment Off-farm self employmentand business
Urban salariedemployment
Variables Model 1 Model 2 Model 1 Model 2 Model 1 Model 2
Female youth �0.333 0.087 0.306 0.491 0.740* 0.950**
(0.70) (0.74) (0.41) (0.43) (0.40) (0.43)Age �0.108 �0.144 �0.013 �0.031 �0.087 �0.100
(0.11) (0.11) (0.06) (0.06) (0.06) (0.07)Education (years) 0.265 0.362* 0.067 0.116* 0.229**** 0.274****
(0.18) (0.19) (0.05) (0.06) (0.06) (0.07)Currently student 0.930 1.303 �0.108 0.131 1.872**** 2.298****
(0.92) (1.06) (0.43) (0.44) (0.44) (0.46)First born �14.213**** �15.475**** �0.416 �0.283 �0.175 �0.087
(0.48) (0.52) (0.42) (0.44) (0.42) (0.44)Married �0.927 �0.650 �0.661 �0.459 �1.384*** �1.159**
(1.02) (0.96) (0.45) (0.45) (0.50) (0.53)Farm size per own child (in hectares) �5.329* �7.559* �2.691*** �2.616*** �2.205*** �2.703***
(2.99) (4.35) (0.86) (0.86) (0.70) (0.91)Age of household head �0.019 �0.005 0.003 0.007 0.007 0.013
(0.02) (0.02) (0.01) (0.01) (0.01) (0.01)Education of household head (years) 0.127 0.072 �0.080 �0.112* �0.010 �0.054
(0.11) (0.11) (0.05) (0.06) (0.06) (0.07)Number of brothers and sisters �0.001 0.028 0.030 0.037 0.035 0.051
(0.13) (0.16) (0.09) (0.09) (0.09) (0.09)Livestock holding (tlu) �0.004 �0.069 �0.025 �0.012 0.006 0.002
(0.05) (0.11) (0.04) (0.04) (0.03) (0.03)Value of assets owned �1.074** �1.018** 0.155 0.311 �0.037 0.119
(0.45) (0.44) (0.15) (0.21) (0.16) (0.21)Number of siblings migrated �0.362 �0.112 �0.175
(0.34) (0.17) (0.16)Number of siblings in business �0.173 0.739** 0.568
(0.86) (0.37) (0.38)Number of siblings in nonfarm employment 0.436 0.054 �0.088
(0.59) (0.17) (0.18)Arsi Negelle 1.825 1.088** 1.654***
(1.39) (0.54) (0.51)Wondo-Oromia 3.618* 0.527 1.598**
(2.09) (0.63) (0.64)Wondo Genet �14.682**** 0.448 0.349
(1.30) (0.59) (0.64)Damot Sore (Wollaita) 2.408** 1.701*** 2.030***
(1.14) (0.60) (0.65)Constant 8.005** 6.141 0.502 �1.929 0.804 �1.884
(3.57) (4.15) (1.62) (1.93) (1.77) (2.06)Prob > chi2 0.000 0.000 0.000Loglikelihood �472.458 �407.336 �400.825Number of Obs. 566 535 535
Note: The reference livelihood strategy (base outcome) is agriculture. The reported values are coefficients followed by standard errors in parenthesis.Significance levels: *: 10%, **: 5%, ***: 1%, ****: 0.1%.
268 WORLD DEVELOPMENT
an important factor driving rural youth away from farming isthe lack of land access. The average marginal effect of chang-ing the covariates on the probability of choosing farming as alivelihood is shown in Table 13. The results show that a 1%reduction in per capita farm size is associated with a 0.05decline in the probability of youth choosing farming as theirlivelihood. Accordingly, youth from land-poor householdsare less likely to show interest in agricultural livelihood.
Compared to their male counterparts, young women aremore likely to choose urban salaried employment thanfarming. This is perhaps due to the cultural influence because,in most parts of Ethiopia, agriculture is typically a man’sdomain. Furthermore, women and girls are less likely toinherit land from their parents, which limits their access tothe basic resource for an agricultural livelihood. Controlling
for the age factor, respondents who are currently studyingare more likely to choose urban, salaried employment thanthose who are no longer students. This may be because thosewho are still attending school have higher hopes of achievingtheir objectives through education than those who are nolonger pursuing an education. More education, captured inthe number of successfully completed grades, increases thelikelihood of choosing urban salaried employment. This is per-haps because, in addition to the impact of information onone’s interest, an increase in educational achievementincreases one’s expectation of success in the urban sector. Edu-cation is also positively correlated with the likelihood ofchoosing off-farm wage employment and business, but thecoefficients are significant only at the 10% level. The positivecorrelation between education and non-farm employment is

Table 13. Average marginal effects of covariates on the probability of choosing farming as a livelihood strategy
dy/ex Delta method P > z
Std. Err. z
Female youth �0.015 0.007 �2.210 0.027
Age 0.092 0.090 1.030 0.304Education (years) �0.093 0.026 �3.550 0.000
Currently student �0.054 0.011 �4.840 0.000
First born 0.003 0.008 0.440 0.662Married 0.012 0.010 1.250 0.213Farm size per own child (in hectares) 0.047 0.014 3.300 0.001
Age of household head �0.034 0.031 �1.120 0.265Education of household head (years) 0.017 0.015 1.140 0.252Number of brothers and sisters �0.022 0.042 �0.510 0.607Livestock holding (tlu) 0.002 0.007 0.210 0.835Value of asset owned �0.104 0.104 �1.000 0.320Arsi Negelle �0.028 0.007 �3.790 0.000
Wondo-Oromia �0.005 0.002 �2.620 0.009
Wondo Genet �0.008 0.010 �0.750 0.453Damot Sore �0.017 0.004 �4.070 0.000
Number of siblings migrated 0.009 0.011 0.780 0.438Number of siblings in business �0.007 0.002 �3.850 0.000
Number of siblings in nonfarm employment 0.000 0.004 �0.050 0.964
Bold values indicate statistically significant correlation in the regression.
ARE RURAL YOUTH IN ETHIOPIA ABANDONING AGRICULTURE? 269
one of the most consistent relations found in the literature(see, for example, Reardon, 1997; Reardon et al., 2001;Winters et al., 2009).
While first-born children are less likely to engage in off-farmwage employment in relation to farming, this does not affecttheir decision concerning other livelihoods. This is becausefirst-born children are more likely to inherit land, and hence,they may prefer to work in farming rather than in off-farmwage employment, pointing toward a lack of land access asa push factor to engage in less attractive off-farm, low-wageemployment. Married youth are less likely to choose urbansalaried employment as a livelihood option, perhaps becausemarried people have family responsibilities and are thereforemore likely to settle for what is available in the village. Mar-riage is often also associated with obtaining land from parents.Marital status also has a negative correlation with off-farmbusiness, though it is statistically significant only at 10%.
Household characteristics, other than assets owned, have lit-tle effect on livelihood choice. The value of assets owned by thehousehold to which the young person belongs is negativelycorrelated with the likelihood of choosing off-farm wageemployment as a livelihood. This may indicate that youthfrom more financially stable households see agriculture as bet-ter paying than off-farm wage employment. We also foundthat having brothers and sisters who are engaged in businessis positively correlated with the likelihood of choosing off-farmself-employment, indicative of the impact of information aswell as capital access.
Spatial variations also exist such that, compared toShashemene, young people from Arsi Negelle and Damot Sorewere more likely to choose off-farm business and salariedemployment over farming. This may be an indication that farm-ing activity in Shashemene is more rewarding than it is in theother two districts or that it is easier to combine farming withnon-farm activities near this small market town. Farming inDamot Sore is subsistence oriented and farm size in the area isvery small. While farms in Arsi Negelle are, on average, largerthan those in other areas, some of the villages have been foodinsecure in the past, indicating higher rainfall and poorer per-formance of agriculture. Youth in Wondo Genet were less likely
to choose off-farm wage employment over farming, which is tobe expected because Wondo Genet is a cash crop productionarea where agriculture yields higher returns than off-farm wageemployment. However, young people in Damot Sore are morelikely to choose off-farm wage employment due to the higherlevel of poverty, severe land scarcity and, therefore, a strongerpush toward low-paying, off-farm livelihood opportunities.
In summary, it appears that young people choose unskilledoff-farm wage employment if their condition is more desperatebecause of the lack of land access and viable livelihood oppor-tunities (push factors), while urban salaried employment seemsto be an attractive opportunity for those with the resources,education, and flexibility to explore such opportunities (pullfactors). This is consistent with findings in the income diversi-fication literature, which documents that participation inunskilled off-farm wage employment is driven by poor perfor-mance and risk in the agricultural sector (see Reardon, 1997).
(b) Determinants of migration
Table 14 reports results from a probit model of migrationoutcome. The first column reports results from a regressionmodel that includes only individual and household level deter-minants. The second column shows results from a model thatfurther includes the district dummies, as these results capturemeso-level determinants such as infrastructure, market access,population pressure, and agro-ecology. A third model includesthe interaction terms between farm size and district dummiesto test if farm size has varying impacts across districts. Theresults of this model are reported in column three.
We found that education is a strong driver of youth migra-tion. Education level is strongly positively associated withmigration. Education brings information about opportunitiesoutside of one’s immediate surroundings and raises expecta-tions for a better life, thereby encouraging youth to explorenew opportunities. The coefficient for farm size is negativeand highly statistically significant in the first model. This indi-cates that households with smaller farm sizes are more likelyto see their youth members migrate. However, the significancedisappears when we include district dummies, although it still

Table 14. Factors associated with household member migration decisions
Model 1 Model 2 Model 3
Female youth �0.024 0.010 0.008�0.090 �0.090 �0.090
Age �0.016 �0.037 �0.039�0.070 �0.070 �0.070
Age, squared 0.001 0.001 0.0010.000 0.000 0.000
Education level 0.103**** 0.110**** 0.112****
�0.020 �0.020 �0.020Ln (Farm size), ha �0.165*** �0.030 0.187
�0.060 �0.070 �0.150Female headed �0.256 �0.243 �0.249
�0.180 �0.180 �0.180Age of Household head �0.007 �0.003 �0.003
�0.010 �0.010 �0.010Education household head �0.008 �0.005 �0.003
�0.020 �0.020 �0.020Male work force �0.016 0.011 0.010
�0.040 �0.040 �0.040Female work force �0.033 �0.022 �0.015
�0.050 �0.050 �0.060Household size 0.039* 0.017 0.020
�0.020 �0.030 �0.030Livestock (in tlu) �0.048*** �0.029** �0.028**
�0.020 �0.010 �0.010
District dummies: Baseline = Shashemene
Arsi Negelle 0.365** 0.442**
�0.180 �0.200Wondo Oromia �0.428 �0.350
�0.400 �0.400Wondo Genet �0.073 0.247
�0.240 �0.260Damot Sore (Wollaita) 1.102**** 1.079****
�0.180 �0.200Arsi Negelle X Ln (farm size) �0.271
�0.200Wondo Oromia X Ln (farmsize) 0.052
�0.310Wondo Genet X Ln (farmsize) 0.039
�0.230Damot Sore X Ln (farm size) �0.317*
�0.180Constant �1.206* �1.731** �1.845***
�0.630 �0.680 �0.690Prob > chi2 0.000 0.000 0.000Loglikelihood �541 �486 �483Number of observations 1393 1393 1393
Note: Probit estimates of migration decision for adolescents and youth(age > 10 & < 30) 2007–13. Standard errors corrected for clustering athousehold level. Significance levels: *: 10%, **: 5%, ***: 1%, ****: 0.1%.
270 WORLD DEVELOPMENT
has a negative sign. This is perhaps because farm sizes arestrongly correlated with the district dummies. Particularly,the Damot Sore district dummy is likely to capture much ofthe farm size effect. The third model includes an interactionvariable to test whether farm size has varying impacts acrossdistricts. Land size is negatively correlated to migration inDamot Sore, where migration probability is the highest. How-ever, it is significant only at a 10% level of significance. We seethat livestock-poor households are more likely to have migrat-ing youth members. This may imply that resource poverty is apush factor as livestock is an indicator of wealth. Livestock isalso one of the things that link youth to the land through theuse of oxen for ploughing, livestock herding, and/or the sale oflivestock products.
7. CONCLUSIONS
In a country where almost six out of ten farm householdscultivate less than one hectare of land, a growing youth pop-ulation in rural areas poses a challenge in terms of ensuringaccess to land and to a livelihood. This study examines landaccess and livelihood choice of rural youth in SouthernEthiopia.
Although Ethiopia’s constitution formally guarantees youthrights to rural land if they wish to establish a livelihood inagriculture, the practical applicability of this formal rightdepends on the availability of local land, inheritance customs,and local administrative processes for land allocation. Wefound that youth in rural areas in Southern Ethiopia facesevere land access constraints. Land cannot be bought in themarket and cannot be rented on a long-term basis from otherfarmers. Furthermore, as local authorities do not have unoc-cupied land to allocate, they cannot provide the youth withtheir constitutional right to land. As a consequence, parentshave become the major source of farmland. However, the landthat can be obtained from parents through inheritance is toosmall to establish a meaningful livelihood for a rapidlyincreasing share of the rural youth.
As a result of the lack of land access, youth are lookingtoward other livelihood options. Only 9% of the youth inour sample chose agricultural as their future livelihood whilethe others plan non-agricultural employment. However,other alternative employment opportunities are currentlyvery limited. On the other hand, the recent expansion ofthe service sector and construction industries in urban areasof Ethiopia, alongside better access to infrastructure andinformation in rural areas created a strong pull towardurban areas. We found that youth migration has signifi-cantly increased in the last six years, especially in the mostdensely populated study areas with poor market access. Thiswas spontaneous migration by the youth themselves andwas not a result of publicly organized activities or policies.The econometric analysis of livelihood choice and migrationshows that the lack of land access is an important driverthat pushes youth out of the traditional agricultural liveli-hood.
Youth unemployment is a growing international challenge.We provide new evidence of a very rapid transition of youthlivelihood strategies in rural Ethiopia. Inability to addressthese land and livelihood access problems may result insocial and economic crises not only in rural areas but alsoin urban areas where a rapidly increasing number of youthmigrate.
Some of the measures that can be taken to ameliorate the sit-uation include: improving non-farm employment opportunitiesin rural areas through youth-targeted employment-generatingschemes and entrepreneurial trainings; relaxation of therestriction on land rental markets; and provision of group landaccess to the youth for high-value crop cultivation and livestockproduction. In addition, the land laws should be revised toensure sustainable and equitable land access instead of a rightthat cannot be fulfilled. Even if the land access and employmentproblems are solved in rural areas, a significant amount ofrural–urban migration is perhaps unavoidable since Ethiopiastill has a very small share of its population in urban areasand urbanization typically involves significant rural–urbanmigration. Ethiopia may avoid the negative consequences oflarge-scale rural–urban migration if programs are designed tostudy migration patterns, prepare for it, and influence itsdirection.

ARE RURAL YOUTH IN ETHIOPIA ABANDONING AGRICULTURE? 271
NOTES
1. There is no globally agreed upon definition of youth. The UN definesyouth as persons in the age group 15–24. The African Youth Charterdefines youth as persons in the age group 15–35 (UN, 2014). In this paperwe define youth as persons between the ages of 15 and 29. This is based onthe definition of youth used in the Ethiopia’s National Youth Policy(FDRE, 2004).
2. Because the survey was combined with field experiments on trustamong siblings, youth who had no sibling in the same age group (15–29)were not included in the sample.
3. For the new sample (40 households), we used recall data, first byasking who lived in that household in 2007 and then collecting currentinformation on each of those members. To be consistent, we used the samemethod for households who were in the sample in 2007, but in this case, wehave the list of members from the 2007 survey, which we used for cross-checking. As a result of this cross checking, we were able to determine thatparents in Wollaita tend to omit daughters from their list of offspring/children, especially if they were married even if they lived with them in2007.
4. Historically, household heads are men who brought the land into themarriage and under whom the land is registered. The exception is female-
headed households. However, with the recently introduced joint landcertification, the household head is not the ‘land holder’ of the family land,as spouses are jointly registered.
5. Note however that households in the Oromo ethnic group in oursample have higher land holdings than the Sidama and Wollaitahouseholds.
6. If we were to generalize this rate for the country’s rural youth andadolescent population, the figures are staggering. Close to 17 millionyoung people in Ethiopia may move to urban areas and establish theirlivelihood there in the next few years. Our sample is not nationallyrepresentative.
7. In 2012, Ethiopia was the 12th fastest growing economy in the Worldand in the 2004–05 to 2011–12 period. Ethiopia’s economy grew at 10.6%,higher than the regional average of 5.4% (Geiger & Moller, 2013).
8. While a household may contain members other than own children andparents, it is not possible from these data to identify those members whoare long-term members that may have similar land inheritance ‘right’ toown children. Since short-term residents are not likely to inherit/shareland of the household, we used land holding/own children to denote theland that the youth may receive from parents.
REFERENCES
Barrett, C. B., Reardon, T., & Webb, P. (2001). Nonfarm incomediversification and household livelihood strategies in rural Africa:Concepts, dynamics, and policy implications. Food Policy, 26(4),315–331.
Becker, G. S. (1965). A theory of the allocation of time. The EconomicJournal, 75(299), 493–517.
Bezu, S., Barrett, C. B., & Holden, S. T. (2012). Does the nonfarmeconomy offer pathways for upward mobility? Evidence from apanel data study in Ethiopia. World Development, 40(8),1634–1646.
Binswanger, H. P., & Rosenzweig, M. R. (1986). Behavioural and materialdeterminants of production relations in agriculture. The Journal ofDevelopment Studies, 22(3), 503–539.
Bryceson, D. F. (1996). Deagrarianization and rural employment in sub-Saharan Africa: A sectoral perspective. World Development, 24(1),97–111.
Bryceson, D. F. (2002). The scramble in Africa: Reorienting rurallivelihoods. World Development, 30(5), 725–739.
Bryceson, D. F., & Jamal, V. (1997). Farewell to farms: De-agrarianisationand employment in Africa. Ashgate Publishing Ltd..
CSAICF. (2012). Ethiopia demographic and health survey 2011. AddisAbaba, Ethiopia and Calverton, Maryland, USA: Central StatisticalAgency and ICF International.
CSA. (2012a). Agricultural sample survey 2011/2012, Volume IV: ReportOn Land Utilization. Addis Ababa, Ethiopia: Central StatisticalAgency.
CSA. (2012b). Household income, consumption and expenditure (HICE)survey 2010/11: Analytical report. Statistical Bulletin: Central Statis-tical Agency of Ethiopia.
CSA. (2013a). National statistics abstract. Addis Ababa, Ethiopia: CentralStatistical Agency.
CSA. (2013b). Report of the inter censal population survey. Addis Ababa:Central Statistical Agency.
Deininger, K., & Jin, S. (2006). Tenure security and land-relatedinvestment: Evidence from Ethiopia. European Economic Review, 50,1245–1277.
Ellis, F. (1998). Household strategies and rural livelihood diversification.Journal of Development Studies, 35(1), 1–38.
Ellis, F. (2000). Rural livelihoods and diversity in developing countries.Oxford: Oxford University Press.
FDRE. (2004). National youth policy. Addis Ababa, Federal DemocraticRepublic of Ethiopia.
FDRE. (2005). Federal rural land administration and utilisation procla-mation. Federal Democratic Republic of Ethiopia.
FDRE. (2008). Summary and statistical report of the 2007 population andhousing census. Federal Democratic Republic of Ethiopia: PopulationCensus Commission.
Geiger, M., & Moller, L. C. (2013). Ethiopia – Second economic update:Laying the foundation for achieving middle income status. Washington,DC: World Bank Group.
Haggblade, S., Hazell, P., & Reardon, T. (2007). Transforming the ruralnonfarm economy: Opportunities and threats in the developing world.Baltimore: Johns Hopkins University Press.
Holden, S., Shiferaw, B., & Pender, J. (2004). Non-farm income,household welfare, and sustainable land management in aless-favoured area in the Ethiopian highlands. Food Policy, 29(4),369–392.
ILO. (2013). Global employment trends for youth 2013: A generation at risk.Geneva: International Labour Office.
Holden, S. T., & Yohannes, H. (2002). Land redistribution, tenureinsecurity, and intensity of production: A study of farm households inSouthern Ethiopia. Land Economics, 78(4), 573–590.
Lanjouw, J. O., & Lanjouw, P. (2001). The rural non-farm sector: Issuesand evidence from developing countries. Agricultural Economics, 26(1),1–23.
Little, P. D., Stone, M. P., Mogues, T., Castro, A. P., & Negatu, W.(2006). ‘Moving in place’: Drought and poverty dynamics in SouthWollo, Ethiopia. The Journal of Development Studies, 42(2), 200–225.
Lundberg, S., & Pollak, R. A. (1993). Separate spheres bargaining and themarriage market. Journal of Political Economy, 988–1010.
Maddala, G. S. (1983). Limited-dependent and qualitative variables ineconometrics. Econometric Society monographs in quantitative econom-ics. Retrieved from WorldCat database.
Manser, M., & Brown, M. (1980). Marriage and household decision-making: A bargaining analysis. International Economic Review, 21(1),31–44.
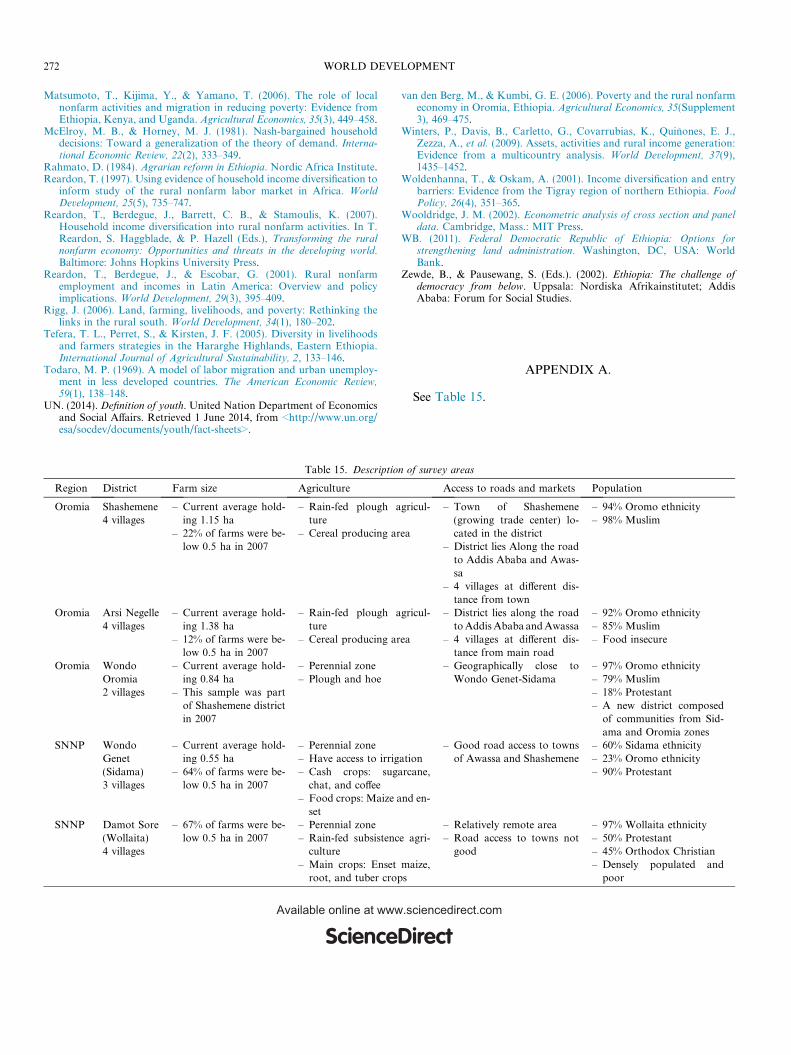
272 WORLD DEVELOPMENT
Matsumoto, T., Kijima, Y., & Yamano, T. (2006). The role of localnonfarm activities and migration in reducing poverty: Evidence fromEthiopia, Kenya, and Uganda. Agricultural Economics, 35(3), 449–458.
McElroy, M. B., & Horney, M. J. (1981). Nash-bargained householddecisions: Toward a generalization of the theory of demand. Interna-tional Economic Review, 22(2), 333–349.
Rahmato, D. (1984). Agrarian reform in Ethiopia. Nordic Africa Institute.Reardon, T. (1997). Using evidence of household income diversification to
inform study of the rural nonfarm labor market in Africa. WorldDevelopment, 25(5), 735–747.
Reardon, T., Berdegue, J., Barrett, C. B., & Stamoulis, K. (2007).Household income diversification into rural nonfarm activities. In T.Reardon, S. Haggblade, & P. Hazell (Eds.), Transforming the ruralnonfarm economy: Opportunities and threats in the developing world.Baltimore: Johns Hopkins University Press.
Reardon, T., Berdegue, J., & Escobar, G. (2001). Rural nonfarmemployment and incomes in Latin America: Overview and policyimplications. World Development, 29(3), 395–409.
Rigg, J. (2006). Land, farming, livelihoods, and poverty: Rethinking thelinks in the rural south. World Development, 34(1), 180–202.
Tefera, T. L., Perret, S., & Kirsten, J. F. (2005). Diversity in livelihoodsand farmers strategies in the Hararghe Highlands, Eastern Ethiopia.International Journal of Agricultural Sustainability, 2, 133–146.
Todaro, M. P. (1969). A model of labor migration and urban unemploy-ment in less developed countries. The American Economic Review,59(1), 138–148.
UN. (2014). Definition of youth. United Nation Department of Economicsand Social Affairs. Retrieved 1 June 2014, from <http://www.un.org/esa/socdev/documents/youth/fact-sheets>.
Table 15. Descriptio
Region District Farm size Agriculture
Oromia Shashemene – Current average hold-ing 1.15 ha
– 22% of farms were be-low 0.5 ha in 2007
– Rain-fed plough ature
– Cereal producing ar4 villages
Oromia Arsi Negelle – Current average hold-ing 1.38 ha
– 12% of farms were be-low 0.5 ha in 2007
– Rain-fed plough ature
– Cereal producing ar4 villages
Oromia WondoOromia
– Current average hold-ing 0.84 ha
– This sample was partof Shashemene districtin 2007
– Perennial zone– Plough and hoe
2 villages
SNNP WondoGenet(Sidama)
– Current average hold-ing 0.55 ha
– 64% of farms were be-low 0.5 ha in 2007
– Perennial zone– Have access to irrig– Cash crops: suga
chat, and coffee– Food crops: Maize a
set
3 villages
SNNP Damot Sore(Wollaita)
– 67% of farms were be-low 0.5 ha in 2007
– Perennial zone– Rain-fed subsistenc
culture– Main crops: Enset
root, and tuber crop
4 villages
van den Berg, M., & Kumbi, G. E. (2006). Poverty and the rural nonfarmeconomy in Oromia, Ethiopia. Agricultural Economics, 35(Supplement3), 469–475.
Winters, P., Davis, B., Carletto, G., Covarrubias, K., Quinones, E. J.,Zezza, A., et al. (2009). Assets, activities and rural income generation:Evidence from a multicountry analysis. World Development, 37(9),1435–1452.
Woldenhanna, T., & Oskam, A. (2001). Income diversification and entrybarriers: Evidence from the Tigray region of northern Ethiopia. FoodPolicy, 26(4), 351–365.
Wooldridge, J. M. (2002). Econometric analysis of cross section and paneldata. Cambridge, Mass.: MIT Press.
WB. (2011). Federal Democratic Republic of Ethiopia: Options forstrengthening land administration. Washington, DC, USA: WorldBank.
Zewde, B., & Pausewang, S. (Eds.). (2002). Ethiopia: The challenge ofdemocracy from below. Uppsala: Nordiska Afrikainstitutet; AddisAbaba: Forum for Social Studies.
APPENDIX A.
See Table 15.
n of survey areas
Access to roads and markets Population
gricul-
ea
– Town of Shashemene(growing trade center) lo-cated in the district
– District lies Along the roadto Addis Ababa and Awas-sa
– 4 villages at different dis-tance from town
– 94% Oromo ethnicity– 98% Muslim
gricul-
ea
– District lies along the roadto Addis Ababa and Awassa
– 4 villages at different dis-tance from main road
– 92% Oromo ethnicity– 85% Muslim– Food insecure
– Geographically close toWondo Genet-Sidama
– 97% Oromo ethnicity– 79% Muslim– 18% Protestant– A new district composed
of communities from Sid-ama and Oromia zones
ationrcane,
nd en-
– Good road access to townsof Awassa and Shashemene
– 60% Sidama ethnicity– 23% Oromo ethnicity– 90% Protestant
e agri-
maize,s
– Relatively remote area– Road access to towns not
good
– 97% Wollaita ethnicity– 50% Protestant– 45% Orthodox Christian– Densely populated and
poor
ScienceDirectAvailable online at www.sciencedirect.com