LOW COST REAL-TIME MEASUREMENT OF THE ECG ...
7
The Eurasia Proceedings of Educational & Social Sciences (EPESS) ISSN: 2587-1730 - This is an Open Access article distributed under the terms of the Creative Commons Attribution-Noncommercial 4.0 Unported License, permitting all non-commercial use, distribution, and reproduction in any medium, provided the original work is properly cited. - Selection and peer-review under responsibility of the Organizing Committee of the conference *Corresponding author: Samet Ciklacandir - E-mail: Email: [email protected] © 2017 Published by ISRES Publishing: www.isres.org The Eurasia Proceedings of Educational & Social Sciences (EPESS), 2017 Volume 7, Pages 162-168 ICRES 2017: International Conference on Research in Education and Science LOW COST REAL-TIME MEASUREMENT OF THE ECG, SPO 2 AND TEMPERATURE SIGNALS IN THE LABVIEW ENVIRONMENT FOR BIOMEDICAL TECHNOLOGIES EDUCATION Samet Ciklacandir Department of Biomedical Engineering, Izmir Katip Celebi University Naciye Mulayim Department of Biomedical Engineering, Izmir Katip Celebi University Savas Sahin Department of Electrical and Electronic Engineering, Izmir Katip Celebi University Abstract: Electrocardiography (ECG) is to measure the electrical activity of the heart. Doctors diagnose various cardiac diseases by analyzing this signal. The ECG signal is one of the best diagnostic devices for heart diseases. The purpose of this work is to display the ECG signal in the LabVIEW (Laboratory Virtual Instrument Engineering Workbench) environment. Lowering the cost by designing your own ECG circuit. The program can also easily process the ECG signal in various ways. There is no need to setup any electronic circuit. In addition to the ECG signal, modules with pulse oximeter and temperature indicating oxygen saturation are added. In this study, low cost ECG, temperature and pulse measurements were performed in our own laboratory environment. The measurement circuit was communicated with the LabVIEW program via Arduino. The data received with Arduino is shown after processing in the LabVIEW environment. The program also shows the patient's heart rate and alerts when the patient enters a heart attack. Keywords: Real-Time Electrocardiography (ECG), temperature, pulse oximeter, LabVIEW, biomedical technologies education. Introduction Electrocardiography (ECG) is the process of recording the electrical activity of the heart over a period of time using electrodes placed on the skin. These electrodes detect the tiny electrical changes on the skin. It is a very commonly performed cardiology test. This signal can be used to diagnose heart diseases. But it is difficult to design this measurement system. Because in the conventional method, the electrical signal is picked up by wired electrodes. The electrodes sense the voltage at the mV level. The ECG signal is very small volts, so it is easy to signal the noise. Noise problems arise in cable ECGs. Various filters must be used to prevent this noise. The filtering process may be hardware and software. In this study, both hardware and programmatically filter added. But programmatically adding filters is better because many parameters can be changed. Thus reducing cost by eliminating the need for electronic devices such as capacitors and resistors. Pulse oximeters measure how much of the hemoglobin in blood is carrying oxygen (oxygen saturation). It has become one of the indispensable devices especially in anesthesia and intensive care units. Normal oxygen saturation level is between 95% and 100%. The device includes a light source and a light sensor. This sensor can be easily measured by a finger the apparatus. The sensor uses its color to detect the blood oxygen ratio. Two different wavelengths of light are sent to the finger using infrared led and red led. The difference of these waves received by the photodetector gives oxygen saturation. In addition, pulse measurements are made. Temperature is an important parameter for diagnosis. The temperature varies depending on the disease. Temperature measurement is done in this system. These three parameters are very important for the health of the person. In this study, ECG, Temperature and SpO 2 (Pulse) circuits were integrated into the Arduino. The received data was displayed in the LabVIEW environment.
-
Upload
khangminh22 -
Category
Documents
-
view
1 -
download
0
Transcript of LOW COST REAL-TIME MEASUREMENT OF THE ECG ...

The Eurasia Proceedings of Educational & Social Sciences (EPESS)
ISSN: 2587-1730
- This is an Open Access article distributed under the terms of the Creative Commons Attribution-Noncommercial 4.0 Unported License, permitting all non-commercial use, distribution, and reproduction in any medium, provided the original work is properly cited.
- Selection and peer-review under responsibility of the Organizing Committee of the conference
*Corresponding author: Samet Ciklacandir - E-mail: Email: [email protected]
© 2017 Published by ISRES Publishing: www.isres.org
The Eurasia Proceedings of Educational & Social Sciences (EPESS), 2017
Volume 7, Pages 162-168
ICRES 2017: International Conference on Research in Education and Science
LOW COST REAL-TIME MEASUREMENT OF THE ECG, SPO2 AND
TEMPERATURE SIGNALS IN THE LABVIEW ENVIRONMENT FOR
BIOMEDICAL TECHNOLOGIES EDUCATION
Samet Ciklacandir
Department of Biomedical Engineering, Izmir Katip Celebi University
Naciye Mulayim
Department of Biomedical Engineering, Izmir Katip Celebi University
Savas Sahin
Department of Electrical and Electronic Engineering, Izmir Katip Celebi University
Abstract: Electrocardiography (ECG) is to measure the electrical activity of the heart. Doctors diagnose
various cardiac diseases by analyzing this signal. The ECG signal is one of the best diagnostic devices for heart
diseases. The purpose of this work is to display the ECG signal in the LabVIEW (Laboratory Virtual Instrument
Engineering Workbench) environment. Lowering the cost by designing your own ECG circuit. The program can
also easily process the ECG signal in various ways. There is no need to setup any electronic circuit. In addition
to the ECG signal, modules with pulse oximeter and temperature indicating oxygen saturation are added. In this
study, low cost ECG, temperature and pulse measurements were performed in our own laboratory environment.
The measurement circuit was communicated with the LabVIEW program via Arduino. The data received with
Arduino is shown after processing in the LabVIEW environment. The program also shows the patient's heart rate
and alerts when the patient enters a heart attack.
Keywords: Real-Time Electrocardiography (ECG), temperature, pulse oximeter, LabVIEW, biomedical
technologies education.
Introduction
Electrocardiography (ECG) is the process of recording the electrical activity of the heart over a period of time
using electrodes placed on the skin. These electrodes detect the tiny electrical changes on the skin. It is a very
commonly performed cardiology test. This signal can be used to diagnose heart diseases. But it is difficult to
design this measurement system. Because in the conventional method, the electrical signal is picked up by wired
electrodes. The electrodes sense the voltage at the mV level. The ECG signal is very small volts, so it is easy to
signal the noise. Noise problems arise in cable ECGs. Various filters must be used to prevent this noise. The
filtering process may be hardware and software. In this study, both hardware and programmatically filter added. But programmatically adding filters is better because many parameters can be changed. Thus reducing cost by
eliminating the need for electronic devices such as capacitors and resistors.
Pulse oximeters measure how much of the hemoglobin in blood is carrying oxygen (oxygen saturation). It has
become one of the indispensable devices especially in anesthesia and intensive care units. Normal oxygen
saturation level is between 95% and 100%. The device includes a light source and a light sensor. This sensor can
be easily measured by a finger the apparatus. The sensor uses its color to detect the blood oxygen ratio. Two
different wavelengths of light are sent to the finger using infrared led and red led. The difference of these waves
received by the photodetector gives oxygen saturation. In addition, pulse measurements are made.
Temperature is an important parameter for diagnosis. The temperature varies depending on the disease.
Temperature measurement is done in this system. These three parameters are very important for the health of the
person. In this study, ECG, Temperature and SpO2 (Pulse) circuits were integrated into the Arduino. The
received data was displayed in the LabVIEW environment.

International Conference on Research in Education and Science (ICRES), May 18 - 21, 2017 Ephesus-Kusadasi/Turkey
163
ECG signal is shown in biomedical education in the course of instrumentation. Biomedical signal processing
course contains these signals. It is important to learn this signal for biomedical engineers. ECG devices are
usually used in biomedical engineering education laboratories. Because the devices are developed, maintained
and repaired by biomedical engineers. The instrument is also calibrated by biomedical engineers. But this device
is very expensive. In this study, it was developed a low cost real time ECG, Temperature and SpO2 data
acquisition system. It is clear that personal computer based signal acquisition and analysis is an effective and cost-effective method
for patient biomedical signal acquisition and monitoring.
There are many software packages available for the acquisition and display of electrical signals in general. Of
these packages LabVIEW, by National Instruments, is one of the most popular and powerful tools available.
Therefore, this study was planned to be done with LabVIEW program in computer environment.
Materials & Methods
1-ECG Circuit Designing
Cell ion exchange generates small voltage. This signal is at millivolt level. First the signal is picked up by the
electrodes. Then this signal is amplified. The INA129 integrated was used to design the circuit that received the
ECG signal. This is an op-amp to boost the integrated low voltage.
Figure 1 INA129 Functional Diagram
Figure 2 INA129 Gain Ratios
This system used 100 gain ratios. A resistance of about 560Ω was used. It was tried to clean up the signal using
the low pass filter because it contains amplified signal noise. The frequency of the ECG signal is between 0 and
150Hz. Band Pass filter is used to prevent noises. Then the signal is amplified again.
Figure 3. Low pass filter circuit
Band-reject filter was used to clean the noise. A noise-free ECG was obtained using a final filter to prevent the
latest 50Hz network noise.

International Conference on Research in Education and Science (ICRES), May 18 - 21, 2017 Ephesus-Kusadasi/Turkey
164
Figure 4 Block diagram of ECG measurement circuit
Figure 5 ECG signal is displayed as seen in the oscilloscope.
1-Pulse Oximeter and Temperature Circuit Designing
The pulse oximeter (SpO2) circuit and the temperature circuit were designed. A simple outer mold for the finger
probe was prepared. It was drawn in the SolidWorks program. A ring-type probe is designed for a completely
wrapped finger and for the passage of rays. A compact and comfortable design for the shape of the fingers was
considered.
Figure 6. Finger probe design in solidworks Figure 7. Finger probe printed in 3D printer
Figure 8 Probe with integrated circuit and leds

International Conference on Research in Education and Science (ICRES), May 18 - 21, 2017 Ephesus-Kusadasi/Turkey
165
Figure 9. Pulse oximeter circuit
In designing of pulse oximeter sensor, two types of leds were used. One of them is red led, the other is
transmitter led. Pulse oximetry uses light to work out oxygen saturation. Light is emitted from light sources
which goes across the pulse oximeter probe and reaches the light detector. Finger is sent rays. If a finger is
placed in between the light source and the light detector, the light will have to pass through the finger to reach
the detector. Part of the light will be absorbed by the finger and the part not absorbed reaches the light detector.
The received analog data was amplified. For this, two LM324 op-amps were used.
The LM35 sensor was used for temperature measurement. Measurement was taken from the finger. Temperature
information was obtained as analog data.
Figure 10 LM35 Temperature sensor
1-Communication with Arduino
Arduino is a microcontroller card. It is a small fast and practical control card. But the received data was between
-2.5V and + 2.5V. The Arduino's ADC converts between 0 and 5 V. So a DC level shifter circuit was used. This
circuit is shown in figure 6. It carried the incoming signal between 0-5 v. The level shifted signal is shown in
figure 12. Three analog data, ECG, pulse and temperature, were taken by Arduino. The received data was
processed and made ready for LabVIEW. Also the buzzer was added for the audible warning. The buzzer will
sound when the temperature rises excessively or the heart rhythm becomes irregular.
Figure 11. DC level shifter circuit
Figure 12. Level shifting a +/- 2.5V signal to 0 - 5V
1-LabVIEW program communication with Arduino
LabVIEW is a kind of programming language. Visual programming is done via LabVIEW. The difference from
c is that the codes are processed in parallel instead of serial. This program communication with Arduino was
provided by serial port method. The received analog data was graphically displayed in the LabVIEW interface.

International Conference on Research in Education and Science (ICRES), May 18 - 21, 2017 Ephesus-Kusadasi/Turkey
166
As a result, ECG, SpO2 and temperature data were displayed in a computer environment. Arduino toolkit was
installed from VI Package Manager. VI is the tool setup program in LabVIEW itself. This tool facilitates the visa
protocol between Arduino and LabVIEW.
Figure 13. VI Package manager
Figure 14. Biomedical toolkit was installed from VI Package manager
Biomedical toolkit allows many signals to be processed and adjusted. For example it can make ECG simulations.
USB port must be set to connect to the Arduino. Then the baud rate and Arduino type should be entered. A baud
rate of 9600 was considered adequate. It should be notified that the connection will be USB or wireless. XBee is
required for wireless connection. XBee is a kind of module that can be integrated into the Arduino. After these
settings the Arduino can be connected to the LabVIEW. It is shown in figure 15.
Figure 15 Various setting parts for Arduino and LabVIEW in communication
Human temperature is normally 36.5 degrees. If the temperature rises above 38 degrees, it is given a warning.
And also the buzzer sounds when there is a warning. In addition, the program can simulate the ECG signal. Many parameters can be set for this signal. The benefit of this simulator is that students learn the signal in many
ways. For example, noise can be added to the signal. Then the student can programmatically prevent this noisy. In this way students learn noise prevention methods. This simulation is quite instructive for the basic ECG
signal.
Figure 16 Temperature display and alarm led
Figure 17 ECG simulator and configure simulator
International Conference on Research in Education and Science (ICRES), May 18 - 21, 2017 Ephesus-Kusadasi/Turkey
167
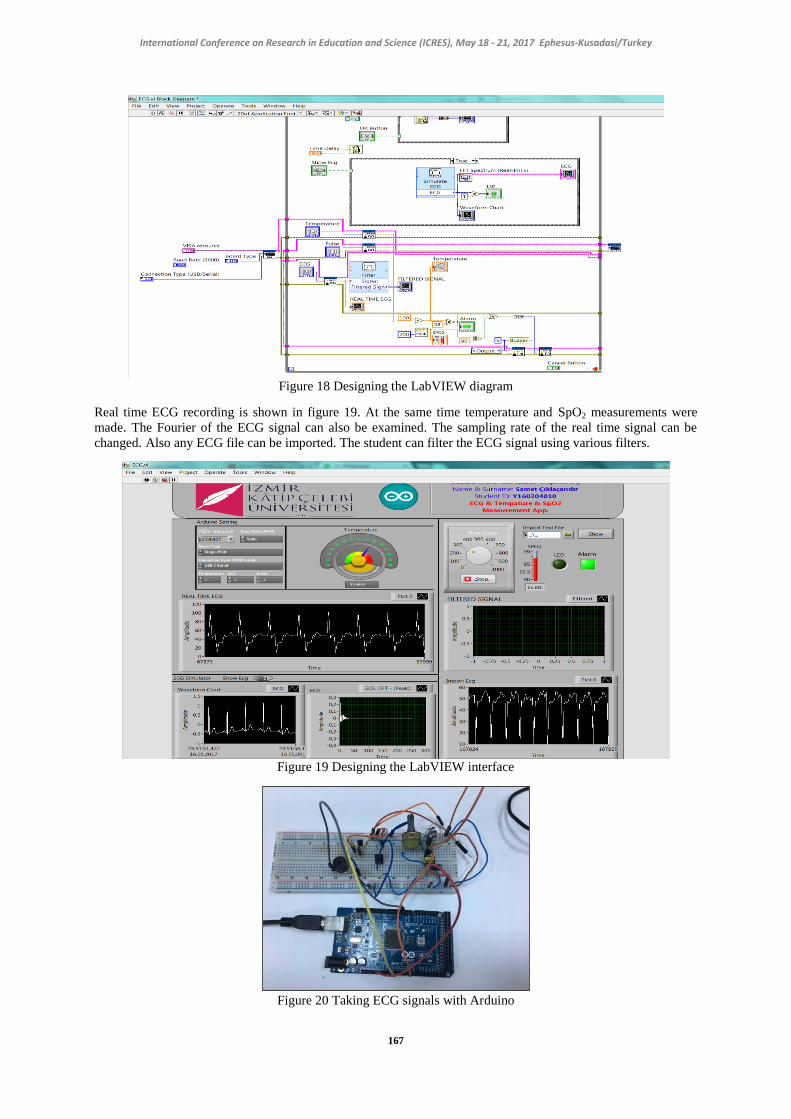
Figure 18 Designing the LabVIEW diagram
Real time ECG recording is shown in figure 19. At the same time temperature and SpO2 measurements were
made. The Fourier of the ECG signal can also be examined. The sampling rate of the real time signal can be
changed. Also any ECG file can be imported. The student can filter the ECG signal using various filters.
Figure 19 Designing the LabVIEW interface
Figure 20 Taking ECG signals with Arduino

International Conference on Research in Education and Science (ICRES), May 18 - 21, 2017 Ephesus-Kusadasi/Turkey
168
Conclusion
ECG devices are usually used in biomedical engineering education laboratories. But these devices can be taken
in small amounts because it is expensive. It cannot be seen the circuits in devices, because this device is a closed
box device. Additionally, students can only obtain measuring of the ECG signal so they do not know how the
device works. As a result, they do not get the skills. The number of students per ECG devices is about 8 in any
university. So the quality of education given is falling. In this study, low cost ECG, Temperature and SpO2
measurement system was developed to solve all these problems. In addition, students can modify the program
for their on studies or works. Programming skills of students develop with this method. It is hoped that this
system can be benefit for student who makes investigation in this area.
References
Retrieved from https://en.wikipedia.org/wiki/Electrocardiography/
Lascu, M., & Lascu, D. (2007, August). LabVIEW based biomedical signal acquisition and processing. In
Proceedings of the 7th WSEAS Int Conf on Signal Processing, Computational Geometry and Artificial
Vision, Athens, Greece. 2007Aug (pp. 24-26).
Olansen, J. B., & Rosow, E. (2001). Virtual bio-instrumentation: biomedical, clinical, and healthcare
applications in LabVIEW. Pearson Education.
Retrieved from http://makezine.com/projects/ir-pulse-sensor/
Mohamad, A. S., & Noor, H. M. (2014, August). Development of smart ECG machine using LabVIEW for
biomedical engineering students. In Engineering Technology and Technopreneuship (ICE2T), 2014 4th
International Conference on (pp. 320-323). IEEE.