A patient-adaptive profiling scheme for ECG beat classification
13
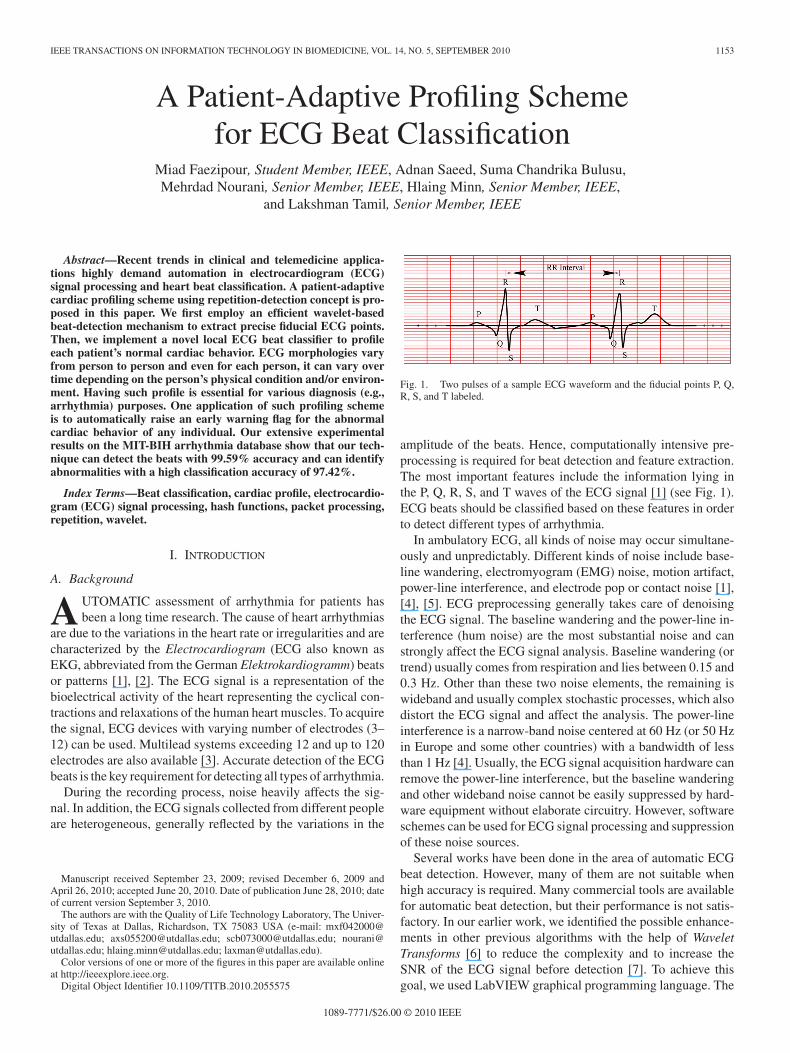
IEEE TRANSACTIONS ON INFORMATION TECHNOLOGY IN BIOMEDICINE, VOL. 14, NO. 5, SEPTEMBER 2010 1153 A Patient-Adaptive Profiling Scheme for ECG Beat Classification Miad Faezipour, Student Member, IEEE, Adnan Saeed, Suma Chandrika Bulusu, Mehrdad Nourani, Senior Member, IEEE, Hlaing Minn, Senior Member, IEEE, and Lakshman Tamil, Senior Member, IEEE Abstract—Recent trends in clinical and telemedicine applica- tions highly demand automation in electrocardiogram (ECG) signal processing and heart beat classification. A patient-adaptive cardiac profiling scheme using repetition-detection concept is pro- posed in this paper. We first employ an efficient wavelet-based beat-detection mechanism to extract precise fiducial ECG points. Then, we implement a novel local ECG beat classifier to profile each patient’s normal cardiac behavior. ECG morphologies vary from person to person and even for each person, it can vary over time depending on the person’s physical condition and/or environ- ment. Having such profile is essential for various diagnosis (e.g., arrhythmia) purposes. One application of such profiling scheme is to automatically raise an early warning flag for the abnormal cardiac behavior of any individual. Our extensive experimental results on the MIT-BIH arrhythmia database show that our tech- nique can detect the beats with 99.59% accuracy and can identify abnormalities with a high classification accuracy of 97.42%. Index Terms—Beat classification, cardiac profile, electrocardio- gram (ECG) signal processing, hash functions, packet processing, repetition, wavelet. I. INTRODUCTION A. Background A UTOMATIC assessment of arrhythmia for patients has been a long time research. The cause of heart arrhythmias are due to the variations in the heart rate or irregularities and are characterized by the Electrocardiogram (ECG also known as EKG, abbreviated from the German Elektrokardiogramm) beats or patterns [1], [2]. The ECG signal is a representation of the bioelectrical activity of the heart representing the cyclical con- tractions and relaxations of the human heart muscles. To acquire the signal, ECG devices with varying number of electrodes (3– 12) can be used. Multilead systems exceeding 12 and up to 120 electrodes are also available [3]. Accurate detection of the ECG beats is the key requirement for detecting all types of arrhythmia. During the recording process, noise heavily affects the sig- nal. In addition, the ECG signals collected from different people are heterogeneous, generally reflected by the variations in the Manuscript received September 23, 2009; revised December 6, 2009 and April 26, 2010; accepted June 20, 2010. Date of publication June 28, 2010; date of current version September 3, 2010. The authors are with the Quality of Life Technology Laboratory, The Univer- sity of Texas at Dallas, Richardson, TX 75083 USA (e-mail: mxf042000@ utdallas.edu; [email protected]; [email protected]; nourani@ utdallas.edu; [email protected]; [email protected]). Color versions of one or more of the figures in this paper are available online at http://ieeexplore.ieee.org. Digital Object Identifier 10.1109/TITB.2010.2055575 Fig. 1. Two pulses of a sample ECG waveform and the fiducial points P, Q, R, S, and T labeled. amplitude of the beats. Hence, computationally intensive pre- processing is required for beat detection and feature extraction. The most important features include the information lying in the P, Q, R, S, and T waves of the ECG signal [1] (see Fig. 1). ECG beats should be classified based on these features in order to detect different types of arrhythmia. In ambulatory ECG, all kinds of noise may occur simultane- ously and unpredictably. Different kinds of noise include base- line wandering, electromyogram (EMG) noise, motion artifact, power-line interference, and electrode pop or contact noise [1], [4], [5]. ECG preprocessing generally takes care of denoising the ECG signal. The baseline wandering and the power-line in- terference (hum noise) are the most substantial noise and can strongly affect the ECG signal analysis. Baseline wandering (or trend) usually comes from respiration and lies between 0.15 and 0.3 Hz. Other than these two noise elements, the remaining is wideband and usually complex stochastic processes, which also distort the ECG signal and affect the analysis. The power-line interference is a narrow-band noise centered at 60 Hz (or 50 Hz in Europe and some other countries) with a bandwidth of less than 1 Hz [4]. Usually, the ECG signal acquisition hardware can remove the power-line interference, but the baseline wandering and other wideband noise cannot be easily suppressed by hard- ware equipment without elaborate circuitry. However, software schemes can be used for ECG signal processing and suppression of these noise sources. Several works have been done in the area of automatic ECG beat detection. However, many of them are not suitable when high accuracy is required. Many commercial tools are available for automatic beat detection, but their performance is not satis- factory. In our earlier work, we identified the possible enhance- ments in other previous algorithms with the help of Wavelet Transforms [6] to reduce the complexity and to increase the SNR of the ECG signal before detection [7]. To achieve this goal, we used LabVIEW graphical programming language. The 1089-7771/$26.00 © 2010 IEEE
Transcript of A patient-adaptive profiling scheme for ECG beat classification
IEEE TRANSACTIONS ON INFORMATION TECHNOLOGY IN BIOMEDICINE, VOL. 14, NO. 5, SEPTEMBER 2010 1153
A Patient-Adaptive Profiling Schemefor ECG Beat Classification
Miad Faezipour, Student Member, IEEE, Adnan Saeed, Suma Chandrika Bulusu,Mehrdad Nourani, Senior Member, IEEE, Hlaing Minn, Senior Member, IEEE,
and Lakshman Tamil, Senior Member, IEEE
Abstract—Recent trends in clinical and telemedicine applica-tions highly demand automation in electrocardiogram (ECG)signal processing and heart beat classification. A patient-adaptivecardiac profiling scheme using repetition-detection concept is pro-posed in this paper. We first employ an efficient wavelet-basedbeat-detection mechanism to extract precise fiducial ECG points.Then, we implement a novel local ECG beat classifier to profileeach patient’s normal cardiac behavior. ECG morphologies varyfrom person to person and even for each person, it can vary overtime depending on the person’s physical condition and/or environ-ment. Having such profile is essential for various diagnosis (e.g.,arrhythmia) purposes. One application of such profiling schemeis to automatically raise an early warning flag for the abnormalcardiac behavior of any individual. Our extensive experimentalresults on the MIT-BIH arrhythmia database show that our tech-nique can detect the beats with 99.59% accuracy and can identifyabnormalities with a high classification accuracy of 97.42%.
Index Terms—Beat classification, cardiac profile, electrocardio-gram (ECG) signal processing, hash functions, packet processing,repetition, wavelet.
I. INTRODUCTION
A. Background
AUTOMATIC assessment of arrhythmia for patients hasbeen a long time research. The cause of heart arrhythmias
are due to the variations in the heart rate or irregularities and arecharacterized by the Electrocardiogram (ECG also known asEKG, abbreviated from the German Elektrokardiogramm) beatsor patterns [1], [2]. The ECG signal is a representation of thebioelectrical activity of the heart representing the cyclical con-tractions and relaxations of the human heart muscles. To acquirethe signal, ECG devices with varying number of electrodes (3–12) can be used. Multilead systems exceeding 12 and up to 120electrodes are also available [3]. Accurate detection of the ECGbeats is the key requirement for detecting all types of arrhythmia.
During the recording process, noise heavily affects the sig-nal. In addition, the ECG signals collected from different peopleare heterogeneous, generally reflected by the variations in the
Manuscript received September 23, 2009; revised December 6, 2009 andApril 26, 2010; accepted June 20, 2010. Date of publication June 28, 2010; dateof current version September 3, 2010.
The authors are with the Quality of Life Technology Laboratory, The Univer-sity of Texas at Dallas, Richardson, TX 75083 USA (e-mail: [email protected]; [email protected]; [email protected]; [email protected]; [email protected]; [email protected]).
Color versions of one or more of the figures in this paper are available onlineat http://ieeexplore.ieee.org.
Digital Object Identifier 10.1109/TITB.2010.2055575
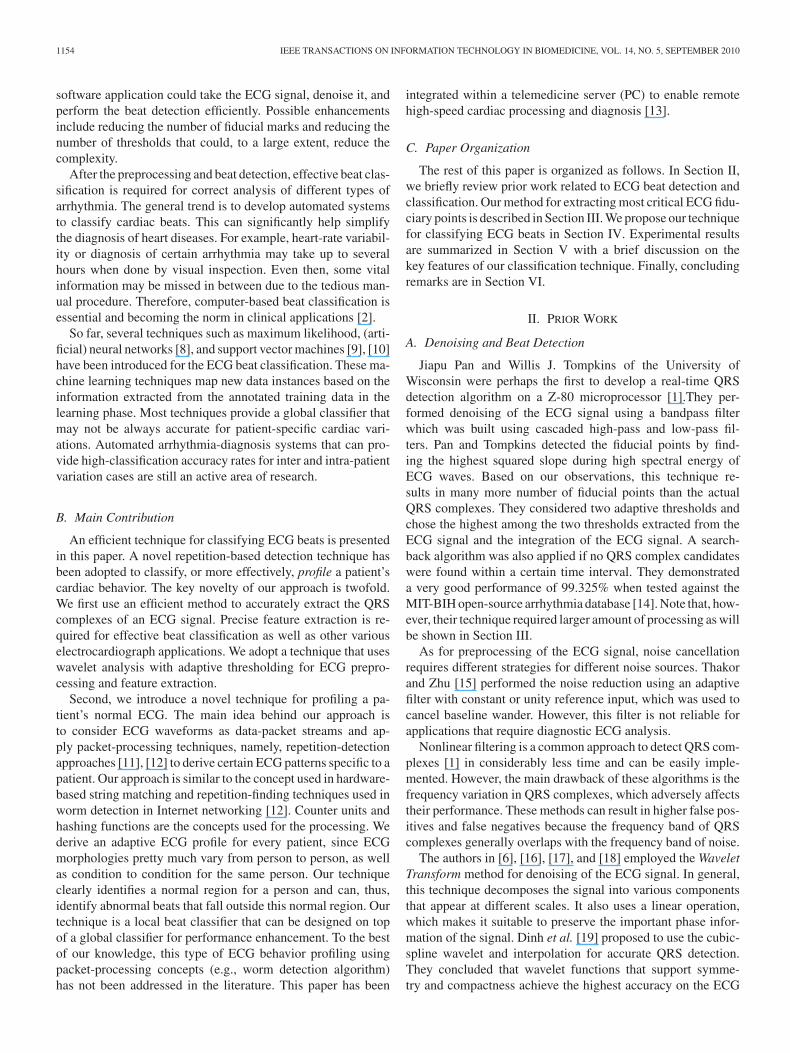
Fig. 1. Two pulses of a sample ECG waveform and the fiducial points P, Q,R, S, and T labeled.
amplitude of the beats. Hence, computationally intensive pre-processing is required for beat detection and feature extraction.The most important features include the information lying inthe P, Q, R, S, and T waves of the ECG signal [1] (see Fig. 1).ECG beats should be classified based on these features in orderto detect different types of arrhythmia.
In ambulatory ECG, all kinds of noise may occur simultane-ously and unpredictably. Different kinds of noise include base-line wandering, electromyogram (EMG) noise, motion artifact,power-line interference, and electrode pop or contact noise [1],[4], [5]. ECG preprocessing generally takes care of denoisingthe ECG signal. The baseline wandering and the power-line in-terference (hum noise) are the most substantial noise and canstrongly affect the ECG signal analysis. Baseline wandering (ortrend) usually comes from respiration and lies between 0.15 and0.3 Hz. Other than these two noise elements, the remaining iswideband and usually complex stochastic processes, which alsodistort the ECG signal and affect the analysis. The power-lineinterference is a narrow-band noise centered at 60 Hz (or 50 Hzin Europe and some other countries) with a bandwidth of lessthan 1 Hz [4]. Usually, the ECG signal acquisition hardware canremove the power-line interference, but the baseline wanderingand other wideband noise cannot be easily suppressed by hard-ware equipment without elaborate circuitry. However, softwareschemes can be used for ECG signal processing and suppressionof these noise sources.
Several works have been done in the area of automatic ECGbeat detection. However, many of them are not suitable whenhigh accuracy is required. Many commercial tools are availablefor automatic beat detection, but their performance is not satis-factory. In our earlier work, we identified the possible enhance-ments in other previous algorithms with the help of WaveletTransforms [6] to reduce the complexity and to increase theSNR of the ECG signal before detection [7]. To achieve thisgoal, we used LabVIEW graphical programming language. The
1089-7771/$26.00 © 2010 IEEE
1154 IEEE TRANSACTIONS ON INFORMATION TECHNOLOGY IN BIOMEDICINE, VOL. 14, NO. 5, SEPTEMBER 2010
software application could take the ECG signal, denoise it, andperform the beat detection efficiently. Possible enhancementsinclude reducing the number of fiducial marks and reducing thenumber of thresholds that could, to a large extent, reduce thecomplexity.
After the preprocessing and beat detection, effective beat clas-sification is required for correct analysis of different types ofarrhythmia. The general trend is to develop automated systemsto classify cardiac beats. This can significantly help simplifythe diagnosis of heart diseases. For example, heart-rate variabil-ity or diagnosis of certain arrhythmia may take up to severalhours when done by visual inspection. Even then, some vitalinformation may be missed in between due to the tedious man-ual procedure. Therefore, computer-based beat classification isessential and becoming the norm in clinical applications [2].
So far, several techniques such as maximum likelihood, (arti-ficial) neural networks [8], and support vector machines [9], [10]have been introduced for the ECG beat classification. These ma-chine learning techniques map new data instances based on theinformation extracted from the annotated training data in thelearning phase. Most techniques provide a global classifier thatmay not be always accurate for patient-specific cardiac vari-ations. Automated arrhythmia-diagnosis systems that can pro-vide high-classification accuracy rates for inter and intra-patientvariation cases are still an active area of research.
B. Main Contribution
An efficient technique for classifying ECG beats is presentedin this paper. A novel repetition-based detection technique hasbeen adopted to classify, or more effectively, profile a patient’scardiac behavior. The key novelty of our approach is twofold.We first use an efficient method to accurately extract the QRScomplexes of an ECG signal. Precise feature extraction is re-quired for effective beat classification as well as other variouselectrocardiograph applications. We adopt a technique that useswavelet analysis with adaptive thresholding for ECG prepro-cessing and feature extraction.
Second, we introduce a novel technique for profiling a pa-tient’s normal ECG. The main idea behind our approach isto consider ECG waveforms as data-packet streams and ap-ply packet-processing techniques, namely, repetition-detectionapproaches [11], [12] to derive certain ECG patterns specific to apatient. Our approach is similar to the concept used in hardware-based string matching and repetition-finding techniques used inworm detection in Internet networking [12]. Counter units andhashing functions are the concepts used for the processing. Wederive an adaptive ECG profile for every patient, since ECGmorphologies pretty much vary from person to person, as wellas condition to condition for the same person. Our techniqueclearly identifies a normal region for a person and can, thus,identify abnormal beats that fall outside this normal region. Ourtechnique is a local beat classifier that can be designed on topof a global classifier for performance enhancement. To the bestof our knowledge, this type of ECG behavior profiling usingpacket-processing concepts (e.g., worm detection algorithm)has not been addressed in the literature. This paper has been
integrated within a telemedicine server (PC) to enable remotehigh-speed cardiac processing and diagnosis [13].
C. Paper Organization
The rest of this paper is organized as follows. In Section II,we briefly review prior work related to ECG beat detection andclassification. Our method for extracting most critical ECG fidu-ciary points is described in Section III. We propose our techniquefor classifying ECG beats in Section IV. Experimental resultsare summarized in Section V with a brief discussion on thekey features of our classification technique. Finally, concludingremarks are in Section VI.
II. PRIOR WORK
A. Denoising and Beat Detection
Jiapu Pan and Willis J. Tompkins of the University ofWisconsin were perhaps the first to develop a real-time QRSdetection algorithm on a Z-80 microprocessor [1].They per-formed denoising of the ECG signal using a bandpass filterwhich was built using cascaded high-pass and low-pass fil-ters. Pan and Tompkins detected the fiducial points by find-ing the highest squared slope during high spectral energy ofECG waves. Based on our observations, this technique re-sults in many more number of fiducial points than the actualQRS complexes. They considered two adaptive thresholds andchose the highest among the two thresholds extracted from theECG signal and the integration of the ECG signal. A search-back algorithm was also applied if no QRS complex candidateswere found within a certain time interval. They demonstrateda very good performance of 99.325% when tested against theMIT-BIH open-source arrhythmia database [14]. Note that, how-ever, their technique required larger amount of processing as willbe shown in Section III.
As for preprocessing of the ECG signal, noise cancellationrequires different strategies for different noise sources. Thakorand Zhu [15] performed the noise reduction using an adaptivefilter with constant or unity reference input, which was used tocancel baseline wander. However, this filter is not reliable forapplications that require diagnostic ECG analysis.
Nonlinear filtering is a common approach to detect QRS com-plexes [1] in considerably less time and can be easily imple-mented. However, the main drawback of these algorithms is thefrequency variation in QRS complexes, which adversely affectstheir performance. These methods can result in higher false pos-itives and false negatives because the frequency band of QRScomplexes generally overlaps with the frequency band of noise.
The authors in [6], [16], [17], and [18] employed the WaveletTransform method for denoising of the ECG signal. In general,this technique decomposes the signal into various componentsthat appear at different scales. It also uses a linear operation,which makes it suitable to preserve the important phase infor-mation of the signal. Dinh et al. [19] proposed to use the cubic-spline wavelet and interpolation for accurate QRS detection.They concluded that wavelet functions that support symme-try and compactness achieve the highest accuracy on the ECG
FAEZIPOUR et al.: A PATIENT-ADAPTIVE PROFILING SCHEME FOR ECG BEAT CLASSIFICATION 1155
readings in MIT-BIH arrhythmia database. Though the wavelettransform approach does not discriminate between the noise andsignal coefficients of the wavelet decomposition at low SNRs,it is still an attractive solution for nonstationary signals as itmaintains the signal behavior.
B. Beat Classification
In addition to the automated ECG signal processing and beatdetection, computer-based ECG beat classification is highly indemand as manual evaluation of the beats could be very timeconsuming. Methods such as pattern recognition, maximumlikelihood, (artificial) neural network, and support vector ma-chines have been widely used for classifying ECG beats [9],[10]. Machine-learning techniques learn from the samples oftraining data and map new data instances based on the informa-tion extracted from the annotated training data samples [8].
1) Support Vector Machines: Support vector machines(SVM) have been around for quite some time and have grabbedmuch attention for ECG beat classification [9], [10], [20]. In thistechnique, training datasets with known classes are given to theSVM program. Based on the training data, the SVM determineshyperplanes in the feature space for each class. The distancesbetween the features of each instance and hyperplanes (classes)are computed and the hyperplane holding the minimum dis-tance indicates that the instance is of that particular class. Eachinstance of data in SVM contains important features of the heartbeat. For example, the instances of an SVM may contain QRSduration, RR interval, amplitude of P, Q, R, S, and T points.In other words, each instance is a vector of certain features ofa beat, often called feature vector. The SVM methods providegood classification results using less training datasets and smallfeature vector sizes.
In beat classification using the SVM method, various ECGfeatures may have information about different classes (types) ofarrhythmia. Mohebbi and Moghadam [20] used the informationof the ST segment in each beat of the ECG wave as elements ofthe feature vectors. Elevation of ST segment is proven to have in-formation about myocardial ischemia episodes that may lead tocertain heart attacks [20]. In another approach, transforms suchas discrete Fourier transform, discrete cosine transform, discretewavelet transform, and adaptive autoregressive coefficients areused in constructing the feature vector [21].
Ghongade and Ghatol [22] proposed using six different fea-tures in SVM classification method: mean R-peak value, meanpower spectral density, area under QRS complex, energy of thesignal, Q–S distance, and autocorrelation value. The authorsclaimed that this reduced feature set provides optimum resultsfor characterizing four classes of heart beats [22].
Park et al. [23] first used higher-order statistics and Hermite-basis functions to extract ECG morphological features. The au-thors then used SVM to classify the beats into multiple classes.Their multiclass beat classification was done hierarchically,based on feature similarities between different classes.
2) Heuristic-Based Approaches: Apart from SVM, otherclassification techniques have been also studied. Christov et al.provided a thorough comparison of time–frequency ECG fea-
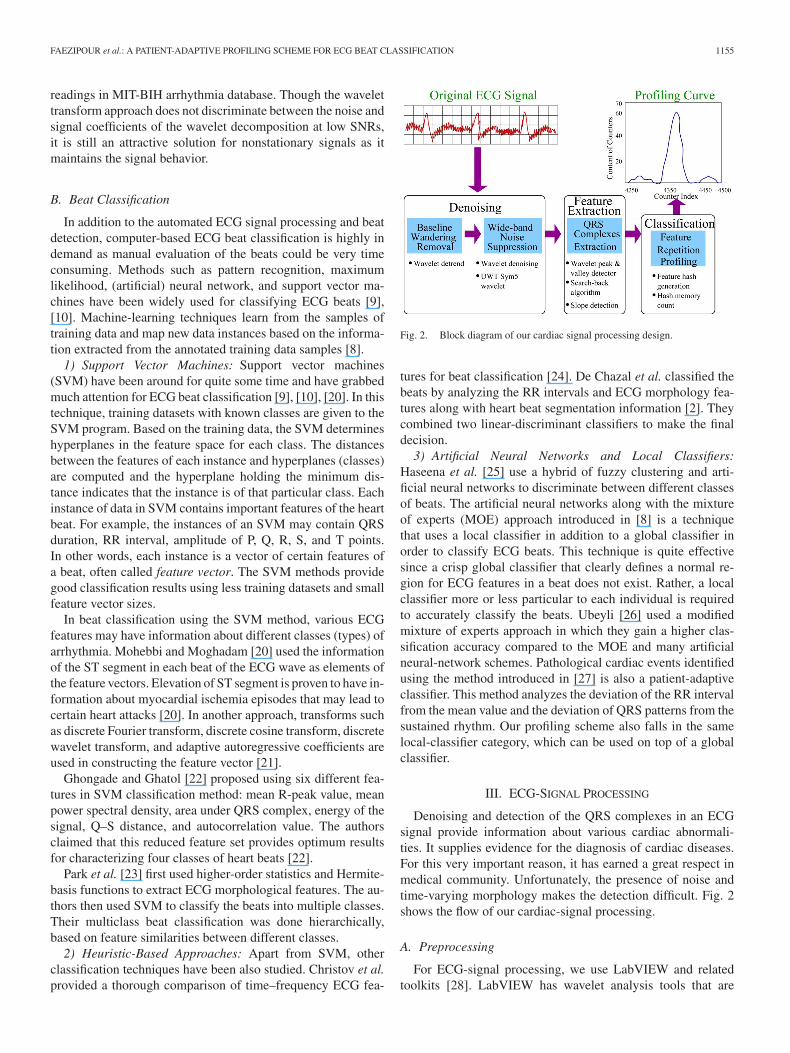
Fig. 2. Block diagram of our cardiac signal processing design.
tures for beat classification [24]. De Chazal et al. classified thebeats by analyzing the RR intervals and ECG morphology fea-tures along with heart beat segmentation information [2]. Theycombined two linear-discriminant classifiers to make the finaldecision.
3) Artificial Neural Networks and Local Classifiers:Haseena et al. [25] use a hybrid of fuzzy clustering and arti-ficial neural networks to discriminate between different classesof beats. The artificial neural networks along with the mixtureof experts (MOE) approach introduced in [8] is a techniquethat uses a local classifier in addition to a global classifier inorder to classify ECG beats. This technique is quite effectivesince a crisp global classifier that clearly defines a normal re-gion for ECG features in a beat does not exist. Rather, a localclassifier more or less particular to each individual is requiredto accurately classify the beats. Ubeyli [26] used a modifiedmixture of experts approach in which they gain a higher clas-sification accuracy compared to the MOE and many artificialneural-network schemes. Pathological cardiac events identifiedusing the method introduced in [27] is also a patient-adaptiveclassifier. This method analyzes the deviation of the RR intervalfrom the mean value and the deviation of QRS patterns from thesustained rhythm. Our profiling scheme also falls in the samelocal-classifier category, which can be used on top of a globalclassifier.
III. ECG-SIGNAL PROCESSING
Denoising and detection of the QRS complexes in an ECGsignal provide information about various cardiac abnormali-ties. It supplies evidence for the diagnosis of cardiac diseases.For this very important reason, it has earned a great respect inmedical community. Unfortunately, the presence of noise andtime-varying morphology makes the detection difficult. Fig. 2shows the flow of our cardiac-signal processing.
A. Preprocessing
For ECG-signal processing, we use LabVIEW and relatedtoolkits [28]. LabVIEW has wavelet analysis tools that are

1156 IEEE TRANSACTIONS ON INFORMATION TECHNOLOGY IN BIOMEDICINE, VOL. 14, NO. 5, SEPTEMBER 2010
highly efficient for ECG denoising and feature extraction [29].The wavelet type we used for discrete wavelet analysis isSymmlet 5 (sym5), which resembles ECG signal morphologiesmore than any other wavelet type. Moreover, Symmlet typeshighly support near-symmetry properties and provide high ac-curacy results on ECG signals [19]. Hence, sym5 wavelet is byfar a good and rationale selection.
The LabVIEW Advanced Signal Processing Toolkit (ASPT)provides the WA Detrend Virtual Instrument (VI) which can beused to remove the low-frequency baseline wandering (or trend)of a signal. In the WA Detrend VI, we also suggest using thesym5 wavelet as it resembles the QRS complex of ECG morethan the other type of wavelets. An internal parameter calledtrend level is required for baseline removal [29]. The trend levelis calculated as follows:
LEVELTrend =
⌈log2 2t
log2 N
⌉(1)
where t is the observation duration and N is the number ofsampling points in observation time t. In this case, the high-pass cutoff frequency is 0.8 Hz (below 1 Hz [5]).
After we suppress baseline wandering, the ECG signal be-comes more stationary and explicit than the raw ECG signal.The remaining noise elements are complex stochastic processeswith wideband nature, and cannot be efficiently suppressed orremoved by the conventional digital-filtering approach [17]. Tosuppress the wideband noise, we chose to use the Wavelet De-noise VI module from the LabVIEW [29]. This module firstdecomposes the ECG signal into several subbands by applyingthe wavelet transform, and then modifies each wavelet coeffi-cient by applying a threshold or shrinkage function, and finallyreconstructs the denoised signal. In our design, we used undeci-mated wavelet transform (UWT) sym5 with single level and softthresholding for the wavelet denoising VI block setup. UWTresults in the approximation wavelet coefficients and the detailcoefficients at all decomposition levels. As UWT has the shift-invariant property, it is highly efficient in robust-feature extrac-tion and pattern-recognition applications. In addition, peak de-tection using UWT-based methods are more robust and less sen-sitive to noise, since UWT-based methods find zero-crossingsin the multiscale UWT coefficients. These settings perform ef-ficient denoising on the original ECG signal and smoothen thesignal without suppressing ECG features such as the P and Twaves. For effective feature extraction, we apply a wavelet de-noise VI with UWT sym5 and multiple levels on the detrendedsignal to make only the QRS complexes of the signal moredistinct.
B. Feature Extraction
The technique we deployed for ECG feature extraction is ahybrid approach of Pan and Tompkin’s adaptive thresholding[1] combined with wavelet peak and valley detection [29], bywhich we achieved significant improvement compared to Panand Tompkin’s technique.
After detrending the signal and applying the wavelet denois-ing VI, the resulting signal would result in a zero DC offset.
TABLE ICOMPARISON OF OUR AND PAN–TOMPKIN’S ALGORITHMS
Fig. 3. Comparison of Pan–Tompkin’s two thresholds.
We mark peaks that are above zero and valleys that are belowzero by the help of WA Multiscale Peak/Valley Detection VI inLabVIEW. This particular VI uses the multiresolution waveletanalysis to detect peaks or valleys of a signal. By determininglocal maximums above a predefined threshold or local minimumbelow the threshold, the peaks or valleys can be extracted in thisVI. Then, we apply an approach similar to Pan and Tompkin’smethod, but with some modifications (summarized in Table I),to dynamically set a threshold for beat detection. The peaks andvalleys, detected from the peak/valley detector VI, now becomecandidates for signal peaks in Pan–Tompkin’s algorithm [1].
In our implementation, only one set of threshold extractedfrom the denoised ECG can be applied, because the thresholdcalculated from integration waveform was found to be alwayslower than the other threshold, as seen in Fig. 3. Therefore, nointegrator is required in our technique. This significantly lowersthe amount of processing compared to Pan–Tompkin’s.
Let us consider Peak as the array of peaks that LabVIEWpeak-detector VI has found. The equations for adaptive thresh-olding are as follows:
PEAK = Maximum (Peak)
NPK = Minimum (Peak)
SPK = 0.125 PEAK + 0.875 SPK
THR = NPK + 0.25 (SPK − NPK).
(2)
A signal peak that is larger than the threshold THR is con-sidered as a QRS complex, where the R point is detected. Eachtime a beat (R point) is found, we intentionally move the start-ing point of the next peak computation to a point that is 360 msapart from the previous R point detected, as R-R intervals cannotphysiologically be less than this timeframe [1].
Similar to Pan–Tomkins approach, a search-back algorithmis required if a beat is not found within a certain time interval.
FAEZIPOUR et al.: A PATIENT-ADAPTIVE PROFILING SCHEME FOR ECG BEAT CLASSIFICATION 1157
We maintain only one R-to-R average (instead of two) for thesearch-back algorithm, that being the average of the eight mostrecent R-R intervals found. If n is the index of the current beat,R-to-R average is computed as follows:
RRAvg =
1n − 1
n−2∑i=0
RR(n−i) , 2 ≤ n ≤ 7
18
7∑i=0
RR(n−i) , n ≥ 8.
(3)
If no beat has been detected within 116% of the currentR-to-R average, the search-back algorithm is applied. This isa percentage that has been found empirically [1]. In the search-back algorithm, we lower the threshold and start looking for aQRS complex from where the last R point is detected. Since ourdenoising technique only keeps the QRS complex of the signaland suppresses the P and T waves, a very low threshold canbe used in this search-back stage. The new threshold we haveapplied in the search-back algorithm is as follows:
THRnew =THRold
8. (4)
If a signal peak (SPK) exceeds this new threshold, we considerit as a beat (R point). The new SPK and threshold (THR) shouldthen be updated accordingly.
C. Fine Tuning
A slope-detection technique has been integrated within ouralgorithm to rule out the possibility of misdetecting T wavesas R beats. In some individuals (e.g., record 116 of the MIT-BIH arrhythmia database [14]), T waves are as high as (or evenhigher than) R waves. This may lead to misdetecting the beat ifa peak-detection algorithm is used. In such cases, the slope isthe key for beat detection. In general, R waves generate higherslopes compared to the P and T waves. Thus, when a peak isdetected, the slope should be compared to the average slope ofpeaks, and removed from the list of beats if it is smaller than theaverage slope:
SlopeAvg =∑# of peaks
i=1 y(Peaki) − y(Peaki − 1)# of peaks
. (5)
If ((y(Peaki) − y(Peaki − 1)) < SlopeAvg ), then
F = F − {Peaki}. (6)
In the above formulations, y(Peaki) and y(Peaki − 1) are theamplitudes of the ith peak and one sample before the ith peak,respectively, and F refers to the set of peaks detected from thewavelet-peak detector in the LabVIEW.
To deal with the rare cases of records with inverted waves orrecords dissimilar to sym5 wavelet, an effective approach is tosquare the entire signal. This would produce positive amplitudesfor the R wave and would ensure that the squared R wave isrelatively larger than P, Q, S, and T. Then, our beat-detectionapproach can be applied to the squared signal to find the beats.So, beforehand, a short timeframe (e.g., 10 s) of each recordshould be analyzed to identify inverted wave records. After
detrending and denoising the short record, absolute values canbe given to our beat-detection approach. If the peaks were foundat the locations where the original amplitude was negative, thesignal can be declared as inverted, and the squared approachshould be employed.
To find the Q and S points of the ECG waveform, we applythis underlying concept that a Q point is the closest valley rightbefore R point, and an S point is the closest valley right aftera detected R point. As mentioned earlier, the valley locationsare found using the WA peak/valley detector with zero as thethreshold. Since the signal has been detrended to zero-baselinewandering, this would locate all valleys that are below zero.When an R point is found, we search through the valley locationarray, and mark the maximum and minimum locations beforeand after that R point as Q and S points, respectively.
Table I summarizes the key differences between our designand Pan–Tompkins algorithm. Adaptive thresholding and em-ploying the earlier search-back algorithm along with slope de-tection guarantee that our approach can take care of inter andintrapatient heart-rate variability or other dynamic variationsover time due to change of the body position, breathing, elec-trode contact, etc., as reflected in the results of Section V.
IV. PROFILING ECG WAVEFORM
A. Concept and Methodology
The main idea in ECG profiling is based on the underlyingconcept of pattern matching used in Internet-packet processing.We treat ECG signals as data packets and apply similar methodsused in packet processing such as identifying chunks of datapackets that match certain (malicious) strings.
In the case of ECG packets, there is no global pattern (withfixed waveform dimensions) for a normal ECG waveform, mak-ing the problem more complicated. The reason is that ECG is aphysiological phenomenon particular to each individual, whichalso depends on physical condition and environment of the per-son. Therefore, we need a patient-adaptive profiling scheme,similar to repetition-based pattern detection schemes, to derivea normal ECG pattern for an individual.
In general, string matching in networking applications is per-formed by comparing packet data bytes to a set of fixed signa-tures. In this process, data-packet chunks are analyzed to checkwhether any portion(s) of the packet stream matches those sig-natures. When predefined fixed signatures are not available forcomparison, repetition-based pattern detection techniques canbe used. The overall idea in repetition-based pattern detection isto identify strings that are frequently repeated at certain numberof times [12]. In this technique, the input stream with total sizeof |S| bytes is consistently broken into strings of L bytes. Theboundaries of these strings with distance b are chosen consis-tently so that when a long string is repeated, the boundarieswithin that string are repeated at the same relative locations. Toachieve this, the boundaries are decided based on the hash valueof a certain sliding window of W -bytes. A boundary (border)is identified when the hash value is a fixed l = log2L bit primenumber. The data bits between two consecutive boundaries areexamined for frequent occurrence. To achieve high-performance

1158 IEEE TRANSACTIONS ON INFORMATION TECHNOLOGY IN BIOMEDICINE, VOL. 14, NO. 5, SEPTEMBER 2010
Fig. 4. Distribution of counter contents for 70 MB of internet packets withabnormalities [12].
detection, without having to implement numerous counters, theshared counter technique is used. In this technique, multiplecounters are used in which small storage units are designed tofunction in parallel. In the design, a multilevel hashing is usedin two phases. The data bits between two consecutive bound-aries are used to first generate a phase I hash. This hash valueis then used in a second-phase hash to produce m independenthash values that index into m arrays. Assuming the width ofeach memory array to be n, each m hash memory would have2n locations in depth. Each array location that is indexed, is in-cremented. Effectively, m shared counters per signature duringmonitoring are used instead of one, adding to the accuracy ofthe conventional counting approach. If, say, k out of m coun-ters exceed a certain threshold THR value, the signature is sentto other processing units as a worm suspect for further inves-tigation. More accurate per signature counting is performed toconfirm the suspicion afterwards.
In our prior work [12], we approximated the distribution of thenumber of counters with content x to be a normal (bell-shapedcurve) distribution:
FX (x) =1
σ√
2πe−
(x −µ ) 2
2 σ 2 (7)
where µ = NP = |S|/2nL and σ =√
µ. In these formulations,the number of times our system enters phase II is N = |S|/L,and P = 1/2n is the probability that phase I string would hashto one of the 2n memory locations.
Based on the contents of the counters, a bell-shaped profilingcurve would be provided, where anomalies would lie on thetail(s) of the curve [12].
In the design of our ECG waveform profiling system, similarconcept as described earlier is used. We analyze the data in eachheart beat and search for repetitions to extract an ECG patternfor any individual. Similar to our packet-processing techniquewhere abnormalities are reflected as a long distorted tail withadditional humps on the normal distribution curve scaled with afactor of the number of counters 2n (see Fig. 4), abnormal ECG
beats of the ECG profiling curve will be seen where humps existon the tail of the bell-shaped curve.
B. Algorithmic Fine Tuning
Essentially, our behavioral analysis/profiling system is basedon repetitions of some sort. The nature of these repeated pa-rameters is application-specific and relevant to the features ofeach application. Thus, our system should be fine-tuned for eachapplication to provide the profiling curve.
In our ECG profiling system, the data chunks chosen for fre-quent occurrence analysis is the time and amplitude informationthat lie in each QRS complex timeframe plus the time differ-ence of the current and previous R points. To be consistent onthe length of these data chunks, we chose a fixed timeframe of150 ms centered at the R point, which empirically correspondsto the largest QRS complex [1]. Since multiple metrics are usedhere to quantify certain features of a heart beat, a (hash) func-tion such as the summation of these quantities can be used tocompact each instance (useful information between the bordersof analysis) in a single string of data. The hash result would bethe signature of phase 1. In phase 2, multiple other (hash) func-tions can be applied to the phase 1 signature (e.g., mathematicalfunctions such as mod, etc.) and multiple counters can be usedto identify frequent occurrence of these hash results in parallel.We have chosen summation as our primary hash function, sinceas we will see further in the design, a linear function is usedto maintain the range properties. Proper normalization is alsorequired to result in an integer hash value. Essentially, when ans point is detected in the signal, the time and amplitude of allsamples corresponding to 150 ms of the ECG signal centered atthe R point, and the current RR distance are all summed up toform one string (hash value). This string is then further analyzedfor frequent occurrence.
Similar to the second phase of the repetition-based pattern-matching detection technique [12], each hash value is also anindex to a presumable memory/counter location. That is, thecounter that the hash value points to is incremented. However,since ECG is a physiological signal, each heart beat patternwould not exactly repeat with the same pattern as it had ap-peared in the previous beat(s). Therefore, hash values wouldnever reproduce the exact same result, and thus, hash-memorycontents would never be incremented if solely the aforemen-tioned technique is used in our ECG profiling system. This isunlike Internet patterns where we search for repeated stringsthat exactly resemble one another in byte representation. Todeal with this issue, we use a valid range where hash valueswould represent more or less a similar pattern, and incrementcounters that fall within that range. Pan and Tompkins definedan empirical range of 92–116% of the average of RR intervals,and claim that the beats that fall within this range indicate anormal range that do not require a search-back algorithm [1].Based on this fact, we chose 25, the difference between 92and 116 as the number of memory locations we index and in-crement their contents. Essentially, for each hash generation,the content of 25 locations, 12 locations above, and 12 lo-cations beneath the actual hash index would be incremented

FAEZIPOUR et al.: A PATIENT-ADAPTIVE PROFILING SCHEME FOR ECG BEAT CLASSIFICATION 1159
Fig. 5. Principles of our ECG profiling system.
Fig. 5 shows the principles of our methodology after featureextraction.
C. Parametric Settings
In our design, we have used one primary hash function (sum-mation with normalization) and report the results. As discussedin repetition-based pattern detection techniques, multiple hashfunctions can be used in parallel to form the shared-counter ap-proach. Other linear hash functions that can be interpreted intoranges properly can also be used. The shared-counter approachyields better results in terms of false positives (FP) and falsenegatives (FN) [12].
Our parametric settings for ECG profiling are summarizedhere. Note carefully that to show the true face of this applica-tion, we expressed all parameters in actual time measurements(second and millisecond). These metrics can be normalized tointeger values by multiplying them with sampling frequency(fs = 360 samples/s in our experiment).
1) L ≈ RRinterval: which is often in the range of 0.7–1.2 srepresenting the time gap expected between two consecu-tive heart beats.
2) W = 150 ms: the size of the sliding window aroundQRS region. Considering the fact that we use 2 bytes
for amplitudes and time index, W will be equivalent to2 × 0.150 s · samples/s ≈ 108 bytes.
3) l = logL = 9: the size of the prime number for boundarycheck is 9 bits.
4) b = RRinterval: which indicates that the borders (bound-aries) of processing are one heart beat apart.
5) m = 1: showing only one memory unit in phase II.6) n = 10: address bits of the memory arrays in phase II with
d ≈ 16 bits wide.7) k = 1: indicating our policy in this particular experimen-
tation to evaluate the system’s performance using onlyone memory unit and one hash function (summation withnormalized values) in the second phase.
8) THR: is the threshold value for counters. Since we chosethe hash function to be the average content of counters forthe best performance, the THR will be any value fallenout of normal range. In other words, the abnormal heartbeats are those that do not fit in the bell-shaped normalbehavior of counter values.
The features that are used in our profiling scheme provideclassification results for different types of arrhythmia versusthe normal ECG behavior. Repetition-detection analyses forfeatures such as the R-R interval and QRS duration provideclassification results for the ventricular or atrial-premature beatclasses. In other words, anomalies on the profiling curve indi-cate the presence of such premature beats. On the other hand, ifthe information lying in the ST segment of the signal is analyzedfor frequent occurrence, abnormalities indicate the presence ofmyocardial ischemia episodes. Essentially, different ECG fea-tures or a combination of features, can collectively classify thebeats into normal versus abnormal beats, where the abnormalitytype (class) depends on the ECG features used for profiling.
V. EXPERIMENTAL RESULTS
A. Denoising and Feature-Extraction Simulation
We have implemented our design in LabVIEW 8.5 graphicalprogramming environment [28] and tested various ECG wave-forms. Fig. 6 shows a raw ECG signal captured with a samplingfrequency of 500 Hz. After applying our denoising and beatdetection technique, Fig. 7 shows the ECG signal that has beendenoised and the Q, R, and S points marked for each beat.
B. Performance Evaluation—Beat Detection
Our algorithm, when evaluated against MIT-BIH arrhythmiadatabase [14], achieved an overall beat detection accuracy of99.59% for the entire 30-min timeframe of the readings. Table IIdepicts the performance of our algorithm when implemented inLabVIEW.
False positives (FP) and false negatives (FN) have been re-flected in the table as erroneously detected beats and missedbeats, respectively. The overall error is calculated as follows:
Error =FP + FN
Total # of Beats. (8)
To determine the detection rate DER (accuracy), the truepositive value TP (the number of correctly identified beats) is

1160 IEEE TRANSACTIONS ON INFORMATION TECHNOLOGY IN BIOMEDICINE, VOL. 14, NO. 5, SEPTEMBER 2010
Fig. 6. Raw ECG signal.
Fig. 7. ECG signal after wavelet denoising and QRS complex extraction.
used [31]:
DER =TP
Total # of Beats. (9)
Sensitivity (Se) and Specificity (Sp) are the most impor-tant parameters, used in literature, to assess the efficiency ofany beat-detection algorithm [30]–[32]. They are defined asfollows:1
Se =TP
TP + FN(10)
Sp =TP
TP + FP. (11)
Our approach is able to detect beats with high accuracy evenwhen considering inter and intrapatient variability. The key nov-elty is that it employs an adaptive thresholding scheme that dy-namically adjusts the threshold for peak detection. In addition,a search-back algorithm is involved in the design that takes intoconsideration the history of the last eight previously detectedbeats, and lowers the threshold to search back for a beat thatwas not found in a nominal range using the previous threshold.
1) Handling Rare Cases: Our algorithm had originally per-formed poorly on those readings (e.g., datasets 108 and 200) thathad inverted waves and did not look like the sym5 wavelet [7].To deal with the rare cases of records with inverted waves orrecords dissimilar to sym5 wavelet, we have devised an effec-tive heuristic by squaring entire signal and then applying ourbeat-detection approach to find the beats. This technique hasbeen quite efficient, as we have achieved high beat-detectionaccuracy on records 108 and 200.
The performance of a few QRS detection algorithms that useddigital filtering and wavelet analysis are compared in Table III.Our algorithm performs quite well just like other well-known
1Note that in some papers [8], [34], slightly different definitions were used.For example, positive prediction was defined as: P+ = TP/(TP + FP) and speci-ficity was defined as: Sp = TN/(TN + FP).
approaches. Nevertheless, we achieved 99.62% accuracy for thefirst 23 readings (datasets 100–124 in Table II) that resemblenormal ECG patterns, while Pan–Tomkins achieved 99.17%accuracy for the same datasets [1].
C. Performance Evaluation—Beat Classification
We have applied our patient-adaptive profiling scheme on theentire 30-min timeframe of each record in the open-source MIT-BIH arrhythmia database [14]. In this experiment, we have usedone hash function (summation with normalized values) in thefirst and second phases.
In general, abnormal ECG beats are reflected as distortionsand humps on the tail of the bell-shaped curve. Highly distortedbell curve indicates the presence of too many irregular beats.
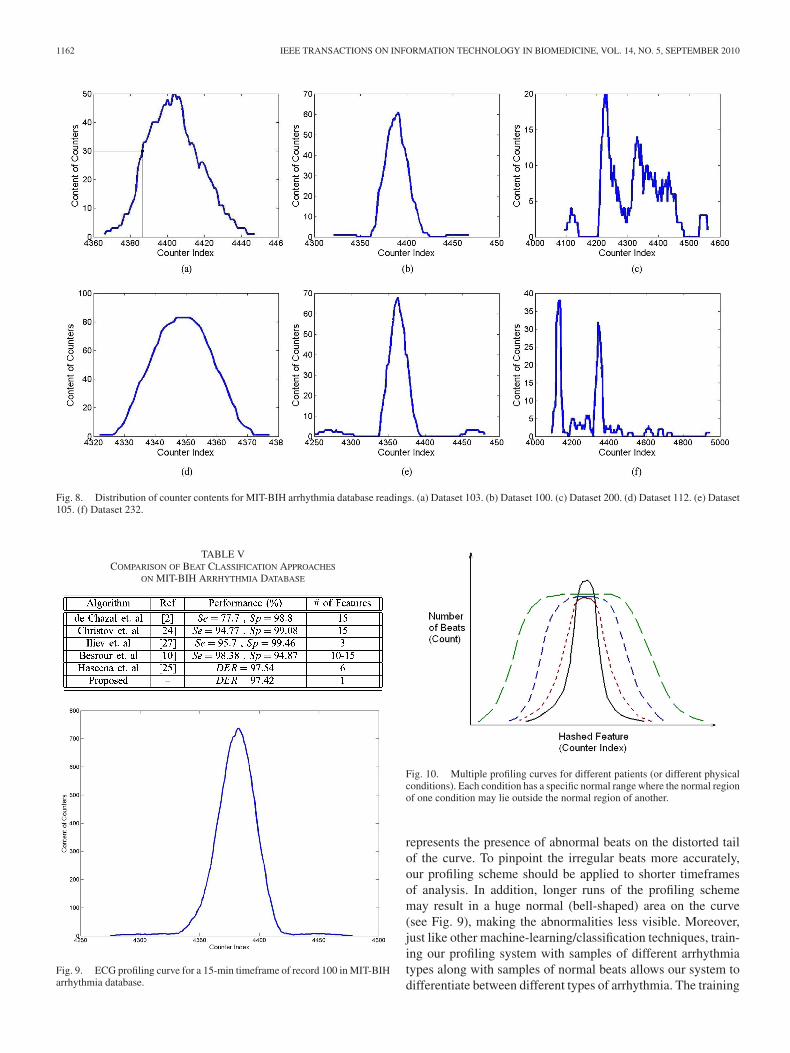
Fig. 8 shows the distribution of the counter contents fordatasets 103, 100, 200, 112, 105, and 232, respectively, whenconsidering a 1-min (first-minute) timeframe of profiling anal-ysis. As can be seen, a bell-shaped curve represents the normaldistribution of the content of the counters. The curve clearlydepicts a normal region of the ECG beats. Any nonzero countercontent that falls outside the normal region would indicate theexistence of abnormal beats. Datasets 103 and 112 do not con-tain any abnormal beats, as the curves reflect this fact. Datasets100 and 105 contain very few abnormal beats, which is reflectedon the curves as very few counter contents outside the normalregion. The abnormalities are of ventricular or atrial arrhythmiatype. Datasets 200 and 232 contain too many abnormal beats, asa normal region can be hardly defined on the curves. All theseresults match the MIT-BIH arrhythmia database annotations forbeat classification.
To numerically verify our results, we computed the percent-age of area under the curve for the abnormal region and com-pared it with the percentage of abnormal beats within the sameanalysis timeframe of the MIT-BIH database. The area under
FAEZIPOUR et al.: A PATIENT-ADAPTIVE PROFILING SCHEME FOR ECG BEAT CLASSIFICATION 1161
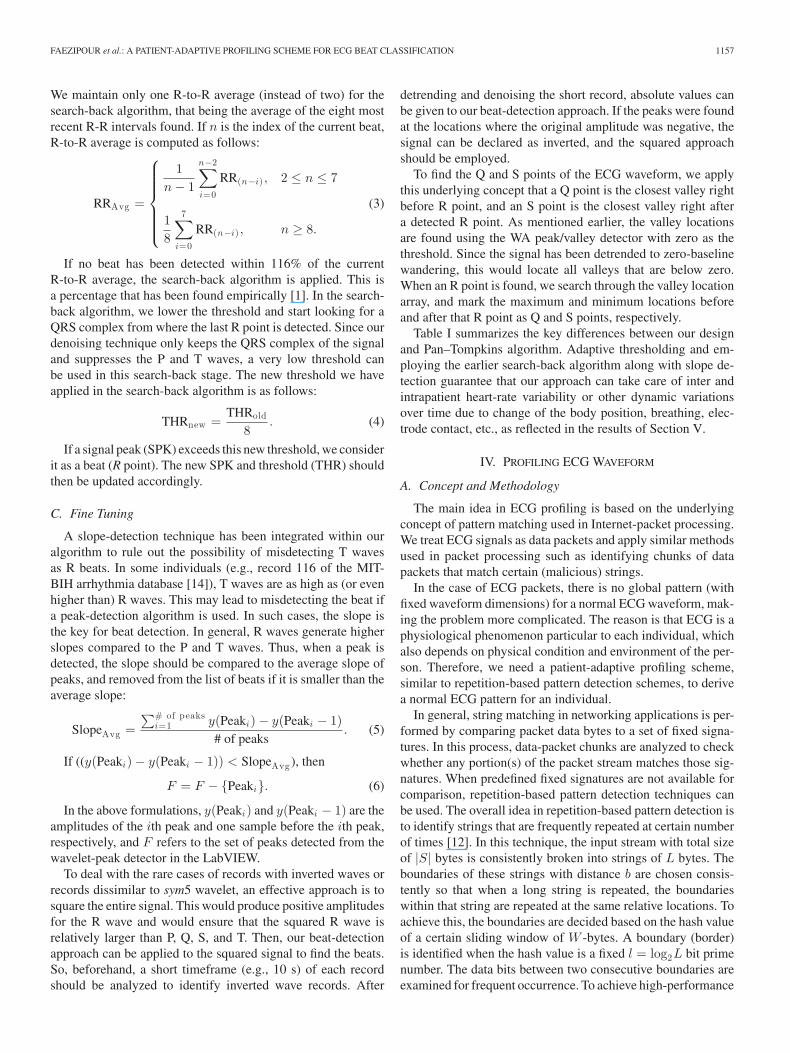
TABLE IIPERFORMANCE EVALUATION OF OUR QRS DETECTOR ON MIT-BIH
ARRHYTHMIA DATABASE (30 MIN LONG EACH)
the curve for abnormal regions would be:
A =b∑
x=a
y(x) (12)
where a and b are the points (often on the tail of the curve) thatfall out of the normal (bell-shaped) region, and y(x) refers tothe content of counter with index x. Table IV compares the per-formance of our scheme with the MIT-BIH arrhythmia databasebeat annotations (normal versus abnormal). The average of theresults of the datasets is reported on row Avg, and the resultsfor the entire 30 min of all 48 datasets are shown in the last rowresulting in an overall classification accuracy of 97.42%. Theresults of 30 one-min timeframes of analysis have been used for
TABLE IIICOMPARISON OF BEAT DETECTION APPROACHES ON MIT-BIH
ARRHYTHMIA DATABASE
TABLE IVPERFORMANCE EVALUATION OF OUR ECG PROFILING SCHEME
ON MIT-BIH ARRHYTHMIA DATABASE
training. Then, the entire 30-min profiling result was analyzedfor each record.
Table V provides a performance comparison for a few pub-lished works. Our profiling scheme has achieved a comparableperformance.
1) Training and Fine Tuning: Counter index in Fig. 8 is ac-tually the hash result of the ECG features (RR interval, QRSduration, QRS amplitudes, etc.), which also points to a memorylocation. This is a value for quantifying ECG features. Eachmemory location is also a counter; i.e., whenever a hashed ECGfeature value is produced, the content of that location is in-cremented by one. The y-axis corresponds to the content ofmemory with index x. For example, point (4387,30) in Fig. 8(a)corresponds to the hash (memory) value of 4387 for the ECGfeatures of particular beat. This memory location contains 30beats. This figure does not show the time sequence of the beats.In other words, our approach does not demonstrate which beatsare irregular in terms of time sequencing, rather it graphically
1162 IEEE TRANSACTIONS ON INFORMATION TECHNOLOGY IN BIOMEDICINE, VOL. 14, NO. 5, SEPTEMBER 2010
Fig. 8. Distribution of counter contents for MIT-BIH arrhythmia database readings. (a) Dataset 103. (b) Dataset 100. (c) Dataset 200. (d) Dataset 112. (e) Dataset105. (f) Dataset 232.
TABLE VCOMPARISON OF BEAT CLASSIFICATION APPROACHES
ON MIT-BIH ARRHYTHMIA DATABASE
Fig. 9. ECG profiling curve for a 15-min timeframe of record 100 in MIT-BIHarrhythmia database.
Fig. 10. Multiple profiling curves for different patients (or different physicalconditions). Each condition has a specific normal range where the normal regionof one condition may lie outside the normal region of another.
represents the presence of abnormal beats on the distorted tailof the curve. To pinpoint the irregular beats more accurately,our profiling scheme should be applied to shorter timeframesof analysis. In addition, longer runs of the profiling schememay result in a huge normal (bell-shaped) area on the curve(see Fig. 9), making the abnormalities less visible. Moreover,just like other machine-learning/classification techniques, train-ing our profiling system with samples of different arrhythmiatypes along with samples of normal beats allows our system todifferentiate between different types of arrhythmia. The training

FAEZIPOUR et al.: A PATIENT-ADAPTIVE PROFILING SCHEME FOR ECG BEAT CLASSIFICATION 1163
Fig. 11. ECG profiling curves for European ST-T database readings. (a) Dataset e0103. (b) Dataset e0105.
data must include a large number of mostly abnormal beats. Oth-erwise, if the system is trained with only abnormal beats, oursystem cannot identify the beats as abnormal, because the ab-normal behavior would become the norm (pattern). Other localclassification techniques follow the same rule. This is why aglobal classifier is still required to distinguish normal versusabnormal beats at a higher level. In this case, the abnormal areashould be set to 100% instead of zero. Our profiling scheme canthen be used as a local classifier, particular to any individual andzooming on short time intervals to classify the beats.
Note that different physical conditions of any individual canproduce different profiling figures. In other words, the normalregion for one condition may lie outside the normal region ofanother for the same patient (see Fig. 10). Our technique is anintelligent local classifier which is capable of identifying thepresence of abnormal beats in an ECG profile, irrespective ofthe patient’s physical condition.
2) Significance of the Proposed Method:1) The significance of our study lies within the efficiency
of the packetized data processing and the accuracy requiredin the ECG profiling technique. Since we consider the ECGrecord as a stream of packets, only one feature is sufficientfor classification. This feature is a hash function applied tothe samples to represent the information in only one string ofdata. The only information required from the ECG record isthe R point. Our entire profiling technique is performed usingthis single feature. Note that feature extraction is a challeng-ing and time-consuming task, especially for ECG signal wherehardware (e.g., amplification and analog-to-digital conversion)and software (e.g., denoising, averaging, etc.) may require longprocessing time and may add to inaccuracy of data [10], [24].Table V also compares the number of features required for afew recent techniques. Most approaches rely on extracting sev-eral features, adding to the complexity and overall latency ofthe beat classification procedure. These features generally in-clude ECG morphology features, heart beat interval features(P, Q, R, S, and T), frequency-based features, higher order cu-mulant features, hermite polynomials, time descriptors, waveletcoefficients, etc. Our technique relies more on the data streamcorresponding to ECG beats than any particular feature. Morespecifically, our method has resulted in high accuracy in therange of other well-known approaches with only one feature.
TABLE VIPERFORMANCE EVALUATION OF OUR ECG PROFILING
SCHEME ON EUROPEAN ST-T DATABASE
2) Another significance of our study is that this type of pack-etized data processing could be effectively applied to other bio-metrics such as electroencephalogram (EEG) to detect the exis-tence of abnormalities. The reason is that our type of repetitionprofiling is relatively feature-independent, and rather looks intothe biometric signal as one single string of data. Hence, it can beemployed and tuned by any irregularity/abnormality detectionapplication.
3) Finally, as the third advantage of our approach, since ourprofiling architecture requires simple logic, e.g., counters, itcould be easily implemented on customized hardware for clin-ical and/or wearable applications to raise an early warning flagfor the existence of any irregularities.
In another experiment, we used the readings in the EuropeanST-T database [35] to profile ST segment elevation abnormali-ties. This results in the myocardial ischemia arrhythmia types.The time and amplitude of 11 points lying 16 ms apart on the STsegment were extracted as the feature vector. The ST segmentstarts at the J point (which is the junction between the QRScomplex and ST segment), and ends after a predefined intervalof 160 ms [20]. According to [36], J is identified as a point ina sliding window of 20 ms, which has a signal slope equal orless than 2.5 mV · s−1 and is located within 20–120 ms afterthe R wave. The summation of these 11-point features has beenused for the hashed string in both phases, which has then beenanalyzed for frequent occurrence. Fig. 11 shows the profilingcurve for one-min timeframe of e0103 and e0105 readings inEuropean ST-T database [35]. ST-segment elevations are re-flected as the humps on the tail of the curve. Table VI showsthe performance evaluation of our scheme compared to theEuropean ST-T database beat annotations. The average of the

1164 IEEE TRANSACTIONS ON INFORMATION TECHNOLOGY IN BIOMEDICINE, VOL. 14, NO. 5, SEPTEMBER 2010
results of the two datasets is reported on row Avg. Note thatthe last row in Tables IV and VI is not the sum of columns.Instead, those are the statistics for all 48 datasets in MIT-BIHand all first 30 records in European ST-T databases, respectively.
VI. CONCLUSION
We introduced a technique for profiling the normal ECGwaveform for any individual by first detecting the beats ac-curately. Our beat detection scheme was a hybrid of Pan andTompkin’s algorithm and wavelet analysis approach. We thenclassified the detected features of the beats by means ofrepetition-based packet-processing techniques. The outcome ofour work is a profiling curve specific to any individual, repre-senting a graphical view of the existence of abnormal beats. Ourexperimentation shows that a negligible classification error of2.58% was observed when tested against the MIT-BIH arrhyth-mia database. This is a novel technique that can be used forautomatic ECG beat classification in early warning monitoringsystems.
REFERENCES
[1] J. Pan and W. J. Tompkins, “A real-time QRS detection algorithm,” IEEETrans. Biomed. Eng., vol. BME-32, no. 3, pp. 230–236, Mar. 1985.
[2] P. de Chazal, M. O’Dwyer, and R. B. Reilly, “Automatic classification ofheartbeats using ECG morphology and heartbeat interval features,” IEEETrans. Biomed. Eng., vol. 51, no. 7, pp. 1196–1206, Jul. 2004.
[3] P. Zarychta, F. E. Smith, S. T. King, A. J. Haigh, A. Klinge, D. Zheng,S. Stevens, J. Allen, A. Okelarin, P. Langley, and A. Murray, “Bodysurface potential mapping for detection of myocardial infarct sites,” inProc. IEEE Comput. Cardiol., Sep./Oct. 2007, pp. 181–184.
[4] B.-U. Kohler, C. Henning, and R. Orglmeister, “The principles of softwareQRS detection,” IEEE Eng. Med. Biol. Mag., vol. 21, no. 1, pp. 42–57,Jan./Feb. 2002.
[5] D. Zhang, “Wavelet approach for ECG baseline wander correction andnoise reduction,” in Proc. 27th IEEE Annu. Conf. Eng. Med. Biol., Sep.2005, pp. 1212–1215.
[6] C. Li, C. Zheng, and C. F. Tai, “Detection of ECG characteristic pointsusing wavelet transforms,” IEEE Trans. Biomed. Eng., vol. 42, no. 1,pp. 21–28, Jan. 1995.
[7] M. Faezipour, T. M. Tiwari, A. Saeed, M. Nourani, and L. S. Tamil,“Wavelet-based denoising and beat detection of ECG signal,” in Proc.IEEE-NIH Life Sci. Syst. Appl. Workshop,, Apr. 2009, pp. 100–103.
[8] Y. H. Hu, S. Palreddy, and W. J. Tompkins, “A patient adaptive ECG beatclassifier using a mixture of experts approach,” IEEE Trans. Biomed.Eng., vol. 44, no. 9, pp. 891–900, Sep. 1997.
[9] M. H. Song, J. Lee, S. P. Cho, K. J. Lee, and S. K. Yoo, “Support vectormachine based arrhythmia classification using reduced features,” Int. J.Control, Autom., Syst., vol. 3, no. 4, pp. 571–579, Dec. 2005.
[10] R. Besrour, Z. Lachiri, and N. Ellouze, “ECG beat classifier using supportvector machine,” in Proc. 3rd IEEE Int. Conf. Inf. Commun. Technol.:From Theory Appl., Apr. 2008, pp. 1–5.
[11] B. Madhusudan and J. Lockwood, “Design of a system for real-time wormdetection,” in Proc. 12th Annu. IEEE Symp. High Perform. Interconnects,Aug. 2004, pp. 77–83.
[12] M. Faezipour, M. Nourani, and R. Panigrahy, “A real-time worm outbreakdetection system using shared counters,” in Proc. 15th Annu. IEEE Symp.High Perform. Interconnects, Aug. 2007, pp. 65–72.
[13] A. Saeed, M. Faezipour, M. Nourani, S. Banerjee, G. Lee, G. Gupta, andL. S. Tamil, “A scalable wireless body area network for bio-telemetry,”J. Inf. Process. Syst., vol. 5, no. 2, pp. 77–86, Jun. 2009.
[14] MIT-BIH Arrhythmia Database. (2010). [Online]. Available: www.physionet.org/physiobank/database/mitdb
[15] N. V. Thakor and Y. S. Zhu, “Applications of adaptive filtering to ECG anal-ysis: Noise cancellation and arrhythmia detection,” IEEE Trans. Biomed.Eng., vol. 38, no. 8, pp. 785–794, Aug. 1991.
[16] J. P. Martinez, S. Olmos, and P. Laguna, “Evaluation of a wavelet-basedECG waveform detector on the QT database,” Comput. Cardiol., vol. 27,pp. 81–84, Sep. 2000.
[17] P. M. Agante and J. P. Marques de Sa, “ECG noise filtering using waveletswith soft-thresholding methods,” Comput. Cardiol., vol. 26, pp. 535–538,Sep. 1999.
[18] J. S. Sahambi, S. N. Tandon, and R. K. P. Bhatt, “Using wavelet transformsfor ECG characterization: An on-line digital signal processing system,”IEEE Eng. Med. Biol. Mag., vol. 16, no. 1, pp. 77–83, Jan./Feb. 1997.
[19] H. A. N. Dinh, D. K. Kumar, N. D. Pah, and P. Burton, “Wavelets for QRSdetection,” in Proc. 23rd IEEE EMBS Int. Conf., Oct. 2001, pp. 1883–1887.
[20] M. Mohebbi and H. A. Moghadam, “An algorithm for automated detectionof ischemic ECG beats using support vector machines,” in Proc. 15th IEEEConf. Signal Process. Commun. Appl., Jun. 2007, pp. 1–4.
[21] N. Acir, “Classification of ECG beats by using a fast least square supportvector machines with a dynamic programming feature selection algo-rithm,” Neural Comput. Appl. J., vol. 14, pp. 299–309, May 2005.
[22] R. Ghongade and A. Ghatol, “An effective feature set for ECG patternclassification,” in Proc. ICMB, 2007, pp. 25–32.
[23] K. S. Park, B. H. Cho, D. H. Lee, S. H. Song, J. S. Lee, Y. J. Chee, I. Y. Kim,and and S. I. Kim, “Hierarchical support vector machine based heartbeatclassification using higher order statistics and hermite basis function,”Comput. Cardiol., pp. 229–232, Sep. 2008.
[24] I. Christov, G. Gomez-Herrero, V. Krasteva, I. Jekova, A. Gotchev, andK. Egiazarian, “Comparative study of morphological and time-frequencyECG descriptors for heartbeat classification,” Med. Eng. Phys., vol. 28,no. 9, pp. 876–887, Nov. 2006.
[25] H. H. Haseena, A. T. Mathew, and J. K. Paul, “Fuzzy clustered probabilisticand multi layered feed forward neural networks for electrocardiogramarrhythmia classification,” J. Med. Syst., pp. 1–10, Aug. 2009.
[26] E. D. Ubeyli, “Eigenvector methods for automated detection of electrocar-diographic changes in partial epileptic patients,” IEEE Trans. Inf. Technol.Biomed., vol. 13, no. 4, pp. 478–485, Jul. 2009.
[27] I. Iliev, V. Krasteva, and S. Tabakov, “Real-time detection of pathologicalcardiac events in the electrocardiogram,” Physiol. Meas., vol. 28, no. 3,pp. 259–276, 2007.
[28] National Instruments, User Manuals for LabVIEW Toolset Version 8.5.1,2008.
[29] LabVIEW for ECG Signal Processing. (2010). [Online]. Available:http://zone.ni.com/devzone/cda/tut/p/id/6349
[30] I. A. Dotsinsky and T. V. Stoyanov, “Ventricular beat detection in singlechannel electrocardiograms,” BioMedical Engineering OnLine, vol. 3,p. 3, 2004.
[31] F. Zhang, J. Tan, and Y. Lian, “An effective QRS detection algorithm forwearable ECG in body area network,” in Proc. IEEE Biomed. CircuitsSyst. Conf., 2007, pp. 195–199.
[32] H.-Y. Zhou and K.-M. Hou, “Embedded real-time QRS detection algo-rithm for pervasive cardiac care system,” in Proc. 9th IEEE Int. Conf.Signal Process., 2008, pp. 2150–2153.
[33] M. Cvikl and A. Zemva, “FPGA-oriented HW/SW implementation ofECG beat detection and classification algorithm,” Digital Signal Process.,vol. 20, no. 1, pp. 238–248, Jan. 2010.
[34] Z. Yong, H. Wenxue, X. Yonghong, and C. Jianxin, “ECG beats classifi-cation based on ensemble feature composed of independent componentsand QRS complex width,” in Proc. IEEE Int. Conf. Comput. Sci. Softw.Eng., Dec. 2008, vol. 1, pp. 868–871.
[35] European ST-T Database. (2010). [Online]. Available: www.physionet.org/cgi-bin/ATM
[36] I. K. Daskalov, I. A. Dotsinsky, and I. I. Christov, “Developments inECG acquisition, preprocessing, parameter measurement, and recording,”IEEE Eng. Med. Biol. Mag., vol. 17, no. 2, pp. 50–58, Mar./Apr. 1998.
Miad Faezipour (S’06) received the B.S. degree inelectrical engineering from the University of Tehran,Tehran, Iran, in 2002, the M.Sc. and Ph.D. degrees inelectrical engineering from The University of Texasat Dallas, Richardson, in Dec. 2006 and May 2010,respectively, where she was involved in packet con-tent inspection, repetition-based methodologies andhardware implementation.
She is currently a Research Associate at The Uni-versity of Texas at Dallas collaborating with the Cen-ter for Integrated Circuits and Systems and the Qual-
ity of Life Technology Laboratory. Her research interests include high-speedpacket processing architectures, and biomedical signal processing and behavioranalysis methodologies.
Dr. Faezipour is with the IEEE Women in Engineering Group.
FAEZIPOUR et al.: A PATIENT-ADAPTIVE PROFILING SCHEME FOR ECG BEAT CLASSIFICATION 1165
Adnan Saeed received the B.Sc. degree in electri-cal engineering from the National University of Sci-ences and Technology, Islamabad, Pakistan, in 2000,the M.Sc. degree in electrical engineering from TheUniversity of Texas at Dallas, Richardson, in 2008,where he is involved in the research on sensor nodesfor body-area networks. He is currently working to-ward the Ph.D. degree from the University of Texasat Dallas, where he is also a member of the Center forIntegrated Circuits and Systems and Quality of LifeTechnology Laboratory.
Suma Chandrika Bulusu received the B.E. degreein electronics and communications engineering fromthe Osmania University, Hyderabad, India, in 2005,the M.S. degree in electrical engineering from theUniversity of Texas at Dallas, Richardson, in May2010, majoring in signal processing and telecommu-nications.
Her M.S. thesis focused on ECG transient ST-episode detection and machine learning based heartbeat classification. She is a Research Assistant at theUniversity of Texas at Dallas in collaboration with the
Quality of Life Technology Laboratory. Her research interests include biomedi-cal signal processing, data mining and classification techniques in pattern recog-nition, and machine learning applied to the biomedical signals.
Mehrdad Nourani (S’91–M’94–SM’05) receivedthe B.Sc. and M.Sc. degrees in electrical engineer-ing from the University of Tehran, Tehran, Iran, andthe Ph.D. degree in computer engineering from CaseWestern Reserve University, Cleveland, OH.
He was with the Department of Electrical andComputer Engineering, University of Tehran, from1995 to 1998 and the Department of Electrical En-gineering and Computer Science, Case Western Re-serve University, from 1998 to 1999. Since August1999, he has been on the Faculty of the University
of Texas at Dallas, where he is currently an Associate Professor of electricalengineering and a member of the Center for Integrated Circuits and Systems. Heis a cofounder of the Quality of Life Technology Laboratory in the University ofTexas at Dallas, where he is involved in the development of innovative technol-ogy and systems that improve people’s quality of life. He is the author or coauthorof more than 150 papers in journals and refereed conference proceedings. Hiscurrent research interests include fault-tolerant architectures, system-on-chiptesting, signal integrity modeling and test, application specific architecturesfor medical applications and high-speed packet processing methodologies andarchitectures.
Dr. Nourani was a recipient of the Clark Foundation Research Initiation Grantin 2001, the National Science Foundation Career Award in 2002, the Best PaperAward at the 2004 International Conference on Computer Design (ICCD), andCisco Systems Inc. URP Award in 2004 and 2010, respectively. He is a memberof the IEEE Computer Society and the Association for Computing Machinery(ACM) Special Interest Group on Design Automation (SIGDA).
Hlaing Minn (S’99–M’01–SM’07) received the B.E.degree in electronics from the Yangon Institute ofTechnology, Yangon, Myanmar, in 1995, the M.Eng.degree in telecommunications from the Asian Insti-tute of Technology (AIT), Pathumthani, Thailand, in1997, and the Ph.D. degree in electrical engineeringfrom the University of Victoria, Victoria, BC, Canada,in 2001.
He was with the Telecommunications Programin AIT as a Laboratory Supervisor during 1998. Hewas a Research Assistant from 1999 to 2001, and
a Postdoctoral Research Fellow during 2002 in the Department of Electricaland Computer Engineering at the University of Victoria. He has been with theErik Jonsson School of Engineering and Computer Science, the University ofTexas at Dallas, Richardson, since 2002, and currently is an Associate Profes-sor. His research interests include wireless communications, statistical signalprocessing, error control, detection, estimation, synchronization, signal design,cross-layer design, cognitive radios, and wireless healthcare applications.
Dr. Minn is an Editor for the IEEE TRANSACTIONS ON COMMUNICATIONS
and International Journal of Communications and Networks.
Lakshman Tamil (S’81–M’88–SM’05) received thePh.D. degree in electrical engineering and the M.S.degree in mathematics from the University of RhodeIsland, in 1989, the M.Tech degree in microwave andoptical communication engineering from the IndianInstitute of Technology, Kharagpur, India, in 1983,and the B.E. degree in electronics and communicationengineering from the Madurai Kamaraj University,Madurai, India, in 1981.
During 2000-2002, he was the CEO and CTOof Yotta Networks Inc., Richardson, TX, a venture
funded startup that developed and marketed terabit switching platforms 1997–1999, he was Section Head of optics and directed research in optical switching,routing, and networks at the North American Alcatel Research Laboratory,Richardson, TX. He was also a consultant for the Naval Research Laboratories,Raytheon, Alcatel, Spike Technologies, and Electrospace. He was a Leaderin creating both the first Multi-Terabit hybrid optical internet protocol routerand a multichannel multipoint distribution service that was a precursor to theWi-Max. He is currently a Professor of electrical engineering and leads theQuality of Life Technology Laboratory at the University of Texas, Dallas. Heis the author or coauthor of more than 100 scholarly research publications injournals, conferences, and edited volumes. He has supervised 12 students fordoctoral studies and holds 19 U.S. patents. His research interests include qualityof life technologies, radio frequency identification, wireless sensor networks,nanophotonics, and optical transmission, switching and routing.