The IWH-BEAT Questionnaire Validation - MDPI
16
Citation: Toledo, M.; Charles-Leija, H.; Castro, C.G.; Guerrero, I.; Ballesteros-Valdés, R. The IWH-BEAT Questionnaire Validation. Int. J. Environ. Res. Public Health 2022, 19, 3559. https://doi.org/10.3390/ ijerph19063559 Academic Editors: Giulio Arcangeli and Raphael M. Herr Received: 29 December 2021 Accepted: 14 March 2022 Published: 17 March 2022 Publisher’s Note: MDPI stays neutral with regard to jurisdictional claims in published maps and institutional affil- iations. Copyright: © 2022 by the authors. Licensee MDPI, Basel, Switzerland. This article is an open access article distributed under the terms and conditions of the Creative Commons Attribution (CC BY) license (https:// creativecommons.org/licenses/by/ 4.0/). International Journal of Environmental Research and Public Health Article The IWH-BEAT Questionnaire Validation Mario Toledo 1, * , Humberto Charles-Leija 1,2 , Carlos Gustavo Castro 1 , Iván Guerrero 1 and Rosalinda Ballesteros-Valdés 1, * 1 Institute for Wellbeing and Happiness, Universidad Tecmilenio, Monterrey 64909, Mexico; [email protected] (H.C.-L.); [email protected] (C.G.C.); [email protected] (I.G.) 2 Business School, Tecnológico de Monterrey, Monterrey 66269, Mexico * Correspondence: [email protected] (M.T.); [email protected] (R.B.-V.) Abstract: Positive Psychology has been devoted to enhancing well-being within organizations during the first two decades of the current millennium. Unfortunately, little data is available on current assessment related to positive psychology practices in the workplace. Therefore, to assess organizational well-being in a valid and reliable way, a new scale has been created and validated by the Institute for Wellbeing and Happiness at Tecmilenio University in Mexico: the BEAT Questionnaire whose main contribution to previous models is the element of meaningful work. EFA and CFA were carried out to determine and confirm the scale’s structure; internal consistency tests were performed too; additionally, convergence with measures of engagement, labor resources, and worker relations were also confirmed, and discriminant validity was tested by comparing associations with job search intentions and negative relationships in the workplace, yielding an instrument with four clearly defined latent dimensions, composed by 24 highly consistent items, convergent with three other valid and reliable scales. All procedures complied with statistical requirements, delivering a valid and reliable instrument for measuring well-being in the workplace. Keywords: organizational well-being; leadership; positive environments; meaningful work; well-being assessment 1. Introduction Promoting well-being within organizations can be seen as a necessity as well as a competitive advantage. In Mexico, from a few years to now, paying attention to the well-being of the Mexican workforce is perceived as an evident necessity. Only 13% of the Mexican workforce feels actively engaged in their work, while 60% reports feeling disconnected and 27% is actively disengaged [1]. Previous studies have shown that stress in the workplace is a worldwide chronic and urgent matter to organizations [2]. According to data from the Mexican government’s Ministry of Health [3], 75% of Mex- icans suffer from fatigue due to work-related stress, which causes negative consequences at emotional, behavioral, cognitive, and physiological levels. The Mexican Human Resources Management Association (AMEDIRH in Spanish) reports that, annually, five thousand people fall ill due to work-related causes, and absen- teeism represents a 13% loss of annual productivity; also, losses of up to three billion and three hundred thousand pesos a year are estimated due to worker’s distractions, poor time management and work-related stress [4]. Interest in individuals and organizational well-being is growing quickly. Different studies indicate that subjective well-being, life satisfaction, optimism, happiness, purpose, and other positive constructs are associated with numerous desirable outcomes, for exam- ple, lower divorce rates, higher educational and organizational success, as well as better relationships [5–8]. Int. J. Environ. Res. Public Health 2022, 19, 3559. https://doi.org/10.3390/ijerph19063559 https://www.mdpi.com/journal/ijerph
-
Upload
khangminh22 -
Category
Documents
-
view
1 -
download
0
Transcript of The IWH-BEAT Questionnaire Validation - MDPI

�����������������
Citation: Toledo, M.; Charles-Leija,
H.; Castro, C.G.; Guerrero, I.;
Ballesteros-Valdés, R. The IWH-BEAT
Questionnaire Validation. Int. J.
Environ. Res. Public Health 2022, 19,
3559. https://doi.org/10.3390/
ijerph19063559
Academic Editors: Giulio Arcangeli
and Raphael M. Herr
Received: 29 December 2021
Accepted: 14 March 2022
Published: 17 March 2022
Publisher’s Note: MDPI stays neutral
with regard to jurisdictional claims in
published maps and institutional affil-
iations.
Copyright: © 2022 by the authors.
Licensee MDPI, Basel, Switzerland.
This article is an open access article
distributed under the terms and
conditions of the Creative Commons
Attribution (CC BY) license (https://
creativecommons.org/licenses/by/
4.0/).
International Journal of
Environmental Research
and Public Health
Article
The IWH-BEAT Questionnaire ValidationMario Toledo 1,* , Humberto Charles-Leija 1,2, Carlos Gustavo Castro 1, Iván Guerrero 1
and Rosalinda Ballesteros-Valdés 1,*
1 Institute for Wellbeing and Happiness, Universidad Tecmilenio, Monterrey 64909, Mexico;[email protected] (H.C.-L.); [email protected] (C.G.C.);[email protected] (I.G.)
2 Business School, Tecnológico de Monterrey, Monterrey 66269, Mexico* Correspondence: [email protected] (M.T.); [email protected] (R.B.-V.)
Abstract: Positive Psychology has been devoted to enhancing well-being within organizationsduring the first two decades of the current millennium. Unfortunately, little data is available oncurrent assessment related to positive psychology practices in the workplace. Therefore, to assessorganizational well-being in a valid and reliable way, a new scale has been created and validated bythe Institute for Wellbeing and Happiness at Tecmilenio University in Mexico: the BEAT Questionnairewhose main contribution to previous models is the element of meaningful work. EFA and CFA werecarried out to determine and confirm the scale’s structure; internal consistency tests were performedtoo; additionally, convergence with measures of engagement, labor resources, and worker relationswere also confirmed, and discriminant validity was tested by comparing associations with job searchintentions and negative relationships in the workplace, yielding an instrument with four clearlydefined latent dimensions, composed by 24 highly consistent items, convergent with three other validand reliable scales. All procedures complied with statistical requirements, delivering a valid andreliable instrument for measuring well-being in the workplace.
Keywords: organizational well-being; leadership; positive environments; meaningful work;well-being assessment
1. Introduction
Promoting well-being within organizations can be seen as a necessity as well as acompetitive advantage. In Mexico, from a few years to now, paying attention to thewell-being of the Mexican workforce is perceived as an evident necessity. Only 13% ofthe Mexican workforce feels actively engaged in their work, while 60% reports feelingdisconnected and 27% is actively disengaged [1]. Previous studies have shown that stressin the workplace is a worldwide chronic and urgent matter to organizations [2].
According to data from the Mexican government’s Ministry of Health [3], 75% of Mex-icans suffer from fatigue due to work-related stress, which causes negative consequences atemotional, behavioral, cognitive, and physiological levels.
The Mexican Human Resources Management Association (AMEDIRH in Spanish)reports that, annually, five thousand people fall ill due to work-related causes, and absen-teeism represents a 13% loss of annual productivity; also, losses of up to three billion andthree hundred thousand pesos a year are estimated due to worker’s distractions, poor timemanagement and work-related stress [4].
Interest in individuals and organizational well-being is growing quickly. Differentstudies indicate that subjective well-being, life satisfaction, optimism, happiness, purpose,and other positive constructs are associated with numerous desirable outcomes, for exam-ple, lower divorce rates, higher educational and organizational success, as well as betterrelationships [5–8].
Int. J. Environ. Res. Public Health 2022, 19, 3559. https://doi.org/10.3390/ijerph19063559 https://www.mdpi.com/journal/ijerph

Int. J. Environ. Res. Public Health 2022, 19, 3559 2 of 16
It has become increasingly evident that taking care of people’s well-being is an ad-vantage for organizations. On an individual level, when workers report higher levels ofwell-being, they are healthier [8,9], have a higher income [10], they become promoted fasterat work [11,12] and perform better [13]. According to Gallup [14], employees in the upperquartile of “engagement” increase customer satisfaction by 10%, profitability by 22% andproductivity by 21%. Conversely, they report a significant decrease in turnover rates (25%in organizations with high turnover rates, 65% in organizations with low turnover rates),absenteeism (37%), and defects in service or production quality (41%). When individuals re-port higher levels of well-being, they show a positive influence on other people and on theircommunities; they demonstrate better organizational citizenship behaviors [15], inspirecustomer loyalty, and increase other employees’ well-being [16]. Ultimately, organizationalwell-being relates to profit, as organizations with higher levels of it report increases in stockmarket value [17] and higher earnings per share (EPS) of +147%, compared to competitors,while companies with low levels of well-being report a 2% reduction in EPS [1].
Understanding and fostering well-being should be approached from an interdisci-plinary perspective at multiple levels within a system that includes individuals, organiza-tions, communities, and nations [7].
A key element in promoting well-being is its measurement and the documentationof its changes within organizations [18,19] and even within countries [20,21]. This paperpresents the psychometric development and validation, of a well-being measurementinstrument: The BEAT questionnaire; some potential applications are implied too.
1.1. The Importance of Measuring Well-Being at Work
Unfortunately, little data is available on current assessment related to positive psychol-ogy practices in the workplace. As such, there is no critical review or study of wellness andwell-being assessment practices currently available. Furthermore, as Spence [22] points out,the available data suggest that very little evaluation of organizational well-being occurs inpractice, and when it does, it is usually on a superficial level.
From a measurement standpoint, operationalization of positive constructs has ad-vanced so rapidly that their measurement in the workplace has been carried out withoutan adequate basis and with insufficient evidence regarding the suitability of the various in-struments available to assess these constructs [23]. The implications of such a questionablemeasurement issue cannot be underestimated as it can result in a waste of organizationalresources (time and money), inappropriate training initiatives, and in the delivery of mis-leading information to leaders, who in turn pass this information on to their subordinates,creating a vicious circle. It is crucial that, in the rush to harness the potential of thesepositive constructs, organizations and consultants (practitioners) resist the temptation touse unsupported measurement instruments or instruments that are inconsistent with theestablished operationalization of a construct. Rather, they must be willing to invest in theuse of well-established, psychometrically supported, and widely used instruments [24].
Having said that, several benefits of using appropriate measurements in organizationscould be listed, even beyond the results of the evaluations themselves. These benefitsinclude aspects such as the perception that the organization cares about employees (e.g.,improving hiring), that it is an attractive workplace (facilitating retention), that all obtainedinformation can be used to make important management decisions (e.g., how and when torestructure a division), or that such wellness-related information can help manage bothpsychological and physical health in a more specific and constructive way [25,26].
1.2. Healthy and Resilient Organizations (HERO)
Although it is true that there is an urgent need to develop adequate methods tomeasure positive practices and constructs within organizations, there are important refer-ences within the practice of positive organizational psychology that serve as an examplefor a correct implementation of strategies of measurement in organizations. One of thestrongest examples in terms of empirical evidence is the HERO model and its method-

Int. J. Environ. Res. Public Health 2022, 19, 3559 3 of 16
ology. Moving away from Mills’ et al. Critique [24] which suggests that organizationalassessments lack methodological rigor and usually present an absence of clarity in both theapproach and statement of their constructs, the HERO model, clearly defines its own threeconstitutive elements.
The HERO model [27], refers to a combination of three main interrelated components:healthy organizational resources and practices (e.g., work resources, healthy organizationalpractices) as strategies to structure and organize work; healthy employees showing highlevels of psychosocial well-being (e.g., confidence, work commitment); and healthy or-ganizational results (e.g., high performance, corporate social responsibility). The HEROmethodology has two main advantages related to data collection and analysis. Data iscollected from different respondents at different levels of the organization (e.g., CEOs,immediate team supervisors, employees, and clients) and from objective indicators offinancial performance (e.g., return on assets) using quantitative (questionnaires) and quali-tative (interviews) methods. In addition, data analysis is performed at the collective stancefollowing a multilevel perspective (that is, including individuals, teams, and organizations).Finally, it should be noted that the tool designed to evaluate this model, the HERO-Check,complies with psychometric adequacy.
When talking about measurement in formal terms, it is common for authors to usevarious concepts in order to name the tools they use or develop devoted to measure rep-resentative aspects of the phenomena of interest, which can be and usually are attitudes,behaviors, beliefs, preferences, degrees of agreement or disagreement about a topic, per-ceptions, etc.; these tools are called measuring instruments, scales, questionnaires, tests orinventories, among other various terms. For the purposes of the content of this paper, allthese terms will be used synonymously with each other, therefore, if words such as scale orquestionnaire are expressed, they are referring to the same concept, that is, an instrumentor measurement scale: The BEAT Questionnaire.
The BEAT Questionnaire is based upon and named after an organizational well-being methodology, the BEAT Model (which is a Spanish acronym, that represents itsfour main elements: Organizational well-being, Leader’s approach, Positive environments,and Meaningful work) developed by the Institute for Wellbeing and Happiness (IWH) inTecmilenio University, México. Although the acronym was conceived in and it is ideal forreading in Spanish, the English meaning of the word BEAT also refers to the pulse, in otherwords, what brings life to an organization; it is due to this coincidence that the authorsbelieve it works in both contexts.
A common difficulty researchers and practitioners often deal with these types ofevaluations is that management often agrees for this kind of studies to be undertaken onlyat an employee level, but not at management level itself. Following the example of alreadyvalidated scales such as the Hero-Check [27] the BEAT questionnaire seeks to evaluate itsconstructs at different levels of the organization, focusing on managers and supervisors aswell as employees.
Despite being a quantitative measurement tool, it can be added to comprehensiveevaluation processes that seek evidence of the organization’s resources (facilities, HRmanagement programs, etc.) in a qualitative way. Another benefit is the briefness inits extension and application time, which can be less than 10 min, which stimulates theresponse rate since it is less tiring for the participants, compared to what has been seen inexhaustive evaluations [28]. In addition, it seeks to comply with adequate psychometricthoroughness, that is, to achieve measurement validity and reliability.
1.3. The BEAT Scale: The Pulse of the Organization1.3.1. Organizational Well-Being
One element that all work environments have in common is the relationship betweenlabor requirements and job resources. Labor requirements are those physical, psycholog-ical, organizational, or social aspects of work that demand sustained effort and have aphysiological and psychological toll on workers [29]. Some harmful examples of these

Int. J. Environ. Res. Public Health 2022, 19, 3559 4 of 16
demands can be work overload, as well as routine or role conflict. On the other hand,work resources are those physical, psychological, or organizational aspects that serve up toachieve objectives, reduce the harmful effects of work requirements, and stimulate personalgrowth [30].
When there is an imbalance between labor requirements and resources, a process oferosion is generated so that it is reflected in symptoms of organizational-derived disease,such as “burnout”, while when requirements and resources are well balanced, a process ofmotivation is usually generated and reflected in positive states related to well-being, suchas “engagement” [27–31].
One of the elements proposed by organizational well-being models is the implementa-tion of resources and organizational practices that help employees to be able to overcomework challenges daily. Based on the elements proposed in the HERO model, some positivepractices can be named, such as work-life balance, mobbing prevention, psychosocialhealth, career development, and organizational communication. On the other hand, taskresources that enable the performance of collaborators should also be included, for exam-ple, autonomy, feedback, teamwork, and the promotion of positive and transformationalleadership [32].
The BEAT questionnaire allows workers to have a voice: to indicate what is good orbad within the organization, and what they perceive the company offers them in orderto increase the chances of flourishing as people and professionals, which is in line withthe approaches of Cameron et al., [33]. The worker can express if he or she considers thatthe organization conveys a sincere concern for his or her well-being, as well as his or herperception of justice during hiring and promotion processes. It is valuable that workersperceive that their effort and loyalty are deemed, since a worker who does not perceivethat his or her company values his or her work, will have less commitment and will be lessdedicated in their tasks within the workplace. The well-being of an organization should notbe seen as an individual responsibility but as a shared one; an organization that providessufficient resources to its collaborators will have a greater opportunity to impact theirwell-being and its own flourishing.
1.3.2. Focus on Positive Leadership
It is said that people do not quit their job, they quit their leader. Leadership isincreasingly becoming an important research topic, and different leadership styles play animportant role in promoting employee well-being and organization results [34,35].
Positive leadership is based on the application of positive principles of behavior thatemerged from Positive Organizational Psychology also known as POP [36]. Specifically,positive leadership has three basic components: it focuses on those people’s strengthsand abilities that reaffirm their human potential, emphasizes results, and facilitates above-average individual and organizational performance; its field of action focuses on thosecomponents that can be conceived as essential virtues of the human condition. Accordingto Cameron [34] there are four ways or strategies for the implementation of positive leader-ship: fostering positive emotions such as compassion, forgiveness, and gratitude; creatingrelational energy as a result of positive relationships; using supportive communication inpositive feedback processes; and doing a positive, meaningful work [33,34,37,38].
Thus, the BEAT questionnaire allows the collaborator to evaluate the approach that hisor her leader has, based on the theoretical framework provided by the positiveleadership approach.
1.3.3. Positive Environmental Features
Relationships in the workplace are fundamental for personal well-being, but also forproductivity. People relate to each other at work and build ties, and given the humannatural need for interaction and connection, having a positive environment where peo-ple can develop positive and meaningful relationships at work is an important factor toconsider while improving wellbeing at the workplace. Studies such as Raile et al. [39]

Int. J. Environ. Res. Public Health 2022, 19, 3559 5 of 16
found that strong connections (i.e., friendship at work) showed a positive correlation withpsychological wellbeing and job satisfaction. In addition, positive relationships can be animportant source of relational energy; Bakker et al. [40] found that teams with a higherdensity network report a greater level of energy and performance. Dutton [41], suggestthat there are practical strategies for building high-quality connections at work, such asrespectful engagement, task enabling, and trust.
Positive interactions play an important role in the workplace, specially predicting teamperformance. Following on Gottman’s [42] research on married couples, Losada et al. [43]found that the same ratio of positive to negative interactions (5 to 1) is the critical differen-tiator between high-, medium-, and low-performing teams.
Fostering a shared identity in the workplace is another important feature for creating apositive environment. In a study conducted by Sherif [44], introducing compellingly sharedgoals that required the collaborative efforts of all, proved to be an effective strategy forreducing tension between team members. The common in-group identity model can explainthis effect, when people are induced to recategorize themselves as a superordinate grouprather than as separate groups, out-group biases are reduced (i.e., prejudice, discrimination).This has huge implications for building a more positive environment where people canthrive in their workplace.
1.3.4. Meaningful Work
Psychology of working theory (PWT) explains how structural and psychologicalfactors have an impact on accessing a fulfilling job [45]. According to this theory, one of itskey elements is Meaningful work. Steger et al. [46] define meaningful work by three keyelements; positive meaning refers to a job that has a personal significance; meaning makingtrough work, which im-plies that people’s work can help them build meaning in their ownlives; and greater good motivation, a facet that reflects commonly held ideas that work ismost meaningful when it has a broader impact on others.
Psychology of working theory (PWT) explains how structural and psychologicalfactors have an impact on accessing a fulfilling job [45]. According to this theory, one ofits key elements is Meaningful work. Steger et al. [46] define meaningful work by threekey elements; positive meaning, refers to a job that has a personal significance; meaningmaking trough work, which implies that people’s work can help them build meaning intheir own lives; and greater good motivation, a facet that reflects commonly held ideas thatwork is most meaningful when it has a broader impact on others.
Meaningfulness is a fundamental human and psychological need; when satisfied, itcan lead to positives outcomes, such as work engagement, job satisfaction, life satisfaction,life expectancy, mental and physical health, wellbeing, meaning in life, organizationalcitizenship behaviors, self-rated job performance, and withdrawal intentions [47–51]; whenunsatisfied, it can lead to negative outcomes, such as substance abuse, suicidal ideation,alienation, and poor workplace performance [50].
PWT suggests that access to a meaningful and fulfilling work is attributable to de-cent work (i.e., fair income, non-discriminatory) via three groups of basic needs: (a) sur-vival/power needs, which refer to basic needs such as food and shelter, and access toopportunities; (b) social contribution needs, which refer to the need to contribute andbelonging, and (c) self-determination needs, which include autonomy, competence, andrelatedness [45]. In other words, work can be a pathway not only to meet basic needs, butto also, to fulfill deeper ones such as belonging to a community and integrating intrinsicvalues into action.
People want their careers and their work to be more than simply a way to earn apaycheck; they want their work to mean something [49]. For example, when people´s taskscontribute to the well-being of others, they are much more rewarding, meaningful, andtranscendental [52,53].
The BEAT questionnaire is designed to offer the collaborator a possibility of eval-uating whether their work is meaningful for them, if their tasks contribute to a better

Int. J. Environ. Res. Public Health 2022, 19, 3559 6 of 16
understanding of their world, make sense of the world around them, and contribute to agreater good.
1.3.5. Contributions of the BEAT Scale
The BEAT scale integrates different elements related to well-being within organizations.It picks up elements from other positive organization models such as the organizationalresources of the HERO model, the positive leader strategies of Cameron [34], and the high-quality connections of Dutton [41]. However, its greatest contribution to the constructionof a model that evaluates such constitutive factors of a positive organization is the elementof meaningful work.
The search for meaning is a human need for most people, and work is one of the mainactivities that contribute to the satisfaction of that need. By allowing both the expression ofindividuality and the opportunity to make a purposeful contribution while connecting withothers [52], work can help with meeting that need. While models such as HERO considersocial and organizational resources, as well as leadership as elements that constitute apositive organization, the BEAT model also proposes the evaluation of, to what extentemployees perceive that they contribute to society or that their work helps them satisfytheir need for significance.
When people pursue a deep purpose or become involved in a work that is personallyimportant, they experience significant positive effects, such as: higher levels of engagement,empowerment, satisfaction, and a sense of accomplishment [53,54]. As described in theliterature, it is because of such effects of meaningful work on people that it is considered acapital element for the constitution of a positive organization.
2. Materials and Methods2.1. Participants
For the present study, data of 395 employees of Tecmilenio, a private university inMexico, were collected during the month of April 2021. 257 women (65.1%) and 135 men(34.2%) were surveyed, while 3 people (0.8%) preferred not to specify their gender. Sevenuniversity campuses in different states of the Mexican Republic participated: Culiacan(n = 38), Ferrería (n = 67), Laguna (n = 29), Las Torres, (n = 123), Mazatlán (n = 44), San LuisPotosí (n = 56), and Veracruz (n = 38). Initially, data of 474 collaborators were collected, butin the end, only 395 complete surveys were kept for the analysis.
2.2. Measurements
The BEAT questionnaire is made up of 24 items that evaluate the four elements of themodel: Organizational Well-being (5 items), Positive leadership (8 items), Positive environments(3 items) and Meaningful work (8 items). It uses a Likert scale ranging from 1 to 5 where 1 istotally disagree and 5 is totally agree.
To analyze the convergent validity of the BEAT questionnaire, correlations with otherelements of well-being in organizations were sought, such as engagement, satisfaction withlabor resources, and discriminant validity with worker relations and job search. A varietyof studies showed a positive correlation between the BEAT elements with engagement, andsatisfaction with organizational and leadership resources [55–57]; and a negative correlationwith poor work relations [58] and job search [59].
For the aims of this study, the adaptation of the UWES-9 to the Mexican populationcomposed by 9 items was used [28]. The UWES-9 measure three components of engagement:vigor, absorption, and dedication.
The scale of satisfaction with work resources (CSRL-16) [57] based upon the HEROmodel [27] has 16 items that measure people’s satisfaction with organizational resources:Resources of the leader (4 items in CSRLL), Task resources (4 items in CSRLT), Organizationalresources (4 items in CSRLO).

Int. J. Environ. Res. Public Health 2022, 19, 3559 7 of 16
The worker relations scale (WRS) [60] is a measure used to test discriminant validity.The three-question scale measures unsatisfactory labor relations. It is expected to show anegative correlation with all the constructs evaluated in the BEAT questionnaire.
A second scale to measure discriminant validity was the job search (JS) question,adapted from Bluedorn [59]. Companies with high levels on the BEAT scale are expectedto have fewer employees seeking other job opportunities.
2.3. Procedure
To perform the psychometric validation of the BEAT scale, data from seven differ-ent campuses were collected. Face validity was obtained through the opinions of thepeople from HR departments who agreed and gave approval to the questionnaire. Thequestionnaire was launched through an electronic link (using the Qualtrics platform) anddisseminated via an email that included an invitation to participate along with a detaileddescription of the research objectives and instructions for answering the questionnaire. Toaddress ethical issues, the procedures complied with the ethical standards in the MexicanEthical Code of the Psychologist [61]. Participation was voluntary and informed consentwas obtained after the question: “Do you agree to participate in this research by answeringthe survey?” The participants were asked to click on a yes or no box, after which they couldcomplete the questionnaire; if they refused (by answering no), the survey was automaticallycanceled. Anonymity and confidentiality were always guaranteed. All procedures werenon-invasive, and no harm was induced as a consequence of participation in the study.
2.4. Analytical Procedure
The psychometric analysis of the BEAT scale consisted in (a) exploratory factorialanalysis (EFA) to examine the theoretical structure of the instrument, (b) internal consistencytests, (c) convergent and discriminant validity tests and finally, (d) confirmatory factorialanalysis (CFA) to test the robustness of the model.
Initially, an exploratory factor analysis (EFA) with all 43 items of the instrument wasperformed and the obtained matrix showed that some items loaded poorly with respectto factors; due to this reason, it was decided to eliminate them from subsequent analyzes;following rounds of EFA and internal consistency analyses were performed yielding a finalfour factor solution with 24 items.
Later, the original sample of 395 individuals was randomly split to generate twodifferent datasets (N1 = 199 and N2 = 196); 199 observations were used for a new exploratoryfactor analysis (EFA) and internal consistency tests to re-examine the theoretical structure ofthe instrument with 24 items; in addition, with the aim of investigating whether the factorstructure can be replicated in the new dataset from 196 participants (N2), a confirmatoryfactor analysis (CFA) was conducted.
Additionally, in order to test construct validity, the composite reliability coefficient(CR), the average variance extracted (AVE) and their respective standardized factor loadingsalong with its standardized error were obtained. Correlations (Pearson r) with CSRL,UWES-9 as proxy criterion measures and the WRS scale and a Job Search (JS) item asdiscriminant measures.
These final EFA, internal consistency analysis CFA, and correlations were completedwith 24 items and the results are presented in the next section. Data were analyzed usingSPSS (21), Excel (2019) and R (3.6).
3. Results3.1. Exploratory Factor Analysis
Concerning the construct validity, an exploratory factor analysis (EFA) with factorextraction by principal components analysis (PCA) was performed to reduce the numberof variables and detect redundant items or items that provide little information [62]. Itwas explored if the items explained a great amount of the common variance or if they

Int. J. Environ. Res. Public Health 2022, 19, 3559 8 of 16
rather reflected uniqueness. The EFA showed a balanced four factors result with a commonvariance within factor-items and also parallel or tau-equivalent items composing each one.
These factors were expected to be the four constructs of the BEAT Model a priori, yetthis analysis was performed in an exploratory fashion and, to confirm the BEAT modelscale structure, a confirmatory factor analysis (CFA) was carried on too, as shown in thefollowing pages.
To assess the strength of the relationship between pairs of variables or items basedon partial correlations, and to verify that the number of explanatory factors is small, theKaiser-Meyer-Olkin (KMO) test was used. The value obtained was 0.945, which justifies afactor analysis [62]. Regarding Bartlett’s Test of Sphericity, it is shown that, in fact, there isa statistically significant correlation between the variables (p < 0.05.). Therefore, the factoranalysis is applicable, as shown in Table 1.
Table 1. Eigenvalues, variance, and Cronbach’s α.
B E A T
Eigenvalues 9.75 3.37 1.83 1.49Variance accounted for each factor % 40.61 14.06 7.61 6.20Cumulative variance accounted for each solution (%) 40.61 54.68 62.28 68.48α 0.79 0.96 0.89 0.89N of Items 5 8 3 8
BEAT Scale’s α = 0.93, KMO = 0.92, Approx. Chi-Square 3513.35, df = 276, Total of items = 24.
Principal components with eigenvalues greater than 1 were considered for the EFA, asrecommended by specialized literature (see eigenvalue rule, Kaiser) [62–64]. Data showthat there are four principal components to be considered. These factors explain 62.4% ofthe variance, as shown in Table 1. Table 2 shows both item distribution through all fourfactors (or principal components) and the number of items composing each one of them, aswell as the factor loadings which ranged from 0.595 to 0.878.
Table 2. Factorial loadings after varimax rotation.
B E A T Communalities
b1 0.10 0.11 0.76 0.04 0.59b2 0.09 0.17 0.70 0.03 0.53b3 0.06 0.10 0.73 0.15 0.58b4 0.12 0.27 0.58 0.19 0.46b5 0.24 0.27 0.68 0.13 0.61e1 0.83 0.13 0.05 0.14 0.73e2 0.90 0.16 0.09 0.12 0.86e3 0.83 0.25 0.11 0.15 0.78e4 0.86 0.19 0.15 0.15 0.83e5 0.88 0.15 0.17 0.13 0.83e6 0.86 0.15 0.15 0.09 0.79e7 0.87 0.12 0.14 0.19 0.83e8 0.85 0.10 0.09 0.23 0.79a1 0.20 0.12 0.17 0.86 0.82a2 0.32 0.21 0.14 0.83 0.85a3 0.28 0.20 0.17 0.79 0.77t1 0.21 0.72 0.05 0.01 0.57t2 0.00 0.75 0.11 0.02 0.58t3 0.17 0.74 0.14 0.09 0.61t4 0.05 0.83 0.09 0.08 0.70

Int. J. Environ. Res. Public Health 2022, 19, 3559 9 of 16
Table 2. Cont.
B E A T Communalities
t5 0.20 0.78 0.24 0.11 0.72t6 0.16 0.71 0.26 0.18 0.63t7 0.27 0.64 0.31 0.19 0.62t8 0.19 0.51 0.14 0.25 0.38
Extraction method: Principal components analysis. Rotation method: Varimax with Kaiser normalization. Therotation converged in 7 iterations. Bold font indicates that the factor loading is significant at 95% level.
3.1.1. Reliability and Item Analysis
To determine the reliability of the instrument, Cronbach’s alpha values were obtainedfor each latent dimension of the scale. All Cronbach’s values are higher than 0.80, whichis an indicator of high internal consistency or equivalence between parallel items of eachlatent factor or dimension [65]. The instrument obtained a global alpha close to 0.95, whichis considered a coefficient that acceptably represents the magnitude of the correlationbetween all 24 items, as shown in Table 1.
3.1.2. Convergent and Discriminant Validity
Table 3 shows latent dimensions (factors) with their respective standardized factorloadings, its composite reliability (CR) and the average variance extracted (AVE). As canbe seen, the CR and AVE coefficients were above the minimum criteria of CR ≥ 0.7 andAVE ≥ 0.5 [66].
Table 3. Overall Confirmatory Factor Analysis (CFA) for the BEAT Measurement Model.
Constructs and Items Factor Loadings SE CR AVE
B
psycho-social health0.810.710.83
0.040.050.05
Healthy Organization Practices Information andcommunication 0.77 0.04 0.87 0.58
Skill development 0.69 0.05
E
Positive communication0.840.890.9
0.030.020.01
Positive Leadership Strength recognition 0.920.91
0.010.01 0.97 0.81
Positive relationships0.930.870.93
0.010.020.01
A
Task enabling 0.81 0.02
Positive Environments Trust 0.90 0.02 0.88 0.71
Respectful engagement 0.82 0.02
T
Positive meaning0.760.730.73
0.010.030.02
Meaningful Work Meaning Making0.700.850.57
0.010.010.01
0.91 0.55
Greater good motivation 0.750.80
0.010.01

Int. J. Environ. Res. Public Health 2022, 19, 3559 10 of 16
The Table 4 shows correlations between the items that make up the four factors of theBEAT questionnaire compared with the CSRL proposed by Spontón, Trógolo, Castellano,Morera, and Medrano [57]. Correlation between the UWES-9 engagement scale, Spanishversion of Hernandez-Vargas et al. [28], and the BEAT scale are also observed. Finally, thereis a negative correlation between BEAT JS and WRS, as expected, because items of WRSmeasure negative relationship with co-workers and JS measures the intention of finding anew job, deemed as job search.
Table 4. Convergent and discriminant validity (BEAT, CSRL, UWES, WRS and JS).
BEAT B E A T CSRLO CSRL CSRL WRS UWES-9 JS
BEAT 1B 0.670 ** 1E 0.859 ** 0.350 ** 1A 0.686 ** 0.394 ** 0.489 ** 1T 0.743 ** 0.491 ** 0.416 ** 0.419 ** 1
CSRLO 0.656 ** 0.552 ** 0.457 ** 0.460 ** 0.568 ** 1CSRLL 0.745 ** 0.334 ** 0.851 ** 0.422 ** 0.357 ** 0.480 ** 1CSRLT 0.679 ** 0.588 ** 0.438 ** 0.474 ** 0.639 ** 0.680 ** 0.488 ** 1WRS −0.477 ** −0.348 ** −0.333 ** −0.572 ** −0.312 ** −0.356 ** −0.259 ** −0.355 ** 1
UWES-9 0.587 ** 0.404 ** 0.361 ** 0.390 ** 0.678 ** 0.567 ** 0.343 ** 0.665 ** −0.366 ** 1JS −0.301 ** −0.142 * −0.324 ** −0.129 −0.194 ** −0.417 ** −0.321 ** −0.292 ** 0.100 −0.214 ** 1
**. Correlation is significant at p < 0.01 (two-tailed test), *. Correlation is significant at p < 0.05 (two-tailed test).
3.2. Confirmatory Factor Analysis
In order to verify the BEAT scale measurement model, a confirmatory factor analysis(CFA), which is a particular case of a structural equation model (SEM), was carried out.The model was specified with each variable by saturating only on the common factorthat it measures, and the unique factors are uncorrelated (although they covary together).The CFA was carried out using the maximum likelihood (ML) estimator according to theassumption of multivariate normality of the items [67] and the nonlinear minimizationsubject to box constraints (NLMINB) optimization method, to avoid false convergence.
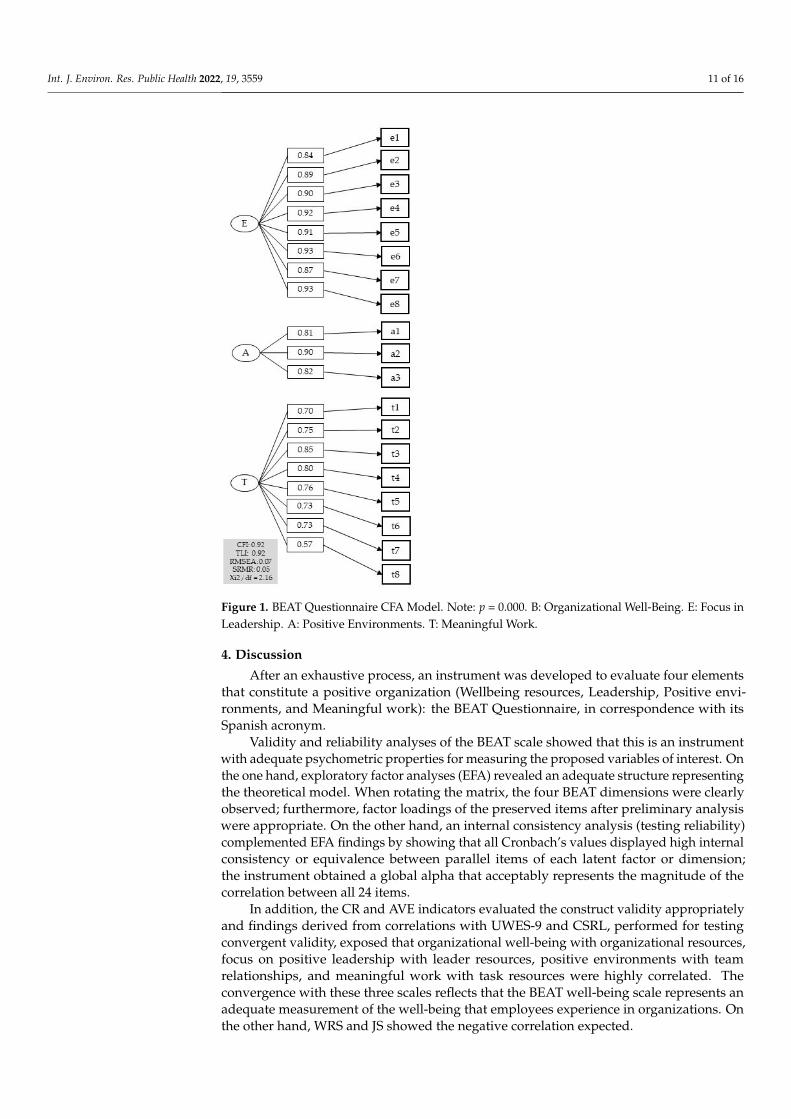
Research literature recommends a comparative fit index (CFI) and a Tucker and Lewisindex (TLI) greater than 0.90, as well as a mean square error of approximation (RMSEA)less than 0.06 ideally and less than 0.08 [68] acceptably a standardized root mean squareresidual (SRMR) less than 0.08 [69]. Regarding the absolute and relative indexes of themodel, the current analysis yielded all these coefficients (N = 196; TLI = 0.920; CFI = 0.928;RMSEA = 0.077; SRMR = 0.054; Xi2/df = 2.16). see Figure 1.
The graphical model shows the four latent variables clearly separated and the itemsbelonging to and determined by each one. Factor loadings are robust and significant.
Int. J. Environ. Res. Public Health 2022, 19, x FOR PEER REVIEW 11 of 16
3.2. Confirmatory Factor Analysis In order to verify the BEAT scale measurement model, a confirmatory factor analysis
(CFA), which is a particular case of a structural equation model (SEM), was carried out. The model was specified with each variable by saturating only on the common factor that it measures, and the unique factors are uncorrelated (although they covary together). The CFA was carried out using the maximum likelihood (ML) estimator according to the as-sumption of multivariate normality of the items [67] and the nonlinear minimization sub-ject to box constraints (NLMINB) optimization method, to avoid false convergence.
Research literature recommends a comparative fit index (CFI) and a Tucker and Lewis index (TLI) greater than 0.90, as well as a mean square error of approximation (RMSEA) less than 0.06 ideally and less than 0.08 [68] acceptably a standardized root mean square residual (SRMR) less than 0.08 [69]. Regarding the absolute and relative indexes of the model, the current analysis yielded all these coefficients (N = 196; TLI = 0.920; CFI = 0.928; RMSEA = 0.077; SRMR = 0.054; Xi2/df = 2.16). see Figure 1.
The graphical model shows the four latent variables clearly separated and the items belonging to and determined by each one. Factor loadings are robust and significant.
Figure 1. Cont.
Int. J. Environ. Res. Public Health 2022, 19, 3559 11 of 16
Int. J. Environ. Res. Public Health 2022, 19, x FOR PEER REVIEW 11 of 16
3.2. Confirmatory Factor Analysis In order to verify the BEAT scale measurement model, a confirmatory factor analysis
(CFA), which is a particular case of a structural equation model (SEM), was carried out. The model was specified with each variable by saturating only on the common factor that it measures, and the unique factors are uncorrelated (although they covary together). The CFA was carried out using the maximum likelihood (ML) estimator according to the as-sumption of multivariate normality of the items [67] and the nonlinear minimization sub-ject to box constraints (NLMINB) optimization method, to avoid false convergence.
Research literature recommends a comparative fit index (CFI) and a Tucker and Lewis index (TLI) greater than 0.90, as well as a mean square error of approximation (RMSEA) less than 0.06 ideally and less than 0.08 [68] acceptably a standardized root mean square residual (SRMR) less than 0.08 [69]. Regarding the absolute and relative indexes of the model, the current analysis yielded all these coefficients (N = 196; TLI = 0.920; CFI = 0.928; RMSEA = 0.077; SRMR = 0.054; Xi2/df = 2.16). see Figure 1.
The graphical model shows the four latent variables clearly separated and the items belonging to and determined by each one. Factor loadings are robust and significant.
Figure 1. BEAT Questionnaire CFA Model. Note: p = 0.000. B: Organizational Well-Being. E: Focus inLeadership. A: Positive Environments. T: Meaningful Work.
4. Discussion
After an exhaustive process, an instrument was developed to evaluate four elementsthat constitute a positive organization (Wellbeing resources, Leadership, Positive envi-ronments, and Meaningful work): the BEAT Questionnaire, in correspondence with itsSpanish acronym.
Validity and reliability analyses of the BEAT scale showed that this is an instrumentwith adequate psychometric properties for measuring the proposed variables of interest. Onthe one hand, exploratory factor analyses (EFA) revealed an adequate structure representingthe theoretical model. When rotating the matrix, the four BEAT dimensions were clearlyobserved; furthermore, factor loadings of the preserved items after preliminary analysiswere appropriate. On the other hand, an internal consistency analysis (testing reliability)complemented EFA findings by showing that all Cronbach’s values displayed high internalconsistency or equivalence between parallel items of each latent factor or dimension;the instrument obtained a global alpha that acceptably represents the magnitude of thecorrelation between all 24 items.
In addition, the CR and AVE indicators evaluated the construct validity appropriatelyand findings derived from correlations with UWES-9 and CSRL, performed for testingconvergent validity, exposed that organizational well-being with organizational resources,focus on positive leadership with leader resources, positive environments with teamrelationships, and meaningful work with task resources were highly correlated. Theconvergence with these three scales reflects that the BEAT well-being scale represents anadequate measurement of the well-being that employees experience in organizations. Onthe other hand, WRS and JS showed the negative correlation expected.

Int. J. Environ. Res. Public Health 2022, 19, 3559 12 of 16
Confirmatory modelling of data using CFA also showed that (a) the instrument mea-sures the four BEAT dimensions adequately and (b) all items are grouped with appropriatefactor loadings. Regarding the absolute and relative indexes of the models, current analy-ses yielded reasonably acceptable coefficients. The RMSEA was at an acceptable but notexcellent level as proposed by authors [70]; however, the other indexes showed betteradequacy, implying an overall goodness of fit for both models (the correlations’ path andthe covariances’ path models).
Although there is recent objective criticism towards the methods of the classical testtheory, also known as true score theory, when it measures reliability and the exploratorystandpoint represented by EFA methods when it measures validity [67], the large psy-chometric tradition has been based upon these methods to such an extent that they havebecome standard practices [71–73]. Therefore, the authors of this article have preferred totake advantage of both positions and their benefits in a complementary sense, recognizingthat the debate remains open.
In general terms, using both approaches (those derived from classical measurementtheories as well as those developments derived from the a priori perspective embodied byprecursors of SEM modeling such as CFA) showed that the scale meets the requirementsprescribed in classic psychometric development studies [71–74] as well as in recent onesdevoted to testing each item’s validity and reliability [67]. Altogether these proceduresrender empirical evidence that the instrument has adequate psychometric properties andconfirms its validity and reliability.
One benefit that can be obtained by using the BEAT scale is the possibility of evalu-ating multiple spheres. When reporting BEAT scale results to organizations, it is highlyrecommended that the multidimensional structure be kept and interpreted, instead ofcondensing a unique score. While a single overall score could provide an overview oforganizational well-being, such an approximation will disguise the variation between itsdifferent composing elements. For example, presenting an overall score to a companymay be insufficient when conducting an intervention. Instead, if any given organizationscores low in meaningful work, interventions can aim to develop strategies such as “jobcrafting” to build a more meaningful perception of work rather than trying to fix the otherorganizational well-being aspects that might be working good otherwise [56,75].
Limitations
It is not possible to recommend an ideal scoring profile for the BEAT scale becausecut points haven’t been established yet due to sampling size limitations. There is a lack ofrepresentativeness of the sample because the study was carried out in only one university(even though it has campuses across the Country) with workers who might already betrained in a previously long-established work well-being culture, producing a ceilingeffect from the start. Consequently, the instrument is at a descriptive stage, but is stilluseful to obtain valuable information when comparing group performances to a certainbut reliable extent.
There is still a need to validate the tool in wider samples to achieve adequate repre-sentativeness; test-retest and cross validation procedures are still required too. In addition,based upon different contextual aspects and realities of the companies, diverse score pro-files are expected depending on their type, size, or line of business. Currently, data from32 companies all over the Mexican territory are being processed and analyzed with the aimof improving the instrument’s general applicability as a potential decision-making tool forthe industry. Future research should examine contextual variations that may influence theBEAT questionnaire scoring.
5. Conclusions
In conclusion, it can be stressed that the BEAT questionnaire is an instrument withadequate psychometric properties for measuring paramount, constitutive organizational

Int. J. Environ. Res. Public Health 2022, 19, 3559 13 of 16
well-being aspects in line to theoretical proposals such as the HERO model and the BEATmodel developed by the IWH of Tecmilenio University.
Organizational Well-being. The BEAT scale can be a useful tool to apply in organizationsas it gives employees a voice by allowing them to talk about how they feel regardingthe resources that their organization provides them with to improve their well-being.By knowing this information, companies can play an active role in the development ofmotivational processes that lead to higher levels of work commitment and, naturally,well-being.
Focus on leadership. Assessing the leader’s approach is also a useful strategy for thesake of achieving higher well-being levels within companies. Different studies reaffirmthe impact that leaders have on their collaborators’ well-being and the organization’sproductivity and results. The promotion of forgiveness, compassion, and gratitude, assources of relational energy and supportive communication, create greater well-being,performance, and are paramount features to be measured too.
Positive environments. Research carried out by POP has confirmed that relationshipsare a great predictor of well-being both at work and in life. For companies, it is capitalto rely on valid measures of how relationships are lived within the organization. TheBEAT scale can offer key information features to guide the decision-making process tohelp organization and teams develop better personnel interactions, greater group cohesion,support, and commitment.
Meaningful work. In addition to evaluating those elements that literature points outas factors of well-being in organizations, the BEAT questionnaire measures the meaningemployees give to their work, enabling a way to know more about their perception aboutdaily tasks, and the impact of these tasks on the employee’s well-being.
In future research, the authors suggest the possibility of analyzing factual relationsbetween the BEAT model and other positive organizational behaviors such as engage-ment, productivity, job satisfaction as well as negative outcome variables such as burnout,turnover rates, etc.
The BEAT model, based on recent findings from the POP, offers the possibility fororganizations to know themselves better and identify areas of opportunity related to insti-tutional well-being. In addition, providing employees with the opportunity of increasingtheir own well-being is an idea that is gradually gaining presence in organizations’ culturalchange, and the tool presented in this article is an effort to have an instrument that providesuseful, valid, and replicable information.
Author Contributions: Conceptualization, I.G., M.T. and H.C.-L.; methodology, M.T. and H.C.-L.;formal analysis, H.C.-L. and C.G.C.; investigation, M.T., H.C.-L. and I.G.; data curation, H.C.-L.and C.G.C.; writing—original draft preparation, M.T., H.C.-L. and C.G.C.; writing—review andediting, M.T., C.G.C. and H.C.-L.; visualization, M.T., C.G.C. and H.C.-L.; supervision, R.B.-V.; projectadministration, I.G.; All authors have read and agreed to the published version of the manuscript.
Funding: This research received no external funding, nor specific grant from funding agencies in thepublic, commercial, or not-for-profit sectors.
Institutional Review Board Statement: The present study did not require any ethical approvalbecause the study was conducted in accordance with the Mexican ethical code of the psychologist, norisk nor physical and/or psychological harm was induced during the process of participating in thestudy and all participants did it voluntarily with the option of withdrawal at any time if desired.
Informed Consent Statement: Informed consent was obtained from all subjects involved in the studyby clicking on the electronic button of acceptance to participate. Previously they had been informedand disclosed about the aims of the study and the possibility of withdrawal if desired, as well asthe confidentiality and privacy of their answers; all these aspects are described in the procedure’ssubsection of the Materials and Methods section.
Data Availability Statement: The questionnaire can be available upon request only for research, non-commercial purposes. To access the analytic information, please refer to https://drive.google.com/drive/folders/1NbEQbkwYegs73oiFlKq9P01NFAs5KL8q?usp=sharing (accessed on 13 March 2022).
Int. J. Environ. Res. Public Health 2022, 19, 3559 14 of 16
Acknowledgments: We extend special thanks to the departments of Talent & Culture, the differentcampus directors, current Provost Bruno Zepeda Blouin and former Provost Héctor Escamilla fortheir thorough support in this endeavor and without whom, this study couldn’t be possible.
Conflicts of Interest: The authors declare no conflict of interest.
References1. Crabtree, S. Worldwide, 13% of Employees Are Engaged at Work. 2013. Available online: https://news.gallup.com/poll/165269
/worldwide-employees-engaged-work.aspx (accessed on 13 March 2022).2. Nixon, A.E.; Mazzola, J.J.; Bauera, J.; Krueger, J.R.; Spector, P.E. Can Work Make You Sick? A Meta-Analysis of the Relationships
between Job Stressors and Physical Symptoms. Work Stress 2011, 25, 1–22. [CrossRef]3. Instituo Mexicano del Seguro Social. Estrés Laboral. 2021. Available online: http://www.imss.gob.mx/salud-en-linea/estres-
laboral (accessed on 28 December 2021).4. Gutierrez, T. Si Tus Empleados Enferman, Tu Empresa También. 2014. Available online: https://www.altonivel.com.mx/
liderazgo/management/46750-empleados-enfermos-perdidas-cuantiosas-para-empresas (accessed on 13 March 2022).5. Ballesteros-Valdés, R.; Charles-Leija, H. A comparative study of wellbeing in students during the COVID-19 pandemic. Tec-
milenio Case. In Wellbeing and Resilience Education: COVID-19 and Its Impact on Education Systems; White, M., McCallum, F., Eds.;Routledge, Taylor & Francis Group: Abingdon, UK, 2021.
6. Diener, E.; Chan, M. Happy People Live Longer: Subjective Well-Being Contributes to Health and Longevity. PsycEXTRA Dataset2010, 3, 1–43. [CrossRef]
7. Huppert, F.A.; So, T.T.C. Flourishing Across Europe: Application of a New Conceptual Framework for Defining Well-Being. Soc.Indic. Res. 2013, 110, 837–861. [CrossRef]
8. Lyubomirsky, S.; King, L.; Diener, E. The Benefits of Frequent Positive Affect: Does Happiness Lead to Success? Psychol. Bull.2005, 131, 803–855. [CrossRef] [PubMed]
9. Bertera, R.L. The effects of workplace health promotion on absenteeism and employment costs in a large industrial population.Am. J. Public Health 1990, 80, 1101–1105. [CrossRef] [PubMed]
10. Koo, J.; Suh, E.M.; Koo, J.; Suh, E.M. The influence of happiness on future income and job performance. Korean J. Soc. Personal.Psychol. 2013, 27, 17–36.
11. Boehm, J.K.; Lyubomirsky, S. Does Happiness Promote Career Success? J. Career Assess. 2008, 16, 101–116. [CrossRef]12. Walsh, L.C.; Boehm, J.K.; Lyubomirsky, S. Does Happiness Promote Career Success? Revisiting the Evidence. J. Career Assess.
2018, 26, 199–219. [CrossRef]13. Böckerman, P.; Ilmakunnas, P. The Job Satisfaction-Productivity Nexus: A Study Using Matched Survey and Register Data. ILR
Rev. 2012, 65, 244–262. [CrossRef]14. Gallup. State of the American Workplace; Gallup: Washington, DC, USA, 2020.15. Organ, D.W. Organizational Citizenship Behavior: The Good Soldier Syndrome: Issues in Organization and Management Series; Lexington
Books: Lexington, MA, USA, 1988.16. Harter, J.K.; Schmidt, F.L.; Keyes, C.L.M. Well-being in the workplace and its relationship to business outcomes: A review of the
Gallup studies. In Flourishing: Positive Psychology and the Life Well-Lived; American Psychological Association: Washington, DC,USA, 2003; pp. 205–224. [CrossRef]
17. Edmans, A. The Link Between Job Satisfaction and Firm Value, With Implications for Corporate Social Responsibility. Acad.Manag. Perspect. 2012, 26, 1–19. [CrossRef]
18. Bellet, C.; de Neve, J.; Ward, G. Does employee happiness have an impact on productivity? Saïd Bus. Sch. WP 2019, 13, 13.[CrossRef]
19. Krekel, C.; Ward, G.; de Neve, J.E. What Makes for a Good Job? Evidence Using Subjective Wellbeing Data. In The Economics ofHappiness; Rojas, M., Ed.; Springer: Berlin/Heidelberg, Germany, 2019.
20. Charles-Leija, H.; Torres García, A.J.; Castro Lugo, D. The effects of social capital on employment in Mexico. Rev. Econ. Inst. 2018,20, 263–283.
21. Rojas, M.; Charles-Leija, H. Chile, milagro de crecimiento económico, per . . . ¿y el bienestar? Perfiles Latinoam. 2022, 30, 59.[CrossRef]
22. Spence, G. Workplace wellbeing programs: If you build it they may NOT come . . . because it’s not what they really need! Int. J.Wellbeing 2015, 5, 109–124. [CrossRef]
23. Mills, M.J.; Culbertson, S.S.; Fullagar, C.J. Conceptualizing and Measuring Engagement: An Analysis of the Utrecht WorkEngagement Scale. J. Happiness Stud. 2012, 13, 519–545. [CrossRef]
24. Mills, M.J.; Fleck, C.R.; Kozikowski, A. Positive psychology at work: A conceptual review, state-of-practice assessment, and alook ahead. J. Posit. Psychol. 2013, 8, 153–164. [CrossRef]
25. Lewis, S. Positive Psychology at Work: How Positive Leadership and Appreciative Inquiry Create Inspiring Organizations; Wiley-Blackwell:Oxford, UK, 2011.
26. Lopez, S.J.; Snyder, C.R. Positive Psychological Assessment: A Handbook of Models and Measures; American Psychological Association:Washington, DC, USA, 2003.

Int. J. Environ. Res. Public Health 2022, 19, 3559 15 of 16
27. Salanova, M.; Llorens, S.; Cifre, E.; Martinez, I.M.M. We Need a Hero! Toward a Validation of the Healthy and ResilientOrganization (HERO) Model. Group Organ. Manag. 2012, 37, 785–822. [CrossRef]
28. Hernandez-Vargas, C.I.; Llorens-Gumbau, S.; Rodriguez-Sanchez, A.M.; Dickinson-Bannack, M.E. Validación de la escala UWES-9en profesionales de la salud en México. Pensam. Psicológico 2016, 14, 89–100. [CrossRef]
29. Demerouti, E.; Nachreiner, F.; Bakker, A.B.; Schaufeli, W.B. The job demands-resources model of burnout. J. Appl. Psychol. 2001,86, 499–512. [CrossRef] [PubMed]
30. Bakker, A.B. An Evidence-Based Model of Work Engagement. Curr. Dir. Psychol. Sci. 2011, 20, 265–269. [CrossRef]31. Schaufeli, W.B.; Bakker, A.B. Job demands, job resources, and their relationship with burnout and engagement: A multi-sample
study. J. Organ. Behav. 2004, 25, 293–315. [CrossRef]32. Salanova, M.; Llorens, S. Hacia una psicología positiva aplicada. Pap. Psicól. 2016, 37, 161–164.33. Cameron, K.; Mora, C.; Leutscher, T.; Calarco, M. Effects of Positive Practices on Organizational Effectiveness. J. Appl. Behav. Sci.
2011, 47, 266–308. [CrossRef]34. Cameron, K.S. Positive Leadership: Strategies for Extraordinary Performance; Berett-Koehler: Oakland, CA, USA, 2012.35. Samad, A. Towards an understanding of the effect of leadership on employee wellbeing and organizational outcomes in Australian
universities. J. Dev. Areas 2015, 49, 441–448. [CrossRef]36. Cameron, K.; Caza, A. Virtuousness as a source of happiness in organizations. In The Oxford Handbook of Happiness; Boniwell, D.,
Conley-Ayers, A., Eds.; Oxford University Press: Oxford, UK, 2013; pp. 676–692.37. Cameron, K.S. Paradox in Positive Organizational Change. J. Appl. Behav. Sci. 2008, 44, 7–24. [CrossRef]38. Cameron, K. Practicing Positive Leadership; Berrett-Koehler: Oakland, CA, USA, 2013.39. Raile, A.N.W.; Kim, R.K.; Choi, J.; Serota, K.B.; Park, H.S.; Lee, D.W. Connections at Work: How Friendship Networks Relate to
Job Satisfaction. Commun. Res. Rep. 2008, 25, 168–178. [CrossRef]40. Baker, W.; Cross, R.; Wooten, M. Positive organizational Network Analysis and Energy Relationships. In Positive Organizational
Scholarship: Foundations of a New Discipline; Cameron, J.E., Dutton, R., Quinn, E., Eds.; Berrett-Koehler: San Francisco, CA, USA,2003; pp. 328–342.
41. Dutton, J.E. Energize Your Workplace: How to Create and Sustain High-Quality Connections at Work; Jossey-Bass: San Francisco, CA,USA, 2003.
42. Gottman, J.M.; Rogers, G.M. The Marriage Clinic: A Scientifically Based Marital Therapy. J. Cogn. Psychother. 2001, 15, 279–281.[CrossRef]
43. Losada, M.; Heaphy, E. The Role of Positivity and Connectivity in the Performance of Business Teams: A Nonlinear DynamicsModel. Am. Behav. Sci. 2004, 47, 740–765. [CrossRef]
44. Sherif, M. Superordinate Goals in the Reduction of Intergroup Conflict. Am. J. Sociol. 1958, 63, 349–356. [CrossRef]45. Duffy, R.D.; Blustein, D.L.; Diemer, M.A.; Autin, K.L. The Psychology of Working Theory. J. Couns. Psychol. 2016, 63, 127–148.
[CrossRef] [PubMed]46. Steger, M.F.; Dik, B.J.; Duffy, R.D. Measuring Meaningful Work: The Work and Meaning Inventory (WAMI). J. Career Assess. 2012,
20, 322–337. [CrossRef]47. Allan, B.; Batz-Barbarich, C.; Sterling, H.; Tay, L. Outcomes of Meaningful Work: A Meta-Analysis. J. Manag. Stud. 2018, 56,
500–528. [CrossRef]48. Allan, B.; Duffy, R.; Collisson, B. Task Significance and Performance: Meaningfulness as a Mediator. J. Career Asses. 2016, 26,
172–182. [CrossRef]49. Šverko, B.; Vizek-Vidovic, V. Studies of the meaning of work: Approaches, models, and some of the findings. In Life Roles, Values,
and Careers; Super, D.E., Šverko, B., Eds.; Jossey-Bass: San Francisco, CA, USA, 1995; pp. 3–21.50. Allan, B.A.; Rolniak, J.R.; Bouchard, L. Underemployment and Well-Being: Exploring the Dark Side of Meaningful Work. J. Career
Dev. 2018, 47, 111–125. [CrossRef]51. McKnight, P.E.; Kashdan, T.B. Purpose in Life as a System that Creates and Sustains Health and Well-Being: An Integrative,
Testable Theory. Rev. Gen. Psychol. 2009, 13, 242–251. [CrossRef]52. Peters, T.J.; Waterman, R.H. In Search of Excellence: Lessons from America’s Best Run Companies; Harper & Row: New York, NY,
USA, 1982.53. Albrecht, S.L. Work Engagement and the Positive Power of Meaningful Work. In Advances in Positive Organizational Psychology;
Emerald Group Publishing Limited: Bingley, UK, 2013; pp. 237–260. [CrossRef]54. Whittington, J.L.; Meskelis, S.; Asare, E.; Beldona, S. Enhancing Employee Engagement: An Evidence-Based Approach; Pal-grave-
Macmillan: New York, NY, USA, 2017.55. Decuypere, A.; Schaufeli, W. Leadership and work engagement: Exploring explanatory mechanisms. Ger. J. Hum. Resour. Manag.
2019, 34, 69–95. [CrossRef]56. Letona-Ibañez, O.; Martinez-Rodriguez, S.; Ortiz-Marques, N.; Carrasco, M.; Amillano, A. Job Crafting and Work Engagement:
The Mediating Role of Work Meaning. Int. J. Environ. Res. Public Health 2021, 18, 5383. [CrossRef] [PubMed]57. Spontón, C.L.; Trógolo, M.A.; Castellano, E.; Morera, L.P.; Medrano, L. Desarrollo y validación de una escala para medir
satisfacción con los recursos laborales. Suma Psicol. 2019, 26, 64–74. [CrossRef]58. Vázquez, C. La psicología positiva y sus enemigos: Una réplica en base a la evidencia científica. Papeles del Psicol. 2013, 34, 91–115.59. Bluedorn, A.C. A Unified Model of Turnover from Organizations. Hum. Relat. 1982, 35, 135–153. [CrossRef]
Int. J. Environ. Res. Public Health 2022, 19, 3559 16 of 16
60. Biggs, D.M.; Swailes, S.; Baker, S. The measurement of worker relations: The development of a three-component scale. Leadersh.Organ. Dev. J. 2016, 37, 2–12. [CrossRef]
61. Sociedad Mexicana de Psicología, A.C. Código Ético de Los Psicólogos, 4th ed.; Trillas: Mexico City, Mexico, 2007.62. Méndez-Martínez, C.; Rondón-Sepúlveda, M.A. Introducción al análisis factorial exploratorio. Rev. Colomb. Psiquiatr. 2012, 41,
197–207. [CrossRef]63. DeVellis, R.F. Scale Development: Theory and Applications, 3rd ed.; Sage Publications: Saunders Oaks, CA, USA, 2016; pp. 50–100.64. Kaiser, H.F. The Application of Electronic Computers to Factor Analysis. Educ. Psychol. Meas. 1960, 20, 141–151. [CrossRef]65. Reyes-Lagunes, I.L.; García-Barragán, L.F. Procedimiento de validación psicométrica culturalmente relevante: Un ejemplo. In La
Psicología Social en México; Aragón, S.R., Loving, R.D., Aragón, R.S., Lagunes, I.R., Eds.; Asociación Mexicana de Psicología Social:Mexico City, Mexico, 2008; pp. 625–636.
66. Fornell, C.; Larcker, D.F. Evaluating Structural Equation Models with Unobservable Variables and Measurement Error. J. Mark.Res. 1981, 18, 39. [CrossRef]
67. Batista-Foguet, M.; Coenders, G.; Alonso, J. Análisis factorial confirmatorio. Su Utilidad en la Validación de Cuestionariosrela-Cionados con la salud. Med. Clin. 2004, 122, 21–27.
68. Kim, H.; Ku, B.; Kim, J.Y.; Park, Y.-J.; Park, Y.-B. Confirmatory and Exploratory Factor Analysis for Validating the Phlegm PatternQuestionnaire for Healthy Subjects. Evidence-Based Complement. Altern. Med. 2016, 2016, 2696019. [CrossRef]
69. Mair, P. Modern Psychometrics with R; Springer: Berlin/Heidelberg, Germany, 2018.70. Xia, Y.; Yang, Y. RMSEA, CFI, and TLI in structural equation modeling with ordered categorical data: The story they tell de-pends
on the estimation methods. Behav. Res. Methods 2019, 51, 409–428. [CrossRef] [PubMed]71. Cronbach, L.J. Coefficient alpha and the internal structure of tests. Psychometrika 1951, 16, 297–334. [CrossRef]72. Cronbach, L.J.; Meehl, P.E. Construct validity in psychological tests. Psychol. Bull. 1955, 52, 281–302. [CrossRef]73. Nunnally, J.C. Psychometric Theory, 2nd ed.; McGraw-Hill: New York, NY, USA, 1978.74. Jöreskog, K.G. A general approach to confirmatory maximum likelihood factor analysis. Psychometrika 1969, 34, 183–202.
[CrossRef]75. Berg, J.M.; Dutton, J.E.; Wrzesnieswsky, A. Job Crafting Exercise, 3rd ed.; University of Michigan: Ann Arbor, MI, USA, 2013.