Validation of a quantitative food-frequency questionnaire for use in Western Mali
11
Validation of a quantitative food-frequency questionnaire for use in Western Mali Liv E Torheim 1, *, Ingrid Barikmo 1 , Anne Hatløy 2 , Moro Diakite ´ 3 , Kari Solvoll 4 , Modibo M Diarra 5 and Arne Oshaug 1 1 Akershus University College, Ringstabekkveien 105, N-1356 Bekkestua, Norway: 2 Fafo Institute for Applied Social Science, Oslo, Norway: 3 Aideb, Bafoulabe ´, Mali: 4 Institute for Nutrition Research, University of Oslo, Norway: 5 CPS, Ministe `re de la Sante, Bamako, Mali Submitted 10 July 2000: Accepted 9 May 2001 Abstract Objective: The purpose of this study was to validate a quantitative food-frequency questionnaire (QFFQ) created for assessing the usual intake of foods and nutrients in the prevailing season in Western Mali. Design: Intake of foods and nutrients over the week preceding the interview was measured with a 69-item QFFQ. Intakes were compared with intakes as measured with 2-day combined weighed and recalled diet records. Setting: A rural village in Western Mali, West Africa. Subjects: Twenty-seven men and 48 women (15–59 years of age) representing 18 households. Results: Spearman rank correlations between intake of food groups from the QFFQ and the diet record ranged from 0.09 (meat/fish) to 0.58 (tea/coffee). Median coefficient was 0.37. Median Spearman correlation coefficient for nutrient intake was 0.40. Men had higher median correlation coefficients than did women. The proportion of subjects being classified into the same quartile of food intake was on median 33%, while a median of 7% was misclassified into extreme quartiles. Correct classification into the same quartile for intake of nutrients was on median 34% while a median of 4% was grossly misclassified. Intakes of most food groups and nutrients as measured by the QFFQ were higher than those measured by the diet records. However, while men had higher estimated intakes for foods eaten in- between meals, women in general had higher intake of foods eaten in the main meals. Conclusion: This QFFQ can be used for comparing the intake of foods and nutrients between groups within this study population. It therefore represents a useful tool in the surveillance of food intake in the population, both in identifying vulnerable groups and for tracking food intake over time. The differences between men and women in overestimating food intake need to be taken into account when using the method. Keywords Human nutrition Food-frequency questionnaire Dietary assessment methods Mali Africa It has been argued that data on dietary intake should be part of nutrition surveillance systems for use in planning policies and strategies, and for monitoring and evaluation purposes 1 . However, in low-income countries, the lack of cost-effective dietary assessment methods makes it difficult to include such data in larger-scale or repeated studies. In these countries the more cumbersome and expensive techniques of weighed records 2–4 and 24-hour recall 5,6 have most often been employed. It is therefore necessary to develop quantitative methods for assessing dietary intake in larger population groups in low-income countries. A stronger focus on food-based dietary guidelines, as recommended by the Food and Agriculture Organization of the United Nations/World Health Organization (FAO/WHO) 7,8 , is another argument for strengthening the efforts in developing dietary assessment methods. The food-frequency questionnaire (FFQ) is currently the method most often used for assessing food intake in larger epidemiological studies in industrialised countries. It represents a simple tool that allows for ranking of individuals 9 ; however, its ability to quantify the absolute intake of foods and nutrients is in general limited 10 . To our knowledge, use of this method in low-income Public Health Nutrition: 4(6), 1267–1277 DOI: 10.1079/PHN2001181 *Corresponding author: Email [email protected] q The Authors 2001
-
Upload
independent -
Category
Documents
-
view
4 -
download
0
Transcript of Validation of a quantitative food-frequency questionnaire for use in Western Mali
Validation of a quantitative food-frequency questionnaire for usein Western Mali
Liv E Torheim1,*, Ingrid Barikmo1, Anne Hatlùy2, Moro DiakiteÂ3, Kari Solvoll4,Modibo M Diarra5 and Arne Oshaug1
1Akershus University College, Ringstabekkveien 105, N-1356 Bekkestua, Norway: 2Fafo Institute for AppliedSocial Science, Oslo, Norway: 3Aideb, BafoulabeÂ, Mali: 4Institute for Nutrition Research, University of Oslo,Norway: 5CPS, MinisteÁre de la Sante, Bamako, Mali
Submitted 10 July 2000: Accepted 9 May 2001
AbstractObjective: The purpose of this study was to validate a quantitative food-frequencyquestionnaire (QFFQ) created for assessing the usual intake of foods and nutrients inthe prevailing season in Western Mali.Design: Intake of foods and nutrients over the week preceding the interview wasmeasured with a 69-item QFFQ. Intakes were compared with intakes as measuredwith 2-day combined weighed and recalled diet records.Setting: A rural village in Western Mali, West Africa.Subjects: Twenty-seven men and 48 women (15±59 years of age) representing 18households.Results: Spearman rank correlations between intake of food groups from the QFFQand the diet record ranged from 0.09 (meat/fish) to 0.58 (tea/coffee). Mediancoefficient was 0.37. Median Spearman correlation coefficient for nutrient intake was0.40. Men had higher median correlation coefficients than did women. Theproportion of subjects being classified into the same quartile of food intake wason median 33%, while a median of 7% was misclassified into extreme quartiles.Correct classification into the same quartile for intake of nutrients was on median34% while a median of 4% was grossly misclassified. Intakes of most food groups andnutrients as measured by the QFFQ were higher than those measured by the dietrecords. However, while men had higher estimated intakes for foods eaten in-between meals, women in general had higher intake of foods eaten in the mainmeals.Conclusion: This QFFQ can be used for comparing the intake of foods and nutrientsbetween groups within this study population. It therefore represents a useful tool inthe surveillance of food intake in the population, both in identifying vulnerablegroups and for tracking food intake over time. The differences between men andwomen in overestimating food intake need to be taken into account when using themethod.
KeywordsHuman nutrition
Food-frequency questionnaireDietary assessment methods
MaliAfrica
It has been argued that data on dietary intake should be
part of nutrition surveillance systems for use in planning
policies and strategies, and for monitoring and evaluation
purposes1. However, in low-income countries, the lack of
cost-effective dietary assessment methods makes it
difficult to include such data in larger-scale or repeated
studies. In these countries the more cumbersome and
expensive techniques of weighed records2±4 and 24-hour
recall5,6 have most often been employed. It is therefore
necessary to develop quantitative methods for assessing
dietary intake in larger population groups in low-income
countries. A stronger focus on food-based dietary
guidelines, as recommended by the Food and Agriculture
Organization of the United Nations/World Health
Organization (FAO/WHO)7,8, is another argument for
strengthening the efforts in developing dietary assessment
methods.
The food-frequency questionnaire (FFQ) is currently
the method most often used for assessing food intake in
larger epidemiological studies in industrialised countries.
It represents a simple tool that allows for ranking of
individuals9; however, its ability to quantify the absolute
intake of foods and nutrients is in general limited10. To
our knowledge, use of this method in low-income
Public Health Nutrition: 4(6), 1267±1277 DOI: 10.1079/PHN2001181
*Corresponding author: Email [email protected] q The Authors 2001
countries has only recently been reported, by Hebert and
co-workers in India11,12 and Sharma and co-workers in
Cameroon and Jamaica13.
Low day-to-day intra-individual variation and relatively
few food items available2,14 may render the FFQ method
especially appropriate for use with African populations.
On the other hand, high levels of illiteracy and the eating
from common plates, which is practised in many
population groups, might make use of the FFQ approach
more complicated.
An FFQ has to be developed and validated specifically
for each region in order to be culturally sensitive and to
correspond to the prevailing food culture15. While several
versions of FFQs have been validated in industrialised
countries9,16±18, no publication on validation of an FFQ
for use in Africa was found when searching Medline and
Popline.
Nutrition researchers in Mali and in Norway have
collaborated since 1996 with a non-governmental organ-
isation (NGO) working in Bafoulabe in rural Western
Mali. The aim of the collaboration is to assess and monitor
the nutrition security situation in the area. This also
includes data on food intake. The quantitative food-
frequency questionnaire (QFFQ) was chosen as the
method for assessing food intake because it has the
potential for use in collecting dietary intake data in larger
population groups at relatively low cost.
This paper describes the validation of a 7-day
quantitative food-frequency questionnaire, created for
assessing the usual food intake in the prevailing season,
to be used in studies on nutrition in Western Mali.
Combined weighed and recalled diet record was chosen
as the method of reference.
Subjects and methods
Area and subjects
The development of the quantitative food-frequency
questionnaire and the validation study took place in a
small village, KersignaneÂ, in the Cercle of BafoulabeÂ.
Bafoulabe is in the Kayes Region of Western Mali towards
the border with Senegal. Bafoulabe is divided into several
arondissements and Kersignane lies in the arondissement
of Oussoubidiania, one of the arondissements where the
NGO was active. The small village of Kersignane was
chosen because it was accessible from the camp of the
NGO, only 3 km away, and it was one of the collaborating
villages of the NGO, thus a basis for co-operation was
expected.
The study protocol was approved by the Malian
National Centre for Scientific and Technological Research
(CNRST). Verbal consent was given from the survey
participants after the study was fully explained to them.
A total of 269 persons lived in the village (census by the
research group). Criteria for inclusion in the validation
study were residence in the village, presence in the village
the preceding week, and age 15 to 59 years. The 108
eligible persons in the village were invited to take part in
the validation study. Of these, 31% either refused to
participate (16 persons) or went away at the time of the
study (17 persons). The validation study thus included 75
persons (48 women and 27 men) representing 18 different
households (here defined as those who eat food prepared
in the same pot).
Study design
Two men and two women from a nearby town were
recruited as field workers, as were also two female nurses
from the collaborating organisation. All the field workers
had at least 12 years of education and spoke both French
and the local language, KassonkeÂ. The six field workers
were thoroughly trained during three weeks by the study
supervisor (IB, nutritionist). In this period, the field
workers also participated in the development of the
methods and the questionnaires, which gave them a good
understanding of the aim and scope of the study and the
precise meaning of the questions.
The validation study was conducted during eight weeks
from October to December 1996, which corresponded to
the season of sorghum and groundnut harvest in the area.
In teams of two, the field workers spent three days in
each household. The first day the study participants were
interviewed about their food intake the preceding week
by use of the quantitative food-frequency questionnaire.
A questionnaire for background information (health,
occupation, education and anthropometric measurements
(height and weight)) was completed. The two following
days the diet was recorded using weighed/recalled diet
records (WRDR). The supervisor was present all the time,
supervising the data collection and checking all the data
on the spot.
The quantitative food-frequency questionnaire
(QFFQ)
The quantitative food-frequency questionnaire was meant
to cover all foods consumed, quantitatively and qualita-
tively, during the seven days preceding the interview.
Through focus group interviews with four different
groups, food items and dishes consumed in the village
were identified. Information from these interviews and
experience from other dietary surveys in Mali2,14 made
the basis for a first version of the QFFQ. The ques-
tionnaire was tested three times in neighbouring villages
to Kersignane in order to ensure completeness and
functionality of the questionnaire.
The final version of the QFFQ contained a list of 69
food items (Appendix A). Open-ended questions on
`other foods consumed' were included at the end of the
QFFQ.
When confirming an item, the number of times the food
had been eaten during the past week (times per day and
days per week) and the average amount of food eaten
1268 LE Torheim et al.

each time were registered in the questionnaire. Volume
measures of different sizes were used for estimating
amounts eaten of non-solid foods, groundnuts and
beverages. The participants showed the amount con-
sumed of a food, e.g. rice with sauce, using millet grains
that were thereafter poured into the volume measure so
that the amount could be read in decilitres. The sizes of
single solid food items like fruit, vegetables and bread
were estimated by drawing up the item on a blackboard,
and indicating its two-dimensional measures.
In order to establish weight equivalencies for volumes
for the different food items, four to eight samples of each
item that had been reported consumed were measured
and weighed using digital scales (Soehnle Digitals; 2 g
precision for 0±2.5 kg and 5 g precision for 2.5±5 kg).
The average weight per decilitre, per cm or per square
cm, according to the type of food, was thereafter
calculated, taking into account percentage of the food
that was edible.
The weighed/recalled diet records (WRDR)
The combined weighed and recalled diet records were
conducted for two subsequent days. The field workers
registered both the ingredients of the dishes and the food
intake for the three main meals: breakfast, lunch and
supper. However, they left the households between these
activities. After supper, recalls were done in order to
register the foods that had been eaten between the main
meals when the field workers were absent. The recalled
amounts were estimated using the same methods as
described for assessment of portions in the QFFQ.
The dishes were eaten from common plates using
either hands or spoons (in the case of porridges). In order
to measure the food intake, five handfuls or spoonfuls
were weighed using digital scales (Soehnle Digitals; 0±
5 kg). The field worker counted the total number of
hand-/spoonfuls eaten using a manual counter. A
person's intake was thus calculated from the number of
hand-/spoonfuls multiplied by the average weight of the
five measured hand-/spoonfuls.
The ingredients of the dishes were weighed separately,
using the same digital scales (Soehnle Digitals; 0±5 kg).
The pans with the dish were weighed when ready to eat
using digit scales with a maximum capacity of 120 kg and
with 100 g precision (Soehnle Digitals).
Nutrient calculations
The food intake data were analysed using a software system
developed at the Institute for Nutrition Research, University
of Oslo, together with the Food Composition Table for Mali
developed at the same institute19. Recipes for the dishes
registered in the weighed/recalled diet records were
calculated and amounts eaten of each dish were split into
ingredients. Twenty-five different standard recipes were
compiled based on the recipes from the WRDR (Appendix
B), and these were used in the calculation of intake from the
food-frequency questionnaire.
Use of basal metabolic rate (BMR) to evaluate the
validity of the reference method
The method described by Goldberg and co-workers20,21
for estimating under- or overreporting of energy intake
was used for evaluating the intakes as measured in the
weighed/recalled diet records. Estimates of BMR were
calculated from standard formulas based on weight, age
and sex22. The lower cut-off limit for the ratio between
measured energy intake (EI) from the weighed/recalled
diet records and BMR was calculated to be 1.00, using
BMR estimates with 95% confidence limits, a diet
recording period of 2 days and a physical activity level
(PAL) of 1.55. The upper cut-off limit, calculated with a
PAL of 2.00, was found to be 3.11.
Statistical methods
Data from the dietary assessments were analysed using
the Statistical Package for the Social Sciences (SPSS)23.
Since most nutrient and food intakes were not normally
distributed, non-parametric statistical methods were used.
The sample median, and 25th and 75th percentiles of
nutrient and food intakes were computed. Differences
between the two methods were tested with Wilcoxon's
signed rank test. The percentage of subjects with a
difference in measured intakes between the two methods
of less than 20% of the mean intake is presented as a
measure of dispersion of the differences between paired
observations24. Bland and Altman plots25 were used to
visualise this dispersion. Spearman rank correlation was
used to assess the relative validity of the questionnaire.
The agreement on category level between the question-
naire and the records was examined by classification of
subjects into quartiles.
Results
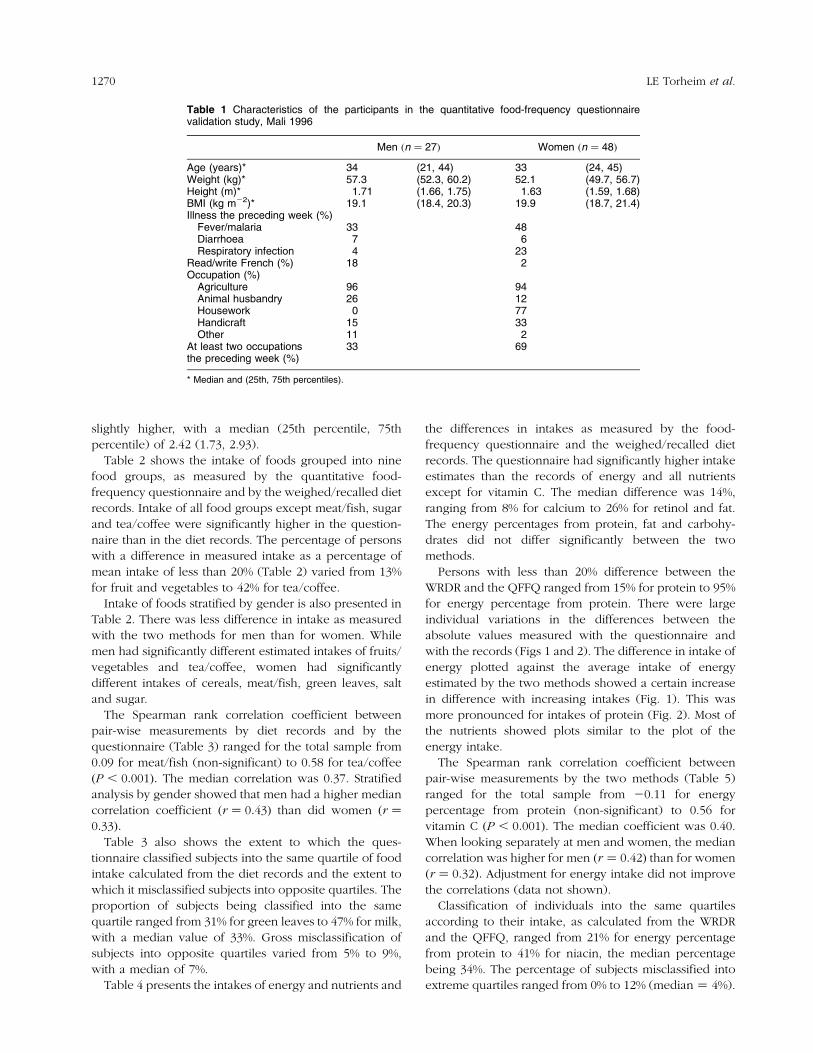
Table 1 shows some characteristics of the study partici-
pants, where median age was 34 years for men and 33
years for women. Body mass index (BMI, kg m22) was
around 19 for men and 20 for women. Fever/malaria was
the most prevalent disease striking 33% of the men and
48% of the women. French, the official language in Mali,
was read and written by 18% of the men and 2% of the
women. Agriculture was the main occupation, practised
by more than 90%. Most women (69%) had at least two
different occupations the preceding week, while this was
the case for 33% of the men.
The median (25th percentile, 75th percentile) ratio
between energy intake as measured by the 2-day
weighed/recalled diet records and estimated BMR was
2.00 (1.58, 2.59). Two persons had a ratio below 1.00 and
six persons had a ratio above 3.11. The ratio between
energy intake as measured by the QFFQ and BMR was
1269Quantitative FFQ in Mali, West Africa
slightly higher, with a median (25th percentile, 75th
percentile) of 2.42 (1.73, 2.93).
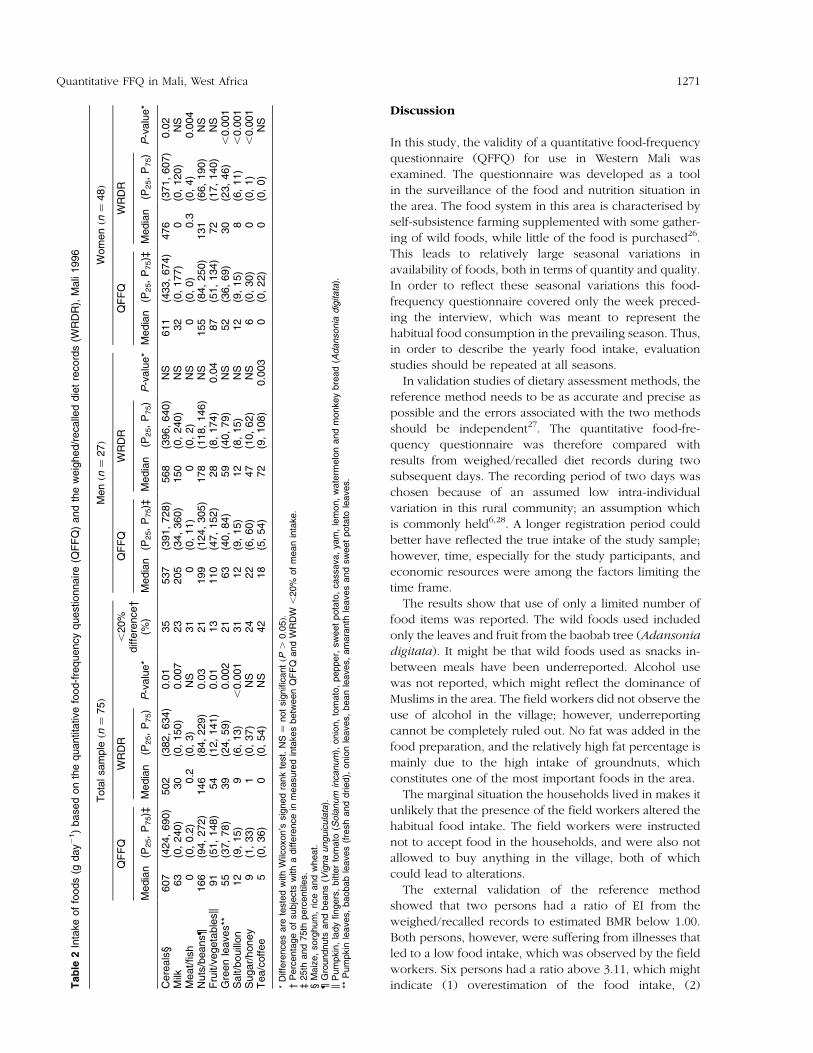
Table 2 shows the intake of foods grouped into nine
food groups, as measured by the quantitative food-
frequency questionnaire and by the weighed/recalled diet
records. Intake of all food groups except meat/fish, sugar
and tea/coffee were significantly higher in the question-
naire than in the diet records. The percentage of persons
with a difference in measured intake as a percentage of
mean intake of less than 20% (Table 2) varied from 13%
for fruit and vegetables to 42% for tea/coffee.
Intake of foods stratified by gender is also presented in
Table 2. There was less difference in intake as measured
with the two methods for men than for women. While
men had significantly different estimated intakes of fruits/
vegetables and tea/coffee, women had significantly
different intakes of cereals, meat/fish, green leaves, salt
and sugar.
The Spearman rank correlation coefficient between
pair-wise measurements by diet records and by the
questionnaire (Table 3) ranged for the total sample from
0.09 for meat/fish (non-significant) to 0.58 for tea/coffee
�P , 0:001�: The median correlation was 0.37. Stratified
analysis by gender showed that men had a higher median
correlation coefficient �r � 0:43� than did women �r �0:33�:
Table 3 also shows the extent to which the ques-
tionnaire classified subjects into the same quartile of food
intake calculated from the diet records and the extent to
which it misclassified subjects into opposite quartiles. The
proportion of subjects being classified into the same
quartile ranged from 31% for green leaves to 47% for milk,
with a median value of 33%. Gross misclassification of
subjects into opposite quartiles varied from 5% to 9%,
with a median of 7%.
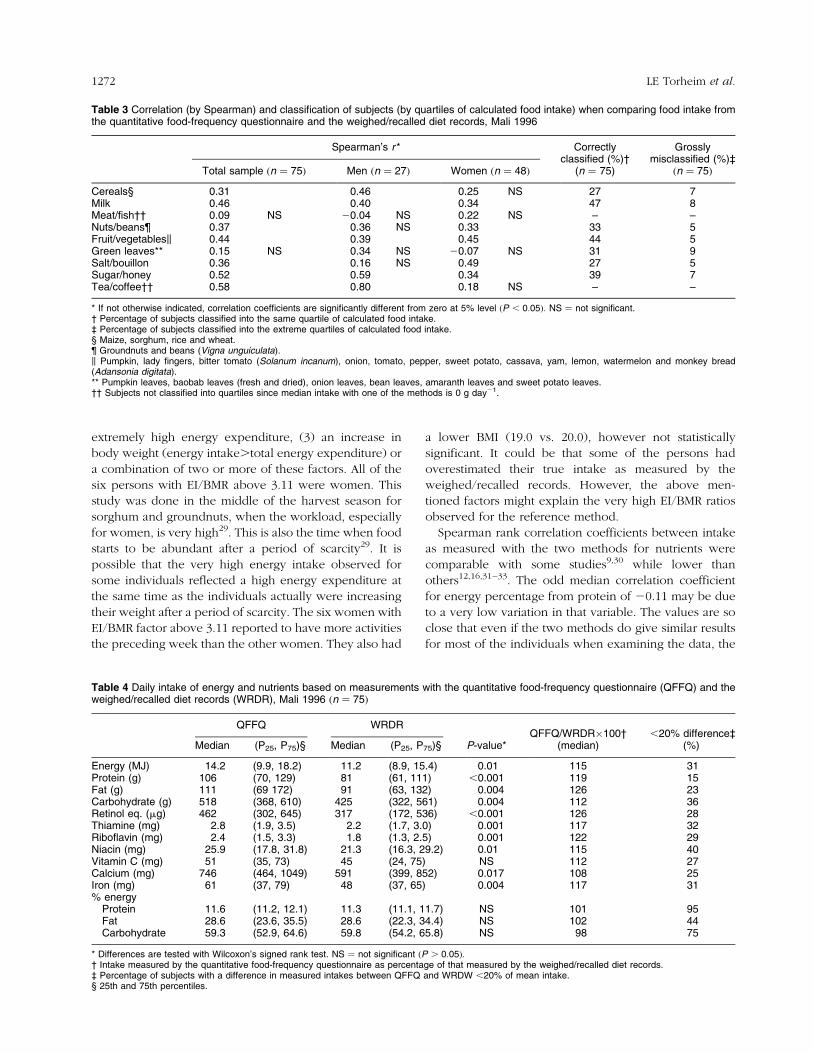
Table 4 presents the intakes of energy and nutrients and
the differences in intakes as measured by the food-
frequency questionnaire and the weighed/recalled diet
records. The questionnaire had significantly higher intake
estimates than the records of energy and all nutrients
except for vitamin C. The median difference was 14%,
ranging from 8% for calcium to 26% for retinol and fat.
The energy percentages from protein, fat and carbohy-
drates did not differ significantly between the two
methods.
Persons with less than 20% difference between the
WRDR and the QFFQ ranged from 15% for protein to 95%
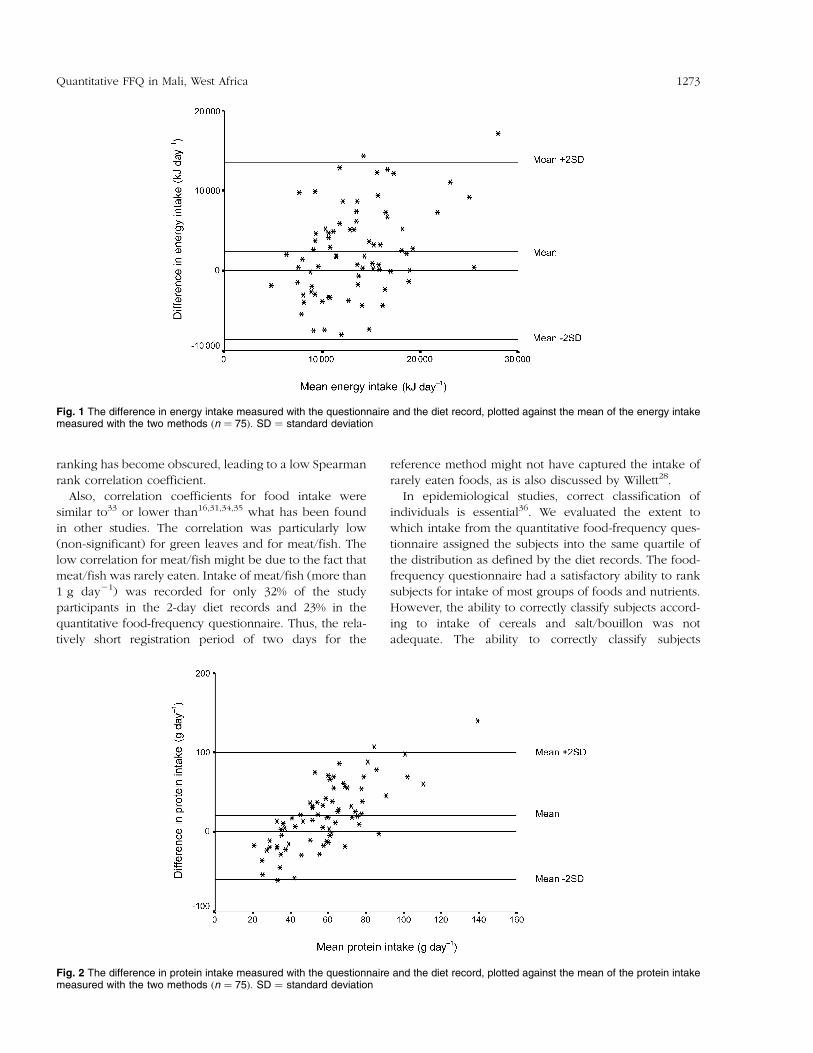
for energy percentage from protein. There were large
individual variations in the differences between the
absolute values measured with the questionnaire and
with the records (Figs 1 and 2). The difference in intake of
energy plotted against the average intake of energy
estimated by the two methods showed a certain increase
in difference with increasing intakes (Fig. 1). This was
more pronounced for intakes of protein (Fig. 2). Most of
the nutrients showed plots similar to the plot of the
energy intake.
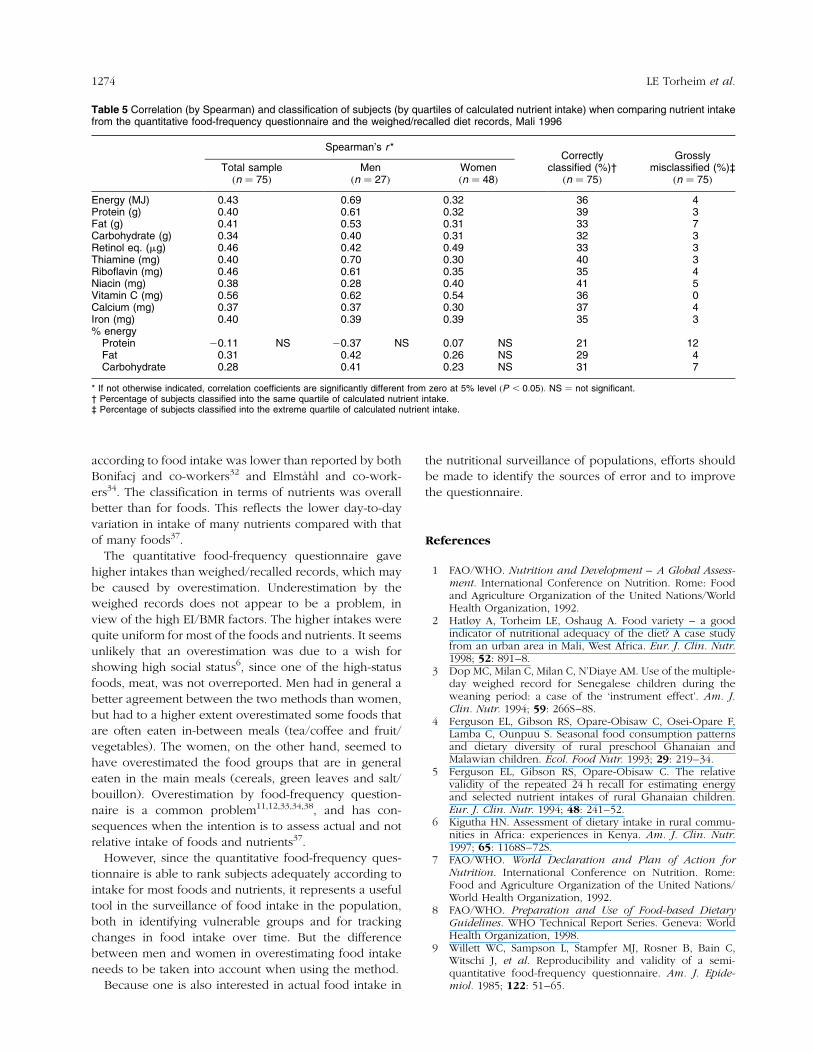
The Spearman rank correlation coefficient between
pair-wise measurements by the two methods (Table 5)
ranged for the total sample from 20.11 for energy
percentage from protein (non-significant) to 0.56 for
vitamin C �P , 0:001�: The median coefficient was 0.40.
When looking separately at men and women, the median
correlation was higher for men �r � 0:42� than for women
�r � 0:32�: Adjustment for energy intake did not improve
the correlations (data not shown).
Classification of individuals into the same quartiles
according to their intake, as calculated from the WRDR
and the QFFQ, ranged from 21% for energy percentage
from protein to 41% for niacin, the median percentage
being 34%. The percentage of subjects misclassified into
extreme quartiles ranged from 0% to 12% (median � 4%).
Table 1 Characteristics of the participants in the quantitative food-frequency questionnairevalidation study, Mali 1996
Men �n � 27� Women �n � 48�Age (years)* 34 (21, 44) 33 (24, 45)Weight (kg)* 57.3 (52.3, 60.2) 52.1 (49.7, 56.7)Height (m)* 1.71 (1.66, 1.75) 1.63 (1.59, 1.68)BMI (kg m22)* 19.1 (18.4, 20.3) 19.9 (18.7, 21.4)Illness the preceding week (%)
Fever/malaria 33 48Diarrhoea 7 6Respiratory infection 4 23
Read/write French (%) 18 2Occupation (%)
Agriculture 96 94Animal husbandry 26 12Housework 0 77Handicraft 15 33Other 11 2
At least two occupationsthe preceding week (%)
33 69
* Median and (25th, 75th percentiles).
1270 LE Torheim et al.
Discussion
In this study, the validity of a quantitative food-frequency
questionnaire (QFFQ) for use in Western Mali was
examined. The questionnaire was developed as a tool
in the surveillance of the food and nutrition situation in
the area. The food system in this area is characterised by
self-subsistence farming supplemented with some gather-
ing of wild foods, while little of the food is purchased26.
This leads to relatively large seasonal variations in
availability of foods, both in terms of quantity and quality.
In order to reflect these seasonal variations this food-
frequency questionnaire covered only the week preced-
ing the interview, which was meant to represent the
habitual food consumption in the prevailing season. Thus,
in order to describe the yearly food intake, evaluation
studies should be repeated at all seasons.
In validation studies of dietary assessment methods, the
reference method needs to be as accurate and precise as
possible and the errors associated with the two methods
should be independent27. The quantitative food-fre-
quency questionnaire was therefore compared with
results from weighed/recalled diet records during two
subsequent days. The recording period of two days was
chosen because of an assumed low intra-individual
variation in this rural community; an assumption which
is commonly held6,28. A longer registration period could
better have reflected the true intake of the study sample;
however, time, especially for the study participants, and
economic resources were among the factors limiting the
time frame.
The results show that use of only a limited number of
food items was reported. The wild foods used included
only the leaves and fruit from the baobab tree (Adansonia
digitata). It might be that wild foods used as snacks in-
between meals have been underreported. Alcohol use
was not reported, which might reflect the dominance of
Muslims in the area. The field workers did not observe the
use of alcohol in the village; however, underreporting
cannot be completely ruled out. No fat was added in the
food preparation, and the relatively high fat percentage is
mainly due to the high intake of groundnuts, which
constitutes one of the most important foods in the area.
The marginal situation the households lived in makes it
unlikely that the presence of the field workers altered the
habitual food intake. The field workers were instructed
not to accept food in the households, and were also not
allowed to buy anything in the village, both of which
could lead to alterations.
The external validation of the reference method
showed that two persons had a ratio of EI from the
weighed/recalled records to estimated BMR below 1.00.
Both persons, however, were suffering from illnesses that
led to a low food intake, which was observed by the field
workers. Six persons had a ratio above 3.11, which might
indicate (1) overestimation of the food intake, (2)Tab
le2
Inta
ke
of
foods
(gday2
1)
based
on
the
quantit
ativ
efo
od-f
requency
quest
ionnaire
(QF
FQ
)and
the
weig
hed/r
eca
lled
die
tre
cord
s(W
RD
R),
Mali
1996
Tota
lsam
ple�n�
75�
Men�n�
27�
Wom
en�n�
48�
QF
FQ
WR
DR
P-v
alu
e*
,20%
diff
ere
nce²
(%)
QF
FQ
WR
DR
P-v
alu
e*
QF
FQ
WR
DR
P-v
alu
e*
Media
n(P
25,
P75)³
Media
n(P
25,
P75)
Media
n(P
25,
P75)³
Media
n(P
25,
P75)
Media
n(P
25,
P75)³
Media
n(P
25,
P75)
Cere
als
§607
(424,
690)
502
(382,
634)
0.0
135
537
(391,
728)
568
(396,
640)
NS
611
(433,
674)
476
(371,
607)
0.0
2M
ilk63
(0,
240)
30
(0,
150)
0.0
07
23
205
(34,
360)
150
(0,
240)
NS
32
(0,
177)
0(0
,120)
NS
Meat/
fish
0(0
,0.2
)0.2
(0,
3)
NS
31
0(0
,11)
0(0
,2)
NS
0(0
,0)
0.3
(0,
4)
0.0
04
Nuts
/beans¶
166
(94,
272)
146
(84,
229)
0.0
321
199
(124,
305)
178
(118,
146)
NS
155
(84,
250)
131
(66,
190)
NS
Fru
it/vegeta
ble
sk
91
(51,
148)
54
(12,
141)
0.0
113
110
(47,
152)
28
(8,
174)
0.0
487
(51,
134)
72
(17,
140)
NS
Gre
en
leave
s**
55
(37,
78)
39
(24,
59)
0.0
02
21
63
(40,
84)
59
(40,
79)
NS
52
(36,
69)
30
(23,
46)
,0.0
01
Salt/
bouill
on
12
(9,
15)
9(6
,13)
,0.0
01
31
12
(9,
15)
12
(8,
15)
NS
12
(9,
15)
8(6
,11)
,0.0
01
Sugar/
honey
9(1
,33)
1(0
,37)
NS
24
22
(6,
60)
47
(10,
62)
NS
6(0
,30)
0(0
,1)
,0.0
01
Tea/c
off
ee
5(0
,36)
0(0
,54)
NS
42
18
(5,
54)
72
(9,
108)
0.0
03
0(0
,22)
0(0
,0)
NS
*D
iffere
nces
are
teste
dw
ithW
ilcoxon's
sig
ned
rank
test.
NS�
not
sig
nifi
cant�P
.0:0
5�:
²P
erc
enta
ge
of
subje
cts
with
adiff
ere
nce
inm
easure
din
takes
betw
een
QF
FQ
and
WR
DW
,20%
of
mean
inta
ke.
³25th
and
75th
perc
entil
es.
§M
aiz
e,
sorg
hum
,rice
and
wheat.
¶G
roundnuts
and
beans
(Vig
na
unguic
ula
ta).
kPum
pkin
,la
dy
fingers
,bitt
er
tom
ato
(Sola
num
incanum
),onio
n,
tom
ato
,pepper,
sw
eet
pota
to,
cassava,
yam
,le
mon,
wate
rmelo
nand
monkey
bre
ad
(Adansonia
dig
itata
).**
Pum
pkin
leaves,
baobab
leaves
(fre
sh
and
dried),
onio
nle
aves,
bean
leaves,
am
ara
nth
leaves
and
sw
eet
pota
tole
aves.
1271Quantitative FFQ in Mali, West Africa
extremely high energy expenditure, (3) an increase in
body weight (energy intake.total energy expenditure) or
a combination of two or more of these factors. All of the
six persons with EI/BMR above 3.11 were women. This
study was done in the middle of the harvest season for
sorghum and groundnuts, when the workload, especially
for women, is very high29. This is also the time when food
starts to be abundant after a period of scarcity29. It is
possible that the very high energy intake observed for
some individuals reflected a high energy expenditure at
the same time as the individuals actually were increasing
their weight after a period of scarcity. The six women with
EI/BMR factor above 3.11 reported to have more activities
the preceding week than the other women. They also had
a lower BMI (19.0 vs. 20.0), however not statistically
significant. It could be that some of the persons had
overestimated their true intake as measured by the
weighed/recalled records. However, the above men-
tioned factors might explain the very high EI/BMR ratios
observed for the reference method.
Spearman rank correlation coefficients between intake
as measured with the two methods for nutrients were
comparable with some studies9,30 while lower than
others12,16,31±33. The odd median correlation coefficient
for energy percentage from protein of 20.11 may be due
to a very low variation in that variable. The values are so
close that even if the two methods do give similar results
for most of the individuals when examining the data, the
Table 3 Correlation (by Spearman) and classification of subjects (by quartiles of calculated food intake) when comparing food intake fromthe quantitative food-frequency questionnaire and the weighed/recalled diet records, Mali 1996
Spearman's r * Correctlyclassified (%)²
(n � 75)
Grosslymisclassified (%)³
�n � 75�Total sample �n � 75� Men �n � 27� Women �n � 48�Cereals§ 0.31 0.46 0.25 NS 27 7Milk 0.46 0.40 0.34 47 8Meat/fish²² 0.09 NS 20.04 NS 0.22 NS ± ±Nuts/beans¶ 0.37 0.36 NS 0.33 33 5Fruit/vegetablesk 0.44 0.39 0.45 44 5Green leaves** 0.15 NS 0.34 NS 20.07 NS 31 9Salt/bouillon 0.36 0.16 NS 0.49 27 5Sugar/honey 0.52 0.59 0.34 39 7Tea/coffee²² 0.58 0.80 0.18 NS ± ±
* If not otherwise indicated, correlation coefficients are significantly different from zero at 5% level �P , 0:05�: NS � not significant.² Percentage of subjects classified into the same quartile of calculated food intake.³ Percentage of subjects classified into the extreme quartiles of calculated food intake.§ Maize, sorghum, rice and wheat.¶ Groundnuts and beans (Vigna unguiculata).k Pumpkin, lady fingers, bitter tomato (Solanum incanum), onion, tomato, pepper, sweet potato, cassava, yam, lemon, watermelon and monkey bread(Adansonia digitata).** Pumpkin leaves, baobab leaves (fresh and dried), onion leaves, bean leaves, amaranth leaves and sweet potato leaves.²² Subjects not classified into quartiles since median intake with one of the methods is 0 g day21.
Table 4 Daily intake of energy and nutrients based on measurements with the quantitative food-frequency questionnaire (QFFQ) and theweighed/recalled diet records (WRDR), Mali 1996 �n � 75�
QFFQ WRDR
P-value*QFFQ/WRDR�100²
(median),20% difference³
(%)Median (P25, P75)§ Median (P25, P75)§
Energy (MJ) 14.2 (9.9, 18.2) 11.2 (8.9, 15.4) 0.01 115 31Protein (g) 106 (70, 129) 81 (61, 111) ,0.001 119 15Fat (g) 111 (69 172) 91 (63, 132) 0.004 126 23Carbohydrate (g) 518 (368, 610) 425 (322, 561) 0.004 112 36Retinol eq. (mg) 462 (302, 645) 317 (172, 536) ,0.001 126 28Thiamine (mg) 2.8 (1.9, 3.5) 2.2 (1.7, 3.0) 0.001 117 32Riboflavin (mg) 2.4 (1.5, 3.3) 1.8 (1.3, 2.5) 0.001 122 29Niacin (mg) 25.9 (17.8, 31.8) 21.3 (16.3, 29.2) 0.01 115 40Vitamin C (mg) 51 (35, 73) 45 (24, 75) NS 112 27Calcium (mg) 746 (464, 1049) 591 (399, 852) 0.017 108 25Iron (mg) 61 (37, 79) 48 (37, 65) 0.004 117 31% energy
Protein 11.6 (11.2, 12.1) 11.3 (11.1, 11.7) NS 101 95Fat 28.6 (23.6, 35.5) 28.6 (22.3, 34.4) NS 102 44Carbohydrate 59.3 (52.9, 64.6) 59.8 (54.2, 65.8) NS 98 75
* Differences are tested with Wilcoxon's signed rank test. NS � not significant �P . 0:05�:² Intake measured by the quantitative food-frequency questionnaire as percentage of that measured by the weighed/recalled diet records.³ Percentage of subjects with a difference in measured intakes between QFFQ and WRDW ,20% of mean intake.§ 25th and 75th percentiles.
1272 LE Torheim et al.
ranking has become obscured, leading to a low Spearman
rank correlation coefficient.
Also, correlation coefficients for food intake were
similar to33 or lower than16,31,34,35 what has been found
in other studies. The correlation was particularly low
(non-significant) for green leaves and for meat/fish. The
low correlation for meat/fish might be due to the fact that
meat/fish was rarely eaten. Intake of meat/fish (more than
1 g day21) was recorded for only 32% of the study
participants in the 2-day diet records and 23% in the
quantitative food-frequency questionnaire. Thus, the rela-
tively short registration period of two days for the
reference method might not have captured the intake of
rarely eaten foods, as is also discussed by Willett28.
In epidemiological studies, correct classification of
individuals is essential36. We evaluated the extent to
which intake from the quantitative food-frequency ques-
tionnaire assigned the subjects into the same quartile of
the distribution as defined by the diet records. The food-
frequency questionnaire had a satisfactory ability to rank
subjects for intake of most groups of foods and nutrients.
However, the ability to correctly classify subjects accord-
ing to intake of cereals and salt/bouillon was not
adequate. The ability to correctly classify subjects
Fig. 1 The difference in energy intake measured with the questionnaire and the diet record, plotted against the mean of the energy intakemeasured with the two methods �n � 75�: SD � standard deviation
Fig. 2 The difference in protein intake measured with the questionnaire and the diet record, plotted against the mean of the protein intakemeasured with the two methods �n � 75�: SD � standard deviation
1273Quantitative FFQ in Mali, West Africa
according to food intake was lower than reported by both
Bonifacj and co-workers32 and ElmstaÊhl and co-work-
ers34. The classification in terms of nutrients was overall
better than for foods. This reflects the lower day-to-day
variation in intake of many nutrients compared with that
of many foods37.
The quantitative food-frequency questionnaire gave
higher intakes than weighed/recalled records, which may
be caused by overestimation. Underestimation by the
weighed records does not appear to be a problem, in
view of the high EI/BMR factors. The higher intakes were
quite uniform for most of the foods and nutrients. It seems
unlikely that an overestimation was due to a wish for
showing high social status6, since one of the high-status
foods, meat, was not overreported. Men had in general a
better agreement between the two methods than women,
but had to a higher extent overestimated some foods that
are often eaten in-between meals (tea/coffee and fruit/
vegetables). The women, on the other hand, seemed to
have overestimated the food groups that are in general
eaten in the main meals (cereals, green leaves and salt/
bouillon). Overestimation by food-frequency question-
naire is a common problem11,12,33,34,38, and has con-
sequences when the intention is to assess actual and not
relative intake of foods and nutrients37.
However, since the quantitative food-frequency ques-
tionnaire is able to rank subjects adequately according to
intake for most foods and nutrients, it represents a useful
tool in the surveillance of food intake in the population,
both in identifying vulnerable groups and for tracking
changes in food intake over time. But the difference
between men and women in overestimating food intake
needs to be taken into account when using the method.
Because one is also interested in actual food intake in
the nutritional surveillance of populations, efforts should
be made to identify the sources of error and to improve
the questionnaire.
References
1 FAO/WHO. Nutrition and Development ± A Global Assess-ment. International Conference on Nutrition. Rome: Foodand Agriculture Organization of the United Nations/WorldHealth Organization, 1992.
2 Hatlùy A, Torheim LE, Oshaug A. Food variety ± a goodindicator of nutritional adequacy of the diet? A case studyfrom an urban area in Mali, West Africa. Eur. J. Clin. Nutr.1998; 52: 891±8.
3 Dop MC, Milan C, Milan C, N'Diaye AM. Use of the multiple-day weighed record for Senegalese children during theweaning period: a case of the `instrument effect'. Am. J.Clin. Nutr. 1994; 59: 266S±8S.
4 Ferguson EL, Gibson RS, Opare-Obisaw C, Osei-Opare F,Lamba C, Ounpuu S. Seasonal food consumption patternsand dietary diversity of rural preschool Ghanaian andMalawian children. Ecol. Food Nutr. 1993; 29: 219±34.
5 Ferguson EL, Gibson RS, Opare-Obisaw C. The relativevalidity of the repeated 24 h recall for estimating energyand selected nutrient intakes of rural Ghanaian children.Eur. J. Clin. Nutr. 1994; 48: 241±52.
6 Kigutha HN. Assessment of dietary intake in rural commu-nities in Africa: experiences in Kenya. Am. J. Clin. Nutr.1997; 65: 1168S±72S.
7 FAO/WHO. World Declaration and Plan of Action forNutrition. International Conference on Nutrition. Rome:Food and Agriculture Organization of the United Nations/World Health Organization, 1992.
8 FAO/WHO. Preparation and Use of Food-based DietaryGuidelines. WHO Technical Report Series. Geneva: WorldHealth Organization, 1998.
9 Willett WC, Sampson L, Stampfer MJ, Rosner B, Bain C,Witschi J, et al. Reproducibility and validity of a semi-quantitative food-frequency questionnaire. Am. J. Epide-miol. 1985; 122: 51±65.
Table 5 Correlation (by Spearman) and classification of subjects (by quartiles of calculated nutrient intake) when comparing nutrient intakefrom the quantitative food-frequency questionnaire and the weighed/recalled diet records, Mali 1996
Spearman's r *Correctly
classified (%)²�n � 75�
Grosslymisclassified (%)³
�n � 75�Total sample�n � 75�
Men�n � 27�
Women�n � 48�
Energy (MJ) 0.43 0.69 0.32 36 4Protein (g) 0.40 0.61 0.32 39 3Fat (g) 0.41 0.53 0.31 33 7Carbohydrate (g) 0.34 0.40 0.31 32 3Retinol eq. (mg) 0.46 0.42 0.49 33 3Thiamine (mg) 0.40 0.70 0.30 40 3Riboflavin (mg) 0.46 0.61 0.35 35 4Niacin (mg) 0.38 0.28 0.40 41 5Vitamin C (mg) 0.56 0.62 0.54 36 0Calcium (mg) 0.37 0.37 0.30 37 4Iron (mg) 0.40 0.39 0.39 35 3% energy
Protein 20.11 NS 20.37 NS 0.07 NS 21 12Fat 0.31 0.42 0.26 NS 29 4Carbohydrate 0.28 0.41 0.23 NS 31 7
* If not otherwise indicated, correlation coefficients are significantly different from zero at 5% level �P , 0:05�: NS � not significant.² Percentage of subjects classified into the same quartile of calculated nutrient intake.³ Percentage of subjects classified into the extreme quartile of calculated nutrient intake.
1274 LE Torheim et al.
10 Kushi LH. Gaps in epidemiologic research methods: designconsiderations for studies that use food-frequency ques-tionnaires. Am. J. Clin. Nutr. 1994; 59: 180S±4S.
11 Hebert JR, Gupta PC, Bhonsle RB, Sinor PN, Mehta H,Mehta FS. Development and testing of a quantitative foodfrequency questionnaire for use in Gujarat, India. PublicHealth Nutr. 1999; 2: 39±50.
12 Hebert JR, Gupta PC, Bhonsle RB, Murti PR, Mehta H,Verghese F, et al. Development and testing of a quantitativefood frequency questionnaire for use in Kerela, India.Public Health Nutr. 1998; 1: 123±30.
13 Sharma S, Cade J, Jackson M, Mbanya JC, Chungong S,Forrester T, et al. Development of food frequency ques-tionnaires in three population samples of African originfrom Cameroon, Jamaica and Caribbean migrants to the UK.Eur. J. Clin. Nutr. 1996; 50: 479±86.
14 Hatlùy A, Hallund J, Diarra MM, Oshaug O. Food variety,socioeconomic status and nutritional status in urban andrural areas in Koutiala (Mali). Public Health Nutr. 2000; 3:57±65.
15 Cassidy CM. Walk a mile in my shoes: culturally sensitivefood-habit research. Am. J. Clin. Nutr. 1994; 59: 190S±7S.
16 Nes M, Andersen LF, Solvoll K, Sandstad B, Hustvedt BE,Lùvù A, et al. Accuracy of a quantitative food frequencyquestionnaire applied in elderly Norwegian women. Eur. J.Clin. Nutr. 1992; 46: 809±21.
17 Bingham SA, Gill C, Welch A, Day K, Cassidy A, Khaw KT,et al. Comparison of dietary assessment methods innutritional epidemiology: weighed records v. 24 h recalls,food-frequency questionnaires and estimated-diet records.Br. J. Nutr. 1994; 72: 619±43.
18 Andersen LF. Evaluation of food frequency questionnairesused among different groups of the Norwegian population.Dissertation, Institute for Nutrition Research, University ofOslo, 1998.
19 Nordeide MB. Table de Composition d'Aliments du Mali.Annex No. 9. Rapport d'Etape SeÂcurite Alimentaire/Femme.Projet de Recherche SSE. Environnement et DeÂveloppe-ment au Mali. Oslo: CNRST/Universite d'Oslo, 1997.
20 Goldberg GR, Black AE, Jebb SA, Cole TJ, Murgatroyd PR,Coward WA, et al. Critical evaluation of energy intake datausing fundamental principles of energy physiology: 1.Derivation of cut-off limits to identify under-recording.Eur. J. Clin. Nutr. 1991; 45: 569±81.
21 Goldberg GR, Black AE. Assessment of the validity ofreported energy intakes ± review and recent developments.Scand. J. Nutr. 1998; 42: 6±9.
22 FAO/WHO/UNU. Energy and Protein Requirements. Tech-nical Report Series 724. Geneva: World Health Organiza-tion, 1985.
23 SPSS, Inc. SPSS 8.0 for Windows. Chicago, IL: SPSS, Inc.,1997.
24 Burema J, van Staveren WA, Feunekes GIJ. Guidelines for
reports on validation studies. Eur. J. Clin. Nutr. 1995; 49:932±3.
25 Bland JM, Altman DG. Statistical methods for assessingagreement between two methods of clinical measurement.Lancet 1986; i: 307±10.
26 Oshaug A, Diarra M, Torheim LE, Diallo F, Diakite M,Sissoko F, et al. Etude qualitative des besoins de lapopulation aÁ BafoulabeÂ. Programme de collaborationPIDEB/INRSP/Universite de Oslo, Oslo, 1997.
27 Kaaks R, Riboli E, van Staveren W. Calibration of dietaryintake measurements in prospective cohort studies. Am. J.Epidemiol. 1995; 142: 548±56.
28 Willett WC. Nutritional Epidemiology. Oxford: OxfordUniversity Press, 1990.
29 Adams AM. Seasonal variations in energy balance amongagriculturalists in central Mali: compromise or adaptation?Eur. J. Clin. Nutr. 1995; 49: 809±23.
30 Pietinen P, Hartman AM, Haapa E, RaÈsaÈnen L, Haapakoski J,Palmgren J, et al. Reproducibility and validity of dietaryassessment instruments. II. A qualitative food frequencyquestionnaire. Am. J. Epidemiol. 1988; 128: 667±76.
31 Goldbohm RA, van den Brandt PA, Brants HA, van't Veer P,Al M, Sturmans F, et al. Validation of a dietary questionnaireused in a large-scale prospective cohort study on diet andcancer. Eur. J. Clin. Nutr. 1994; 48: 253±65.
32 Bonifacj C, Gerber M, Scali J, Daures JP. Comparison of dietaryassessment methods in a Southern French population: use ofweighed records, estimated-diet records and a food-frequencyquestionnaire. Eur. J. Clin. Nutr. 1997; 51: 217±31.
33 Andersen LF, Nes M, Lillegaard IT, Sandstad B, BjùrneboeGEA, Drevon CA. Evaluation of a quantitative foodfrequency questionnaire used in a group of Norwegianadolescents. Eur. J. Clin. Nutr. 1995; 49: 543±54.
34 ElmstaÊhl S, Riboli E, LindgaÈrde F, Gullberg B, Saracci R. TheMalmoÈ food study: the relative validity of a modified diethistory method and an extensive food frequency ques-tionnaire for measuring food intake. Eur. J. Clin. Nutr. 1996;50: 143±51.
35 Salvini S, Hunter DJ, Sampson L, Stampfer MJ, Colditz GA,Rosner B, et al. Food-based validation of dietary ques-tionnaire: the effects of week-to-week variation in foodconsumption. Int. J. Epidemiol. 1989; 18: 858±66.
36 Beaton GH. Approaches to analysis of dietary data:relationship between planned analysis and choice ofmethodology. Am. J. Clin. Nutr. 1994; 59: 253S±61S.
37 Nelson M. The validity of dietary assessment. In: MargettsMB, Nelson M, eds. Design Concepts in NutritionalEpidemiology, 2nd ed. Oxford: Oxford University Press,1997; 241±72.
38 Bingham SA, Day NE. Using biochemical markers to assessthe validity of prospective dietary assessment methods andthe effect of energy adjustment. Am. J. Clin. Nutr. 1997; 65:1130S±7S.
1275Quantitative FFQ in Mali, West Africa
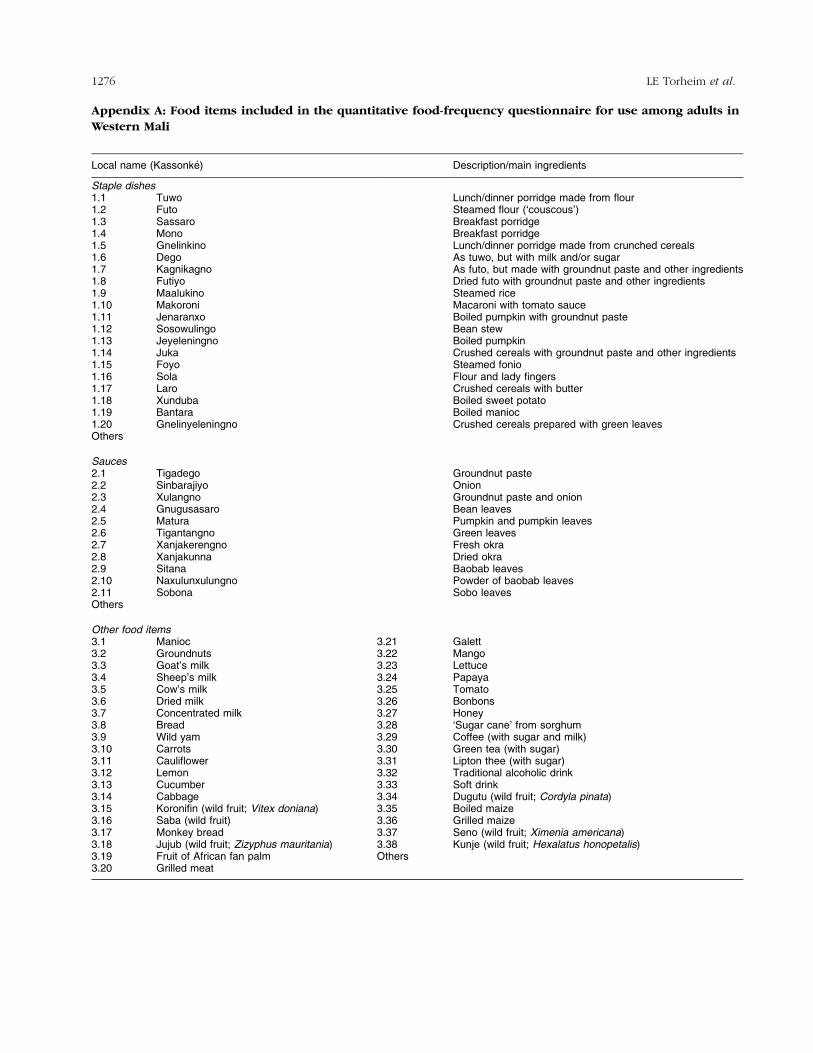
Appendix A: Food items included in the quantitative food-frequency questionnaire for use among adults in
Western Mali
Local name (KassonkeÂ) Description/main ingredients
Staple dishes1.1 Tuwo Lunch/dinner porridge made from flour1.2 Futo Steamed flour (`couscous')1.3 Sassaro Breakfast porridge1.4 Mono Breakfast porridge1.5 Gnelinkino Lunch/dinner porridge made from crunched cereals1.6 Dego As tuwo, but with milk and/or sugar1.7 Kagnikagno As futo, but made with groundnut paste and other ingredients1.8 Futiyo Dried futo with groundnut paste and other ingredients1.9 Maalukino Steamed rice1.10 Makoroni Macaroni with tomato sauce1.11 Jenaranxo Boiled pumpkin with groundnut paste1.12 Sosowulingo Bean stew1.13 Jeyeleningno Boiled pumpkin1.14 Juka Crushed cereals with groundnut paste and other ingredients1.15 Foyo Steamed fonio1.16 Sola Flour and lady fingers1.17 Laro Crushed cereals with butter1.18 Xunduba Boiled sweet potato1.19 Bantara Boiled manioc1.20 Gnelinyeleningno Crushed cereals prepared with green leavesOthers
Sauces2.1 Tigadego Groundnut paste2.2 Sinbarajiyo Onion2.3 Xulangno Groundnut paste and onion2.4 Gnugusasaro Bean leaves2.5 Matura Pumpkin and pumpkin leaves2.6 Tigantangno Green leaves2.7 Xanjakerengno Fresh okra2.8 Xanjakunna Dried okra2.9 Sitana Baobab leaves2.10 Naxulunxulungno Powder of baobab leaves2.11 Sobona Sobo leavesOthers
Other food items3.1 Manioc 3.21 Galett3.2 Groundnuts 3.22 Mango3.3 Goat's milk 3.23 Lettuce3.4 Sheep's milk 3.24 Papaya3.5 Cow's milk 3.25 Tomato3.6 Dried milk 3.26 Bonbons3.7 Concentrated milk 3.27 Honey3.8 Bread 3.28 `Sugar cane' from sorghum3.9 Wild yam 3.29 Coffee (with sugar and milk)3.10 Carrots 3.30 Green tea (with sugar)3.11 Cauliflower 3.31 Lipton thee (with sugar)3.12 Lemon 3.32 Traditional alcoholic drink3.13 Cucumber 3.33 Soft drink3.14 Cabbage 3.34 Dugutu (wild fruit; Cordyla pinata)3.15 Koronifin (wild fruit; Vitex doniana) 3.35 Boiled maize3.16 Saba (wild fruit) 3.36 Grilled maize3.17 Monkey bread 3.37 Seno (wild fruit; Ximenia americana)3.18 Jujub (wild fruit; Zizyphus mauritania) 3.38 Kunje (wild fruit; Hexalatus honopetalis)3.19 Fruit of African fan palm Others3.20 Grilled meat
1276 LE Torheim et al.
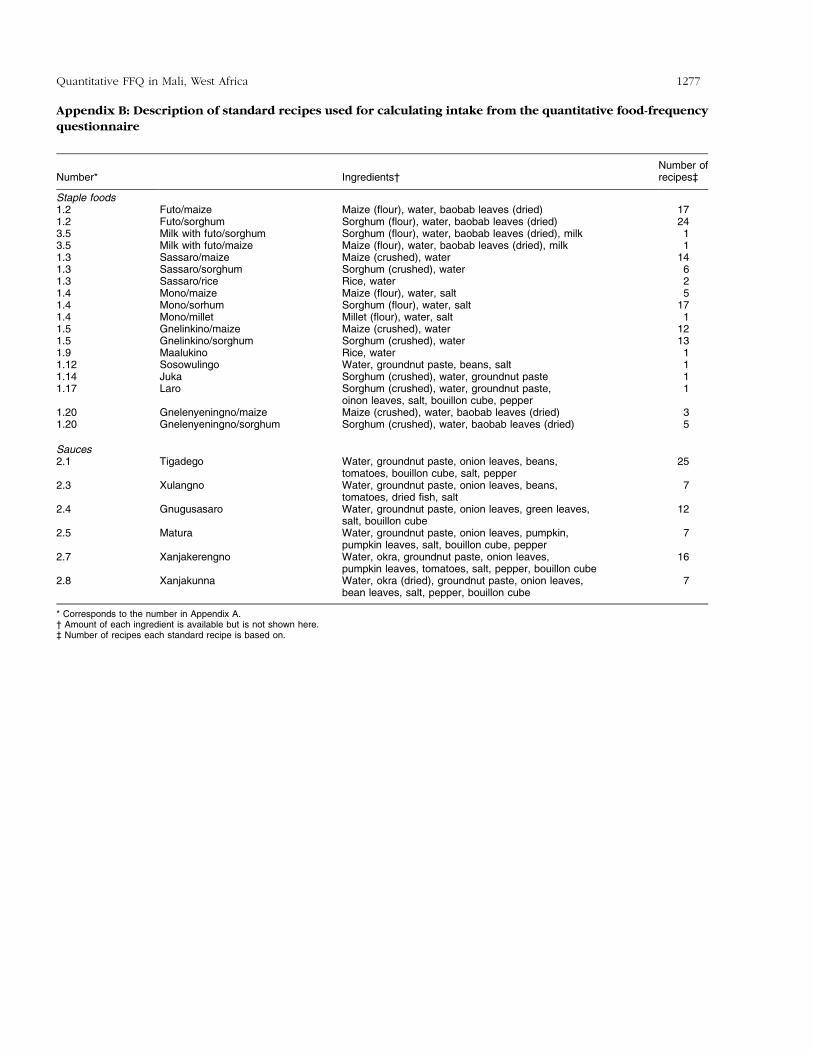
Appendix B: Description of standard recipes used for calculating intake from the quantitative food-frequency
questionnaire
Number* Ingredients²Number ofrecipes³
Staple foods1.2 Futo/maize Maize (flour), water, baobab leaves (dried) 171.2 Futo/sorghum Sorghum (flour), water, baobab leaves (dried) 243.5 Milk with futo/sorghum Sorghum (flour), water, baobab leaves (dried), milk 13.5 Milk with futo/maize Maize (flour), water, baobab leaves (dried), milk 11.3 Sassaro/maize Maize (crushed), water 141.3 Sassaro/sorghum Sorghum (crushed), water 61.3 Sassaro/rice Rice, water 21.4 Mono/maize Maize (flour), water, salt 51.4 Mono/sorhum Sorghum (flour), water, salt 171.4 Mono/millet Millet (flour), water, salt 11.5 Gnelinkino/maize Maize (crushed), water 121.5 Gnelinkino/sorghum Sorghum (crushed), water 131.9 Maalukino Rice, water 11.12 Sosowulingo Water, groundnut paste, beans, salt 11.14 Juka Sorghum (crushed), water, groundnut paste 11.17 Laro Sorghum (crushed), water, groundnut paste,
oinon leaves, salt, bouillon cube, pepper1
1.20 Gnelenyeningno/maize Maize (crushed), water, baobab leaves (dried) 31.20 Gnelenyeningno/sorghum Sorghum (crushed), water, baobab leaves (dried) 5
Sauces2.1 Tigadego Water, groundnut paste, onion leaves, beans,
tomatoes, bouillon cube, salt, pepper25
2.3 Xulangno Water, groundnut paste, onion leaves, beans,tomatoes, dried fish, salt
7
2.4 Gnugusasaro Water, groundnut paste, onion leaves, green leaves,salt, bouillon cube
12
2.5 Matura Water, groundnut paste, onion leaves, pumpkin,pumpkin leaves, salt, bouillon cube, pepper
7
2.7 Xanjakerengno Water, okra, groundnut paste, onion leaves,pumpkin leaves, tomatoes, salt, pepper, bouillon cube
16
2.8 Xanjakunna Water, okra (dried), groundnut paste, onion leaves,bean leaves, salt, pepper, bouillon cube
7
* Corresponds to the number in Appendix A.² Amount of each ingredient is available but is not shown here.³ Number of recipes each standard recipe is based on.
1277Quantitative FFQ in Mali, West Africa