A validation study of the Italian Short-Form Leeds Dyspepsia Questionnaire
10
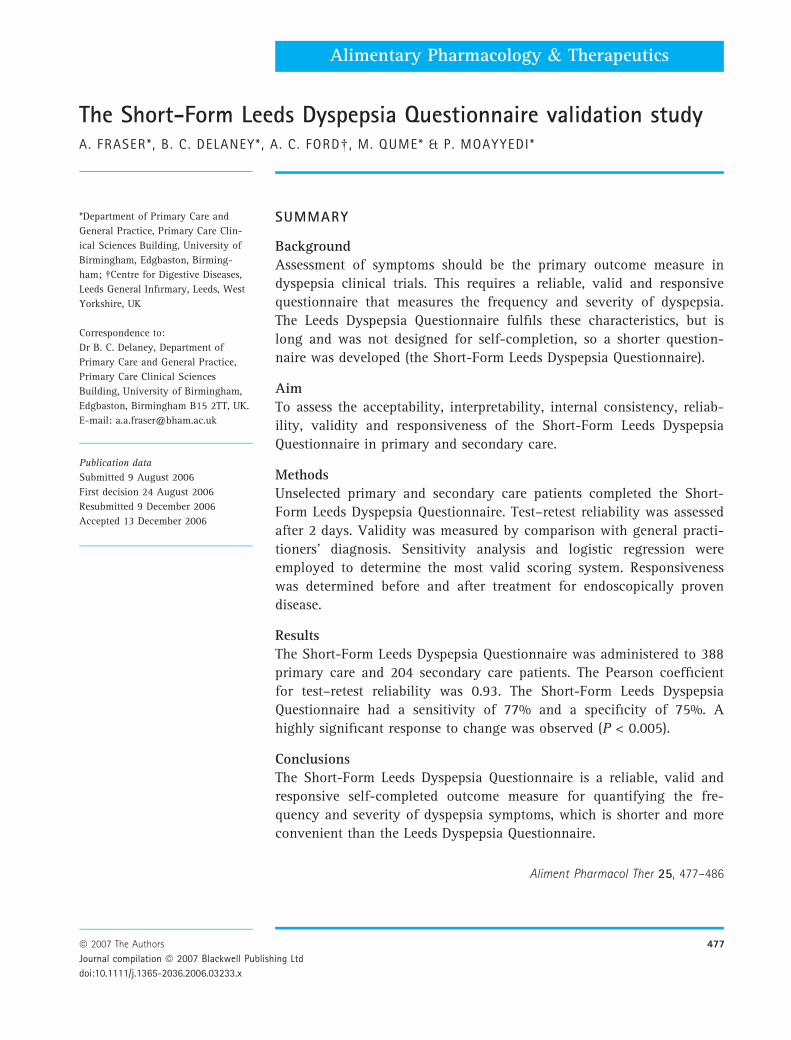
The Short-Form Leeds Dyspepsia Questionnaire validation study A. FRASER*, B. C. DELANEY*, A. C. FORD , M. QUME* & P. MOAYYEDI* *Department of Primary Care and General Practice, Primary Care Clin- ical Sciences Building, University of Birmingham, Edgbaston, Birming- ham; Centre for Digestive Diseases, Leeds General Infirmary, Leeds, West Yorkshire, UK Correspondence to: Dr B. C. Delaney, Department of Primary Care and General Practice, Primary Care Clinical Sciences Building, University of Birmingham, Edgbaston, Birmingham B15 2TT, UK. E-mail: [email protected] Publication data Submitted 9 August 2006 First decision 24 August 2006 Resubmitted 9 December 2006 Accepted 13 December 2006 SUMMARY Background Assessment of symptoms should be the primary outcome measure in dyspepsia clinical trials. This requires a reliable, valid and responsive questionnaire that measures the frequency and severity of dyspepsia. The Leeds Dyspepsia Questionnaire fulfils these characteristics, but is long and was not designed for self-completion, so a shorter question- naire was developed (the Short-Form Leeds Dyspepsia Questionnaire). Aim To assess the acceptability, interpretability, internal consistency, reliab- ility, validity and responsiveness of the Short-Form Leeds Dyspepsia Questionnaire in primary and secondary care. Methods Unselected primary and secondary care patients completed the Short- Form Leeds Dyspepsia Questionnaire. Test–retest reliability was assessed after 2 days. Validity was measured by comparison with general practi- tioners’ diagnosis. Sensitivity analysis and logistic regression were employed to determine the most valid scoring system. Responsiveness was determined before and after treatment for endoscopically proven disease. Results The Short-Form Leeds Dyspepsia Questionnaire was administered to 388 primary care and 204 secondary care patients. The Pearson coefficient for test–retest reliability was 0.93. The Short-Form Leeds Dyspepsia Questionnaire had a sensitivity of 77% and a specificity of 75%. A highly significant response to change was observed (P < 0.005). Conclusions The Short-Form Leeds Dyspepsia Questionnaire is a reliable, valid and responsive self-completed outcome measure for quantifying the fre- quency and severity of dyspepsia symptoms, which is shorter and more convenient than the Leeds Dyspepsia Questionnaire. Aliment Pharmacol Ther 25, 477–486 Alimentary Pharmacology & Therapeutics ª 2007 The Authors 477 Journal compilation ª 2007 Blackwell Publishing Ltd doi:10.1111/j.1365-2036.2006.03233.x
-
Upload
independent -
Category
Documents
-
view
3 -
download
0
Transcript of A validation study of the Italian Short-Form Leeds Dyspepsia Questionnaire
The Short-Form Leeds Dyspepsia Questionnaire validation studyA. FRASER* , B. C. DELANEY* , A. C. FORD� , M. QUME* & P. MOAYYEDI*
*Department of Primary Care and
General Practice, Primary Care Clin-
ical Sciences Building, University of
Birmingham, Edgbaston, Birming-
ham; �Centre for Digestive Diseases,
Leeds General Infirmary, Leeds, West
Yorkshire, UK
Correspondence to:
Dr B. C. Delaney, Department of
Primary Care and General Practice,
Primary Care Clinical Sciences
Building, University of Birmingham,
Edgbaston, Birmingham B15 2TT, UK.
E-mail: [email protected]
Publication data
Submitted 9 August 2006
First decision 24 August 2006
Resubmitted 9 December 2006
Accepted 13 December 2006
SUMMARY
BackgroundAssessment of symptoms should be the primary outcome measure indyspepsia clinical trials. This requires a reliable, valid and responsivequestionnaire that measures the frequency and severity of dyspepsia.The Leeds Dyspepsia Questionnaire fulfils these characteristics, but islong and was not designed for self-completion, so a shorter question-naire was developed (the Short-Form Leeds Dyspepsia Questionnaire).
AimTo assess the acceptability, interpretability, internal consistency, reliab-ility, validity and responsiveness of the Short-Form Leeds DyspepsiaQuestionnaire in primary and secondary care.
MethodsUnselected primary and secondary care patients completed the Short-Form Leeds Dyspepsia Questionnaire. Test–retest reliability was assessed
after 2 days. Validity was measured by comparison with general practi-tioners’ diagnosis. Sensitivity analysis and logistic regression wereemployed to determine the most valid scoring system. Responsivenesswas determined before and after treatment for endoscopically provendisease.
ResultsThe Short-Form Leeds Dyspepsia Questionnaire was administered to 388primary care and 204 secondary care patients. The Pearson coefficientfor test–retest reliability was 0.93. The Short-Form Leeds DyspepsiaQuestionnaire had a sensitivity of 77% and a specificity of 75%. Ahighly significant response to change was observed (P < 0.005).
ConclusionsThe Short-Form Leeds Dyspepsia Questionnaire is a reliable, valid andresponsive self-completed outcome measure for quantifying the fre-quency and severity of dyspepsia symptoms, which is shorter and moreconvenient than the Leeds Dyspepsia Questionnaire.
Aliment Pharmacol Ther 25, 477–486
Alimentary Pharmacology & Therapeutics
ª 2007 The Authors 477
Journal compilation ª 2007 Blackwell Publishing Ltd
doi:10.1111/j.1365-2036.2006.03233.x
INTRODUCTION
Dyspepsia is a common condition, and one that con-
sumes considerable resources in both investigation and
treatment and of which there is still a great deal of
uncertainty regarding its management.1, 2 As a result,
a number of ‘cost-effectiveness’ randomized trials of
dyspepsia management strategies have been conduc-
ted. One difficulty for researchers has been choosing
an appropriate outcome measure as definitions of dys-
pepsia have changed over the years, and cost-effect-
iveness studies require that the ‘effect measure’ is not
contaminated by ‘resource use questions’ such as visits
to a doctor. Multidimensional scales that also assess
quality of life are particularly problematic, as there are
better validated quality of life measures that have gen-
eralizability over other disease areas (e.g. Health Util-
ity Index3 and EQ-5D4). As there is no ‘absolute’
definition of dyspeptic symptoms we rely on question-
naires that have established psychometrics.5 Dyspepsia
symptoms can be assessed by measuring either fre-
quency or severity. The frequency of symptoms has
been found to correlate more closely with a clinical
diagnosis of dyspepsia than severity, indicating that
frequency may be more valid for pragmatic studies.6
In gastro-oesophageal reflux disease (GERD), severity
of symptoms correlates more closely with oesophagitis
cure than frequency, indicating that severity may be
more responsive to change.7 Measuring both frequency
and severity of dyspepsia symptoms may improve both
validity and responsiveness to change of an instru-
ment compared with measuring either alone.6–9 A final
important factor for cost-effectiveness trials is that the
instrument is suitable for self-completion by the sub-
ject, in terms of length and ease of comprehension.
For clinical trials based in a primary care setting,
the outcome measure should have been validated in a
primary care population, where the aetiology, preval-
ence and severity of patients’ symptoms may differ to
those from secondary or tertiary care populations.10
In addition, outcome measures should be able to
distinguish between patients suffering from predomin-
antly ulcer-like symptoms (epigastric pain) or reflux
symptoms (heartburn and regurgitation); some evi-
dence suggests that predominant ulcer-like or reflux
symptoms do not reliably predict endoscopic diagnosis
of oesophagitis or ulcer, respectively.11
In a recent review of symptom-based outcome
measures for dyspepsia and GERD trials 37 studies
were identified describing 26 questionnaire outcome
measures.5 Twelve assessed symptoms only, and 14
were multidimensional. Of the unidimensional ques-
tionnaires, only two assessed both frequency and
severity of dyspepsia and had proven reliability, valid-
ity and responsiveness. The Reflux Disease Diagnostic
Questionnaire (RDQ) is an excellent measure for GERD,
but is not validated to assess dyspepsia.11 The Leeds
Dyspepsia Questionnaire (LDQ)10 was the only fully
validated unidimensional instrument to assess both
frequency and severity of dyspepsia symptoms.
Although the LDQ is a useful unidimensional outcome
measure for dyspepsia, it has three main disadvanta-
ges. It is researcher administered (not self-completed),
it is long (nine pages) and has a long reference time
frame (6 months). The aim of this study was to valid-
ate a shortened and revised the LDQ as a suitable
measure for dyspepsia trials.
METHODS
Questionnaire development
The Short-Form Leeds Dyspepsia Questionnaire
(SF-LDQ) was developed by shortening and revising
the previously validated LDQ.10 The LDQ contained
eight questions relating to dyspeptic symptoms, and
one question about the most troublesome symptom for
the patient. The SF-LDQ contained the four questions
from the LDQ which had the greatest validity com-
pared with dyspepsia diagnosis by general practition-
ers (GP) and gastroenterologists.12 Each question
comprised two stems concerning the frequency and
severity of each symptom during the last 2 months.
This time frame was a balance between reducing recall
bias (requiring a shorter time frame) and maximizing
data capture without unnecessary respondent burden
(requiring a longer time frame).9 The SF-LDQ also con-
tained a single question concerning the most trouble-
some symptom experienced by the patient to enable
categorization of patients on the basis of predominant
heartburn or epigastric pain.
The SF-LDQ was redesigned to increase its accepta-
bility, interpretability and feasibility of self-comple-
tion. The questions were arranged to fit onto a single
A4 page, with shaded boxes around the questions and
tick boxes for responses. Short summaries of the
symptoms were included to reduce ambiguity, and dia-
grammatic representations of epigastric pain and
heartburn were added to ensure understanding of these
symptoms.
478 A. FRASER et al.
ª 2007 The Authors, Aliment Pharmacol Ther 25, 477–486
Journal compilation ª 2007 Blackwell Publishing Ltd
The SF-LDQ was piloted initially using six rounds of
peer review and feedback. Version 6 of the question-
naire was piloted using a sample of 67 consecutive
primary care patients. Several modifications of the for-
mat were made and instructions were included on the
questionnaire as a result. The final version of the
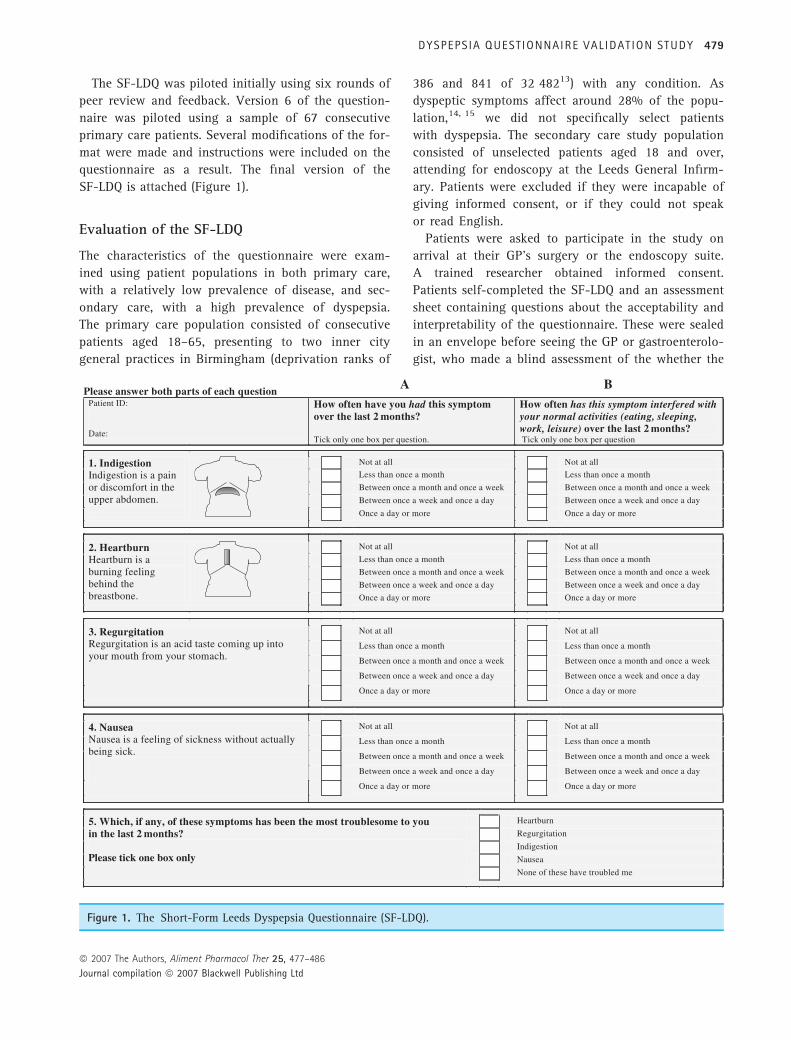
SF-LDQ is attached (Figure 1).
Evaluation of the SF-LDQ
The characteristics of the questionnaire were exam-
ined using patient populations in both primary care,
with a relatively low prevalence of disease, and sec-
ondary care, with a high prevalence of dyspepsia.
The primary care population consisted of consecutive
patients aged 18–65, presenting to two inner city
general practices in Birmingham (deprivation ranks of
386 and 841 of 32 48213) with any condition. As
dyspeptic symptoms affect around 28% of the popu-
lation,14, 15 we did not specifically select patients
with dyspepsia. The secondary care study population
consisted of unselected patients aged 18 and over,
attending for endoscopy at the Leeds General Infirm-
ary. Patients were excluded if they were incapable of
giving informed consent, or if they could not speak
or read English.
Patients were asked to participate in the study on
arrival at their GP’s surgery or the endoscopy suite.
A trained researcher obtained informed consent.
Patients self-completed the SF-LDQ and an assessment
sheet containing questions about the acceptability and
interpretability of the questionnaire. These were sealed
in an envelope before seeing the GP or gastroenterolo-
gist, who made a blind assessment of the whether the
Figure 1. The Short-Form Leeds Dyspepsia Questionnaire (SF-LDQ).
DYSPEPS IA QUESTIONNAIRE VAL IDAT ION STUDY 479
ª 2007 The Authors, Aliment Pharmacol Ther 25, 477–486
Journal compilation ª 2007 Blackwell Publishing Ltd

patient suffered with dyspepsia and recorded this on
the preprinted envelope along with demographic infor-
mation. Validity was established by comparing the
SF-LDQ score with the presence or absence of dyspep-
sia as diagnosed by the GP or gastroenterologist.
All primary care participants were asked to complete
a second SF-LDQ after 2 days to assess test–retest reli-
ability. Within the secondary care population, patients
identified as having oesophagitis or peptic ulcer dis-
ease during endoscopy were asked to complete a sec-
ond SF-LDQ 2 months later after receiving treatment
of proven efficacy (proton pump inhibitor therapy
and/or Helicobacter pylori eradication therapy). This
enabled assessment of the SF-LDQ’s responsiveness to
change in conditions with evidence-based treatments.
Freepost envelopes were used to enhance response
rates, but non-responders to the second questionnaire
were not contacted.
Data were entered onto Microsoft Excel 2000 before
conversion into SPSS Inc., Chicago, IL, USA, v10 for
analysis. Logistic regression analysis was performed
using Generalized Linear Interactive Modelling, Royal
Statistical Society (GLIM) to determine the most valid
scoring system for the questionnaire. Statistical signi-
ficance was determined where P < 0.05. Ethical
approval was obtained for South Birmingham, West
Birmingham and Leeds, UK.
RESULTS
Population
A total of 592 patients were enrolled into the study, 388
patients from primary care and 204 patients from sec-
ondary care. Out of these, 361 (61%) were female and
231 (39%) were male. Ages for the primary care patients
ranged from 18 to 65, and for secondary care, 18–81.
Fifty-five questionnaires (9%) had one or more missing
responses and were excluded from the final analysis, as
a summed score could not be calculated. Score analysis
was therefore performed on 375 patients from primary
care and 162 patients from secondary care.
Interpretability and acceptability
Five hundred and eighty-six participants from primary
and secondary care completed at least one question
concerning the interpretability and acceptability of the
SF-LDQ. Overall, 97% found the questionnaire easy to
read, 95% found it easy to interpret and 94% thought
the layout was sufficiently clear.
Endorsement frequencies (the proportion of respond-
ents who chose each response category to a question)
were calculated for each response category to every
question using combined data from primary and sec-
ondary care. Every response category had an endorse-
ment frequency of >5%, except for regurgitation
severity ‘more than daily’ (Table 1). The distribution of
responses to each of the questions about symptom fre-
quency and severity were positively skewed, reflecting
the inclusion of the 278 participants from primary care
(47% of all participants) who did not have dyspepsia
according to their GPs diagnosis.
Non-response to questions regarding symptom fre-
quency occurred with 1% or less of participants, indica-
ting that this part of the questionnaire was acceptable
and interpretable. However, there was no response to
questions regarding symptom severity in around 5% of
cases, indicating that this part of the questionnaire may
have been less acceptable or interpretable.
Table 1. Endorsement frequencies for each response category of the Short-Form Leeds Dyspepsia Questionnaire
Symptom
Response category (%)
Notat all
Less thanmonthly
Between monthlyand weekly
Between weeklyand daily
Morethan daily
Noresponse
Indigestion frequency 35 16 15 16 17 1Heartburn frequency 39 18 15 15 13 0.8Regurgitation frequency 43 21 14 14 8 0.5Nausea frequency 38 23 16 14 9 1Indigestion severity 45 12 13 16 8 5Heartburn severity 50 11 15 12 7 5Regurgitation severity 56 13 12 10 4 5Nausea severity 46 18 12 11 6 6
480 A. FRASER et al.
ª 2007 The Authors, Aliment Pharmacol Ther 25, 477–486
Journal compilation ª 2007 Blackwell Publishing Ltd
Internal consistency
Cronbach’s alpha coefficient for combined primary
and secondary care patients was 0.90, representing a
high level of internal consistency. The item-total cor-
relation for each question ranged from 0.57 to 0.75,
suggesting that each question was independently asso-
ciated with the total questionnaire score and that all
questions were measuring different aspects of the same
condition.
Test–retest reliability
In the primary care sample, 151 of 375 patients (40%)
returned a fully completed second questionnaire after
at least 2 days. Pearson’s correlation coefficient
between the first and second summed total scores was
0.93, representing a high degree of reliability on
re-testing the questionnaire.
Validity
Concurrent validity was established using the primary
care population and divergent validity was examined by
comparing the primary and secondary care populations.
Concurrent validity
Concurrent validity was assessed by comparing the
SF-LDQ score with the GPs’ opinion of whether the
patient had dyspepsia, expressed as a dichotomous
‘yes’ or ‘no’ response. Altogether 101 patients (27%)
were diagnosed as suffering with dyspepsia, 278
patients (73%) had no dyspepsia. Nine participants out
of 375 with fully completed questionnaires did not
receive a clinical assessment of dyspepsia by their GP,
so 366 primary care patients were analysed to deter-
mine concurrent validity.
Sensitivity analyses
SF-LDQ scores were calculated using five different
methods to evaluate which produced the most valid
assessment of dyspepsia. These methods were:
1 a summed total score of the frequency and sever-
ity responses for each symptom (range: 0–32);
2 a summed score of the frequency responses for
each symptom (range: 0–16);
3 a summed score of the severity responses for each
symptom (range: 0–16);
4 a categorized score of the single most frequent
symptom (range: 0–4) and
5 a categorized score of the single most severe
symptom (range: 0–4).
Categorized scores were calculated by rating the sin-
gle most frequent or severe symptom from 0 (not at
all) to 4 (once a day or more). Scoring systems 1–3 are
more practical and feasible to administer as they
require simple addition. Scoring systems 4 and 5 are
more complex, but may be more valid as they are
based on the Rome criteria for assessing the presence
of dyspepsia.16
For each scoring system, a Receiver Operating Char-
acteristics (ROC) curve was plotted against the GPs’
diagnosis to determine the most sensitive and specific
point on the scale. The first point on each ROC curve
where sensitivity was greater than specificity was
selected as the ‘cut-off’ for diagnosing the presence of
dyspepsia. This gave a dichotomous outcome of whe-
ther dyspepsia was present or absent for each scoring
system. Table 2 shows the area under the ROC curves
and their 95% confidence intervals (CIs) using differ-
ent scoring systems, together with the chosen cut-off
score, sensitivity and specificity for that system.
Although the summed frequency score produced a
slightly larger area under the ROC curve (0.83) com-
pared with the summed total score (0.82), this differ-
Table 2. Attributes of the five systems used to score the Short-Form Leeds Dyspepsia Questionnaire in the primary carepopulation
Scoring system Area under curve (95% CI) ‘Cut-off’ score Sensitivity Specificity
1 Summed total score 0.82 (0.777–0.868) 7/32 77.3 73.22 Summed frequency score 0.83 (0.790–0.876) 4/16 86.0 66.23 Summed severity score 0.76 (0.700–0.817) 2/16 80.6 61.04 Categorized frequency score 0.79 (0.738–0.836) 2/4 86.1 59.75 Categorized severity score 0.73 (0.671–0.787) 1/4 84.2 45.7
DYSPEPS IA QUESTIONNAIRE VAL IDAT ION STUDY 481
ª 2007 The Authors, Aliment Pharmacol Ther 25, 477–486
Journal compilation ª 2007 Blackwell Publishing Ltd

ence was not statistically significant. The summed
total score was chosen as the preferred method of
scoring the questionnaire because this scoring system
had the greatest specificity, giving closer agreement
between the sensitivity and specificity, and it also had
a greater range of possible scores, allowing greater
precision.17 Figure 2 shows the ROC curve for the
summed total score.
Logistic regression analyses
Logistic regression analyses assessed the strength of
the scoring system’s association with the GPs’ diagno-
sis. All associations were strongly statistically signifi-
cant (P < 0.0005). The summed frequency score was
marginally the best predictor of GPs’ diagnosis. How-
ever, the difference between the summed total score
and the summed frequency score again was not statis-
tically significant.
Discriminant validity
Discriminant validity was assessed by comparing
the primary and secondary care populations using the
summed total scoring system. Figure 3 shows the
range of scores in the two populations. The difference
between these scores was highly statistically signifi-
cant using the Mann–Whitney U-test (P < 0.0005),
demonstrating that the SF-LDQ was able to discrimi-
nate between two populations with different preva-
lence of dyspepsia.
Responsiveness to change
Oesophagitis or peptic ulcers was found in 60 of the
162 patients who completed the first questionnaire
from the secondary care population following endo-
scopy. These patients were asked to complete a second
questionnaire following treatment of proven efficacy,
2 months after the endoscopy. This questionnaire was
returned by 47 patients (78%). Ten patients were
excluded due to missing data, leaving 37 patients eli-
gible for this analysis.
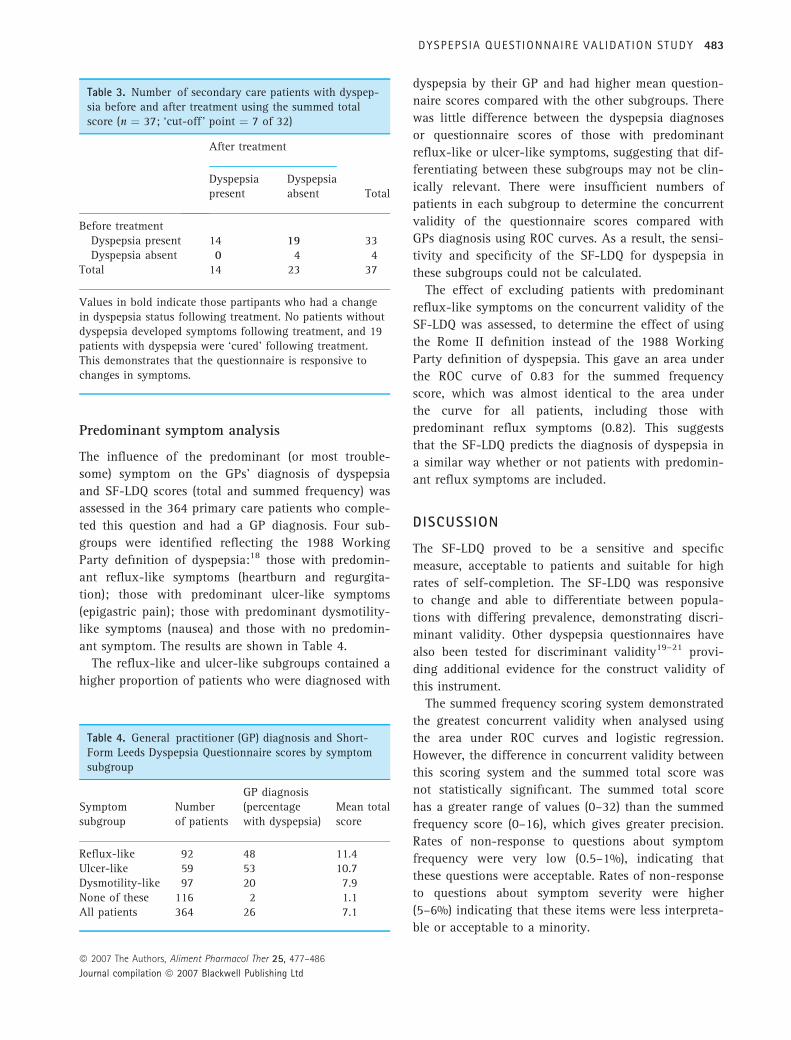
The number of patients with dyspepsia present and
absent according to the ‘cut-off’ identified by the sen-
sitivity analysis for the summed total score (seven of
32) was compared before and after treatment (Table 3).
Before treatment 89% of patients had dyspepsia com-
pared with 38% after treatment, which was highly sig-
nificant using the McNemar test (P < 0.005). The
standardized response mean for this change was 1.1,
suggesting a large degree of responsiveness.
1 - Specificity1.000.750.500.250.00
Sen
sitiv
ity1.00
0.75
0.50
0.25
0.00
Figure 2. Receiver Operating Characteristic curve for thesummed total score of the Short-Form Leeds DyspepsiaQuestionnaire. The lines show the most sensitive and spe-cific cut-off point for the scoring system.
Secondary carePrimary care
Sum
med
tota
l sco
re
34
30
26
22
18
14
10
6
2
–2
Figure 3. Box plot showing the distribution of Short-Form Leeds Dyspepsia Questionnaire summed total scoresfor primary (n ¼ 375) and secondary care (n ¼ 162) pop-ulations. ‘Boxes’ show 25–75th centiles, with the horizon-tal line representing the mean. ‘Whiskers’ represent the5th and 95th centiles.
482 A. FRASER et al.
ª 2007 The Authors, Aliment Pharmacol Ther 25, 477–486
Journal compilation ª 2007 Blackwell Publishing Ltd
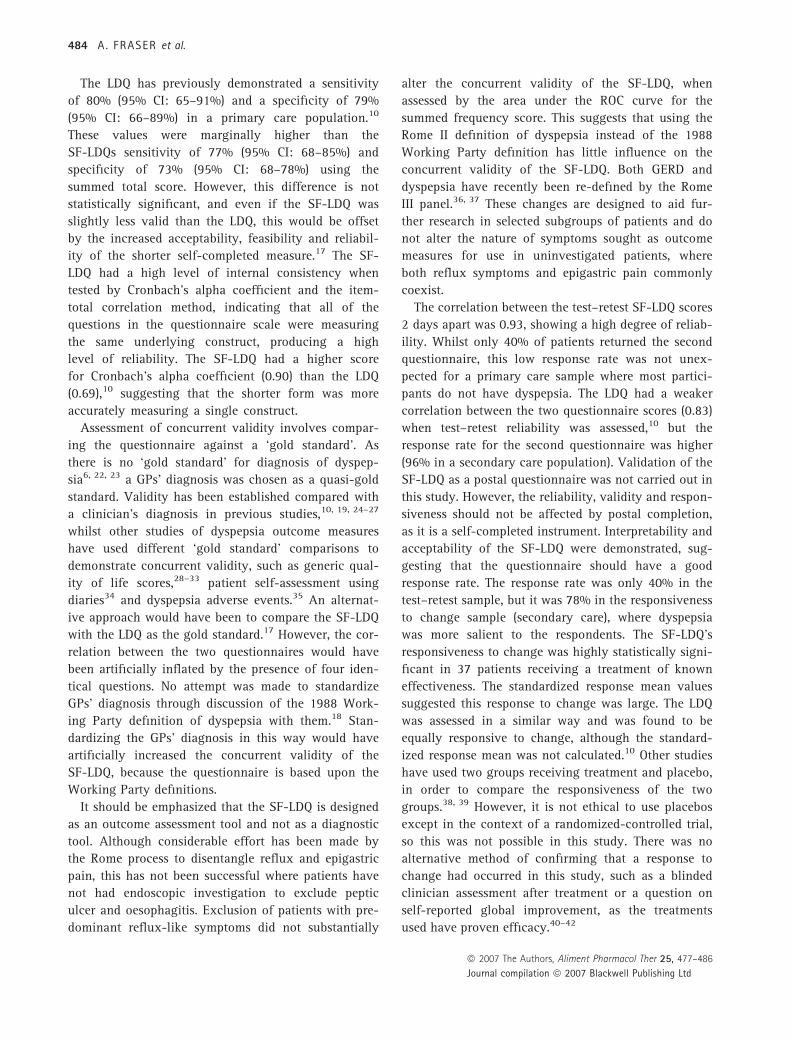
Predominant symptom analysis
The influence of the predominant (or most trouble-
some) symptom on the GPs’ diagnosis of dyspepsia
and SF-LDQ scores (total and summed frequency) was
assessed in the 364 primary care patients who comple-
ted this question and had a GP diagnosis. Four sub-
groups were identified reflecting the 1988 Working
Party definition of dyspepsia:18 those with predomin-
ant reflux-like symptoms (heartburn and regurgita-
tion); those with predominant ulcer-like symptoms
(epigastric pain); those with predominant dysmotility-
like symptoms (nausea) and those with no predomin-
ant symptom. The results are shown in Table 4.
The reflux-like and ulcer-like subgroups contained a
higher proportion of patients who were diagnosed with
dyspepsia by their GP and had higher mean question-
naire scores compared with the other subgroups. There
was little difference between the dyspepsia diagnoses
or questionnaire scores of those with predominant
reflux-like or ulcer-like symptoms, suggesting that dif-
ferentiating between these subgroups may not be clin-
ically relevant. There were insufficient numbers of
patients in each subgroup to determine the concurrent
validity of the questionnaire scores compared with
GPs diagnosis using ROC curves. As a result, the sensi-
tivity and specificity of the SF-LDQ for dyspepsia in
these subgroups could not be calculated.
The effect of excluding patients with predominant
reflux-like symptoms on the concurrent validity of the
SF-LDQ was assessed, to determine the effect of using
the Rome II definition instead of the 1988 Working
Party definition of dyspepsia. This gave an area under
the ROC curve of 0.83 for the summed frequency
score, which was almost identical to the area under
the curve for all patients, including those with
predominant reflux symptoms (0.82). This suggests
that the SF-LDQ predicts the diagnosis of dyspepsia in
a similar way whether or not patients with predomin-
ant reflux symptoms are included.
DISCUSSION
The SF-LDQ proved to be a sensitive and specific
measure, acceptable to patients and suitable for high
rates of self-completion. The SF-LDQ was responsive
to change and able to differentiate between popula-
tions with differing prevalence, demonstrating discri-
minant validity. Other dyspepsia questionnaires have
also been tested for discriminant validity19–21 provi-
ding additional evidence for the construct validity of
this instrument.
The summed frequency scoring system demonstrated
the greatest concurrent validity when analysed using
the area under ROC curves and logistic regression.
However, the difference in concurrent validity between
this scoring system and the summed total score was
not statistically significant. The summed total score
has a greater range of values (0–32) than the summed
frequency score (0–16), which gives greater precision.
Rates of non-response to questions about symptom
frequency were very low (0.5–1%), indicating that
these questions were acceptable. Rates of non-response
to questions about symptom severity were higher
(5–6%) indicating that these items were less interpreta-
ble or acceptable to a minority.
Table 3. Number of secondary care patients with dyspep-sia before and after treatment using the summed totalscore (n ¼ 37; ‘cut-off ’ point ¼ 7 of 32)
After treatment
TotalDyspepsiapresent
Dyspepsiaabsent
Before treatmentDyspepsia present 14 19 33Dyspepsia absent 0 4 4
Total 14 23 37
Values in bold indicate those partipants who had a changein dyspepsia status following treatment. No patients withoutdyspepsia developed symptoms following treatment, and 19patients with dyspepsia were ‘cured’ following treatment.This demonstrates that the questionnaire is responsive tochanges in symptoms.
Table 4. General practitioner (GP) diagnosis and Short-Form Leeds Dyspepsia Questionnaire scores by symptomsubgroup
Symptomsubgroup
Numberof patients
GP diagnosis(percentagewith dyspepsia)
Mean totalscore
Reflux-like 92 48 11.4Ulcer-like 59 53 10.7Dysmotility-like 97 20 7.9None of these 116 2 1.1All patients 364 26 7.1
DYSPEPS IA QUESTIONNAIRE VAL IDAT ION STUDY 483
ª 2007 The Authors, Aliment Pharmacol Ther 25, 477–486
Journal compilation ª 2007 Blackwell Publishing Ltd
The LDQ has previously demonstrated a sensitivity
of 80% (95% CI: 65–91%) and a specificity of 79%
(95% CI: 66–89%) in a primary care population.10
These values were marginally higher than the
SF-LDQs sensitivity of 77% (95% CI: 68–85%) and
specificity of 73% (95% CI: 68–78%) using the
summed total score. However, this difference is not
statistically significant, and even if the SF-LDQ was
slightly less valid than the LDQ, this would be offset
by the increased acceptability, feasibility and reliabil-
ity of the shorter self-completed measure.17 The SF-
LDQ had a high level of internal consistency when
tested by Cronbach’s alpha coefficient and the item-
total correlation method, indicating that all of the
questions in the questionnaire scale were measuring
the same underlying construct, producing a high
level of reliability. The SF-LDQ had a higher score
for Cronbach’s alpha coefficient (0.90) than the LDQ
(0.69),10 suggesting that the shorter form was more
accurately measuring a single construct.
Assessment of concurrent validity involves compar-
ing the questionnaire against a ‘gold standard’. As
there is no ‘gold standard’ for diagnosis of dyspep-
sia6, 22, 23 a GPs’ diagnosis was chosen as a quasi-gold
standard. Validity has been established compared with
a clinician’s diagnosis in previous studies,10, 19, 24–27
whilst other studies of dyspepsia outcome measures
have used different ‘gold standard’ comparisons to
demonstrate concurrent validity, such as generic qual-
ity of life scores,28–33 patient self-assessment using
diaries34 and dyspepsia adverse events.35 An alternat-
ive approach would have been to compare the SF-LDQ
with the LDQ as the gold standard.17 However, the cor-
relation between the two questionnaires would have
been artificially inflated by the presence of four iden-
tical questions. No attempt was made to standardize
GPs’ diagnosis through discussion of the 1988 Work-
ing Party definition of dyspepsia with them.18 Stan-
dardizing the GPs’ diagnosis in this way would have
artificially increased the concurrent validity of the
SF-LDQ, because the questionnaire is based upon the
Working Party definitions.
It should be emphasized that the SF-LDQ is designed
as an outcome assessment tool and not as a diagnostic
tool. Although considerable effort has been made by
the Rome process to disentangle reflux and epigastric
pain, this has not been successful where patients have
not had endoscopic investigation to exclude peptic
ulcer and oesophagitis. Exclusion of patients with pre-
dominant reflux-like symptoms did not substantially
alter the concurrent validity of the SF-LDQ, when
assessed by the area under the ROC curve for the
summed frequency score. This suggests that using the
Rome II definition of dyspepsia instead of the 1988
Working Party definition has little influence on the
concurrent validity of the SF-LDQ. Both GERD and
dyspepsia have recently been re-defined by the Rome
III panel.36, 37 These changes are designed to aid fur-
ther research in selected subgroups of patients and do
not alter the nature of symptoms sought as outcome
measures for use in uninvestigated patients, where
both reflux symptoms and epigastric pain commonly
coexist.
The correlation between the test–retest SF-LDQ scores
2 days apart was 0.93, showing a high degree of reliab-
ility. Whilst only 40% of patients returned the second
questionnaire, this low response rate was not unex-
pected for a primary care sample where most partici-
pants do not have dyspepsia. The LDQ had a weaker
correlation between the two questionnaire scores (0.83)
when test–retest reliability was assessed,10 but the
response rate for the second questionnaire was higher
(96% in a secondary care population). Validation of the
SF-LDQ as a postal questionnaire was not carried out in
this study. However, the reliability, validity and respon-
siveness should not be affected by postal completion,
as it is a self-completed instrument. Interpretability and
acceptability of the SF-LDQ were demonstrated, sug-
gesting that the questionnaire should have a good
response rate. The response rate was only 40% in the
test–retest sample, but it was 78% in the responsiveness
to change sample (secondary care), where dyspepsia
was more salient to the respondents. The SF-LDQ’s
responsiveness to change was highly statistically signi-
ficant in 37 patients receiving a treatment of known
effectiveness. The standardized response mean values
suggested this response to change was large. The LDQ
was assessed in a similar way and was found to be
equally responsive to change, although the standard-
ized response mean was not calculated.10 Other studies
have used two groups receiving treatment and placebo,
in order to compare the responsiveness of the two
groups.38, 39 However, it is not ethical to use placebos
except in the context of a randomized-controlled trial,
so this was not possible in this study. There was no
alternative method of confirming that a response to
change had occurred in this study, such as a blinded
clinician assessment after treatment or a question on
self-reported global improvement, as the treatments
used have proven efficacy.40–42
484 A. FRASER et al.
ª 2007 The Authors, Aliment Pharmacol Ther 25, 477–486
Journal compilation ª 2007 Blackwell Publishing Ltd
Three percent of respondents commented that the
text size was too small and a larger version of the
questionnaire should be made available for such
patients in clinical trials. Non-English speaking
patients were excluded from this study, but should be
included in clinical dyspepsia trials to increase gener-
alizability. Translation of the SF-LDQ into other lan-
guages would alter its characteristics, necessitating
further validation.17, 31
The SF-LDQ is a self-completed outcome measure
that assesses both the frequency and severity of dys-
pepsia symptoms for which acceptability, interpretabil-
ity, reliability, validity and responsiveness to change
have been demonstrated. It is a precise measure using
the summed total score of frequency and severity
responses and has good feasibility due to its brevity.
The SF-LDQ meets all the criteria for an outcome
measure for dyspepsia in cost-effectiveness trials, and
is particularly well suited to primary care trials invol-
ving uninvestigated patients.
ACKNOWLEDGEMENTS
This work was undertaken by Dr Adam Fraser as part
of a Masters in Primary Care degree at the University
of Birmingham. John C. Duffy provided statistical
advice at the Department of Primary Care and General
Practice, University of Birmingham. He carried out the
sensitivity analyses and logistic regression analyses.
Val Redman and Beth Hinks are Research Associates at
the Department of Primary Care and General Practice,
University of Birmingham. They assisted with patient
recruitment and data entry.
AUTHOR CONTRIBUTIONS
Adam Fraser: Lead contributor to study design and
planning, conducting the study, data analysis and wri-
ting the manuscript; Brendan C. Delaney: guarantor of
the submission and corresponding author. Contributed
to study design and planning, and writing the manu-
script; Alexander C. Ford: responsible for conducting
the secondary care arm of the study at Leeds General
Infirmary; Michelle Qume: contributed to conducting
the study, data entry and analysis and writing the
manuscript; Paul Moayyedi: contributed significantly
to study design and planning, especially questionnaire
development. All authors have checked and approved
the final draft submitted.
STATEMENT OF INTERESTS
Authors’ declaration of personal interests: All authors
were employed by the University of Birmingham at
the time of this study.
Declaration of funding interests: The study was fun-
ded in full by the Medical Research Council as part of
the CUBE trial (ISRCTN 87644265). The general prac-
tices involved were reimbursed by the Midlands
Research Practices Consortium (MidReC) for each
patient enrolled. Gastroenterologists recruited patients
in secondary care without remuneration.
REFERENCES
1 Delaney BC, Moayyedi P, Deeks J, et al.
The management of dyspepsia: a sys-
tematic review. Health Technol Assess
2000; 4: 1–189.
2 Talley NJ. Dyspepsia: management
guidelines for the millennium. Gut
2002; 50: 72iv–8.
3 Torrance GW, Boyle MH, Horwood SP.
Application of multi-attribute utility
theory to measure social preference for
health states. Oper Res 1982; 30:
1043–69.
4 Kind P, Dolan P, Gudex C, Williams A.
Variations in population health status:
results from a United Kingdom national
questionnaire survey. BMJ 1998; 316:
736–41.
5 Fraser A, Delaney B, Moayyedi P.
Symptom-based outcome measures for
dyspepsia and GERD trials: a systematic
review. Am J Gastroenterol 2005; 100:
442–52.
6 Agreus L. Natural history of dyspepsia.
Gut 2002; 50: 2iv–9.
7 Sharma N, Donnellan C, Preston C,
Delaney B, Duckett G, Moayyedi P. A
systematic review of symptomatic out-
comes used in oesophagitis drug ther-
apy trials. Gut 2004; 53 (Suppl. 4):
iv58–65.
8 Talley NJ. A critique of therapeutic tri-
als in Helicobacter pylori-positive func-
tional dyspepsia. Gastroenterology 1994;
106: 1174–83.
9 McColl E. Best Practice in Symptom
Assessment: a review. Gut 2004; 53
(Suppl. 4): iv49–54.
10 Moayyedi P, Duffett S, Braunholtz D,
et al. The Leeds Dyspepsia Question-
naire: a valid tool for measuring the
presence and severity of dyspepsia. Ali-
ment Pharmacol Ther 1998; 12: 1257–
62.
11 Shaw MJ, Talley NJ, Beebe TJ, et al. Ini-
tial validation of a diagnostic question-
naire for gastroesophageal reflux
disease. Am J Gastroenterol 2001; 96:
52–7.
12 Moayyedi P. Helicobacter pylori Eradi-
cation in General Practice: Medical
DYSPEPS IA QUESTIONNAIRE VAL IDAT ION STUDY 485
ª 2007 The Authors, Aliment Pharmacol Ther 25, 477–486
Journal compilation ª 2007 Blackwell Publishing Ltd
Benefits and Health Economics. Leeds:
Institute of Epidemiology and Health
Services Research, University of Leeds,
1999.
13 Office of the Deputy Prime Minister. The
English Indices of Deprivation. London:
Neighbourhood Renewal Unit, 2004.
14 Heading RC. Prevalence of upper gastro-
intestinal symptoms in the general pop-
ulation: a systematic review. Scand
J Gastroenterol Suppl 1999; 231: 3–8.
15 Stanghellini V. Three-month prevalence
rates of gastrointestinal symptoms and
the influence of demographic factors:
results from the Domestic/International
Gastroenterology Surveillance Study
(DIGEST). Scand J Gastroenterol Suppl
1999; 231: 20–8.
16 Talley Colin-Jones NJD, Koch KL,
Koch M, Nyren O, Stanghellini V. Func-
tional dyspepsia: a classification with
guidelines for diagnosis and manage-
ment. Gastroenterol Int 1991; 4: 145–
60.
17 Fitzpatrick R, Davey C, Buxton MJ,
Jones DR. Evaluating patient-based out-
come measures for use in clinical trials.
Health Technol Assess 1998; 2: 1–74.
18 Management of dyspepsia: report of a
working party. Lancet 1988; 1: 576–9.
19 Buckley MJ, Scanlon C, McGurgan P,
O’Morain CA. A validated dyspepsia
symptom score. Ital J Gastroenterol
Hepatol 1997; 29: 495–500.
20 Poitras MR, Verrier P, So C, Paquet S,
Bouin M, Poitras P. Group counseling
psychotherapy for patients with func-
tional gastrointestinal disorders: devel-
opment of new measures for symptom
severity and quality of life. Dig Dis Sci
2002; 47: 1297–307.
21 Calvet X, Bustamante E, Montserrat A,
et al. Validation of phone interview for
follow-up in clinical trials on dyspepsia:
evaluation of the Glasgow Dyspepsia
Severity Score and a Likert-scale symp-
toms test. Eur J Gastroenterol Hepatol
2000; 12: 949–53.
22 Dent J. Definitions of reflux disease and
its separation from dyspepsia. Gut 2002;
50: 17iv–20.
23 Talley NJ, Stanghellini V, Heading RC,
Koch KL, Malagelada JR, Tytgat GN.
Functional gastroduodenal disorders.
Gut 1999; 45 (Suppl. 2): II37–42.
24 Greatorex R, Thorpe JA. Clinical assess-
ment of gastro-oesophageal reflux by
questionnaire. Br J Clin Pract 1983; 37:
133–5.
25 Junghard O, Lauritsen K, Talley NJ,
Wiklund IK. Validation of seven graded
diary cards for severity of dyspeptic
symptoms in patients with non-ulcer
dyspepsia. Eur J Surg Suppl 1998; 583:
106–11.
26 Locke GR, Talley NJ, Weaver AL,
Zinsmeister AR. A new questionnaire
for gastroesophageal reflux disease.
Mayo Clin Proc 1994; 69: 539–47.
27 Talley NJ, Phillips SF, Wiltgen CM,
Zinsmeister AR, Melton LJ III. Assess-
ment of functional gastrointestinal dis-
ease: the bowel disease questionnaire.
Mayo Clin Proc 1990; 65: 1456–79.
28 Hu WH, Lam KF, Wong YH, et al. The
Hong Kong index of dyspepsia: a valid-
ated symptom severity questionnaire for
patients with dyspepsia. J Gastroenterol
Hepatol 2002; 17: 545–51.
29 Dimenas E, Glise H, Hallerback B,
Hernqvist H, Svedlund J, Wiklund I.
Quality of life in patients with upper
gastrointestinal symptoms. An improved
evaluation of treatment regimens?
Scand J Gastroenterol 1993; 28: 681–7.
30 Shaw M, Talley NJ, Adlis S, Beebe T,
Tomshine P, Healey M. Development of
a digestive health status instrument:
tests of scaling assumptions, structure
and reliability in a primary care popula-
tion. Aliment Pharmacol Ther 1998; 12:
1067–78.
31 Goldman J, Conrad DF, Ley C, et al.
Validation of Spanish language dyspep-
sia questionnaire. Dig Dis Sci 2002; 47:
624–40.
32 Garratt AM, Ruta DA, Russell I, et al.
Developing a condition-specific measure
of health for patients with dyspepsia
and ulcer-related symptoms. J Clin Epi-
demiol 1996; 49: 565–71.
33 Eypasch E, Williams JI, Wood-Dauphinee
S, et al. Gastrointestinal Quality of Life
Index: development, validation and
application of a new instrument. Br J
Surg 1995; 82: 216–22.
34 Leidy NK, Farup C, Rentz AM,
Ganoczy D, Koch KL. Patient-based
assessment in dyspepsia: development
and validation of Dyspepsia Symptom
Severity Index (DSSI). Dig Dis Sci
2000; 45: 1172–9.
35 Rabeneck L, Wristers K, Goldstein JL,
Eisen G, Dedhiya SD, Burke TA. Reliab-
ility, validity, and responsiveness of
severity of dyspepsia assessment (SODA)
in a randomized clinical trial of a COX-
2-specific inhibitor and traditional
NSAID therapy. Am J Gastroenterol
2002; 97: 32–9.
36 Drossman DA. The functional gastroin-
testinal disorders and the Rome III Pro-
cess. Gastroenterology 2006; 130:
1377–90.
37 Vakil N, VanZanten S, John D, Kahrilas
P, Roger J. The Definition of GERD: a
Global, Evidence-based Consensus.
Los Angeles, USA: Digestive Disease
Week, 2006.
38 Rabeneck L, Cook KF, Wristers K,
Souchek J, Menke T, Wray NP. SODA
(severity of dyspepsia assessment): a
new effective outcome measure for dys-
pepsia-related health. J Clin Epidemiol
2001; 54: 755–65.
39 Rothman M, Farup C, Stewart W,
Helbers L, Zeldis J. Symptoms associ-
ated with gastroesophageal reflux dis-
ease: development of a questionnaire
for use in clinical trials. Dig Dis Sci
2001; 46: 1540–9.
40 Laine L, Hopkins RJ, Girardi LS. Has the
impact of Helicobacter pylori therapy
on ulcer recurrence in the United States
been overstated? A meta-analysis of
rigorously designed trials. Am J Gast-
roenterol 1998; 93: 1409–15.
41 Chiba N, De Gara CJ, Wilkinson JM,
Hunt RH. Speed of healing and
symptom relief in grade II to IV gastr-
oesophageal reflux disease: a meta-ana-
lysis. Gastroenterology 1997; 112:
1798–810.
42 Penston JG. Review article: Clinical
aspects of Helicobacter pylori eradica-
tion therapy in peptic ulcer disease. Ali-
ment Pharmacol Ther 1996; 10: 469–86.
ª 2007 The Authors, Aliment Pharmacol Ther 25, 477–486
Journal compilation ª 2007 Blackwell Publishing Ltd
486 A. FRASER et al.