ECG TRANSMISSION THROUGH RF BY KUSHSAIRY BIN ABDUL ...
24
ECG TRANSMISSION THROUGH RF BY KUSHSAIRY BIN ABDUL KADIR INTERNATIONAL ISLAMIC UNIVERSITY MALAYSIA 2007
-
Upload
khangminh22 -
Category
Documents
-
view
1 -
download
0
Transcript of ECG TRANSMISSION THROUGH RF BY KUSHSAIRY BIN ABDUL ...

ECG TRANSMISSION THROUGH RF
BY
KUSHSAIRY BIN ABDUL KADIR
INTERNATIONAL ISLAMIC UNIVERSITY MALAYSIA
2007

ECG TRANSMISSION THROUGH RF
By
KUSHSAIRY BIN ABDUL KADIR A dissertation submitted in partial fulfilment of the
requirements for the degree of Master of Science in Mechatronics Engineering
Kulliyyah of Engineering International Islamic University Malaysia
JUNE 2007

ii
ABSTRACT
An ECG signal is an important physiological signal being monitored by medical personnel to check the heart condition of a patient. ECG monitors, currently in use are bulky, wired and non portable requiring a series of wires run from patients’ bed to the nurses’ desk, regarded to be manual. Current trend of monitoring of bio-medical signals is toward more integration of data acquisition devices (such as ECG machines) with presentation devices (such as PCs, cellular phones) through the wireless means for on-line monitoring purposes. In this paper design and implementation of an ECG data telemetry system is presented which takes ECG signals from a simulator and sends it through a wireless connection to a nearby computer. Radio frequency transmitters are used and the received signal is interfaced to the computer through NI-Card. The ECG signal is displayed after passing it through a series of filters developed in the software tool of LabView. Through experiments frequency and attenuation responses are given to show to indicate that the proposed telecommunication system is robust and reliable.
iii
ملخص البحث
التي يتم مراقبتها من قبل الموظف الطبي إشارة فسيولوجية مهمة ) اي سي جي(تعتبرإشارة ال
، المستخدم في الوقت الحاضر حجمه آبير، )اي سي جي(مرشد ال . لفحص حالة مرضى القلب
وله توصيالت سلكية عديدة، واليمكن تغير مكانه بسهولة، آما يتطلب عدة توصيالت بين سرير
االتجاه الحالي يميل . المريض، ومكتب الممرضة، باإلضافة إلى أن السيطرة عليه تتم يدويا
) اي سي جي(لوجية باستخدام أجهزة ال أآثر إلى الحصول على اإلشارات الطبية البيو
والمربوطة مع االدوات المساعدة مثل الحاسوب والموبايل بدون الحاجة إلى التوصيالت
اي سي (تم في هذه االطروحة تصميم، وتطبيق نظام ال . السلكية لغرض متابعة حالة المريض
ب بدون الحاجة الى والذي يأخذ اإلشارات من المحاآي، ويرسلها إلى الحاسوب القري) جي
تم استخدام جهاز إرسال التردد الراديوي آما أن االشارة المستلمة تذهب . التوصيالت السلكية
تعرض على الشاشة بعد مرورها ) أي سي جي(إشارة ال ). ان آي(إلى الحاسوب خالل آارت
تم ". يوالب ف"خالل مجموعة من المرشحات التي تم تطويرها في أدوات السوفت وير المسمى
خالل التجارب قياس التردد، وآثافة االشعاع االلكترومغناطيسي للتاآيد على ان هذا النظام
. المقترح هو قوي وموثوق به

iv
APPROVAL PAGE I certify that I have supervised and read this study and that in my opinion, it conforms to acceptable standards of scholarly presentation and is fully adequate, in scope and quality, as a dissertation for the degree of Master of Science in Mechatronics Engineering. ……………………………………... Sheroz Khan
Supervisor I certify that I have read this study and that in my opinion it conforms to acceptable standards of scholarly presentation and is fully adequate, in scope and quality, as a dissertation for the degree of Master of Science in Mechatronics Engineering. ….…………………………………… Othman O. Khalifa Internal Examiner …….………………………………… Wahyudi Martono Internal Examiner The dissertation was submitted to the Advanced Engineering and Innovation Centre and is accepted as a partial fulfilment of the requirements for the degree of Master of Science in Manufacturing Engineering. ……..…………………………………… Hamzah Mohd Salleh Director, Advanced Engineering and
Innovation Centre The dissertation was submitted to the Kulliyah of Engineering and is accepted as a partial fulfilment of the requirements for the degree of Master of Science in Manufacturing Engineering. ………………………………………….. Ahmad Faris Ismail Dean, Kulliyyah of Engineering

v
DECLARATION
I hereby declare that this dissertation is the result of my own investigations, except
where otherwise stated. I also declare that it has not been previously or concurrently
submitted as a whole for any other degrees at IIUM or other institutions.
Kushsairy bin Abdul Kadir Signature.................................................. Date . ……………………….

vi
INTERNATIONAL ISLAMIC UNIVERSITY MALAYSIA
DECLARATION OF COPYRIGHT AND
AFFIRMATION OF FAIR USE OF UNPUBLISHED RESEARCH
Copyright © 2007 By Kushsairy bin Abdul Kadir. All Rights Reserved.
ECG DATA TRAMSMISSION THROUGH RF
No part of this unpublished research may be reproduced, stored in a retrieval system, or transmitted, in any form or by any means, electronic, mechanical, photocopying, recording or otherwise without prior written permission of the copyright holder except as provided below.
1. Any material contained in or derived from this unpublished research may only be used by others in their writing with due acknowledgement.
2. IIUM or its library will have the right to make transmit copies (print of
electronic) for institutional and academic purposes. 3. The IIUM library will have the right to make, store in a retrieval system
and supply copies of this unpublished research if requested by other universities and research libraries.
Affirmed by Kushsairy bin Abdul Kadir
…………………………….. ………………………….. Signature Date

vii
In dedication to my parent, beloved wife and children

viii
ACKNOWLEDGEMENTS
Bismillahhirrahmaannirrahim, All praise is due to Allah without whose help this dissertation would not reach this stage. The dissertation was done under the supervision of Assoc. Prof. Dr Sheroz Khan, in the Department of Electrical and Communication Engineering. I would like to express my gratitude to Assoc. Prof. Dr. Sheroz Khan for his dedicated guidance, suggestions, critical comments and warm support. I would like to thank all the people who help directly or indirectly to finish this dissertation I am grateful to all the academic and administration staff at the Advanced Engineering and Innovation Centre, International Islamic University for their cooperation, kindness and assistance. Last but not least, I owe a lot to my friend and colleague Mr Zulkifli Mahmoodin. Our conversations and work together have greatly influenced this dissertation. Finally, I wish to express my deep gratitude to my beloved wife and childrens for their unlimited support and patience.

ix
TABLE OF CONTENTS Abstract ………………………………………………………………….............. ii Abstract in Arabic ……………………………………………………………….. iii Approval Page ……………………………………………………………..……. iv Declaration …………………………………………………………………........ v Acknowledgements…………………………………………………………........ vi List of Tables ……………………………………………………………………. xii List of Figures ………………………………………………………………....... xiii List of Abbreviations ……………………………………………………………. xvi
CHAPTER ONE: INTRODUCTION ……………………………………….......... 1
1.1 Introduction……..…………………………………………................. 1 1.2 Problem Statement……………………………………………………. 2 1.3 Propose Approaches. ………………………………………………… 3
1.4 Objective of the Thesis. …………………………………………….. 4 1.5 Thesis Structure……………………………………………………… 4
CHAPTER TWO: LITERATURE REVIEW…….…………………………….. 6
2.1 Biological Waveform……………………………………………….. 6 2.2 Electrocardiogram………….. ………………………………………. 6 2.3 Mathematical Model of ECG……………………………………….. 8 2.4 Abnormal ECG Pattern……………………………………………….. 9 2.5 Telemetry in Biomedical Signal Acquisition………………………… 10 2.6 Telemetry Techniques. ………………………………………………. 11
2.6.1 Wireless Medical Telemetry (WMST) Band…………………… 11 2.6.2 ISM Radio Frequency Band……………………………………. 12
2.7 Review of Existing Literature………………………………………… 12 2.7.1 Telemetry Based System for Measurement and Monitoring of Biomedical Signals…………………………………………. 12 2.7.2 Transmitting Biological Waveform Using Cellular Phone ……..13 2.7.3 A Wireless ECG Samrt Sensor for Broad Application in Life
Threatening Event Detection…………………………………… 14 2.7.4 An Ultra-low Power, Self-organizing Wireless Network and
Non-invasive Biomedical Instrumentation …………………….. 14 2.7.5 Bluetooth Telemedicine Processor for Multichannel biomedical
Signal Transmission via Mobile Cellular Network………………16 2.7.6 Electrocardiogram (EKG) Data Acquisition and Wireless
Transmission……………………………………………………. 16 2.8 Existing Wireless Technology…………………………….…………. 16 2.9 Summary…………………………………..…………………………. 17

x
CHAPTER THREE: EXPERIMENTAL METHODOLOGY.……….………….. 19 3.1 Introduction ………………………………………………………….. 19 3.2 ECG Data Transmission System: An Overview……………………… 19 3.3 ECG Simulator………………………………………………………... 20 3.4 Signal Amplification and Conditioning Module…………………….. 21
3.4.1. Common Mode Rejection Ratio ………………………………. 22 3.4.2. ECG Amplifier………………………………………………… 22
3.5 Radio Frequency Transmission………………………………………. 26 3.5.1 RF Spectrum………………………………………………… 27 3.5.2 Transmission Technique………………………………………… 26
3.5.2.1 Amplitude Modulation…….………………………….. 27 3.5.2.2 Frequency Modulation……..…………………………. 28 3.5.2.3 Phase Modulation…………………………………….. 28
3.6 Telemetry Transceiver……………………………………………….. 29 3.6.1 Radiometrix Transceiver………… ............................................. 30 3.6.2 Laipac Transceiver……………………………………………. 31 3.6.3 Transceiver of Choice………………………………………… 31
3.7 LabView Data Acquisition card (NI-DAQ)………………………… 32 3.7.1 Analog Digital Converter……………………………………… 34
3.8 LabView Data Acquisition Software..………………………………… 35 3.8.1 Implementation of Data Acquisition and Graphical User Interface……………………………………………………….. 37 3.9 Summary……………………………………………………………. 39
CHAPTER FOUR: RESULT AND ANALYSIS …..………………………… 40 4.1 Introduction ………………………………………………………….. 40
4.2 Signal Acquisition…….……………………………………………… 40 4.2.1 Simulation Result….…………………………………………….. 41 4.2.2 Signal with Common mode Noise………………………………. 45 4.3 Experimental Result………………………………..………………… 47
4.3.1 Applying Sinusoidal and ECG Signal to the System…………… 48 4.3.2 Frequency Response of the Instrumentation Amplifier………… 53 4.3.3 Investigate Transmitting of Radiometrix RF Module…………. 55 4.3.4 Effect of different types of Antenna…………………………… 58
4.4 Graphical User interface of LabVIEW……………………………….. 60 4.4.1 FFT of ECG signal…………………………………………….. 63 4.4.2 Effect of higher order filter……………………………………. 64 4.4.3 Effect of Noisy Environment…………………………………... 67 4.4.4 ECG signal from test subject……………………………………. 70
4.5 Summary …………………………………………………………..… 71
CHAPTER FIVE: CONCLUSIONS AND SUGGESTION FOR FURTHER WORK ……………………………………………………….. 73
5.1 Conclusion…………………………………………………………… 73 5.2 Further Areas of Research…………………………………………… 76
BIBLIOGRAPHY ……………………………………………………………….. 77
xi
APPENDICES …………………………………………………………………… 79 APPENDIX 1 : DATA SHEET APPENDIX II : RADOMETRIX TRANSCEIVER APPENDIX III : E SERIES DATA ACQUISITION CARD

xii
LIST OF TABLES
Table No. Page No. 2.1 Electrocardiogram Basic Characteristic 6 2.2 Wireless Technology comparison table 17
3.1 ECG Simulator ESH 10 specifications 21 3.2 Comparison of Transceiver module 31 4.1 Vout versus Rgain 45 4.2 Experimental setup for Instrumentation Amplifier 48 4.3 Frequency response 54 4.4 Attenuation Factors Due to Distance in Laboratory 56 4.5 Attenuation Factors Due to Distance in Corridor 56
4.6 Comparison of Transmission Distance with Different Types of
Antenna 57
5.1 Comparison table of existing research to the purpose system 74

xiii
LIST OF FIGURES
Table No. Page No. 2.1 One Cycle of ECG Signal 7 2.2 Three Channels ECG Leads Configuration 8 3.1 ECG Data Transmission Through RF systems 20 3.2 LM 741 Dual in Line Package (DIP) 23 3.3 Standard ECG Instrumentation Amplifiers 23 3.4 Electromagnetic Spectrum 26 3.5 Amplitude Modulation 27 3.6 Frequency Modulation 28 3.7 Phase Modulation 29 3.8 Phase Relationship 29 3.9 RF Transceiver Subsystem 30 3.10 Ni-DAQ PXI-6040E Series Block Diagram 33 3.11 I/O Connector Pin Assignment Ni-DAQ PX1 6040E 34 3.12 A 4-bit Successive approximation ADC 35 3.13 A sample screen of LabVIEW Graphical Based 36 3.14 A sample of LabView Virtual Oscilloscope 37 3.15 Block Diagrams of Digital Filters 37 4.1 Schematic Diagram of Instrumentation Amplifier for
simulation 41
4.2 Simulated Result when Rgain = 1KΩ 41 4.3 Simulated Result when Rgain = 800Ω 42 4.4 Simulated Result when Rgain = 600Ω 42

xiv
4.5 Simulated Result when Rgain = 400Ω 43 4.6 Simulated Result when Rgain = 200 43 4.7 Simulated Result when Rgain = 100Ω 44 4.8 Instrumentation Amplifier with Common mode noise 45 4.9 Voltage at V1 46 4.10 Voltage at V2 46 4.11 Voltage at Voutput 47 4.12 Transmitted Sine wave Signal 48 4.13 Received Sine wave Signal 50 4.14 Transmitted and Received Sine wave Signals 50 4.15 ECG Signal at the Output of Amplifier 51 4.16 ECG Signal after the Receiver 52 4.17 ECG Waveform before and after Transmission 53 4.18 Frequency Response of Instrumentation Amplifier 54 4.19 Attenuation Due to Distance in Laboratory 56 4.20 Attenuation Due to Distance in Corridor 57 4.21 Graphical User Interface at Remote Terminal 60 4.22 Graphical Programming Language of the System 61 4.23 ECG Signal before and after inversion 62 4.24 FFT of ECG signal 63 4.25 ECG Signal after First Stage Filter 64 4.26 ECG Signal after Second Stage Filter 65 4.27 ECG Signal after Third Stage Filter Filters 65 4.28 Comparison between First stage, Second stage and Third
stage Filter 66

xv
4.29 ECG signal before Filtering in Low noise Environment 67 4.30 ECG signal before Filtering in Low noise Environment 68
4.31 ECG signals before Filtering in Medium noise 68 4.32 ECG signals after Filtering Medium noise Environment 68
4.33 4.34 4.35 4.36
ECG signals before Filtering in Heavy noise Environment ECG signals after Filtering in Heavy noise Environment ECG signal from test subject Transient Protection circuit for electrodes interface
69
69
70
70
xvi
LIST OF ABBREVIATIONS
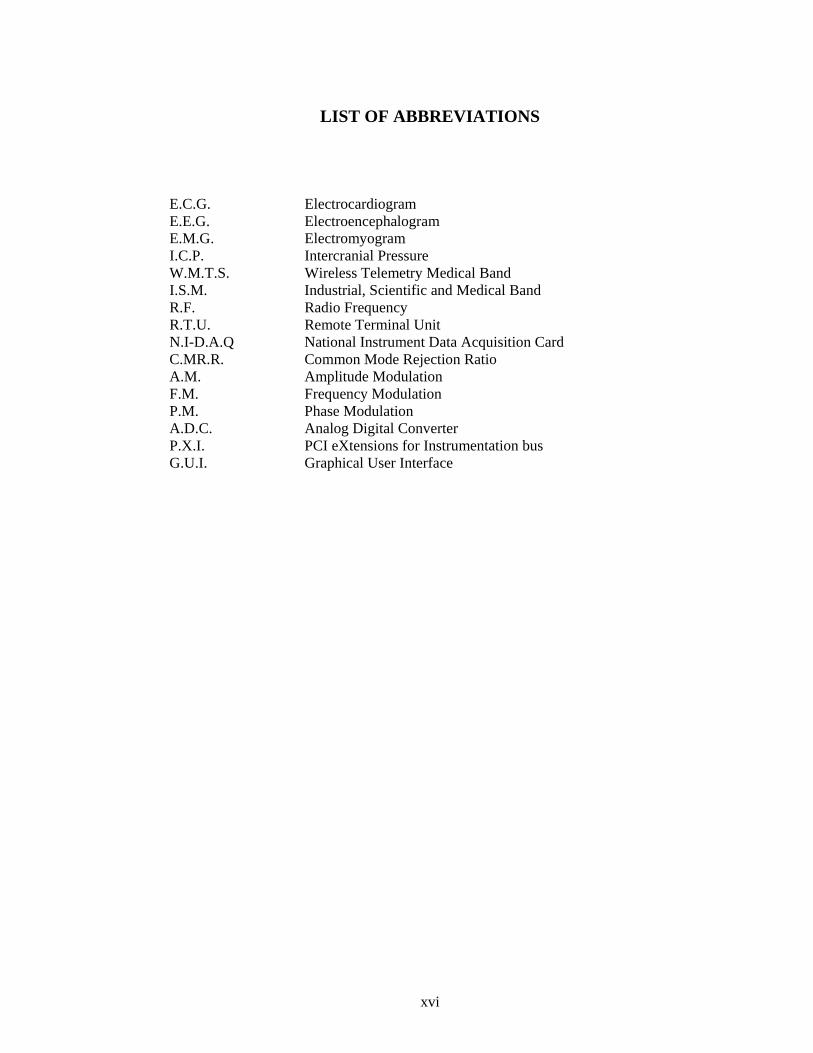
E.C.G. Electrocardiogram E.E.G. Electroencephalogram E.M.G. Electromyogram I.C.P. Intercranial Pressure W.M.T.S. Wireless Telemetry Medical Band I.S.M. Industrial, Scientific and Medical Band R.F. Radio Frequency R.T.U. Remote Terminal Unit N.I-D.A.Q National Instrument Data Acquisition Card C.MR.R. Common Mode Rejection Ratio A.M. Amplitude Modulation F.M. Frequency Modulation P.M. Phase Modulation A.D.C. Analog Digital Converter P.X.I. PCI eXtensions for Instrumentation bus G.U.I. Graphical User Interface

1
CHAPTER ONE
INTRODUCTION
1.1 INTRODUCTION An electrocardiogram (ECG) is a recording of the electrical activity captured on the
body surface generated by the heart. Skin electrodes are placed at designated locations
on the body collect ECG measurement information. An ECG signal is characterized
by six peaks and valleys, labeled with successive letters of alphabets P, Q, R, S, T and
U. An ECG signal is used by medical personal to determine the conditions of the
human heart. This is done using ECG monitors. ECG monitors are used to look after
varying heart conditions in order to get an insight into existing problems or to help
predict impeding problems.
An ECG machine must be able to deal with extremely weak signals ranging
from 0.5mV to 50mV, combined with a DC component of up to ± 300mV resulting
from electrodes skin interface and a common mode component of up to 1.5V resulting
from potential between electrodes and ground. The bandwidth of the signal is in the
range of 0.5Hz to 100Hz. Typically an ECG machine has 12 or 3 electrodes to be
connected to the patient body. The types of electrode used are pre-gelled electrodes or
suction cup type electrodes. The electrode is placed on the plane of body and signals
are the result of various combinations of electrodes. An ECG machine acquires the
signal and displays it on screen. If a medical personnel needs to analyze ECG pattern
it is printed out using a thermal paper. Some of the newest ECG machines have
storage capability and so a signal can be transferred to a PC via a serial cable or while

2
some other machines have provision to manually download the ECG data using USB
port.
Research has been carried out over many years on the development of
technique for the radio frequency (RF) telemetry to eliminate the need of wired and
human intervention in sending an ECG signal from a patient ECG machine to a PC. It
is with this aim the project is undertaken to provide a solution of transmitting the ECG
signal via a wireless link. The advantages of this solution are many, for example; it
can reduce the size of the machine, and also once connected to the PC there are many
possibility that can be done for analysis and manipulation of ECG signal such as
display the signal over an internet.
1.2 PROBLEM STATEMENT
ECG signals are vital parameter that being used by medical personnel to diagnose
hearts conditions of a patient. The current practice of acquiring and monitoring the
signal are more or less wired and manual. Most ECG machines in hospital use a
thermal paper to record ECG pattern for the purpose of analysis by medical personnel.
The latest ECG machine has memory capability but the transfer of ECG data is done
via a serial cable, some of these monitors have USB ports and one has to download
the data to a nearby computer. Another disadvantage of current ECG systems used in
hospital is that its display is on the CRT of the ECG machine. These machines are
bulky and fixed to the wall or to a monitoring station thus make the machine non-
portable. For a standard practice where patients with heart conditions are monitored
every 1 to 2 hours for unusual heart rhythms using ECG monitor, nurses need to go
from patient to patient dragging the station with them.

3
Therefore, This work will concentrate on acquiring ECG signal from a patient
and to transmit the signal automatically to a PC using a wireless link. The medical
personnel can then monitor the ECG signal and patient vital sign can be logged onto a
central workstation and saved for the purpose of analysis. With elimination of cables
and wire and also reduction of size of the ECG machine patients with less severe
condition need not to be bedridden with the portable ECG machine.
1.3 PROPOSE APPROACHES This thesis aims at building an ECG system that can transmit the ECG data from the
local terminal to a remote PC via wireless link. This is achieved by using a RF
transmission to transmit the data to the centrally monitoring terminal. Generally the
system can be broken into three main phases:
• ECG signal acquisition and conditioning
• Data transmission and Receiving
• Displaying the ECG signal at a remote terminal
Firstly a signal is generated from an ECG simulator that will simulate signal of
a patient, the signal generated by the simulator is in the range of 40mV. This is the
range of ECG signal generated at the surface of human body. Then, the signal is
acquired and amplified to the required level using an instrumentation amplifier for
transmission. The signal is then modulated using frequency modulation technique
before being transmitted using a RF transmitter. The acquisition and transmitting side
of the ECG system is going to be battery operated. The signal is then received by RF
receiver and demodulated first before it is sent to a National Instrument Data
Acquisition Card (NI-DAQ) in the PC.

4
Then the signal is converted from analog to digital form using built in ADC.
Lastly LabVIEW software is used to process the signal and then display the signal on
the screen using virtual instrument of the LabVIEW. The virtual instrument will
display the filtered and unfiltered signal for comparison purposes.
1.4 OBJECTIVE OF THE THESIS
The main objective of this thesis is to design and implement ECG data transmission
through RF and display the signal on a PC at a central workstation. The second
objective of the thesis is to acquire the signal at the central workstation and condition
the signal to get a good representative of ECG terminal on the graphical user interface.
This is to overcome the current ECG data transmission system where the nurse need to
go from one patient to one patient to record the ECG signal on thermal paper, by a
wire using a serial cable or by manual download using USB port.
1.5 THESIS STRUCTURE
The document introduces the broader problem of health monitoring in Hospital. The
thesis provide details of the design and implementation of a system that addresses the
problem of section 1.1 and whose general solution is given in section 1.3. The purpose
method is an alternative to the current ECG monitoring system that is implemented in
the hospital. The chapters are classified as introduction, literature review,
methodology, results and discussion and finally conclude with conclusion and
recommendation.
Chapter 1 is the introduction, brief information about the whole work and
objective of each section.
5
Chapter 2 is the literature review; it discusses some of the background ideas,
such as on the function of human body and the understanding of biological signal,
specifically the ECG signal, sensors and transducer for capturing the signal, and
descriptions of other types of ECG system. It also discusses on the INTERNET
technology in patient health care and comparison was also made on past and current
research and development on the topic.
Chapter 3 is the methodology. It discusses the method followed to develop and
implement the system along with the necessary requirement. It shows how the signal
is acquired and the types of suitable sensors, amplifier and the filtering requirement to
be integrated with the LabVIEW.
Chapter 4 delves into the implementation of the system. It shows simulation
and experimental testing that have been done. The results obtained by this work are
discussed in this chapter. It also shows how the system works.
Chapter 5 concludes by discussing on the significance of the finding and give
recommendation for future work. This chapter shows how the system is properly
working and how to improve it in the future.

6
CHAPTER TWO
LITERATURE REVIEW 2.1 BIOLOGICAL WAVEFORM
Biological waveforms are time-varying biopotentials, representing electrical activity
corresponding to bodily functions, which can be measured on the body’s surface. We
can monitor a patient by acquiring and transmitting desired biological waveforms.
Electrocardiogram (ECG) is one of the most commonly monitored biological
waveforms.
2.2 ELECTROCARDIOGRAM (ECG)
The rhythmic behavior of heart can be monitored and used as a diagnostic tool to
detect heart abnormalities by acquiring electrical activity on the body surface, across
the heart, known as ECG. This electrical activity originates from electrical activation
of muscles in heart, inherently indicating a sort of mechanical motion. The electric
potentials generated by the heart appear throughout body and can be measured across
its surface. Figure 2.1 displays a typical ECG waveform which, is characterized by
five peaks and valleys labeled in with the successive letters P, Q, R, S, T and U [1]
The following table highlights ECG sections and what they indicate:

7
Table 2.1 Electrocardiogram Basic Characteristics
Figure 2.1: One Cycle of ECG signal
To perform a clinical ECG, it is important that one lead (also known as channel) be
recorded in order to accurately describe the heart’s electrical activity. There are two
planes in which these leads may lie: the frontal plane (the plane of the body that is
parallel to the ground when one is lying on one’s back); and the transverse plane (the
plane of the body that is parallel to the ground when one is standing erect). For three
channels ECG, only the leads in the frontal plane are required. The frontal plane of an
ECG consist of three basic leads, as can be seen in Figure 2.2. These leads are the