Specification of Assessment-test Criteria through ASP Specifications
Upload
khangminh22Category
view
0download
0
ECG SIGNAL PROCESSING TECHNIQUES
BY USING ASP.NET APPLICATION BASED
ON GUI IN MATLAB
A Thesis Submitted to the
Graduate School of Natural and Applied Sciences of Yıldırım Beyazıt University
In Partial Fulfillment of the Requirements for the Degree of Master of Science in
Electrical and Electronics Engineering, Department of Electrical and Electronics
Engineering
by
Hussain A. Jaber Alziarjawey
August, 2015
ANKARA

M.Sc THESIS EXAMINATION RESULT FORM
We have read the thesis entitled “ECG Signal Processing Techniques by Using
ASP.NET Application Based on GUI with MATLAB” completed by HUSSAIN ABED
JABER ALZIARJAWEY under supervision of Assoc. Prof. Dr. İlyas ÇANKAYA and we
certify that in our opinion it is fully adequate, in scope and in quality, as a thesis for the degree
of Master of Science.
Assoc. Prof. Dr. İlyas ÇANKAYA
Supervisor
Assist. Prof. Dr. Ömer KARAL Assist. Prof. Dr. Cemal KOÇAK
(Jury Member) (Jury Member)
Prof. Dr. Fatih V. ÇELEBİ
Director Graduate School of Natural and Applied Sciences
ii

ECG SIGNAL PROCESSING TECHNIQUES BY USING ASP.NET APPLICATION BASED ON GUI IN MATLAB
ABSTRACT
An electrocardiogram (ECG/EKG) is an electrical recording of the heart and is used as an
essential diagnostic tool in the investigation of heart disease, so any defect of heart rate or
rhythm, or change in the shape of the QRS complex, is very significant to get an evidence for
detecting cardiac arrhythmia. The most of earlier methods of ECG signal analysis for detecting
PQRST was based on Digital Signal Processing (DSP) technique, for example Wavelet
Transform(WF), Fast Fourier Transform(FFT) and Artificial Neural Networks(ANN). The
work in this thesis have proposed a simple and dependable method to detect the P, Q, R, S
and T values of an ECG signal normal and abnormal cases. This method is based on
determination a mathematical relationship between the highest values (peaks and valleys) of
the ECG waveform and time.
Second part in the thesis includes using three different digital signals processing techniques for
ECG signals are: Digital Filters (FIR and IIR), Wavelet signal processing (Filters Banks
technique) and adaptive Filter Signal Processing.
The work in this thesis is exemplified through designing a graphical user Interface (GUI) in
MATLAB for creating a new software package for revealing of PQRST for both normal and
abnormal ECG using a simple mathematical algorithm to get PQRST values, draw these
values at the same time and share the package results to website using the ASP .NET
application.
The proposed software system will be devoted to the purposes of scientific research in the
medical and engineering fields together, rather than clinical diagnosis as well as it can be
utilized in training for clinicians and engineers working together in the same field which
related to heart disease.
iii

MATLAB’DA GRAFİK KULLANICI ARAYÜZÜ BAZLI ASP.NET UYGULAMASI KULLANILARAK EKG SİNYAL İŞLEME TEKNİKLERİ
ÖZET
Elektrokardiyogram (EKG) kalple ilgili elektronik kayıttır ve kalp atış hızı ve ritminin veya
QRS kakopleksinin şeklinde meydana gelen değişikliklerin tespit edilmesi için kalp
hastalığının araştırılmasında kullanılan gerekli bir teşhis aletidir ve kalpteki ritim bozukluğunu
tespit etmekle ilgili kanıtları elde etmek için çok önemlidir. PQRST tespiti için EKG sinyal
analizinin en eski metodu Dalgacık Dönüşümü (WF), Hızlı Fourier Dönüşümü (FFT)ve Yapay
Sinir Ağları (ANN) gibi Dijital Sinyal İşleme (DSP) teknikleri kullanılmaktadır. Bu tez
çalışması EKG sinyallerinin normal ve anormal vakaların P,Q,R,S,T ve T değerlerini korumak
için basit ve güvenilebilir bir metot önermektedir. Bu metot, EKG dalga şekli ve zaman
arasındaki en yüksek değerler (yüksek ve alçak) arasındaki matematiksel ilişkileri bulmaya
dayandırılmaktadır.
Bu tezin ikinci kısmı EKG sinyalleri için üç farklı dijital sinyal işleme tekniğinin
kullanılmasını ihtiva etmektedir. Bu sinyaller şunlardır: Dijital Filtreler (FIR ve IRR),
Dalgacık sinyal işleme (Filtre Bankası tekniği ) ve Uygulanabilir Filtre Sinyal İşlemi.
Bu tez çalışması, PQRST değerlerini elde etmek ve aynı zamanda bu değerleri EKG üzerinde
çizmek ve ASP.NET uygulamalarını kullanarak paket sonuçlarını paylaşmak, basit
matematiksel algoritmalar kullanarak hem normal EKG hem de anormal EKG için PQRST’yi
ortaya koymak ve yeni yazılım paketleri oluşturmak için MATLAB’da Grafik Kullanıcı
Arayüzü tasarlayarak örneklendirilmiştir.
Önerilen bu yazılım sistemi, klinik tanılar yerine kullanılmak için bilimsel araştırma amacına
hizmet etmesi ve kalp hastalığı ile ilgili aynı alanda çalışan klinisyen ve mühendislerin eğitimi
için kullanılacaktır.
iv

ACKNOWLEDGEMENTS
First and foremost, I would like to express my gratitude to my supervisor Assoc. Prof. Dr.
İlyas Çankaya for his guidance, advice and constant support throughout my thesis work. His
knowledge and personal guidance have been the essential keys for the completion of this
work. I could never imagine having a better advisor. I would like to thank him for being my
advisor here at Graduate School of Natural and Applied Sciences at Yıldırım Beyazıt
University.
I am deeply grateful to the head of the Electronics and Communication Engineering
Department, University of Yıldırım Beyazıt, Prof. Dr. H. Haldun Göktaş. I would also like
to thank director of graduate School of Natural and Applied Sciences Prof. Dr. Fatih V.
ÇELEBİ, also I want to express my respects to all my teachers who teaching me and also
helping me how to learn during all my study periods.
I want to express my respects to Assoc. Prof. Dr. Sinan Canan and Assis. Prof. Dr. Sezgin
Kaçar for helping me in this thesis. So I thank them from the bottom of my heart.
Special thanks to my family and to my friends for every kind of support they provided me.
Particularly, I would like to express my love to my wife Hadeel Al-jobouri, without her
constant love and support throughout my time here; this thesis would not have been possible.
Last but not least, special thanks to my parents who have sacrificed so much to give me a good
education. I thank them for all they have done for me.
August, 2015 Hussain A. Jaber Alziarjawey
v

CONTENTS
M.Sc THESIS EXAMINATION RESULT FORM ................................................................ ii
ABSTRACT ..............................................................................................................................iii ÖZET ......................................................................................................................................... iv
ACKNOWLEDGEMENTS ...................................................................................................... v
ABBREVATIONS ..................................................................................................................viii
LIST OF TABLES ..................................................................................................................... x
LIST OF FIGURES .................................................................................................................. xi
CHAPTER 1 INTRODUCTION .............................................................................................. 1
1.1. Objective of the Thesis ................................................................................................. 1 1.2. Organization of the Thesis ............................................................................................ 2
CHAPTER 2 BACKGROUND ON ECG SIGNAL ............................................................... 4
2.1. Medical Background on ECG Signal ............................................................................ 6 2.1.1 Anatomy of the Heart ............................................................................................ 9
2.1.2 Electrical Activity of Heart Cells ........................................................................ 10
2.1.3 ECG Waveform ................................................................................................... 12
2.1.4 ECG Leads System .............................................................................................. 14 2.2. Noise in the ECG Signal ............................................................................................. 15
2.2.1 Power Line Interferences ..................................................................................... 16
2.2.2 Low Frequency Noise .......................................................................................... 17 2.2.3 Muscle Contraction (EMG noise)........................................................................ 18
CHAPTER 3 ECG SIGNAL PROCESSING TECHNIQUES ............................................ 20
3.1 Digital Filters ....................................................................................................... 20
3.1.1 Finite Impulse Response (FIR) Filter .................................................................. 23 3.1.2 Infinite Impulse Response (IIR) Filters ............................................................... 27
3.2 Wavelet Analysis ........................................................................................................ 29 3.3 Adaptive Signal Processing ........................................................................................ 33
vi

CHAPTER 4 DESIGNING A GUI IN MATLAB ................................................................ 36
4.1 Architecture of the MATLAB GUI ............................................................................ 37 4.1.1 Creating and Displaying a Graphical User Interface ........................................... 40
4.1. ECG Signal Simulation Based on the MATLAB GUI ............................................... 42 4.2.1 ECG Noises and Filtrations ................................................................................. 43
4.2.2 Normal ECG Analysis ......................................................................................... 45
4.2.3 ECG Abnormalities Analysis .............................................................................. 48
4.2.4 DSP Techniques of ECG Analysis ...................................................................... 51
CHAPTER 5 ECG SIGNAL PROCESSING USING ASP .NET ....................................... 54
5.1 .NET Application Deployment Process ...................................................................... 54 5.2 Deploying .NET Components over the Web Site ....................................................... 58 5.3 ASP .NET Web Site Application ................................................................................ 63
CHAPTER 6 CONCLUSION AND FUTURE WORKS ..................................................... 68
6.1 Conclusion .................................................................................................................. 68 6.2 Future Work ................................................................................................................ 71
REFERENCES ........................................................................................................................ 72
BIOGRAPHY........................................................................................................................... 77
vii

ABBREVATIONS
A/D Analog to Digital AECG Ambulatory ECG AHA American Heart Association AIAS Arrhythmia Intelligent Analysis Software ALE Adaptive Line Enhancement ANC Adaptive Noise Cancellation APB Atrial Premature Beat API Application Programming Interface ASP Active Server Pages AV node Atrioventricular Node AVF Augmented Vector Foot AVL Augmented Vector Left AVR Augmented Vector Right BSS Blind Source Separation CWT Continuous Wavelet Transform DAC Digital Analog Convertor DOM Difference Operation Method DOP Difference Operation Process DSP Digital Signal Processing DWT Discrete Wavelet Transform ECG/EKG Electrocardiogram EEG Electroencephalogram ELM Extreme Learning Machine EMG Electromyogram FECG Fetal Electrocardiograms FFT Fast Fourier Transform FIR Finite Impulse Response GUI Graphical User Interface HPF High Pass Filter
viii

I/P Input IAC Improved Adaptive Power Line Interference Canceller IIR Infinite Impulse Response LA Left Atrium LDA Linear Discriminant Analysis LMS Least Mean Square LPF Low Pass Filter LV Left Ventricle MLP Multilayered Perceptron music Multiple Signal Classifications PLI Power Line Interference PLL Phase-Locked Loop PNN Probabilistic Neural Network RA Right Atrium RV Right Ventricle SA node Sinoatrial Node SEMG Signal Distorted Surface Electromyogram SFG Signal-Flow Graph SVM Support Vector Machine SVW Slope Vector Waveform VE Ventricular Extra systoles VLSI Very Large Scale Integration VPB Ventricular Premature Beat VPC Ventricular Premature Complexes WA- PM Wavelet Analysis and Pattern Matching
ix

LIST OF TABLES
Table 2.1 A brief guide for the most of abnormalities ECG signal with graphs ……..... 7
Table 2.2 Amplitude and duration of waves, intervals and segments of ECG signal….............................................................................................................................
14
Table 3.1 The comparison between FIR and IIR filters ……………………………….. 28
Table 3.2 comparison of signal processing techniques…………………………………. 34
Table 4.1 Components of basic GUI …………………………………………………... 37
Table 4.2 Brief summary of the results of ECG abnormalities signal………………….. 49
x

LIST OF FIGURES
Figure 2.1 Structure of heart chamber…………………………………………………... 9
Figure 2.2 Normal ECG with the waves that is consisted noted ……………………….. 10
Figure 2.3 Schematic of action potential in ventricle cell ……………………………… 11
Figure 2.4 A vector view of the standard 12 Leads ECG ………………………………. 14
Figure 2.5 Power line interference (50 Hz) in ECG signal ……………………………... 16
Figure 2.6 Low frequency noise present in ECG signal ………………………………... 17
Figure 2.7 Example of muscle noise of ECG signals…………………………………… 18
Figure 3.1 A simplified block diagram of a real-time digital filter with analogue input and output signal ………………………………………………………………………
20
Figure 3.2 Block diagrams of FIR filters ……………………………………………….. 22
Figure 3.3The output of a FIR filter of order N is the weighted sum of the values in the storage registers of the delay line ……………………………………………………….
23
Figure 3.4 Frequency response of the FIR bandpass filter……………………………… 25
Figure 3.5 The frequency spectrum of ECG signal using the FFT ……………………... 25
Figure 3.6 Block diagrams of IIR filters ………………………………………………... 26
Figure 3.7 The output of an IIR filter is delayed and fed back………………………….. 27
Figure 3.8 Applying IIR filters on the ECG signal with noise …………………………. 27
Figure 3.9 Simple filter bank ………………………………………………………….. 30
Figure 3.10 A typical wavelet application ……………………………………………… 30
Figure 3.11 Frequency response of low and high pass filter……………………………. 31
Figure 3.12 ECG signal generated by the analysis filter bank ………………………….. 31
Figure 3.13 Elements of a typical adaptive filter ……………………………………….. 32
Figure 3.14 ALE application on ECG signal …………………………………………… 33
Figure 4.1 The guide tool window in design mode……………………………………... 39
Figure 4.2 Example of GUI layout within the guide window…………………………... 40
Figure 4.3 The m-file for filters GUI, automatically created by guide………………….. 41
Figure 4.4 The main first GUI page of the package system ……………………………. 42
Figure 4.5 Export and print out graph for each type of noise as (.fig, .png and .bmp types).........................................................................................................................
43
Figure 4.6 The place of saving graphs as (.fig, .png and .bmp types) …………………... 43
xi

Figure 4.7 Applying multi types of filters to remove ECG noises ……………………... 44
Figure 4.8 The main GUI page for normal ECG analysis ………………………………. 45
Figure 4.9 Steps of PQRST & heart rate detection............................................................ 47
Figure 4.10 The main GUI page for ECG abnormality analysis ………………………... 48
Figure 4.11 The main GUI page for DSP techniques of ECG analysis …………………. 51
Figure 4.12 An example of using of Adaptive Line Enhancement (ALE) Filter ……….. 52
Figure 4.13 Result of Filters Banks Filter by using high and lowpass filters of wavelet technique …………………………………………………………………………………
52
Figure 5.1 Deployment Project dialog …………………………………………………... 54
Figure 5.2 Adding files in .NET Project ………………………………………………… 55
Figure 5.3 Creating a .NET Project ……………............................................................... 56
Figure 5.4 Contents of subfolder distrib ………………………………………… 56
Figure 5.5 Contents of subfolder src……………………………………………………... 57
Figure 5.6 Creating an ASP.NET web site………………………………......................... 58
Figure 5.7 WebFigureControl to toolbox………………………………………………... 59
Figure 5.8 Adding a reference to the deployed component that created by the MATLAB Builder NE Product…………………………………………………………...
60
Figure 5.9 Writing code in C#………................................................................................ 60
Figure 5.10 Web site page at initialization………………………………………………. 61
Figure 5.11 ASP .NET site page after running…………………………………………... 61
Figure 5.12 ASP .NET web site login page………..………………………….................. 62 Figure 5.13 ASP .NET web site registration page …..…………………………………... 63
Figure 5.14 ASP .NET web site startup (main) page……………..................................... 64
Figure 5.15 ASP .NET web site of ECG noise and filtration page……………………… 65
Figure 5.16 ASP .NET web site of normal ECG analysis page…………………………. 65
Figure 5.17 ASP .NET web site of ECG abnormalities analysis page…………………... 66
Figure 5.18 ASP .NET web site of DSP techniques of ECG analysis page ……………..
66
xii

CHAPTER 1
INTRODUCTION
The greatest progress to date in the use of computers for the clinical analysis of physiological
data has occurred in the field of cardiology. There are several reasons for this; first of all,
electrocardiogram (ECG) potentials are relatively easy to measure; secondly, the ECG is an
extremely useful indicator for both screening and diagnosis. In addition, certain abnormalities
of the ECG are quite well defined and can be readily identified. The ECG signal provides the
following information of a human heart [1]:
Impulse origin and propagation
Drug effects on the heart
Heart position and its relative chamber size
Changes in electrolyte concentrations
Extent and location of myocardial ischemia
Heart rhythm and conduction disturbances
This chapter will be organized as follows: A brief overview of advantage of ECG test,
objective of the thesis and organization of the thesis.
1.1. Objective of the Thesis
The proposed software system tool can be utilized in training for clinicians and
engineers working together in the same field which related of heart disease.
Therefore the main objective of this thesis is designing a new software package using
MATLAB Graphical User Interface (GUI) and shares the package results to website
by using ASP .NET, this package provides the following main features are as
follows:
1

1. Introduces three DSP techniques for removing noise in the ECG signal which
includes: digital filters, FIR and IIR, wavelet processing (Filters Banks technique) and
adaptive filter signal processing. Detecting R peaks and measuring the heart rate in
normal ECG signal and the abnormalities ECG signal.
2. Detecting PQRST values in normal ECG signal and the abnormalities ECG signal.
3. To classify the signals to detect Arrhythmia problems based on the signals that had
been analyzed which includes Supraventricular Arrhythmia, Apnea, Normal Sinus
Rhythm, Ventricular Tachyarrhythmia and Intracardiac Atrial Fibrillation.
4. To know the shape of the normal ECG signal and the abnormalities ECG signal
through analyzing these signals and extract the features of all types of ECG signals.
5. To build a project package (windows standalone application) is a self-extracting
executable file. Other people who do not have MATLAB can use this package directly; it
is a .zip file (setup file) or executable file.
6. To create .NET applications for publishing and share them as an ASP.NET
application site by using visual studio. NET.
1.2. Organization of the Thesis
The work in this thesis has been organized to be in six chapters, and summarized as follows:
Chapter 1 of this thesis titled “introduction” presents a brief overview of advantage of the
ECG test, the objective of the thesis and organization of the thesis.
In Chapter 2 that titled “Background on ECG Signal” presents a literature review of theories
on ECG techniques of some methods done by others in the relevant research areas. Explains
the basic concept of the medical background on ECG, introducing different types of
arrhythmias in ECG signal, anatomy and function of the heart, electrical activity of heart cells,
modes of lead placement and ECG waves and interval. This chapter also explains the types of
noises in ECG signal.
In Chapter 3 that titled “ECG Signal Processing Techniques” discusses three different
techniques of biomedical digital signal processing such as Digital Filters, Wavelet signal
processing with filter banks and Adaptive signal processing. They have been applied to ECG
2

signal in this thesis in details with providing a review of the background theory of these
techniques.
In Chapter 4 that titled “Designing a GUI in MATLAB with .Net Application” explains the
how a Graphical User Interface works, creating and displaying a Graphical User Interface and
this chapter also explains MATLAB builder NE for Microsoft .NET framework as well as
presents .NET application deployment process and finally explain how can deploy .NET
components over the web site.
In Chapter 5 that titled “ECG Signal Simulation Based On The MATLAB GUI with .Net
Application” presents the results that have been obtained in this thesis which is exemplified by
proposing new software packages using a MATLAB GUI and share the package results to
website by using ASP NET.
In Chapter 6 that titled “Conclusion and Future works” give a summary of the conclusions and
some recommendations are suggested for possible further developments.
3

CHAPTER 2
BACKGROUND ON ECG SIGNAL
In recent years, many studies and mathematical analyzes have been developed for the exertion
of analyzing the ECG signal, detecting arrhythmias, developing heart beat classification
system; all of these studies or techniques and algorithms which have been proposed during the
last decade includes Artificial Neural Network, Fuzzy Logic methods, Digital Signal Analysis,
Genetic Algorithm, Support Vector Machines, Hidden Markov Model Self-Organizing Map,
Bayesian, Slope Vector Waveform (SVW), Discrete Wavelet Transform (DWT) and
Difference Operation Method (DOM) [2 - 7]. All of these methods above have been dealing
with the PQRS complex detection for ECG signals. A brief review of some recent and
significant researches is presented for example;
Pande et al. (1985) have improved short-time Fourier Transform technique and algorithm
which presented for detection of the QRS-complex [8]. Further, recognition of an isoelectric
region on the ECG is needed for fixing a baseline for amplitude measurements of various
component waves. An approach and its implementation of microprocessor was suggested for
identification of the baseline.
Douglas et al. (1990) have described an approach to cardiac arrhythmia analysis using Hidden
Markov models [9]. This technique classified by detecting and analyzing QRS complex and
determining the R-R intervals to determine the ventricular arrhythmia. The Hidden Markov
modeling approach combines structural and statistical knowledge of the ECG signal in a single
parametric model. The Hidden Markov modeling addresses the problem of detecting low
amplitude P waves in typical ambulatory ECG recordings.
Xu et al. (2004) have described a Slope Vector Waveform (SVW) method that has proposed
an algorithm to detect ECG QRS complex and evaluate RR interval [10]. Through this
technique provide quickly and accurately search for the R location, RR interval and QRS
complex duration, and gives excellent results ECG feature extraction. Yu et al. (2007) have
presented a Discrete Wavelet Transform (DWT) method that states to extract the relevant
4

information from the ECG input data in order to perform the classification task [11]. Their
proposed work includes number of disjoint processing modules which are data acquisition,
pre-processing beat detection, feature extraction, and classification. In the feature extraction
module the Wavelet Transform is designed to address the problem of non-stationary ECG
signals. It was derived from a single generating function called the mother wavelet by dilation
and translation processes. By using this technique in feature extraction can get to big
advantage is that it has a varying window size, narrow at higher frequencies and broad at
lower frequencies, which leads to an optimal time frequency resolution in all frequency
ranges.
Ahmad et al. (2008) have presented an ECG beat classification scheme based on multiple
signal classification (MUSIC) algorithm, morphological descriptors, and neural networks for
discriminating nine ECG beat types [12]. That are normal, fusion of ventricular and normal,
fusion of paced and normal, left bundle branch block, right bundle branch block, premature
ventricular concentration, atrial premature contraction, paced beat, and ventricular flutter.
MUSIC algorithm is used to calculate pseudo spectrum of ECG signals. The low-frequency
samples are picked to have the most valuable heartbeat information. These samples along with
two morphological descriptors which deliver the characteristics and features of all parts of the
heart and form an input feature vector. Which is used for the initial training of a classifier
neural network. The neural network is designed to have nine sample outputs which constitute
the nine beat types. Two neural network schemes, namely multilayered perceptron (MLP)
neural network and a probabilistic neural network (PNN), are employed. The experimental
results achieved a promising accuracy of 99.03% for classifying the beat types using MLP
neural network.
Chouhan et al. 2008 have presented an algorithm for detection of QRS complexities using
Adaptive Quantized Threshold [13]. The recognition of QRS complexes forms the origin for
more or less all automated ECG analysis algorithms. The presented algorithm utilizes a
modified definition of slope of ECG signal, as the feature for detection of QRS. A succession
of transformations of the filtered and baseline drift corrected ECG signal is used for mining of
a new modified slope-feature. Yeh et al. (2008) have presented a Difference Operation Method
(DOM) that have used for detecting the QRS complex of an electrocardiogram signal, this
5

technique includes two processes, one is the Difference Operation Process (DOP) and the
other is the waves detection process [14]. The outline of this technique includes two steps. The
first step is finding the point R by applying the difference equation operation to the ECG
signal. The second step looks for the points Q and S according to the point R to find the QRS
complex. Franklin et al (2013) have described a method by using Artificial Neural Networks
(ANN) for detecting PQRST through use of the derivative where search for the minimum and
maximum of the derivative of a wave [15]. The highest peak (R wave) should be the zero
crossing between the maximum and minimum of the derivative. Similarly, the Q point should
be at the zero crossing before the maximum and the S point should be at the zero crossing after
the minimum. The P and T waves are done similarly by looking for local maximums in the
original waveform and then using the derivative to identify peak and end points. In this thesis
proposes a simple and dependable method to detect the P, Q, R, S and T values of an
electrocardiogram (ECG) signal. This method is based on finding a mathematical relationship
between the highest values (peaks and valleys) of the ECG waveform and time. In this
proposed method is exemplified by designing a graphical user Interface (GUI) by using
MATLAB for detecting PQRST by using simple mathematical algorithm to get PQRST values
and draw these values on ECG wave at the same time. This program will be devoted to the
purposes of scientific research instead of clinical diagnosis.
2.1. Medical Background on ECG Signal
An arrhythmia is a disturbance of the normal rhythm of the heart. Arrhythmias are very
common and affect over 700.000 people in the worlds today. Arrhythmias may occur
naturally, or be due to heart disease or other causes, such as a reaction to a medicine. An
arrhythmia may occur continuously or just occasionally. The heart rate can become
abnormally rapid, slow and/or irregular. The causes of this irregularity are from different parts
of the heart. Arrhythmias are identified by its origin in the heart and the rhythm of the
heartbeat. Bradycardia is heart rhythm which is slower than 60 beats-per-minute and
tachycardia is heart rhythm that is faster than 160 beats-per-minute. All arrhythmias can
generally be identified from the ECG signal by two categories of features; morphological and
statistical. Morphological features are ECG wave structures that can be visually identified and
6

these features are used in short term monitoring applications. [16, 17] Statistical features are
detected by mathematical methods, e.g., expectation vectors, covariance matrix and so on.
There are a number of different types of arrhythmia; Table 2.1 shows many types of abnormal
ECG. Table 2.1 A brief guide for the most of abnormalities ECG signal with graphs
Name of Abnormality Rate Rhythm Waves Characteristics Graph
Normal sinus rhythm
Normal (60-100 bpm)
Regular P Wave- Normal (positive & precedes each QRS), PR Interval Normal (0.12-0.20 sec), QRS Normal (0.06-0.10 sec).
Sinus bradycardia
Slow ( < 60 bpm )
Regular P Wave -Normal, PR Interval Normal (0.12-0.20 sec), QRS Normal (0.06-0.10 sec).
Sinus tachycardia
Fast
(> 100 bpm) Regular P Wave -Normal, may
merge with T wave at very fast rates, PR Interval Normal (0.12-0.20 sec), QRS Normal (0.06-0.10 sec). QT interval shortens with increasing heart rate
Wandering pacemaker
Normal (60-100bpm)
May be irregular
P Wave -Changing shape and size from beat to beat (at least three different forms), PR Interval- Variable, QRS Normal (0.06-0.10 sec), T wave normal. If heart rate exceeds 100 bpm, then rhythm may be multifocal atrial tachycardia (MAP).
Atrial flutter Fast (250-350 bpm) for Atrial, but
ventricular rate is often slower
Regular or
irregular
P Wave- Not observable, but saw-toothed flutter waves are present, PR Interval- Not measureable ,QRS- Normal (0.06-0.10 sec)
Atrial fibrillation Very fast (> 350 bpm) for
Atrial, but ventricular rate may be slow, normal or fast
Irregular P Wave- Absent - erratic waves are present, PR Interval- Absent,QRS- Normal but may be widened if there are conduction delays.
7
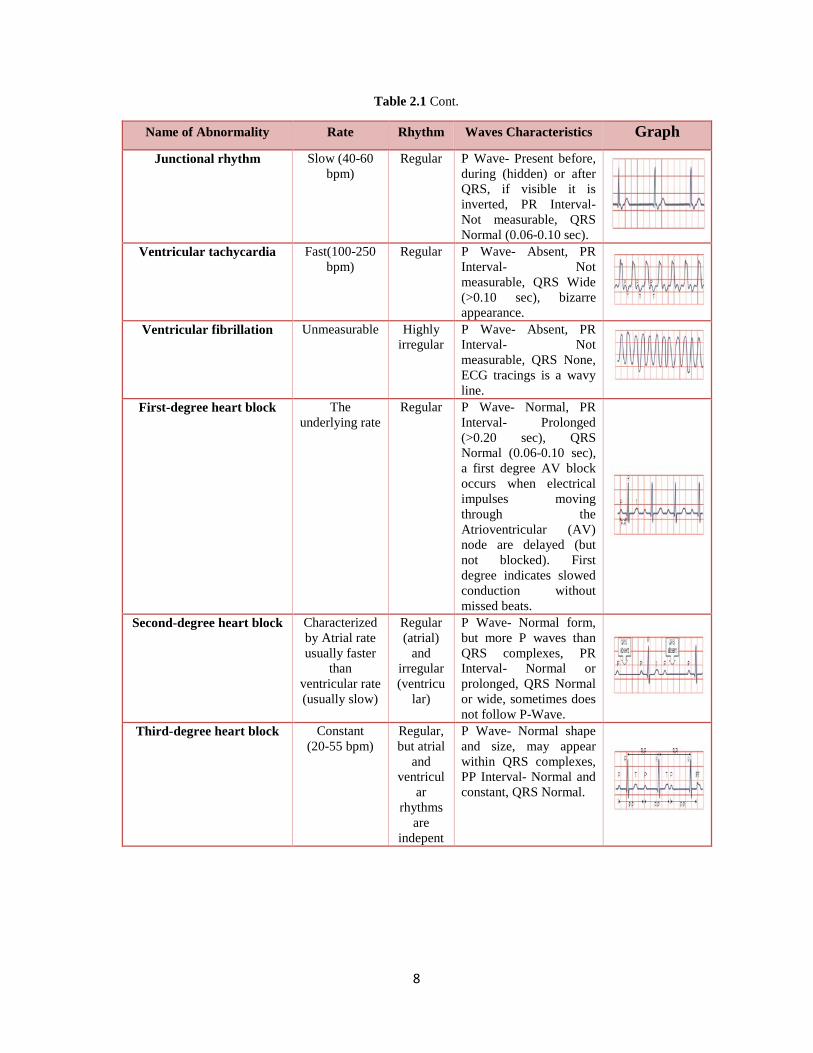
Table 2.1 Cont.
Name of Abnormality Rate Rhythm Waves Characteristics Graph Junctional rhythm Slow (40-60
bpm) Regular P Wave- Present before,
during (hidden) or after QRS, if visible it is inverted, PR Interval- Not measurable, QRS Normal (0.06-0.10 sec).
Ventricular tachycardia Fast(100-250 bpm)
Regular P Wave- Absent, PR Interval- Not measurable, QRS Wide (>0.10 sec), bizarre appearance.
Ventricular fibrillation Unmeasurable Highly irregular
P Wave- Absent, PR Interval- Not measurable, QRS None, ECG tracings is a wavy line.
First-degree heart block The underlying rate
Regular P Wave- Normal, PR Interval- Prolonged (>0.20 sec), QRS Normal (0.06-0.10 sec), a first degree AV block occurs when electrical impulses moving through the Atrioventricular (AV) node are delayed (but not blocked). First degree indicates slowed conduction without missed beats.
Second-degree heart block Characterized by Atrial rate usually faster
than ventricular rate (usually slow)
Regular (atrial)
and irregular (ventricu
lar)
P Wave- Normal form, but more P waves than QRS complexes, PR Interval- Normal or prolonged, QRS Normal or wide, sometimes does not follow P-Wave.
Third-degree heart block Constant (20-55 bpm)
Regular, but atrial
and ventricul
ar rhythms
are indepent
P Wave- Normal shape and size, may appear within QRS complexes, PP Interval- Normal and constant, QRS Normal.
8

2.1.1 Anatomy of the Heart
The human heart is at the center of the cardiovascular system, which is responsible for
oxygenating blood and delivering it to different parts of the human body. The heart is a
hollow muscle that is about the size of a fist. In one minute, it pumps about five liters (roughly
five quarts) of blood through the body, it is made up of four chambers as shown in Figure 2 .1
Right Atrium (RA), Left Atrium (LA), Right Ventricle (RV), Left Ventricle (LV). The
morphology and heart rate reflects the cardiac health of human heart beat [18]. It is a
noninvasive technique that means this signal is measured on the surface of human body which
is used in identification of the heart diseases [19, 20]. Any disorder of heart rate or rhythm, or
change in the morphological pattern, is an indication of cardiac arrhythmia which could be
detected by analysis of the recorded ECG waveform. The amplitude and duration of the
PQRS-T wave contains useful information about the nature of disease afflicting the heart. The
electrical wave is due to depolarization and repolarization of Na+ and K ions in the blood
[19]. ECG is considered to be one of the most powerful diagnostic tools in medicine that is
routinely used for the assessment of the functionality of the heart. An ECG is the conventional
method for noninvasive interpretation of the electrical activity of the heart in real-time. The
electrical cardiac signals are recorded by an external device by attaching electrodes to the
outer surface of the skin of the patient’s thorax. These currents stimulate the cardiac muscle
and cause the contractions and relaxations of the heart. The electrical signals travel through
the electrodes to the ECG device which records them as characteristic waves. Different waves
reflect the activity of different areas of the heart which generate the respective flowing
electrical currents. Figure 2.2 shows a schematic representation of a normal ECG and its
various waves. A main study of this thesis is to detect abnormal signals generated by the
human heart; hence, a substantial understanding of the source of this signal is essential.
9

Figure 2.1 Structure of heart chamber
2.1.2 Electrical Activity of Heart Cells
The mechanical mechanism of the heart is founded on and tightly related to electrical activity
of heart cells. The electrical activity of one cell or part of one cell can interact with its
surroundings. In the resting state of the cell, the difference in potential between inside the cell
and the outside, called the resting membrane potential, is in range of – 60 mV to – 90 mV
(inside cell has lower potential than the outside) [21].
10

Figure 2.2 Normal ECG with the waves that is consisted noted
The electrical potential remains relatively unchanged without any external stimulus. An
electrical stimulus from an external source or from neighboring cells or parts of cells with
potential higher than a threshold level increases the cell membrane permeability to sodium
ions and causes a rapid sequence of changes in the membrane potential called an action
potential. The underlying electrophysiology in an action potential is as follows [22].
Initially, the electrical stimulus causes a rapid change in permeability of the membrane to
sodium; sodium ions flow into the cell abruptly increasing the membrane potential to 20 mV.
This phenomenon is called depolarization and is shown as phase 0 in Figure 2.3
Eventually the membrane potential will decrease and return to resting state called
repolarization. This process happens slower than depolarization, and it can be divided into
three phases.
a) Phase 1 is a slightly decrease in potential due to the opening of potassium channels
0 0.2 0.4 0.6 0.8-0.4
-0.2
0
0.2
0.4
0.6
0.8
1
Time (sec)
Am
plitu
de (m
v)
R
T ST
Segment
ST Interval
QRS Interval
S Q
PR Segment
P
PR Interval
11

b) In phase 2, the membrane potential remains almost constant in the plateau phase,
due to balance of sodium and potassium ions
c) Finally, in phase 3, the membrane potential decreases continuously to level of
membrane resting potential [21]
An action potential in one part of a cell stimulates an action potential in another cell or part of
the same cell dependent on its electrical influence or ability to meet the threshold. This
mechanism is used to conduct electrical activity through all the muscle cells of the heart.
Figure 2.3 Schematic of action potential in ventricle cell
2.1.3 ECG Waveform
The output of ECG is a graph of two-dimensional plot, the x-axis represents time in seconds
and the y-axis represents signal voltage in milli-volts. Conventional ECG machines prints its
output on grid graph papers, each square grid is 1mm2. Each second is represented by 25mm
on the x-axis, and one millivolt is represented by 1cm on the graph. A typical normal ECG
beat, known as Normal Sinus Rhythm (NSR), can be represented by the PQRST waves. Each
wave is generated by a physiological event of the heart.
A normal ECG consists of a P wave, a QRS complex, and a T wave. The P wave is caused by
electric currents produced by the depolarization of the atria before their contraction, while the
QRS complex is caused by electric currents produced by the depolarization of the ventricles
prior to their contraction, during the extending of the depolarization in the ventricular
myocardium. The QRS complex usually consists of three different waves, the Q, R, and S
Phase 0
Phase 1 Phase 2 Phase 3 Phase 4
0 = depolarization
1, 2, 3 = repolarization
4 = diastolic phase
12
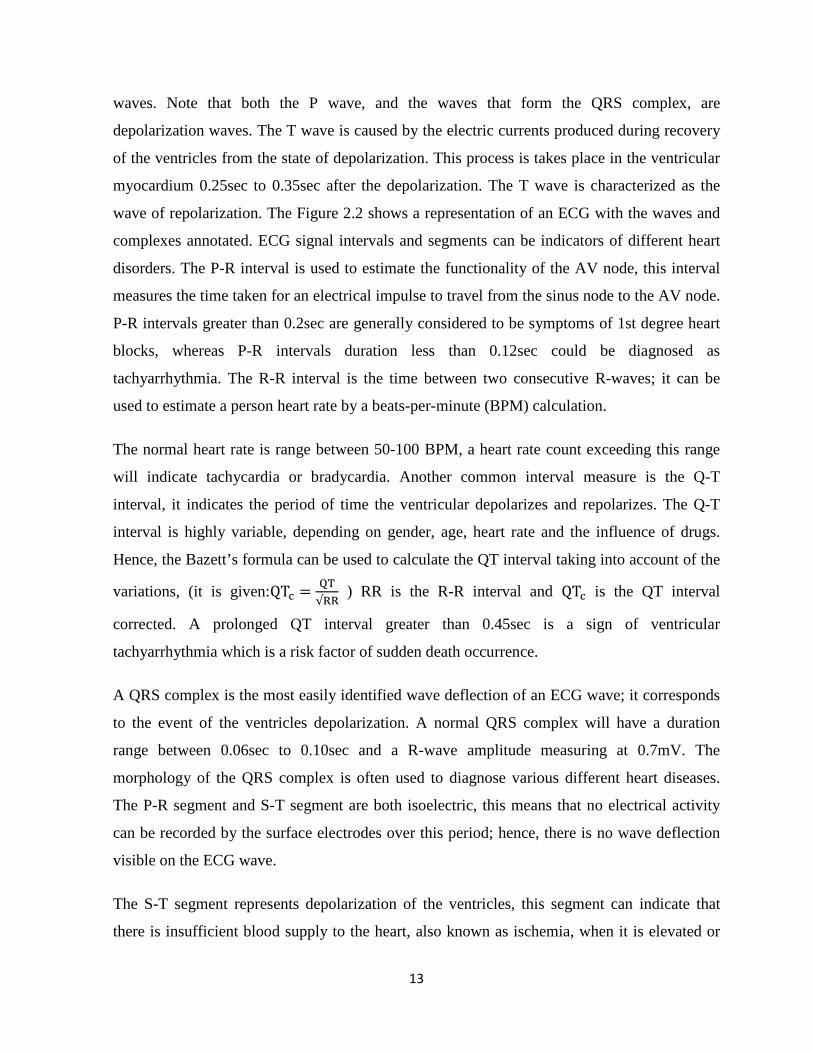
waves. Note that both the P wave, and the waves that form the QRS complex, are
depolarization waves. The T wave is caused by the electric currents produced during recovery
of the ventricles from the state of depolarization. This process is takes place in the ventricular
myocardium 0.25sec to 0.35sec after the depolarization. The T wave is characterized as the
wave of repolarization. The Figure 2.2 shows a representation of an ECG with the waves and
complexes annotated. ECG signal intervals and segments can be indicators of different heart
disorders. The P-R interval is used to estimate the functionality of the AV node, this interval
measures the time taken for an electrical impulse to travel from the sinus node to the AV node.
P-R intervals greater than 0.2sec are generally considered to be symptoms of 1st degree heart
blocks, whereas P-R intervals duration less than 0.12sec could be diagnosed as
tachyarrhythmia. The R-R interval is the time between two consecutive R-waves; it can be
used to estimate a person heart rate by a beats-per-minute (BPM) calculation.
The normal heart rate is range between 50-100 BPM, a heart rate count exceeding this range
will indicate tachycardia or bradycardia. Another common interval measure is the Q-T
interval, it indicates the period of time the ventricular depolarizes and repolarizes. The Q-T
interval is highly variable, depending on gender, age, heart rate and the influence of drugs.
Hence, the Bazett’s formula can be used to calculate the QT interval taking into account of the
variations, (it is given:QTc = QT√RR
) RR is the R-R interval and QTc is the QT interval
corrected. A prolonged QT interval greater than 0.45sec is a sign of ventricular
tachyarrhythmia which is a risk factor of sudden death occurrence.
A QRS complex is the most easily identified wave deflection of an ECG wave; it corresponds
to the event of the ventricles depolarization. A normal QRS complex will have a duration
range between 0.06sec to 0.10sec and a R-wave amplitude measuring at 0.7mV. The
morphology of the QRS complex is often used to diagnose various different heart diseases.
The P-R segment and S-T segment are both isoelectric, this means that no electrical activity
can be recorded by the surface electrodes over this period; hence, there is no wave deflection
visible on the ECG wave.
The S-T segment represents depolarization of the ventricles, this segment can indicate that
there is insufficient blood supply to the heart, also known as ischemia, when it is elevated or
13

depressed from the isoelectric line. This shift is caused by the changes in electrical current
flow properties of the dead conductive cells, due to ischemia from coronary blockage.
Elevation of the S-T segment implies that myocardial infarction is taking place. Depression of
the S-T segment indicates coronary ischemia, which can be caused by coronary blockage or
overdose of substance, e.g. digoxin or potassium.
The P-R segment corresponds to the electrical impulse triggered by the AV node, traveling
through conductive cells in the heart towards the ventricles, this segment does not signify any
clinical diagnosis of heart disorder but it helps us understand how the heart conduction system
works. Table 2.2 shows amplitude and duration of waves, intervals and segments [14, 23] of
ECG signal.
2.1.4 ECG Leads System
Any muscle contraction causes an electrical change depolarization, these changes can be
detected by pairs of electrodes placed on the surface of the body by using ECG leads, these
leads indicates to an imaginary line between two ECG electrodes and these leads consist of 12-
leads, each one of these leads represent electrical activity from a different angle on the heart
muscle. This leads to the 12 different electrical pictures which refer to different shapes and
amplitudes depending on the position of electrodes on the surface of the body. As a result, it
allows seeing the heart from various different angles. The different leads can be compared to
radiographs taken from different angles [24– 26]. The 12 standard ECG leads are divided in
two groups, the first group called limb leads and consist of three bipolar limb leads (I, II, and
III), I is a lead obtained between a negative electrode and a positive electrode where the
negative electrode placed on the right arm while the positive electrode placed on the left arm.
II is a lead obtained between a negative electrode and a positive electrode where the negative
electrode placed on the right arm while the positive electrode placed on the left foot. And III is
a lead obtained between a negative electrode and a positive electrode where the negative
electrode placed on the left arm while the positive electrode placed on the left foot. The
unipolar limb leads (AVR, AVL, and AVF), and the second group called chest leads, also
called precordial or V leads,(V1,V2,V3,V4,V5 and V6) .The description of the 12 ECG leads
and the mapping of electrodes positions are shown in the Figure 2.4.
14

Table 2.2 Amplitude and duration of waves, intervals and segments of ECG signal [14, 23]
Sl. no. Features Amplitude (mV) Duration (ms)
1 P wave 0.1-0.2 60-80
2 PR-segment - 50-120
3 PR- interval - 120-200
4 QRS complex 1 80-120
5 ST-segment - 100-120
6 T –wave 0.1-0.3 120-160
7 ST-interval - 320
8 RR-interval - (0.4-1.2)s
Figure 2.4 A vector view of the standard 12 Leads ECG [27]
2.2. Noise in the ECG Signal
Generally the recorded ECG signal is often contaminated by different types of noises and
artifacts that can be within the frequency band of ECG signal, which may change the
characteristics of ECG signal. Hence, it is difficult to extract useful information of the signal.
The primary sources of noise in ECG signals are:
Power line interferences
Low frequency Noise
15

Muscle contraction (EMG noise)
These artifacts strongly affects the ST segment, degrades the signal quality, frequency
resolution, produces large amplitude signals in ECG that can resemble PQRST waveforms and
masks tiny features that are important for clinical monitoring and diagnosis. Cancelation of
these artifacts in ECG signals is an important task for better diagnosis.
2.2.1 Power Line Interferences
Power line interferences consist of depending on the power supply 60 Hz/50 Hz, pickup and
harmonics because of improper grounding [28]. It is indicated as an impulse or spike at 60
Hz/50 Hz harmonics, and will appear as additional spikes at integral multiples of the
fundamental frequency as shown in Figure 2.5. Its frequency content is 60 Hz/50 Hz and its
harmonics, amplitude is up to 50 percent of peak-to-peak ECG signal amplitude [26]. A 60 Hz
notch filter can be used to remove the power line interferences [14]. Besides providing power
to the electrocardiograph itself, power lines are connected to other pieces of equipment and
appliances in the typical hospital floor, and ceiling running past the room to other points in the
building. This power line can affect the recording of the ECG and introduces interference at
the line frequency in the recorded trace [29]. Also it occurs through two mechanisms:
capacitive and inductive coupling. Capacitive coupling refers to the transfer of energy between
two circuits by means of a coupling capacitance present between the two circuits. The value of
the coupling capacitance decreases with increasing separation of the circuits. Inductive
coupling on the other hand is caused by mutual inductance between two conductors. When
current flows through wires it produces a magnetic flux which can induce a current in adjacent
circuits. Typically, capacitive coupling is responsible for high frequency noise while inductive
coupling introduces low frequency noise. For this reason inductive coupling is the dominant
mechanism of power line interference in ECG. To limit the amount of power line interference,
electrodes should be applied properly, that there are no loose wires, and all components have
adequate shielding [30].
16

Figure 2.5 Power line interference (50 Hz) in ECG signal
2.2.2 Low Frequency Noise
This noise is a result of changes of impedance between the electrode and a body of the patient.
The impedance changes as a result of changes of distances between the source of signal (heart)
and the electrode caused by the movement of the patient including breathing and changes of
contact between the body and the electrode which to a significant extent is caused by the
movement of the body of the patient, as shown in Figure 2.6. The low frequency noise is
located in the frequency below 1Hz. However, in some types of examinations, say exercise
examination of ECG, this range of frequencies is far higher and can reach the frequency of
several Hz [31]. In exercise test of ECG, the amplitude of low frequency noise becomes higher
which calls for the use of more effective means of noise suppression.
0 500 1000 1500 2000 2500-4
-2
0
2
4
6
8
10
12
Sampling
Ampl
itude
17

Figure 2.6 Low frequency noises present in ECG signal [29]
2.2.3 Muscle Contraction (EMG noise)
The noise of this nature is caused by the contraction of skeletal muscles which appear because
of the movement of the patient (related with the movement or inappropriate ambient
temperature in which the ECG examination is being carried out). Muscle signals, as shown in
Figure 2.7, are always associated with ECG signals. The highest level of noise is present in
stress tests. In these conditions, the noise is caused by intensive muscle contractions during
running on a treadmill or the load of the patient caused by cycle ergometer. The movement of
the patient is present during a long-term recording of ECG signals under normal conditions
which is present in Holter testing. In this case, the level of muscle noise depends quite
significantly on a level of activity (movement) of the patient, which could vary within the
testing.
18

Figure 2.7 Example of muscle noise of ECG signals
19
CHAPTER 3
ECG SIGNAL PROCESSING TECHNIQUES
ECG Signal Processing has become an essential and effective pedagogical approach to solve a
problem of detecting selected arrhythmia conditions from a patient’s ECG signals. Several
advanced signal processing techniques have been applied for cardiac arrhythmia detection
using Wavelets, Fourier Transforms, Artificial Neural Networks, Independent Component
Analysis, etc. Introducing a simple algorithm for arrhythmia detection can be very useful for
better conceptual understanding of signal processing. In this thesis, simple methods have been
discussed and used to clean ECG signal corrupted by noise and to extract required parameters
for detecting arrhythmia condition. These simple procedures involve using Digital filter
techniques, wavelet techniques and Adaptive filter techniques. There are various artifacts
which get added in these signals and change the original signal; therefore there is a need of
removal of these artifacts from the original signal.
3.1 Digital Filters
The function of a digital filter is the same as its analog counterpart, but its implementation is
very different. Analog filters are implemented using either active or passive electronic circuits,
and they operate on continuous waveforms. On the other hand, Digital filters are implemented
using either a digital logic circuit or a computer program and they operate on a sequence of
numbers that are obtained by sampling the continuous waveform. There are several advantages
of digital filters over analog filters. A digital filter is highly immune to noise because of the
way it is implemented (software/digital circuits). Accuracy is dependent only on round-off
error, which is directly determined by the number of bits that the designer chooses for
representing the variables in the filter.
Digital filtering has specific characteristics that you need to pay special attention. The analog
input signal must satisfy certain requirements. Furthermore, on converting an output digital
20

signal into analog form, it is necessary to perform additional signal processing in order to
obtain the appropriate result. Figure 3.1 shows the block diagram of digital filtering process.
Figure 3.1 A simplified block diagram of a real-time digital filter with analogue input and output signal
The bandlimited analogue signal is sampled periodically and converted into a series of digital
samples, x(n), n = 0, 1, .... The digital processor implements the filtering operation, mapping
the input sequence, x(n), into the output sequence, y(n), in accordance with a computational
algorithm for the filter [32]. The DAC converts the digitally filtered output into analogue
values which are then analogue filtered to smooth and remove unwanted high frequency
components. The process of converting an analog signal into digital form is performed by
sampling with a finite sampling frequency fs. If an input signal contains frequency
components higher than half the sampling frequency (fs/2), it will cause distortion to the
original spectrum. This is the reason why it is first necessary to perform filtering of an input
signal using a low-pass filter that eliminates high-frequency components from input frequency
spectrum. This filter is called anti-aliasing filter as it prevents aliasing. After the process of
filtering and sampling, a digital signal is ready for further processing which, in this case, is
filtering using the appropriate digital filter. The output signal is also a digital signal which, in
some cases, needs to be converted back into analog form. After digital-to analog conversion,
signal contains some frequency components higher than fs/2 that must be eliminated. Again, it
is necessary to use a low pass filter with the sampling frequency fs/2. Digital filter attenuation
is usually expressed in terms of the logarithmic decibel scale (dB) [33]. The attenuation
measured in decibels can be found using the following equation (3.1):
𝑎𝑎 = 20 ∗ log�𝐻𝐻(𝑓𝑓)� (3.1)
Input Filter ADC
Digital Signal
processor Stage
DAC Output Filter
X(t)
A I/P
X(n) Y(t)
AO/P
21

Cut-off frequencies are used for filter specification, the cut-off frequency of the passband is a
frequency at which the transition of the passband to the transition region occurs. The cut-off
frequency of the stopband is a frequency at which the transition of the transition region to the
stopband occurs. These two frequencies are equivalent only for the ideal filter which is not
possible to realize in practice.
Digital filters can be classified in several different groups, depending on what criteria are used
for classification. The two major types of digital filters which are finite impulse response
(FIR) and infinite impulse response (IIR). Both types have some advantages and disadvantages
that should be carefully considered when designing a filter. Besides, it is necessary to take into
account all fundamental characteristics of a signal to be filtered as these are very important
when deciding which filter to use. In most cases, it is only one characteristic that really matters
and it is whether it is necessary that filter has linear phase characteristic or not [34]. It is
necessary that a filter has linear phase characteristic to prevent loosing important information.
When a signal to be filtered is analyzed in this way, it is easy to decide which type of digital
filter is best to use. Accordingly, if the phase characteristic is of the essence, FIR filters should
be used as they have linear phase characteristic. Such filters are of higher order and more
complex, therefore. Otherwise, when it is only frequency response that matters, it is preferable
to use IIR digital filters which have far lower order, i.e. are less complex, and thus much easier
to realize. Either type of filter, in its basic form, can be represented by its impulse response
sequence, h (k) (k = 0, 1, ...). The input and output signals to the filter are related by the
convolution sum, which is given in equations (3.2) for the IIR and in (3.3) for the FIR filter
𝑦𝑦(𝑛𝑛) = ∑ ℎ(𝑘𝑘)𝑥𝑥(𝑛𝑛 − 𝑘𝑘)∞𝑘𝑘=0 (3.2)
𝑦𝑦(𝑛𝑛) = ∑ ℎ(𝑘𝑘)𝑥𝑥(𝑛𝑛 − 𝑘𝑘)𝑁𝑁−1𝑘𝑘=0 (3.3)
It is evident from these equations that, for IIR filters, the impulse response is of infinite
duration whereas for FIR it is of finite duration, since h (k) for the FIR has only N values. In
practice, it is not feasible to compute the output of the IIR filter using equation (3.2) because
the length of its impulse response is too long (infinite in theory). Instead, the IIR filtering
equation is expressed in a recursive form:
22

𝑦𝑦(𝑛𝑛) = ∑ ℎ(𝑘𝑘)𝑥𝑥(𝑛𝑛 − 𝑘𝑘)∞𝑘𝑘=0 = ∑ 𝑎𝑎𝑘𝑘𝑥𝑥(𝑛𝑛 − 𝑘𝑘)𝑁𝑁
𝑘𝑘=0 − ∑ 𝑏𝑏𝑘𝑘𝑦𝑦(𝑛𝑛 − 𝑘𝑘)𝑀𝑀𝑘𝑘=1 (3. 4)
Where the 𝑎𝑎𝑘𝑘 and 𝑏𝑏𝑘𝑘 are the coefficients of the filter and M , N are finite. The values of ℎ(𝑘𝑘),
for FIR, or 𝑎𝑎𝑘𝑘 and 𝑏𝑏𝑘𝑘, for IIR, are often very important objectives of most filter design
problems. In Equation (3.4), the current output sample, 𝑦𝑦(𝑛𝑛), is a function of past outputs as
well as present and past input samples, that is the IIR is a feedback system of some sort. This
should be compared with the FIR equation in which the current output sample,𝑦𝑦(𝑛𝑛) is a
function only of past and present values of the input. Note, however, that when the 𝑏𝑏𝑘𝑘 are set
to zero, the equation (3.4) reduces to the FIR equation (3.3).
3.1.1 Finite Impulse Response (FIR) Filter
A finite impulse response (FIR) filter has a unit impulse response that has a limited number of
terms, Figure 3.2 as opposed to an infinite impulse response (IIR) filter which produces an
infinite number of output terms when a unit impulse is applied to its input. FIR filters are
generally realized nonrecursively, which means that there is no feedback involved in
computation of the output data. The output of the filter depends only on the present and past
inputs. This quality has several important implications for digital filter design and
applications. FIR filters typically used for real-time ECG processing.
Figure 3.2 Block diagrams of FIR filters
FIR filters can be designed using different methods, but most of them are based on ideal filter
approximation. The objective is not to achieve ideal characteristics, as it is impossible anyway,
but to achieve sufficiently good characteristics of a filter. The transfer function of FIR filter
approaches the ideal as the filter order increases, thus increasing the complexity and amount of
time needed for processing input samples of a signal being filtered.
𝒚𝒚(𝒏𝒏)
𝒙𝒙(𝒏𝒏) 𝑿𝑿(𝒛𝒛)
𝒀𝒀(𝒛𝒛)
𝒉𝒉𝒃𝒃(𝒏𝒏)
𝑩𝑩(𝒛𝒛)
23

The basic characteristics of (FIR) filters are:
Finite impulse response, finite impulse response implies that the effect of transients or
initial conditions on the filter output will eventually die away. Figure 3.3 shows a signal-
flow graph (SFG) of a FIR filter realized nonrecursively.
Figure 3.3The output of a FIR filter of order N is the weighted sum of the values in the storage registers of the
delay line
The filter is merely a set of “tap weights” of the delay stages. The unit impulse response is
equal to the tap weights, so the filter has a difference equation given by equation (3.5), and a
transfer function equation given by equation (3.6).
𝑦𝑦(𝑛𝑛𝑛𝑛) = ∑ 𝑏𝑏𝑘𝑘𝑥𝑥(𝑛𝑛𝑛𝑛 − 𝑘𝑘𝑛𝑛)𝑁𝑁𝑘𝑘=0 (3.5)
𝐻𝐻(𝑧𝑧) = 𝑏𝑏0 + 𝑏𝑏1𝑧𝑧−1 + 𝑏𝑏2 𝑧𝑧−2 + ⋯ + 𝑏𝑏𝑁𝑁𝑧𝑧−𝑁𝑁 (3.6)
Linear phase, in many biomedical signal processing applications, it is important to
preserve certain characteristics of a signal throughout the filtering operation, such as the
height and duration of the QRS pulse. A filter with linear phase has a pure time delay as its
phase response, so phase distortion is minimized. A filter has linear phase if its frequency
response 𝐻𝐻�𝑒𝑒𝑗𝑗𝑗𝑗�can be expressed as
𝐻𝐻�𝑒𝑒𝑗𝑗𝑗𝑗� = 𝐻𝐻1(𝜃𝜃)e−j(αθ+β) (3.7)
where 𝐻𝐻1(𝜃𝜃) is a real and even function, since the phase of 𝐻𝐻�𝑒𝑒𝑗𝑗𝑗𝑗� is
𝒃𝒃𝟏𝟏
𝒃𝒃𝟐𝟐
𝒃𝒃𝟑𝟑
𝒀𝒀(𝒛𝒛) ∑
∑
∑
𝒛𝒛−𝟏𝟏 𝒛𝒛−𝟏𝟏 𝒛𝒛−𝟏𝟏 𝒛𝒛−𝟏𝟏
∑
𝒃𝒃𝟎𝟎
𝒃𝒃𝑵𝑵
𝑿𝑿(𝒛𝒛)
24

∠𝐻𝐻�𝑒𝑒𝑗𝑗𝑗𝑗� = 𝑓𝑓(𝑥𝑥) = �−∝ 𝜃𝜃 − 𝛽𝛽, 𝐻𝐻1(𝜃𝜃) > 0 −𝛼𝛼𝜃𝜃 − 𝛽𝛽 − 𝜋𝜋, 𝐻𝐻1(𝜃𝜃) < 0 (3.8)
FIR filters can easily be designed to have a linear phase characteristic. Linear phase can be
obtained in four ways, as combinations of even or odd symmetry (defined as follows) with
even or odd length.
�ℎ(𝑁𝑁 − 1 − 𝐾𝐾) = ℎ(𝜃𝜃𝐾𝐾), 𝑒𝑒𝑒𝑒𝑒𝑒𝑛𝑛 𝑠𝑠𝑦𝑦𝑠𝑠𝑠𝑠𝑒𝑒𝑠𝑠𝑠𝑠 𝑓𝑓𝑓𝑓𝑠𝑠 0 ≤ 𝐾𝐾 ≤ 𝑁𝑁 ℎ(𝑁𝑁 − 1 − 𝐾𝐾) = −ℎ(𝜃𝜃𝐾𝐾),𝑓𝑓𝑜𝑜𝑜𝑜 𝑠𝑠𝑦𝑦𝑠𝑠𝑠𝑠 𝑓𝑓𝑓𝑓𝑠𝑠 0 ≤ 𝐾𝐾 ≤ 𝑁𝑁 (3. 9)
Stability, since a nonrecursive filter does not use feedback, it has no poles except those
that are located at z = 0. Thus there is no possibility for a pole to exist outside the unit
circle. This means that it is inherently stable [35]. As long as the input to the filter is
bounded, the output of the filter will also be bounded. This contributes to ease of design,
and makes FIR filters especially useful for adaptive filtering where filter coefficients
change as a function of the input data.
There are many areas where FIR filters have been employed, including multirate processing
noise reduction [36, 37], matched filtering, and image processing [38]. In multirate processing,
for example, FIR filters have been successfully used for efficient digital anti-aliasing and anti-
imaging filtering for multirate systems such as high quality data acquisition and the compact
disc player. Figure 3.4 shows the application and construction of FIR bandpass filter to an
ECG signal using convolution and FFT to evaluate the filter’s frequency response. Firstly and
in order to show the range of the filter’s operation with respect to the frequency spectrum of
the ECG data, a spectrum analysis is implemented on both the ECG data and the filter by
using the FFT to analyze the data without windowing or averaging as shown in Figure 3.5.
25

Figure 3.4 Frequency response of the FIR bandpass filter
Figure 3.5 The frequency spectrum of ECG signal using the FFT
0 5 10 15 20 25 30 35 40 45 500
50
100
150
200
250
300
Freqency (Hz)
H(f)
0 5 10 15 20 25-2
-1
0
1
2
Ampl
itude
ECG Signal with Noise
0 5 10 15 20 25-1
-0.5
0
0.5
1Result of Finite Impulse Response Filtering
Time (sec)
Ampl
itude
26

3.1.2 Infinite Impulse Response (IIR) Filters
The primary advantage of IIR filters as shown in Figure 3.6 over FIR filters is that they can
usually meet a specific frequency criterion, such as a cutoff sharpness or slope, with a much
lower filter order (i.e., a lower number of filter coefficients).
The transfer function of IIR filters includes both numerator and denominator terms equation
(3.10) unlike FIR filters which have only a numerator. The equation for the IIR filter is the
same as that for any general linear process shown in equation (3.11).
𝐻𝐻(𝑧𝑧) = ∑ 𝑎𝑎𝑖𝑖𝑧𝑧−1𝑛𝑛𝑖𝑖=0
1−∑ 𝑏𝑏𝑖𝑖𝑧𝑧−1𝑛𝑛𝑖𝑖=1
= 𝑎𝑎0 +𝑎𝑎1𝑧𝑧−1+𝑎𝑎2 𝑧𝑧−2+⋯ +𝑎𝑎𝑁𝑁𝑧𝑧−𝑁𝑁
1−𝑏𝑏1𝑧𝑧−1−𝑏𝑏2 𝑧𝑧−2−⋯−𝑏𝑏𝑁𝑁𝑧𝑧−𝑁𝑁= 𝑌𝑌(𝑧𝑧)
𝑋𝑋(𝑧𝑧) (3.10)
Rearranging the terms gives:
𝑌𝑌(𝑧𝑧) = 𝑏𝑏1𝑌𝑌(𝑧𝑧)𝑧𝑧−1 + ⋯+ 𝑏𝑏𝑁𝑁𝑌𝑌(𝑧𝑧)𝑧𝑧−𝑛𝑛 + 𝑎𝑎0 𝑋𝑋(𝑧𝑧) + 𝑎𝑎1 𝑋𝑋(𝑧𝑧)𝑧𝑧−1 + ⋯𝑎𝑎𝑛𝑛𝑋𝑋(𝑧𝑧)𝑧𝑧−𝑁𝑁 (3.11)
Figure 3.6 Block diagrams of IIR filters
The Y(z) terms on the right side of this equation are delayed feedback terms. Figure 3.7 shows
these feedback terms as recursive loops; hence, these types of filters are also called recursive
filters. The Figure 3.8 shows Applying IIR filters on the ECG signal with noise.
𝒚𝒚(𝒏𝒏)
𝒙𝒙(𝒏𝒏) 𝑿𝑿(𝒛𝒛)
𝒀𝒀(𝒛𝒛)
ℎ𝑏𝑏𝑌𝑌(𝑛𝑛)
𝐵𝐵(𝑧𝑧)
ℎ𝑎𝑎𝑌𝑌(𝑛𝑛)
𝐴𝐴(𝑧𝑧)
27

Figure 3.7 The output of an IIR filter is delayed and fed back
Figure 3.8 Applying IIR filters on the ECG signal with noise
0 5 10 15 20 25-2
-1
0
1
2
Ampl
itude
ECG Signal with Noise
0 5 10 15 20 25-1
-0.5
0
0.5
1Result of Infinite Impulse Response Filtering
Time (sec)
Ampl
itude
28

The non-recursive (FIR) and recursive (IIR) filters have different characteristics for numbers
of applications. The non-recursive filters are chosen due to its best performance of numerical
operations, differentiation and integration. The Table 3.1 below shows the comparison
between FIR and IIR filters.
Table 3.1 Comparison between FIR and IIR filters
FIR Filters IIR Filters non recursive filter Recursive filter No feedback feedback is involved Always Stable May Be Unstable Linear Phase Response Non-Linear Phase Response FIR has no limited cycles. has limited cycles Less Efficient More Efficient No Analog Equivalent Analog Equivalent FIR is dependent upon i/p only. IIR filters are dependent on both i/p and o/p. FIR filters are used for tapping of a higher-order. IIR filters are better for tapping of lower-orders,
since IIR filters may become unstable with tapping higher-orders.
FIR only consists of zeros. IIR filters consist of zeros and poles, and require less memory than FIR filters.
FIR filters have only numerators IIR filters have both numerators and denominators. Where the system response is zero, we use FIR filters. Where the system response is infinite, we use IIR
filters,
3.2 Wavelet Analysis
Wavelet transform used as another method to describe the properties or processing biomedical
images and a nonstationary biosignal waveform that change over time [39-42]. The wavelet
transform is divided into segments of scale rather than sections of time, and it is applied on a
set of orthogonal basis functions obtained by contractions, dilations and shifts of a prototype
wavelet. The main difference between wavelet transforms and Fourier transform-based
methods is that the Fourier transform-based methods use windows of constant width while the
wavelet uses windows that are frequency dependent.
The continuous wavelet transform (CWT) can be represented mathematically in the followıng
equation (3.12).
W(a, b) = ∫ x(t) ψa,b∗ (t) dt (3.12)
29

Where the x(t) is given signal, a is the scale factor, b is time and * is the complex conjugate.
Probing function ψ is called “wavelet” because it can be any of a number of different
functions so it always takes on an oscillatory form. Also a prototype wavelet function ψ(t) is
termed a mother wavelet when b = 0 and a = 1, then the wavelet is in its natural form, that is,
ψ1,0(t) ≡ ψ(t).
The orthogonal basis functions denoted by ψa,b∗ (t) are obtained by scaling and shifting ψ(t)by
scale factor a and time b respectively in the following equation ( 3.13 ).
ψa,b(t) = 1�|a|
ψ�t−ba� (3. 13)
By adjusting the scale factor, the window duration can be arbitrarily changed for different
frequencies, i.e. if a is greater than one then the wavelet function ψ is stretched along the time
axis whereas when it is less than one (but still positive) it contacts the function. Negative
values of a simply flip the probing function ψ on the time axis. Because of the redundancy in
the transform by using CWT coefficients then it is rarely performed recovery of the original
waveform using CWT coefficients, while the more parsimonious DWT when reconstruction of
the original waveform is desired. The redundancy in CWT is not a problem in analysis
applications but will be costly when the application needs to recover the original signal
because for recovery, all of the coefficients (that are generated due to oversampling many
more coefficients than are really required to uniquely specify the signal) will be required and
the computational effort could be too much. While the DWT may still require redundancy to
produce a bilateral transform except if the wavelet is carefully chosen such that it leads to an
orthogonal family or basis in order to produce a nonredundant bilateral transform.
For most signal and image processing applications, DWT-based analysis is best described in
terms of filter banks. The use of a group of filters to divide up a signal into various spectral
components is termed subband coding. The most basic implementation of the DWT uses only
two filters as in the filter bank shown in Figure 3.9.The waveform under analysis is divided
into two components, 𝑌𝑌𝑙𝑙𝑙𝑙 (𝑛𝑛) and 𝑌𝑌ℎ𝑙𝑙 (𝑛𝑛), by the digital filters 𝐻𝐻0 (𝜔𝜔) and 𝐻𝐻1 (𝜔𝜔). The
spectral characteristics of the two filters must be carefully chosen with 𝐻𝐻0 (𝜔𝜔) having a
lowpass spectral characteristic and 𝐻𝐻1 (𝜔𝜔) a highpass spectral characteristic. The highpass
30

filter is analogous to the application of the wavelet to the original signal, while the lowpass
filter is analogous to the application of the scaling or smoothing function.
Figure 3.9 Simple filter bank
Signal recovery is illustrated in Figure 3.10 where a second pair of filters, 𝐺𝐺0 (𝜔𝜔) and 𝐺𝐺1 (𝜔𝜔),
operate on the high and lowpass subband signals and their sum is used to reconstruct a close
approximation of the original signal, 𝑋𝑋′ (𝑠𝑠). The Filter Bank that decomposes the original
signal is usually termed the analysis filters while the filter bank that reconstructs the signal is
termed the syntheses filters [43]. FIR filters are used throughout because they are inherently
stable and easier to implement.
Figure 3.10 A typical wavelet application
The DWT can also be used to construct useful descriptors of a waveform. Since the DWT is a
bilateral transform, all of the information in the original waveform must be contained in the
subband signals. Figure 3.11 shows the frequency characteristics of the high and lowpass filter
while the Figure 3.12 shows the ECG signal generated by the analysis filter bank.
𝒀𝒀𝒉𝒉𝒉𝒉 (𝒏𝒏)
𝑯𝑯𝟎𝟎 (𝝎𝝎)
𝑯𝑯𝟏𝟏 (𝝎𝝎)
𝑿𝑿 (𝒏𝒏) 𝒀𝒀𝒍𝒍𝒉𝒉 (𝒏𝒏)
𝐗𝐗(𝒏𝒏)
𝒀𝒀𝒉𝒉𝒉𝒉 (𝒏𝒏)
𝒀𝒀𝒍𝒍𝒉𝒉 (𝒏𝒏) 𝑮𝑮𝟎𝟎 (𝝎𝝎)
𝑮𝑮𝟏𝟏 (𝝎𝝎)
𝑯𝑯𝟎𝟎 (𝝎𝝎)
𝑯𝑯𝟏𝟏 (𝝎𝝎) Ope
ratio
n ∑
𝐗𝐗′(𝐧𝐧)
Analysis Filter
Synthesis Filter
31

Figure 3.11 Frequency response of low and high pass filter
Figure 3.12 ECG signal generated by the analysis filter bank
0 50 100 150 200 2500
0.5
1
1.5Low Pass Filter
Gai
n (d
B)
0 50 100 150 200 2500
0.5
1
1.5High Pass Filter
Frequency
Gai
n (d
B)
32

3.3 Adaptive Signal Processing
An adaptive filter is essentially a digital filter with self-adjusting characteristics. It adapts,
automatically, to changes in its input signals. Adaptive filters are the central topic in the sub-
area of DSP known as adaptive signal processing. Adaptive techniques have been used in
filtering of 60-Hz line frequency noise from ECG signals, extracting fetal ECG signals, and
enhancing P waves, as well as for removing other artifacts from the ECG signal [44].
A typical adaptive filter paradigm is shown in Figure 3.13 .The filter coefficients are modified
by a feedback process designed to make the filter’s output,
y(𝑛𝑛) , as close to some desired response, d(𝑛𝑛), as possible, by reducing the error, e(𝑛𝑛), to a
minimum. As with optimal filtering, the nature of the desired response will depend on the
specific problem involved and its formulation may be the most difficult part of the adaptive
system specification [35]. The FIR filters with stability criteria make them effective in optimal
filtering and adaptive applications [36]. For this reason, the adaptive filter can be performed
by a set of FIR filter coefficients.
LMS recursive algorithm is a simpler and more popular approach which is based on gradient
optimization when it is adapted for use in an adaptive environment with the same Wiener-
Hopf equations [45].
Figure 3.13 Elements of a typical adaptive filter
The LMS algorithm uses a recursive gradient method for detection the filter coefficients that
output the minimum sum of squared error [46]. The advantage of the LMS algorithm is simple
∑
𝐇𝐇(𝒛𝒛) 𝐗𝐗(𝒏𝒏)
Input
𝐲𝐲(𝒏𝒏)
Response
Error 𝐞𝐞(𝒏𝒏)
𝐝𝐝(𝒏𝒏)
Desired Response
− +
33

and easy of mathematical computation, while the drawbacks of this method are the influence
of non-stationary interferences on the signal, the influence of signal component on the
interference, computer word length requirements, coefficient drift, slow convergence rate and
higher steady-state error. Adaptive filter has a number of applications in biomedical signal
processing. For example, it can be used to eliminate a narrowband noise 60 Hz line source that
distorts a broadband signal, or inversely it can be used to eliminate broadband noise from a
narrowband signal and this process is called adaptive line enhancement (ALE) or Adaptive
Interference Suppression. In ALE the narrowband component is the signal while in adaptive
interference suppression it is the noise. Figure 3.14 introduces an application of adaptive line
enhancer that applied to ECG signal where the least square mean (LSM) recursive algorithm
used to implement the ALE filter in order to eliminate broadband noise from a narrowband
signal.
Figure 3.14 ALE application on ECG signal
The Table 3.2 shows the comparison of signal processing techniques that used in this thesis:
0 5 10 15 20 25-2
-1
0
1
2
Am
plitu
de
ECG Signal with Noise
0 5 10 15 20 25-0.5
0
0.5
Time(sec)
Am
plitu
de
Result of Adaptive Filter
34

Table 3.2 Comparison of signal processing techniques
Methods Advantages Limitations
Digital Filters
• Used to reshape the spectrum in order to provide some improvement in SNR • These filters are closely related to spectral analysis • Filters can be divided into two groups according to the way that they achieve the reshape of the spectrum, FIR and IIR filters, and based on their approach • IIR fılters are more efficient in terms of computer time and memory than FIR filters; this is the disadvantage of FIR filters
• The user is unable to know which frequency characteristics are the best or any type of filtering will be so effective on splitting up noise from signal • The user will depend on his knowing on signal or source features or by trial and error • Cannot respond to changes that might occur during the path of the signal
Wavelet Analyses
• Describe the properties a nonstationary waveform • It is divided into segments of scale rather than sections of time • It is applied on a set of orthogonal basis functions obtained by contractions, dilations and shifts of a prototype wavelet. • uses windows that are frequency dependent • good technique when it is used especially with signals that have long durations of low frequency components and short durations of high frequency components like EEG signals or signals of differences in interbeat (R-R) intervals
Adaptive Signal
Processing
• Many well documented implementations (LMS, RLS, Kalman filters) • Are optimal in that they minimize the mean squared estimation error • Can be computed in real-time
• They assume your process dynamics are linear • Only provide a point estimate Can only handle processes with additive, unimodal noise
35

CHAPTER 4
DESIGNING A GUI IN MATLAB
A graphical user interface (GUI) is a pictorial interface to a program. A good GUI can make
programs easier to use by providing them with a consistent appearance and with intuitive
controls like pushbuttons, list boxes, sliders, menus, and so on. The GUI should behave in an
understandable and predictable manner, so that a user knows what to expect when anyone
performs an action. For example, when a mouse click occurs on a pushbutton, the GUI should
initiate the action described on the label of the button. MATLAB Builder NE lets user to
create .NET and COM components from MATLAB programs that include MATLAB math
and graphics, and GUIs developed with MATLAB. So user can integrate these components
into larger .NET and .COM by using Active Server Pages .NET (ASP .NET) and deploy them
royalty-free to computers that do not have MATLAB installed. ASP.NET is used to create
web pages and web technologies and is an integral part of Microsoft’s .NET framework
vision. As a member of the .NET framework, ASP.NET is a very valuable tool for
programmers and developers as it allows them to build dynamic, rich web sites and web
applications using compiled languages like VB and C#. ASP.NET is not limited to script
languages, it allows you to make use of .NET languages like C#, J#, VB, etc. It allows
developers to build very compelling applications by making use of Visual Studio, the
development tool provided by Microsoft. ASP.NET is purely server-side technology. It is built
on a common language runtime that can be used on any Windows server to host powerful
ASP.NET web sites and technologies. Therefore there are many reasons for using .NET
application are as follows [47]:
Sharing application with others who do not have MATLAB
Integrating MATLAB algorithms into other applications
Having many concurrent users work with your MATLAB algorithms
ASP.NET drastically reduces the amount of code required to build large applications
36

The ASP.NET framework is complemented by a rich toolbox and designer in the
Visual Studio integrated development environment. Drag-and-drop server controls, and
automatic deployment are just a few of the features this powerful tool provides
Being language-independent, it allows you to choose the language that best applies to
your application or partition your application across many languages
The source code and HTML are together therefore ASP.NET pages are easy to
maintain and write. Also the source code is executed on the server. This provides a lot
of power and flexibility to the web pages
All the processes are closely monitored and managed by the ASP.NET runtime, so that
if process is dead, a new process can be created in its place, which helps keep your
application constantly available to handle requests
With built-in Windows authentication and per-application configuration, your
applications are safe and secured
The Web server continuously monitors the pages, components and applications
running on it. If it notices any memory leaks, infinite loops, other illegal activities, it
immediately destroys those activities and restarts itself
It is purely server-side technology so, ASP.NET code executes on the server before it
is sent to the browser
Provides simplicity as ASP.NET makes it easy to perform common tasks, from simple
form submission and client authentication to deployment and site configuration
This chapter introduces the basic knowledge of the MATLAB GUIs and how user can build
Graphical User Interfaces (GUIs) in MATLAB. Then discusses how MATLAB .NET
applications deploy as WEB site by using ASP.NET with Microsoft Visual Studio.
4.1 Architecture of the MATLAB GUI
A graphical user interface provides the user with a familiar environment in which to work.
This environment contains pushbuttons, toggle buttons, lists, menus, text boxes, and so on, all
of which are already familiar to the user, so that anyone can concentrate on using the
application rather than on the mechanics involved in doing things.
37

However, GUIs are harder for the programmer because a GUI-based program must be
prepared for mouse clicks (or possibly keyboard input) for any GUI element at any time. Such
inputs are known as events, and a program that responds to events is said to be event driven.
The three principal elements required to create a MATLAB Graphical User Interface are [48]:
a) Components: Each item on a MATLAB GUI is a graphical component. The types of
components include graphical controls (pushbuttons, edit boxes, lists, sliders, etc.), static
elements (frames and text strings), menus, and axes. Graphical controls and static
elements are created by the function uicontrol, and menus are created by the functions
uimenu and uicontextmenu. Axes, which are used to display graphical data, are created by
the function axes.
b) Figures: The components of a GUI must be arranged within a figure, which is a
window on the computer screen. In the past, figures have been created automatically
whenever we have plotted data. However, empty figures can be created with the function
figure and can be used to hold any combination of components.
c) Callbacks: Finally, there must be some way to perform an action if a user clicks a
mouse on a button or types information on a keyboard. A mouse click or a key press is an
event, and the MATLAB program must respond to each event if the program is to perform
its function. For example, if a user clicks on a button, that event must cause the MATLAB
code that implements the function of the button to be executed. The code executed in
response to an event is known as a call back. There must be a callback to implement the
function of each graphical component on the GUI. The basic GUI elements are
summarized in Table 4.1
Table 4.1 Components of basic GUI
Graphical Controls
Elements Created By Description
Pushbutton
Uicontrol
A graphical component that implements a pushbutton. It triggers a
callback when clicked with a mouse.
38

Table 4.1 Cont.
Graphical Controls
Elements Created By Description Check box
Uicontrol
A check box is a type of toggle button that appears as a small square
with a check mark in it when it is "on ". Each mouse click on a check
box triggers a callback.
Edit box
Uicontrol
An edit box displays a text string and allows the user to modify the
information displayed. A callback is triggered when the user presses
the Enter key.
List box
Uicontrol
A list box is a graphical control that displays a series of text strings. A
user can select one of the text strings by single- or double-clicking on
it. A callback is triggered when the user selects a string.
Popup menus
Uicontrol
A popup menu is a graphical control that displays a series of text
strings in response to a mouse click. When the popup menu is not
clicked on, only the currently selected string is visible.
Slider
Uicontrol
A slider is a graphical control to adjust a value in a smooth, continuous
fashion by dragging the control with a mouse. Each slider change
triggers a callback.
Static Elements
Elements Created By Description Panel
Uicontrol
Creates a panel, which is a rectangular box within a figure. Frames arc
used to group sets of controls together. Frames never trigger callbacks.
Text field
Uicontrol
Creates a label, which is a text string located at a point on the figure.
Text fields never trigger callbacks.
Menu and Axes
Elements Created By Description
Menu items Uimenu. Creates a menu item. Menu items trigger a callback when a mouse
button is released over them.
Axes
Axes Creates a new set of axes to display data on. Axes never trigger
callbacks
39

4.1.1 Creating and Displaying a Graphical User Interface
MATLAB GUIs are created using a tool called guide (GUI development environment). This
tool allows a user to layout the GUI, selecting and aligning the GUI components to be placed
in it. When guide is executed, it creates the Layout Editor [49], as shown in Figure 4.1.
Figure 4.1 The guide tool window in design mode
The large gray area with grid lines is the layout area, where a user can layout the GUI. The
layout editor window has components of GUI along the left side of the layout area. A user can
create any number of GUI components by first clicking on the desired component, and then
dragging its outline in the layout area. The top of the window has a toolbar with a series of
useful tools that allow the user to distribute and align GUI components, modify the properties
of GUI components, add menus to GUIs, and so on. The basic steps required to create a
MATLAB GUI are [50]:
Decide what elements are required for the GUI and what the function of each element
will be. Make a rough layout of the components by hand on a piece of paper.
Property inspector Menu Editor Align Objects
GUI Components
Design Area
Drag to Resize Design
40

Use a MATLAB tool called guide (GUI development environment) to layout the
components on a figure. The size of the figure and the alignment and spacing of
components on the figure can be adjusted using the tools built into guide.
Use a MATLAB tool called the Property Inspector (built into guide) to give each
component a name (a "tag") and to set the characteristics of each component, such as
its color, the text it displays, and so on.
Save the figure to a file. When the figure is saved, two files will be created on disk
with the same name but different extents. The fig file contains the actual GUI that have
created, and the M-file contains the code to load the figure and skeleton call backs for
each GUI element.
Write code to implement the behavior associated with each callback function.
As an example of these steps, the Figures 4.2 and 4.3 below illustrates how Creating and
Displaying a Graphical User Interface, two files will be created with the same name (filters.fig
and filters.m).
Figure 4.2 Example of GUI layout within the guide window
Pop-up menus
Radio Button
Push Button
Axes
41

Figure 4.3 The m-file for filters GUI, automatically created by guide
4.1. ECG Signal Simulation Based on the MATLAB GUI
This thesis presents new software packages using a MATLAB GUI and shares the package
results to website by using ASP NET, which it is very easy and important at the same time to
use for clinicians and engineers in research studies as well as to students who works in the
medical section. The results of the system package in MATLAB GUI are composed of four
components. Firstly, ECG noises and filtrations. Secondly, ECG analyses for normal signal for
detecting heart rate and PQRST values. Thirdly, ECG analysis for the abnormalities for
detecting heart rate and PQRST values. Fourthly, DSP techniques of ECG Analysis which
includes three techniques Digital filters (FIR and IIR), Wavelet processing (Filters Banks) and
Adaptive filter signal Processing. Some of the results are based on our work that have done in
previously published paper [51]. The figures of these results have shown in the details in the
following five sections.
Code automatically created by guide after saving the GUI layout and take the same name of GUI.
42

4.2.1 ECG Noises and Filtrations
In this section of system packages provides the following main features for the first step of
processing of ECG by removable some types of important noises in ECG signal as in
Figure 4.4.
Figure 4.4 The main first GUI page of the package system
a) Loading ECG signal with noises which consists of three types of noises are as
follows :
ECG Signal with 50 Hz Interference
ECG Signal with High Frequency Interference
ECG Signal with mixed Two main Types of above Noises
b) Export and save graphs in anywhere in hard disk or over the network so by default the
place of saving is current folder, but the user can select save as to save at anywhere for
each type of noise as (.fig, .png and .bmp types) as in Figures 4.5 and 4.6.
43

Figure 4.5 Export and print out graph for each type of noise as (.fig, .png and .bmp types)
Figure 4.6 The place of saving graphs as (.fig, .png and .bmp types)
c) Applying multi types of filters to remove ECG noises Figure 4.7 are as follows:
Gaussian Filter
Moving Average Filter
Median Filter
Print out ECG Noise
Save Noise graph as (.fig, .png and .bmp types)
44

Butter Worth Filter
FIR1 Filter
Sgolay Filter
Weighted Window Filter
Smooth Filter
Figure 4.7 Applying multi types of filters to remove ECG noises
d) Export and save graphs in anywhere in hard disk or over the network so by default the
place of saving is current folder, but the user can select save as to save at anywhere for
each type of filter as (.fig, .png and .bmp types).
4.2.2 Normal ECG Analysis
In this section of system packages provides the following main features for the second step of
processing of normal ECG and analysis which analyzes of ECG recordings to get P, Q, R, S,
and T as well as detect heart rate as shown in Figure 4.8 are as follows.
Apply Butter Worth Filter
45

Figure 4.8 The main GUI page for normal ECG analysis
1. Draw full sampling of ECG signal recordings from any source of data as text or binary
files and excel files as shown in Figure 4.8.
2. Import date from anywhere in hard disk or over the network and from any type of data.
3. When select detect R-peak and heart rate button performs the steps of heart rate
detection by using a windowing filter two times for finding local maxima of R-peak
after removing low frequency components then adjusts the filter size.
4. When click export and save button user can save graph which display on the left side
as three types of file (.fig,png. And bmp.).
5. User can save data as (txt, mat and xlsx types).
6. Types of image (figure) that program can save figure.
7. Types of data that the program can save data.
5
7
1
2
3
4
8
9
6
10 11 12 13
15 14 16
46

8. Get analysis data button mean get analysis of ECG data to detect PQRST values. It is
necessary for anyone who works on this program should select the numbers of
samples for one cardiac cycle in an ECG signal of the P-QRS-T waves are equal to
400 samples.
9. When click this button we can save graph which display on the bottom side as three
types of files (.fig, .png and bmp).
10. The user can print out each of figures depend on which one wants.
11. Types of image (figure) that program can save P-QRS-T waves figure.
12. Selection about which one the user want to print out, all samples or specific samples.
13. Enter the range of sampling data for analysis data of ECG to get PQRST value.
14. POP- UP menu used to select steps for detecting R- peaks and heart rate detection.
15. Select type of data as (mat, txt and xlsx) to draw the ECG signal.
16. When the user selects data from which type of data want also these data for any lead of
ECG want to draw it.
The Figure 4.9 describes the P-QRS-T and heart rate detecting flow chart design .The first step
of the flowchart have started by selection of ECG lead (I,II,III) as well as type of files (.mat
file,.txt file,.xlsx file). After selecting which lead you select and type of data from any type of
file the algorithm start to read ECG data and removing low and high frequency components,
after that, using a windowing filter and thresholding for finding local maxima .The last step for
detecting R – peaks using adjust filter (again windowing filter) to detect heart rate and P-QRS-
T waves after a simple mathematical calculation by MATLAB equations to calculate P, Q, R,
S and T.
47

Figure 4.9 Steps of PQRST & heart rate detection
4.2.3 ECG Abnormalities Analysis
In this section of system packages provides the same features as the previous section, but the
main different features are the processing for ECG abnormalities Analysis which includes
(Supraventricular Arrhythmia, Apnea, Normal Sinus Rhythm, Ventricular Tachyarrhythmia
and Intracardiac Atrial Fibrillation) which analyzes of abnormalities ECG recordings for
detecting an arrhythmia and calculate P, Q, R, S, and T as well as detect heart rate of ECG
abnormalities therefore the Figure 4.10 and Table 4.2 demonstrates all the ECG abnormalities
and give a brief summary of the results of analysis of ECG abnormalities are as follows:
End
Using a windowing Filter
Thresholding
Using The Adjust Filter
PQRST & Heart Rate Detection
Start
ECG Data Input
Lead Selection (I,II,III)
File Type Selection (.mat file,.txt file,.xlsx file)
Read ECG signal
Remove Low and High Frequency Components
48

Figure 4.10 The main GUI page for ECG abnormality analysis
The Table 4.2 shows the results of multi cases of ECG abnormalities signals, from these
results we found for example; in normal sinus rhythm is the rhythm of a healthy normal heart,
where the sinus node triggers the cardiac activation. This is easily diagnosed by noting that the
three deflections, P-QRS-T, follow in this order and are differentiable. The heart beat is
normal 96 bpm (between 60 and 100). Apnea-ECG in this case is close to be the normal case
as regular and normal heart rate is 73 bpm (between 60 and 100) also three deflections, P-
QRS-T, follow in this order and are differentiable. Supraventricular arrhythmia is an
arrhythmia of an abnormality in the timing or pattern of the heartbeat. Arrhythmias may cause
the heart to beat too rapidly, too slowly, or irregularly. They are common and may cause a
wide variety of symptoms, such as a racing, skipping or fluttering sensation (called
palpitations) in your chest. Ventricular tachyarrhythmia is a rhythm of ventricular origin may
also be a consequence of a slower conduction in ischemic ventricular muscle that leads to
circular activation (re-entry). The result is activation of the ventricular muscle at a high rate
(over 120/min), causing rapid, bizarre, and wide QRS-complexes Intra cardiac. Atrial
fibrillation is activation in the atria may also be fully irregular and chaotic, producing irregular
49
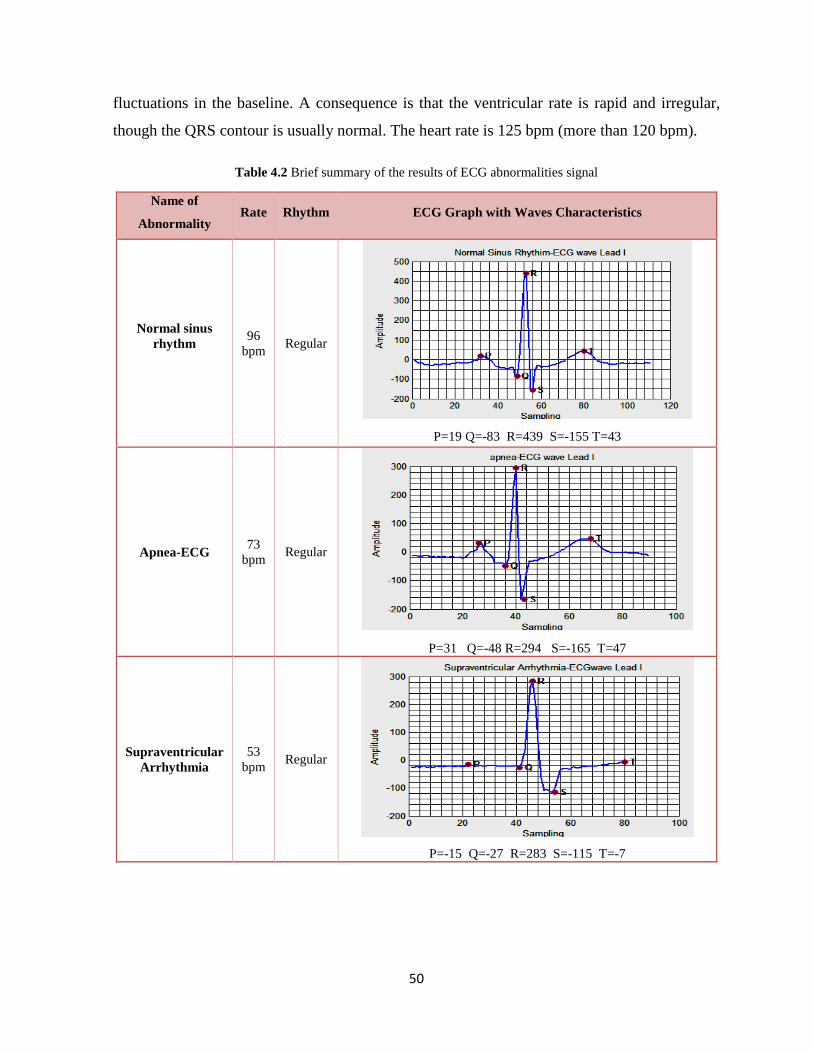
fluctuations in the baseline. A consequence is that the ventricular rate is rapid and irregular,
though the QRS contour is usually normal. The heart rate is 125 bpm (more than 120 bpm).
Table 4.2 Brief summary of the results of ECG abnormalities signal
Name of
Abnormality Rate Rhythm ECG Graph with Waves Characteristics
Normal sinus rhythm
96 bpm Regular
P=19 Q=-83 R=439 S=-155 T=43
Apnea-ECG 73 bpm Regular
P=31 Q=-48 R=294 S=-165 T=47
Supraventricular Arrhythmia
53 bpm Regular
P=-15 Q=-27 R=283 S=-115 T=-7
50

Table 4.2 Cont.
Name of
Abnormality Rate Rhythm ECG Graph with Waves Characteristics
Ventricular Tachyarrhythmia
125 bpm
May be irregular
P=-29 Q=-85 R=1026 S=-60 T=-25
Intra cardiac Atrial Fibrillation
125 bpm Irregular
P=-432 Q=-984 R=7696 S=-1041 T=-404
4.2.4 DSP Techniques of ECG Analysis
In this section of system packages provides the following main features of using three
techniques of Digital signal processing which includes Digital filter technique, wavelet
technique and Adaptive filter technique of processing of ECG by removable some types of
important noises in ECG signal as shown in Figure 4.11 are as follows.
51

Figure 4.11 The main GUI page for DSP techniques of ECG analysis
a) In Digital filter technique, apply two types of digital filters which are FIR filter and
IIR filter as shown in Figure 4.11 with variable order of the filter.
b) In Adaptive filter technique; apply Adaptive Line Enhancement (ALE) Filter with
variable order of the filter as shown in Figure 4.12.
52

Figure 4.12 An example of using of Adaptive Line Enhancement (ALE) Filter
c) In Wavelet technique, apply Filters Banks Filter by using high and low pass filters as
shown in Figure 4.13.
Figure 4.13 Result of Filters Banks Filter by using high and lowpass filters of wavelet technique
53

CHAPTER 5
ECG SIGNAL PROCESSING USING ASP .NET
This thesis proposes new software packages using MATLAB GUI and shares the package
results to website by using ASP .NET. The results of the system packages are composed of five
components. Firstly, ECG noises and filtrations. Secondly, ECG analyses for normal signal for
detecting heart rate and PQRST values. Thirdly, ECG analysis for the abnormalities for
detecting heart rate and PQRST values. Fourthly, DSP techniques of ECG Analysis which
includes three techniques Digital filters (FIR and IIR), Wavelet processing (Filters Banks) and
Adaptive filter signal Processing. Finally, put all four components above in one graphical user
interface (GUI) and create .NET applications as well as publishing and share them as an ASP
site by using visual studio .NET.
5.1 .NET Application Deployment Process
When the MATLAB Builder NE product processes your MATLAB code, it creates several
overloaded methods that implement the MATLAB functions. Each of these overloaded
methods corresponds to a call to the generic MATLAB function with a specific number of
input arguments. Creating a .NET component by using the deployment tool GUI to build a
.NET class that wraps around the sample MATLAB code are as follows [52]:
a) Writing a code in MATLAB in our example.
b) At the command window type deploytool and press Enter. The deploytool
GUI can be opened as shown in figure 5.1.
54

Figure 5.1 Deployment Project dialog
c) Create a deployment project using the Deployment Project dialog steps:
i. Type the name of your project (my component) in the Name field.
ii. Enter the location of the project in the Location field. Alternately, navigate to the
location.
iii. Select the target for the deployment project (.NET Assembly) from the Target
drop-down menu.
iv. And then click OK
d) On the Build tab Figure 5.2, click Add class. Type the name of the class
(mycomponentclass) in the Class Name field, and then add files by clicking Add files.
55

Figure 5.2 Adding files in .NET Project
e) In the last step, click the Build button, Figure 5.3. The builder does two process
firstly, generates two C# files, a component data file and a component wrapper. The
component data file contains static information for the component. The wrapper contains
the implementation code for the .NET component and provides a .NET application
programming interface (API) for the MATLAB functions you add to the project at
design time. Secondly, the MATLAB Builder NE two compiles the C# code and
generates two subfolders under the project folder: project-folder/src and project-
folder/distrib files.
Add file (filters.m) by clicking add files icon
56

Figure 5.3 Creating a .NET Project
The Figures 5.4 and 5.5 illustrates subfolders which contain the following files.
Figure 5.4 Contents of subfolder distrib
After adding files click build button
57

Figure 5.5 Contents of subfolder src
5.2 Deploying .NET Components over the Web Site
Using the WebFigures feature in MATLAB Builder NE you can display MATLAB figures on
a Web site for graphical manipulation by end users. This enables them to use their graphical
applications from anywhere on the web without the need to download MATLAB or other tools
that can consume costly resources. After the compilation of coding files are finished in
MATLAB, then can go to the Visual Studio program. It must first create a new ASP.NET
website are as follows [53]:
a. Start Microsoft Visual Studio
b. Create an ASP.NET web site Figure 5.6
58

Figure 5.6 Creating an ASP.NET web site
c. Add WebFigure Control to the Microsoft Visual Studio toolbar by dragging the file
MATLAB\toolbox\dotnetbuilder\bin\arch\v2.0 WebFiguresService.dll, on to the
Microsoft Visual Studio Toolbox toolbar as follows:
i. Expand the General section of the Toolbox toolbar
ii. Drag the DLL file to the expanded section, as shown in the Figure 5.7
Create a new an ASP.NET web site
59

Figure 5.7 WebFigureControl to toolbox
d. Drag the WebFigureControl from the toolbar to your Web page. Then add a
reference to MWArray to your project and a reference to the deployed component that
created by the MATLAB Builder NE Product (mycomponent project) in the first step
Figure 5.8
Adding WebFigureControl to Toolbox
60

Figure 5.8 Adding a reference to the deployed component that created by the MATLAB Builder NE Product
e. In Microsoft Visual Studio, access the code for the Web page by right-clicking the
workspace and selecting View Code. Then Adding code to the Page_Load method
ensures it executes every time the Web page loads Figure 5.9
Figure 5.9 Writing code in C#
Adding a reference component that created by the MATLAB Builder NE Product.
61

f. Test the Web page by running it in Microsoft Visual Studio. Select Debug, then
starting Debugging. The page must be appearing as shown in the following Figures 5.10
and 5.11 at initialization and running page.
Figure 5.10 Web site page at initialization
Figure 5.11 ASP .NET site page after running
Webfigure1 Webfigure2
62

5.3 ASP .NET Web Site Application
In this part after completing the designing software package using MATLAB Graphical User
Interface (GUI) we have created an ASP .NET web site by using visual studio .NET, first of
all, we must build a simple user registration form that will allow user register to the website in
ASP.Net using C#. User will fill up the registration form with details such as username,
password, email address, full name and country; these details will be saved in the database
table. The registration form will also make sure that duplicate username and email addresses
are not saved by verifying whether the username and email address must not exist in the table,
so for access to the website in ASP.Net for any user must have registration confirmation in the
registration form and then enter at any time by using only user name and password in the login
page as shown in Figures 5.12 and 5.13.
Figure 5.12 ASP .NET web site login page
63

Figure 5.13 ASP .NET web site registration page
The first page will appear for any user who want to access to the website in ASP .Net is a
login page so if has registered previously the user can access directly to the web site, but if
don’t have access previously the user must fill the registration form to able enter to web site in
ASP.Net. Our application that has designed in web site in ASP .Net consist of multi pages and
the user can navigate from any page to the other just by clicking the name of the page after
have made registration confirmation of the registration form. The Figure 5.14 shows the
startup (main) page that will appear to user after login correctly to able from choosing any
page that the user want to work on it.
64

Figure 5.14 ASP .NET web site startup (main) page
Through the startup (main) page the user can navigate to five pages, which are ECG noise and
filtration, normal ECG analysis, ECG abnormalities analysis, DSP techniques of ECG analysis
and registration page as shown in figures 5.15,5.16,5.17 and 5.18.
65

Figure 5.15 ASP .NET web site of ECG noise and filtration page
Figure 5.16 ASP .NET web site of normal ECG analysis page
66

Figure 5.17 ASP .NET web site of ECG abnormalities analysis page
Figure 5.18 ASP .NET web site of DSP techniques of ECG analysis page
67

CHAPTER 6
CONCLUSION AND FUTURE WORKS
This chapter will introduce conclusion and future work of this thesis with entitled ECG signal
processing techniques by using ASP.NET application based on GUI in MATLAB that deals
with following points are:
Remove multi types of noises in ECG signal
Detecting heart rate for normal ECG signal and abnormal ECG signals
Investigation to calculate the PQRST values for normal ECG signal and abnormal
ECG signals by proposing a simple mathematical algorithm
Detecting of Arrhythmia problems
How To build a project package (windows standalone application)
Introduces three Digital Signal Processing (DSP) techniques for removing noise in
the ECG signal
Crate package software system by designing graphical user interface (GUI) using
MATLAB
Create .NET application package
6.1 Conclusion
This thesis presents new software packages using a MATLAB GUI and shares the package
results to website by using ASP NET, which it is very easy and important at the same time to
use for clinicians and engineers in research studies as well as to students who works in the
medical section. This software package covers all ECG signal analysis, which includes
removing ECG noises, heart rate detection and calculates of PQRST values; therefore this
system package contains five sections.
In the first section that titled ECG noises and filtrations removes all types of noises in ECG
signal by using multi types of filters. In the second part of system package which titled ECG
68

normal analysis for detecting heart rate and calculate PQRST values by using a simple
mathematical calculation by MATLAB equations, while the most of earlier methods for
detecting PQRST values of ECG signal analysis was based on DSP technique, for example
(Wavelet Transform and Fast Fourier Transform) and Artificial Neural networks, while this
thesis presents a developer program is a flexible and thorough tool for calculate P, Q, R, S and
T from ECGs and detect heart rate.
This proposed software tool is based on finding a mathematical relationship between the
highest values (peaks and valleys) of the ECG waveform and time. This developed program
can be utilized in training for clinicians and engineers working together in the same field
which related to ECG abnormalities.
In the third part which entitled ECG analysis for the abnormalities, also introduce some
analysis for detecting heart rate and PQRST values, but for some cases of ECG abnormalities
such as Supraventricular Arrhythmia, Apnea, Normal Sinus Rhythm, Ventricular
Tachyarrhythmia and Intracardiac Atrial Fibrillation which analyzes of abnormalities ECG
recordings for detecting an arrhythmia and calculate P, Q, R, S, and T as well as detect heart
rate of ECG abnormalities. In the fourth part that titled DSP techniques of ECG analysis which
introduces three techniques are as follows: digital filters (FIR and IIR), wavelet processing
(filters banks technique) and adaptive filter signal processing. These three techniques have
used for removing ECG noises were implemented in this part of the system by using
MATLAB and perform completely successful in removing most types of the ECG noises. The
output results have shown that the performance of IIR filters better than FIR filters that used it
for ECG noise cancellation. While in the second technique which entitled adaptive filter
processing, introducing an application of adaptive line enhancer that applied to ECG signal
where the LSM recursive algorithm used to implement the ALE filter in order to eliminate
broadband noise from a narrowband signal.
The last technique is wavelet processing that applied of ECG signal which have low and high
frequency noises by passing this signal through a filter bank which consists of subbands series
of low pass and high pass filters. The ECG signals that generated by the analysis filter bank
with the topmost plot showing the outputs of the first set of filters with the finest resolution,
the next from the top showing the outputs of the second set of a set of filters, etc.
69

Only the lowest (i.e., smoothest) low pass subband signal is included in the output of the filter
bank, the rest are used only in the determination of low pass and high pass subbands. The
lowest plots show the frequency characteristics of the low and high pass filters. Finally, all
these works that designed in one graphical user interface (GUI) have created in .NET
applications for publishing and sharing them as an ASP .NET web site by using visual studio
.NET. ASP.Net application introduces a lot of new features which include:
Sharing applications with others who do not have MATLAB
Integrating MATLAB algorithms into other applications such C# , and having
many concurrent users work with MATLAB algorithms
ASP.NET drastically reduces the amount of code required to build large
applications
The ASP.NET framework is complemented by a rich toolbox and designer in the
Visual Studio integrated development environment. WYSIWYG editing, drag-and-drop
server controls, and automatic deployment are just a few of the features this powerful tool
provides
Provides simplicity as ASP.NET makes it easy to perform common tasks, from
simple form submission and client authentication to deployment and site configuration
The source code and HTML are together therefore ASP.NET pages are easy to
maintain and write. Also the source code is executed on the server. This provides a lot of
power and flexibility to the web pages
All the processes are closely monitored and managed by the ASP.NET runtime, so
that if process is dead, a new process can be created in its place, which helps keep your
application constantly available to handle requests
It is purely server-side technology so, ASP.NET code executes on the server before
it is sent to the browser
Web application exists in compiled form on the server so the execution speed is
faster as compared to the interpreted scripts
ASP.NET 2.0 ships with a Web Parts Framework that provides the infrastructure
and the building blocks required for creating modular web pages that can be easily
customized by the users
70

6.2 Future Work
Nowadays the analysis of ECG for detecting heart rate, cardiac arrhythmia and the magnitude
and intervals of the P-QRS-T is one of the most significant subjects in the biomedical field so
there is a lot of work must be developed for this thesis are as follows:
The work in this thesis can be developed by applying to the telemedicine application
area. So cardiac arrhythmia detecting through remote access of ECG diagnosis is a highly
effective and beneficial service for each of the medical sections and patients. The remote
access control between patient and hospital or research center to transmit ECG information
24 hours a day of patient, especially from one clinic or patient’s home for chronic patients
to a remote site. So by using this service will be a part of homecare service center for tele
homecare and as well as create link between nurses for consultation with specialists
doctors in the event that an abnormality is found in the patient. In general, an ECG
diagnosis research by applying the telemedicine application area is very significant in the
future.
Automatic cardiac abnormality detection by detecting heart rate, the QRS complex is
necessary for real time application.
Automatic detection of R-peaks and feature extraction techniques of ECG signal in real
time.
Calculate ST segment and other sensitive intervals in the ECG signal are best and most
important for detecting an arrhythmia and the frequency spectrum of these segments.
Other techniques can be used and apply of ECG signal like Artificial Neural networks,
to test by applying for it and see the result.
71

REFERENCES
[1] A.J. Moss and S. Stern, "Noninvasive Electrocardiology", Clinical Aspects of Holter,
London, Philadelphia, W.B. Saunders, 1996.
[2] C. Saritha, V. Sukanya, and Y. N. Murthy, "ECG Signal Analysis Using Wavelet
Transforms", Bulgarian Journal of Physics, Vol. 35, pp. 68-77, 2008.
[3] S. Karpagachelvi, M. Arthanari, and M. Sivakumar, "ECG Feature Extraction Techniques-
A Survey Approach", (IJCSIS) International Journal of Computer Science and Information
Security, Vol. 8, No.1, pp. 76-80, 2010.
[4] K. Prasad and J. S. Sahambi, "Classification of ECG Arrhythmias Using Multi-Resolution
Analysis and Neural Networks", IEEE Transactions on Biomedical Engineering, Vol. 1, pp.
227- 231, 2003.
[5] J. P. Martínez, R. Almeida, S. Olmos, A. P. Rocha, and P. Laguna, "A Wavelet-Based
ECG Delineator: Evaluation on Standard Databases", IEEE Transactions on Biomedical
Engineering, Vol. 51, No. 4, pp. 570-581, 2004.
[6] S. Cerutti and C. Marchesi, "Advanced Methods of Biomedical Signal Processing", Wiley
IEEE Press, 2011.
[7] A. N. Ali, "Advanced Biosignal Processing", Berlin Heidelberg: Springer-Verlag, 2009.
[8] V. N. Pande, H.K.Verma and P. Mukhopadhyay, "Software Detection of ECG Baseline
and QRS-Complex for Coronary Intensive Care", Vol. 8, No. 3, pp. 203–214, 1985.
[9] A.C. Douglas, R.M. Stem, G.G. Cano, and S.A. Briller, "An Approach to Cardiac
Arrhythmia Analysis Using Hidden Markov Models", IEEE Transactions On Biomedical
Engineering, Vol. 37, No. 9, pp. 826-836, 1990.
[10] X. Xu and Y. Liu, "ECG QRS Complex Detection Using Slope Vector Waveform (SVW)
Algorithm", Proc. the 26th Annual International Conference of the IEEE EMBS, pp. 3597-
3600, 2004.
[11] S. N. Yu, Y.H. Chen, "Electrocardiogram Beat Classification Based on Wavelet
Transformation and Probabilistic Neural Network”, Pattern Recognition Letters, Vol. 28, No.
10, pp. 1142–1150, 2007.
72

[12] R. N. Ahmad and A. R. Kadkhodamohammadi, "Cardiac Arrhythmias Classification
Method Based on MUSIC, Morphological Descriptors, and Neural Network", EURASIP
Journal on Advances in Signal Processing, No. 202, Hindawi Publishing Corporation, 2008.
[13] V. S. Chouhan, and S. S. Mehta, "Detection of QRS Complexes in 12- Lead ECG Using
Adaptive Quantized Threshold", IJCSNS International Journal of Computer Science and
Network Security, Vol. 8, No. 1, pp. 153-163, 2008.
[14] Y. C. Yeh and W. J. Wang, "QRS Complexes Detection for ECG Signal: The Difference
Operation Method”, Computer Methods and Programs in Biomedicine, Vol. 91, No. 3, pp.
245–254, 2008.
[15] S. Franklin and J. Wallcave, "Cardiac Condition Detection Using Artificial Neural
Networks", Electrical Engineering Department California Polytechnic State University San
Luis Obispo, June 2013.
[16] L. Sornmo and P. Laguna, "Biomedical Signal Processing in Cardiac and Neurological
Applications”, Biomedical Engineering, Academic Press, New York 2005.
[17] U. R. Acharya, J.S. Suri, J.A.E. Spaan and S.M. Krishan, "Advances in Cardiac Signal
Processing", Springer, Berlin 2007.
[18] R. Acharya, J. S. Suri, J. A.E. Spaan and S .M. Krishnan, "Advances in Cardiac Signal
Processing", Springer, IEEE Trans. Biomedical Engineering, pp. 1-50, 2007.
[19] W. J. Germann and C. L. Standield, "Principles of Human Physiology", Benjamin
Cummings, San Francisco, 2002.
[20] J. D. Bronzino, "The Biomedical Engineering Handbook", IEEE Press, 2000.
[21] G.S. Wagner, “Marriott’s Practical Electrocardiography", 10th Ed., Lippincott Williams &
Wilkins, Philadelphia, 2001.
[22] Hobbie R. K., "Intermediate Physics for Medicine and Biology", 2nd Ed., John Wiley &
Sons, 1988.
[23] R.M. "Rangayyan, Biomedical Signal Analysis: A Case-Study Approach", Wiley–
Interscience, New York, pp.18–28, 2001.
[24] D. Jennings, A. Flint, B. C. H. Firton and L. D. M. Nokes, "Introduction to Medical
Electronics Applications", Edward Arnold, 1995.
[25] J. D. Enderle, S. M. Blanchard, and J. D. Bronzino, "Introduction to Biomedical
Engineering", 2nd Ed., by Elsevier Inc., 2005.
73

[26] M. Kutz, "Standard Handbook of Biomedical Engineering and Design", McGraw-Hill
Professional Publishing, 2003.
[27] M. M. K. Delano, "A Long Term Wearable Electrocardiogram (ECG) Measurement
System", M.S. thesis, Dept. of Elect. Eng. and Compu. Scie., Massachusetts Institute of
Technology, United States, 2012.
[28] G.M. Friesen, T.C. Jannett, M.A. Jadallah, S.L. Yates, S.R. Quint, and H.T. Nagle, "A
Comparison of The Noise Sensitivity of Nine QRS Detection Algorithms", IEEE Transaction
Biomedical Engineering, Vol. 37, No.1, 1990.
[29] H. Al-jobouri, "Designation of Interface and Software Program As A Base For ECG
Monitoring and Signal Analysis", M.S. Thesis, Dept. of Medical Eng., AlNahrain Univ.,
Baghdad, Iraq, 2004.
[30] R. Panda, "Removal of Artifacts from Electrocardiogram", M.S. Thesis, Dept. of
Electronics and Communication Engineering, National Institute of Technology Rourkela,
Odisha, India, 2012.
[31] A. Gacek and W.Pedrycz ,"ECG Signal Processing, Classification and Interpretation",
Springer Press, 2012.
[32] B. Widrow and J.M. McCool, "A Comparison of Adaptive Algorithms Based on the
Methods of Steepest Descent and Rrandom Search", IEEE Transaction Antennas Propagation,
Vol. 24, No. 5, pp. 615-637, 1976b.
[33] B. Friedlander, "System Identification Techniques for Adaptive Noise Canceling", IEEE
Transactions on Acoustics, Speech and Signal Processing, Vol. 30, No. 5, pp. 699-709, 1982.
[34] S.D. Stearns and R.A. David, "Signal Processing Algorithms in MATLAB", Prentice
Hall, Upper Saddle River, NJ, USA 1996.
[35] V.K. Ingle and J. G. Proakis, "Digital Signal Processing with MATLAB", Brooks/Cole,
Inc. Pacific Grove, CA, 2000.
[36] R.E. Crochiere and L.R. Rabiner, "Interpolation and Decimation of Digital Signals- A
Tutorial Review", IEEE Proc., Vol. 69, No. 3, pp. 300-331, 1981.
[37] C.F. Hamer, E.C. lfeachor and B.W. Jervis, " Digital Filtering of Physiological Signals
with Minimal Distortion", Medical and Biological Engineering and Computing, Vol. 23, No.
3, pp. 274-278, 1985.
74

[38] G. Wade, P. van-Eetvelt and H. Darwen, "Synthesis of Efficient Low-Order FIR Filters
From Primitive Sections", IEEE Proc., Vol. 137, No. 5, pp. 367-372, 1990.
[39] N. B. Eugene, "Biomedical Signal Processing and Signal Modeling", John Wiley & Sons,
Inc., 2001.
[40] C. Sergio and C. Marchesi, "Advanced Methods of Biomedical Signal Processing",
Wiley-IEEE Press, 2011.
[41] R. M. Rangayyan, "Biomedical Signal Analysis: A Case-Study Approach", Wiley-IEEE
Press, 2002.
[42] S. Mallat, "A Wavelet Tour of Signal Processing", Second Edition (Wavelet Analysis &
Its Applications), 2nd Academic Press, 1999.
[43] P. Zhou, M.M. Lowery, R.F. Weir and T.A. Kuiken, "Elimination of ECG Artifacts From
|Myoelectric Prosthesis Control Signals Developed by Targeted Muscle Reinnervation", 27th
Annual International Conference of the Engineering in Medicine and Biology Society, IEEE-
EMBS, Vol. 5, pp. 5276-5279, 2005.
[44] B. Widrow et al., "Adaptive Noise Cancelling: Principal and Application ", Proceeding of
IEEE, Vol. 63, pp. 1692-1716, 1975.
[45] J. L. Semmlow, "Biosignal and Biomedical Image Processing: MATLAB Based
Applications", Marcel Dekker Inc., New York, 2004.
[46] R. K. Abhay and M. G. Sanjay, "Adaptive Power Line Interference Canceller: A Survey",
International Journal of Advances in Engineering & Technology, Vol. 5, No. 2, pp. 319-326,
2013.
[47] https:/ www.mathworks.com/matlab builder NE 3 user’ guide /pdf_doc, 2010.
[48] S. Simakov, “Introduction to MATLAB Graphical User Interfaces", Commonwealth of
Australia, 2005.
[49] P. Marchan and O. T. Holland, "Graphics and GUIs with MATLAB", 3rd Ed., Chapman
& Hall/CRC, 2003
[50] https:/ www.mathworks.com/.creating graphical user interfaces/ pdf_doc, 2015.
[51] Hussain A. J. AL-Ziarjawey and I. Çankaya, "Heart Rate Monitoring and PQRST
Detection Based on Graphical User Interface with Matlab", 7th international conference on
computer science and information technology (ICCSIT), Barcelona, Spain , December 22-24,
75

2014, International Journal of Information and Electronics Engineering, Vol. 5, No. 4, pp.
311-316, 2015.
[52] S. P. Chandran and M. Angepat, "Comparison Between ASP.NET and PHP
Implementation of A Real Estate Web Application", M.S. Thesis, Dept. of Software
Engineering, School of Innovation, Design and Engineering, 2011.
[53] H. P. Halvorsen, "Introduction to Visual Studio and C#", M.S. Thesis, Dept. of Electrical
Engineering, Information Technology, Telemark University College, 2014.
76

BIOGRAPHY
Name: Hussain Abed Jaber
Personal Information
Date of Birth: 17 / 05 / 1973 Place of Birth: Baghdad Marital status: Married Nationality: Iraqi. Sex: Male.
Address: In Turkey Ankara / Çankaya
In Iraq: Iraq / Baghdad / Al- Mansour
Email Address: [email protected] [email protected] [email protected] Telephone (Mobile in Turkey): (0090) 554 593 82 18. (Mobile in Iraq): (00964) 7901382720, 7702616130
Education [ 1992 – 1996 ] University of Technology Baghdad, Iraq. B.Sc. Degree / Electrical & Electronic Engineering Department In 1st and 2nd year, studying the General of Engineering Sciences. In 3rd, Specialization in the Electrical & Electronic Engineering. In 4th year, Specialization in the Electrical Engineering. 2013 Yildirm Beyazit university (now I’m doing master degree in
Electronic and communication engineering )
Work experience
[ 1996 - 1999] AL NADA Company (Iraqi company) Baghdad, Iraq. [ 1999 - 2005] MDS Company (Jordanian company) Baghdad, Iraq.
[ 2005 - 2013] CCMED Company (Japanese company) Baghdad, Iraq. Training Certificate I have a training certificate from the following companies : Kontron Co., Ltd France Company (in Iraq 2001). Drager Co., Ltd Germany Company (in Iraq 2002). Al-Tabiaa Computer Training Center (in Iraq 2004).
77

CPA MOH ( in Iraq 2003) Furuno Electric Co., Ltd (in Japan 2006). Jokoh Co., Ltd (in Japan 2006). Inami Co., Ltd (in Japan 2006). Kubota Corporation (in Japan 2006). Paramount Bed Co., Ltd (in Japan 2006). Nakamura Medical Industry Co., Ltd (in Japan 2006). Furuno Electric Co., Ltd (in Japan 2007). Jokoh Co., Ltd (in Japan 2007). Sysmex Corporation (in Japan 2007). NIHON KOHDEN Company (in Japan 2008). ACOMA company (in Japan 2008). Furuno Electric Co., Ltd (in Japan 2008). Jokoh Co., Ltd (in Japan 2008). Sysmex Corporation (in Japan 2008). Furuno Electric Co., Ltd (in Japan 2009). Jokoh Co., Ltd (in Japan 2009). Sysmex Corporation (in Japan 2009). NIHON KOHDEN Company (in Japan 2009). Sakura Company (in Japan 2009). Hitachi company (in Turkey 2011) sales training about MRI & CT devices.
Languages Arabic (mother language), second language (English) and I am continuing in taking Turkish courses in TAD center.
Hobbies Sports and Reading.
Professional memberships
I have been Memberships in the Iraqi Engineer Union from 1996 till now.
IEEE Member.
Dissemination
Journal and Conference : Hussain A. J. AL-Ziarjawey and I. Çankaya, "Heart Rate Monitoring and PQRST Detection Based on Graphical User Interface with Matlab",7th international conference on computer science and information technology (ICCSIT), Barcelona, Spain, December 22-24, 2014, International Journal of Information and Electronics Engineering, Vol. 5, No. 4, July 2015.
78
Copyright © 2022 FDOKUMEN