Cost-effectiveness of pre-participation screening of athletes with ECG in Europe and Algeria
23
Cost-Effectiveness of Preparticipation Screening for Prevention of Sudden Cardiac Death in Young Athletes Matthew T. Wheeler, MD, PhD; Paul A. Heidenreich, MD, MS; Victor F. Froelicher, MD; Mark A. Hlatky, MD; and Euan A. Ashley, MB ChB, DPhil Background: Inclusion of 12-lead electrocardiography (ECG) in preparticipation screening of young athletes is controversial because of concerns about cost-effectiveness. Objective: To evaluate the cost-effectiveness of ECG plus cardiovascular-focused history and physical examination compared with cardiovascular-focused history and physical examination alone for preparticipation screening. Design: Decision-analysis, cost-effectiveness model. Data Sources: Published epidemiologic and preparticipation screen- ing data, vital statistics, and other publicly available data. Target Population: Competitive athletes in high school and college aged 14 to 22 years. Time Horizon: Lifetime. Perspective: Societal. Intervention: Nonparticipation in competitive athletic activity and disease-specific treatment for identified athletes with heart disease. Outcome Measure: Incremental health care cost per life-year gained. Results of Base-Case Analysis: Addition of ECG to preparticipa- tion screening saves 2.06 life-years per 1000 athletes at an incre- mental total cost of $89 per athlete and yields a cost-effectiveness ratio of $42 900 per life-year saved (95% CI, $21 200 to $71 300 per life-year saved) compared with cardiovascular-focused history and physical examination alone. Compared with no screening, ECG plus cardiovascular-focused history and physical examination saves 2.6 life-years per 1000 athletes screened and costs $199 per ath- lete, yielding a cost-effectiveness ratio of $76 100 per life-year saved ($62 400 to $130 000). Results of Sensitivity Analysis: Results are sensitive to the relative risk reduction associated with nonparticipation and the cost of initial screening. Limitations: Effectiveness data are derived from 1 major Euro- pean study. Patterns of causes of sudden death may vary among countries. Conclusion: Screening young athletes with 12-lead ECG plus cardiovascular-focused history and physical examination may be cost-effective. Primary Funding Source: Stanford Cardiovascular Institute and the Breetwor Foundation. Ann Intern Med. 2010;152:276-286. www.annals.org For author affiliations, see end of text. Y oung athletes are the healthiest members of society, yet more than 90 competitive young athletes die suddenly and unexpectedly in the United States each year (1). Most of these deaths are attributed to underlying structural heart disease, including hypertrophic cardiomyopathy, anoma- lous coronary artery anatomy, arrhythmogenic right ven- tricular cardiomyopathy, and aortic aneurysm (1). Athletes with intrinsic arrhythmic diseases, including the long QT, Brugada, and Wolff–Parkinson–White syndromes, also have an increased risk for sudden death. Although the risk for sudden cardiac death for the young competitive-athlete population as a whole is low (2 per 100 000 persons per year) (1, 2), it is at least 2.5-fold higher than that of the age-matched nonathlete population (3). The risk for sudden cardiac death increases with increasing peak intensity of exercise and increasing level of competition (4, 5). The underlying autopsy-proven cardiac abnormality has been appropriately diagnosed during life in only a small minority of young athletes who have sudden cardiac death (6, 7). In ath- letes with underlying but undiscovered heart disease, the risk for sudden cardiac death may be more than 100-fold higher than that of unaffected peers. Identification and appropriate treatment for these high-risk persons may substantially reduce their likelihood of dying suddenly (8, 9). Ongoing debate (10, 11) surrounds the optimal ap- proach to screening young competitive athletes for occult cardiovascular disease to minimize sudden cardiac death. Current strategies for screening U.S. high school and col- lege student-athletes before competitive exercise follow the recommendations of the 36th Bethesda Conference (12, 13), which refines previous suggestions for screening before competitive exercise (14, 15). The Bethesda Conference recommended screening with focused personal history, family history, and physical examination tailored toward See also: Print Editors’ Notes ............................. 277 Editorial comment.......................... 324 Related article ............................. 269 Summary for Patients ....................... I-40 Web-Only Appendix Tables Appendix Figures Conversion of graphics into slides Annals of Internal Medicine Article 276 © 2010 American College of Physicians
Transcript of Cost-effectiveness of pre-participation screening of athletes with ECG in Europe and Algeria

Cost-Effectiveness of Preparticipation Screening for Prevention ofSudden Cardiac Death in Young AthletesMatthew T. Wheeler, MD, PhD; Paul A. Heidenreich, MD, MS; Victor F. Froelicher, MD; Mark A. Hlatky, MD; andEuan A. Ashley, MB ChB, DPhil
Background: Inclusion of 12-lead electrocardiography (ECG) inpreparticipation screening of young athletes is controversial becauseof concerns about cost-effectiveness.
Objective: To evaluate the cost-effectiveness of ECG pluscardiovascular-focused history and physical examination comparedwith cardiovascular-focused history and physical examination alonefor preparticipation screening.
Design: Decision-analysis, cost-effectiveness model.
Data Sources: Published epidemiologic and preparticipation screen-ing data, vital statistics, and other publicly available data.
Target Population: Competitive athletes in high school and collegeaged 14 to 22 years.
Time Horizon: Lifetime.
Perspective: Societal.
Intervention: Nonparticipation in competitive athletic activity anddisease-specific treatment for identified athletes with heart disease.
Outcome Measure: Incremental health care cost per life-yeargained.
Results of Base-Case Analysis: Addition of ECG to preparticipa-tion screening saves 2.06 life-years per 1000 athletes at an incre-
mental total cost of $89 per athlete and yields a cost-effectivenessratio of $42 900 per life-year saved (95% CI, $21 200 to $71 300per life-year saved) compared with cardiovascular-focused historyand physical examination alone. Compared with no screening, ECGplus cardiovascular-focused history and physical examination saves2.6 life-years per 1000 athletes screened and costs $199 per ath-lete, yielding a cost-effectiveness ratio of $76 100 per life-yearsaved ($62 400 to $130 000).
Results of Sensitivity Analysis: Results are sensitive to the relativerisk reduction associated with nonparticipation and the cost of initialscreening.
Limitations: Effectiveness data are derived from 1 major Euro-pean study. Patterns of causes of sudden death may varyamong countries.
Conclusion: Screening young athletes with 12-lead ECG pluscardiovascular-focused history and physical examination may becost-effective.
Primary Funding Source: Stanford Cardiovascular Institute and theBreetwor Foundation.
Ann Intern Med. 2010;152:276-286. www.annals.orgFor author affiliations, see end of text.
Young athletes are the healthiest members of society, yetmore than 90 competitive young athletes die suddenly
and unexpectedly in the United States each year (1). Mostof these deaths are attributed to underlying structural heartdisease, including hypertrophic cardiomyopathy, anoma-lous coronary artery anatomy, arrhythmogenic right ven-tricular cardiomyopathy, and aortic aneurysm (1). Athleteswith intrinsic arrhythmic diseases, including the long QT,Brugada, and Wolff–Parkinson–White syndromes, alsohave an increased risk for sudden death.
Although the risk for sudden cardiac death for the youngcompetitive-athlete population as a whole is low (2 per100 000 persons per year) (1, 2), it is at least 2.5-fold higherthan that of the age-matched nonathlete population (3). Therisk for sudden cardiac death increases with increasing peakintensity of exercise and increasing level of competition (4, 5).The underlying autopsy-proven cardiac abnormality has beenappropriately diagnosed during life in only a small minority ofyoung athletes who have sudden cardiac death (6, 7). In ath-letes with underlying but undiscovered heart disease, the riskfor sudden cardiac death may be more than 100-fold higherthan that of unaffected peers. Identification and appropriatetreatment for these high-risk persons may substantially reducetheir likelihood of dying suddenly (8, 9).
Ongoing debate (10, 11) surrounds the optimal ap-proach to screening young competitive athletes for occultcardiovascular disease to minimize sudden cardiac death.Current strategies for screening U.S. high school and col-lege student-athletes before competitive exercise follow therecommendations of the 36th Bethesda Conference (12,13), which refines previous suggestions for screening beforecompetitive exercise (14, 15). The Bethesda Conferencerecommended screening with focused personal history,family history, and physical examination tailored toward
See also:
PrintEditors’ Notes . . . . . . . . . . . . . . . . . . . . . . . . . . . . . 277Editorial comment. . . . . . . . . . . . . . . . . . . . . . . . . . 324Related article. . . . . . . . . . . . . . . . . . . . . . . . . . . . . 269Summary for Patients. . . . . . . . . . . . . . . . . . . . . . . I-40
Web-OnlyAppendix TablesAppendix FiguresConversion of graphics into slides
Annals of Internal MedicineArticle
276 © 2010 American College of Physicians

detection of cardiac abnormalities but did not explicitlyrecommend routine use of 12-lead electrocardiography(ECG). In Italy, preparticipation screening is governed bydecree of the Italian Ministry of Health, which requiresphysician-led screening with history, physical examination,and ECG (16). In the 30 years since ECG screening wasintroduced in Italy, longitudinal evidence from the Venetoregion of Italy has suggested an 89% absolute risk reduc-tion in risk for sudden cardiac death in competitive ath-letes, such that the total risk for sudden cardiac death inscreened athletes is now similar to that in contemporary,age-matched nonathletes (9). The success of the Italianapproach has led the European Society of Cardiology toadopt a common European protocol, including ECG asthe centerpiece of cardiovascular screening (17), and theInternational Olympic Committee to recommend ECGscreening for Olympic athletes (18).
The cost of adding ECG to the screening program hasbeen a central argument against its routine use (13). Expertcommentators have identified a formal cost-effectivenessanalysis as an urgent need (10, 11, 19). By contrast, thecost of ECG screening was not discussed in a recent Amer-ican Heart Association scientific statement (20) recom-mending ECG screening for young patients with atten-tion deficit hyperactivity disorder who were prescribedstimulants (21). Previous cost analyses of screening ath-letes with ECG have not fully accounted for the costsand benefits of screening (6, 22, 23). We sought tomodel the cost-effectiveness of including 12-lead ECGas part of preparticipation cardiovascular screening foryoung athletes.
METHODS
DesignWe used a decision model (Figure 1) to project the
costs and survival rates for U.S. male and female athletesparticipating in high school and college interscholastic ath-letics who had a single cardiovascular preparticipationscreening evaluation to identify underlying cardiac diseasespredisposing to sudden cardiac death. The model evaluated3 screening options: no screening; cardiovascular-focusedhistory and physical examination alone, as recommendedby the American Heart Association consensus panel (13);and cardiovascular-focused history and physical examina-tion plus 12-lead ECG with interpretation, as recom-mended by the European Society of Cardiology ConsensusPanel (17). We adhered to recommendations for conductof cost-effectiveness analyses (24) by using a societal per-spective on health care costs and benefits, following life-time effects of interventions, and applying a 3% annualdiscount rate. We did not include costs and benefits unre-lated to cardiovascular health of the athletes screened in theanalysis.
Decision ModelWe assigned a cohort of patients to 1 of 4 branches on
the basis of results of preparticipation testing and actualpresence or absence of underlying cardiac disease. Wemodeled preparticipation testing as an initial primaryscreening test followed by a secondary testing step. Wemodeled persons who we did not find to be at risk or who,despite having a positive test result, did not continue on tosecondary testing, in the negative primary-testing group.We divided persons in the negative-testing branch intothose without disease (true negative) and those with under-lying (occult) cardiac disease, which put them at increasedrisk for sudden cardiac death (false negative). Persons inthe positive-testing branch were subjected to secondarytesting, which was modeled to have comparatively highsensitivity and specificity versus initial screening. If wefound that these persons had disease, we modeled them toreceive treatment (as necessary) and restricted them fromathletic activity, as appropriate (true positive). We assignedpersons who had a negative result on secondary testing toeither the true-negative (Figure 1, group C) or the false-negative (Figure 1, group B) branch on the basis of under-lying cardiac disease status. Each branch then used aMarkov process to model, on a yearly basis, the incidenceof death, including incident sudden cardiac death and in-cident baseline risk for death (minus the baseline risk forsudden cardiac death for nonathletes without heart disease)by age (25); the cost of medical care; and the utility-adjusted quality of life. In each subsequent year, a 0.1% or1% annual rate of being reclassified to have disease duringthe course of routine care occurred in the secondary testingfalse-negative and screening false-negative groups, respec-
Context
Estimates suggest that about 1 in 220 000 young athleteshave sudden cardiac death each year. The European Soci-ety of Cardiology and the International Olympic Commit-tee recommend that preparticipation screening for sportsinclude electrocardiography; however, screening in theUnited States typically does not includeelectrocardiography.
Contribution
This analysis estimated that adding electrocardiography tohistory and physical examination to screen athletes aged14 to 22 years saves 2.06 life-years per 1000 athletesscreened at a cost of $42 000 per life-year saved com-pared with screening with history and physical alone. Theaddition of electrocardiography seemed to remain cost-effective in a range of sensitivity analyses.
Caution
Analysis was based largely on 1 European study, andpatterns of cardiac disease differ geographically.
—The Editors
ArticleCost-Effectiveness of Electrocardiography Screening in Young Athletes
www.annals.org 2 March 2010 Annals of Internal Medicine Volume 152 • Number 5 277

tively. These persons were subsequently assigned the riskand cost characteristics of the true-positive branch. TheMarkov process continued until the fraction of persons ineach branch alive reached 0, with all persons modeled todie by age 100 years. After cessation of competitive athleticactivity, the annual excess sudden cardiac death mortalityrisk in the false-negative group was decreased to 50% ofthe excess mortality in persons identified with and treatedfor heart disease, and risk in the true-negative group de-creased to the baseline risk for nonathletes. After age 35years, when the rate of sudden cardiac death due to ath-erosclerotic coronary artery disease is substantially largerthan the risk for sudden death due to other causes in thescreened population as a whole, the risk for death for allgroups is modeled to be equivalent.
Prevalence and Rates of Sudden Cardiac DeathWe calculated rates of sudden cardiac death in athletes
and nonathletes (Table 1) by using data from a study byCorrado and colleagues (9) and applied them to the U.S.population on the basis of derivation of expected preva-lence of predisposing cardiac disease in the United States.We generated baseline U.S. rates in parallel from the prod-uct of incidence of sudden cardiac death in athletes (1) andprevalence rates in the young for predisposing cardiac dis-eases known to cause or predispose to sudden cardiac death
on the basis of the best available epidemiologic data(Appendix Figures 1 and 2 and Appendix Table 1, avail-able at www.annals.org). These rates were similar to therates derived from the study by Corrado and colleagues (9).We derived high and low estimates of sudden cardiac deathincidence from alternative data sources suggesting varia-tions in prevalence of predisposing disease or incidence ofsudden cardiac death in athletes (Appendix Table 1). Wederived background annual mortality rates from U.S. vitalstatistics data from 2004 (25).
CostsWe obtained baseline yearly medical costs from Na-
tional Center for Health Statistics data from 2004 (35).We obtained clinical history and physical, ECG tracingand interpretation, and secondary testing costs (Table 1)from Medicare reimbursement schedules and the Con-sumer Price Index, adjusted when appropriate to 2004U.S. dollars (33, 34). Initial screening costs included esti-mated indirect time and travel costs for screening. Wemodeled best-case costs by assuming efficiencies of massscreening (cost for ECG $5) in secondary analyses. Second-ary testing costs were based on a second clinic visit, echo-cardiography, and exercise test or Holter monitor as aver-age secondary testing guided by expected prevalence ofunderlying diseases (Appendix Table 1). A disease-specific
Figure 1. Decision analysis model.
Secondary positive
nonparticipation
Positive
screening
Negative
screening
No screening
Screening
Participation
True
positive A
True
negative
True
negative
False
positive
False
negative
False
negative
Secondary
negative
ECG + H & P
CV-focused
H & P
Secondary
testingSudden death
in athlete
Sudden death
in nonathlete
Athlete
who survives
Nonathlete
who survives
Athlete
who survives
Death from
other cause
Death from
other cause
Disease
discovered
Sudden death
in athlete
Death from
other cause
A
B MA
B
B
C
B
C
A M
C M
CV � cardiovascular; ECG � 12-lead electrocardiography; H & P � history and physical examination; M � Markov node.
Article Cost-Effectiveness of Electrocardiography Screening in Young Athletes
278 2 March 2010 Annals of Internal Medicine Volume 152 • Number 5 www.annals.org

approach to determining secondary testing methods, in-cluding cardiac magnetic resonance imaging or commer-cially available genetic testing, when appropriate in aminority of athletes undergoing secondary screening,generated a similar mean value. We estimated initial treat-ment and follow-up above yearly baseline costs on the basisof expected rates of utilization for athletes who had a pos-itive screening result on initial or secondary testing, and weused wide estimates for high and low ranges because of theuncertainty inherent in these estimates. This estimate in-cludes expected initial-year societal costs for cardiac surgery($48 000 per person) (36) for 1%, electrophysiology studyand ablation ($18 000 per person) (37) for 2%, and im-plantable cardioverter-defibrillator implantation ($28 000per person) (38) for 2% of the true-positive population.
Effectiveness of Treatment and NonparticipationWe estimated baseline effectiveness of correct identifi-
cation and treatment of athletes with occult heart diseasefrom a large published longitudinal study evaluating ef-
fectiveness of preparticipation screening in Italy (9).The effect of treatment or nonparticipation, expressedas the ratio of the risk for sudden cardiac death for acompetitive athlete with occult heart disease versus therisk for sudden cardiac death for athletes identified withheart disease and treated appropriately, varied widely.We calculated the baseline risk reduction directly fromthe findings of Corrado and colleagues (9) and modifiedthe risk reduction to account for expected differences inbaseline prevalence of predisposing underlying disease inU.S. versus Italian athletes, including a lower expectedprevalence of arrhythmogenic right ventricular cardio-myopathy and an increased frequency of premature cor-onary artery disease (1). This ratio was varied from 1,reflecting no effect of screening-based discovery of dis-ease, to 23, calculated as the maximum literature-derived rate of sudden cardiac death in athletes dividedby the minimum estimate of sudden cardiac death innonathletes after identification.
Table 1. Costs, Effectiveness Assumptions, and Test Characteristics*
Variable Base Case Low Estimate Low CI forSimulation
High CI forSimulation
High Estimate(Reference)
SCD risk per 100 000 person-yearsAthlete with heart disease 174 (9) 38 (5) 150 200 335 (1)Athlete with no heart disease 0.4 (9) 0.11 (5) 0.3 0.5 0.8†Athlete disqualified with heart disease 28 (9) 9† 16 50 174†Nonathlete with no heart disease 0.2 (9) 0.1† 0.18 0.22 0.8†Heart disease prevalence 1.2 (9) 0.3 (2) 1 1.4 2.5†
Test characteristicsSensitivity
H & P 15 (26) 3 (7, 27) 8 25 30 (28)ECG � H & P 68 (9, 26) 37 (29) 50 73 75 (8)
SpecificityH & P 97 (9, 28) 73 (30) 92 98 98 (23, 26, 31)ECG � H & P 95 (9, 32) 84 (29) 93 97 98 (26)
Costs, $Screening
H & P 73 (33)‡ 0 55 84 231§ECG 34 (33)‡ 5 30 58 304§
EvaluationCardiology visit 128 (33) 98 – – 275§Echocardiography 253 (33) 171 – – 1825§Stress test 135 (33) 85 – – 560§Cardiac MRI 1100 (33) 670 – – 2200Holter monitor 380 (33) 110 – – 740§Cardiac CT 560† 360 – – 1800Total cost 580† 330 400 780 3000§
Treatment for discovered heart diseaseCost (1st year) 5000†� 1000 4000 6000 15 000Cost per year (annual) 350† 50 250 450 1200
CT � computed tomography; ECG � 12-lead electrocardiography; H & P � cardiovascular-focused history and physical examination; MRI � magnetic resonance imaging;SCD � sudden cardiac death.* Numbers in parentheses are references.† Author consensus estimates.‡ Medicare reimbursement cost of $61 � $12 indirect cost for H & P and Medicare reimbursement cost of $27 � $7 indirect cost for ECG.§ Maximum estimates for costs of ECG, echocardiography, exercise testing, Holter monitor, and clinical facility use charges obtained by averaging charges from a randomsampling of 20 California hospitals’ chargemasters from 2007 (34).� Averaged over a population who underwent secondary testing and was found to have positive results, above baseline medical cost; each identified individual is modeled tohave 2 additional clinic visits, additional echocardiography, stress testing, and Holter monitor and either MRI or CT (average $2500 per individual); electrophysiology studyand ablation, cardiac surgery, or implantable cardioverter-defibrillator implantation (total 5% of identified individuals; distributed average $1500 per individual); andmedications, counseling, other clinic visits, and second opinions ($1500 per individual).
ArticleCost-Effectiveness of Electrocardiography Screening in Young Athletes
www.annals.org 2 March 2010 Annals of Internal Medicine Volume 152 • Number 5 279

Test CharacteristicsWe used the findings from 2 studies (9, 26) to derive
the test characteristics of cardiovascular-focused historyand physical examination (Table 1). History and physicalexamination characteristics may be substantially more orless sensitive (3% to 30%) and specific (73% to 98%) onthe basis of the thresholds used to determine a positive testresult (27, 28, 30, 39). We modeled ECG test characteris-tics on the basis of findings from longitudinal studies ofcompetitive athletes in Italy (8, 9, 40). Baseline test char-acteristics are similar to those found in screening of sec-ondary school-aged student-athletes in Nevada or England(26, 27) but have higher specificity than when ECG testingis applied to elite athletes or African-American athletes(41–46). Interpretation of ECG was assumed to followEuropean consensus document guidance with modifica-tions, which recommends secondary testing only with dis-tinctly abnormal ECG findings, including prolonged QT,bundle-branch block, deep ST-segment depression andT-wave inversion, and arrhythmias and excluding voltagecriteria for left ventricular hypertrophy and prolonged PRinterval (44, 47, 48). We evaluated a range of assumptionsfor the test characteristics of history and physical and ECGto account for substantial variability in the reported sensi-tivity and specificity of screening tests for undiagnosed car-diac disease in athletes.
UtilitiesWe used Health Utilities Index-Mark 3 scores (Ap-
pendix Table 1) derived from a cross-sectional populationsample (49) for adolescents of normal health (0.94) inwhom heart disease was discovered (0.89) in secondaryanalyses. We assumed that utility scores for athletes whowere disqualified from competition were equivalent tothose for adolescents with heart disease in the first year. We
discounted the decrement in utility linearly over 4 yearsfrom diagnosis; all patients had equivalent utility scoresfrom 5 years onward after receiving a diagnosis. Regardlessof secondary testing results, we ascribed athletes with apositive initial screening result a 5% decrement in qualityof life lasting 1 week versus adolescents with normal health.
Sensitivity AnalysesWe did sensitivity analyses to account for uncertainty
in model assumptions and to address variability in pub-lished clinical data. We did univariate sensitivity analysesover low and high absolute estimates and low and highestimates of the expected population median (Table 1 andAppendix Table 1). We varied risk ratios and test charac-teristics over the ranges derived from the screening litera-ture. We did Monte Carlo simulations, varying each inputover a distribution with the base case as the median and thelow and high estimates of the median representing the95% CI limits of two 1-sided normal distributions, withvalues limited to positive numbers (or values from 0 to 1for utilities or test characteristics) to evaluate the overallCIs of the model. We chose a random value from withinthis distribution for each variable, and we chose variablesthat were interdependent together.
Role of the Funding SourceThe Breetwor Foundation and the Stanford Cardio-
vascular Institute funded this study. Dr. Wheeler was sup-ported by a U.S. Public Health Service training grant fromthe National Heart, Lung, and Blood Institute, NationalInstitutes of Health. The funding sources had no role inthe design and conduct of the study; in the collection,analysis, and interpretation of the data; in the reporting,preparation, or review of the manuscript; or in the decisionto submit the manuscript for publication.
Table 2. Base-Case Analysis Comparing Methods of Cardiovascular Screening to Prevent SCD in Student-Athletes
Strategy AthletesRecommendedfor SecondaryTesting, n
Identified Athletesat Increased Riskfor SCD, n
Cases ofSCD inAthletes,n*
LYs Saved,undiscountedLYs
LYs Saved,discountedLYs†
LYs Saved per1000 Athletes,discountedLYs
Total IncrementalCost vs. Baseline,million $
Cost-effectiveness assuming baseline ofno screening
No screening 0 0 1100 0§ 0§ 0 0§H & P 117 000 6700 1010 5100 2060 0.56 410ECG � H & P 213 000 30 200 670 24 200 9700 2.62 736
Cost-effectiveness assuming baseline ofCV-focused H & P
ECG � H & P** 96 000 23 500 670 19 200 7630 2.06 327
ECG � 12-lead electrocardiography; H & P � cardiovascular-founded history and physical examination; ICER � incremental cost-effectiveness ratio; LY � life-year;SCD � sudden cardiac death.* Cumulative cases of SCD in athletes from age of screening to 35 years. Additional LYs are saved by treatment of discovered underlying heart disease.† Discount rate of 3% per annum applied to LYs and costs.‡ Probabilistic sensitivity analysis–based 95% CI.§ Average remaining life expectancy is 61.89 years; the average remaining discounted life expectancy is 27.3 years, and the total discounted lifetime medical cost for thescreened population is $388 billion.¶ Weak dominance occurs when a strategy is less costly and less effective and has a higher ICER than a more expensive strategy.** Assuming that H & P–based screening is included in baseline medical care.
Article Cost-Effectiveness of Electrocardiography Screening in Young Athletes
280 2 March 2010 Annals of Internal Medicine Volume 152 • Number 5 www.annals.org

RESULTS
Validation of the ModelThe base-case model compared outcomes for all U.S.
student-athletes undergoing 3 cardiovascular screening op-tions from age 16 years. Not screening athletes led to anaverage remaining life expectancy of 61.9 years in thosewithout underlying cardiac disease and 60.8 years in thosewith underlying heart disease (27.3 years and 26.9 years ona discounted basis, respectively). In addition, because ath-letes with underlying heart disease have a risk for subse-quent discovery of their condition through routine medicalcare, development of symptoms, or aborted sudden cardiacarrest, they have higher medical costs ($329 000 vs.$310 000 per person or $114 000 vs. $105 000 per personin current costs on a discounted basis). The total numberof sudden deaths in young athletes in the model over 8years of increased risk due to athletic activity averages 89per year, with a risk for sudden death of 2.4 per 100 000athletes per year. These numbers closely approximatethe average of 90 nontraumatic sudden cardiac deaths inyoung, competitive athletes per year in the UnitedStates (1).
Evaluation of Screening Methods Versus No ScreeningScreening with cardiovascular-focused history and
physical saved 0.56 life-year per 1000 athletes comparedwith no screening (Table 2). The per-athlete incrementalcost of history and physical versus no screening was $133or $111 on a discounted basis. We screened 3.7 millioncompetitive athletes in high-risk activity (Appendix Table1); we recommended an additional 117 000 athletes forsecondary testing and identified 6600 athletes at increasedrisk for sudden cardiac death. The total incremental costwas $410 million, assuming an optimized, cardiovascular-focused history and physical. The cost-effectiveness ratiofor history and physical versus no screening was $199 000per life-year saved on a discounted basis ($301 000 perquality-adjusted life-year [QALY] saved).
Screening with ECG and cardiovascular-focused his-tory and physical saved an average of 2.6 life-years per1000 athletes screened compared with no screening (Table
2). We recommended an additional 213 000 athletes forsecondary testing, and we identified 30 200 athletes at in-creased risk at a total incremental cost of $736 million.The incremental cost of screening with ECG plus historyand physical compared with no screening was $199 perathlete, including all secondary testing and treatment costs.The cost-effectiveness ratio of ECG plus history and phys-ical versus no screening was $76 100 per life-year saved.With utility adjustments, this increased to $111 000 perQALY saved.
Addition of ECG to History and Physical ExaminationFrom a health economics standpoint, our analyses in-
dicate that the strategy of using history and physical exam-ination to screen for sudden death should fall out ofconsideration by weak dominance (50). However, perfor-mance of a routine history and physical examination thatincludes components of cardiovascular history and physicalexamination may be considered part of the standard ofcare, independent of cardiovascular screening effects inyoung athletes. In this case, the history and physical exam-ination and associated subsequent costs may be consideredpart of the baseline medical costs of the health care system.To assess this approach, we evaluated the incremental ad-dition of 12-lead ECG to history and physical alone. Com-parison of ECG plus history and physical examination tocardiovascular-focused history and physical examinationalone saves 2.1 life-years per 1000 athletes screened at anincremental cost of $88 per athlete. At a cost of $327million, 96 000 additional athletes had secondary testing,and we identified 23 500 athletes potentially at risk. Theincremental cost-effectiveness ratio of adding ECG plushistory and physical examination versus history and phys-ical examination alone was $42 900 per life-year saved($61 600 per QALY saved).
One-Way Sensitivity AnalysesThe cost-effectiveness of screening was generally ro-
bust to changes of the input variables within ranges esti-mated for the population mean (Figure 2). For each of thecost and effectiveness inputs, variation within the rangesused for probabilistic sensitivity analyses resulted in ECGplus history and physical examination having an incremen-tal cost-effectiveness ratio of $50 000 to $100 000 perlife-year saved compared with no screening and of$25 000 to $60 000 per life-year saved compared withcardiovascular-focused history and physical examinationalone. In comparison with history and physical examina-tion alone, ECG plus history and physical examinationexceeded a cost-effectiveness ratio of $100 000 per life-yearsaved with low rates of sudden cardiac death in athletes,low population prevalence of disease, or low efficacy ofscreening. Varying the age at screening from 12 to 22 yearshad minimal effect on the cost-effectiveness of screening,although age may materially affect the sensitivity and spec-ificity of testing by ECG or history and physical examina-tion. Changes in the estimated sensitivity and specificity of
Table 2—Continued
Incremental Costper AthleteScreened,discounted $
ICER, 95% CI,discounted $/LYsaved‡
ICER, discounted$/LY saved
0 – –111 153 000–412 000 Weakly dominated¶199 62 400–130 000 76 100
89 21 200–71 300 42 100
ArticleCost-Effectiveness of Electrocardiography Screening in Young Athletes
www.annals.org 2 March 2010 Annals of Internal Medicine Volume 152 • Number 5 281

Figure 2. Univariate sensitivity analyses.
SCD risk: athlete with disease
Risk ratio: athlete vs. DQ
Years of increased risk
Age at screening
Discount rate
Prevalence
ECG + H & P sens/spec
ECG cost
ECG + H & P cost
Base H & P cost
Secondary testing cost
Initial treatment cost (1st year)
Maintenance treatment cost (annual)
All costs
335*
23†
15 y
12 y
0%
2.5%
68%/95%‡
$5
$5
$0
$330
$1000
$50
200*
9.4†
10 y
14 y
2.5%
1.4%
73%/94%
$25
$85
$55
$400
$4000
$250
Inputs
150*
4†
5 y
18 y
4%
1%
50%/97%
$65
$135
$84
$780
$6000
$450
38*
1.6†
3 y
22 y
7%
0.3%
75%/84%
$304
$535
$231
$3000
$15 000
$1200
SCD risk: athlete with disease
Risk ratio: athlete vs. DQ
Years of increased risk
Age at screening
Discount rate
Prevalence
ECG + H & P sens/spec
H & P sens/spec
ECG cost
ECG + H & P/H & P cost
H & P cost
Secondary testing cost
Initial treatment cost (1st year)
Maintenance treatment cost (annual)
All costs
335*
23†
15 y
12 y
0%
2.5%
75%/84%
30%73%§
$5
$5/$0
$0
$330
$1000
$50
200*
9.4†
10 y
14 y
2.5%
1.4%
73%/93%
25%/92%
$25
$85/$60
$55
$400
$4000
$250
Inputs
Base Case
Base Case
150*
4†
5 y
18 y
4%
1%
50%/97%
8%/98%
$65
$135/$80
$84
$780
$6000
$450
38*
1.6†
3 y
22 y
7%
0.3%
37%/98.5%
3%/98.7%
$304
$535/$231
$231
$3000
$15 000
$1200
Incremental Cost-Effectiveness Ratio:ECG + H & P vs. No Screening, discounted $/life-year saved
$0 $100 000 $200 000
Incremental Cost-Effectiveness Ratio:ECG + H & P vs. H & P alone, discounted $/life-year saved
$0 $100 000 $200 000
The incremental cost-effectiveness ratios (ICERs) of ECG � H & P versus no screening (top) and versus H & P alone (bottom) are shown as changed byvarying critical measurements through possible ranges. The base-case estimates (top [$76 100 per life-year saved] and bottom [$42 900 per life-yearsaved]) are shown (vertical lines). The horizontal solid boxes represent the ICER resulting from inputting the described variable over the expected rangeof the mean value (also used in probabilistic sensitivity analysis); the horizontal lines represent the ICER found using expected minimum and maximuminputs, which may be applicable to certain specific subgroups or particular payers. The table shows the low-value input, the low-value input used forprobabilistic sensitivity analysis, the high-value input used for probabilistic sensitivity analysis, and the high-value input for each variable or combinationof variables. In the bottom panel, the ICER between ECG � H & P and H & P alone is dependent not on H & P cost but on the interpretation ofH & P results before ECG interpretation. “Risk ratio: athlete versus DQ” is the mortality risk reduction associated with disqualification and treatmentof athletes with underlying occult heart disease versus continued participation without diagnosis. “ECG cost” is cost of ECG greater than H & P cost.All costs are all screening cost variables, including primary and secondary screening tests and initial and recurring screening-related treatment costs, inputinto the model concurrently. DQ � disqualified; ECG � 12-lead electrocardiography; H & P � cardiovascular-focused history and physical examina-tion; SCD � sudden cardiac death; sens/spec � sensitivity/specificity.* Per 100 000 life-years.† x-fold risk reduction.‡ Base-case assumption.§ ECG � H & P found to be both cost- and life-saving versus comparator.
Article Cost-Effectiveness of Electrocardiography Screening in Young Athletes
282 2 March 2010 Annals of Internal Medicine Volume 152 • Number 5 www.annals.org

the combination of ECG plus history and physical exami-nation resulted in comparatively small changes in the in-cremental cost-effectiveness ratio.
Lower effectiveness of disqualification resulting fromidentification of athletes with underlying cardiac disease(risk reduction, 33% vs. 84%) increased the incrementalcost-effectiveness ratio to more than $188 000 per life-yearsaved for ECG plus history and physical examination ver-sus no screening. An intermediate but more modest 50%sudden cardiac death risk reduction with treatment anddisqualification led to an incremental cost-effectiveness ra-tio for ECG plus history and physical examination of$119 000 versus no screening and $63 600 per life-yearsaved versus history and physical examination alone. In thebase-case analysis, we used conservative estimates for thechange in sudden death risk in athletes with underlyingheart disease. In a sensitivity analysis (Appendix Table 2,available at www.annals.org), we assumed a more substan-tial increase in risk for death with time. This reduced theincremental cost-effectiveness ratio of screening for ECGplus history and physical examination to $28 000 per life-year saved versus history and physical examination aloneand $46 000 per life-year saved versus no screening.
Some investigators have expressed concern about thepotentially prohibitive costs of initial and secondary test-ing. Varying the incremental cost of ECG from $5 to $304per athlete corresponds to an incremental cost-effectivenessratio of $28 900 to $174 000 per life-year saved for ECGversus history and physical examination alone. An incre-mental cost-effectiveness threshold for ECG screening of$100 000 per life-year saved for history and physical exam-ination alone corresponds to an incremental ECG cost overhistory and physical examination of $151. Varying the costof secondary testing from $330 to $3000 per athlete whohad a positive test result on initial screening changes thecost per life-year saved from $39 700 to $73 500 for ECGplus history and physical examination versus history andphysical examination alone.
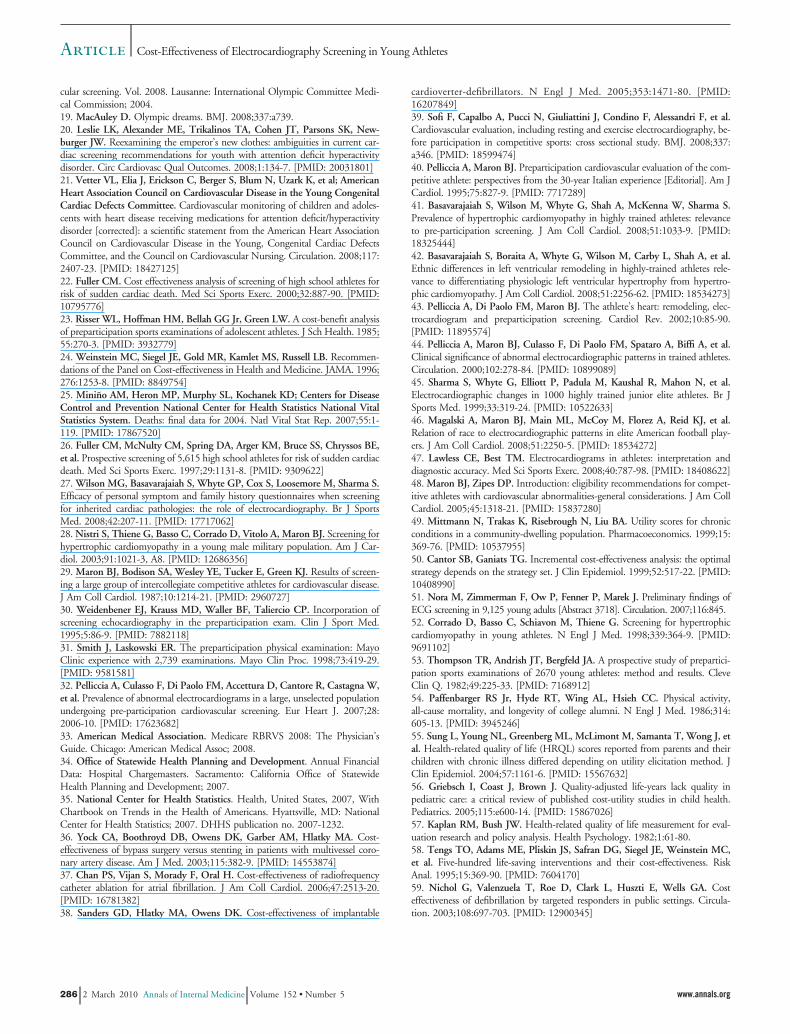
Probabilistic AnalysisA probabilistic analysis evaluating 10 000 iterations of
the model shows that addition of ECG was incrementallylife-saving in more than 99.8% of simulations versus his-tory and physical examination alone (Figure 3 and Appen-dix Table 3, available at www.annals.org). In 99.9% ofsimulations, ECG plus cardiovascular-focused history andphysical examination was less than the $100 000 per life-year saved cost-effectiveness threshold compared withcardiovascular-focused history and physical examinationalone. Compared with no screening, ECG plus history andphysical examination costs less than $100 000 per life-yearsaved in 79.9% of simulations. In contrast, history andphysical examination alone cost more than $100 000 perlife-year saved in all 10 000 simulations.
Figure 3. Probabilistic sensitivity analysis.
ECG � 12-lead electrocardiography; H & P � cardiovascular-focusedhistory and physical examination; ICER � incremental cost-effectivenessratio.Top. Scatterplot of simulation done for each of 3 base-case comparisons,varying each input variable over the expected range of the populationmedian. In nearly all simulations, H & P is weakly dominated by ECG �H & P because it is less costly, is less effective, and has a higher ICER.The ICERs can be measured by dividing the discounted life-years savedby the incremental discounted cost. Reference lines for ICERs of$50 000 per life-year saved and $100 000 per life-year saved are shown.Dots below each of these lines represent simulations, with ICERs shownbelow these willingness-to-pay thresholds. Bottom. Willingness-to-paycurves for comparisons between ECG � H & P and H & P, ECG � H &P and no screening, and H & P and no screening. Proportion of simulationsplotted versus ICER for each of 3 base-case comparisons are shown. Simu-lations that were not life-saving are included in the proportion of simulationsgreater than $300 000 per life-year saved. The probability of preferring ECG� H & P over H & P alone is 68% at a willingness-to-pay threshold of$50 000 per life-year saved and 99.9% at $100 000 per life-year saved.ECG � H & P is cost-effective and life-saving in 0.2% of simulations versusH & P alone. The probability of preferring ECG � H & P over no screen-ing is 0% at a willingness-to-pay threshold of $50 000 per life-year and79.9% at $100 000 per life-year. The probability of preferring H & P overno screening is 0% at $100 000 per life-year.
ArticleCost-Effectiveness of Electrocardiography Screening in Young Athletes
www.annals.org 2 March 2010 Annals of Internal Medicine Volume 152 • Number 5 283

Cost-Effectiveness of Other Screening MethodsIn exploratory analyses, we evaluated the cost-
effectiveness of screening by using assumptions for screen-ing methods in several recent published sources (9, 13, 27,44, 51, 52). We estimated screening test characteristics foreach method and estimated a screening cost for eachmethod (Appendix Table 4 and Appendix Figure 3, avail-able at www.annals.org). These data confirm that the spec-ificity of screening has a substantial effect on cost-effectiveness. Comparing these data with base cases showsthat on the basis of cost per life-year saved, screening ath-letes with ECG alone to detect cardiovascular disease maybe the preferred strategy, may cost less, and may detectmore at-risk individuals than history and physical exami-nation alone. Univariate and probabilistic sensitivity anal-yses (Appendix Figures 4 and 5, available at www.annals.org) suggest that screening with highly specific ECG alonemay be less than societal willingness-to-pay thresholds innearly all cases.
DISCUSSION
Preparticipation screening of student-athletes for car-diovascular disease using a single, appropriately interpretedECG and cardiovascular-focused history and physical ex-amination reduces sudden cardiac death and has an accept-able cost-effectiveness ratio of $76 000 per life-year saved,compared with a strategy of no screening. The addition ofECG to the current recommended standard of history andphysical examination also reduces sudden death, with anincremental cost-effectiveness ratio of $42 900 per life-year. Screening athletes with cardiovascular-focused his-tory and physical examination alone is unlikely to savemoney (�$199 000 per life-year added) compared with astrategy of no screening, mainly because of the strategy’srelatively poor sensitivity and specificity in young athletes(7, 26, 27, 30, 31, 53). Despite concerns about total cost,the incremental life-years saved by including ECG are sig-nificant. Of note, these results assume the use of a highthreshold for ECG positivity, which is critical to cost-effective implementation of ECG plus screening withcardiovascular-focused history and physical examination.Organized mass screenings of young athletes may improvethe efficiency of cardiovascular screening and improve itscost-effectiveness.
The epidemiology of sudden cardiac death in athletesdiffers between the United States and Italy, with U.S. ath-letes having hypertrophic cardiomyopathy more often andarrhythmogenic right ventricular cardiomyopathy occur-ring more in Italian athletes (1, 7–9, 40). Although thesedifferences may lead to lower efficacy of screening in theU.S. context, no studies have definitively addressed thisquestion (8, 9, 32, 40). Data from our study, includingthose modeling the effects of lower efficacy, should informthe appropriateness of undertaking a trial of sufficient mag-
nitude to determine the efficacy of screening U.S. student-athletes.
Of importance, our data are based on a single screen-ing per student-athlete engaged in interscholastic or inter-collegiate high-risk sports rather than annual screening,which is currently recommended by consensus documents(13, 17). Exploratory analyses (Appendix Figures 6 and 7and Appendix Table 5, available at www.annals.org) sug-gest that annual screening of any kind, or extending screen-ing to all middle school and high school students, is highlyunlikely to be cost-effective in reduction of sudden cardiacdeath. In the case of extending screening to a wider popu-lation of young people, a mixture of the strategies of noscreening and ECG with history and physical examinationwill be the most economically optimal, given any system-wide budget constraint. As with all screening strategies,limiting screening to a higher-risk subgroup will lead todifficult policy choices, and ethical concerns about inequal-ity and preferential treatment will arise. Student-athletesparticipating in interscholastic sports have been identifiedas a high-risk subgroup (1–6). Male sex; African-Americanethnicity; and participation in football, basketball, or elite-level or professional sports seem to be additional risk fac-tors for athlete-associated sudden death (5, 44–46).
Screening has potentially substantial effects that ex-tend beyond clearance for sports participation. Prepartici-pation history and physical examination may have ad-ditional benefits on injury reduction, general healthawareness, updating vaccination status, or modeling posi-tive lifelong health care interactions in young persons.These potential effects are not accounted for in the model.In addition, the long-term effects of early diagnosis andtreatment of high-risk diseases, as well as common diseases,such as hypertension and hyperlipidemia, are not well de-scribed or easily evaluated. Risk factor reduction or earlytreatment of such conditions as hypertension that do notwarrant exclusion from sports in the United States shouldbe weighed against the potential for harm associated withdisqualifying athletes at intermediate risk for sudden car-diac death. In addition, the benefit of college athletic par-ticipation in promoting lifelong physical activity is unam-biguous (54).
The validity of utility measurements in young adults isdebated, as adolescent and parental preferences and risktolerance are often at odds (55, 56). Although we includedquality-of-life measures in our secondary analyses, studiesthat inform personal, family, and community perspectiveson utility, with respect to participation, disqualification,and sudden cardiac death in young athletes, are needed.The effects of substantial decrements in utility caused bypositive primary screening or exclusion from athletic activityand treatment of underlying cardiac disease could easily offsetany life-saving benefits with quality-of-life decrements.
Consensus panels developed current ECG criteria andhave been repeatedly shown to restrict secondary testingfrom 2% to 9% of the screened population (17, 27, 40, 44,
Article Cost-Effectiveness of Electrocardiography Screening in Young Athletes
284 2 March 2010 Annals of Internal Medicine Volume 152 • Number 5 www.annals.org

45). Although this is acceptable in cost-effectiveness terms,improvements in specificity, as refinement of criteria overtime has shown (17, 27, 40, 44, 45), may be expected fromthe application of digital processing techniques to largedatabases of athlete ECG results to redefine the “normal”athlete ECG. Use of less stringent criteria to determinepositive screening by ECG or history and physical exami-nation or screening of selected populations (for example,elite cyclists or professional basketball players) may result insubstantially more referrals for secondary testing (30, 31, 53).
In conclusion, we show that preparticipation screeningof young athletes with ECG plus cardiovascular-focusedhistory and physical examination is reasonable in cost andis effective at saving lives. Screening with ECG can becost-effective compared with common benchmarks, such asdialysis for patients with chronic kidney disease ($20 000to $80 000 per QALY saved), or interventions, such aspublic access to defibrillation ($55 000 to $162 000 perQALY saved) or implantable cardioverter-defibrillator im-plantation ($34 000 to $70 000 per QALY saved), for pre-vention of sudden cardiac death (37, 57–59). Dedicatedcardiovascular screening with history and physical exami-nation is substantially more costly and marginally moreeffective than no screening. Sensitivity analyses show thatin nearly all cases, screening with ECG plus cardiovascular-focused history and physical examination is the preferredstrategy.
From Stanford University, Stanford, California, and Veterans AffairsPalo Alto Health Care System, Palo Alto, California.
Grant Support: From the Breetwor Foundation and the Stanford Car-diovascular Institute. Dr. Wheeler was supported by a U.S. PublicHealth Service training grant (5HL 07034) from the National Heart,Lung, and Blood Institute, National Institutes of Health.
Potential Conflicts of Interest: Disclosures can be viewed at www.acponline.org/authors/icmje/ConflictOfInterestForms.do?msNum�M08-2738.
Reproducible Research Statement: Study protocol, statistical code, anddata set: Available from Dr. Ashley (e-mail, [email protected]).
Requests for Single Reprints: Euan A. Ashley, MB ChB, DPhil, Divi-sion of Cardiovascular Medicine, Stanford University, 300 PasteurDrive, Falk Cardiovascular Research Building, Stanford, CA 94305;e-mail, [email protected].
Current author addresses and author contributions are available at www.annals.org.
References1. Maron BJ. Hypertrophic cardiomyopathy and other causes of sudden cardiacdeath in young competitive athletes, with considerations for preparticipationscreening and criteria for disqualification. Cardiol Clin. 2007;25:399-414, vi.[PMID: 17961794]2. Drezner JA, Chun JS, Harmon KG, Derminer L. Survival trends in theUnited States following exercise-related sudden cardiac arrest in the youth: 2000–2006. Heart Rhythm. 2008;5:794-9. [PMID: 18486566]
3. Corrado D, Basso C, Rizzoli G, Schiavon M, Thiene G. Does sports activityenhance the risk of sudden death in adolescents and young adults? J Am CollCardiol. 2003;42:1959-63. [PMID: 14662259]4. Thompson PD, Franklin BA, Balady GJ, Blair SN, Corrado D, Estes NA3rd, et al; American Heart Association Council on Nutrition, Physical Activity,and Metabolism. Exercise and acute cardiovascular events placing the risks intoperspective: a scientific statement from the American Heart Association Councilon Nutrition, Physical Activity, and Metabolism and the Council on ClinicalCardiology. Circulation. 2007;115:2358-68. [PMID: 17468391]5. Van Camp SP, Bloor CM, Mueller FO, Cantu RC, Olson HG. Nontrau-matic sports death in high school and college athletes. Med Sci Sports Exerc.1995;27:641-7. [PMID: 7674867]6. Tanaka Y, Yoshinaga M, Anan R, Tanaka Y, Nomura Y, Oku S, et al.Usefulness and cost effectiveness of cardiovascular screening of young adolescents.Med Sci Sports Exerc. 2006;38:2-6. [PMID: 16394946]7. Maron BJ, Shirani J, Poliac LC, Mathenge R, Roberts WC, Mueller FO.Sudden death in young competitive athletes. Clinical, demographic, and patho-logical profiles. JAMA. 1996;276:199-204. [PMID: 8667563]8. Pelliccia A, Di Paolo FM, Corrado D, Buccolieri C, Quattrini FM, PisicchioC, et al. Evidence for efficacy of the Italian national pre-participation screeningprogramme for identification of hypertrophic cardiomyopathy in competitiveathletes. Eur Heart J. 2006;27:2196-200. [PMID: 16831826]9. Corrado D, Basso C, Pavei A, Michieli P, Schiavon M, Thiene G. Trends insudden cardiovascular death in young competitive athletes after implementationof a preparticipation screening program. JAMA. 2006;296:1593-601. [PMID:17018804]10. Myerburg RJ, Vetter VL. Electrocardiograms should be included in prepar-ticipation screening of athletes. Circulation. 2007;116:2616-26; discussion 2626.[PMID: 18040041]11. Chaitman BR. An electrocardiogram should not be included in routinepreparticipation screening of young athletes. Circulation. 2007;116:2610-4; dis-cussion 2615. [PMID: 18040040]12. Maron BJ, Douglas PS, Graham TP, Nishimura RA, Thompson PD. TaskForce 1: preparticipation screening and diagnosis of cardiovascular disease inathletes. J Am Coll Cardiol. 2005;45:1322-6. [PMID: 15837281]13. Maron BJ, Thompson PD, Ackerman MJ, Balady G, Berger S, Cohen D,et al; American Heart Association Council on Nutrition, Physical Activity, andMetabolism. Recommendations and considerations related to preparticipationscreening for cardiovascular abnormalities in competitive athletes: 2007 update: ascientific statement from the American Heart Association Council on Nutrition,Physical Activity, and Metabolism: endorsed by the American College of Cardi-ology Foundation. Circulation. 2007;115:1643-455. [PMID: 17353433]14. Maron BJ, Thompson PD, Puffer JC, McGrew CA, Strong WB, DouglasPS, et al. Cardiovascular preparticipation screening of competitive athletes. Astatement for health professionals from the Sudden Death Committee (clinicalcardiology) and Congenital Cardiac Defects Committee (cardiovascular disease inthe young), American Heart Association. Circulation. 1996;94:850-6. [PMID:8772711]15. Maron BJ, Thompson PD, Puffer JC, McGrew CA, Strong WB, DouglasPS, et al. Cardiovascular preparticipation screening of competitive athletes: ad-dendum: an addendum to a statement for health professionals from the SuddenDeath Committee (Council on Clinical Cardiology) and the Congenital CardiacDefects Committee (Council on Cardiovascular Disease in the Young), AmericanHeart Association. Circulation. 1998;97:2294. [PMID: 9631885]16. Italian Ministry of Health. Decree of the Italian Ministry of Health, 18February 1982. Norme per la tutela sanitaria dell’attivita sportiva agnostica [Rulesconcerning the medical protection of athletic activity]. Gazzetta Ufficiale. 1982;5March:63.17. Corrado D, Pelliccia A, Bjørnstad HH, Vanhees L, Biffi A, Borjesson M, etal; Study Group of Sport Cardiology of the Working Group of Cardiac Reha-bilitation and Exercise Physiology and the Working Group of Myocardial andPericardial Diseases of the European Society of Cardiology. Cardiovascular pre-participation screening of young competitive athletes for prevention of suddendeath: proposal for a common European protocol. Consensus Statement of theStudy Group of Sport Cardiology of the Working Group of Cardiac Rehabilita-tion and Exercise Physiology and the Working Group of Myocardial and Peri-cardial Diseases of the European Society of Cardiology. Eur Heart J. 2005;26:516-24. [PMID: 15689345]18. International Olympic Committee Medical Commission. Sudden cardio-vascular death in sport. Lausanne recommendations: preparticipation cardiovas-
ArticleCost-Effectiveness of Electrocardiography Screening in Young Athletes
www.annals.org 2 March 2010 Annals of Internal Medicine Volume 152 • Number 5 285
cular screening. Vol. 2008. Lausanne: International Olympic Committee Medi-cal Commission; 2004.19. MacAuley D. Olympic dreams. BMJ. 2008;337:a739.20. Leslie LK, Alexander ME, Trikalinos TA, Cohen JT, Parsons SK, New-burger JW. Reexamining the emperor’s new clothes: ambiguities in current car-diac screening recommendations for youth with attention deficit hyperactivitydisorder. Circ Cardiovasc Qual Outcomes. 2008;1:134-7. [PMID: 20031801]21. Vetter VL, Elia J, Erickson C, Berger S, Blum N, Uzark K, et al; AmericanHeart Association Council on Cardiovascular Disease in the Young CongenitalCardiac Defects Committee. Cardiovascular monitoring of children and adoles-cents with heart disease receiving medications for attention deficit/hyperactivitydisorder [corrected]: a scientific statement from the American Heart AssociationCouncil on Cardiovascular Disease in the Young, Congenital Cardiac DefectsCommittee, and the Council on Cardiovascular Nursing. Circulation. 2008;117:2407-23. [PMID: 18427125]22. Fuller CM. Cost effectiveness analysis of screening of high school athletes forrisk of sudden cardiac death. Med Sci Sports Exerc. 2000;32:887-90. [PMID:10795776]23. Risser WL, Hoffman HM, Bellah GG Jr, Green LW. A cost-benefit analysisof preparticipation sports examinations of adolescent athletes. J Sch Health. 1985;55:270-3. [PMID: 3932779]24. Weinstein MC, Siegel JE, Gold MR, Kamlet MS, Russell LB. Recommen-dations of the Panel on Cost-effectiveness in Health and Medicine. JAMA. 1996;276:1253-8. [PMID: 8849754]25. Minino AM, Heron MP, Murphy SL, Kochanek KD; Centers for DiseaseControl and Prevention National Center for Health Statistics National VitalStatistics System. Deaths: final data for 2004. Natl Vital Stat Rep. 2007;55:1-119. [PMID: 17867520]26. Fuller CM, McNulty CM, Spring DA, Arger KM, Bruce SS, Chryssos BE,et al. Prospective screening of 5,615 high school athletes for risk of sudden cardiacdeath. Med Sci Sports Exerc. 1997;29:1131-8. [PMID: 9309622]27. Wilson MG, Basavarajaiah S, Whyte GP, Cox S, Loosemore M, Sharma S.Efficacy of personal symptom and family history questionnaires when screeningfor inherited cardiac pathologies: the role of electrocardiography. Br J SportsMed. 2008;42:207-11. [PMID: 17717062]28. Nistri S, Thiene G, Basso C, Corrado D, Vitolo A, Maron BJ. Screening forhypertrophic cardiomyopathy in a young male military population. Am J Car-diol. 2003;91:1021-3, A8. [PMID: 12686356]29. Maron BJ, Bodison SA, Wesley YE, Tucker E, Green KJ. Results of screen-ing a large group of intercollegiate competitive athletes for cardiovascular disease.J Am Coll Cardiol. 1987;10:1214-21. [PMID: 2960727]30. Weidenbener EJ, Krauss MD, Waller BF, Taliercio CP. Incorporation ofscreening echocardiography in the preparticipation exam. Clin J Sport Med.1995;5:86-9. [PMID: 7882118]31. Smith J, Laskowski ER. The preparticipation physical examination: MayoClinic experience with 2,739 examinations. Mayo Clin Proc. 1998;73:419-29.[PMID: 9581581]32. Pelliccia A, Culasso F, Di Paolo FM, Accettura D, Cantore R, Castagna W,et al. Prevalence of abnormal electrocardiograms in a large, unselected populationundergoing pre-participation cardiovascular screening. Eur Heart J. 2007;28:2006-10. [PMID: 17623682]33. American Medical Association. Medicare RBRVS 2008: The Physician’sGuide. Chicago: American Medical Assoc; 2008.34. Office of Statewide Health Planning and Development. Annual FinancialData: Hospital Chargemasters. Sacramento: California Office of StatewideHealth Planning and Development; 2007.35. National Center for Health Statistics. Health, United States, 2007, WithChartbook on Trends in the Health of Americans. Hyattsville, MD: NationalCenter for Health Statistics; 2007. DHHS publication no. 2007-1232.36. Yock CA, Boothroyd DB, Owens DK, Garber AM, Hlatky MA. Cost-effectiveness of bypass surgery versus stenting in patients with multivessel coro-nary artery disease. Am J Med. 2003;115:382-9. [PMID: 14553874]37. Chan PS, Vijan S, Morady F, Oral H. Cost-effectiveness of radiofrequencycatheter ablation for atrial fibrillation. J Am Coll Cardiol. 2006;47:2513-20.[PMID: 16781382]38. Sanders GD, Hlatky MA, Owens DK. Cost-effectiveness of implantable
cardioverter-defibrillators. N Engl J Med. 2005;353:1471-80. [PMID:16207849]39. Sofi F, Capalbo A, Pucci N, Giuliattini J, Condino F, Alessandri F, et al.Cardiovascular evaluation, including resting and exercise electrocardiography, be-fore participation in competitive sports: cross sectional study. BMJ. 2008;337:a346. [PMID: 18599474]40. Pelliccia A, Maron BJ. Preparticipation cardiovascular evaluation of the com-petitive athlete: perspectives from the 30-year Italian experience [Editorial]. Am JCardiol. 1995;75:827-9. [PMID: 7717289]41. Basavarajaiah S, Wilson M, Whyte G, Shah A, McKenna W, Sharma S.Prevalence of hypertrophic cardiomyopathy in highly trained athletes: relevanceto pre-participation screening. J Am Coll Cardiol. 2008;51:1033-9. [PMID:18325444]42. Basavarajaiah S, Boraita A, Whyte G, Wilson M, Carby L, Shah A, et al.Ethnic differences in left ventricular remodeling in highly-trained athletes rele-vance to differentiating physiologic left ventricular hypertrophy from hypertro-phic cardiomyopathy. J Am Coll Cardiol. 2008;51:2256-62. [PMID: 18534273]43. Pelliccia A, Di Paolo FM, Maron BJ. The athlete’s heart: remodeling, elec-trocardiogram and preparticipation screening. Cardiol Rev. 2002;10:85-90.[PMID: 11895574]44. Pelliccia A, Maron BJ, Culasso F, Di Paolo FM, Spataro A, Biffi A, et al.Clinical significance of abnormal electrocardiographic patterns in trained athletes.Circulation. 2000;102:278-84. [PMID: 10899089]45. Sharma S, Whyte G, Elliott P, Padula M, Kaushal R, Mahon N, et al.Electrocardiographic changes in 1000 highly trained junior elite athletes. Br JSports Med. 1999;33:319-24. [PMID: 10522633]46. Magalski A, Maron BJ, Main ML, McCoy M, Florez A, Reid KJ, et al.Relation of race to electrocardiographic patterns in elite American football play-ers. J Am Coll Cardiol. 2008;51:2250-5. [PMID: 18534272]47. Lawless CE, Best TM. Electrocardiograms in athletes: interpretation anddiagnostic accuracy. Med Sci Sports Exerc. 2008;40:787-98. [PMID: 18408622]48. Maron BJ, Zipes DP. Introduction: eligibility recommendations for compet-itive athletes with cardiovascular abnormalities-general considerations. J Am CollCardiol. 2005;45:1318-21. [PMID: 15837280]49. Mittmann N, Trakas K, Risebrough N, Liu BA. Utility scores for chronicconditions in a community-dwelling population. Pharmacoeconomics. 1999;15:369-76. [PMID: 10537955]50. Cantor SB, Ganiats TG. Incremental cost-effectiveness analysis: the optimalstrategy depends on the strategy set. J Clin Epidemiol. 1999;52:517-22. [PMID:10408990]51. Nora M, Zimmerman F, Ow P, Fenner P, Marek J. Preliminary findings ofECG screening in 9,125 young adults [Abstract 3718]. Circulation. 2007;116:845.52. Corrado D, Basso C, Schiavon M, Thiene G. Screening for hypertrophiccardiomyopathy in young athletes. N Engl J Med. 1998;339:364-9. [PMID:9691102]53. Thompson TR, Andrish JT, Bergfeld JA. A prospective study of prepartici-pation sports examinations of 2670 young athletes: method and results. CleveClin Q. 1982;49:225-33. [PMID: 7168912]54. Paffenbarger RS Jr, Hyde RT, Wing AL, Hsieh CC. Physical activity,all-cause mortality, and longevity of college alumni. N Engl J Med. 1986;314:605-13. [PMID: 3945246]55. Sung L, Young NL, Greenberg ML, McLimont M, Samanta T, Wong J, etal. Health-related quality of life (HRQL) scores reported from parents and theirchildren with chronic illness differed depending on utility elicitation method. JClin Epidemiol. 2004;57:1161-6. [PMID: 15567632]56. Griebsch I, Coast J, Brown J. Quality-adjusted life-years lack quality inpediatric care: a critical review of published cost-utility studies in child health.Pediatrics. 2005;115:e600-14. [PMID: 15867026]57. Kaplan RM, Bush JW. Health-related quality of life measurement for eval-uation research and policy analysis. Health Psychology. 1982;1:61-80.58. Tengs TO, Adams ME, Pliskin JS, Safran DG, Siegel JE, Weinstein MC,et al. Five-hundred life-saving interventions and their cost-effectiveness. RiskAnal. 1995;15:369-90. [PMID: 7604170]59. Nichol G, Valenzuela T, Roe D, Clark L, Huszti E, Wells GA. Costeffectiveness of defibrillation by targeted responders in public settings. Circula-tion. 2003;108:697-703. [PMID: 12900345]
Article Cost-Effectiveness of Electrocardiography Screening in Young Athletes
286 2 March 2010 Annals of Internal Medicine Volume 152 • Number 5 www.annals.org

Current Author Addresses: Drs. Wheeler and Ashley: Division of Car-diovascular Medicine, Stanford University School of Medicine, 300 Pas-teur Drive, Falk Cardiovascular Research Building, Stanford, CA 94305-5406.Dr. Hlatky: Department of Health Research and Policy, Stanford Uni-versity School of Medicine, Redwood Building, T150A, Stanford, CA94305-5405.Drs. Froelicher and Heidenreich: Veterans Affairs Palo Alto HealthcareSystem, 3801 Miranda Avenue, Palo Alto, CA 94304.
Author Contributions: Conception and design: M.T. Wheeler, P.A.Heidenreich, V.F. Froelicher, M.A. Hlatky, E.A. Ashley.Analysis and interpretation of the data: M.T. Wheeler, P.A. Heidenreich,V.F. Froelicher, M.A. Hlatky, E.A. Ashley.Drafting of the article: M.T. Wheeler, M.A. Hlatky.Critical revision of the article for important intellectual content: M.T.Wheeler, P.A. Heidenreich, V.F. Froelicher, M.A. Hlatky, E.A. Ashley.Final approval of the article: P.A. Heidenreich, V.F. Froelicher, M.A.Hlatky, E.A. Ashley.Statistical expertise: M.T. Wheeler.Collection and assembly of data: M.T. Wheeler.
60. Gold MR, Siegel JE, Russell LB, Weinstein MC. Cost-Effectiveness inHealth and Medicine. New York: Oxford Univ Pr; 1996.61. Maron BJ, Gardin JM, Flack JM, Gidding SS, Kurosaki TT, Bild DE.Prevalence of hypertrophic cardiomyopathy in a general population of youngadults. Echocardiographic analysis of 4111 subjects in the CARDIA Study. Cor-onary Artery Risk Development in (Young) Adults. Circulation. 1995;92:785-9.[PMID: 7641357]62. Arola A, Jokinen E, Ruuskanen O, Saraste M, Pesonen E, KuuselaAL, et al. Epidemiology of idiopathic cardiomyopathies in children andadolescents. A nationwide study in Finland. Am J Epidemiol. 1997;146:385-93. [PMID: 9290498]63. Agnarsson UT, Hardarson T, Hallgrimsson J, Sigfusson N. The prevalenceof hypertrophic cardiomyopathy in men: an echocardiographic populationscreening study with a review of death records. J Intern Med. 1992;232:499-506.[PMID: 1474350]64. Davis JA, Cecchin F, Jones TK, Portman MA. Major coronary artery anom-alies in a pediatric population: incidence and clinical importance. J Am CollCardiol. 2001;37:593-7. [PMID: 11216984]65. Pelliccia A, Spataro A, Maron BJ. Prospective echocardiographic screeningfor coronary artery anomalies in 1,360 elite competitive athletes. Am J Cardiol.1993;72:978-9. [PMID: 8213561]66. Yamanaka O, Hobbs RE. Coronary artery anomalies in 126,595 patientsundergoing coronary arteriography. Cathet Cardiovasc Diagn. 1990;21:28-40.[PMID: 2208265]67. Pelliccia A, Maron BJ, Spataro A, Proschan MA, Spirito P. The upper limitof physiologic cardiac hypertrophy in highly trained elite athletes. N Engl J Med.1991;324:295-301. [PMID: 1824720]68. Kyto V, Saraste A, Voipio-Pulkki LM, Saukko P. Incidence of fatal myo-carditis: a population-based study in Finland. Am J Epidemiol. 2007;165:570-4.[PMID: 17237135]69. Gemayel C, Pelliccia A, Thompson PD. Arrhythmogenic right ven-tricular cardiomyopathy. J Am Coll Cardiol. 2001;38:1773-81. [PMID:11738273]70. Joseph A, Ackerman D, Talley JD, Johnstone J, Kupersmith J. Manifesta-tions of coronary atherosclerosis in young trauma victims—an autopsy study. JAm Coll Cardiol. 1993;22:459-67. [PMID: 8335815]
71. Lipshultz SE, Sleeper LA, Towbin JA, Lowe AM, Orav EJ, Cox GF, et al.The incidence of pediatric cardiomyopathy in two regions of the United States. NEngl J Med. 2003;348:1647-55. [PMID: 12711739]72. Miura K, Nakagawa H, Morikawa Y, Sasayama S, Matsumori A, HasegawaK, et al. Epidemiology of idiopathic cardiomyopathy in Japan: results from anationwide survey. Heart. 2002;87:126-30. [PMID: 11796547]73. Bar-Dayan Y, Elishkevits K, Goldstein L, Goldberg A, Ohana N, Onn E, etal. The prevalence of common cardiovascular diseases among 17-year-old Israeliconscripts. Cardiology. 2005;104:6-9. [PMID: 15942176]74. Quaglini S, Rognoni C, Spazzolini C, Priori SG, Mannarino S, SchwartzPJ. Cost-effectiveness of neonatal ECG screening for the long QT syndrome. EurHeart J. 2006;27:1824-32. [PMID: 16840497]75. Blangy H, Sadoul N, Coutelour JM, Rebmann JP, Joseph M, Scherrer C,et al. [Prevalence of Brugada syndrome among 35,309 inhabitants of Lorrainescreened at a preventive medicine centre]. Arch Mal Coeur Vaiss. 2005;98:175-80. [PMID: 15816318]76. Gallagher MM, Forleo GB, Behr ER, Magliano G, De Luca L, Morgia V,et al. Prevalence and significance of Brugada-type ECG in 12,012 apparentlyhealthy European subjects. Int J Cardiol. 2008;130:44-8. [PMID: 18054807]77. Oe H, Takagi M, Tanaka A, Namba M, Nishibori Y, Nishida Y, et al.Prevalence and clinical course of the juveniles with Brugada-type ECG inJapanese population. Pacing Clin Electrophysiol. 2005;28:549-54. [PMID:15955188]78. Junttila MJ, Raatikainen MJ, Karjalainen J, Kauma H, Kesaniemi YA,Huikuri HV. Prevalence and prognosis of subjects with Brugada-type ECG pat-tern in a young and middle-aged Finnish population. Eur Heart J. 2004;25:874-8. [PMID: 15140536]79. Vidaillet HJ Jr, Pressley JC, Henke E, Harrell FE Jr, German LD. Familialoccurrence of accessory atrioventricular pathways (preexcitation syndrome). NEngl J Med. 1987;317:65-9. [PMID: 3587328]80. Krahn AD, Manfreda J, Tate RB, Mathewson FA, Cuddy TE. The naturalhistory of electrocardiographic preexcitation in men. The Manitoba Follow-upStudy. Ann Intern Med. 1992;116:456-60. [PMID: 1739235]81. Hyduk A, Croft JB, Ayala C, Zheng K, Zheng ZJ, Mensah GA. Pulmonaryhypertension surveillance—United States, 1980-2002. MMWR Surveill Summ.2005;54:1-28. [PMID: 16280974]82. Rich S, Dantzker DR, Ayres SM, Bergofsky EH, Brundage BH, Detre KM,et al. Primary pulmonary hypertension. A national prospective study. Ann InternMed. 1987;107:216-23. [PMID: 3605900]83. Milewicz DM, Dietz HC, Miller DC. Treatment of aortic disease in patientswith Marfan syndrome. Circulation. 2005;111:e150-7. [PMID: 15781745]84. Pyeritz RE, McKusick VA. The Marfan syndrome: diagnosis and manage-ment. N Engl J Med. 1979;300:772-7. [PMID: 370588]85. Fixler DE, Pastor P, Chamberlin M, Sigman E, Eifler CW. Trends incongenital heart disease in Dallas County births. 1971-1984. Circulation. 1990;81:137-42. [PMID: 2297821]86. Fyler D. Report of the New England Regional Infant Cardiac Program[Abstract]. Pediatrics. 1980;65:377-461.87. National Federation of State High School Associations. 2006-07 HighSchool Athletics Participation Survey. vol. 2008; 2008. Indianapolis: NationalFederation of State High School Associations.88. National Collegiate Athletics Association. 1981-82 to 2004-05 NCAASports Sponsorship and Participation Rates Report. vol. 2008. Indianapolis: Na-tional Collegiate Athletics Association; 2007.89. Minino AM, Heron MP, Murphy SL, Kochanek KD; Centers for DiseaseControl and Prevention National Center for Health Statistics National VitalStatistics System. Deaths: final data for 2004. Natl Vital Stat Rep. 2007;55:1-119. [PMID: 17867520]90. U.S. Census Bureau. Annual Estimates of the Resident Population by Sexand Selected Age Groups for the United States: 1 April 2000 to 1 July 2008.Washington, DC: U.S. Census Bureau; 2009.
Annals of Internal Medicine
W-80 2 March 2010 Annals of Internal Medicine Volume 152 • Number 5 www.annals.org

Appendix Figure 1. Characteristics of the unscreened student-athlete population.
Underlying Potentially Detectable Cardiovascular Disease
Left ventricular hypertrophy
Mitral valve prolapse
Bicuspid aortic valve
The Wolff–Parkinson–White syndrome
Anomalous coronary arteries
Hypertrophic cardiomyopathy
Premature coronary artery disease
The Brugada syndrome
Mitral stenosis
Dilated cardiomyopathy
Coarctation
The Marfan syndrome
Long QT
Arrhythmogenic right ventricular cardiomyopathy
Aortic aneurysm
Myocarditis
Pulmonary hypertension
0 10 000 20 000 30 000 40 000 50 000 60 000 70 000
Student-Athletes Potentially at Increased Risk, n
63 000
48 000
9300
7400
7400
7400
3700
2220
2200
1900
930
740
740
740
370
370
11
Student-athletes who harbor cardiac abnormalities have a potential increased risk for sudden cardiac death. The shaded bars represent the athletesexpected to have underlying cardiac abnormalities participating in at-risk athletic activities. An estimate of the total number of student-athletes in at-riskactivities is 3.7 million. Mitral valve prolapse and left ventricular hypertrophy do not carry similar risk for early death compared with other findings inthe population.
www.annals.org 2 March 2010 Annals of Internal Medicine Volume 152 • Number 5 W-81

Appendix Figure 2. Expected prevalence and risk for sudden cardiac death per year in young athletes.
Cardiac disease
Left ventricular hypertrophy
Mitral valve prolapse
Bicuspid aortic valve
Anomalous coronary arteries
The Wolff–Parkinson–White syndrome
Hypertrophic cardiomyopathy
Premature CAD
The Brugada syndrome
Mitral stenosis
Dilated cardiomyopathy
Myocarditis
Coarctation
The Marfan syndrome
Long QT
ARVC
Aortic aneurysm
0 0.2 0.80.60.4 1.0 1.2 1.4 1.6 1.8Prevalence in Young Adults, %
Cardiac disease
ARVC
Hypertrophic cardiomyopathy
Myocarditis
Anomalous coronary arteries
Aortic aneurysm
Coarctation
Long QT
The Marfan syndrome
Dilated cardiomyopathy
Premature CAD
The Brugada syndrome
Bicuspid aortic valve
The Wolff–Parkinson–White syndrome
Left ventricular hypertrophy
Mitral valve prolapse
0.0 0.1 0.30.2 0.4 0.5 0.6
Risk for Sudden Cardiac Death per Athlete-Year, %
ARVC � arrhythmogenic right ventricular cardiomyopathy; CAD � coronary artery disease. Top. Expected frequencies of student-athletes who harborunderlying cardiac abnormalities were calculated from figures for total student-athlete participants and prevalence of cardiac abnormalities in samples ofadolescent and young adult populations (see Appendix Table 1 for references). The number of athletes at risk was then divided by the number of athletesfound to have sudden cardiac death in registry data (13) to generate an estimated yearly risk for sudden cardiac death by underlying diagnosis. Bottom.Many athletes who harbor potential causes of sudden cardiac death have comparatively low risk versus others. Sudden deaths in the left ventricularhypertrophy group are assumed to be due to subclinical forms of hypertrophic cardiomyopathy; those from mitral valve prolapse may be due tomechanical or arrhythmic causes.
W-82 2 March 2010 Annals of Internal Medicine Volume 152 • Number 5 www.annals.org

Appendix Table 1. Model Baseline Cost, Utility, and Disease Prevalence Assumptions*
Variable Base Case(Reference)
Low Estimate(Reference)
Low CI forSimulation
High CI forSimulation
High Estimate(Reference)
Baseline medical cost per year by age, $6–17 y 1285 (35) 1000 1100 1400 160018–44 y 2631 (35) 2200 2500 2800 300045–64 y 5224 (35) 4400 5100 5300 6000�65 y 8906 (35) 7800 8500 9500 10 000
UtilitiesAthlete 0.94 (49) 0.87 0.93 0.95 1.00Secondary screening at 1 y 0.939† 0.87 0.929 0.949 1.00Nonathlete 0.94† 0.87 0.93 0.95 1.00Heart disease (newly diagnosed) 0.89 (49) 0.76 0.85 0.93 1.00Heart disease (4 y onward after diagnosis) 0.94† 0.76 0.93 0.95 1.00False negative (disease not discovered) 0.94† 0.90 0.93 0.95 1.00
Test characteristics of ECG aloneSensitivity, % 40 10 (27) 25 45 65Specificity, % 98 61.5 (27)‡ 95.2 98.8 99Cost, $ 34 5 25 65 304
MiscellaneousMaximum life span, y 100† – – – –Age at screening, y 16† 12 14 18 22Years of extra risk 8† 3 5 10 15Annual discount rate 0.03 (60) 0.00 0.025 0.04 0.07Annual probability of heart disease discovery in
primary testing false-negative group0.01†§ 0.001 0.008 0.012 0.075
Athletes screened, n� 3 700 000¶ 1 000 000 2 000 000 5 000 000 20 000 000
Prevalence, %Hypertrophic cardiomyopathy 0.2 (61) 0.003 (62) – – 0.3 (63)Anomalous coronary anatomy 0.2 (64) 0.05 (65) – – 1.3 (66)Left ventricular hypertrophy 1.7 (67) 1 – – 8 (43)Myocarditis 0.05 (68) 0.0015 (68) – – 0.1Aortic aneurysm 0.01* 0.005 – – 0.13 (30)Arrhythmogenic right ventricular cardiomyopathy 0.02 (69) 0.01 – – 0.05Premature coronary artery disease 0.1 (70) 0.005 – – 5 (70)Dilated cardiomyopathy 0.05 (71) 0.003 (62) – – 0.2 (72)Mitral stenosis 0.06 (73) 0.03 – – 0.1Long QT syndrome 0.02 (74) 0.01 – – 0.06Mitral valve prolapse 1.3 (30) 0.34 (73) – – 5 (29)The Brugada syndrome 0.06 (75, 76) 0.02 (77) – – 0.6 (78)The Wolff–Parkinson–White syndrome 0.2 (79, 80) 0.05 – – 0.4Pulmonary arterial hypertension 0.0003 (81) 0.0001 (82) – – 0.003The Marfan syndrome 0.02 (83) 0.005 (84) – – 0.03 (83)Coarctation 0.025 (85) 0.017 (86) – – 0.04Bicuspid aortic valve 0.25 (73) 0.1 – – 0.5
ECG � 12-lead electrocardiography.* Numbers in parentheses are references.† Author consensus estimates.‡ ECG alone using mildly abnormal ECG findings as positive initial screening (44).§ Disease discovery when primary testing yields false-negative results in base case is 10-fold more frequent than in the secondary testing false-negative group because the lattergroup will be less likely to have readily discoverable disease if disease is not demonstrated on secondary testing. However, a substantial proportion of individuals withunderlying disease in the primary testing false-negative group have disease easily discovered by echocardiography or other imaging technologies.� Not included in probabilistic sensitivity analyses. Probability distributions for probabilistic sensitivity analyses were defined with the base case as the median input and thelow and high estimates of the median set as the 95% CIs of two 1-sided normal distributions, with all values limited to positive numbers (or values of 0 to 1 for utilities andtest characteristics).¶ Based on the number of sports participants in high-risk sports divided by the average number of sports per athlete for high school and college athletes (5, 87, 88).
www.annals.org 2 March 2010 Annals of Internal Medicine Volume 152 • Number 5 W-83

Appendix Table 2. Cost-Effectiveness Ratios Using Relative Risk as Multipliers of the Baseline Risk for Death*
Screening Method AthletesRecommendedfor SecondaryTesting, n
IdentifiedAthletes atIncreasedRisk forSCD, n
Cases ofSCD inAthletes,n*
Life-YearsSaved,discountedlife-years
Life-YearsSaved per1000Athletes,discountedlife-years
TotalIncrementalCost vs. NoScreening,discountedmillions $
DiscountedCost perAthlete, $
ICER ComparedWith NoScreening,$/life-yearsaved
ICER Comparedwith Next LeastExpensiveNondominatedStrategy,$/life-yearsaved
Quality-AdjustedICER, discounted$/QALY saved
No screening – – 1070 – – – – – Least expensive –ECG alone 73 100 17 700 818 10 200 2.8 328 89 32 200 32 200 40 300H & P 110 000 6700 980 3730 1 422 114 113 000 Dominated DominatedECG � H & P 180 000 30 200 650 17 250 1.90 794 215 46 000 65 500 83 600
ECG � 12-lead electrocardiography; H & P � cardiovascular-focused history and physical examination; HR � hazard ratio; ICER � incremental cost-effectiveness ratio;QALY � quality-adjusted life-year; SCD � sudden cardiac death.* In the base case, conservative estimates were used for the propagation of risk associated with underlying heart disease discovered through screening, by reducing the risk fordeath to that of the background population after age 35 years. In this sensitivity analysis, the ratio of the risk for death due to underlying heart disease to without underlyingheart disease as a multiplier compared with the baseline, actuarial yearly risk for death. In this analysis, as participants with underlying heart disease age in the model, theirrisk for SCD becomes substantially larger than that of unaffected contemporaries or that of persons in the base-case model.The multiplicative model assumes that having underlying heart disease increases the relative risk for death above baseline throughout the individual’s lifetime. HRs weremultiplied by the baseline actuarial rate of death at each age until age 99 years for individuals without heart disease (HR, 0.997), with undiscovered heart disease (HR, 1.61),and with discovered heart disease (HR, 1.30). These ratios are derived from the ratio of the risk for SCD in nonathletes with occult cardiovascular abnormalities or diagnosedcardiovascular disease (9) to the incidence of any cause of death at age 24 years (89) (at completion of competitive athletic activity for most individuals). The average lifeexpectancy for athletes with heart disease in this model is age 56.8 years from the time of screening versus age 61.93 years for those without underlying heart disease.
Appendix Table 3. Probabilistic Sensitivity Analysis
BaselineVariable
Comparator Simulation 95% CI,Comparator orFalse-Positive TestResults, n*
Simulation 95% CI,ComparatorTrue-Positive TestResults, n*
Mean TotalIncrementalCost per10 000Simulations,million $
Mean Simulation(Median), ICER,$/life-year saved
Simulation (95% CI),ICER, $/life-yearsaved*
MedianSimulation, ICER,$/QALY†
Simulation (95% CI),ICER, $/QALY*
No screening ECG 44 300–172 000 10 800–21 500 319 65 100 (62 100) 43 900–102 100 94 600 24 400; dominated‡No screening H & P 74 400–290 100 3500–11 300 433 241 000 (223 000) 153 000–412 000 381 000 85 300 QALY; dominated‡No screening ECG � H & P 112 000–255 000 21 400–35 700 733 87 600 (84 700) 62 400–130 000 130 000 58 800 QALY; dominated‡H & P ECG 44 300–172 000 10 800–21 500 Cost-saving§ Cost-effective and
life-savingCost-effective and
life-saving: 1520Cost-effective and
QALY savingCost-effective and QALY
saving; dominated‡H & P ECG � H & P 112 000–255 000 21 400–35 700 302 45 700 (45 200) 21 200–71 300 66 200 15 300; dominated‡ECG ECG � H & P 112 000–255 000 21 400–35 700 414 122 000 (117 000) 79 600–233 200 190 000 44 200; dominated‡
ECG � 12-lead electrocardiography; H & P � cardiovascular-focused history and physical examination; ICER � incremental cost-effectiveness ratio; QALY � quality-adjusted life-year.* Simulations were run as pairwise comparisons, ignoring dominance and weak dominance.† Simulation median given as mean was not meaningful because of proportion of QALY costing simulations.‡ Because of the significant effect of changes in utilities varied over the estimated range, ICERs for each method were dominated versus all strategies with a decrease in QALYin a substantial fraction of simulations. Comparator was found to result in net negative QALY for screening in 24% of simulations (ECG alone vs. no screening), 28%of simulations (H & P vs. no screening), 21% of simulations (ECG alone vs. H & P), 25% of simulations (ECG � H & P vs. ECG alone), 25% of simulations (ECG �H & P vs. no screening), and 23% of simulations (ECG � H & P vs. H & P).§ Screening with ECG versus H & P alone saves $115 million.
W-84 2 March 2010 Annals of Internal Medicine Volume 152 • Number 5 www.annals.org

App
endi
xT
able
4.C
ompa
riso
nof
Cos
t-Ef
fect
iven
ess
ofD
iffe
rent
Scre
enin
gM
etho
dsfo
rR
educ
ing
Sudd
enD
eath
inY
oung
Ath
lete
s*
Scre
enin
gM
etho
dSe
nsit
ivit
y,%
Spec
ific
ity,
%R
efer
ence
Cri
teri
aFa
lse-
Posi
tive
Res
ult,
n
Iden
tifi
edas
Hig
hR
isk
at1
y,n†
LYs
Save
dpe
r10
00A
thle
tes
Dis
coun
ted
LYs
Save
dpe
r10
00A
thle
tes
Tota
lC
ost,
mill
ion
$
Cos
tpe
rA
thle
te,
$
Dis
coun
ted
Cos
tpe
rA
thle
te,
$
Dis
coun
ted
Cos
tpe
rLY
Save
d,$
Dis
coun
ted
Cos
tpe
rQ
ALY
Save
d,$
Incr
emen
tal
Cos
tpe
rA
thle
te,
$†
Incr
emen
tal
LYs
Save
dpe
r10
00A
thle
tes
ICER
Com
pare
dW
ith
Nex
tLe
ast
Expe
nsiv
e,N
ondo
min
ated
Stra
tegy
All
met
hods
No
scre
enin
g0
100
––
––
––
0–
––
––
–Le
ast
expe
nsiv
eFH
597
.127
Une
xpla
ined
deat
hin
youn
gfa
mily
mem
ber
106
000
2200
0.40
0.16
166
6545
274
900
559
000
––
Wea
kly
dom
inat
ed
ECG
alon
e25
98.8
27EC
Gab
norm
al43
900
1110
02.
430.
9723
074
6264
000
9230
0–
–W
eakl
ydo
min
ated
ECG
alon
e40
98.0
51EC
Gab
norm
al73
100
1776
03.
891.
5529
510
080
5140
074
200
801.
55$5
140
0EC
Gal
one
4595
.244
Mar
kedl
yab
norm
alel
iteat
hlet
es17
550
019
980
4.29
1.72
402
148
109
6340
094
000
––
Wea
kly
dom
inat
ed
H&
P15
97.0
–Ba
seca
se10
970
066
601.
390.
5641
013
311
119
920
031
000
0–
–D
omin
ated
ECG
�hi
stor
y25
97.5
27A
bnor
mal
ECG
,se
rious
sym
ptom
s,or
FH91
400
1110
02.
390.
9654
416
814
715
390
022
800
0–
–D
omin
ated
ECG
alon
e55
89.7
44D
istin
ctly
abno
rmal
,el
iteat
hlet
es37
650
024
400
5.10
2.05
614
243
166
8110
012
500
0–
–W
eakl
ydo
min
ated
ECG
�H
&P
6895
.0Ba
seca
se18
280
030
200
6.56
2.62
737
244
199
7610
011
100
0–
–W
eakl
ydo
min
ated
ECG
�H
&P
7393
.152
ECG
orpo
sitiv
eH
&P
252
200
3240
07.
002.
7981
527
822
078
800
116
000
––
Wea
kly
dom
inat
edEC
G�
H&
P34
84.7
26EC
Gor
posi
tive
hist
ory
559
300
1510
02.
861.
1610
0137
727
023
250
042
500
0–
–D
omin
ated
ECG
�H
&P
9084
.913
ECG
�H
&P
552
000
3996
08.
413.
3710
1839
027
581
600
125
000
195
1.82
107
000
FH5
70.1
27A
nyhe
art
dise
ase
infa
mily
mem
ber
109
300
022
00�
0.49
�0.
1410
8048
929
2N
etlif
eco
stin
gD
omin
ated
––
Dom
inat
ed
ECG
alon
e75
61.5
44M
ildly
abno
rmal
,el
iteat
hlet
es1
407
000
3330
06.
162.
5116
2170
443
817
440
033
500
0–
–D
omin
ated
ECG
alon
e85
35.0
27Is
olat
edLV
Hby
Soko
low
–Lyo
ncr
iteria
237
600
037
700
6.28
2.60
2545
1129
688
264
200
655
000
––
Dom
inat
ed
Incr
emen
tal
Effe
ctiv
enes
s(L
Ys
Save
dpe
r10
00A
thle
tes)
H&
Pas
base
line
com
para
tor
H&
P15
97.0
–Ba
seca
se–
––
––
––
––
––
–EC
G�
hist
ory
2597
.527
Abn
orm
alEC
G,
serio
ussy
mpt
oms,
orFH
�18
278
4440
1.01
0.40
134
–36
9080
012
500
0–
–W
eakl
ydo
min
ated
ECG
�H
&P
6895
–Ba
seca
se73
112
2353
25.
182.
0632
8–
8942
900
6160
089
2.06
4290
0EC
G�
H&
P73
93.1
52EC
Gor
posi
tive
H&
P14
256
825
752
5.61
2.24
405
–10
948
900
7110
0–
–W
eakl
ydo
min
ated
ECG
�H
&P
3484
.726
ECG
orpo
sitiv
ehi
stor
y44
963
984
361.
480.
6159
1–
160
263
000
571
000
––
Dom
inat
edEC
G�
H&
P90
84.9
13EC
G�
H&
P44
232
733
300
7.02
2.81
607
–16
458
356
310
000
750.
7510
100
0
EC
G�
12-l
ead
elec
troc
ardi
ogra
phy;
FH�
fam
ilyhi
stor
y;H
&P
�ca
rdio
vasc
ular
-foc
used
hist
ory
and
phys
ical
exam
inat
ion;
ICE
R�
incr
emen
tal
cost
-eff
ecti
vene
ssra
tio;
LVH
�le
ftve
ntri
cula
rhy
pert
roph
y;LY
�lif
e-ye
ar;
QA
LY�
qual
ity-
adju
sted
life-
year
.*
The
valid
ity
ofco
mpa
riso
nam
ong
stra
tegi
esm
aybe
limit
edbe
caus
eth
ete
stch
arac
teri
stic
sde
rive
dor
esti
mat
edfr
omth
eci
ted
publ
icat
ions
may
not
befu
llyap
plic
able
toth
epo
pula
tion
used
for
the
mod
elno
rre
prod
ucib
lein
wid
ecl
inic
alpr
acti
ce.
†C
ost
vers
usne
xtle
ast
expe
nsiv
e,no
ndom
inat
edst
rate
gy.D
omin
ated
stra
tegi
esar
eth
ose
that
are
mor
eex
pens
ive
and
less
effe
ctiv
eth
anle
ssex
pens
ive
stra
tegi
es.W
eakl
ydo
min
ated
stra
tegi
esar
eth
ose
that
are
incr
emen
tally
less
cost
-eff
ecti
vepe
rLY
save
dth
anm
ore
cost
lyst
rate
gies
,su
chth
ata
com
bina
tion
ofth
em
ore
expe
nsiv
ean
dle
ssex
pens
ive
nond
omin
ated
stra
tegi
esw
ould
bepr
efer
able
tous
eof
the
wea
kly
dom
inat
edst
rate
gy.
www.annals.org 2 March 2010 Annals of Internal Medicine Volume 152 • Number 5 W-85

Appendix Figure 3. Cost-effectiveness of screening athletes to prevent sudden cardiac death.
Incr
emen
tal C
ost,
dis
coun
ted
$/at
hlet
e sc
reen
ed
Incremental Gain in Life-Years, life-year saved/athlete screened
ECG + H & P
ECG alone
H & P
FH
Estimated sensitivity, specificitycriteria (reference)
$100 000/life-year
$50 000/life-year
85%, 35%LVH by Sokolow–Lyon criteria (27)
75%, 61.5%mildly abnormal (44)
34.7%, 84.7%(26)
90%, 84.9%(13)
73%, 93.1%(52)
68%, 95%(base case)
55%, 89.7%distinctly abnormal (44)
45%, 95.2%markedly abnormal (44)
40%, 98%(51)
25%, 98.8%ECG (27)
25%, 97.5%ECG + history (27)
5%, 70.1%any FH heart disease (27)
15%, 97%(base case)
5%, 97.1%death in young
family member (27)
*
*
0 0.0005–0.0005 0.001 0.0015 0.002 0.0025 0.003 0.0035
0
100
200
300
400
500
600
700
Data reported with each symbol are the estimated sensitivity and specificity, as well as criteria (reference). Evaluation of different screening methods andtest characteristics derived from the athlete-screening literature. Test methods and reported test results were used as inputs in the model and comparedwith a strategy of no screening. The discounted incremental life-years gained per 1000 athletes screened are plotted against the cost per athlete screenedfor each method. The incremental cost-effectiveness ratio, screening method, and threshold for a positive test result are shown together with the referencefrom which test characteristic estimates were derived. Because of significant heterogeneity between the populations studied and methods used in thestudies compared, the test characteristics derived from each study may not be entirely applicable to the screened population described for the base case.In addition, the methods of FH, H, and H & P are not uniform across the studies referenced. References from which input estimates have been derivedare shown in parentheses. Details of incremental cost-effectiveness ratio versus no screening for each study and comparison with a baseline of H & P forthose including history can be found in Appendix Table 4. Estimated test sensitivity and specificity for each graphed incremental cost-effectiveness ratiois shown and is derived from references in parentheses. Incremental cost-effectiveness ratios versus no screening and test sensitivity and specificity are asfollows: cost-effectiveness ratio, $51 400 (sensitivity 40%, specificity 98%), $63 400 (45%, 95.2%), $64 000 (25%, 98.8%), $76 100 (68%, 95%),$78 800 (73%, 93.1%), $81 000 (55%, 89.7%), $81 600 (90%, 84.9%), $153 900 (25%, 97.5%), $174 000 (75%, 61.5%), $199 200 (15%, 97%),$232 500 (34%, 84.7%), $264 000 (85%, 35%), and $275 000 (5%, 97.1%); life costing (5%, 70.1%). ECG � 12-lead electrocardiography; FH �family history; H & P � cardiovascular-focused history and physical examination; LVH � left ventricular hypertrophy.
W-86 2 March 2010 Annals of Internal Medicine Volume 152 • Number 5 www.annals.org

Appendix Figure 4. Univariate sensitivity analyses for ECG strategies.
SCD risk: athlete with disease
Risk ratio: athlete vs. DQ
Years of increased risk
Age at screening
Discount rate
Prevalence
ECG alone sens/spec
ECG cost
Secondary testing cost
Initial treatment cost
Maintenance treatment cost
All costs
335*
23†
15 y
12 y
0%
2.5%
40%/98%‡
$5
$330
$1000
$50
200*
9.4†
10 y
14 y
2.5%
1.4%
45%/95.2%
$25
$400
$4000
$250
Inputs
150*
4†
5 y
18 y
4%
1%
25%/98.8%
$65
$780
$6000
$450
38*
1.6†
3 y
22 y
7%
0.3%
65%/61.5%
$304
$3000
$15 000
$1200
SCD risk: athlete with disease
Risk ratio: athlete vs. DQ
Years of increased risk
Age at screening
Discount rate
Prevalence
ECG + H & P sens/spec
ECG alone sens/spec
ECG + H & P cost
Base H & P cost
Secondary testing cost
Initial treatment cost (1st year)
Maintenance treatment cost (annual)
All costs
335*
23†
15 y
12 y
0%
2.5%
68%/95%
10%/99%
$5
$0
$330
$1000
$50
200*
9.4†
10 y
14 y
2.5%
1.4%
73%/93%
25%/98.8%
$85
$55
$400
$4000
$250
Inputs
Base Case
Base Case
150*
4†
5 y
18 y
4%
1%
75%/84%
45%/95.2%
$135
$84
$780
$6000
$450
38*
1.6†
3 y
22 y
7%
0.3%
50%/97%
40%/98%
$535
$231
$3000
$15 000
$1200
Incremental Cost-Effectiveness Ratio:ECG Alone vs. No Screening, discounted $/life-year saved
$0 $100 000 $200 000
Incremental Cost-Effectiveness Ratio:ECG + H & P vs. ECG alone, discounted $/life-year saved
$0 $100 000 $200 000 $300 000
The incremental cost-effectiveness ratios (ICERs) of ECG alone versus no screening (top) and versus ECG � H & P (bottom) are shown. The ECG �H & P versus ECG alone strategies were compared by varying critical measurements through possible ranges. The comparison of ECG alone versusH & P alone is not shown because the ECG alone strategy is dominant (costs less and is more effective) in all cases except when ECG specificity is low,the cost of ECG is more than $65, and the cost of H & P is less than $42. Vertical lines show the base-case estimates. Horizontal solid boxes representthe ICER resulting from inputting the described variable over the expected range of the mean value (also used in probabilistic sensitivity analysis).Horizontal lines represent the ICER found using expected minimum and maximum inputs, which may be applicable to specific subgroups or particularpayers. The table shows low-value input, the low-value input used for probabilistic sensitivity analysis, the high-value input used for probabilisticsensitivity analysis, and the high-value input for each variable or combination of variables. “Risk ratio: athlete vs. DQ” represents the ratio of riskreduction associated with disqualification and treatment of athletes with underlying occult heart disease. DQ � disqualified; ECG � 12-lead electro-cardiography; H & P � cardiovascular-focused history and physical examination; SCD � sudden cardiac death; sens/spec � sensitivity/specificity.* Per 100 000 life-years.† x-fold risk reduction.‡ Base-case assumption.
www.annals.org 2 March 2010 Annals of Internal Medicine Volume 152 • Number 5 W-87

Appendix Figure 5. Probabilistic sensitivity analysis resultsevaluating screening athletes using ECG alone versus otherscreening methods.
ECG � 12-lead electrocardiography; H & P � cardiovascular-focusedhistory and physical examination; ICER � incremental cost-effectivenessratio.Top. Scatter plot of life-saving versus incremental increase in cost foreach of 10 000 Monte Carlo simulations randomly varying each variableover estimated ranges (see Table 1 and Appendix Table 1 for inputs).ECG alone has sensitivity of 40% and specificity of 98%, based on datafrom Nora and colleagues (51) together with estimate of prevalence ofscreened athletes potentially at risk (Appendix Table 1). Lines represent-ing the willingness-to-pay threshold ICERs of $50 000 per life-year and$100 000 per life-year are shown for comparison. Simulations with neg-ative incremental cost are cost-saving versus the comparator. Averagevalues and CIs for incremental cost-effectiveness ratios based on proba-bilistic simulations are shown in Appendix Table 3. Bottom. Cost-effectiveness acceptability curve, showing the proportion of simulationsless than the ICER at given values in discounted dollars per discountedlife-years saved. The probability of preferring ECG alone to no screeningis 12.6% at a willingness-to-pay threshold of $50 000 per life-year and97% at $100 000 per life-year. ECG alone is cost-effective and life-saving in more than 93.6% of simulations vs. H & P alone and less than$50 000 per life-year saved in more than 99.9% of simulations.
Appendix Figure 6. Effect of repeated testing on screeningcost-effectiveness.
Incr
emen
tal C
ost-
Effe
ctiv
enes
s R
atio
, dis
coun
ted
$/at
hlet
e sa
ved
Tests per Athlete During Career, n
ECG + H & P
H & P
0 1 2 3 4 5 6 7 8
0
100 000
200 000
300 000
400 000
500 000
600 000
700 000
800 000
900 000
1 000 000
Because the primary analysis assumes a single episode of screening, yetcurrent recommendation statements advise yearly or biannual screening,the effects of repeated screening for each methodology in terms of changein cost-effectiveness were modeled. Yearly screening costs (screening testplus secondary testing costs) are assumed to recur with each additionalyear of screening, as an upper bound of cost of screening (see AppendixTable 5 for more information). More conservative estimates about thecost of repeated screening in reduction of repeated secondary testingcosts may lead to costs intermediate between those shown and the base-case estimate. Efficacy was assumed to be independent of the numberof tests, although the veracity of this assumption is not well known.Cardiovascular-focused ECG � 12-lead electrocardiography; H & P �history and physical examination.
W-88 2 March 2010 Annals of Internal Medicine Volume 152 • Number 5 www.annals.org

Appendix Figure 7. Sensitivity analysis of cost-effectivenessof screening as a function of total students and student-athletes potentially at risk for sudden cardiac death.
Incr
emen
tal C
ost-
Effe
ctiv
enes
s R
atio
, dis
coun
ted
$/at
hlet
e sc
reen
ed
Students Screened, million n
ECG + H & P
CV-focused H & P
0 2 4 6 8 10 12 14 16 18 20 22 24 26
0
100 000
200 000
300 000
400 000
500 000
600 000
700 000
800 000
900 000
1 000 000
Incr
emen
tal C
ost-
Effe
ctiv
enes
s R
atio
, dis
coun
ted
$/at
hlet
e sc
reen
ed
Students Screened, million n0 2 4 6 8 10 12 14 16 18 20 22 24 26
0
100 000
200 000
300 000
400 000
500 000
600 000
700 000
800 000
900 000
1 000 000
Assuming a constant number of athletic sudden cardiac deaths. ECG �12-lead electrocardiography; H & P � cardiovascular-focused historyand physical examination.Top. Sensitivity analysis examining total number of athletes at risk versuscost-effectiveness ratio for ECG � H & P or H & P, compared with noscreening. The total number of sudden cardiac deaths in athletes wasassumed to be independent of the number screened for this analysis;however, nonathletic death and background nonsudden cardiac deathremained constant on a per-individual basis for each risk group. A totalof 26 million students is the middle school– and high school–aged pop-ulation in the United States (90). Ten million students is the estimatedtotal school-aged population participating in any sports. A total of 3.7million students (base case) is the estimated high school– and college-aged population participating in high-intensity, interscholastic and inter-collegiate sports. Bottom. The sensitivity analysis examining the totalnumber of athletes at risk versus the incremental cost-effectiveness ratioassuming underlying at-risk heart disease prevalence of 0.1%, with pro-portionally higher yearly incidence of death in the high-risk subgroup,modeled after the risk estimates in reference 13.
www.annals.org 2 March 2010 Annals of Internal Medicine Volume 152 • Number 5 W-89

App
endi
xT
able
5.C
ompa
riso
nof
Scre
enin
gM
etho
dsA
ssum
ing
36th
Bet
hesd
aC
onfe
renc
eor
Bas
e-C
ase
Mea
sure
men
ts*
Scre
enin
gM
etho
dC
ompa
rato
rSe
nsit
ivit
y,%
Spec
ific
ity,
%To
tal
Incr
emen
tal
Cos
t,di
scou
nted
mill
ion
$
Incr
emen
tal
Cos
tpe
rA
thle
te,
nond
isco
unte
d$
Incr
emen
tal
Dis
coun
ted
Cos
tpe
rA
thle
te,
$
LYs
Save
dpe
r10
00A
thle
tes
Dis
coun
ted
LYs
Save
dpe
r10
00A
thle
tes
ICER
,di
scou
nted
$/LY
save
d
Fals
e-Po
siti
veTe
stR
esul
ts,
n
Iden
tifi
edas
Hig
hR
isk
at1
y,n†
Stat
emen
tas
sum
ptio
ns,
10m
illio
nsc
reen
ed,
sing
lesc
reen
ing
per
athl
ete
H&
P(b
ase
case
)N
osc
reen
ing
1597
970
108
970.
290.
1375
700
0‡29
970
015
00EC
G�
H&
P(b
ase
case
)N
osc
reen
ing
6895
1510
174
151
2.02
0.83
183
000
499
500
6800
ECG
�H
&P
(13)
No
scre
enin
g90
8519
6025
219
61.
970.
8523
000
0‡1
498
500
9000
Bas
e-ca
seas
sum
ptio
ns3.
7m
illio
nsc
reen
ed,
year
lysc
reen
ing
per
athl
ete,
recu
rrin
gfo
llow
-up
test
ing
cost
sY
early
H&
PN
osc
reen
ing
1597
2780
862
751
1.39
0.56
135
000
0‡88
000
066
00Y
early
ECG
�H
&P
No
scre
enin
g68
9543
8013
6611
846.
562.
6245
210
01
464
000
3020
0
Stat
emen
tas
sum
ptio
ns,
10m
illio
nsc
reen
ed,
year
lysc
reen
ing
per
athl
ete,
recu
rrin
gfo
llow
-up
test
ing
cost
sY
early
H&
PN
osc
reen
ing
1597
7320
831
732
0.29
0.13
571
700
0‡2
397
600
1500
Yea
rlyEC
G�
H&
PN
osc
reen
ing
9085
1330
015
4913
341.
970.
851
563
000
1198
800
090
00
Bas
e-ca
seas
sum
ptio
ns,
3.7
mill
ion
scre
ened
,ye
arly
scre
enin
gpe
rat
hlet
e,no
recu
rrin
gfo
llow
-up
test
ing
cost
sY
early
H&
PN
osc
reen
ing
1597
2300
717
623
1.39
0.56
112
100
0‡88
000
066
00Y
early
ECG
�H
&P
No
scre
enin
g68
9535
0011
0095
06.
562.
6236
300
01
464
000
3020
0
Stat
emen
tas
sum
ptio
ns,
10m
illio
nsc
reen
ed,
year
lysc
reen
ing
per
athl
ete,
nore
curr
ing
follo
w-u
pte
stin
gco
sts
Yea
rlyH
&P
No
scre
enin
g15
9760
9069
260
90.
290.
134
760
000‡
239
760
015
00Y
early
ECG
�H
&P
No
scre
enin
g90
8572
3085
372
31.
970.
8585
000
011
988
000
9000
W-90 2 March 2010 Annals of Internal Medicine Volume 152 • Number 5 www.annals.org

App
endi
xT
able
5—C
onti
nued
Scre
enin
gM
etho
dC
ompa
rato
rSe
nsit
ivit
y,%
Spec
ific
ity,
%To
tal
Incr
emen
tal
Cos
t,di
scou
nted
mill
ions
$
Incr
emen
tal
LYs
Save
dpe
r10
00A
thle
tes
Incr
emen
tal
Dis
coun
ted
LYs
Save
dpe
r10
00A
thle
tes
Incr
emen
tal
Cos
tpe
rA
thle
te,
nond
isco
unte
d$
Incr
emen
tal
Dis
coun
ted
Cos
tpe
rA
thle
te,
$
Dif
fere
nce
inD
isco
unte
d$
per
LYSa
ved
(Scr
eeni
ngM
etho
dvs
.C
ompa
rato
r),
$
Dif
fere
nce
inFa
lse-
Posi
tive
Test
Res
ults
,n
Dif
fere
nce
inPe
rson
sId
enti
fied
asH
igh
Ris
kat
1y,
n†
Stat
emen
tas
sum
ptio
ns,
10m
illio
nsc
reen
ed,
sing
lesc
reen
ing
per
athl
ete
ECG
�H
&P
(13)
H&
P(b
ase
case
)90
8599
01.
690.
7314
499
136
400
119
880
075
00
Bas
e-ca
seas
sum
ptio
ns,
3.7
mill
ion
scre
ened
,ye
arly
scre
enin
gpe
rat
hlet
e,re
curr
ing
follo
w-u
pte
stin
gco
sts
Yea
rlyEC
G�
H&
PY
early
H&
P68
9516
002.
182.
0650
443
321
000
058
400
023
600
Stat
emen
tas
sum
ptio
ns,
10m
illio
nsc
reen
ed,
year
lysc
reen
ing
per
athl
ete,
recu
rrin
gfo
llow
-up
test
ing
cost
sY
early
ECG
�H
&P
Yea
rlyH
&P
6895
3760
1.73
0.69
434
376
539
300
159
840
053
00Y
early
ECG
�H
&P
Yea
rlyH
&P
9085
6030
1.69
0.73
718
603
830
700
959
040
075
00
Bas
e-ca
seas
sum
ptio
ns,
3.7
mill
ion
scre
ened
,ye
arly
scre
enin
gpe
rat
hlet
e,no
recu
rrin
gfo
llow
-up
test
ing
cost
sY
early
ECG
�H
&P
Yea
rlyH
&P
6895
1210
2.18
2.06
383
327
158
600
584
000
2360
0
Stat
emen
tas
sum
ptio
ns,
10m
illio
nsc
reen
ed,
year
lysc
reen
ing
per
athl
ete,
nore
curr
ing
follo
w-u
pte
stin
gco
sts
Yea
rlyEC
G�
H&
PY
early
H&
P90
8511
401.
690.
7316
111
415
740
01
598
400
7500
Yea
rlyEC
G�
H&
PY
early
H&
P68
9529
301.
730.
6933
929
342
000
0‡9
590
400
5300
EC
G�
12-l
ead
elec
troc
ardi
ogra
phy;
H&
P�
card
iova
scul
ar-f
ocus
edhi
stor
yan
dph
ysic
alex
amin
atio
n;IC
ER
�in
crem
enta
lco
st-e
ffec
tive
ness
rati
o;LY
�lif
e-ye
ar.
*C
ompa
red
wit
hba
selin
eof
H&
P.E
ffec
tsof
seve
ral
test
s,re
peat
edfo
llow
-up
test
ing,
and
scre
ened
popu
lati
onsi
ze.
†N
umbe
rof
athl
etes
who
rece
ived
scre
enin
gan
dw
ere
foun
dto
have
high
risk
.In
year
lysc
reen
ing
anal
yses
,on
lyat
hlet
esid
enti
fied
at1
yw
ere
incl
uded
.‡
Dom
inat
edst
rate
gy.
www.annals.org 2 March 2010 Annals of Internal Medicine Volume 152 • Number 5 W-91