Democratic and Popular Republic of Algeria
106
Re-port No. 12534-At Democratic and Popular Republic of Algeria Rteview of Agricultural Policies and Agricultural Services 1 987-1 993 December 29,1t994 Natural Resources and EnvironmentDivision Maghreb and Iran Department Middle East and North Africa Regional Office w. X ~~~~~~~~~~~~~~~~~~~~~~~~~~~~~~~~~~~~~~~~~~~~~~~~~~~~~~~~~~...X v > f a _ w o S rA \ ¢~~~., c, ' ,' .i S*'; }44<<_j, ,,'2-,4' 3~~ MIRGRPIS - ; yetSC 254A Public Disclosure Authorized Public Disclosure Authorized Public Disclosure Authorized Public Disclosure Authorized Public Disclosure Authorized Public Disclosure Authorized Public Disclosure Authorized Public Disclosure Authorized
-
Upload
khangminh22 -
Category
Documents
-
view
1 -
download
0
Transcript of Democratic and Popular Republic of Algeria

Re-port No. 12534-At
Democratic and Popular Republic of AlgeriaRteview of Agricultural Policies and Agricultural Services1 987-1 993
December 29,1t994
Natural Resources and Environment DivisionMaghreb and Iran DepartmentMiddle East and North Africa Regional Office
w. X
~~~~~~~~~~~~~~~~~~~~~~~~~~~~~~~~~~~~~~~~~~~~~~~~~~~~~~~~~~...X
v > f a _ w o S rA \ ¢~~~., c, ' , ' .i
S*'; }44<<_j, ,,'2-,4'
3~~ MIRGRPIS -
; yetSC 254A
Pub
lic D
iscl
osur
e A
utho
rized
Pub
lic D
iscl
osur
e A
utho
rized
Pub
lic D
iscl
osur
e A
utho
rized
Pub
lic D
iscl
osur
e A
utho
rized
Pub
lic D
iscl
osur
e A
utho
rized
Pub
lic D
iscl
osur
e A
utho
rized
Pub
lic D
iscl
osur
e A
utho
rized
Pub
lic D
iscl
osur
e A
utho
rized

DEMOCRATIC AND POPULAR REPUBLIC OF ALGERIA
REVIEW OF AGRICULTURAL POLICIES AND AGRICULTURAL SERVICES1987 - 1993
CURRENCY EQUIVALENTS
Currency Unit = Algerian Dinar (DA)
Official Exchange Rate (DA per US$)
Period End of Period Period Average
1988 6.731 5.9151989 9.032 7.6091990 12.191 8.9581991 21.392 18.4731992 22.781 21.8361993 24.120 23.345April 1994 36.000
FISCAL YEAR
January 1 - December 31
WEIGHTS AND MEASURES
Metric System

ABDREVIAT!ONS AND ACRONYMS
Al Artificial InseminationASMIDAL Entreprise Nationale des Engrais et de Produits Phytosaitaires (National Enterprise for the
Production of Fertilizers and Plant Protection Chemicals)AVN Autonte vetennaire nationale (National Veterinay Authority)BADR Algenan Agricultural Development BankCAH ComitE ad hoC (ad hoc Conmrmce tor Imports)CASAP Coopaves Agricoles de Serices et dApprousionnement (Agricultural Input Supply
Cooperatives)CCLS Coopratives des CEreales et Lgumes Secs (Cooperatives for Cereals and Pulses)CDC Cahiers des Charges (Import Permits)CEM Country Economic MemorandumCNCC Centre Nationale de Cont&ole et Cerdficaion des Semences at Plamtes (National Center for the
Control and Certification of Seeds and Plants)CNP Conseil Natonal de la Planification (National Planning Council)COOPAPI Coopfrtives Apicoles (Apiculture Cooperatives)COOPSEL CoopEaives de Services de I'Eevage Born et Ovin (Cooperative for ivesatock Services)COOPSEM Coopives de Semen ces (3eed Production Cooperatives)COPAVI Cooperadves de la Producitn Avicole (Poultry Cooperatives)DA Algerian dinarDAS Domaines Agricoles Socai aS (Socialist State Farms)DOP Direcdion de l'Organlsatic 3de la Producion (Directorate of Production)DP Direction de la Planifcation (Directorate of Planning)DR Direction de la Regulaion (Directorate of Regulon)DRC Domesdc resource costDRVF Diection de la Reckerche, de la Vulgarisadon et de la Fomzation (Directorate of Research,
Extension and Trining)DSA Directions des Services Agricoles (Directorates of Agriculu Services)DSV Direcion des Services Vaernaires (Directorate of Veterinary Services)EAC F&ploitatonos agricolks collectf (Agricultural Cooperative Farms)EAI E&loitations agricoks individuelles (Agricultural Individual Farms)EC European ConuityEDI4MA Entrepnse de Disiibution de Madcines et Matiel Agricole (Enterpise for the Distribution of
Agricutural Machinery and Equipment)EEP Export Enhanemen ProgramENAFLA Ewrepise Nationake Algriene des Fruits et Lgumaes (State Enterprise for Marketing Fresh
Fruits and Vegetables)ENAFROID Entreprise Nationale du Froid (National Enterprise for Frozen Foods)ENAPAL EwtrepriseNationale&l Approvisionnement enProdisAlimentaires (National Enterprise forFood
Supply)ENASUCRE Entreprise Nationale du Sucre (State Enterprise for Sugar Procesing)ENCG Entrepmse Nationale des Corps Gras (State Enterprise for Processig Fats and Oils)ENIAL Entreprise Natonale de Developpement des Industries Aimnentaires (State Enterprise for the
Development of Food ndustries)ERIAD Entreprise Regionale des Indtries Cereakeres et D*ives (State Regional Enterprise for Cereal
Processing)ESW Economic and Sector WorkFAO Food and Agrculture Organization of the United NationsGDP Gross Domestic ProductGD JMMA Groupens d 'lntrets Commnwu pour la Distributon et 1, "inmance du Materil Agricol et
de la Pete Hydradique (Apex Orgnization for the 1DIMN-A)
GNP Gross National ProductGOA Government of AlgeriaIBRD Intemnational Bank for Reconstruction and DevelopmentIFDC International Ferilizer Development CenterIMF International Monetary FundINPV Institut National de la Protection des Vegetaux (Institute for Plant Protection)IPM Integrated Pest ManagementITGC Insihut Techmqye des Grandes CWltures (Technical insttute for Field Crops)I litersMGLA Matiere grasse lainere anhydre (butter oil)MT Metric TonsMOA Ministry of AgricultureMOC Ministry of CommerceMOF Ministry of FinanceNEP New Economic ProgramNPC Nominal protection coefficientOAIC Office Algenen Interprofessiornel des Cirales (Algerian Interprofessional Ceras Board)O&M Operation and maintenanceONAB Office National des Aliments du Betails (National Livestock Feed Board)ONAMA Office National de Materiel Agricole (National Board for Agricultural Equipment)ONAPSA Office National d'Appropmsionnement et de Serices Agricoles (National Office of Agricultural
Services and Supplies)ORELAfT Office Regional Est du Lait et des Produdt Laitiers (State Milk Board for the Eastern Region)OREVIC Office R&gional des Vuades du Centre (State Meat Board for the Central Region)ORLAC Office Regional du Lait et des Prodiats Laiders du Centre (State Milk Board for the Central
Region)OROLAIT Office R)gional Ozest du Lait et des Prod*d:s Laiders (State Milk Board for the Western Region)ORVE Office Regional des Viandes de l'Est (Stae Meat Board for the Eastern Region)ORVO Offices Regional des Vuindes de l'Ouest (State Meat Board for the Western Region)PE Public EnterprisesPMA Enreprise NationaledeProducton desMatrielsAgricoles (National Enterprise for the Prduction
of Agricultural Equipment)QR Quantitative restrictionsSMP Skdm Milk PowderSOJUC Societe des Jus et Conserves (State Enterprise for Juices and Preserves)SSR Self sufficiency ratioUCA Union des Cooperatives Agricoles (Union of Agricultural Cooperatives)UF Unitesfourrageres (Forage Units)VA Value addedVAT Value Added TaxWHO World Health OrganizationWUE Water use efficiency
DEtMOCRATIC AND POPULAR REPUBLIC OF ALGERIAREVIEW OF AGRICULTURAL POLICIES AND AGRICULTURAL SERVICES
1987 - 1993
Table of Contents Pape
ExecutiveSummary . ............................................... I
1. Introduction ...................................................... 1
2. Recent Performae of the Agricultmal Secor ................................. 2Genea ....................... ......................... 2Agroecological Issues ................................................ 3Idgation ........ ........................................ 3Crop Production: Climatic Conditions and Produicdon Stability ........................ 4Livestock Production ................................................. S
3. Macroeconomic Policies Affecting the Agricultural Sector and Agricultura Services. 7Fisal Meurs twards Agriculture. 7Production Subsidies. 8Trde and Forein Exchange Regimes .11Rural Finance and Interest Rate Policies .14Employment .iSReflecion on Policy Objectives. 15
4. Output Distribution and Markeing Services ........... .................. I.... 17Current Status of Marketixb ............................................ 17'Administrative Agricultural Markeing Channels ......... ..................... 17
Ces ............................................. 17The Dairy Subsector ........................................... 19Oilseeds ............................................ 19Sugar ..................................................... 19
Agrtural Marketing by the Private Sector . .................................. 19Fruits and Vegetables .......................................... 20Livestock ............................................. 21
Review of Consraints in Agricultual Marketing Services ......................... 21
Thi seor work s based on several missions undertain in 19 anl 1993. We adnowwdge wh gratiudethe cooperation, contrbutons and commnts of the Algeran authorities. The Task ger s Mr. KutluSomel (abo contibut on agricultural policy and crop producton) and the contributors are Mr. MiNdDeba e ( and marketug); Mr. Ian Goldin (agricultural tae); Mr. Lauent Madi(livesock sector); Mr. Harald Stier (agricultural inputs); Mr. Orhan Dogan (consu,tant,issues); Mr. Noman Kanafi (consltant, agricultura machinery); Mr. Hendrik KuIh (consulant,seeds); Mr. Villy Nilsen (consultant, agricultural macinery); Mr. Ronald Phlips (cooperaves); and Mr. Gary Reusch6 (consultan, seeds). Mr. John Mclntire is the peer reviewe. Mr.MYp _ Sinha I the Acding Naturl lRores and wir m n tDivision Chif and the County
Dpawtmnt Diredr s Mr. Daiel Ridhie. Support frm the Danish Trust Fod s grptefulyadcowleged for thework of Mess. Kanfani and Niesen.

ii
5. Lnput Distribution and Marketing and Other Agricultural Services .................... 23Seeds ................... .................. 23Fertilizers .................. 25Pesticides . 27Agricultu ral Machinery and Equipment 28Livestock Services ................ ............... 30
Sanitary Control and Veterinary Services ............... 30Livestock Input Supply ............... 31
Review of Constraints in Input Supply and Provision of Agricultural Services ............ 31
6. Structural and Institutional Issues ........................................ 33Land Tenure ..................................................... 33Cooperatives ..................................................... 34Public Administration for Agriculture ................. .................... 36Research and Extension ................ ........ ........ 37
7. Conclusions and Recommendations ........................ 38
Statistical Annex ... 46
The following technical docments, which were used in the preparation of this report, are available on a restrictedbasis:
Agricultural Policy Issues (in English)The Trade Dimension (in Engish)Agricultural Marketing (in English)The Livestock Sector (in English)Agroecological Issues in Nordhem Algeria (in French, unedited)Agricultural Cooperatives: Issues, Prospects and Challenges (in English)Fertilizer and Chemical Input Distribution (in English)Seeds Subsector (two reports; in English, unedited)Agriculual Machinery and Equipmet (in English, unedited)

DEMOCRATIC AND POPULAR REPUBLIC OF ALGERIAREVIEW OF AGRICULTURAL POLICIS AND AGRICULTURAL SERVICES
197 -1993
Executive S_mmary
1. Background. In 1987, Algeria began taking major steps towards the economic transformationof the agricultural sector. The dismantling of the state farms and their transformaton into individual andcollective private farms have changed the basic structure of the agricultural sector. Other actions includedprivatizing some cooperatives and giving autonomy to some of the large public enterprises (PE) involved in inputproduction and service provision, including marketing, while remaining under public ownership through holdingcompanies (Fonds de particpion). Considerably more challenging work lies ahead in agricultural reform inAlgeria. Private farms and farmers are more numerous as compared to the situation uuder socialist organizationand are also more diffused over space. The needs of this new organization have to be addressed in the areas ofinput and service provision, including diverse areas as marketing, storage, credit, input supply, and tecnicalinforation. The monopolistic PE that served the socialist farms have to be adapted and restruchtred to servethese private fanmers under competitive market conditions and the private sector has to assume a higher role inproviding agricultural services. This transformation will involve considerable structural and macroeconomicadjustment, involving macroeconomic prices; public expenditures; the directon, level and sustainabiity ofagricultural subsidies; public ownership; etc. The sector's ability to absorb these impacts is critical to the successof the adjustment program. lhe objecdive of the sector work is to assess specific issues n the transformanonprocess ofAlgerian agriculture pertaining to agricultural services, to review recent policy developments affectngthe agricultural sector and to develop optionsfor change to ensure that an evenual adjustmtprogram inducesad eqate supply response andpromotesflexiblity, efficiency, producty and stability In agricutual production.The term 'agricultmua services" is used broadly to cover, e.g., the adminision, research and extension,wholesale and retail marketing (including imports and exports) of agricultural products and inpUtS and theorganization of agroindustry, etc., with the associated regulatory frmnework.
2. The analysis in this document focuses on conditions that existed until mid-1993, when the studywas concluded. Considerable progess has been achieved in inproving macroeconomic conditions as a result ofthe Stabilization Program initiated in April 1994. Some of the policy changes have affected the agriultural sectordirecdy; while an effort has been made to record these changes in this document, they are not analyzed in depthas this would merit another study. '
3. Agriculture contributes around 11-15 percent of total value added (VA) and 11-12 percent ofGDP. It receives around 8-10 percent of total investment and absorbs around 25 percent of labor. The twoconsecutive seasons of outsanding output due to favorable weather conditions in 1991 and 1992 have resultedin real growth rates of 23.0 and 4.8 percent in agricultural VA (in 1980 prices), but 1993 was anotherdisappointing year due to drought and the same situation is expected for 1994. Food imports of US$1.9 biUlionand US$1.75 biSlion comprised 19.5 and 22.5 percent of total imports in 1990 and 1991 respectively. The foodself sufficiency ratio (SSR), is low, particularly in cereals, pulses, edible oil and milk, and there are technicallimits to increasing SSR. Imports of agricultural inputs and equipment increse the dendence of the agriculturalsector on the international market.
4. Agriculural Policies. The pervasive nature of implicit and explicit supports in agriculture, aswell as the inconsistency between some of the policy measures require some reflection on policy objectives. Thebasic issues are that (a) it is difficult to find an explicit statement of policy objectives that go beyond therhetorical; and (b) there is a high degree of confusion of efficiency and equity objectives. Other issues arewhether: (c) any of the explicit objectives are realistic and economically sound; (d) some of the policy objectivesimplicit in the measures taken are realistic and consistnt; and (e) the policy measures taken are the best toachieve the given objectives.
ii
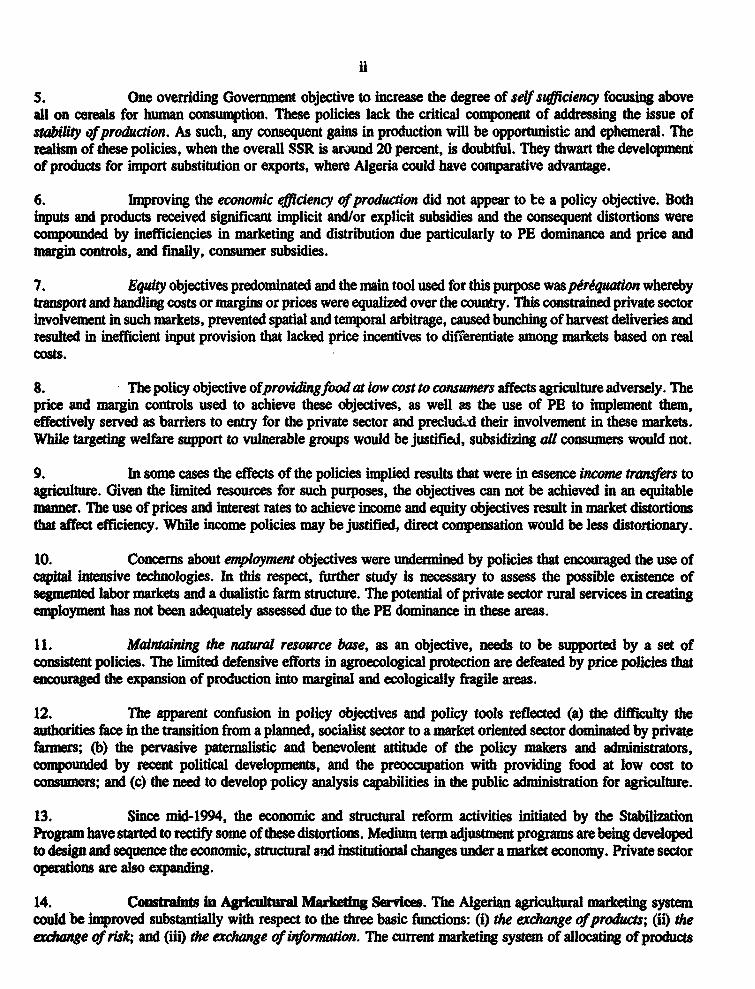
5. One ovefriding Government objective to increase the degree of self sicaency focusing aboveall on cereals for human consumpton. These policies lack the critical component of addressing the issue ofstabibly of production. As such, any consequent gains in production will be opportunistic and ephemeral. Therealism of these policies, when the overall SSR is around 20 percent, is doubtful. They thwart the developmentof products for import substitution or exports, where Algeria could have comparative advantage.
6. Improving the economic efficency of production did not appear to te a policy objective. Bothinputs and products received significant implicit and/or explicit subsidies and the consequent distortions werecompounded by inefficiencies in marketing and distribution due particularly to PE dominance and price andmargin controls, and finally, consumer subsidies.
7. Equity objectives predominated and the main tool used for this purpose was pdrEquation wherebytransport and handling costs or margins or prices were equalized over the country. This constrained private sectorinvolvement in such markets, prevented spatial and temporal arbitrage, caused bunching of harvest deliveries andresulted in inefficient input provision that lacked price incentives to differentiate among markets based on realcosts.
8. The policy objective ofprovidingfood at low cost to conswners affects agriculture adversely. Theprice and margin controls used to achieve these objectives, as well as the use of PE to implement them,
fecuively served as barriers to entry for the private sector and precluckd their involvement in these markets.While targeting welfare support to vulnerable groups would be justified, subsidizing all consumers would not.
9. In some cases the effects of the policies implied results that were in essence income tranfers toagriculture. Given the limited resources for such purposes, the objectives can not be achieved in an equitablemanner. The use of prices and interest rates to achieve income and equity objectives result in market distortionsthat affect efficiency. While income policies may be justified, direct compenaion would be less distortionaly.
10. Concems about enmplymen objectives were undermined by policies that encouraged the use ofcapa intesive technologies. In this respect, further study is necessary to assess the possible existence ofsegmented labor markets and a dualistic farm structure. The potential of private sector rural services in creatingemployment has not been adequately assessed due to the PE dominance in these areas.
11. Maintaining the natural resource base, as an objective, needs to be supported by a set ofconsistent policies. The limited defensive efforts in agroecological protection are defeated by price policies thatencouraged the expansion of production into marginal and ecologically fragile areas.
12. The appauent confusion in policy objectives and policy tools reflected (a) the difficulty theauthorities face in the transition from a planned, socialist sector to a market oriented sector domiated by privatefarmers; (b) the pervasive paternalistic and benevolent attitude of the policy makers and administrators,compounded by recent political developments, and the preoccupaion with providing food at low cost toconsumers; and (c) the need to develop policy analysis capabilities in the public administation for agriculture.
13. Since mid-1994, the economic and structal reform activities initated by the StabilizationProgram have started to rect some of these distortions. Medim term adjustment programs are being developedto design and sequence the economic, structura and instiutional changes under a market economy. Private sectoropeaions are also expanding.
14. Cofstraints in Agricultural Marketg Services. The Algerian agricultural marketing systemcould be improved substantially with respect to the three basic functions: (i) the exchange ofproducts; (ii) theechange of risk; and (ill) the exc*ange of informauion. The current marketing system of allocating of producs

iii
entails high and unnecessary costs throughout the agricultural and food marketing chains, both private and public.This poor performance results mainly from (i) high post-harvest losses or deterioration along the marketing chain;(ii) inefficient transporation; (iii) poor storage conditions and insufficient availability of storage facilities; and(iv) inefficient disfiibution of consumer products at the retail level. Four constraints have been identified:
a. the strong Government market intervention polices implemented through parastatals affect shortto medium term positions taken by private entrepreneurs in the market;
b. the preferential treatment and monopolistic position of the parastatals in marketing chains, inaccess to foreign exchange and credit, serve as barriers to entry for the private sector;
c. the poor infrastructure and equipment at the wholesale level (i.e., between farmers andprocessing and distribution enterprises); and
d. a poor regulatory environment, where some positive developments have been taking place sincemid-1993.
15. Constraints in Input Supply and Provision of Agricultu Services. The basic constraints ininput supply and related agricultual services stem from: (i) the inability of the PE to adapt in the face of anagricultural sector now composed of private farmers; (ii) the maintained privileges of PE monopolies in accessto resources such as foreign exchange, subsidies, credit, etc., but subject to overall resource consmints; (fii) theGovenmient interventions in prices, margins and other controls such as effective QR; and (iv) as a consequence,the limited involvement and experience of the private sector in these areas.
16. The PE involved in input supply and provision of services have traditionally served the statefams under a planned, socialist system, characterized by central decisions on input use based on techimcalcriteria. Furthermore, the scale of the state farms was considerably larger as compared to the average privatefarm size today. These private farmers are economic agents that are sensitive to and respond to economic stimuli,and are more dispersed over space. The PE have not responded to the needs of this new structure and havecontnued to behave and produce as before, without adequate assessment of market stmcture, demand or logistics.
17. The PE have continued to have privileged access to the scarcer foreign exchange resources forimports of inputs, raw maWials, machinery, equipment and spare parts. Furtherore, the PE have continuedto be the media through which Government input subsidy programs are implemented. This has effectively reducedpart c. the market risk for the PE, but this option is not available to the private sector. As effective barriers toentry me gradually decreased it will be possible to have more participation of the private sector.
18. The Govermment administered prices and margins and piriquation schemes effectively block.private sector involvement in input supply. Although, most agricultural input subsidies have been eliminated onApril 1994 in conformity with the IMF Stand By agreement, the private sector will not be able to provideservices in these areas in a competitive manner if it is not allowed to differentiate between market segments. Suchcontrols and panterritorial pricing also encourage inefficient production in unsuitable areas, as wel as adverselyaffecting retail operations, especially by the input supply cooperatives. While social reasons may justifyGovermment intervention in well targeted, specific areas, panterritorial control and uniform prices and/or marginscan not be justified.
19. Land Temwe. Land tenure is a fundamental problem. Currentily, four main modes of rights overland exist in Algeria. These are (i) Pilot Farms under the jurisdiction of the public domain; (ii) individual privatefarms (EAI) and collective private farms (EAC); (iii) the traditional private sector farms (melk); and (iv) the landin the steppe areas under the jurisdiction of the national domain but where tribes exercise a usage right. The basic

iv
issues now are the resolution of ownership rights for the EAC and EAI and registering the property rights of thetraditional private farmers. One problem area is that the cooperative and collective operations expected of theEAC have not worked. Centrifugal forces are thus changing the EAC into defacto EAI. There are currently somepreliminary moves to turn this into a de jure situation. However, the central authorities' concern to maintainviable farm sizes and prevent fragmentation and parcellization may be slowing the process. Knowledge about landtenure issues and land use patterns needs to be improved at the policy making level. A conmmittee has beenforned to advise the policy makers on the issues and propose action, legislation, etc., and there are positivedevelopments. Yet, the task at hand is monumental and it has to be recognized that it wiUl take considerable timeand resources to develop a land tenure system that is conducive to efficient use of resources through the marketsystem and does not pose major equity problems. The linkages with rural finance (collateral requirements) haveto be considered, and, manageable market systems and the associated legal fraework for the sale, inheritanceand rental of land (for cash or in kind returns) need to be organized. However, above all, adequate policy signalsmust be given to fanmers that they are the owners of the land in order to promote investments in land andefficient exploitation of resources. Under the Cadastre Project supported by the Bank, resoes have beenallocated for a study on agricultural land tenure.
20. Cooperatives. Since independence, Cooperatves have been state sponsored organizations thatserved as instruments for implementing agricultural policy. The cooperatives maintained close ties with the PE,which either supplied goods to or purchased products from the cooperatives. The present transformation of theAlgerian cooperative system was initiated in 1988 but there is a wide variation in the extent to which cooperativeshave transformed themselves from govermmental agencies to private enterprises. The most important system ofcooperatives involved in cereals and pulses, the CCLS, have been left out of the legal framework of privadzaion.The CCLS are not cooperatives in any sense of the concept, and in their present status appear to be anunnecessary stage in the distribution of imported commodities. Their restructring within a broader frameworkof the distribution of agricultural commodities should be a priority. The privatized cooperatives, especially thoseinvolved in input supply, face an overwhelming debt burden arising from their patrimoine, i.e., assessed valueof infrasucture and stock when the new, privauzed cooperatives were formed. Thepatrmomne reflects not theeconomic but the accounting value of outdated and depreciated infrastructure and equipment as well as lossesincurred as a consequence of implementing govermment policies under socialist agriculture. It is necessary toreview the debt position of the cooperatives, release them from any liability on the pautriine, and establish asetlement mechanism for cooperative debts, in such a manner as to relieve them from dependence on theGoverment. The defacto monopoly position of PE in the supply of key agricultural inputs effectively preventcooperatives from engagg in activities such as importng seeds and other inputs. This condition is exacerbatedby Govermnent controls over prices and margins for inputs which squeeze cooperative profits.
21. Research and Extension. Traditionally, the organization and orientation of agricultural resarchin Algeria was geared to the socialist sector. Extension emphasized conveying the technical information necessaryto realize production plans to the limited number of state farms. Hence, the main challenge to the research andextension system today is to reorient itself to the needs of private farmers guided by profit motives under marketconditions with real resource constraints and climate and market risks. The limited resources of the publicresearch and extension organizations essentially require that they be used effectively in priority areas. A Researchand Exension Project is under implementaion with Bank financing (Loan 3216-AL). On the other hand, privatesector research and extension should be allowed and encouraged.
22. Public AdminLstrton for Agricutre. MOA is the focal public organ for the concepualizon,development and execution of agricultural policy. MOC, MOF and CNP are also involved in the policy processesin coordination with MOA. There are two related issues: (a) the higher role for market forces and private sectoroperations will require a reorientation towards new perspectives for the processes and methods of agriculturalpolicy; (b) policy objectives have to be subjected to critical assessment of feasibility, cost and alternatives. It istherefore important to develop agricultural policy analysis capacity in the MOA, with close linlges to CNP,

v
MOC, MOP and the universities. Commitment from the Government, backed by sustainable resource allocation,should be supported by a program of technical assistance.
23. Conclusions and Rmmendations. Algerian agriculture maifests serious problems thatconstrain its potential. These problems emanate from (i) the policy dimension, pertining to both the generalmacroecononmc enviromnent and to the agricultural sector specifically; and (i;) structurl, institutional andtechnical constraints, related to land temnre, agroindustrial structure, marketing, input supply, cooperatives,research and extension on appropriate technologies and the regulatory environment. The soluton of majormacroeconomic problems, such as those related to the management of the foreign exchange and trade regimes,the financial sector and the interest rate, and budgetary management, will require a well designed and sequencedadJusment program, which should take into consideration the potential impact on the agricultural sector.Problems of a policy and structural nature that pertain specifically to the agricultural sector also need to beaddressed within an agricutural sector adjustment program.
24. On broad macroeconomic issues, those pertaining to the foreign exchange and trade regime areof critical importance to agriculture:
a. imported inputs entail implicit subsidies due to the overvalued exchange rate, resuting ininefficient use due to distorted prices; better targeted subsidies should be more transparent in thebudget and shoudd not use the exchange rate as the medium;
b. before the macroeconomic stabilization program, the limited foreign exchange from officialresources were effectively rationed through administrative processes and QR imposeu - theCAH and, while imports with foreign exchange from the 'paraliel" market and own sources wereallowed for the private sector, it was not permitted to reflect the higher foreign exchange costson product and service prices; this caused various compensatory measures, such as over-invoicing, to recover costs. Starting April 1994 and following the macroeconomic stabilizationprogrm, the CAH has been dissolved and the QR have been removed except for (i) strategiccommodities where imports by the private sector would be based on professional, technical andcommercial competence; and (ii) the temporary suspension of many competng imports to allowdomestic production to develop; on the other hand, imports with foreign exchange from the"parallel" market and own sources are no longer allowed;
c. the overvalued exchange rate renders nontradables expensive and discourages foreign investment;on April 1994, the DA was devalued by 50 percent, but the gap between the official exchangerate and the parallel market rate remains substantial; the macroeconomic stabilization programcalls for the gradual liberalization of the exchange rate leading to the introduction of an inter-bank foreign exchange market by mid-1995;
d. the privileged access of the PE to foreign exchange perpetuated their inefficiencies and crowdedout the private sector, serving as a barrier to entry; the first trade liberalizing measures underthe Stand-By agreement should facilitate the private sector access to foreign exchange;
e. the wedge between the official and market exchange rates incorporates transactions costs and riskpremia, which are rents accruing to agents not directly involved in producton and services; and
f. foreign exchange retention schemes discriminated against agricultural exports at 50 percent, whilethe global retention rate was 100 percent; after mid-1994, the foreign exchange retention rate isunified at 50 percent for all types of exports (except for hydrocarbons and mine products).
vi
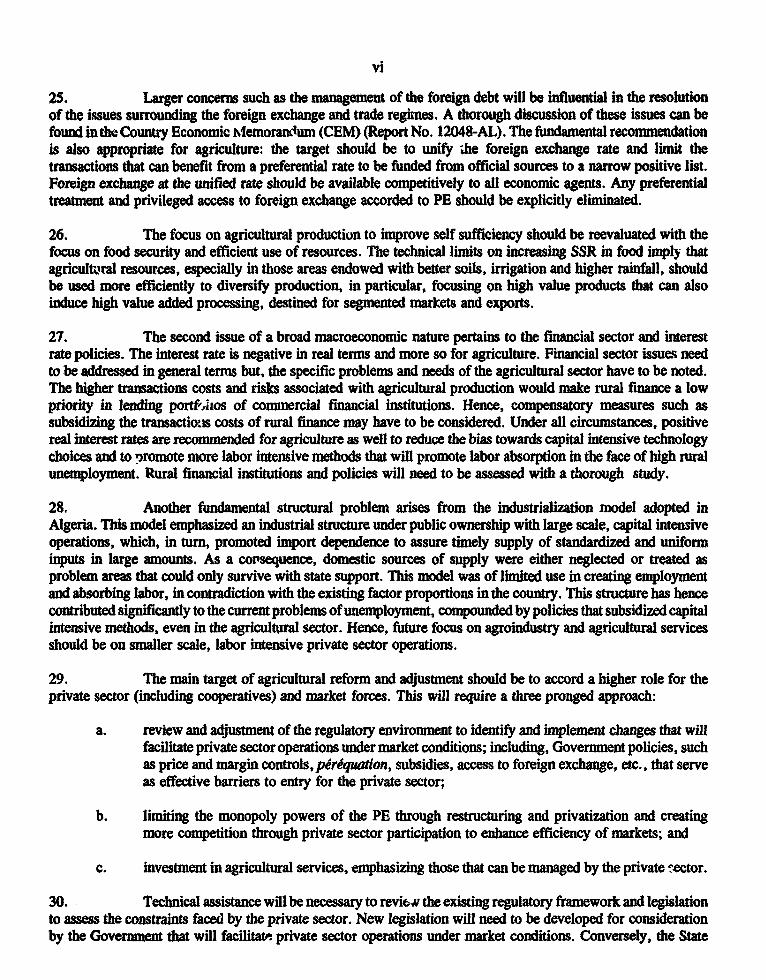
25. Larger concerns such as the management of the foreign debt will be influential in the resolutionof the issues surrounding the foreign exchange and trade regimes. A thorough discussion of these issues can befound inthe Country Economic hlemoranium (CEM) (Report No. 12048-AL). The fundamental recommendationis also appropriate for agriculture: the target should be to unify bhe foreign exchange rate and limit thetransactions that can benefit from a preferential rate to be funded from official sources to a narrow positive list.Foreign exchange at the unified rate should be available competively to all econoniic agents. Any preferentialtreatment and privileged access to foreign exchange accorded to PE should be explicidy eliminated.
26. The focus on agricultural production to improve self sufficiency should be reevaluated with thefocus on food security and efficient use of resources. The technical limits on incteasing SSR in food imply thatagrictltvual resources, especially in those areas endowed with better soils, irrigation and higher rainfall, shouldbe used more efficiently to diversify production, in particular, focusing on high value products that can alsoinduce high value added processing, destined for segmented markets and exports.
27. The second issue of a broad macroeconomic nature pertains to the financial sector and interestrate policies. The interest rate is negative in real terms and more so for agriculture. Financial sector issues needto be addressed in general terms but, the specific problems and needs of the agricultural sector have to be noted.The higher transactions costs and risks associated with agricultural production would make rural finance a lowpriority in lending portftmtos of conmnercial financial institutions. Hence, compensatory measures such assubsidizing the transactioms costs of rural finance may have to be considered. Under aUl circumstances, positivereal interest rates are recommended for agriculture as well to reduce the bias towards capital intensive technologychoices and to ='romote more labor intensive methods that will promote labor absorption in the face of high ruralunemployment. Rural financial institutions and policies will need to be assessed with a thorough study.
28. Another fundamental structural problem arises from the industrialiation model adopted inAlgeria. This model emphasized an industrial structure under public ownership with large scale, capital intensiveoperatons, which, in turn, promoted import dependence to assure timely supply of standardized and uniforminputs in large amounts. As a copsequence, domestic sources of supply were either neglected or treated asproblem areas that could only survive with state support. This model was of limited use in creating employmentand absorbing labor, in contradiction with the existing factor proportions in the country. This structure has hencecontributed significantly to the current problems of unemployment, compounded by policies that subsidized capitalintensive methods, even m the agricultral sector. Hence, future focus on agroindustry and agricultural servicesshould be on smaller scale, labor intensive private sector operations.
29. The main target of agricultural reform and adjustnent should be to accord a higher role for theprivate sector (including cooperatives) and market forces. This will require a three pronged approach:
a. review and adjustment of the regulatory enviromnent to identify and implement changes that willfacilitate private sector operations under narket conditions; including, Government policies, suchas price and margin controls,pgriquaton, subsidies, access to foreign exchange, etc., that serveas effective barriers to entry for the private sector;
b. limiting the monopoly powers of the PE through restructuring and privatization and creatngmore competition through private sector participation to enhance efficiency of markets; and
c. investment in agricultural services, emphasizng those that can be managed by the private sector.
30. Technical assistance will be necessary to revi6v the existing regulatory framework and legislationto assess the constrain faced by the private sector. New legislation will need to be developed for considerationby the Goverment that will facilitate private sector operations under market conditions. Conversely, the State
vii
agencies will need to assume a regulatory oversight role as opposed to their traditional role as active participantsin production and provision of agricultural services.
31. Agricultural policies will need to be based on clear, consistent and transparent objectives. Whileit is the prerogative of any Government to influence economic activity, interventions should be selective, entailminirmu distortion and be within budgetary constraints. In agriculture, it is important to direct interventions toinfluence production through product prices rather than input and service priees to reduce distortions. Theelimination of explicit subsidies on most agricultural inputs in April 1994 should improve the situation. However,water and seed prices are still subsidized, and implicit input subsidies are still in place. Social interventiomsshould be well targeted to be effective and to reduce spillover distortionary effects. For these purposes, it isnecessary to develop policy analysis capabilities in the MOA, CNP, MOC and MOF.
32. Certain policy reforms are a prerequisite to the development of agricultural services. Only minordevelopments can be expected in marketing and processing under the current centrally planned environment forthe cereal and dairy subsectors. Reforms in these two key sensitive subsectors need to be based on well designedprograms to ensure sufficient and stable supply. In the dairy subsector, the distortions that produce widedifferences between producer and consumer prices and import costs need to be reduced. Consumer subsidies needto be targeted towards vulnerable groups. Furtemore, the issue of the comparative advantage in milk productionwould need to be addressed, including the role it plays in the portfolio of agricultural products for farmers. Ifprice distortions are reduced, there would be interest by the private sector in developing small to medium sizemarketing and processing activities.
33. In the cereal subsector, reforms in price and trade polici s will be slow. International trade withAlgeria in cereals is conducted under concessional arrangements that defacto use a single Algerian countrpartthat guarante credit and can handle large quantities. Hence, reform in this sector would need to be developedbased on thorough and detailed studies, considering domestic production issues as well. Considering that Algeriaw4ll continue to depend largely on imports for the country's needs over the long run in cereals and cerealproducts, it would be conceivable to select the main port terminals and related facilities to be modernized and/orexpanded, and be put under private sector management.
34. Reforms in the price and trade policy, and demonopolization would be imperative before anyinvolvement in investnents in the sugar and oilseeds subsectors. In both subsectors, restrctrng andrefurbishing of the existing refining facilities would need to be analyzed. Studies looking at the production andmarket potential for oilseeds would also be recomiended. In the fruits and vegetables and livestock subsectorsthere is significant potential for private and public investment but the main issue is to give the private sectoraccess to credit and foreign exchange. It should be noted that price policies have been addressed since 1990.Today, almost 90 percent of tt - products have liberalized prices. However, the remaining products withadministered prices are the most critical for agricultural production.
35. Development of private marketing services would need substantial reform in the role ofGovernment and its agencies in pricing products. Such reform should guarantee enough freedom to emergingentrepreneurs such as merchants, transporters, small processors and retailers, to let them gradually supplant theexisting large PE (i) in offering alternative new outlets for farmers products; (ii) in adding higher value toagricultural products; (ii) in creating jobs; and (iv) in providing better supply (larger quantities, better qualityand efficient services) to the population. The role of the Government, together with the representatives ofentrepreneurs and farmers in each subsector, should focus on rules and enforcement of fair competition andcontracts, consumer health, improved infrastructure and information on market conditions and new technologies.Private sector participation in these markets will increase as barriers to entry are gradually eliminated.

viii
36. RestucturIng, including amvestiture and privatization of agroindustrial enterprises in competitivesubsectors should be a priority. Private sector development has the biggest potential in processing in the cereals,feed, fruit and vegetables and livestock subsectors. The administered prices and margins, and the p0rmqwionpolicies confer indirect preference to parastatals, including large subsidies. These policies discourage privatesector operations in the areas. Privatization should be addresseo, stri with the ERIAD in the milling andbaking industry, ENAPLA, ENAFROID, ENCG, SOJUC, and the regional dairy and meat boards. In most ofthese subsectors, effectve bariers to pnvate sector entry should be removed.
37. In input supply, the dominant position of ONAPSA should be considered with priority with aview towards restructuring and privatization. Similarly, problems associated with other PE such as ONAB,GDIMMA, PMA, ASMIDAL, etc., should be addressed and programs should be developed for restructuring andprivatization. Private enterpnse access to these markets is limited due to adminstered prices and margins,pruatiOdn, and implicit and explicit subsidies to the PE. On policy matters, state controls over prices, marginsand other concrete allocation decisions need to be removed. Under the stipulations of the new agreeent withthe IMP, most explicit input subsidies have been eliminated, but input prces have to be declared and are stillnot market determined.
38. Are for pote investments in agricultural services need to be identified to complement theadjusitm process. Technical and financial support for investment could target three categories of investorsproviding services to farmers:
a. private enterprises providing wholesale marketing and processing services along the agriculturaland food marketing chain; merchants and associations of farmers whose mam activities are (i)to buy or get delivery of agricultural products frm fannewrs and importers; (ii) to condition(clean, dry, sort, package, etc.) these products accordingly with incentives given by the domesticmarkets; (iii) to store; (iv) to transport; (v) to process the products and add service value tothem; and (vi) to manage commercial risks and risks related to price fluctuaions;
b. selected PE, with a strong commitment from Government to demonopolize and privatize, toimprove the handling of domestic and imported socialy sensitive products, and to assist theirreorienation to new, or more focused, acities; and
c. the State and municipalities to improve a number of public and semi-public (in connection withnational or regional professional associations) (i) infrastructure (mainly port facilities to unloadincoming ships, facilitate tansit, inspection, inland transportation, etc., and regional commodityexchanges); and 00i) agencies involved in the priority fields listed above, i.e., regulating andenforcement of fair competition and contracts; consumer health safety; and market information;and training in business administration and marketin. The infrastructural investments shouldemphasize management by the private sector to enhance cost recovery for O&M.

DEMOCRATIC AND POPULAR REPUBLIC OF ALGERIA
REVIEW OF AGRICULTURAL POLICIES AND AGRICULTURAL SERVICES1987 - 1993
1. Introduction
1.1. In 1987, Algeria began taking major steps towards the economic transformation of the agriculturalsector. The dismanling of the state fanns (DAS; Domaie Agnicoles Socialistes) and their transformation intocollectve and ixdividual pnvate farms (EAC/EAI; Exploitations Agricoles Collectives and Exploiations AgncolesIndividuelles) have effectively changed the basic structure of the agricultural sector. Legislation governingcooperatives was changed and most state cooperatives (excluding the cooperatives for cereals and pulses; theCCLS) were given private sector status. Other actions included giving autonomy to some of the large publicenterprises (PE) and parastatals' involved in input production and service provision, including marketing, whileremaining under public ownraship through holdnig companies (Fonds departicipation). The private sector is nowallowed to participate in such agricultural services and is also given the right to import, which, as will beexplained below, remains largely on paper due to the dominance of PE and their preferential access to foreignexchange and credit. State controls over output and input prices remain, covering some critical commodities.
1.2. Considerably more challenging work lies ahead in agncultural reform in Algena after anencouraging start. Private farms and farmers are more numerous as compared to the situation under socialistorganizion and are also more diffused over space. The needs of this new organization have to be addressed inthe areas of input and service provision, including diverse areas as marketing, storage, credit, input supply, andtechnical information. The monopolistic PE that served the socialist farms have to be adapted and restructuredto serve these private farmers under competitive market conditions and the private sector has to assume a higherrole in providing agricultural services.
1.3. The Algerian economy will be undergoing significant adjustments in the medium term. Theorganzation and the management of the agricultural sector will have to be gradually relinquished to market forceswhich can more efficiently determine resource allocation. This transformation will involve considerable structuraland macroeconomic adjustment, involving macroeconomic prices; public expenditures; the direction, level andsustainability of agricultural subsidies; public ownership; etc. The sector's ability to a.,orb these impacts iscritical to the success of the adjustment program. It is necessary to assess policy developnts, and structuraland instiuional bottlenecks in agricultural services3 and develop options for change to ensure that an eventualadjustment program induces and promotes flexibility, efficiency, productivity and stability in agriculturalproduction.
1.4. The objectve of the sector work is to assess specific issues in the transformation process ofAlgerian agriculture pertaining to agricultural services and to review recent policy developments affecting theagricultural sector. After an initial review of the recent production perfonnance, a discussion of themacroeconomic factors affecting agriculture will follow, the most important being the agricultural subsidies; themanagement of the macroeconomic prices of the foreign exchange and interest rates; the trade regime; andemployment policies. This will be followed by focusing on specific issues pertaining to agricultural services onoutput marketing and input supply respectively, and, subsequently, structural and institutional constraints, leadingto conclusions and recommendations. The analysis in this document focuses on conditions that existed until mid-1993, when the study was concluded. Considerable progress has been achieved in improving macroeconomic
In this document, parastatals are used to designate the various public enterprises, marketing boards, etc.
2 The term agricuural senvces is used broadly, covering, e.g., the administration, research and extension, wholesaleand retail marketing (including imports and exports) of agricultural products and inputs and the organization ofagroidustry, etc., with the associated regulatory famework.
2
conditions as a result of the Stabilization Program inidated in April 1994.3 Some of the policy changes haveaffecte the agricultural sector directly; while an effort has been made to record these changes in this document,they are not analyzed in depth as this would merit another study.
1.S. Seeral complementary studies or operations elaborate on certain issues that are not treated indetail in the present report. The 1993 Country Economic Memorandum (CEM) (Report No. 12048-AL) discussesthe broad macroecononic issues, particularly those related to the foreign exchange and trade regimes, as wellas discussing consumer related issues. In 1991, the former were also discussed in the ESW on Exchange andTrade Reionn (Report No. 9508-AL) and the latter were discussed in the ESW on Consumer Subsidy Reform(Report No. 9881-AL). The discussion of agricultural policies in the present report also served as the backgroundfor the CEM. Water related issues are treated in the 1992 ESW, the Water Resources Development StrategyPaper (Report No. 10858-AL), and the irrigation projects under implementation with Bank financing. The 1993Tanort Strategy Note also discusses grain import and transport facilites. The 1993 ESW on EnvironmentalIssues discusses agroecological matters. Agricultural research and extension are being addressed in a pilotResearch and Extension Project (Loan No. 3216-AL). Land tenure matters are to be addressed in a study to befnanced by the Cadaste Project under implementation. The Enterprise and Financial Sector Adjustmeant Lo(EFSAL) addresses financial sector reform and restructuring issues, among others, in two critical PE inagriculral input and machinery production. Rural finance issues were addressed in an Agricultural Credit Loan,which was not extended due to the deterioration in the general conditions in the financial sector. A rural financestudy would be conucted under the proposed Agricultural Services Project. A prices and incentives studyconducted by the Algerian authorities addresses issues of comparative advantage in agricultural production. Thepresent report also updates some of the information in the 1990 ESW, "Algeria: A new Opportunity for Growth"(Report No. 7419-AL). Finally, the present report is in conformity with the 1993 Agricultual Strateg Paper(Report No. 11741-AL).
2. Recent Perfornce of the Agricultural Sector
2.1. Genal. Agriculture contributes around 11-15 percent of total value added (VA) and 11-12percent of GODP (Table 1). It receives around 8-10 percent of total investment and absorbs around 25 percent oflabor (Tables 2, 3 and 4). The two consecutive seasons of oustanding output due to favorable weather conditionsin 1991 and 1992 have resulted in real growth rates of 23.0 and 4.8 percent in agricultural VA (in 1980 prices),but 1993 was another disappointing year due to drought and the same situation is expected for 1994.
2.2. Food imports of US$1.90 billion and US$1.75 billion comprised 19.5 and 22.5 percent of totalimports in 1990 and 1991 respectively (Table 1). Within the past decade, the highest share of food imports intotal imports reached 27.8 percent in 1989 after a severe drought, amounting to US$2.63 billion.4 There aretecical limits to increasing the low food self sufficiency ratio (SSR: the percentage of food demand met by
3 In accordance with the Stand-by agreemen of the IMP signed on May 1994, Algei has taken several measurelatd to its macro-economy, specifically: (a) an immedia devaluation of the DA by 50 percent, this will befollowed by a gradud liberalization of the exchange rate by mid-1995; (b) the CAHhas been dissolved and the QRhave been abolished except for 'straegic products where the pnvate sector's right to import is based onprofessional, technical and commera criteria, and the temporary suspension of certain import competig importsto allow domestic production to develop; (c) elimination of agricultural input subsidies -except for water and seeds;(d) an increase in the Central Bak interest rates to an average of 24 percent and elimination of ceilings on lendingrates; and (e) monetary and fiscal policy adjustments.
For purposes of comparison, exports totaled US$ 9.57 billion, US$ 12.93 billion and US$ 12.57 billion in 1989,1990 and 1991 rspectively.

3
domestic production). According to preliminary FAO data, overall SSR is 24 percent (measured in calories) andis projected to increase to 27 percent by the year 2010. The SSR in critical products such as cereals (20, 24)r,pulses (20, 53), vegetable oils (11,17) and milk (38, 24) are projected to continue to be low. Imports ofagricultural inputs and equipment increase the dependence of the agricultural sector to the international market.
2.3. Since 1990, agricultural investments have comprised between 8-10 percent of total investmentsin the economy (Table 2). Around half of these investments have been in irrigation. The remainder is absorbedmostly by agriculture, but forestry has been picking up. Due to their priority, irrigation investments dominatepublic investments in agriculture with a share of over two thirds.
2.4. Agroecologkal Issues. The natural resource base is threatened by several natural or man-madefactors. The consequences are not only jeopardizng the productivity of farm land but also the substantiveinvestments in irrigation. Soil erosion and desertification through the encroachment of sand dunes are the twomain agroecological problems.
2.5. Soil Erosion. The main factor causing soil loss is water erosion, due to heavy runoff in thefragile areas, which are primarily the overgrazed pastures, denuded forest areas, the untilled fallow and theravines and gullies in the watershed areas. In some areas, expansion of production into marginal areas in responseto Govermment price incentives and the use of inappropriate tillage techniques have recendy become more critical.As a consequence, almost 10 million ha of land in the North is considered susceptible to loss of productivity asa result of soil erosion. Currendy, (a) soil erosion in the watershed areas reaches 2,000 MT/km3/year; (b) 120million MT of sedimentation is lost to the sea annually; (c) on average, dams have lost about half their capacitydue to siltation; and (d) the annual reduction of water storing capacity in dams is around 20 million m3. Theseproblems require a concerted research and extension effort (both for erosion control and for promotingapropriate production technologies) along with public works and involvement of local populations i managingthe natural resource base and the environment.
2.6. Deserification. The encroachment of sand dunes results in irreversible loss of agncultural land.Intensive efforts are under way to stabilize dunmes with "barrages verts" and controlling grazing in marginal areas(despite the countervailing pressures from contradictory subsidies to promote livestock production). An exampleof effective controls is observed in Bousaada, where the foramate presence of underground water has allowedland widt highly sandy soils to be allocated to producers. Commercial production on these farms is the bestguarantee for dune stabilization. Similar approaches should be used where the potential of the private sector canbe exploited to counter ecological problems.
2.7. Irrigation. Irrigated areas make up only about 10 percent of cultivated and 34 percent of arableland (Table 7) and there are plans to expand these areas substantially by the year 2010. The Government giveshigh priority to and allocates a large share of agricultural investments to irrigation. However, there are importantproblems in the management of the water resources and the imgated areas. Overall system efficiency is estimatedat 36 percent. This low system efficiency is compounded by low on-farm water use efficiency (WUE), whichwould imply that as low as only 20 percent of the water harnessed for irrigation is actually converted into plantproduction. In some cases, the exigencies of self sufficiency policies result in the use of valuable irrigated landfor crops with low economic value. These problems are compounded by the lack of effective water charges tocover at least operation and maintenance (O&M) costs. As a consequence, system maintenance is not done in aneffective manner. Soil erosion in the watershed areas has caused irrigated areas to decline by reducing waterstorage capacity in dams as a result of siltation. Hence, the following should be given as high priority asinvestments in expanding irrigated areas: (a) rehabilitation and effective O&M of irrigation systems; (b) effective
The first number in the parentheses is the average SSR for 1988-1990 and the second is the projected SSR for 2010,according to preliminary FAO data.

4
disseminaon of production techiques; and (c) water pricing that promotes higher on-farm WUE. On the otherhand, actions bringing out the natural potentW of the South have been taken in order to increase nationalagricultural production capacity. The encouraging results of the first experiments have shown multiplepossibilities to rapidly increase agricultual production through the exploitation of water resources in fte Southernregions. It is also important to note that economic and social objectives must be taken into consideration in thedevelopment of the South.
2.8. Crop Production: Climatic Conditions and Production Stabilt. Since the initiation of thereforms in 1987, climatic conditions have exhibited substantial variability, from the extremes of drought in1987/1988 to the record setting harvests of 1990/1991 and 1991/1992 (Tables 8-11). Preliminary results indicatea sharp drop in agricultural production in 1992/1993 due to drought, particularly in cereals with a 38 percentdrop over the previous season. ',here is also a risk that 1994 will present the same disappointing results due todrought. Despite the investments in irrigation and the availability of adaptable techniques of prouction,agricultural production remains highly susceptible to climatic conditions. In this respect, the issue of enhandngstabiity around an increasing trend of production becomes criticil for several reasons.
2.9. From the national perective, the high degree of production variability makes the managementof the sector quite difficult in terms of assuring adequate food supplies in a timely maimer through imports andin terms of developing effective incentives. Storage capacity in cereals and pulses is nearly equal to the averagelevel of domestic production and to about 20 percent of annual consumption. The investment in storage capacityand the opportunity cost of the idle resources stored therein are in effect the premia for the expensive nationalinsurance policies to counter the vagaries of climatic variability. For the farmers, who are invariably risk averseand give high priority to the stability of income and consumption streams, the basic methods of managing therisks of climatic variability are first a reduced level of input use to account for risk, and second, a diversificationof income generating activities in a portfolio of crop and livestock production and off-farm employment.
2.10. For several main crops, such as cereals, pulses and potatoes, trend analyses indicate that stabilityaround an increasing trend is a major issue. Regressions for production, area and yields were estimated for theperiod 1964-1992, or 1991 if data were not available, with and without intercept and slope dummy variables forthe period between 1987-1992 (or 1991) to account for the 1987 reforms (Tables 12-14). It may be prematureto expect results as a consequence of the 1987 reforms but the evidence indicates that stability of production isa wajor issue that does need to be addressed by policy makers and researchers.
2.11. For cereals as a whole and specifically for durum and barley, there are statistically significantincreases in the trends after 1987 for area and production but not for yields (Table 12, Figures 3-5). This impliesthat most of the production increases are due to area expansion, into fallow, into marginal lands or at the expenseof other crops. Invariably, these regressions have low correlation coefficients indicating substantial residualvariation around the trend. For bread wheat, there are no statistically significant shifts in trends after 1987, whichindicate a downward trend in area, an insignificant trend in production and hence a slight upward trend in yields.Stability in cereal production depends on sustainable yield increases brought about by the development andeffective extension of adapted improved technologies that are economically viable. While this will not eliminatethe effects of weather totally, it can reduce them and enhance stabfility. Evidence from countries with similaragroecological conditions, such as Turkey, show that this is feasible. The adjustment of the research andextension organization to the new structure of agriculture could expedite effective results in this direction.
2.12. Similar trend regressions for faba beans, chickpeas and potatoes show varied results (Tables 13-14, Figures 6-11). For faba beans, an irrigated crop and hence not as susceptible to variable rainfall, there arenot only no statistically significant changes in trends after 1987 but yields actually show a significant downwardtrend. For chickpeas, invariably produced under rainfed conditions, the story is exactly the same, except that theresidual unexplained variation is considerably higher. For poatoes, a high priority crop under current

5
Government policies, there are significant upward production and area trends that do not change after 1987 andthere is very little residual variation (i.e., high correlation coefficients). For potato yields however, even thoughthere is a significant upward yield trend which does not change after 1987, the residual variation around the trendis quite high, indicating a high degree of instability.
2.13. IUvestock Production. The livestock sector accounts for around 50 percent of the agriculturalGDP and has been a primary source of agricultural growth. Depending on the subsector, this can be attributedto more liberal market conditions, protection in the form of quantitative restrictions (QR) and high tariffs onimports, or specific incentives provided by the State through price supports and input, particularly feed, subsidies.The State continues to play a pervasive role, especially in the dairy industry, in: (i) input and service delivery;(ii) producer and consumer price setting; and (iii) distribution and marketing. The private sector plays a dominmtrole in production, but it faces obstacles in participating in trade, marketivg and processing, due to the operationsof large monopolistic PE.
2.14. Trends il Livestock Production. The compositon of the Algerian herd is dominated by sheep(Table 15). Over the past 12 years, despite the severe drought of 1984-1987, the ovine populadon grew at 2.5percent anmually, from 13.4 million to 18 million heads. Cattle and goat populations have been stable. In the meatsubsector, because of QR on imports, supply is based mainly on local production (Table 16). The SSR for redmeat has averaged 90 percent for ten years. In 1991, shares in total supply were: poultry, 46 percent; mutton,30 percent; beef, 20 percent; and goat meat, 4 percent. Red meat production grew at an average rate of 6.7percent annually between 1981 and 1992. Meat marketing and processing are dominated by the private sectorwhich controls an estimated 95 percent of transactions, in both official and clandestine markets. The poultryindustry expanded dramatically between 1980 and 1987, with the production of meat increasing from 98,000 to225,000 tons (12.6 percent per year), and the production of eggs from 308 to 2,800 million (37.1 percent peryear). This growth has been achieved primarily in the modern private sector, spurred by high prices in liberalizedmarkets; availability of credit for investments, especially for egg production; and important public investmentsupstream in the production chain whereby the public sector controlled input supply (animal feed, chicks, parentstocks, veterinary products, and equipment). However, the 1987 reforms affected the public sector in poultryinputs adversely. The disrupted input supply, with stges and price increases, affected the economics of bothegg and broiler production, which, in 1992, dropped to 2,068 million eggs and 189,000 tons of meat. Translatedin terms of per capita annual consumption, both egg and meat consumption decreased from 125 eggs and 10 kilosof meat in 1987 to 80 eggs and 7.5 kilos of meat in 1992.
2.15. The Dairy Sector. Since the early 80s the Government has promoted milk production to improveself sufficiency (SSR remained at 35 percent in 1992). Due to consumer subsidies, the consumption of milk isvery high compared to neighboring countries: in 1991, amual per capita milk equivalent consumption of dairyproducts amounted to 116 1 in Algeria, 53 1 in Morocco, and 70 1 in Tunisia, compared with WHOrecommendations of 901. Annual per capita consumption increased from 54.51 in 1969 to 94.5 1 in 1985, andto 116 1 in 1991. Imports represent about 60 percent of the total consumption and 97 percent of the milkprocessed by the national dairy industry (Table 19).
2.16. Milk is supplied from three different sources:
a. Locally produced milk, mainly consumed on-farm or sold in the market, is estimated to amountto 35 percent of the total supply in 1991. Domestic milk production has registered a 75 percentincrease between 1984 and 1991, due to strong Government support (Table 17). However, only3-4 percent of domestic raw milk production is collected by the parastatals. The limited but livelysector of peddlers provide milk direcdy to the consumers or to small businesses which produceyogurt and cheese (Tables 17-18).
6
b. Skim milk powder (SMP), imported and reconstituted by the regional daily boards represents 31percent of total supply. The milk industry is dependent on imported milk powder used forreconstituting. Imports represent more than 60 percent of the overall national consumption.Between 1985 and 1992, the dairy boards imported about 700,000 tons of SMP together with175,000 tons of butter oil (matire grasse laWtiAre anhydre, MGLA), representing an average of87,000 tons of SMP a year. The import bill increased from US$80 million in 1985 to US$300million in 1992 due to increases in prices and volumes.
c. Imported Ia/da (ready to use powdered milk) represents 34 percent of total supply; between 1985and 1992, about 580,000 tons of lakda were imported by the public sector.
2.17. Technical Constraints in Livestock Production. Technical constraints are the criticalimpediment to livestock development in Algeria and the Govermment has focused on technical issues for a longterm strategy. To improve the efficiency of livestock producdon, policy issues such as trade restrictions, privatesector development and the dominance of the public sector in production and input supply also need to beaddressed with priority in a long term strategy. The four major technical constraints impeding livestockproduction and productivity in Algeria which need to be addressed with priority are:
a. A structural feedstuff deficit which currently amnounts to 50 percent of the estimated needs of 9.7billion forage units (UF). 6 Of this need, 3.2 billion UF are met by forage and 1.5 billion UFfrom concentrate, mainly barley. A primary factor in this deficit is the low yields of forage cropsand rangelands. Finally, this deficit is aggravated by the poor quality of the cultivated forage andanimal feed, especially in terms of protein content. The balance is covered by increasing grazingpressure on the rangelands, marginal and fallow lands, and increasing the use of straw andstubble.
b. Inadequate delivery of veterinary services prevents improvement in animal health. Lack ofresources for compulsory campaigns and vaccine shortages, especialy in the remote Mkiya,result in very low vaccination coverage and inadequate epidemic surveillance. The privatizationof veterinary services is well advanced. However, the public sector's dominance in input marketshinders further development of private practice. In particular, veterinarians face constraints dueto: (i) limited access to credit; (ii) shortages of adequate veterinary products; and (iii) competitionfrom free public services.
c. Weak genetic improvement programs due to: (i) inadequate artificial insemination (Al)technology,; (ii) lack of a national strategy for selection and performance testing, especially oflocal breeds; and (iii) inadequate follow-up of the performance of improved animals.
d. Deficient livestock management practices which have resulted in productivity declines, especiallysince the 1987 reforms and in the modern sector which was concentrated in the DAS. Also,agricultural services (research, extension, and other production support services such as Al) areinadequate to support small and geographically dispersed farms. As a result of feed grainsubsidies, the use of concentates in ruminant intake, particularly barley, has increased butwithout consequent improvement of livestock productivity.
6 One standard forage unit is the equivalent of the energy provided by one kg of barley.

7
3. M Policies Affecting the Agcultal Sector and Agricultural Services
3.1. Fal Measures towards Agriculture. The Government considers the agricultural sector astrategic sector, which is allocated priority in production subsidies, current public expenditures and publicinvestments.' These expenditures are in addition to the consumer subsidies for several basic commodities (in1993, semolina, flour, bread, milk and baby food) covering the difference between the costs of domesticproduction or the costs of imports and the fixed consumer prices." As these are welfare expenditures, they willnot be discussed here, but they do exert an adverse influence on the efficiency of agricultural narkets and theinterest of the private sector in these markets.
3.2. The planned 1993 budget relatives affecting agriculture were as follows:
Budgetary line item DA billion Percent
Total revenues 336Toull expenditures 504
of which:Curent expenditures for agriculture 281 60.3
of which:Ministry of Agriculture 3.3 0.65Production subsidies 11.6 2.30Seaonl credit interest rate subsidies 0.7 0.14
Consumer subsidies 23.0 4.56
Investment expenditures 200 49.7of which:Agricultural and irrigation investments 18.2 3.61Rural electrification 4.4 0.86Long term credit interest rate subsidies 0.3 0.06
ERIAD 0.42Chambers of Agriculture 0.14
The 1993 Plan defines the following specific pnority areas which appear to be exhaustive of agricultural activities(* indicates that the activity will also benefit from interest rate subsidies): (a) land developmen (*); (b) agriculturalactivities on newly developed lands; (c) hydraulic exploration (*); (d) cmerl, pulse, and forage production; (e)indusi afforestation; (f) water recycling and treatment; (g) inDras ural and on-farm production relatedinvestments; (h) palm groves and other mstic plantations; (i) aquaculture (*); 0) trituration and refining of oilseeds,yeast prduction, sugar refining; (k) fertilizers, fertilizer inputs (*); (1) cold storage of seeds and plants; (m) smalland medium irrigation in zones to be promoted; and (n) storage infrastructure for strategic cereals (*).
In 1992, such expenditures for social safety comprised DA 20 billion of direct assistance and DA 34.3 billion inconsumer subsidies. The planned expenditures from the 1993 Budget were DA 24 bilion and DA 23 billionrespectively.

8
3.3. Current expenditures planned from the 1993 Budget entailed DA11.6 billion of productonsubsidies as price guarantees, DAO.7 billion of interest rate subsidies for seasonal credit and DA3.3 billion forthe Ministry of Agriculture (5.1 per,.ent of the total current expenditures). Only DA6.7 billion of productionsubsidies could be disbursed due to drought. For investment expenditures, explicit allocations were for DA4.35billion for rural electrification and DA18.24 billion for agriculture and hydraulics, together comprising 11.3percent of public investments. In addition, there were capital operations of DAO.3 billion for the long termcomponent of the interest rate subsidies and an unknown amount for the reimbursement of the losses(assainissen en) of the PE input (mainly fertilizer) producers and distributors, due to the Government'sintervention in reducing input prices in 1992. Treasury operations that do not appear on the Budget also coversome of the PE losses. Finally, there are extrabudgetary expenditures (varafiscalite) of DAO.55 billion for theChambers of Agriculture and the regional PE for Cereal Processing (ERIAD). While some of the relativemagnitudes may appear to be small in terms of fiscal burden, their effects on the agricultural sector are quiteimportant. Furthermore, when projected deficits amount to a third of expenditures, all magnitudes need to bescrutinized as potental fiscal burden.
3.4. On taxation, agriculture benefits from a multitude of exemptions. Agricultural incomes arisingfrom the production of cereals and pulses and on-farm poultry production of a non-industrial naure are exemptfrom taxation "permanently" and incomes from agricultural (including livestock) activities are exempt fromtaxation in areas identified as (a) development zones, for a period of 10 years; and (b) in mountain zones, fora period of 5 years. Many agricultural products and inputs are either exempt from or have low rates of VAT.9The sale of live animals, cereals and milk, are also exempt from VAT, while sales operations regarding pulses,rice and aquatic anials and plants are subject to a 7 percent rate. Imported inputs for priority activities andscientific research equipment are exempt from customs levies. The exemptions will be lifted in the financinglegislation (loi desfinances) of 1995. Invements in priority activities are exempt from VAT and imported inputsfor these investments benefit from a low customs levy of 3 percent. Finally, agricultural land and farm buildingsare exempt from taxation except for the EAC and EAI which have to pay for usufruct rights (redevance dejouissance) at a rate varying between 120-1200 DA/ha according to zones.'0 The loi des finances of 1994 hasintrduced a land tax over private agricultural land and has raised the redevance de jouissance for the EAI andEAC from 1200 Dafha to 7500 DA/ha. Construction of buildings for the priority activities benefits from a 5 or10 year exemption, the latter in the case of location in development zones. These exemptions, along with actualproblems of collection, reduce the role of agriculture as a public revenue source.
3.5. Prodution Subsidies. Production is subsidized through output price supports. Furthermore, someprocessed agricultural products are subject to price and margin controls at the production and distribution levels.The list of agricultural products and inputs subject to different levels of control is given in Table 20. Explicitinput subsidies have been eliminated but implicit input subsidies occur at the level of imported inputs whichbenefit from the overvalued exchange rate and some are further exempted from customs levies and VAT. On
9 Veterinaiy medicines, agricultural protection chemicals, sheet plastic for greenhouses and equipment for priorityactivities are exempt from VAT. Animal feeds, fertilizers, poultry inputs and many imported inputs benefit froma reduced VAT rate of 7 percent. Livestock, tomato concentrate and honey sale operations are subject to a 13percent VAT except for red meat which is subject to a slaughter tax. For some higher value fruits and fish, VATis as high as 21-40 percent. Financial activities are subject to VAT of 7 percent for insurance and 10 percet forbank operations.
10 As her is no comprehensive and effective cadastre, land taxation would be difficult to implement. Furthrmore,in some wzlaya, the list of the EAC/EAI beneficiaries has not been compiled, making their taxation difficult.

9
occasion, such as in 92, they benefit from price reductions to be financed by the Budget (assainissemet)."Finally, confounding the objectives of social equity and production efficiency, cereals, pulses and most inputsare subject to panterdtorial price equalization (p&nquaton).
3.6. The main policy ins ent utilized to influence agricultural production is the guaranteed price.These currendy cover cereals, pulses, potatoes, industrial tomatoes, oil grains, sugar beets, onion, garlic, rawcow's milk, tobacco and seeds for cereals, pulses, potatoes, forage grains and garlic (Table 21). The subsidiesimplicit in the guaranteed prices are budgeted for according to the difference between a reference price and theguaranteed price and financed by the 'Fonds de garantie" from the budget. For major comnodities such ascereals and milk, the reference prices are based on imports.)2 For others, there is either an apparenly arbitraryreference price, subject to change, or, the sales price is the reference price, which is bound to be variable unlessalso controlled. The reference and guaranted prices for cereals and pulses in 1993 are as follows:
Cereals Reference Guarnteed Prcent Pulse Reference Guaranteed PercentPrice Price over and Price Price over
(DAMM (DAIMT) Reference Rice (DAAMI) (DA/MT) Reference
Durum wheat 4,082.5 10,250 151 Harkot Beans 11,802.0 29,700 152
Bread wheat (hard) 4,082.5 9,100 123 Lentils 11,802.0 25,250 114
Bread wheat 4,285.0 9,100 112 ChIckpeas 11,802.0 17,200 46
Barley 3,587.5 4,700 31 Rice 11,802.0 14,000 19
Oats 2,890.0 5,100 76 Faba beans 11,802.0 12,900 9
maize 3,M50.0 11,700 260 Feverolles 11,802.0 11,600 -2
Tritkale 3,565.0 7,150 101 Dry peas 11,802.0 13,400 14
3.7. While the cereal reference prices appear to be based on import costs, the constancy of referenceprices for the heterogeneous group of pulses and rice indicates that support price decisions need to be taken withan adequate assessment of their effects on production or the Budget. The initial 1993 budgetary allocation ofDAI 1.6 billion for this purpose was distributed as follows, but due to the drought, budgetary allocations reachedonly DA 6 billion against the projee DA 11.6 billion:
DA miMon DA millionAlocated Disbursed
Cereals and pulses and their seeds 9,500 4,449Industrial tomatoes 630 796Potatoes and seed potatoes 1,200 1,086Garlic seeds 10 -
Oil grains 2 -
Raw cow's milk 240 437
Total 11,582 6,768
Some of these are actually subsidies to compensate for (and thus prevent farmers from payng for) the inefficienciesof the domestic producers and distributors of inps.
12 The calcuaion of the consmer sbdies for the imported goods is also based on these reference prices.

10
3.8. Guaranteed production prices will manifest their effects maily on the relative profitability ofdifferent commodities to the extent they are above market prices and provided it is possible to substitute the moreprofitable commodities in place of others in the various agroecological zones. The tool used for this purpose isaverage costs of production for the country as a whole (Table 22). Hence, the approach will be successful to theextent that these budgets approximate the costs of production of a large number of farmers. The margins providedby the guaranteed prices favor wheat and maize against barley, oats and tridcale. Among pulses, lentils, peas andchickpeas are provided higher margins than others and among vegetables, garlic has a prominent position. Seeds,in general, are provided higher margins due to the policy of self sufficiency in seeds.
3.9. Within this framework, the emphasis is on cereals. The policies of the past two years havechanged relative prices between durum and bread wheat against the former (Figure 12). As the average marginsforeseen are the same, bread wheat production would have been expected to take off and substitute, wherepossible, for durum. Similarly, between wheat and barley, relative prices and relative profitability have developedagainst the latter (Figure 12), leading to the expectation for barley production and area to fall.'3 On the contrary,both durm and barley production have taken off while bread wheat production has stagnated.14 This illustratesthe need to analyze the potential effects of policies.
3.10. The system for implemeting the guankteed prices is most convoluted and entails comp tingpayments between public entities involved in storage, imports, collection and processing. This complex systemof controls is confounded furither by the measures ahning to achieve pirOquadon for social objectives, whichwould encourage production in areas not suitable for specific activities. For this reason, as well as for reasonsof effectiveness and efficiency, a simpler and more transparent system of implemendng price guarantees wouldbe desirable. However, this should above all be based on a sound review of the objectives and an assessment ofoptions with respect to the tools that can be used to achieve these objectives.
3.11. An issue related to support policies is that of comparative advantage. According to the resultsof a study on prices and incentives, analysis of domestic resource costs (DRC) suggests that Algeria hascomparative advantage in cereal production under conditions that produce higher yields (Tables 23-24). I Thiscould be the justification for investing in technological improvements to increase productivity and the stabilityof production. The issue is whether these lines of crop production need to be supported to the extent they are.Ignoring the input subsidies, the current guaranteed price of bread wheat is DA9, 100/MT, which, at the officialexchange rate of DA23.4/US$, is equal to US$388/T.16 This is about two and a half times the current
is Some officials have indicated that at the basis of this policy of reducing the relative aiveness of feed crops isthe objective of reducing the reve profitability of livestock production vis-&-is cereal poduction. However, asmost livestock product pnces are not controlled, they can increa to some extent based on demand condiions, tomainin a degree of parity with cereal prices.
14 There are two reasons why barley production has taken off. One is the fairly interesting guaranteed price, albeitreltively less aractive than durum or bread wheat. The more important one is that the demand for barley isderived demand, driven esentialy by livestock product prices, which are largely uncontrolled (mainly red meat).This facilitates the conversion of the barley output into lucrative livestock production.
This study is based on farm technology models of 1988/1989 and on the beter known information of the EAC/EAI.Acta input use has decreased in subsequent years, which would influence the results of the study.
It should be noted that the guaranteed cereal production prices for 1993 remained at the same nominal levels asthose of 1992. Given the high infation rate of 31.8 percent in 1992 and the projected inflation rate of 30.2 percentin 1993, there is a significant drop in these prices in real terms. It will be interesting to assess the response offanners tothese real changes. Furthermore, the implicit nominal protection coefficient (NPC) would be considerablylower at the mar exnge rate of DA 3540/US$, lowering the effects of protection of the price supports.

11
international price and nearly three and a half times the concessional price at which Algeria has been recendyimporting wheat. Budgetary resources could be targeted to areas which can produce better results in terms ofproduction. Furthermore, increasing self sufficiency in the so called strategic area of cereals has to be assessedwith respect to costs and benefits. Such in depth analysis does not appear to be at the foundation of the supportpolicies.
3.12. Livestock Product Prices and Subsidies. For livestock products, with the exception of milk,the Government is not directly involved in price determination but does exert influence through price controlson agricultural products such as cereals. In the meat market, the most important policy interventions are hightariffs (about 45 percent) and QR which have culminated in a ban on meat and live fattening animal inmports in1993. For milk, subsidies hold consumer prices considerably lower than official producer prices (DA5/1 retailprice against DA1 I/1 ex-factory price for reconstituted milk). The guaranteed farm-gate price for domesticproduction is DAS.5/1. In addition, there are producer price subsidies, through guaranteed prices, which wereestablished to boost the collection of local milk. In the dairy marketing chain, controlled consumer prices andcommercial margins have had four major effects: (i) leakage of subsidized milk through illicit reexports toneighboring countries, estimated to about 15 percent of imported SMP; (ii) price distortions within the dairysector whereby local processors prefer to transform subsidized milk rather than fresh milk; (iii) the controlledprices increase the fiscal burden; and (iv) low consumer prices have increased milk consmption in Algeriabeyond the international standards of consumption currently recommended.
3.13. For animal feed, most of the subsidies have been eliminated. Some direct subsidies remain, suchas those on concentrates, mainly barley, which are distributed free to producers during drought periods. Thiseliminates the traditional regulation of the sheep population according to climatic conditions, thus increasingpressure on ecologically already fragile grazing areas. There are also indirect subsidies to PE such as thepreferential access enjoyed by the feed industry to barley at adminisered prices.
3.14. DRC analysis for the livestock sector was conducted for bovine and ovine production (Tables 25-26). The results indicate that Algeria has comparative advantage in these areas for extensive to semi-intensivemodes of production. The basic issue is that these modes of production rely on exploiting commnon resources ofgrazng, such as pastures and forests. The potential for overexploitation of these "free' resources impliessignificant real social costs in terms of the degradation of resources. Hence, if these costs could be factored intoanalysis, the results would change.
3.15. Trade and Foreign Exchange Regimes. Trade and exchange rate policies exercise a decisiveinfluence over agricultural development in Algeria. These policies have gone through several important changessince the initiation of the economic reform program in 1987. A review of recent developments in the exchangerate and trade regimes will be followed by the specific implications for agriculture in general and agriculturalservices in particular.
3.16. Exchange Rate Policies. Until the end of 1988, official foreign exchange (i.e., foreign exchangeaccruing to the Central Bank) was centrally allocated through import licenses to designated importers. Since1988, this system has been progressively liberalized. Commercial banks were authorized to offer private foreignexchange accounts to individuals and firms and a foreign exchange retention scheme was also introduced. Formost industries and services, the retention rate was 100 percent but agricultural and fishery products had a 50percent retention rate and wine only 20 percent. While domestic firms could retain foreign exchange earnings,and use them to finance their imports, they could not legally buy domestic currency at the "market" price norreflect such "market" prices to their costs, as such currency transactions were only authorized at the official rateof exchange. This undermined the benefits of the retention policies. Starting April 1994 and in conformity with
12
the arrangernts under the Stand-By agreement, export revenue retention rates are fixed at 50 percent for allagricultmal, industrial and service products17.
3.17. In April 1991, the introduction of convertibility for merchandise import transactions and theabolition of most import iicenses for all but "strategic" conHmodities were followed by a devaluation of the officialrate from a level of DAS.9/US$ in June 1988 to DA22/US$ in October 1991. Despite this real devaluation ofover 60 percent, excess demand for foreign exchange at the officid rate persisted, due to the raised burden ofexternal debt service, increasing difficulties in raising new credit, and persistent macroeconomic imbalances, andthe financial system continued to ration foreign exchange and eternal credit among importers. These problemsled in September 1992 to the New Economic Program (NEP) which defined a more gradual liberalizaion processby stabilizing the nominal exchange rate at around DA22/US$'8 and establishing an ad hoc inteministericommittee (comiMt ad hoc; CAH) which ensures that the economic and strategic goals of the Government arerefected in the volume and composition of imports. Top priority is accorded to stimulating production,preserving jobs and meeting basic social needs. This is accomplished via the discretionary allocation of officialforeign exchange and external credit. All import transactions over US$100,000 financed with official foreignexchange or external credit must be approved by the CAH. The overall effect of the CAH system has been toreduce the efficiency of foreign exchange allocation through delays and arbitrary decisions. The system hascred new non-tariff bamers which incite rent seeking, speculation, and misallocation of resources as well asa widening of the differential between the official and parallel foreign exchange rates. The April 1994 Stand-Byagreement with the IMF has resulted in many changes in the right direction, namely, the devaluation of the DAby 50 percen to reach the equivalent of DA36/$ and the elimination of the CAH.
3.18. Trade Poldes. From 1987 untiP the middle of 1992, trade reforms were gradually implementedin parallel with the liberalization of foreign exchange allocion. At the beginning of the period, most goods couldonly be imported through goverment-sanctioned, monopolistic PE importers. By mid-1992, the system evolvedto the point where licensed foreign or domesic importers are authorized to import legally all goods that are notbaned. Import licenses are no longer required, except for a limited number of "strategic" commodities (mainlyfood staples, construction materials and pharmaceuticals) which require a cauier des charges (CDC). StartingApril 1994, the CDC has also been eliminated and replaced by professional nd technical criteria that importersmust meet to be able to import "strategic" products.
3.19. In January 1992, a major tariff reform was enacted subjecting imports to: (i) a customs duty; (ii)an ad valorem compensation tax (to finance consumer subsidies); and (iii) a uniform customs tax of 2.4 percent.Among other actions, the reform reduced the number of tariff rates from 18 to seven (ranging from 0 to 60percent); cut the maximum rate from 120 to 60 percent; and reduced the number of exemptions. In the absenceof detailed 1992 data, the effects of the reforms on agricultural products can not be assessed, except that tariffson agricultural products have come down in line with the overall reductions, and that the reduction in the numberand range of duty rates, together with the unification of the compensation tax rates, has resulted in a significantdecline in dispersion (rable 27).
3.20. However, the non-ariff barriers implied by the exchange and trade restrictions, introduced aspart of the NEP in 1992, have reduced the benefits frm the tariff reform. In addition, the NEP has reintroducedcxplicit trade restrictions that divide imports into three categories of descending priority: (a) strategic commoditieswvhose imports must be submitted in advance for CAH for approval; (b) imports tied to national production and
In principle, the retention rate for subsidized products should be smaller than the retention rate for non-subsidized
The official exchange rate is linked to a trade-weighted basket of currencies and so in pracdce flucuaes somewhataround this value.
13
investment objectives; and (c) imports of "laixury" goods, which accounted for approximately 12 percet of totalimports in 1991, are now banned. In accordance with the Stand-By agreement, the restrictions introduced by theNEP in 1992 have been reduced and are now limited to two main import lists. The first list includes around 10essential and strategic commodities where imports are subject to the professional and technical criteria previouslymentioned'9. The second list enumerates imports that are temporarily suspended (until the beginning of 1995) toallow domestic production to develop.
3.21. Agricultural Trade. The current system serves to reinforce the distortions in Algerian agricultureby perpetuating the goal of cereal and other "strategic" foodstuff self sufficiency while at the same time restrictingimports of technologies and inputs necessary to increase the competitiveness of domestic producers (Table 28).The objective of the CAH was to satisfy primarily the production needs in input supply, spare parts, and varioussupplies (packaging, etc.) and secondarily to satisfy investment needs. Before the elimination of the CAH in April1994, approximately 40 percent of agricultural input imports fell below the US$100,000 floor for CAHprocessing. These imports comprised principally seeds, tractors and spare parts and, like all other officialimports, were imported at the official exchange rate. Although the CAH was created to allocate in the bestpossible manner Algeria's meager foreign exchange resources, this has resulted in a substantial undervaluationof their worth and caused an inefficient and inappropriate allocation of scarce inputs. These problems werecompounded by the delays in the processing of demands for foreign exchange by the CAH. For agriculturalinputs, a lag of one to four months was to be expected. With delays averaging around nine weeks, considerableforward planning and high levels of stocks were required. Delays in the supply of agricultural inputs, such asseeds, pesticides or fertilizers, were particularly disruptive. For imports valued at over US$100,000, applicationsto the CAH followed the process described above. Fertlizers, phytosanitary products and veterinary imports wereseen as priority imports and typically approved by the CAH with a two to four month delay. Spare parts foragricultual machinery and equipment, animal feedstuffs and irrigation equipment and parts had lower priority,and hence suffered from delays and restrictions i-l foreign exchange allocation and imports. One result is thatimporters had a tendency to overstate their requirements and carry excessive stocks. These adjustments to thereguations did not however allow them to act m an efficient manner; on the conry the agricultural servicesand inputs sector have suffered from the restrictions placed on foreign exchange. Finally, there are import banson live animals (except breeding stock), fruits, sea products and most dairy products (except powder milk andbaby fomula). Export bans covered palm plants, cork (unprocessed), livestock (ovine and bovine), dates onbranches, bran and bran products and horses.
3.22. Tariff levels in agriculture are significantly below those in other sectors and in 1992 were reducedto an unweighted mean of just over 20 percent. The tariff levels for most products whose imports are permittedare zero percent. With the ad valorem compensation tax and 2.4 percent customs tax, the total trade tax is seldomover 10 percent. In the case of seeds, fertilizers, water pumps, agricultural tractors, harvesters, productionmachinery and dairy equipme, the customs di-j -- Yro. For grain milling machines, it is 3 percent and forother food processing equipment 5 percent. Animal feeds, including maize and oilseed products, are subject toa 3 percent customs duty. The level of trade taxes applicable to agricultural inputs and services is low, even byintemational standards. Progress on this front, however, masks the QR which result in much higher levels ofefective protection. The CAH has become the principal instrument for the implementation of the QR and thepervasive restrictions on foreign exchange mean that taditional trade insuments are no longer an effectiveindication of trade policies. Presently, the customs duty have been raised from 3 to 7 percent for seeds andcereals and from 15 to 17 percent for agricultural equipments, fertilizers and animal feed. A customs duty rateof 25 to 40 percent is applied to agricultural products, fishing products, fishing equipments, agricultral tools,and spare parts.
The 10 esst and saegic products are durum and bread wheat, barley, flour and semolina, powdered milk,coffee, tea, suga, phamecal products, and basic surgical matr and equipmnts.

14
3.23. The trade and foreign exchange regimes thus affect agriculture in three specific or general ways.First, the overvalued exchange rate implicitly subsidizes imported inputs, discourages foreign investment byovervaluing nontradables and prevents the development of potential agricultural exports. Second, QR add todistortions, and the requirement thz- all essential and basic imports be subject to the professional and technicalcriteria is implemented mainly in a way to block private sector imports and provide preferential access to thelimited foreign exchange resources at the official exchange rate to the monopolistic public sector importers.
3.24. Third, production subsidies for the policy of increased self sufficiency in agricultural productionand inputs compensate for lack of competitiveness. Liberalization of the foreign exchange and trade regimeswould obviously affect the competitiveness of both basic production and processing as well as the input industries,assuming that there are no countervailing policies to protect specific actvities. Such liberalization is bound tohave a shock effect on agriculture unless managed through a well designed transition process. In particular, dueto the high capital intensity of the agricultural input industries and thieir dependence on imported equipment andinputs, these industries will face significantly increased costs that will reduce their competitiveness vis4--simports. Any Government program to minimize the impact on agriculture should be within budget constraints;and any subsidy programs for agriculture should be explicit and avoid a preferential exchange rate as the mediumfor subsidies. Within this framework, self sufficiency policies should be tempered by conceding to the technicaland economic constraints and focusing on food security based on comparative advantage.
3.25. Finally, Algeria is not isolated from the distortions in international markets. As a major importerof agricultural products, Algeria benefits from export promotion programs in developing countries. Informationon cereal imports through the Export Enhancement Program (EEP) of USA is given in Table 29. While theseprograms do benefit the importers and consumers, they do have an adverse effect on production that Algeria, likemany other countries, tries to compensate for with subsidies that are ill afforded under dire budget constraints.Another adverse consequence of these programs is that they are Govemment to Government sales to ensurepayment guarantees; thus they exclude private sector inolvement and encourage the perpetuation of PE monopolypowers (e.g., OAIC).
3.26. Rural Finance and Interest Rate Poicies. Formal credit sources provide a very minor part ofrural finance. The main sources of rural finance in Algeria appear to be the informal credit resources, paymentfacilities provided by cooperatives involved in input provision, and autofinancing. Formal credit has beenorganized under BADR, an autonomous commercial bank founded in 1982. Untl 1987, it was primarily involvedin financing the DAS, whose debts were guaranteed by the Government. After 1987, BADR had to finance anagricultural sector dominated by private farms. Without the guarantee of the State, BADR has been reluctant toassume the transactions costs and risks associated with rural finance, particularly when interest rates arecontrolled by the Govermment and are negative in real terms. It ha- also had a very high rate of repaymentarrears, which has made many farmers ineligible for BADR credit. Hence, agricultural credit from BADRsources has been falling precipitously. Out of an estimated one million farms, BADR currently serves around60,000 farmers but over 95 percent of its portfolio is directed at the Pilot Farms (Table 30).
3.27. Currently, nominal interest rates are 20 percent and have been raised in 1994 to an average rateof 24 percent, but hey are still negative in real terms. In addition, the Govemment has decided to extend interestrate subsidies to priority areas in agriculture. This entailed a 1993 budgetary allocation of DA700 million ofinterest rate subsidies for working capital, which would be subject to 8 percent interest, and, of DA300 millionfor investment credit, which would be subject to 5-6 percent interest. The budgetary allocations cover thedifference between the maximum interest rate of 20 percent and the subsidized interest rate. The interest ratesubsidies pose two main problems. First, the budgetary allocation of DA1.0 billion for interest rate subsidieswould cover about DA7-8 billion of agricultural credit at most. This is quite modest in proportion to the VA ofDA147 billion projected for 1993. In other words, even if the possibility of rationing is ignored, these subsidieswill benefit a select few among the agriculral producers, and are tantamount to an income transfer that also

15
distorts financial markete. The second obvious problem is that interest rate subsidies make capital and capitalintensive methods cheaper: this is a basic contradiction in a sector where official unemnployment has surpassed25 percent. As a legacy of these policies, compounded by subsidies for fuel and high minimm agricultural wagesimplemented under socialist agriculture, Algeria uses considerably higher levels of machinery and lower levelsof labor in production than its neighbors in the Maghreb (Table 34). Policies that encourage techniques that aremore in conformity with the factor proportions in the country would be more conducive to efficiency as well asincreased employment.
3.28. Employment. Agriculture currently employs about 25 percent of the labor force, equivalent toover one million people. The extent to which these data are based on sound statistical evidence is not clear andmore needs to be understood about rural employment patterns through surveys and case studies. The erraticmovements in employment appear to be manipulations of data rather than actual measurement (Table 3). Aderivative of the data is the share of agriculture in employment creation which varies from 0 to 56 percent,excluding the net loss of 1990. In 1993, agriculture was expected to contribute 24 percent of employment creationwith 30 thousand jobs. These data indicate that employment issues in agriculture need to be subjected to seriousresearch or policy analysis. In the face of policies that discriminate against labor intensive technologies inagriculture, expectations of substantial employment creation do not appear realistic.
3.29. The n,ore precise data from the 1987 Census indicate that the rural unemploymet rate of 26percent is higher than the national average of 22 percent unemployment (Table 4). Other information that canbe gleaned from the 1987 Census indicates that agricultural female labor comprise only one percent of theagricultural labor force. This is a highly atypical situation that may reflect cultural attitudes and merits furtherrefinement with case studies. Thus, the female unemployment rate appears to be lowe, than male's for both rurallabor and heads of household. However, the unemployment rates are higher for both rural female and male laborand heads of household as compared to urban counterparts.
3.30. Reflection on Policy Objectives. The pervasive nature of implicit and explicit supports inagriculture, as well as the inconsistency between some of the policy measures require some reflection on policyobjectives. The basic issues are that (a) it is difficult to find an explicit statement of policy objectives that gobeyond the rhetorical; and (b) there is a high degree of confiusion of efficiency and equity objectives. Other issuesare whether: (c) any of the explicit objectives are realistic and economically sound; (d) some of the policyobjectives implicit in the measures taken are realistic and consistent; and (e) the policy measures taken are thebest to achieve the given objectives.
3.31. One overriding Goverment objective related to production is to increase the degree of selfsuffcieny focusing above all on cereals for human consumption. As indicated above, these policies lack thecritical component of addressing the issue of stability of production through productivity gains. As such, anyconsequent production gains will be opportunistic and ephemeral. The realism of these policies, when the overallSSR is around 20 percent, is doubtful. They thwart the development of products for import subsdtution orexports, where Algeria could have comparative advantage. In some cases, as in the case for seeds, it would beuseful to assess if the implicit savings of self sufficiency would justify the investment in the protected publicsector activities in seed production.
3.32. Improving the economic efficincy of production did not appear to be a policy objective. Onedemonstration of this is that both inputs and products received significant implicit or eplicit subsidies. Theconsequent distortions were compounded by inefficiencies in marketing and distribution due to organization(particularly PE dominance) and price and margin controls, and finally, consumer subsidies. In some cases where
20 For 1993, the disbursement of intrest rate subsidies has reace only 25 percent of the budgetay allocadons.

16 0
costs are transferred to farmers, they reflect not economic costs but the costs of the inefficiency PE productionand distribution.
3.33. Equity objectives predominated and the main tools used for this purpose was the variouspOriquaion schemes that equalized transport and handling costs, margins or the controlled prices over thecountry. This was one of the factors that prevented private sector involvement in such maikets. Of course, thisalso posed problems of preventing spatial and temporal arbitrage, bunching of harvest deliveries and inefficientinput provision that lacked price incentives to differentiate among markets based on real costs. Anothermanifestation of equity objectives is the priority given to less advantaged areas such as mountain zones, whichbenefit from tax exemptions and interest rate subsidies. It is clear that these measures would not have anyefficiency promoting effects but, as poverty reduction schemes, they merit closer evaluation.
3.34. The policy objective ofprovidngfood at low cost to consuners affects agriculture adversely. Theprice and margin controls used to achieve these objectives, as well as the use of PE to implement them,effectively served as barriers to entry for the private sector and precluded their involvement in these markets.While targeting welfare support to vulnerable groups would be justified, subsidizing all consumers would not.
3.35. In some cases the direct, implicit if not explicit, effects of the policies implied results that werein essence income transfers to agriculture. Given the limited resources for such purposes, the objectives can notbe achieved in an equitable manner. The use of prices and interest rates to accomplish income and equityobjectives result in market distortions that affect efficiency. While income policies may be justified, prices andinterest rates should not be tools used for this purpose; direct compensation is less distortionary.
3.36. Any concern about enployment objectives were undermined by policies that encouraged the useof capital intensive technologies. In this respect, further study is necessary to assess the possible existence ofsegmented labor markets and a dualistic farm structure, i.e., large farms using extensive methods of monocultureproduction with high levels of mechanical inputs on one hand and small diversified family farms using laborintensive technologies on the other. The potential of private sector ural services (retail inpUt supply, repairs, etc.)in creating employment has not been adequately assessed due to the preocwpation with maiiing PEdominance in these areas.
3.37. The objective of maintaining the natural resource base needs to be supported by a set ofconsistent policies. The limited defensive efforts in agroecological protection are defeated by price policies thatencourage the expansion of production into marginal and ecologically fragile areas.
3.38. The apparent confusion in policy objectives and policy tools reflected (a) the difficulty theauthorities face in the transition from a planned, socialist sector to a market oriented sector dominated by privatefarmers; (b) the pervasive paternalistic and benevolent attitude of the policy makers and administrators,compounded by recent political developments, and the preoccpaion of providing food at low cost to consumers;and (c) the need to develop policy analysis capabilities in the public administration for agriculture.
3.39. Since mid-1994, the economic and structural reform activities initiated by the StabilizationProgram have started to rectify some of these distortions. Medium term adjustment programs are being developedto design and sequence the economic, strctural and institutional changes under a market economy. Private sectoroperations are also expanding.

17
4. Output Distibution and Markeig Services
4.1. Current Status of Marketing. Agricultural marketing from farmers to food processors andretailers is either based on state marketing parastatals or on slowly reemerging tradidonal local markets andprivate wholesalers. The state owned marketing and processing channels are primarily orieed towards basic foodstaples: durum and bread wheat, wheat flour, semolina, sugar, edible oil and margarine, milk, and tomato paste.The agroindustral structure and the administrative channels used for its inputs and supplies reflect theconsequences of industrialization policies aiming at capital intensive methods and economies of scale contayto the factor proportions in the country. In particular, lack of product standardization and the instability ofmarketing, exacerbated by the current low degree of self sufficiency, force the large agroindustrial PE and theadministrative supply, marketing and distribution channels they use, to rely excessively on imports for rawmaterals and inputs. When dealing with imports, the large PE are able to operate in large quantides ofstanardized products to meet the requirements of their large capacities, whereas when dealing with domesticagricultural products, they have to collect small quantities of nonstdardized products. Thus, the bulk of the rawmaterias supply (55 to 70 percent of crop production and 65 to 75 percent of livestock production) in mostagroindustrial subsectors come from imports. In addition, for imports, the large PE usually benefit frommonopoly or quasi-monopoly powers and privileges.
4.2. With a high percentage of the country's supply coming from imports, the PE agroindustries,which benefit from import monopolies, had a share of only about 46 percent in total agroindustria output in1990. This figure is rather surprising and shows the potendal vitality of the private sector. The private sector ismore developed in four subsectors: fruits and vegetables, livestock and dairy products, and feed. Among the main:onstraints to private sector development have been: (i) access to raw materials; (ii) access to foreign exchange;
and (iii) low profitability due to administered prices and margins. Some of these constraints are beginning to beeliminated in 1994 with increased facility of access to raw materials, foreign exchange and liberalization of priceand margin controls.
4.3. AdmInitrative Agricultural Marketing Chanels. As of 1993, administrative marketingchannels operate under mortapolistic or quasi-monopolistic conditions in (a) the cereal subsector; (b) the dairysubsector; (c) the oilseeds subsector; and (d) the sugar subsector.21 There are few altemative outlets to Statechannels for farmers in the cereals and dairy subsectors. Algeran farmers do not produce nor therefore supplythe sugar and oilseeds processing enterprises. Also of significant size and impact on their respective subsectors,PE operate in the livestock feed subsector, the beverages subsector (wine, juices), and the tomato processingindustry and to a lesser extent, in the meat subsector.
4.4. Cereals.7 Cereal processing, under the aministration of the Algerian literprofessional CerealsBoard (OAIC), with five large state owned processing groups (ERIAD), and 39 parstat cereal "cooperatives"(CCLS), is largely based on imported raw materials. Eighty percent of semolina and 82 percent of flour sold toconsumers were imported or processed in Algeria from imported durum and bread wheat. A total of around11,000 personnel are involved in cereal marketing (OAIC; Union of Cooperatives, UCA; and CCLS), for sales(at the administered and subsidized prices) of DA28.5 billion (US$1.2 billion).
4.5. Large PE dominate the cereal processing subsector. Organized around five regional PE (theERIAD), the public sector comprises 132 plants of which 42 have more than one processing unit (Tables 31-32,Figure 2). The ERIAD are large enterprises: for example, ERIAD-Algiers operates 21 processing units with6,200 employees in two semolina mills, three flour mills, six mills for both flour and semolina, one unit for
21 The tobacco idustry is also entirely centmaly amintred.
Most of the discussion on cereals pertain to pulses as well.

18
semolina, pasta and couscous, two for pasta and couscous, five for biscuits and one for bread. ERIAD-Sidi BelAbbes, with about 5,350 employees, operates 37 units, all built in the early 80s, of which 16 flour mills processabout 280,000 MT, 15 semolina mills process about 235,000 MT, one snall corn wet milling plant processes35,500 MT, and four units for pasta, biscuits, couscous and bread process about 17,500 MT of wheat. In sharpcontrast, cereal processing in the private sector takes place in small and aging mills, mostly used for localconsumption in rural areas, covering about 40 percent of the domestically produced dunum and bread wheat, i.e.,about 8-10 percent of consumption.
4.6. Cerea Cooperatives (CCLS). With small exceptions, imported and domestic cereals to beprocessed into food for human consumption pass through the 39 cereal cooperatives. The CCLS have been leftoutside the legal framework of cooperative privatization in 1988 and are managed by a Director appointed bythe Government. The CCLS receive and store the small deliveries of the local farmers. Their more importantfimction is to serve as a transit point for storage of inmported cereals to be milled by the local ERIAD facilities.For imports, instructions are given by OAIC to the local UCA to take delivery of the wheat to be unloaded fromthe ship in the port elevator. Instructions are then given to the UCA to transfer the grain from the port silo toregional silos administered by the local CCLS and to the silos of the regional ER1AD. The CCLS usually takedeliverv of the grain at the port silo and transport it by road or train to their own silos. As the ERLAD have theirown storage facilities, the step involving CCLS storage would appear superfluous.
4.7. In all this process, most of the key economic, financial and commercial decisions on quantitiesto be delivered, stored and transferred are made outside the CCLS by OAIC together with representadives of theregional UCA and ERLAD, and by the Government through the OAIC on prices and margins at each stage ofthe markeing chain from the delivery at the port silo to the local processing facilities. The CCLS are not'cooperatives" in any sense of the term. Furthermore, due to the administrative controls over their activities, theyhave no incentive to operate efficiently. In a market enviroment, even with minor state intervention, thetransport and storage fmuctions of the CCLS can be performed more efficiently by the private sector.
4.8. The National Livestock Feed Board (ONAB), which receives small deliveries of domestic grains,is a minor actor in the cereal marketing chain. ONAB operates 24 processing units in the country, with 4,200employees and sales of DA7 bfllion (about US$300,000) in 1992. ONAB does not directly import cereals but,instead, buys about 750,000 MT of imported corn through OAIC (out of a total of about 1 million MT, theremaining quanities being distributed to the private feed mills). ONAB also directly imports around 250,000 MTof soymeal per year. Prior to 1990, ONAB was the only importer of feed grains and protein feed products inAlgeria. Domestic purchases of ONAB remain small; its management does not consider it is up to ONAB topromote domestic feed grain production. Small private feed mills are better able to buy small quantities locally.
4.9. Grain Storage and Trasportadon Equipment. Total storage capacity for cereals is 2.74 millionMT. One third of the storage facilities is considered obsolete by representatives of OAIC, with a rather largenumber of installations dating from earlier than 1935. A significant part of the transportation is made by truckand rail. UCA and CCLS use about 1,700 trucks (10 to 20 MIT), for a total truck transport capacity of about21,000 MT. Private truckers are now contracted by OAIC and have access to the pgrquation system for thetransportation of grain.
Individual procssing units are also large scale. Average annual production capacities are 28,000 MT for semolinaand 25,000 MT for flour. The Corso cereal processing complex of ERIAD-Algiers, in the wdaya of Boumerdes,has a grain silo of 125,000 MT, equivalent to a one year supply of the needs of its proceing units; a mill witha 400 MT/day capacity which produced 45,000 MT of semolina and 49,000 MT of flour in 1990 at full capacity;a pasta and couscous unit of 87 MT/day, but utilized at less than ful capacity; and an industrial bakey of 10,000MT capacity, utilized only at 30 percet apacity in 1990.
19
4.10. The Dairy Subsector. The dairy processing subsector is also supplied mainly by imports. Algeriaimports the equivalent of about 90 percent of its annual commercial dairy production requirements (between275,000-350,000 MT of SMP). Three regional boards process dairy products: Office R&gional du Lait et desProduts Laitiers du Centre (ORLAC) in the center; Office Regional Est du Lait et des Produits Laitiers(ORELAIT) in the east; and Office Regional Ouest du Lait et des Produits Laitiers (OROLAIT) in the west.Deliveries of domestically produced milk to the three PE was around 82 million I in 1987 and decreased to about37.1 million I in 1990 (3.6 percent of purchases). Total produlction by the thdee enterprises was about 1 billionI of milk equivalent in 1991 or about two thirds of total processing capacity (Table 18). In addition, about onethird of consumer dairy products is distributed by Entreprise Nationale a lApprovisionnement en ProdttsAlimentaires (ENAPAL), another PE, which imported 115,645 MT of ready to use milk powder in 1991. Dairyprocessing is largely based on the reconstitution of fluid milk from imported SMP and butter oil. The privatesector comprises small enterprises which use both domestic milk and subsidized milk from PE to process dairyproducts (yogurt and cheese). Milk production capacities are typically large while processed products areproduced in small scale operations (Table 33).
4.11. Government intervention essentially determines marketing channels in the dairy subsector. A keyelement in the development of the subsector is the government intervention in the consumer and producer pricesof milk which entails subsidies at both levels. The subsidies (compensaion) take place through the three PE, e.g.,in 1990, ORLAC received compensation equal to 47.75 percent of its total revenues; for ORELAIT, cempensa-don rose from 37.8 percent in 1989 to 74.5 percent of sales in 1991. In 1993, total subsidies (compensation)received by the three PE was DA 5.4 billion.
4.12. ODlseeds. The vegetable oil industry is entirely based on imports (about 340,000 MT of raw oilin 1992). With a labor force of 5,150, the Entreprise Nationale des Corps Gras (ENCG) operates nine refming,three margarine and five soap processing units of rather small size. With the exception of oil refining operatingat 96 percent capacity, processing capacities are underutilized at about 60 percent for soap production and 65percent for margarine production. ENCG controls between 90 and 100 percent of the oil, margarine and soapmarkets. Total revenues of ENCG in 1991 were about DA6.4 billion, of which, compensation from the budgetaccounted for more than DA2 billion (in 1992, DA4.775 billion). Consumer prices for edible oils and margarineare now regulated. The lo! des finances of 1994 and 1995 forecasts a DA 52 million subsidy to promote thedevelopment of oilseed crops. However, a pilot project of 2,000 ha, financed in part by the State, aims toreintroduce oilseed production, forcing ENCG to reopen one of its unsafe crushing plants that have ceasedproduction since 1982. This might cause some environmental problems that need to be seriously considered.
4.13. Sugar. Sugar processing by Entreprise Nationale du Sucre (ENASUCRE) is also entirely basedon imported raw sugar. ENASUCRE production only covers 20 to 25 percent of domestic needs. The difference(600,000 MT) is directly imported. Total refining capacity in 1991 was about 300,000 MT of raw sugar for aproduction of about 215,000 MT (80 percent capacity utilization) in three refineries (El Khemis, Guelma andMostaganem) with a labor force of under 2,000. The two beet processing factories in El Khemis and Guehna(150,000 MT each) have not been operating since 1983. In 1991, total revenues on processing about 250,000MT of imported raw sugar were about DA3.5 billion of which DAI.4 billion were subsidies.
4.14. Agricultural Marketng by the Private Sector. Administrative channels, mainly for cereals,provide farmers with a low risk marketing outlet within their portfolio of products, but, farmers use privatemarketing channels for most other products, such as fruits (including olives), vegetables, forage crops and liveanimals. These channels are more risky in that there is less market intervention by the Government. Here,parastatals play a smaller and decreasing role and these institutions could easily be privatized as they operate incompetitive domestic markets. Parastatals offer a low cost alternative to farmers in several subsectors with activeprivate marketing operations but also influence the domestic market by importing goods and selling them at lowerthan economic and financial cost, due to Govemment subsidies. They play a dual role: (a) they act as an option
20
market (at no direct cost to farmers) in the sense that they secure an outlet to farm products when prices drop;and (b) they import food to alleviate consumer price increases. This structure creates significant uncertainty sinceparastatals often act unpredictably at the request of the Government, invariably reacting to social pressure tointervene in the market.
4.15. Fhits and Vegetables. Most farmers are involved in fruit and vegetable production. They selltheir products either (a) to local merchants before or at harvest (sometimes forward to merchants who thenundertake harvest, conditioning, transportation and storage operations); (b) to regional wholesale markets in theproduction or consumption regions; or (c) to about thirty processing firms from the private or cooperative sector.Farmers can also deliver their products to the Entreprise Naionale Algerienne des Fruits et Ugunes (ENAFLA),a large PE marketing fruits and vegetables or to several processing factories (mainly tomatoes). Vegetableproduction, covering about 40 percent of cultivated land, continues to grow, with potatoes as the leading crop.Per capita consumption of fruits and vegetables was about 140 kg in 1992 (34 percent potatoes and 14 percenttomatoes). The main export products are early potatoes (prmeurs) and dates.
4.16. Frit and Vegetable Poessing. Except for tomatoes, fruit and vegetable processing is notdeveloped. With 20 of the 27 processing plants, more than 90 percent of the inctustrial tomato production isconcentrated in the east. Total processing capacity would be about 140,000 MT of concenurate but, 177,000 MTand 150,000 MT of tomatoes were processed into about 33,000 MT and 26,000 MT of tomato concentrate,respectively in 1990 and 1991. The excellent year of 1991, with good rainfall, was nevertheless only able to meetless than one third of the country's needs.24 On average, 40-50,000 MT of tomato concentrate are imported eachyear, mostly from Turkey (tnple concentrate) and from the EC (double concentrate). In 1992 and 1993, domesticproduction of tomato concentrate (75,000 MT) has allowed the country to cover its consumpdon needs. Thisproduct has not been imported since 1992. Besides tomato concentrate, consumpdon of processed fmits andvegetables is low (about 0.5-1 kg per capita per year). For these other products, the tomato factories do thecanning. Accounting for more than 75 percent of the installed processing capacity and more than 85 percent ofthe actual production of tomato concOrate (30-35,000 MT), four cooperative enterprises and 23 privateentrepreneurs also process fruits and vegetables. One large PE, SocietE des Jus et Conseres (SOJUC), operates14 factories of which 9 can produce tomato concentrate. SOJUC also has a defacto monopoly on imports of bulktiple concentrate which it process into double concentrate in consumer packaging. SOJUC's other productonactivities have declined sharply over the last five years.
4.17. Olives and Olive Oil. Over the past 20 years, olive production has been fluctuatig between 80-200,000 MT per year. About two thirds of the production comes from the central region which also has 85-90percent of the olive processing capacity (mostly Bejaia and Tizi Ouzou). With good weather conditions in 1990and 1991, olive oil production has reached record levels with, respectively, 24,000 MT and 30,000 MT. Untilthe late 80s, 95 percent of olive oil was produced in more than 1,500 small private artisanal mills. in the late80s and early 90s, it was decided to modemize the inuial olive oil sector. This was partly implemented withthe installation of about 200 modern units, of which only 11 were in the public sector. The results are not known.There are also 75 large mills with continuous crushing processes under both state and private ownership. Smallprocessing units are often poorly inined and experience low exuraction rates of about 140 IMT of olives,which represents an average loss of 40 I/MT. In terms of quality, due to poor and long post-harvest storage ofolives and to poor storage conditions of oil, acidity is too high (70 percent of the production has acidity higherthan 3.5). Consumer prices for olive oil are fully liberalized.
4.18. Wholesale Markets. Numerous private intermediaries and a large PE (ENAFLA) operate in fruitand vegetable wholesale markets. The rather active private wholesale marketing sector is poorly equipped in
Amw consmption of tomato concentrate is about 3-3.5 kg per capita.

21
exchange infrastructure and transportation, storage, conditioning and packaging equipment. The network ofwholesale markets is poorly developed over the country and currently the Ministry of Economy, the centraladministration in charge of these exchanges, can provide only hliited support. Two new exchanges have beenbuilt near Algiers: Hatatba in 1993 and Eucalyptus in July 1994. These exchanges are given as examples and pilotefforts that could be duplicated in other regions. The roles of commission agents and of their responsibilities lackclear legal definition and enforcement. The number of small merchants operating on the fresh fruit and vegetablesmarkets is reported to be between 3,500 and 4,000 but the large majority (more than 95 percent) operate a smallpickup truck only.' ENAFLA handles about 200,000 MT a year of fresh fruits and vegetables, of which potatoesand potato seeds represent half of annual sales. Small quantities of potatoes (3-4,000 MT) are exported to theEC in May each ye6. ENAFLA has 27 collection and conditioning points, some with storage facilities, but notall are in operation.
4,19. Post-harvest Handling of Perishables. Grading systems or compulsory packaging standards forfruits and vegetables do not exist in Algeria.2 Packaging is very diverse and of poor quality (PVC plastic andrecycled wood). Post-harvest handling and storage of fruits and vegetables are poor and result in significantlosses. An informal assessment of post-harvest losses by MOA gives 15-20 percent as an order of magnitude forpotatoes: i.e., 200-300,000 MT a year would be lost due to poor storage conditions (15-25 percent of domesticconsumption). Less than 10 percent of the storage capacity belongs to the private sector (10,000 MT against about100,000 MT in the public sector). ENAFLA operates only about 200,000 cubic meters of refrigerated storage,mainly for potatoes with an equivalent of 50,000 MT total capacity. Fresh perishables are transported mainly innon-refrigerated trucks except in the south and for long distance hauls.
4.20. Livestock. Animals, for slaughtering or fattening, are sold on local markets by farmers and bymerchants on the basis of an informal estimate of the weight and quality of the animal. Buyers are of fourcategories: (a) other farmers; (b) merchants who generally transport the animals to other regions, usually fromthe interior of the country, the high plateau region, to the littoral, and some of these merchants (engraisseurs)faten the animals for a few weeks as well; (c) slaughterhouse agents (dtevillards) with a small role played bythe agents of the regional PE in meat and livestock marketing (OREVIC, ORVE and ORVO); and (d) butchers.An unknown quantity of live animals are also smuggled by farmers or merchants to the neighboring countriesto raise foreign currency. The three PE handle about 5 percent of the total slaughter. Other slaughterhouses(municipal) and rural slaughtering account for about 95 percent of total slaughtering. The same PE are sometimesasked by the Government to stabilize prices by importing frozen meat. Farmers and representatives of theNational Chamber of Agriculture did not express any complaints about the current livestock marketing system.
4.21. Review of Constraints In Agicaulral Market Services. In the agricultural sector, as inother sectors, markets are expected to fulfil three related fimctions:
a. the exchange ofproducts, allocating goods over space, time and quality, form or type of productsto meet consumer demand;
The tedecy of the Govement to use the wholesale markets to collect taxes and duties also discourages their use.Diffeential taxation based on quality (lower quality and packaging taxed higher) would encourage bener materialto go through the wholesale markets and allow these markets to trmt effective pnce information to farmersthrough inmediaries.
25 Regulations on quality control, fraud and consumer prowtecon have been published in a comprehensive documentin January 1993 by the Centre Algeien du Contrdle de la Qwa1itE et de l 'Embalage, Division du Controle de laQat et de la Rpression des Frades.

22
b. the exchange of risk with regard to potential price fluctuations; sellers exchange their risk offuture price decreases with buyers who face the risk of future price increases and through salesand purchases, prices are fixed at a level that offsets respective risks; and
c. the exchange of information about (i) current and future supply and demand; and (ii) productcharacteristics, through prices.
4.22. The Algerian agricultural marketing system could be improved substantially with respect to eachof the above functions. The current marketing systemn of allocating of products entails high and unnecessary coststhroughout the agricultural and food marketing chains, both private and public. This poor performance resultsmainly from (i) high post-harvest losses or deterioration along the marketing chain; (ii) inefficient transportation;(iii) poor storage conditions and insufficient availability of storage facilities; and (iv) inefficient distribution ofconsumer products at the retail level. Four main factors have been identified as constraints:
a. the strong Govermnent market intervention policy, implemented through parastatals, includingthe unpredictable imports of products by PE monopolies, affect short to medium term positionstaken by private entrepreneurs in the market;
b. the preferential treatment and monopolistic position of the parastals in marketing chains, inaccess to foreign exchange and credit serve as barriers to entry for the private sector;
C. the poor infrastnwture and equipment at the wholesale level (i.e., between farmers andprocessing and distribution enterprises); and
d. a poor regulatory environment, including consumer protection against health hazards,sbdardization of packaging and products, information systems, legal definition of the role andliabilities of commercial intermediaries, and training of professionals on business issues includingagricultural and food marketing. In order to improve the agricultural marketing system, certainissues have been addressed by the publication of a series of regulations. These consist mainly ofa national plan to introduce fruit and vegetable wholesale markets and conditions pertaining tothe activities of the wholesale agent of fruits and vegetables.
4.23. Exchange of Products. Agricultural producers do not benefit from the parastatals in marketingand could get better services and prices from alternative channels. They avoid, through diverse mechanisms, theofficial administrative channels and use them as a last resort against adverse market conditions. As a result, thelarge but undercapitalized parastatals are not supplied by local producers in a sufficient and regular manner andthe processing PE turn to imports, usually under quasi-monopolistic conditions. They also underutilize their largeprocessing capacities and cannot allocate their fixed costs over sufficiently large quantities. As a result, theyregularly expect Government subsidies to cover financial losses.
4.24. Alternative private marketing channels, including cooperatives, remain underdeveloped maWydue to inadequate (i) credit from the banking system which gives preferential treatment to PE; and (i) foreigncurrency to purchase, e.g., refrigerated pickup trucks or large trucks, refrigeration equpment for small tomedium size warehouses, packaging devices and equipment, and weighing, labeling, testing equipment.Furtermore, private marketing channels are crowded out by distortionary administrative prices and margins andthe parastatals' privileged access to imports of raw material and priority in financing imported equipment.
4.25. Wholesale exchanges for perishables and livestock are a key link between farmers and thedistribution sector. The basic premise of such markets and intermediation is that marketing is a specializedfunction that farmers should not be expected to undertake. Such intermediation serves the useful functions of

23
price information transmission and price stabilization through arbitrage. Licensed wholesale markets whichconcentrate suppliers and traders in a number of selected places and are managed by the private sector shouldprovide users with services such as:
a. cleaning equipment to be used after market hours; safety, police; loading, unloading instlations;weighing equipment; storage facilities; road access and large parking lots; and
b. telephone and fax linkages; a central place on the market to post information on prices andvolumes in other exchanges in Algeria, and, in retun, to transmit information from the localexchange to the other places in the country.
4.26. Exchange of Risks. Producer and marketiag risks are transferred to the State budget or toconsumers. For the basic staples, maket intervention through the PE and price subsidies result in a relativestability of flows and prices and are the main instrument currently available to deal with risks. In terms of budgettransfers, this instrument is costly and ineffective. For other socially less sensitive products, farmers,intermediaries and consumers share market risks. However, market iteredaries are accused of benefting frominsufficient competition and capturing the largest share of the marketing margin.
4.27. Market intervention by parastatals creates another risk: private entrepreneurs are fiaced with theuncertnty of how much, when and how parastatals will import. This unhedgeable risk results in short termpositions taken by intermediaries who, then, cannot accomplish arbitrage trade between regions and over time.Thus, parastatals remain in charge of meeting demand through the year and the country.
4.28. Echange of Infonnation. Market information is generally weak. The relatively poordevelopment of commodity exchanges for produce and livestock results m limited information on (i) volumessupplied; and (ii) prices in other regions. Cereals are considered strategic products and (i) prices and allocationof quantities are set by government agencies; ad (ii) market information is restricted to the higher echelons ofOAIC.
S. Input Dbution and Marketing and Otier A4dcuural Serices
5.1. Seeds. Ascribing them strategic importance, the Government has given priority to sdf sufficiencyin cereal and potato seeds. In terms of agroclimatic conditions, Algeria has significant potental for seedproduction, which can be realized if stmrtural constraints of an institutional, legal and orgational nature areremoved and price policies are changed to allow a greater role for the private sector and market forces.
5.2. Cereal seed production is carred out by the Insit Tecique des Grandes Ctutres (ITGC) andPilot Farms for basic seeds and by contracted private farmers and Pilot Farms for certified seeds. This operationis overseen by UCA and OAIC through CCLS, while the inspection is carried out by ITOC. A recentlyestablished organization, the Centre Nationale de Contr8le d Cenaficaton des Seences at Plantes (CNCC) isresponsible for seed certfication.28 For seed potato, production is carried out by four coperatves (COOPSEM),ENAFLA and the Ofice Ntonal d'Approvlsionnent et des Services Agricoles (ONAPSA). The latter is also
For eqty reasons, cerified seed prodauon was diffused over the country, some locations having less tan idedagroclmaological dchaacstis. Receny, seed production has been shifted to conoenae in areas with higherresource endowmens.
These recen developments are being supported by a project finaced by an EC grnt. The project aims to improvethe legidstive, institutional and production envi for cereal seed productio.

24
effectively the sole importer of basic seed potato and is diversifying into seed potato production in anticipationof higher competition under market conditions for its various input supply services. For most other vegetable seedor plant material, the private sector has a larger role in production and marketing. However, import restrictionsand research constraints limit the diversity of material and the availability of new varieties.
5.3. While cereal seed imports are insignificant, seed potato was a major import item until the1992/1993 season. In 1991/1992, 120,000 MT of seed potato were imported; this was over half the estimatedannual requirements of 223,000 MT. In 1992/1993, seed potato imports were reduced to around 25,00 MT.As a consequence of the policy of self sufficiency in seed potato production, multiplication within the countrywas increased, along with efforts to improve seed production technology through a project funded by Canada.
5.4. Cereal seeds are purchased by the CCLS at prices determined by the Government which entaila 10-20 percent premium over the commodity price and are sold by the CCLS with a subsidy, at a price lowerthan the commodity price. For example, in 1991/1992, durum wheat was purchased at DA10,2501MT whereascertified seed was purchased at DAl 1,800/MT and sold at DA4,500/MT. The premia do not appear to provideadequate incentives for quality seed production; the rejection rate for certified seed has been as high as 60percent, in addition to as much as 30 percent of the fields being rejected and harvesting losses being in the orderof 25-30 percent. According to MOA estimates, the annual cereal seed requirement is -. 000 MT, of whicharound 73,000 MT are supplied directly by farmers from their own crops (Table 35). Of tL - maining 297,000MT, certified seed comprises only about a third. The rest are drawn from what are claimed to be "homogeneouslots" in the commodity stocks and sold by the CCLS after minor processing and treatment; however, the highdegree of crop variability on farmer plots would make it difficult to consider these as commercial seed. Thedistribution of the cerdfied and the lower quality seeds is conducted through an administrave process, with thebetter certified seeds reserved for "agrislueurs perfomaws in high potential zones, who implement improvedproduction techniques.
5.5. The seed price subsidies result in an excessive rate of replacement for cereal seeds. Selfpollinating cereals need to have seed replacement at the rate of around 20-25 percent annually, even though hightechnology producers may replace cereal seeds more frequently. Under tae present ciramstance in Algeria,nearly 80 percent of cereal seeds are replaced annamlly. This puts unnecesry strain on the cereal seedproduction and distribution systems. Resources can be better utilized to focus on certified seed production at alower scale corresponding to a 20-25 percent replacement rate. However, price policies that discourage farmersfrom selecting their own seed need to change along with the changes in the structure of seed production.
5.6. The intense focus on seeds, especially cereal seeds, stems from the belief that seeds incorporatethe technical potential of a crop. However, seeds are but one input in improved technologies. It would beadvisable to focus on the availability of appropriate technology, extension messages, adequate supply of inputsand equipment, etc., that would facilitate economic adoption of complementary practices would help realize thepotential of improved seeds.
5.7. The current structure of seed production needs significant adjustment. In particular, a higher roleis advisable for the private sector and the farmers in the production and marketing nf seed. The effective PEimport and marketing monopolies need to be eliminated and the Government's role should be reduced to researchand certification processes. It would be desirable to review seed policies, regulations and the potential for seedproduction, particularly given the current bilateral and multilateral support in this area. The legal frameworkneeds to be reviewed and adjusted to encourage domestic and foreign private enterprises to become more active,particularly for the production of hybrid seeds for domestic use and exports. The CCLS are superfluous underthe present organization of seed distrbution; they buy the crop destined for consumption and, after processingand treatmet, sell it back to the farmers as seed. Such processing and treatment, with minimal investment, canbe conducted more efficiently and economically at the farm or village level by farmers or farmer orgaizations.

25
5.8. Fertizers. Until recently, ONAPSA had a legal monopoly as a PE over the supply ofagricultural inputs, which were sold to the govermment cooperatives, CooNratives Agricoles de Services etd'Approvisionnement (CASAP), supplying the farmers. The domestic fertilizer producer PE, the EntrepriseNationale des Engrais et de Prodwits Phytosanitaires (ASMIDAL), produces nitrogenous and phosphaticfertilizers29; potash fertilizers are all imported. ASMIDAL's output is much lower than installed nominal fertilizerproduction capacity (Table 36). Recent events affecting agricultural input marketing were: (1) the restructuringof the DAS into EAC/EAI; (2) the legal abolition of monopolies in domestic and foreign trade (in practice, manyobstacles still remain); and (3) the privatization of CASAP. The fertilizer distribution system is still evolving.Instead of a planned system based on theoretical fertilizer requirements, this market has now become demanddriven and price sensitive. Private farmers base fertilizer use on economic criteria and risk considerations, whichresult in lower doses than would be applied under technical considerations alone. Despite the liberalization ofinput trade, the private sector has not been able to enter the market and ONAPSA still controls fertilizer imports(finished products not produced by ASMIDAL) but domestic distibution is shared with ASMIDAL which nowsells 75-80 percent of its domestically marketed output directly to the CASAP. Fertilizer is distributed by railand trucks (owned by the CASAP and ONAPSA) and the physical fertilizer distribution and storage system isgenerally adequate (except for some open air storage at the CASAP level).
5.9. Fertilzer Coasumpdon Trnds. Fertilizer use incresed rapidly from 42,000 MT of nutrientsat independence in 1962 to 260,000 MT (605,000 MT of fertilizer product equivalent) in 1986. Since then, ithas declined to reach 216,000 MT in 1992 (Table 38), remarkably, without any apparent adverse effect on yieldsand production. The decrease in fertilizer use can be explained by the following:
a. The dissolution of the DAS into EACIEAI can account for about 40 percent of the decrease. TheDAS used considerably more fertilizer per ha than the private farmers (Table 37) and had a 60percent share in overall use. Based on technical standards, these raes were evidently excessive,economically not optimal and did not achieve high yields in comparison to Algeria's neighbors.If the EAC/EAI fertilizer rates now are around the pre-reform average of the private sector (36percent of the DAS), ceteris paribus, a 40 percent overall drop in fertilizer use would result.
b. Fertilizer price increases were a second factor that had a negative impact on fertilizer usealthough the effects are more complex and difficult to measure. Fertilizer prices have traditionallybeen controlled by the Govemment. With the exception of 1991, crop/fertilizer relative priceshave been quite stable (Table 39). Hence, ceterisparibus it would appear that farmers' financialincentives to use ferilizers on key crops have not changed much despite recent drastic fertilizerprice increases. However, the prices of many other complementary inputs have also increased.rurthermore, fertilizer price increases may still have affected demand because the price elasticityof demand for fertilizer mntrients tends to be higher, particularly in the short term, for changesin fertilizer prices than for compesaory changes in crop prices. Some reasons for this are that:(i) increased fertilizer prices affect the farmer immediately, whereas expected crop price increasesare uncertain; and (ii) the increased financing requirements to purchase fertitizers coincided withcurilment of credit from BADR.
5.10. Fertlizer Pricing. Until April 1994, fertilizer prices and margins were controlled (fixed) by theGovernment. In accordance with the April 1994 decree, fertilizers prices and margins are no longer administeredby the Govermment, but they have to be declared in advance. Algerian farmers have benefitted from explicit andimplicit (through the overvalued exchange rate) subsidies on fertilizes. However, according to the limited
X9 FERPHOS, the phospae rock prodoer may also some minor quatities of ploaphate rock for directapplication.
26
information available for nitrogen and phosphate in 1992, the net economic subsidy to farmers isdisproportionately small as compared to the protection accorded to the fertilizer industry (Table 40). Exports aresubsidized while farmers are effectively held captive to the inefficiency of the fertilizer industry. An IFDC studyshows that the weighted nominal economic subsidy on fertilizers for farmers at the nominal exchange rate in1°88, 1989 and 1990 was 19, 25 and 12 percent respectively, compared to what amounts to a tax at the presenttime (Table 41). However, international fertilizer prices are deeply depressed currenty and not sustainable in thelonger term. The distributors share a fixed distribution margin, presently of DA200/MT. Fixed margins preventedany logistical management of distribution and inventories in the network, resulting in late deliveries and localshortages. The fixed margins penalized distributors which supply distant consumers and also encouragedinefficient fertilizer use and crop production in remote areas. Finally, they discouraged private sector interest.If a remote region, such as the Sahara, is to be supported for social or other justifiable reasons, a targetedapproach is better than global pgr6quation of distribution costs with fixed margins. The liberalization of fertilizerprices and margins should rectify these problems.
5.11. Fertlzer Imports. Since the abolition of monopolies in 1990 there are, in principle, no legalobstacles to private sector competition to ASMIDAL, ONAPSA and CASAP in the production, imports,distributifn and sales of fertilizers. However, private activity has not developed in the sector. One principalobst:-.ie for private sector imports is the need for cahiers des charges (CDC), i.e., Government approval, inorder to obtain the necessary foreign exchange allocaion. In practice, theJ approval of the CDC is limited to theenvelope of foreign exchange available for the particular commodity (e.g., fertilizers). Import permits have beenapproved and foreign exchange has been made available only to the established PE fertilizer importers(ASMIDAL, ONAPSA). Some CASAP have tried to import fertils directly bit were refused Governmentapproval. Advantage should be taken of the low international fertilizer prices to open up !mports defacto to theprivate sector. The private sector will become more interested in distributing fertilizers now that prices andmargins are no longer administered by the Govermment and t the CDC has been eliminated. Llizaton ofthe fertlizer import and distribution systen and prices would have to be coordinated with the Goverment's cropprice policy to ensure a smooth transition to market conditions while avoiding politically unacceptable reactionsfrom agricultural producers and consumers.
5.12. Technical Issues on Fertilzers. Several technical issues need to be addressed in ferdlizer use:
a. Except for the FAO trials in the early 70s, there has been little research on crop response tofertilizer in different agroecological zones. Furthermore, there is no operational map of soilfertility for the country and soil analysis laboratories are il r,zrently not available. Fertilizerrecommendations are thus based either on theoretical stanards, the scant field informationavailable or information from Mediterranean countries with similar ecological conditions.Recommendations should be based on research, soil tests and fertilizer trials on firmers' fields.
b. There are only five different fertilizer products available and these may neither be sufficient northe cheapest source of plant nutrients. Imports and competitive production should aim atdiversifying the fertilizer products available to famrs. Research should also focus on theferdlUzer product mix to promote diversity and more economic use o fertilizers in Algeria.
c. There are no drious environmental problems in Algeria arising from fertilizer use. There arepotential localized problems which should be monitored such as (a) excessive amounts offertilizers used on vegetables; (b) over-watering (due to water priing policies) causing nitratemovement down the soil profile, possibly into underground aquifers.
5.13. Fertilizer LAgislation. In spite of or because of Government control of the fertilizer sector, thereis no specific &feilizer legislation. The sector is subject to the requirements of vanous decrees conerning the

27
organizations involved in fertilizer production, distribution and markeing. These include decrees on ex-factory,wholesale and retail prices, margins and subsidies. There is no comprehensive legislation on product quality,guaranteed analysis, labeling or registration of products. As an essential step towards a liberalization of themarket, appropriate legislation should be enacted to protect the interests of farmers as fertilizer users.
5.14. The main impediments for an efficient domestc fertilizer supply system are ASMIDAL andONAPSA. ASMIDAL's operations are highly inefficient with poorly maintained and operated productionfacilities, poorly trained and surplus staff and a backlog in amortization resulting in high debts and finncialcharges. 1992 resulted in a loss of DA2.5 b for a total sales of DA2.6 b and total costs DAS. I b. The company'scumulated losses amount to DA17.2 b. It is not in Algeria's interest to allow agriculture to be hostage toASMIDAL's problems anvi the fertilizer market should be liberalized as soon as possible to allow de factocompetition from fertilizer imports. The Enterprise and Financial Sector Adjustment Loan (EFSAL), financedpartly by the Bank, also addresses a restructuring program for ASMIDAL. ASMIDAL's report on "Pln deRedressement; 1993-1997" dated May 1993, focuses on fnancial, employment and production related issues.However, ASMIDAL would like to maintain its monopoly privileges as well as protection from imports andcontinue to depend on subsidies. ASMIDAL's restructuring should go ahead without further delay to put it ona sound financial footing, without exclusive privileges, permitting genuine autonomous operation or privatization,as well as facing competition from the private sector through imports or production.
5.15. Pesticides. Pesticides (insecticides and fungicides but no herbicides) are formulated locally byASMIDAL using imported active ingredients and supplying 80 percent of the market. Other products are allimported in finished form by ONAPSA (about 20 percent of total supply) and the private sector (less than onepercent). The distribution system is similar to that of fertilizers but ONAPSA also uses accredited private dealers.Estimates for market shares at the wholesale/retail level range from 45-60 percent for ASMIDALlCASAP, 35-40percent for ONAPSA/CASAP and some 15 percent for private retailers. Pesticide consumption in Algeria hasdeclined from 1980 to 1991 in a manner similar to fertilizers (Table 42).
5.16. Pesticide Imports and Distribution. The physical distribution system for pesticides, which arenot bulky, does not constitute a constraint. Imports and distribution of pesticides are, in princir!e, free but theproducts have to be approved by the Institut National de la Protecdon des Vegetaux (INPV). The private sectorhas the same difficulties in obining foreign exchange necessary for imporeng pesticides as for fertilizers andONAPSA therefore has a defacto quasi-monopoly over imports of plant protection materals. The process ismismanaged, leading to shortages in the market. Imports of substandard products, poorly packaged and labeledare fairly common (this also applies to products formulated locally by ASMIDAL). More effective private sectorcompetition on equal terms with the parastatals would contribute towards ensurng the availability of a broaderrange of products and eliminate local shortages. To break the ONAPSA/ASMIDAL quasi-monopoly, as forfertilizers, consideration should be given to allocating a higher amounts of foreign exchange to the private sectorfor importing plant protection materials.
5.17. Tecdnical Issues on Pesticides. Issues pertaining to production, safety and appropriate applicationtechnologies affect pesticide use:
a. Application Eqwipment. Since the reorganization of the DAS there have been complaints of lackof sufficient equipment appropriate for the smaller private farms and protective gear for theapplication of pesticides.
b. Pesticide Handling and Storage. There are frequent reports on deficiencies in the handling andstorage of pesticides at the production, distribution and the retail level. Specialist services arerequired to detenrine actions to ensure safe handling and storage of pesticides and the destuctionof old stocks in an enviromnentally safe manner.

28
c. Farm Level Use. There are no reports of serious incidents of pesticide poisoning among farmersin Algeria. A program to train farmers and other handlers in the safe use of pesticides should beundertaken and maintained. Some compounds with known long term toxicity are still in use andshould be eliminated as soon as possible.
d. Pest and Pesticde Management. Proposals regarding pest management have been prepared forthe Mitidja project. These should not only be implemented in Mitidja but they should be suitablyadapted and extended to include crop and pest complexes not covered in Mitidja as well.
5.18. Pesticide Legislation. A law on pesticides (Loi phytosanitaire) was promulgated in 1987 but theregulations to implement it are still under discussion. Proposals for a Plant Protection Inspectorate are also underdiscussion. Registration and importation of pesticides are strictly controlled but other aspects, such as packaging,labeling, handling and use are very poorly controlled. Every effort should be made to get the necessary legislationand policing instrunents in place to ensure safe and effective pest management in Algeria.
5.19. Training and Technical Assistance. The INPV lacks staff and resources to implement thenecessary programs, e.g., Integrated Pest Management (IPM), for major crops. Training and technical assistanceare necessary for INPV and other actors in the sector. The needs of the pesticide sector in terms of resources,training and technical assistance should be evaluated.
5.20. Agricltural Machinery and Equipment. The PE monopoly Office National de MatrinelAgricole (ONAMA), produced agricultural machinery and equipment and was also involved in the imports,distribution, sales, repair and maintenance of agricultural machinery, equipment and spare parts. It wasdismantled in 1986. Currently, there are two major organizations in agricultural machinery and equipent: (a)Entreprise Nationale de Production des MatOrielsAgricoles (PMA) which dominates the production of agriculturalmachinery and is also involved in imports and services (maintenance and repair); and (b) an Entreprise deDistribution de Machines et Matenel Agncole (EDIMMA) in each wilaya, in charge of distribution of machinery,equipment and spare parts (of PMA and other origin) and repair and mamtenance services. Wilaya and privatesector enterpdrises also insure some production. The EDIMMA were to be organized as cooperatives and, wherethis was not possible, the provincial governments would manage the EDIMMA. In 1993, only 14 out of 48EDIMMA have a cooperative structure. In 1989, to counter the dominant monopoly position of PMA, theEDIMMA established Grouemets dIntgrits Communs pour la Distributon et la Maintenance du MatrielAgricole et de la Petite Hydraulique (GDIMMA) as an apex organization. The organization of the sector is givenin Figure 1. The problem of the relative roles of PMA and GDIMMA in imports of agricultural machinery andequipment should be resolved as these imports are liberalized and the private sector participates in these marketsin a competitive manner.
5.21. Duting the era of socialist agriculture, policies to promote mnzaion, such as low machineryand equipment prices, access to overvalued exchange rates for imports and subsidized credit, did not provideincentives to maintain agricultural machinery but, encouraged purchases of new machinery and equipment.3Monopolistic PE had smothered existing small scale repair and m intnan shops by depriving them of spareparts. Thus today, an optimistic estimate is that a quarter of the tactor and combine harvester park is in needof major overhaul and that most of these equipment are immobile. Looking at overall balances, if the exisdngpark of around 95,000 tractors, 9,000 combine harvesters and miscellaneous other equipment were fullyoperational, it would be able to serve the needs of the sector (Tables 43-44). However, in addition to a significant
30 Tis behavior continues even today, when resource consrat are consierably stronger. In 1992, a public tederwas amounced comprising 160 tractors, 30 combine harvesters, 100 sprayers and miscellaneous other machineryfor the Pilot Farms, which carry the vestiges of the DAS. This tender did not include any allocationfor pare parts.

29
portion of the machinery and equipment park not being operational, the dissolution of the DAS into EAC/EAIhas complicated this picture. Average fatm size and the operational unit of individual plots are now considerablysmaller than that which existed under DAS. The large machinery produced for the large DAS may not beappropriate for the private farms. Despite this, PMA has ceased the production of 45 HP tractors, claiming theycost the same as the 65 HP tractors, and now produces, paradoxically, 65 HP and 68 HP tractors.
5.22. Production. PMA produces tractors, combine harvesters and other machinery and equipment,mostly under license, in four plants in Algeria and also has a 50 percent share in SAKMO, a joint venture inTunisia for the production of diesel engines. The two main plants at Constantine (tractors) and Sidi Bel Abbes(combine harvesters) are of 1973 and 1976 vintage respectively. Production costs are high due to low capacityutilization, which in turn, is due to worn machinery which have not had proper maintenance and overhaul in thepast ten years; lack of imported spare parts; and management and labor problems.3" PMA's financial andoperational conditions merit scrutiny and thorough assessment to ensure that any domestic production ofmachinery and equipment meets the needs of the agricultural sector in an economically efficient manner. PMAis one of the industrial enterprises to be restructured under the EFSAL. Its March 1993 report, "Passage al'Autonomie' expresses a desire to maintain its monopoly powers through reestablishing control over the aftersales service network, demanding protection from competitive imports and continued dependence on subsidies.
5.23. Demand for new machinery and equipment is expected to remain at most stagnant and willprobably decline, due to price increases arising from depreciation of the DA.32 Even then, assuming PMA candeliver about 4000 tractors annually, additional imports of 2-3000 tractors (depending on non-agriculturaldemand) will be needed for replacement demand. Liberalization of imports allowing for diversification of sizeand make of tractors would affect this projection.
5.24. Small scale private sector enterprises also exist in the production of equipment, parts and smallmachinery. However, they are constrained by access to resources, particularly foreign exchange to import partsand machine tools. These enterprises should be encouraged as they have a positive effect on employment due tothe more labor intensive technologies they employ as compared to the large PE and they would be able toproduce more appropriate tools for tie specific envirornments they are in.
5.25. Imports. Currently, imports of agricultural machinery are banned even though some small scalemachinery have been imported. According to the Stabilization Program, these imports are expected to beliberalized in 1995. A higher role for the private sector in such imports should provide competition to the PEin increasing the efficiency of their operations, with a view towards restructuring and privatization as well.Import regulations should ensure adequate supply of spare parts and after sales service for imported agriculturalmachinery and equipment. In particular, agricultural machinery and equipment should be appropriate to the soiland land tenure conditions in Algeria. Furthermore, given the high proportion of machinery lying idle, priorityshould be given to imports of spare parts, in order to use the existing park more effectively.
5.26. Distibution and Repair and Maintenance Services. While EDIMMA had the mandate toprovide maintenance and repair services, and PMA the mandate to produce agricultural machinery andequipment, their efforts to increase the conaol of the market have resulted in both providing distribution(machinery and spare parts) and repair and maintenance services. As part of its restructuring, PMA proposes toregain control of the EDIMMA, on the doubtful pretext that the country can not support two after sales networks.However, in response to GDIMMA's right to import, PMA also has grand designs to establish a network of 50
31 It is esimated that the overhaul of the assembly line in Constantine would imply a six month shutdown. Accordingto PMA, overall renovaton of production faclities would require an investment of US$100 m over 2-3 years.
The value added component of domestic tractors fell from aound 60 percent in mid-80s to 40 percent currently.

30
affiliates with 10,000 e 2 covered area and DA 500 m (apparently an inflated figure) of equipment for repairs andmaintenance. This is yet another example of large scale and capital intensive investments that are in contradictionwith the factor proportions and high unemployment in the country. Smaller scale, more diffused and laborintensive repair and maintenance services under private sector operations can generate more satisfactory results.
5.27. It is interesting to note that both PMA and the EDIMMA have resorted to using the private sectorin trying to achieve control of the market. In addition to its 48 ilaya level and 180 daira level shops, theEDIMMA also have 1000 recognized private sector shops authorized, after strict scrutiny, to conduct repairs andmaintenance and some can also sell machinery, equipment and spare parts. Similarly, PMA has 150 private sectorlicensed agents, which distribute and sell machinery, equipment and which handle 50 percent of the spare partssupply. Overall, the repair and maintenance facilities in the country are inadequate in number in proportion tothe size of the machinery park and the PE have failed in supplying these services. Given the successful experiencewith the private sector, priority should be given to increasing its role in the sector and enhancing competition.A greater role for the private sector in imports, distribution, repair and maintenance services should be facilitatedby enabling them to establish representative enterprises for foreign companies, establishing networks and limitingrestrictive practices such as exclusive contracts, price discrimination, etc. Furthermore, existing price and margincontrols should be eliminated.
5.28. Tebmical Issu in Agricultutal M on. Certain technical issues need to be addressedthrough research, training and technical assistance:
a. Research should emphasize appropriate agricultural machinery and equipment as well as theireffective use. Their suitability in different agroecological zones and for smaller farm and parcelsizes should be assessed, particularly as inappropriate practices may be contributing to the serioussoil erosion problem in Algeria.
b. Repair and maintenance skills have eroded after being squeezed out by public sector monopolies.Without a concerted focus on developing these skills, and allowing them to be remuneratedsatisatonrily under market conditions, importing spare parts to enhance the use of the existingmachine park will only be partially effective.
c. Rental of machinery and equipment for custom services for tillage, cultivation, harvest, etc.,should be encouraged under market conditions.
5.29. Uvestock Services. Despite the 1987 reforms, the State has a dominant role in most activitiesof the livestock sector except production. Research and extension, production support services (e.g., milkcollection, artificial insemination; Al, and genetic improvement), and trade (e.g., input supply, meat, dairy, andgenitors) are almost exclusively controlled by public bodies, though many parastatals claim to have become"autonomous". An exception to this is the 1988 law allowing private veterinary practice. The MOA also manages38 Pilot Farms specialized in cattle breeding and 15 in sheep breeding, focusing on genitors and semenproduction, and also training, extension and technology transfer. Various parastatals also own livestock farms,such as OREVIC which owns 15,000 ha and the state owned poultry breeding farms for parent stock. EvenONAPSA owns a production farm called the Livestock Economic Unit.
5.30. Sanitary Control and Veterinary Services. The number of veterinarians has increased from 55in 1980 to 1,265 in 1993. However, a chronic shortage of supplies, including vaccines, and a 'ack of operatingresources reduce the effectiveness of sanitary coverage. With the 1988 Law on Veterinary Medicine and AnimalHealth, Algeria has moved quickly toward private practice in veterinary services. The National VeterinaryAuthority (AVN) certifies and supervises new practices, and coordinates the collaboration between the publicsector a-4 professional associations. Today there are 1265 practicing veterinans of which 565 are in the prvate

31
sector, and of which 65 are women. The regional distribution of veterinarians is uneven: about 75 percent of theprivate practitioners are located in the north, 20 percent in the center, and 5 percent in the south. Privatevetinarians face a mumber of constraints ranging from access to credit to competition from public organizations,mainly the provincial agricultural directorates (DSA) which provide free services and control compulsoryvaccination campaigns.
5.31. Livestock Input Supply. Despite recent changes which legally allow private sector involvementin livestock input supply, parastatals continue to control the market and enjoy monopoly or quasi-monopolypositions. In the livestock sector two parastaals have leading roles along with other PE:
a. ONAB owns 26 production plants with an overall installed capacity of 400 MT/h, and controls50 percent of the national market which ranges between 3.2 and 3.4 m MT/year of animal feed.As 80 percent of the raw materials are imported, supply difficulties have caused animal feedproduction to decrease over the past years. In 1992 ONAB produced 1.45 m MT of animal feed(85 percent for poultry and 15 percent for rmnats, mainly dairy cows), compared to 1.7 mMT in 1988. The decline was not compensated by private sector production. The basic technicalconstraint of the structural feed deficit is becoming more serious.
b. ONAPSA imports veterinary products and material, livestock equipment, and live animals.Seventy percent of the heifers for the dairy program have been imported by ONAPSA, and therest by other PE such as ORELAIT, ORLAC and OROLAIT. ONAPSA controls 80 percent ofthe veterinary product market. The livestock business represents about 20 percent of ONAPSArevenues. Due to foreign exchange constraits, resources allocated to veterinary drugs, materials,and equipment, although increasing from about US$15.5 m in 1991 to a planned US$20 m 1993,are insufficient and result in chroric shortages of supplies. Furthermore, because of top downprogramming, many products are inadequate and do not meet the priority needs of producers.
c. Other PE, such as OAIC which imports corn and ERLkD which provides feed mills with cerealby-products, are also involved in the animal feed industry as raw material suppliers for bothpublic and private enterprises;
d. the capacities of the private sector are growing. Private operators are involved in importinginputs for animal feed and animals used for reproductive purposes. They also insure themanufacturing of animal feed. The current potential of the private sector is an indication thatONAB needs to ne restructured and privatized and that the presence of the PE is no longerjustified.
5.32. Because of limited access to foreign exchange and bureaucratic obstacles to obtain import licenses,the private sector has a marginal role in livestock and veterinary input markets. Ten private companies operatein veterinary drugs and equipment (including the production of frozen semen) and there are around 300 feedproducers with a total capacity of 1,600 MT/h. This is four times the capacity of ONAB, but most are smallscale, on-farm producers with limited milling capacity (between 0.5-1 MT/h). Cooperatives have substantialpotential but face resource constraints, falling demand and the restrictive PE activities in input supply.
5.33. Review of Constraints in hput Supply and Proviion of Agricultural Services. The basicconstraints in input supply and related agricultural services stem from: (i) the inability of the PE to adapt in theface of an agricultural sector now composed of private farmers; (ii) the maintained privileges of PE monopoliesin access to resources such as foreign exchange, subsidies, credit, etc.; (iii) the Government interventions inprices, margins and other restrictions such as effective QR through the CAH; and (iv) as a consequence, thelimited involvement and experience of the private sector in these areas. However, this situation is improving due

32
to the changes made by the Government such as the elimination of the CAH and the QR and the liberalizationof most prices and margins.
5.34. The various PE involved in input supply and provision of services, such as ONAPSA, ONAB,ASMIDAL, etc., have traditionally been involved in supplying the DAS under a planned, socialist system. Thissystem was characterized by central decisions on input use based on technical cnteria. Furthermore, the scaleof the DAS was considerably larger as compared to the average private farm size today. These private farmersare economic agents that are sensitive to and respond to prices and other economic stimuli, and are moredispersed over space. The PE have not been able to respond to the specific needs of this new structure and havecontinued to behave and produce as before, without adequate assessment of market structure, demand or logistics.Any diversification of activities, for example, as in the case of ONAPSA, is more to maintain market control andpreempt private sector entry, rather than increasing efficiency. As a consequence, the PE have not been able tosupply the private farmers efficiently. The results have been accumulating inventories and continued losses. Asbefore, they have returned to the State, which has continued to accommodate them, pepetating theirinefficiencies.
5.35. Due to the dependence on inmports for inputs, raw materials, machinery, equipment and spareparts, the PE have continued to have privileged access to the scarcer foreign exchange resources, even if theyhave declined in absolute terms. The adiniumstve foreign exchange allocation process under CAH has beenused to implement arbitrary QR and the private sector has been starved of foreign exchange resources to precludeany competition they could provide. Furthermore, the PE have continued to be the media through whichGovernment input subsidy programs are implemented. This has effectively reduced part of the market risk forthe PE, but this option is not available to the private sector.
5.36. The various Government price and margin controls andp6r6quaion schemes, effectively precludeprivate sector involvement in input supply. The private sector will not be able to provide services in these areasin a competitive manner if it is not allowed to differentiate between market segments. Such controls andpanterritorial pricing also encourages inefficient production in unsuitable areas, as well as adversely affectingretail operations, especially by the CASAP. While some social or other reason may justify Governmentintervention in well targeted, specific areas, overall, panterritorial control and implementation of uniform pricesand/or margins can not be justified. Apparently, such Government programs are not being effective in someinputs such as spare parts and pesticides, as prices have risen above controlled levels in the market.
5.37. With all the barriers to entry and lack of access to resources, as well as lack of clarity in theregulatory environment despite apparent claims of market liberalization, the private sector has justifiably beencautious in entering the input supply and service provision. Where it has made some headway, it has apparentlybeen successful, as in the case of veterinary or spare parts supplies. Clearer rules which are effectivelyimplemented, equitable access to resources under competitive conditons and technical assistance to private sectorassociations will facilitate private sector operations.
5.38. ONAPSA has a commanding position in monopolizing input supply. It is involved in fertilizers,pesticides, veterinary supplies, seeds, breeder livestock, etc., and has organic links with domestic producers suchas ASMIDAL and uses the CASAP as a capdve sales and distribution network. It is using its privileges todiversify into production of inputs to reinforce market control. Its monopoly position is untenable and it wouldhave to be targeted with priority for restructuning and privaization. This will allow the barriers to private sectorentry into the input and services market to be breached, provided the associated policy and regulatory frameworkis also adjusted.
5.39. In the case of domestic production of inputs, machinery, equipment and spare parts, while someprotection should be provided against dumping and similar predatory trade activities, farmers as well asconsumers and taxpayers should not pay for and be captive to the inefficiencies of PE such as ASMIDAL andPMA. Competition from the private sector and imports should be allowed to permit farmers access to adequate
33
and appropriate input supply and services. Domestic production in these areas would need to be subjected toeconomic assessment with respect to comparative advantage, with a view towards restructuring and privatization.
6. Structural and Insitutional Issues
6.1. Land Tenure. Currently, four main modes of rights over land exist in Algeria. These are (i) PilotFarms under the jurisdiction of the public domain; (ii) individual private farms (EAI) and collective private farms(EAC); (iii) the traditional private sector farms (melk); and (iv) the land in the steppe areas under the jurisdictionof the national domain but where tribes exercise a usage right. In 1985, around 900,000 private fanrs in the25 northern wlaya held 4.4 million ha and the DAS held 2.8 nillion ha. In 1987, around 2.0 million ha weredistributed to the EAC and EAI through the dissolution of DAS. Total arable land is 7.5 million ha (i.e.,excluding the steppe and other grazing lands but including 3 million ha of fallow), which is distributed as follows:
Lands in the national domain 2.80 million ha
of which:
EAC and EAI 2.00 million ha
Individual lands existing prior to 1987 0.66 million ha
Pilot Farms3 0.15 million ha
Private lands 4.70 million ha
6.2. Average farm sizes under the EAC and EAI are, at least initiaUy, higher than the average of 4.9ha in the traditional private sector. Furthermore, the DAS lands were typically of higher potential productivity,rainfall, quality, access to resources, etc. The tradidonal private sector, being situated in the less endowed zones,would need higher average unit sizes to produce incomes comparable to the better endowed areas. In this respect,the EAC and EAI have favorable inital conditions in terms of land endowments. The approximate distributionof EAC and EAI lands are as follows:
EAC EAI
Number 29,481 18,024
Area (ha) 1,819,065 170,036
Number of beneficiaries 157,426 18,024
Average Area per Unit (ha) 61.7 9.4
Average Area per Beneficiary (ha) 11.6 9.4
6.3. The basic issue for the EAC and EAI now is the resolution of ownership rights. One problemarea is that the cooperative and collective operations expected of the EAC have not worked. Centrifugal forcesare thus changing the EAC into defacto El. There are currently some preliminary moves to turn this into adejure situation. However, the preoccupation of the central authorities to maintain viable farm sizes and preventfragmentation and parcellization may be slowing the process. As of September 1993, 28,000 "administrativedeeds" (acaes admWnistradfs) have been provided to the nearly 48,000 EAC and EAI. The number of aaes
33 The 150,000 ha of "Pilot Farms" are used for the production of seed and plant material and as "a resource tobalance production". The role, functions and the future of these lands merit consideration.
34
adinnistrataf established by the end of 1994 for the assigned EAC and EAI have risen to 36,715 over a totalof 48,636. The other main issue is the fact that in the country, 600 communes out of a total 1541 have had acadastre, which is slowing the process of providing deeds to the traditional private land owners.
6.4. Land tenure in the tribal areas represent all the contradictions of maintaining traditional land usesystems under growing market conditions, distorted through support policies. Usufruct rights over these landshave been allocated traditionally to various tribes for low intensity grazing of small ruminants and managed ina manner that has balanced resources and herd size (particuarly under variable rainfall conditions). However,the increasing demand for livestock products (with a cultural preference for mutton) aising from increasingincomes has increased the attractiveness of livestock production. The extensive controls on crop production havenade livestock production, with virtually no controls, and the associated feed production (mainly barley) lucrativerefuges. This situation has been compounded by the feed subsidies provided by central authorities to encouragelivestock production for import substitution. As a consequence, herd sizes are not adjusted to varying forageproduction due to climatic conditions and are maintaed at levels above the carrymg capacities of these fagilemarginal lands. Furthermore, partly as a consequence of attractive guaranteed prices, barley area is increasingin these areas in an opportnistic manner. Tribal links are exploited in plowing steppes for barley production,in full knowledge that tribal customs can not overrule these actions. The adverse ecological consequences ofperpetuating such a land tenure system will be irreversible and need to be addressed as a high priority.
6.5. One otI' .r issue is a maner of conjecture that needs to be substantiated with further research. Itis highly probable tha- there is a dualistic farm strucure in Algeria with large farms using capital intensivetechiques on one side and small family farms using labor intensive techniques primarly with family labor onthe other side. In other countries, such as Egypt, this structure has invariably resulted in segmented labormarkets, with the larger farms facing labor shortages and high wages because farm family labor is used on thesmal family farm with priority and is not offered on the market when the larger farms would demand labor. The1990 World Bank Agricultural Sector Report provide some supporting data from 1985. In the 25 wiaya of theNorth, 0.7 percent of the private producers owned more than 50 ha, totaling 9.6 percent of the private lands,with average land size of 69 ha. The remaining 99.3 percent of the private producers aveaged only 4.4 ha.
6.6. Knowledge about land distribution and lnd use patterns can be improved at the policy mankiglevel. A committee has been formed to advise the policy makers on the issues and propose action, legislation,etc., ad there are positive developments. Yet, the task at hand is monumental and it has to be recognized thatit will take considerable time and resources to develop a land tenure system that is conducive to efficient use ofresources through the market system and does not pose major equity problems. The linkages with rural finance(collateral requirements) have to be considered, and, manageable market systems and the associated legalframework for the sale, inheritance and rental of land (for cash or in kind returns) need to be organized.However, above all, adequate policy signals must be given to farmers that they are the owners of the land inorder to promote investments in land and efficient exploitation without concerns arising from insecurity oruncertainty of tenure.
6.7. Cooperatives. Since independence, Cooperatives have been state sponsored organtionsestablished not by their members in common pursuit of individual interests but by the Government as instrumentsfor implementing agricultural policy. The cooperatives maintaned close ties with the PE, which either suppliedgoods to or purchased products from the cooperatives. The list of cooperatives in Algeria is given in Table 45.The present transformation of the Algerian cooperative system was initiated in 1988 as part of the largeragricultural reform effort begun in 1987. There is a wide variation in the extent to which cooperatives havetransformed themselves from governmental agencies to private enterprises.
6.8. The most imnportant system of cooperatives involved in cereals and pulses, the CCLS, which areorganically linked to the OAIC, have been left out of the legal framework of privatization. The CCLS are not

35
cooperatives in any sense of the concept, and under their current status appear to be a superfluious stage in thedistribution of inported commodities; their involvement in domestic production as a producer "cooperative' islimited. They essentially serve as a tool of government policies and derive income from the Govermnent as aresult. Apart from their superfluous functions, the CCLS, as such, only serve to perpetuate the negative imageof "government" cooperatives, set a bad example and have an adverse effect on the development of a privatecooperative movement. As discussed elsewhere, their restructuring within a broader framework of the distributionof agricultural commodities, including their forfeiture of cooperative pretensions, should be a priority.
6.9. The cooperatives face an overwhelming debt burden arising from theirpatrimoine, i.e., assessedvalue of iftucture and stock when the new, privatized cooperatives were formed. First, the pafrmoinereflects not the economic but the accounting value of outdated and depreciated infrastructure and equipment aswell as losses incurred as a consequence of implementing government policies under socialist agriculture. Assuch, the new cooperatives should not be liable for thepatimoine. Furthermore, this debt inhibits eligibility fornew investment credit. Eventual repayment of this debt will reduce earnings when capital is needed forreinvestment and to attract members through patronage rebates. In a period of declining revenues, repaymentcould force some cooperatives to become insolvent. It is thus necessary to review the debt position of thecooperatives, release them from any liability on the patrimoine, and establish a settlement mechanism (includingnetting out cross debts) with clear terms to settle cooperative debts in such a manner to relieve them fromdependence on the Govermnent.
6.10. The defacto monopoly position of PE, especially ONAPSA, in the supply of key agriculturalinputs effectively prevents cooperatives from engaging in activities such as importing seeds and other inputs. Thiscondition is exacerbated by State controls over prices and margins for inputs which squeeze cooperative profits.
6.11. Other constraints blocking the emergence of a private sector cooperative movement in Algeriainclude:
a. The reduction in credit sources and the difficulties of farmers in obtaining seasonal credit whichhave lowered cooperative sales (in some cases cooperatives extend payment facilities to membersto overcome the credit crunch).
b. Price increases for imported inputs, due to the devaluation of the Dinar, which are a factor inthe decline in fanner demand for cooperative products and services.
c. A lack of entrepreneurial attitudes and managerial expertise or practices (especially in the areasof financial management and investment analysis) within cooperative leadership.
d. An unclear and arbitrarily interpreted cooperative tax code.
e. Lack of resources and know-how for membership education and involvement. Many farmers arereluctant to join cooperatives because of the experience with the former govermnent controlledorganizations or misunderstanding of their new status. Recruiting and retaining members willrequire mastering new skills and approaches to allow them to participate actively in the decisionmaking process and to exercise real accountability over cooperative management.
f. A tendency to focus attention on the EAC, EAI, and the larger traditional private farmers to theexclusion of the smallfellah who individually purchase small quantities of inputs but collectivelyrepresent a significant proportion of total production. This tendency is exacerbated by thefellah'slack of capital or access to credit, and by staff's natural preference to deal with the former DAStechnicians, who have a similar educational and employment background.
36
g. Too large a catchment area for the cooperatves that complicates member identification and tendsto alienate the typical member.
h. A tendency at aU levels (farmer, cooperative, DSA) to expect government intervention andsubsidies as a solution to all problems.
i. Mastery in some of the wlaya agriculural decision mdkng circles (DSA, Chamber ofAgriculture, cooperative Directors) of the rhetoric of cooperative privatization but without a real,in depth understanding of what it involves, and continuation of "production at any cost' planningand cooperatives as instrnments of state policy.
6.12. Many of these problems persist because the traditional PE and state controls over matiets, inputprovision and production are maintained. Others pertain to the organization of cooperatives, their managemntutechniques and legislation regarding their new "privatized" status. Solutions need to be organized around aprogram that focuses on cooperatives as part of the broader private sector activities.
6.13. Public Adminston for Agriculture. MOA is the focal point in the conceptualization, designand execution of agricultural policy. Apart from the MOA, three other government organisms are involved inmatters related to agriculture. These are the MOC, the MOF, and the CNP. The basic process is that thetechnical and policy proposals of MOA are synthesized into the budgeting and planning activities by the MOC,MOF and CNP, after being filtered through the various criteria defined by economy wide constraints andpriorities. Within this framework, there are two related issues: (a) the higher role for market forces and privatesector operations will require a reorientation towards new perspectives for the processes and methods ofagricultural policy; amd (b) certain policy objectives (explicit or implicit) appear to be accepted without anycritical assessment of feasibility, cost and altematives.
6.14. The first issue is to ensure that under market conditions the various economic agents in the publicand private sectors are guided by adequate regulatory and policy interventions by the Government. On the wayto restructuring or privatization, production and marketing or distribution decisions by the PE for inpUtS andoutput should be based on market infomation (supply, demand, seasonal patterns, etc.).4 The PE, some of thembeing basically monolithic production structures (e.g., ASMIDAL), are neither organized for nor have thetechnical capacity for market assessment. Hence, even with restuctuing, they may expect to continue to dependon the charity of the public coffer. Some of the others involved in marketing (e.g., ONAPSA) are beginning toadjust by expanding into integrated production and distribution of inputs (e.g., seeds). This adjustment wouldbe of concern first, if it is done under State tutelage, with privileges not accorded to the private sector (to theextent of expanding the monopoly power of the PE) and second, again without a proper market assessment whichwould imply that the associated risks will have to be covered by the Budget. While these may appear to beoperational issues, it appears that the PE have substantial influence on policy making processes and protect theirinterests accordingly. This results in price and market organiztion policies that are not conducive to efficientagricultural production in a sector now dominated by private fianers.
6.15. The second issue is to a certain extent related to the vagueness of objectives. The lack ofspecificity and clarity in objectives results in tools that are not commensurate with the needs and a generaltendency to continue with what was being done in the past. For example, the priority subsectors to benefit frominterest rate subsidies are defined too large in prcportion to the meager resources allocated. Price supports are
34 One example is that the authorities were caught unprepared in 1992 when feilizer consumption was considerablybelow production, resulting in accumuation of large inventories. The Govemnment had to inerfere to reducefertilizer prices, at a substantial cost to the Budget to be determined in 1993.
37
used as self standing tools without the complementary support from technology generation and extension. Theassmen of the policies is confined to the financia implicadons for the budget, and there is little analysis ofthe economic costs of the various policies such as self sufficiency. While one may doubt the quality of thestatistical data, there is very limited, if any, analytical interpretation, even in very elementary ways, of theexiting data.3
6.16. In 1992, MOA was reorganized (Table 46). This reorganization entailed first the transfer of thedirectorates related to irrigation from the Ministry of Equipment to MOA. Second, there was internal adjustment,a prominent one being the elevation of statistics from a subdirectorate under planning to an independentdirectorate. This reorganization is incomplete in two main aspects: (a) some of the directorates do not have thepersonnel and material resources to execute their functions; and, (b) some of the directorates do not have clearterms of reference and others do not have terms of reference that are compatible with the current organizationof agriculture.
6.17. The Directorates of Statistics, Irrigation and Hydro-agricultual Studies do not have the personnelor the resources to implement their programs. Recruiting adequately trained staff remains an issue due to salaryrestrictions. Basic equipment such as computers and links with the rural networks are lackng. These would affectthe effective performance of these directorates.
6.18. With the dominance of private production in agriculture, the Directorates of Planning, EconomicRlation, and Production whose terms of reference pertain to the era of socialist production need to bereoriented to a new role of being regulatory agencies rather than executing agencies. This requires training,restaffing, adequate equipment and above all, emphasis on analyucal capabilities for assessing developments,evaluating policy options and providing policy makers with a sound basis for their decisions.
6.19. It is therefore of paramount importance to develop the MOA as a center for agriculuural policyanalysis, with close linkages to CNP, MOC and MOP and the universities. This will require a program with clearobjectives and terms of reference, entailig (a) trng of exisig staff through in house and extal programs;(b) training staff through degree programs abroad; and (c) provision of the adequate equipment and infrastrmturefor policy analysis. A commitment from the Government, expressing sound interest backed by concrete resourceallocation on a sustainable basis, should be supported by a program of technical assistance.
6.20. Research and Extension. Traditionally, the organization and orientation of agricultural researchin Algeria was geared to the socialist sector. Extension emphasized conveying the technical information necessaryto realize production plans to the limited number of state farms. Hence, the main challenge to the research andextension system today is to reorient itself to the needs of private farmers guided by profit motives under marketconditions with real resource constraints and climate and market risks. The limited resources of the publicresearch and extension organizations essentially require that they be used effectively, in priority areas. A PilotResearch and Extension Project is under implemeion with Bank financing. On the other hand, private sectorresearch and extension should be allowed and encouraged.
6.21. The public sector research and extension activities should focus on a limited number of priorityareas which would not be lucrative enough for the private sector, such as cereals, pulses and adaptation trials foragronomic practices. Research priorities should be clearly identified around a program, which incorporates a welldefined set of training activities. This research program should avoid esoteric basic science research and focus
3 The last agrictual census was held in 1964-65 and a new one is being planned for 1995. The main justificationfor the census is to establish the universe for te sampling basis. Given the resources that a census requies, thisis not a valid justification. The resourc could be used more effectively for case studies or regional studies, usingfaidy effecdve sampling techniques to ensure statistical soundness.

38
on adaptable field-fanner oriented research. Agricultural economics, both policy and field oriented, should bean integral part of the research agenda. High priority should also be given to soil analysis and on-farm fertilizertrials. The basic approach to such research should be flexible and adaptable to incorporate the diversity of farmercircumstances, farm structures and ecological conditions. It should encourage participatory methods to facilitateinformation flows from farmers to guide research. This approach would necessitate a decentaized organizatonrather than a national model for research and extension. Impact assessment should be an integral part of researchand extension projects. Finally, the public research and extension programs must be tailored to what is sustainablein terms of public financing.
6.22. The private sector w.euld be more effective in research and extension in the areas of horticulture,irrigation management and livestock. Some of these activities would fall under the conmmercial practices of privatefirms involved in seed, input or equipment producdon and distribution, regulated according to a well defined setof laws and rules. However, it is also desirable for the private sector professional organizadons (e.g., Chamberof Agriculture or an interprofessional organization) to assume the responsibility of financing research andextension.
7. Colodusions and Recommendation
7.1. Algerian agriculture manifests serious problems that constrain its potential. These problemsemanate from (i) the policy dimension, pertaining to both the general macroeconomic environment and to theagricultural sector specifically; and (ii) structural and institutional constraints, related to land tenure,agroindustrial structure, marketing, input supply, cooperatives and the regulatory environment. The solution ofmajor macroecononmc problems, such as those related to the management of the foreign exchange and traderegimes, thefinancial sector and the interest rate, and budgetary management, will reqwure a well designed andsequenced adjustment program, which should take into consideration the potentia impact on the agriculturalsector. Problems of a polcy and stural natre that pertain specifically to the agricultural sector need to beaddressed within a medium term agricultural sector adjustment program. The salient charaistic of such aprogram would be a higher role for market forces in resource allocation and the private sector in proviingagriculural services in the areas of producton, maring, processing, storage, and inputs supply. However,certain measures can be designed and start to be implemented in order to promote change in agricultural services,which would facilitate an enhanced supply response as a consequence of eventual medium term macroeconomicand sectoral adjustment programs. This section wi1l summarize the conclusions and recommdations for sucha medium tenn program more specifically but will also touch upon longer term issues.
7.2. The main target of agricultural reform and adjustnent should be to accord a higher role for theprivate sector and market forces. This will require a three pronged approach:
a. revew and adjustment of the macroeconomic enWronment, the regulatory framework andstructural, institutional and technical constraints to identify and implement changes that willfacilitate private sector operations under market conditions, including Government policies, suchas price and margin controls, perequation, subsidies, access to foreign exchange, etc., that serveas effective barriers to entry for the private sector;
b. limiting the monopoly powers of the PE through methods that include restructung andprivatiaon and creating more competition through private sector participation to enhanceefficiency of markets; and
c. investment in agricultural services, focusing on those that can be managed by the private sector.
39
7.3. Some of these problems are being addressed in the context of the Stabilization Program. Forexample, price and margin controls have been remnoved from inputs and some other commodities, imports havebeen liberalized and opened up to increased private sector activities, and investments, paicularly in small andmedium private enterprises are being encouraged. However, considerably more work- lies ahead.
7.4. Tecdical assistance wil be necessary to review the exisig regulatory framework and legislationto assess the constraints faced by the private sector. New legislaton wll need to be developedfor considerationby the Government that willfacilitate private sector operations under market conditions and reduce or eliminatethe monopoly powers of PE in agricultural services. Conversely, the State agencies will need to assume aregulatory oversight role as opposed to their traditional role as active participants in the planning of productionand of provision of agricultural services.
7.5. Agriculturalpolicies will need to be based on clear, consistent and transparent objectives. Whileit is the prerogative of any Govemment to influence economic activity, interventions sholdd be selective, entailminimum distortion and be wihin budgetary constraints. In agriculture, it is important to direct interventions toinfluence production through product prices rather than input and service prces to reduce distortions. Socialinterventions should be well targeted to be effective and to reduce spillover distortionary effects. For thesepurposes, it is necessary to develop policy analysis capabilities in the MOA, CNP, MOC and MOP.
7.6. Trade and Foeign Exchange Regimes. On broad macroeconomic issues, those pertaining tothe foreign excange and trade regimes are of critical importance to agriculture:
a. imported inputs entail implicit subsidies due to the overvalued exchange rate, resulting ininefficient use due to distorted prices; better targeted subsidies should be more transparent in thebudget and should not use the exchange rate as the medium;
b. before the macroecomic stabilization program, the limited foreign exchange from officialresources were effectively rationed through administaive processes and QR imposed by theCAHl and, while imports with foreign exchange from the 'paralle" market and own sources wereallowed for the private sector, it was not permitted to reflect the higher foreign exchange costson product and service prices; this caused various compensatory meaures, such as over-invoicing, to recover costs. Starting April 1994 and following the macroeconomic stabilizationprogram, the CAH has been dissolved and the QR have been removed except for (i) strategiccommodities where imports by the private sector would be based on professional, technical andcommercial competence; and (ii) the tenporary suspension of many competing imports to allowdomestic production to develop; on the other hand, imports with foreign exchange from the"parallel" market and own sources are no longer allowed;
c. the overvalued exchange rate renders nontradables expensive and discourages foreign investment;on April 1994, the DA was devalued by 50 percent, but the gap between the official exchangerate and the parallel market rate remains substantial; the macroeconomic stabilization programcalls for the gradual liberalization of the exchange rate leading to the introduction of an inter-bank foreign exchange market by mid-1995;
d. the privilegd access of the PE to foreign exchange perpetuated their inefficiencies and crowdedout the private sector, serving as a barrier to entry; the first trade liberalizing measures underthe Stand-By agreement should facilitate the private sector access to foreign exchange;
e. the wedge between the official and market exchange rates incorporates actions costs and riskpremia, which are rents accruing to agents not directly involved in production and services; and

40
f. foreign exchange retention schemes discriminated against agricultural exports at 50 percent, whilethe global retention rate was 100 percent; after mid-1994, the foreign exchange retention rate isunified at 50 percent for all types of exports (except for hydrocarbons and mine products).
7.7. Broader concers such as the management of the foreign debt will be influeial in the resolutionof the issues surrounding the foreign exchange and trade regimes. A thorough discussion of these issues can befound in the Country Economic Memorandum (CEM) (Report No. 12048-AL). In 1994, Algeria has restmcturedits official and commercial debt with the Paris and London Clubs. The fundamental recommendation is alsoappropriate for agriculture: the target should be to unzy theforeign exchange rate and litmt the transactions t*atcan benefitfrom a preferential rate to befwrdedfrom official sources to a narrow positive list. Foreign exchangeat the unified rate should be available competitively to all economic agents. Any preferential treatment andprivileged access to foreign exchange accorded to PE should be explicitly eliminated. QR should be eliminatedon the remnin products that are still under Government control and compensatory tariffs should be introduced.The activities of the financial institutions associated with internadonal trade, such as letters of credit, transfers,etc., also need to be improved.
7.8. The fcs on agricual production to improve self sfflciency should be reevaltued,eirphasizing food security through trade bused on comparative adnages and efficient use of resources. Thetechnical limits on increasing SSR in food imply that agricultural resources, especially in those areas endowedwith better soils, irrigation and higher rainall, should be used more efficiently to diversify production, inpartcular, focusing on high value products that can also induce high value added processing, destned forsegmented markets and exports. Sustainable production for export markets needs to be competitve. Furthermore,export markets have higher standards and are difficult to penetrate without specific investmeAt to meet theirrequiments. Algeria should identify and focus on export market niches for products with comparativeadvantage, with due attention to quality aspects.
7.9. Rural Fine and dterest Rates. The second issue of a broad macroeconomic nature perainsto the financial sector and interest rate policies. The state dominates the financial sector both in terms ofcontrolling the financial institutions and determining the interest rate, which is negatve in real tems and moreso for agriculture. These fundamental issues need to be addressed in general terms. However, the specificproblems and needs of the agricultural secor have to be noted. Ihe higher transactons costs and risks associatedwith agriculturalproduction would make ruralfinance a low prioty in lending portfolios of commercialfinancialinstitutions. Hence, compensatory measures such as subsidizing the transactions costs of ruralfinance may haveto be considered. Under all circwnstances, positive real interest rates are recommendedfor agriculure as wellto reduce the bias towards capital intensive technology choices and to promote more labor intensive methods thatwill promote labor -bsorption in the face of high rural unemployment. Rural financial institutions will need tobe assessed with a tL -ough study to develop options for effective, efficient and competitive credit for seasonaland mvestment finance. Particular attention will need to be paid to developing adequae risk managementcapacty and risk sharing arrangements through insurance and calamity fimds.
7.10. Price Podcies. Price policies covering both product prices and input prices should be subjectedto a thorough review and options need to be developed with a clear understanding of their implications. Certainbasic principles should apply to the review and reform of price policies:
a. all controls over margins and pireqation schemes need to be eliminated to enhance privatesector interest, to reduce rents arising from avoiding such restrictions, and allow arbitrage;
b. price iterventions should be confined to a basic minimum of commodities, this has already beenaccomplished under the Stand-By agreement; the basic tools for influencing markets and pricesshould be developed with a view towards minimizing budgetary burden (e.g., compensatory

41
payments, rather than purchases and storage by the State, as this causes resources to be tied up)and enhance traparency;
c. to reduce distortions affecdng efficiency of hiput use, interventions in markets should berestricted to output prices;
d. subsidies should not be implemented exclusively through the PE and other options should beexplored; and
e. any subsidy scheme for social reasons should be well targeted and less distortionary meansshould be chosen for such interventions.
7.11. The design and the sequencing of agricultural price policy reform would need to be developedbased on thorough studies that identify options, priorities and measures to alleviate the inevitable adverse anddifferential consequences on some producers, economic agents and consumers. Developing these options foragricultural price policy wiU require serious preparatory work, including an understanding of linkages with otherfactors such as the macroeconomic variables of the exchange rate and the interest rate; the trade regime; publicenterprise reform and restucrng; private sector development with an effective regulatory frmework; andstructural and institutional reform.
7.12. Land Teue. A funamental structural problem is the current land tenure system which doesnot accord explicit ownership rights to farmers. An e plicit and dear policy statement is necessary, announcingthe commitment to pivatizaon of land and asswing the security of tenure. The lack of security of ownershipis constraining farm level investments, possibly causing inefficient exploitation or outright neglect, and theimpossibility of using land as collateral is limiting access to both seasonal and investment credit. Problemsassociated with land tenure can be addressed with a long tenn program. Cadastre of the new distribution of landwill take time and resources. Under the Cadastre Project supported by the Bank, resources have been allocatedfor a study on agricultural land temnre.
7.13. Structure of Indutry. Another fuidamental stucual problem arises from the industrializationmodel adopted in Algeria, as it affects agroindustry and agricultural input industries. This model emphasized anindustrial stru e under public ownership with large scale, capital intensive operations, which, in turn,promoted import dependence to assure timely supply of sutdardied and uniform inputs in large amounts. Asa consequence, domestic sources of supply were either neglected or treated as problem areas that could onlysurvive with state support. A very serious consequence of this model was that it was of limited use in creatingemployment and absorbing labor, in contradiction with the exing factor proportions in the country. Thisstructue has hence contributed significantly to the current problems of unemployment, compounded by policiesthat subsidized capital intensive methods, even in the agricultural sector. Hence, faurefocus on agroindustry andagncultural services should be on small scale, labor intensive pnvate sector operations.
7.14. Cooperatives. As a special issue in private sector development, cooperatives need to be trulyprivatized and allowed to participate in a competitive manner in markets to serve their members. This will requirea review of the current structure and legislation, eliinating the cooperative status of CCLS, notwithstanding theirrestructuring, and the removal of the monopoly powers of the PE in marketing, input supply and agriculturalservices. The patrimoine and other debts of cooperatves that are not a consequence of their own actions and thatare essentially legacies of Govermment policies, should be cleared through a settlement mechanism.
7.15. Subsectoral hu. Certain policy reforms are a pre-requisite to the development of agriculturalservices. Only minor developments can be expected in marketing and processing under the current centrally

42
planned enviroment for the cereals and dairy subsectors. Reforms in these two key sensitive subsectors needto be based on well designed programs to ensure sufficient and stable supply.
7.16. In the cereals subsector, price and trade policy refonns will require special effort. Intemationaltrade with Algeria in cereals is conducted under concessional arrangements that defacto use a single Algeriancounwtpait that guarantees credit and that can handle large quantities. Hence, reform in this sector would needto be developed based on thorougb and detailed studies, considerng domestic production issues as well. The roleof OAIC in the cereals sector needs to be assessed and due considerion should be given to graduallyrestring and developing it into an organizaton managing security or buffer stocks of staples, whie theprivate sector manages the main activites of imports, marketing, storage andprocessing of cereals. Consideringthat Algeria will continue to depend largely on imports for the country's needs over the long run in cereals andceal products, it would be conceivable to select the main port terminals and related facilities to be modernizedand/or expanded, and be put under private sector management.
7.17. In the dairy subsector, the distortions that produce wide differences between producer andconsumer prices and import costs need to be reduced. Consumer subsidies need to be targeted towards vulnerablegroups. Furthermore, the issue of the comparative advantage in milk production would need to be addressed,including the role it plays in the portfolio of agricultural products for farmers. If price distortions are reduced,there would be interest by the private sector in developing small to medium size marktg and processingactivities.
7.18. Reforms in price and trade policies, and demonopolization would be imperative before anynvolvement in investments in the sugar and oilseeds subsectors. In both subsectors, restructuring andrefurbishing of the existng refiming facilities would need to be analyzed. Studies looking at the production andmarket potental for oilseeds would also be recommended. In the fjhits and vegetables and livestock subsectorsthere is significant potential for private and public investment but the main issue is to give the private sectoraccess to credit and foreign exchange.
7.19. Prvate Sector Development, RetrcrA g and a on of Public Eterpises.Development of private marketing services would need substantial reform in the role of Government and itsagencies in pricing products. Such reform should guarantee enough freedom to emerging entrepreneurs such asmerchants, transporters, small processors and retailers, to let them gradually supplat the existing large PE (i)in offering alternative new outlets for farmers products; (ii) in addig higher value to agricultural products; (ii)in creaing jobs; and (iv) in providing better supply (arger quantities, better quality and efficient services) to thepopulation. The role of the Government, together with the rresentatves of entrepreneus and farmers in eachsubsector, should focus on rules and enforcement of fair compettion and contacts, consumer health safety,improved public infrastructure and more information about supply and demand, prices and new technologies.
7.20. Restucturing and/or prvatizon of agroindustrial enterprises in competive subsectors shouldbe a pnority. Private sector development has the biggest potential in processing in the cereals, feed, fruit andvegetables and livestock subsectors. Pricing policies, preference to parasatals, including large subsidies, preventprivate sector operations. Privatization should be addressed, starting with the ERIAD in the milling and baidngindty, ENAFLA, ENAFROID, ENCG, SOJUC, and the regional dairy and meat boards (OROLAIT,ORELAIT, ORLAC, OREVIC, ORVE and ORVO).
7.21. In input supply, the domnantpositon of ONAPSA should be considered with pnorty with a viewtowards resucturing andprivatzation. Similarly, problems associated with other PE such as ONAB, GDIMMA,etc., should be addressed and programs should be developed for restrucuring and privadzation. PMA andASMIDAL's restructuring plans are being addressed under EFSAL and needs to be followed up. On policymatters, state controls over prices, margin and other concrete allocation decisions need to be removed.

43
7.22. Investmits In Aricultual Services. Areas for potential inveme agricultura servicesneed to be identified to complement the adjustment process. Technical and fiancial support for investment couldtarget three categones of investors providing services to farmers. A summary of potential areas for investmentand technical assistance is given in the matrinx below. These categories of investors would be:
a. private enterprises (including privadzed enerpris or enterprises well advanced in the processof the privatization) providing wholesale marketing and processing services along the agriculturaland food marketing chain; merchants and associations of farmers whose main activities are (i)to buy or get delivery of agricultural products from farmers and importers; (ii) to condition(clean, dry, sort, package, etc) these products accordingly with incentives given by the domesticmarkets; (iii) to store; (iv) to transport; (v) to process the products and add service value tothem; and (vi) to manage commercial risks and risks related to price fluctuations;
b. selected PE, with a strong commitment from Government to demonopolize and privatize, toimprove the handling of domestic and imported socially sensitive products, and to assist theirreorientation to new, or more focused, activities; and
c. the State and municipalites to improve a number of public and semi-public (in connection withnational or regional professional associations) (i) infratructure (mainly port facilities to unloadincoming ships, facilitate transit, inspection, inland transportaton, etc., and regional commodityexchanges); and (ii) agencies involved in the priority fields listed above, i.e., regulating andenforcement of fai competition and contracts; consmer health safety; and market information;and training in business admiion and marketing. The in investments shouldemphasize management by the private sector to enhance cost recovery for O&M.

44
Matix for Summary A_sment of Agrictual Servic Development
Agricultural _____________ Phsal Eeme of PodutwPs xcang of Risk iluunlnatl. o Market m.forzalim
Ma.n | upt potential Ma_ Poteni Inestmnt Level of Risk Main Asse_ment of Suggdted Areas for Acionto famers Deveopmt of Areas of Nice Counter- Market Informato
(outide se- Private Enepries Phiu pat tocommuptia.) I Farmer
Ceras The CCLS under None wihin the Port sios nd alig None fo bread State budget Admistave pcing PbaNio in ral tirm oftthe sw4etvion of _irdCMNaon er4 m ida and durmm and PE pubwe in th e Market infom3a*mUCA and OAIC and Imort sysemm tUnpa small local wheat; Small Officia ourl; aching imos Of gkiD
silos for feed volumes of domestic and flour, and estimatesproducs production. trade and abot coming rp
p t dat remainrested to a lfw
snior decision makrs
Oiseeds( One PE (ENCO) None witin the One crushing plant (but under not picable not not applicablecurreuscowpensatlou numerous conditon) and apcaand Import system retucu_ g of exisin
_ _ _ _ _ _ _ __ _ _ _ _ _ _ __. rei neries _ _ _ _ _ _ ___ _ _ _ _ _. ___ _ _ _ _ _ _
Sugar beets (*) One PE None witin dhe . not applcable not not applicable(ENASUCRE) cant compensaton appliable
.___ ____ ______and ino rt system Milk Regional PE and Minmal withiIn he Deveopmnt of a pilot Smanll wihin State budget mostly nonexistent Plcatons of esdmates of
small local cumunt compensation network of sanl collection tho current and PE prodution of milk; importsprocessors and import system cents in seetC rgios; intrvention of daisy products
refrgrated tucs and pick- systemI____ __ up cks
Fresh prodce One PE Large for both a) Prinv: Medi-sie Potentially bigh Local Poor marker Cogaboration between(ENAFLA) and commerc and | refrigeaed soo level of risk merchants informadion in tms govenmenit ageaces andnumerous small condidoning packaging equpmem (box, and of data collec seectd secl trudewholesalers aan a etc.e rorirted (ntuc dNAFA proemsinatOn cotcion, pocpessn dand
w esalers a e.and tg rapdgoatd tNu¢ p drosemsiain coDecdon. ptoIroeg andI I b) Public: infrastuctu for dissmination,j_________ _ vwhoksdae exchange markets

45
dustal 23 privae Sman Restructuing and pduct Hgh with a Sae budget Weak see fresh producetomatoes enpdses and one d rather short and, to a
PE period of smal extnt,production private
enutepre-neun (**)
Potatoes One PE Medium Stoage aHcilies; packaging High State budget, Weak see fresh produce(ENAPLA) and equ_pent diverified ENAPLAnumous smal processing and privaewholesakles anae _
__ __ _ __ _ retailrs __ _ _ _ _ _ _ _ _ _ _ _ _ _ __ _ _ _ _ _ _ _ _ _ _ _ _( *)
Livestock numeo small medium to large for a) Private: specialized ucks, Lage Local private Weak Collaboration betweenwholsalers and commerne, small for ceanig equipment for mercants government agecies andrers ard the processng sanitation, ef ad trucs or, to a selcted sector trade
regioa PE for process, meat s exnt, asocatons to iWove datawholers and retailes; the regional colecdon, prwcesig and
b) Public: senies, paasta dssemitonIfastrucu for selected
__ _ _ ___ _ . _ ___I__ __ r_ io a ex h n e_ ak t .__ _ _ _ _ ___ _ _ _ ___ _ _ _ _ _ _ _ _
Input PE monopows, Large for madktg, Private: strage, cold stMage,| Low risk Stae budget Litle market Colaboradon betweendistrion and coopeavs and stora, tanport and transpoaon through the information under government agencies andservice some pte sector imports as well as equ nt,repair shops. PE disperd private selcted seoral tradeprovison repair and di on networks secor agricual asociations to inprove data
t _humame servies, production colection, procing andprovided pica aD dissemndonmarg controls are
input and PE monpoies Some; needs to be Small scal production Medium risk State budget Poor market Collaboration betweenmwcey ad through PE In assessed and would activities; refibishlng large through the information under government agencies aNdequipment Input distrdbuon requimes elimnato of scae plants based on PB small scale private selected setral tradeproduction ard service price and margin assessment of economic agricultural product associations to imprve dua
provision controls conditi and possible colctio, prcing andsucu arid pdivatizaton dissemination
() curently there is no production in Algeria.(CC) forward contractig i8 not developed and enfrcement would be difficult.
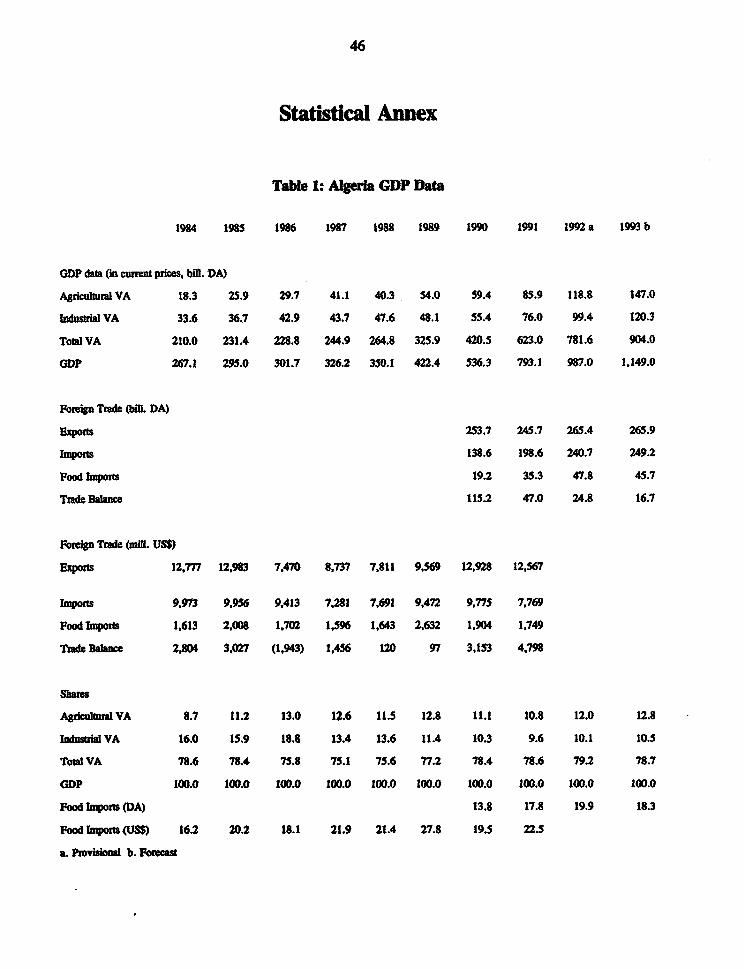
46
Statistical Annex
Table 1: Algea GDP Data
1984 1985 1986 1987 1988 1989 1990 1991 1992 a 1993 b
GDP data (in currn pices, bill. DA)
Agricultal VA 18.3 25.9 29.7 41.1 40.3 54.0 59.4 85.9 118.8 147.0
Indusra VA 33.6 36.7 42.9 43.7 47.6 48.1 55.4 76.0 99.4 120.3
Total VA 210.0 231.4 228.8 244.9 264.8 325.9 420.5 623.0 781.6 904.0
GDP 267.1 295.0 301.7 326.2 3S0.1 422.4 536.3 793.1 987.0 1,149.0
Porign Trade (bill. DA)
E;xOrs 253.7 245.7 265.4 265.9
Import 138.6 198.6 240.7 249.2
Food Impots 19.2 35.3 47.8 45.7
Tfade Balne 115.2 47.0 24.8 16.7
Forign Thade (mill. US$)
Expo 12,777 12,983 7,470 8.737 7,811 9,569 12,928 12,567
Impots 9,973 9,956 9,413 7.281 7,691 9.472 9.775 7,769
Food Imports 1,613 2,008 1,702 1.596 1,643 2,632 1,904 1.749
Tmade Balance 2,804 3,027 (1,943) 1,456 120 97 3,153 4.798
Sbr
Agriudl VA 8.7 11.2 13.0 12.6 11.5 12.8 11.1 10.8 12.0 12.8
lndustril VA 16.0 15.9 18.8 13.4 13.6 11.4 10.3 9.6 10.1 10.5
Total VA 78.6 78.4 75.8 75.1 75.6 77.2 78.4 78.6 79.2 78.7
GDP 100.0 100.0 100.0 100.0 100.0 100.0 100.0 100.0 100.0 100.0
Food Impoms (DA) 13.8 17.8 19.9 18.3
Food mports (US$) 16.2 20.2 18.1 21.9 21.4 27.8 19.5 22.5
a. Pevisional b. Forecast

47
Table 2: Algeria - Investueuts (billion DA)Value Value Value Value Value Shae Share Share Share
1989 1990 1991 1992a 1993 b 1990 1991 192 1993 ba
Agriculture and Fisheries 4.20 3.67 S.SO 5.67 7.84 3.84 4.13 3.17 3.17
Agriculttre (c) 0.56 1.00 1.30 1.20 1.70 1.05 0.98 0.67 0.69
Fisheries (c) 0.02 0.00 0.01 0.03 0.04 0.01 0.00 0.02 0.02
A&F Pdvate Sector 3.62 2.67 4.19 4.44 6.10 2.80 3.15 2.49 2.49
Hydraulics and Fory 5.41 5.52 7.31 9.27 16.47 5.78 5.49 5.19 6.72
Hydraulics (c) 4.49 4.57 S.91 4.70 14.47 4.78 4.44 2.63 5.90
Forey (C) 0.92 0.90 1.40 1.70 2.00 0.94 1.05 0.95 0.82
H&F Private Sector 0.00 0.05 0O.O 0.00 0.00 0.06 0.00 0.00 0.00
.&F&H&P Public 5.99 6.47 8.62 7.63 18.21 6.78 6.47 4.27 7.43
A&F&H&P Private 3.62 2.72 4.19 4.44 6.10 2.85 3.15 2.49 2.49
A&F&H&P Total 9.61 9.19 12.81 12.07 24.31 9.62 9.62 6.76 9.92
Total Public 39.05 41.21 51.52 72.27 109.00 43.16 38.70 40.46 44.48
Total Priva 50.65 54.27 81.61 106.33 136.06 56.84 61.30 59.54 55.52
ToWa 89.70 95.48 133.13 178.60 245.06 100.0 100.0 100.0 100.0
(a) Provisional
(b) Forecast
(C) Public Investments

48
Table 3: Algeria - Employment
1984 1985 1986 1987 1988 1989 1990 1991 1992 1993prOV plan
Agriculture 960 990 1,002 1.003 1.003 1,010 970 1.040 1,050 1,080
Total 3,718 3,840 3,914 3,979 4,039 4,095 4,144 4,236 4,296 4,407
Growth
Agriculture 3.1 1.2 0.1 0.0 0.7 (4.0) 7.2 1.0 2.9
Total 3.3 1.9 1.7 1.5 1.4 1.2 2.2 1.4 2.6
Share of Agricultue 25.8 25.8 25.6 25.2 24.8 24.7 23.4 24.6 24.4 24.5
Emiployment Creation
Agricudture 30 12 1 0 7 -40 70 10 30
Total '22 74 65 80 79 83 125 80 126
Share of Agricuture 24.6 16.2 1.5 0.0 8.9 56.0 12.5 23.8

49
Table 4: Algeria - Employment according to the 1987 Census
Total Percent
Labor Force 5,237,506
Unemployment 1,135,140 22 percent of labor force
Employed Labor Force 4,102.366 78 percent of labor force
Employed Agricultural Labor (b) 756,571 18 percent of employed labor
Employed Rural Labor 1,741,494 42 percent of employed labor
Rural Labor Force 2,342,310 45 percent of labor force
Employed Rural Labor 1,741,494 74 percent of rural labor force
Unemployed Rural Labor 600,816 26 percent of rural labor force
Female Labor Force 419,753 8 percent of the labor force
Rural Female Labor 68,519 16 percent of the female labor force
Employed Agriacuul Female Labor (b) 5,948 1 percent of employed agricul labor
Unemployed Femrae Labor 58,774 14 percert of the female labor force
Unemployed Rural Female Labor 16,565 24 percent of the rural female labor force
Male Labor Force 4,817,753 92 percent of the labor force
Rural Male Labor 2,273,791 47 percent of the male labor force
Employed Agricultural Male Labor 0) 746,813 99 percent of employed agriculturl labor
Unemployed Male Labor 1,076,366 22 percent of the male labor force
Unemployed Rural Male Labor 584,251 26 percent of the rural male labor force
Employment of Heads of Household (a) (c)
Total 2,536,626
Employed 2,283,612 90 percent of the total heads of households
Unemployed 253,014 10 percent of the total heads of households

50
Urban Total 1,334.339 53 percent of the total heads of households
Urban Employed 1,241,591 93 percent of the urban heads of households
Urban Unemployed 92,748 7 percent of the urban heads of households
Female Urban Total 48.746 4 percert of the urban heads of households
Female Urban Unemployed 1,568 3 percent of the female urban heads of households
Male Urban Total 1,285,593 96 percent of the urban heads of households
Male Urban Unemployed 91,180 7 percent of the male urban heads of households
Rural Total 1,202,287 47 percent of the total heads of households
Rural Employed 1,042.021 87 percent of the rural heads of households
Rural Unemployed 160,266 13 percent of the rual heads of households
Female Rural Total 11,491 1 percent of the mral heads of households
Pemale Rural Unemployed 650 6 percent of the female rual heads of households
Male Rural Total 1,190,796 99 percent of the mral heads of households
Male Rural Unemployed 159,616 13 percent of the male rural heads of households
(a) Covers resident active population 15 years of age and over.
(b) Includes both urban and rural agricultural labor.
(c) The data in the official staisties are inconistent between totals and sums of parts and hence unreliable. The dataabove reflect totals based on sums of parts.
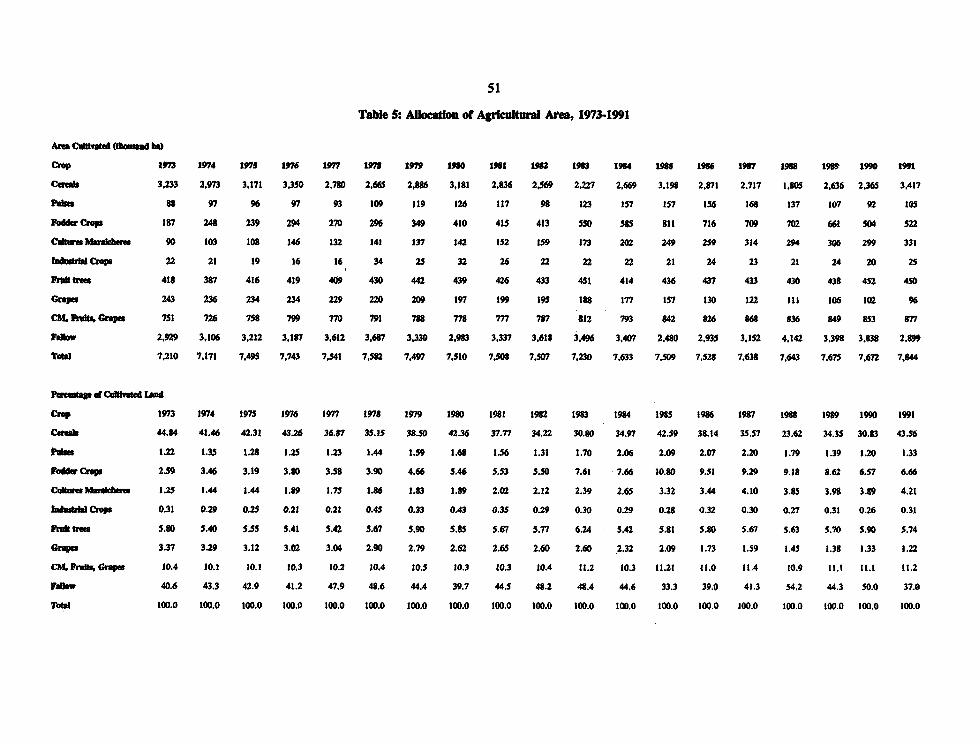
51
Table 5: ALocation of Agrkcltral Area, 1973-1991
Ar Cvied Oumud be
Crp V7;3 1974 175 176 1977 1978 1980 1961 1962 1963 19S4 1965 19S6 19S7 19 16 1990 1991Ceats 3.233 2.973 3.171 3,350 2,780 2,665 2,886 3,181 2,836 2,569 2.227 2,669 3.198 2,871 2.717 1.805 2.636 2.365 3.417Pts 88 97 96 97 93 109 119 126 117 98 123 157 157 156 168 137 107 92 105
Fodder Crop 167 24 239 294 270 296 349 410 415 413 550 585 811 716 709 702 661 504 522CuturesMraMbwu 90 103 103 146 132 141 137 142 152 159 173 202 249 259 314 294 306 299 331
lA&lcrps 22 21 19 16 16 34 25 32 26 22 22 22 21 24 23 21 24 20 25Fra tret 418 387 416 419 409 430 442 439 426 433 4S1 414 436 437 433 430 438 452 450
Graj 243 236 234 234 229 220 209 197 199 195 168 177 157 130 122 I1I 106 102 96CM. F , Grpa 751 726 758 799 770 791 788 778 777 787 812 793 842 826 S68 S36 849 853 177Falow 2,929 3,106 3,212 3.187 3,612 3,687 3.330 2,983 3,337 3,618 3,496 3,407 2.480 2,935 3.152 4,142 3.398 3.838 2.699Tald 7,210 7.171 7,495 7.743 7.541 7,582 7.497 7,510 7,506 7,507 7,230 7.633 7.509 7.528 7,638 7.643 7.675 7.672 7,44
Patage o C blrted Lad
Crp 1973 1974 1975 1976 1977 1978 1979 1980 1981 1982 1983 1984 1985 1986 197 1988 1989 1990 1993Cagab 44.84 41.46 42.31 43.26 36.87 35.15 38.50 42.36 37.77 34.22 30.60 34.97 42.59 38.14 35.57 23.62 34.35 30.83 43.56tube 1.22 1.35 1.28 1 .25 1.23 1.44 1.59 1.68 1.56 1.31 1.70 2.06 2.09 2.07 2.20 1.79 1.39 1.20 1.33Fodr crops 2.59 3.46 3.19 3.8D 3.58 3.90 4.66 5.46 5.53 5.50 7.61 7.66 10.60 9.51 9.29 9.18 8.62 6.57 6.66
Cdlwes rksres 1.25 1.44 1.44 1.89 1.75 1.86 1.83 1.89 2.02 2.12 2.39 2.65 3.32 3.44 4.10 3.85 3.98 3.89 4.21
IndrIa Crp 0.31 0.29 0.25 0.21 0.21 0.45 0.33 0.43 0.35 029 0.30 0.29 0.28 0.32 0.30 0.27 0.31 0.26 0.31
Frut te 5.80 5.40 5.55 5.41 5.42 5.67 5.90 5.85 5.67 S.77 6.24 5.42 5.81 5.80 5.67 5.63 5.70 5.90 5.74
Gapes 3.37 3.29 3.12 3.02 3.04 2.90 2.79 2.62 2.65 2.60 2.60 2.32 2.09 1.73 1.59 1.45 1.38 1.33 1.22CM, Frunds, Grapes 10.4 10.1 10.1 10.3 10.2 10.4 10.5 10.3 10.3 30.4 11.2 10.3 11.21 11.0 13.4 10.9 11.1 11.1 11.2Falow 40.6 43.3 42.9 41.2 47.9 48.6 44.4 39.7 44.5 48.2 48.4 44.6 33.3 39.0 41.3 54.2 44.3 50.0 37.0TbOW 300.0 100.0 100.0 100.0 100.0 100.0 100.0 100.0 300.0 300.0 100.0 100.0 100.0 100.0 100.0 100.0 100.0 300.0 100.0
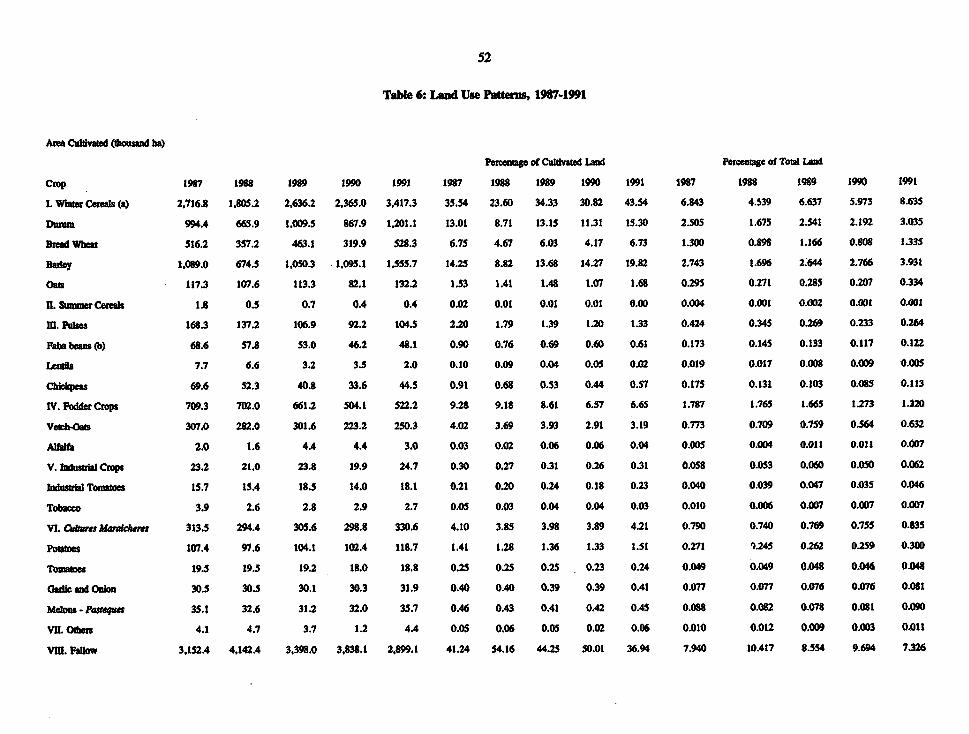
52
Table 6: Lnd Use Patterns, 1987-1991
Ans Cudvatd (6ousand ha)
Pecemap of Cu1atd Lad Percenage of Total Land
Ctop 1987 1968 1969 1990 1991 1967 1968 1989 1990 1991 1967 1968 1989 1990 1991
1. Wnt Cereals (a) 2,716.8 1,605.2 2,636.2 2,365.0 3,417.3 35.54 23.60 34.33 30.82 43.54 6.843 4.S39 6.637 5.973 8.635
Dutum 994.4 665.9 1,009.5 867.9 1,201.1 13.01 8.71 13.15 11.31 15.30 2.505 1.675 2.541 2.192 3.035
Bread Wheat 516.2 357.2 463.1 319.9 S28.3 6.75 4.67 6.03 4.17 6.73 1.300 0.898 1.166 0.808 1.335
Ba*y 1,089.0 674.5 1,050.3 1,095.1 1,555.7 14.25 8.82 13.68 14.27 19.82 2.743 1.696 2.644 2.766 3.931
Oau 117.3 107.6 113.3 82.1 132.2 1.53 1.41 1.48 1.07 1.68 0.295 0.271 0.285 0.207 0.334
IL Summer Cereals 1.8 0.5 0.7 0.4 0.4 0.02 0.01 0.01 0.01 0.00 0.004 0.001 0.002 0.001 0.001
m. Puse 168.3 137.2 106.9 92.2 104.5 2.20 1.79 1.39 1.20 1.33 0.424 0.345 0.269 0.233 0.264
FAW beans (b) 68.6 S7.8 53.0 46.2 48.1 0.90 0.76 0.69 0.60 0.61 0.173 0.145 0.133 0.117 0.122
TIls 7.7 6.6 3.2 3.5 2.0 0.10 0.09 0.04 0.05 om 0.019 0.017 O.00S 0.009 0.005
Ch jlpa 69.6 52.3 40.8 33.6 44.5 0.91 0.68 0.53 0.44 0.57 0.175 0.131 0.103 0.085 0.113
IV. Fodder Cops 709.3 702.0 661.2 504.1 522.2 9.28 9.18 8.61 6.57 6.65 1.787 1.765 1.665 1.273 1.320
Vetch.oas 307.0 282.0 301.6 223.2 250.3 4.02 3.69 3.93 2.91 3.19 0773 0.709 0.759 0.564 0.632
AlfIlfa 2.0 1.6 4.4 4.4 3.0 0.03 0.02 0.06 0.06 0.04 0.005 0.004 0.011 0.011 0.007
V. I_sdal Crops 23.2 21.0 23.8 19.9 24.7 0.30 0.27 0.31 0.26 0.31 0.058 0.053 0.060 0.050 0.062
1ndut Tomatoes 15.7 15A 18.5 14.0 18.1 0.21 0.20 0.24 0.18 0.23 0.040 0.039 0.047 0.035 0.046
Tohecco 3.9 2.6 2.8 2.9 2.7 0.05 0.03 0.04 0.04 0.03 0.010 0.006 0.007 .07 0.07
VI. Culum Makms 313.5 294.4 305.6 298.8 330.6 4.10 3.85 3.98 3.89 4.21 0.790 0.740 0.769 0.755 0.835
Potatoes 107.4 97.6 104.1 102.4 118.7 1.41 1.28 1.36 1.33 1.51 0.271 0).245 0.262 0.259 0.300
Tomaoes 19.5 19.5 19.2 18.0 18.8 0.25 0.25 0.25 0.23 0.24 0.049 0.049 0.048 0.046 0.04S
(arlic aNd Onion 30.5 30.5 30.1 30.3 31.9 0.40 0.40 0.39 0.39 0.41 0.077 0.077 0.076 0.076 0.081
Maim - PAsteq 35.1 32.6 31.2 32.0 35.7 0.46 0.43 0.41 0.42 0.45 0.088 0.082 0.078 081 0.090
VIl. Ods 4.1 4.7 3.7 1.2 4.4 0.05 0.06 0.05 0.02 0.06 0.010 0.012 0.009 0.003 0.011
Vm. PFlow 3,152.4 4.142.4 3,398.0 3,838.1 2,899.1 41.24 54.16 44.25 50.01 36.94 7.940 10.417 8.554 9.694 7.326

53
IX. Grap 121.6 110.8 IOS.6 101.9 96.0 1.59 1.45 1.38 1.33 1.22 0306 0.279 0.266 0.257 0.243
Table gapes 37.0 37.5 39.0 39.8 40.0 0.48 0.49 0.51 0.52 0.51 0.093 0.094 0.098 0.10t 0.101
Wine gapes 79.6 68.1 62.7 59.1 55.3 1.04 0.89 0.82 0.77 0.70 0.201 0.171 0.158 0.149 0.140
GOapwsforfawsl 1.6 1.4 1.3 1.5 1.4 0.02 0.02 0.02 0.02 0.02 0.004 0.003 0.003 0.004 0.004
P*uc nuwl 3.3 3.8 2.6 1.5 1.3 0.04 0.05 0.03 0.02 0.02 0.008 0.010 o.007 0.004 M003
X. Fndt a 433.4 430.5 437.7 452.3 449.9 5.67 5.63 S.70 5.89 5.73 1.092 1.082 1.102 1.142 1.137
Dae palm 72.5 76.2 78.3 78.6 81.9 0.95 1.00 1.02 1.02 1.04 0.183 0.192 0.197 0.199 0207
Olive ues 161.7 161.2 161.5 170.2 164.5 2.12 2.11 2.10 2.22 2.10 0.407 0.405 0.407 0.430 OA16
Clau 45.5 44.6 45.1 44.3 43.9 0.59 0.58 0.59 0.58 0.56 0.115 0.112 Q.114 0.112 0.111
o0abs 153.7 148.5 152.8 159.2 159.7 2.01 1.94 1.99 2.07 2.03 0.387 0.373 0.3 0.402 0.403
Xl. Naral Prairies 26.1 23.1 34.3 26.1 35A 0.066 0.058 0.086 0.066 0.089
Xn. ?acag & awrco 31.104.8 31,151.7 31,053A 31,015.3 30,780.9 78.347 78.336 78.177 78.335 77.778
Xm. Non aducre Land 972.8 979.7 993.2 916.2 953.5 2.450 2.464 2.500 2.314 2.409
Total Ariult LaId 39,701.2 39,766.6 39,722.2 39,592.9 39,575.3 100.000 100.0 100.0 100.0 100.0
Totl Land Use 39,748.0 39,03.2 39,760.3 39,631.5 39,618.8 100.1 100.1 100.1 IOD.t 100.1
Toal Culvad Land 7,644.3 7,648.7 7,679.3 7,673.9 7,849.2 100.00 100.00 100.00 100.O0 100.00 19.255 19.234 19.332 19.3S2 19.33
Notl: (a) Are Harvesed (b) PaF bems and Evoes

54
Table 7: Distribution of Irrigated Land (1990)
Irrigated as Distribution of
Cultivated Igated percent of hrigated LandCrop Area Area Cultivated (percent)
Cereals 2,365.0 26.0 1.1 6.7PUss 92.0
Tree Crops 452.0 151.0 33.4 39.1
Grapes 100.0 6.0 6.0 1.6Vegetables 299.0 173.0 57.9 44.8
Industa Crops 20.0 10.0 50.0 2.6Forage Crops 504.0
Others 20.0 5.2
Total 3,832.0 386.0 10.1 100.0

55
Table 8: Production of Principal Crops (1962-1993) ('000 )
Crop 1982 1983 1984 1985 1986 1987 1988 1989 1990 1991 1992 1993
Durom Wheat 632.6 492.0 586.0 961.8 764.7 776.5 415.4 813.3 554.9 1,291.8 1,299.8 796.1
Bread Wheat 344.5 297.8 300.6 S16.3 444.1 398.3 199.0 338.8 195.1 577.6 466.8 220.4
Buley 483.4 446.7 502.7 1,330.2 1,082.8 819.9 389.7 789.9 833.4 1,809.9 1,370.2 408.0
Oats 60.1 49.4 64.4 107.7 89.1 67.7 29.6 59.6 41.3 128.1 88.2 27.2
Paba beans 19.5 21.1 26.1 31.6 41.0 33.0 15.5 23.2 16.2 32.5 28.0 20.3
keveroa)
LAntis 1.7 1.1 1.7 2.0 0.8 2.1 1.5 1.2 0.8 0.9 1.0 0.8
Chickpas 9.3 9.9 12.6 16.3 18.2 25.9 14.6 20.5 14.8 24.2 26.1 24.9
ldustal 52.4 91.9 121.7 131.7 169.8 166.1 158.8 204.6 106.1 219.1 335.2 524.9Tomatoes
Tobacco 4.5 3.3 6.3 4.0 3.9 4.6 3.5 3.5 3.6 3.4 7.0 6.9
Potoe 415.1 490.7 520.9 814.7 811.7 904.6 898.8 1,000 808.5 1,077.3 1,300 1,065.2.7
Tomoes 194.0 159.8 144.0 217.3 302.2 291.2 282.8 306.6 295.9 315.4 550.0 303.8
Melns - 193.2 206.9 243.0 318.2 317.7 360.0 232.0 300.9 264.1 371.5 50.0 490.0Par_qes
Date pahm 206.5 181.5 182.7 198.8 188.8 224.4 196.1 210.1 205.9 209.1 253.0 261.6
Citrus 319.4 255.4 285.4 244.1 253.1 277.2 311.8 268.1 281.0 323.6 275.6 360.8
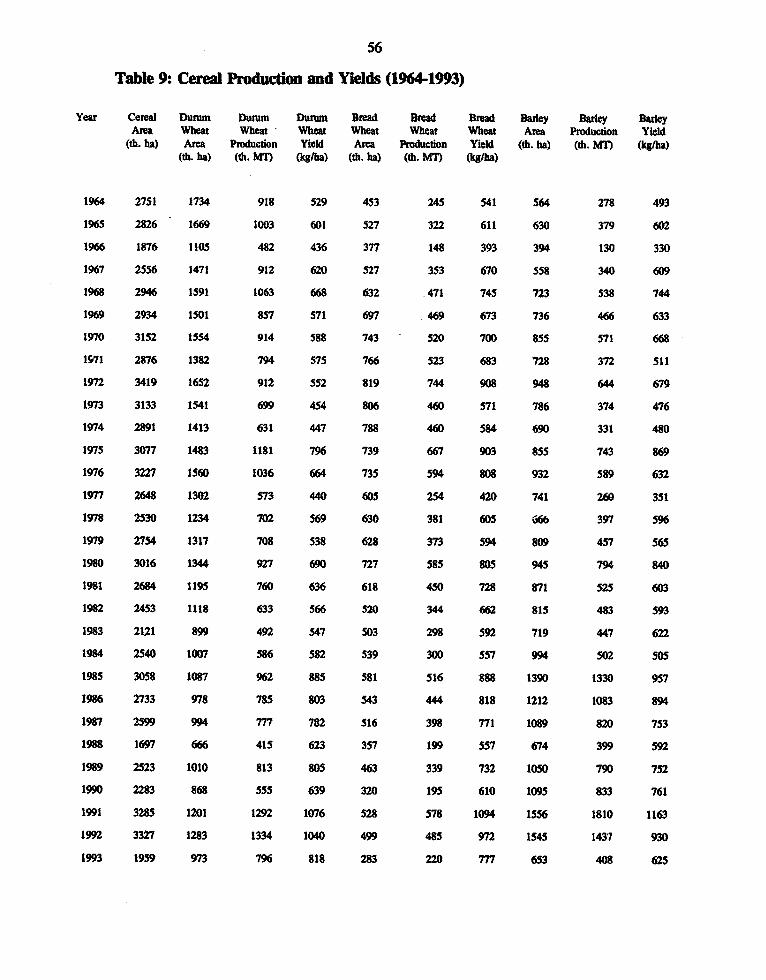
56
Table 9: Cereal Production and Yields (1964-1993)
Year Cereal Dumim Dumm Durum Bread Bread Bread Baley Badey BadeyArea Wheat Wheat Wheat Wheat Wheat Wheat Aea Pwduction Yield
(th. ha) Area Production Yield Anea Producdon Yield (th. ha) (di. MIT) (kgta)(th. ha) (th. MNT) (kg/ha) (th. ha) (th. NIT) (Jg/ba)
1964 2751 1734 918 529 453 245 541 564 278 493
1965 2826 1669 1003 601 527 322 611 630 379 602
1966 1876 1105 482 436 377 148 393 394 130 330
1967 2556 1471 912 620 527 353 670 558 340 609
1968 2946 1591 1063 668 632 471 745 723 538 744
1969 2934 1501 857 571 697 469 673 736 466 633
1970 3152 1554 914 588 743 520 700 855 571 668
1571 2876 1382 794 575 766 523 683 728 372 511
1972 3419 1652 912 552 819 744 908 948 644 679
1973 3133 1541 699 454 806 460 571 786 374 476
1974 2891 1413 631 447 788 460 584 690 331 480
1975 3077 1483 1181 796 739 667 903 855 743 869
1976 3227 1560 1036 664 735 594 808 932 589 632
1977 2648 1302 573 440 605 254 420 741 260 351
1978 2530 1234 702 569 630 381 605 666 397 596
1979 2754 1317 708 538 628 373 594 809 457 565
1980 3016 1344 927 690 727 585 805 945 794 840
1981 2684 1195 760 636 618 450 728 871 525 603
1982 2453 1118 633 566 520 344 662 815 483 593
1983 2121 899 492 547 503 298 592 719 447 622
1984 2S40 1007 586 582 539 300 557 994 S02 505
1985 3058 1087 962 885 581 516 888 1390 1330 957
1986 2733 978 785 803 543 444 818 1212 1083 894
1987 2599 994 777 782 516 398 771 1089 820 753
1988 1697 666 415 623 357 199 557 674 399 592
1989 2523 1010 813 805 463 339 732 1050 790 752
1990 2283 868 555 639 320 195 610 1095 833 761
1991 3285 1201 1292 1076 528 578 1094 1556 1810 1163
1992 3327 1283 1334 1040 499 485 972 1545 1437 930
1993 1959 973 796 818 283 220 777 653 408 625
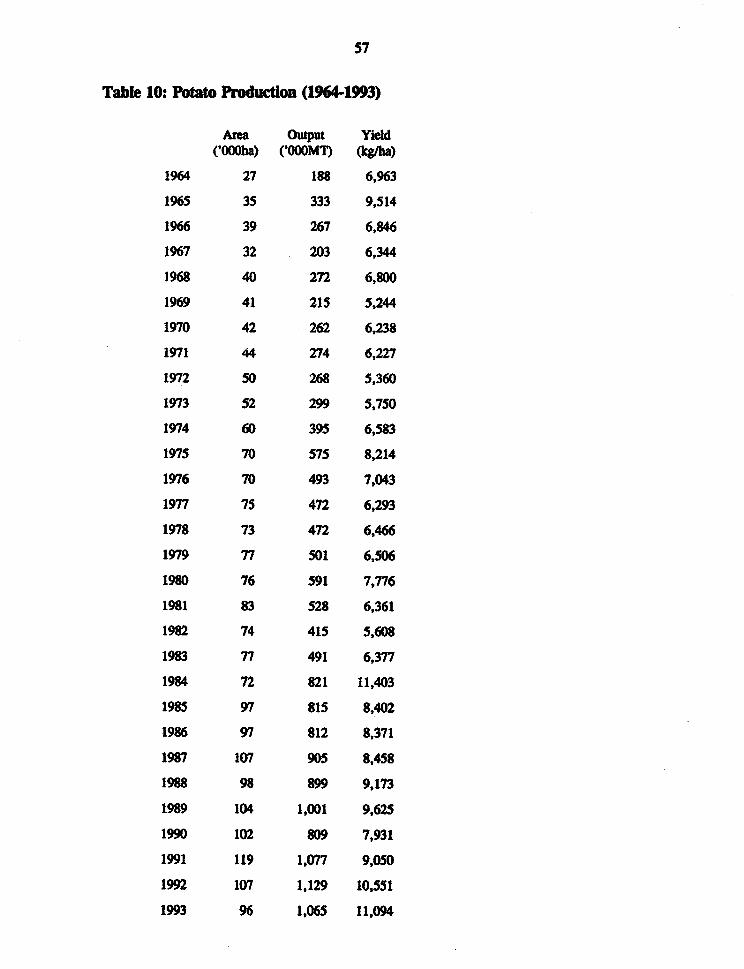
57
Table 10: Potato Production (1964-1993)
Area Output Yield('OOOha) ('OOOMI) (kgAba)
1964 27 188 6,963
1965 35 333 9,514
1966 39 267 6,846
1967 32 203 6,344
1968 40 272 6,800
1969 41 215 5,244
1970 42 262 6,238
1971 44 274 6,227
1972 50 268 5,360
1973 52 299 5,750
1974 60 395 6,583
1975 70 575 8,214
1976 70 493 7,043
1977 75 472 6,293
1978 73 472 6,466
1979 77 501 6,506
1980 76 591 7,776
1981 83 528 6,361
1982 74 415 5,608
1983 77 491 6,377
1984 72 821 11,403
1985 97 815 8,402
1986 97 812 8,371
1987 107 905 8,458
1988 98 899 9,173
1989 104 1,001 9,625
1990 102 809 7,931
1991 119 1,077 9,050
1992 107 1,129 10,551
1993 96 1,065 11,094
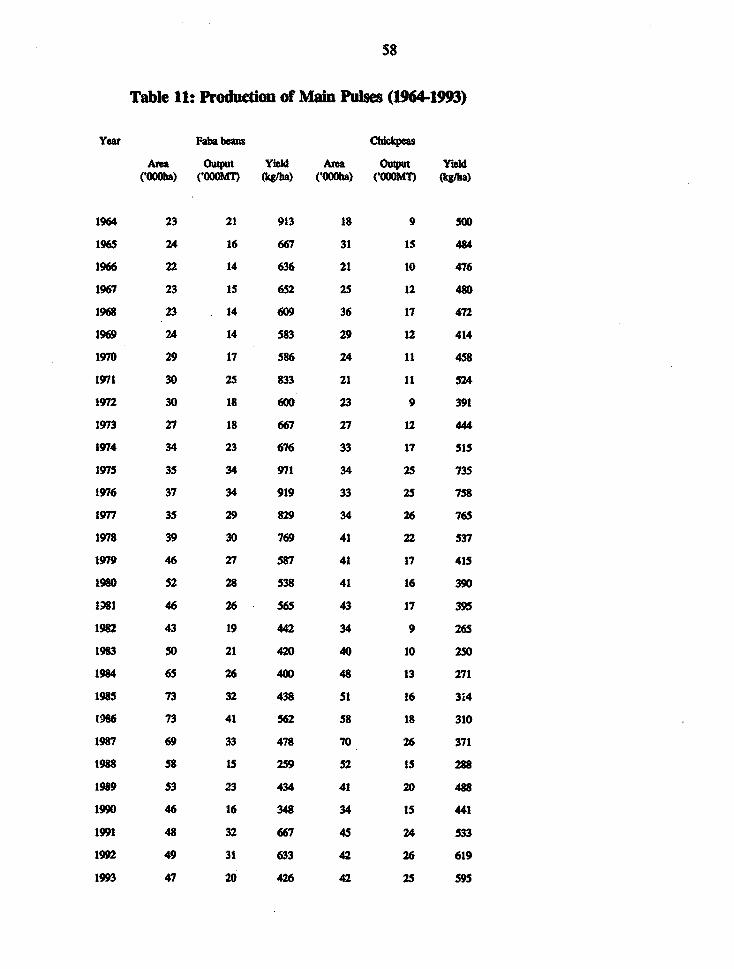
58
Table 11: Production of Main Pulses (1964-1993)
Yea Faba bea Ch bkpes
Area output Yield Anea output Yidd(O00ba) ('MT) (kb) COOha) (OOOMT) (kgh)
1964 23 21 913 18 9 500
1965 24 16 667 31 15 484
1966 22 14 636 21 10 476
1967 23 IS 652 25 12 480
1968 23 14 609 36 17 472
1969 24 14 583 29 12 414
1970 29 17 586 24 11 458
1971 30 25 833 21 11 524
1972 30 18 600 23 9 391
1973 27 18 667 27 12 444
1974 34 23 676 33 17 515
1975 35 34 971 34 25 735
1976 37 34 919 33 25 758
1977 35 29 829 34 26 765
1978 39 30 769 41 22 537
1979 46 27 587 41 17 415
1980 52 28 538 41 16 390
1981 46 26 565 43 17 395
1982 43 19 442 34 9 265
1983 50 21 420 40 10 250
1984 65 26 400 48 13 271
1985 73 32 438 51 16 314
1986 73 41 562 58 18 310
1987 69 33 478 70 26 371
1988 58 1S 259 52 15 288
1989 53 23 434 41 20 4S8
1990 46 16 348 34 15 441
1991 48 32 667 45 24 533
1992 49 31 633 42 26 619
1993 47 20 426 42 25 595

59
Table 12: Algeria - Cereal Trends, 1964-1992: Regressions
Dependent CoefficienteVariables' Adjusted
Constant Dl t Dlt R-square
CERA 2822 a -4.1 -0.03
CERA 2853 a -13992 a -6.1 537.3 a 0.43
CERQ 1489 a 25.4 c 0.09
CERQ 1572 a -14155 a 17.1 551.6 a 0.35
CERY 522 a 9.7 a 0.30
CERY 539 a -1243 7.9 b 49.9 0.30
BAA 525 a 25.6 a 0.49
BAA 557 a -7161 a 22.8 a 277.4 a 0.78
BAQ 219 b 28.3 a 0.44
BAQ 269 a -6571 a 23.2 a 257.8 a 0.61
BAY 503 a 11.1 a 0.28
BAY 519 a -643 9.3 b 26.9 0.25
DWA 1618 a -23.6 a 0.51
DWA 1657 a -5290 a -27.6 a 207.4 a 0.70
DWQ 838 a -1.7 -0.03
DWQ 894 a -5683 a -7.8 225.1 a 0.32
DWY 493 a 10.4 a 0.35
DWY 516 a -1610 c 7.8 b 68.8 c 0.40
BWA 679a -6.1b 0.11
BWA 640 a -1541 -1.2 52.6 0.26
BWQ 433 a -1.3 -0.03
BWQ 410 a -1900 1.8 68.7 0.05
BWY 605 a 6.1 b 0.10
BWY 609 a -1664 5.9 63.9 0.11

60
Notation (the same notation applies to the next two tables as well):
Variables:
CER: Cereals; BA: Barley; DW: Dunum Wheat; BW: Bread Wheat; followed by A: Area inthousand ha; Q: Production in thousand MT; Y: Yields in kg/ha (e.g., BAY: Barley yields)
DI: Dummy variable; DI = 1 for 1987 - 1992, DI = 0 otherwise.
t: trend variable for 1964 - 1992; t = 0 in 1964.
Dlt: DI x t; variable for slope (trend) shift after 1987.
2 Sitatistical significance of the regression coefficients (based on two tail t-test):
a: significantly different from 0 with p < 0.01;b: significantly different from 0 with p < 0.05;c: significantly different from 0 with p < 0.10;no notation implies that the null hypothesis of the coefficient being not significantlydifferent from 0 can not be rejected.

61
Table 13: Algeria - Trends for the Production of Pulses, 1964-1992: Regressons
Coeficients Adj.Dep. Rve. Constant DI t Dlt Square
FBA 18.9 a 1.7 a 0.73
FBA 15.1 a 174.7 a 2.1 a -7.5 a 0.85
FBQ 17.8 a 0.4 b 0.19
FBQ 15.1 a 18.7 0.8 a -1.2 0.32
FBY 780.4 a -12.7 a 0.33
FBY 771.9 a -1353.3 -11.4 b 52.1 0.32
CPA 21.5 a 1.1 a 0.58
CPA 20.0 a 198.4 a 1.3 a- -8.1 a 0.74
CPQ 12.4 a 0.3 b 0.13
CPQ 12.6 a 12.2 0.2 -0.8 0.08
CPY 527.3 a -5.5 b 0.08
CPY 551.6 a -1207.0 -8.4 b 51.6 0.09
Notes: Please refer to Table 12; FB: Faba beans; CP: Chickpeas
Table 14: Algeia - Trends In Pbtato Production, 1964-1992: Regreons
Coefficients Adj.Dep. RVar. Confltant DI t Dlt Square
POTA 27.8 a 3.1 a 0.94
POTA 28.8 a 7.2 2.9 a -0.2 0.94
POTQ 127.5 a 29.0 a 0.85
POTQ 156.4 a 809.2 25.1 a -27.4 0.87
POTY 6176.7 a 81.5 a 0.18
POTY 6360.0 a 8197.2 57.0 -294.6 0.16
Notes: Please refer to Table 12; POT: pottoes

62
Table 15: Size of the Herd (million heads)
Year Bovine Ovine Caprine Equine Cameline
1980 1.355 13.370 2.723 0.175 0.1491981 1.376 13.739 2.749 0.172 0.1521982 1.501 15.499 2.857 0.160 0.1561983 1.642 17.702 2.962 0.160 0.1481984 1.404 15.664 2.809 0.092 0.1241985 1.416 15.660 2.688 0.091 0.1331986 1.347 13.766 2.514 0.080 0.1211987 1.416 16.148 2.568 0.084 0.1341988 1.435 16.429 2.232 0.085 0.1141989 1.405 17.316 2.404 0.086 0.1221990 1.393 17.698 2.472 0.081 0.1221991 1.300 17.928 2.652 0.135 0.1351992 1.350 18.018 2.774 0.145 0.145
Source: Ministry of Agriculure
Table 16: Meat Production and Import (Thousand Tons)
YEAR PRODUCTION IMPORTS Self SufficiencyRatio (percent)
Red Meat White Meat (Red Meat) (Red Meat)
1981 142 111 22 (ov.4) 86.61982 146 118 27 (ov.1o) 84.41983 172 137 34 (ov.l5) 83.51984 158 144 31 (ov.14) 83.61985 166 162 29 (ov.13) 85.11986 169 210 28 (ov.14) 85.81987 200 225 4 (ov. 1) 98.01988 221 225 13 (ov. o) 94.51989 235 231 1 (ov. O) 100.01990 244 211 18 (ov. 6) 93.21991 260 223 23 (ov.NA) 91.91992 290 189 19 (ov. 1) 94.0
Source: Mmistry of Agriculture NA: Not Available
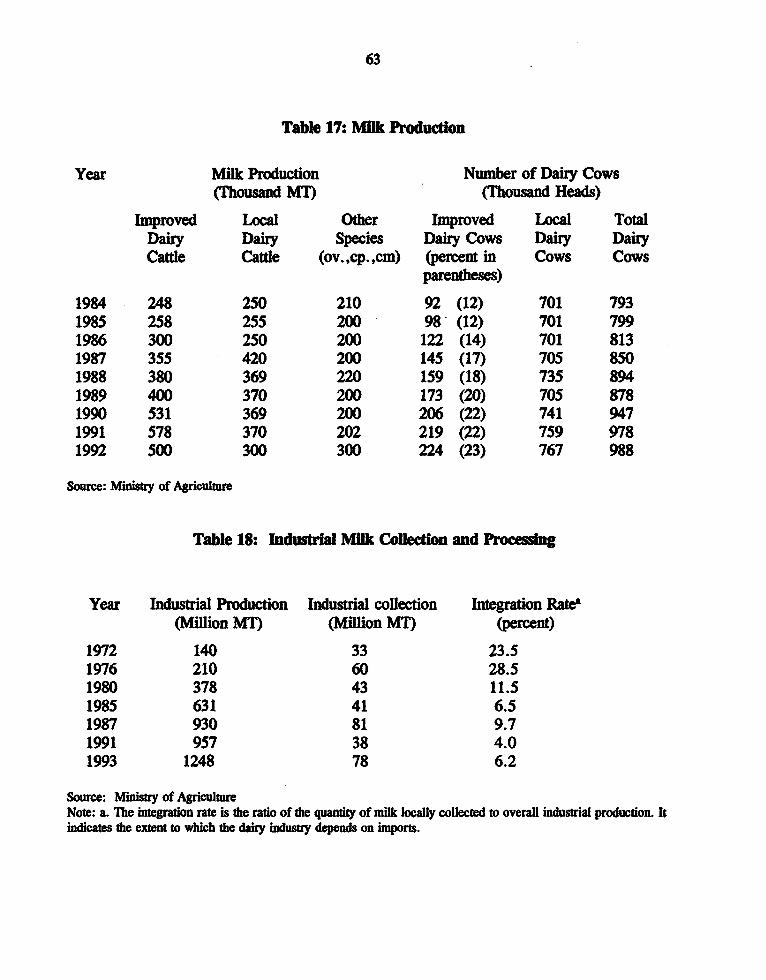
63
Table 17: Milk Producdon
Year Milk Production Number of Dairy Cows(Thousand MT) (Thousand Heads)
Improved Local Other Improved ILal TotalDairy Dairy Species Dairy Cows Dairy DairyCatde Cattle (ov.,cp.,cm) (percn in Cows Cows
parentheses)
1984 248 250 210 92 (12) 701 7931985 258 255 200 98 (12) 701 7991986 300 250 200 122 (14) 701 8131987 355 420 200 145 (17) 705 8501988 380 369 220 159 (18) 735 8941989 400 370 200 173 (20) 705 8781990 531 369 200 206 (22) 741 9471991 578 370 202 219 (22) 759 9781992 500 300 300 224 (23) 767 988
Source: Ministry of Agrikul
Table 18: IndusrIal Mlik Collection and Processing
Year Industra Production Industri collection Integation Rate(Million Ml) (Miflion MI) (percent)
1972 140 33 23.51976 210 60 28.51980 378 43 11.51985 631 41 6.51987 930 81 9.71991 957 38 4.01993 1248 78 6.2
Source: Minisatry of AgriculureNote: a. The inegration rate is the ratio of the quandty of milk locally collected to overall indust production. Itindicates the exten to which the dairy industry depends on imports.

64
Table 19: Imnports of Milk and Dairy Products (thousand MT of Milk Equivalent)
Milk Powder for Ready-toa-Use National Self sufficiencyym enuari Prcessng Powdered Milk Production Rado (percent)
1984 575' 6341 708 371985 631 695 713 351986 784 615 750 351987 930 590 975 391988 859 698 949 381989 926 NA 970 NA1990 931 717 1100 401991 957 890 1150 381992 1250 NA 1229 NA1993 1000
Source: Ministry of Agriculture NA: Not Available(1) Estimate

65
Table 20: Algeia - List of Agriculhturl Products or luputs under Price or Margin Controls
19941199S 199211993
Products with Guaranteed Productio Prkes: Products with Guaranteed Productin Price:1. Cereats 1. Cereals2. Cereal seeds 2. Cereal seeds3. Oil grains 3. Oil grains4. Indus tomatoes 4. Industrial tomatesS. Sugar beets 5. Sugar beets6. Raw cow's milk 6. Raw cow's milk7. Potaoes 7. Potatoes8. Garlic 8. Garlic9. Dry onions 9. Dry onions10. Raw leaf tobacco 10. Raw leaf tobacco11. Seed potatoes 11. Seed potatoes12. Garlic seed 12. Garlic Seed13. Onion seed 13. Onion Seed14. Forage grain seeds 14. Forage grain seeds15. Pulses16. Pulse seeds
Products with price ceiigs by decre at all stages of Products with price ceili by decree at all stages ofproduction and disibution: production and distribution1. Durum wheat 1. Durum wheat2. Bread wheat 2. Bread wheat3. Cereal gramins and seeds 3. Pulse and cereal grains and seeds4. Electricity and natual gas 4. Petroleum products (except ubricants)5. Petroleum products (except lubricants, motor fuel,
marine fuel and asphalt)
Products with price ceiligs by order of the M hitry of Products witb price ceilings by order of the Minstry ofCommerce, at all stages of production and distribution: Economy, at all stages of productin and distributions1. Basic and improved bread 1. Other cereals and pulses2. Basic semolina 2. Basic and improved bread3. Bread flour 3. Basic semolina4. Pasteurized milk 4. Bread flour5. Powder whole milk 5. Pasteurized milk in plastic bags6. Basic baby milk and cereals 6. Powder whole milk7. Rail freight 7. Basic baby milk and cereals8. Port services 8. Rail freight
9. Port services

66
Produ wtlb fied mrsbis by order of the Miry of Products wih fized margins by order of the Minh ofComeces: Eonoy:1. PWses ad rce 1. Coffee2. Ceeas (other than durum and bread wheat) 2. Tea3. Cofis 3. Qualit semolina and flour4. Cooking oi 4. Ord0ay pasta and couscousS. Suar 5. Pasurized milk in all but pbstic bag conainers6. Tobacco and matches 6. Powder milk other than whole milk
7. No-basi baby milk and cereals8. Cooking oil9. Sugar10. Double concente of toma11. Active and dry yeat for bakeries12. Livest feed13. Ferlizers14. Metal packagig for food productsIS. Plastc sheets16.Tobacco products and matches17. Agriculaual equipmen and spare parts

67
Table 21: Algeria - Evolution of Guaranteed Agricultural Prices
Products Unit 1991 1992 1993
Dunum Wheat MT 5,400.00 10,250.00 10,250.00
Bread Wheat MT 3,700.00 9,100.00 9,100.00
Barley MT 2,300.00 4,700.00 4,700.00
Oats MT 2,600.00 5,100.00 5,100.00
Triticale MT 2,500.00 7,150.00 7,150.00
Maize MT 3,200.00 11,400.00 11,700.00
Lentils MT 9,900.00 25,250.00 25,250.00
Beans MT 9,900.00 29,700.00 29,700.00
Chickpeas MT 9,900.00 17,200.00 17,200.00
Faba Beans MT 4,000.00 12,900.00 12,900.00
Feverolles MT 3,500.00 11,600.00 11,600.00
Peas (dry) MT 4,500.00 13,400.00 13,400.00
Potatoes kg 3.25 6.50 6.50
Seed Potatoes kg 5.50 9.00 9.00
Garlic kg 15.00 34.70 34.70
Seed garlic kg 18.00 36.00 36.00
Onions kg 4.00 5.00 5.00
Industial Tomatoes kg 2.70 4.00 4.50
Raw Cow's Milk 1 7.00 10.00 12.00
Tobacco (blond) MT 67,000.00 121,000.00 121,000.00
Tobacco (brown) MT 45,000.00 91,000.00 91,000.00

68
Table 22: Algeria - Analysis of Guaranteed Agricukua Plroduction Prices for 1993
podc Unat Pi Prie Yld Cs o Mo rgn mari PereeDAIMf S$MTr MYRa Noduc I fa Mari
Dur Wbeat Mr 10,250 438 1.10 4,600 4,250 4675 70.
Dad Wheat Ml 9,100 389 1.20 53 3,750 4,500 70.0
Barley Mr 4,700 201 SO 4,970 630 94 15.48
Oabs MT S,100 218 0.90 4,4 860 774 20.8
Tritkale Ml 7,150 306 1.00 6,070 1,80 I1,80 17.7
Mahe MT 11700 500 2. 5,170 5,0 14,75 9932
Lntils& MT 25,250 1079 O.50 14,650 10,560 S,28M 71*
Deanm iMr 29,700 120 0.40 21,100 8,600 3,440 40.76
Chickpeas Ml 17,200 73S 0.70 9,860 7,340 5,138 74.44
Faba Dean MT 12,900 551 1.00 8,120 4,780 4,70 58.7
Fe'lbea MT 11,600 496 1.00 8,000 3,600 3,610 45.00
Peas (dry) PAT 13,400 573 0.80 7,710 560 4,552 73.80
potatoes MT 6,500 278 13.00 4,570 1,930 25,090 4.23
Seed Ptato MT 9,00D 385 9.00 4,570 4,430 39,870 96.94
Galik MT 34,700 1483 3.50 14,150 20,50 71,925 145.23
Seed arc Mr 36,000 1538 2.5 14,140 21,860 5,650 154.60
onions MT 5,s00 214 10.20 3,570 1,430 14,5 40.06
Indbtr MT 4,500 192 13.00 2,320 2,180 28,340 93.TuNat
Tobacco 0od) MT 121,000 5171 0.60 93,220 27,780 16,668 29.80
Tobaco (dar MT 91,000 3889 0.90 62,110 28,150 25,965 46.42
Telbb (frr smm) MT 71,40 3051 1.20 50,340 21,060 25,272 41.84
Note: The offial exchange rate used Is DA 23.4 = US$ 1.00.

69
Table 23: Algeria - Economic Analysis of Cereal Production
Durun, Bread wheat Barleyyields yields yields
avg. good avg. good avg. good
Ze ANi DRC 4.70 0.79 1.80 0.83
N2 DRC 5.89 0.86 2.47 0.90
N3 DRC 1.91 0.46 - . - -
Zone BNI DRC 4.70 0.41 5.33 0.56 0.76 0.27
N2 DRC 4.70 0.36 2.74 0.68 2.30 0.34
N3 DRC 2.12 0.39 7.65 0.79 - -
Zone CNi DRC - - 4.35 0.92 2.17 0.35
N2 DRC - - 60.99 1.80 - -
Zone DN2 DRC - - - - 2.59 na
N3 DRC - - - - 1.86 0.15
Zone MNi DRC 1.05 0.35 - - 1.64 0.82
N2 DRC 1.82 0.46 - - 2.36 0.98
Notes: DRC = Domestic resource cost. The Ni indicate the levels of higher technology with decreasing i. Thezones are defined as follows (with percent of cultivable area in paretheses):
A: coWal plais with high resource endownts and average annual rainfall above 600 mm (4)B- interior plains with average annual rainfal between 450-600 mm (20)C: interior plains with average annal raimlal between 350-450 mm (47)D: teppe zones with average anmial rainfall betwee 200-350 mm (14)M: mountinous zoe with average annual rainfall above 350 mm (4).

70
Table 24: Algeria - Sestivity of DRC to the Exchange Rate
DRUM BREAD WHEAT BARLEYDAIUS$ 3S 40 45 35 40 45 35 40 45ZONE ANI 4.0 4.11 3.66 1.80 1. 1.40N2 6.63 S.G0 4.58 247 2.16 1.92N3 1.91 1.67 1.49ZONE DNI 4.70 4.11 3.66 5.33 4.6 4.15 0.77 0.67 05N2 4.70 4.11 3.66 2.74 2.40 2.13 2.3D 2.01 1.79N3 2.13 1.86 1.65 7.65 6.69 5.95ZONE CNt 2.17 1.90 1.69N2 3S 3.81 3.o3 s wM
ZONE DN2 2.59 2 27 2.01N3 1.86 I.t 1.47ZONE MNI L.05 0.92 -82 L30 1.14 1.01N2 1.82 I.59 1.42
Now Ple se Table 23 for the dfnko of tdit aza dth Ni.
Table 25: Algeria - Economic Analysis of Bovine Livestock Systems
A B C D Eextensive seanlext. semi intensive gh te.
Pwrhasedfeeds: b b,s b,h b,s,f b,s,h,g
Traditional Bovine SystemsDRC Farm -0.11 0.03 0.24 0.63 1.52DRC Wholesale market 0.21 0.46 0.77 1.68 3.53
Improved Bovine SystemsDRC Farm 0.19 0.23 0.87 0.99 1.16DRC Wholesale Market 0.38 0.44 1.62 1.93 2.22
Notes code for feeds: b = barley/concentrate, s = straw, h = hay, g = grazing (meadows, fallow, pastures,natural forests)
Table 26: Algeria - Economic Analysis of Ovine Livestock Systems
System: 01 02 03 04
DRC Farm 0.46 0.72 2.94 5.46DRC at Slaughter 0.54 0.91 6.27 49.40
Note: The Oi indicate the various technical levels of production, with i increasing with the level of technology.

71
Table 27: Struture of Customs Duties by Product Category
Imort Category Number of Unweighted Coefficient Imxot IMpors PercentTariff Mean of Vaiation Weighted (in minions of Total
Positions Mean of DA) Iports
1990 Customs Duties'
Total Import 5502 25.0% 122.1% 8.1% 87018 100%
Agriulture 349 19.9% 134.7% 0.8% 7614 9%
Mining 114 15.3% 139.6% 8.2% 421 0.5%
Manufacturing 5039 25.6% 120.8% 8.8% 78982 91%
1991 Customs Duties3
Totd imports 5558 24.9% 122.4% 9.1% 139241 100%
Agriculture 349 19.8% 135.6% 1.6% 11170 8%
Mining 116 15.2% 140.1% 10.1% 648 0.5%
Manufacturng 5093 25.5% 121.0% 9.8% 127424 92%
992 Customs Duties'
Total Iports 6077 24.8% 79.0%
Agiculture 368 18.2% 86.8%
Minng 115 12.0% 136,%
Manufacmring 5588 25.5% 77.4%
Source: Direclon G vrale des Douanes, Office National de Statisdques.
1990, 1992 Droit de Douane book rates.
2 Official imports only.
3 1991 Dmoit de Doww rates from CNP.
4 Totad inpnts, ihuSding non.fficdal

72
Table 28: Productlon, Jmports and Agruturl EuNots
-Fenilizers- -Nitrogenous fertlizers- -Phosphats- -Pbtassium Value- -TrAtors- -Harvesters- -Sep.- -Pest.-Year Prod. Imp. Pmd. Inp. Exp. Prod. Inp. Imp. Exp. Utd. W. Utd. Inp. IMP. Imp.
IOQOM T lOOOMfT MT MfT MfT MfT MfT MT 10,000$ No. No. No. 1000$ 1000$ 10,000$
1961 1S 35 0 9000 0 ISQ0 10000 16000 0 0 0 0 0 0 3411971 55 150 39000 48000 2000 16400 76700 25000 466 40500 1329 3650 2665 97 3641981 46 148 23700 37353 3400 22700 53018 57424 2881 48000 9530 4590 23171 192 16601982 99 SO 50990 18454 2194 47960 13973 17962 2459 49200 6242 4720 21853 22 10481983 100 48 47000 9500 0 53000 18587 19882 1922 50279 7320 4857 8017 536 7221984 179 88 101788 18832 0 77503 21321 47877 1446 61319 7257 5693 6892 2941 8731985 177 115 105828 3507 4252 71147 61929 50020 2049 75310 1994 7012 11057 1051 31921986 166 164 112490 18790 12060 53800 88780 56650 2239 82808 2008 8208 20642 1421 36571987 172 121 117000 3600 17000 55100 60600 57200 2223 89271 2668 8628 10000 4369 56431988 176 30 105500 0 28000 70700 5100 25000 2024 94000 2020 9000 4721 4693 44351989 146 51 100300 80M0 24000 45300 17000 26000 3490 98000 1300 9400 5319 2659 1559
Source: PAO Agrostat

73
Table 29: Algeria - Wheat Imports under the Export Enhancement Program of the USA
Price CIF Bonus Export IntemationalAlgiers price market
Quanty (1) (2) (1 + 2) price(MIl) ---- ($US / MT) ----------
Durum wheat
1986 240,000 $112 $44.16 $156 $1481987 764,000 $112 $39.40 $151 $1671988 340,500 $133 $31.66 $165 $2021989 275,000, na $14.54 $1811990 902,420 na $27.10 $1511991 624,300 na $51.79 $1481992* 574,200 na $46.40 $176
Bread wbeat
1985 500,000 $106 $45.27 $151 $1731986 854,000 $88 $32.67 $121 $1611987 562,000 $79 $40.55 $120 $1341988 1,034,000 na $24.48 $1801989 825,000 $177 $15.08 $192 $2011990 930,880 na $36.15 $1561991 474,200 na $60.39 $1381992* 248,950 na $40.36 $158
Note: 1992 transactions are those until April 26, 1992. Bread wheat includes *hard red winter and western red spring."Durumn is 'US hard amber durunm. Intemational prices are CIF Rouerdm for dumm and FOB Thunder bay forbread wheat. The data are from USDA, FAS, Fax polling Service. na = not available.
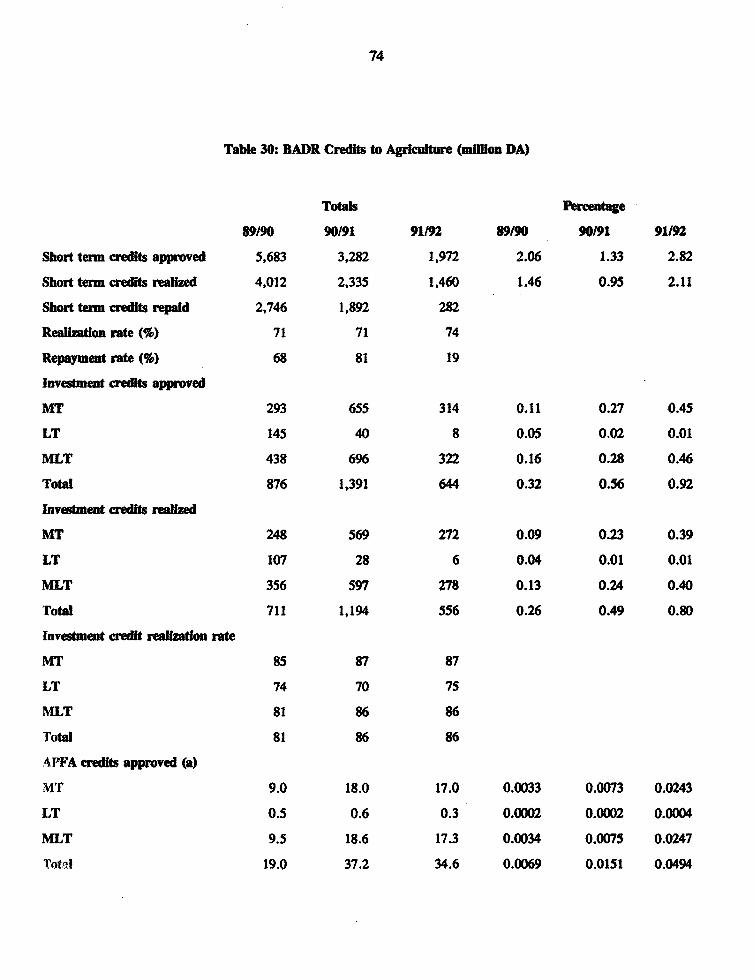
74
Table 30: BADR Credks to Agrculture (milon DA)
Totals PercentJge
89/90 90191 91192 89/90 90/91 91192
Short term credits approved 5,683 3,282 1,972 2.06 1.33 2.82
Short term credits realized 4,012 2,335 1,460 1.46 0.95 2.11
Short ter credits repaid 2,746 1,892 282
Reaizaion rate (%) 71 71 74
Repayment rate (%) 68 81 19
Investent cradts approved
MT 293 655 314 0.11 0.27 0.45
LT 145 40 8 0.05 0.02 0.01
MLT 438 696 322 0.16 0.28 0.46
Total 876 1,391 644 0.32 0.56 0.92
investment credt reaized
MT 248 569 272 0.09 0.23 0.39
LT 107 28 6 0.04 0.01 0.01
ALT 356 597 278 0.13 0.24 0.40
Total 711 1,194 556 0.26 0.49 0.80
Investment credit reaWizton rate
MfT 85 87 87
LT 74 70 75
MLT 81 86 86
Total 81 86 86
APFA credits approved (a)
MT 9.0 18.0 17.0 0.0033 0.0073 0.0243
LT 0.5 0.6 0.3 0.0002 0.0002 0.0004
MLT 9.5 18.6 17.3 0.0034 0.0075 0.0247
Total 19.0 37.2 34.6 0.0069 0.0151 0.0494

75
AFFA credits realzed
MT 7.0 15.0 5.0 0.0026 0.0061 0.0072
LT 0.3 0.6 0.0 0.0001 0.0002 0.0000
MLT 7.3 15.6 5.0 0.0027 0.0063 0.0072
Total 14.6 31.2 10.0 0.0053 0.0127 0.0144
APFA credit realization rate
MT 78 83 29
LT 60 100 0
MLT 77 84 29
Total 77 84 29
Fiancing of POilt Farms
Farm credis 260,479 238,544 67,328 94.36 96.59 96.21
Investment credits 8,978 3,700 3.25 1.50 0.00
Tottd 269,456 242,244 67,328 97.62 98.09 96.21
Total Credits Approved 276,034 246,954 69,979
Totad Credis RealIed 274,194 245,804 69,354
Reaization rate 99 100 99
Note: (a) APFA: Accasion a la propriti. fondre agricole par la rise en vaker daws la Sud
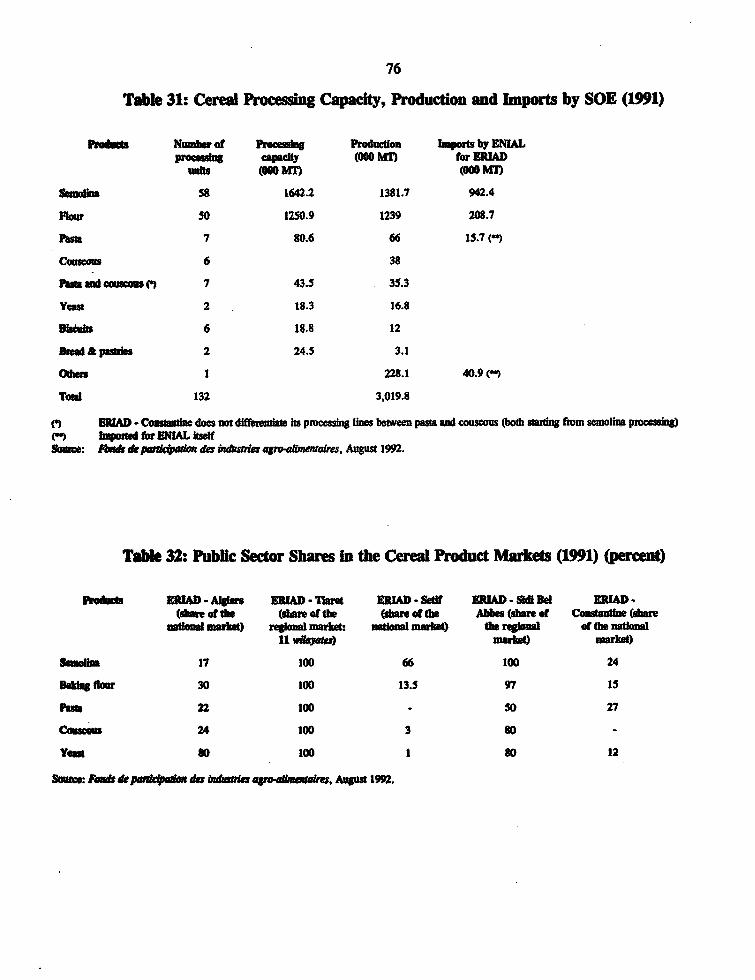
76
Tabe 31: Cerea Processig Capacity, Production and Imports by SOE (11)
ftoP s Number of rosig Producto Impors bsk ENIALproceun capact (000 MIT) for ERIAD
uns "GM) (00 MM
SBadi. S8 1642.2 1381.7 942.4
FPu SO 1250.9 1239 208.7
Pat 7 80.6 66 15.7 (
Cosous 6 38
sa san couceas n 7 43.5 35.3
Yew 2 18.3 16.8
obdui 6 18.8 12
_rmlAp h 'i.I 2 24.5 3.1
Odws 1 228.1 40.9 (
TOMal 132 3,019.8
tIIAD - Consmanne does not dffumuas pocesig lnes bte pasta and ouscous (both saing fim smoi proceing)(*) hayosted for bNIAL itselfSone: A* drpatien des Lettn'a agro-elin , August 1992.
Table 32: Public Setor Shares in the Ceread Product Markes ( ) (prcent)
products W .D - fglers ERW D - Tret EMAD - Sof t AD B-R Del DUAD,(dre of te (are of the (slate f tbe Abbes (sle of Cantlee (shr
nainlmak) rgia market:' ntonal arket) the regin of the nafUna11 iate) mark market)
Besn 17 100 66 100 24
Bdklagflout 30 100 13.5 97 15
Pasta 22 100 50 27
Couscosas 24 100 3 89
Yeast 80 100 1 80 12
Satsce: RAmds depwvd4&*R da huhwudas aM-l Or. Anust 1992.

77
Table 33: Processing of Dairy Products (1991)
Products Processing Capaty Producdon Capacit Udulo(pren)
Pasteuized milk ('000 1) 1,579,204 892,687 56
Fermented milk ('000 I) 132,492 67,495 51
URT milk ('000 1) 38,900 2,576 7
Yoghurt ('000 1) 65,836 30,771 47
Cheese ('0001) 98,876 40,522 41
ce cnrmu ('000 1) 2,415 761 31
Other fresh dairy products ('0001) 10,800 9,976 92
Melted cheese (MI) 5,725 5,971 104
hIfant milk powder (Ml') 406 33 8
Butte (MT) 9,428 2,971 31
Souce: Fonds de paridpation des industies agrobamemaires, August 1992
Table 34: Comparison of Labor and Equipment Utilization in Cereal Production In te Magheb
Machinery AnimalLabor Serices Traction
(person days/ha) (hoursha) (daysha)MOROCCO (1)Tradiional 15.97 1.20 3.33Semi-Mechanized 16.61 3.79 2.68Medhaized 8.50 7.06 1.11Irnigated 13.00 16.17 0.00
AWLERIU (2)N 3 2.06 7.55 0.00N 2 4.68 8.97 0.00N 1 2.00 12.10 0.00Irrigad 15.20 0.00 0.00
TUY'IAE9 (3)Large 8.00 18.80 0.00Medium 7.50 15.00 0.00
1. Soue: F&:ha tedaqwa de I'Ad. 'LapolW desapi Edltckads dam k agesko Aw,ac SDaab JAmr Irn2. Souse: Aua Pofibiliy. Pm#edon and Compamie Advante, Tuns lne 1987, MD_h de v*uhw. DiwUmt
de P_a4% &amqm a Analy ctse Ecmnow, p. 39. MJtym des khad* pow OME dmr e Bli t.,dt.3. Some: Moyet des db*h.tui poar lOrge Ut dur et D taidre.
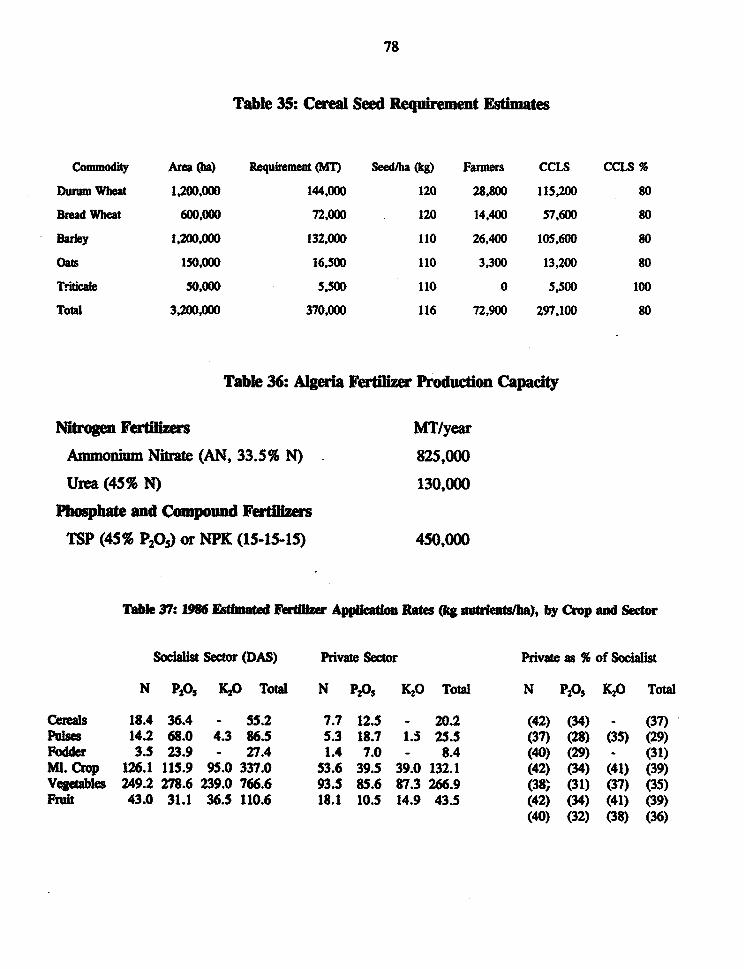
78
Table 35: Cereal Seed Requirement Estimates
Commodity Area (ha) Requirement(MT) Seed/ha (kg) Famers CCLS CCLS %
Durum Wheat 1,200,000 144,000 120 28,800 115,200 80
Brad Wheat 600,000 72,000 120 14,400 57,600 80
Buley 1,200,000 132,000 110 26,400 105,600 80
Oats 150,000 16,500 110 3,300 13,200 80
Tricale 50,000 5,500 110 0 5,500 100
Total 3,200,000 370,000 116 72,900 297,100 80
Table 36: Algeria Fertilizer Production Capacity
Nitrogen Fertilzers MT/year
Ammonium Nitrate (AN, 33.5% N) 825,000
Urea (45% N) 130,000
Phosphate and Compound Fertilizer
TSP (45% P205) or NPK (15-15-15) 450,000
Tabl 37: 1986 F_iinated Fertier Appicaion Rats (kg nmtrleu/ba), by Crop aod Setor
Socaist Sector (DAS) Privat Sector Private as % of Socialist
N P205 K20 Total N P205 K20 Totad N P205 K2O Total
Cereals 18.4 36.4 - 55.2 7.7 12.5 - 20.2 (42) (34) - (37)Puses 14.2 68.0 4.3 86.5 5.3 18.7 1.3 25.5 (37) (28) (35) (29)Fodder 3.5 23.9 - 27.4 1.4 7.0 - 8.4 (40) (29) - (31)M. Crop 126.1 115.9 95.0 337.0 53.6 39.5 39.0 132.1 (42) (34) (41) (39)Vegetables 249.2 278.6 239.0 766.6 93.5 85.6 87.3 266.9 (38, (31) (37) (35)Fiuit 43.0 31.1 36.5 110.6 18.1 10.5 14.9 43.5 (42) (34) (41) (39)
(40) (32) (38) (36)
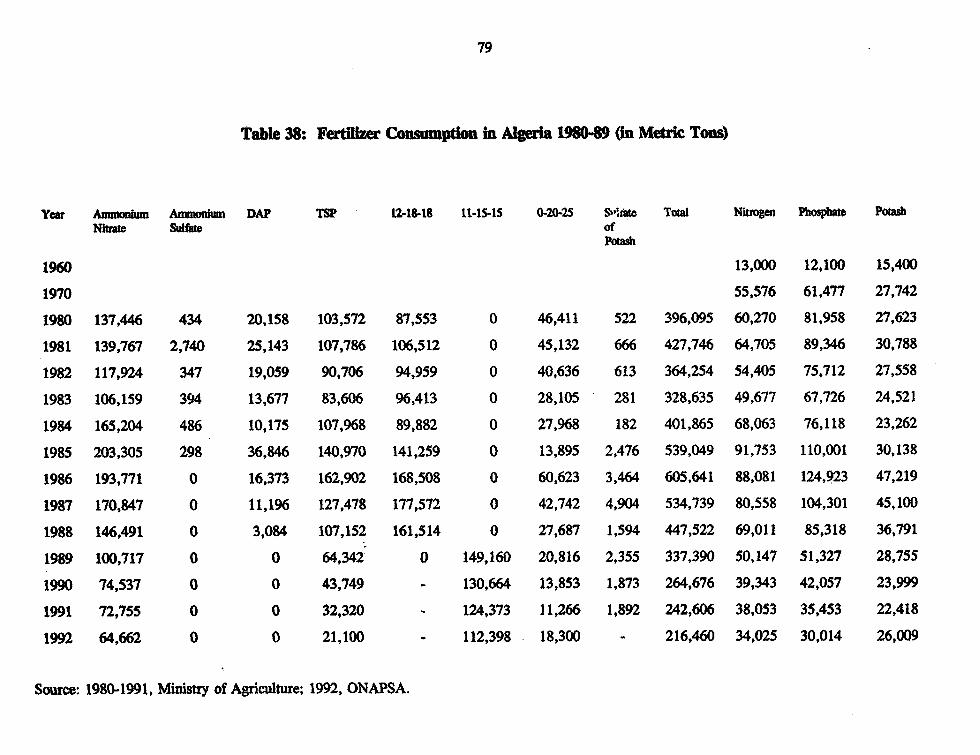
79
Table 38: Fertilzer Consumption in Algeia 198089 (in Metric Tons)
Year Amnmaon Ammonium DAP TSP l2-148- 11-15IS 0-20-25 S"liate Tot Nitrogen Phospbate PotasbNiae Slfte of
Potash
1960 13,000 12,100 15,400
1970 55,576 61,477 27,742
1980 137,446 434 20,158 103,572 87,553 0 46,411 522 396,095 60,270 81,958 27,623
1981 139,767 2,740 25,143 107,786 106,512 0 45,132 666 427,746 64,705 89,346 30,788
1982 117,924 347 19,059 90,706 94,959 0 40,636 613 364,254 54,405 75,712 27,558
1983 106,159 394 13,677 83,606 96,413 0 28,105 281 328,635 49,677 67,726 24,521
1984 165,204 486 10,175 107,968 89,882 0 27,968 182 401,865 68,063 76,118 23,262
1985 203,305 298 36,846 140,970 141,259 0 13,895 2,476 539,049 91,753 110,001 30,138
1986 193,771 0 16,373 162,902 168,508 0 60,623 3,464 605,641 88,081 124,923 47,219
1987 170,847 0 11,196 127,478 177,572 0 42,742 4,904 534,739 80,558 104,301 45,100
1988 146,491 0 3,084 107,152 161,514 0 27,687 1,594 447,522 69,011 85,318 36,791
1989 100,717 0 0 64,342 0 149,160 20,816 2,355 337,390 50,147 51,327 28,755
1990 74,537 0 0 43,749 - 130,664 13,853 1,873 264,676 39,343 42,057 23,999
1991 72,755 0 0 32,320 - 124,373 11,266 1,892 242,606 38,053 35,453 22,418
1992 64,662 0 0 21,100 - 112,398 18,300 - 216,460 34,025 30,014 26,009
Source: 1980-1991, Ministry of Agriculture; 1992, ONAPSA.

80
Table 39: Principal Crop aod Fatlier Prices and Price Ratios
1980 1981 1982 1983 1984 1985 3986 1967 £968 19t9 1990 199t 1992 1993
Ferilizer (DA/MT)
AN 33.5% 349 349 349 349 482 W6 770 40 924 924 1109 4450 2710 2700
TSP 461 462 462 462 462 590 839 10 120 1232 1232 1472 570 393D 3900
NPK 552 55252 552 690 1006 1120 1240 1364 1364 1637 SW0 3900 3900
Crops (DA/Ml)
Drwum Wheat 1250 1250 1400 UGO 1aw 2000 22110 2600 270 40t0 5000 54010 10250 10250
Brad Wheg 115G' 1150 13 00 1 500 19G0 21C0 2200 2200 3G00 3300 37G0 9100 9100
Barley 600 600 60D tOO 130 1400 150 1700 170 2300 2300 2300 4700 4700
Oats 7A0 700 700 1tO0 IOEO 13G0 1430 360 16E0 22 2600 2600 5100 510O
Pomaes 1100 130 1w0 1900 390 2S 260 2SO 30 3w0 3250 3250 650 6500
CrtylBtirzer ptice uta (kg aqrpk uUlm)
Drmu WbaVAN 1.2 1.2 13 1.3 1.1 Q9 1.0 1.1 3.0 I.5 15 0.4 1.3 1.3
Dread WIhat/AN 1.1 1.1 12 1.2 1.0 0.9 0.9 0.9 Q 1.1 1.0 0.3 1.1 1.1
BaleyAN 0.8 0.8 0.8 0.6 0 07 0.7 07 0.6 0 0.7 02 0.6 0.6
OatsAN 0.7 0.7 0.7 0.7 0.6 6 .6 0.6 0 S 0.2 0.6 0.6
Poato/AN 1.1 1.2 1.5 1.8 13 1.2 1.1 1.1 1i 1.1 1.0 0.2 0.8 0.S
DM=U whearTP 12 1.2 1. t.A 12 1.1 . t.1 1.0 1.5 1.6 0.4 1.2 1.2
Bred WheATP 1.1 1.1 13 1.3 1.2 1. 1.0 0.9 0.8 1.1 1.0 0.3 1.1 1.1
BarleyTP 0. 0.8 0.8 0.Q 0 8 0.7 07 0.6 0.9 0.7 0.2 0.6 0.6
OasTSP 0.7 0.7 07 1.0 0. 0.7 07 0.7 0.6 0. 0. 0.2 0.6 0.6
PoatoeTSP 1.1 1.3 1.6 1.9 1.5 1.4 2 1.2 .2 1.1 1.0 0.3 0.8 0.6

81
Table 40: Algeria - Ferdlizer Subsidies (1992)
Per M T Per MrT Total Total TotalNitrogen Phophate Nitrogen3 Pbosphate
19*2 CosumwptIon OmS1) 34,025 21,100
Nutrient PrIces per bMTl
US$ fob or cff price 246.59 302.46
Domestic equivalent of US$ cif or fob price
a. At market exchange rate (DA 351US$) 9,228 11,021
b. At o al mchae rate (DA 22WUS$) 6,022 7,089
c. Domestic cost of productone 13,433 12,826
d. Retail price 8,060 8,478
e. Impicit subsidy to farmers (a-b) 3,206 3,932 109 83 192
f. Explcit subsidy (tax) to tanners (bf) (2,038) (1,389) (69) (29) (99)
g. Net eonomic abidy to farmers (e+f=a-d) 1,168 2,543 40 54 93
h. ImpBlt eomic subudylprotection to dustry (b) 7,411 5,737 252 121 373
i. Total explict f hc fertilier wbsldy (c-d) 5,373 4,348 183 92 275
(1) based on AN and TSP prices plus DA 200 fixed distnbution cost for comparability with domestic prices
(2) includes cost of production and profit and distribution (DA 200/MT) margins
(3) total monetary figures are in million DA

82
Table 41: Fertilizer Price Formation (1993)
Fertilizer Prices (DAIMT) AN TSP NPK
CIF/FOB (for comparison) @ 23 DA/$ 1,900 3,200 n.a.
Ex-Factory ASMIDAL 4,300 5,700 6,400
less: Industry subsidy (implicit) 1,800 2,000 2,700
plus: Distribution margin 200 200 200
= Retail price 2,700 3,900 3,900
Implicit subsidy (tax) on farmer (600) (500) n.a.
Source: ASMIDAL, April 1993 and British Sulphur Corporation trade jourmals forinternational prices.
Table 42: Pesdcide Use in Algeria
SOYkh (tOso) 4iquids MM0O0b TOWal
Fingide HOb Iu _ Vari FuVng&ile Herblde leicdde Various Soids liqd
1980 15,534 181 8,498 640 164 449 914 110 24,853 1.637
1981 15,826 53 5,826 2,439 48 350 346 771 24,144 1,515
1982 17.024 1,348 4,797 1,227 243 328 709 392 24.396 1.672
1983 12,079 76 5,692 581 58 285 444 611 18,428 1398
1984 10,268 522 4,486 312 75 479 702 430 15.588 1,684
1985 9,103 1,m 3,777 231 263 648 1,877 412 14,388 3,200
1986 9,105 185 4,807 841 101 694 967 447 14,938 2,209
1987 8,023 128 4,605 474 33 895 696 107 13,230 1.731
1988 7,564 103 2,795 480 37 400 681 553 10,942 1,671
1989 5,524 210 6,207 979 26 280 884 115 12,920 1.305
1990 S,99 117 3,313 284 17 173 209 178 9.013 57
1991 6,126 81 3,832 393 39 280 1,754 168 10,432 2,241
Soure: M hsiy of Agrculu

83
Table 43: Agrcultul Machinery Park (1991/92)
Equipment Number Percort Percent
Tractors 93,000 100.0
- Wheel traos (2WD) 83,000 100.0 87.4
- Total Deutz licensed 72,200 87.0 76.0
- PMA 59,300 71.4 62.4
- KHD 7,200 8.7 7.6
- Torpedo 6,000 7.2 6.3
- Other 10,500 12.7 11.1
- IMT 6,800 8.2 7.2
- Fortscbritt 2,000 2.4 2.1
-Goldoni 1,700 2.0 1.8
- Track tractors 12,000 100.0 12.6
- Fiat 6,900 57.5 7.3
- UTB 5,100 42.5 5.4
Combine harvesters 9,000 100.0
- Total Claas licensed 8,040 89.3
- PMA 7080 78.7
-Class 950 10.6
-Other 970 10.8
Pick-up balers 26,000 100.0
- Total Cass licensed 25,000 96.2
- PMA 22,360 86.0
-Clas 2,650 10.2
- Other 990 3.8
Table 44: Age Diribution of Agrknuta Equipment
> 12 years 9-12 yea 5-8 years <S yeas
Tractors 36 13 35 16
Combine harvesters 47 10 24 19
Equipmuen for fodder 35 5 41 19
Soil prqearation equipmint 26 12 38 23
Pant protection equipnt 23 1 28 47

84
Table 45: Types and Numbers of Regisered Cooperatives
TYPE NJMER MEMBERS
Input SupplyCCLS 39 200 000
CASAP 192 190 000
COOPSTEPPE 33 164 000
Coop6rative de Semence 4 3345
CASSEDEP (geehuse production) 11 6 010
Coiawive Regionate Agricole deProduction de Plants Fhitiers et de Sernces 3
Cooperative Agncole de &ervices Spias en CulturIndarielles 9
Procesln
COOPOLIVE 8
Cooperatve Vlicole (COOPEViT 8 10000
CAPCS (tomato procesIng) 2
Plant Protection
CoopErative Specialisee en Protecionde Vegta (CASPV) 3
Animal Proteon
Coopraie de Sernces d'Elewge (COOPSEL) 44 58 000
COOPAVI 124 30 000
COOPAPI 18 30 000
COOP Agro-Pastorale 7
COOPPAB (feed mlling) 5
COOP POLYVAL (family groupings) 182 1400
Agicultu Equipment
Cooperative de Disribwion de Mat rie kole (CODIMA) 13
COOP Maintenance 6
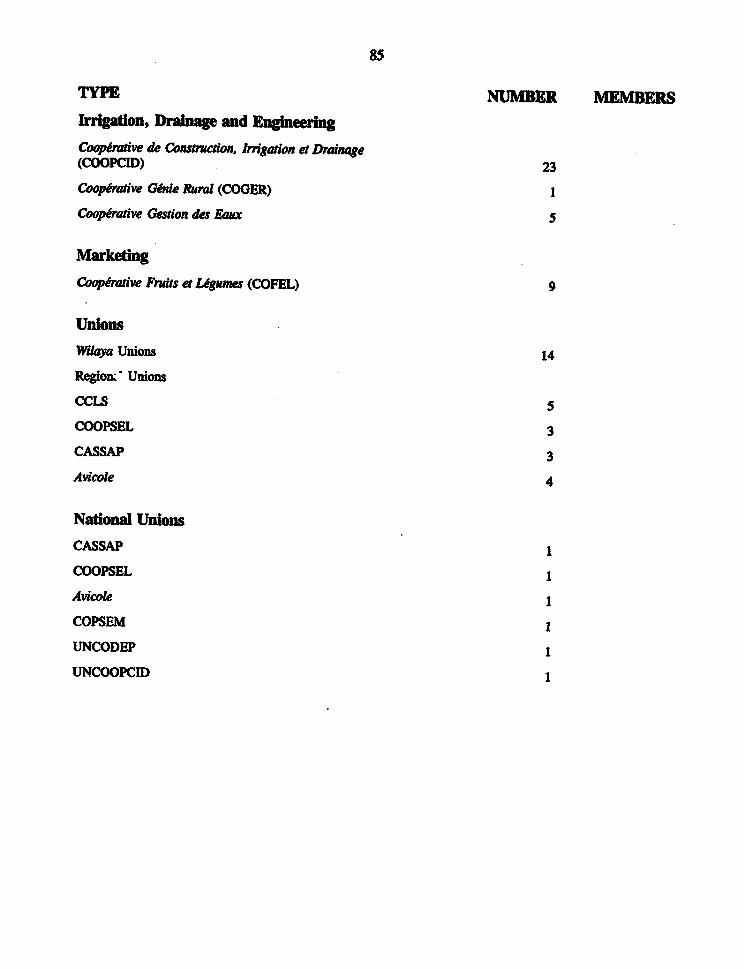
85
TYPE NUMBER MMBERS
hTigation, Drainage and Eneerng
Cooperative de Constocaon, Irrngaon et Draiage(COOPCID) 23
Coopraive G*nde Rural (COGER) 1
Cooprative Gestion des Eaux 5
Maketng
CoopErative Fruits et Ugumes (COFEL) 9
Unions
Wilaya Unions 14
Regions Unions
cCLS 5
COOPSEL 3
CASS"P 3Avicok 4
National UnionsCASS" I
COOPSEL I
Avicole ICOPSEM 1
UNCODEP 1
UNCOOPCID 1

86
Table 46: Central Organization of the Mistry of Agriculture
Journal Officiel de la R6publique Algfrienne, No. 93, 30 D6cembre 1992.
DMcret ex6cutif no. 92493 du 28 d6cembre 1992 portant organisaton de l'adniidrationcentrale du ministere de I'agriculture
Le MinisteLe Cabinet du Ministre
Directeur de CabinetDeux Directeurs d'Etudes
Chef de CabinetHuit Charg6s d'Etudes et de SynthseSept Attach6s de Cabinet
Les Directions
La Direction des P6rimttres d'Irrigationla Sous-direcion du D6veloppement des P6rim&tres Irrigu6sLa S/D des Concessions d'IrrigationLa S/D de la Valorisation de l'Eau
La Direction des Etudes G6nfrales Hydro-Agricolesla S/D de la Petite et Moyenne HydrauliqueLa S/D des Etudes G6n6rales et des Sch6mas Directurs d'Amdnagement Hydro-AgricoleLa S/D des Investissements Hydrauliques AgricolesLa S/D de l'Agricuture Saharienne
La Direction de l'Am6nagement Rural, de l'Organisation Fonciere et de la Protection desPatrimoines
La S/ID de l'Amenagement et des Equipements RurauxLa S/D de l'Organisation du Patrimoine Foncier AgricoleLa S/D de la Protection des Patrimoines
La Direction des Production AgricolesLa S/D du D6veloppement des Productions VegetalesLa S/D du D6veloppement des Productions AnimalesLa S/D de la Valorisation des Productions et de 'Int6ation Agro-IndustrielleLa S/D du Developpement de la Normalisation
La Direction des Services VeterinairesLa S/D de la SantW Animale et de la Pharnacie VeterinaireLa S/D du Contr6le Sanitaire et de l'Hygiene AlimentaireLa S/D des Haras
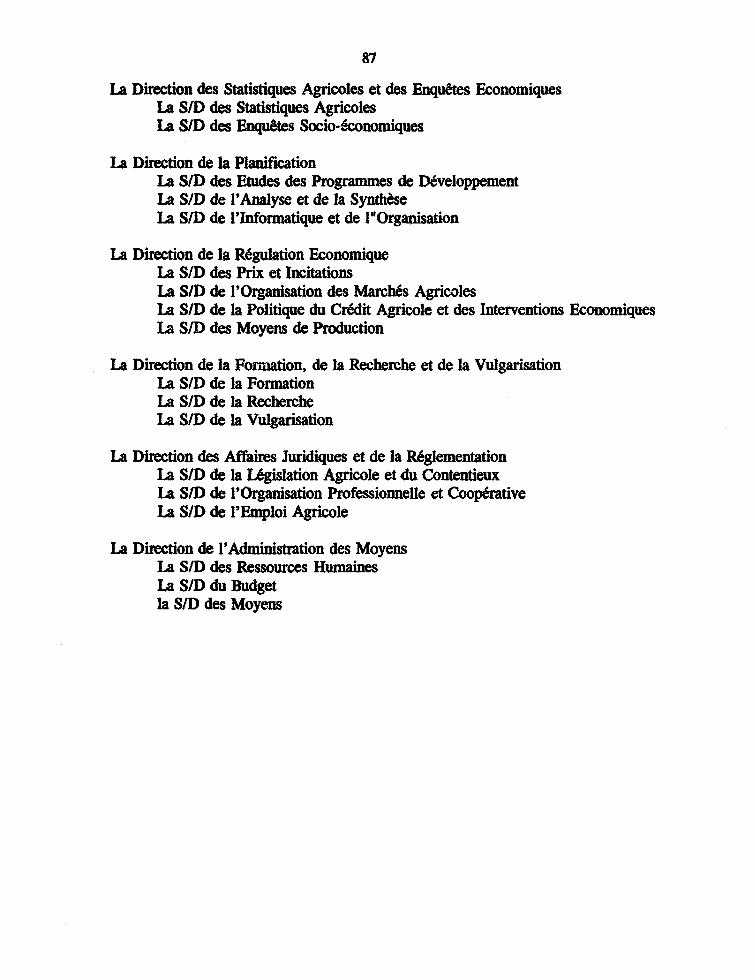
87
La Detion des Statistiques Agricoles et des Enquetes EconomiquesLa S/D des Statistiques AgricolesLa SID des Enquet&s Socio-6conomiques
Ia Direction de la PlanificationLa S/D des Etudes des Programmes de DNveloppementLa S/D de I'Analyse et de la SyntheseLa S/D de l'Informatique et de l"Organisation
La Direction de la Regulation EconomiqueLa S/D des Prix et IncitationsLa S/D de l'Organisation des March6s AgricolesLa S/D de la Politique du Cr&dit Agricole et des Interventions EconomiquesLa S/D des Moyens de Production
La Direction de la Formation, de la Recherche et de la VulgarisationLa S/D de la Formationla S/D de la RechercheLa S/D de la Vulgarisation
La Direction des Affaires Juridiques et de la R6glementationLa S/D de la Legislation Agricole et du ContentieuxLa S/D de l'Organisation Professionnelle et Coop6rativeLa S/D de l'Emploi Agricole
La Direction de I'Administration des MoyensLa S/D des Ressources HumainesLa S/D du Budgetla S/D des Moyens

88
Fig. 1 Distribution network for agricultural machines and spares
JP Import & production ofspares & machines
-------------------- __p PMA .
Import of spares & ad. hocImport of machines 4regionaldistributions
centres
48 E.DIMMA F1 Blida(Wilaya)
180 shops ooooQ
oro O recognized 0000 0 l501tcensedagentsworkshops 3C 33 C 3O C 3C 3 I0liesdant
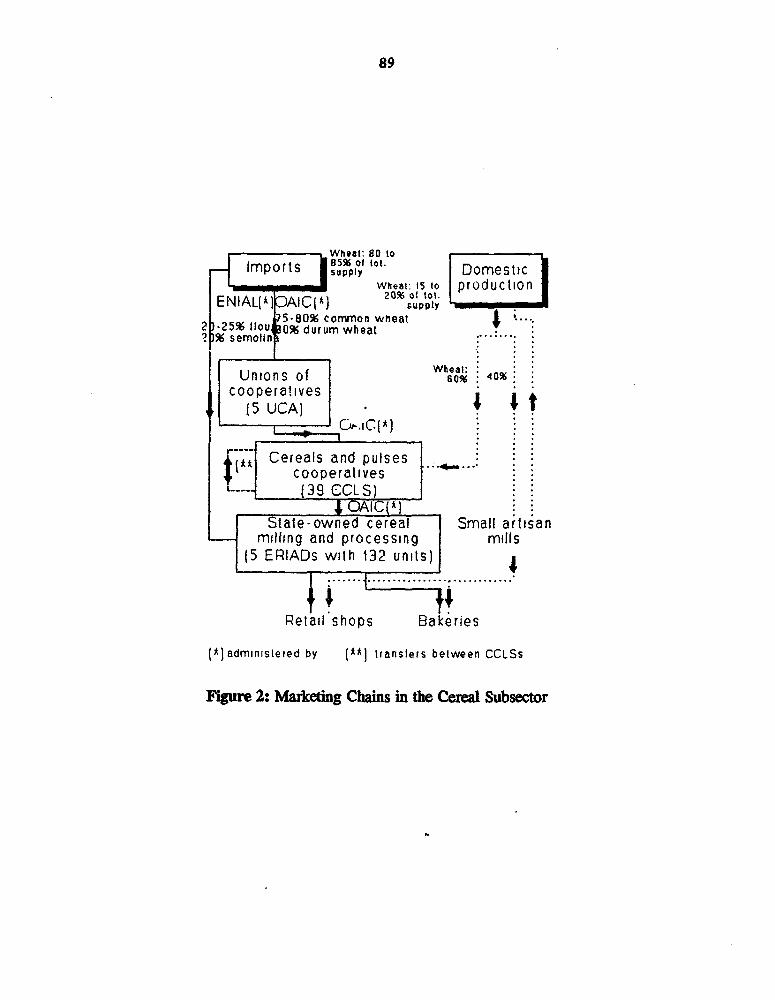
89
Wheat: S0 toImports 85% of lot. Domestic|
mpots supply ometUWheat: 15 lo production I
ENlAL(t) I :AICtA) 20% ot to,3-580% common wheat 4
2 -25% fiou 0% durum wheat2 % semolin.,
Unions of Whe0% . 40X 6cooperatives 4 s -
(5 UCA) . + +
P7* Cereals and pulsescooperatives
t ~(39 CCLS)..1OAIC(A)
State-owned cereal Small artisanmilling and processing mills
(5 ERIADs with 132 units)
. ..
Retail shops Bakeries
(A)administered by (AAI transfers between CCLSs
Figure 2: Maketing Chains in the Cereal Subsector
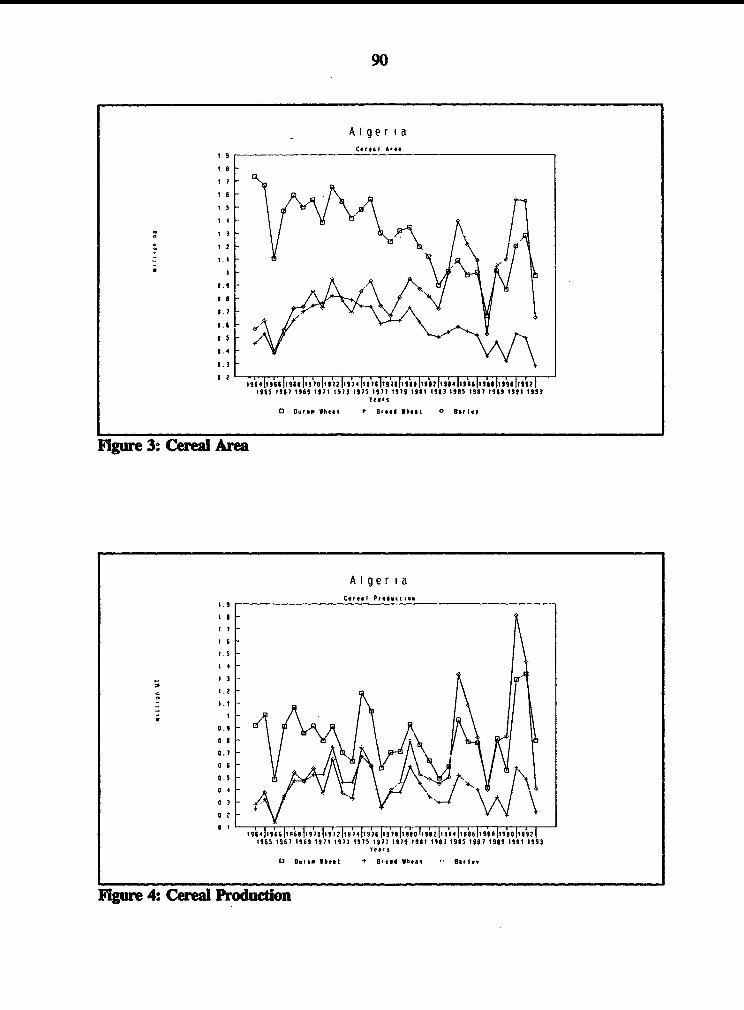
90
Cereal Pooa
¶9 ~~-
tI
15
14
17
* ~ ~~~~~~~~~~ I I
'.5
.14
1965 IS61 1969 19)1 1973 ¶975 1977 1919 1991 19q3 1985 ISO?9199 1991 1993
Yes, s
O Drgr 19eat1 + 8ad Wheal '' O4l 1v
Figre 4: Cereal Aroduction

91
A f aeor i aC.3,.I 3.fIdj
33
3.9
3.7
3.6
..5
04
0 3 394 J33Sis 31 831 9 7z384t9s39Ib 90j31d 8 7It3 '4l3 Ie3l39eIt s8l319;2 I1$35 3961 3969 1373 3973 1973 t39l 3979 3983 1993 1335 t997 I33 3t39 !993
Too 5
a o ,.. 14. , + 83e d wheat 0 8.r13*
Figue 5: Cereal YIe1
AI ger i a1Potat Area
138
128
333
390
30
so
30
50
40
3385 3963 3383 1873 3373 3975 t973 1373 3383 1983 3985 IS87 1889 i383 3393
Figur 6: Potato Area
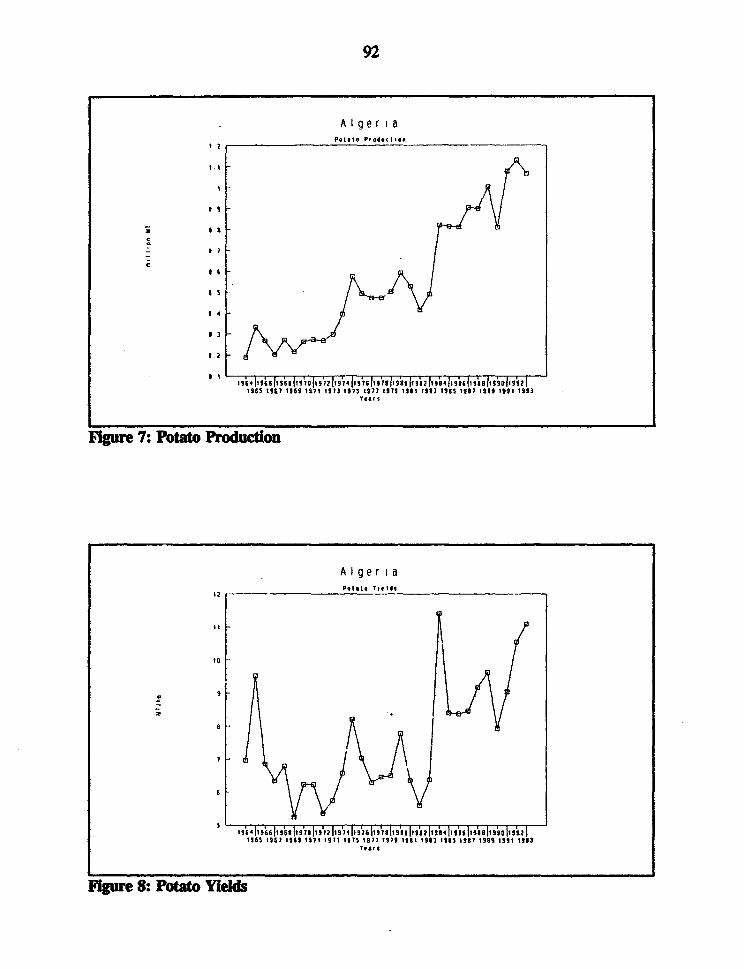
92
AI ge r i a
U0 $
07 6
0 4
t964 11 i lSl7arl'76 7119 i lll[711 1l469 1 ,a6 17 4r IIl 9116s6l1 t 2o1s bl1965 tg&7 t969 1171 7113 117 tS77 i171 ... 1193 .. 1987 Isis 1111 11t3
Tkl~ S
Fure 7: Potato Production
Al ger i aPotato Teld I4
I 1164 11 66111r$91117179 f41t 2 1 ?l 7 ll1? [919l1I s11s211l984 iI8 6111lZS 9 119377 113IllS 1967 1M6s 1971 1971 107$ 1977 1197 1161 1193 1905 1987 1196 1191 1613
Fiue 8: Plato Yields