Wind energy for rural areas of Algeria
6
(This is a sample cover image for this issue. The actual cover is not yet available at this time.) This article appeared in a journal published by Elsevier. The attached copy is furnished to the author for internal non-commercial research and education use, including for instruction at the authors institution and sharing with colleagues. Other uses, including reproduction and distribution, or selling or licensing copies, or posting to personal, institutional or third party websites are prohibited. In most cases authors are permitted to post their version of the article (e.g. in Word or Tex form) to their personal website or institutional repository. Authors requiring further information regarding Elsevier’s archiving and manuscript policies are encouraged to visit: http://www.elsevier.com/copyright
-
Upload
independent -
Category
Documents
-
view
3 -
download
0
Transcript of Wind energy for rural areas of Algeria

(This is a sample cover image for this issue. The actual cover is not yet available at this time.)
This article appeared in a journal published by Elsevier. The attachedcopy is furnished to the author for internal non-commercial researchand education use, including for instruction at the authors institution
and sharing with colleagues.
Other uses, including reproduction and distribution, or selling orlicensing copies, or posting to personal, institutional or third party
websites are prohibited.
In most cases authors are permitted to post their version of thearticle (e.g. in Word or Tex form) to their personal website orinstitutional repository. Authors requiring further information
regarding Elsevier’s archiving and manuscript policies areencouraged to visit:
http://www.elsevier.com/copyright
Author's personal copy
Renewable and Sustainable Energy Reviews 16 (2012) 2381– 2385
Contents lists available at SciVerse ScienceDirect
Renewable and Sustainable Energy Reviews
j ourna l h o mepage: www.elsev ier .com/ locate / rser
Wind energy for rural areas of Algeria
Y. Himria,∗, S. Rehmanb, A. Agus Setiawanc, S. Himrid
a Société Nationale de I’ELectricité et du GAZ (SONELGAZ), Béchar, Algeriab Engineering Analysis Section, Center for Engineering Research, Research Institute, King Fahd University of Petroleum and Minerals, Box 767, Dhahran 31261, Saudi Arabiac Department of Electrical & Computer Engineering, Curtin University of Technology, GPO Box U1987, Perth 6845, Australiad University of Béchar, Department of Fundamental Sciences, Algeria
a r t i c l e i n f o
Article history:Received 17 December 2010Accepted 29 January 2012
Keywords:AlgeriaFrequencyPlant capacity factorRenewable energyRETScreenWind speed
a b s t r a c t
This paper presents long-term analysis of wind speed data in terms of annual, seasonal and diurnalvariations at Tindouf, which is situated on the south west region of Algeria. The wind speed data wascollected over a period of 08 years between 1976 and 1984. The study showed that the long-term sea-sonal wind speeds were found to be relatively higher during September compared to other months. Thediurnal change in long-term mean wind speed indicated that higher electricity could be produced dur-ing 09:00–18:00 h, which also coincides with higher electricity demand period. The annual wind energyproduction and capacity factor, obtained using wind speed frequency distribution and wind power curveof 1000 kW wind turbine and RETScreen software were found comparable with each other if unadjustedenergy production values calculated by the software were used rather than the renewable energy deliv-ered. Development of wind farm of 30 MW installed capacity at this site could result into avoidance of23,252 tonnes/year of CO2 equivalents GHG from entering into the local atmosphere thus creating a cleanand healthy atmosphere for local inhabitants.
© 2012 Elsevier Ltd. All rights reserved.
Contents
1. Introduction . . . . . . . . . . . . . . . . . . . . . . . . . . . . . . . . . . . . . . . . . . . . . . . . . . . . . . . . . . . . . . . . . . . . . . . . . . . . . . . . . . . . . . . . . . . . . . . . . . . . . . . . . . . . . . . . . . . . . . . . . . . . . . . . . . . . . . . . . . 23812. Site and data description. . . . . . . . . . . . . . . . . . . . . . . . . . . . . . . . . . . . . . . . . . . . . . . . . . . . . . . . . . . . . . . . . . . . . . . . . . . . . . . . . . . . . . . . . . . . . . . . . . . . . . . . . . . . . . . . . . . . . . . . . . . . . 23833. Analyses, results and discussions . . . . . . . . . . . . . . . . . . . . . . . . . . . . . . . . . . . . . . . . . . . . . . . . . . . . . . . . . . . . . . . . . . . . . . . . . . . . . . . . . . . . . . . . . . . . . . . . . . . . . . . . . . . . . . . . . . . . 2383
3.1. Wind speed analysis . . . . . . . . . . . . . . . . . . . . . . . . . . . . . . . . . . . . . . . . . . . . . . . . . . . . . . . . . . . . . . . . . . . . . . . . . . . . . . . . . . . . . . . . . . . . . . . . . . . . . . . . . . . . . . . . . . . . . . . . . . 23833.2. Wind speed frequency distribution . . . . . . . . . . . . . . . . . . . . . . . . . . . . . . . . . . . . . . . . . . . . . . . . . . . . . . . . . . . . . . . . . . . . . . . . . . . . . . . . . . . . . . . . . . . . . . . . . . . . . . . . . . 23833.3. Wind energy yield estimation . . . . . . . . . . . . . . . . . . . . . . . . . . . . . . . . . . . . . . . . . . . . . . . . . . . . . . . . . . . . . . . . . . . . . . . . . . . . . . . . . . . . . . . . . . . . . . . . . . . . . . . . . . . . . . . . 2384
4. Conclusion. . . . . . . . . . . . . . . . . . . . . . . . . . . . . . . . . . . . . . . . . . . . . . . . . . . . . . . . . . . . . . . . . . . . . . . . . . . . . . . . . . . . . . . . . . . . . . . . . . . . . . . . . . . . . . . . . . . . . . . . . . . . . . . . . . . . . . . . . . . . 2385Acknowledgments . . . . . . . . . . . . . . . . . . . . . . . . . . . . . . . . . . . . . . . . . . . . . . . . . . . . . . . . . . . . . . . . . . . . . . . . . . . . . . . . . . . . . . . . . . . . . . . . . . . . . . . . . . . . . . . . . . . . . . . . . . . . . . . . . . . 2385References . . . . . . . . . . . . . . . . . . . . . . . . . . . . . . . . . . . . . . . . . . . . . . . . . . . . . . . . . . . . . . . . . . . . . . . . . . . . . . . . . . . . . . . . . . . . . . . . . . . . . . . . . . . . . . . . . . . . . . . . . . . . . . . . . . . . . . . . . . . 2385
1. Introduction
Wind energy has been used since the earliest civilization togrind grain, pump water from deep wells, and power sailboats.The increasing awareness of both the monetary and the environ-mental costs of burning fossil fuels is making alternative energymore appealing than ever. The power generated from wind can beused for all small and large applications such as lighting, refriger-ation, computers, televisions, water pumping, water desalination,
∗ Corresponding author.E-mail addresses: y [email protected] (Y. Himri), [email protected]
(S. Rehman), [email protected] (A. Agus Setiawan), s [email protected](S. Himri).
water heating, air-conditioning, running fans, and so on. A modernwind turbine of 1.65 MW rated capacity can produce more than4.7 million kWh of energy in a year which will be enough to powermore than 470 average households in the U.S. [1]. The power ofthe wind is clean, free, and abundance source of energy. It has nopolitical and geographical boundaries and no need for means oftransport. The wind power technology has achieved the commer-cial acceptability and is economically compatible with traditionalmeans of energy generation.
These days, power of the wind is being encouraged due to avail-ability of low maintenance multi megawatt sized efficient windturbines. Accordingly, the annual global wind power market grew astaggering 41.5% in year 2009 compared to 2008. More than 38 GWof new wind power capacity was added around the globe in 2009(see Fig. 1), bringing the total installed capacity to 158.5 GW [2].
1364-0321/$ – see front matter © 2012 Elsevier Ltd. All rights reserved.doi:10.1016/j.rser.2012.01.055

Author's personal copy
2382 Y. Himri et al. / Renewable and Sustainable Energy Reviews 16 (2012) 2381– 2385
Fig. 1. Global wind power cumulative installed capacity.
0
5
10
15
20
25
30
35
40
1990
1991
1992
1993
1994
1995
1996
1997
1998
1999
2000
2001
2002
2003
2004
2005
2006
2007
2008
2009
Year
Win
d p
ow
er
ca
pa
cit
y, (%
)
Fig. 2. Annual percent wind power installed capacity.
This represents a year-on-year growth of 31.7%, as can be seen fromFig. 2. One third of these additions were made in China, which dou-bled its installed capacity yet again. Since 2005, the global windpower growth has been always more than 25%.
The use of non renewable sources of energy not only resultsin deterioration of environment and health but also confronts uswith the dilemma of the rapid depletion rates of such resources.While renewable energy sources can be used indefinitely with min-imal impacts on the environment as compared with fossil fuels.Tremendous opportunities exist in Algeria for growth in the useof renewable energy technologies. The Algerian Government hasintroduced a national program for integration of renewable withan objective to achieve 5% of power generation by 2017 and a long-term target of reaching 20% by 2030. In Algeria the first wind speedmeasurement campaign was conducted in 1918. Wind measure-ments, however, were taken as an average of three readings in eachday 07h00, 13h00 and 18h00. Averages were taken over each indi-cated hour, and the three hourly points were averaged to obtain themean wind speed for that day [3] while the foremost work, in theform of wind atlas was reported by [4] giving the results of the sta-tistical study of 37 locations using the WAsP. Himri et al. [5] utilizedwind speed data over a period of almost 10 years for three stations,namely Adrar, Timimoun and Tindouf to assess the wind powerpotential at these sites. They estimated that wind farms of 30 MW
installed capacity could be established at Adrar, Timimoun and Tin-douf. These wind farms, if established, could produce 98,832 MWh,78,138 MWh and 56,040 MWh of electricity annually, respectively.In another study, Himri and Himri [6] presented a review of Alge-ria’s renewable energy sources, which could be exploited for thegeneration of sustainable energy in Algeria. Himri et al. [7] pre-sented the wind characteristic at three locations in Algeria. Theyrevealed that the energy could be harnessed for almost 64% thetime using wind machines with cut-in speed of 3 m/s or more.Himri et al. [8] presented wind speed data analysis for three sta-tions namely Adrar, Timimoun and Tindouf, Algeria, using windenergy conversion systems (WECSs) of different sizes between 150and 1300 kW. They found that Adrar is the best location amongthe sites considered, for harnessing the wind power, while Timi-moun is the second best location and Tindouf was placed at numberthree.
The higher capacity factors are also found for wind machines ofsmaller sizes. According to a contract signed lately between “Elec-tricity and Gas Engineering Company” (CEEG) subsidiary of GroupSONELGAZ “Algerian Company of Electricity and Gas” and Frenchturbine manufacturer VERGNET, that the construction of Algeria’sfirst wind firm, of 10 MW installed capacity consisting of 10 windturbines of 1 MW rated power each from GEV HP, which will bebased in the south-western region of Adrar (1543 km of Algiers),should be operational in 2012. The project would cost about D 24million in terms of total investment cost. Furthermore, the costof energy from this wind farm is expected to be approximatelyD 0.094/kWh. It is part of energy policy diversification in Alge-ria, a country that is fortunate in having large renewable energyresources and countless “Farwind” sites. Regarding the potentialsof renewable energy and economic links with Europe, Algeria isamong the most important country in North Africa.
Algeria is now positively disposed to the promotion of renew-able energy source and views renewable as a way of promoting thedevelopment of small and local businesses in selected areas anddiversifying supply patterns at the regional level. Algeria is per-fectly placed to play a leading role in the lucrative future windpower industries. It has developed national programs and setnational indicative targets for renewables in order to pursue thedevelopment of alternative electricity sources, with an objective toachieve 5% of power generation by 2017 and a long-term target ofreaching 20% renewable energy power by 2030 [9].
This program establishes numerous measures to inquire andinstruct the public about renewable energy. It is integrated into aframework for sustainable development and land use planning. Thegovernment has interpreted international examples of best prac-tice (e.g. the German feed-in law for power generation based onrenewable energy) into the policy framework of Algeria [10]. NewEnergy Algeria NEAL has joined the International Energy Agency’sSolarPACES programs and incorporated renewable energy targetsinto national laws as shown in Table 1, to help create a stable envi-ronment for long-term investors.
Having ambitious quantitative targets, the Algerian’s environ-mental friendly energy strategy has set up wind projects of totalinstalled capacity of 36 MW around 2015. The total cost of the aboveinstalled capacity is expected to be around D 82 millions.
Table 1A total list of power production with wind power source up to 2015.
Project and place Capacity (MW) Bill-book Cost ($ × 106) Observation
WPP1.Tindouf 6 2006–2007 13 Wind power plantWPP2.Tindouf 10 2008–2010 23 Wind power plantWPP3.Timimoun 10 2010–2012 23 Wind power plantWPP4.Bechar 10 2015 23 Wind power plant
Total 36 – 82 –

Author's personal copy
Y. Himri et al. / Renewable and Sustainable Energy Reviews 16 (2012) 2381– 2385 2383
NEAL beside Government support has solicited several sourcesof funding to support these projects including World Bank, AIE andthe European bank of investment [11]. In May 2010 an interna-tional workshop “the 2010 USTO Photovoltaic’s Energy Workshop,Opportunities, Pathways and Solution” was held at the Universityof Sciences and Technology of Oran (USTO), Algeria.
The objective of the above workshop was to consolidate the con-struction and development of Sahara Solar Breeder (SSB) projectwhich will be carried out on 500 m2 in Saida (200 km of Oran). Theestimated project cost of 5 million US$ is expected to be financedby a grant from the two Japanese agencies namely Japan Interna-tional Cooperation Agency (JICA) and Japan Science and TechnologyAgency (JSTA) through the cooperation with USTO. Tindouf with anannual average wind speed of 4.3 m/s at 10 m above the ground sur-face may be a candidate site to start wind power generation in thenear future [5].
This paper presents seasonal and diurnal variability of windspeed at 68.5 m above the ground and frequency distribution indifferent wind speed bins. The energy production and capacity fac-tor, obtained using two methods viz. wind power curve of 1000 kWalong with the frequency distribution and RETScreen software werecompared.
2. Site and data description
Tindouf is located in the south west region of Algeria. The lat-itude and longitude of the location of data collection station are27◦40′ and 08◦06′, respectively. It is 401 m above mean sea level. Inorder to develop wind power, it is important to understand the vari-ability and availability of annual, seasonal and diurnal wind speed.At Tindouf, the wind speed measurements were made at 10 m AGLand recorded every 3 h interval (viz. 0, 3, 6, 9, 12, 15, 18 and 21 h).The data included in this study were collected over a period of08 years from 1976 to 1984. With regard to general weather condi-tions, the average annual temperature was 21.8 ◦C and the surfacepressure was 96 kPa. The annual average wind speed was found tobe 4.3 m/s at 10 m AGL.
3. Analyses, results and discussions
This section provides in depth analysis of wind data, energyyield, capacity factor and comparison of capacity factor and energyyield with two methods.
3.1. Wind speed analysis
The seasonal variation of wind speed provides basic informationabout the wind strength and consequently about its availabilityduring different months of the year which helps in planning theoperation of existing power plants and the load requirements of theload center. The variation of monthly average wind speed at 10 mand 68.5 m above the ground is depicted in Fig. 3. As shown in Fig. 3,the maximum monthly mean wind speed of 5.5 m/s was observedin April, while a minimum of 3.0 m/s in December at 10 m AGL.Overall higher monthly mean wind speeds were observed duringMarch–September compared to other months. At 68.5 m AGL, thehourly wind speeds were calculated using the 1/7th wind powerlaw and the resulting monthly means over entire data collectionperiod are also depicted in Fig. 3. It was observed that the estimatedwind speed values at 68.5 m AGL followed the same trend as thoseof at 10 m AGL.
The diurnal variation of three hourly mean wind speeds at 10 mand 68.5 m heights is shown in Fig. 4. At 10 m height above theground level, the higher values of hourly mean wind speed ofthe order of 4.4 m/s and greater were observed between 09:00
Fig. 3. Seasonal variation of long-term mean wind speed.
Fig. 4. Diurnal variation of long-term mean wind speed.
and 18:00 h while lower during rest of the period of the day. Thisobservation indicates that higher electricity could be produced dur-ing 09:00 to 18:00 h which also coincide with higher electricitydemand time. Similar trends, but with larger magnitudes, werenoticed at 68.5 m AGL.
3.2. Wind speed frequency distribution
The wind availability analysis is carried out in terms of the occur-rence of the number hours or percentage of time during which thewind remained in a certain wind speed bin. Fig. 5 shows the fre-quency distribution of wind speed in different wind speed bins at68.5 m AGL at Tindouf.
The wind speed values at 68.5 m hub height were calculatedusing the 1/7th wind power law, it is also obvious from this figurethat the wind remained above 3 m/s for 66% of the time, and usually
Fig. 5. Percent distribution of hourly mean wind speed in different bins for Tindoufat 68.5 m.
Author's personal copy
2384 Y. Himri et al. / Renewable and Sustainable Energy Reviews 16 (2012) 2381– 2385
Table 2Wind turbine parameters [20].
Item Value
Model DEWIND 62Rated power (kW) 1000Rotor diameter (m) 62Hub height (m) 68.5Swept area of rotor (m2) 3019Cut-in-wind speed (m/s) 3Rated wind speed (m/s) 11.5Cut-out-wind speed (m/s) 23Rotor speed (rpm) 12.1–25.2Tower type Tubular
modern wind turbines start generating power at cut-in-speed of 3.5or 4 m/s so the wind turbine can produce energy for 66% of the timesat Tindouf.
3.3. Wind energy yield estimation
The energy yield was obtained using two different approachesviz., wind power curve of the wind machine along with thewind frequency distribution and the RETScreen software [12]. TheRETScreen is a tool for analyzing the technical and financial via-bility of potential renewable energy projects is now being used bymore than 35,000 people in over 196 countries around the globe, asreported in the literature [13–19]. The software requires the windturbine power curve, the annual average wind speed; the rotorswept area, the mean temperature and pressure, hub height, etc.The wind turbine related parameters are summarized in Table 2[5,20].
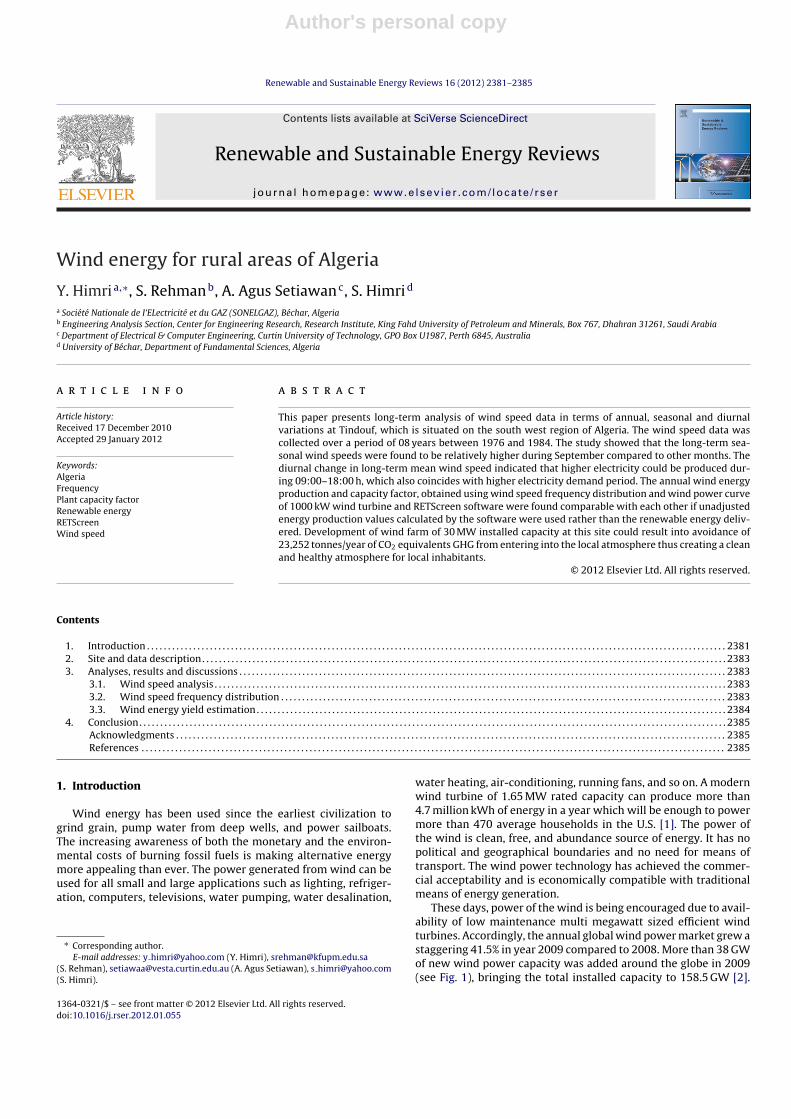
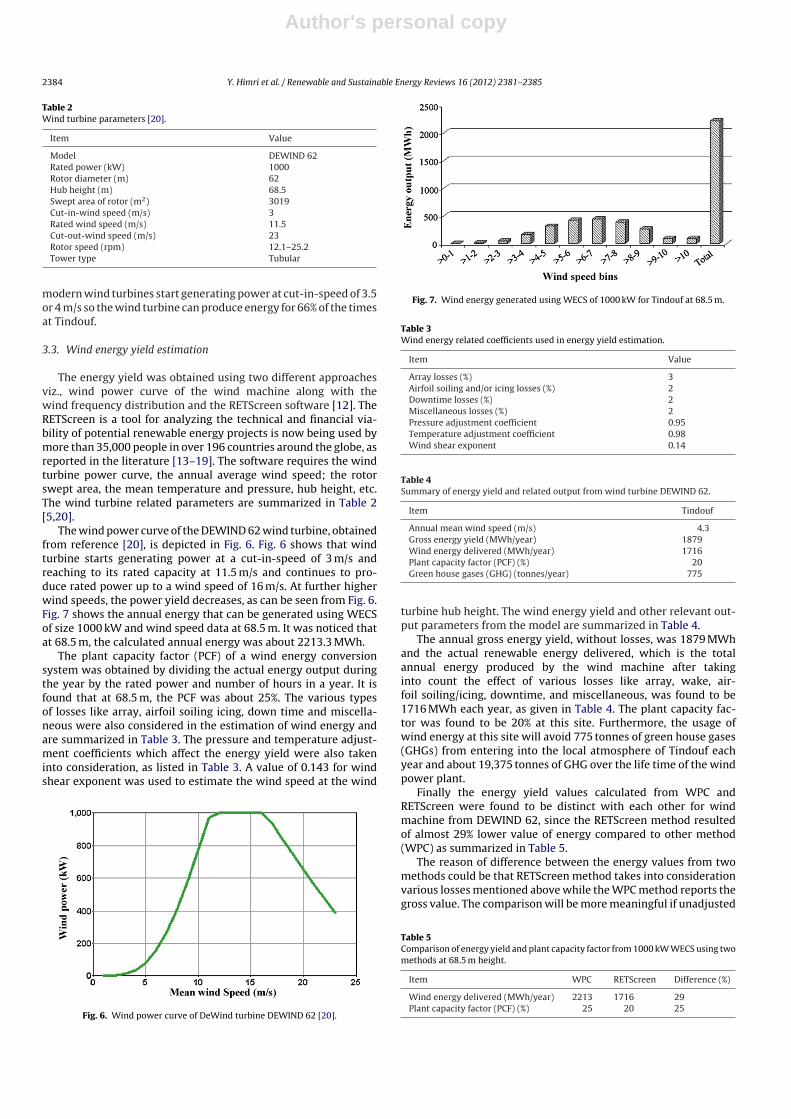
The wind power curve of the DEWIND 62 wind turbine, obtainedfrom reference [20], is depicted in Fig. 6. Fig. 6 shows that windturbine starts generating power at a cut-in-speed of 3 m/s andreaching to its rated capacity at 11.5 m/s and continues to pro-duce rated power up to a wind speed of 16 m/s. At further higherwind speeds, the power yield decreases, as can be seen from Fig. 6.Fig. 7 shows the annual energy that can be generated using WECSof size 1000 kW and wind speed data at 68.5 m. It was noticed thatat 68.5 m, the calculated annual energy was about 2213.3 MWh.
The plant capacity factor (PCF) of a wind energy conversionsystem was obtained by dividing the actual energy output duringthe year by the rated power and number of hours in a year. It isfound that at 68.5 m, the PCF was about 25%. The various typesof losses like array, airfoil soiling icing, down time and miscella-neous were also considered in the estimation of wind energy andare summarized in Table 3. The pressure and temperature adjust-ment coefficients which affect the energy yield were also takeninto consideration, as listed in Table 3. A value of 0.143 for windshear exponent was used to estimate the wind speed at the wind
Fig. 6. Wind power curve of DeWind turbine DEWIND 62 [20].
Fig. 7. Wind energy generated using WECS of 1000 kW for Tindouf at 68.5 m.
Table 3Wind energy related coefficients used in energy yield estimation.
Item Value
Array losses (%) 3Airfoil soiling and/or icing losses (%) 2Downtime losses (%) 2Miscellaneous losses (%) 2Pressure adjustment coefficient 0.95Temperature adjustment coefficient 0.98Wind shear exponent 0.14
Table 4Summary of energy yield and related output from wind turbine DEWIND 62.
Item Tindouf
Annual mean wind speed (m/s) 4.3Gross energy yield (MWh/year) 1879Wind energy delivered (MWh/year) 1716Plant capacity factor (PCF) (%) 20Green house gases (GHG) (tonnes/year) 775
turbine hub height. The wind energy yield and other relevant out-put parameters from the model are summarized in Table 4.
The annual gross energy yield, without losses, was 1879 MWhand the actual renewable energy delivered, which is the totalannual energy produced by the wind machine after takinginto count the effect of various losses like array, wake, air-foil soiling/icing, downtime, and miscellaneous, was found to be1716 MWh each year, as given in Table 4. The plant capacity fac-tor was found to be 20% at this site. Furthermore, the usage ofwind energy at this site will avoid 775 tonnes of green house gases(GHGs) from entering into the local atmosphere of Tindouf eachyear and about 19,375 tonnes of GHG over the life time of the windpower plant.
Finally the energy yield values calculated from WPC andRETScreen were found to be distinct with each other for windmachine from DEWIND 62, since the RETScreen method resultedof almost 29% lower value of energy compared to other method(WPC) as summarized in Table 5.
The reason of difference between the energy values from twomethods could be that RETScreen method takes into considerationvarious losses mentioned above while the WPC method reports thegross value. The comparison will be more meaningful if unadjusted
Table 5Comparison of energy yield and plant capacity factor from 1000 kW WECS using twomethods at 68.5 m height.
Item WPC RETScreen Difference (%)
Wind energy delivered (MWh/year) 2213 1716 29Plant capacity factor (PCF) (%) 25 20 25

Author's personal copy
Y. Himri et al. / Renewable and Sustainable Energy Reviews 16 (2012) 2381– 2385 2385
energy yield (2018 MWh), which is the energy that one or morewind turbines will produce at standard conditions of temperatureand atmospheric pressure. In such case the difference wouldnarrow down to 9.6%.
4. Conclusion
The wind data analysis used in this paper covered a period of08 years between 1976 and 1984. The study conducted a detailedanalysis of the wind speed data and made the following observa-tions:
• At Tindouf, the long-term annual mean wind speed at 68.5 m AGL,calculated using 1/7 power law, was found to be 5.7 m/s.
• The higher wind speeds were observed in the day time between09:00 and 18:00 h and relatively lower during rest of the period.
• The long-term seasonal wind speeds were found to be relativelyhigher during March to September compared to other months.
• The frequency distribution of wind speed at 68.5 m AGL in dif-ferent wind speed bins showed that the wind remained above3 m/s for 66% of the time during entire data collection period.This means, that the energy could be harnessed for 66% of timeusing wind machine from DEWIND 62 with cut-in-speed of 3 m/sat Tindouf.
• The annual wind energy yield and plant capacity factor, obtainedusing wind power curve of 1000 kW and RETScreen methodswere comparable with each other for unadjusted energy yieldvalues rather than the renewable energy delivered.
• Wind farm of 30 MW installed capacity at Tindouf, if developed,could produce 51,467 MWh of electricity annually.
• The plant capacity factor at this site was found to be 20%.• Such a development at this site could result into avoidance of
23,252 tonnes/year of CO2 equivalents GHG from entering intothe local atmosphere thus creating a clean and healthy atmo-sphere for local inhabitants.
Acknowledgments
The authors wish to acknowledge the support of Research Insti-tute of King Fahd University of Petroleum and Minerals, Dhahran,Saudi Arabia and thank Dr Dennis Kumetat at the London School
of Economics & Political Science, Department of Geography andEnvironment U.K. for literature searches.
References
[1] AWEA American Wind Energy Association. Wind energy applications guide;2001.
[2] GWEC Global Wind Energy Council Press Release. Global wind energy marketscontinue to boom another record year; 2010.
[3] Seltzer P. Le climat de l’Algérie: le vent. Edition Franc aise; 1946. p. 83–101.[4] Hammouche R. Atlas Vent de l’Algérie. Alger: Publication interne de l’ONM
(Office National de Météorologie); 1990.[5] Himri Y, Rehman S, Draoui B, Himri S. Wind power potential assessment
for three locations in Algeria. Renewable and Sustainable Energy Reviews2008;12:2495–504.
[6] Himri Y, Himri S. Review of Algeria’s renewable energy sources. In: Enviroenergy 2009: international conference on energy and environment Taj Chandi-garh. 2009.
[7] Himri Y, Draoui B, Himri S. Wind characteristics of Algeria. In: Nanotechnologyconference and trade show. 2008.
[8] Himri Y, Himri S, Boudghene Stambouli A. Wind speed data analysis used ininstallation of wind energy conversion systems in Algeria. In: Transmissionand distribution conference and exposition, IEEE PES. 2010. p. 1–5.
[9] CTF. Climate investment funds: clean technology fund investment plan forconcentrated solar power in the middle east and north Africa region. In: Inter-sessional meeting of the CTF trust fund committee. 2009.
[10] Supersberger N, Kumetat D, Tanzler D, Fritzsche K, Schuwer D, Vallentin D,et al. Energy systems in OPEC countries: system analytic comparison of nuclearpower, renewable energies and energy efficiency, Final project report, March2010.
[11] Himri Y, Malik AS, Himri S, Boudghene Stambouli A. Algerian renewable energy.In: Projects for clean environment, 2009 NSTI nanotechnology conference andtrade show, vol. 3. 2009. p. 98–102.
[12] RETScreen International Clean Energy Project Analysis Software,www.retscreen.net/ang/centre.php; 2007 [accessed 25.04.07].
[13] Brower M, New Mexico wind resources: AGIS approach, new mexico energy,minerals, and natural resources department, Final report, September, 1997.
[14] Rehman S. Offshore wind power assessment on the east coast of Saudi Arabia.Wind Engineering 2006;29(5):409–20.
[15] Chandler William S, Brown DE, Whitlock CH, Stackhouse Jr PW. Energy designsoftware using NASA meteorology and solar energy data. Hampton, VA: NASALangley Research Center; 2002.
[16] Brughuis FJ. Large wind turbines: the higher the better. In: Advanced towersystems BV Netherlands EWEC; 2006.
[17] Houri A. Solar water heating in Lebanon: current status and future prospects.Renewable Energy 2005;31(5):663–75.
[18] Rehman S, Maher AB, Al-Moallem SA. Cost of solar energy generated using PVpanels. Renewable and Sustainable Energy Reviews 2007;11(8):1843–57.
[19] Ianniciello C, Pitt P, Wild L, Artz S. An assessment of energy options for a remotefirst nation community. In: Proceedings of the international green energy con-ference. 2005.
[20] DeWind. Publication, DEWIND62 1000 kW wind machine technical descrip-tion, http://www.dewind.de; 2007 [accessed 25.04.07].