Microeconometric analysis of determinants of occupational choice in Algeria
22
Since 1994 Inter-University Consortium Connecting Universities, the Labour Market and Professionals S t b 2011 ALMALAUREA WORKING PAPERS no. 5 AlmaLaurea Working Papers – ISSN 2239-9453 September 2011 Micro econometric analysis of determinants of occupational choice in Algeria by Lassassi Moundir Hammouda Nacer-eddine Centre de recherche en économie appliquée pour le développement (CREAD) This paper can be downloaded at: AlmaLaurea Working Papers series http://www.almalaurea.it/universita/pubblicazioni/wp REsearch Papers in Economics (RePEC) Also available at:
Transcript of Microeconometric analysis of determinants of occupational choice in Algeria

Since 1994 Inter-University Consortium
Connecting Universities, the Labour Market and Professionals
S t b 2011
ALMALAUREA WORKING PAPERS no. 5
AlmaLaurea Working Papers – ISSN 2239-9453
September 2011
Micro econometric analysis of determinants of occupational choice in Algeria
by
Lassassi MoundirHammouda Nacer-eddine
Centre de recherche en économie appliquée pour le développement (CREAD)
This paper can be downloaded at:
AlmaLaurea Working Papers seriesg phttp://www.almalaurea.it/universita/pubblicazioni/wp
REsearch Papers in Economics (RePEC)
Also available at:
The AlmaLaurea working paper series is designed to make available to a wide readership selectedworks by AlmaLaurea staff or by outside, generally available in English or Italian. The series focuses on thestudy of the relationship between educational systems, society and economy, the quality of educationalprocess, the demand and supply of education, the human capital accumulation, the structure and working ofthe labour markets, the assessment of educational policies.Comments on this series are welcome and should be sent to [email protected].
AlmaLaurea is a public consortium of Italian universities which, with the support of the Ministry ofEducation, meets the information needs of graduates, universities and the business community. AlmaLaureahas been set up in 1994 following an initiative of the Statistical Observatory of the University of Bologna. Itsupplies reliable and timely data on the effectiveness and efficiency of the higher education system tomember universities’ governing bodies, assessment units and committees responsible for teaching activitiesand career guidance.
AlmaLaurea:
facilitates and improves the hiring of young graduates in the labour markets both at the national andinternational level;
simplifies companies' search for personnel reducing the gap between the demand for and supply of simplifies companies search for personnel, reducing the gap between the demand for and supply of qualified labour (www.almalaurea.it/en/aziende/);
makes available online more than 1.5 million curricula (in Italian and English) of graduates, including those with a pluriannual work experience (www.almalaurea.it/en/);
ensures the optimization of human resources utilization through a steady updating of data on the careers of students holding a degree (www.almalaurea.it/en/lau/).
Each year AlmaLaurea plans two main conferences (www.almalaurea.it/en/informa/news) in which the results of the annual surveys on Graduates’ Employment Conditions and Graduates’ Profile are presented.
___________________________________________________________________________________________
AlmaLaurea Inter-University Consortium | viale Masini 36 | 40126 Bologna (Italy)Website: www.almalaurea.it | E-mail: [email protected]
___________________________________________________________________________________________
The opinions expressed in the papers issued in this series do not necessarily reflect the position of AlmaLaurea
© AlmaLaurea 2011Applications for permission to reproduce or translate all or part of this material should be made to:AlmaLaurea Inter-University Consortiumemail: [email protected] | fax +39 051 6088988 | phone +39 051 6088919
1
International Conference on « Human Capital and Employment in the European and Mediterranean Area »
Bologna, 10-11 March 2011
Micro econometric analysis of determinants of occupational choice in Algeria
by
Lassassi Moundir*
Hammouda Nacer-eddine**
Abstract: A review of the literature on the issue of labor market participation and occupational choice, allows us to see that research on this one turned more on developed countries. In underdeveloped countries, including Algeria, the determinants of participation in economic activity and individuals’ occupational choice remain understood despite their economic and social importance since the degree of economic vulnerability and social development is strongly correlated with the occupied job. This work is not concerned with income from the labor market but rather the process that takes place upstream, that is to say, the integration into the labor market. We will study the labor market functioning by analyzing the supply and demand of labor. So the first step is to analyze the participation determinants in economic activity and in a second stage to determine the role of individual characteristics, in particular human capital for the tenure choice. The aim of this work is to answer to the following questions:
• What are the factors that influence individual's participation in the labor market? Is there a difference between men and women?
• What are the occupational choice determinants of an individual on the labor market? Is this the same factors for men and women?
• What are the causes of failure in the labor market? To answer to all our concerns, we have exploited the employment surveys conducted by the National Office of Statistics (NOS) from Algerian households (employment surveys 1997 and 2007). For processing and data analysis, we applied several econometric techniques: models of discrete choice (binary logistic regression) and segmentation techniques. Four major findings emerged from this study: first, we note that women's participation in economic activity is following logic quite different from that of men. For women, the education and training that determine the participation in the labor market. For men, it is rather the age that determines participation. The second result concerns the effect of the sex variable; the latter has very important effect in the first phase of participation in economic activity. In the second phase (being busy) the effect of this variable is less important. The third result indicates the human capital importance in the positioning in the various segments of the labor market and improving the job situation. The fourth result is dysfunction in the labor market due to the mismatch between characterized supply by a population increasingly educated and labor demand characterized by job creation increasingly unqualified. Keywords: Human capital, labor market, occupational choice, recruitment channels, discrete choice model. JEL Classification: C25, J21, J23, J24.
* Attaché de recherche au centre de recherche en économie appliquée pour le développement (CREAD). e-mail: [email protected] / [email protected]. ** Directeur de recherche au centre de recherche en économie appliquée pour le développement (CREAD). e-mail: [email protected]

2
Introduction Among the theories which relate the work on the youth labor market and integration into working life include the human capital theory (Becker, 1964), the filter theory (Spence and Arrows, 1973, 1974), the job search theory, wage reservation theory. All work on employability is part of one or other of these theories. The insertion is a complex process, very different in different person’s concerned categories (M. Vernières, 1997). For the human capital theory, income is function of the classification, determined by human capital accumulation. Hence, individuals invest in their own capital to increase their labor productivity and thus their income. In this theory, employees are not the result of supply and demand law, but on the capital in professional skills yield. These skills can be innate or acquired through training as well as other behaviors that contribute to increased productivity (D-G Tremblay, 1997). The relation between education and wages is not always significant, as productivity-wage relation. E. Lazear explained that wages increase with seniority, even if productivity does not increase. D-G. Tremblay notes that in addition to the classical analysis framework, individuals can make other investment types such as investment in labor market knowledge, either: the acquisition of information on the employment, geographical displacement to get the best job opportunities, accepting a lower paid job, but may be more advantageous opportunities. He makes two remarks on the human capital theory. The first is that investment in human capital is age decreasing function because older you are and less time is available to grow that capital. The second is that wage gains are increasing at a decreasing rate with age. For JC Eicher, the human capital theory does not prove that productivity is totally linked to the training level. Proponents of this theory have been incorporating other variables in the basic model to explain the level of income. The added variables are age, sex, region, occupation and working hours. J. Vincens, meanwhile, noted that the human capital theory can have explanatory power in a system where employees are flexible and / or the overall unemployment is low. In the case of Africa, a considerable number of studies have applied the mincerien model or its variants (Schultz 2004, Psacharopoulos et al. 1994, Kuépié et al. 2006, etc) and showed significant yields and positive education years. The role of education is important because it determines the individual access to the most profitable sectors (formal sector, public sector) labor market (Kouamé et al. 1999, Brilleau et al. 2004, Lachaud 1998). In addition, low investment in human capital can lead to low participation in the labor market, if the expected wage is below the reservation wage. Some studies have investigated the women situation in the labor market after childbirth. If Newel, Joshi (1986) and Perry (1988) argue that many women know the transition from working full time to part-time employment, other studies show that many of them live transition periods in their careers by moving to a lower employment in terms of quality, responsibility and / or compensation (Newel and Joshi, 1996), or simply lose their jobs (Desai and Waite, 1991, Rösen and Sunström, 1996, Wetzels, 1999). Many studies have tried to take into account the endogeneity potential of fertility variables and labor supply; they led to three sets of results. If the first group consists of studies tend to confirm the negative effect thesis of fertility on labor supply (Smith-Lovin and Tickamyer, 1978), the other two tend to disprove this thesis. Indeed, some studies have led to a reduction of this negative effect (Waite and Stolzenberg, 1976) and this broadly without this effect disappears (Chevalier and Viitanen, 2001). The third study group says the disappearance of the negative effect in favor of a positive effect. (Chevalier and Viitanen 2001) conclude that not only the negative effect is of short duration, but in the long term, giving birth during adolescence increases the labor supply levels, wages and experience reducing the likelihood live in poverty. In this study, it does not interest income from the labor market but rather the process that takes place upstream, that is to say, the integration into the labor market. It is therefore in this work to analyze the share determinants of men and women participation in economic activity and secondly to determine the role of individual characteristics in the tenure choice. We have structured the work into three parts; the first is the labor supply analysis, the second is labor demand analysis and the

3
third door on the labor market functioning by focusing on causes of dysfunction between supply and demand for labor. 1. Situation of work market in Algeria Before any analysis of the labor market, it is important to begin by presenting the main indicators: participation rates, unemployment rates and occupancy rates. Table 1: Major indicators of labor market in 2010
Male Female Total Participation rates in the labor force (participation rate) 15 years and over 68,9 14,2 41,7 15-24 years 46,5 8,9 28,2 Employment Population Ratio 15 years and over 63,3 11,5 37,6 15-24 years 37,8 5,6 22,1 25 and over 74,3 13,8 44 Unemployment rate All 8,1 19,1 10 Youth (16-24 years) 18,6 37,4 21,5 Adults (25 years +) 5,4 15 7,1 Unemployment rate by educational level Uneducated 1,7 2,7 1,9 Primary 7,5 8 7,6 Middle 10,5 12,8 10,7 Secondary 7 17,2 8,9 Higher 10,4 33,3 20,3 Unemployment rate by graduation No diploma 7,2 7,7 7,3 Graduated vocational training 10,5 20,2 12,5 Graduated higher education 11,1 33,6 21,4 All 8,1 19,1 10 % Of youth aged 15-24 in either the workforce or school 11,3 40 25,3
Source: Household Labor Force Survey 2010 (NOS) The first conclusion that emerges from the table 1 is the low participation of women in the labor market; the participation rate of women aged from 15 and over is 14.2%. The second conclusion is that the employment rate is relatively low, less than 38% of 15 years and older population, despite the growth of employment rate in recent years it has not sufficient impact to boost the labor market. The third finding is that the young people of 15 to 24 years who are the most affect from this situation of the labor market; the rate of youth unemployment is three times higher than adults. The situation is more complex for women; unemployment affects more women than men, the unemployment rate for women is 2.35 times higher than that of men. This brings us to say that there is a double discrimination, discrimination on the integration of youth into the labor market and greater discrimination against women. Unemployment affects more graduates. The unemployment rate for higher education graduates is 20.3%, this means that one graduate in five is unemployed after leaving university. The proportion is higher for girls, where one girl of 3 found the unemployed against one boy of ten. Another more dramatic reality is that 25.3% of Youth so one over four are neither in the labor force nor in school. This proportion is higher for girls, 40% of girls are neither in the labor force nor school against 11.3% for boys.
4
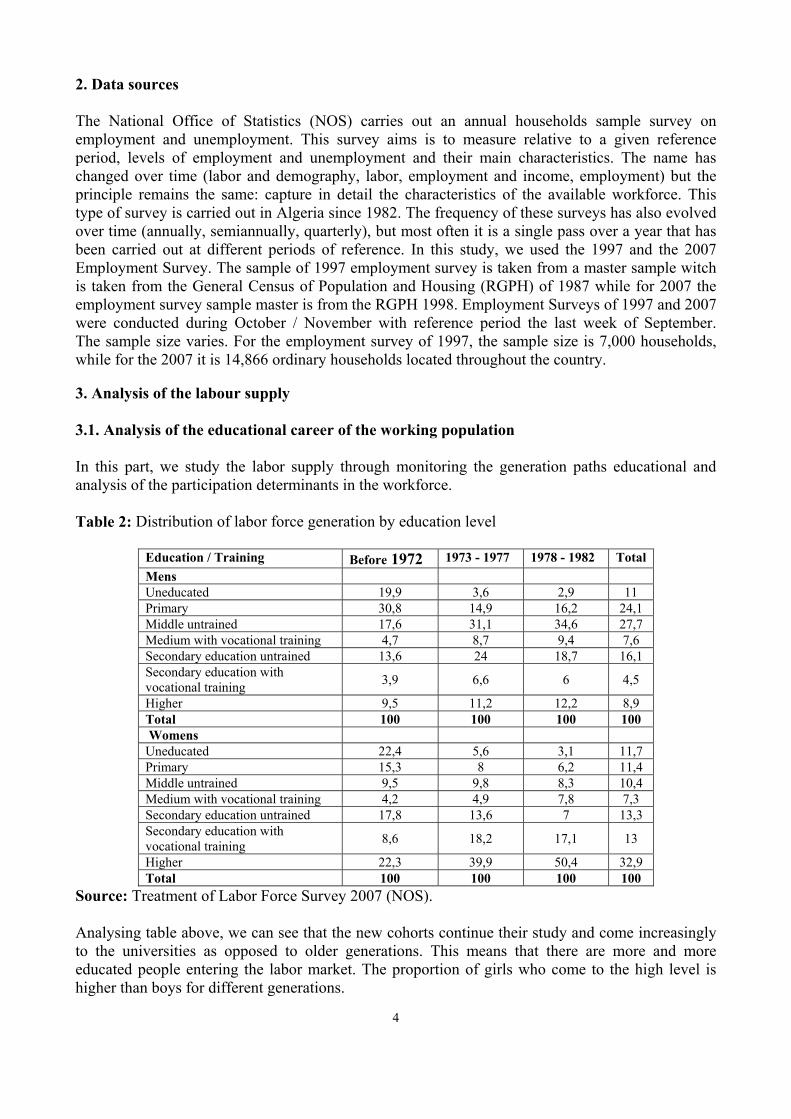
2. Data sources The National Office of Statistics (NOS) carries out an annual households sample survey on employment and unemployment. This survey aims is to measure relative to a given reference period, levels of employment and unemployment and their main characteristics. The name has changed over time (labor and demography, labor, employment and income, employment) but the principle remains the same: capture in detail the characteristics of the available workforce. This type of survey is carried out in Algeria since 1982. The frequency of these surveys has also evolved over time (annually, semiannually, quarterly), but most often it is a single pass over a year that has been carried out at different periods of reference. In this study, we used the 1997 and the 2007 Employment Survey. The sample of 1997 employment survey is taken from a master sample witch is taken from the General Census of Population and Housing (RGPH) of 1987 while for 2007 the employment survey sample master is from the RGPH 1998. Employment Surveys of 1997 and 2007 were conducted during October / November with reference period the last week of September. The sample size varies. For the employment survey of 1997, the sample size is 7,000 households, while for the 2007 it is 14,866 ordinary households located throughout the country. 3. Analysis of the labour supply 3.1. Analysis of the educational career of the working population In this part, we study the labor supply through monitoring the generation paths educational and analysis of the participation determinants in the workforce. Table 2: Distribution of labor force generation by education level
Education / Training Before 1972 1973 - 1977 1978 - 1982 Total Mens Uneducated 19,9 3,6 2,9 11 Primary 30,8 14,9 16,2 24,1 Middle untrained 17,6 31,1 34,6 27,7 Medium with vocational training 4,7 8,7 9,4 7,6 Secondary education untrained 13,6 24 18,7 16,1 Secondary education with vocational training 3,9 6,6 6 4,5
Higher 9,5 11,2 12,2 8,9 Total 100 100 100 100 Womens Uneducated 22,4 5,6 3,1 11,7 Primary 15,3 8 6,2 11,4 Middle untrained 9,5 9,8 8,3 10,4 Medium with vocational training 4,2 4,9 7,8 7,3 Secondary education untrained 17,8 13,6 7 13,3 Secondary education with vocational training 8,6 18,2 17,1 13
Higher 22,3 39,9 50,4 32,9 Total 100 100 100 100
Source: Treatment of Labor Force Survey 2007 (NOS). Analysing table above, we can see that the new cohorts continue their study and come increasingly to the universities as opposed to older generations. This means that there are more and more educated people entering the labor market. The proportion of girls who come to the high level is higher than boys for different generations.

5
3.2. Analysis of educational cohort background (1978-1982) The following table shows the educational cohort background, it is those born between 1978 and 1982. In 2007, they are aged between 25 and 29 years. Table 3: Educational background of the generation from 1978 to 1982 Number in thousands
Output Rate Rate of passage Staff
Output
Followed vocational training
%
Total 9,091 90,91 3398 309 1 0,39
Primary 17,39 80,87 3089 591 28 4,78
Middle 34,81 52,64 2498 1183 248 20,99
Secondary 22,37 42,21 1315 760 244 32,06
Higher 16,33 555 555 46 8,37
Boys 3,38 96,62 1748 59 0 0
Primary 16,19 83,19 1689 283 14 5,09
Middle 42,85 46,69 1405 749 157 20,92
Secondary 23,80 36,59 656 416 98 23,68
Higher 13,73 240 240 13 5,42
Girls 15,14 84,86 1651 250 1 0,48
Primary 18,59 78,02 1401 307 14 4,50
Middle 26,29 60,29 1093 434 92 21,10
Secondary 20,84 47,80 659 344 145 42,17
Higher 19,08 315 315 33 10,63
Source: Treatment of Labor Force Survey 2007 (NOS).
Before starting, it is important to note that since higher education reform in 1971, we observed an exponential growth in numbers of academics. Currently, the number of enrolled students in universities is more than 1.2 million students and the graduate number is 150 thousand graduates trained by the Algerian universities. On this generation of 3.4 million people, more than 9% had never attended school. The proportion of girls who have never attended school is higher (15.14%) than boys (3.38%), 16.33% come to the next level, or one over six, so there is a very high attrition throughout the school cycle. The loss is greater for boys than for girls. In fact, for boys those arriving at the top level are 13.73% against 19% for girls. This means that over 83% leave without diploma (More than 86% for boys and 81% for girls). For those who were enrolled but did not reach the higher level, more than 79% did not follow vocational training after leaving school. This proportion is 81.4% for boys and 76.8% for girls. From these results, we ask for the future of these people who are excluded from the education system without any qualifications and who do not attend any training after leaving school.
1 These are not in school.
6
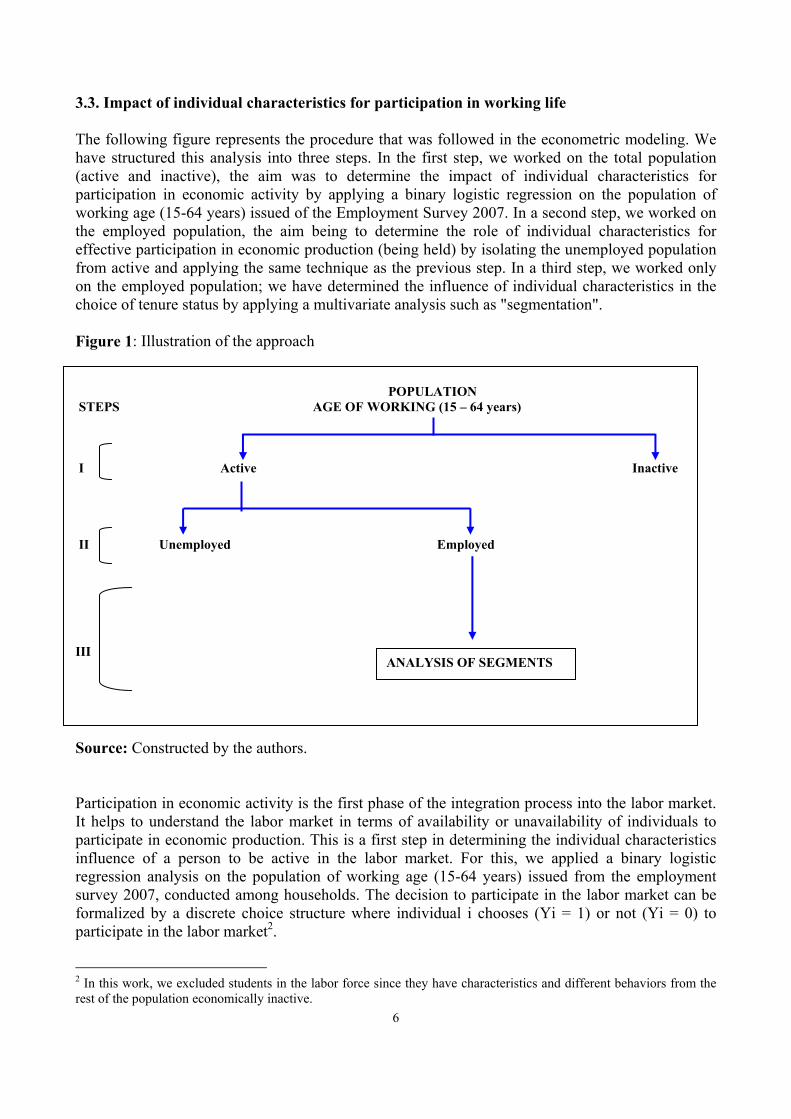
3.3. Impact of individual characteristics for participation in working life The following figure represents the procedure that was followed in the econometric modeling. We have structured this analysis into three steps. In the first step, we worked on the total population (active and inactive), the aim was to determine the impact of individual characteristics for participation in economic activity by applying a binary logistic regression on the population of working age (15-64 years) issued of the Employment Survey 2007. In a second step, we worked on the employed population, the aim being to determine the role of individual characteristics for effective participation in economic production (being held) by isolating the unemployed population from active and applying the same technique as the previous step. In a third step, we worked only on the employed population; we have determined the influence of individual characteristics in the choice of tenure status by applying a multivariate analysis such as "segmentation". Figure 1: Illustration of the approach
POPULATION STEPS AGE OF WORKING (15 – 64 years) I Active Inactive II Unemployed Employed III Source: Constructed by the authors. Participation in economic activity is the first phase of the integration process into the labor market. It helps to understand the labor market in terms of availability or unavailability of individuals to participate in economic production. This is a first step in determining the individual characteristics influence of a person to be active in the labor market. For this, we applied a binary logistic regression analysis on the population of working age (15-64 years) issued from the employment survey 2007, conducted among households. The decision to participate in the labor market can be formalized by a discrete choice structure where individual i chooses (Yi = 1) or not (Yi = 0) to participate in the labor market2.
2 In this work, we excluded students in the labor force since they have characteristics and different behaviors from the rest of the population economically inactive.
ANALYSIS OF SEGMENTS
7
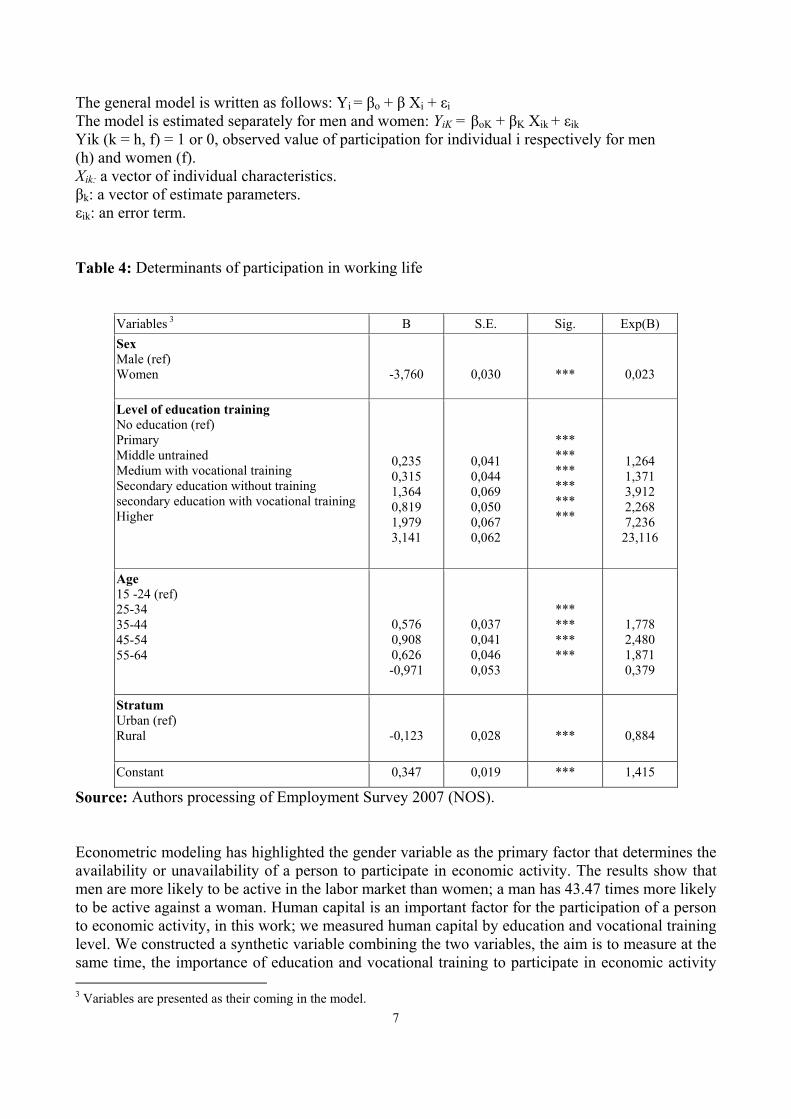
The general model is written as follows: Yi = βo + β Xi + εi The model is estimated separately for men and women: YiK = βoK + βK Xik + εik Yik (k = h, f) = 1 or 0, observed value of participation for individual i respectively for men (h) and women (f). Xik: a vector of individual characteristics. βk: a vector of estimate parameters. εik: an error term. Table 4: Determinants of participation in working life
Variables 3 B S.E. Sig. Exp(B) Sex Male (ref) Women
-3,760
0,030
***
0,023
Level of education training No education (ref) Primary Middle untrained Medium with vocational training Secondary education without training secondary education with vocational training Higher
0,235 0,315 1,364 0,819 1,979 3,141
0,041 0,044 0,069 0,050 0,067 0,062
*** *** *** *** *** ***
1,264 1,371 3,912 2,268 7,236 23,116
Age 15 -24 (ref) 25-34 35-44 45-54 55-64
0,576 0,908 0,626 -0,971
0,037 0,041 0,046 0,053
*** *** *** ***
1,778 2,480 1,871 0,379
Stratum Urban (ref) Rural
-0,123
0,028
***
0,884
Constant 0,347 0,019 *** 1,415
Source: Authors processing of Employment Survey 2007 (NOS). Econometric modeling has highlighted the gender variable as the primary factor that determines the availability or unavailability of a person to participate in economic activity. The results show that men are more likely to be active in the labor market than women; a man has 43.47 times more likely to be active against a woman. Human capital is an important factor for the participation of a person to economic activity, in this work; we measured human capital by education and vocational training level. We constructed a synthetic variable combining the two variables, the aim is to measure at the same time, the importance of education and vocational training to participate in economic activity 3 Variables are presented as their coming in the model.
8
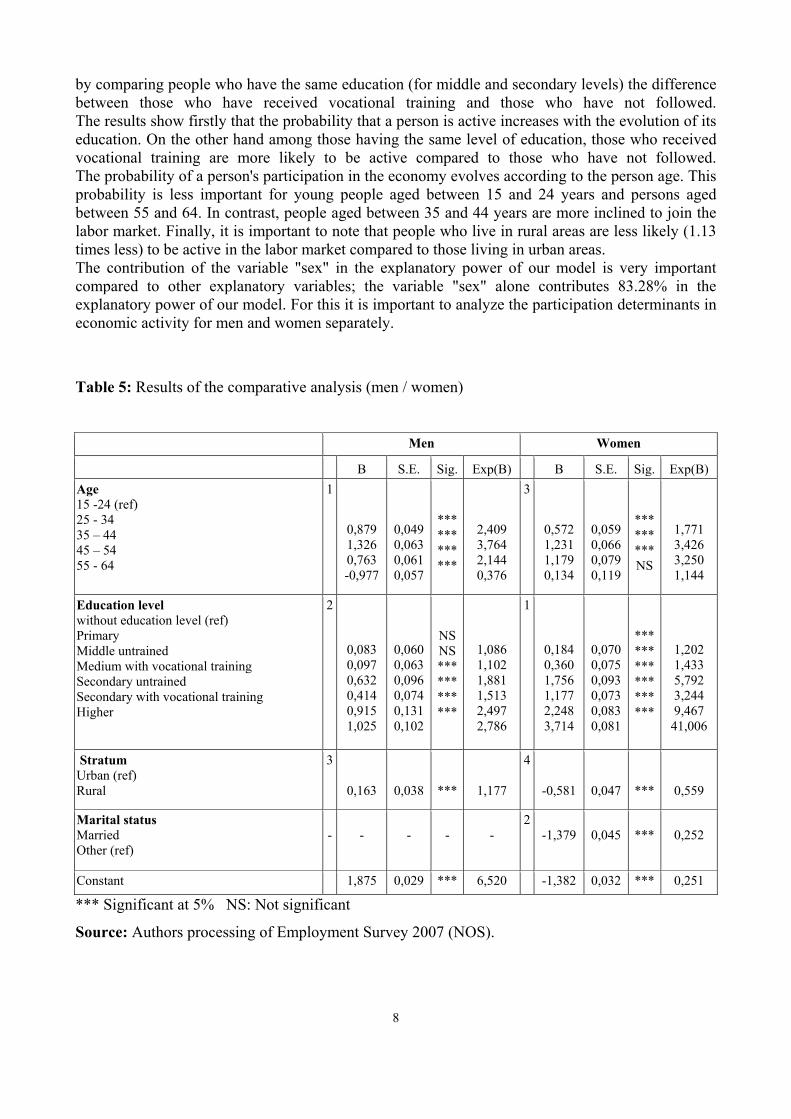
by comparing people who have the same education (for middle and secondary levels) the difference between those who have received vocational training and those who have not followed. The results show firstly that the probability that a person is active increases with the evolution of its education. On the other hand among those having the same level of education, those who received vocational training are more likely to be active compared to those who have not followed. The probability of a person's participation in the economy evolves according to the person age. This probability is less important for young people aged between 15 and 24 years and persons aged between 55 and 64. In contrast, people aged between 35 and 44 years are more inclined to join the labor market. Finally, it is important to note that people who live in rural areas are less likely (1.13 times less) to be active in the labor market compared to those living in urban areas. The contribution of the variable "sex" in the explanatory power of our model is very important compared to other explanatory variables; the variable "sex" alone contributes 83.28% in the explanatory power of our model. For this it is important to analyze the participation determinants in economic activity for men and women separately. Table 5: Results of the comparative analysis (men / women) Men Women
B S.E. Sig. Exp(B) B S.E. Sig. Exp(B) Age 15 -24 (ref) 25 - 34 35 – 44 45 – 54 55 - 64
1
0,879 1,326 0,763 -0,977
0,049 0,063 0,061 0,057
*** *** *** ***
2,409 3,764 2,144 0,376
3
0,572 1,231 1,179 0,134
0,059 0,066 0,079 0,119
*** *** *** NS
1,771 3,426 3,250 1,144
Education level without education level (ref) Primary Middle untrained Medium with vocational training Secondary untrained Secondary with vocational training Higher
2
0,083 0,097 0,632 0,414 0,915 1,025
0,060 0,063 0,096 0,074 0,131 0,102
NS NS *** *** *** ***
1,086 1,102 1,881 1,513 2,497 2,786
1
0,184 0,360 1,756 1,177 2,248 3,714
0,070 0,075 0,093 0,073 0,083 0,081
*** *** *** *** *** ***
1,202 1,433 5,792 3,244 9,467 41,006
Stratum Urban (ref) Rural
3
0,163
0,038
***
1,177
4
-0,581
0,047
***
0,559
Marital status Married Other (ref)
-
-
-
-
-
2 -1,379
0,045
***
0,252
Constant 1,875 0,029 *** 6,520 -1,382 0,032 *** 0,251
*** Significant at 5% NS: Not significant
Source: Authors processing of Employment Survey 2007 (NOS).
9
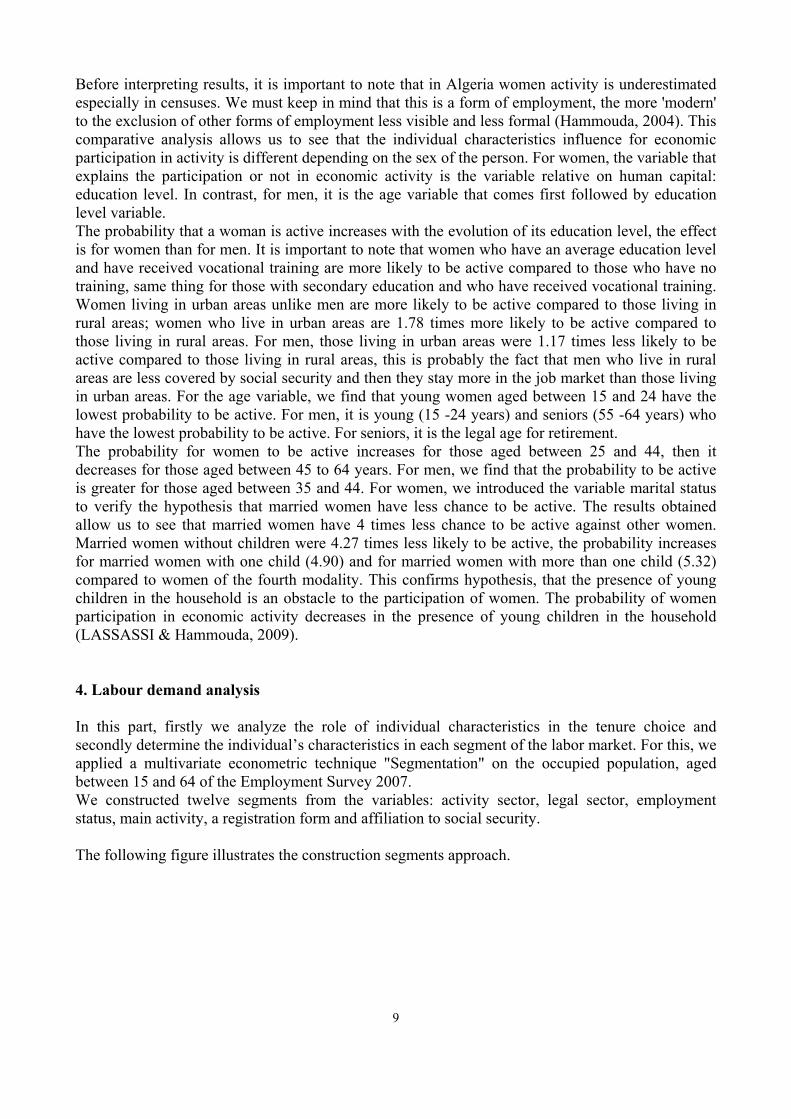
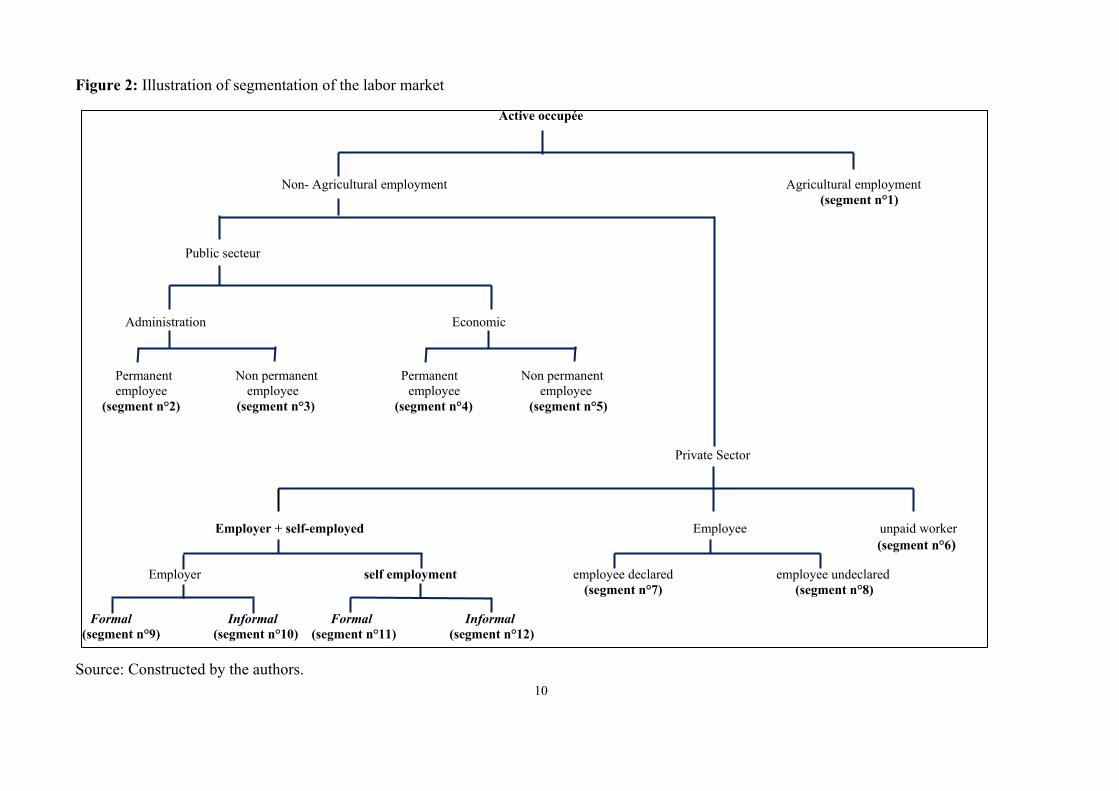
Before interpreting results, it is important to note that in Algeria women activity is underestimated especially in censuses. We must keep in mind that this is a form of employment, the more 'modern' to the exclusion of other forms of employment less visible and less formal (Hammouda, 2004). This comparative analysis allows us to see that the individual characteristics influence for economic participation in activity is different depending on the sex of the person. For women, the variable that explains the participation or not in economic activity is the variable relative on human capital: education level. In contrast, for men, it is the age variable that comes first followed by education level variable. The probability that a woman is active increases with the evolution of its education level, the effect is for women than for men. It is important to note that women who have an average education level and have received vocational training are more likely to be active compared to those who have no training, same thing for those with secondary education and who have received vocational training. Women living in urban areas unlike men are more likely to be active compared to those living in rural areas; women who live in urban areas are 1.78 times more likely to be active compared to those living in rural areas. For men, those living in urban areas were 1.17 times less likely to be active compared to those living in rural areas, this is probably the fact that men who live in rural areas are less covered by social security and then they stay more in the job market than those living in urban areas. For the age variable, we find that young women aged between 15 and 24 have the lowest probability to be active. For men, it is young (15 -24 years) and seniors (55 -64 years) who have the lowest probability to be active. For seniors, it is the legal age for retirement. The probability for women to be active increases for those aged between 25 and 44, then it decreases for those aged between 45 to 64 years. For men, we find that the probability to be active is greater for those aged between 35 and 44. For women, we introduced the variable marital status to verify the hypothesis that married women have less chance to be active. The results obtained allow us to see that married women have 4 times less chance to be active against other women. Married women without children were 4.27 times less likely to be active, the probability increases for married women with one child (4.90) and for married women with more than one child (5.32) compared to women of the fourth modality. This confirms hypothesis, that the presence of young children in the household is an obstacle to the participation of women. The probability of women participation in economic activity decreases in the presence of young children in the household (LASSASSI & Hammouda, 2009). 4. Labour demand analysis In this part, firstly we analyze the role of individual characteristics in the tenure choice and secondly determine the individual’s characteristics in each segment of the labor market. For this, we applied a multivariate econometric technique "Segmentation" on the occupied population, aged between 15 and 64 of the Employment Survey 2007. We constructed twelve segments from the variables: activity sector, legal sector, employment status, main activity, a registration form and affiliation to social security. The following figure illustrates the construction segments approach.
10
Figure 2: Illustration of segmentation of the labor market
Active occupée
Non- Agricultural employment Agricultural employment (segment n°1)
Public secteur
Administration Economic
Permanent Non permanent Permanent Non permanent employee employee employee employee (segment n°2) (segment n°3) (segment n°4) (segment n°5) Private Sector
Employer + self-employed Employee unpaid worker (segment n°6) Employer self employment employee declared employee undeclared (segment n°7) (segment n°8) Formal Informal Formal Informal (segment n°9) (segment n°10) (segment n°11) (segment n°12) Source: Constructed by the authors.

11
4.1. Econometric modeling results The results of this analysis allowed us to say that education is the most important factor in the choice of tenure. Overall, we find that young men aged between 15 and 29 years with an education level below secondary level (no education, primary and medium) are more in the segments "agricultural employment" and "wage undeclared. They are more in agricultural employment for those living in rural areas. For those living in urban areas, they are more in the segment "wage undeclared. For women with the same profile, we find they are more in the segments "agricultural employment", "informal self-employment" and "unpaid worker". They are more in agricultural employment for those living in rural areas. For those living in urban areas, they are more in the segment "informal self-employment" and the " unpaid worker ". However, for persons aged 30 and over with secondary education and higher education, they are more in the segments "public economy" and "administration" for both men and women. Nevertheless, it is important to note that the weight of women in the segment "administration" is more important than men. In contrast, men are more in the economic public segment than women. In trying to detail the results, we find that: Men with no education whatever their age are more occupied in the agricultural segment, the more they advance in age and less in this segment are primarily for the benefit segments undeclared salaries, informal self-employment. However, uneducated women aged fewer than 25 are more in the segment “agricultural sector”. Those aged 25 and older are in the segment “informal employment”. People with primary education aged between 15 and 19 years living in urban areas as opposed to rural areas (which are in the segment “agricultural employment”) are more in the segment “salaried undeclared”. Men with primary aged between 20 and 24 are in segments “agricultural employment” and “undeclared salaries”. Women with the same profile are in informal self-employment and segments homemaker. For men with the same level of education aged 25 and over are in segments undeclared wage employment in agriculture and unlike women who are in informal employment segment. People with average educational level between 15 and 19 years living in urban areas as opposed to rural areas (which are in the “agricultural employment” segment) are more in the salaried undeclared segment. Men aged between 20 and 24 are more in the salaried undeclared segment unlike women who are in informal employment segment. People between 25 and 29 are in the undeclared salaries segment regardless of their living environment (urban / rural). People aged 30 and older are in the segment administration. The weight of women in this segment is more important than men. Men with high school aged between 15 and 19 years as opposed to women (who are in the informal self-employment segment) are in the agricultural employment segment. People between 20 and 24 living in urban areas as opposed to rural areas (which are in the “administration” segment due to the existence of more opportunities) are in the wage undeclared segment. Both men and women aged 25 and older are in the administration segment (more women). Finally, people aged between 20 and 24 years they lived in an urban or rural area are more in the administration segment (more for rural). For both men and women aged 25 and over, they are in the government segment but the number of women is greater in this segment than men. 4.2. Employment trends analysis by segments The following table illustrates changes in employment between 1997 and 2007 for different segments of the labor market.
12
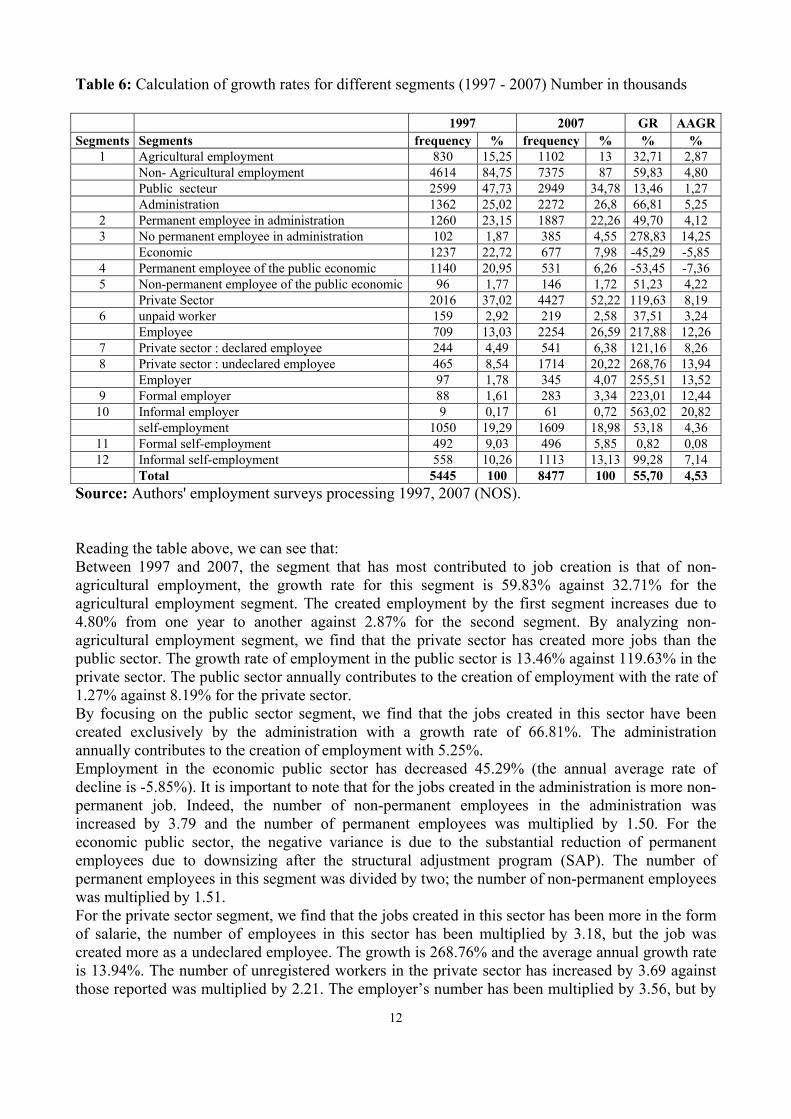
Table 6: Calculation of growth rates for different segments (1997 - 2007) Number in thousands
Source: Authors' employment surveys processing 1997, 2007 (NOS). Reading the table above, we can see that: Between 1997 and 2007, the segment that has most contributed to job creation is that of non-agricultural employment, the growth rate for this segment is 59.83% against 32.71% for the agricultural employment segment. The created employment by the first segment increases due to 4.80% from one year to another against 2.87% for the second segment. By analyzing non-agricultural employment segment, we find that the private sector has created more jobs than the public sector. The growth rate of employment in the public sector is 13.46% against 119.63% in the private sector. The public sector annually contributes to the creation of employment with the rate of 1.27% against 8.19% for the private sector. By focusing on the public sector segment, we find that the jobs created in this sector have been created exclusively by the administration with a growth rate of 66.81%. The administration annually contributes to the creation of employment with 5.25%. Employment in the economic public sector has decreased 45.29% (the annual average rate of decline is -5.85%). It is important to note that for the jobs created in the administration is more non-permanent job. Indeed, the number of non-permanent employees in the administration was increased by 3.79 and the number of permanent employees was multiplied by 1.50. For the economic public sector, the negative variance is due to the substantial reduction of permanent employees due to downsizing after the structural adjustment program (SAP). The number of permanent employees in this segment was divided by two; the number of non-permanent employees was multiplied by 1.51. For the private sector segment, we find that the jobs created in this sector has been more in the form of salarie, the number of employees in this sector has been multiplied by 3.18, but the job was created more as a undeclared employee. The growth is 268.76% and the average annual growth rate is 13.94%. The number of unregistered workers in the private sector has increased by 3.69 against those reported was multiplied by 2.21. The employer’s number has been multiplied by 3.56, but by
1997 2007 GR AAGRSegments Segments frequency % frequency % % %
1 Agricultural employment 830 15,25 1102 13 32,71 2,87 Non- Agricultural employment 4614 84,75 7375 87 59,83 4,80 Public secteur 2599 47,73 2949 34,78 13,46 1,27 Administration 1362 25,02 2272 26,8 66,81 5,25 2 Permanent employee in administration 1260 23,15 1887 22,26 49,70 4,12 3 No permanent employee in administration 102 1,87 385 4,55 278,83 14,25 Economic 1237 22,72 677 7,98 -45,29 -5,85 4 Permanent employee of the public economic 1140 20,95 531 6,26 -53,45 -7,36 5 Non-permanent employee of the public economic 96 1,77 146 1,72 51,23 4,22 Private Sector 2016 37,02 4427 52,22 119,63 8,19 6 unpaid worker 159 2,92 219 2,58 37,51 3,24 Employee 709 13,03 2254 26,59 217,88 12,26 7 Private sector : declared employee 244 4,49 541 6,38 121,16 8,26 8 Private sector : undeclared employee 465 8,54 1714 20,22 268,76 13,94 Employer 97 1,78 345 4,07 255,51 13,52 9 Formal employer 88 1,61 283 3,34 223,01 12,44
10 Informal employer 9 0,17 61 0,72 563,02 20,82 self-employment 1050 19,29 1609 18,98 53,18 4,36
11 Formal self-employment 492 9,03 496 5,85 0,82 0,08 12 Informal self-employment 558 10,26 1113 13,13 99,28 7,14 Total 5445 100 8477 100 55,70 4,53

13
distinguishing between formal and informal employers, we find that the employer’s number has involved more informal than formal employers. Indeed, the number of informal employers has increased by 6.63 but for formal employers it was multiplied by 3.23. For self-employment, we find that their number was multiplied by 1.53. The number of informal self-employed has developed more than formal self-employed; the first has been multiplied by 1.01 and the second by 1.99. The analysis4 conducted on the population with higher educational level, we can see that the segment where the workforce has changed in this period is "non-permanent employees in the administration” segment. The number of jobs in this segment was multiplied by 14.83; this is due to different active policies of labor market. We therefore find that these programs have not enabled the integration of graduates in significant numbers both in the economic public sector nor the private sector and even in the administration sector; they are more in employee segment as non-permanent than permanent because of their status. This analysis of employment trends in segments between 1997 and 2007, allows us to reach to the conclusion that the employment situation in Algeria in this period has deteriorated in terms of job security or decent work as defined by the ILO. Indeed, we found that: the public sector contributes little to job creation and administration is the biggest contributor in creating non-permanent jobs, or it was in a preceding period the guarantor of sheltered employment. Informal firms have reached significant proportions in the economic fabric of countries as well as unregistered jobs. 5. Operation analysis of the labor market 5.1. Impact of individual characteristics for participation in economic activity In this step, we worked only on active population, the purpose being to determine the individual’s characteristic effect of family membership for the occupied population. For this, we isolated the unemployed population from active and we have applied the same technique used in the first step. The general model is written as follows: Yi = βo + β Xi + εi Yi = 1 if the individual is employed (occupied) or Yi = 0 if the individual has no market activity (unemployed). Xik: a vector of individual characteristics. βk : a vector of estimate parameters. εik: an error term.
4 See table 1 annexe I.

14
Table 7: Probability of belonging to the employed category vs. unemployed
B S.E. Sig. Exp(B) Age 15 -24 (ref) 25 - 34 35 – 44 45 – 54 55 – 64
0,653 1,752 2,320 2,804
0,042 0,062 0,098 0,206
*** *** *** ***
1,922 5,767 10,181 16,503
Vocational Training Yes Public School Yes Private school No (ref)
-0,455 -0,427
0,049 0,109
*** ***
0,634 0,653
Education Level Illiterate Primary Medium Secondary Superior (ref)
0,707 0,253 0,229 0,280
0,109 0,069 0,063 0,065
*** *** *** ***
2,027 1,288 1,258 1,323
Sex Men (ref) Women
-0,288
0,051
***
0,750 Constant 2,215 0,060 *** 9,161
*** Significant at the 5 Source: Authors processing of Employment Survey 2007 (NOS). Econometric modeling has highlighted the age variable as the primary factor that determines to be occupied in the labor market. All things being equal, young people aged between 15 and 24 years are most at risk to be unemployed. The probability of being employed increases with age, this probability is 1.92 times higher for people aged between 25 and 34 years, it increases for those aged between 35 and 44 (5.76) for those aged between 45 and 54 (10,18) and for those aged between 55 and 64 years compared with people aged between 15 and 24. Individuals who have received vocational training either in a training public center or private are more at risk of being unemployed compared to those who have not received vocational training. This probability is 1.57 times less for those who were trained in a public center and it is 1.53 times less for those who have completed training in a private center. The variable education level allows us to see that more person educated level increases less he has chance to be employed!
15
Table 8: Comparative analysis results (men / women)
Men Women B S.E. Sig. Exp(B) B S.E. Sig. Exp(B)
Age 15 -24 (ref) 25 - 34 35 – 44 45 – 54 55 - 64
1
0,582 1,661 2,242 2,761
0,0470,0690,1050,211
*** *** *** ***
1,790 5,262 9,412 15,822
1
1,021 2,154 2,878 3,515
0,099 0,145 0,295 1,014
*** *** *** ***
2,776 8,619 17,774 33,615
Vocational Training Yes No (ref)
2 -0,292
0,056
***
0,747
2 -0,823
0,102
***
0,439
Stratum Urban (ref) Rural
3
0,150
0,044
***
1,161
4
-0,220
0,101
***
0,803 Education Level Illiterate (ref) Primary Medium Secondary Higher
4
-0,340 -0,379 -0,219 -0,394
0,1120,1090,1140,126
*** *** *** ***
0,711 0,685 0,803 0,674
3
-0,825 -0,870 -1,229 -1,606
0,328 0,312 0,307 0,300
*** *** *** ***
0,438 0,419 0,292 0,201
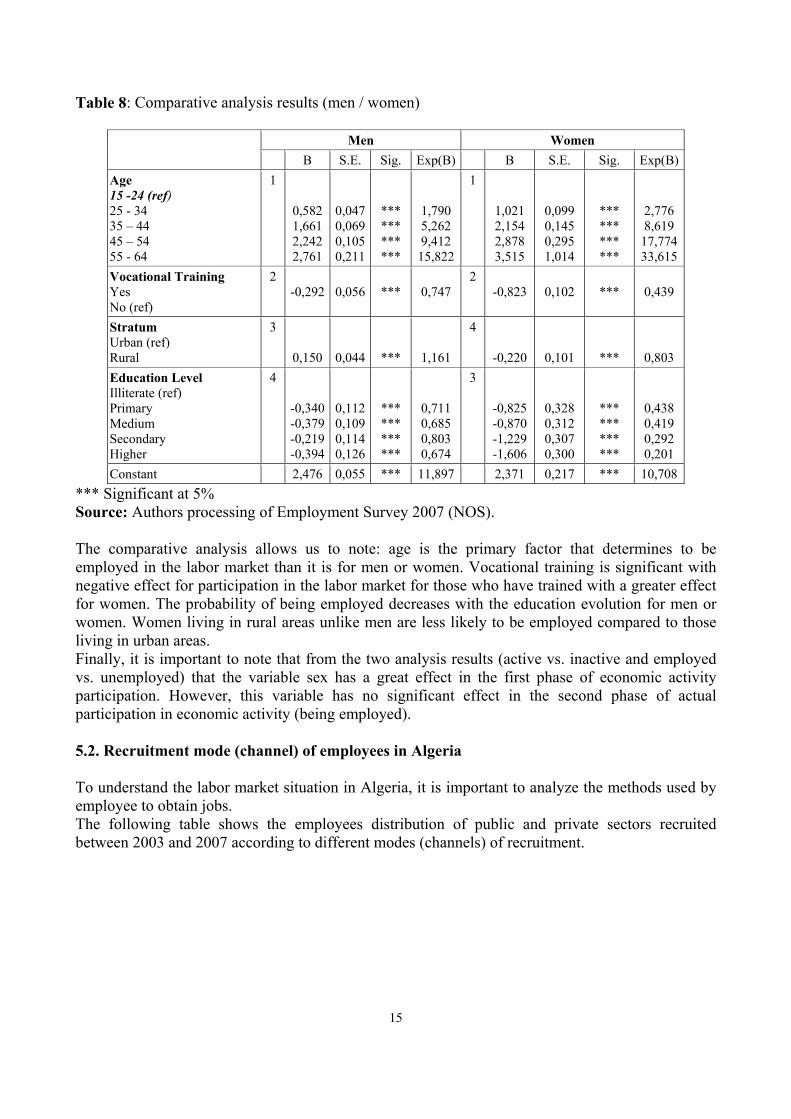
Constant 2,476 0,055 *** 11,897 2,371 0,217 *** 10,708*** Significant at 5% Source: Authors processing of Employment Survey 2007 (NOS). The comparative analysis allows us to note: age is the primary factor that determines to be employed in the labor market than it is for men or women. Vocational training is significant with negative effect for participation in the labor market for those who have trained with a greater effect for women. The probability of being employed decreases with the education evolution for men or women. Women living in rural areas unlike men are less likely to be employed compared to those living in urban areas. Finally, it is important to note that from the two analysis results (active vs. inactive and employed vs. unemployed) that the variable sex has a great effect in the first phase of economic activity participation. However, this variable has no significant effect in the second phase of actual participation in economic activity (being employed). 5.2. Recruitment mode (channel) of employees in Algeria To understand the labor market situation in Algeria, it is important to analyze the methods used by employee to obtain jobs. The following table shows the employees distribution of public and private sectors recruited between 2003 and 2007 according to different modes (channels) of recruitment.
16
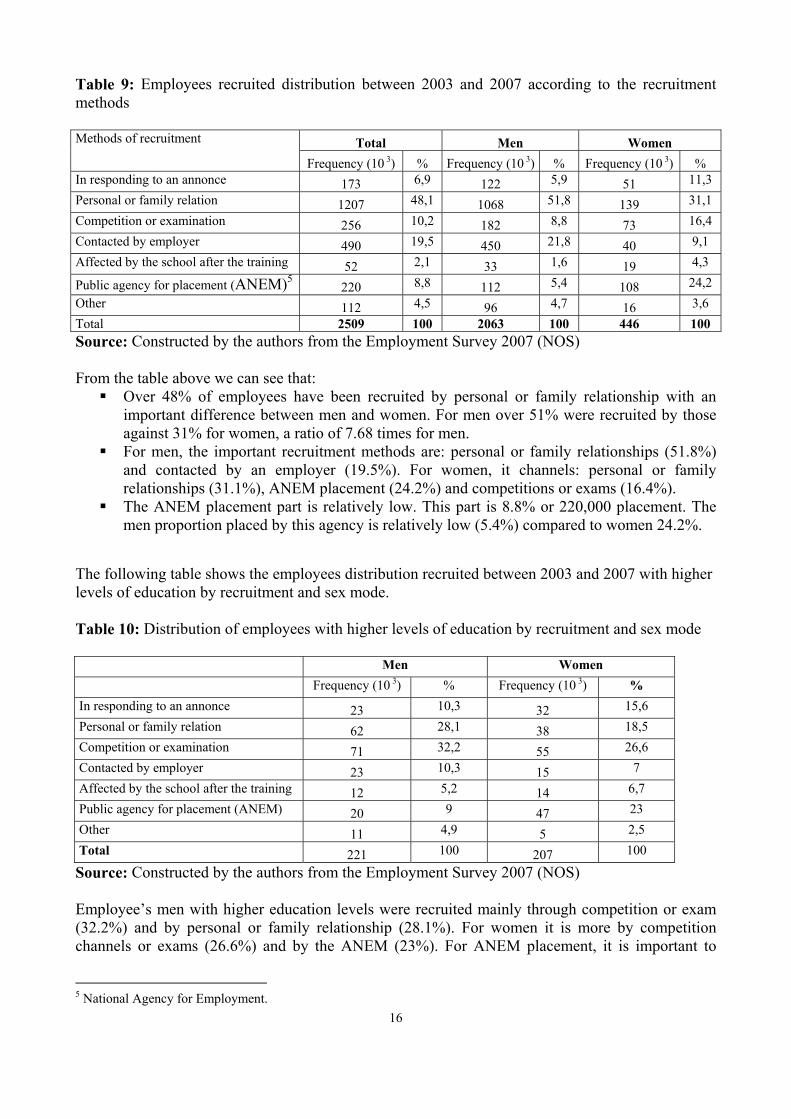
Table 9: Employees recruited distribution between 2003 and 2007 according to the recruitment methods Methods of recruitment Total Men Women
Frequency (10 3) % Frequency (10 3) % Frequency (10 3) % In responding to an annonce 173 6,9 122 5,9 51 11,3 Personal or family relation 1207 48,1 1068 51,8 139 31,1 Competition or examination 256 10,2 182 8,8 73 16,4 Contacted by employer 490 19,5 450 21,8 40 9,1 Affected by the school after the training 52 2,1 33 1,6 19 4,3
Public agency for placement (ANEM)5 220 8,8 112 5,4 108 24,2 Other 112 4,5 96 4,7 16 3,6 Total 2509 100 2063 100 446 100 Source: Constructed by the authors from the Employment Survey 2007 (NOS) From the table above we can see that:
Over 48% of employees have been recruited by personal or family relationship with an important difference between men and women. For men over 51% were recruited by those against 31% for women, a ratio of 7.68 times for men.
For men, the important recruitment methods are: personal or family relationships (51.8%) and contacted by an employer (19.5%). For women, it channels: personal or family relationships (31.1%), ANEM placement (24.2%) and competitions or exams (16.4%).
The ANEM placement part is relatively low. This part is 8.8% or 220,000 placement. The men proportion placed by this agency is relatively low (5.4%) compared to women 24.2%.
The following table shows the employees distribution recruited between 2003 and 2007 with higher levels of education by recruitment and sex mode. Table 10: Distribution of employees with higher levels of education by recruitment and sex mode Men Women Frequency (10 3) % Frequency (10 3) % In responding to an annonce 23 10,3 32 15,6 Personal or family relation 62 28,1 38 18,5 Competition or examination 71 32,2 55 26,6 Contacted by employer 23 10,3 15 7 Affected by the school after the training 12 5,2 14 6,7 Public agency for placement (ANEM) 20 9 47 23 Other 11 4,9 5 2,5 Total 221 100 207 100
Source: Constructed by the authors from the Employment Survey 2007 (NOS) Employee’s men with higher education levels were recruited mainly through competition or exam (32.2%) and by personal or family relationship (28.1%). For women it is more by competition channels or exams (26.6%) and by the ANEM (23%). For ANEM placement, it is important to
5 National Agency for Employment.

17
know: what legal sector and in which labor market segments these placement have been made? The following table shows the employees hired distribution between 2003 and 2007 with higher education levels by mode of recruitment, legal sector, the labor market segments and gender. Table 11: Distribution of ANEM investment for employees with a higher level Total Men Women Variables Terms
Frequency
(10 3) % Frequency
(10 3) % Frequency
(10 3) % Legal sector
Public 64 94,6 17 87,2 46 97,7Private 4 5,4 3 12,8 1 2,3 Total 67 100 20 100 47 100
Segments of the labor market
Permanent employees in the public administration 9
12,9 1 3,9 8 16,6
Non-permanent employees in the public administration 46
68,3 11 55,2 35 73,7
Permanent employees in public economic enterprise 2
3,6 2 8,2 1 1,7
Non-permanent employees in public economic enterprise 7
9,8 4 19,8 3 5,7
Private sector employees 4 5,4 3 12,8 1 2,3 Total 67 100 20 100 47 100
Source: Constructed by the authors from the Employment Survey 2007 (NOS) Almost all (over 94%) of ANEM placements for employees with higher education levels are in the public sector. In administration, over 68% were recruited as non-permanent employees and 13% as permanent employees. In the economic public sector 9.8% were recruited as non-permanent employees and less than 4% as permanent employees. By comparing analysis between men and women we can see that: The proportion of ANEM placements for women with higher educational level is higher in the administration segment either as permanent employees or as non-permanent employees compared to men of the same educational level. For men, the proportions are greater in the other segments: non-permanent employees in administration and non-permanent employees in the economic public sector. These results challenge us on the effectiveness of APLM to support the employability of higher graduates. Indeed, ANEM place little graduates in the private sector (5.4%), it invests more in the public sector but not as permanent employees, which challenges us on the job quality. The following table shows the employees distribution by main occupation and experience. Table 12: Distribution of employees by main occupation and experience Experience Before 1992 1993 - 1997 1998 - 2002 2003 - 2007 Total Senior officials 7,1 13,5 12,1 10,3 9,6 Intellectual and scientific professions 22,5 23,5 33,6 43,5 28,5 Associate professionals 29,5 30,5 35,2 35 31,6 Clerks 14,9 5,7 3 1,5 8,8 Service workers and shop and market 12,5 11,9 4,8 1,6 9,1 Farmers and skilled agricultural and fishery 0,9 1,7 1,9 0,7 1,1 Industrial workers and trades 3,3 2,7 1,1 0,9 2,4 Plant and machinery 1,1 1,1 1,1 0,2 0,9 Laborers and unskilled workers 8,4 9,4 7,1 6,4 8 Total 100 100 100 100 100 Source: Constructed by the authors from the Employment Survey 2007 (ONS)

18
Reading the table above, we can see that the employees recruited before 1992 occupied the following professions: intellectual and scientific profession (43.5%), intermediate profession (35%), senior officials and managers (10.3%). Those who were recruited in the last five years between 2003 and 2007 are less represented in these three profession, the proportions were significantly decreased by cons we find them in administration (14.9%) and personnel (12.5%). This clearly means that there is deterioration in the employment quality for people with a higher level or more precisely a disqualification. Conclusion The youth inclusion in active life is for a long time a recurrent society problem, often lived hard by young people and their families. Despite increasing resources mobilized by the government, the unemployed young people proportion remains in fact permanently important. This situation carried in a context of high tension on the labor market. The labor supply analysis allows us to see that the new cohorts pursue their studies and go more and more universities as opposed to older generations. This means that there are more and more educated people coming to the labor market. On the other hand, men participation in economic activity follows logic quite different from the participation of women. In fact, for men the age is the variable that determines the participation in the labor market, by contrary for women is the education level and vocational training that determine the participation or not in labor market. Closely following an academic or vocational training has a positive impact on women participation rates. The analysis of labor demand we found that: Young people are the most exposed group to insecurity on the job market. Human capital is an important factor in positioning in the various segments of the labor market and improving the job situation. Higher is the educational level of a person and most the job occupied is protected. From these two points, we came to the conclusion that there is discrimination against youth and persons with low educational attainment and even for those with an average level for the protected work occupation. The occupation conditions and position in different segments of the labor market differ significantly by sex. The analysis of employment trends in segments between 1997 and 2007, allows us to reach the conclusion that the employment situation in Algeria during this period had deteriorated in terms of employment security or decent job as defined by the ILO. From the functioning analysis of the labor market, we found that age was the variable that determines first whether or not participation in the labor market. Young people aged between 15 and 24 years are most at risk of unemployment. Individuals who have received vocational training are most at risk of unemployment compared to those not trained. Individuals with education below the average are more likely to be employed compared to those with a medium level. In contrast, those with education level higher than the average are at greater risk of unemployment, this is due to the mismatch between followed training and the request of the labor market. We arrived at the conclusion that there is deterioration in the employment quality for people with a higher level or more precisely a disqualification (unskilling). On the one hand, there are more and more educated people entering the labor market and in the other hand jobs created are increasingly unskilled. This calls into question the whole discourse and politics aimed at improving the young employability entrants to the labor market. This work has enabled us to determine the impact of human capital, the role of other individual factors for participation in the labor market and the individuals occupational choice but it is important to deep on the work taking into account other factors such as: household characteristics, factor earnings and the country macroeconomic context which may affect the employability and individuals occupational choice in a market increasingly segmented. References Becker G. (1993), Human Capital: a Theoretical and Empirical Analysis, Third edition, University of ChicagoPress.
19
Blau D., Robins L. (1988), Child care costs and family labor supply, Review of Economics and Statistics, 70 (3): 374-381. Brilleau A., Roubaud F., Torelli C. (2004), L’emploi, le chômage et les conditions d’activité dans les principales agglomérations de sept Etats membres de l’UEMOA, Document de travail DIAL. DT 2004-06. Chevalier A., Viitanen T.K. (2001), “The Long Run Consequences of Teenage Motherhood in Britain”, Version 51, London School of Economics Working Papers, Hougton, Warwick University. Desai S., Waite L. (1991), “Women’s employment during pregnancy and after the first Birth: Occupational characteristics and work commitment”, American Sociological Review, Working papers, Volume 56, Issue 4. Eicher J.C, (1979), Education et réussite professionnelle- Economie de l’éducation, Economica. Geweke J. (1991), Efficient simulation from the multivariate normal and student-t distribution subject to linear constraints, computing science and statistics: proceedings of the twenty-third symposium on the interface. Computing science and statistics, American statistical Association, pp 571-578. Hammouda N., Lassassi M. (2011), Essai statistique sur le potentiel entrepreneurial en Algérie, Editions IRMC-KARTHALA, pp.35- 72. Hammouda N-E. (2004), Essai d’une typologie des ménages selon leur comportement d’activité, in actes du colloque « genre et marché du travail au Maghreb ; rabat 11 & 12 avril 2003 ». Heckman J.J. (1981), “The Incidental Parameters Problem and the Problem of Initial Conditions in Estimating a Discrete Time-Discrete Data Stochastic Process, in Structural Analysis of Discrete Data”, MIT Press. Heckman J.J. (1974), “Effects of Child Care Programs on Woman’s Work Effort.” Journal of Political Economy. 82, pp 136-169. Hobcraft J., Kiernan K. (2001), “Childhood Poverty, early motherhood and adult social exclusion”. The British Journal of Sociology, Volume 52, issue 3, page 495-517. Hout M. (1978), “The Determinants of Marital Fertility in the United States, 1968-70: Inference from a Dynamic Model”, Demography, May, 1978, 15 (2), pp.132-159 Iacovou, Maria, (2001), Fertility and Female Labour Supply’, Working Papers of the Institute for Social and Economic Research, paper 19. Colchester: University of Essex. Keane M. (1994), A Computationally Practical Simulation Estimator for Panel Data, in Econometrica, Vol 62, pp 95-116. Kuépié M., Nordman C. J., Roubaud F. (2006), « Education and Labour Market Outcomes in Sub-Saharan Africa», Document de Travail DIAL, DT 2006-16. Kouamé A. (1999), Education et Emploi des femmes à Abidjan, Chapitre1- Collection Sociétés Africaines et Diaspora- L’Harmattan. Lachaud J.P. (1998), « Modélisation des déterminants de la pauvreté et marché du travail en Afrique : le cas du Burkina Faso », Document de travail 32, Centre d’Economie du Développement, Université Montesquieu Bordeaux IV. Lassassi M., Hammouda N. (2009), Déterminants de la participation au marché du travail et du choix occupationnel : une analyse micro économétrique appliquée au cas de l’Algérie, GDRI DREEM Working paper. Lassassi M., Hammouda N. (2008), Capital humain, informalité et strate de résidence de l’employeur : quels impacts sur la croissance de l’emploi des PME privées en Algérie ? les cahiers du MECAS, N°4, pp.193-217. Lazear E.P, (1981), Agency, earning profiles, productivity and hours restriction, American Economic Review, volume 71, n°4, pp.606-620. Mincer J. (1974), « Schooling, Experience and Earnings », New York, National Bureau of Economic Research. Newel M., Joshi H.(1986), “The Next Job after the First Baby Occupational Transition Among Women Born in 1946”, Centre for Population Studies, Working paper, 86-3. Perry S. (1988), “Downward occupational mobility and part-time women workers.” Applied Economics, Working paper 20, pp 485-495. Psacharopoulos G., Patrinos H.A. (2004), « Returns to Investment in Education: a Further Update », Education Economics, 12(2), pp 111-134. Schultz T.P. (2004), Evidence of Returns to Schooling in Africa from Household Surveys: Monitoring and Restructuring the Market for Education, Journal of African Economies, 13, AERC Supplement, pp 95-148. Smith-Lovin L., Tickamyer A.K. (1978), “Nonrecursive Models of Labour Fore Participation, Fertility Behaviour and Sex Role Attitudes”, American Sociological Review, 43 (4), pp 541-557. Vernières M. (1997), L’insertion professionnelle: analyse et débats, Editions Economica. Vincens J. (1998), L’insertion professionnelle des jeunes, quelques réflexions théoriques, Formation-emploi, n°61, CEREQ, France, pp 59-72.

20
ANNEX I Table 1: Calculation of growth rates for each segment between 1997 and 2007 (higher education)
1997 2007 Segments Segments Frequency Weight % Frequency Weight % TC TCAM
1 Agricultural employment 7 1,77 1,8 17 1,63 1,63 149,33 9,57 Non-agricultural employment 386 98,23 98,2 1050 98,37 98,37 171,97 10,52 Public Sector 316 80,40 80,4 760 72,36 71,18 140,43 9,17 Administration 204 52,00 52,0 628 82,70 58,87 207,44 11,89 2 Permanent employee in the administration 197 50,07 50,1 516 82,16 48,36 162,29 10,12 3 Non-permanent employee in the administration 8 1,92 1,9 112 17,84 10,50 1383,40 30,96 Economic 112 28,40 28,4 131 17,30 12,31 17,73 1,65 4 Permanent employee of the public economic 107 27,26 27,3 105 79,89 9,84 -2,02 -0,20 5 Non-permanent employee of the public economic 4 1,14 1,1 26 20,11 2,48 491,34 19,45 Private Sector 70 17,83 17,8 290 27,64 27,19 314,19 15,27 6 Unpaid worker 1 0,32 0,3 11 3,87 1,05 801,39 24,59 Employee 26 6,73 6,7 145 49,83 13,55 446,39 18,51 7 Private sector : declared employee 16 4,05 4,0 89 61,67 8,36 460,47 18,81 8 Private sector : undeclared employee 11 2,69 2,7 55 38,33 5,19 425,18 18,04 Employer 18 4,55 4,6 63 43,87 5,94 254,56 13,49 9 Informal employer 1 0,24 0,2 2 2,61 0,16 73,46 5,66
10 Formal employer 17 4,31 4,3 62 97,39 5,79 264,78 13,82 Self-employment 24 6,22 6,2 71 49,04 6,64 189,92 11,23
11 Informal self-employment 8 2,07 2,1 21 30,13 2,00 162,72 10,14 12 Formal self-employment 16 4,15 4,2 50 69,87 4,64 203,47 11,74 Total 393 100 100 1067 100 100 171,56 10,51
Source: Authors' processing of employment surveys, 1997, 2007 (NOS)