A MICROECONOMETRIC EVALUATION OF THE A CTIVE LABOUR M ARKET POLICY IN SWITZERLAND
40
A MICROECONOMETRIC EVALUATION OF THE ACTIVE LABOUR MARKET POLICY IN SWITZERLAND* Michael Gerfin and Michael Lechner In the late 1990s, Switzerland introduced an ambitious active labour market policy (ALMP) encompassing several programmes. We evaluate their effects on the individual employment probability using unusually informative data from administrative records. Using a matching estimator for multiple programmes, we find positive effects for one particular programme unique to the Swiss ALMP. It consists of a wage subsidy for temporary jobs in the regular labour market that would otherwise not be taken up by the unemployed. We also find negative effects for traditional employment programmes operated in sheltered labour markets. For training courses, the results are mixed. In the 1990s, substantial active labour market policies (ALMP) were enacted in many continental European countries. Many policy makers as well as economists consid- ered ALMP as important tools to reduce Europe’s notoriously high levels of unem- ployment, without having to go through the painful side-effects of substantial reforms of the labour markets. Recent evaluation studies surveyed for example by Fay (1996) and Heckman et al. (1999), however, do not appear to develop any consensus whether these hopes are justified. Quite to the contrary, many studies raise serious doubts. In addition, the available data used were typically far from being ideal, adding additional uncertainty about the ‘true’ effect of Europe’s diverse ALMP. After Switzerland experienced a continuous increase in unemployment in the beginning of the 1990s, a revision of the law regulating unemployment insurance and ALMP was enacted in 1997. It expanded ALMP considerably. Furthermore, it made benefit payments conditional on participation in a labour market pro- gramme after being unemployed for more than seven months. This activation principle, in conjunction with compulsory programme participation after some defined duration of unemployment, had previously been introduced in Denmark and since then only in the New Deal in the UK (OECD, 2001). The Swiss ALMP consists of many different training and employment pro- grammes similar to the kind of programmes found in other European countries. * We are grateful to the State Secretariat of Economic Affairs of the Swiss Government (seco) and the Bundesamt fu ¨r Sozialversicherung for providing the data. Financial support from the Swiss National Science Foundation (12-50815.97, Gerfin, and 12-53735.18, Lechner) as well as from seco is gratefully acknowledged. Heidi Steiger, SIAW, provided valuable research assistance. Monica Curti and Jonathan Gast, both seco, were also particularly helpful for many practical details of this study. We are very grateful to David Grubb, Patrick Puhani, the editor Costas Meghir and three anonymous referees of this journal for extensive and very helpful comments on a previous version. A preliminary version of this paper has been presented at the annual meeting of the section on population economics of the German Economic Association in Zurich, 2000, the Conference on Panel Data in Geneva, 2000, the annual meeting of the Swiss Society of Economics and Statistics in Geneva, 2000, as well as at seminars at IZA in Bonn, at Texas A&M, Rice University, the University of Chicago, the University of California at Los Angeles (UCLA), the University of Western Ontario (London), and the CEP at the London School of Economics. We thank participants, in particular Jim Heckman, Guido Imbens, Jeff Smith and Todd Stinebricker, for helpful comments and suggestions. All remaining errors are our own. The Economic Journal, 112 (October), 854–893. Ó Royal Economic Society 2002. Published by Blackwell Publishers, 108 Cowley Road, Oxford OX4 1JF, UK and 350 Main Street, Malden, MA 02148, USA. [ 854 ]
-
Upload
independent -
Category
Documents
-
view
2 -
download
0
Transcript of A MICROECONOMETRIC EVALUATION OF THE A CTIVE LABOUR M ARKET POLICY IN SWITZERLAND
A MICROECONOMETRIC EVALUATION OF THE ACTIVELABOUR MARKET POLICY IN SWITZERLAND*
Michael Gerfin and Michael Lechner
In the late 1990s, Switzerland introduced an ambitious active labour market policy (ALMP)encompassing several programmes. We evaluate their effects on the individual employmentprobability using unusually informative data from administrative records. Using a matchingestimator for multiple programmes, we find positive effects for one particular programmeunique to the Swiss ALMP. It consists of a wage subsidy for temporary jobs in the regular labourmarket that would otherwise not be taken up by the unemployed. We also find negative effectsfor traditional employment programmes operated in sheltered labour markets. For trainingcourses, the results are mixed.
In the 1990s, substantial active labour market policies (ALMP) were enacted in manycontinental European countries. Many policy makers as well as economists consid-ered ALMP as important tools to reduce Europe’s notoriously high levels of unem-ployment, without having to go through the painful side-effects of substantialreforms of the labour markets. Recent evaluation studies surveyed for example by Fay(1996) and Heckman et al. (1999), however, do not appear to develop any consensuswhether these hopes are justified. Quite to the contrary, many studies raise seriousdoubts. In addition, the available data used were typically far from being ideal,adding additional uncertainty about the ‘true’ effect of Europe’s diverse ALMP.
After Switzerland experienced a continuous increase in unemployment in thebeginning of the 1990s, a revision of the law regulating unemployment insuranceand ALMP was enacted in 1997. It expanded ALMP considerably. Furthermore, itmade benefit payments conditional on participation in a labour market pro-gramme after being unemployed for more than seven months. This activationprinciple, in conjunction with compulsory programme participation after somedefined duration of unemployment, had previously been introduced in Denmarkand since then only in the New Deal in the UK (OECD, 2001).
The Swiss ALMP consists of many different training and employment pro-grammes similar to the kind of programmes found in other European countries.
* We are grateful to the State Secretariat of Economic Affairs of the Swiss Government (seco) and theBundesamt fur Sozialversicherung for providing the data. Financial support from the Swiss NationalScience Foundation (12-50815.97, Gerfin, and 12-53735.18, Lechner) as well as from seco is gratefullyacknowledged. Heidi Steiger, SIAW, provided valuable research assistance. Monica Curti and JonathanGast, both seco, were also particularly helpful for many practical details of this study. We are verygrateful to David Grubb, Patrick Puhani, the editor Costas Meghir and three anonymous referees of thisjournal for extensive and very helpful comments on a previous version. A preliminary version of thispaper has been presented at the annual meeting of the section on population economics of the GermanEconomic Association in Zurich, 2000, the Conference on Panel Data in Geneva, 2000, the annualmeeting of the Swiss Society of Economics and Statistics in Geneva, 2000, as well as at seminars at IZA inBonn, at Texas A&M, Rice University, the University of Chicago, the University of California at LosAngeles (UCLA), the University of Western Ontario (London), and the CEP at the London School ofEconomics. We thank participants, in particular Jim Heckman, Guido Imbens, Jeff Smith and ToddStinebricker, for helpful comments and suggestions. All remaining errors are our own.
The Economic Journal, 112 (October), 854–893. � Royal Economic Society 2002. Published by BlackwellPublishers, 108 Cowley Road, Oxford OX4 1JF, UK and 350 Main Street, Malden, MA 02148, USA.
[ 854 ]
In addition, there is a unique large programme that we call Temporary Wage Subsidy.It encourages the unemployed to accept job offers that pay less than their un-employment benefit by (over-) compensating the difference with a subsidy. Thesejobs are temporary, and participants are still registered as job seekers. In this sense,this wage subsidy programme differs from the employment subsidy programme inthe British New Deal and most other countries.
We perform a microeconometric evaluation of the different programmes of theSwiss ALMP. We focus on the differences of individual success in the labour marketthat are due to these programmes. The Swiss government made available a novel,informative and large database consisting of administrative records from the un-employment insurance system, as well as from the social security system for thepopulation of unemployed persons in December 1997.1
For any evaluation study, there is the question of identification strategies andestimation methods suitable for the specific situation. Angrist and Krueger (1999),Heckman and Robb (1986) and Heckman et al. (1999) provide excellent overviewsof available strategies. Because we argue that we observe the major variables in-fluencing selection as well as outcomes, we assume that labour market outcomesand selection are independent conditional on these observables (conditional in-dependence assumption, CIA). Therefore, for the present situation characterisedby rich data, an estimator that exploits CIA and avoids other assumptions would becalled for. In addition, that estimator should avoid restricting the effects to be thesame in specific sub-population because there is substantial a priori evidence thatthose programmes could have different effects for different individuals. Finally,this estimator has to take account of the different programmes of the Swiss ALMP.
An estimator that fulfils these requirements is matching. The idea is to constructan artificial comparison group and compare their labour market outcomes tothose of the programme participants. Under CIA, this estimator is consistent whenthe comparison group has the same distribution of observables determining out-comes and participation as the group in the programme. Angrist (1998), Dehejiaand Wahba (1999), Heckman, Ichimura and Todd (1998), Heckman, Ichimura,Smith and Todd (1998) and Lechner (1999, 2000), among others, recently applyand discuss matching. Imbens (2000) and Lechner (2001a) extend the binarymatching approach (in the programme vs not in the programme) to allow formultiple programmes.
Our results indicate considerable heterogeneity with respect to both the effectsof the different programmes and the effects for different subpopulations within aprogramme. Employment programmes perform poorly, Vocational training programmesshow a rather mixed performance depending on the specific subprogrammeconsidered, whereas Temporary wage subsidy is a successful programme in terms ofincreasing the chances on the labour market. With respect to the heterogeneity bysub-population, it appears that participating in a programme in the early stages ofthe unemployment spell is less effective than participating in later stages.
1 This study is part of a series of evaluation studies commissioned by the Swiss State Secretariatof Economic Affairs (seco), that use diverse empirical methods; for an overview in German, seehttp://www.seco-admin.ch/wirtpol/amp/d_ForschungALV.html.
2002] 855A C T I V E L A B O U R M A R K E T P O L I C Y
� Royal Economic Society 2002
The plan of the paper is as follows: Section 1 gives the stylised facts of the Swisslabour market and explains the institutional arrangements of the unemploymentinsurance system. Furthermore, it gives the details of the active labour marketpolicies. Section 2 discusses data issues, presents descriptive statistics and empiri-cally characterises the selection processes into the programmes. Section 3 discussesour identification and estimation strategy. Section 4 contains the results andSection 5 concludes. Two Appendices contain more information on the data, aswell as the results of the estimation of a multinomial probit model used to explainparticipation in the programmes. Finally, an Appendix that can be downloadedfrom the internet2 contains additional information.
1. The Swiss Labour Market
1.1. The Economic Situation
Switzerland is a federalist state with three major language regions. The Germanspeaking region is by far the largest and economically most prosperous part.Generally, the Swiss labour market operates on broadly similar terms as, forexample, the German labour market. It is even more geared towards consensusbetween union, employers and government. The female labour market parti-cipation rate is relatively high at about 70% (with about 55% of them working part-time). The share of foreigners in the work force is about 20%.3
Switzerland has a unique unemployment experience. Before 1990, unemploy-ment never was a major problem. In the 1970s, the unemployment rate neverexceeded 1% and, in the 1980s, the highest rate was 1.1%. After a long period ofeconomic growth, the first seven years of the 1990s proved to be a period ofstagnation and the unemployment rate increased markedly and reached a max-imum of 5.2% in 1997. Since then, unemployment fell again to 2.8% in 1999.4 Themain reason why recessions before 1990 did not translate into a large increase inunemployment, as in most other Western European countries, seems to be thecyclical responsiveness of the foreign labour force. About 75% of the employmentreduction in the 1975/6 recession was absorbed by a reduction in the non-per-manent foreign labour force.5 The situation was different in the 1990s, with morethan 60% of the foreign labour force having a permanent work permit, implying amuch reduced responsiveness. In addition, female labour supply also becamemuch less elastic with respect to labour demand.
Foreigners are over-represented among the unemployed with a share of roughly40%. This is also the case for women whose unemployment rate is about 1%-pointhigher than the overall unemployment rate. There is also a disparity in unem-ployment rates between the German speaking cantons and the non-Germanspeaking cantons (3.4% vs 7.1% in 1995).
2 www.siaw.unisg.ch/lechner/gl_ej.3 The source for most of the numbers presented in this section is OECD (1996).4 The OECD standardised unemployment rates are somewhat lower then those based on the Swiss
official statistics.5 Non-permanent work permits are only renewed in case of successful employment.
856 [ O C T O B E RT H E E C O N O M I C J O U R N A L
� Royal Economic Society 2002
1.2. Unemployment Insurance and Active Labour Market Policies
Switzerland had no compulsory unemployment insurance until the late 1970s. Thenational unemployment insurance law (AVIG) was enacted only as late as 1984.Active labour market policies were provided for in the AVIG but they were of noimportance before its last major revision in 1996. The main feature of that revisionis a change from so-called passive unemployment benefits towards an active systemin which benefit payments are conditional on participation in labour marketprogrammes.6 Benefit entitlement was prolonged to two years. The entitlementperiod is separated into two parts: the first 30 weeks are unconditional on pro-gramme participation whereas the remaining entitlement is conditional on someparticipation. However, in practice, these rules are not strictly enforced; it is notunusual to participate in programmes in the first 30 weeks of the unemploymentspell. In this case, the unconditional benefit payments can be received later. Fre-quently unemployed receive the same benefits in the conditional period as beforewithout any participation in ALMP, because no programme has been offered.
Entitlement is conditional on having contributed to the unemployment insur-ance for at least 6 months in the previous two years. After the entitlement periodhas expired, a new entitlement period is conditional on being employed for atleast another 12 months within three years after the previous unemployment spell.The replacement ratio is, in general, 80% of the insured earnings.7 The maximumof the monthly benefit is limited to about CHF 7,000.
The cantons are obliged by law to supply a minimum of places in labour marketprogrammes per year. Until January 2000, this minimum was 25,000 distributedacross cantons according to their unemployment. This minimum was exceeded in1998 by roughly 6,000. By comparison, there were about 190,000 registered job-seekers in 1997 and 140,000 in 1998.
The active labour market programmes (ALMP) can be grouped into three broadcategories:
(a) Training courses(b) Employment programmes(c) Temporary employment with wage subsidy (Temporary wage subsidy)
The difference between (b) and (c) is that employment programmes take placeoutside the ‘regular’ labour market (see below). By contrast, Temporary wage subsidymust be a regular, but temporary, job.
Training programmes consist of a wide variety of courses, ranging from basiccourses to specific work-related training. The decision to participate in a trainingcourse is made by the placement officer according to his impressions obtainedmainly from the monthly interviews. The unemployed can also apply for trainingcourses. The law requires that courses must be necessary and adequate with thegoal to improve individual employment chances. Criteria for the decision includeage and motivation of the unemployed, and the duration of the course and its
6 The amount of benefits is the same for the active as well as passive ones.7 A reduced replacement ratio of 70% applies to able-bodied persons without parental obligations or
with previous monthly earnings above about CHF 3,500.
2002] 857A C T I V E L A B O U R M A R K E T P O L I C Y
� Royal Economic Society 2002
relevance for the occupation. Occupational retraining is specifically not consid-ered to be a task of the ALMP. The duration of training courses varies between oneday and several months.
Employment programmes usually last for six months. They should be as similaras possible to regular employment, but they should also be extraordinary, i.e. em-ployment programmes should not be in competition with other firms. Employ-ment programmes are organised by both public and private institutions.8 Duringan employment programme, the unemployed have to continue their job searchand must accept any suitable job offer. While in an employment programme, anunemployed person receives a wage which can be larger than the unemploymentbenefit. However, in practice, this would be an exception. Participation in trainingcourses and employment programmes does not extend the benefit entitlementperiod. By contrast, Temporary wage subsidy (TEMP) can extend the entitlementperiod if its cumulated duration exceeds 12 months.
The objective of TEMP is to encourage job seekers to accept job offers that payless than their unemployment benefit by compensating the difference. The in-come generated by this scheme is larger than unemployment benefits.9 Thus, thisprogramme is financially attractive for both the unemployed and the placementoffice. Persons in TEMP are registered as job seekers and must obey the same rulesas unemployed receiving benefits.
TEMP does not belong to the ALMP officially but there is compelling evidencethat the placement offices use them as an active labour market policy instru-ment. This is documented in Bauer et al. (1999) and in interviews we conductedat selected placement offices. Not surprisingly, it is the largest programme of theALMP. In 1998, roughly 20% of the unemployed were at some point in TEMP.Thus, we treat it as part of the ALMP. Bauer et al. (1999) report that only about20% of the jobs in TEMP are arranged by the placement office. The OECD(1996) states that TEMP can be a powerful instrument to bring the unemployedback to employment. However, there is concern that it may lead to seriousdistortions in the labour market if not tightly monitored. For example, workersmight be laid-off and recalled in the TEMP scheme. Furthermore, firms mightuse TEMP to avoid dismissal protection rules to have a more flexible work force;or TEMP might be used to avoid the wage levels set out in collective wagebargaining agreements. However, there is (yet?) no evidence of these negativeeffects in practice.
In Switzerland, the cantons and even the placement offices within a canton arefairly free regarding their policy of allocating unemployed to programmes. Theyjust have to conform to the rather vague guidelines set out in the federal law. Thisintroduces regional heterogeneity into the allocation process that is evident from
8 There is no substantive difference between the type of ‘jobs’ offered by the two different groups ofproviders of these programmes.
9 The compensation payment is the replacement ratio applied to the difference between the earn-ings in the temporary job and the previous earnings, which will always be larger than the differencebetween the unemployment benefit and the earnings in the temporary job. At the same time, theunemployment insurance system ‘saves money’ by always paying less than the regular unemploymentbenefit.
858 [ O C T O B E RT H E E C O N O M I C J O U R N A L
� Royal Economic Society 2002
both the interviews we conducted and the estimation results of the factorsexplaining the selection process presented below.
1.3. The Programmes of the Swiss ALMP as Defined in this Study
There are 16 different types of training courses that we aggregate into five fairlyhomogenous groups:
(a) Basic courses (aiming at improving the effectiveness of job search and self-esteem)
(b) Language courses(c) Computer courses(d) Further vocational training(e) Other courses (including courses for specific occupations).10
The employment programmes are differentiated according to whether they areoffered by public or private institutions. Temporary wage subsidy is a programme ofits own, and the final group consists of those who never participated in any pro-gramme.11 Thus, in total, we have nine groups of ALMP participation status towhich we allocate the individuals in our data.
With respect to programme heterogeneity, there is a fundamental problem wehave to address: how do we deal with multiple programme participation of thesame unemployed? In principle, it is possible to observe individuals with pro-gramme ‘careers’ where participation in a later programme is, of course, notindependent of prior participation. This creates an endogeneity problem, becausemore successful programmes will increase the likelihood of employment for theirparticipants, while less successful programmes may just lead to yet another pro-gramme participation. For this reason, we evaluate only the first major programme.This approach implies that further programme participation is an indicator offailure of the first programme because it does not bring the unemployed back intoemployment. In practice, this approach is less restrictive than it appears. Onlyabout 30% of all participants enter a second programme, and the majority of thesesuccessive programmes are of the same type as the first programme.
Another problem concerns the group of non-participants. For this group, impor-tant time varying variables like ‘unemployment duration prior to the programme’are not defined. To make meaningful comparisons to those unemployed entering aprogramme, we use an approach suggested in Lechner (1999) which consists ofdrawing a hypothetical programme starting date from the sample distribution ofstarting dates for each non-participant. Persons with simulated starting date laterthan their actual exit date from unemployment are excluded from the data set.12
To summarise, we evaluate the first major programme starting after 1 January1998. A major programme is defined as having a duration of at least two weeks.
10 See Table A1 in Appendix A1 for details on the aggregation of the groups.11 ‘Never’ means in this case the period between 1 January 1998, and 31 January 1999, because we
have information about participation only for this period.12 Lechner (2001d) contains a sensitivity analysis of this procedure by using starting dates predicted
by relevant information available in December 1997. The results appear to be robust.
2002] 859A C T I V E L A B O U R M A R K E T P O L I C Y
� Royal Economic Society 2002
The reason not to consider programmes starting before 1998 is that the data donot contain sufficient information on the type and the duration of programmesprior to 1998.13
Table 1 shows the descriptive statistics of several important variables across thedifferent groups defined by programme participation. The largest group is Non-participation (about one third) which is interesting given that programme partici-pation is in principle compulsory after 30 weeks. The largest programme group isTemporary wage subsidy. All other programmes are of similar size except Further voca-tional training and Other courses. The final column shows that the employment rate atthe final day in our data varies between 48% and 25%. Of course, this is not indicativefor programme success because participants differ substantially with respect tovariables influencing future employment. Hence, we expect differences in the em-ployment rates for these different groups of unemployed, even without any pro-gramme participation. The table shows that important variables like qualification,nationality and duration of unemployment also vary substantially. The proportion ofthose starting a programme in the first 150 days of the unemployment spell (recallthat programme participation is, in principle, compulsory after 150 days) is inter-esting, since it is low for employment programmes with 18% and about twice as largefor most other programmes (except Other training courses). This indicates that espe-cially training courses and TEMP often start earlier than required by law.
Important information is missing in Table 1 because, at the moment, there areno detailed information available on programme costs. Therefore, a cost, benefitanalysis is not possible.
Data that are informative about the outcome and selection processes are im-portant in evaluation studies, because they allow us to disentangle differencesbetween participants and non-participants due to selective participation fromdifferences caused by the specific programme. Since we use data from the ad-ministrative unemployment register, in principle, we know (almost) as much aboutthe unemployed as the placement officer. We also need to know everything aboutthe type, timing and duration of the programmes. In addition, we must measurethe success of the programmes, eg by information on successful employment.Again, by using the administrative data, we have this information. In addition,there is evidence in the literature – see the survey by Heckman et al. (1999) – that itis important to control for individual labour market histories so as to captureindividual heterogeneity. We can do this because it was possible to merge datafrom the social security records with the unemployment registrar data. Hence, wehave retrospective data on labour market status and earnings covering at most tenyears prior to the current unemployment spell. In conclusion, we have good datafor a comprehensive evaluation of the Swiss ALMP. The data are described in moredetail in Section 2.
13 Comprehensive coverage of labour market programmes in the official statistics was only intro-duced in 1998.
860 [ O C T O B E RT H E E C O N O M I C J O U R N A L
� Royal Economic Society 2002
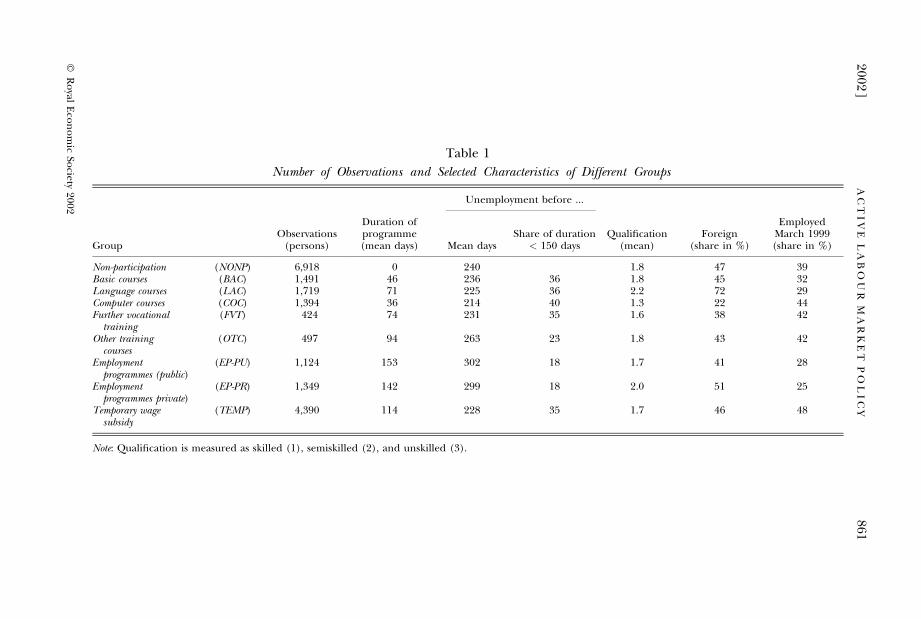
Table 1
Number of Observations and Selected Characteristics of Different Groups
Unemployment before ...
GroupObservations
(persons)
Duration ofprogramme(mean days) Mean days
Share of duration< 150 days
Qualification(mean)
Foreign(share in %)
EmployedMarch 1999(share in %)
Non-participation (NONP) 6,918 0 240 1.8 47 39Basic courses (BAC) 1,491 46 236 36 1.8 45 32Language courses (LAC) 1,719 71 225 36 2.2 72 29Computer courses (COC) 1,394 36 214 40 1.3 22 44Further vocational
training(FVT) 424 74 231 35 1.6 38 42
Other trainingcourses
(OTC) 497 94 263 23 1.8 43 42
Employmentprogrammes (public)
(EP-PU) 1,124 153 302 18 1.7 41 28
Employmentprogrammes private)
(EP-PR) 1,349 142 299 18 2.0 51 25
Temporary wagesubsidy
(TEMP) 4,390 114 228 35 1.7 46 48
Note: Qualification is measured as skilled (1), semiskilled (2), and unskilled (3).
2002]
861A
CT
IV
EL
AB
OU
RM
AR
KE
TP
OL
IC
Y
�R
oyal
Eco
no
mic
Society
2002
2. Data and Empirical Analysis of the Selection Process
2.1. Data Base
Our empirical analysis is based on administrative data. We obtained access tothe information system for placement and labour market statistics (AVAM)and the unemployment offices payment systems (ASAL). From there, weobtained data from January 1996 to March 1999 for all persons who wereregistered as unemployed on 31 December 1997 (about 180,000).14 These dataprovide detailed information about the unemployment history, ALMP partici-pation and personal characteristics. In addition, we received data from thesocial security records for the period 1988–97, albeit only for a randomsubsample of about 25,000 observations. The merged sample contains infor-mation on the individual labour market histories and earnings on a monthlybasis for ten years prior to the current unemployment spell. In addition, wehave detailed information concerning several aspects: socio-demographics (age,gender, marital status, native language, nationality, type of work permit, lan-guage skills); region (town/village and labour office in charge); subjectivevaluations of placement officer (qualifications, chances to find job); sanctionsimposed by the placement office; previous job and desired job (occupation,sector, position, earnings, full-/part-time); and a short history of labour marketstatus on a daily basis.
The subjective valuations of the placement officers and the benefit sanctions canbe particularly informative since they will capture characteristics like motivationand personal appearance that are usually unobservable. We are confident that,after controlling for this wealth of information, there is little unobserved hetero-geneity left that is systematically correlated with labour market outcomes andprogramme participation.
We applied a series of sample selection rules to the data given in Appendix Ain detail. The most important criteria are to consider only individuals unem-ployed for less than 12 months on 31 December 1997, who did not participate inany major programme in 1997, and who are aged between 25 and 55 years old.The reasons for these selection criteria are that, given the two-year entitlementperiod, we want to make sure that there is sufficient time left to participate in aprogramme after 31 December 1997. Furthermore, given our concentration onthe first programme, we exclude those who participated in a major programmebefore. In addition, given the variety of options for young and older unemployed(schooling and early retirement), we exclude them from our analysis. The finalsample has 19,307 observations.15
14 Thus we use a stock sample that is representative for the population of unemployed in December1997, but not necessarily for the inflows into unemployment in 1997.
15 The full set of descriptive statistics is contained in Appendix www.siaw.unisg.ch/lechner/gl_ej.
862 [ O C T O B E RT H E E C O N O M I C J O U R N A L
� Royal Economic Society 2002
2.2. Empirical Analysis of the Participation Process into the Programmes
This Section describes the estimation results of a multinomial probit model (MNP)for the selection of the individuals into the programmes.16 Full results are pre-sented in Tables B1 and B2 in Appendix B.
The results indicate that the main determinants of the selection process into theprogrammes are gender, region of residence, unemployment history, qualifica-tion, knowledge of language and previous occupation. The results correspond towhat we would expect from the legal requirements and our interviews at selectedplacement offices. It seems that the unemployed are sent into programmes thatare adequate with respect to their skill levels and the formal requirements forimproving their employment chances. For example, foreigners whose mothertongue is not the language spoken in the canton they live in usually enter Languagecourses and are much less likely to go to Computer courses, Further vocational trainingor TEMP.
Low-skilled unemployed are likely to be selected into Language courses and bothtypes of Employment programmes. On the other hand, unemployed with a higher skilllevel tend to go to Computer courses, Further vocational training and TEMP. Womenare more likely to enter Basic courses, Language courses and TEMP. The probabilityfor entering Employment programmes increases with age.
A main determinant of Basic training is residential location. This is also a resultof the federalist system allowing placement offices some discretion with respect tothe classification of actual programmes in the official groups (here mainly betweenBasic and Language courses).
The employment histories indicate the proportion of time unemployed in theprevious ten years has a positive effect on the probability of entering an Employmentprogramme. For all other programmes, this effect is negative (compared to non-participation). On the other hand, the proportion of time being employed in thelast ten years has only a positive impact on the probability of entering Temporarywage subsidy. This finding suggests that the unemployed in TEMP seem to have astronger attachment to the labour market in terms of past employment.
Finally, we find large positive correlations between the unobserved error termsin the MNP relating to the two employment programmes, whereas the corre-sponding correlations between training programmes are mainly negative. Notsurprisingly, the negative correlation between Language courses and Computer coursesis the largest one. However, the estimation of these correlations appears to berather imprecise.
The correlations of the estimated probabilities (Table B3 in Appendix B) arenegative with the two exceptions of Computer courses and Further vocational trainingand the two Employment programmes implying that participants in these two pairs ofprogrammes are fairly similar.
16 The MNP has been estimated by maximum simulated likelihood using the GHK simulator (100replications for each individual observation in each equation). Non-participation is chosen as the refer-ence group. We chose the MNP as opposed to the multinomial logit because it does not impose therestrictive independence of irrelevant alternatives assumption.
2002] 863A C T I V E L A B O U R M A R K E T P O L I C Y
� Royal Economic Society 2002
3. Econometric Estimation of the Effects of ALMP
3.1. Notation and Definition of Causal Effects
The prototypical model of the microeconometric evaluation literature is as follows:an individual chooses between two states, like participation in a training pro-gramme or non-participation in such a programme. The potential participant in aprogramme will receive a hypothetical outcome (eg earnings) in both states. Thismodel is known as the (Roy, 1951; Rubin, 1974) model of potential outcomes andcausal effects.17
Consider the outcomes of ðM þ 1Þ different mutually exclusive states denotedby fY 0;Y 1; . . . ;Y Mg. The different states will to be called treatments to stick to theterminology of that literature. It is assumed that each individual receives exactlyone of the treatments (typically, category ‘0’ denotes treatment type no treat-ment). Therefore, for any individual, only one component of fY 0;Y 1; . . . ;Y Mgcan be observed in the data. The remaining M outcomes are counterfactuals.Participation in a particular treatment m is indicated by the variableS 2 f0; 1; . . .Mg.
The definitions of average treatment effects used for the case of just two treat-ments need to be extended.18 In the following equations, the focus is on a pair-wise comparison of the effects of treatments m and l :
cm;l0 ¼ EðY m � Y lÞ ¼ EY m � EY l ð1Þ
hm;l0 ¼ EðY m � Y l jS ¼ mÞ ¼ EðY m jS ¼ mÞ � EðY l jS ¼ mÞ ð2Þ
where cm;l0 denotes the expected (average) effect of treatment m relative to treatment
l for a participant drawn randomly from the population19 and hm;l0 is the expected
effect for an individual randomly drawn from the population of participants intreatment m only. Note that both average treatment effects are symmetric in thesense that cm;l
0 ¼ �cl ;m0 . Note also that, if the participants in treatments m and l differ
in a way that is related to the distribution of X , and if the treatment effects vary with X ,then hm;l
0 6¼ �hl ;m0 , ie the treatment effects on the treated are not symmetric.
3.2. Identification
3.2.1. The conditional independence assumptionThe causal model clarifies that the average causal treatment effect is generally notidentified. The lack of identification has to be overcome by plausible, untestableassumptions. Their plausibility depends on the problem analysed and the dataavailable. Angrist and Krueger (1999), Heckman and Robb (1986) and Heckmanet al. (1999) provide excellent overviews about available identification strategies.Here, as already noted in the previous Section, the data are so rich, that it seems
17 See for example Holland (1986) for an extensive discussion of different concepts of causality.18 Assume for the rest of the paper that the typical assumptions of the Rubin model are fulfilled; see,
for example Holland (1986) or Rubin (1974).19 If a variable Z cannot be changed by the effect of the treatment then all what follows is also valid in
strata of the data defined by different values of Z .
864 [ O C T O B E RT H E E C O N O M I C J O U R N A L
� Royal Economic Society 2002
plausible to observe all important factors that jointly influence labour marketoutcomes and the process of selecting people into the nine states. Therefore, weassume that treatment participation and treatment outcome is independent,conditional on a set of observable attributes conditional independence assump-tion, CIA, Rubin (1977). Rosenbaum and Rubin (1983) show how this assumptioncould effectively be used for semi/nonparametric treatment evaluation, since it isnot necessary to condition on a potentially high number of attributes, but only onthe participation probability conditional on the attributes.20
Imbens (2000) and Lechner (2001a) consider identification under the CIA inthe model with multiple treatments. The CIA defined to be valid in a subspace ofthe attribute space is formalised in (3):
Y 0;Y 1; . . . ;Y Ma
S jX ¼ x 8x 2 v: ð3Þ
This assumption requires the researcher to observe all characteristics that jointlyinfluence the outcomes, as well as the selection into treatments. In that sense, theCIA may be called a ‘data hungry’ identification strategy.21 In addition, it is re-quired that all individuals in that subspace actually have the possibility of partici-pating in all states (ie 0 < PðS ¼ mjX ¼ x; 8m ¼ 0; . . . ;M ;8x 2 vÞ. Lechner(2001a) shows that the CIA identifies all effects defined in this section. Lechner(2001a) also shows that depending on the effect of interest, this assumption can beweakened to involve fewer potential outcomes.22
We already argued in Section 2 that our database is exceptionally good, so we areconfident that all factors that remain unobserved do not systematically influencethe participation process in the programmes as well as the labour market out-comes.
3.2.2. Reducing the dimension using balancing scoresThe basic ingredients of the final estimate are estimates of EðY m jX ; S ¼ mÞ, sincethe CIA implies that EðY m jS ¼ lÞ ¼ E
X½EðY m jX ; S ¼ mÞjS ¼ l . However, nonpara-
metric estimates cannot easily be obtained because of the high dimension of X andthe resulting curse of dimensionality in any nonparametric estimator.23 In thatrespect, Lechner (2001a) shows also that some modified versions of the balancingscore properties known from the binary treatment model (Rosenbaum and Rubin,1983) hold in this more general setting as well. In the following, the basic results ofLechner (2001a) are repeated.
20 See for example Section X in the paper by Heckman and Robb (1986) for the link betweenmatching on the propensity score and classical selection models.
21 Note that the CIA is not the minimal identifying assumption, because all that is needed to identifymean effects is conditional mean independence. However, the CIA has the virtue of making the lattervalid for all transformations of the outcome variables. Furthermore, in this study, it would be difficult toargue why conditional mean independence should hold and the CIA might nevertheless be violated.
22 In fact, the (particular) average treatment effect on the treated for treatment m compared totreatment l , involves Y l only. For details, see Lechner (2001a). Nevertheless, since we are interested inall treatment effects, the more restrictive version given in (3) is appropriate.
23 Since identification is obtained nonparametrically, it appears natural to avoid imposing a func-tional form on EðY m jX ; S ¼ mÞ for the purpose of ease of estimation (thus avoiding the danger ofinconsistent estimates due to incorrect imposition of functional forms, that have carefully been avoidedbeforehand).
2002] 865A C T I V E L A B O U R M A R K E T P O L I C Y
� Royal Economic Society 2002
Denoting the choice probability of alternative j conditional on X asPðS ¼ j jX ¼ xÞ ¼ PjðxÞ, gives the following result for the effect of treatment mcompared to treatment l on the participants in treatment m:
hm;l0 ¼ EðY m jS ¼ mÞ � E
Pl jml ðX ÞfE½Y l jPl jml ðX Þ; S ¼ l jS ¼ mg
Pl jml ðxÞ ¼ Pl jml ðS ¼ l jS ¼ l or S ¼ m;X ¼ xÞ ¼ PlðxÞPlðxÞ þ PmðxÞ
:ð4Þ
If the respective probabilities Pl jml ðxÞ are known or if a good estimator is available,ie a consistent estimator that converges at the parametric rate, the dimension ofthe (nonparametric) estimation problem is reduced to one. If Pl jml ðxÞ is modelleddirectly, no information from subsamples other than the ones containingparticipants in m and l is needed for the estimation of hm;l
0 and hl ;m0 .
The equality
EðY l jS ¼ mÞ ¼ EPl jml ðX Þ
fE½Y l jPl jml ðX Þ; S ¼ l jS ¼ mg
suggests a similar strategy of identifying (and estimating) the population effect
cm;l0 :
cm;l0 ¼ EY m � EY l ¼
XM
j¼0
½EðY m jS ¼ jÞ � EðY l jS ¼ jÞ PðS ¼ jÞ
¼XM
j¼0
EPmjmj ðX Þ
E½Y m jPmjmjðX Þ; S ¼ m jS ¼ j
( )
� EPl jlj ðX Þ
E½Y l jPl jljðX Þ; S ¼ l jS ¼ j PðS ¼ jÞn o
: ð5Þ
In this evaluation, it will be more straightforward from a modelling point of view tospecify the complete discrete choice problem of choosing a particular treatmentout of the complete list of treatments simultaneously (see Section 2). Pl jml ðxÞ couldthen be computed from that model. In this case, we have consistent estimates ofall marginal choice probabilities ½P0ðX Þ; . . . ;PM ðX Þ . Hence, it may be attractiveto condition jointly on PlðX Þ and PmðX Þ instead of Pl jml ðX Þ . This also identifieshm;l
0 , because PlðX Þ together with PmðX Þ is ‘finer’ than Pl jml ðX Þ, since
E½Pl jml ðX ÞjPlðX Þ;PmðX Þ ¼ EPðX Þ
PlðX Þ þ PmðX ÞjPlðX Þ;PmðX Þ
� �¼ Pl jml ðX Þ:
To summarise, in this paper, to identify the various effects of interest, we use thecondition
EðY l jS ¼ mÞ¼! EPmðX Þ;Pl ðX Þ
E½Y l jPmðX Þ;PlðX Þ; S ¼ l jS ¼ m
8l ;m ð6Þ
which is a direct implication of condition (3) and the common supportrequirement.
Making use of (4) and (5) justifies the strategy of estimating EðY l jS ¼ mÞ for allcombinations of m and l based on (6), and then using these estimates to com-
866 [ O C T O B E RT H E E C O N O M I C J O U R N A L
� Royal Economic Society 2002
pute the different treatment effects cml0 and hml
0 . Such an estimator is proposednext.
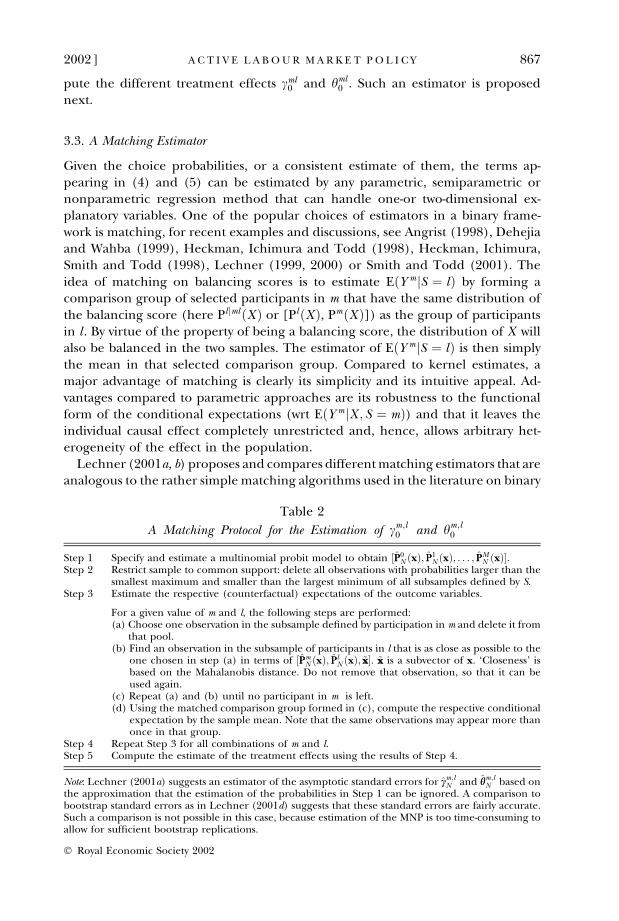
3.3. A Matching Estimator
Given the choice probabilities, or a consistent estimate of them, the terms ap-pearing in (4) and (5) can be estimated by any parametric, semiparametric ornonparametric regression method that can handle one-or two-dimensional ex-planatory variables. One of the popular choices of estimators in a binary frame-work is matching, for recent examples and discussions, see Angrist (1998), Dehejiaand Wahba (1999), Heckman, Ichimura and Todd (1998), Heckman, Ichimura,Smith and Todd (1998), Lechner (1999, 2000) or Smith and Todd (2001). Theidea of matching on balancing scores is to estimate EðY m jS ¼ lÞ by forming acomparison group of selected participants in m that have the same distribution ofthe balancing score (here Pl jml ðX Þ or [PlðX Þ, PmðX Þ]) as the group of participantsin l . By virtue of the property of being a balancing score, the distribution of X willalso be balanced in the two samples. The estimator of EðY m jS ¼ lÞ is then simplythe mean in that selected comparison group. Compared to kernel estimates, amajor advantage of matching is clearly its simplicity and its intuitive appeal. Ad-vantages compared to parametric approaches are its robustness to the functionalform of the conditional expectations (wrt EðY m jX ; S ¼ mÞ) and that it leaves theindividual causal effect completely unrestricted and, hence, allows arbitrary het-erogeneity of the effect in the population.
Lechner (2001a, b) proposes and compares different matching estimators that areanalogous to the rather simple matching algorithms used in the literature on binary
Table 2
A Matching Protocol for the Estimation of cm;l0 and hm;l
0
Step 1 Specify and estimate a multinomial probit model to obtain ½PP0N ðxÞ; PP1
N ðxÞ; . . . ; PPMN ðxÞ .
Step 2 Restrict sample to common support: delete all observations with probabilities larger than thesmallest maximum and smaller than the largest minimum of all subsamples defined by S.
Step 3 Estimate the respective (counterfactual) expectations of the outcome variables.
For a given value of m and l, the following steps are performed:(a) Choose one observation in the subsample defined by participation in m and delete it from
that pool.(b) Find an observation in the subsample of participants in l that is as close as possible to the
one chosen in step (a) in terms of ½PPmN ðxÞ; PPl
N ðxÞ; ~xx . ~xx is a subvector of x. ‘Closeness’ isbased on the Mahalanobis distance. Do not remove that observation, so that it can beused again.
(c) Repeat (a) and (b) until no participant in m is left.(d) Using the matched comparison group formed in (c), compute the respective conditional
expectation by the sample mean. Note that the same observations may appear more thanonce in that group.
Step 4 Repeat Step 3 for all combinations of m and l.Step 5 Compute the estimate of the treatment effects using the results of Step 4.
Note: Lechner (2001a) suggests an estimator of the asymptotic standard errors for ccm;lN and hhm;l
N based onthe approximation that the estimation of the probabilities in Step 1 can be ignored. A comparison tobootstrap standard errors as in Lechner (2001d) suggests that these standard errors are fairly accurate.Such a comparison is not possible in this case, because estimation of the MNP is too time-consuming toallow for sufficient bootstrap replications.
2002] 867A C T I V E L A B O U R M A R K E T P O L I C Y
� Royal Economic Society 2002
treatments. Here, the estimators are based on [PlðX Þ, PmðX Þ] that performed well inLechner (2001b). The exact matching protocol is contained in Table 2.
Several comments are in order. Step 2 ensures that we estimate effects only inregions of the attribute space where observations from two treatments could beobserved having a similar participation probability (common support require-ment).24
Table 3 shows the distribution of the deleted observation due to the commonsupport requirement across the different subsamples. Overall, the loss of observa-tions is about 14%. Language courses lose about 20% of their participants, whereasvocational training courses lose only close to 7%. For the other groups, the loss isclose to the mean loss. Given the results for the language courses, it is not surprisingthat a comparison of the means of the deleted and the remaining samples reveals,that in general, the share of unskilled people, foreigners and women is somewhathigher in the deleted sample. The differences appearing in the distribution ofsectors and occupations are probably related to those characteristics.25
A second remark with respect to the matching algorithm concerns the fact thatthe same comparison observation is used repeatedly in forming the comparisongroup (matching with replacement). This modification of the ‘standard’ estimator isnecessary for the estimator to be applicable at all when the number of participantsin treatment m is larger than in the comparison treatment l . Since the role of mand l could be reversed in this framework, this will always be the case when thenumber of participants is not equal in all treatments. This procedure has thepotential problem that few observations may be heavily used although other sim-ilar observations are available. This may result in a substantial and unnecessaryinflation of the variance. Therefore, the potential occurrence of this problemshould be monitored. Comparing the results with the limited evidence availablefrom other studies (Lechner, 2001b), values between 17% and 55% for the share ofthe largest 10% of the weights relative to the sum of the weights in the respectivecomparison group do not appear to be exceptionally large.26
Comparing the means of the probabilities used for matching in the respectivematched comparison sample to the respective numbers in Lechner (2001b) revealsthat they are somewhat higher.27 This is not surprising because, in this study, fouradditional variables are used. Hence, the quality of the match with respect to the
24 Note that, if we would only be interested in pair-wise average effects on the treated, the currentimplementation would be unnecessarily strict, because making sure that there is an overlap for eachpair would be sufficient. In that case, each effect would be based on a different population defined bythe corresponding definition of the support. A comparison of the estimates could thus not disentangledifferences coming from different supports and differences coming from different effects. For a de-tailed discussion of the common support issue, see Lechner (2001c). The values of the estimatedprobabilities used to ensure common support are given in Appendix www.siaw.unisg.ch/lechner/gl_ej.
25 The detailed results are available in Appendix www.siaw.unisg.ch/lechner/gl_ej.26 The detailed results are available in Appendix www.siaw.unisg.ch/lechner/gl_ej.27 The detailed results are available in Appendix www.siaw.unisg.ch/lechner/gl_ej. To ensure that
the match is not only adequate with respect to the balancing score but also with respect to otherimportant variables, such variables which are denoted as ~xx in Table 2 are also included in the matching.~xx contains the following four variables: Native language not a Swiss language, Gender, Begin of programmeand Duration of unemployment until begining of programme. The weight in the Mahalanobis distance for thetwo probabilities is increased by a factor of 5 compared to ~xx.
868 [ O C T O B E RT H E E C O N O M I C J O U R N A L
� Royal Economic Society 2002
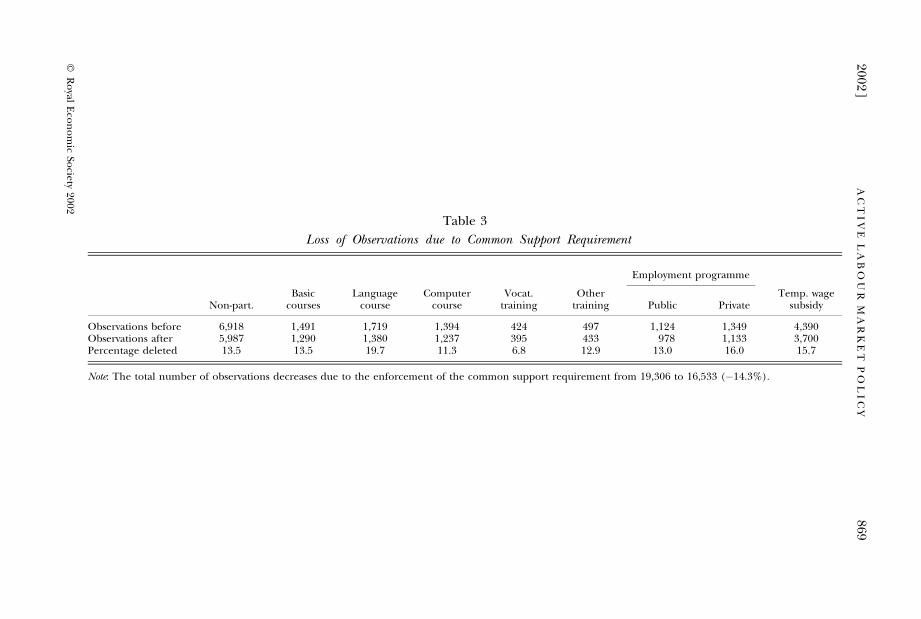
Table 3
Loss of Observations due to Common Support Requirement
Employment programme
Non-part.Basic
coursesLanguage
courseComputer
courseVocat.
trainingOther
training Public PrivateTemp. wage
subsidy
Observations before 6,918 1,491 1,719 1,394 424 497 1,124 1,349 4,390Observations after 5,987 1,290 1,380 1,237 395 433 978 1,133 3,700Percentage deleted 13.5 13.5 19.7 11.3 6.8 12.9 13.0 16.0 15.7
Note: The total number of observations decreases due to the enforcement of the common support requirement from 19,306 to 16,533 (�14.3%).
2002]
869A
CT
IV
EL
AB
OU
RM
AR
KE
TP
OL
IC
Y
�R
oyal
Eco
no
mic
Society
2002
probabilities must necessarily deteriorate. Nevertheless, the level of the meandifferences in the various groups appears to be rather small.
4. Results
4.1. Measures for the Effectiveness
Our goal is to measure the micro effects of participation in the programmes withrespect to the outcomes in the labour market. To do so, we rely on the data fromthe unemployment registrars only, because the social security data ends December1997, just before the programmes start. Therefore, we can only observe individualsas long as they are registered as unemployed. When they leave the unemploymentregister we observe the destination state of the initial transition out of unem-ployment (employment, out-of-labour-force). The following transition is, however,only observed if its destination is unemployment. We do not observe earnings, orany other job characteristic, when people leave the unemployment register foremployment. Furthermore, the potential period of observing programme effectscannot be longer than 15 months, since our latest observation dates from 31March 1999. In that sense, the analysis is restricted to the short-run effects of theALMP. Having in mind the above qualifications, the effects of the programmes willbe measured in terms of changes in the average probabilities of unsubsidisedemployment.28
Effects are measured after the programme begins.29 Hence, if somebody leaves aprogramme early to take up a job, this will influence our measure of effectiveness ofthe programme in a positive way. Such a measure could be disputed when onebelieves that being in the programme is a ‘good thing’ per se, but we concentratesolely on the success in the labour market. The alternative of measuring the effectsafter the programme ends entails an endogeneity problem (at least in the shortrun), because successful participants will leave their programme earlier.
Table 4 gives descriptive statistics for the outcome variables employed as well as fornot being registered as unemployed. These outcomes are measured either with respectto a particular distance in time to the start of the respective programme (here oneyear), or at a particular day in calendar time (here the last day observed in thedata, ie 31 March 1999). Table 4 shows that the concept of time does not reallymatter. However, the distinction employment–unemployment matters because therelative size of the flows into the remaining state ‘out-of-the-labour-force’ differbetween programmes. In the following, employment will be used as outcome be-cause we consider it to be the more relevant concept from an economic point ofview.30
28 The time in a programme, including a job subject to the temporary wage subsidy, is not consideredas employment in that sense.
29 In fact, begin is defined here as the official allocation to the programme to take account ofbehavioural change due to the knowledge that programme participation is certain.
30 Note that the employment rates given in Table 4 do not exactly equal the ones given in Table 1.Table 4 is based on the subsample restricted by the common support requirement. However, all dif-ferences are smaller than two percentage points.
870 [ O C T O B E RT H E E C O N O M I C J O U R N A L
� Royal Economic Society 2002
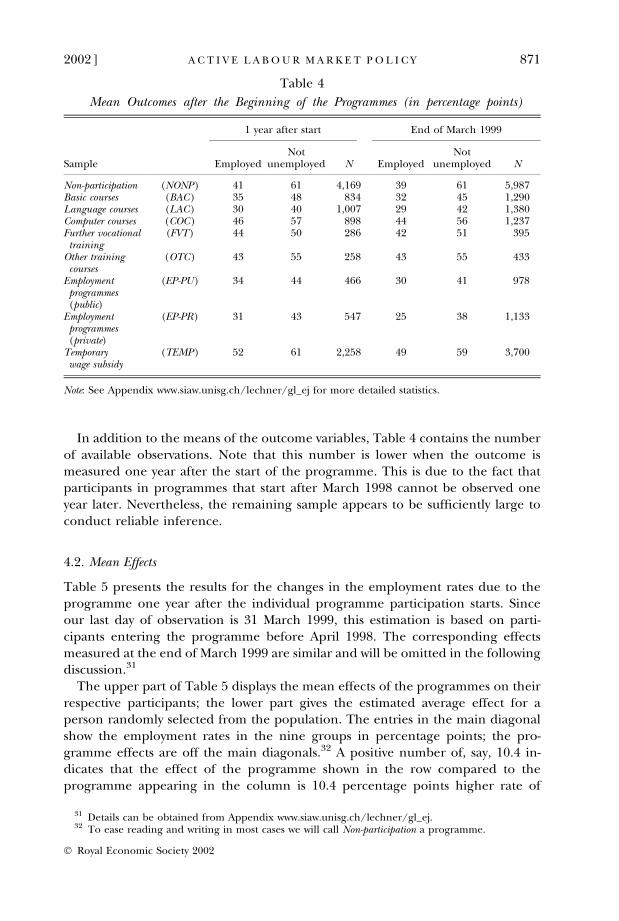
In addition to the means of the outcome variables, Table 4 contains the numberof available observations. Note that this number is lower when the outcome ismeasured one year after the start of the programme. This is due to the fact thatparticipants in programmes that start after March 1998 cannot be observed oneyear later. Nevertheless, the remaining sample appears to be sufficiently large toconduct reliable inference.
4.2. Mean Effects
Table 5 presents the results for the changes in the employment rates due to theprogramme one year after the individual programme participation starts. Sinceour last day of observation is 31 March 1999, this estimation is based on parti-cipants entering the programme before April 1998. The corresponding effectsmeasured at the end of March 1999 are similar and will be omitted in the followingdiscussion.31
The upper part of Table 5 displays the mean effects of the programmes on theirrespective participants; the lower part gives the estimated average effect for aperson randomly selected from the population. The entries in the main diagonalshow the employment rates in the nine groups in percentage points; the pro-gramme effects are off the main diagonals.32 A positive number of, say, 10.4 in-dicates that the effect of the programme shown in the row compared to theprogramme appearing in the column is 10.4 percentage points higher rate of
Table 4
Mean Outcomes after the Beginning of the Programmes (in percentage points)
1 year after start End of March 1999
Sample EmployedNot
unemployed N EmployedNot
unemployed N
Non-participation (NONP) 41 61 4,169 39 61 5,987Basic courses (BAC) 35 48 834 32 45 1,290Language courses (LAC) 30 40 1,007 29 42 1,380Computer courses (COC) 46 57 898 44 56 1,237Further vocationaltraining
(FVT) 44 50 286 42 51 395
Other trainingcourses
(OTC) 43 55 258 43 55 433
Employmentprogrammes(public)
(EP-PU) 34 44 466 30 41 978
Employmentprogrammes(private)
(EP-PR) 31 43 547 25 38 1,133
Temporarywage subsidy
(TEMP) 52 61 2,258 49 59 3,700
Note: See Appendix www.siaw.unisg.ch/lechner/gl_ej for more detailed statistics.
31 Details can be obtained from Appendix www.siaw.unisg.ch/lechner/gl_ej.32 To ease reading and writing in most cases we will call Non-participation a programme.
2002] 871A C T I V E L A B O U R M A R K E T P O L I C Y
� Royal Economic Society 2002

Table 5
Average Effects Measured as Difference in Employment Rates One Year After Start of Programme (in percentage points)
Employment programme
m Non-part.Basic
coursesLanguagecourses
Computercourses
Vocat.training
Othertraining Public Private
Temporary wagesubsidy
Average effect for participants in programme (hm;l0 )
NONP 42 10.4** 8.3* 9.2** �7.1**BAC �10.5** 36 �18.4** �14.8**LAC �8.7** 31 �15.6 �16.1* 9.1 �20.2**COC �4.8 11.1** 46 �14.1* �9.1**FVT 13.0** 44 13.8* 13.8* �11.9**OTC 8.9 43 12.7* �7.9EP-PU �6.6* �10.6 �14.3* 33 �15.1**EP-PR �7.9* �15.3* 31 �22.6**TEMP 5.8** 17.4** 10.9** 7.4* 17.5** 14.7** 52
Average effect (cm;l0 )
NONP 42 10.1** 6.0* 9.9** 8.5** �7.6**BAC �10.1** 36 �6.5 �8.8* �16.7** �17.7**LAC �6.0* 31 �12.5** �13.5**COC 6.5 46 �10.2* �11.2**FVT 8.8* 44 8.6 �8.8*OTC 16.7** 12.5** 10.2* 43 16.5** 15.1**EP-PU �9.9** �8.6 �16.5** 33 �17.4**EP-PR �8.5** �15.1** 31 �16.1**TEMP 7.6** 17.7** 13.5** 11.2** 8.8* 17.4** 16.1** 52
Note: Results are based on matched samples. ** indicates significance at the 1% level (2-sided test), * significance at the 5% level. Estimated coefficients notsignificant at the 10% level are omitted.
872[
OC
TO
BE
RT
HE
EC
ON
OM
IC
JO
UR
NA
L
�R
oyal
Eco
no
mic
Society
2002
employment. In the upper part of the Table, this effect is valid for the populationparticipating in the programme appearing in the rows of the Table. For example,the entry for the programme in the 5th row (Further vocational training, FVT) andthe programme in the 8th column (Employment programme, Private, EP-PR) shouldbe read as follows: ‘For the population participating in FVT, FVT increases theprobability of being employed one year after the programme on average by 13.8percentage points compared to that population being in EP-PR.’
The effects presented in the lower part of the Table have a correspondinginterpretation, but they do not refer to a specific subpopulation. Note these effectsare symmetric (cm;l
0 ¼ �cl ;m0 ). The Table contains only an entry for a pair-wise
effect when the estimate is statistically significant at the 10% level.The results for the respective participants in the programmes (upper part of
Table 5) indicate that TEMP is superior to almost all the other programmes. Themean gain is between about 6% and 22 percentage points. In particular, TEMP isthe only programme that dominates Non-participation (NONP) (+6%). The pair-wiseeffects show clearly that TEMP is the most effective programme, whereas Employ-ment programmes (EP) as well as Basic (BAC) and Language courses (LAC) havenegative effects. The remaining courses are intermediate.
It might appear strange that a programme can harm individual employmentchances. However, assume that the programmes themselves do not change theemployment chances directly.33 Nevertheless, an immediate indirect effect of allprogrammes will be a reduction in job search activities compared to non-parti-cipants. Furthermore, participants may receive fewer job offers from the labouroffice. In this case, we should expect an initial negative effect from any kind ofparticipation in a programme but, in the longer run, the direct effect of a suc-cessful programme needs to overcompensate for this initial fall. (Note that wemeasure the effects from the start of the programme.) Indeed, the dynamics of theeffects presented below show exactly that pattern.
The population effects contained in the lower panel, by and large, confirm theresults that appear in the upper panel of Table 5.34 This is somewhat surprisingbecause a well targeted programme could be expected to be more efficient for itsparticipants than for participants in other programmes or non-participants.Howerer, a comparison of corresponding numbers above and below the maindiagonal in the upper panel of Table 5 for the different groups of participantsreveals no systematic pattern. In particular the effects of the programmes do notappear to be consistently more positive for their particular participants than forother groups of the population. This result suggests that selection into the pro-grammes appears not to be correlated with realised gains from the programmes.This raises the question whether the allocation of individuals to specific parts ofthe active labour market policies could be improved in the future.
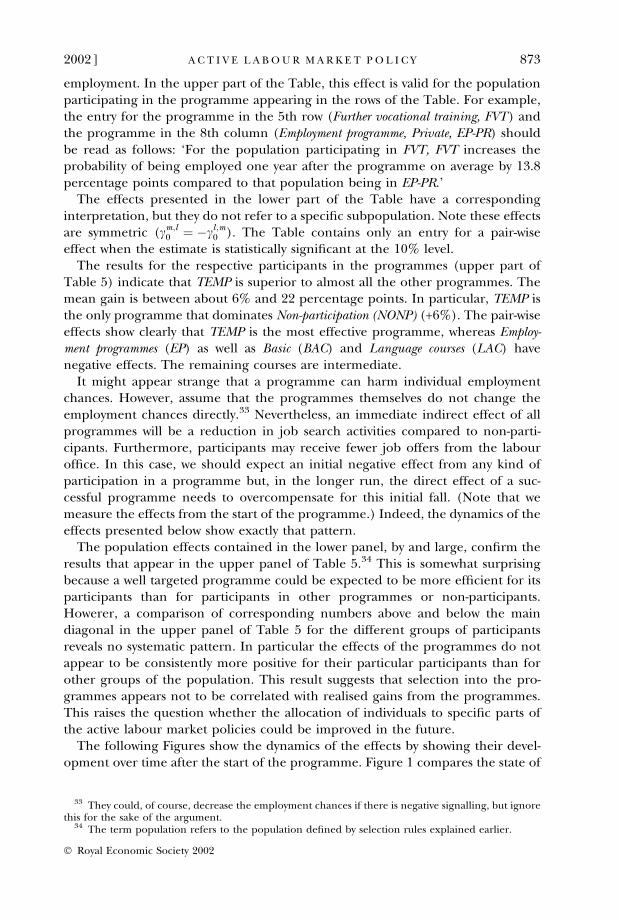
The following Figures show the dynamics of the effects by showing their devel-opment over time after the start of the programme. Figure 1 compares the state of
33 They could, of course, decrease the employment chances if there is negative signalling, but ignorethis for the sake of the argument.
34 The term population refers to the population defined by selection rules explained earlier.
2002] 873A C T I V E L A B O U R M A R K E T P O L I C Y
� Royal Economic Society 2002
non-participation as the reference state with all programmes.35 In this case, alleffects relative to NONP are estimated for the entire population. Note that a lineabove zero indicates that NONP would actually increase employment compared tothe programme indicated by this particular line. The sample sizes decrease withincreasing distance from the start (beginning month 3), since the last observationis 31 March 1999, and programmes may start until 31 January 1999. However, mostprogrammes start in the first quarter of 1998, so that the sample size is potentiallylarge enough to estimate the effects for about one year after the start of a pro-gramme with sufficient precision.36
The dynamic evolution of the effects has the expected profile: in the beginning,they are positive and increasing (probably a result of reduced job search activitiesin the programmes), but then they decline as participants leave their respectiveprogrammes and increase their job search activities. For all programmes, we findan initial negative effect compared to NONP. For TEMP, this effect disappears after
Dif
fere
nce
in e
mpl
oym
ent r
ates
in %
-poi
nts
Days after start
30
20
10
0
–10
–20
–300 50 100 150 200 250 300 350 400 450 500
NONPBACLACCOCFVTOTCEP–PUEP–PRTJOB
Fig. 1. Average Effects for the Population: A Comparison to NonparticipationNote : NONP : Nonparticipation, BAC: Basic training course; LAC: Language course;
COC: Computer course; FVT : Further vocational training; OTC: Other training course;EP-PU: Employment programme (public); EP-PR: Employment programme (private);
TJOB: Temporary wage subsidy.Only estimated effects that are significant at the 5% level are reported.
A ten-day moving average is used.
35 Lechner (2001b) proposed composite effects to summarise the different pair-wise effects. For thesake of brevity, they are only contained in the Appendix www.siaw.unisg.ch/lechner/gl_ej.
36 See Appendix www.siaw.unisg.ch/lechner/gl_ej for the detailed results.
874 [ O C T O B E RT H E E C O N O M I C J O U R N A L
� Royal Economic Society 2002
about four months and becomes positive after about eight months. We observe asimilar, but somewhat slower, reversal for FVT, Other training courses (OTC), andwith a further delay also for Computer courses (COC). However, in all these cases theeffect does not become significantly positive. The dynamics of the effects of LAC,BAC as well as EP have a similar shape, but remain significantly negative until theend of the observation period.
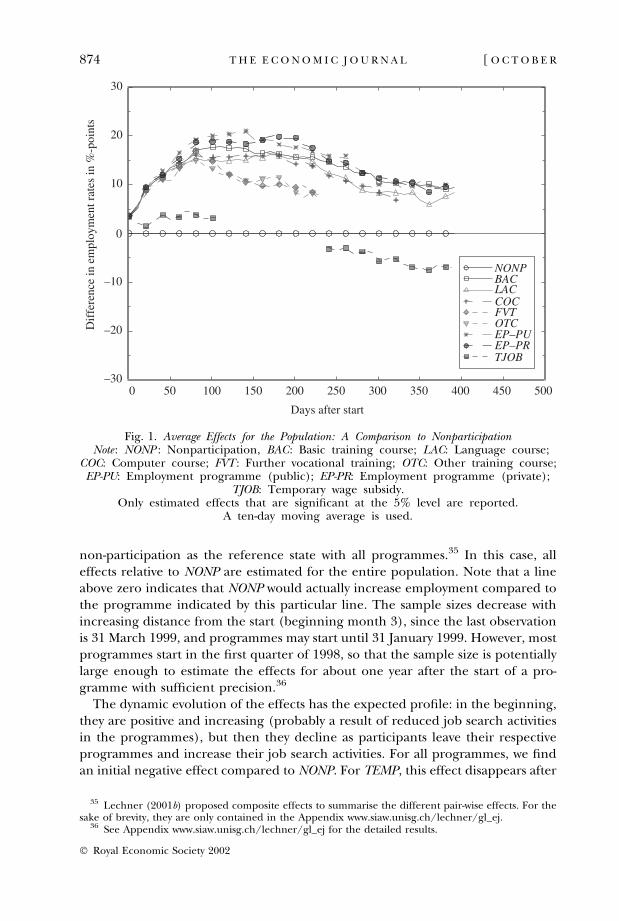
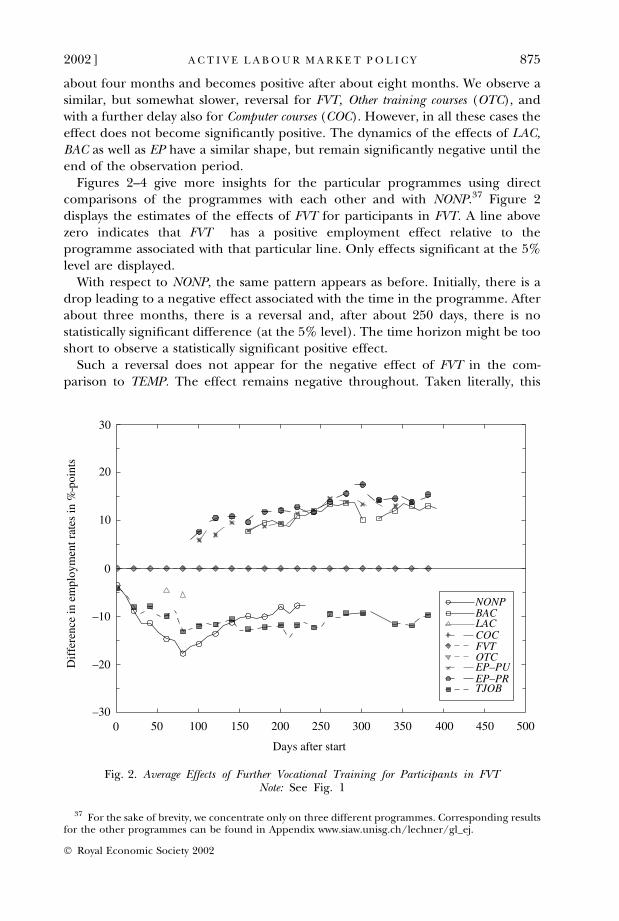
Figures 2–4 give more insights for the particular programmes using directcomparisons of the programmes with each other and with NONP.37 Figure 2displays the estimates of the effects of FVT for participants in FVT. A line abovezero indicates that FVT has a positive employment effect relative to theprogramme associated with that particular line. Only effects significant at the 5%level are displayed.
With respect to NONP, the same pattern appears as before. Initially, there is adrop leading to a negative effect associated with the time in the programme. Afterabout three months, there is a reversal and, after about 250 days, there is nostatistically significant difference (at the 5% level). The time horizon might be tooshort to observe a statistically significant positive effect.
Such a reversal does not appear for the negative effect of FVT in the com-parison to TEMP. The effect remains negative throughout. Taken literally, this
Dif
fere
nce
in e
mpl
oym
ent r
ates
in %
-poi
nts
Days after start
0 50 100 150 200 250 300 350 400 450 500
NONPBACLACCOCFVTOTCEP–PUEP–PRTJOB
30
20
10
0
–10
–20
–30
Fig. 2. Average Effects of Further Vocational Training for Participants in FVTNote: See Fig. 1
37 For the sake of brevity, we concentrate only on three different programmes. Corresponding resultsfor the other programmes can be found in Appendix www.siaw.unisg.ch/lechner/gl_ej.
2002] 875A C T I V E L A B O U R M A R K E T P O L I C Y
� Royal Economic Society 2002
means that the participants in FVT would have been better off if they wouldhave participated in TEMP instead. Comparisons with EP as well as with BAC showthat these programmes are all dominated by FVT after about three months.
Whereas the results for OTC are similar to those for FVT, the results for BAC aswell as for LAC differ substantially from the results for FVT. In both cases, weobserve similar dynamic patterns: with respect to NONP, the initial drop is some-what reversed over time, but remains significantly negative. They are alwaysdominated by TEMP and, after some time, they are also dominated by othertraining courses (FVT, OTC). COC are between FVT, OTC and BAC, LAC. They arepermanently dominated by TEMP, whereas the negative effect compared to non-participation disappears towards the end.
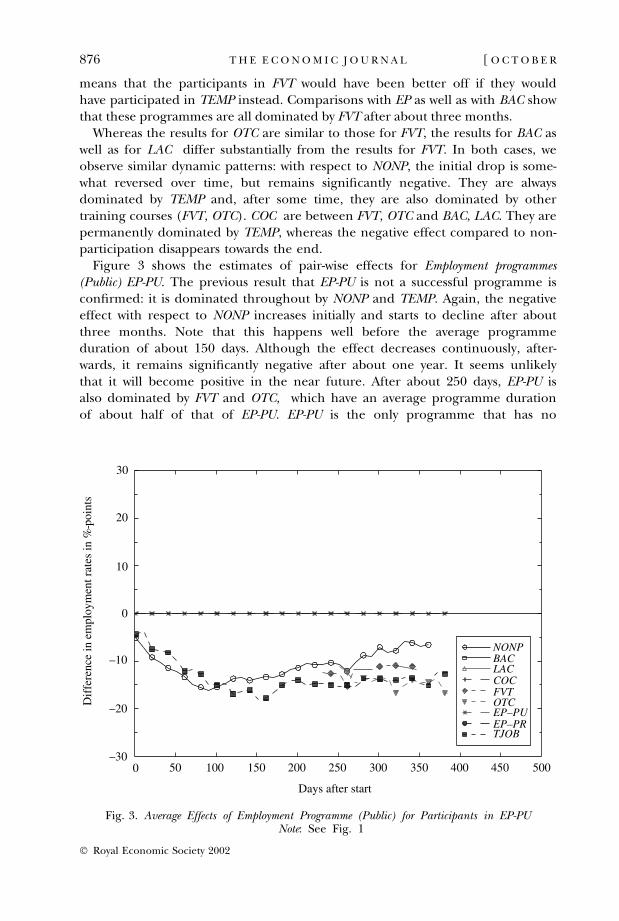
Figure 3 shows the estimates of pair-wise effects for Employment programmes(Public) EP-PU. The previous result that EP-PU is not a successful programme isconfirmed: it is dominated throughout by NONP and TEMP. Again, the negativeeffect with respect to NONP increases initially and starts to decline after aboutthree months. Note that this happens well before the average programmeduration of about 150 days. Although the effect decreases continuously, after-wards, it remains significantly negative after about one year. It seems unlikelythat it will become positive in the near future. After about 250 days, EP-PU isalso dominated by FVT and OTC, which have an average programme durationof about half of that of EP-PU. EP-PU is the only programme that has no
Dif
fere
nce
in e
mpl
oym
ent r
ates
in %
-poi
nts
Days after start
0 50 100 150 200 250 300 350 400 450 500
NONPBACLACCOCFVTOTCEP–PUEP–PRTJOB
30
20
10
0
–10
–20
–30
Fig. 3. Average Effects of Employment Programme (Public) for Participants in EP-PUNote: See Fig. 1
876 [ O C T O B E RT H E E C O N O M I C J O U R N A L
� Royal Economic Society 2002
positive effect at all. The results for EP-PR lead to the same conclusions as theones for EP-PU.
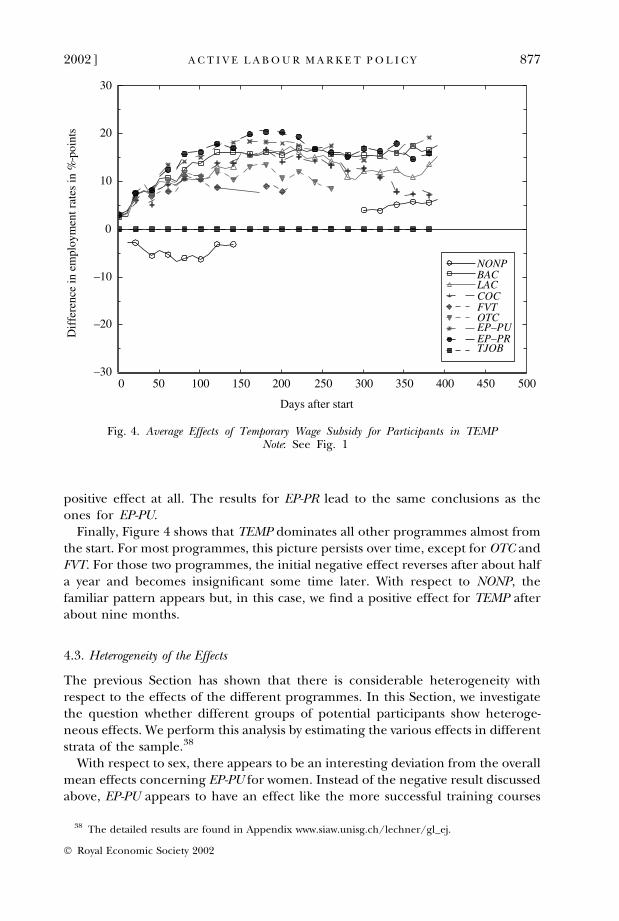
Finally, Figure 4 shows that TEMP dominates all other programmes almost fromthe start. For most programmes, this picture persists over time, except for OTC andFVT. For those two programmes, the initial negative effect reverses after about halfa year and becomes insignificant some time later. With respect to NONP, thefamiliar pattern appears but, in this case, we find a positive effect for TEMP afterabout nine months.
4.3. Heterogeneity of the Effects
The previous Section has shown that there is considerable heterogeneity withrespect to the effects of the different programmes. In this Section, we investigatethe question whether different groups of potential participants show heteroge-neous effects. We perform this analysis by estimating the various effects in differentstrata of the sample.38
With respect to sex, there appears to be an interesting deviation from the overallmean effects concerning EP-PU for women. Instead of the negative result discussedabove, EP-PU appears to have an effect like the more successful training courses
Dif
fere
nce
in e
mpl
oym
ent r
ates
in %
-poi
nts
Days after start
0 50 100 150 200 250 300 350 400 450 500
NONPBACLACCOCFVTOTCEP–PUEP–PRTJOB
30
20
10
0
–10
–20
–30
Fig. 4. Average Effects of Temporary Wage Subsidy for Participants in TEMPNote: See Fig. 1
38 The detailed results are found in Appendix www.siaw.unisg.ch/lechner/gl_ej.
2002] 877A C T I V E L A B O U R M A R K E T P O L I C Y
� Royal Economic Society 2002
(FVT, COC, OTC). This effect changes only for EP-PU, but not for EP-PR, for whichit remains as negative as for men and women together.
Several interesting differences appear with respect to nationality (Swiss or non-Swiss). First, a puzzling result is that LAC, have a large negative effect for the non-Swiss population. This is seriously at odds with our priors. We suspect that theobservable factors related to the participation of this population – such as the yearof entering the social security system, mother tongue, type of work permit andknowledge of language – may not be sufficient selectivity controls.
Second, we find larger positive effects of TEMP and COC for the non-Swisspopulation. This might be explained by the hypothesis that only foreigners withgood prospects are admitted to COC. However, we did not test whether thesedifferences are significant.
Considering two subgroups defined by the duration of the unemployment spellbefore the start of the programme (more or less than 270 days), a major differenceappears with respect to shape and level of the effect of NONP. For people with ashort unemployment spell, there is the familiar large negative initial effect. How-ever, for those being in unemployment for more than 270 days before the pro-grammes start the corresponding curve is much flatter. This different shape is, ofcourse, transferred to the results for all other programmes. For example, forTEMP, there is no initial negative effect. Furthermore, we find an earlier and largersignificant positive effect. From an economic point of view, these results are per-fectly compatible with the following consideration: assume that the average joboffer arrival rate is higher in the beginning of an unemployment spell. One reasoncould be a sorting argument: the ‘good’ unemployed find jobs earlier so, in thepopulation of long-term unemployed, there are predominantly people with badchances on the labour market. In that case, the cost of any programme in terms ofa reduction of the employment probability due to receiving less job offers during aprogramme are higher for the population that is at an early stage of theirunemployment spell. Put differently, it appears to be a bad idea to ‘lock awaythe unemployed in a programme’ while they have a high probability of finding ajob. After the returns to job search have fallen to a lower level, these indirectcosts of programme participation are much lower. There is a discussion of this‘lock-in’ effect in OECD (2001). Calculations for Finland, for example, clearlyillustrate why job seekers should not be referred to ALMP early in the unem-ployment spell.
4.4. Sensitivity
We checked our specification in several directions that could influence our overallconclusions.39 First, we used two more restricted versions of the covariance matrixof our multiple choice model:
(i) Only correlations between EP and TEMP allowed(ii) No correlations and homoscedasticity
39 Again, see Appendix www.siaw.unisg.ch/lechner/gl_ej for the detailed results.
878 [ O C T O B E RT H E E C O N O M I C J O U R N A L
� Royal Economic Society 2002
Furthermore, the number of replications has also been reduced to only 20. In allcases, the final evaluation results are surprisingly robust to the different resultingbalancing scores. The same holds true for matching with and without the variablesthat have been included in addition to the probabilities.
The second set of sensitivity checks relate to the outcome variables. When we use‘not unemployed’ instead of ‘employed’ as the outcome we obtain different resultscompared to NONP because this group contains the largest share of unemployedwho leave the labour force after being deregistered from the unemploymentregister. Therefore, using not unemployed as the outcome variable makes NONPthe most successful strategy, whereas the relative effects between the other groupsremain more or less the same.
Changing the start of measurement from the begin of a programme to the endof a programme can have serious consequences for some results (at least in theshort run) because of the already discussed endogeneity problem (successfulparticipants leaving the programme early into employment). The most interest-ing changes appear with respect to the effect of the EP-PR: after an initial positiveeffect compared to NONP for the first three months,40 we obtain a negative effectafter some time. In this case, it is more difficult to obtain precise estimatesbecause the number of observations is necessarily lower than in the standardcase. Furthermore, since matching takes only account of start dates and not ofend dates (because end dates are considered to be endogenous), these resultsmay be influenced by business cycles as well as seasonal effects. Due to theeconomic upswing after 1997, we would expect an upward bias in the effects ofthe Employment programmes, because the outcomes of the participants of the Em-ployment programme are measured considerably later than the outcomes of thenon-participants.
In another sensitivity check, the ‘standard’ results are compared to results thatare based on calendar time instead of time counted from the start of a pro-gramme. The mean effect is computed using all observations that already havestarted a programme. Therefore, these effects have a different interpretationbecause, initially, they are based on observations shortly after the start of theirprogramme. Over time more observations enter, but also the share of the ‘older’(measured as distance from start) observations, as well as the total number ofobservations, increases. We find effects that are similar to the ones already pre-sented.
There may be concerns that the unemployed with only temporary permitsmight leave the unemployment register and re-migrate to their home country. Inthat case, we would observe them as being out-of-the-labour-force. Another issuemight be that we want to consider the effects only for the so-called full-timeunemployed. Our results for the subsample of full-time unemployed who haveeither permanent permits or are Swiss citizens indicate, however, that the mainconclusions do not change for that subsample. Yet, the negative effects for theLACs are somewhat smaller than for the full sample. The results for women in
40 We use the starting date as the end date for non-participants, which means we require them toremain unemployed until the programme of the participant to whom he or she is matched ends.
2002] 879A C T I V E L A B O U R M A R K E T P O L I C Y
� Royal Economic Society 2002
that subgroup do not substantially deviate from the general findings for womenpresented above.
Additional sensitivity checks for a subgroup of the programmes can be found inLechner (2001d).
4.5. Summary of the Results
Perhaps the most important result of our evaluation study is that we find differenteffects for two different types of temporary employment programmes. On the onehand, there are traditional employment programmes. These programmes usuallytake place in a sheltered labour market that is not supposed to be in competition withthe regular labour market. For these programmes, we find significant negative effectscorresponding to results of evaluation studies for other countries. Our conjecture isthat the additional amount of human capital obtained in these programmes is toosmall to compensate for the initial negative effects due to reduced job search.
On the other hand, we find a successful temporary employment programme thatis unique. It is based on a wage subsidy scheme where the unemployed areencouraged to accept jobs that pay less than the unemployment benefit. Thedifference is overcompensated by payments from unemployment insurance. Jobs inthis programme are within the regular labour market. Here, our conjecture for thereasons for the positive effect is that working in a job in the competitive market isvalued by potential future employers because the unemployed still keep work-habitspecific human capital. The idea here is that working in a market environment isdifferent from the work environment in an employment programme intendedsolely for the unemployed. Carling and Richardson (2001) report similar findingsfor Sweden. They conclude that ‘the more regular work the participants are allowedto do, the better the program is relative to other ones’ (p. 27). Furthermore, thisprogramme could be used as a cheap screening device by future employers. Theycould use the programme to uncover otherwise unobserved characteristics andoffer regular jobs to ‘good’ programme participants.
As stated in Section 1, the OECD considers Temporary wage subsidy as a potentiallypowerful instrument. Our results indicate that this is true. However, there is concernregarding potential negative incentive effects of TEMP in terms of underbidding ofthe wages set in collective agreements and avoidance of dismissal protection. At thispoint, we do not have evidence as to whether these considerations are important.
To date, the only other econometric evaluation of the Swiss ALMP is by Laliveet al. (2000). Within their duration analysis framework, they allow for unobservedheterogeneity. Any such generalisation of CIA has a price in terms of additionalrestrictions at another place of the model (by basically restricting the effect ofobserved heterogeneity). They need a more restrictive specification of both theselection process into the programmes and of the dependence of the labourmarket outcomes on time and personal characteristics. Furthermore, the hetero-geneity of the effects among the participants and non-participants is tightlyrestricted compared to our approach. Given the good data available for this study,such assumptions seem to be an unnecessary high price to pay to allow forunobserved heterogeneity independent of observables. One of the main differ-
880 [ O C T O B E RT H E E C O N O M I C J O U R N A L
� Royal Economic Society 2002
ences compared to our results seems to be a positive effect for EP for women afterthe programme ended that dominates the initial negative effect during the pro-gramme.41
5. Conclusions
This paper provides a microeconometric evaluation of the different programmesof the Swiss ALMP. We focus on the differences of the chances to find a job thatare due to these programmes. The estimates are based on a rich databaseconstructed from administrative records of the unemployment as well as fromthe social insurance system. We use a matching estimator allowing for unre-stricted effect heterogeneity among the population as well as for heterogeneitywith respect to the different programmes of the Swiss active labour marketpolicy.
The results point to considerable effect heterogeneity both with respect todifferent programmes as well as with respect to different subpopulations. First,Employment programmes perform poorly. We attribute this to the fact that theresulting reduction of received job offers due to being in these comparativelylong programmes by far outweighs the gains in terms of additional workexperience provided by these programmes. An exception is women in Publicemployment programmes. Uncovering the reason for this exception will be left tofuture research.
Vocational training programmes show a rather mixed performance depending onthe specific sub-programmes considered. Although none of the programmes have apositive effect, Further vocational training, Other training courses, as well as Computercourses (in particular for foreigners) do not look bad. Future research shoulddisentangle these still heterogeneous groups of courses further, possibly to obtain amore precise picture of their effects. In contrast to these courses, Language courses aswell as Basic courses perform rather poorly. However, in particular with respect toLanguage courses, we suspect that the adjustment for the selection process could stillbe plagued by some remaining selection on unobservables.
Temporary wage subsidy appears to be the one clearly successful programme interms of increasing the chances in the labour market. However, there are someissues whether this programme has incentive effects leading to some undesirabledistortions in the labour market. The British New Deal programme also featuressubsidised employment appearing to be similar to the Temporary wage subsidy. Themain difference is that in the New Deal people in subsidised employment areexpected to stay with their employer when the subsidy period of six months hasexpired. The Swiss Temporary wage subsidy, on the other hand, is intended toencourage temporary employment while looking for a better job.
With respect to general heterogeneity by subpopulation, it appears that parti-cipating in a programme in the early stages of the unemployment spell is lesseffective than participating in later stages. We argue that this is due to the fact that
41 Lalive et al. (2000) treat the largest programme, TEMP, as a censored exit state and not as aprogramme.
2002] 881A C T I V E L A B O U R M A R K E T P O L I C Y
� Royal Economic Society 2002
participation reduces the number of offers received compared to non-participa-tion. This appears to be particularly damaging for people that would be goodmatches to these offers. With increasing duration of unemployment, sorting willhave already eliminated the best matches and hence the positive (human capitalenhancing) effect of the programme will be more important than the temporaryreduction of received job offers.
There are still shortcomings that could be improved in future work. The databasecould be extended in several immediate ways: first, it would be desirable to increasethe observation period to also identify longer-term effects of the programmes,second, having some information from the social security system for the period after1997 would allow us to take account of the quality of the jobs found in terms ofearnings and job stability, and third, having some data about the direct costs of theseprogrammes would be useful to perform some sort of cost–benefit analysis.
Here we concentrate on the effect of the first programme so as to avoid obviousendogeneity problems and ignore any further effects of a successive treatments. Infact, if there are any such effects, they are attributed to the first treatment. However,before the issues relating to the timing and spacing of various programmes as well asprogramme careers can be fruitfully evaluated, further methodological advances arenecessary that are beyond the scope of this study. The same is true for evaluating themacroeconomic effects of such programmes.
University of BernUniversity of St Gallen,Swiss Institute for International Economics and Applied Economic Research (SIAW)
Date of receipt of first submission: May 2000Date of receipt of final typescript: April 2002
Appendix A: Data
A.1. Aggregation of Training Courses
When defining the categories used in the estimation, we try to combine programmes thatare similar. Furthermore, the resulting groups should have a sufficient size in terms ofobservations. Still there remains some heterogeneity, especially in Other courses and tolesser extent in Further vocational training. Basic courses also is a rather heterogeneousgroup. See Table A1.
A.2. Sample Selection
The data selection process is performed in four steps as indicated in Table A2. The first steprelates to personal characteristics. With the age restriction, we want to avoid problems withschooling and early retirement options.
We exclude people who are long-term unemployed on 31 December 1997 (step 2) andwho have previously participated in employment programmes (step 3). Finally, we excludeall non-participants whose simulated programme starting point is later than their exit fromunemployment (see Section 2 for details).
882 [ O C T O B E RT H E E C O N O M I C J O U R N A L
� Royal Economic Society 2002
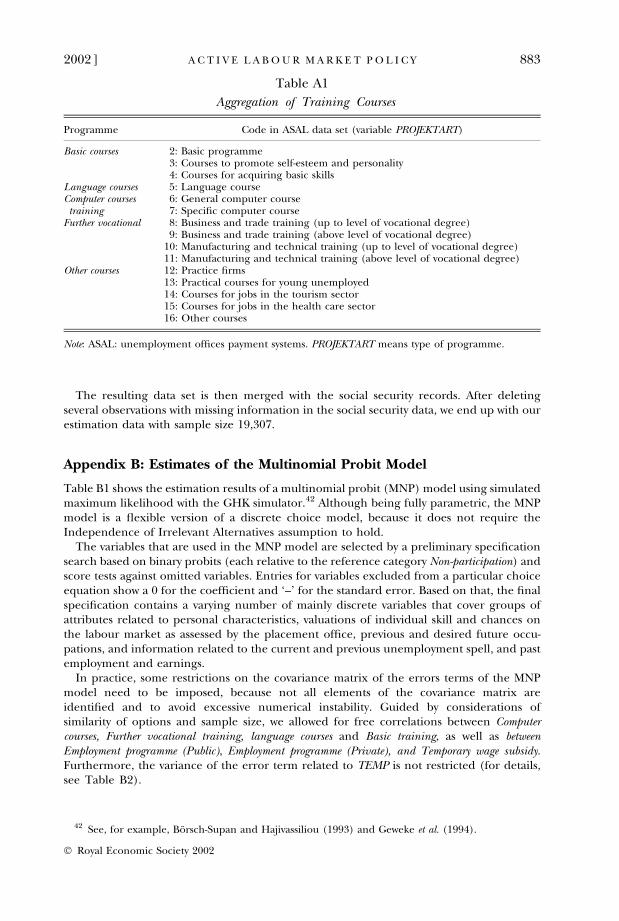
The resulting data set is then merged with the social security records. After deletingseveral observations with missing information in the social security data, we end up with ourestimation data with sample size 19,307.
Appendix B: Estimates of the Multinomial Probit Model
Table B1 shows the estimation results of a multinomial probit (MNP) model using simulatedmaximum likelihood with the GHK simulator.42 Although being fully parametric, the MNPmodel is a flexible version of a discrete choice model, because it does not require theIndependence of Irrelevant Alternatives assumption to hold.
The variables that are used in the MNP model are selected by a preliminary specificationsearch based on binary probits (each relative to the reference category Non-participation) andscore tests against omitted variables. Entries for variables excluded from a particular choiceequation show a 0 for the coefficient and ‘–’ for the standard error. Based on that, the finalspecification contains a varying number of mainly discrete variables that cover groups ofattributes related to personal characteristics, valuations of individual skill and chances onthe labour market as assessed by the placement office, previous and desired future occu-pations, and information related to the current and previous unemployment spell, and pastemployment and earnings.
In practice, some restrictions on the covariance matrix of the errors terms of the MNPmodel need to be imposed, because not all elements of the covariance matrix areidentified and to avoid excessive numerical instability. Guided by considerations ofsimilarity of options and sample size, we allowed for free correlations between Computercourses, Further vocational training, language courses and Basic training, as well as betweenEmployment programme (Public), Employment programme (Private), and Temporary wage subsidy.Furthermore, the variance of the error term related to TEMP is not restricted (for details,see Table B2).
Table A1
Aggregation of Training Courses
Programme Code in ASAL data set (variable PROJEKTART)
Basic courses 2: Basic programme3: Courses to promote self-esteem and personality4: Courses for acquiring basic skills
Language courses 5: Language courseComputer courses 6: General computer coursetraining 7: Specific computer course
Further vocational 8: Business and trade training (up to level of vocational degree)9: Business and trade training (above level of vocational degree)
10: Manufacturing and technical training (up to level of vocational degree)11: Manufacturing and technical training (above level of vocational degree)
Other courses 12: Practice firms13: Practical courses for young unemployed14: Courses for jobs in the tourism sector15: Courses for jobs in the health care sector16: Other courses
Note: ASAL: unemployment offices payment systems. PROJEKTART means type of programme.
42 See, for example, Borsch-Supan and Hajivassiliou (1993) and Geweke et al. (1994).
2002] 883A C T I V E L A B O U R M A R K E T P O L I C Y
� Royal Economic Society 2002
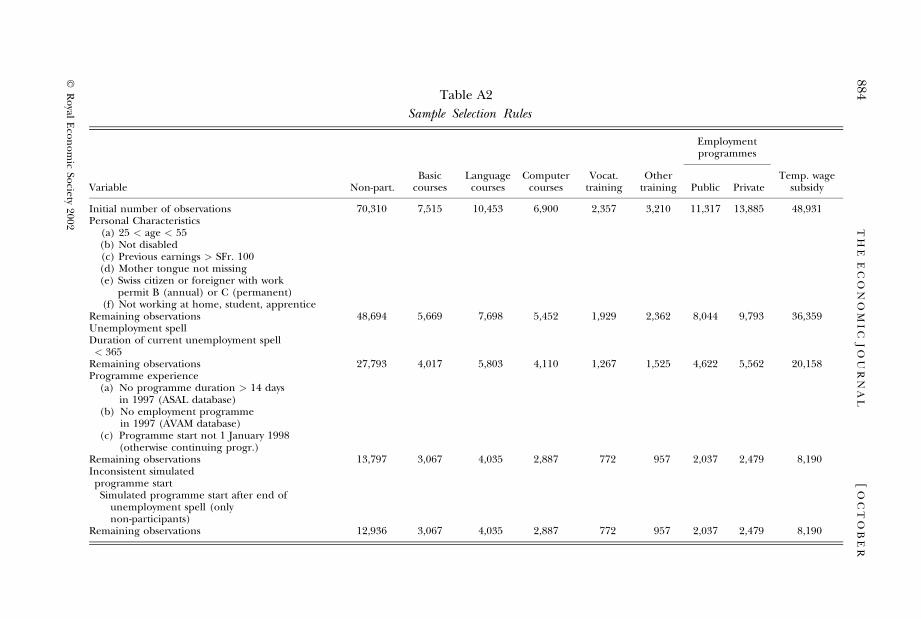
Table A2
Sample Selection Rules
Employmentprogrammes
Variable Non-part.Basic
coursesLanguage
coursesComputer
coursesVocat.
trainingOther
training Public PrivateTemp. wage
subsidy
Initial number of observations 70,310 7,515 10,453 6,900 2,357 3,210 11,317 13,885 48,931Personal Characteristics
(a) 25 < age < 55(b) Not disabled(c) Previous earnings > SFr. 100(d) Mother tongue not missing(e) Swiss citizen or foreigner with work
permit B (annual) or C (permanent)(f) Not working at home, student, apprentice
Remaining observations 48,694 5,669 7,698 5,452 1,929 2,362 8,044 9,793 36,359Unemployment spellDuration of current unemployment spell< 365
Remaining observations 27,793 4,017 5,803 4,110 1,267 1,525 4,622 5,562 20,158Programme experience
(a) No programme duration > 14 daysin 1997 (ASAL database)
(b) No employment programmein 1997 (AVAM database)
(c) Programme start not 1 January 1998(otherwise continuing progr.)
Remaining observations 13,797 3,067 4,035 2,887 772 957 2,037 2,479 8,190Inconsistent simulatedprogramme startSimulated programme start after end of
unemployment spell (onlynon-participants)
Remaining observations 12,936 3,067 4,035 2,887 772 957 2,037 2,479 8,190
884[
OC
TO
BE
RT
HE
EC
ON
OM
IC
JO
UR
NA
L
�R
oyal
Eco
no
mic
Society
2002
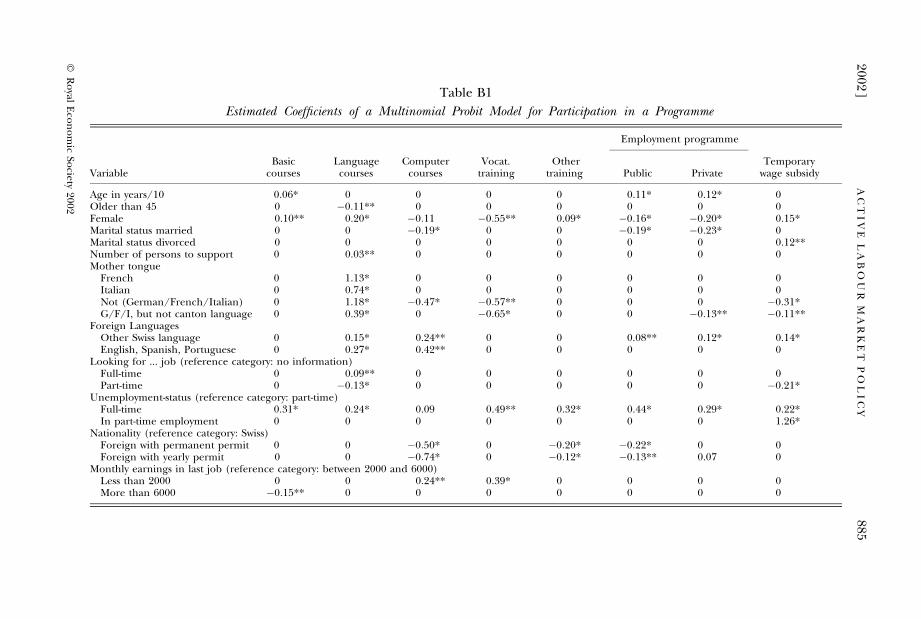
Table B1
Estimated Coefficients of a Multinomial Probit Model for Participation in a Programme
Employment programme
VariableBasic
coursesLanguagecourses
Computercourses
Vocat.training
Othertraining Public Private
Temporarywage subsidy
Age in years/10 0.06* 0 0 0 0 0.11* 0.12* 0Older than 45 0 �0:11** 0 0 0 0 0 0Female 0.10** 0.20* �0:11 �0:55** 0.09* �0:16* �0:20* 0.15*Marital status married 0 0 �0:19* 0 0 �0:19* �0:23* 0Marital status divorced 0 0 0 0 0 0 0 0.12**Number of persons to support 0 0.03** 0 0 0 0 0 0Mother tongue
French 0 1.13* 0 0 0 0 0 0Italian 0 0.74* 0 0 0 0 0 0Not (German/French/Italian) 0 1.18* �0:47* �0:57** 0 0 0 �0:31*G/F/I, but not canton language 0 0.39* 0 �0:65* 0 0 �0:13** �0:11**
Foreign LanguagesOther Swiss language 0 0.15* 0.24** 0 0 0.08** 0.12* 0.14*English, Spanish, Portuguese 0 0.27* 0.42** 0 0 0 0 0
Looking for ... job (reference category: no information)Full-time 0 0.09** 0 0 0 0 0 0Part-time 0 �0:13* 0 0 0 0 0 �0:21*
Unemployment-status (reference category: part-time)Full-time 0.31* 0.24* 0.09 0.49** 0.32* 0.44* 0.29* 0.22*In part-time employment 0 0 0 0 0 0 0 1.26*
Nationality (reference category: Swiss)Foreign with permanent permit 0 0 �0:50* 0 �0:20* �0:22* 0 0Foreign with yearly permit 0 0 �0:74* 0 �0:12* �0:13** 0.07 0
Monthly earnings in last job (reference category: between 2000 and 6000)Less than 2000 0 0 0.24** 0.39* 0 0 0 0More than 6000 �0:15** 0 0 0 0 0 0 0
2002]
885A
CT
IV
EL
AB
OU
RM
AR
KE
TP
OL
IC
Y
�R
oyal
Eco
no
mic
Society
2002
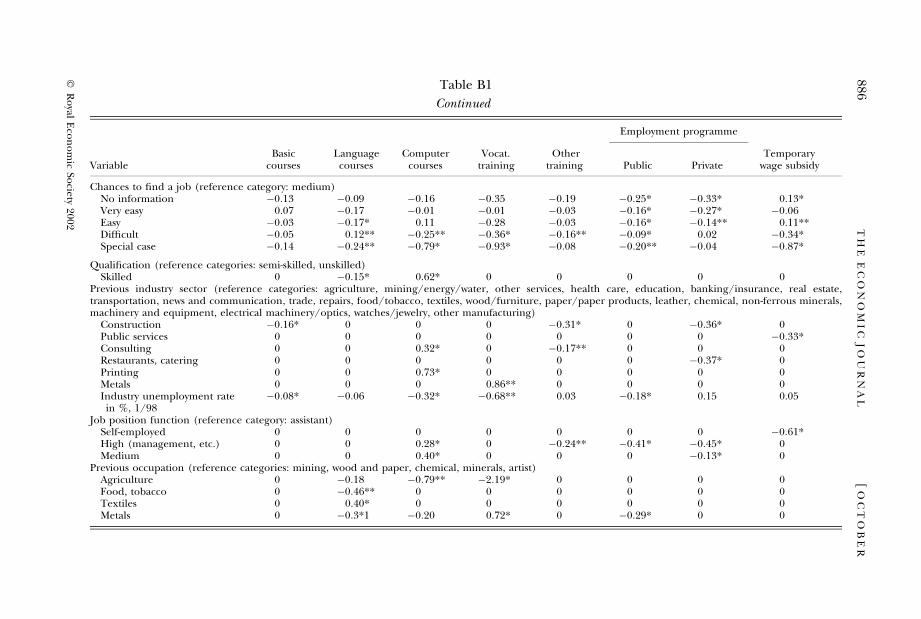
Table B1
Continued
Employment programme
VariableBasic
coursesLanguagecourses
Computercourses
Vocat.training
Othertraining Public Private
Temporarywage subsidy
Chances to find a job (reference category: medium)No information �0:13 �0:09 �0:16 �0:35 �0:19 �0:25* �0:33* 0.13*Very easy 0.07 �0:17 �0:01 �0:01 �0:03 �0:16* �0:27* �0:06Easy �0:03 �0:17* 0.11 �0:28 �0:03 �0:16* �0:14** 0.11**Difficult �0:05 0.12** �0:25** �0:36* �0:16** �0:09* 0.02 �0:34*Special case �0:14 �0:24** �0:79* �0:93* �0:08 �0:20** �0:04 �0:87*
Qualification (reference categories: semi-skilled, unskilled)Skilled 0 �0:15* 0.62* 0 0 0 0 0
Previous industry sector (reference categories: agriculture, mining/energy/water, other services, health care, education, banking/insurance, real estate,transportation, news and communication, trade, repairs, food/tobacco, textiles, wood/furniture, paper/paper products, leather, chemical, non-ferrous minerals,machinery and equipment, electrical machinery/optics, watches/jewelry, other manufacturing)
Construction �0:16* 0 0 0 �0:31* 0 �0:36* 0Public services 0 0 0 0 0 0 0 �0:33*Consulting 0 0 0.32* 0 �0:17** 0 0 0Restaurants, catering 0 0 0 0 0 0 �0:37* 0Printing 0 0 0.73* 0 0 0 0 0Metals 0 0 0 0.86** 0 0 0 0Industry unemployment ratein %, 1/98
�0:08* �0:06 �0:32* �0:68** 0.03 �0:18* 0.15 0.05
Job position function (reference category: assistant)Self-employed 0 0 0 0 0 0 0 �0:61*High (management, etc.) 0 0 0.28* 0 �0:24** �0:41* �0:45* 0Medium 0 0 0.40* 0 0 0 �0:13* 0
Previous occupation (reference categories: mining, wood and paper, chemical, minerals, artist)Agriculture 0 �0:18 �0:79** �2:19* 0 0 0 0Food, tobacco 0 �0:46** 0 0 0 0 0 0Textiles 0 0.40* 0 0 0 0 0 0Metals 0 �0:3*1 �0:20 0.72* 0 �0:29* 0 0
886[
OC
TO
BE
RT
HE
EC
ON
OM
IC
JO
UR
NA
L
�R
oyal
Eco
no
mic
Society
2002
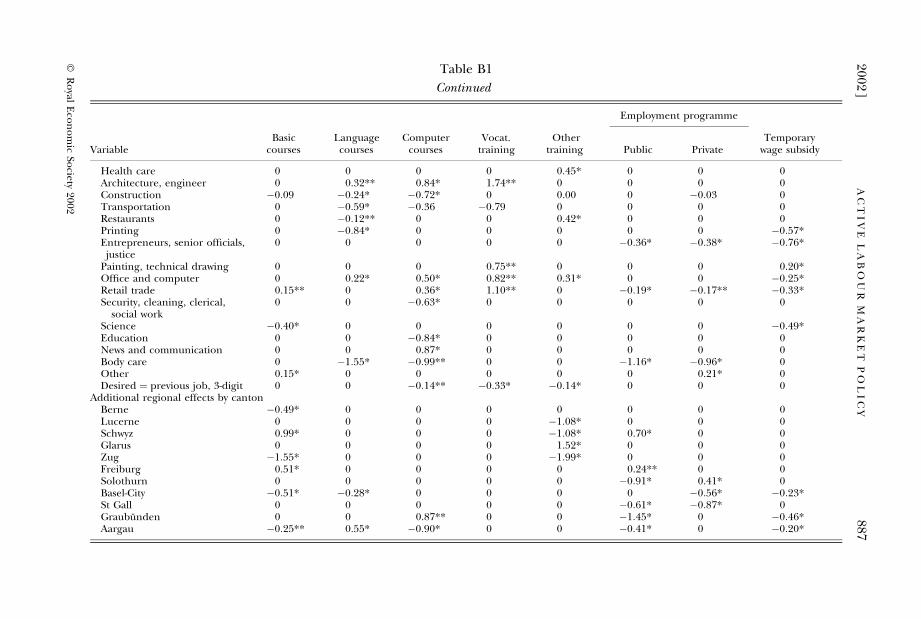
Table B1
Continued
Employment programme
VariableBasic
coursesLanguagecourses
Computercourses
Vocat.training
Othertraining Public Private
Temporarywage subsidy
Health care 0 0 0 0 0.45* 0 0 0Architecture, engineer 0 0.32** 0.84* 1.74** 0 0 0 0Construction �0:09 �0:24* �0:72* 0 0.00 0 �0:03 0Transportation 0 �0:59* �0:36 �0:79 0 0 0 0Restaurants 0 �0:12** 0 0 0.42* 0 0 0Printing 0 �0:84* 0 0 0 0 0 �0:57*Entrepreneurs, senior officials,justice
0 0 0 0 0 �0:36* �0:38* �0:76*
Painting, technical drawing 0 0 0 0.75** 0 0 0 0.20*Office and computer 0 0.22* 0.50* 0.82** 0.31* 0 0 �0:25*Retail trade 0.15** 0 0.36* 1.10** 0 �0:19* �0:17** �0:33*Security, cleaning, clerical,
social work0 0 �0:63* 0 0 0 0 0
Science �0:40* 0 0 0 0 0 0 �0:49*Education 0 0 �0:84* 0 0 0 0 0News and communication 0 0 0.87* 0 0 0 0 0Body care 0 �1:55* �0:99** 0 0 �1:16* �0:96* 0Other 0.15* 0 0 0 0 0 0.21* 0Desired ¼ previous job, 3-digit 0 0 �0:14** �0:33* �0:14* 0 0 0
Additional regional effects by cantonBerne �0:49* 0 0 0 0 0 0 0Lucerne 0 0 0 0 �1:08* 0 0 0Schwyz 0.99* 0 0 0 �1:08* 0.70* 0 0Glarus 0 0 0 0 1.52* 0 0 0Zug �1:55* 0 0 0 �1:99* 0 0 0Freiburg 0.51* 0 0 0 0 0.24** 0 0Solothurn 0 0 0 0 0 �0:91* 0.41* 0Basel-City �0:51* �0:28* 0 0 0 0 �0:56* �0:23*St Gall 0 0 0 0 0 �0:61* �0:87* 0Graubunden 0 0 0.87** 0 0 �1:45* 0 �0:46*Aargau �0:25** 0.55* �0:90* 0 0 �0:41* 0 �0:20*
2002]
887A
CT
IV
EL
AB
OU
RM
AR
KE
TP
OL
IC
Y
�R
oyal
Eco
no
mic
Society
2002
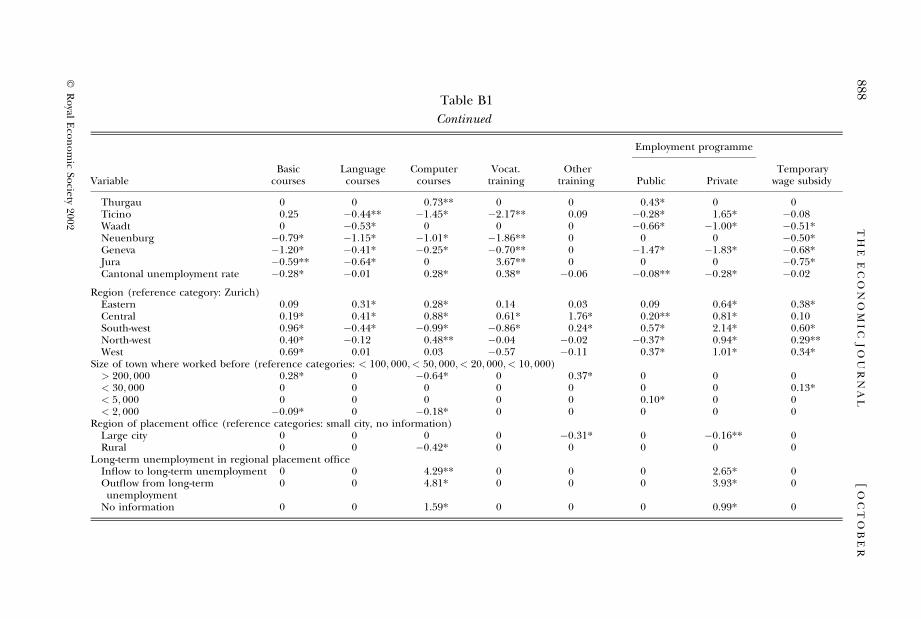
Table B1
Continued
Employment programme
VariableBasic
coursesLanguagecourses
Computercourses
Vocat.training
Othertraining Public Private
Temporarywage subsidy
Thurgau 0 0 0.73** 0 0 0.43* 0 0Ticino 0.25 �0:44** �1:45* �2:17** 0.09 �0:28* 1.65* �0:08Waadt 0 �0:53* 0 0 0 �0:66* �1:00* �0:51*Neuenburg �0:79* �1:15* �1:01* �1:86** 0 0 0 �0:50*Geneva �1:20* �0:41* �0:25* �0:70** 0 �1:47* �1:83* �0:68*Jura �0:59** �0:64* 0 3.67** 0 0 0 �0:75*Cantonal unemployment rate �0:28* �0:01 0.28* 0.38* �0:06 �0:08** �0:28* �0:02
Region (reference category: Zurich)Eastern 0.09 0.31* 0.28* 0.14 0.03 0.09 0.64* 0.38*Central 0.19* 0.41* 0.88* 0.61* 1.76* 0.20** 0.81* 0.10South-west 0.96* �0:44* �0:99* �0:86* 0.24* 0.57* 2.14* 0.60*North-west 0.40* �0:12 0.48** �0:04 �0:02 �0:37* 0.94* 0.29**West 0.69* 0.01 0.03 �0:57 �0:11 0.37* 1.01* 0.34*
Size of town where worked before (reference categories: < 100; 000; < 50; 000; < 20; 000; < 10; 000)> 200; 000 0.28* 0 �0:64* 0 0.37* 0 0 0< 30; 000 0 0 0 0 0 0 0 0.13*< 5; 000 0 0 0 0 0 0.10* 0 0< 2; 000 �0:09* 0 �0:18* 0 0 0 0 0
Region of placement office (reference categories: small city, no information)Large city 0 0 0 0 �0:31* 0 �0:16** 0Rural 0 0 �0:42* 0 0 0 0 0
Long-term unemployment in regional placement officeInflow to long-term unemployment 0 0 4.29** 0 0 0 2.65* 0Outflow from long-termunemployment
0 0 4.81* 0 0 0 3.93* 0
No information 0 0 1.59* 0 0 0 0.99* 0
888[
OC
TO
BE
RT
HE
EC
ON
OM
IC
JO
UR
NA
L
�R
oyal
Eco
no
mic
Society
2002
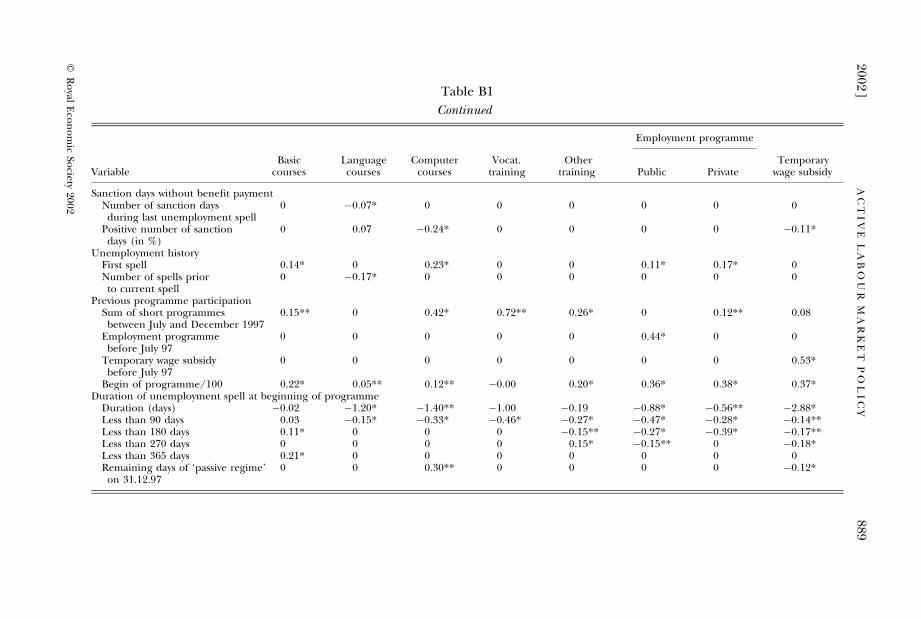
Table B1
Continued
Employment programme
VariableBasic
coursesLanguagecourses
Computercourses
Vocat.training
Othertraining Public Private
Temporarywage subsidy
Sanction days without benefit paymentNumber of sanction daysduring last unemployment spell
0 �0:07* 0 0 0 0 0 0
Positive number of sanctiondays (in %)
0 0.07 �0:24* 0 0 0 0 �0:11*
Unemployment historyFirst spell 0.14* 0 0.23* 0 0 0.11* 0.17* 0Number of spells priorto current spell
0 �0:17* 0 0 0 0 0 0
Previous programme participationSum of short programmesbetween July and December 1997
0.15** 0 0.42* 0.72** 0.26* 0 0.12** 0.08
Employment programmebefore July 97
0 0 0 0 0 0.44* 0 0
Temporary wage subsidybefore July 97
0 0 0 0 0 0 0 0.53*
Begin of programme/100 0.22* 0.05** 0.12** �0:00 0.20* 0.36* 0.38* 0.37*Duration of unemployment spell at beginning of programme
Duration (days) �0:02 �1:20* �1:40** �1:00 �0:19 �0:88* �0:56** �2:88*Less than 90 days 0.03 �0:15* �0:33* �0:46* �0:27* �0:47* �0:28* �0:14**Less than 180 days 0.11* 0 0 0 �0:15** �0:27* �0:39* �0:17**Less than 270 days 0 0 0 0 0.15* �0:15** 0 �0:18*Less than 365 days 0.21* 0 0 0 0 0 0 0Remaining days of ‘passive regime’on 31.12.97
0 0 0.30** 0 0 0 0 �0:12*
2002]
889A
CT
IV
EL
AB
OU
RM
AR
KE
TP
OL
IC
Y
�R
oyal
Eco
no
mic
Society
2002
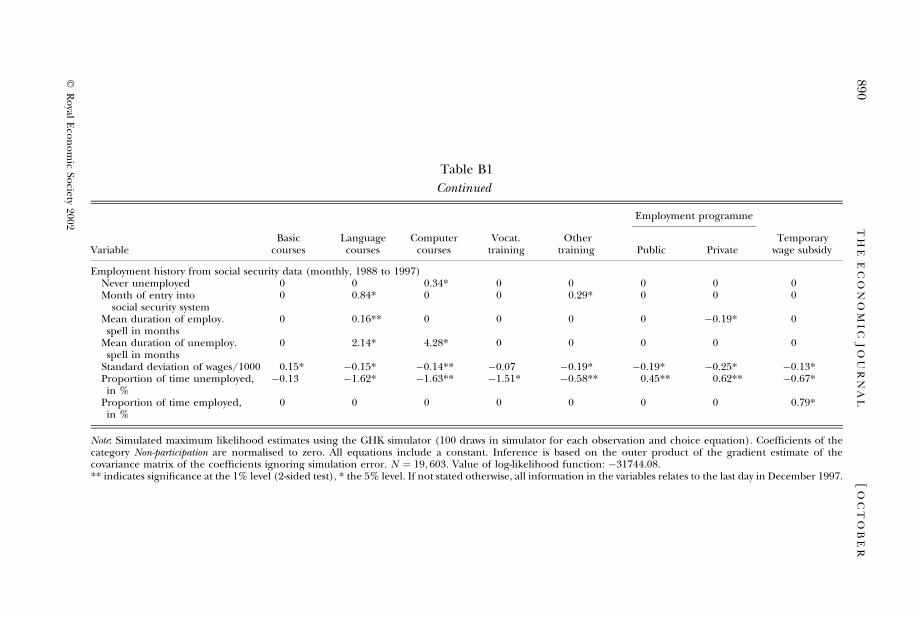
Table B1
Continued
Employment programme
VariableBasic
coursesLanguagecourses
Computercourses
Vocat.training
Othertraining Public Private
Temporarywage subsidy
Employment history from social security data (monthly, 1988 to 1997)Never unemployed 0 0 0.34* 0 0 0 0 0Month of entry into
social security system0 0.84* 0 0 0.29* 0 0 0
Mean duration of employ.spell in months
0 0.16** 0 0 0 0 �0:19* 0
Mean duration of unemploy.spell in months
0 2.14* 4.28* 0 0 0 0 0
Standard deviation of wages/1000 0.15* �0:15* �0:14** �0:07 �0:19* �0:19* �0:25* �0:13*Proportion of time unemployed,in %
�0:13 �1:62* �1:63** �1:51* �0:58** 0.45** 0.62** �0:67*
Proportion of time employed,in %
0 0 0 0 0 0 0 0.79*
Note: Simulated maximum likelihood estimates using the GHK simulator (100 draws in simulator for each observation and choice equation). Coefficients of thecategory Non-participation are normalised to zero. All equations include a constant. Inference is based on the outer product of the gradient estimate of thecovariance matrix of the coefficients ignoring simulation error. N ¼ 19; 603. Value of log-likelihood function: �31744:08.** indicates significance at the 1% level (2-sided test), * the 5% level. If not stated otherwise, all information in the variables relates to the last day in December 1997.
890[
OC
TO
BE
RT
HE
EC
ON
OM
IC
JO
UR
NA
L
�R
oyal
Eco
no
mic
Society
2002
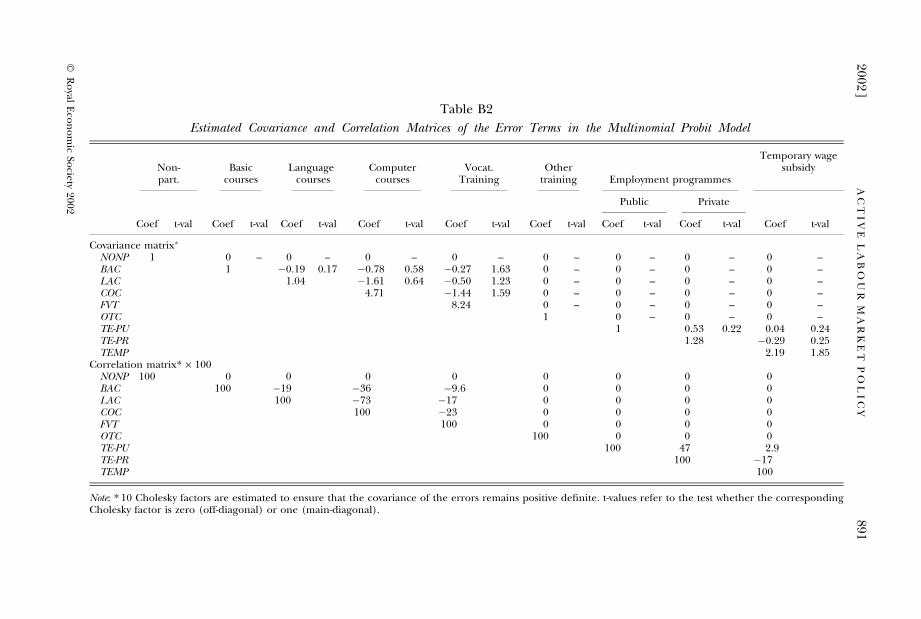
Table B2
Estimated Covariance and Correlation Matrices of the Error Terms in the Multinomial Probit Model
Non-part.
Basiccourses
Languagecourses
Computercourses
Vocat.Training
Othertraining Employment programmes
Temporary wagesubsidy
Public Private
Coef t-val Coef t-val Coef t-val Coef t-val Coef t-val Coef t-val Coef t-val Coef t-val Coef t-val
Covariance matrix�
NONP 1 0 – 0 – 0 – 0 – 0 – 0 – 0 – 0 –BAC 1 �0.19 0.17 �0.78 0.58 �0.27 1.63 0 – 0 – 0 – 0 –LAC 1.04 �1.61 0.64 �0.50 1.23 0 – 0 – 0 – 0 –COC 4.71 �1.44 1.59 0 – 0 – 0 – 0 –FVT 8.24 0 – 0 – 0 – 0 –OTC 1 0 – 0 – 0 –TE-PU 1 0.53 0.22 0.04 0.24TE-PR 1.28 �0.29 0.25TEMP 2.19 1.85
Correlation matrix* · 100NONP 100 0 0 0 0 0 0 0 0BAC 100 �19 �36 �9.6 0 0 0 0LAC 100 �73 �17 0 0 0 0COC 100 �23 0 0 0 0FVT 100 0 0 0 0OTC 100 0 0 0TE-PU 100 47 2.9TE-PR 100 �17TEMP 100
Note: * 10 Cholesky factors are estimated to ensure that the covariance of the errors remains positive definite. t-values refer to the test whether the correspondingCholesky factor is zero (off-diagonal) or one (main-diagonal).
2002]
891A
CT
IV
EL
AB
OU
RM
AR
KE
TP
OL
IC
Y
�R
oyal
Eco
no
mic
Society
2002
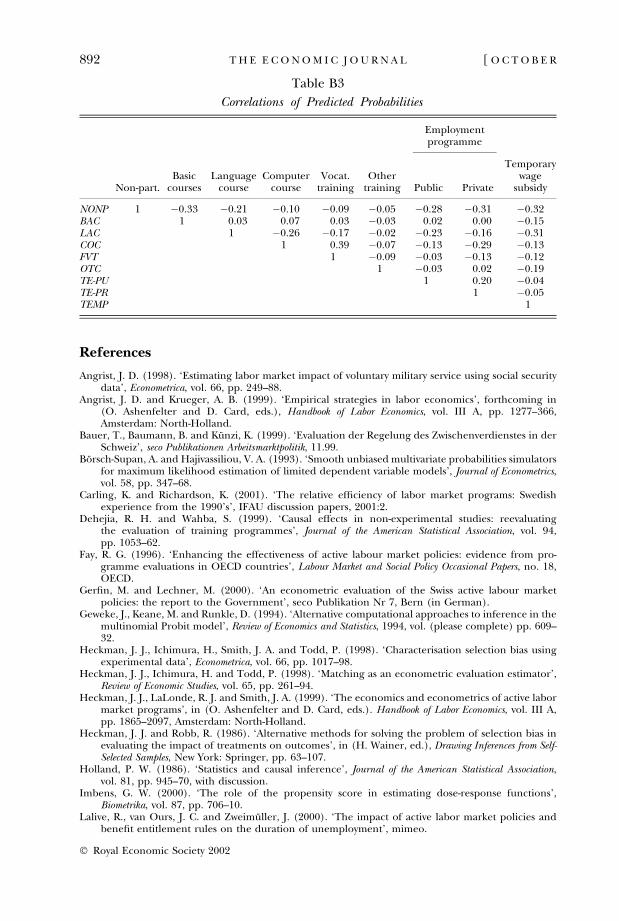
References
Angrist, J. D. (1998). ‘Estimating labor market impact of voluntary military service using social securitydata’, Econometrica, vol. 66, pp. 249–88.
Angrist, J. D. and Krueger, A. B. (1999). ‘Empirical strategies in labor economics’, forthcoming in(O. Ashenfelter and D. Card, eds.), Handbook of Labor Economics, vol. III A, pp. 1277–366,Amsterdam: North-Holland.
Bauer, T., Baumann, B. and Kunzi, K. (1999). ‘Evaluation der Regelung des Zwischenverdienstes in derSchweiz’, seco Publikationen Arbeitsmarktpolitik, 11.99.
Borsch-Supan, A. and Hajivassiliou, V. A. (1993). ‘Smooth unbiased multivariate probabilities simulatorsfor maximum likelihood estimation of limited dependent variable models’, Journal of Econometrics,vol. 58, pp. 347–68.
Carling, K. and Richardson, K. (2001). ‘The relative efficiency of labor market programs: Swedishexperience from the 1990’s’, IFAU discussion papers, 2001:2.
Dehejia, R. H. and Wahba, S. (1999). ‘Causal effects in non-experimental studies: reevaluatingthe evaluation of training programmes’, Journal of the American Statistical Association, vol. 94,pp. 1053–62.
Fay, R. G. (1996). ‘Enhancing the effectiveness of active labour market policies: evidence from pro-gramme evaluations in OECD countries’, Labour Market and Social Policy Occasional Papers, no. 18,OECD.
Gerfin, M. and Lechner, M. (2000). ‘An econometric evaluation of the Swiss active labour marketpolicies: the report to the Government’, seco Publikation Nr 7, Bern (in German).
Geweke, J., Keane, M. and Runkle, D. (1994). ‘Alternative computational approaches to inference in themultinomial Probit model’, Review of Economics and Statistics, 1994, vol. (please complete) pp. 609–32.
Heckman, J. J., Ichimura, H., Smith, J. A. and Todd, P. (1998). ‘Characterisation selection bias usingexperimental data’, Econometrica, vol. 66, pp. 1017–98.
Heckman, J. J., Ichimura, H. and Todd, P. (1998). ‘Matching as an econometric evaluation estimator’,Review of Economic Studies, vol. 65, pp. 261–94.
Heckman, J. J., LaLonde, R. J. and Smith, J. A. (1999). ‘The economics and econometrics of active labormarket programs’, in (O. Ashenfelter and D. Card, eds.). Handbook of Labor Economics, vol. III A,pp. 1865–2097, Amsterdam: North-Holland.
Heckman, J. J. and Robb, R. (1986). ‘Alternative methods for solving the problem of selection bias inevaluating the impact of treatments on outcomes’, in (H. Wainer, ed.), Drawing Inferences from Self-Selected Samples, New York: Springer, pp. 63–107.
Holland, P. W. (1986). ‘Statistics and causal inference’, Journal of the American Statistical Association,vol. 81, pp. 945–70, with discussion.
Imbens, G. W. (2000). ‘The role of the propensity score in estimating dose-response functions’,Biometrika, vol. 87, pp. 706–10.
Lalive, R., van Ours, J. C. and Zweimuller, J. (2000). ‘The impact of active labor market policies andbenefit entitlement rules on the duration of unemployment’, mimeo.
Table B3
Correlations of Predicted Probabilities
Employmentprogramme
Non-part.Basic
coursesLanguage
courseComputer
courseVocat.
trainingOther
training Public Private
Temporarywage
subsidy
NONP 1 �0.33 �0.21 �0.10 �0.09 �0.05 �0.28 �0.31 �0.32BAC 1 0.03 0.07 0.03 �0.03 0.02 0.00 �0.15LAC 1 �0.26 �0.17 �0.02 �0.23 �0.16 �0.31COC 1 0.39 �0.07 �0.13 �0.29 �0.13FVT 1 �0.09 �0.03 �0.13 �0.12OTC 1 �0.03 0.02 �0.19TE-PU 1 0.20 �0.04TE-PR 1 �0.05TEMP 1
892 [ O C T O B E RT H E E C O N O M I C J O U R N A L
� Royal Economic Society 2002
LaLonde, R. J. (1986). ‘Evaluating the econometric evaluations of training programs with experimentaldata’, American Economic Review, vol. 76, pp. 604–20.
Lechner, M. (1999). ‘Earnings and employment effects of continuous off-the-job training in EastGermany after unification’, Journal of Business and Economic Statistics, vol. 17, pp. 74–90.
Lechner, M. (2000). ‘An evaluation of public sector sponsored continuous vocational training programsin East Germany’, Journal of Human Resources, vol. 35, pp. 347–75.
Lechner, M. (2001a). ‘Identification and estimation of causal effects of multiple treatments under theconditional independence assumption’, in (M. Lechner and F. Pfeiffer, eds.), Econometric Evaluationof Active Labour Market Policies, Heidelberg: Physica, pp. 43–58.
Lechner, M. (2001b). ‘Programme heterogeneity and propensity score matching: an application to theevaluation of active labour market policies’, forthcoming in The Review of Economics and Statistics.
Lechner, M. (2001c). ‘A note on the common support problem in applied evaluation studies’,Discussion Paper 2001-01, Department of Economics, University of St. Gallen.
Lechner, M. (2001d). ‘Some practical issues in the evaluation of heterogeneous labour market pro-grammes by matching methods’, forthcoming in the Journal of the Royal Statistical Society – Series A.
McFadden, D. (1984). ‘Econometric analysis of qualitative response models’, in (Z. Griliches andM. D. Intriligator, eds.), Handbook of Econometrics, vol. 2, Amsterdam: North Holland. pp. 1396–457.
OECD (1996). Labour Market Policies in Switzerland, Paris.OECD (2001). Labour Market Policies and the Public Employment Service, Paris.Rosenbaum, P. R. and Rubin, D. B. (1983). ‘The central role of the propensity score in observational
studies for causal effects’, Biometrika, vol. 70, pp. 41–50.Rosenbaum, P. R. and Rubin, D. B. (1985). ‘Constructing a control group using multivariate matched
sampling methods that incorporate the propensity score’, The American Statistician, vol. 39, pp. 33–8.Roy, A. D. (1951). ‘Some thoughts on the distribution of earnings’, Oxford Economic Papers, vol. 3,
pp. 135–46.Rubin, D. B. (1974). ‘Estimating causal effects of treatments in randomized and nonrandomized
studies’, Journal of Educational Psychology, vol. 66, pp. 688–701.Rubin, D. B. (1977). ‘Assignment to treatment group on the basis of a covariate’, Journal of Educational
Statistics, vol. 2, pp. 1–26.Rubin, D. B. (1991). ‘Practical implications of modes of statistical inference for causal effects and the
critical role of the assignment mechanism’, Biometrics, vol. 47, pp. 1213–34.Smith, J. A. and Todd, P. (2001). ‘Does matching overcome Lalonde’s critique of nonexperimental
estimators?’, forthcoming in the Journal of Econometrics.
2002] 893A C T I V E L A B O U R M A R K E T P O L I C Y
� Royal Economic Society 2002