Treatment of chronic mountain sickness: Critical reappraisal of an old problem
Upload
independentCategory
view
1download
0
A Microeconometric Evaluation of Rehabilitation ofLong-term Sickness in Sweden
Markus Frölich +, Almas Heshmati ++, and Michael Lechner + *
+ University of St. Gallen, Swiss Institute for International Economicsand Applied Economic Research (SIAW)
++ Stockholm School of Economics, Department of Economic Statistics
First draft: August 1999, Last changes: July 5, 2000Date this version has been printed: 5-Jul-00
Abstract
In this study the effects of various types of rehabilitation programmes on different labour market
and health related outcomes are estimated. The main feature of this study, compared to previous
research, is that it jointly evaluates multiple treatments by nonparametric matching estimators.
The study is based on a sample of 6287 persons in western Sweden who are long-term sick ob-
served during 1991 to 1994 and could participate in rehabilitation programmes. Our results sug-
gest that work-place training is superior to the other rehabilitation programmes with respect to
labour market outcomes. However, no positive effects of rehabilitation compared to non-
participation are found.
Keywords: Programme evaluation, matching, multiple treatments, multi-programme causal
models, long-term sickness, vocational rehabilitation, Swedish labour markets.
JEL classification: C50, H43, I12, J26, J31 * Almas Heshmati is grateful to Service Research Forum (TjänsteForum) and the RFV for financial assistance. Mi-
chael Lechner gratefully acknowledges support from the Swiss National Science Foundation (grant NFP 12-53735.18). Part of this work has been completed while Michael Lechner visited the Stockholm School of Eco-nomics and while Almas Heshmati visited the SIAW at the University of St. Gallen. We thank TjänsteForum andthe CEMS programme for making these stays possible. We thank Lars-Gunnar Engström and Maud Capelle forcompetent help with the data and excellent research assistance. Furthermore, we thank Ylva Eklund, Eva-MariaMagnusson and Lisa Lindell of the RFV, Sweden, for their patient explanations of the institutional details. Wealso thank Prof. Juan José Dolado for comments and suggestions. This paper has been presented by MarkusFrölich at the annual congress of the Swiss Society of Statistics and Economics, March 23, 2000 in Solothurn,Switzerland and at the EALE/SOLE World Conference, June 23, 2000 in Milan, Italy.Addresses for correspondence: Markus Frölich and Michael Lechner, Swiss Institute for International Economicsand Applied Economic Research (SIAW), University of St. Gallen, Dufourstrasse 48, CH-9000 St. Gallen, Swit-zerland, [email protected], [email protected], www.siaw.unisg.ch/lechner; Almas Heshmati,Department of Economic Statistics, Stockholm School of Economics, Box 6501, S-113 83 Stockholm, Sweden,[email protected], www.hhs.se/personal/heshmati.
2
1 Introduction
With the beginning of 1991 a substantial reform process was initiated in the Swedish rehabilita-
tion policy, which led to a remarkable expansion in vocational rehabilitation activities in Swe-
den.1 Rigorous evaluation of the successfulness of rehabilitative activities in Sweden in reinte-
grating individuals into the labour market has been limited so far. The major reasons for this lack
could be data availability problems and methodological difficulties. These difficulties arise be-
cause in practice local managers of rehabilitative programmes may select programme participants
in such a way as to enhance successful programme outcomes, or alternatively select participants
with severe illnesses and little prospects on successful outcomes. This internal selection process
causes difficulties in evaluating the effects of rehabilitation programmes, since we do not observe
what a participant’s performance would have been with regard to restored work capacity or
reemployment without participation in a rehabilitation programme. Depending on the selection
process, the selection of participants with greater potential will result in a higher programme effi-
ciency and thus in an increased ex ante probability of reemployment. Thus any sound evaluation
study should begin with a careful analysis of the institutional environment and the track through
which participants enter into the programmes (Angrist and Krueger, 1999, and Heckman, La-
Londe and Smith, 1999).
There is an extensive literature on the issue of evaluating vocational rehabilitation programmes
for sick unemployed. Aakvik and Risa (1996) studied the success of Norwegian vocational reha-
bilitation programmes. They concluded that the presence of managerial creaming in the selection
of participants had positive effects on the probability of successful rehabilitation and on the par-
ticipants’ employability. Marklund (1995) studied the observed positive correlation between par-
ticipation in vocational rehabilitation and disability pension in Sweden. Here the creaming is
based on the participants’ needs of improved work capacity. The information on health status of
participants after termination of rehabilitation is used in the decision making concerning disabil-
ity pension of difficult cases. Bergendorff, Lidwall, Ljungberg and Marklund (1997) emphasised
in their study of sickness absenteeism and vocational rehabilitation in Sweden the importance of
1 At the same time when the rehabilitation system was changed, the Swedish labour market experienced major
changes as well. Prior to the 1990s the level of open unemployment in Sweden was about 2%. In the early 1990sit increased drastically to 9%. Afterwards, it declined gradually to 5-6% in 1999. A relatively large proportion ofthe individuals receiving long-term sickness benefit compensation belongs to the pool of unemployed. For in-stance, the share of unemployed among the long-term sick increased from 9% in 1986-1991 to 18% in 1991-1994
3
individual and environmental specific factors on the rehabilitation effects in shortening the dura-
tion of sickness and to reduce the risk of disability. They found high correlation between long-
term sickness and multiple risk factors, such as advanced age, occupational and work environ-
ment, psychiatric diagnosis, unemployment, drinking problem, social isolation, and concluded
that in such cases the chances of successful rehabilitation are in general quite small (see also Re-
dovisar, 1996). Heshmati and Engström (1999) found that participation in vocational rehabilita-
tion has positive effects on participants’ health status and on their return to work but did not ob-
serve any evidence of selection on unobservable characteristics. Their study differs from the cur-
rent one in a number of respects, since they used a parametric approach with strong distributional
assumptions and did not distinguish between different types of rehabilitation, with all non-
participants in vocational rehabilitation considered as reference group.
Aakvik, Heckman and Vytlacil (1999) evaluated the effects of vocational rehabilitation training
programmes on re-employment in Norway. Allowing for heterogeneous effects, various measures
of treatment effects were estimated semiparametrically. They observed that the programme par-
ticipants have an 8% higher re-employment rate than non-participants. The higher employment
rate is due to the caseworkers systematic selection of participants who would have had higher
employment chances even without the training programme. After controlling for observable and
unobservable characteristics of the applicants, the treatment effect has been found to be negative.
However, they did not account for the type of vocational or non-vocational training offered.
Selander et al. (1997) indicated that the problems of inefficiency and co-ordination in the Swed-
ish rehabilitation programmes remained even after the reform period. Unemployed individuals
are found to be the most difficult cases among the long term sick, with transfers to disability pen-
sion about three times likelier than for employed individuals. They analysed the return to work
among a sample of vocational rehabilitation participants with different employment status in the
Stockholm and Jämtlands counties during 1992 to 1994 and found significant differences in the
participation probabilities and the development of health status after programme participation by
county of residence, employment status, gender, citizenship, the length and type of rehabilitation.
Their results indicated a positive association between employment and return to work. Menckel
and Strömberg (1996) found in an analysis based on a survey of 530 occupational health units
that after 1991 these units worked to a higher degree with rehabilitative issues. Their involvement
(Redovisar, 1996). Thus, the unfavourable changes in the labour market are positively correlated with registered

4
in early sickness stages and in co-ordination of workplace-based rehabilitation explains to some
extent the differences in the effectiveness of rehabilitation by participants’ employment status.
Westerholm (1993) found a good supportive atmosphere at the workplace being directly and in-
versely related to absenteeism and an important factor determining return to work.
One of the disadvantages of the previous evaluation studies is the lack of considering simultane-
ously a set of rehabilitation programmes, multiple outcome variables, and correction for the dif-
ferent composition of the participant groups. This study estimates the effects of participation in
various rehabilitative measures on different outcome variables, using methods proposed by Im-
bens (1999) and Lechner (1999) for the evaluation of multiple programmes. Here, we follow the
multivariate-balancing score matching implementation discussed in Lechner (2000). Identifying
the various treatment effects requires that the researcher observes all factors influencing jointly
the outcomes under investigation as well as the selection process.
For our empirical study we consider a sample of 6287 individuals with long-term sickness quali-
fied for participation in rehabilitative programmes. Our sample is residing in a concentrated area
in western Sweden and is observed during 1991 to 1994. A major advantage of this data is its
richness in information about variables that are important factors as well for the selection process
into the different programmes as for labour market and health related outcomes, which is a major
prerequisite of the estimator employed.
The main contributions of this paper are twofold. First, it estimates the effects of various reha-
bilitative measures on four outcome variables: re-employment, re-integration into the labour
force, transfers to disability pension, and health status. Second, it adds experience regarding the
new methods of multiple treatment evaluation with matching techniques and extends them to ac-
count for sampling weights for non-random data. Neither positive labour market effects of reha-
bilitation nor any reductions in transfers to disability pension can be found. The different pro-
grammes could be ranked according to their re-employment performance into no rehabilitation
and work-place rehabilitation, which are most successful, followed by medical and social reha-
bilitation, which are less successful, and finally followed by educational and passive evaluation,
which might even harm re-employment chances.
The remainder of this paper is organised as follows. In Section 2 the Swedish social insurance
system is introduced. Section 3 contains a description of the selection process into the pro-
long-term sickness and the risk of a transition to disability pension.

5
grammes and Section 4 explains the data used. The estimation method employed to estimate the
programme effects is outlined in Section 5. Estimation results are discussed in Section 6. The
final section concludes. Three appendices provide a more extensive description of the data, fur-
ther estimates, and some numbers on the magnitude of the Swedish social insurance system.
2 Vocational rehabilitation in Sweden
2.1 The Swedish sickness insurance system
The Swedish social insurance system has emerged over the past 100 years and with a total ex-
penditure of about 33 billion L2 per annum or 17% of gross national product is of considerable
importance3. It is administrated by the National Social Insurance Board (Riksförsäkringsverket,
RFV) with 25 insurance offices, 280 local insurance offices, and 50 service offices, and financed
mainly through compulsory insurance premium contributions proportional to income from em-
ployment but also through public taxes.
Persons employed for at least one month are covered by the public sickness insurance and are
eligible for sickness benefit when becoming ill. According to the gravity of sickness full (100%)
or partial (75%, 50% or 25%) sickness benefit is approved. The full sickness benefit amounts to
80% of previous income, up to a national maximum level of 7.5 times the base amount, which is
an amount fixed yearly by the National Social Insurance Board such that it retains its real value
by following the changes in the retail price index. In 1996 about 8% of women and 25% of men
working full time had annual incomes exceeding this ceiling. The maximum monthly sickness
benefit during 1991-1994 was about 2000 L�in 1999 prices4.
Absence from work due to sickness has decreased since the beginning of the 1990s. This change
in sickness behaviour could be connected with repeated modifications in the regulations regard-
2 All monetary figures in January 1999 L (exchange rate 9.0838 SEK = 1 L, January 1999) based on CPI-deflator
(Konsumentprisindex 1980=100, 1989=188.1, 90=207.6, 91=227.2, 92=232.3, 93=243.2, 94=248.5, 95=254.8,96=256.0, 97=257.3, 98=257.0, Jan 1999: 256.2).
3 This section is mainly based on various publications of the National Social Insurance Board (RFV), 1990-1999.For a comprehensive overview of the social insurance in Sweden see RFV (1999a,b).
4 The maximum monthly sickness benefit in 1991 is calculated as (0.80x7.5x3997)/12=1999L, where 3997L is thebase amount for the year 1991.
6
ing sickness insurance5, for instance the introduction of unpaid waiting days, reductions in pay-
ment levels, employers’ responsibility for payments and a more restrictive application of the
regulations. It could also have been provoked by an increased unemployment rate or through the
fact that most persons with frequent long-term sickness were already granted disability pension in
the 1980s. The number of sickness benefit days is generally increasing with employee’s age and
is much higher for females than for males. There are also variations across regions depending on
the population and industrial structure.6
Sickness cases that last for more than four weeks are considered as long-term sick and appropri-
ate means for these are examined. In the 1990s around 20% of all long-term sickness cases re-
ceived active rehabilitation, while disability pension is granted only to persons of age 16-64
whose working ability is reduced permanently or temporary by at least 25%. A temporary dis-
ability pension is recommended when a person’s working ability is expectedly reduced for a pe-
riod of 1-3 years.7 If working disability is expected to last longer than 3 years then a permanent
disability pension is approved. Compensation for disability pension is paid in form of a basic
pension and a supplementary pension. The level of the former varies with marital status, while
the latter depends on previous earnings. However, the sum of both components is lower than
sickness and rehabilitation benefits.8 The number of people who prematurely ceased their active
working life for health reasons corresponds to about 8% of the labour force and has been in-
5 Since the beginning of the nineties, the rules regarding sickness cash benefits have been altered several times.
Prior to July 1990, the sickness cash benefit constituted of 100% of the sickness qualifying income for all days ofsickness with only two categories for the sickness degree (100%, 50%). In July 1990 the number of sickness cate-gories was extended to four (100%, 75%, 50%, 25%) and the payable share of qualifying income was reduced to90%. In March 1991, the payable share of qualifying income was changed to 65% during the first three days, 80%during days 4-90 and 90% from day 91 on. In January 1992, the legislation was changed such that sickness cashand rehabilitation benefits are paid by the employer instead from the insurance office for the first 14 days of sick-ness. In April 1993, an unpaid waiting day was introduced and the cash benefit from the day 91 on was decreasedfrom 90% to 80%. In July 1993, the benefit level was decreased from 80% to 70% from the 365th day of sicknesson. In January 1996, the level was reduced to 75% during the days 2-14 and a 10% additional complementaryform of insurance that covers via collective agreements the days 15-90 was introduced. In January 1998, the levelwas changed to 80% during days 2-14 and 90% during days 15-90. The latter includes already the 10% coveredvia collective insurance.
6 A weighted average unit cost of administration calculated for sixteen types of benefit in 1998 shows a variationranging from 85% to 114% compared to the national average unit cost (RFV, 1999a,b).
7 A temporary disability pension is applicable in three main situations depending on the individual’s physical con-dition: First, the individual’s sickness is not grave or only of temporary duration and the individual will likely re-cover without external assistance. Second, the sickness is severe and recovery will not be possible without exter-nal assistance or recovery may be stimulated considerably by external assistance. Third, the sickness is (at leasttemporary) irremediable and recovery of work capacity may be uncertain or of little economic benefit.
8 To encourage pre-retired individuals that were granted disability pension to re-enter into the active labour force,the social insurance system allows them to return to sickness benefit and the rehabilitation system within the first

7
creasing over time. It is higher for females than for males, increases with age, and the most com-
mon reason for disability pension is musculoskeletal disease (see RFV, 1999a,b).
2.2 The Swedish vocational rehabilitation policy
In 1991 a reform process in the Swedish rehabilitation policy was initiated, leading to a remark-
able expansion of vocational rehabilitation. One important reason for this gradual reform were
increasing costs of the sickness insurance and disability pension schemes during the 1980s. The
government had appointed a rehabilitation investigation committee in 1988, which recommended
rehabilitative measures in the early sickness stages to reduce the social cost of long-term sickness
(SOU, 1988). The legal responsibilities of the involved parties for initiating, co-ordinating and
financing vocational rehabilitation (VR) were defined. Expenditures on VR and the number of
VR-beneficiaries increased.
Illness or injuries that last for a longer time and make it difficult for the person to return to work
entitles them to receive help through rehabilitation. The employer is responsible for the assess-
ment of work capacity, if an employee has been sick for more than four weeks.9 The employer is
also responsible to facilitate implementation of VR measures conducted at the own workplace
including transfers, changes in duties and work hours, work training, education and necessary
adjustments to the current workplace. The social insurance office co-operates to establish a reha-
bilitation plan. The plan is based on the rehabilitative needs, medical assessments and the em-
ployee’s desire, and it is composed of measures necessary to restore lost working capacity. The
office also co-ordinates various contributions to the rehabilitation process. Participants in voca-
tional measures, i.e. those measures with a view to restore their employability, are entitled to re-
habilitation allowance for at most one year, while individuals receiving only non-vocational re-
habilitation receive only sickness benefit. Rehabilitation allowance is basically the sickness bene-
fit plus additional benefits to cover extra expenses related to the programme participation.
With the reform in 1991, the Swedish social insurance offices have the responsibility for the ad-
ministration of vocational rehabilitation through a co-ordination role. They do not have any reha-
bilitation personnel but special funds to purchase work training and education-related rehabilita-
tion services. The opportunity to purchase services is expected to increase the influence of insur-
years of their disability pension, with sickness/rehabilitative benefits much higher than disability pension. Though,this policy has been used mainly after 1994 when a more restrictive disability pension policy has been applied.

8
ance offices on the providers and make the rehabilitation measures better fitted to the ills’ needs
and possibly more efficient.10
The official objectives of the social insurance office are to supply and co-ordinate rehabilitative
actions to fully or partially restore lost working capacity and to help the sick person to become
independent of the welfare system. Successful rehabilitation in that context is not only achieved
when the client is able to return to employment, but also when the client remains unemployed
after completion of a rehabilitation programme, receives partial disability pension, or is enrolled
in education with an increased working capacity. The Swedish vocational rehabilitation strategy
consists of a variety of different rehabilitative measures, which we classify into very short, pas-
sive measures and more substantial, active measures. An example of a passive measure is the
programme Evaluation of Health Status and Work Capacity, which is a measure of very short
duration, a few days, and intended to screen cases that are difficult to assess. The aim is to define
their health status and to assess their work capacity with respect to the Swedish labour market to
decide whether recovering the previous work capacity is medically possible and economically
sensible.
The vocational active measures contain work training with the current employer or at a new place
of work and educational training towards a new occupation. These measures intend to improve
employability and to guide individuals back into the competitive labour market. Work training at
the own workplace is conditional on co-operation from the employer to make the training feasi-
ble, e.g. adjustments in working hours and duties, provision of technical support etc. Unemployed
long-term sick individuals are often offered work training at sheltered public workplaces.11
The non-vocational active rehabilitation measures consist of medical and social rehabilitation and
are rather intended to restore basic work capacity. These measures are not co-ordinated by the
9 Or if the employee has been sick at least 6 times during the recent 12 months, or if it is required by the employee.10 Other actors involved are the occupational health service, the social service and institutions, hospitals, unemploy-
ment agencies and private rehabilitation contractors. The actors’ engagements differ by target group and their re-habilitation goals. The employer’s activities are directed towards the employed individuals with the objective ofreducing their sickness absenteeism or to establish their exit from the labour market. The employment service of-fices are involved in all cases where the clients are unemployed, with the objective to re-engage them in regularwork. The health care services are provided to the sick person in disregard of their employment status with theobjective to promote health recovery. Finally, the social service actor’s target groups are persons with problemsrelated to social factors and conditions and aim to assist these individuals in their readjustment to a normal lifewith a reduced dependency on the welfare system.
11 These are subsidised workplaces created by the public sector designed for vocational training of long-term sick.

9
insurance office. Individuals with severe health problems may receive different forms of reha-
bilitation parallel or sequentially.
3 The selection process into the programmes
The basis for the choice of an appropriate evaluation strategy is a thorough analysis of the insti-
tutional environment and the process through which participants enter in rehabilitation. This se-
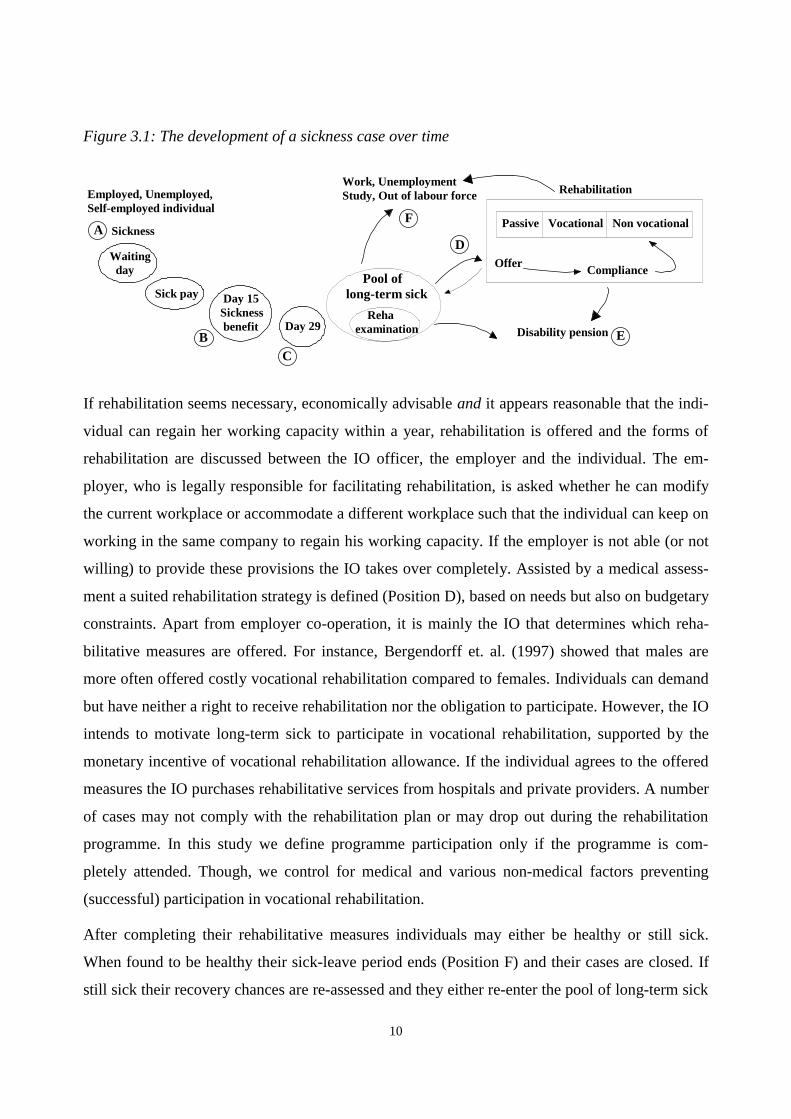
lection process as it was relevant for the years after the reform in 1991 is shown in Figure 3.1.
At the first day of an illness the employer or the local social insurance office in case of unem-
ployed or self-employed persons is notified thereof. The first day is considered a ’waiting day’
where no benefits are paid (Position A).12 Regularly employed individuals receive sick pay from
their employer from the second to the 14th day of their sickness. After these two weeks the social
insurance office (IO) becomes involved (Position B). Unemployed and self-employed individuals
are attending the IO from the first day on. The individual can apply for continuous sickness bene-
fit by presenting a current medical certificate to the IO. The IO decides about entitlement to sick-
ness benefit and about the degree of reduced working capacity due to sickness, which can be 25,
50, 75 or 100%. The sickness benefit will be paid for an unlimited period as long as the individ-
ual is sick and still eligible for sickness benefit, i.e. not receiving rehabilitation benefit and not
granted disability pension.
After 28 days of continued sickness (Position C) a special declaration and medical certificate are
requested by the IO to assess continued entitlement to sickness benefit and the potential need of
rehabilitation or disability pension. These individuals are classified by the RFV as long-term sick
and a rehabilitation assessment should be carried out within the following 8 weeks, either by the
employer, the IO or by the IO on behalf of the employer. The rehabilitation assessment aims to
find out whether rehabilitation is necessary and advisable, whether the individual will recover its
working capacity without external assistance or whether a temporary or permanent disability pen-
sion seems most suited. If no rehabilitation assistance is necessary and recovery is expected
within less than a year, the individual will stay in the sickness pool and draw benefits until
healthy. If it seems that sickness may last for more than a year, the individual will be granted
temporary or permanent disability pension and the case is closed (Position E).
12 Self-employed can choose between 3-30 waiting days.
10
Figure 3.1: The development of a sickness case over time
Pool oflong-term sick
Disability pension
Work, UnemploymentStudy, Out of labour force
Day 29
Day 15Sickness benefit
Sick pay
Waiting day
Sickness
Employed, Unemployed,Self-employed individual
A
BC
D
E
F
OfferCompliance
Rehaexamination
Passive Vocational Non vocational
Rehabilitation
If rehabilitation seems necessary, economically advisable and it appears reasonable that the indi-
vidual can regain her working capacity within a year, rehabilitation is offered and the forms of
rehabilitation are discussed between the IO officer, the employer and the individual. The em-
ployer, who is legally responsible for facilitating rehabilitation, is asked whether he can modify
the current workplace or accommodate a different workplace such that the individual can keep on
working in the same company to regain his working capacity. If the employer is not able (or not
willing) to provide these provisions the IO takes over completely. Assisted by a medical assess-
ment a suited rehabilitation strategy is defined (Position D), based on needs but also on budgetary
constraints. Apart from employer co-operation, it is mainly the IO that determines which reha-
bilitative measures are offered. For instance, Bergendorff et. al. (1997) showed that males are
more often offered costly vocational rehabilitation compared to females. Individuals can demand
but have neither a right to receive rehabilitation nor the obligation to participate. However, the IO
intends to motivate long-term sick to participate in vocational rehabilitation, supported by the
monetary incentive of vocational rehabilitation allowance. If the individual agrees to the offered
measures the IO purchases rehabilitative services from hospitals and private providers. A number
of cases may not comply with the rehabilitation plan or may drop out during the rehabilitation
programme. In this study we define programme participation only if the programme is com-
pletely attended. Though, we control for medical and various non-medical factors preventing
(successful) participation in vocational rehabilitation.
After completing their rehabilitative measures individuals may either be healthy or still sick.
When found to be healthy their sick-leave period ends (Position F) and their cases are closed. If
still sick their recovery chances are re-assessed and they either re-enter the pool of long-term sick

11
and recover without external assistance, are granted disability pension or again receive rehabili-
tative measures. A case is closed when the individual is no longer on sick leave.
4 Data and descriptive statistics
4.1 Data
The data used in this study is taken from the Riks-LS data set, which has been collected by the
National Social Insurance Board (RFV) for the purpose of evaluating the efficacy of vocational
rehabilitation, after major changes in the long-term sickness regulations had been introduced with
the beginning of 1991. The survey was conducted in the second half of 1994 and beginning of
1995 and analysed retrospectively 75000 sickness cases, who had received sickness cash benefit
for a period of at least 60 consecutive days between July 1991 and June 1994. Due to the struc-
ture of the social insurance database, which accumulates sickness cases according to the fiscal
years, 1991/92, 1992/93, 1993/94, the data was collected in form of three independent cross-
sections.13 In each of these three fiscal years and in each local insurance office 70 cases were ran-
domly selected from the sickness cases with at least 60 days duration and followed up either until
closure of the case or until December 1994, the end of the follow-up period. Still unclosed cases
were not followed up further, which consist of long-lasting illnesses and sickness cases that oc-
curred close to the end of the last survey period 1994. The caseworkers in charge of these se-
lected cases were presented a questionnaire on the development and assessment of the case.
Since the same number of cases were drawn randomly in each office but the local offices differ in
size and caseload the data is not an iid sample. Accordingly sickness cases occurring in smaller
insurance offices are over-represented and a sampling weight14 has been calculated to take ac-
count of this, which complicates to some degree the econometric considerations, as will be ex-
plained in Section five. The data collection ended in December 1994.
The data set provides rich information about the socioeconomic variables of the individuals, de-
tails on their health status and selection into rehabilitation. The latter variables are of particular
importance, since observing all relevant variables that simultaneously determine the selection
13 A detailed description of the data set including questionnaire can be found in Redovisar (1995).14 The sampling weight is defined as the ratio of the number of sickness spells exceeding 60 days and the number of
cases drawn in each IO (70 per year). The weight variable varies by local insurance office and time.

12
process and the outcomes is essential for justifying the conditional independence assumption and
obtaining unbiased estimates by the matching estimator introduced in the next section.
The information about the individual prior to the beginning of the sickness spell (Figure 3.1, po-
sition A) are age, gender, marital status, citizenship, education, occupation, previous health rec-
ord, previous participation in vocational rehabilitation programmes, employment status, qualify-
ing income, and income loss due to sickness15. The variables regarding the environment of the
individual are county of residence, community type, local unemployment rate and year of sick-
ness registration. Information characterising the first stage of the sickness spell (Position B) con-
tain the medical institution which registered sick leave, initial degree of sickness, indications of
alcohol or drug abuse, and medical diagnosis.
As outlined in the previous section, selection into rehabilitative measures proceeds then in two
steps. First a specialist of the IO or of the employer assembles the medical report and other as-
sessments to judge the need for rehabilitation. The initial medical recommendation, the case-
workers non-medical recommendation, and the organisation that carried out the rehabilitation
assessment are recorded in the data, revealing some of the otherwise unobserved characteristics
of the sick person. The officers have clear guidelines to follow for assessing the need and success
chances of rehabilitative measures and they do not face any incentive structures for discriminat-
ing against particular groups.16 Then the insurance office or employer, respectively, will work out
together with the sick person a rehabilitation plan. Although the officer will seek agreement with
the sick individual, the individual has no right to claim rehabilitative measures if the officer does
not offer them. In this stage a variety of medical and non-medical obstacles preventing the cli-
ent’s participation in vocational rehabilitation could surface17, which are recorded in the data.
Some individuals might try to influence the selection process in a non-recorded way, e.g. by
simulating illness to receive disability pension, dropping out of rehabilitation or lacking effort. If
such factors also influence the outcomes of interest, then the conditional independence assump-
15 Qualifying income is based on the earnings during the 12 months prior to the sickness. Income loss is the differ-
ence between qualifying income and the amount of sickness cash benefit received at the event of sickness.16 Cases assessed by the employer might differ from cases assessed by the insurance office. In the former medical
staff from the Occupational Health Service (Företagshälsovard) are involved.17 The medical factors are due to waiting for treatment or improved health status. The non-medical factors are char-
acterised as educational (incomplete education, poor knowledge in Swedish language), private (divorce, mentalillness), family (child care, elderly care), social (ongoing misuse, lack of residential), economics (higher incomefrom sick-leave than working income), labour market (cannot find a job after completed rehabilitation), the clientfeels ill or unable to participate in a vocational rehabilitation programme, or other.

13
tion would be invalid and estimates generated by a matching estimator biased. Personal contact,
medical evaluation, caseworkers’ experience and past sickness record are among factors that un-
veil such attempts. Furthermore, the caseworkers at the insurance offices are urged to encourage
individuals that lack initiative or confidence and stimulate them for participation in rehabilitation.
Information about the rehabilitation period (Position D) is limited to the types of measures re-
ceived. Unfortunately, no reliable information on the length of rehabilitative measures or their
sequential ordering is available. The rehabilitative measures are coded as evaluation of health and
work capacity, work training at own or at a new workplace, educational training, social, medical
and other rehabilitation or a parallel or sequential combination of several measures. Finally, for
closed sickness cases the outflow destination (Position E or F) is reported. An indicator of subse-
quent health status is reported for these closed cases, which reveals, whether the individual suf-
fered another sickness spell exceeding 30 days within six months after closure. However, at the
end of the data collection period of the Risk-LS data set still many cases remained unclosed and
these right-censored cases are treated as still sick. Further details are found in the Appendix A.1.
4.2 Definition of treatment groups and descriptive statistics
To deal with the heterogeneous rehabilitative measures described in Section 2.2, and to estimate
specific effects for certain groups, we define 6 mutually exclusive and exhaustive categories of
rehabilitative measures: NO REHABILITATION, PASSIVE rehabilitation, WORKPLACE rehabilitation,
EDUCATIONAL rehabilitation, MEDICAL rehabilitation, and SOCIAL rehabilitation. Henceforth we
will refer to these categories as treatments and denote by a treatment group all individuals who
participated in the same treatment.
This classification is based on the social insurance offices’ grouping of rehabilitative measures
and on our previous considerations. NO REHABILITATION contains all those cases that did not re-
ceive any rehabilitative measures at all. PASSIVE rehabilitation consists of all those cases that re-
ceived only passive measures like Evaluation of Health Status and Work Capacity. WORKPLACE
rehabilitation comprises the active measures rehabilitation at the own workplace, i.e. with the
current employer, and rehabilitation at a new workplace, i.e. at a new employer18. EDUCATIONAL
18 These two measures have been merged into the same treatment group out of two reasons. First, the data collection
seems to have not been very careful with the distinction between these two kinds of rehabilitative measures, sincealmost all unemployed have been implausibly classified as receiving rehabilitation at own workplace. The secondreason is that the treatment effect between rehabilitation in old workplace and new workplace is not defined for
14
rehabilitation corresponds to educational, MEDICAL rehabilitation to medical measures, and
SOCIAL rehabilitation contains social and other measures. Notice that between 6% and 23% of the
individuals of the four latter groups have received additionally passive measures (cf. Table A.1 in
the appendix).A number of cases received more than one active measure. Since neither it is
known whether these measures where given parallel or sequentially, nor the time sequence of
these measures, we assigned these cases to the supposedly most substantial measure, which in
most cases has been MEDICAL rehabilitation (Appendix A.2).
4.3 Descriptive statistics
This evaluation study is based on 5 (out of 25) insurance offices in Western Sweden, Halland-
slän, Bohuslän, Älvsborgslän, Värmlandslän and Göteborgskommun, with 67 (out of 280) local
insurance offices and a total of 10309 documented long-term sickness cases.19 Since we are inter-
ested in the effects of rehabilitation on restoring previous work capacity and labour market posi-
tion, we excluded all individuals in education and those aged above 55 to not confuse rehabilita-
tion with early retirement intended to ease labour market pressure. We also deleted all cases re-
ceiving pension benefit at the entry to the current sickness spell, which are individuals who re-
entered the sickness pool or rehabilitation system after having been granted disability pension.
We furthermore dropped all cases with missing values on important variables and finally retained
6287 cases of which 3087 received any form of rehabilitation. In the first two columns of Table
A.1 in the appendix the means of all relevant variables are given for the original sample and the
selected subsample. In Appendix A.3 the number of lost cases is tracked.
In Table 4.1 the means of selected variables in the selected subsample are presented for the six
treatment groups. The average age is about 40 years and women represent the majority of the
sickness cases covered. Regarding education and occupation it can be seen that unskilled blue-
collar workers often receive WORKPLACE rehabilitation and less frequent NO REHABILITATION.
White-collar workers most often do not receive any rehabilitation. Individuals previously work-
ing in the manufacturing sector often participate in WORKPLACE rehabilitation, whereas individu-
als occupied in agriculture-related and other service sectors most likely receive SOCIAL rehabili-
individuals who were not employed at the time they became sick. Hence the treatment effect could not be esti-mated for individuals in unemployment or education.
19 Selection criteria for the insurance offices have been, the geographic concentration, similar industrial develop-ment, homogenous labour markets.

15
tation. According to the previous labour market status, for the employed in most cases
WORKPLACE rehabilitation is arranged, while the unemployed are usually transferred to EDU-
CATIONAL or SOCIAL measures. Thus, not surprisingly the individuals in the treatment groups
EDUCATION and SOCIAL rehabilitation had somewhat lower earnings before their sickness started.
Table 4.1: Selected characteristics by treatment groups (means or shares in %)
9DULDEOH 1RQH 3DVVLYH :RUNSO� (GXFDW� 0HGLFDO 6RFLDO1XPEHU�RI�REVHUYDWLRQV�LQ�JURXS ���� ��� ���� ��� ���� ���$JH LQ�\HDUV ���� ���� ���� ���� ���� ����*HQGHU�� PDOH �� �� �� �� �� ��&LWL]HQVKLS�� 6ZHGLVK�ERUQ �� �� �� �� �� ��/DERXU�PDUNHW�SRVLWLRQ�� EOXH�FROODU��XQVNLOOHG �� �� �� �� �� ��
ZKLWH�FROODU�ZRUNHU �� �� �� �� �� ��2FFXSDWLRQ�LQ� PDQXIDFWXULQJ �� �� �� �� �� ��
DJULFXOWXUH���RWKHUV �� �� �� �� �� ��3ULRU�HPSOR\PHQW�VWDWXV� HPSOR\HG �� �� �� �� �� ��
XQHPSOR\HG �� �� � �� �� ��6LFNQHVV�EHQHILW�TXDOLI\LQJ�LQFRPH��L� ����� ����� ����� ����� ����� �����3UHYLRXV�VLFNQHVV�UHFRUG !����GD\V�LQ�ODVW���PRQWKV �� �� �� �� �� ��3UHYLRXV�SDUWLFLSDWLRQ�LQ�YRFDWLRQDO�UHKDELOLWDWLRQ � �� �� �� �� ��6DPSOLQJ�ZHLJKW�FRUUHVSRQGLQJ�WR�,2 ���� ���� ���� ���� ���� ����&RXQW\�� +DOODQGVOlQ � � � � �� �
bOYVERUJVOlQ �� �� �� �� � ��&RPPXQLW\�W\SH� LQGXVWULDO�FLWLHV �� � �� �� �� ��
UXUDO�DQG�RWKHU �� �� �� �� �� ��3RVLWLRQ�%��%HJLQQLQJ�RI�VLFNQHVV�VSHOO��VLFNQHVV�UHJLVWUDWLRQ�6LFNQHVV�GHJUHH� �����VLFN�OHDYH �� �� �� �� �� ��,QGLFDWLRQV�RI�DOFRKRO�RU�GUXJ�DEXVH � � � �� � ��'LDJQRVLV�� SV\FKLDWULF �� �� �� �� �� ��
PXVFXORVNHOHWDO �� �� �� �� �� ��3RVLWLRQ�&��,QYHVWLJDWLRQ�IRU�WKH�QHHG�RI�UHKDELOLWDWLRQ��UHKDELOLWDWLRQ�DVVHVVPHQW�&DVH�DVVHVVHG�E\�� HPSOR\HU �� �� �� �� �� ��
,2 �� �� �� �� �� ��,2�RQ�EHKDOI�RI�WKH�HPSOR\HU � �� �� �� �� ��QRW�QHHGHG �� � �� � �� ��
0HGLFDO�95�UHFRPPHQGDWLRQ��ZDLW��VHH �� �� �� �� �� ��95�QHHGHG��GHILQHG �� �� �� �� �� ��HOLJLEOH�IRU�GLVDELOLW\�SHQVLRQ � � � � � �
1RQ�PHGLFDO�95�UHFRPPHQG���ZDLW��VHH �� �� �� �� �� ��95�QHHGHG��GHILQHG �� �� �� �� �� ��HOLJLEOH�IRU�GLVDELOLW\�SHQVLRQ � � � � � �
5HKDELOLWDWLRQ�SUHYHQWHG�E\��PHGLFDO�UHDVRQV �� �� �� �� �� ��E\�YDULRXV�IDFWRUV � � � �� � ��QRW�SUHYHQWHG �� �� �� �� �� ��
1RWH��6DPSOH�PHDQV�LQ�HDFK�WUHDWPHQW�JURXS�PXOWLSOLHG�E\������H[FHSW�DJH��LQFRPH�DQG�VDPSOLQJ�ZHLJKW���6HH�DOVR�7DEOH�$���
16
The health and benefit records show that having been sick for more than 60 days in the last six
months or having participated in vocational rehabilitation in the previous twelve month period
increases the chances to be assigned to EDUCATIONAL rehabilitation.
The sampling weight is proportional to the size of the insurance office in terms of long-term
sickness cases. In general the large insurance offices conduct more often PASSIVE rehabilitation.
Furthermore, regional differences are substantial. For instance, Halland relies very often on
MEDICAL rehabilitation while the preferences for vocational training are much stronger in the
Älvsborg. In rural communities vocational rehabilitation is more often conducted.
With respect to the diagnosis of the current sickness it can be seen that persons on alcohol or
drugs or with psychiatric disorder are often offered SOCIAL rehabilitation. Regarding the reha-
bilitation assessment, the employers offer the long-term sick WORKPLACE training while the in-
surance offices offer EDUCATIONAL training. Cases classified as wait and see by the medical or
non-medical assessment differ significantly from those who need vocational rehabilitation. The
latter are offered vocational training, while the former usually either do not participate in reha-
bilitation or receive non-vocational rehabilitation. Clients where medical factors prevented con-
ducting vocational rehabilitation more often participate in MEDICAL rehabilitation, while those
without preventing factors select rather into WORKPLACE training.
4.4 Outcome variables
Table 4.2 shows sickness length and post-treatment variables reported in the data set for closed
cases. With the exception of subsequent health status only outflow destinations are available. Un-
closed cases are treated as still sick. It is seen that the group NO REHABILITATION exhibit the
shortest sickness spells. Furthermore, the frequency of unclosed sickness cases is lowest among
those receiving NO REHABILITATION, while it is highest among the participants in PASSIVE reha-
bilitation. The outflow destinations of closed cases are predominantly return to the previous
workplace for all treatment groups and also to unemployment after PASSIVE, MEDICAL and SOCIAL
rehabilitation. The outflow destinations from EDUCATIONAL rehabilitation are more diffuse.

17
Table 4.2: End of sickness and outflow destinations by treatment groups (mean or share in %)
9DULDEOH 1RQH 3DVVLYH :RUNSO� (GXFDW� 0HGLFDO 6RFLDO2YHUDOO�OHQJWK�RI�VLFNQHVV�VSHOO��LQ�GD\V� ��� ��� ��� ��� ��� ���0HGLDQ�OHQJWK�RI�VLFNQHVV�VSHOO��LQ�GD\V� ��� ��� ��� ��� ��� ���&DVH�QRW�FORVHG�� VWLOO�VLFN��ULJKW�FHQVRUHG� � �� �� �� �� ��D��5HWXUQ�WR�SUHYLRXV�ZRUNSODFH �� �� �� �� �� ��E��6WDUWV�ZRUNLQJ�DW�D�QHZ�ZRUNSODFH � � � �� � �F��:RUNV�DW�D�VKHOWHUHG�SODFH � � � �� � �G��/HDYHV�WR�HGXFDWLRQ � � � � � �H��/HDYHV�WR�XQHPSOR\PHQW �� �� � �� �� ��I��)XOO�VLFNQHVV�EHQHILW � � � � � �J��3DUWLDO�VLFNQHVV�EHQHILW � � � � � �K��(DUO\�UHWLUHPHQW��IXOO�SHQVLRQ� � � � � � �L��(DUO\�UHWLUHPHQW��SDUWLDO�SHQVLRQ� � � � � � �M��/HDYHV�WR�RWKHU�RXWFRPHV �� � � � � �3RVLWLYH�KHDOWK�VWDWXV��VL[�PRQWKV�ODWHU �� �� �� �� �� ��1RWH� &RUUHVSRQGV�WR�SRVLWLRQ�(�DQG�)�LQ�)LJXUH�����
These outflow destinations are aggregated to three outcome variables: outflows to employment,
outflows to the labour force and outflows to disability pension. Outflows to employment is de-
fined as the share of all long-term sick who returned to regular employment (a,b in Table 4.2).
The Outflows to the labour force are the share of long-term sick who returned to regular em-
ployment, employment at sheltered workplaces or unemployment (a,b,c,e in Table 4.2). Outflows
to disability pension is the share of long-term sick being transferred to permanent or temporary
disability pension (h,i in Table 4.2). In addition to these flow variables measured immediately at
the end of a sickness case, a binary Health status outcome is recorded for closed cases, which is
one if during the six month period following the last day of the sickness spell there has not been a
new sickness spell exceeding 30 days and the person has not been transferred to a permanent or
temporary full disability pension. These represent the official labour market and welfare aims of
the rehabilitation policy in Sweden.
Table 4.3 provides the unadjusted levels of the outcome variables among the various treatment
groups. With respect to outflows to employment and labour force, WORKPLACE and NO REHA-
BILITATION appear as the most successful programmes and PASSIVE rehabilitation as the worst.
EDUCATIONAL rehabilitation is not very successful in re-employing participants but fares better in
re-integrating them into the labour force. The difference between outflows to employment and
outflows to the labour force is smallest for WORKPLACE and MEDICAL rehabilitation, while the
other measures re-integrate a substantial fraction into non-regular employment or unemployment.

18
Lowest levels of transfers to disability pension are found for the WORKPLACE rehabilitation
group. Concerning health status six months after closure of the case NO and SOCIAL rehabilitation
appear as the most successful.
Table 4.3: Unadjusted levels of the outcome variables (in % points).
(PSOR\PHQW�D� /DERXU�IRUFH�E� 'LVDELOLW\�SHQVLRQ�F� +HDOWK�VWDWXV�G�1RQH �� �� �� ��3DVVLYH �� �� �� ��:RUNSODFH �� �� � ��(GXFDWLRQ �� �� � ��0HGLFDO �� �� � ��6RFLDO �� �� � ��1RWH�� D��2XWIORZV�WR�UHJXODU�HPSOR\PHQW�DW�FORVLQJ�GD\�LQ���SRLQWV�
E��2XWIORZV�WR�ODERXU�IRUFH��UHJXODU�HPSOR\PHQW��HPSOR\PHQW�DW�VKHOWHUHG�ZRUNSODFHV��XQHPSOR\PHQW��F��2XWIORZV�WR�GLVDELOLW\�SHQVLRQ�G��3URORQJHG�+HDOWK�VWDWXV��'HILQHG�DV�RQH�LI�GXULQJ�WKH�VL[�PRQWKV�IROORZLQJ�WKH�ODVW�GD\�RI�WKH�VLFNQHVV�VSHOO�WKH�LQGL�YLGXDO�KDG�QRW�D�QHZ�VLFNQHVV�VSHOO�H[FHHGLQJ����GD\V�DQG�KDG�QRW�EHHQ�WUDQVIHUUHG�WR�D�SHUPDQHQW�RU�WHPSRUDU\�IXOOGLVDELOLW\�SHQVLRQ�
These numbers, however, are misleading and should be interpreted with care since the composi-
tion of individuals differs among the distinct groups and any sensible estimator must adjust for
these differences. For instance the group EDUCATIONAL rehabilitation contains substantially more
unemployed and repeatedly sick individuals (see Table 4.1).
Nevertheless, with this data set which is exceptionally informative regarding the selection process
(Section 4.1), we are confident that conditional on all these explanatory variables we fully control
for selection effects with respect to the labour market outcomes, i.e. that all relevant factors that
jointly influence the selection process and the subsequent labour market outcomes are contained
or at least approximated by observed variables. In this case we can employ the matching estima-
tor, which will be introduced in the following section, to adjust for the different compositions of
characteristics in the treatment groups and obtain unbiased treatment effects.
However, we are less certain that this also holds with respect to the variable health status, since
the medical data are not overly detailed. This might lead to biased estimates of the health effects
of rehabilitation and estimated treatment effects on health should be interpreted very cautiously.20
20 For instance, if severity of sickness is not fully captured by the variables reported in the data but affects the par-
ticipation decision, then the estimated health effects would be biased, since more severe sickness cases are likelyto be associated with worse subsequent health status.
19
If the explanatory variables do not fully control for any form of self-selection, then even the esti-
mated labour market effects would be biased. In that case we would on average expect upwardly
biased treatment effects of the rehabilitative measures compared to no rehabilitation, since initial
participants in vocational rehabilitation with low confidence or ambition might drop out during
rehabilitation and would then be recorded as non-participants and only motivated patients are
likely to participate in rehabilitation.
5 Identification and Estimation Methods
5.1 Notation and definition of causal effects
The prototypical model of the microeconometric evaluation literature is the following: An indi-
vidual can choose between M+1 different mutually exclusive and exhaustive treatments (pro-
grammes), like participation in one of M different rehabilitation programmes or non-participation
in any programme. After participation in a certain treatment a vector of outcomes will be ob-
served. Ex ante these latent outcomes are called hypothetical or potential outcomes. This model
has been proposed by Roy (1951) and Rubin (1974). Since the statistical content of the model is
most clearly spelled out in Rubin (1974), this model is called the Rubin-causality-model in the
following. Denote these hypothetical outcomes by 0 1{ , ,..., }MY Y Y . It is assumed that each par-
ticipant receives exactly one of the treatments, where typically the ’0’ category denotes the case of
the treatment type ’no treatment’. Therefore, for any participant only one component of
0 1{ , ,..., }MY Y Y can be observed. The remaining M outcomes are counterfactuals in the language
of the Rubin model. Let participation in a particular treatment m be indicated by the variable
{0,1,..., }S M∈ .21
With this notation several causal effects can be defined.22 In the following equations the focus is
on a pair-wise comparison of the effects of the treatments m and l:
γ 0m l m l m lE Y Y EY EY, ( )= − = − , (1)
21 This section basically summarises results obtained in Lechner (1999, 2000). The reader interested in more details
of that approach is referred to those papers, which can be downloaded from the Internet.22 Assume henceforth that the typical assumptions of the Rubin model are fulfilled (see Holland, 1986, or Rubin,
1974).
20
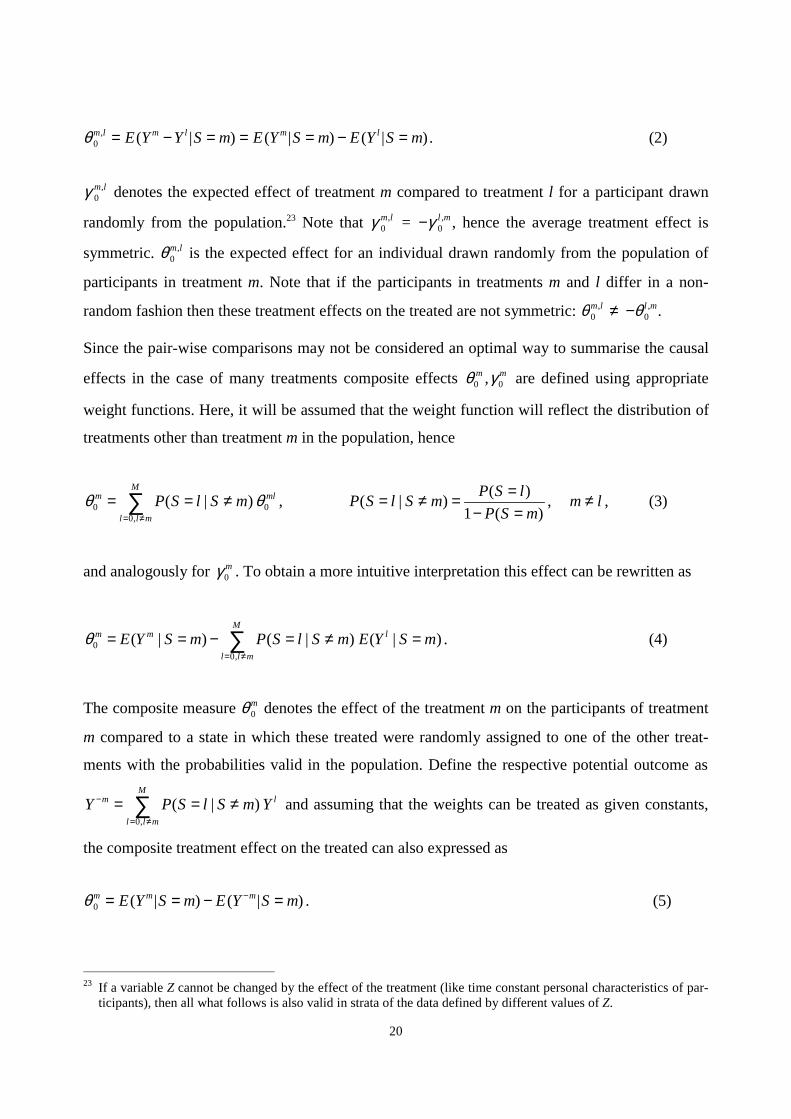
θ 0m l m l m lE Y Y S m E Y S m E Y S m, ( | ) ( | ) ( | )= − = = = − = . (2)
γ 0m l, denotes the expected effect of treatment m compared to treatment l for a participant drawn
randomly from the population.23 Note that γ 0m l, = −γ 0
l m, , hence the average treatment effect is
symmetric. θ 0m l, is the expected effect for an individual drawn randomly from the population of
participants in treatment m. Note that if the participants in treatments m and l differ in a non-
random fashion then these treatment effects on the treated are not symmetric: θ 0m l, ≠ −θ 0
l m, .
Since the pair-wise comparisons may not be considered an optimal way to summarise the causal
effects in the case of many treatments composite effects 0 0,m mθ γ are defined using appropriate
weight functions. Here, it will be assumed that the weight function will reflect the distribution of
treatments other than treatment m in the population, hence
0 00,
( | )M
m ml
l l m
P S l S mθ θ= ≠
= = ≠∑ , ( )
( | )1 ( )
P S lP S l S m
P S m
== ≠ =− =
, m l≠ , (3)
and analogously for 0mγ . To obtain a more intuitive interpretation this effect can be rewritten as
00,
( | ) ( | ) ( | )M
m m l
l l m
E Y S m P S l S m E Y S mθ= ≠
= = − = ≠ =∑ . (4)
The composite measure θ 0m denotes the effect of the treatment m on the participants of treatment
m compared to a state in which these treated were randomly assigned to one of the other treat-
ments with the probabilities valid in the population. Define the respective potential outcome as
0,
( | )M
m l
l l m
Y P S l S m Y−
= ≠
= = ≠∑ and assuming that the weights can be treated as given constants,
the composite treatment effect on the treated can also expressed as
θ 0m m mE Y S m E Y S m= = − =−( | ) ( | ) . (5)
23 If a variable Z cannot be changed by the effect of the treatment (like time constant personal characteristics of par-
ticipants), then all what follows is also valid in strata of the data defined by different values of Z.

21
5.2 Identification
The Rubin model clarifies that the average causal treatment effect is generally not identified.
Therefore, the lack of identification has to be overcome by plausible, untestable assumptions that
should depend on the problem analysed and the data available. One such assumption is that par-
ticipation and treatment outcomes are independent conditional on a set of (observable) attributes.
This conditional independence assumption (CIA) is formalised in expression (6) as
Y Y Y S X x xM0 1, ,..., | ,C = " ³χ . (6)
This assumption is plausible only if we can observe all factors that influence simultaneously the
assignment to the specific rehabilitative measures as well as the potential outcomes, requiring a
very informative data set. However, as argued in the previous section we are confident that the
data at hand is sufficiently detailed justify the conditional independence assumption with respect
to the labour market outcome variables.
5.3 Estimation
By equation (6) it follows that the expected counterfactual outcome E Y X x S ml[ | , ]= = is identi-
cal to E Y X x S ll[ | , ]= = ,m l∀ . Hence the expected counterfactuals are identified through ob-
served outcomes of individuals that participated in treatment l, but only for those X with a posi-
tive probability to be selected into treatment l. Thus average treatment effects are only meaning-
ful if they are defined with respect to the set of common support of X among participants in the
treatments m and l. Since the common support for m and l would vary with each treatment effect,
it is more convenient to restrict the definition of the treatment effects to the joint common support
X% which contains only those X for which all M+1 participation probabilities are strictly positive:
{ | ( | ) 0 0,.., }X x P S l X x l M= = = > ∀ =% . Redefine the average treatment effects as:
γ 0m l
X X X
m l
X X X
m lE Y Y E E Y X S m E Y X S l,
|~
|~ [ | , ] [ | , ]� - = = - =
³ ³
2 7 2 7
θ 0m l
X X X
m l
X X X
m lE Y Y S m E E Y X S m E Y X S l S m,
|~
|~| [ | , ] [ | , ]� - = = = - = =
³ ³
2 7 2 7,

22
and the composite effects analogously. This joint common support restriction will induce an in-
creased loss of observations, but eases interpretation of the treatment effects, since the underlying
population will be identical for all estimated effects.
Analogous to Lechner (1999) or Imbens (1999) the expected counterfactual outcome is also
identified via averaging over the participation probabilities:
( ) ( )| |
| [ | ( ), ( ), ] |l l m l
X X X X X XE Y S m E E Y P X P X S m S m
∈ ∈= = = =
% %
= ( )|
[ | ( ), ( ), ] |l m l
X X XE E Y P X P X S l S m
∈= =
%
= ( )| ,
|[ | ( ), ] |l m m l
X X XE E Y P X S l S m
∈= =
%
, (7)
with ( ) : ( | )mP X P S m X= = , and | , ( ) : ( | , { , })m m lP X P S m X S m l= = ∈ . Equation (7) shows that
for the pair-wise comparisons the dimension of the conditioning variables can be reduced even to
the order of one, thus simplifying estimation considerably.
We will estimate the respective treatment effects by the sequential matching estimator suggested
in Lechner (1999) and applied in Lechner (2000).24 However, as observations are not randomly
sampled, the matching estimator must be extended to take account of the sampling weight intro-
duced in Section 4. With wi the sampling weight of observation i the average treatment effect on
the treated is estimated as $ ,~,
( )
θ m li i
mil
i
ii
i i
w Y Y
wi with S m X X=
¼ -" = ³
ÊÊ3 8
,
where ( )liY is the observed outcome of that individual of the treatment group l which is matched to
observation i. The estimator $ ,θ m l is a weighted average of the differences between the observed
outcomes of the participants in treatment m and the observed outcomes of their matched counter-
parts in treatment l. Thus, the sampling weight of a participant in treatment m is also assigned to
its matched counterpart. Analogously
24 In many cases this identifying assumption is exploited via a matching estimator, for recent examples see Angrist
(1998) or Heckman, Ichimura, and Todd (1998).

23
$ ~,( ) ( )
γ m li i
mil
i
ii
i
w Y Y
wi with X X=
¼ -" ³
ÊÊ2 7
,
where ( )miY and ( )
liY are the observed outcomes of the individuals of treatment group m and l, re-
spectively, which are matched to the observation i. The match of treatment group m to observa-
tion i is defined as that participant in treatment group m whose Mahalanobis distance to
ˆ ˆ( ), ( ), ( )m li i iP X P X V X is smallest, where ˆ ( )m
iP X , ˆ ( )liP X are the estimated participation
probabilities of observation i and ( )iV X may contain specific components of iX . We match on
the two marginal probabilities ( )mP X , ( )lP X instead of matching on | , ( )m m lP X , since in the
application in Lechner (2000) matching on both marginal probabilities appeared to have superior
properties. The steps of the matching estimator of Lechner (1999) are given in Table 5.1.
Table 5.1: The estimation procedure
Step 1
Step 2
Estimate a multinomial probit model to obtain 0 1 5ˆ ˆ ˆ[ ( ), ( ),..., ( )]P X P X P X .Estimate the joint common support and delete all observations that are not within.
Step 3 Estimate the conditional expectations appearing in equation ��� by matching as follows:For a given value of m and l the following steps are performed:a) Choose one observation in the subsample defined by participation in m and delete it from that
pool.b) Find an observation in the subsample of participants in l that is as close as possible to the one
chosen in step a) in terms of ˆ ˆ[ ( ), ( ), ]m lP X P X V . V may contain some components of X con-sidered to be particularly important. Closeness is based on the Mahalanobis distance. Do notremove that observation, so that it can be used again.
c) Repeat a) and b) until no participant in m is left.d) Using the matched comparison group formed in c), compute the respective conditional ex-
pectation by the weighted sample mean. Note that the same observations may appear morethan once in that group.
Step 4 Repeat step 3 for all combinations of m and l.Step 5 Check the quality of the matching performed in step 4.Step 6 Compute the estimate of the treatment effects using the results of step 4 and compute their ap-
proximate covariance matrix (see Lechner, 1999).
The joint common support X% is estimated by deriving for each treatment m the maximum and
the minimum of the estimated participation probability ˆ ( | )mP X S s= in each treatment group s.
Then the minimum of these maxima among all treatment groups s and the maximum of the
24
minima are taken as the margins of the joint support for treatment m.25 This procedure is repeated
for each treatment m, which gives the estimated joint common support. Thereafter all observa-
tions are discarded, for which at least one participation probability lies above the minima of the
maxima or below the maxima of the minima.
6 Results
Traditionally the various rehabilitative measures have been judged against a single base line
group, which has usually been NO REHABILITATION. In this study we compare all rehabilitative
measures with each other including NO REHABILITATION and judge the success of the various re-
habilitative measures on all the four outcome variables. If rehabilitative measures would have any
positive short-term effects on health they should reduce the duration in sickness26 and hence in-
crease outflows out of sickness compared to the non-participants. If vocational rehabilitative
measures would assist in restoring the lost working capacity then they should foster outflows
back to regular employment and into the labour force. If rehabilitative measures would have any
mid term effects on health this should be reflected in the outcome criterion health.
6.1 Estimation of the propensity scores
The first step of the matching estimator given in Table 5.1 consists in estimating the participation
probabilities. Before estimating these probabilities by a multinomial probit model (MNP) we
conducted a preliminary specification search to reduce the number of covariates based on binary
probits of each treatment compared to the group NO rehabilitation as well as on score tests against
omitted variables27 and retained the variables presented in Table 6.1 for the MNP. Although being
fully parametric, the multinomial probit model (MNP) is a flexible version of a discrete choice
model, because it does not hinge on the Independence of Irrelevant Alternatives assumption, as
e.g. a multinomial logit model.28 The number of categories used however makes the exact com-
putation of the likelihood function impossible. Therefore, we used simulated maximum likeli-
25 It is assumed that the support of the conditional participation probability ( | )mP X S s= is compact for all m and s.26 Notice that the reported variable sickness spell length is not a sensible outcome variable since it comprehends the
time before, during and after rehabilitation.27 This corresponds to a multinomial probit with a diagonal covariance matrix.28 In practise, some restrictions on the covariance matrix of the error terms of the MNP need to be imposed, since
not all elements of the covariance matrix are identified and to avoid excessive numerical instability. See below.

25
hood using the so-called GHK simulator (Börsch-Supan and Hajivassiliou, 1993). Since the ob-
servations are not randomly sampled from the population we use weighted maximum likelihood
estimators (WESML) as well for the estimation of the binary probits as for the multinomial probit
(see Manski and Lerman, 1977).
The MNP is estimated with the NO rehabilitation group as the reference group, and the results are
given in Table 6.1. From these coefficients all six participation probabilities can be computed for
any particular vector of characteristics X. From Table 6.1 it can be seen that young individuals
are more likely to participate in WORKPLACE training, while older individuals receive less often
rehabilitative measures. Males are less likely to participate in WORKPLACE rehabilitation. Swedish
born receive more likely WORKPLACE and EDUCATIONAL rehabilitation. Occupation in manufac-
turing reduces chances to receive any rehabilitation, while occupation in agriculture or other
services increases the probability to participate in SOCIAL rehabilitation. Individuals with prior
health problems and those who participated previously in vocational rehabilitation are more
likely to receive MEDICAL rehabilitation and to some extent EDUCATIONAL and WORKPLACE reha-
bilitation. Previous employment status and earnings are positively related to the participation
probability in WORKPLACE rehabilitation, which indicates that labour market attachment and the
magnitude of income loss increases the incentives for active participation in rehabilitation. While
the estimated coefficients mentioned so far are rather small in magnitude, the impacts of county
of residence and community type are large. Especially with regard to MEDICAL and SOCIAL reha-
bilitation, heterogeneity among the counties and communities is enormous. While Hallandslän,
Bohuslän and Göteborgskommun advocate strongly these two types of rehabilitation, it is much
more rare in Älvsborgslän. Also MEDICAL and SOCIAL rehabilitation are much more frequent in
industrial cities, while particularly uncommon in urban and suburban regions. This considerable
heterogeneity might be explained by differing budget restrictions, resource allocation and supply
of rehabilitation programmes.

26
Table 6.1: Results of the estimation of a multinomial probit model
9DULDEOH 3DVVLYH :RUNSODFH (GXFDWLRQ 0HGLFDO 6RFLDO&RQVWDQW ����� ����� ����� ����� �����$JH� ������\HDUV � ���� � � �
������\HDUV � ����� ����� ����� �����*HQGHU��PDOH� � ����� � � �&LWL]HQ��6ZHGLVK�ERUQ� ����� ���� ���� ������ �������:LGRZ���ZLGRZHU � ����� � � �2FFXSDWLRQ�LQ� PDQXIDFWXULQJ ������ ����� ����� ������� �������
DJULFXOWXUH���RWKHUV � � � � ����3UHYLRXV�VLFNQHVV�UHFRUG��������GD\V � � � ���� �
!����GD\V � � � ������� �3UHYLRXV�SDUWLFLSDWLRQ�LQ�YRFDWLRQDO�UHKDELOLWDWLRQ � ���� ���� ���� �(PSOR\HG�SULRU�WR�VLFNQHVV ����� ���� ������� ������ ������6LFNQHVV�EHQHILW�TXDOLI\LQJ�LQFRPH � ���� � � �&RXQW\�� +DOODQGVOlQ � � � ���� ����
%RKXVOlQ ����� ����� � ���� ����bOYVERUJVOlQ � � � ����� �*|WHERUJVNRPPXQ ����� ����� ����� ���� ����
8UEDQ���VXEXUEDQ�UHJLRQ � ����� � ����� �����0DMRU���PLGGOH�ODUJH�FLWLHV � ����� � ����� �����,QGXVWULDO�FLWLHV � � � ���� ����6LFNQHVV�UHJLVW��E\�SV\FK��RU�VRFLDO�PHGLFLQH�FHQWUH ���� � ���� ���� ����6LFNQHVV�UHJLVWUDWLRQ�E\�SULYDWH�RU�RWKHUV � � � � �����6LFNQHVV�GHJUHH������ ���� ���� ���� ������� ������,QGLFDWLRQV�RI�DOFRKRO�RU�GUXJ�DEXVH � ����� � � ����'LDJQRVLV� SV\FKLDWULF � � � � ����
PXVFXORVNHOHWDO ���� ���� ���� ���� ����LQMXULHV ���� ���� ������ ���� ����
$VVHVVHG�E\ HPSOR\HU ���� ���� ���� ���� ����,2 ���� ���� ���� ������ ����,2�RQ�EHKDOI�RI�HPSOR\HU ���� ���� ���� ���� ����
$VVHVVPHQW�QRW�QHHGHG ����� ����� ����� ����� �����0HGLFDO�95�UHFRPPHQGDWLRQ��ZDLW��VHH ���� ���� ���� ���� ����
��5HKDELOLWDWLRQ�QHHGHG ���� ���� ���� ���� ������HOLJLEOH�IRU�GLVDELOLW\�SHQVLRQ ���� ������� ������� ���� ������
1RQPHGLFDO�95�UHFRPP���5HKDELOLWDWLRQ�QHHGHG ���� ���� ���� ���� ������HOLJLEOH�IRU�GLVDELOLW\�SHQVLRQ � � � ����� �
0HGLFDO�IDFWRUV�SUHYHQWHG�YRFDWLRQDO�UHKDELOLWDWLRQ � ����� � ���� �9DULRXV�RWKHU�IDFWRUV�SUHYHQWHG�95 � ����� � ���� �5HKDELOLWDWLRQ�QHHGHG�E\�ERWK�UHFRPPHQGDWLRQV ����� ����� ����� ����� �����
,PSOLHG�YDULDQFHV�DQG�FRUUHODWLRQ�PDWUL[�RI�WKH�HUURU�WHUPV1RQH 3DVVLYH :RUNSODFH (GXFDWLRQ 0HGLFDO 6RFLDO
1RQH � � � � ����� �3DVVLYH � ����� ����� ����� �:RUNSODFH ���� ����� ����� �(GXFDWLRQ ���� ����� �����0HGLFDO ����� ����6RFLDO ����
27
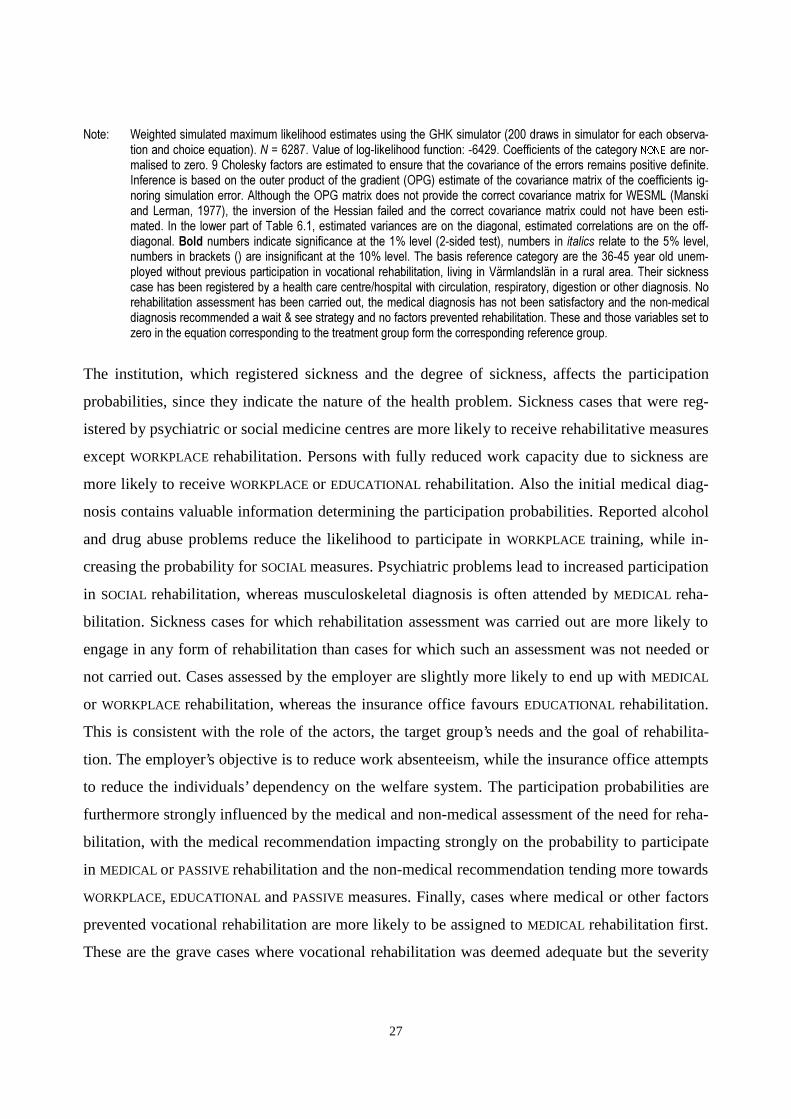
1RWH� :HLJKWHG�VLPXODWHG�PD[LPXP�OLNHOLKRRG�HVWLPDWHV�XVLQJ�WKH�*+.�VLPXODWRU������GUDZV�LQ�VLPXODWRU�IRU�HDFK�REVHUYD�WLRQ�DQG�FKRLFH�HTXDWLRQ���1� �������9DOXH�RI�ORJ�OLNHOLKRRG�IXQFWLRQ���������&RHIILFLHQWV�RI�WKH�FDWHJRU\�121(�DUH�QRU�PDOLVHG�WR�]HUR����&KROHVN\�IDFWRUV�DUH�HVWLPDWHG�WR�HQVXUH�WKDW�WKH�FRYDULDQFH�RI�WKH�HUURUV�UHPDLQV�SRVLWLYH�GHILQLWH�,QIHUHQFH�LV�EDVHG�RQ�WKH�RXWHU�SURGXFW�RI�WKH�JUDGLHQW��23*��HVWLPDWH�RI�WKH�FRYDULDQFH�PDWUL[�RI�WKH�FRHIILFLHQWV�LJ�QRULQJ�VLPXODWLRQ�HUURU��$OWKRXJK�WKH�23*�PDWUL[�GRHV�QRW�SURYLGH�WKH�FRUUHFW�FRYDULDQFH�PDWUL[� IRU�:(60/��0DQVNLDQG�/HUPDQ��������� WKH� LQYHUVLRQ�RI� WKH�+HVVLDQ� IDLOHG�DQG� WKH� FRUUHFW� FRYDULDQFH�PDWUL[� FRXOG� QRW� KDYH� EHHQ� HVWL�PDWHG��,Q�WKH�ORZHU�SDUW�RI�7DEOH������HVWLPDWHG�YDULDQFHV�DUH�RQ� WKH�GLDJRQDO��HVWLPDWHG�FRUUHODWLRQV�DUH�RQ� WKH�RII�GLDJRQDO��%ROG�QXPEHUV� LQGLFDWH�VLJQLILFDQFH�DW� WKH����OHYHO� ���VLGHG� WHVW���QXPEHUV� LQ� LWDOLFV� UHODWH� WR� WKH���� OHYHO�QXPEHUV�LQ�EUDFNHWV����DUH�LQVLJQLILFDQW�DW�WKH�����OHYHO��7KH�EDVLV�UHIHUHQFH�FDWHJRU\�DUH� WKH�������\HDU�ROG�XQHP�SOR\HG�ZLWKRXW�SUHYLRXV�SDUWLFLSDWLRQ�LQ�YRFDWLRQDO�UHKDELOLWDWLRQ�� OLYLQJ� LQ�9lUPODQGVOlQ� LQ�D�UXUDO�DUHD��7KHLU�VLFNQHVVFDVH�KDV�EHHQ�UHJLVWHUHG�E\�D�KHDOWK�FDUH�FHQWUH�KRVSLWDO�ZLWK�FLUFXODWLRQ��UHVSLUDWRU\��GLJHVWLRQ�RU�RWKHU�GLDJQRVLV��1RUHKDELOLWDWLRQ�DVVHVVPHQW�KDV�EHHQ�FDUULHG�RXW�� WKH�PHGLFDO�GLDJQRVLV�KDV�QRW�EHHQ�VDWLVIDFWRU\�DQG� WKH�QRQ�PHGLFDOGLDJQRVLV�UHFRPPHQGHG�D�ZDLW��VHH�VWUDWHJ\�DQG�QR�IDFWRUV�SUHYHQWHG�UHKDELOLWDWLRQ��7KHVH�DQG�WKRVH�YDULDEOHV�VHW�WR]HUR�LQ�WKH�HTXDWLRQ�FRUUHVSRQGLQJ�WR�WKH�WUHDWPHQW�JURXS�IRUP�WKH�FRUUHVSRQGLQJ�UHIHUHQFH�JURXS��
The institution, which registered sickness and the degree of sickness, affects the participation
probabilities, since they indicate the nature of the health problem. Sickness cases that were reg-
istered by psychiatric or social medicine centres are more likely to receive rehabilitative measures
except WORKPLACE rehabilitation. Persons with fully reduced work capacity due to sickness are
more likely to receive WORKPLACE or EDUCATIONAL rehabilitation. Also the initial medical diag-
nosis contains valuable information determining the participation probabilities. Reported alcohol
and drug abuse problems reduce the likelihood to participate in WORKPLACE training, while in-
creasing the probability for SOCIAL measures. Psychiatric problems lead to increased participation
in SOCIAL rehabilitation, whereas musculoskeletal diagnosis is often attended by MEDICAL reha-
bilitation. Sickness cases for which rehabilitation assessment was carried out are more likely to
engage in any form of rehabilitation than cases for which such an assessment was not needed or
not carried out. Cases assessed by the employer are slightly more likely to end up with MEDICAL
or WORKPLACE rehabilitation, whereas the insurance office favours EDUCATIONAL rehabilitation.
This is consistent with the role of the actors, the target group’s needs and the goal of rehabilita-
tion. The employer’s objective is to reduce work absenteeism, while the insurance office attempts
to reduce the individuals’ dependency on the welfare system. The participation probabilities are
furthermore strongly influenced by the medical and non-medical assessment of the need for reha-
bilitation, with the medical recommendation impacting strongly on the probability to participate
in MEDICAL or PASSIVE rehabilitation and the non-medical recommendation tending more towards
WORKPLACE, EDUCATIONAL and PASSIVE measures. Finally, cases where medical or other factors
prevented vocational rehabilitation are more likely to be assigned to MEDICAL rehabilitation first.
These are the grave cases where vocational rehabilitation was deemed adequate but the severity

28
of the sickness requested postponement of vocational measures until at least a partial recovery
had been achieved.
To sum up, selection to the different rehabilitative measures is more influenced by factors char-
acterising the social insurance office, the initial sickness degree and the results of the rehabilita-
tion assessment, than by individual socioeconomic characteristics such as age, gender.
Since estimation of MNP with full variance-covariance matrix is often numerically unstable,
some elements of the covariance matrix need to be restricted to zero. A variety of models with
different zero-restrictions on the Cholesky matrix have been estimated and finally the model pre-
sented in Table 6.1 has been chosen. In the lower part of that table the estimated variances and
correlations of the error terms are displayed. Particularly striking is the rather large variance in
the MEDICAL rehabilitation group, indicating that the individuals with need for medical rehabilita-
tion fit less well into this participation model or may be more heterogeneous.
The estimated coefficients of Table 6.1 are used to compute all participation probabilities for all
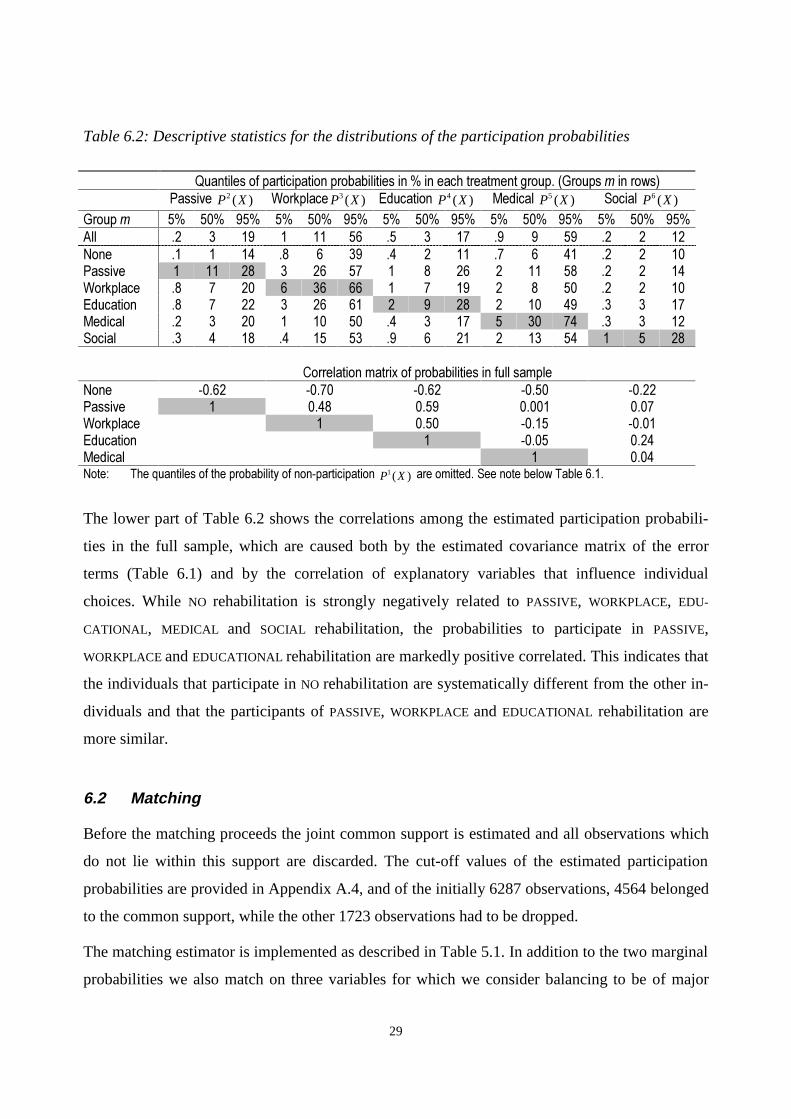
observations. Table 6.2 provides some descriptive statistics of the distributions of these prob-
abilities in the various subgroups. The columns in the upper part of the table contain the 5%, 50%
and 95% quantiles of the estimated participation probabilities. The first row provides these quan-
tiles for the whole population, the following rows give these quantiles in the subsamples m. Of
course, the values of the probabilities that correspond to the category in which these observations
are observed (shaded area) are the highest one in each column. The estimated quantiles exhibit a
considerable variation of the estimated probabilities, which means that the observations within a
treatment show considerably heterogeneity with respect to their characteristics. This indicates
also that there is probably sufficient overlap among the treatment groups, as it is necessary for
nonparametric evaluation.
29
Table 6.2: Descriptive statistics for the distributions of the participation probabilities
4XDQWLOHV�RI�SDUWLFLSDWLRQ�SUREDELOLWLHV�LQ���LQ�HDFK�WUHDWPHQW�JURXS���*URXSV�P�LQ�URZV�3DVVLYH� 2 ( )P X :RUNSODFH 3 ( )P X (GXFDWLRQ� 4 ( )P X 0HGLFDO� 5 ( )P X 6RFLDO� 6 ( )P X
*URXS�P �� ��� ��� �� ��� ��� �� ��� ��� �� ��� ��� �� ��� ���$OO �� � �� � �� �� �� � �� �� � �� �� � ��1RQH �� � �� �� � �� �� � �� �� � �� �� � ��3DVVLYH � �� �� � �� �� � � �� � �� �� �� � ��:RUNSODFH �� � �� � �� �� � � �� � � �� �� � ��(GXFDWLRQ �� � �� � �� �� � � �� � �� �� �� � ��0HGLFDO �� � �� � �� �� �� � �� � �� �� �� � ��6RFLDO �� � �� �� �� �� �� � �� � �� �� � � ��
&RUUHODWLRQ�PDWUL[�RI�SUREDELOLWLHV�LQ�IXOO�VDPSOH1RQH ����� ����� ����� ����� �����3DVVLYH � ���� ���� ����� ����:RUNSODFH � ���� ����� �����(GXFDWLRQ � ����� ����0HGLFDO � ����1RWH� 7KH�TXDQWLOHV�RI�WKH�SUREDELOLW\�RI�QRQ�SDUWLFLSDWLRQ� 1 ( )P X �DUH�RPLWWHG��6HH�QRWH�EHORZ�7DEOH�����
The lower part of Table 6.2 shows the correlations among the estimated participation probabili-
ties in the full sample, which are caused both by the estimated covariance matrix of the error
terms (Table 6.1) and by the correlation of explanatory variables that influence individual
choices. While NO rehabilitation is strongly negatively related to PASSIVE, WORKPLACE, EDU-
CATIONAL, MEDICAL and SOCIAL rehabilitation, the probabilities to participate in PASSIVE,
WORKPLACE and EDUCATIONAL rehabilitation are markedly positive correlated. This indicates that
the individuals that participate in NO rehabilitation are systematically different from the other in-
dividuals and that the participants of PASSIVE, WORKPLACE and EDUCATIONAL rehabilitation are
more similar.
6.2 Matching
Before the matching proceeds the joint common support is estimated and all observations which
do not lie within this support are discarded. The cut-off values of the estimated participation
probabilities are provided in Appendix A.4, and of the initially 6287 observations, 4564 belonged
to the common support, while the other 1723 observations had to be dropped.
The matching estimator is implemented as described in Table 5.1. In addition to the two marginal
probabilities we also match on three variables for which we consider balancing to be of major

30
importance, namely the indicators for the medical and non-medical recommendation of the need
for vocational rehabilitation with status rehabilitation needed and defined and the non-medical
recommendation eligible for disability pension.29
After having matched pairs for all treatment groups, the success of the matching should be in-
spected before proceeding to the estimation of the treatment effects. A poor match quality would
indicate that the matched groups are not genuinely balanced on the observed characteristics and
that no outcome comparisons based on these matches would be justified. In the following we
measure the match quality by the balancing of the corresponding propensity scores (Lechner,
2000). The upper panel of Table 6.3 gives the standardised bias, whereas the lower panel contains
the absolute bias, i.e. the average difference of the probabilities in the two samples. At first it ap-
pears that the mean of the probability relating to the treatment group (m) is almost always higher
than the mean in the matched comparison group, whereas for the probability of the comparison
treatment (l) it is just opposite. This could however be expected, because the unadjusted mean of
( )mP X is largest in subsample m, whereas the mean of ( )lP X is largest in subsample l.
Somewhat worrying are the sometimes large values of the standardised bias in the upper part of
the table. However, this finding looks much less dramatic when comparing the absolute biases,
which do never exceed 0.7%-points and are of the same magnitude as in Lechner (2000). This
means that in some cases the large values of the standardised bias relate basically to small prob-
abilities and hence small standard deviations used for standardising. Nevertheless, some caution
might be adequate when comparing the estimated effects for NO compared to PASSIVE rehabilita-
tion and MEDICAL compared to EDUCATIONAL rehabilitation. Apart from the participation prob-
abilities we also checked the balancing of the variables age, gender, employment status, and
medical and non-medical recommendation. No sizeable unbalances have been detected.
29 We do not exactly use the Mahalanobis metric, but overweight the two probabilities by a factor of 10.

31
Table 6.3: The balancing of the probabilities used for matching
l
m
1RQH 3DVVLYH :RUNSODFH (GXFDWLRQ 0HGLFDO 6RFLDO
( )mP X 1( )P X ( )mP X 2 ( )P X ( )mP X 3( )P X ( )mP X 4 ( )P X ( )mP X 5 ( )P X ( )mP X 6 ( )P X
6WDQGDUGLVHG�ELDV�� �����1RQH ��� ���� ��� ���� ���� ���� ��� ���� ���� ���3DVVLYH ��� ���� ��� ���� ��� ���� ��� ���� ��� ����:RUNSODFH ��� ��� ��� ���� ��� ���� ��� ���� ��� ����(GXFDWLRQ ��� ��� ��� ���� ��� ���� ��� ���� ��� ����0HGLFDO ��� ���� ��� ���� ��� ���� ��� ���� ��� �����6RFLDO ��� ��� ��� ���� ��� ���� ��� ���� ��� ����
%LDV��� �����1RQH ��� ���� ��� ���� ���� ���� ��� ���� ��� ���3DVVLYH ��� ���� ��� ���� ��� ���� ��� ���� ��� ����:RUNSODFH ��� ��� ��� ���� ��� ��� ��� ���� ��� ����(GXFDWLRQ ��� ��� ��� ��� ��� ���� ��� ���� ��� ����0HGLFDO ��� ���� ��� ���� ��� ���� ��� ���� ��� ����6RFLDO ��� ��� ��� ���� ��� ���� ��� ���� ��� ����1RWH�� 7KH�VWDQGDUGLVHG�ELDV��6%��LV�GHILQHG�DV�WKH�DEVROXWH�GLIIHUHQFH�RI�WKH�PHDQV�LQ�WKH�VXEVDPSOHV�P�DQG�WKH�PDWFKHG
FRPSDULVRQ�VDPSOH�REWDLQHG�IURP�SDUWLFLSDQWV�LQ�O�GLYLGHG�E\�WKH�VTXDUH�URRW�RI�WKH�DYHUDJH�RI�WKH�YDULDQFHV�LQ�P�DQGWKH�PDWFKHG�FRPSDULVRQ�VDPSOH� ������6%�FDQ�EH�LQWHUSUHWHG�DV�ELDV�LQ���RI�WKH�DYHUDJH�VWDQGDUG�GHYLDWLRQ��7KH�ELDVJLYHV�WKH�GLIIHUHQFH�LQ�WKH�PHDQ�SUREDELOLWLHV�LQ�WKH�VXEVDPSOHV�P�DQG�WKH�PDWFKHG�FRPSDULVRQ�VDPSOH�
A matching algorithm that uses every control observation only once runs into problems in regions
of the attribute space where the density of the probabilities is very low for the comparison group
compared to the treatment group.30 An algorithm that allows using the same observation more
than once does not have that problem as long as there is overlap in the distributions. The draw-
back of that estimator might be that it uses observations too often, in the sense that comparable
observations that are almost identical to the ones actually used are available. Hence, in principle
there could be substantial losses in precision. Table 6.4 addresses this issue, considering a meas-
ure already used in Lechner (2000). It is a concentration ratio computed as the sum of weights in
the first decile of the weight distribution, where each weight equals the number of treated obser-
vations, adjusted by their sampling weight, to which the specific control observation is matched
to it. These weights are divided by the total sum of weights in the comparison sample. Compared
to Gerfin and Lechner (2000) and Lechner (2000), these figures appear fairly high, particularly
when matched to the individuals that did not participate in rehabilitation (first row). This implies
a considerable loss in precision which will materialise in less significant estimated treatment ef-
30 Since every group acts as a comparison group in the multi-programme framework, this occurs by definition.

32
fects. This, however, might be unavoidable, since the large NO rehabilitation group contains cases
that are rarely represented in the other treatment groups.
Table 6.4: Excess use of single observations in %
l
m
1RQH 3DVVLYH :RUNSODFH (GXFDWLRQ 0HGLFDO 6RFLDO
1RQH �� �� �� �� ��3DVVLYH �� �� �� �� ��:RUNSODFH �� �� �� �� ��(GXFDWLRQ �� �� �� �� ��0HGLFDO �� �� �� �� ��6RFLDO �� �� �� �� ��1RWH�� 6KDUH�RI�WKH�VXP�RI�ODUJHVW�����RI�ZHLJKWV�RI�WRWDO�VXP�RI�ZHLJKWV�
6.3 Effects of rehabilitation
Tables 6.5 and 6.6 present the estimated pair-wise average treatment effects and average treat-
ment effects on the treated. Below we will also discuss results for particular sub-populations. All
estimates are based on weighting to take account of the sampling weights.31 The estimation re-
sults in Tables 6.5 and 6.6 are discussed jointly for each outcome variable. Table 6.5 provides the
treatment effects for an individual drawn randomly from the total population ( ,0 [ ]m l m lE Y Yγ = − ),
while Table 6.6 contains these effects for an individual drawn from the treatment population m,
( ,0 [ | ]m l m lE Y Y S mθ = − = ). In Table 6.5 a positive number indicates that the treatment in the cor-
responding row (m) had a positive effect compared to the treatment in the corresponding column
(l), whereas in Table 6.6 a positive number indicates that treatment m had a positive effect on the
participants in treatment m compared to treatment l. In the last column in Tables 6.5 and 6.6 the
composite effects are presented.
Concerning the outcome variable outflows into employment Table 6.5 indicates that NO and
SOCIAL rehabilitation fare significantly better than PASSIVE and EDUCATIONAL rehabilitation by
about 16% and 19%, respectively32. Also WORKPLACE rehabilitation increases re-employment
chances compared to EDUCATIONAL rehabilitation by 12.5%, although only weakly significant.
31 For the estimation of the conditional expectations the components of the sample means in group l are weighted by
the individual sampling weight of the individual in treatment group m to whom the particular person is matched.

33
Thus, for the population as a whole, NO, SOCIAL and to some extent WORKPLACE rehabilitation are
strongly preferable to PASSIVE and EDUCATIONAL rehabilitation.
Table 6.5: Evaluation results for the whole population ( ,0
m lγ , in % points)
l
m
1RQH 3DVVLYH :RUNSODFH (GXFDWLRQ 0HGLFDO 6RFLDO &RPSRVLWHHIIHFW
(PSOR\PHQW1RQH ���� ���� ���� ���3DVVLYH ����� ���� ����� ����� �����:RUNSODFH ���� ���� ���� ���(GXFDWLRQ ����� ����� ���� ����� �����0HGLFDO ���� ����6RFLDO ���� ���� ���� ����
/DERXU�IRUFH1RQH ���� ���� ���� ���� ����3DVVLYH ����� ���� �����:RUNSODFH ����� ���� ����(GXFDWLRQ ���� ����0HGLFDO ����� ���� ����6RFLDO ���� ����
'LVDELOLW\�SHQVLRQ1RQH ���� ����3DVVLYH ���� ���:RUNSODFH ��� ����(GXFDWLRQ ��� ���0HGLFDO ��� ����6RFLDO ��� ����
6LFNQHVV�WHUPLQDWHG�ZLWKLQ�UHSRUWLQJ�SHULRG�� QRW�ULJKW�FHQVRUHG�1RQH ���� ���� ���� ��� ����3DVVLYH ����� ���� �����:RUNSODFH ����� ���� ����(GXFDWLRQ ���� ����0HGLFDO ���� ���� ����6RFLDO ���� ����1RWH�� $EVROXWH�XQDGMXVWHG�OHYHOV�RQ�PDLQ�GLDJRQDO��VKDGHG��LQ�EUDFNHWV���7KH�FHOOV�FRQWDLQ�RQO\�HQWULHV�LI�WKH�HIIHFW�LV�VLJQLIL�
FDQW�DW�WKH�����OHYHO��(IIHFWV�VLJQLILFDQW�DW�WKH����OHYHO�DUH�JLYHQ�LQ�LWDOLFV��WKRVH�VLJQLILFDQW�DW�WKH����OHYHO�DUH�JLYHQ�LQEROG�OHWWHUV��1R�VLJQLILFDQW�HIIHFWV�DUH�IRXQG�IRU�KHDOWK�
Estimating these effects for the various treatment-subpopulations, in Table 6.6 it can be seen that
those selected into NO rehabilitation were well placed, with higher employment chances than had
they participated in PASSIVE or EDUCATIONAL rehabilitation. The participants in PASSIVE reha-
bilitation would have been better off, had they been transferred to NO, WORKPLACE or SOCIAL re-
32 All figures in % should be read as %-points with respect to the outcome variable.

34
habilitation. Also those participants in EDUCATIONAL rehabilitation would have been better off
with NO or SOCIAL rehabilitation. Particularly interesting is, that the participants in WORKPLACE
rehabilitation obtain strongly and significantly improved employment chances compared to the
situation had they participated in PASSIVE, EDUCATIONAL or MEDICAL rehabilitation. This differs
from the results in Table 6.5 where WORKPLACE rehabilitation is only weakly significantly supe-
rior to EDUCATIONAL rehabilitation. Thus for those who were selected into WORKPLACE rehabili-
tation their chances have clearly improved compared to other rehabilitative measures, while this
may not be true for the groups of individuals who participated in other treatments.
In the last column of Tables 6.5 and 6.6 the composite effects are given which summarise all es-
timated pair-wise effects. Unfortunately no confidence levels are yet available and these compos-
ite effects should be interpreted very cautiously. NO and WORKPLACE rehabilitation are clearly the
most successful and PASSIVE and EDUCATIONAL the worst. MEDICAL seems not to affect employ-
ment chances and SOCIAL is moderately negative. Only for SOCIAL rehabilitation the whole-
population estimates ,m lγ and the treatment-population estimates ,m lθ differ, with ,m lθ worse
than ,m lγ , implying that for the actual participants in SOCIAL rehabilitation this measure was more
harmful than for the population on average, suggesting that the wrong cases have been selected
into SOCIAL rehabilitation.
Regarding the outcome variable outflows into the labour force hardly any significant effects can
be found for the whole population. In Table 6.5 NO rehabilitation displays higher outflows com-
pared to PASSIVE, WORKPLACE and MEDICAL rehabilitation by 10-17%, which is confirmed by the
specific effects in Table 6.6 for the NO rehabilitation group. As with outflows to employment, the
participants in PASSIVE and EDUCATION are worse of compared to NO rehabilitation or other reha-
bilitative measures. For the participants in WORKPLACE rehabilitation only weakly significant
positive effects compared to MEDICAL rehabilitation are detected. The composite effects show that
WORKPLACE rehabilitation has on average almost no effect, while NO rehabilitation increases out-
flows considerably. For PASSIVE, EDUCATIONAL and SOCIAL similar results as for outflows to em-
ployment appear, with PASSIVE and EDUCATIONAL being worst and a negative effect for SOCIAL
rehabilitation, again aggravated by an apparently improper selection of participants.
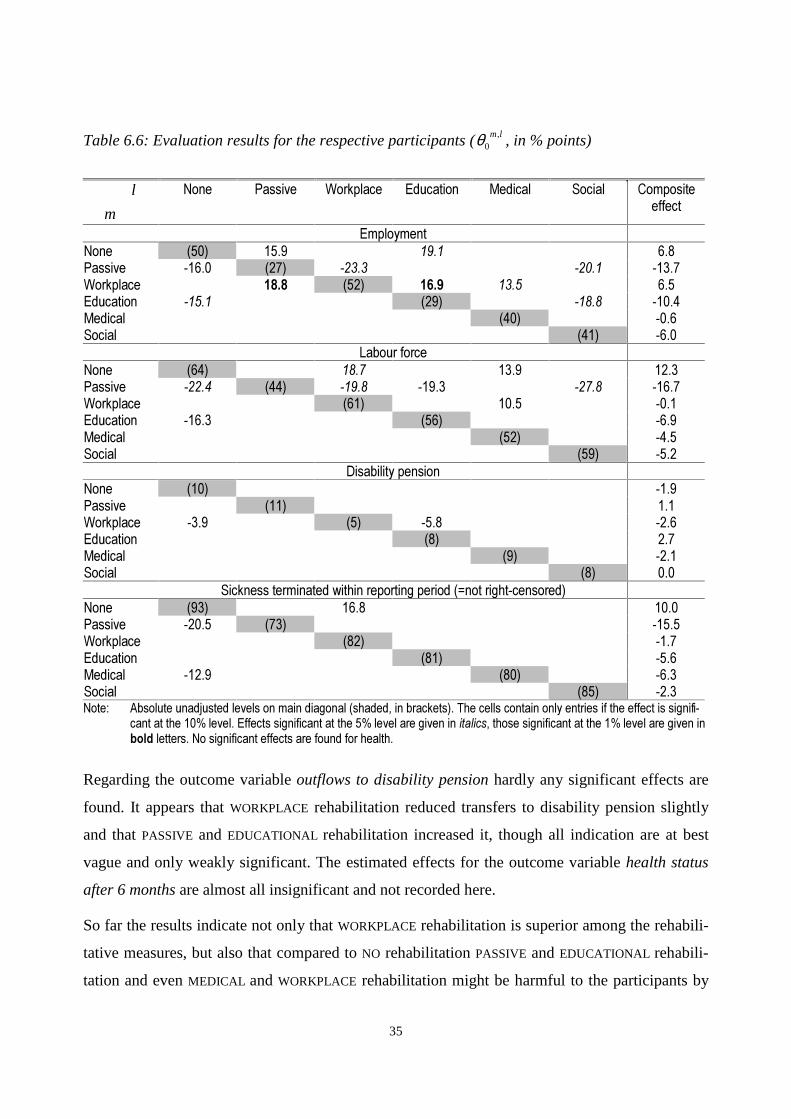
35
Table 6.6: Evaluation results for the respective participants ( ,0
m lθ , in % points)
l
m
1RQH 3DVVLYH :RUNSODFH (GXFDWLRQ 0HGLFDO 6RFLDO &RPSRVLWHHIIHFW
(PSOR\PHQW1RQH ���� ���� ���� ���3DVVLYH ����� ���� ����� ����� �����:RUNSODFH ���� ���� ���� ���� ���(GXFDWLRQ ����� ���� ����� �����0HGLFDO ���� ����6RFLDO ���� ����
/DERXU�IRUFH1RQH ���� ���� ���� ����3DVVLYH ����� ���� ����� ����� ����� �����:RUNSODFH ���� ���� ����(GXFDWLRQ ����� ���� ����0HGLFDO ���� ����6RFLDO ���� ����
'LVDELOLW\�SHQVLRQ1RQH ���� ����3DVVLYH ���� ���:RUNSODFH ���� ��� ���� ����(GXFDWLRQ ��� ���0HGLFDO ��� ����6RFLDO ��� ���
6LFNQHVV�WHUPLQDWHG�ZLWKLQ�UHSRUWLQJ�SHULRG�� QRW�ULJKW�FHQVRUHG�1RQH ���� ���� ����3DVVLYH ����� ���� �����:RUNSODFH ���� ����(GXFDWLRQ ���� ����0HGLFDO ����� ���� ����6RFLDO ���� ����1RWH�� $EVROXWH�XQDGMXVWHG�OHYHOV�RQ�PDLQ�GLDJRQDO��VKDGHG��LQ�EUDFNHWV���7KH�FHOOV�FRQWDLQ�RQO\�HQWULHV�LI�WKH�HIIHFW�LV�VLJQLIL�
FDQW�DW�WKH�����OHYHO��(IIHFWV�VLJQLILFDQW�DW�WKH����OHYHO�DUH�JLYHQ�LQ�LWDOLFV��WKRVH�VLJQLILFDQW�DW�WKH����OHYHO�DUH�JLYHQ�LQEROG�OHWWHUV��1R�VLJQLILFDQW�HIIHFWV�DUH�IRXQG�IRU�KHDOWK�
Regarding the outcome variable outflows to disability pension hardly any significant effects are
found. It appears that WORKPLACE rehabilitation reduced transfers to disability pension slightly
and that PASSIVE and EDUCATIONAL rehabilitation increased it, though all indication are at best
vague and only weakly significant. The estimated effects for the outcome variable health status
after 6 months are almost all insignificant and not recorded here.
So far the results indicate not only that WORKPLACE rehabilitation is superior among the rehabili-
tative measures, but also that compared to NO rehabilitation PASSIVE and EDUCATIONAL rehabili-
tation and even MEDICAL and WORKPLACE rehabilitation might be harmful to the participants by

36
reducing their re-employment chances and their labour force reintegration by about 10-20%
points. These sizeable negative effects, however, are largely due to the prolongation of the sick-
ness spell through rehabilitation. Taking a look at the shares of sickness cases which terminated
within the reporting period, July 1991 until December 1994, which are given on the main diago-
nal at the bottom of Tables 6.5 and 6.6, it can be seen that 93% of all sickness cases in NO reha-
bilitation were closed before December 1994, whereas only 73% of all sickness cases in PASSIVE
rehabilitation terminated within the data collection period. Due to this data collection scheme the
remaining 27% cases in PASSIVE rehabilitation are right-censored and their final outflow destina-
tion is unknown. Estimating the effects of rehabilitation on the probability that a sickness case
ends before December 1994 (Tables 6.5 and 6.6) it is seen, that among the rehabilitative meas-
ures no significant differences are found. However, a participant in NO rehabilitation is signifi-
cantly more likely to terminate its sickness within the reporting period than had he participated in
PASSIVE, WORKPLACE or MEDICAL rehabilitation. Interestingly, the significant effects are of simi-
lar magnitude than the treatment effects on the re-employment and labour force reintegration out-
comes, suggesting that the negative employment effects of PASSIVE, WORKPLACE and MEDICAL
rehabilitation compared to NO rehabilitation are mainly due to a 10-20 %-points increased prob-
ability of exhausting the data collection period. Thus it seems that rehabilitative measures extend
the sickness spell substantially compared to NO rehabilitation.
To disentangle the effects of rehabilitation on the length of sickness from the effects on the out-
flow destination after termination of the sickness, the treatment effects are also estimated for two
specific sub-populations: All sickness cases which were registered in the period July 1991 until
June 1993 and all sickness cases which were closed in the data collection period. While the for-
mer sub-population includes only cases with at least 18 months to recover before right-censoring,
the latter includes only cases for which the outflow destination is observed. The estimation re-
sults for the former population, presented in Table B.1 in the appendix, are very similar to the
results in Tables 6.5. and 6.6. Although the share of closed cases increased to 83-96% for the
various rehabilitative measures, the probability of sickness termination within reporting period is
still significantly reduced for WORKPLACE and MEDICAL rehabilitation by about the same magni-
tude as for the whole population.
For the population of closed cases, strikingly most estimated treatment effects are insignificant.
No significant effects on the outcome variables outflows to labour force, disability pension and

37
health status are found and only few effects with respect to re-employment chances. Particularly
remarkable is the large negative effect of EDUCATIONAL rehabilitation compared to NO rehabilita-
tion, while the previously negative effects of the other rehabilitative measures compared with NO
rehabilitation have vanished. Also compared to WORKPLACE rehabilitation EDUCATIONAL reha-
bilitation performs worse for the sub-population of closed cases than it does for the whole popu-
lation. Thus even when considering only closed cases EDUCATIONAL rehabilitation appears seri-
ously harmful. It should however be recalled that this sample of closed cases is endogenously
selected, in the sense that individuals for whom the treatment prolonged the duration of sickness
are undersampled, whereas individuals for whom the treatment reduced the duration of the sick-
ness spell are oversampled. Thus sample selection is performed on an outcome variable. Never-
theless, these results help to understand the reasons behind the size of the estimated effects.
Taken together it seems that the often negative effects of PASSIVE, MEDICAL and WORKPLACE re-
habilitation compared to NO rehabilitation in the Tables 6.5 and 6.6 might to a large extent be at-
tributed to a prolongation of the sickness spell due to rehabilitation, whereas EDUCATIONAL reha-
bilitation seems to decrease re-employment chances without prolonging significantly the sickness
spell. Apart from the time spent in rehabilitative measures, also bureaucratic delays or inertia in
the rehabilitative process may cause these extended sickness spells, e.g. for PASSIVE rehabilita-
tion. Further, reduced job search activity or reduced private rehabilitation in form of re-creation
and vacation may be along the factors explaining the negative treatment effects. Additionally, as
seen in Table 4.1, the pool of participants in EDUCATIONAL rehabilitation seems to contain sub-
stantially more bad-risks, with 35% who have been sick for more than sixty days in the previous
six months and 23% who have had participated in vocational rehabilitation in the year before. If a
potential employer is aware of the accumulation of repeatedly sick persons in the participant pool
of EDUCATIONAL rehabilitation but not able to obtain detailed information about the sickness his-
tory of an applicant, which is a very sensitive topic indeed, the employer will associate a higher
average risk for increased sickness absenteeism in the future with the participants in EDUCA-
TIONAL rehabilitation and will be reluctant to employ a person from the participants in EDU-
CATIONAL rehabilitation.
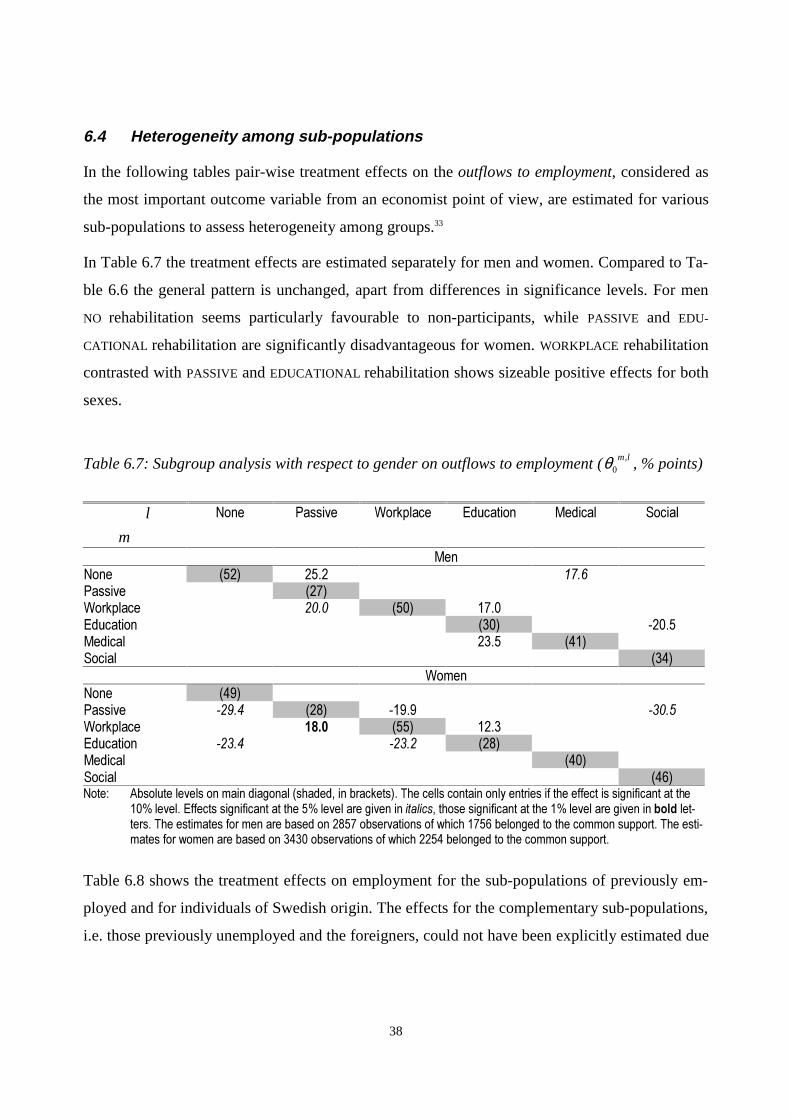
38
6.4 Heterogeneity among sub-populations
In the following tables pair-wise treatment effects on the outflows to employment, considered as
the most important outcome variable from an economist point of view, are estimated for various
sub-populations to assess heterogeneity among groups.33
In Table 6.7 the treatment effects are estimated separately for men and women. Compared to Ta-
ble 6.6 the general pattern is unchanged, apart from differences in significance levels. For men
NO rehabilitation seems particularly favourable to non-participants, while PASSIVE and EDU-
CATIONAL rehabilitation are significantly disadvantageous for women. WORKPLACE rehabilitation
contrasted with PASSIVE and EDUCATIONAL rehabilitation shows sizeable positive effects for both
sexes.
Table 6.7: Subgroup analysis with respect to gender on outflows to employment ( ,0
m lθ , % points)
l
m
1RQH 3DVVLYH :RUNSODFH (GXFDWLRQ 0HGLFDO 6RFLDO
0HQ1RQH ���� ���� ����3DVVLYH ����:RUNSODFH ���� ���� ����(GXFDWLRQ ���� �����0HGLFDO ���� ����6RFLDO ����
:RPHQ1RQH ����3DVVLYH ����� ���� ����� �����:RUNSODFH ���� ���� ����(GXFDWLRQ ����� ����� ����0HGLFDO ����6RFLDO ����1RWH�� $EVROXWH�OHYHOV�RQ�PDLQ�GLDJRQDO��VKDGHG��LQ�EUDFNHWV���7KH�FHOOV�FRQWDLQ�RQO\�HQWULHV�LI�WKH�HIIHFW�LV�VLJQLILFDQW�DW�WKH
����OHYHO��(IIHFWV�VLJQLILFDQW�DW�WKH����OHYHO�DUH�JLYHQ�LQ�LWDOLFV��WKRVH�VLJQLILFDQW�DW�WKH����OHYHO�DUH�JLYHQ�LQ�EROG�OHW�WHUV��7KH�HVWLPDWHV�IRU�PHQ�DUH�EDVHG�RQ������REVHUYDWLRQV�RI�ZKLFK������EHORQJHG�WR�WKH�FRPPRQ�VXSSRUW��7KH�HVWL�PDWHV�IRU�ZRPHQ�DUH�EDVHG�RQ������REVHUYDWLRQV�RI�ZKLFK������EHORQJHG�WR�WKH�FRPPRQ�VXSSRUW�
Table 6.8 shows the treatment effects on employment for the sub-populations of previously em-
ployed and for individuals of Swedish origin. The effects for the complementary sub-populations,
i.e. those previously unemployed and the foreigners, could not have been explicitly estimated due
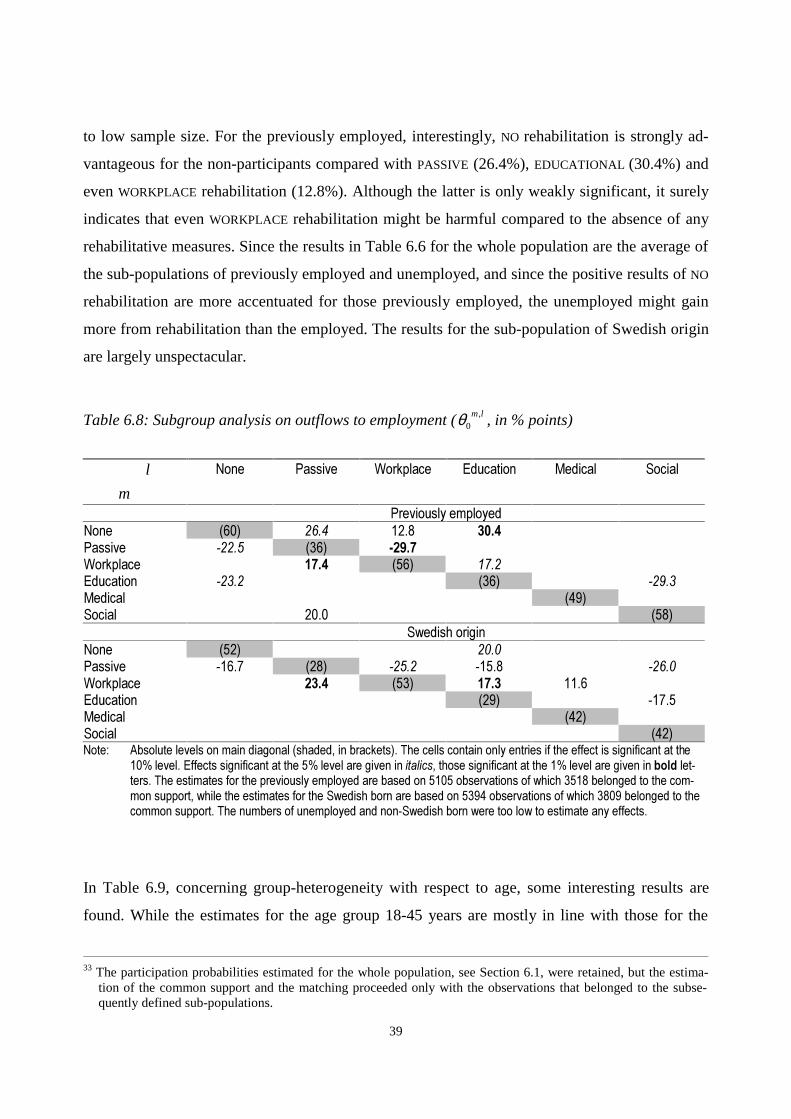
39
to low sample size. For the previously employed, interestingly, NO rehabilitation is strongly ad-
vantageous for the non-participants compared with PASSIVE (26.4%), EDUCATIONAL (30.4%) and
even WORKPLACE rehabilitation (12.8%). Although the latter is only weakly significant, it surely
indicates that even WORKPLACE rehabilitation might be harmful compared to the absence of any
rehabilitative measures. Since the results in Table 6.6 for the whole population are the average of
the sub-populations of previously employed and unemployed, and since the positive results of NO
rehabilitation are more accentuated for those previously employed, the unemployed might gain
more from rehabilitation than the employed. The results for the sub-population of Swedish origin
are largely unspectacular.
Table 6.8: Subgroup analysis on outflows to employment ( ,0
m lθ , in % points)
l
m
1RQH 3DVVLYH :RUNSODFH (GXFDWLRQ 0HGLFDO 6RFLDO
3UHYLRXVO\�HPSOR\HG1RQH ���� ���� ���� ����3DVVLYH ����� ���� �����:RUNSODFH ���� ���� ����(GXFDWLRQ ����� ���� �����0HGLFDO ����6RFLDO ���� ����
6ZHGLVK�RULJLQ1RQH ���� ����3DVVLYH ����� ���� ����� ����� �����:RUNSODFH ���� ���� ���� ����(GXFDWLRQ ���� �����0HGLFDO ����6RFLDO ����1RWH�� $EVROXWH�OHYHOV�RQ�PDLQ�GLDJRQDO��VKDGHG��LQ�EUDFNHWV���7KH�FHOOV�FRQWDLQ�RQO\�HQWULHV�LI�WKH�HIIHFW�LV�VLJQLILFDQW�DW�WKH
����OHYHO��(IIHFWV�VLJQLILFDQW�DW�WKH����OHYHO�DUH�JLYHQ�LQ�LWDOLFV��WKRVH�VLJQLILFDQW�DW�WKH����OHYHO�DUH�JLYHQ�LQ�EROG�OHW�WHUV��7KH�HVWLPDWHV�IRU�WKH�SUHYLRXVO\�HPSOR\HG�DUH�EDVHG�RQ������REVHUYDWLRQV�RI�ZKLFK������EHORQJHG�WR�WKH�FRP�PRQ�VXSSRUW��ZKLOH�WKH�HVWLPDWHV�IRU�WKH�6ZHGLVK�ERUQ�DUH�EDVHG�RQ������REVHUYDWLRQV�RI�ZKLFK������EHORQJHG�WR�WKHFRPPRQ�VXSSRUW��7KH�QXPEHUV�RI�XQHPSOR\HG�DQG�QRQ�6ZHGLVK�ERUQ�ZHUH�WRR�ORZ�WR�HVWLPDWH�DQ\�HIIHFWV�
In Table 6.9, concerning group-heterogeneity with respect to age, some interesting results are
found. While the estimates for the age group 18-45 years are mostly in line with those for the
33 The participation probabilities estimated for the whole population, see Section 6.1, were retained, but the estima-
tion of the common support and the matching proceeded only with the observations that belonged to the subse-quently defined sub-populations.

40
whole population, the estimated effects for the 46-55 year old show strongly negative results for
EDUCATIONAL training. EDUCATIONAL rehabilitation decreases re-employment chances by about
30% for the participants and also substantially for those who did not participate in this measure.
Thus EDUCATIONAL rehabilitation appears to decrease employment chances remarkably for this
age group. Also worth mentioning is, that those who did not participate in EDUCATIONAL reha-
bilitation are less harmed by this measure than those who did participate, suggesting that the se-
lection of participants exacerbated the negative effects. In contrast to the previous subgroup re-
sults, MEDICAL rehabilitation displays strongly significant and large positive results, though only
compared to EDUCATIONAL and SOCIAL rehabilitation.
Table 6.9: Subgroup analysis with respect to age on outflows to employment ( ,0
m lθ , in % points)
l
m
1RQH 3DVVLYH :RUNSODFH (GXFDWLRQ 0HGLFDO 6RFLDO
$JH�������\HDUV1RQH ���� ����3DVVLYH ���� ����� �����:RUNSODFH ���� ���� ����(GXFDWLRQ ���� �����0HGLFDO ����6RFLDO ����
$JH�������\HDUV1RQH ���� ���� ����3DVVLYH ���� �����:RUNSODFH ���� ���� ����(GXFDWLRQ ����� ����� ���� ����� �����0HGLFDO ���� ���� ����6RFLDO ����1RWH�� $EVROXWH�OHYHOV�RQ�PDLQ�GLDJRQDO��VKDGHG��LQ�EUDFNHWV���7KH�FHOOV�FRQWDLQ�RQO\�HQWULHV�LI�WKH�HIIHFW�LV�VLJQLILFDQW�DW�WKH
����OHYHO��(IIHFWV�VLJQLILFDQW�DW�WKH����OHYHO�DUH�JLYHQ�LQ�LWDOLFV��WKRVH�VLJQLILFDQW�DW�WKH����OHYHO�DUH�JLYHQ�LQ�EROG�OHW�WHUV��7KH�HVWLPDWHV�IRU�DJH�������DUH�EDVHG�RQ������REVHUYDWLRQV�ZLWK������REVHUYDWLRQV�LQ�WKH�FRPPRQ�VXSSRUW�ZKLOH�WKH�HVWLPDWHV�IRU�DJH�������DUH�EDVHG�RQ������REVHUYDWLRQV�ZLWK������REVHUYDWLRQV�LQ�WKH�FRPPRQ�VXSSRUW�
In Table 6.10 the treatment effects are estimated for the sub-populations of individuals which did
not participate in vocational rehabilitation in the twelve-month period before the beginning of the
current sickness spell and which have been sick for less than 15 days in the previous six months,
respectively. The estimation results for the complementary populations are not reported since the
estimated effects were all insignificant. For these two sub-populations WORKPLACE rehabilitation
performs significantly better in comparison to PASSIVE, EDUCATIONAL and MEDICAL rehabilitation

41
than it does for the whole population (Table 6.6). Also MEDICAL rehabilitation displays some sig-
nificant positive effects compared to PASSIVE and EDUCATIONAL rehabilitation, which have been
insignificant for the whole population.
Table 6.10: Subgroup analysis with respect to health record on outflows to employment ( ,0
m lθ )
l
m
1RQH 3DVVLYH :RUNSODFH (GXFDWLRQ 0HGLFDO 6RFLDO
1R�SUHYLRXV�YRFDWLRQDO�UHKDELOLWDWLRQ��LQ�ODVW�WZHOYH�PRQWKV�1RQH ���� ����3DVVLYH ����� ���� ����� ����� �����:RUNSODFH ���� ���� ���� ����(GXFDWLRQ ����� ���� �����0HGLFDO ���� ����6RFLDO ����
3UHYLRXV�VLFNQHVV�UHFRUG������GD\V��LQ�ODVW�VL[�PRQWKV�1RQH ���� ���� ���� ����3DVVLYH ���� ����� �����:RUNSODFH ���� ���� ���� ����(GXFDWLRQ ���� �����0HGLFDO ���� ���� ����6RFLDO ����� ����1RWH�� $EVROXWH�OHYHOV�RQ�PDLQ�GLDJRQDO��VKDGHG��LQ�EUDFNHWV���7KH�FHOOV�FRQWDLQ�RQO\�HQWULHV�LI�WKH�HIIHFW�LV�VLJQLILFDQW�DW�WKH
����OHYHO��(IIHFWV�VLJQLILFDQW�DW�WKH����OHYHO�DUH�JLYHQ�LQ�LWDOLFV��WKRVH�VLJQLILFDQW�DW�WKH����OHYHO�DUH�JLYHQ�LQ�EROG�OHW�WHUV��7KH�HVWLPDWHV�IRU�QR�SUHYLRXV�SDUWLFLSDWLRQ�DUH�EDVHG�RQ������REVHUYDWLRQV�ZLWK������REVHUYDWLRQV�LQ�WKH�FRPPRQVXSSRUW��ZKLOH�WKH�HVWLPDWHV�IRU�SUHYLRXV�VLFNQHVV�EHORZ����GD\V�DUH�EDVHG�RQ������REVHUYDWLRQV�ZLWK������REVHUYD�WLRQV�LQ�WKH�FRPPRQ�VDPSOH�
7 Conclusions
This study estimates the causal effects of rehabilitation in Western Sweden on the labour market
situation, disability pension frequency, and health status. The various rehabilitative measures are
grouped into no rehabilitation, passive rehabilitation, workplace rehabilitation, educational reha-
bilitation, medical rehabilitation, and social rehabilitation, and the effects are estimated by non-
parametric propensity score matching for multiple treatments. Average programme effects are
estimated for the whole population and for sub-populations to detect heterogeneity among rele-
vant groups of the population.
The estimates for the whole population indicate that many rehabilitative measures decrease re-
employment and re-integration chances compared to no rehabilitation. For the participants in
42
workplace rehabilitation re-employment chances improve compared to all other rehabilitative
measures, though no significant evidence is found that work-place rehabilitation would boost re-
employment compared to no rehabilitation. Passive and educational rehabilitation fare worst
among the rehabilitative measures. For most rehabilitative measures these negative effects seem
to stem from a prolongation of the sickness spell due to participation in rehabilitation, whilst edu-
cational rehabilitation appears to reduce re-employment chances directly. These negative effects
of rehabilitation might be explained by indirect costs or opportunity costs of the time spent in
rehabilitation in form of reduced job search activity or reduced private re-creative activities, e.g.
holidays. Also stigma effects might contribute to the negative re-employment chances of educa-
tional rehabilitation, whose participants often have been repeatedly long-term sick.
Little evidence is found on effects of the rehabilitation on transitions to disability pension and on
health status. It seems that workplace rehabilitation is slightly successful in reducing transfers to
disability pension, even compared to no rehabilitation.
The subgroup analyses on re-employment performance reveal only small differences between
men and women. Concerning previously employed, those who did not receive any rehabilitative
measures were on average better off than had they participated in rehabilitation, suggesting that
even participation in workplace rehabilitation might be harmful in some cases. For the previously
unemployed, however, rehabilitation might be more promising. For the 46-55 year old it is found
that educational rehabilitative measures have strongly damaging effects on re-employment
chances.
Taken together, it appears that of all rehabilitative interventions workplace rehabilitation is most
successful in stimulating re-employment. Unfortunately, no direct comparison of workplace re-
habilitation with no rehabilitation can be made, since the treatment effects between these two
groups are almost always insignificant. Educational rehabilitation fails bluntly in improving la-
bour market chances. Better targeting of rehabilitative measures should be considered. The nu-
merous estimates have shown that average pair-wise effects are often very large (in many cases
above 20% difference in employment ratios), but only occasionally significant. This indicates
substantial heterogeneity among individuals and a coarse subgroup analysis cannot be able to
fully capture all differences. Attempts to estimate treatment effects on the individual level to al-
low better targeting of services to individuals might increase overall performance of the rehabili-
tation programmes.

43
Appendix A: Data
A.1 Variable definition and descriptive statistics
It follows a detailed description of the variables used in the order of occurrence in a sickness
spell. The individual characteristics include information on age, gender, marital status and coun-
try of origin. The level of education and the individual labour market position is categorised into
non-trained workers, trained blue collar workers, white collar workers and self-employed. The
occupational sector has been aggregated to four classes: health care, natural and social sciences,
manufacturing and machinery, agriculture and other services. The current employment status
prior to sickness is coded as employed, participating in educational programs, unemployed, other
or unknown. The sickness benefit qualifying income as a proxy for earned income is recorded, as
well as the resulting income loss due to sickness. The income qualifying sickness benefit is based
on income during 12 months prior to the outbreak of sickness. The sickness benefit receivable at
the event of sickness is equivalent to 80% of a maximum of 7.5 base amount.34 The magnitude of
income losses during a sick-leave period is derived as the difference between sickness qualifying
income and the amount actually received. The past health record is documented by the length of
past sick-leave in the last six months measured in days and by an indicator whether the individual
had participated in vocational rehabilitation during the previous twelve month period. It is also
known, whether the person already received sickness benefit or partial disability pension at the
beginning of the current sickness spell. The latter is a sign that the individual had already been
granted disability pension though has decided later on to re-enter the rehabilitation system. The
former is a likely indication that the individual had received sickness benefit due to reduced par-
tial work capacity for an extended period. A new sickness spell is then the consequence of a
negative change in the degree of work capacity. Furthermore, for each sickness case the geo-
graphic location and time period is reported. The county, community type and local open unem-
ployment are documented. The sampling weight corresponding to the insurance office is also a
proxy for the size of an insurance region or for the healthiness of its residents.
A variety of information is documented about the beginning of the current sickness spell. The
institution of sick-leave registration is known and grouped into health care centre or hospital,
psychiatric or social medicine centre, private or others. The initial degree of sick leave is meas-
34 The base amount for the years 1991-1994 has been 3997, 4092, 3989 and 3995 L�in January 1999 prices.

44
ured as full-time (100%), part time (25%, 50%, 75%) or unknown. Also, presence of drug or al-
cohol abuse and the main health diagnosis is reported: psychiatric, circulation, respiratory, diges-
tion, musculoskeletal diseases, injuries and other diagnosis.
After about four weeks of prolonged sickness often an assessment of the need for rehabilitation is
carried out. It is reported whether this assessment was carried out or whether it was not needed or
not carried out. The organisation that carried out the assessment is recorded, namely the em-
ployer, the insurance office, or the insurance office on behalf of the employer. The recommenda-
tion emanating from the medical assessment could be: wait and see, rehabilitative measures
needed and defined, possible or definite eligibility for disability pension, and diagnosis not satis-
factory. In like manner the results from early non-medical assessment are described. A variable
further indicates whether there were any medical or non-medical reasons (educational, private,
family, social, economic, labour market, etc) that prevented acceptance or completion of reha-
bilitative measures. A variety of logical combinations of the medical and non-medical recom-
mendations have been constructed.
For individuals which participated in rehabilitation the rehabilitative measures received are
documented and have been grouped into NO REHABILITATION, PASSIVE rehabilitation, WORKPLACE
rehabilitation, EDUCATIONAL training, MEDICAL rehabilitation, and SOCIAL rehabilitation (see
Section 4.2). Handling of cases receiving multiple measures is described in the Appendix A.2.
At the end of the sickness case or the reporting period, the outflow destination is recorded for
closed cases, while unclosed cases are right-censored and treated as still sick. The overall sick-
ness spell length is know, though not very meaningful since it comprises the time before, during
and after participation in rehabilitation and an decomposition is not feasible. The recorded out-
flow destinations for closed cases are: return to previous workplace, working at a new workplace,
working at a sheltered workplace, leaves to education, leaves to unemployment, full or partial
sickness benefit, full or partial disability pension, other outcomes. These outflows have been ag-
gregated to the four outcome variables of interest: Re-employment, re-integration into the labour
force, disability pension and prolonged health status (see Section 6.1). The prolonged health
status is a reported binary variable, which is one if during the six month period following the last
day of the sickness spell the individual had not a new sickness spell exceeding 30 days and had
not been transferred to a permanent or temporary full disability pension.

45
In Table A.1 descriptive statistics of all these variables are given. Column 2 contains the variable
means for the original Riks-LS data set of 10309 relevant observations in Western Sweden. As
described in Section 4.3 and in Appendix A.3 a number of observations with missing information
or aged above 55 have been dropped and this selected sample of 6287 observations is represented
in column three. Differences between these two samples are mainly due to the exclusion of older
individuals for which vocational rehabilitation might be less sensible and intertwined with dis-
ability pension issues. Columns four to nine contain the decomposition of the selected sample of
6287 observations into the six treatment groups, which has been the basis of the estimation of the
multinomial probit model for the participation probabilities.
Due to the common support restriction of nonparametric identification, as explained in Section
5.2, the matching algorithm is performed only with those observations that lie in the common
support of participation probabilities of all treatment groups. With respect to the estimated par-
ticipation probabilities (Section 6.1), 4564 observations fulfil this condition. Their descriptive
statistics and its decomposition into the six treatment groups is presented in the columns 10 to 16.
When comparing the selected sample and the observations in the common support, only a few
striking dissimilarities can be found. The average sample weight has been reduced from 7.75 to
7.02 and the fraction living in rural areas has increased, while the urban and major cities re-
trenched. Regarding the rehabilitation assessment, the cases assessed by the insurance office have
increased, while cases for which an assessment did not seem necessary decreased considerably
among the untreated. Also cases with medical or non-medical assessment recommending reha-
bilitation expanded. Overall, these two samples appear similar and consequently the results of the
matching estimator based on these common support observations are expected to hold alike for
the selected sample of 6287 individuals in Western Sweden.

Table A.1: Descriptive statistics of all variables by treatment groups (mean or share in %)
6HOHFWHG�VDPSOH�LQ�:HVWHUQ�6ZHGHQ 2EVHUYDWLRQV�LQ�FRPPRQ�VXSSRUW$OO $OO 1RQH 3DVV :RUN (GXFD 0HGLF 6RFLDO $OO 1RQH 3DVV :RUN (GXFD 0HGLF 6RFLDO
1XPEHU�RI�REVHUYDWLRQV�LQ�JURXS ����� ���� ���� ��� ���� ��� ���� ��� ���� ���� ��� ��� ��� ��� ���3RVLWLRQ�$��%DFNJURXQG�FKDUDFWHULVWLFV��3HUVRQDOLW\�$JH LQ�\HDUV ���� ���� ���� ���� ���� ���� ���� ���� ���� ���� ���� ���� ���� ���� ����$JH� ������\HDUV �� �� �� �� �� �� �� �� �� �� �� �� �� �� ��
������\HDUV �� �� �� �� �� �� �� �� �� �� �� �� �� �� ��������\HDUV �� �� �� �� �� �� �� �� �� �� �� �� �� �� ��������\HDUV �� � � � � � � � � � � � � � �
0DULWDO�VWDWXV� PDUULHG �� �� �� �� �� �� �� �� �� �� �� �� �� �� ��XQPDUULHG �� �� �� �� �� �� �� �� �� �� �� �� �� �� ��ZLGRZ���ZLGRZHU � � � � � � � � � � � � � � �GLYRUFHG �� �� �� �� �� �� �� �� �� �� �� �� �� �� ��
*HQGHU� PDOH �� �� �� �� �� �� �� �� �� �� �� �� �� �� ��&LWL]HQVKLS� 6ZHGLVK�ERUQ �� �� �� �� �� �� �� �� �� �� �� �� �� �� ��
(GXFDWLRQ�DQG�HPSOR\PHQW�/DERXU�PDUNHW EOXH�FROODU��XQVNLOOHG �� �� �� �� �� �� �� �� �� �� �� �� �� �� ��SRVLWLRQ� EOXH�FROODU��VNLOOHG �� �� �� �� �� �� �� �� �� �� �� �� �� �� ��
ZKLWH�FROODU�ZRUNHU �� �� �� �� �� �� �� �� �� �� �� �� �� �� ��VHOI�HPSOR\HG �� �� �� �� � �� �� �� �� �� �� � �� �� ��
2FFXSDWLRQ�LQ� KHDOWK�FDUH �� �� � �� �� �� �� � � � �� �� �� �� �YDULRXV�VFLHQFHV �� �� �� �� �� �� �� �� �� �� �� �� �� �� ��PDQXIDFWXULQJ �� �� �� �� �� �� �� �� �� �� �� �� �� �� ��DJULFXOWXUH���RWKHUV �� �� �� �� �� �� �� �� �� �� �� �� �� �� ��
3ULRU�HPSOR\� HPSOR\HG �� �� �� �� �� �� �� �� �� �� �� �� �� �� ��PHQW�VWDWXV� LQ�HGXFDWLRQ � � � � � � � � � � � � � � �
XQHPSOR\HG �� �� �� �� � �� �� �� �� �� �� � �� �� ��RWKHU���XQNQRZQ � � � � � � � � � � � � � � �
6LFNQHVV�EHQHILW�TXDOLI\LQJ�LQFRPH��L��D ����� ����� ����� ����� ����� ����� ����� ����� ����� ����� ����� ����� ����� ����� �����0D[LPXP�SD\DEOH�VLFNQHVV�EHQHILW��L��E ����� ����� ����� ����� ����� ����� ����� ����� ����� ����� ����� ����� ����� ����� �����,QFRPH�ORVV��L��F ���� ���� ���� ���� ���� ���� ���� ���� ���� ���� ���� ���� ���� ���� ����

47
9DULDEOH�GHILQLWLRQ $OO $OO 1RQH 3DVV :RUN (GXFD 0HGLF 6RFLDO $OO 1RQH 3DVV :RUN (GXFD 0HGLF 6RFLDO3UHYLRXV�KHDOWK�DQG�EHQHILW�UHFRUG�3UHYLRXV�VLFN� �����GD\V �� �� �� �� �� �� �� �� �� �� �� �� �� �� ��QHVV�UHFRUG ������GD\V � � � �� � � �� �� �� �� �� � � �� ���GD\V�VLFN�LQ� ������GD\V �� �� � �� � �� �� � �� � �� � � �� ���ODVW���PRQWKV�� !����GD\V �� �� �� �� �� �� �� �� �� �� �� �� �� �� ��
XQNQRZQ � � � � � � � � � � � � � � �3UHYLRXV�SDUWLFLSDWLRQ�LQ QR �� �� �� �� �� �� �� �� �� �� �� �� �� �� ��9RFDWLRQDO�UHKDELOLWDWLRQ \HV � �� � �� �� �� �� �� �� � �� �� �� �� ���LQ�ODVW����PRQWKV�� XQNQRZQ � � � � � � � � � � � � � � �5HFHLYLQJ�VLFNQHVV�EHQHILW�EHIRUH�VLFNQHVV � � � � � � � � � � � � � � �5HFHLYLQJ�SHQVLRQ�EHQHILW�EHIRUH�VLFNQHVV � � � � � � � � � � � � � � �1RW�UHFHLYLQJ�VLFNQHVV�RU�SHQVLRQ�EHQHILWV �� �� �� �� �� �� �� �� �� �� �� �� �� �� ��
*HRJUDSKLF�ORFDWLRQ�DQG�WLPH�SHULRG�6DPSOLQJ�ZHLJKW�FRUUHVSRQGLQJ�WR�,2 ���� ���� ���� ���� ���� ���� ���� ���� ���� ���� ���� ���� ���� ���� ����/RFDO�RSHQ�XQHPSOR\PHQW�UDWH��LQ��� ���� ���� ���� ���� ���� ���� ���� ���� ���� ���� ���� ���� ���� ���� ����&RXQW\� +DOODQGVOlQ �� �� � � � � �� � � � � � � �� �
%RKXVOlQ �� �� �� �� �� �� �� �� �� �� �� �� �� �� ��bOYVERUJVOlQ �� �� �� �� �� �� � �� �� �� �� �� �� � ��9lUPODQGVOlQ �� �� �� �� �� �� �� �� �� �� �� �� �� �� ��*|WHERUJVNRPPXQ �� �� �� �� � � �� � �� �� �� � � �� �
&RPPXQLW\�W\SH� XUEDQ���VXEXUEDQ�UHJLRQ �� �� �� �� �� �� �� �� �� �� �� �� �� �� ��PDMRU���PLGGOH�ODUJH�FLW\ �� �� �� �� �� �� �� � � � � � � �� �LQGXVWULDO�FLW\ �� �� �� � �� �� �� �� �� �� �� �� �� �� ��UXUDO�DQG�RWKHU �� �� �� �� �� �� �� �� �� �� �� �� �� �� ��
<HDU�RI�VLFNQHVV ������� �� �� �� �� �� �� �� �� �� �� �� �� �� �� ��UHJLVWUDWLRQ� ������� �� �� �� �� �� �� �� �� �� �� �� �� �� �� ��
������� �� �� �� �� �� �� �� �� �� �� �� �� �� �� ��
3RVLWLRQ�%��%HJLQQLQJ�RI�VLFNQHVV�VSHOO��VLFNQHVV�UHJLVWUDWLRQ�,QLWLDO�VLFNQHVV�UHJLVWUDWLRQ�E\�
KHDOWK�FDUH�FHQWUH���KRVSLWDO �� �� �� �� �� �� �� �� �� �� �� �� �� �� ��SV\FKLDWULF���VRFLDO�PHGLFLQH�FHQWUH � � � � � �� � �� � � �� � �� �� ��E\�SULYDWH�RU�RWKHUV �� �� �� �� �� �� �� � �� � �� �� �� � �
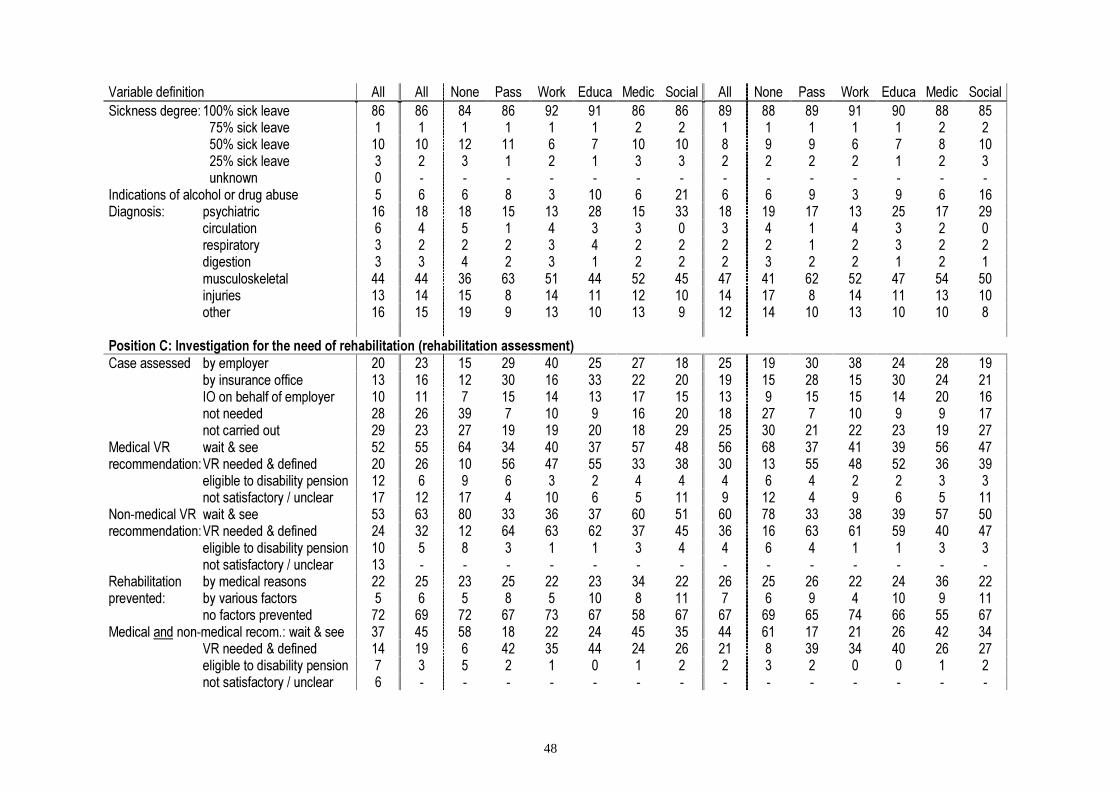
48
9DULDEOH�GHILQLWLRQ $OO $OO 1RQH 3DVV :RUN (GXFD 0HGLF 6RFLDO $OO 1RQH 3DVV :RUN (GXFD 0HGLF 6RFLDO6LFNQHVV�GHJUHH� �����VLFN�OHDYH �� �� �� �� �� �� �� �� �� �� �� �� �� �� ��
������VLFN�OHDYH � � � � � � � � � � � � � � �������VLFN�OHDYH �� �� �� �� � � �� �� � � � � � � ��������VLFN�OHDYH � � � � � � � � � � � � � � ���XQNQRZQ � � � � � � � � � � � � � � �
,QGLFDWLRQV�RI�DOFRKRO�RU�GUXJ�DEXVH � � � � � �� � �� � � � � � � ��'LDJQRVLV� SV\FKLDWULF �� �� �� �� �� �� �� �� �� �� �� �� �� �� ��
FLUFXODWLRQ � � � � � � � � � � � � � � �UHVSLUDWRU\ � � � � � � � � � � � � � � �GLJHVWLRQ � � � � � � � � � � � � � � �PXVFXORVNHOHWDO �� �� �� �� �� �� �� �� �� �� �� �� �� �� ��LQMXULHV �� �� �� � �� �� �� �� �� �� � �� �� �� ��RWKHU �� �� �� � �� �� �� � �� �� �� �� �� �� �
3RVLWLRQ�&��,QYHVWLJDWLRQ�IRU�WKH�QHHG�RI�UHKDELOLWDWLRQ��UHKDELOLWDWLRQ�DVVHVVPHQW�&DVH�DVVHVVHG� E\�HPSOR\HU �� �� �� �� �� �� �� �� �� �� �� �� �� �� ��
E\�LQVXUDQFH�RIILFH �� �� �� �� �� �� �� �� �� �� �� �� �� �� ��,2�RQ�EHKDOI�RI�HPSOR\HU �� �� � �� �� �� �� �� �� � �� �� �� �� ��QRW�QHHGHG �� �� �� � �� � �� �� �� �� � �� � � ��QRW�FDUULHG�RXW �� �� �� �� �� �� �� �� �� �� �� �� �� �� ��
0HGLFDO�95 ZDLW��VHH �� �� �� �� �� �� �� �� �� �� �� �� �� �� ��UHFRPPHQGDWLRQ�95�QHHGHG��GHILQHG �� �� �� �� �� �� �� �� �� �� �� �� �� �� ��
HOLJLEOH�WR�GLVDELOLW\�SHQVLRQ �� � � � � � � � � � � � � � �QRW�VDWLVIDFWRU\���XQFOHDU �� �� �� � �� � � �� � �� � � � � ��
1RQ�PHGLFDO�95 ZDLW��VHH �� �� �� �� �� �� �� �� �� �� �� �� �� �� ��UHFRPPHQGDWLRQ�95�QHHGHG��GHILQHG �� �� �� �� �� �� �� �� �� �� �� �� �� �� ��
HOLJLEOH�WR�GLVDELOLW\�SHQVLRQ �� � � � � � � � � � � � � � �QRW�VDWLVIDFWRU\���XQFOHDU �� � � � � � � � � � � � � � �
5HKDELOLWDWLRQ E\�PHGLFDO�UHDVRQV �� �� �� �� �� �� �� �� �� �� �� �� �� �� ��SUHYHQWHG� E\�YDULRXV�IDFWRUV � � � � � �� � �� � � � � �� � ��
QR�IDFWRUV�SUHYHQWHG �� �� �� �� �� �� �� �� �� �� �� �� �� �� ��0HGLFDO�DQG�QRQ�PHGLFDO�UHFRP���ZDLW��VHH �� �� �� �� �� �� �� �� �� �� �� �� �� �� ��
95�QHHGHG��GHILQHG �� �� � �� �� �� �� �� �� � �� �� �� �� ��HOLJLEOH�WR�GLVDELOLW\�SHQVLRQ � � � � � � � � � � � � � � �QRW�VDWLVIDFWRU\���XQFOHDU � � � � � � � � � � � � � � �
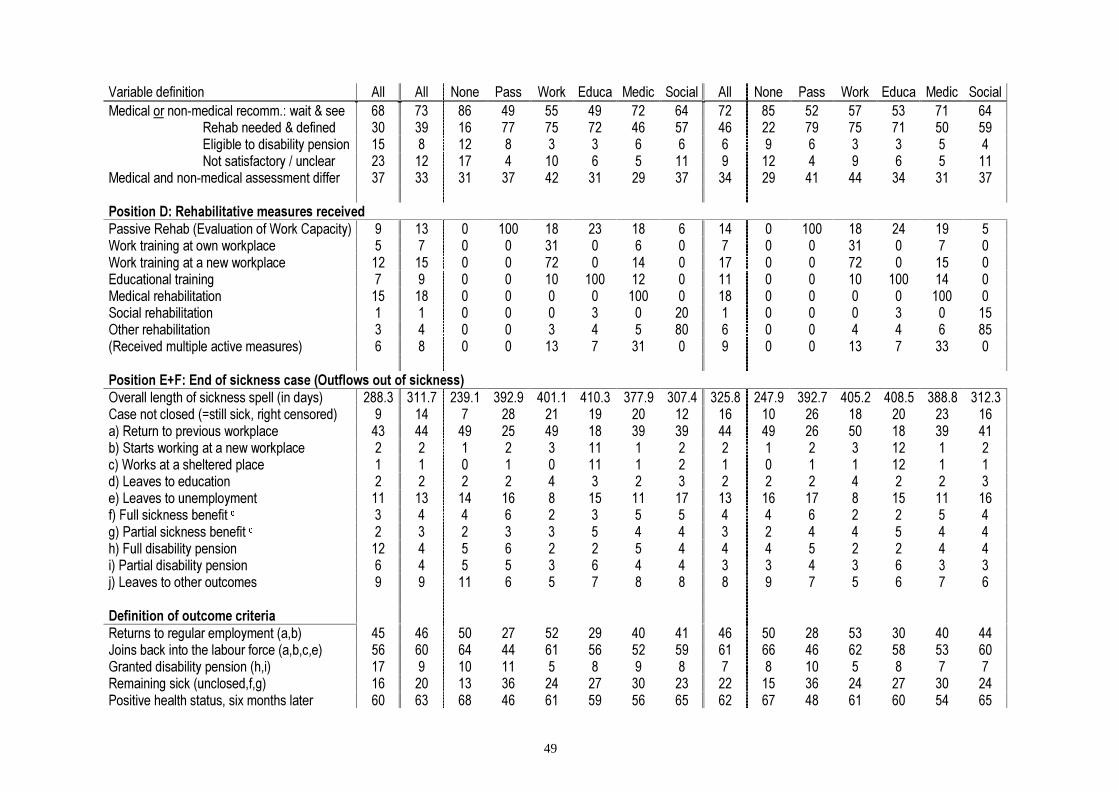
49
9DULDEOH�GHILQLWLRQ $OO $OO 1RQH 3DVV :RUN (GXFD 0HGLF 6RFLDO $OO 1RQH 3DVV :RUN (GXFD 0HGLF 6RFLDO0HGLFDO�RU�QRQ�PHGLFDO�UHFRPP���ZDLW��VHH �� �� �� �� �� �� �� �� �� �� �� �� �� �� ��
5HKDE�QHHGHG��GHILQHG �� �� �� �� �� �� �� �� �� �� �� �� �� �� ��(OLJLEOH�WR�GLVDELOLW\�SHQVLRQ �� � �� � � � � � � � � � � � �1RW�VDWLVIDFWRU\���XQFOHDU �� �� �� � �� � � �� � �� � � � � ��
0HGLFDO�DQG�QRQ�PHGLFDO�DVVHVVPHQW�GLIIHU �� �� �� �� �� �� �� �� �� �� �� �� �� �� ��
3RVLWLRQ�'��5HKDELOLWDWLYH�PHDVXUHV�UHFHLYHG3DVVLYH�5HKDE��(YDOXDWLRQ�RI�:RUN�&DSDFLW\� � �� � ��� �� �� �� � �� � ��� �� �� �� �:RUN�WUDLQLQJ�DW�RZQ�ZRUNSODFH � � � � �� � � � � � � �� � � �:RUN�WUDLQLQJ�DW�D�QHZ�ZRUNSODFH �� �� � � �� � �� � �� � � �� � �� �(GXFDWLRQDO�WUDLQLQJ � � � � �� ��� �� � �� � � �� ��� �� �0HGLFDO�UHKDELOLWDWLRQ �� �� � � � � ��� � �� � � � � ��� �6RFLDO�UHKDELOLWDWLRQ � � � � � � � �� � � � � � � ��2WKHU�UHKDELOLWDWLRQ � � � � � � � �� � � � � � � ���5HFHLYHG�PXOWLSOH�DFWLYH�PHDVXUHV� � � � � �� � �� � � � � �� � �� �
3RVLWLRQ�(�)��(QG�RI�VLFNQHVV�FDVH��2XWIORZV�RXW�RI�VLFNQHVV�2YHUDOO�OHQJWK�RI�VLFNQHVV�VSHOO��LQ�GD\V� ����� ����� ����� ����� ����� ����� ����� ����� ����� ����� ����� ����� ����� ����� �����&DVH�QRW�FORVHG�� VWLOO�VLFN��ULJKW�FHQVRUHG� � �� � �� �� �� �� �� �� �� �� �� �� �� ��D��5HWXUQ�WR�SUHYLRXV�ZRUNSODFH �� �� �� �� �� �� �� �� �� �� �� �� �� �� ��E��6WDUWV�ZRUNLQJ�DW�D�QHZ�ZRUNSODFH � � � � � �� � � � � � � �� � �F��:RUNV�DW�D�VKHOWHUHG�SODFH � � � � � �� � � � � � � �� � �G��/HDYHV�WR�HGXFDWLRQ � � � � � � � � � � � � � � �H��/HDYHV�WR�XQHPSOR\PHQW �� �� �� �� � �� �� �� �� �� �� � �� �� ��I��)XOO�VLFNQHVV�EHQHILW�G � � � � � � � � � � � � � � �J��3DUWLDO�VLFNQHVV�EHQHILW�G � � � � � � � � � � � � � � �K��)XOO�GLVDELOLW\�SHQVLRQ �� � � � � � � � � � � � � � �L��3DUWLDO�GLVDELOLW\�SHQVLRQ � � � � � � � � � � � � � � �M��/HDYHV�WR�RWKHU�RXWFRPHV � � �� � � � � � � � � � � � �
'HILQLWLRQ�RI�RXWFRPH�FULWHULD5HWXUQV�WR�UHJXODU�HPSOR\PHQW��D�E� �� �� �� �� �� �� �� �� �� �� �� �� �� �� ��-RLQV�EDFN�LQWR�WKH�ODERXU�IRUFH��D�E�F�H� �� �� �� �� �� �� �� �� �� �� �� �� �� �� ��*UDQWHG�GLVDELOLW\�SHQVLRQ��K�L� �� � �� �� � � � � � � �� � � � �5HPDLQLQJ�VLFN��XQFORVHG�I�J� �� �� �� �� �� �� �� �� �� �� �� �� �� �� ��3RVLWLYH�KHDOWK�VWDWXV��VL[�PRQWKV�ODWHU �� �� �� �� �� �� �� �� �� �� �� �� �� �� ��

Note: All monetary figures in January 1999 L, average CPI-deflator for 1991-1994=(227.2*0.5+232.3+243.2+248.5*0.5)/3 = 237.8.a Sickness based pay in L, as proxy for income.b Maximum payable sickness benefit is equivalent to 80% of a maximum of 7.5 base amount.c Income loss is defined as the difference between qualifying income level and receivable amounts of benefitat the event of sickness.d These individuals are no longer sick (sickness case has been closed), but are granted continuous sicknessbenefit. This allows them income generating part-time work, averting them from turning to social security,on reduced salary levels.e Prolonged Health status: Defined as one if during the six months following the last day of the sicknessspell the individual had not a new sickness spell exceeding 30 days and had not been transferred to a perma-nent or temporary full disability pension.
A.2 Handling of cases with multiple treatments
There have been 536 cases that received more than one active measure. Since no reliable infor-
mation is available to find out, whether these multiple measures were delivered at the same time
or sequentially, nor to decide which of these measures has been the principal or the first, we as-
sign them to the groups three, four and five in the following way. These assignments correspond
to our prior beliefs about, which is likely to be the first or principal of the rehabilitative measures
received.35
Individuals receiving medical measures are assigned to the group medical rehabilitation (=339
cases), since medical rehabilitation is of foremost urgency before any serious vocational reha-
bilitation could start. Cases with multiple measures not receiving medical rehabilitation but
workplace rehabilitation are allocated to the group workplace rehabilitation (=171 cases), since
workplace rehabilitation is usually full-time while training or social rehabilitative measures oper-
ate alongside. Lastly, individuals not subject to medical rehabilitation or workplace rehabilitation
but to educational rehabilitation are allocated to the educational rehabilitation group (=26 cases).
A closer look at the medical diagnosis indicates that these cases with multiple treatments often
suffer from severe illnesses caused by multiple factors. Furthermore they show a longer overall
sickness-spell length, giving support to the conjecture that to a substantial extent these multiple
treatments were given sequentially. Deleting these individuals from the data set would bias the
treatment effects upwards, since these difficult cases would not be included any longer. Thus,
since the objectives of this evaluation study are treatment effects for the whole working popula-
tion of age below 55 and not for a population consisting only of individuals easy to rehabilitate,
these cases with multiple treatments must not be dropped from the sample.

51
A.3 Selection of sample
As mentioned previously we base our evaluation study on the 5 insurance offices of Hallandslän,
Bohuslän, Älvsborgslän, Värmlandslän and Göteborgskommun in Western Sweden. Since we
want to address the effects of rehabilitative measures on the individuals who receive rehabilita-
tion as a means to restore their work capacity and to re-enter into the labour market, we drop a
number of the 10309 cases contained in the original data set. We exclude cases with missing data
on the key outcome variables, aged above 55, or receiving partial or non-full time disability pen-
sion benefit already prior to the sickness spell. We furthermore delete those individuals being in
education or with unclear occupation and cases for which either sickness degree, previous health
record or previous participation in vocational rehabilitation are unknown. Finally we drop those
cases where no vocational rehabilitation investigation has been carried out or where both medical
and IO assessment decided that no vocational rehabilitation is needed. Thus, 6287 observations
are retained, with 3200 cases not participating in any rehabilitative measure and 3087 cases re-
ceiving any form of rehabilitation.
Table A.2: Selection of the sample
&DVHV�GHOHWHG ��&DVHVGHOHWHG
��&DVHV�UH�PDLQLQJ
&RPSOHWH�VDPSOH �����GHOHWH��DJH�!��� ���� ����GHOHWH��FDVHV�UHFHLYLQJ�SHQVLRQ�EHQHILW�EHIRUH�VLFNQHVV ��� ����GHOHWH��FDVHV�ZKHUH�HPSOR\PHQW�VWDWXV�LV�HGXFDWLRQ ��� ����GHOHWH��FDVHV�ZKHUH�HPSOR\PHQW�VWDWXV�LV�XQFOHDU ��� ����GHOHWH��FDVHV�ZKHUH�SUHYLRXV�VLFNQHVV�KLVWRU\�LV�XQNQRZQ ��� ����GHOHWH��FDVHV�ZKHUH�SUHYLRXV�SDUWLFLSDWLRQ�LQ�95�LV�XQNQRZQ ��� ����GHOHWH��FDVHV�ZKHUH�WKH�VLFNQHVV�GHJUHH�LV�XQNQRZQ � ����GHOHWH��FDVHV�ZKHUH�QRQ�PHGLFDO�UHFRPPHQGDWLRQ�XQFOHDU��QRW�VDWLVIDFWRU\ ��� ����
35 These beliefs have been informally confirmed by Mr. Sten Olsson at the Swedish National Insurance Board
(Riksförsäkringsverket), Stockholm.

52
A.4 Estimation of global common support
As described in Section 5.3 the global common support is limited by the minima of the maxima
and the maxima of the minima of the estimated participation probabilities, which are listed in the
Table A.4. For instance, among the individuals, which did participate in workplace rehabilitation,
the maximum of the estimated probabilities to participate in NO REHABILITATION was 96%, while
the minimum was 1%. The minimum of the maxima of the estimated participation probabilities
for NO REHABILITATION among the six treatment groups was 91% and the maximum of the min-
ima was 3%. All observations with estimated participation probability for NO REHABILITATION
above 91% or below 3% were deleted.
Accordingly only observations with estimated participation probabilities 1ˆ {0.03,..,0.91}P ∈ and
2ˆ {0,..,0.26}P ∈ and 3ˆ {0,..,0.68}P ∈ and 4ˆ {0.01,..,0.28}P ∈ and 5ˆ {0,..,0.81}P ∈ and
6ˆ {0,..,0.32}P ∈ were retained and used for the matching estimator, which were 4564 out of the
6287 selected cases. The descriptive statistics of the remaining ‘common support’ sample are
given in columns 10-16 of Table A.1.
Table A.4: Margins of the common support
1ˆ ( )P X 2ˆ ( )P X 3ˆ ( )P X 4ˆ ( )P X 5ˆ ( )P X 6ˆ ( )P X
0D[LPXP1RQH ��� �� �� �� �� ��3DVVLYH ��� �� �� �� �� ��:RUNSODFH ��� �� �� �� �� ��(GXFDWLRQ ��� �� �� �� �� ��0HGLFDO ��� �� �� �� �� ��6RFLDO ��� �� �� �� �� ��0LQLPXP�RI�0D[LPD ��� �� �� �� �� ��
0LQLPXP1RQH �� � � � � �3DVVLYH �� � � � � �:RUNSODFH �� � � � � �(GXFDWLRQ �� � � � � �0HGLFDO �� � � � � �6RFLDO �� � � � � �0D[LPXP�RI�0LQLPD �� � � � � �1RWH��(VWLPDWHG�3UREDELOLWLHV�LQ���
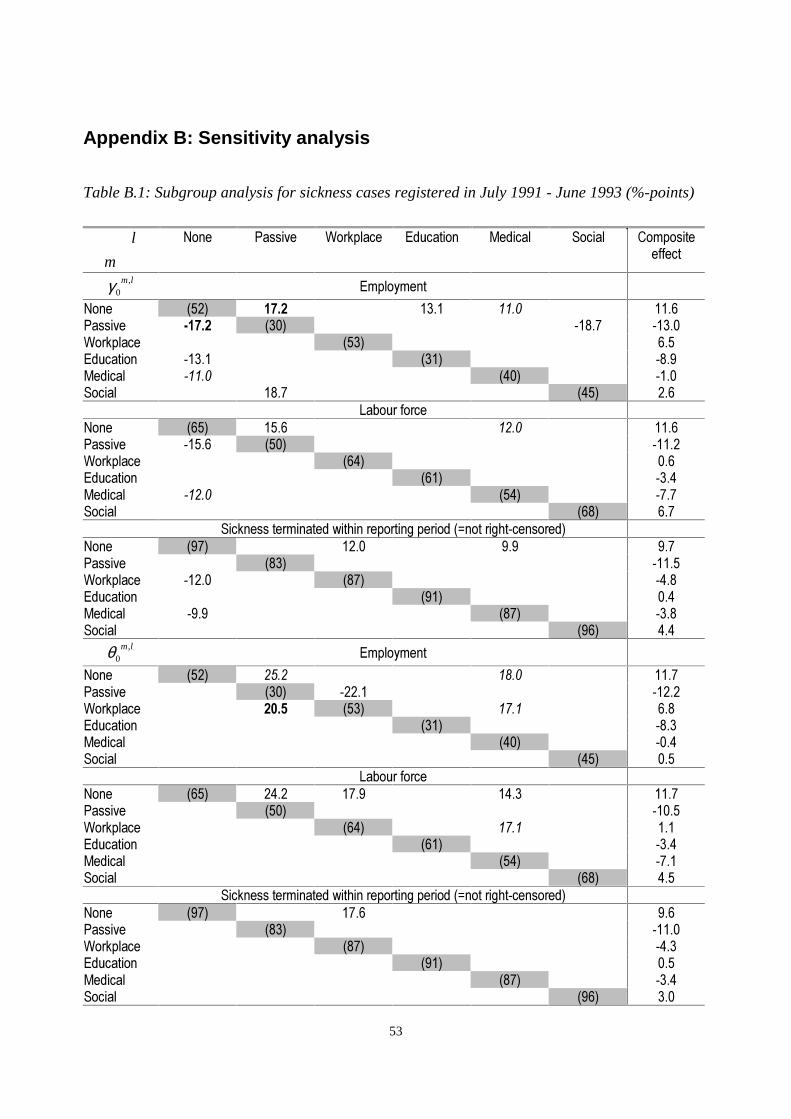
53
Appendix B: Sensitivity analysis
Table B.1: Subgroup analysis for sickness cases registered in July 1991 - June 1993 (%-points)
l
m
1RQH 3DVVLYH :RUNSODFH (GXFDWLRQ 0HGLFDO 6RFLDO &RPSRVLWHHIIHFW
,0
m lγ (PSOR\PHQW
1RQH ���� ���� ���� ���� ����3DVVLYH ����� ���� ����� �����:RUNSODFH ���� ���(GXFDWLRQ ����� ���� ����0HGLFDO ����� ���� ����6RFLDO ���� ���� ���
/DERXU�IRUFH1RQH ���� ���� ���� ����3DVVLYH ����� ���� �����:RUNSODFH ���� ���(GXFDWLRQ ���� ����0HGLFDO ����� ���� ����6RFLDO ���� ���
6LFNQHVV�WHUPLQDWHG�ZLWKLQ�UHSRUWLQJ�SHULRG�� QRW�ULJKW�FHQVRUHG�1RQH ���� ���� ��� ���3DVVLYH ���� �����:RUNSODFH ����� ���� ����(GXFDWLRQ ���� ���0HGLFDO ���� ���� ����6RFLDO ���� ���
,0
m lθ (PSOR\PHQW
1RQH ���� ���� ���� ����3DVVLYH ���� ����� �����:RUNSODFH ���� ���� ���� ���(GXFDWLRQ ���� ����0HGLFDO ���� ����6RFLDO ���� ���
/DERXU�IRUFH1RQH ���� ���� ���� ���� ����3DVVLYH ���� �����:RUNSODFH ���� ���� ���(GXFDWLRQ ���� ����0HGLFDO ���� ����6RFLDO ���� ���
6LFNQHVV�WHUPLQDWHG�ZLWKLQ�UHSRUWLQJ�SHULRG�� QRW�ULJKW�FHQVRUHG�1RQH ���� ���� ���3DVVLYH ���� �����:RUNSODFH ���� ����(GXFDWLRQ ���� ���0HGLFDO ���� ����6RFLDO ���� ���
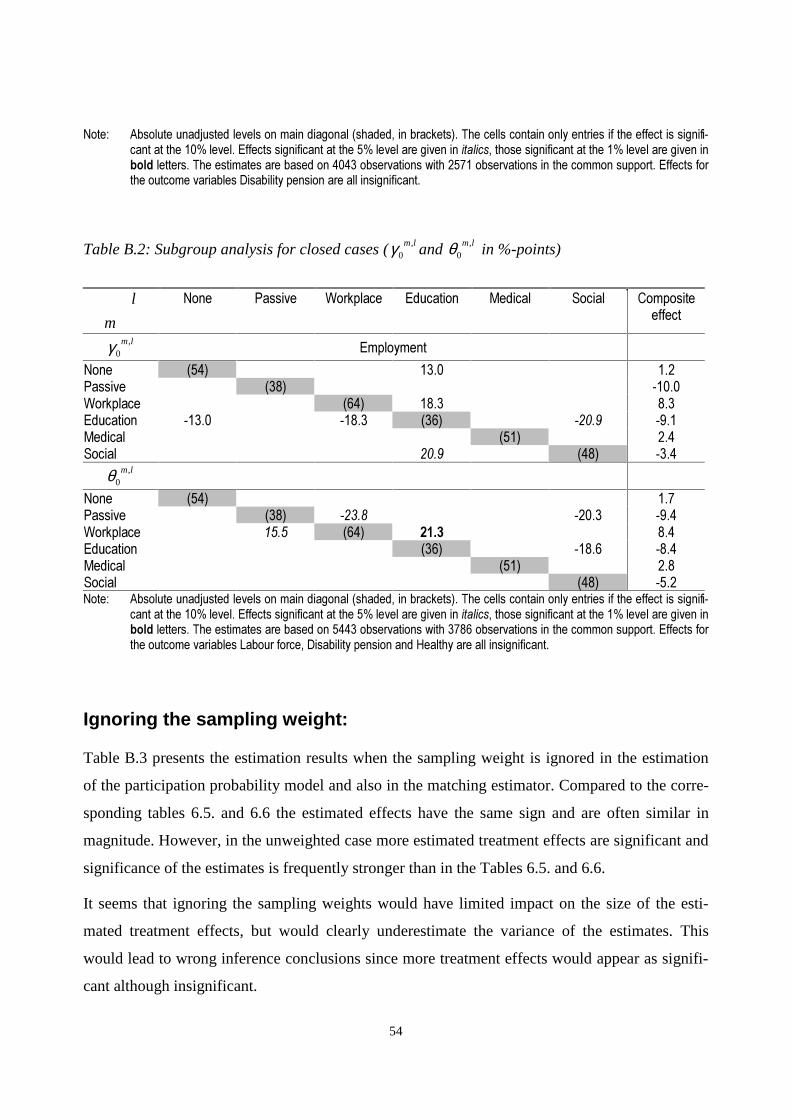
54
1RWH�� $EVROXWH�XQDGMXVWHG�OHYHOV�RQ�PDLQ�GLDJRQDO��VKDGHG��LQ�EUDFNHWV���7KH�FHOOV�FRQWDLQ�RQO\�HQWULHV�LI�WKH�HIIHFW�LV�VLJQLIL�FDQW�DW�WKH�����OHYHO��(IIHFWV�VLJQLILFDQW�DW�WKH����OHYHO�DUH�JLYHQ�LQ�LWDOLFV��WKRVH�VLJQLILFDQW�DW�WKH����OHYHO�DUH�JLYHQ�LQEROG�OHWWHUV��7KH�HVWLPDWHV�DUH�EDVHG�RQ������REVHUYDWLRQV�ZLWK������REVHUYDWLRQV�LQ�WKH�FRPPRQ�VXSSRUW��(IIHFWV�IRUWKH�RXWFRPH�YDULDEOHV�'LVDELOLW\�SHQVLRQ�DUH�DOO�LQVLJQLILFDQW�
Table B.2: Subgroup analysis for closed cases ( ,0
m lγ and ,0
m lθ in %-points)
l
m
1RQH 3DVVLYH :RUNSODFH (GXFDWLRQ 0HGLFDO 6RFLDO &RPSRVLWHHIIHFW
,0
m lγ (PSOR\PHQW
1RQH ���� ���� ���3DVVLYH ���� �����:RUNSODFH ���� ���� ���(GXFDWLRQ ����� ����� ���� ����� ����0HGLFDO ���� ���6RFLDO ���� ���� ����
,0
m lθ1RQH ���� ���3DVVLYH ���� ����� ����� ����:RUNSODFH ���� ���� ���� ���(GXFDWLRQ ���� ����� ����0HGLFDO ���� ���6RFLDO ���� ����1RWH�� $EVROXWH�XQDGMXVWHG�OHYHOV�RQ�PDLQ�GLDJRQDO��VKDGHG��LQ�EUDFNHWV���7KH�FHOOV�FRQWDLQ�RQO\�HQWULHV�LI�WKH�HIIHFW�LV�VLJQLIL�
FDQW�DW�WKH�����OHYHO��(IIHFWV�VLJQLILFDQW�DW�WKH����OHYHO�DUH�JLYHQ�LQ�LWDOLFV��WKRVH�VLJQLILFDQW�DW�WKH����OHYHO�DUH�JLYHQ�LQEROG�OHWWHUV��7KH�HVWLPDWHV�DUH�EDVHG�RQ������REVHUYDWLRQV�ZLWK������REVHUYDWLRQV�LQ�WKH�FRPPRQ�VXSSRUW��(IIHFWV�IRUWKH�RXWFRPH�YDULDEOHV�/DERXU�IRUFH��'LVDELOLW\�SHQVLRQ�DQG�+HDOWK\�DUH�DOO�LQVLJQLILFDQW�
Ignoring the sampling weight:
Table B.3 presents the estimation results when the sampling weight is ignored in the estimation
of the participation probability model and also in the matching estimator. Compared to the corre-
sponding tables 6.5. and 6.6 the estimated effects have the same sign and are often similar in
magnitude. However, in the unweighted case more estimated treatment effects are significant and
significance of the estimates is frequently stronger than in the Tables 6.5. and 6.6.
It seems that ignoring the sampling weights would have limited impact on the size of the esti-
mated treatment effects, but would clearly underestimate the variance of the estimates. This
would lead to wrong inference conclusions since more treatment effects would appear as signifi-
cant although insignificant.
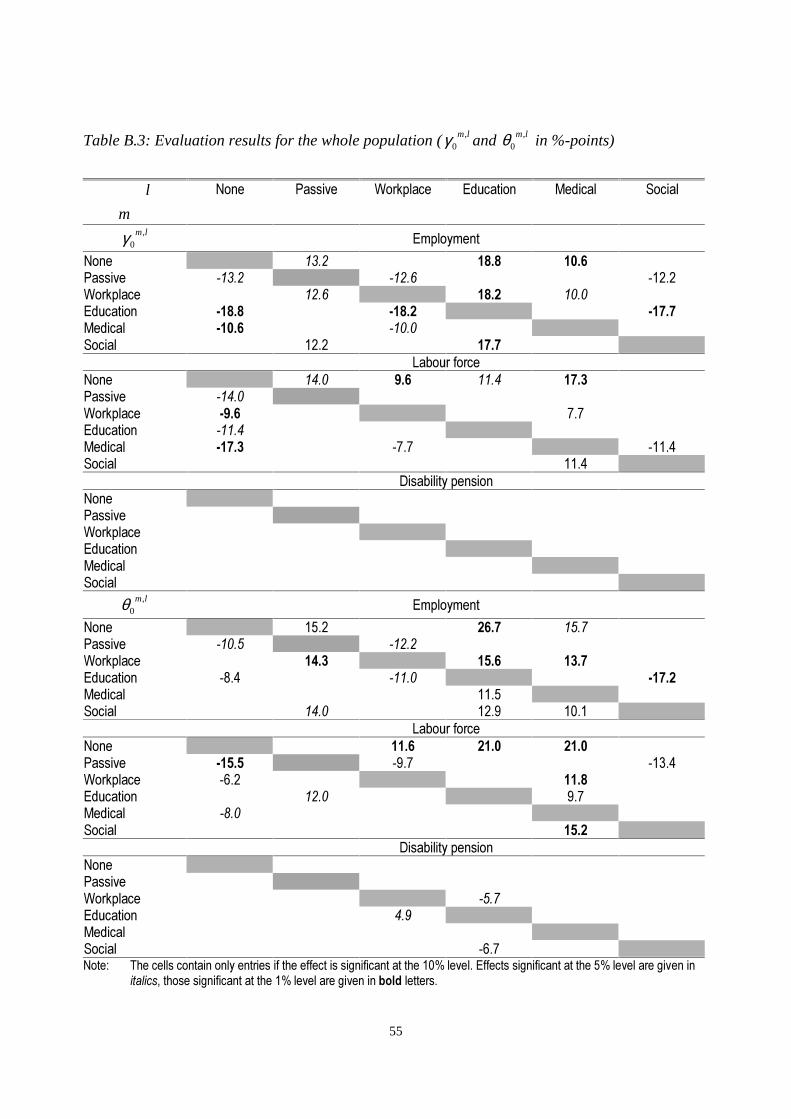
55
Table B.3: Evaluation results for the whole population ( ,0
m lγ and ,0
m lθ in %-points)
l
m
1RQH 3DVVLYH :RUNSODFH (GXFDWLRQ 0HGLFDO 6RFLDO
,0
m lγ (PSOR\PHQW
1RQH ���� ���� ����3DVVLYH ����� ����� �����:RUNSODFH ���� ���� ����(GXFDWLRQ ����� ����� �����0HGLFDO ����� �����6RFLDO ���� ����
/DERXU�IRUFH1RQH ���� ��� ���� ����3DVVLYH �����:RUNSODFH ���� ���(GXFDWLRQ �����0HGLFDO ����� ���� �����6RFLDO ����
'LVDELOLW\�SHQVLRQ1RQH3DVVLYH:RUNSODFH(GXFDWLRQ0HGLFDO6RFLDO
,0
m lθ (PSOR\PHQW
1RQH ���� ���� ����3DVVLYH ����� �����:RUNSODFH ���� ���� ����(GXFDWLRQ ���� ����� �����0HGLFDO ����6RFLDO ���� ���� ����
/DERXU�IRUFH1RQH ���� ���� ����3DVVLYH ����� ���� �����:RUNSODFH ���� ����(GXFDWLRQ ���� ���0HGLFDO ����6RFLDO ����
'LVDELOLW\�SHQVLRQ1RQH3DVVLYH:RUNSODFH ����(GXFDWLRQ ���0HGLFDO6RFLDO ����1RWH�� 7KH�FHOOV�FRQWDLQ�RQO\�HQWULHV�LI�WKH�HIIHFW�LV�VLJQLILFDQW�DW�WKH�����OHYHO��(IIHFWV�VLJQLILFDQW�DW�WKH����OHYHO�DUH�JLYHQ�LQ
LWDOLFV��WKRVH�VLJQLILFDQW�DW�WKH����OHYHO�DUH�JLYHQ�LQ�EROG�OHWWHUV�

56
Appendix C: Facts about Swedish Social Insurance System
Table C.1: Some indicators for the Swedish social insurance system
<HDU 85D ,1-85<E 727$/F 6,&.%G 5(+$%H ',6�3I �&$6+J 6+257K /21*L &/26('M
���� ��� ������ ������ ����� � ������ ��� ����� ������ ������������ ��� ������ ������ ����� �� ������ �� ����� ������ ������������ ��� ������ ������ ����� ��� ������ �������� ����� ������ ����������� ��� ������ ������ ����� ���� ������ ����� ����� ������ ����������� ��� ������ ������ ����� ���� ������ ������� ����� ������ ����������� ��� ������ ������ ����� ���� ������ ������� ����� ������ ���������� ��� ������ ������ ����� ���� ������ ������� ����� ������ ���������� ��� ������ ������ ����� ���� ������ �������� ����� ����� ���������� ��� ������ ������ ����� ���� ������ �������� ���� ������ ���������� ��� ������ ������ ����� ���� ������ �������� ����� ����� ������
<HDU %$6(N .3,O ,1685(P 6,&.15Q '$<6R &203S 5�3$<T 3(5621U 6(59,&(V
���� ����� ����� ������� ������� ��������� ���� � � ����� ����� ����� ������� ������� ��������� ���� � � ����� ����� ����� ������� ������� ��������� ���� � ������ ���������� ����� ����� ������� ������� �������� ���� ����� ������ ���������� ����� ����� ������� ������� �������� ���� ����� ������ ���������� ����� ����� ������� ������� �������� ���� ����� ������ ���������� ����� ����� ������� ������� �������� ���� ����� ������ ���������� ����� ����� ������� ������� �������� ���� ����� ������ ���������� ����� ����� ������� ������� �������� ���� ����� ������ ���������� ����� ����� ������� ������� �������� ���� ����� ������ ������1RWH� D��3HUFHQW�RSHQ�XQHPSOR\PHQW�±�VRXUFH��$P����60������DQG�������E��1XPEHU�RI�RFFXSDWLRQDO�LQMXULHV��F��7RWDO�FRVW�RI
VRFLDO�LQVXUDQFH�V\VWHP�LQ�06(.��G��6LFNQHVV�FDVK�EHQHILW�SD\PHQW��H��5HKDELOLWDWLRQ�DOORZDQFH�SD\PHQW��I��7RWDO�QXP�EHU�RI�FDVHV�ZLWK�GLVDELOLW\�SHQVLRQ��J��&DVK�EHQHILW�DV���RI�TXDOLI\LQJ�LQFRPH������������PHDQV�SUHVHQFH�RI�RQH�XQSDLGZDLWLQJ�GD\�DQG�GLIIHUHQW�OHYHO�RI�VLFNQHVV�FDVK�EHQHILW��K��6KRUW�WHUP��OHVV�WKDQ����GD\V��RQJRLQJ�VLFNQHVV�FDVHV�LQ�'H�FHPEHU��L��/RQJ�WHUP��ORQJHU�WKDQ����GD\V��RQJRLQJ�VLFNQHVV�FDVHV�LQ�'HFHPEHU��M��&ORVHG�FDVHV�RI�VLFNQHVV�LQ�'H�FHPEHU��N��%DVH�DPRXQW��O��.3,������ �����±�VRXUFH��6&%�\HDUO\�VWDWLVWLFV��P��1XPEHU�RI�LQVXUHG��������Q��1XPEHU�RIVLFNQHVV�LQVXUHG��������R��1XPEHU�RI�VLFN�GD\V��S��$YHUDJH�VLFN�UDWH�GD\V��T��1XPEHU�RI�SHUVRQV�ZLWK�UHKDELOLWDWLRQ�DO�ORZDQFH��U��1XPEHU�RI�SHUVRQV�UHFHLYLQJ�SXUFKDVHG�UHKDELOLWDWLRQ�VHUYLFHV��V��1XPEHU�RI�VHUYLFHV�SXUFKDVHG�6RXUFHV��6RFLDO�,QVXUDQFH�6WDWLVWLFV�)DFWV�DQG�6RFLDO�,QVXUDQFH�LQ�6ZHGHQ�$QQXDO�5HSRUW��YDULRXV�LVVXHV�KWWS���ZZZ�UIY�VH�VWDWLVWLFV���DOO�PRQHWDU\�ILJXUHV�LQ�6(.�
The economic crisis of 1991 caused major changes in the level of unemployment. The rate of
open unemployment (column a) increased from about 2% to more than 8% and similar increases
were observed in the number of persons engaged in various labour markets training programs, at
most 6% of the labour force. Some studies find positive association between the unemployment
and the probability of long-term sickness at individual level. The figures in Table 2.1 are however
aggregates and doesn’t show such relationship.
57
The aggregate level of short- (h) and long-term (i) sickness and the number of cases closed (j), all
measured in December, declined over time. The same pattern is observed when looking at the
total number of sickness days that led to benefit payments at the end of the year (o) and the aver-
age sick rate per insured person (p). The later represents the annual number of benefit days (full
or partial) per insured person in relation to the number of persons insured for sickness benefit (n)
at the end of the year. Sick pay to employees from the employer is not included.
The reductions are to some extent due to the transfer of responsibility for sickness benefit pay-
ment from the insurance office to the employers during the first 14 days of a sickness spell and
increases in the level of unemployment as well as the risk of losing jobs. Among other factors
reducing the frequency and length of sickness spells are declining number of occupational inju-
ries because of improved work safety, reduced sickness benefit and increased number of pre-
retirement (f) over time. The total real cost of insurance system has been reduced by 8.1% during
the period of 1989 to 1998. The number of rehabilitation cases, number of persons receiving re-
habilitation allowance (q) and number of services purchased (s) increased following the intro-
duction of the rehabilitation reform in 1991. However, the rehabilitation activities have reduced
in magnitude after 1995.
Registered at the social insurance offices are all insured persons (m) domiciled in Sweden who
have passed their 16th birthday. Sickness allowance insurance (n) is held by all registered insured
persons whose annual earned income is a minimum of 24% of the base amount. The income
qualifying for sickness benefit is thus in the interval SEK 8800-273 000 in 1998. Before 1998 the
minimum amount was SEK 6 000.
References
Aakvik, A., J.J. Heckman and E.J. Vytlacil (1999), “Training Effects on Employment when the Training Effects areHeterogeneous: An application to Norwegian Vocational Rehabilitation Programs”, unpublished working paper,presented at the ZEW Research Conference, Mannheim, June 25-26, 1999.
Aakvik, A. and A.E. Risa (1996), “Success through Selection in Norwegian Vocational Rehabilitation Programs?”,unpublished working paper, Department of Economics, University of Bergen, Norway.
Angrist, J.D. (1988), “Estimating Labour Market Impact of Voluntary Military Service using Social Security Data”,Econometrica, 66, 249-288.
Angrist, J.D. and A.B. Krueger (1999), “Empirical Strategies in Labour Economics”, O. Ashenfelter and D. Card(eds.): The Handbook of Labour Economics, Volume III.
Bergendorff, S., U. Lidwall, D. Ljungberg and S. Marklund (1997), “Sickness Absenteeism and Vocational Reha-bilitation in Sweden – A Summary”, in: Steffan Marklund (ed.): Risk-, friskfaktorer – sjukskrivning och reha-bilitering i Sverige, RFV Redovisar, 6, 157-166.

58
Börsch-Supan, A. and V.A Hajivassiliou (1993): “Smooth Unbiased Multivariate Probabilities Simulators for Maxi-mum Likelihood Estimation of Limited Dependent Variable Models”, Journal of Econometrics, 58, 347-368.
Gerfin, M. and M. Lechner (2000), “Microeconometric Evaluation of the Active Labour Market Policy in Switzer-land”, Discussion Paper 2000-10, Department of Economics, University of St. Gallen.
Heckman, J.J, H. Ichimura, and P. Todd (1997), “Matching as an Econometric Evaluation Estimator: Evidence froma Job Training Programme”, Review of Economic Studies, 64, 605-654.
Heckman, J.J., R.J. LaLonde and J.A. Smith (1999), “The Economics and Econometrics of Active Labour MarketPrograms”, in O. Ashenfelter and D. Card (eds.): The Handbook of Labour Economics, Volume III.
Heshmati, A. and L.G. Engström (1999), “Estimating the Effects of Vocational Rehabilitation Programs in Sweden”,SSE/EFI Working Paper Series in Economics and Finance, 293, Stockholm School of Economics.
Holland, P.W. (1986), “Statistics and Causal Inference”, Journal of American Statistical Association, 81, 945-970,with discussion.
Imbens, G.W. (1999), “The Role of Propensity Score in Estimating Dose-Response Functions”, Technical WorkingPapers, NBER, 237, forthcoming in Biometrika.
Lechner, M. (1999), “Identification and Estimation of Causal Effects of Multiple Treatments under the ConditionalIndependence Assumption”, Discussion Paper 9908, Department of Economics, University of St. Gallen.
Lechner, M. (2000), “Programme Heterogeneity and Propensity Score Matching: An Application to the Evaluationof Active Labour Market Policies”, Discussion Paper 2000-01, Department of Economics, University of St.Gallen.
Manski, C.F. and S. Lerman (1977), “The Estimation of Choice Probabilities from Choice-Based Samples”Econometrica, 45, 1977-1988.
Marklund, S. (1995), “Vilka långtidssjuka blir rehabiliterade?”, in: Marklund S. (ed.) Rehabilitering i ett samhäll-sperspektiv, Lund, Studentlitteratur.
Menckel, E. and A. Strömberg (1996), “The Rehabilitation Work of Occupational Health Physicians in Sweden: ASurvey of 530 Occupational Health Units”, in: J. Behrens and P. Westerholm (eds.), Occupational Health Policy,Practice and Evaluation, 181-192, WHO Regional Office for Europe.
Redovisar (1995), “RIKS-LS – en undersökning om långvarig sjukskrivning och rehabilitering”, Riksförsäkringsver-ket, Redovisar 1995:20.
Redovisar (1996), “Långvarig sjukskrivna – arbetslöshet och sammansatta riskfaktorer”, Riksförsäkringsverket, Re-dovisar 1996:14.
RFV (1992-95), “Social Insurance in Sweden 1991/92”, 92/93, 93/94 and “Social Insurance Statistics, Facts 1991”,1992, 1993, 1994, Riksförsäkringsverket, www.rfv.se.
RFV (1999a), “Annual Review of Budget Year 1998”, Social Insurance Statistics 1989-1999, Riksförsäkringsverket.
RFV (1999b), “Social Insurance in Sweden 1999”, Annual Report 1990/91-1998/99, Riksförsäkringsverket.
Roy, A.D. (1951), “Some Thoughts on the Distribution of Earnings”, Oxford Economic Papers, 3, 135-146.
Rubin, D.B. (1974), “Estimating Causal Effects of Treatments in Randomized and Nonrandomized Studies”, Journalof Educational Psychology, 66, 688-701.
Selander, Jb., S-U. Marnetoft, A. Bergroth and J. Ekholm (1997), “Arbetslivsinriktad rehabilitering – en jämförandestudie av anställdas och arbetslösas arbetslivslivsinriktade rehabilitering”, Centrum för Socialförsäkringsfor-skning (CSF), Mitthögskolan i Östersund, Rapport 1997:2.
SOU (1988), “Tidig och samordnad rehabilitering”, SOU, 41.
Westerholm, P. (1993), “Factors Determining Return to Work”, in: C.R.W. Gill and C. Trew (eds.), Proceedings ofthe 17th International Congress of Life Assurance Medicine, 113-122, Royal Society of Medicine Services Inter-national Congress and Symposium Series 200, Royal Society of Medicine Services Limited.
Copyright © 2022 FDOKUMEN