SICKNESS, CHANGE OF RESIDENCE, AND DEATH*
11
Brit. J. prev. soc. Med. (1958), 12, 172-182 SICKNESS, CHANGE OF RESIDENCE, AND DEATH* I. GENERAL RESULTS OF FOLLOW-UP IN TWO POPULATION GROUPS BY DONOVAN J. THOMPSON AND ANTONIO CIOCCO Department of Biostatistics, Graduate School of Public Health, University of Pittsburgh INTRODUCTION In this paper we present some basic data on resi- dence changes and mortality experience observed in a population sample of (a) the Arsenal Health District of Pittsburgh, Pa, from 1951 to 1956; and (b) Donora, Pa, from 1948 to 1957. The analyses of these data seek to answer only two questions at this time: (1) Are the movement (i.e. change of residence) and mortality experiences of persons who complain of some sickness in a household interview survey different from the experiences of those who have no such complaint? (2) To what extent are the estimates of mortality rates affected by the loss of a portion of the originally designated sample through change of address? Both questions bear upon the increasing efforts being made to describe the natural history of the diseases which now predominate as causes of dis- ability and death, and to identify the significant time periods in which to search for possible aetiological factors of these conditions. For these purposes studies are needed which can cover a considerable span of time before the onset of disability or death from the chronic diseases. Data ob- tained through household sickness surveys, of which many have been made in recent decades (Logan and Brooke, 1957), can provide a starting point for * This work was supported in part by a research contract with the Air Pollution Medical Program, Public Health Service, U.S. Depart- mnent of Health, Education, and Welfare. such long-term studies, as we hope to show in this and following papers. This point was illustrated in the resurvey of the Hagerstown population after 20 years (Ciocco, 1946; Lawrence, 1948), which led to the conclusion that "A substantial proportion of the persons who are ill at 65 have had the same or another chronic illness for at least 20 years" (Ciocco and Lawrence, 1952). However, as has been learned from these and many other studies which seek to relate certain individual characteristics at one point in time to the development of disease conditions later, a number of problems of analysis and interpretation arise. These problems are due in part to the bias re- sulting from the selection of the population under observation (Berkson, 1955), to effects of the passage of time on the development of the condition under study (Kodlin and Thompson, 1958), to the non- specific nature of the characteristic chosen for the initial observation, or to poor definition of the onset of the conditions under study. In brief, while it is well recognized that long-term studies are required to elucidate the factors related to the onset of the numerically important disabling and fatal diseases of current preoccupation, more knowledge is required to provide a sound basis for carrying out such studies. Moreover, the tools for the analyses of these studies are still somewhat crude, so that the findings resulting from them cannot be readily interpreted. There is a definite need, therefore, to explore and probe further into the statistical as well as into the observational methodology of long- term investigation of chronic disease. The study here reported with others planned in this series constitutes an example of such exploration. 172 by copyright. on August 6, 2022 by guest. Protected http://jech.bmj.com/ Br J Prev Soc Med: first published as 10.1136/jech.12.4.172 on 1 October 1958. Downloaded from
-
Upload
khangminh22 -
Category
Documents
-
view
7 -
download
0
Transcript of SICKNESS, CHANGE OF RESIDENCE, AND DEATH*

Brit. J. prev. soc. Med. (1958), 12, 172-182
SICKNESS, CHANGE OF RESIDENCE, AND DEATH*
I. GENERAL RESULTS OF FOLLOW-UP INTWO POPULATION GROUPS
BY
DONOVAN J. THOMPSON AND ANTONIO CIOCCODepartment of Biostatistics, Graduate School ofPublic Health, University ofPittsburgh
INTRODUCTION
In this paper we present some basic data on resi-dence changes and mortality experience observed ina population sample of (a) the Arsenal HealthDistrict of Pittsburgh, Pa, from 1951 to 1956; and(b) Donora, Pa, from 1948 to 1957.
The analyses of these data seek to answer only twoquestions at this time:
(1) Are the movement (i.e. change of residence)and mortality experiences of persons who complainof some sickness in a household interview surveydifferent from the experiences of those who have nosuch complaint?
(2) To what extent are the estimates of mortalityrates affected by the loss of a portion of the originallydesignated sample through change of address?
Both questions bear upon the increasing effortsbeing made to describe the natural history of thediseases which now predominate as causes of dis-ability and death, and to identify the significant timeperiods in which to search for possible aetiologicalfactors of these conditions.
For these purposes studies are needed which cancover a considerable span of time before the onset ofdisability or death from the chronic diseases. Data ob-tained through household sickness surveys, of whichmany have been made in recent decades (Logan andBrooke, 1957), can provide a starting point for
* This work was supported in part by a research contract with theAir Pollution Medical Program, Public Health Service, U.S. Depart-mnent of Health, Education, and Welfare.
such long-term studies, as we hope to show in thisand following papers. This point was illustrated inthe resurvey of the Hagerstown population after20 years (Ciocco, 1946; Lawrence, 1948), which ledto the conclusion that "A substantial proportionof the persons who are ill at 65 have had the same oranother chronic illness for at least 20 years" (Cioccoand Lawrence, 1952). However, as has been learnedfrom these and many other studies which seek torelate certain individual characteristics at one pointin time to the development of disease conditions later,a number of problems of analysis and interpretationarise. These problems are due in part to the bias re-sulting from the selection of the population underobservation (Berkson, 1955), to effects of the passageof time on the development of the condition understudy (Kodlin and Thompson, 1958), to the non-specific nature of the characteristic chosen for theinitial observation, or to poor definition of the onsetof the conditions under study.
In brief, while it is well recognized that long-termstudies are required to elucidate the factors relatedto the onset of the numerically important disablingand fatal diseases of current preoccupation, moreknowledge is required to provide a sound basis forcarrying out such studies. Moreover, the tools for theanalyses of these studies are still somewhat crude, sothat the findings resulting from them cannot bereadily interpreted. There is a definite need, therefore,to explore and probe further into the statistical aswell as into the observational methodology of long-term investigation of chronic disease. The study herereported with others planned in this series constitutesan example of such exploration.
172
by copyright. on A
ugust 6, 2022 by guest. Protected
http://jech.bmj.com
/B
r J Prev S
oc Med: first published as 10.1136/jech.12.4.172 on 1 O
ctober 1958. Dow
nloaded from
SICKNESS, CHANGE OF RESIDENCE, AND DEATH
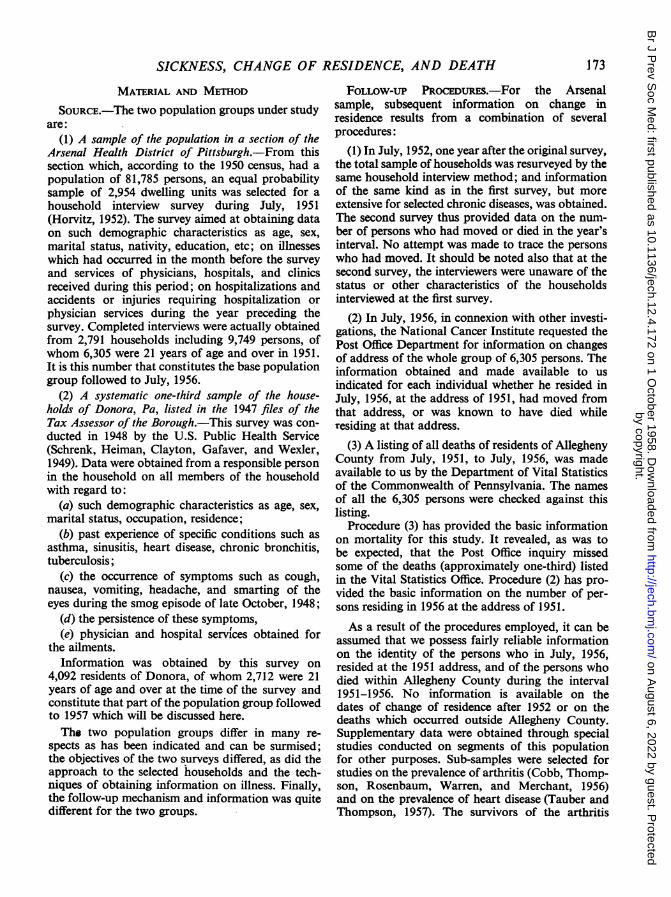
MATERIAL AND METHOD
SOURCE.-The two population groups under studyare:
(1) A sample of the population in a section of theArsenal Health District of Pittsburgh.-From thissection which, according to the 1950 census, had apopulation of 81,785 persons, an equal probabilitysample of 2,954 dwelling units was selected for ahousehold interview survey during July, 1951(Horvitz, 1952). The survey aimed at obtaining dataon such demographic characteristics as age, sex,marital status, nativity, education, etc; on illnesseswhich had occurred in the month before the surveyand services of physicians, hospitals, and clinicsreceived during this period; on hospitalizations andaccidents or injuries requiring hospitalization orphysician services during the year preceding thesurvey. Completed interviews were actually obtainedfrom 2,791 households including 9,749 persons, ofwhom 6,305 were 21 years of age and over in 1951.It is this number that constitutes the base populationgroup followed to July, 1956.
(2) A systematic one-third sample of the house-holds of Donora, Pa, listed in the 1947 files of theTax Assessor of the Borough.-This survey was con-ducted in 1948 by the U.S. Public Health Service(Schrenk, Heiman, Clayton, Gafaver, and Wexler,1949). Data were obtained from a responsible personin the household on all members of the householdwith regard to:
(a) such demographic characteristics as age, sex,marital status, occupation, residence;
(b) past experience of specific conditions such asasthma, sinusitis, heart disease, chronic bronchitis,tuberculosis;
(c) the occurrence of symptoms such as cough,nausea, vomiting, headache, and smarting of theeyes during the smog episode of late October, 1948;
(d) the persistence of these symptoms,(e) physician and hospital services obtained for
the ailments.Information was obtained by this survey on
4,092 residents of Donora, of whom 2,712 were 21years of age and over at the time of the survey andconstitute that part of the population group followedto 1957 which will be discussed here.The two population groups differ in many re-
spects as has been indicated and can be surmised;the objectives of the two surveys differed, as did theapproach to the selected households and the tech-niques of obtaining information on illness. Finally,the follow-up mechanism and information was quitedifferent for the two groups.
FOLLOW-UP PRocEDuS.-For the Arsenalsample, subsequent information on change inresidence results from a combination of severalprocedures:
(1) In July, 1952, one year after the original survey,the total sample of households was resurveyed by thesame household interview method; and informationof the same kind as in the first survey, but moreextensive for selected chronic diseases, was obtained.The second survey thus provided data on the num-ber of persons who had moved or died in the year'sinterval. No attempt was made to trace the personswho had moved. It should be noted also that at thesecond survey, the interviewers were unaware of thestatus or other characteristics of the householdsinterviewed at the first survey.
(2) In July, 1956, in connexion with other investi-gations, the National Cancer Institute requested thePost Office Department for information on changesof address of the whole group of 6,305 persons. Theinformation obtained and made available to usindicated for each individual whether he resided inJuly, 1956, at the address of 1951, had moved fromthat address, or was known to have died whileresiding at that address.
(3) A listing of all deaths of residents of AlleghenyCounty from July, 1951, to July, 1956, was madeavailable to us by the Department of Vital Statisticsof the Commonwealth of Pennsylvania. The namesof all the 6,305 persons were checked against thislisting.
Procedure (3) has provided the basic informationon mortality for this study. It revealed, as was tobe expected, that the Post Office inquiry missedsome of the deaths (approximately one-third) listedin the Vital Statistics Office. Procedure (2) has pro-vided the basic information on the number of per-sons residing in 1956 at the address of 1951.As a result of the procedures employed, it can be
assumed that we possess fairly reliable informationon the identity of the persons who in July, 1956,resided at the 1951 address, and of the persons whodied within Allegheny County during the interval1951-1956. No information is available on thedates of change of residence after 1952 or on thedeaths which occurred outside Allegheny County.Supplementary data were obtained through specialstudies conducted on segments of this populationfor other purposes. Sub-samples were selected forstudies on the prevalence of arthritis (Cobb, Thomp-son, Rosenbaum, Warren, and Merchant, 1956)and on the prevalence of heart disease (Tauber andThompson, 1957). The survivors of the arthritis
173
by copyright. on A
ugust 6, 2022 by guest. Protected
http://jech.bmj.com
/B
r J Prev S
oc Med: first published as 10.1136/jech.12.4.172 on 1 O
ctober 1958. Dow
nloaded from

DONOVAN J. THOMPSON AND ANTONIO CIOCCO
study group, which to begin with involved 944persons, are still under periodic observation. Theheart study group involved, to start with, 778persons, who were kept under observation until themiddle of 1954. Even with these supplementary datait is anticipated that the identification of deaths andmovement is subject to some errors. Specifically,we believe that deaths and movements may beunderestimated.
The follow-up procedures in Donora were direct,thus avoiding some of the "errors" inherent in theArsenal material. These procedures consisted of thefollowing steps:
(1) A complete census of all the households of theBorough of Donora was made in February-March,1957.
(2) If no member of the household sampled in1948 remained at the original address, informationwas sought from the neighbours or current residentsas to the present whereabouts of the listed individ-uals of that household, and, in addition, a centralfile was established so that information becameimmediately available if members of that householdhas been contacted in some other part of theborough.
(3) Letters were sent to every person who had leftDonora. As a result, contact was made with thatperson or with other members of his household inthe case of 99 I per cent. of the persons listed in theoriginal survey.
In the Donora follow-up, information was obtain-ed on the incidence and prevalence of certain chronicconditions during the interval 1948-1957 as well ason hospitalization and medical services received inthe interval, place and cause of death, etc. It shouldbe emphasized that the 1957 interviewers were notaware of the responses to health questions whichhad been made in 1948. Findings related to theseaspects of the Donora follow-up will be presentedin other publications.
Definitions.-In the 1951 survey of the ArsenalHealth District, the respondent was asked questionssuch as: "Has anyone in the household been ill inbed, been ill at home, or called in or visited aphysician during the past month? Has anyone beeninjured or involved in an accident for which medicalcare was sought during the past year ?"
If the answer to any of these questions was "yes"the person involved was classified as "ill", unless the
reason given for the answer indicated that theepisode concerned normal pregnancy or childbirth,routine physical examinations, immunizations, etc.
In the 1948 survey of Donora, the main questionwas: "Were you affected by the smog of October 28-31 ?"
If the answer was "yes", the persons involvedwere placed in the class: "acute illness". Inquiry wasalso made regarding the prevalence of certainchronic illnesses such as asthma, heart disease,chronic bronchitis, tuberculosis, and sinusitis.Persons with these conditions and/or acute illnessare included in the "all illness" class.
One other difference in the study of the twosamples is in the definition of movement. For theArsenal sample, information is available primarily onwhether or not the subject was living in 1956 at the1951 address. More complete information was ob-tained on the Donora sample. For the purpose ofthis study, the term "movement" for the Arsenalsample means change in first address, for the Donorasample it means leaving the borough.
DESCRIPTION OF MOVEMENT OR DEATH
In 1956, information was obtained that 368 of the6,305 persons in the Arsenal sample had died between1951 and 1956 and that 2,347 had moved from the1951 address. For all but fourteen of the deaths,copies or abstracts of the death certificates are athand. For the Donora sample, the resurvey of 1957found that 298 of the 2,712 had died and that 456had left Donora in the 84- years that had elapsedbetween the two surveys. Copies or abstracts of thedeath certificates are available on 276 of the dead.The findings on movement and death are sum-
marized by sex, by broad age groups, and byillness experience reported at the initial survey inTables IA and IB.
The major points to note are:
(I) The expected difference between the twosexes with respect to mortality is evident, but there islittle sex difference with respect to movement.
(2) The percentage of known deaths increase withincrease in age at first observation, but the per-centages of persons who moved decrease witl?age.
(3) In the Donora sample (Table IA), for each sexand for each age group, the percentage of ill personswho had died in the 8k-year interval is larger thanthe percentage of persons who died during the8+-year interval but were not reported ill during
174
by copyright. on A
ugust 6, 2022 by guest. Protected
http://jech.bmj.com
/B
r J Prev S
oc Med: first published as 10.1136/jech.12.4.172 on 1 O
ctober 1958. Dow
nloaded from

SICKNESS, CHANGE OF RESIDENCE, AND DEATH
TABLE IADONORA SAMPLE, STATUS IN 1957 ACCORDING TO ILLNESS EXPERIENCE REPORTED IN 1948
Males Females
Age (yrs) In 1948 Percentage in 1957 In 1948 Percentage in 1957
In Left In Leftlllness* Reported Number Donora Donora Dead Number Donora Donora Dead
None 238 72 6 26 6 *8 252 69 3 29 9 *821-34 Acute Only.. 157 64 3 32 5 3 2 203 73 9 24 6 1I5
All .187 64 9 32 4 2 7 240 73 9 24-9 1-2
None .. 166 83-7 13-3 3-0 162 85 8 11 7 2 535-49 Acute Only.. . 222 82-4 12 2 5 *4 199 81*4 12*1 6- 5
All .. . 243 82 3 12 3 5 * 3 232 81*0 12*5 6- 5
None 136 69 9 14-7 15 *4 128 82 8 6- 3 10 950-64 Acute Only.. . 235 72 * 3 8 *9 18 *7 174 72*4 10-9 16*7
All . . . 266 70*7 9*0 20 3 193 72*0 10*4 17*6
None 44 50 0 4 5 45-5 43 55 8 2-3 41*965 and Over Acute Only.. 82 42-7 7 3 50*0 69 40*6 15*9 43 * 5
All .100 40-0 9 0 51-0 82 39 0 15 9 45 1
* The "all" illness category includes the "acute only" plus persons reporting only chronic illness.
TABLE IBARSENAL SAMPLE. STATUS IN 1956 ACCORDING TO ILLNESS EXPERIENCE REPORTED IN 1951
Males Females
Age (yrs) In 1951 Percentage in 1956 In 1951 Percentage in 1956
At same Changed At same ChangedIllness Reported Number Address Address Dead Number Address Address Dead
21-34 No .. 846 44-9 53 8 13 901 47 3 52- 7 -
Yes . .96 54-1 43*8 2-1 161 43*5 54*7 1.9
35-49 No .862 64-1 33 *9 2 *0 871 66-5 32-4 I.1Yes 133 51 9 43-6 4-5 213 57-3 36-6 6-1
50-64 No .597 65 *5 25 *1 9*4 559 65*5 29 *0 5*5Yes .133 54*1 24 8 21*1 187 63 *6 28 *9 7 *5
65 and Over No .247 51*8 25 *1 23 *1 261 56-7 22 6 20-7Yes 100 43 *0 18 *0 39*0 138 52*1 28 3 19 *6
the smog episode. The differences between the per-centages do not increase or decrease consistentlyfrom the younger to the older age groups; however,there is a tendency for the ratios of the correspond-ing percentages to decrease from the younger to theolder age groups.
(4) The percentage of ill persons who left Donorain the 81-year interval is higher than the corres-ponding percentage among persons not reportedill who left Donora in two of the four age groupsamong males and three of the four age groupsamong females. Thus it would appear that there isno consistent difference between the ill persons andthe persons not reported ill with respect to migra-tion from Donora.
(5) In the Arsenal sample (Table IB) for each sexand for each age group (except females 65 years ofage and over) the percentage of persons who died
during the interval 1951-1956 is higher among thepersons reported ill in the 1951 survey than amongthose not reported ill. This difference is more strik-ing in the males than in the females.
(6) Among the females in three of the four agegroups in the Arsenal sample, the percentage ofpersons who moved is higher for those who re-ported illness in the 1951 survey than those who didnot. Among the males this is observed in only oneage group.
Before proceeding to an estimate of the mortalityrates, let us consider the above findings. Taken atface value they indicate that reported illness, be itthe acute variety associated with a smog episode or aconglomeration of acute and chronic conditions asfound in the Arsenal survey, segregates from thepopulation a group which for a few years at leastwill have a higher mortality than the rest. Further
175
by copyright. on A
ugust 6, 2022 by guest. Protected
http://jech.bmj.com
/B
r J Prev S
oc Med: first published as 10.1136/jech.12.4.172 on 1 O
ctober 1958. Dow
nloaded from

DONOVAN J. THOMPSON AND ANTONIO CIOCCO
analyses of our data will seek to determine the cir-cumstances in which the differences persist. Someillnesses or conditions are undoubtedly moreimportant than others in such segregation. From thedata of the Hagerstown resurvey which took placeafter an interval of 20 years, the conclusion wasreached that the life span was shortened only whenmajor chronic conditions were reported in the initialsurvey. Future examination of the material at handon the Arsenal and Donora samples will indicatehow valid such conclusion is for the shorter span oftime involved here. The lack of striking differences inmortality between the ill and not-ill females in theoldest age group of the Arsenal sample also deservesadditional examination, since it may reflect the re-spondent bias often suspected in household surveys.
In a subsequent paper it will be shown that thedifferences in movement rates between the ill andnot-ill persons probably reflect only samplingvariation. Nevertheless, the amount of the change isconsiderable, and is an important factor to considerin any attempt at follow-up of population samples.It creates an important problem for the estimationof mortality rates as we shall next point out.
ESTIMATION OF MORTALITY RATES
The data we have described relate mortality andmobility through time in two groups of persons-the "ill" and the "not ill". In many follow-up in-vestigations, the persons we have described as"moved" would be lost to follow-up on the date oftheir first movement. In some investigations diligentefforts are made to keep this moved group underobservation, but.nevertheless some fraction (largeor small) is finally lost to follow-up. The carefulinvestigator is concerned with the possible in-fluences such losses may have in contrasting twoor more groups, such as our "ill" and "not ill", interms of mortality or any other characteristic. Fromthis point of view the movement experience can beviewed as a disturbance the possible influence ofwhich requires investigation. The principal fearappears to be that the remnants remaining underobservation at the end of some time period will notbe "representative" of their respective initial groups.Differential selection of the "movers" in the variousgroups is, perhaps, viewed as the principal mechan-ism responsible for any lack of comparabilityamong the remn'ants of each group at the end ofsome time period.
In this material, the data for the Donora sampleinclude information about the date of movementfrom the borough of all the persons who moved,and about the date and place of death of those who
died during the interval 1948 to 1957. For theArsenal sample, in the interval 1952-56, informationis available only about the date and place of death ofthose who died and could be found in the vitalstatistics records, but no information was obtainedabout the date of change of residence within theperiod. Since the Donora data are more complete,the'analytical procedures to be described will bebased on these data to begin with.The events of death and movement in a series of
discrete intervals of time may be shown graphicallyas in the Figure (opposite). During the first interval,(t., tj), the persons in the cohort have a probabilityof dying, P1, and a probability of moving, R1. Bythe end of the first period, t1, the persons alive at thebeginning time point, to, will be found in one of thefour categories indicated by the four following cells:
CategoryMoved and DiedMoved and SurvivedNot moved and DiedNot moved and Survived
Probability012 (1)9b2 (1)b1 (1)b0 (1)
In the next interval, tl to t2, we have two categoriesof living persons to consider (indicated by thebroken arrows): those who moved and those whodid not move during the first period. If we are notinterested in the subsequent movement of those whomoved in the interval to to tl, we can consider thatduring the interval t1 to t2 they are subject only tothe risk of dying, the probability of which is desig-nated as P2(1). The survivors of the first period whodid not move are again subject to both movementand death during the interval t1 to t2, and theirprobability of dying in the interval is designated asP2, which may be the same as P2(') or may have adifferent value. The survivors at t2 are of three types,as may be noted from the Figure, and for the periodt2 to t3 a probability of dying is defined for each ofthe three types, P3, p3(2), p3(1), which may again beidentical or different.
In terms of this representation of the events ofmovement and death and their associated pro-babilities, the total probability of dying during theinterval t1 to t, designated Pt, is given by:
w- 1F(-1Pt (I - Pi)
w - 1
i =j + 1
w rJ- 1£ n 00¢(i)¢ 2U)
j= I ti=O(1 - Pi)
I w
[1- (1 - Pi) j (1 - P JJ) -i = I i =ji+ I
176
by copyright. on A
ugust 6, 2022 by guest. Protected
http://jech.bmj.com
/B
r J Prev S
oc Med: first published as 10.1136/jech.12.4.172 on 1 O
ctober 1958. Dow
nloaded from

SICKNESS, CHANGE OF RESIDENCE, AND DEATH
The observed frequency of occurrence of thevarious categories of events in the model willfurnish the basic information for estimating theprobabilities defined. For the case of completefollow-up for the period t0 to t,, Pt would beestimated simply by dividing the total observeddeaths (ignoring movement) by the number of per-sons in the original sample.
If the follow-up of the movers is incomplete, as ismost frequently the case, we may be forced to baseour calculations of mortality rates on the incom-plete experience obtained by following each in-dividual to the end of the period during which hemoves. From the model described in the Figure weshall then be estimating a total probability of dyingduring the interval t0 to t,, defined as Ps, where
w
Ps = I - O(l-JPi).i= 1
Time d d T(totti) m | |R I
m | |I -R,T PI | -PC I1
d d T(t1 It2) m *| R2m IR
T Pa F I|
d d T
(t2,ts) m Rs
m _ iR,
T P. I- I
If the subsequent mortality of the "movers" andof those not moving is identical, P1(i) = Pi for allj < i; i = 2, . . ., w; Ps and P, are identical. How-ever, if the subsequent mortality of the movers andthose not moving is different, Ps may differ from P,.
If we limit our consideration of mortality only tothose who moved at some time during the period offollow-up, we can calculate a total probability ofdying for those who moved, Pm, in the followingfashion:
pM =
dmPm =- ,
m
where m is the total number moved, and dm is thenumber of deaths occurring from the moved group.As defined, Pm is a measure of the composite
mortality at a stated point in all the subgroups thathave moved before that point. It may easily beshown that Pm is a simple weighted average of thetotal probability of dying before the stated point ineach of the subgroups. The weights used in theaveraging process are the probabilities that a studyperson will be included in a particular subgroup. IfpN() has the same definition for the subsequentmortality in the subgroup which moves during theith period as P, has for the total study group, andif the relative weights are denoted by ai,
Pm = 0ai PI(i)The probabilities Pm, Ps, andP, are, in general, related in thefollowing way:
d d T
lP21 *.1-1 Id d T
IdT2,1 1 I
~
Pt -Ps -k{Pnm -Pm*}.
IP"1IddTE1iZE
FiouRE.-Schematic representation of a probability model for follow-up investigations,of a characteristic (Mortality-d) in the presence of adisturbance (Movement-m). Three consecutive time periods repre-sented.
177
by copyright. on A
ugust 6, 2022 by guest. Protected
http://jech.bmj.com
/B
r J Prev S
oc Med: first published as 10.1136/jech.12.4.172 on 1 O
ctober 1958. Dow
nloaded from
DONOVAN J. THOMPSON AND ANTONIO CIOCCO
In this equation, k is a proportionality constant andPm* has the same functional form as Pm, with Pi(i)replaced by Pi throughout.
Further to clarify the interpretation of Pm, we
might calculate the survivors to say, 1953, of thesub-group which moved in 1948 and survived thatperiod, and the survivors of the subgroups whichmoved in the years 1949-1952. The total number ofpersons in these subgroups multiplied by (1 - Pm)will give the total survivors to 1953 of these sub-groups. It can also be shown that this calculationyields the same result as would be obtained by em-
ploying the usual actuarial or life-table methodsappropriate for open cohorts.
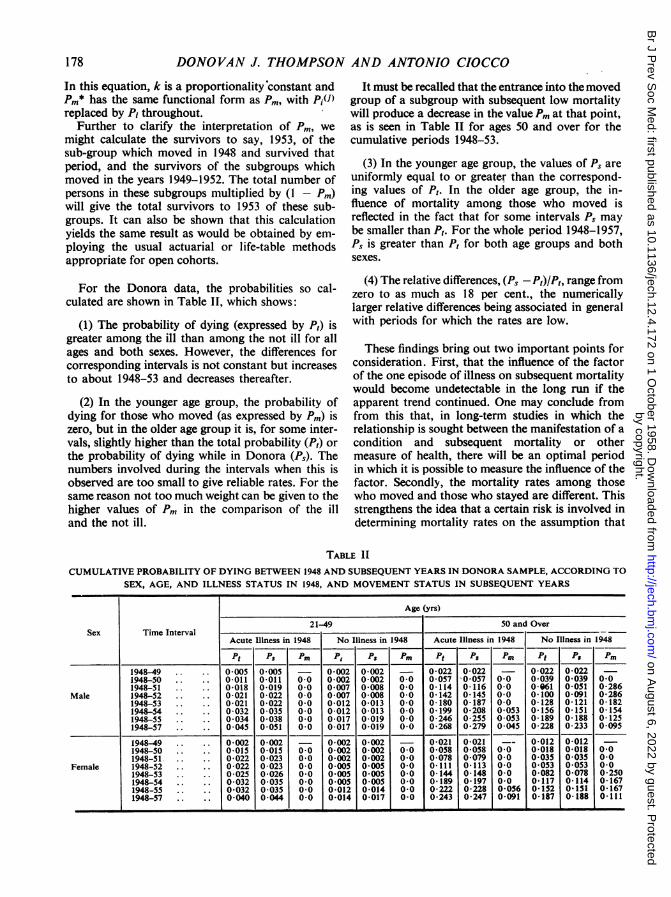
For the Donora data, the probabilities so cal-culated are shown in Table II, which shows:
(1) The probability of dying (expressed by Pt) isgreater among the ill than among the not ill for allages and both sexes. However, the differences forcorresponding intervals is not constant but increasesto about 1948-53 and decreases thereafter.
(2) In the younger age group, the probability ofdying for those who moved (as expressed by Pm) iszero, but in the older age group it is, for some inter-vals, slightly higher than the total probability (Pt) orthe probability of dying while in Donora (Ps). Thenumbers involved during the intervals when this isobserved are too small to give reliable rates. For thesame reason not too much weight can be given to thehigher values of Pm in the comparison of the illand the not ill.
It must be recalled that the entrance into the movedgroup of a subgroup with subsequent low mortalitywill produce a decrease in the value Pm at that point,as is seen in Table II for ages 50 and over for thecumulative periods 1948-53.
(3) In the younger age group, the values of Ps are
uniformly equal to or greater than the correspond-ing values of Pt. In the older age group, the in-fluence of mortality among those who moved isreflected in the fact that for some intervals Ps may
be smaller than Pt. For the whole period 1948-1957,Ps is greater than Pt for both age groups and bothsexes.
(4) The relative differences, (Ps-P,)/P,, range fromzero to as much as 18 per cent., the numericallylarger relative differences being associated in generalwith periods for which the rates are low.
These findings bring out two important points forconsideration. First, that the influence of the factorof the one episode of illness on subsequent mortalitywould become undetectable in the long run if theapparent trend continued. One may conclude fromfrom this that, in long-term studies in which therelationship is sought between the manifestation of a
condition and subsequent mortality or othermeasure of health, there will be an optimal periodin which it is possible to measure the influence of thefactor. Secondly, the mortality rates among thosewho moved and those who stayed are different. Thisstrengthens the idea that a certain risk is involved indetermining mortality rates on the assumption that
TABLE IICUMULATiVE PROBABILITY OF DYING BETWEEN 1948 AND SUBSEQUENT YEARS IN DONORA SAMPLE, ACCORDING TO
SEX, AGE, AND ILLNESS STATUS IN 1948, AND MOVEMENT STATUS IN SUBSEQUENT YEARS
Age (yrs)
21-49 50 and OverSex Time Interval
Acute Illness in 1948 No Illness in 1948 Acute Illness in 1948 No Illness in 1948
Pt PS Pm Pt P8 PM Pt PS PM Pt PS Pm1948-49 0.005 0005 - 0*002 0002 - 0*022 0022 - 0022 00221948-50 0-011 0-011 0-0 0 002 0 002 0 0 0 057 0 057 0-0 0-039 0 039 0 01948-51 0-018 0-019 0 0 0 007 0 008 0 0 0 114 0 116 0-0 0C161 0 051 0-286
Male 1948-52 0*021 0*022 00 0*007 0 008 00 0142 0145 00 0100 0091 0-2861948-53 0-021 0-022 0-0 0-012 0-013 0.0 0-180 0-187 0 0 0-128 0-121 0-1821948-54 0-032 0-035 0 0 0-012 0-013 0.0 0 199 0-208 0 053 0156 0151 01541948-55 0-034 0-038 0.0 0-017 0 019 0.0 0-246 0 255 0-053 0-189 0 188 0-1251948-57 0 045 0051 0.0 0-017 0-019 0.0 0-268 0-279 0 045 0-228 0-233 0 095
1948-49 0.002 0002 - 0*002 0002 - 0*021 0*021 --0_012 00121948-50 0-015 0-015 0 0 0*002 0 002 0.0 0 058 0 058 0 0 0-018 0-018 0.01948-51. 0*022 0023 00 0*002 0*002 00 0078 0*079 00 0035 0035 00
Female 1948-52 0*022 0*023 00 0*005 0 005 00 0111 0113 00 0053 0053 001948-53 0-025 0-026 0-0 0-005 0-005 0 0 0 144 0 148 0 0 0-082 0 078 0 2501948-54 0-032 0 035 0.0 0 005 0 005 0.0 0 189 0*197 0.0 0*117 0 114 0'1671948-55 .. 0-032 0 035 0 0 0-012 0-014 0 0 0-222 0-228 0-056 0 I52 0lSI 0 1671948-57 .. .. 0040 0 044 0 0 0*014 0 017 0.0 0 243 0-247 0 091 0 187 0 188 0l11l
.~~~~~~~~~~~~~~~~~~~~ L
178
by copyright. on A
ugust 6, 2022 by guest. Protected
http://jech.bmj.com
/B
r J Prev S
oc Med: first published as 10.1136/jech.12.4.172 on 1 O
ctober 1958. Dow
nloaded from

SICKNESS, CHANGE OF RESIDENCE, AND DEATH
there is equality in the mortality rates of those whomoved and those who did not.The Pt as calculated is a measure of the probability
of dying of the total cohort. Unless it is possible tofollow-up a cohort, as was done in Donora, thisprobability can be estimated only approximately.It will be noted that, if Ps were used in its stead, thevalue of Pt would be overestimated when the mor-tality of the moved was less than the mortality ofthose who did not move, and that the value ofPt would be underestimated when the mortality ofthe moved was higher than that of those who didnot move.
Several ways have been suggested for estimatingthe probability of dying when complete informationon the persons who have moved is not available.For example, there is the time-honoured approachused in life-table construction inwhich the populationat risk at the beginning of the interval is reduced byone-half of the persons who moved during the inter-val. With this approach,
Pij
when di = observed deaths and ni = the numbermoved (lost to follow-up) during the period, and Ii =the number at risk at the beginning of the period. Forw periods of follow-up we may define Pa as follows:
W A
Pa = 1 - r (1 -_Pi).
If, as is often the case, information is not availableregarding the dates of movement and subsequentmortality, and if there is only information on thenumber of persons at the initial observation period,the numbers who moved, and the numbers whodied in the place of residence, only an over-allmortality rate for the total interval of follow-up canbe calculated by following the suggested approach.The rates calculated in this manner (Ps, Pa) may bedenoted, respectively;
Po_ ds d +
P0a= dPa
n rni
where: n is the size of the original cohortd is the total number of observed deathss is the number of survivors among thosewho have not moved,
m is the number of persons who have moved(lost to follow-up) during the total periodof follow-up.
The values of Ps, Pa, Poa, Pos, calculated on the1948-1957 experience of the Donora sample, arecompared with Pt in Table III; and the values ofPs and Pa calculated on the one year experience(1951-1952) of the Arsenal sample are comparedwith Pt in Table IV.
TABLE IICOMPARISON OF VARIOUS ESTIMATES OF THE PROBABILITY OF DYING DONORA SAMPLE, 1948-1957, ACCORDING TO
SEX, AGE, AND ILLNESS STATUS IN 1948
Male Female
Probability of Dying Age 21-49 Age 50 and Over Age 21-49 Age 50 and Over
Ill Not III Ill Not Ill Ill Not III Ill Not Ill
Pt °00449 00173 02681 02278 00398 00145 02428 01871PS 00506 0-0193 0-2791 0 2327 0*0438 0*0173 0 2467 0-1878Pa 0 0513 0-0196 0-2784 0-2351 0 0445 0-0175 0-2488 0-1829P°a 0 0500 0-0194 0-2772 0-2321 0 0438 0-0164 0-2511 0-1813PO$ 0-0565 0-0220 0-2907 0-2500 0-0488 0-0188 0-2701 0-1875
TABLE IVCOMPARISON OF VARIOUS ESTIMATES OF THE PROBABILITY OF DYING, ARSENAL SAMPLE, 1951-1952 AND 1951-1956,
ACCORDING TO SEX, AGE, AND ILLNESS STATUS IN 1951
Male FemaleProbability
Period of Dying Age 21-49 Age 50 and Over Age 21-49 Age 50 and Over
Ill Not I11 Ill Not Ill Il Not Ill Ill Not IIIPt 0°0089 00059 00772 00178 00080 00006 00277 00244
1951-2 Ps 00103 00069 00794 00189 00000 00000 00270 00209Pa 0*00094 0-0063 0*0761 0-0183 0*0000 0*0000 0*0258 0-0202
1951-6 P° 00337 0-0150 0-2687 0-1187 0-0279 0-0022 0-1064 0-0806POs 0 0472 0 0210 0-3195 0 1422 0 0400 0 0030 0-1318 0-0982
179
by copyright. on A
ugust 6, 2022 by guest. Protected
http://jech.bmj.com
/B
r J Prev S
oc Med: first published as 10.1136/jech.12.4.172 on 1 O
ctober 1958. Dow
nloaded from

DONOVAN J. THOMPSON AND ANTONIO CIOCCO
The data of Table III reveal immediately that, incomparison with P,, the "true" mortality rate forthe 81-year period, the other calculated rates arehigher in most instances. The estimate, P', has thelargest discrepancy, obviously because it entirelyoverlooks the moved in the denominator. On theother hand, when the rates are calculated annually,based only on the persons who stayed in Donora(Ps), the magnitude of the deviation from P, isabout equal to if not smaller than that observed whenPa or P%a is computed. It is interesting to note thatthe difference between P° and Pt is more oftensmaller than the difference between P, and Pt.Similar comparisons are possible on the Arsenalsample for the one-year interval 1951-52.The data of Table IV show that in this instance the
differences between Pa and Pt are more often smallerthan the difference between P, and Pt.The implication of these comparisons will be
discussed elsewhere. Here it is sufficient to pointout that the differences between the several ratescompared are in part due to differences in the fre-quency of movement within the time intervalsstudied. Consequently, estimation procedures formortality or other rates become purely arithmeticalexercises unless they take into account the actualbehaviour of disturbing factors such as movementin the above example.
It is of interest to note from Tables III and IV thatthe difference between corresponding rates for the"ill" and "not ill" or the ratio of the correspondingrates indicates that the differences or ratios based onPt are closely approximated by differences or ratiosbased on the various approximations. In other words,as the events of movement occurred in the DonoraSample for the period 1948-57 and in the ArsenalSample for the period 1951-2, the approximationusually employed to calculate mortality when thereis loss in the population at risk (here indicated asPa)may overestimate or underestimate the actual mor-tality rates of the ill and not ill by a considerableamount. However, as it happens, these approxi-mations do not seem to distort too much the differ-ence between the two groups.
SAMPLING VARIATION
Chance fluctuations in all the rates we havedescribed must be considered when contrasting theill group with the not ill group. To employ aparametic test for this purpose requires calculationof the variance. If we follow accepted procedures,the variance of the estimated Pt may be taken sim-ply as Pt (1 - Pt)In, where n is the original size of thegroup considered. For rates such as Pa, in which
corrections are made for the reduction in the size ofthe original cohort, a formula suggested by Irwin(1949) may be used. The difference in mortalityrates for corresponding ill and not ill groups, whendivided by the estimated variance of the difference,will be approximately normally distributed with zeromean and unit variance under the "null hypothesis".
From the data of Tables III and IV we havecarried out tests of the differences between mor-tality rates for corresponding ill and not ill groups,based on Pt for 1948-57, for the Donora sample, andon Pt for 1951-52, and P°a for 1951-56, for theArsenal sample. The results of the tests show that theobserved difference would occur by chance less thanonce in a hundred in the cases of:
(a) Donora males and females in the age group21-49;
(b) Arsenal males of 50 years and over, when Ptfor 1951-52, is compared;
(c) Arsenal males of 50 years and over and femalesof 21-49 years when P0a, for 1951-56 is compared.
For the other age and sex groups on which thetests have been made the differences are apparentlynot large enough to reach statistical significance interms of the stated criterion for sampling variation.The whole question of testing group differences
for follow-up data of the type reported here is, ofcourse, dependent upon the specific objectives of theanalysis. Differences in the cumulative mortalitybetween the two groups up to some point of time inthe follow-up period may be of interest for one pur-pose; differences in the annual mortality may be ofinterest for another. Perhaps, most generally, wewould seek for a representation of the entire phe-nomenon in terms of the cumulative probabilitydistribution function of the time at death to deter-mine whether the two groups have different dis-tributions and what the magnitudes of the differencesare.To our knowledge, an adequate discussion of the
problems of determining the proper variance ex-pressions, the "effective" sample size, the forms ofthe distribution functions, choice of test criteria,etc., which are appropriate for follow-up investi-gations has not as yet appeared in the literature. Insubsequent papers of this series we hope to examinethis aspect of the analysis of cohort data in greaterdetail.
DIscUSSIONThe relationship of reported illness and subse-
quent mortality and change of residence has been
180
by copyright. on A
ugust 6, 2022 by guest. Protected
http://jech.bmj.com
/B
r J Prev S
oc Med: first published as 10.1136/jech.12.4.172 on 1 O
ctober 1958. Dow
nloaded from
SICKNESS, CHANGE OF RESIDENCE, AND DEATH
examined (a) for the interval 1948-1957 in a sampleof 2,712 persons aged 21 years and over residing andsurveyed in Donora, Pa, in 1948; and (b) for theinterval 1951-1956 in a sample of 6,305 personsaged 21 years and over residing and surveyed in theArsenal Health District of Pittsburgh, Pa, in 1951.The survey of Donora in 1948 was undertaken toinvestigate the sickness effects of the smog episodeof October of that year. The survey of the ArsenalDistrict in 1951 was undertaken to determine thefrequency of illness and the receipt of medical carein the population.
The analyses discussed in this paper seek toanswer only two questions:
(I) Did persons who reported illness change theiraddress or die at a different rate from persons whodid not?
(2) To what extent is the estimate of mortalityaffected by the differential mobility?
In answer to the first question, the data reveal:
(1) There was no consistent difference in the fre-quency of change of address between those whoreported illness at the initial survey and those whodid not.
(2) In general, persons who reported some illnessat the initial survey had a higher mortality than thosewho did not.
(a) For the Donora data for which annual mor-tality rates could be estimated, the difference showeda tendency to become smaller with length of time.
(b) The difference between the mortality of thosewho reported illness at the initial survey and thosewho did not may be due to chance variation forcertain age-sex subgroups. However, a thoroughinvestigation of the role of chance in the observeddifferences has not been undertaken.
While a full interpretation of these findings re-quires further analysis of the data, certain inferencesmay be drawn now. It appears that observationssuch as these made by eliciting information onsickness complaints through interviews does identifypersons who for some time will have a higher riskof dying than others. Taking into consideration theHagerstown study already mentioned and the find-ings of the Donora sample, we could conclude thatthe duration of this higher risk has an optimumpoint.
If it were true that identification of persons witha greater risk of mortality for a specified interval of
time can be made through the interview type ofsurvey, this approach could be used to throw lighton the patterns of sickness which lead to deathand also to provide an earlier starting point forstudies aimed at exploring antecedent factors insickness. Further analysis of the present material,particularly with respect to the relationship ofspecific sickness to specific cause of death, and ofspecific sickness in successive observations, is re-quired before a final interpretation can be made ofthe findings here reported.
In answer to the second question, the Donora dataindicate that estimates in which an adjustment ismade for loss of data due to change of residence,or in which this loss is disregarded, may vary con-siderably from the rate based on knowledge aboutthe total cohort. Although, in this particular sample,the different estimates did not affect the differencesin mortality rate between those who reported illnessat the initial survey and those who did not, it isclear that the usual methods of estimating mortalityrates for a cohort that has been affected in the courseof time by a loss of persons under observation maygive rather crude approximations. Our data haveshown that the differential rate of mortality amongthose who move as well as the varying proportions ofpersons who move will produce departures from theactual mortality rate that cannot be compensated forby the adjustment procedures now employed.The observations and points discussed only hint at
some of the major questions which must be resolvedbefore we can undertake with assurance the analysisof long-term or cohort data. It is hoped that as moresuch data are collected greater efforts will be made tore-examine critically the pertinent analytical pro-cedures.
SUMMARY
Data on reported illness, subsequent mortality,and change of residence from two follow-up studiesof approximately 9,000 adult persons have beenanalysed for relations between reported illnessstatus and subsequent mobility or subsequentmortality. These analyses show (1) no consistentor clear-cut relation between reported illness statusand later mobility, and (2) higher subsequent mor-tality among persons reported ill than among per-sons reported not ill. Various methods of estimatingthe subsequent mortality in the ill and not-ill group,which utilize different assumptions concerningmortality within the groups lost to follow-up throughmovement, are compared with the rate based oncomplete mortality knowledge about the totalcohort.
181
by copyright. on A
ugust 6, 2022 by guest. Protected
http://jech.bmj.com
/B
r J Prev S
oc Med: first published as 10.1136/jech.12.4.172 on 1 O
ctober 1958. Dow
nloaded from
DONOVAN J. THOMPSON AND ANTONIO CIOCCO
REFERENCES
Berkson, J. (1955). Proc. Mavo Clin., 30, 319.Ciocco, A. (1946). Hum. Biol., 18, 33.
and Lawrence, P. S. (1952). In "Illness and Health Services in an
Ageing Population", by G. St. U. Perrott, A. C'occo, G. Baehr,L. S. Rosenfeld, and Their Collaborators, p. 26 (Public HealthService Publication, No. 170). Washington, D.C., U.S.A.
Cobb, S.. Thompson, D. J., Rosenbaum, J., Warren, J. E., andMerchant, W. R. (1956). J. chron. Dis., 3, 134.
Horvitz, D. G. (1952). Pub!. Hit/h Rep. (Wash.), 67, 1003.
Kodlin, D., and Thompson, D. J. (1958). "An Appraisal of theLongitudinal Approach to Studies of Growth and Development".Monogr. Soc. Res. Child Developm., 23, 1. (Serial No. 67).
Lawrence, P. S. (1948). Publ. Hith Rep. (Wash.), 63, 69.Logan, W. P. D., and Brookes, E. M. (1957). "The Survey of Sickness,
1943-1952". General Register Office. Studies on Medical andPopulation Subjects, No. 12. H.M.S.O., London.
Schrenk, H. H., Heimann, H., Clayton, G. D., Gafafer, W. M., andWexler, H. (1949). "Air Pollution in Donora, Pa: Epidemiology ofthe Unusual Smog Episode of October, 1948. Preliminary Report"(Public Health Bulletin, No. 306). Washington, D.C., U.S.A.
Tauber, J., and Thompson, D. J. (1957). J. chron. Dis., 6, 595.
182
by copyright. on A
ugust 6, 2022 by guest. Protected
http://jech.bmj.com
/B
r J Prev S
oc Med: first published as 10.1136/jech.12.4.172 on 1 O
ctober 1958. Dow
nloaded from