LONG-TERM GROUNDWATER QUALITY AND SALINE INTRUSION ASSESSMENT IN AN IRRIGATED ENVIRONMENT: A CASE...
14
LONG-TERM GROUNDWATER QUALITY AND SALINE INTRUSION ASSESSMENT IN AN IRRIGATED ENVIRONMENT: A CASE STUDY OF THE AQUIFER UNDER THE LBDC IRRIGATION SYSTEM † MUHAMMAD BASHARAT 1 * and ATA-UR-REHMAN TARIQ 2 1 International Waterlogging and Salinity Research Institute, WAPDA, Lahore, Pakistan 2 CEWRE, University of Engineering and Technology, Lahore, Pakistan ABSTRACT Pakistan’s irrigation system is more than a century old. Due to the increasing population and consequent intensifying agriculture, dependence on groundwater is successively increasing. The underground reservoir that was recharged during the first half of the twentieth century by the newly built irrigation system with low cropping intensities is now being overexploited. Groundwater quality is variable, both vertically and horizontally, with the exception of areas adjacent to rivers, where it is fresh. This paper describes groundwater quality in the Lower Bari Doab Canal (LBDC) irrigation system based on 47 years of historic water quality data (TDS, SAR and RSC). Areas are delineated in the form of zones and depths. The tail end of the command is facing severe groundwater depletion, whereas in certain parts, groundwater quality deterioration with the passage of time has also been detected. Possible reasons and mechanisms of saline intrusion within the aquifer are described. Lateral saline intrusion is not a major issue due to very slow groundwater movement. But in areas with saline groundwater lying below the upper layer of irrigation leaked fresh water, mobilization of deeper saline water is taking place as a result of pumping by farmers. In addition, results of the solute transport model and MODPATH runs were evaluated in support of water quality analysis and groundwater flow rates. Copyright © 2013 John Wiley & Sons, Ltd. key words: saline intrusion; groundwater quality; conjunctive use; aquifer mining; TDS; MODPATH Received 11 August 2012; Revised 8 January 2013; Accepted 8 January 2013 RÉSUMÉ Le système d’irrigation du Pakistan est plus que centenaire. En raison de la croissance démographique et par conséquent l’intensification de l’agriculture, la dépendance des eaux souterraines est grandissante. Le réservoir souterrain qui a été rechargé pendant la 1re moitié du 20e siècle par le système d’irrigation nouvellement construit, avec de faibles intensités de culture, est désormais surexploité. La qualité des eaux souterraines est variable, à la fois verticalement et horizontalement, à l’exception des zones adjacentes aux cours d’eau, où elle est douce. Le document décrit la qualité des eaux souterraines dans le système inférieur du canal d’irrigation de Bari Doab (LBDC) basée sur 47 années de données historiques de qualité des eaux (TDS, SAR et LRC). Le système est délimité en zones d’équiprofondeur de la nappe. La queue de la commande doit faire face à l’épuisement sévère des eaux souterraines, alors que dans certaines régions, la détérioration de la qualité des eaux souterraines a également été détectée. Les raisons possibles et les mécanismes de l’intrusion saline dans l’aquifère sont décrits. L’intrusion latérale d’eau salée n’est pas un problème majeur en raison du mouvement des eaux souterraines très lent. Mais dans les régions où l’eau souterraine saline est surmontée d’une couche d’eau douce provenant des fuites des systèmes d’irrigation, la mobilisation de l’eau saline profonde est observée à la suite de pompage par les agriculteurs. En outre, les modèles de transport des solutés et le modèle MODPATH ont été évalués par l’analyse de la qualité de l’eau et des débits d’eau souterraine. Copyright © 2013 John Wiley & Sons, Ltd. mots clés: intrusion d’eau salée; qualité des eaux souterraines; utilisation conjuguée; exploitation minière d’un aquifère; TDS; MODPATH * Correspondence to: Muhammad Basharat, IWASRI - WAPDA Muhammad Pura Village, Raiwind Road, Phase-II, WAPDA Town Lahore Punjab 53700 Pakistan. E-mail: [email protected] † Qualité des eaux souterraines à long terme et évaluation d’intrusion saline dans un environnement irrigué. Une étude de cas de l’aquifère du système d’irrigation du Lower Bari Doab Canal (LBDC), Pakistan. IRRIGATION AND DRAINAGE Irrig. and Drain. 62: 510–523 (2013) Published online 29 April 2013 in Wiley Online Library (wileyonlinelibrary.com) DOI: 10.1002/ird.1738 Copyright © 2013 John Wiley & Sons, Ltd.
Transcript of LONG-TERM GROUNDWATER QUALITY AND SALINE INTRUSION ASSESSMENT IN AN IRRIGATED ENVIRONMENT: A CASE...
IRRIGATION AND DRAINAGE
Irrig. and Drain. 62: 510–523 (2013)
Published online 29 April 2013 in Wiley Online Library (wileyonlinelibrary.com) DOI: 10.1002/ird.1738
LONG-TERM GROUNDWATER QUALITY AND SALINE INTRUSION ASSESSMENT INAN IRRIGATED ENVIRONMENT: A CASE STUDY OF THE AQUIFER UNDER THE
LBDC IRRIGATION SYSTEM†
MUHAMMAD BASHARAT1* and ATA-UR-REHMAN TARIQ2
1International Waterlogging and Salinity Research Institute, WAPDA, Lahore, Pakistan2CEWRE, University of Engineering and Technology, Lahore, Pakistan
ABSTRACT
Pakistan’s irrigation system is more than a century old. Due to the increasing population and consequent intensifying agriculture,dependence on groundwater is successively increasing. The underground reservoir that was recharged during the first half of thetwentieth century by the newly built irrigation system with low cropping intensities is now being overexploited. Groundwaterquality is variable, both vertically and horizontally, with the exception of areas adjacent to rivers, where it is fresh. This paperdescribes groundwater quality in the Lower Bari Doab Canal (LBDC) irrigation system based on 47 years of historic water qualitydata (TDS, SAR and RSC). Areas are delineated in the form of zones and depths. The tail end of the command is facing severegroundwater depletion, whereas in certain parts, groundwater quality deterioration with the passage of time has also been detected.Possible reasons and mechanisms of saline intrusion within the aquifer are described. Lateral saline intrusion is not a major issuedue to very slow groundwater movement. But in areas with saline groundwater lying below the upper layer of irrigationleaked fresh water, mobilization of deeper saline water is taking place as a result of pumping by farmers. In addition, results ofthe solute transport model and MODPATH runs were evaluated in support of water quality analysis and groundwater flow rates.Copyright © 2013 John Wiley & Sons, Ltd.
key words: saline intrusion; groundwater quality; conjunctive use; aquifer mining; TDS; MODPATH
Received 11 August 2012; Revised 8 January 2013; Accepted 8 January 2013
RÉSUMÉ
Le système d’irrigation du Pakistan est plus que centenaire. En raison de la croissance démographique et par conséquentl’intensification de l’agriculture, la dépendance des eaux souterraines est grandissante. Le réservoir souterrain qui a été rechargépendant la 1re moitié du 20e siècle par le système d’irrigation nouvellement construit, avec de faibles intensités de culture, estdésormais surexploité. La qualité des eaux souterraines est variable, à la fois verticalement et horizontalement, à l’exception deszones adjacentes aux cours d’eau, où elle est douce. Le document décrit la qualité des eaux souterraines dans le système inférieurdu canal d’irrigation de Bari Doab (LBDC) basée sur 47 années de données historiques de qualité des eaux (TDS, SAR et LRC). Lesystème est délimité en zones d’équiprofondeur de la nappe. La queue de la commande doit faire face à l’épuisement sévère deseaux souterraines, alors que dans certaines régions, la détérioration de la qualité des eaux souterraines a également été détectée.Les raisons possibles et les mécanismes de l’intrusion saline dans l’aquifère sont décrits. L’intrusion latérale d’eau salée n’estpas un problème majeur en raison du mouvement des eaux souterraines très lent. Mais dans les régions où l’eau souterraine salineest surmontée d’une couche d’eau douce provenant des fuites des systèmes d’irrigation, la mobilisation de l’eau saline profonde estobservée à la suite de pompage par les agriculteurs. En outre, les modèles de transport des solutés et le modèle MODPATH ont étéévalués par l’analyse de la qualité de l’eau et des débits d’eau souterraine. Copyright © 2013 John Wiley & Sons, Ltd.
mots clés: intrusion d’eau salée; qualité des eaux souterraines; utilisation conjuguée; exploitation minière d’un aquifère; TDS; MODPATH
* Correspondence to: Muhammad Basharat, IWASRI - WAPDA Muhammad Pura Village, Raiwind Road, Phase-II, WAPDA Town Lahore Punjab 53700Pakistan. E-mail: [email protected]† Qualité des eaux souterraines à long terme et évaluation d’intrusion saline dans un environnement irrigué. Une étude de cas de l’aquifère du systèmed’irrigation du Lower Bari Doab Canal (LBDC), Pakistan.
Copyright © 2013 John Wiley & Sons, Ltd.
511LONG-TERM GROUNDWATER QUALITY AND SALINE INTRUSION ASSESSMENT
INTRODUCTION
Pakistan is an agrarian country where irrigation is used on75% of agricultural land, mainly in the Indus Basin. Like inmany other developing countries in South Asia, agriculturein Pakistan is heavily dependent on groundwater irrigationfor sustainability of current crop production levels. Becausecanal irrigation systems do not provide farmers withadequate water or enough control over irrigation deliveries,a majority of farmers have turned to groundwater as a soleor supplemental source of irrigation. Sale and purchase ofgroundwater through informal water markets offer otherfarmers the opportunity to use groundwater, particularlythose who do not own a private tubewell. ’The factorsaffecting private tubewell development and the emergenceof groundwater markets are complex and interlinked’(PIES, 2001), including physical, economic and socialfactors. The growth in the number of private tubewells hasincreased total water availability for crop production andhas also provided on-demand control over irrigationsupplies at farm level. This increased supplement to canalwater is considered to be at stake due to overdevelopmentand quality deterioration in some of the irrigated areas ofthe Indus Basin; in particular, the Punjab Province is facingunprecedented groundwater depletion rates. The same hasbeen pointed out for the lower part of Bari Doab by Basharatand Ali (2012). Shah (2006) mentioned this as a key challengeby saying ’Sustaining the massive welfare gains, groundwaterdevelopment has created without ruining the resource is akey water challenge facing the world today.’
Increasing groundwater use
The Indus Basin Irrigation System (IBIS) was designed for anannual cropping intensity of about 75% with the intention ofspreading irrigation water over as large an area as possible,in order to expand settlement opportunities (Jurriens andMollinga, 1996). Now, the increasing demand for food, dueto the ever-increasing population, has caused annual croppingintensities to rise from 150 to 180% in different canalcommands. This has been possible only with an increasingcontribution of groundwater to meet additional water require-ments. Large-scale groundwater irrigation, demonstratedunder Salinity Control and Reclamation Projects (SCARPs)in the 1960s, led to a proliferation of private tubewellswith a capacity of about one cusec (cfs) or less built byfarmers in the 1970s, 1980s and onward. Cropping intensitywas 103, 111 and 122% during 1960, 1972 and 1980, respec-tively (Ahmad, 1995). The same now is operating at about170% and even higher in some areas. Hence, groundwatermining, due to higher abstraction rates, as compared to thecorresponding recharge, is well reported in the literature(NESPAK/SGI, 1991; Steenbergen Van and Olienmans,1997; Basharat and Tariq, 2013).
Copyright © 2013 John Wiley & Sons, Ltd.
Groundwater quality deterioration
Groundwater is a valuable resource in the province of Punjabdue to its fresh quality in about 70% of the area. It provides atleast an equivalent quantity of water to agriculture as is suppliedfrom canal water. Groundwater mining, a term often defined aslong-term groundwater level decline caused by sustainedgroundwater pumping, is a key issue associated with ground-water use. Many areas of the IBIS, particularly the Punjabprovince, are experiencing groundwater mining. Associatedwith this mining is the degradation of groundwater quality,however, in only some of the areas. Groundwater qualitydegradation can be from external pollutants to the aquifer orfrom within the aquifer by saltwater intrusion. The intrusioncan be lateral or vertical depending upon the groundwaterquality variation and hydraulic gradient in both directions.Groundwater mining has been a concern in Punjab for manyyears, but increased demands on groundwater resourceshave overstressed aquifers, especially in the Bari Doab, i.e.the area between the Ravi and Sutlej rivers. Generally speak-ing, assessment of groundwater quality on a long-term basisin IBIS is absent. The same has been studied in detail forthe LBDC irrigation system in Punjab, Pakistan.
LBDC irrigation system and the aquifer
The LBDC irrigation system covers a culture-able commandarea (GCA) of 0.80 million hectares (Mha) and out of this,commands gross command area (CCA) of 0.70Mha. The maincanal with a design discharge of 278 m3 s�1 off-takes from theleft bank of the Ravi River at the Balloki Barrage and flows for201 km, supplyingwater to its 65 off-taking channels, as shownin Figure 1. The canal irrigation is managed through fourirrigation divisions, i.e. Balloki, Okara, Sahiwal and Khanewal.Agriculture in the area is sustained through surface watersupplies from the Balloki Barrage and pumped groundwaterfrom the underlying unconfined aquifer. The canal watersupply is less costly, as well as the most important and depend-able prime water source, both for crop water requirements andgroundwater recharge, with recent average annual (2001–2011)deliveries of about 4900 million cubic metres (MCM) at thecanal head (Basharat, 2012a). However, the sustainability ofthis increased food security is most importantly linked to thesustainability of the groundwater reservoir.
The alluvial sediments that comprise the aquifer exhibitconsiderable heterogeneity both laterally and vertically.Despite this, the broad view is that the aquifer behavesas a single contiguous, unconfined aquifer. Study of thelithological logs of test holes (180–300 m deep) and testtubewells (30–110 m deep) indicates that Bari Doab consistsof consolidated sand, silt and silty clay, with variable amountsof kankers. Re-evaluation of the original data (WAPDA,1980) and geological sections (Unites States Department of
Irrig. and Drain. 62: 510–523 (2013)
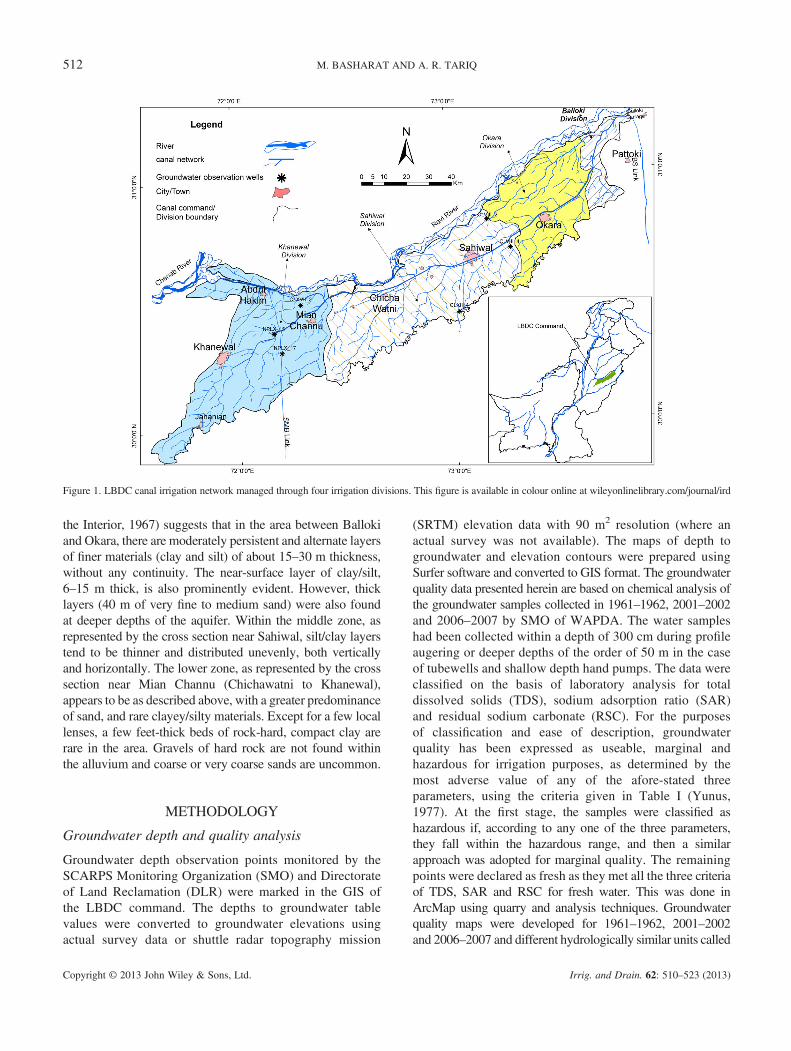
Figure 1. LBDC canal irrigation network managed through four irrigation divisions. This figure is available in colour online at wileyonlinelibrary.com/journal/ird
512 M. BASHARAT AND A. R. TARIQ
the Interior, 1967) suggests that in the area between Ballokiand Okara, there are moderately persistent and alternate layersof finer materials (clay and silt) of about 15–30 m thickness,without any continuity. The near-surface layer of clay/silt,6–15 m thick, is also prominently evident. However, thicklayers (40 m of very fine to medium sand) were also foundat deeper depths of the aquifer. Within the middle zone, asrepresented by the cross section near Sahiwal, silt/clay layerstend to be thinner and distributed unevenly, both verticallyand horizontally. The lower zone, as represented by the crosssection near Mian Channu (Chichawatni to Khanewal),appears to be as described above, with a greater predominanceof sand, and rare clayey/silty materials. Except for a few locallenses, a few feet-thick beds of rock-hard, compact clay arerare in the area. Gravels of hard rock are not found withinthe alluvium and coarse or very coarse sands are uncommon.
METHODOLOGY
Groundwater depth and quality analysis
Groundwater depth observation points monitored by theSCARPS Monitoring Organization (SMO) and Directorateof Land Reclamation (DLR) were marked in the GIS ofthe LBDC command. The depths to groundwater tablevalues were converted to groundwater elevations usingactual survey data or shuttle radar topography mission
Copyright © 2013 John Wiley & Sons, Ltd.
(SRTM) elevation data with 90 m2 resolution (where anactual survey was not available). The maps of depth togroundwater and elevation contours were prepared usingSurfer software and converted to GIS format. The groundwaterquality data presented herein are based on chemical analysis ofthe groundwater samples collected in 1961–1962, 2001–2002and 2006–2007 by SMO of WAPDA. The water sampleshad been collected within a depth of 300 cm during profileaugering or deeper depths of the order of 50 m in the caseof tubewells and shallow depth hand pumps. The data wereclassified on the basis of laboratory analysis for totaldissolved solids (TDS), sodium adsorption ratio (SAR)and residual sodium carbonate (RSC). For the purposesof classification and ease of description, groundwaterquality has been expressed as useable, marginal andhazardous for irrigation purposes, as determined by themost adverse value of any of the afore-stated threeparameters, using the criteria given in Table I (Yunus,1977). At the first stage, the samples were classified ashazardous if, according to any one of the three parameters,they fall within the hazardous range, and then a similarapproach was adopted for marginal quality. The remainingpoints were declared as fresh as they met all the three criteriaof TDS, SAR and RSC for fresh water. This was done inArcMap using quarry and analysis techniques. Groundwaterquality maps were developed for 1961–1962, 2001–2002and 2006–2007 and different hydrologically similar units called
Irrig. and Drain. 62: 510–523 (2013)
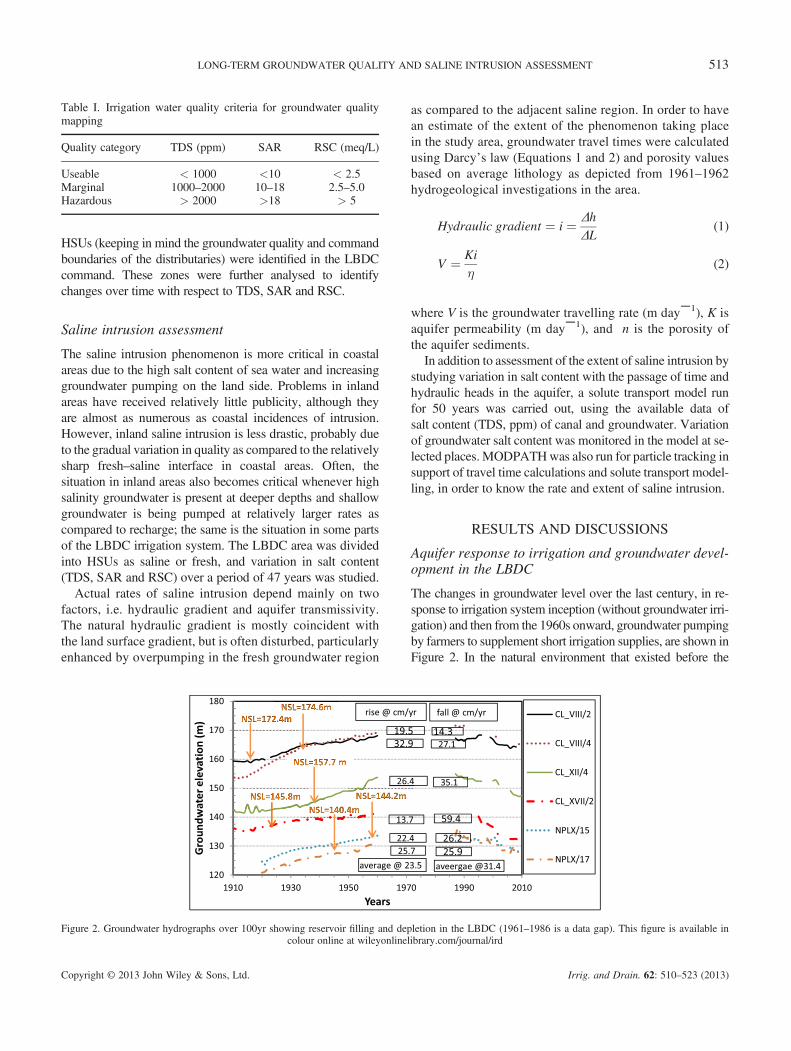
Table I. Irrigation water quality criteria for groundwater qualitymapping
Quality category TDS (ppm) SAR RSC (meq/L)
Useable < 1000 <10 < 2.5Marginal 1000–2000 10–18 2.5–5.0Hazardous > 2000 >18 > 5
513LONG-TERM GROUNDWATER QUALITY AND SALINE INTRUSION ASSESSMENT
HSUs (keeping in mind the groundwater quality and commandboundaries of the distributaries) were identified in the LBDCcommand. These zones were further analysed to identifychanges over time with respect to TDS, SAR and RSC.
Saline intrusion assessment
The saline intrusion phenomenon is more critical in coastalareas due to the high salt content of sea water and increasinggroundwater pumping on the land side. Problems in inlandareas have received relatively little publicity, although theyare almost as numerous as coastal incidences of intrusion.However, inland saline intrusion is less drastic, probably dueto the gradual variation in quality as compared to the relativelysharp fresh–saline interface in coastal areas. Often, thesituation in inland areas also becomes critical whenever highsalinity groundwater is present at deeper depths and shallowgroundwater is being pumped at relatively larger rates ascompared to recharge; the same is the situation in some partsof the LBDC irrigation system. The LBDC area was dividedinto HSUs as saline or fresh, and variation in salt content(TDS, SAR and RSC) over a period of 47 years was studied.
Actual rates of saline intrusion depend mainly on twofactors, i.e. hydraulic gradient and aquifer transmissivity.The natural hydraulic gradient is mostly coincident withthe land surface gradient, but is often disturbed, particularlyenhanced by overpumping in the fresh groundwater region
Figure 2. Groundwater hydrographs over 100yr showing reservoir filling and depcolour online at wileyonline
Copyright © 2013 John Wiley & Sons, Ltd.
as compared to the adjacent saline region. In order to havean estimate of the extent of the phenomenon taking placein the study area, groundwater travel times were calculatedusing Darcy’s law (Equations 1 and 2) and porosity valuesbased on average lithology as depicted from 1961–1962hydrogeological investigations in the area.
letionlibrary
Hydraulic gradient ¼ i ¼ ΔhΔL
(1)
V ¼ Ki
�(2)
where V is the groundwater travelling rate (m day‾1), K isaquifer permeability (m day‾1), and n is the porosity ofthe aquifer sediments.
In addition to assessment of the extent of saline intrusion bystudying variation in salt content with the passage of time andhydraulic heads in the aquifer, a solute transport model runfor 50 years was carried out, using the available data ofsalt content (TDS, ppm) of canal and groundwater. Variationof groundwater salt content was monitored in the model at se-lected places.MODPATHwas also run for particle tracking insupport of travel time calculations and solute transport model-ling, in order to know the rate and extent of saline intrusion.
RESULTS AND DISCUSSIONS
Aquifer response to irrigation and groundwater devel-opment in the LBDC
The changes in groundwater level over the last century, in re-sponse to irrigation system inception (without groundwater irri-gation) and then from the 1960s onward, groundwater pumpingby farmers to supplement short irrigation supplies, are shown inFigure 2. In the natural environment that existed before the
in the LBDC (1961–1986 is a data gap). This figure is available in.com/journal/ird
Irrig. and Drain. 62: 510–523 (2013)
514 M. BASHARAT AND A. R. TARIQ
inception of perennial canal irrigation, the groundwater hydrau-lic system was in a state of dynamic equilibrium, i.e. there wasno long-term rise or decline of the groundwater table. However,the groundwater adjacent to the rivers was at a higher level ascompared to that in the middle of the Doabs, due to riverseepage. However, after the inception of the irrigation system,the recharge pattern totally changed; more or less, it becameuniform in the lateral direction from the rivers. The groundwa-ter levels in the aquifer had risen much with the passage of timein response to spreading of irrigation supplies starting in 1912with a relatively low cropping intensity of about 67%.Peak crop water demand is about 8 mm day�1 at the farmhead (30 years normal ETo by Pakistan MeteorologicalDepartment, 2006), indicating a net peak flow requirement ofabout 1 litre per second per hectare (lps ha�1). The canal flowof 0.23 lps ha�1 (3.3 cfs per 1000 acres) at the watercoursehead, for a present cropping intensity of about 160%, cannotmeet peak demand, leading to complementary tubewellirrigation which started in the 1960s and gradually intensifiedwith the passage of time.
There has been an exponential growth of tubewells withinthe last four decades in the LBDC irrigation system. The
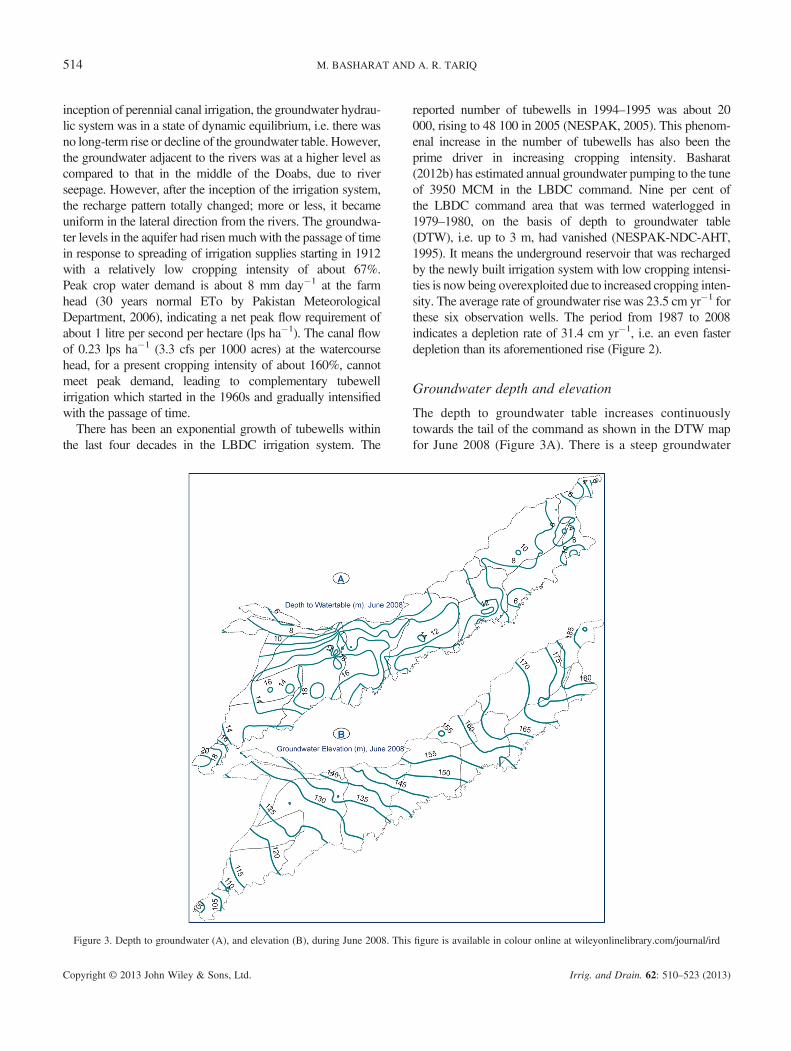
Figure 3. Depth to groundwater (A), and elevation (B), during June 2008. This
Copyright © 2013 John Wiley & Sons, Ltd.
reported number of tubewells in 1994–1995 was about 20000, rising to 48 100 in 2005 (NESPAK, 2005). This phenom-enal increase in the number of tubewells has also been theprime driver in increasing cropping intensity. Basharat(2012b) has estimated annual groundwater pumping to the tuneof 3950 MCM in the LBDC command. Nine per cent ofthe LBDC command area that was termed waterlogged in1979–1980, on the basis of depth to groundwater table(DTW), i.e. up to 3 m, had vanished (NESPAK-NDC-AHT,1995). It means the underground reservoir that was rechargedby the newly built irrigation system with low cropping intensi-ties is now being overexploited due to increased cropping inten-sity. The average rate of groundwater rise was 23.5 cm yr�1 forthese six observation wells. The period from 1987 to 2008indicates a depletion rate of 31.4 cm yr�1, i.e. an even fasterdepletion than its aforementioned rise (Figure 2).
Groundwater depth and elevation
The depth to groundwater table increases continuouslytowards the tail of the command as shown in the DTW mapfor June 2008 (Figure 3A). There is a steep groundwater
figure is available in colour online at wileyonlinelibrary.com/journal/ird
Irrig. and Drain. 62: 510–523 (2013)
515LONG-TERM GROUNDWATER QUALITY AND SALINE INTRUSION ASSESSMENT
gradient (1 in 3060, as shown in Figure 3B) as compared tothe natural ground slope (1 in 3715) in the downstreamdirection of the LBDC irrigation system. Basharat (2012b)analysed groundwater depletion and its variation over the irri-gation command. On average, for the Sahiwal and Khanewaldivisions of the LBDC command, the rate of groundwaterdepletion was 0.36 m yr�1 for the period from 1987 to 2008.The volume of groundwater depleted in these two irrigationdivisions (GCA 0.599 Mha) for the above period, using 25%specific yield, was 11 300MCM (9.17MAF), whereas ground-water levels are stable in both the Balloki and Okara divisionswithout any notable depletion.
According to Basharat and Tariq (2013), spatial climatevariability within the irrigation system in the Indus Basin hascreated differential variations in rainfall and as a result, inirrigation water demand. For the LBDC irrigation system, theyconcluded that annual normal rainfall decreases towards the tail(212 mm) as compared to the head (472 mm). Increasinggroundwater depletion rate towards the tail end of the commandwas attributed to decreasing recharge to groundwater in thedownstream direction of the LBDC system, as a result ofdecreasing rainfall in this direction. The current situation ofgroundwater depletion in tail reaches of the LBDC (Khanewaldivision) indicates that water demand exceeds supply. Thisdeficit is currently being met by overexploitation/mining ofgroundwater resources, resulting mainly in unprecedenteddropping of groundwater levels. The situation is almost similarin the Sahiwal division but less severe due to the groundwatertable depth being comparatively shallower by about 5 m, ascompared to the Khanewal division.
Groundwater quality
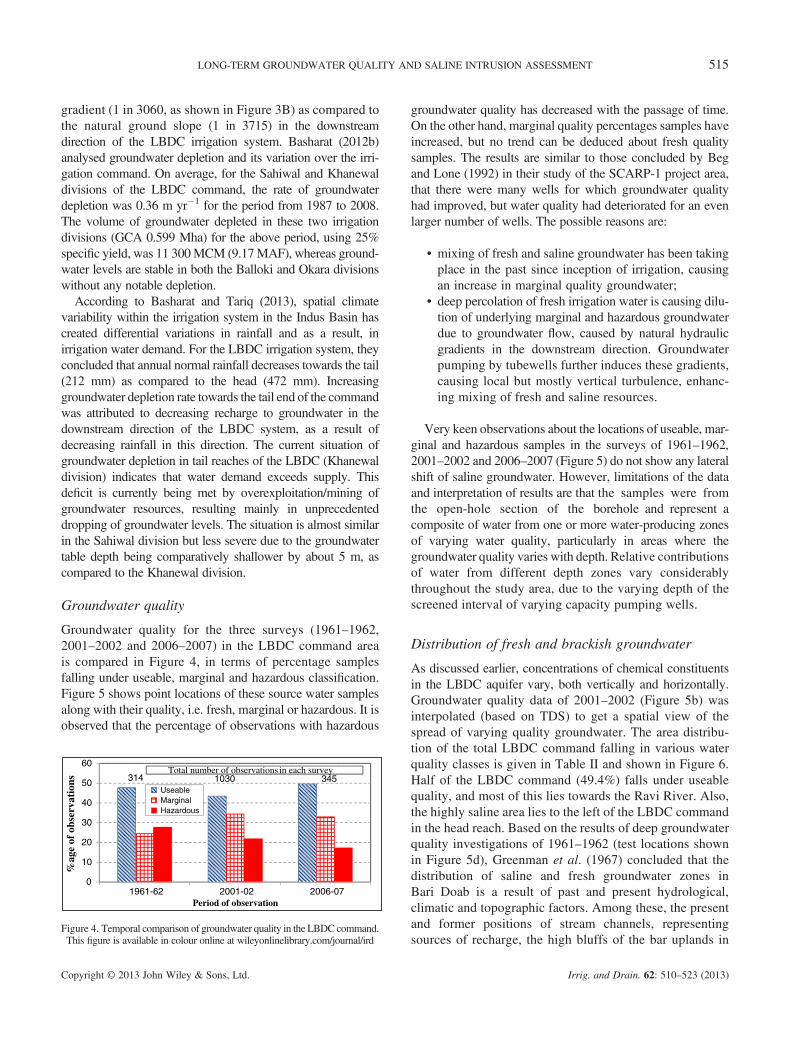
Groundwater quality for the three surveys (1961–1962,2001–2002 and 2006–2007) in the LBDC command areais compared in Figure 4, in terms of percentage samplesfalling under useable, marginal and hazardous classification.Figure 5 shows point locations of these source water samplesalong with their quality, i.e. fresh, marginal or hazardous. It isobserved that the percentage of observations with hazardous
314 1030 345
0
10
20
30
40
50
60
1961-62 2001-02 2006-07
%ag
e of
obs
erva
tion
s
Period of observation
UseableMarginalHazardous
Total number of observations in each survey
Figure 4. Temporal comparison of groundwater quality in the LBDC command.This figure is available in colour online at wileyonlinelibrary.com/journal/ird
Copyright © 2013 John Wiley & Sons, Ltd.
groundwater quality has decreased with the passage of time.On the other hand, marginal quality percentages samples haveincreased, but no trend can be deduced about fresh qualitysamples. The results are similar to those concluded by Begand Lone (1992) in their study of the SCARP-1 project area,that there were many wells for which groundwater qualityhad improved, but water quality had deteriorated for an evenlarger number of wells. The possible reasons are:
• mixing of fresh and saline groundwater has been takingplace in the past since inception of irrigation, causingan increase in marginal quality groundwater;
• deep percolation of fresh irrigation water is causing dilu-tion of underlying marginal and hazardous groundwaterdue to groundwater flow, caused by natural hydraulicgradients in the downstream direction. Groundwaterpumping by tubewells further induces these gradients,causing local but mostly vertical turbulence, enhanc-ing mixing of fresh and saline resources.
Very keen observations about the locations of useable, mar-ginal and hazardous samples in the surveys of 1961–1962,2001–2002 and 2006–2007 (Figure 5) do not show any lateralshift of saline groundwater. However, limitations of the dataand interpretation of results are that the samples were fromthe open-hole section of the borehole and represent acomposite of water from one or more water-producing zonesof varying water quality, particularly in areas where thegroundwater quality varies with depth. Relative contributionsof water from different depth zones vary considerablythroughout the study area, due to the varying depth of thescreened interval of varying capacity pumping wells.
Distribution of fresh and brackish groundwater
As discussed earlier, concentrations of chemical constituentsin the LBDC aquifer vary, both vertically and horizontally.Groundwater quality data of 2001–2002 (Figure 5b) wasinterpolated (based on TDS) to get a spatial view of thespread of varying quality groundwater. The area distribu-tion of the total LBDC command falling in various waterquality classes is given in Table II and shown in Figure 6.Half of the LBDC command (49.4%) falls under useablequality, and most of this lies towards the Ravi River. Also,the highly saline area lies to the left of the LBDC commandin the head reach. Based on the results of deep groundwaterquality investigations of 1961–1962 (test locations shownin Figure 5d), Greenman et al. (1967) concluded that thedistribution of saline and fresh groundwater zones inBari Doab is a result of past and present hydrological,climatic and topographic factors. Among these, the presentand former positions of stream channels, representingsources of recharge, the high bluffs of the bar uplands in
Irrig. and Drain. 62: 510–523 (2013)
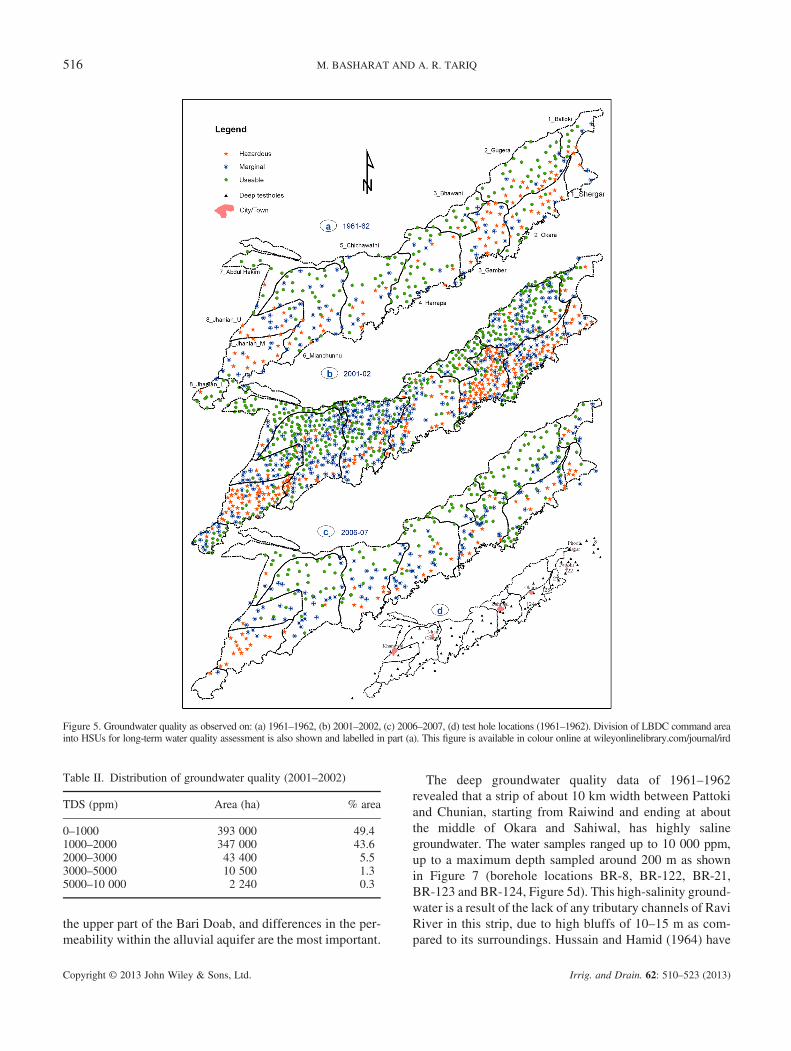
Figure 5. Groundwater quality as observed on: (a) 1961–1962, (b) 2001–2002, (c) 2006–2007, (d) test hole locations (1961–1962). Division of LBDC command areainto HSUs for long-term water quality assessment is also shown and labelled in part (a). This figure is available in colour online at wileyonlinelibrary.com/journal/ird
Table II. Distribution of groundwater quality (2001–2002)
TDS (ppm) Area (ha) % area
0–1000 393 000 49.41000–2000 347 000 43.62000–3000 43 400 5.53000–5000 10 500 1.35000–10 000 2 240 0.3
516 M. BASHARAT AND A. R. TARIQ
the upper part of the Bari Doab, and differences in the per-meability within the alluvial aquifer are the most important.
Copyright © 2013 John Wiley & Sons, Ltd.
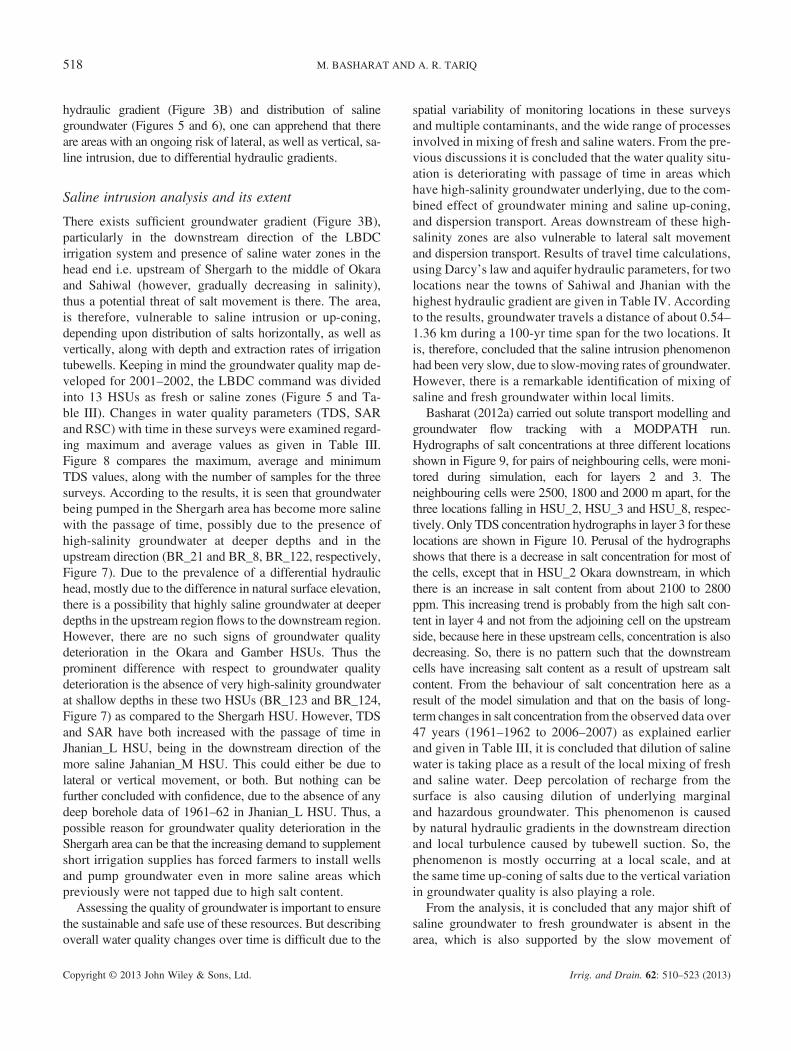
The deep groundwater quality data of 1961–1962revealed that a strip of about 10 km width between Pattokiand Chunian, starting from Raiwind and ending at aboutthe middle of Okara and Sahiwal, has highly salinegroundwater. The water samples ranged up to 10 000 ppm,up to a maximum depth sampled around 200 m as shownin Figure 7 (borehole locations BR-8, BR-122, BR-21,BR-123 and BR-124, Figure 5d). This high-salinity ground-water is a result of the lack of any tributary channels of RaviRiver in this strip, due to high bluffs of 10–15 m as com-pared to its surroundings. Hussain and Hamid (1964) have
Irrig. and Drain. 62: 510–523 (2013)
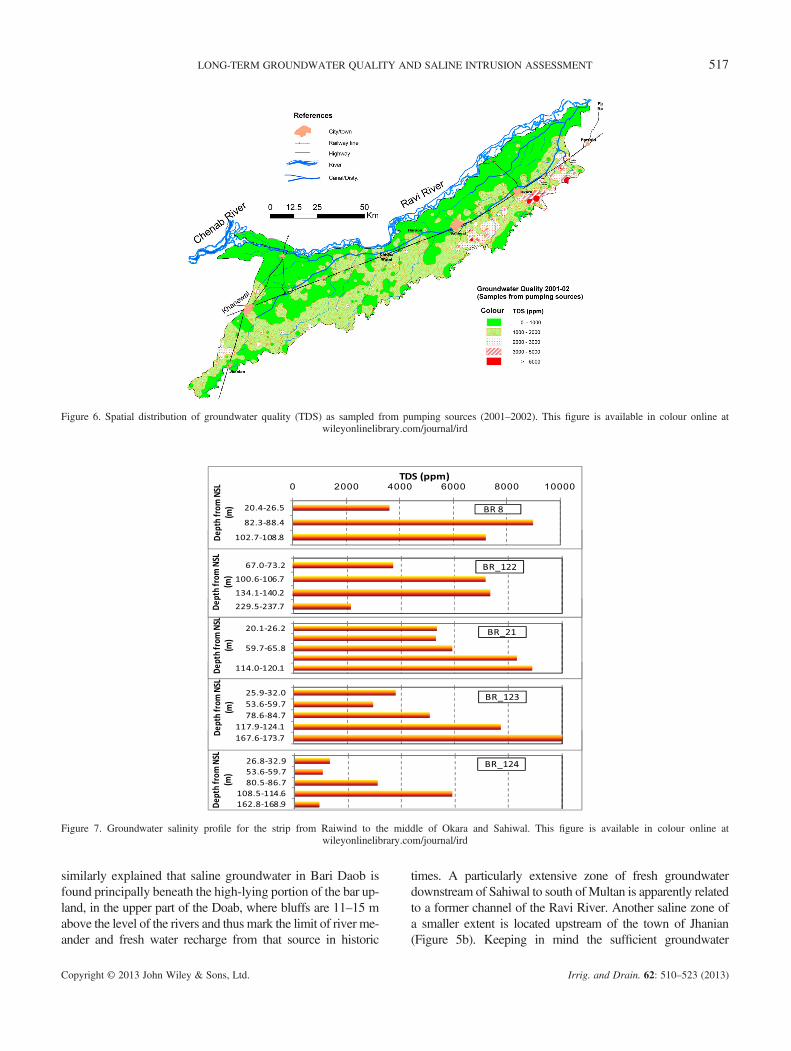
Figure 6. Spatial distribution of groundwater quality (TDS) as sampled from pumping sources (2001–2002). This figure is available in colour online atwileyonlinelibrary.com/journal/ird
Figure 7. Groundwater salinity profile for the strip from Raiwind to the middle of Okara and Sahiwal. This figure is available in colour online atwileyonlinelibrary.com/journal/ird
517LONG-TERM GROUNDWATER QUALITY AND SALINE INTRUSION ASSESSMENT
similarly explained that saline groundwater in Bari Daob isfound principally beneath the high-lying portion of the bar up-land, in the upper part of the Doab, where bluffs are 11–15 mabove the level of the rivers and thus mark the limit of river me-ander and fresh water recharge from that source in historic
Copyright © 2013 John Wiley & Sons, Ltd.
times. A particularly extensive zone of fresh groundwaterdownstream of Sahiwal to south of Multan is apparently relatedto a former channel of the Ravi River. Another saline zone ofa smaller extent is located upstream of the town of Jhanian(Figure 5b). Keeping in mind the sufficient groundwater
Irrig. and Drain. 62: 510–523 (2013)
518 M. BASHARAT AND A. R. TARIQ
hydraulic gradient (Figure 3B) and distribution of salinegroundwater (Figures 5 and 6), one can apprehend that thereare areas with an ongoing risk of lateral, as well as vertical, sa-line intrusion, due to differential hydraulic gradients.
Saline intrusion analysis and its extent
There exists sufficient groundwater gradient (Figure 3B),particularly in the downstream direction of the LBDCirrigation system and presence of saline water zones in thehead end i.e. upstream of Shergarh to the middle of Okaraand Sahiwal (however, gradually decreasing in salinity),thus a potential threat of salt movement is there. The area,is therefore, vulnerable to saline intrusion or up-coning,depending upon distribution of salts horizontally, as well asvertically, along with depth and extraction rates of irrigationtubewells. Keeping in mind the groundwater quality map de-veloped for 2001–2002, the LBDC command was dividedinto 13 HSUs as fresh or saline zones (Figure 5 and Ta-ble III). Changes in water quality parameters (TDS, SARand RSC) with time in these surveys were examined regard-ing maximum and average values as given in Table III.Figure 8 compares the maximum, average and minimumTDS values, along with the number of samples for the threesurveys. According to the results, it is seen that groundwaterbeing pumped in the Shergarh area has become more salinewith the passage of time, possibly due to the presence ofhigh-salinity groundwater at deeper depths and in theupstream direction (BR_21 and BR_8, BR_122, respectively,Figure 7). Due to the prevalence of a differential hydraulichead, mostly due to the difference in natural surface elevation,there is a possibility that highly saline groundwater at deeperdepths in the upstream region flows to the downstream region.However, there are no such signs of groundwater qualitydeterioration in the Okara and Gamber HSUs. Thus theprominent difference with respect to groundwater qualitydeterioration is the absence of very high-salinity groundwaterat shallow depths in these two HSUs (BR_123 and BR_124,Figure 7) as compared to the Shergarh HSU. However, TDSand SAR have both increased with the passage of time inJhanian_L HSU, being in the downstream direction of themore saline Jahanian_M HSU. This could either be due tolateral or vertical movement, or both. But nothing can befurther concluded with confidence, due to the absence of anydeep borehole data of 1961–62 in Jhanian_L HSU. Thus, apossible reason for groundwater quality deterioration in theShergarh area can be that the increasing demand to supplementshort irrigation supplies has forced farmers to install wellsand pump groundwater even in more saline areas whichpreviously were not tapped due to high salt content.
Assessing the quality of groundwater is important to ensurethe sustainable and safe use of these resources. But describingoverall water quality changes over time is difficult due to the
Copyright © 2013 John Wiley & Sons, Ltd.
spatial variability of monitoring locations in these surveysand multiple contaminants, and the wide range of processesinvolved in mixing of fresh and saline waters. From the pre-vious discussions it is concluded that the water quality situ-ation is deteriorating with passage of time in areas whichhave high-salinity groundwater underlying, due to the com-bined effect of groundwater mining and saline up-coning,and dispersion transport. Areas downstream of these high-salinity zones are also vulnerable to lateral salt movementand dispersion transport. Results of travel time calculations,using Darcy’s law and aquifer hydraulic parameters, for twolocations near the towns of Sahiwal and Jhanian with thehighest hydraulic gradient are given in Table IV. Accordingto the results, groundwater travels a distance of about 0.54–1.36 km during a 100-yr time span for the two locations. Itis, therefore, concluded that the saline intrusion phenomenonhad been very slow, due to slow-moving rates of groundwater.However, there is a remarkable identification of mixing ofsaline and fresh groundwater within local limits.
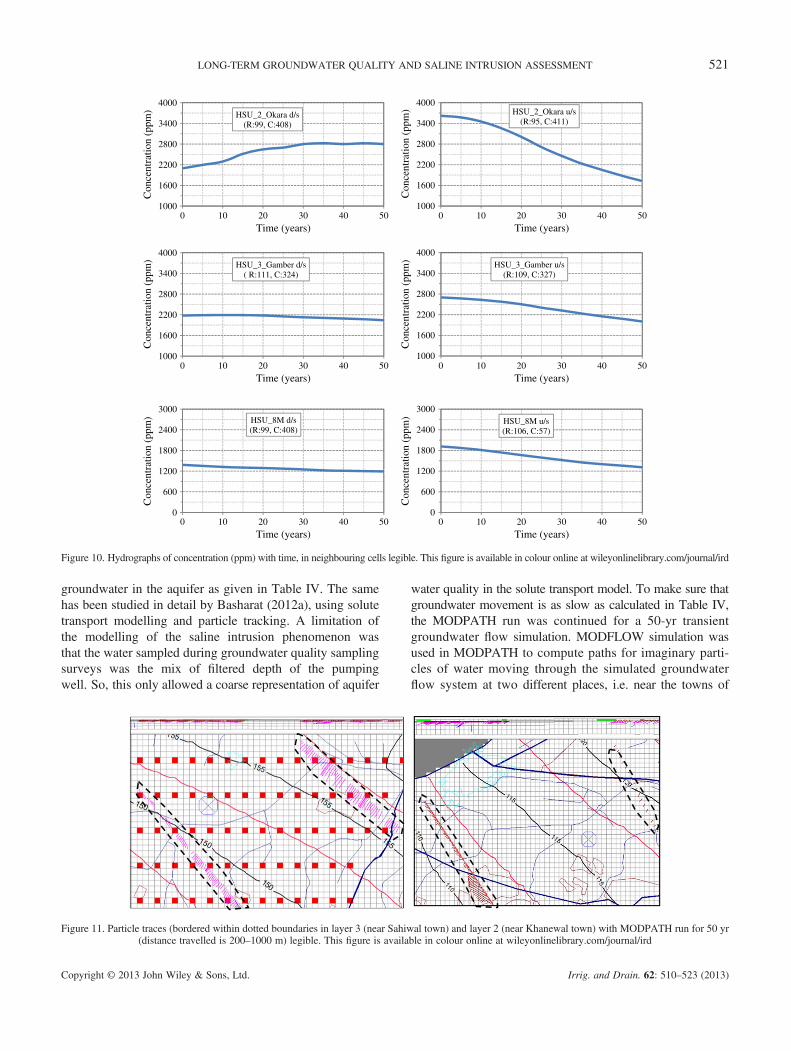
Basharat (2012a) carried out solute transport modelling andgroundwater flow tracking with a MODPATH run.Hydrographs of salt concentrations at three different locationsshown in Figure 9, for pairs of neighbouring cells, were moni-tored during simulation, each for layers 2 and 3. Theneighbouring cells were 2500, 1800 and 2000 m apart, for thethree locations falling in HSU_2, HSU_3 and HSU_8, respec-tively. Only TDS concentration hydrographs in layer 3 for theselocations are shown in Figure 10. Perusal of the hydrographsshows that there is a decrease in salt concentration for most ofthe cells, except that in HSU_2 Okara downstream, in whichthere is an increase in salt content from about 2100 to 2800ppm. This increasing trend is probably from the high salt con-tent in layer 4 and not from the adjoining cell on the upstreamside, because here in these upstream cells, concentration is alsodecreasing. So, there is no pattern such that the downstreamcells have increasing salt content as a result of upstream saltcontent. From the behaviour of salt concentration here as aresult of the model simulation and that on the basis of long-term changes in salt concentration from the observed data over47 years (1961–1962 to 2006–2007) as explained earlierand given in Table III, it is concluded that dilution of salinewater is taking place as a result of the local mixing of freshand saline water. Deep percolation of recharge from thesurface is also causing dilution of underlying marginaland hazardous groundwater. This phenomenon is causedby natural hydraulic gradients in the downstream directionand local turbulence caused by tubewell suction. So, thephenomenon is mostly occurring at a local scale, and atthe same time up-coning of salts due to the vertical variationin groundwater quality is also playing a role.
From the analysis, it is concluded that any major shift ofsaline groundwater to fresh groundwater is absent in thearea, which is also supported by the slow movement of
Irrig. and Drain. 62: 510–523 (2013)

Table
III.
Groundw
ater
quality
andlevelchangesin
theLBDCcommand(for
water
quality
:maxim
umvaluewith
outbracketsandaveragevalues
with
inbrackets)
HSU
1961–1
962
2001–2002
2006–2007
Groundw
ater
quality
Water
level(m
)
No.
ofobs.
TDS
(ppm
)SAR
RSC
(meq/l)
No.
ofobs.
TDS
(ppm
)SAR
RSC
(meq/l)
No.
ofobs.
TDS
(ppm
)SAR
RSC
(meq/l)
Average
present
condition
Tem
poral
change
Rise
(1913–1960)
Depletio
n(1960–2008)
1_Balloki
122890
(786)
28(6.85)
8.83
(2.6)
182118
(845)
29.3
(6.2)
12.5
(1.9)
142080
(1020)
17 (6.5)
4.0(1.1)
Useable
Nochange
3–6
0–1
1_Shergarh
41656
(1186)
19(13.3)
7.35
(5.7)
138282
(2262)
269.1
(20.7)
14.8
(6.1)
712420
(4680)
54.8
(23.7)
6.6(1.04)
Hazardous
Deterioratin
g9–12
0–1
2_Gugera
552970
(930)
25(5.64)
24.5
(2.2)
135
2662
(1052)
40.5
(5.5)
13.3
(2.0)
521472
(722)
9.7
(3.5)
3.2(0.35)
Useable
Improving
6–15
1–2
2_Okara
255840
(1558)
68(12.5)
10.2
(1.9)
918621
(1800)
92.2
(14.1)
20.7
(2.5)
356365
(1415)
45.5
(8.6)
6.2(0.9)
Marginal
Nochange
9–15
0–2
3_Bhawani
162760
(788)
30(4.79)
18.9
(2.0)
372061
(746)
12.0
(4.1)
3.3
(0.5)
151280
(589)
7.9
(2.7)
1.2(0.2)
Useable
Improving
6–12
4–5
3_Gam
ber
304790
(1824)
38(14.2)
21.8
(5.3)
108
8448
(1653)
68(15.5)
17.2
(4.2)
414488
(1149)
32.7
(7.8)
16.2
(2.1)
Marginal
Bitim
proved
9–15
2–3
4_Harrapa
442760
(906)
29(6.48)
18.9
(1.8)
792739
(1099)
31.5
(9.6)
12.7
(2.6)
422047
(918)
37.8
(8.3)
14.9
(2.3)
Useable
Nomajor
change
6–12
3–4
5_Chichaw
atni
524025
(953)
20(5.99)
15.4
(2.5)
141
3040
(1105)
39.6
(7.6)
13.3
(1.2)
362827
(1102)
26.6
(8.4)
8.4(1.2)
Useable
toMarginal
Nochange
6–9
1–4
6_Mianchunn
u66
2980
(949)
26(6.87)
10.1
(2.2)
161
2752
(993)
29.5
(6.3)
11.4
(1.2)
465585
(952)
24 (6.7)
8.3(1.6)
Useable
Nochange
6–9
1–5
7_Abdul
Hakim
111250
(525)
21 (3.9)
8.5
(1.1)
472848
(641)
8.08
(3.04)
3.2
(0.7)
91248
(645)
11.6
(3.7)
5.4(0.6)
Useable
Nochange
6–8
1–2
8_Jahanian_U
181900
(1016)
24(10.6)
10.8
(4.2)
522093
(951)
19.6
(6.8)
8.0
(2.2)
1513082
(872)
13.4
(8.2)
6.7(3.1)
Useable
Nochange
93
8_Jahanian_M
215528
(1790)
33(15.4)
18.3
(6.1)
773264
(1296)
36(12.3)
14.7
(5.2)
172600
(1535)
29.4
(16.8)
12.9
(5.9)
Marginal
Nochange
93–
8
8_Jahanian_L
121784
(808)
35.3
(8.6)
11.6
(1.4)
252419
(1089)
16.6
(5.3)
6.6
(0.7)
23087
(2343)
14.3
(13.4)
1.9(0.9)
Marginal
TDS,S
AR
increased
98
519LONG-TERM GROUNDWATER QUALITY AND SALINE INTRUSION ASSESSMENT
Copyright © 2013 John Wiley & Sons, Ltd. Irrig. and Drain. 62: 510–523 (2013)
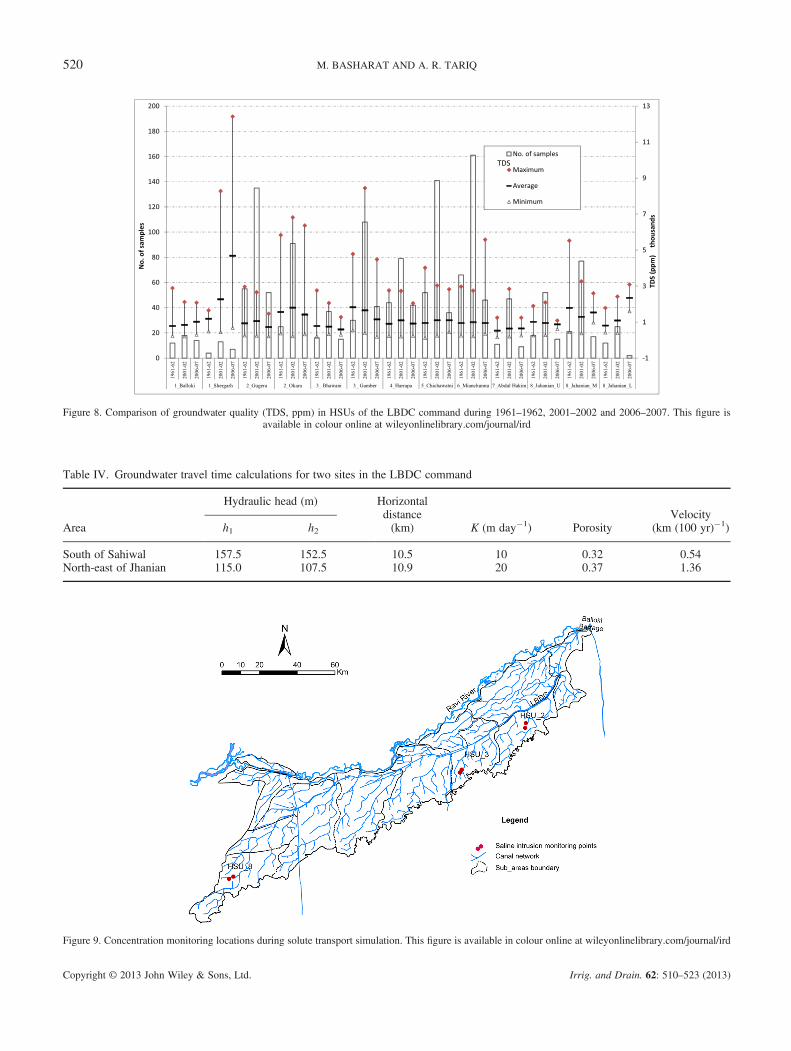
Figure 9. Concentration monitoring locations during solute transport simulation. This figure is available in colour online at wileyonlinelibrary.com/journal/ird
Table IV. Groundwater travel time calculations for two sites in the LBDC command
Area
Hydraulic head (m) Horizontaldistance(km) K (m day�1) Porosity
Velocity(km (100 yr)�1)h1 h2
South of Sahiwal 157.5 152.5 10.5 10 0.32 0.54North-east of Jhanian 115.0 107.5 10.9 20 0.37 1.36
Figure 8. Comparison of groundwater quality (TDS, ppm) in HSUs of the LBDC command during 1961–1962, 2001–2002 and 2006–2007. This figure isavailable in colour online at wileyonlinelibrary.com/journal/ird
520 M. BASHARAT AND A. R. TARIQ
Copyright © 2013 John Wiley & Sons, Ltd. Irrig. and Drain. 62: 510–523 (2013)
1000
1600
2200
2800
3400
4000
Con
cent
ratio
n (p
pm)
Time (years)
HSU_2_Okara d/s(R:99, C:408)
1000
1600
2200
2800
3400
4000
Con
cent
ratio
n (p
pm) HSU_2_Okara u/s
(R:95, C:411)
1000
1600
2200
2800
3400
4000
Con
cent
ratio
n (p
pm) HSU_3_Gamber d/s
( R:111, C:324)
1000
1600
2200
2800
3400
4000
Con
cent
ratio
n (p
pm) HSU_3_Gamber u/s
(R:109, C:327)
0
600
1200
1800
2400
3000
Con
cent
ratio
n (p
pm) HSU_8M d/s
(R:99, C:408)
0
600
1200
1800
2400
3000
0 10 20 30 40 50
Time (years)0 10 20 30 40 50
Time (years)0 10 20 30 40 50
Time (years)0 10 20 30 40 50
Time (years)0 10 20 30 40 50
Time (years)0 10 20 30 40 50
Con
cent
ratio
n (p
pm) HSU_8M u/s
(R:106, C:57)
Figure 10. Hydrographs of concentration (ppm) with time, in neighbouring cells legible. This figure is available in colour online at wileyonlinelibrary.com/journal/ird
521LONG-TERM GROUNDWATER QUALITY AND SALINE INTRUSION ASSESSMENT
groundwater in the aquifer as given in Table IV. The samehas been studied in detail by Basharat (2012a), using solutetransport modelling and particle tracking. A limitation ofthe modelling of the saline intrusion phenomenon wasthat the water sampled during groundwater quality samplingsurveys was the mix of filtered depth of the pumpingwell. So, this only allowed a coarse representation of aquifer
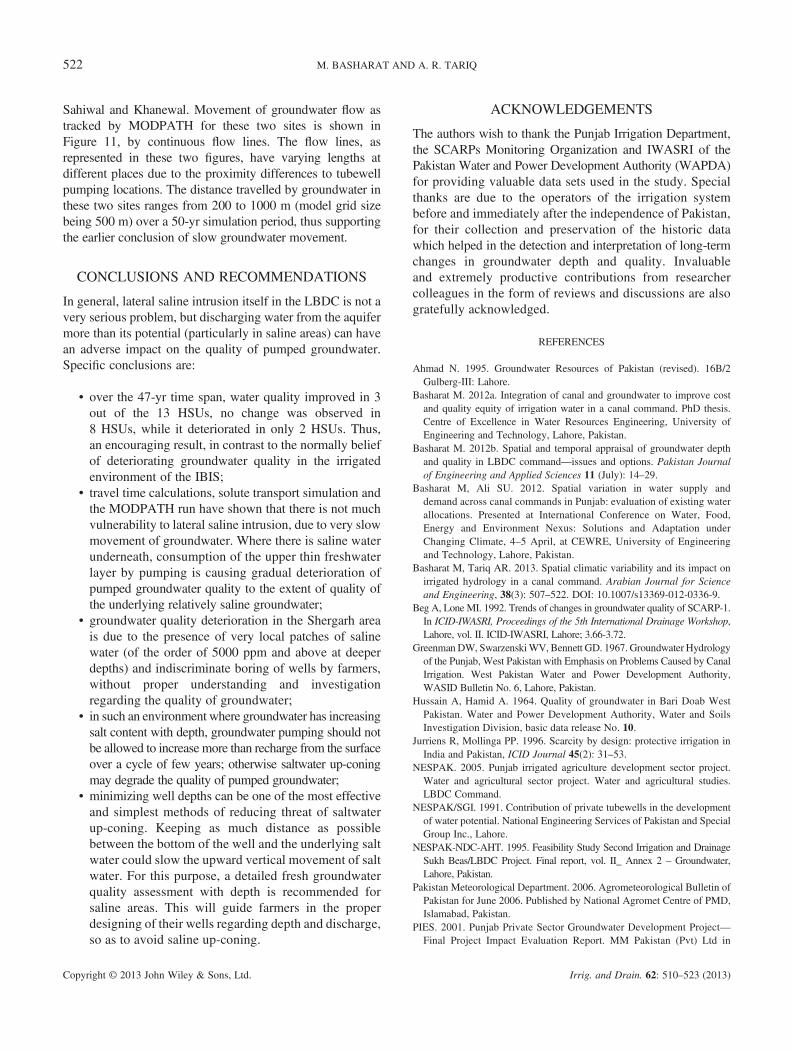
Figure 11. Particle traces (bordered within dotted boundaries in layer 3 (near Sahiw(distance travelled is 200–1000 m) legible. This figure is availa
Copyright © 2013 John Wiley & Sons, Ltd.
water quality in the solute transport model. To make sure thatgroundwater movement is as slow as calculated in Table IV,the MODPATH run was continued for a 50-yr transientgroundwater flow simulation. MODFLOW simulation wasused in MODPATH to compute paths for imaginary parti-cles of water moving through the simulated groundwaterflow system at two different places, i.e. near the towns of
al town) and layer 2 (near Khanewal town) with MODPATH run for 50 yrble in colour online at wileyonlinelibrary.com/journal/ird
Irrig. and Drain. 62: 510–523 (2013)
522 M. BASHARAT AND A. R. TARIQ
Sahiwal and Khanewal. Movement of groundwater flow astracked by MODPATH for these two sites is shown inFigure 11, by continuous flow lines. The flow lines, asrepresented in these two figures, have varying lengths atdifferent places due to the proximity differences to tubewellpumping locations. The distance travelled by groundwater inthese two sites ranges from 200 to 1000 m (model grid sizebeing 500 m) over a 50-yr simulation period, thus supportingthe earlier conclusion of slow groundwater movement.
CONCLUSIONS AND RECOMMENDATIONS
In general, lateral saline intrusion itself in the LBDC is not avery serious problem, but discharging water from the aquifermore than its potential (particularly in saline areas) can havean adverse impact on the quality of pumped groundwater.Specific conclusions are:
• over the 47-yr time span, water quality improved in 3out of the 13 HSUs, no change was observed in8 HSUs, while it deteriorated in only 2 HSUs. Thus,an encouraging result, in contrast to the normally beliefof deteriorating groundwater quality in the irrigatedenvironment of the IBIS;
• travel time calculations, solute transport simulation andthe MODPATH run have shown that there is not muchvulnerability to lateral saline intrusion, due to very slowmovement of groundwater. Where there is saline waterunderneath, consumption of the upper thin freshwaterlayer by pumping is causing gradual deterioration ofpumped groundwater quality to the extent of quality ofthe underlying relatively saline groundwater;
• groundwater quality deterioration in the Shergarh areais due to the presence of very local patches of salinewater (of the order of 5000 ppm and above at deeperdepths) and indiscriminate boring of wells by farmers,without proper understanding and investigationregarding the quality of groundwater;
• in such an environment where groundwater has increasingsalt content with depth, groundwater pumping should notbe allowed to increase more than recharge from the surfaceover a cycle of few years; otherwise saltwater up-coningmay degrade the quality of pumped groundwater;
• minimizing well depths can be one of the most effectiveand simplest methods of reducing threat of saltwaterup-coning. Keeping as much distance as possiblebetween the bottom of the well and the underlying saltwater could slow the upward vertical movement of saltwater. For this purpose, a detailed fresh groundwaterquality assessment with depth is recommended forsaline areas. This will guide farmers in the properdesigning of their wells regarding depth and discharge,so as to avoid saline up-coning.
Copyright © 2013 John Wiley & Sons, Ltd.
ACKNOWLEDGEMENTS
The authors wish to thank the Punjab Irrigation Department,the SCARPs Monitoring Organization and IWASRI of thePakistan Water and Power Development Authority (WAPDA)for providing valuable data sets used in the study. Specialthanks are due to the operators of the irrigation systembefore and immediately after the independence of Pakistan,for their collection and preservation of the historic datawhich helped in the detection and interpretation of long-termchanges in groundwater depth and quality. Invaluableand extremely productive contributions from researchercolleagues in the form of reviews and discussions are alsogratefully acknowledged.
REFERENCES
Ahmad N. 1995. Groundwater Resources of Pakistan (revised). 16B/2Gulberg-III: Lahore.
Basharat M. 2012a. Integration of canal and groundwater to improve costand quality equity of irrigation water in a canal command. PhD thesis.Centre of Excellence in Water Resources Engineering, University ofEngineering and Technology, Lahore, Pakistan.
Basharat M. 2012b. Spatial and temporal appraisal of groundwater depthand quality in LBDC command—issues and options. Pakistan Journalof Engineering and Applied Sciences 11 (July): 14–29.
Basharat M, Ali SU. 2012. Spatial variation in water supply anddemand across canal commands in Punjab: evaluation of existing waterallocations. Presented at International Conference on Water, Food,Energy and Environment Nexus: Solutions and Adaptation underChanging Climate, 4–5 April, at CEWRE, University of Engineeringand Technology, Lahore, Pakistan.
Basharat M, Tariq AR. 2013. Spatial climatic variability and its impact onirrigated hydrology in a canal command. Arabian Journal for Scienceand Engineering, 38(3): 507–522. DOI: 10.1007/s13369-012-0336-9.
Beg A, Lone MI. 1992. Trends of changes in groundwater quality of SCARP-1.In ICID-IWASRI, Proceedings of the 5th International Drainage Workshop,Lahore, vol. II. ICID-IWASRI, Lahore; 3.66-3.72.
GreenmanDW, SwarzenskiWV, Bennett GD. 1967. Groundwater Hydrologyof the Punjab, West Pakistan with Emphasis on Problems Caused by CanalIrrigation. West Pakistan Water and Power Development Authority,WASID Bulletin No. 6, Lahore, Pakistan.
Hussain A, Hamid A. 1964. Quality of groundwater in Bari Doab WestPakistan. Water and Power Development Authority, Water and SoilsInvestigation Division, basic data release No. 10.
Jurriens R, Mollinga PP. 1996. Scarcity by design: protective irrigation inIndia and Pakistan, ICID Journal 45(2): 31–53.
NESPAK. 2005. Punjab irrigated agriculture development sector project.Water and agricultural sector project. Water and agricultural studies.LBDC Command.
NESPAK/SGI. 1991. Contribution of private tubewells in the developmentof water potential. National Engineering Services of Pakistan and SpecialGroup Inc., Lahore.
NESPAK-NDC-AHT. 1995. Feasibility Study Second Irrigation and DrainageSukh Beas/LBDC Project. Final report, vol. II_ Annex 2 – Groundwater,Lahore, Pakistan.
Pakistan Meteorological Department. 2006. Agrometeorological Bulletin ofPakistan for June 2006. Published by National Agromet Centre of PMD,Islamabad, Pakistan.
PIES. 2001. Punjab Private Sector Groundwater Development Project—Final Project Impact Evaluation Report. MM Pakistan (Pvt) Ltd in
Irrig. and Drain. 62: 510–523 (2013)

523LONG-TERM GROUNDWATER QUALITY AND SALINE INTRUSION ASSESSMENT
association with Mott MacDonald Limited, Multi Dimensional Consultantsand Hunting Technical Services, Lahore, Pakistan.
Shah T. 2006. Groundwater and human development: challenges andopportunities in livelihoods and environments. In Proceedings ofIWMI-ITP-NIH International Workshop on ’Creating Synergy betweenGroundwater Research and Management in South and Southeast Asia’,8–9 February 2005, Roorkee, India.
Steenbergen Van F, OlienmansW. 1997. Groundwater resources managementin Pakistan. In ILRI Workshop: Groundwater Management: SharingResponsibilities for an Open Access Resource, Ppoceedings of the
Copyright © 2013 John Wiley & Sons, Ltd.
Wageningen Water Workshop, 12-14 October, 1997, Wageningen,The Netherlands.
United States Department of the Interior. 1967. Geological Survey, WaterSupply Paper 1608-H, Plate 6, 1967, U.S. Government Printing Office,Washington, D.C. 20402.
WAPDA. 1980. Hydrogeological data of Bari Doab, vol. 1, basic data releaseNo. 1 by Directorate General of Hydrogeology, WAPDA, Lahore.
Yunus M. 1977. Water quality in the Indus Plains. In Proceedings of WaterManagement for Agriculture (EXXON seminar), 15–17 November,Lahore, Pakistan.
Irrig. and Drain. 62: 510–523 (2013)