Economics of wheat cultivation in irrigated and unirrigated ...
128
Journal of Progressive Agriculture, Vol.4, No. 2: October, 2013 1 Economics of wheat cultivation in irrigated and unirrigated areas of Banswara DEVENDRA PRATAP SINGH 28 Indraprabha B/H Karni Bhawan Palace Hotel N/R Aashiyana Palace, Lalgarh Karni Nagar Bikaner, Rajasthan. 334001 Received: June, 2013 Accepted: July, 2013 ABSTRACT The average cost of cultivation was estimated as Rs.22300.08 and Rs.14975.34 per hectare respectively for irrigated and unirrigated wheat. The average net return per hectare was estimated Rs. 29181.25 and Rs 12039.66 for irrigated and unirrigated wheat respectively. The relative profitability of irrigated and unirrigated wheat shows that irrigated wheat is more profitable than unirrigated wheat therefore, it is necessary to motivate the farmers for cultivation of wheat crop on fairly better soil and introduction of wheat in irrigated farming system. Key words: wheat cultivation, irrigated, unirrigated area Rajasthan stands fifth in area and production in wheat out of major wheat growing states in the country. In Rajasthan major producing districts of wheat are Sri Ganganagar, Hanumangarh, Jaipur, Alwar, Bharatpur, Udaipur, Sirohi, Rajsamand, Dungarpur, and Banswara. The study area Banswara district has largest production in Udaipur region. It contributes more than 50% of total production of the region. Banswara district has highest irrigated area in the region. Banswara is one of the major wheat producing districts in southern Rajasthan. The climate is favourable for wheat cultivation and remains frost free and temperature usually does not fall below 10- 13C. This climatic suitability coupled with emerging immense irrigation facilities due to ‘Mahi Bajaj Sagar Project’ provides bright future of wheat cultivation in Banswara district. A study of comparison of irrigated and unirrigated wheat in this area of the state is of paramount importance. The present scenario encompasses evaluation of strategies related to input supply and strengthening of the inputs supply system. Adequate knowledge of cost structure of wheat crop has become essential for making necessary adjustments towards the input based strategies for enhancing the production. Cost of cultivation of wheat is one of the important criteria for determination and comparative analysis of cost structure with the use of resources in irrigated and unirrigated areas. The present study entitled “Sustainability of wheat cultivation in irrigated and unirrigated areas of Banswara district of Rajasthan” is proposed to be undertaken in one of the important districts for wheat cultivation in Rajasthan. The results and conclusion emerging from the study are will be useful for the government policy makers, agricultural scientists, extension agencies and all the farmers of the concerned district. Keeping the above facts in view, the present study entitled “Sustainability of wheat cultivation in irrigated and unirrigated areas of Banswara district of Rajasthan” was undertaken: 1. To study the growth in area, production and productivity of wheat in Banswara district. 2. To study cost and returns on different cost concepts basis in Banswara district of Rajasthan. METERIALS AND METHODS Selection of district: Banswara district in South Rajasthan has a significant area under wheat and the researcher is fully acquainted with this region. Hence, Banswara district was purposively selected for this study. Selection of tehsil: On the basis of highest area and production under wheat, Bagidora tehsil of Banswara districtwas selected purposively for the study. Selection of Villages: Two villages namely Chinch having highest irrigated area under wheat cultivation and Karji having highest unirrigated area under wheat cultivation were selected purposively for the study. Selection of Farmers: A sample of 60 farmers was selected with probability proportion to number of farmers in each size group. The small, medium and large size holdings are given in the table below:
-
Upload
khangminh22 -
Category
Documents
-
view
4 -
download
0
Transcript of Economics of wheat cultivation in irrigated and unirrigated ...

Journal of Progressive Agriculture, Vol.4, No. 2: October, 2013
1
Economics of wheat cultivation in irrigated and unirrigated areas of Banswara
DEVENDRA PRATAP SINGH28 Indraprabha B/H Karni Bhawan Palace Hotel N/R Aashiyana
Palace, Lalgarh Karni Nagar Bikaner, Rajasthan. 334001
Received: June, 2013Accepted: July, 2013
ABSTRACTThe average cost of cultivation was estimated as Rs.22300.08 and Rs.14975.34 per hectare
respectively for irrigated and unirrigated wheat. The average net return per hectare was estimated Rs.29181.25 and Rs 12039.66 for irrigated and unirrigated wheat respectively. The relative profitability ofirrigated and unirrigated wheat shows that irrigated wheat is more profitable than unirrigated wheattherefore, it is necessary to motivate the farmers for cultivation of wheat crop on fairly better soil andintroduction of wheat in irrigated farming system.
Key words: wheat cultivation, irrigated, unirrigated area
Rajasthan stands fifth in area and production inwheat out of major wheat growing states in thecountry. In Rajasthan major producing districts ofwheat are Sri Ganganagar, Hanumangarh, Jaipur,Alwar, Bharatpur, Udaipur, Sirohi, Rajsamand,Dungarpur, and Banswara.
The study area Banswara district has largestproduction in Udaipur region. It contributes morethan 50% of total production of the region. Banswaradistrict has highest irrigated area in the region.
Banswara is one of the major wheat producingdistricts in southern Rajasthan. The climate isfavourable for wheat cultivation and remains frostfree and temperature usually does not fall below 10-13C. This climatic suitability coupled with emergingimmense irrigation facilities due to ‘Mahi Bajaj SagarProject’ provides bright future of wheat cultivation inBanswara district.
A study of comparison of irrigated andunirrigated wheat in this area of the state is ofparamount importance. The present scenarioencompasses evaluation of strategies related to inputsupply and strengthening of the inputs supply system.Adequate knowledge of cost structure of wheat crophas become essential for making necessaryadjustments towards the input based strategies forenhancing the production. Cost of cultivation ofwheat is one of the important criteria fordetermination and comparative analysis of coststructure with the use of resources in irrigated andunirrigated areas.
The present study entitled“Sustainability of wheat cultivation in irrigated andunirrigated areas of Banswara district of Rajasthan” isproposed to be undertaken in one of the importantdistricts for wheat cultivation in Rajasthan. The
results and conclusion emerging from the study arewill be useful for the government policy makers,agricultural scientists, extension agencies and all thefarmers of the concerned district.
Keeping the above facts in view, the presentstudy entitled “Sustainability of wheat cultivation inirrigated and unirrigated areas of Banswara district ofRajasthan” was undertaken:1. To study the growth in area, production and
productivity of wheat in Banswara district.2. To study cost and returns on different cost
concepts basis in Banswara district of Rajasthan.
METERIALS AND METHODS
Selection of district:Banswara district in South Rajasthan has a
significant area under wheat and the researcher isfully acquainted with this region. Hence,Banswara district was purposively selected for thisstudy.Selection of tehsil:On the basis of highest area and production underwheat, Bagidora tehsil of Banswara districtwasselected purposively for the study.Selection of Villages:Two villages namely Chinch having highestirrigated area under wheat cultivation and Karjihaving highest unirrigated area under wheatcultivation were selected purposively for thestudy.Selection of Farmers:A sample of 60 farmers was selected withprobability proportion to number of farmers ineach size group. The small, medium and large sizeholdings are given in the table below:

Journal of Progressive Agriculture, Vol.4, No. 2: October, 2013
2
Table 1. Classification of farmers in different size holdings-Category Size Holding (ha.)
Irrigated Farmers Unirrigated FarmersSmall Up to 3 Up to 1.99Medium >3≤4.60 >1.99≤3.25Large >4.60 >3.25
Collection of Data:Both primary and secondary data were collected
from different sources. Secondary data in respect toArea and production of wheat were collected from thepublications of the Directorate of Economics andStatistics, Government of Rajasthan, Jaipur. Theprimary data were collected on pre- structure and pre-tested schedules.
Analysis of Data:To fulfill the first objective of studying growth in
area, production and productivity of wheat inBanswara district, the compound growth model wasused.
Cost of cultivation:To study the cost and return of wheat and different
size of holdings were studied. The cost of cultivation
of wheat was worked out using various cost conceptsbasis.
Cost of cultivation/haCost of production/quintal = ----------------------------
Yield/ha
RESULTS AND DISCUSSION
Growth in area, production and productivity:To study growth in area, production and
productivity, the compound growth rates were workedout which are given in table below. The table revealsthat compound growth rates of area, production andproductivity in Banswara district were positive. Thecoefficient for production and productivity is lowbecause of infestation of wheat crop with Molyadisease, Tandu disease and Rust disease and attack ofTermite in the area.
Table 2.Compound growth rates of area, production and productivity of wheat:
Growth Rates Banswara RajasthanArea
CCR 0.1034** -0.0232Ns
F-Value 10.56 1.00Significance 0.017 0.356
ProductionCGR 0.735NS 0.0058NS
F-Value 1.57 0.06Significance 0.256 0.820
ProductivityCCR 0.0118NS 0.0278
F-Value 1.22 22.32Significance 0.311 0.003
Cost structure of irrigated and unirrigated wheat The cost items were groupedUnder cost A1 to cost C3 has been presented in table below:
Table 3.Cost of cultivation of Irrigated and Unirrigated wheat in Banswara district (Rs./ha).
Type of Cost Irrigated wheat Unirrigated wheatSmall Medium Large Average Small Medium Large Average
Cost A1 14299.39 16199.36 17330.03 15942.93 9600.47 10841.62 11601.43 10681.17Cost A2 14299.39 16199.36 17330.03 15942.93 9600.47 10841.62 11601.43 10681.17Cost B1 14651.37 16785.36 18030.25 16488.99 9823.74 11090.07 12222.96 11045.59Cost B2 19651.37 21785.36 23030.25 21488.99 13323.74 14590.07 15722.96 14545.59Cost C1 15801.12 17575.34 18523.791 17300.08 10432.81 11487.08 12506.12 11475.34Cost C2 20801.12 22575.34 23523.79 22300.08 13932.81 14987.08 16006.12 14975.34Cost C3 22881.23 24832.87 25876.17 24530.09 15326.09 16485.79 17606.73 16472.87

Journal of Progressive Agriculture, Vol.4, No. 2: October, 2013
3
Cost A1 gives the idea of operational expensesexcept for family labour. Cost B1 and cost C1 areimportant since gross output less of their costs givesreturn to family labour and return to owned landrespectively. Cost C2 is the final cost it gives the netincome over total cost.
It can be concluded from the table that the costA1 and A2 increased with increase in the farm sizegroup.
Cost of Production:The cost of production per quintal on different
cost concepts basis are given in the table below:
Table 4. Cost of production in irrigated wheat cultivation on different size holding
Type of cost Irrigated wheatSmall Medium Large Average
Cost A1 512.52 524.25 470.92 502.56Cost A2 512.52 524.25 470.92 502.56Cost B1 525.13 543.22 489.95 519.43Cost B2 704.35 705.03 625.82 678.40Cost C1 566.35 568.78 503.36 546.16Cost C2 745.56 730.59 639.23 705.13Cost C3 820.12 803.65 703.16 775.64
Table 5. Cost of production in unirrigated wheat cultivation on different size holding
Type of cost Unirrigated wheatSmall Medium Large Overall Average
Cost A1 680.88 634.01 588.91 634.60Cost A2 680.88 634.01 588.91 634.60Cost B1 696.72 648.54 620.45 655.24Cost B2 944.95 853.22 798.12 865.43Cost C1 739.92 671.76 634.83 682.17Cost C2 988.14 876.44 812.49 892.36Cost C3 1086.96 964.08 893.74 981.59
It is evident from the table that the overall costof production per quintal of irrigated wheat wasRs.705.13. The cost of production per quintal washighest on small farms Rs.745.56 followed bymedium and large farmer that is Rs. 639.23respectively.
It is also evident from the table that theoverall cost of production per quintal of unirrigatedwheat was Rs.892.36. The cost of production washighest on small farms Rs.988.14 followed bymedium and large farmer Rs.876.44 and Rs.812.49respectively.
Table 6. Return from cultivation of irrigated wheatParticulars Irrigated wheat Overall Average
(Rs./ha)Small Medium LargeGross income 44523.00 50061.00 59860.00 51481.33Farm business income 30223.61 33861.64 42529.97 35538.41Family labour income 24871.63 28275.64 36829.75 29992.34Net income 23721.88 27485.66 36336.21 29181.25
It is evident from the table that overall averagegross income per hectare of irrigated wheatcultivation was Rs.51481.33 on sample farms. It wasRs. 44523, Rs.50061 and Rs.59860 on small ,
medium and large farms respectively. The grossincome per hectare increased with the increase in sizeof land holding because of higher productivity onlarge farms.

Journal of Progressive Agriculture, Vol.4, No. 2: October, 2013
4
Table 7. Returns from cultivation of unirrigated wheat
Particulars Un irrigated wheat Overall Average(Rs./ha)Small Medium Large
Gross income 23605.00 27155.00 30285.00 27015.00Farm business income 14004.53 16313.38 18683.57 16333.83Family labour income 10281.26 12564.93 14562.04 12469.41Net income 9672.19 12167.92 14278.88 12039.66
On an average farm business income fromunirrigated wheat cultivation was Rs.16333.83.Among different land size holdings, it varied from Rs,
18683.57 on large farms to Rs.14004.53 on smallfarms. The farm business income increases withincrease in size of land holdings.
Table 8. Net returns per hectare of irrigated wheat on different cost concepts basis
Particulars Irrigated wheat Overall Average(Rs./ha)Small Medium Large
Cost A1 30223.61 33861.64 42529.97 35538.41Cost A2 30223.61 33861.64 42529.97 35538.41Cost B1 29871.63 33275.64 41829.75 34992.34Cost B2 24871.63 28275.64 36829.75 29992.34Cost C1 28721.88 32485.66 41336.21 34181.25Cost C2 23721.88 27485.66 36336.21 29181.25Cost C3 21641.77 25228.13 33983.83 26951.24
It is evident from the table that overall netreturns on cost A1 ,A2 ,B1, B2, C1, C2 , and C3 basis wereRs. 35538.41 , Rs. 35538.41, Rs. 34992.34, Rs.29992.34, Rs. 34181.25, Rs. 29181.25 and Rs.26951.24 per hectare of irrigated wheat cultivation,respectively. The net returns increased with increasein the size of holding.
It is evident from the table as below that overallnet returns on cost A1, A2, B1, B2, C1, C2, and C3 basiswere Rs. 16333.83, Rs. 16333.83, Rs. 15969.41, Rs.12469.41, Rs. 15539.66, Rs, 12039.66 and Rs.10542.13 per hectare of unirrigated wheat cultivation,respectively. The net returns increased with increasein the size of the holding.
Table 9. Net returns per hectare of unirrigated wheat on different cost concept basis:
Particulars Unirrigated wheat Overall Average(Rs./ha)Small Medium Large
Cost A1 14004.53 16313.38 18683.57 16333.83Cost A2 14004.53 16313.38 18683.57 16333.83Cost B1 13781.26 16064.93 18062.04 15969.41Cost B2 10281.26 12564.93 14562.04 12469.41Cost C1 13172.19 15667.92 17778.88 15539.66Cost C2 9672.19 12167.92 14278.88 12039.66Cost C3 8278.91 10669.21 12678.27 10542.13
CONCLUSION
Wheat crop has an important place in thecropping pattern of Banswara district. The growthrates of area, production and productivity of wheat inBanswara district showed a positive increase over theyears. The main factor which influences the wheatproduction is irrigation facilities.
The farmers of the study area were awarewith the recommended quantity of all the inputs butdue to poor economic condition and their non-availability at village level was the main constraintsin wheat production.
The average cost of cultivation wasestimated as Rs.22300.08 and Rs.14975.34 perhectare respectively for irrigated and unirrigatedwheat. The average net return per hectare wasestimated Rs. 29181.25 and Rs 12039.66 for irrigatedand unirrigated wheat respectively. The relativeprofitability of irrigated and unirrigated wheat showsthat irrigated wheat is more profitable than unirrigatedwheat therefore, it is necessary to motivate thefarmers for cultivation of wheat crop on fairly bettersoil and introduction of wheat in irrigated farmingsystem.

Journal of Progressive Agriculture, Vol.4, No. 2: October, 2013
5
RECOMMENDATIONSOn the basis of the results obtained in the
present study, the following suggestions can be made:Growth in area, production and productivity hasregistered low trend which is alarming situation forthe district. This is due to termite attack and wheatrust. Therefore, efforts need to be made to evolveresistant varieties so that the low trend can bechecked. The government should make properinspection of spray material to check sale of spuriousinsecticide / pesticides to safeguard the farmers fromincurring losses as some of the farmers reported to the
researcher about no control of termite even after anumber of sprays.Government must ensure timely and adequate supplyof water in canal, so that the wheat crop irrigation atcrucial stages of growth.The farmer communities of the area are unable toutilize the recommended inputs due to poverty andnon availability. Inputs should be provided on time inthe area with some subsidy in the inputs. It is alsosuggested that more credit facilities should beprovided to the farmers by lending institutions atproper time and in adequate amount.
REFERENCES
Anonymous. 2006. “Vital Statistics, Directorate ofEconomics and Statistics, Pant Krishi Bhawan, Jaipur.
Gajja, B.L. and Kalla, J.C. 1983. “Inter- district variationin area of wheat in Rajasthan.” Agricultural Situation inIndia. 37:751-756.
Jyothirmai, U.L., Shareef, S.M. and Rao, A.P.2003.”Recourses use efficiency of paddy crop in threeregions of Nagarjuna Sagar command area in AndhraPradesh”. Economic affairs, Calcutta 48(1): 59-64
Kumar, A. and Mor, B.S. 2001. “To analysis the growthrates in area, production and productivity of majorcrops in Haryana. Research on crops. 2(3): 327-331.
Verma, A.R. 2006. “Growth in production and productivityof principal crops and constraints in food security inMadhya Pradesh.” Ind. J. of Agril. Econ. 61(3):442-443.
Sudhakar, D., Singh, N.P. and Dwivedi, S. 2000. ‘A studyof resource use efficiency of wheat crop in AgraDistrict.” J. of Agric. and scientific Research. 36(1-2):14-18.

Journal of Progressive Agriculture, Vol.4, No. 2: October, 2013
6
Cost and profitability of Rabi jowar cultivation in Marathwada region
K H PAGARE, SACHIN S MORE AND PALLAB DEBNATHDepartment of Agricultural Economics and Statistics, College of Agriculture,
Marathwada Agricultural University, Parbhani – 431 402 (M.S.)INDIA.
Received: June, 2013Accepted: July, 2013
ABSTRACT
This study examines the economics of rabi Jowar cultivation in Marathwada region of Maharashtrastate. In Analytical techniques, tabular analysis which includes mean, percentage, frequency and ratiowere used. It is revealed from the study that in case of physical input and output there was negativerelationship between human labour and farm size. There was no significant difference in the use ofbullock labour and machine labour among different categories of farm. Per hectare item wise cost andtheir proportion to cost ‘C’ was Rs. 15,294.21 on overall farmer’s field. In context of profitability of rabiJowar, overall yield level was 15.52 quintal per ha. and in general gross income was Rs. 26,968. It isalso revealed that cost ‘A’, Cost ‘B’ and cost ‘C’ decreased with the increase in farm size and the input-output ratios increased with the increase in farm size. Unit cost assessment at cost ‘A’, Cost ‘B’ andcost ‘C’ were Rs. 687.87, Rs. 888.18 and Rs. 985.45, respectively. This indicates that rabi Jowar isquite profitable for cultivation for all categories of farmers especially for the large farmers inMarathwada region.
Key words: Cost, Physical input-output, Profitability, Rabi Jowar, Marathwada region.
Jowar (Sorghum bicolar (L.) Monch) belongs tofamily graminaceae is one of the most importantcereal crops in the world and is one of the four majorfood grains of our country. It is a staple food formillions of poor rural people in Asian and Africancountries including India. Besides being a majorsource of staple food for human beings, it is also themost important food and fodder crop of dry landagriculture. Sorghum is the fifth most importantcereal crop in the world after wheat, rice, maize andbarley. In case of cropping pattern on an averageproportionate area under rabi Jowar crop inMarathwada region is 22.26 per cent and at overalllevel cropping intensity of rabi Jowar farm is 147.00per cent (Pagare et al, 2013). The nutritional value ofsorghum is same as of that of corn and that is why itis gaining importance as livestock feed. Sorghum isalso used for ethanol production, producing grainalcohol, starch production, production of adhesivesand paper other than being used as food and feed. Onemore advantage of this crop is that it can be grown inboth Kharif and Rabi season. Till recently, India has
had huge monopoly in the world supplies of Jowar.But with the development of domestic industries insome of East African countries, India has increasinglybegin to face stiff competition from these sources inher export market. Study revealed that medium andlarge scale farmers are incurring higher costs perquintal of Jowar than the small holders. Although thesmall holders are receiving a slightly higher producerprice than the medium and large operators (Patil andKunal, 1988). Mruthyunjay Kumar (1989) examinedthe trends and structural changes in cost of productionof 10 crops including sorghum which revealed thatthe cost of cultivation increased over time due toinflationary pressure and declining profitability. Onthe contrary, on an average, per quintal cost ofproduction was worked out to be Rs. 566.33 in Rabisorghum production and output-input ratio was 1.24.Study regarding economics of sorghum cultivation inpaddy fallows revealed that the returns from grainyield of Rabi sorghum was Rs.15226 per hectare withan average grain yield of 34.57 quintals per hectare.The net returns at cost
A of Rs. 12444 per hectare from sorghum cultivationis rationally high (Dayakar et al., 2005). Based on allthese facts, an attempt has been made to access theeconomics of rabi Jowar cultivation in Marathwadaregion.
MATERIALS AND METHODS
Methodology is of vital importance in the anyeconomic study. It includes salient features of studyarea, sampling design, methods of data collection,analytical tools used and term and concept involved
in study. In order to fulfill the objective of the presentstudy, primary data were collected from varioussources. Multistage sampling design was adopted forselection of the district, tehsil, village and respondentfarmers.
At first stage, the Parbhani and Beed districts werepurposively selected because these two districts aretraditionally known for rabi Jowar cultivation andthey are having predominant area of rabi Jowar inthe Marathwada region. At second stage, one tehsilfrom each district was selected on the basis of highest
Journal of Progressive Agriculture, Vol.4, No. 2: October, 2013
7
area of rabi Jowar. At third stage, from each selectedtehsil a list of revenue villages was prepared inconsultation with revenue department and then sixvillages were selected randomly. At the fourth stage,a list of rabi Jowar growers was prepared inconsultation with Talathi (Patwari) of each selectedvillage, then from a list ten rabi Jowar growers wereselected randomly. Thus, 120 rabi Jowar growerswere selected for the present study. The selectedsample then post classified into three groups i.e. small(Area under rabi Jowar is upto 02 ha.) medium (Areaunder rabi Jowar is between 02 to 04 ha.) and large(Area under rabi Jowar is above 04 ha.) farmer.Number of respondents in small size group were 30,medium size group 50 and large size group 40. Thus,effective total sample size was 120. Parbhani andBeed market were purposely selected because thesetwo markets were the major market of Parbhani andBeed district, respectively. From the selected market,different middlemen were selected randomly for thestudy of marketing rabi Jowar. Ten middlemen wereselected for the present study.
The sample farmers were interviewed personallyand the objectives of the study were explained tothem to ensure the co-operation. The information wascollected from them in a specially designed scheduleby survey method. Data pertained for the year 2009-10. Further, data was analyzed with respect toobjective of the study for meaningful conclusion. InAnalytical techniques, tabular analysis which includesmean, percentage, frequency and ratio were used toachieve the objective laid down for the study.
RESULTS AND DISCUSSION
Physical inputs can be converted intomonetary terms to determine the cost of cultivationper hectare. Similarly main produce and by producecan also be converted into monetary terms to knowthe gross returns with the help of cost and returns,profitability with respect to rabi Jowar production.
Physical input and output of rabi Jowar growersPhysical input and output of rabi Jowar production
was calculated and are presented in Table 1.0. Use ofhuman labour was 52.82 man days on small farmers,followed by 39.71 man days on medium farmers and28.32 man days on large farmers. It inferred thathuman labour decreased with the increase in farmsize. On an average, use of human labour was foundto be 40.08 man days. Use of bullock labour was06.33 pair days on small farms, 06.55 pair days onmedium farms and 05.44 pair days on large farms. Onan average, use bullock labour was 06.13pair days.There was no significant difference in the use ofbullock labour and machine labour among differentcategories of farms, this was mainly because in allcategories of farm, bullock labour were mainly usedfor ploughing and threshing operations only. The
average seed rate used for Jowar cultivation ranged inbetween 11.66 to 12.05 kg per ha. among differentcategories of farm. Maximum use of manure wasobserved (16.66 quintal) on medium farms followedby (14.11 quintal) large farms and (10.93 quintal)small farms. In general, use of manure was found tobe 13.90 quintal per hectare. Use of fertilizer withrespect to nitrogen, phosphorous and potashdecreased with the increase in farm size. Thus, ingeneral use of nitrogen, phosphorus and potash were54.19, 40.75 and 24.72 kg per ha. It was alsoobserved from Table 1.0 that per hectare mainproduce of rabi Jowar was highest (16.16 quintal) onmedium farm, followed by (15.47 quintal) small and(14.93 quintal) large farm. In general main produce ofrabi Jowar was 15.52 quintal. By produce of rabiJowar decreased with the increase in farm size. Ingeneral by produce was 34.44 quintal.Per hectare cost of cultivation of overall rabiJowar growers in Marathwada region:
Per hectare item wise cost and their proportion tocost ‘C’ with respect to overall rabi Jowar growerswere calculated and are presented in Table 2.0. Cost‘C’ was Rs. 15,294.21 on the overall farmer’s field.The maximum share of cost ‘C’ was accounted byhired human labour i.e. 22.26 per cent followed byrental value of land (17.80 per cent), family humanlabour (09.86 per cent), machine labour (8.72 percent) and bullock labour (8.02per cent). Cost ‘A’ wasRs. 10,675.75 (69.80 per cent) and Cost ‘B’ was Rs.13,784.61 (90.12 per cent). The productivity of largerfarm was less as compared to other farm’s category. Itwas mainly because larger farmers mainly depend onacreage response to production.
Profitability of rabi Jowar in Marathwada region:Profitability of rabi Jowar on different size of
farms were calculated and it are presented in Table3.0. The result revealed that, per hectare grain yieldwas highest on medium farm followed by small andlarge farm respectively. At overall level, yield was15.52 quintal per ha. In regards to gross income,small farmers received the gross income of Rs.28,533.50, medium farmers received income of Rs.28,044 and large rabi Jowar growers received Rs.24,294.50. In general, per hectare gross income wasRs. 26,968. Cost ‘A’ was the highest (Rs. 12,135.66)in case of small farmers followed by (Rs. 11,235.70)medium and (Rs. 88,70.04) large farmers. At overalllevel, it was Rs. 10,675.75 per ha. The highest cost‘A’ was found on small farmer’s field, it was mainlybecause they have utilized maximum human energyto cultivate rabi Jowar, the reason may be theybelieve in intensive cultivation practices to improvethe yield level. In regard to cost ‘B,’ it was highest(Rs. 15,282.51) on small farmers followed by (Rs14,453.50) medium farmers and (Rs. 11,828.64) largefarmers, respectively. On an average it was Rs.

Journal of Progressive Agriculture, Vol.4, No. 2: October, 2013
8
13,784.61. Cost ‘C’ was highest (Rs. 17,450.31) onsmall farmers followed by (Rs. 15936.70) mediumand (Rs. 12,724.44) large farmers, respectively. Atoverall level it was Rs. 15,294.21. It is clear that cost‘A’, Cost ‘B’ and Cost ‘C’ decreased with theincrease in farm size. In general, farm businessincome was Rs. 16,292.25, while family labourincome was Rs. 13,183.39 and net profit was Rs.11,673.79. Input output ratios showed increasingtrend with the increase in farm size. Input output ratioon cost ‘A’ was 02.52, cost ‘B’ was 01.95 and cost‘C’ was 01.76. It implied that when Rs 01.00 is spenton Jowar production, it would lead to give the returnof Rs. 01.76 at cost ‘C’, which indicated the efficientuse of capital in rabi Jowar production. Per quintalcost assessment of rabi Jowar was maximum on smallfarmer compared to medium and large farmer. Unitcost assessment at cost ‘A’, cost ‘B’ and cost ‘C’were Rs. 687.87, Rs. 888.18 and Rs. 985.45,respectively.
CONCLUSION
In short it can be concluded that in case ofphysical input and output of rabi Jowar growers useof human labour decreased with the increase in thefarm size. There was also no significant difference inthe use of bullock labour and machine labour useamong different categories of farm because in allcategories of farm. Per hectare item wise cost andtheir proportion to cost ‘C’ was Rs. 15,294.21 on theoverall farmer’s fields. The productivity of largefarmers was less as compared to other farmer’scategory. It was mainly because of larger farmsmainly depends on acreage to production. In case ofprofitability of rabi Jowar, at overall yield level was15.52 quintal per ha. and in general gross income wasRs. 26,968. It was clear that cost ‘A’, Cost ‘B’ andcost ‘C’ decreased with increase in farm size.
Table 1.0 Physical input and output of rabi Jowar growers(Per ha.)
Particulars UnitRabi Jowar growers
Small Medium Large OverallInputHuman labour Days 52.82 39.71 28.32 40.08Bullock labour Days 06.33 06.55 05.44 06.13Machine labour Hrs. 04.67 04.40 04.29 04.55Seed Kgs 11.66 12.05 10.98 11.53Manures Qtls. 10.93 16.66 14.11 13.90Nitrogen Kgs 60.72 64.08 43.75 54.19Phosphorus Kgs 47.70 41.35 38.05 40.75Potash Kgs 28.75 25.15 23.05 24.72Out PutMainproduce (grain) Qtls. 15.47 16.16 14.93 15.52By produce (fodder) Qtls. 38.56 35.777 29.01 34.44
Table 2.0 Per hectare cost of cultivation of overall rabi Jowar growers in Marathwada region.
Particulars Unit Quantity Rate/ha(Rs)
Value( Rs)
Percentage to thetotal cost
Hired human labour DaysMale 16.30 120.00 1956.00 12.78Female 24.18 60.00 1450.80 09.48Bullock labour Days 06.14 200.00 1228.00 08.02Machine labour Hrs. 04.45 300.00 1335.00 08.72Seed Kgs 11.53 20.00 230.60 01.50Manures Qtls. 13.90 50.00 695.00 04.54Fertilizers KgsNitrogen (N) 54.19 13.90 753.24 04.92Phosphorus (P) 40.75 18.86 768.54 05.02Potash (K) 24.72 08.00 197.76 01.29Irrigation charges Rs. - - 780.39 05.10Incidental charges Rs. - - 253.33 01.65Repair on farm implements Rs. - - 210.00 01.37Working capital (1 to 9) Rs. - - 9858.66 64.46Interest on working capital Rs. - - 591.51 03.86Depreciation on farm implements Rs. - - 196.36 01.28Land revenue and other taxes Rs. - - 29.22 00.19Cost -A (10 to 13) Rs. - - 10675.75 69.80Rental value of land Rs. - - 2722.88 17.80

Journal of Progressive Agriculture, Vol.4, No. 2: October, 2013
9
Particulars Unit Quantity Rate/ha(Rs)
Value( Rs)
Percentage to thetotal cost
Interest on fixed capital Rs. - - 385.98 02.52Cost- B (14+15+16) Rs. - - 13784.61 90.12Family labour Days - -Male 10.13 120.00 1215.60 07.94Female 04.90 60.00 294.00 01.92Cost - C (17+18) Rs. 15294.21 100
Table 3.0 Profitability of rabi Jowar in Marathwada region (Rs. / ha.)
Particulars Rabi Jowar growersSmall Medium Large Overall
Returns from main produce 13149.50 13736.00 12690.50 13192.00Returns from by produce 15384.00 14308.00 116040.00 13776.00Gross income 28533.5 28044 24294.5 26968COST A 12135.66 11235.70 8870.04 10675.75COST B 15282.51 14453.50 11828.64 13784.61COST C 17450.31 15936.70 12724.44 15294.21Farm business income (gross returns minus cost –A)
16397.84 16808.30 15424.46 16292.25
Family labour income (gross returns minus cost-B)
13250.99 13584.50 12465.86 13183.39
Net profit (Gross returns minus Cost-C) 11083.19 12107.30 11570.06 11673.79Input output ratio atCOST A 2.35 2.49 2.73 2.52COST B 1.86 1.93 2.05 1.95COST C 1.63 1.75 1.90 1.76Unit cost assessmentUnit cost A (Rs/qts) 784.46 695.27 594.10 687.87Unit cost B (Rs/qts) 987.88 894.77 792.27 888.18Unit cost C (Rs/qts) 1128.00 986.18 852.27 985.45
REFERENCES
Asmatoddin, Md., Jawale, S.V. and Ghulghule, J.N.2009. Socio- economic status and cropping pattern ofmedium farm owner in Marathwada region. Int.J.Comand Busi. Management. 2(1): 37-41.
Pand, A. and Mhopadhay, A. 1983. Cost & profitabilitiesof wheat and it’s competing crops, in West Bengal.Agric. Situ. India. 37(10): 629 – 634.
Dayakar, Rao, B., Thirumal, V. and Hyma Jyothi, S.2005. Economics of sorghum cultivation followspaddy in Guntur district of Andhra Pradesh.Agric.Situ.India. 61(12): 885-888.
Gurjar, M.L. and Varghese, K.A. 2005. Structuralchanges overtime in cost of cultivation 08 major rabicrops in Rajasthan. Indian J. Agric.Econ. 60(2): 249-263.
Kaur, C. and sekhon, M.K. 2006. Cost structure and rateof return in major paddy producing states of India.Agric.situ India. 62(3): 155-163.
Kumar, S. and Kumar, S. 2004. Resource productivityand returns from selected foodgrain crop of HimachalPradesh. Agric. Situ. India. 61(7):475-485.
Murthyunjaya K.P. 1989. Trends and structural changesin cost and production and profitability of crop inIndia. Agric. Situ. India. 44(6): 451-457.
Pagare, K.H., More, S.S., Pallab Debnath and RaviShrey. 2013. Land holding and cropping pattern ofRabi Jowar growers in Marathwada Region. Sci. Res.Rept 3(1):15-19.
Pandey, H.K. and Duggal, S.C. 1970. Input cost andreturn of major crop in Nainital block of Varanasi.Agric. Situ. India. 24(12): 1099-1103.
Patil, S.S. and Kunnal, L.B. 1988. Cost return structure ofJowar production. Farming system. 4(1-2): 34-37.
Singh, D.V. 1982. Economics of bajara cultivation inWestern Rajasthan. Agric. Situ. India. 37(8): 505-510.
Suryawanshi, S.D. and Gaikwad, N.S. 1984. An analysisof yield gap in rabi Jowar in drought prone area ofAhmednagar district. Agric. Situ. India. 24(2): 147-153.

Journal of Progressive Agriculture, Vol.4, No. 2: October, 2013
10
Improvement of yield through front line demonstrations in mothbean
1R.K.VERMA AND 2DAYANAND1Associate Professor (Extension Education), KVK, Abusar-Jhunjhunu (Raj.)
2Senior Scientist (Agronomy) CAZRI RRC, Jaisalmer (Raj.)
Received: August, 2013Accepted: Sept., 2013
ABSTRACT
Front line demonstrations on mothbean variety RMO-40 were conducted at farmers fields indistrict Jhunjhunu (Rajasthan) during Kharif seasons since the year 1997-2004. On eight years overallaverage basis about 37.90 per cent higher grain yield was recorded under demonstrations than thefarmers traditional practices. The extension gap, technology gap and technology index were 146 kg perha, 288.87 kg per ha and 35.22 %, respectively. FLD programme was effective in changing attitude,skill and knowledge of improved/ recommended practices of moth bean cultivation. This also improvedthe relationship between farmers and scientists and built confidence between them.
Key words: Demonstration, Extension gap, Potential yield, Technology gap and Technology index.
The Indian Council of Agricultural Research hadevolved a new concept of “First LineDemonstrations” in 1990-1991, which later on termedas “Front Line Demonstrations”. To organise frontline demonstrations (FLD) on various crop is one ofthe important mandate of the Krishi Vigyan Kendras.Along with transfer of technology, the basic purposeof these demonstrations is to test research findings onfarmers fields and to get direct feed back from thefarmers to help the scientists to reorient their research& training programmes.
In front line demonstrations latest and proventechnologies are demonstrated at farmers field for thefirst time before being fed into the main extensionsystem of the state department of agriculture.
Field demonstration is a long term educationalactivity conducted in systematic manners on a farmersfield to show worth of a new practice or idea. Fielddemonstration educates farmers through resultsobtained in terms of higher yield and it follows theprinciple of “seeing is believing”.Pulses plays animportant role in human diet and main source ofvegetable protein. Pulses are grown in about 32.07lakh ha. area in rajasthan out of which 21.33 lakh haarea comes under kharif pulses and 10.74 lakh haarea under rabi pulses.
In jhunjhunu district of Rajasthan bajra, mungbean, moth bean, cowpea and cluster bean are themain kharif crops due to rainfed condition. Moth bean(Vigna aconitifolia L.) is the main kharif pulse cropraised under limited moisture condition in vast areabut the productivity is very low i.e. 357 kg. /ha onlyin the state (2006-07). other reasons of lowproductivity are use of local genotype of longduration, sowing by boadcasting, poor soil fertilitywith no use of fertilizer & manure, no seed treatmentand no use of plant protection measures. Productivityof this crop can be enhanced by adopting the
improved package of practices as recommended bythe research institutes and agricultural universities.Hence Krishi Vigyan Kendra, Abusar- Jhunjhunu theonly farm science centre located in the district initiateFLD programmes funded by ICAR since kharif 1997.Due to encouraging results, demonsrations werecontinued in the following years at farmers field.Theobjectives of study were as follows. To enlist the cultivation practices of mothbean
under FLD To compare the yield levels of local check
(farmers field) and FLD fields.
MATERIALS AND METHODS
Farmers of operational area of KVK, Jhunjhunuwere selected as per allotment of FLD’s to KVK byZonal Project Directorate (Zone-VI). Accordingly theFLD’s of moth bean were laid out in the villagesnamely Khudot, Padampura, Alsisar, Bibasar, Rayla,Chudela, Jawaharpura, Bass Ghasiram, Sigra etc. Ingeneral soils of the area under study were sandy tosandy loam in texture which is low in nitrogen, low tomedium in phosphorus and medium to high in potash& totally rainfed. The farmers were provided fullrecommended package of practices with quality seedof Moth bean variety RMO-40 during all the years ofthe study. In case of local check plots existingpractices being used by farmers. Regular visits by theKVK Scientists to demonstration fields were ensuredand guided the farmers time to time. These visits werealso utilized to collect feedback information forfurther improvement in the research and extensionprogrammes. Field days and group meeting were alsoorganized at the demonstration sites to provide theopportunities for other farmers to witness the benefitsof demonstrated technologies.Data were collectedfrom the FLD farmers. The grain yield ofdemonstration crop was recorded & analysed.

Journal of Progressive Agriculture, Vol.4, No. 2: October, 2013
11
Different parameters as suggested by Yadav et al.(2004) and Sagar & Chandra (2004) were used forcalculating gap analysis.
The details of different parameters are asfollows: Extension gap = Demonstration yield - Farmers
practice yield Technology gap = Potential yield -
Demonstration yield Technology index = Potential yield -
Demonstration yield x 100/ Potential yieldPotential yield- Potential yield is the highestyield recorded in the study area during past fiveyears.
RESULTS AND DISCUSSION
The cultivation practices of moth beandemonstrated at farmers field are mentioned in table-1and compared with existing practices (localpractices). Subhash Chandra and Atul Chandra (2002)stated that Similar practices gave good results atfarmers field in Bikaner district of Rajasthan. Duringthe period of study (1997-2004) it was observed thatyield of demonstration was significantly higher(531.13 kg/ha.) than local ceck plots (385.13 kg/ha.)as shown in table-2. However year wise fluctuation inyield were observed mainly on account of variation inrainfall, mid season dry spells & change in thelocations of trial every year. Average yield levelsvaried from 188 to 508 kg/ha.in local checks and 347to 694 kg/ha.in demonstration plots. In terms ofpercentage yield improvement in demonstration wasrecorded from 18.75 to 84.57 per cent over localcheck. The variety RMO-40 performed extremelywell as compared to local check.
Yield improvement to the extent of 84.57 percent is due to combined effect of high yielding &short duration variety (RMO-40), seed treatment withfungicide & bio-fertilizer, appropriate method & timeof sowing, appropriate method of fertilizer applicationand insect pest control practices adopted under thedemonstrations.
It was also observed that low productivity ofMoth bean under local check plots was mainly due touse of low yielding long duration local genotypeswithout application of fertilizers & pesticides. Thelocal genotypes are prone to viral mosaic disease. Thereslts conform the findings of Subhash Chandra andAtul Chandra (2002), Lakhera, J.P. and Sharma,B.M.(2003), Sharma,O.P. (2003), Singh, Narhari et al(2005), Kirar, B.S. et al (2006), Yadav, V.P.S. et al(2007).
An extension gap of 60-188 kg per hectare wasfound between demonstrated technology and farmerspractices during study period and on average basis theextension gap was 146 kg per hectare (Table 2). Theextension gap was lowest (60 kg/ha) during 1999 and
was highest (188 kg/ha) during 2003. Such gap mightbe attributed to adoption of improved technology indemonstrations which resulted in higher grain yieldthan the traditional farmers practices. Widetechnology gap were observed during different yearsand this was lowest (126 kg/ha) during 2000 and washighest (473 kg/ha) during 2002. On eight yearsaverage basis the technology gap of total 210demonstrations were found as 288.87 kg per hectare.The difference in technology gap during differentyears could be due to more feasibility ofrecommended technologies during different years.Similarly, the technology index for all thedemonstrations during different years were inaccordance with technology gap. Higher technologyindex reflected the inadequate proven technology fortransferring to farmers and insufficient extensionservices for transfer of technology. The resultsconfirm the findings of front line demonstrations onoilseed and pulse crops by Singh et al (2000), Singhet al (2002) and Yadav et al (2004).
Problems and perspective
Crop production in the area depends upon thelimited monsoon rainfall. It is characterised by lowannual rainfall (450 mm). This rainfall is uncertain,uneven & erratic and due to that the crop productionbecomes very poor. The crops are very often sufferfrom abberent climatic conditions like delayed onsetof monsoon, early departure of monsoon, long dryspells, high temperature, hot wind waves and windstorms. It has been observed that during initial yearfarmers had hesitation to adopt the new variety and donot believe in KVK scientists. However the problemwas solved by motivating the farmers throughtraining, extension activities and visits of farmers toKVK instructional farm. This programme waseffective in changing attitude, skill and knowledge offarmers about improved practices of moth beancultivation that helped in adoption of same. Besidesadoption of improved practices of moth beancultivation it also improved the relationship betweenfarmers and scientists and built confidence betweenthem. Pulse production in this area can be increased byintroduction of short duration genotypes like RMO-40of Moth bean. This variety is characterised by highpotential yield, short duration, disease resistant andremains almost green up to maturity. Farmers can use the seed of this variety year afteryear. KVK is also providing truthfully labelled seedto the farmers of the area. The seed of moth bean isbeing disseminated among other fellows of farmingcomunity by demonstration farmers, agriculture inputsupply agencies and KVK.

Journal of Progressive Agriculture, Vol.4, No. 2: October, 2013
12
The feed back received from the farmingcommunity & KVK scientists also observed that sincelast thirteen years the high yielding varieties of mothbean has replaced almost 85 per cent of local seed.Though the KVK provided the FLD’s since eightyears but due to development of seed chain in thearea, supply of truthfully labelled seed by KVK andawareness of the farmers about high yielding varietiesof moth bean resulted in getting 85 per cent seedreplacement. The productivity gain under FLD over thefarmers practices of moth bean cultivation createdgreater awareness and motivated the other farmers toadopt appropriate production technology of mothbean cultivation in the district.
CONCLUSION
Front line demonstration program was effective inchanging attitude, skill and knowledge of farmersabout improved practices of moth bean cultivationthat helped in adoption of same. Besides adoption of
improved practices of moth bean cultivation it alsoimproved the relationship between farmers andscientists and built confidence between them.The demonstration farmers also acted as primarysource of information on the improved practices ofmoth bean cultivation and also acted as source ofgood quality pure seeds in their locality andsurrounding area for the next crop. The concept ofFront line demonstration may be applied to all farmercategories including progressive farmers for speedyand wider dissemination of the recommendedpractices to other members of the farmingcommunity. This will help in the removal of thecross-sectional barrier of the farming population. Byconducting effective front line demonstrations ofproven technologies, yield potential of crops can beincreased to a great extent. The technologies suitableand applicable for the arid areas similar to Jhunjhunudistrict of Rajasthan should be developed so thatfarming community may motivate to adopt thetechnologies.
Table 1 Grain yield and gap analysis of front line demonstrations of Moth bean at farmers field
Year Area/ha.
No. ofdemonstrat
ions
Variety Potentialyield
(Kg/ha)
Demonstration yield(Kg/ha)
Farmerspractice yield
(Kg/ha)
Increaseover
Farmerspractice (%)
Extensiongap
(Kg/ha)
Technologygap (Kg/ha)
TechnologyIndex
1997 10 20 RMO-40 820 541 379 42.74 162 279 34.021998 10 20 RMO-40 820 442 361 22.43 81 378 46.091999 20 40 RMO-40 820 380 320 18.75 60 440 53.652000 20 40 RMO-40 820 694 508 36.61 186 126 15.362001 15 30 RMO-40 820 670 488 37.30 182 150 18.292002 10 20 RMO-40 820 347 188 84.57 159 473 57.682003 10 20 RMO-40 820 635 447 42.05 188 185 22.562004 10 20 RMO-40 820 540 390 38.46 150 280 34.15
Overallaverage
15 30 - 820 531.13 385.1 37.90 146 288.87 35.22
Table 1. Cultivation practices of mothbean followed by farmers under FLD
Operations Existing practices Improved practicesUse of seed Local seed Short duration variety RMO-40Sowing method Broadcasting Line sowingSeed treatment Not practiced Seed treatment with fungicide & rhizobium cultureFertilizer application Not used Phosphate was applied through DAP (Basal
application)Insect pest management Not done Protection measures were adopted as per needMarketing Grain sold in local
marketGrain sold to other farmers as a quality seed
Journal of Progressive Agriculture, Vol.4, No. 2: October, 2013
13
REFERENCES
Hegde, D.M. 2005. Striving for self sufficiency. The HinduSurvey of Indian Agriculture 2005: 58-63.
Kirar, B.S. 2006. Demonstration: An effective tool forincreasing the productivity of urd. Indian Res. J. Ext.Edu. 6(3):1-3.
Kumawat S.R., Regar M.L. and Bhat D.S. 2010. Impactof Frontline Demonsatration on adoption of improvedcastor production technology. Journal of ProgressiveAgriculture, Vol.1No.1 Oct.: 14-17.
Lakhera, J.P. and Sharma, B.M. 2003. Effect of front linedemonstration on transfer of improved mustardproduction technology. Rajasthan Journal ofExtension Education. 11:89-92.
Sharma, O.P. 2003. Mothbean yield improvement throughfrontline demonstrations. Agricultural Extensionreview, September to October:11-13.
Singh, N. 2005. Front line demonstrations on rice inManipur. Agricultural Extension review, May toJune:6-7.
Singh, B. and Chauhan,T.R. 2006. Factors influencingthe adoption of mothbean production technology inarid zone of Rajasthan. Journal of arid legumes.3(1):34-38.
Singh, B. and Chauhan, T.R. 2010. Adoption ofmungbean production technology in arid zone ofRajasthan. Indian Res. J. Ext. Edu. 10(2) May:73-77.
Singh, R.K., Gaur, R.B., Verma, R.S. and Yadava, D.K.2000. Evaluation of front line demonstrations toidentify adoption gaps in Chickpea production inirrigated conditions of Sriganganagar district. IndianJournal of Pulses Research. 13(1): 28-30
Singh, R.K., Gaur, R.B., Verma, R.S. and Yadava, D.K,Singh, V. and Prakash, V. 2002. Evaluating gaps intransfer of technology in Chickpea front linedemonstrations in semi-arid region of Rajasthan.Haryana Journal of Agronomy, 18(1&2): 110-114.
Subhash C. and Chandra, A. 2002. Success story of mothvariety RMO-40. Krishi Vistar Samiksha, Sept.-Oct.:15-16
Yadav, D.B., Kamboj, B.K. and Garg, R.B. 2004.Increasing the productivity and profitability ofsunflower through front line demonstrations inirrigated agroecosystem oooof eastern Haryana.Haryana Journal of Agronomy, 20(1&2): 33-35.
Yadav, V.P.S. 2007. Boosting pulse production technologythrough front line demonstration. Indian Res. J. Ext.Edu. 7(2&3) May & September:12-14.
Vasanthakumar, J. and Tamil Selvi, G. 1999. yield gapin paddy and extent of adoption of improved paddypractices. Agricultural Extension review, Nov.-Dec.:16-21.

Journal of Progressive Agriculture, Vol.4, No. 2: October, 2013
14
Effect of different spacing and fertilizer levels on yield parameters of mungbean underguava based agri-horti system
1SURENDRA KUMAR, 1R.S. MEENA, 1PRAVESH KUMAR, 2RAJESH DADHICH AND 1AJEET SINGH1Depptartment of Agronomy, Institute of Agricultural Sciences, BHU, Varanasi (UP) - 221 005
2 National Seeds Corporation Limited (A Govt. India Undertaking), (UP) Varanasi- 221 008*Email: [email protected]
Received: August, 2013Accepted: Sept., 2013
ABSTRACT
A field experiment was conducted during kharif season of 2012-13 to find out suitablemanagement practice to manage agri- horti system under Psidium guajava L. based agroforestry system.Suitability of the method was assessed based on yield of mungbean. The yield attributes i.e. pod/plant,pod length, number of seeds/pod, seed yield, stover yield, biological yield and harvest index weresignificantly influenced with distance and RDF levels. The seed yield of mungbean was significantlyhigher due to tree management practices imposed to Psidium guajava L. Seed yield as affected bydistance from tree was found significant in D2 (2.0 m away from tree 748 kg/ ha) recorded significantlyhigher seed yield than D1 (1.25 m away from tree 629 kg/ ha) in mungbean. Seed yield as affected by RDFlevels were also found significant. No significant difference recorded in between F3 (75% RDF) and F4(125% RDF) and they were found significantly superior than remaining RDF levels. Lowest seed yieldrecorded in F1 (50% RDF) level. Interaction between distance from tree and RDF level was foundsignificant. The seed yield of mungbean significantly higher with the combination of 2.0 m away from treeand 100% RDF level.
Key words: Distance, Mungbean, Psidium guajava L., RDF levels, Yield parameters
In agroforestry, trees and agricultural crops arecombined together and they compete with each otherfor growth resources such as light, water andnutrients. The resource sharing in component cropsmay result in complementary or competitive effectdepending upon nature of species involved in thesystem. Psidium guajava L. is one of the fast growingfruit tree species, which is being promoted forcultivation by the wood fruit based industries in thefarmers field in Uttar Pradesh state. Hence many ofthe small and marginal farm in Vindhyan region, aregrowing this particular tree species on the field bunds.
Mungbean [Vigna radiata (L.) Wilczek] is oneof the most ancient and extensively grownleguminous crops of India. Mungbean is an excellentsource of high quality protein. It contains about 25per cent protein. It is primarily a rainy season crop butwith the development of early maturing varieties, ithas also proved to be an ideal crop for spring andsummer seasons. It can also be used as a greenmanure crop and its green plants are used as fodderafter removing the mature pods. It also contains highquality of lysine (4600 mg/ g N) and tryptophan (60mg/ g N) and consumed as whole grain or as well asin the form of Dal for table purposes. Mungbean issupposed to be easily digestible and, hence, ispreferred by patients. The sprouted seeds ofmungbean are rich in ascorbic acid (vitamin C),riboflavin and thiamine (Choudhary, 2010).
Distance from the tree row is an importantfactor that determines the extent of influence to theadjoining crop. Trees imposed the competition nearthe tree line and reduces the growth and yieldcompared to away from the tree line. As the distanceincreases from the tree row the availability ofphotosynthetically active radiation increases andcompetition for below ground resources reduces.(Patil and Channabasappa, 2008). Reduction of cropyields due to resource competition from tree hedges isa serious drawback of hedgerow intercropping.Hedgerow intercrops showed a clear reduction closerto the hedgerows, indicating significant competitionfrom hedgerows, however, growth and yield of cropsincreased with increasing distance from hedgerows(Costa and Chandrapala, 2001) Farmers have a wrongnotion that mungbean, being legume crop does notneed any nutrient and usually grow it on the marginallands without applying any fertilizer. This seems tobe an important reason for low productivity in thecountry.
MATERIALS AND METHODS
A field experiment was conducted duringkharif season of 2012-13 at Agronomy farm of RajivGandhi South Campus Banaras Hindu University,Barkachha, Mirzapur, Uttar Pradesh. Which issituated in Vindhyan region of district Mirzapur (250
10’ latitude, 820 37’ longitude and altitude of 147meters above mean sea level. This region comes

Journal of Progressive Agriculture, Vol.4, No. 2: October, 2013
15
under agro-climatic zone III A (Semi-Arid EasternPlain Zone) and the region is mostly rainfed.Vindhyan soil comes under rainfed and has invariablypoor fertility status. The soil of the experimental sitewas sandy loam and having 183.33 kg/ha alkalinepermanganate oxidizable N (Subbiah and Asija 1956),15.55 kg/ha available P (Olsen et al. 1954), 122.0kg/ha 1 N ammonium acetate exchangeable K(Stanford and English 1949) and 0.27% organiccarbon (Jackson 1973). The pH of soil was 5.4 (1:2.5soil and water ratio). Guava trees were six year oldplanted in august 2007 at a spacing of 7 X 7 meter.Mungbean was sown as an intercrop. The experimentwas conducted in factorial randomized block designhaving five levels of N + P + K and two level ofdistance i.e. 1.25 m away from tree (D1) and 2.0 maway from tree (D2) in guava-mungbean agri-hortisystem with three replications. The treatments wererandomized as per statistical procedure. Experimentconsists total 10 treatment combinations. Gross andnet plot sizes of treatment (D1 and D2) were 3 X 4.5m, 2 m X 3.3 and 3 X 3 m, 2 X 1.8 respectively.Mungbean crop was sown adjacent to fruit plantedtree species at 15th August with recommendedpackage of practice. ‘HUM-16’ variety of mungbeanwas used for sowing. All the data obtained fromgroundnut for two consecutive years of trails werestatistically analyzed using the F-test (Gomez andGomez 1984). Critical difference (CD) values atP=0.05 were used for determine the significance ofdifferences between mean values of treatments.
RESULTS AND DISCUSSION
Effect of distanceResults of the experiment were revealed that
the yield parameters were observed significant withdistance from tree i.e. number of pod/ plant, podlength, number of seeds/pod, seed yield, stover yield,biological yield and harvest index (Table1). Yieldparameters of mungbean were observed significantlyhigher in D2 distance (2.0 m away from tree) fromtree, number of pod/ plant ( 8.92), Pod length(6.20cm), number of seeds/pod (9.43), seed yield(7.48 kg/ha), biological yield (2775 kg/ha) andharvest index (26.55%) than D1 (1.25 m away fromtree). Guava offered the maximum competition nearthe tree line (1.25 m) and reduced the seed yield up to15.90 %, compared to away from the tree line (2.0m). The maximum seed yield of mungbean wasrecorded in 2.0 m away from the tree row (748 kg/ha) which was significantly higher than 1.25 m awayfrom tree row (629 kg/ ha). The extent of reduction inthe yield of mungbean near the tree row i.e. 1.25 maway from tree line may be attributed to severecompetition by the tree roots which get reduced withincrease in distance from tree line and shade from the
guava tree also might have reduced the yieldparameters near the tree row. This reduction in theseed yield near the tree row may also be ascribed tolower soil moisture and low availability of light nearthe tree row and also harmful impact of these factorsobserved in the reduction of yield parameters. Similarfindings recorded by Patil et al. (2011); Kaushal andVerma, (2013).
Effect of RDF levelsResults of the experiment were revealed that
increased RDF levels up to 125% recorded theenhanced pod length, number of pod/ plant, numberof seed/ pod, test weight, seed, straw, biological yieldand harvest index over the remaining RDF level. Itwas due to enhanced vegetative growth in terms ofdry matter production and branches/ plant providedmore sites for the translocation of photosynthates andultimately resulted in increased yield parameterswhich were significantly benefitted with theavailability of nutrients during crop growing season,that ultimately contributed towards higher yield(Table 1). It is an established fact that nitrogen andphosphorus plays an important role in the formationof new shoots thereby; increase in the number ofbranch/ plant. In addition, it regulates thephotosynthesis and carbohydrate metabolism whichcan be considered to be one of the major factorslimiting growth particularly during the reproductivephase. As stated earlier, the adequate supply ofnitrogen, phosphorus along with potassium play avital role in metabolic process of photosynthesis thatresult in increased flowering and fruiting therebyimproving number of pod/ plant, number of seed/ podand test weight. The increase in above parameterswith the application of nitrogen, phosphorus andpotassium to its appropriate level might be due to itsfavorable effect on growth parameters. Thesignificant increase in number of pod/ plant due to theapplication of 125% RDF level might be on accountof better removal and translocation of nutrients,especially phosphorus, resulting in higher number ofpod/ plant. The results were in close conformity withthe observations recorded by Meena (2005); Meena(2013)
Interaction between distance from tree forseed yield (kg/ ha) was found to be significant (Table2). Seed yield was found significantly different withF3 (100% RDF) and F2 (75% RDF) over both thedistances while remaining doses were found at par. AtD1 RDF level F4 (125% RDF) being at par with F3
(100% RDF) found significantly superior overremaining treatments while at D2, F3 (100% RDF)found numerical higher seed yield but statistically atpar with F4 (125% RDF) and significantly superiorover other treatments. Lowest seed yield recorded byF1 (50% RDF) level at both the distances

Journal of Progressive Agriculture, Vol.4, No. 2: October, 2013
16
Table 1 Effect of different distance from tree and RDF levels on yield parameters of under guava(Psidium guajava L.) based agri-horti system
Treatment No. ofPod/plant
Pod length(cm)
No ofseed/pod
Testweight(g)
Seed yield(kg/ ha)
Stoveryield
(kg/ha)
Biologicalyield
(kg/ ha)
Harvestindex(%)
D-distance from treeD1-1.25 m away fromtree
7.66 6.08 9.07 27.88 2.33 1977 2606 23.90
D2- 2.0 m away fromtree
8.92 6.20 9.43 28.15 0.04 2027 2775 26.55
CD (p=0.05) 0.16 0.10 0.15 NS 41 NS 160 1.24
F-RDF levelsF1- 50% RDF 6.78 6.00 8.68 26.84 481 1740 2221 21.65
F2- 75% RDF8.05 6.16 9.17 28.16 643 1971 2614 24.53
F3-100% RDF 9.25 6.27 9.75 28.98 892 2250 3142 28.35
F4-125% RDF 9.63 6.22 9.78 28.90 882 2187 3069 28.85F5-150% RDF 7.73 6.08 8.87 27.19 547 1860 2407 22.75
CD (p=0.05) 0.26 0.16 0.24 0.59 65 181 254 1.97
Table 2 Interaction between distance and RDF levels on Seed yield (kg/ha) of mungbeanDistance/ RDF levels 50% RDF 75% RDF 100% RDF 125% RDF 150% RDF
D1-1.25 m away from tree 460 575 766 832 513
D2- 2.0 m away from tree 501 710 1018 931 580
CD (p=0.05) 113
REFERENCES
Chaudhary, H.R. 2010. Integrated Nutrient Managementin Mungbean [Vigna radiate (L.) Wilczek]. M.Sc.(Ag.),Thesis, Rajastan Agricultural University,Bikaner.
Costa, WAJMD and Chandrapala, A.G. 2001. Effects ofdifferent tree species on growth and yield of mungbean (Vigna radiata (L.) Wilczek) grown in hedgerowintercropping systems in Sri Lanka. Journal ofAgronomy and Crop Science 184, 1: 43-48.
Gomez, K.A. and Gomez, A.A. 1984. StatisticalProcedures for Agricultural Research. John Wiley &Sons, Singapore. Pp 693
Jackson, M.L. 1973. Soil Chemical Analysis. Prentice Hallof India Pvt Ltd, New Delhi.
Kaushal, R. and Verma, K.S. 2013. Tree-crop interactionstudies in natural agroforsty system: A case studyfrom western Himalayas in India tree-crop.Interaction Studies in Natural AgroforestrySystem.pp34-39
Meena, R.S. 2005. Effect of organic and inorganic sourcesof nutrients on growth, yield and quality of mungbean[Vigna radiata (L.) Wilczek]. M.Sc. Thesis, RajasthanAgricultural University, Bikaner.
Meena, R.S. 2013. Effect of Organic and Inorganic Sourcesof Nutrient on Growth Attributes and Dry MatterPartitioning of Mungbean [Vigna radiata (L.)Wilczeck] in Arid Western Rajasthan. Environment &Ecology 31(1): 131-134.
Olsen, S.R., Cole, C.V., Watanabe, F.S. and Dean, L.A.1954. Estimation of available phosphorus in soils byextraction with sodium bicarbonate. USDA Circ. No.939, Washington.
Patil, H.Y., Patil, S.J., Mutanal, S.M., Chettiand, M.B.,Arvinda, K. 2011. Productivity of legumes asinfluenced by morphological characters in teak basedagroforestry system. Karnataka Agriculture Science,24(4): 483-486.
Patil, M.B. and Channabasppa, K.S. 2008. Effect of treemanagement practices in Acacia auriculiformis basedagroforestry system on growth and yield ofassociated black gram. Karnataka JournalAgriculture Science 21(4): 538-540.
Singh Narendra, Midha L.K., Prasad Dasharath,Vandana Asha Ram and Singh Parmeshwer 2013.Effect of spacing and nitrozen levels on nutrientcontents and their uptake in hybrid pearl millet,Journal of Progressive Agriculture. 4 (1) April: 85-86.
Stanford, S. and English, L. 1949. Use of flamephotometer in rapid soil tests for K and Ca. Agron J.41: 446-7.
Subbiah, B.V. and Asija, G.L. 1956. A raped processor ofdetermination of available nitrogen in nitrogen in soil.Current science 25:259-260.

Journal of Progressive Agriculture, Vol.4, No. 2: October, 2013
17
Point –biserial technique to measure the validity of knowledge test
1NEETA KHANDELWAL AND 2K.L. DANGI1Assistant Professor, Dept. of Home Science Ext. Edu., ASPEE College of Home Science
and Nutrition, SDAU, Gujarat2 Professor, Dept.of Ext. Education, R.C.A., MPUAT, Udaipur-313001(Raj.)
Received: Jan., 2013Accepted: Sept., 2013
ABSTRACT
Behavioral scientists often restrict to measure the tests’ validity with the help of content validity orsome other convenient or easiest techniques which are not statistical. Therefore, we can not rely moreon these techniques. The term validity means truthfulness. Lindquist (1951) defined “validity of a testas the accuracy with which it measures that is intended to be measured.” One common technique usedto measure item validity of test is the point -biserial correlation (rpb). The “pt bis”, as it is sometimescalled is the correlation between an item score (1/0) and the total score on a test (Downee and Heath,1970). The present paper attempts to measure the validity of a knowledge test with the help of point-biserial correlation coefficient. Point-biserial technique is more powerful than that of biserial technique.The present paper is based on original data. Behavioural scientists and students are advised to usethis mathematical technique which proves to be more authentic.
Key words: Point –biserial technique, validity of knowledge test
Point–biserial correlation coefficient (rp-bis) isestimated for establishing internal validity of tests’during their construction. Though, this technique isconsidered only when items are scored simply as 1 ifthe response toward items is correct and 0 forincorrect. Point- biserial assumes that the variable,which has been classified into two categories, can bethought of as concentrated at two distinct points alonga graduated scale or continuum.
Point-biserial correlation is mathematicallyequivalent to the Pearson product moment correlation.The point -biserial correlation coefficient (rpb) isconsidered only in the situations or circumstances,especially in the field of test construction when onevariable is continuous and the other is conceived asdichotomous (e.g. Y).
In the usual scoring of items, the procedure is tomark the item either right or wrong. This right -wrong scoring is regarded as being a true dichotomy.Y can either be "naturally" dichotomous, like gender,or an artificially dichotomized variable. In mostsituations, it is not advisable to artificiallydichotomize variables. When we artificiallydichotomize a variable, the new dichotomous variablemay be conceptualized as having an underlyingcontinuity. If this is the case, a biserial correlationwould be more appropriate computation.
In the present study, the validity of theknowledge test of tribal and non- tribal womenregarding natural resources conservation wasmeasured using following formulae of point-biserialtechnique:
rpb =t
tp
S
XX
q
p
Where,
pX = The mean score of those
respondents answering the item correctly
tX = The mean of the total test
scores
tS = Standard Deviation
p = the proportion of the totalrespondents answering the item correctly
q = 1- p
Correlation coefficient was worked out for allthe items separately, one after another, havingdifficulty index between 30 to 80. The range of 30 to80 was arbitrarily fixed up by the authors. The Point –biserial value for all the items were tested forsignificance with n-2 degree of freedom, where ‘n’was the total number of respondents and degree offreedom was 2 because there were two types ofrespondents. Items having significant biserialcorrelation at 0.01 and 0.05 level of probability wereselected for the final format of knowledge test. Fortesting the significance of departure of correlationcoefficient from zero, the required‘t’ test of thedifference between means was estimated with thehelp of following formula:
t = rpb 21
2
rpb
n

Journal of Progressive Agriculture, Vol.4, No. 2: October, 2013
18
Where,rpb = Point –biserial correlation coefficientn = number of total respondents.Illustration: The point- biserial correlation
coefficient is being illustrated below with the help ofempirical data (Khandelwal, 2006). This is theexample of only one item of knowledge test {whichtree species should be planted in degraded lands? -fuel wood trees (1), any other (0)} regarding soilconservation. Thirty farm women (15 tribal and 15non-tribal were selected for data collection).Thesewere other than those targeted respondents, who wereincluded in the study. These were true to the types oftargeted respondents for the study. The test-developers were concerned with how well the itemwas separating the well informed respondents fromthe poorly informed ones. Dichotomously scoreditems may also be correlated with a continuousoutside criterion, such as academic grade pointindexes or other measures of achievements.
In the first column of Table 1, total number ofrespondents was arranged in three ranges on the basisof scores in descending order. Say, range is of scores
between 26-29, there were total 12 respondents whoanswered the item correctly. Respondents whosescore was in the range of 26-29 were put in column2nd. Each interview schedule was drawn, and theresponses of the first item were tallied into eithercolumn 2nd or 3rd based on right or wrong answers.Column 4th was the total number of respondents. Thesum of this column was 30, which was the totalnumber of respondents who replied correctly and thenumber of respondents who responded incorrectly tothe item. Column 5th indicated the reference point.The reference point (x’) in the present case was themidpoint of the mid range (22-25) which came to be23.5. The reference point of mid range and the sum ofall the reference points is always zero. Column 6th
was the multiplication of respective values ofcolumns 4th and 5th. Column 7th was the square ofcolumn values of 5th and multiplication with column6th. The mean of the respondents who answered theitem was also needed. Hence, column 8th was set upwhich contains the products of the values of column2nd and 5th (fpx’).
Table 1: Worksheet for the Point-biserialRange of Score
(1)Fp(2)
fw(3)
Ft(4
)
x'(
5)
ft x’(6)
ft 2'x(7)
fp x’(8)
26-29 12 0 12 1 12 12 1222-25 5 3 8 0 0 0 018-21 2 8 10 -
1-10 10 -2
f
p = 19
fw =11
ft =30
x’=0
ft
x’ = 2ft
2'x = 22
fpx
’ = 10
Where,fp = Frequency of the respondents who
replied correctly to test itemfw = Frequency of the respondents who
replied incorrectly to test itemft = Total frequency of respondentsx' = Reference point (23.5 in the present
example)ft x’ =Scores obtained by multiplying the
respective values of column 4th and 5th
ft2'x =Scores obtained by squaring the
respective values of column 5th and multiplying withcolumn 6th
fp x’=Scores obtained by multiplying therespective values of column 2nd and 5th
rpb
t
tp
S
XXbiserialPo
)int(
q
p
First two means were found out as follows:
pX= x’ +
fp
fpx 4)'(
(4 was the total number in one range, (that
was 26-29) means 4 in this case)
(i) pX = 23.5 +19
)10( 4
= 25.6
(ii) tX= x’ +
ft
ftx 4)'(
= 23.5 +30
)2( 4
= 23.7

Journal of Progressive Agriculture, Vol.4, No. 2: October, 2013
19
The standard deviation was also computed as given below:
2x = 2
2
2 4
N
XX
(Here 2x=
2ftx, 2x
= 'ftx
andN was the total number of respondents, who
were 30 in the present case)
= 2
2
430
222
= (22- 0.13) (16)
= 349.92
tS =30
92.349= 3.41
P =30
19= 0.63
q = 1-p = 1- 0.63 = 0.37
rpb41.3
7.236.25
37.0
63.0
=41.3
9.1702.1 = 0.557 1.304 = 0.72
t = 0.722)72.0(1
230
= 0.7248.
28
= 0.72 33.58 = 0.72 7.63 = 5.493
Since the calculated value of‘t’ (5.493) wasgreater than that tabulated value of ‘t’ (2.763) at 0.01level of significance with 28 degree of freedom.Therefore, it was inferred that there had beensignificant difference between tribal and non-tribalwomen with regards to knowledge of one item of soilconservation practices. More clearly; the item (whichtree species should be planted in degraded lands?)was capable of differentiating well informed womenfrom poorly ones. Hence, the item was included in thefinal format of the knowledge test.
REFERENCES
Lindquist, E.F. (ed.), 1951. Educational Measurement.Research methods in social sciences and extensioneducation. Variables and their measurements: 18-33.
Khandelwal, N. 2006. An analytical study on conservationof natural resources by tribal and non-tribal women ofUdaipur district of Rajasthan, Ph.D Thesis (Ext.Edu.).Submitted to Rajasthan College of agriculture,
Maharna Pratap University of Agriculture andTechnology, Udaipur (Rajasthan).
Downee, N.M. and Heath, R. W. 1970. Basic statisticalmethods. Third edition. Harper international edition,Harper and row publishers, New York, Evanston andLondon.

Journal of Progressive Agriculture, Vol.4, No. 2: October, 2013
20
Evaluation of different mutant lines of isabgol (Plantago ovata Forsk) for seed yield andbiochemical parameters
A.K.SHARMA AND RAJU RAM MEGHWALDepartment of Plant Breeding &Genetics, College of Agriculture, Bikaner,
SK Rajathan Agri. University, BikanerEmail: [email protected]
Date of Received: July, 2013Date of Acceptance: Sept., 2013
ABSTRACT
A field trial of 121 mutant lines of isabgol was conducted to evaluate the productivity andquality of isabgol in term of seed yield and biochemical parameters. All the mutant lines exhibited awide range of variability in biochemical parameters as well as seed yield. The mutant lines viz; RIM-4-500-53,RIM-2-1000-40, RIM-2-100-48, RIM-2-900-41 ,RIM-2-700-43and RIM-89-800-35 were found tobe the best in term of seed yield with all other biochemical parameters likes total chlorophyll content,protein, husk, sugar and swelling percent studied.
Key words: Carbohydrate, Chlorophyll, Isabgol and Nitrogen.
Isabgol is medicinal plant, valued for its husk Itbelongs to the family Plantaginaceae and genusPlantago with chromosome number 2n=8 (Hyde,1953; Bassett and Baum, 1969). The seed husk of thisplant is commonly called Psyllium .The seed andhusk is used for medicinal purposes (Karnick, 1976;Gupta, 1987; Wolver et al., 1994; Galindo et al.,2000; Maiti and Mandal, 2000; Aishwath and Ram,2008). The seed of isabgol contains mucilage (10-12%), fatty oil (5%) and large quantities ofalbuminous mater which is a pharmacologicallyinactive glycosides viz. Acubin and a pentose sugar.(Chevallier, 1996; Jamal et al., 1987; Sharma andKaul, 1986) The seed husk has the property ofabsorbing and retaining water which accounts for itsutility in checking constipation, diarrhea andintestinal irritation. Isabgol is also an excellent sourceof dietary fiber. The husk has the property ofabsorbing and retaining water and therefore, it hasnumerous pharmaceutical uses principally as swellingdietary and potentially for lowering blood cholesterollevel. It is beneficial in chronic dysenteries ofamoebic and bacillary origin (Mehta et al., 1976).Thepresent study was therefore, undertaken to evaluatethe performance of different mutant lines of isabgolfor yield and biochemical parameters.
MATERIALS AND METHODS
The experiment material comprised of 121mutant lines of isabgol (Plantago ovata Forsk.)derived from treatment of gamma rays. These lineswere raised in augmented design (Federer, 1956) with12 blocks and each having 10 test genotypes and 4check varieties namely RI-89, GI-2, NIHARIKA andHI-5 at Research Farm College of Agriculture,Bikaner during Rabi 2012. Each genotype wasassigned a single row plot of 4 meter long with 30 cmrow to row and 10 cm plant to plant distance.
Observations were recorded on ten randomly selectedcompetitive plants to study the total chlorophyllcontent, protein percent, husk percent, sugar content,swelling percent, seed yield per plant, harvest indexand biological yield per plant. The mean values wereused for statistical purposes.
BIOCHEMICAL PARAMETERS:Leaf chlorophyll (total Chl.) content was
estimated by acetone extraction method. (Arnon,D.I.1949). Nitrogen content of seed was estimated at75 DAS maturity stage by calorimetric method (Snelland Snell 1949). Value of nitrogen obtained wasconverted to crude protein percent by multiplyingwith factor 6.25. Estimated soluble carbohydrate byanthron reagent method (Dubois et al. 1956).Swelling factor was estimated by modified method ofKalyanasundaram et aI. (1982) from one gram seed ofeach genotype and husk percent estimated bymechanical method.
RESULTS AND DISCSSION
The results for the biochemical estimation ofdifferent best mutant lines of isabgol in respect ofseed yield with other parameters are presented inTable (1). The data revealed that results were highlysignificant for all the characters. Among all the121mutant lines only, twenty mutant lines showed highleaf chlorophyll content than all the check varieties. Itranged from 1.63 (RIM5-1-19) to 1.73mg/g (RIM84-75-34). The line RIM-4-200-59(17.56) exhibitedmaximum protein percentage followed by RIM-4-600-52 (17.17and RIM-4-500-53 (17.01). The husk isa important constituents in isabgol, used for curing ofmany diseases. The maximum husk percentage wasobserved in RIM-108-90-35 (31.54), RIM-2-700-43and RIM-2-800-42 (31.22) and RIM-2-900-41(30.17).The same range of husk per cent age was alsoreported by (Lal and Sharma, 2002). The high mean
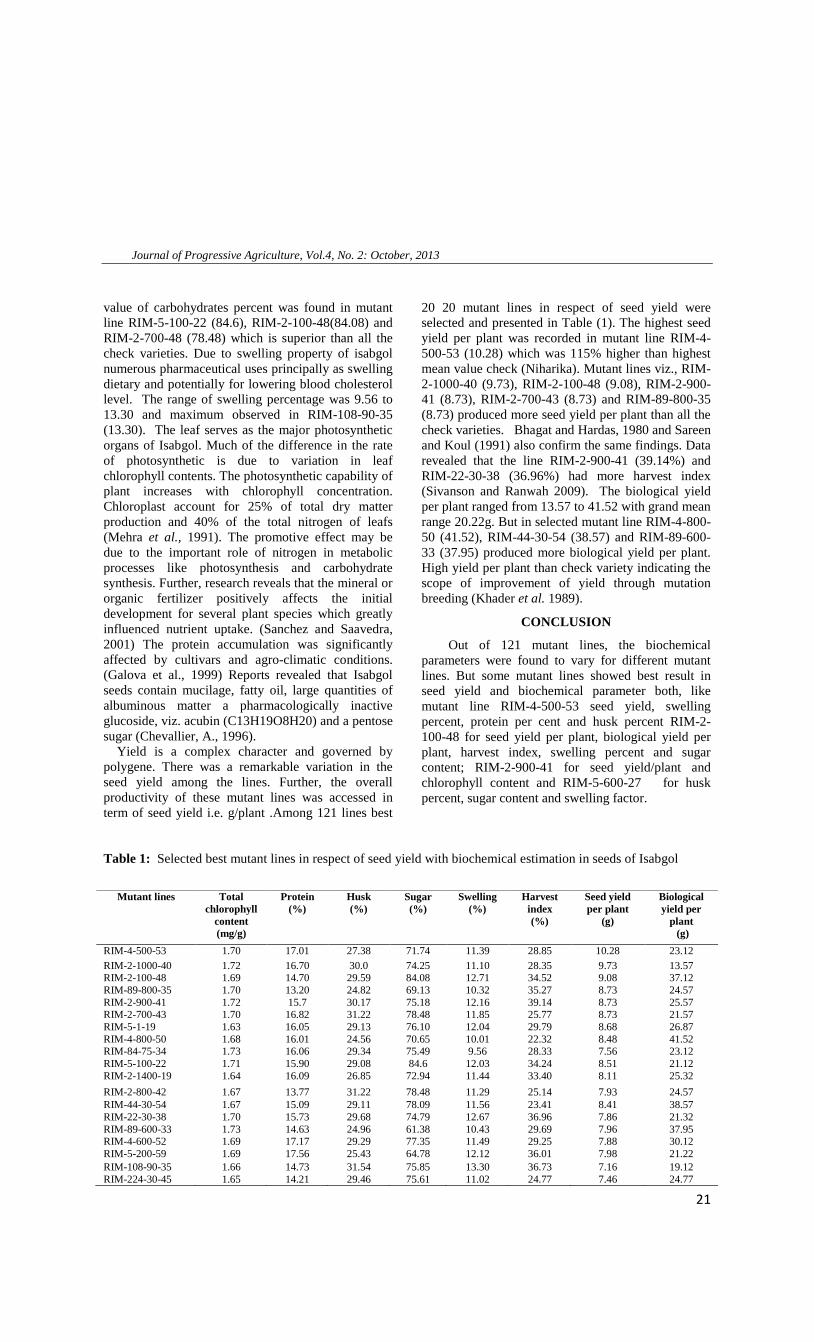
Journal of Progressive Agriculture, Vol.4, No. 2: October, 2013
21
value of carbohydrates percent was found in mutantline RIM-5-100-22 (84.6), RIM-2-100-48(84.08) andRIM-2-700-48 (78.48) which is superior than all thecheck varieties. Due to swelling property of isabgolnumerous pharmaceutical uses principally as swellingdietary and potentially for lowering blood cholesterollevel. The range of swelling percentage was 9.56 to13.30 and maximum observed in RIM-108-90-35(13.30). The leaf serves as the major photosyntheticorgans of Isabgol. Much of the difference in the rateof photosynthetic is due to variation in leafchlorophyll contents. The photosynthetic capability ofplant increases with chlorophyll concentration.Chloroplast account for 25% of total dry matterproduction and 40% of the total nitrogen of leafs(Mehra et al., 1991). The promotive effect may bedue to the important role of nitrogen in metabolicprocesses like photosynthesis and carbohydratesynthesis. Further, research reveals that the mineral ororganic fertilizer positively affects the initialdevelopment for several plant species which greatlyinfluenced nutrient uptake. (Sanchez and Saavedra,2001) The protein accumulation was significantlyaffected by cultivars and agro-climatic conditions.(Galova et al., 1999) Reports revealed that Isabgolseeds contain mucilage, fatty oil, large quantities ofalbuminous matter a pharmacologically inactiveglucoside, viz. acubin (C13H19O8H20) and a pentosesugar (Chevallier, A., 1996).
Yield is a complex character and governed bypolygene. There was a remarkable variation in theseed yield among the lines. Further, the overallproductivity of these mutant lines was accessed interm of seed yield i.e. g/plant .Among 121 lines best
20 20 mutant lines in respect of seed yield wereselected and presented in Table (1). The highest seedyield per plant was recorded in mutant line RIM-4-500-53 (10.28) which was 115% higher than highestmean value check (Niharika). Mutant lines viz., RIM-2-1000-40 (9.73), RIM-2-100-48 (9.08), RIM-2-900-41 (8.73), RIM-2-700-43 (8.73) and RIM-89-800-35(8.73) produced more seed yield per plant than all thecheck varieties. Bhagat and Hardas, 1980 and Sareenand Koul (1991) also confirm the same findings. Datarevealed that the line RIM-2-900-41 (39.14%) andRIM-22-30-38 (36.96%) had more harvest index(Sivanson and Ranwah 2009). The biological yieldper plant ranged from 13.57 to 41.52 with grand meanrange 20.22g. But in selected mutant line RIM-4-800-50 (41.52), RIM-44-30-54 (38.57) and RIM-89-600-33 (37.95) produced more biological yield per plant.High yield per plant than check variety indicating thescope of improvement of yield through mutationbreeding (Khader et al. 1989).
CONCLUSION
Out of 121 mutant lines, the biochemicalparameters were found to vary for different mutantlines. But some mutant lines showed best result inseed yield and biochemical parameter both, likemutant line RIM-4-500-53 seed yield, swellingpercent, protein per cent and husk percent RIM-2-100-48 for seed yield per plant, biological yield perplant, harvest index, swelling percent and sugarcontent; RIM-2-900-41 for seed yield/plant andchlorophyll content and RIM-5-600-27 for huskpercent, sugar content and swelling factor.
Table 1: Selected best mutant lines in respect of seed yield with biochemical estimation in seeds of Isabgol
Mutant lines Totalchlorophyll
content(mg/g)
Protein(%)
Husk(%)
Sugar(%)
Swelling(%)
Harvestindex(%)
Seed yieldper plant
(g)
Biologicalyield per
plant(g)
RIM-4-500-53 1.70 17.01 27.38 71.74 11.39 28.85 10.28 23.12RIM-2-1000-40 1.72 16.70 30.0 74.25 11.10 28.35 9.73 13.57RIM-2-100-48 1.69 14.70 29.59 84.08 12.71 34.52 9.08 37.12RIM-89-800-35 1.70 13.20 24.82 69.13 10.32 35.27 8.73 24.57RIM-2-900-41 1.72 15.7 30.17 75.18 12.16 39.14 8.73 25.57RIM-2-700-43 1.70 16.82 31.22 78.48 11.85 25.77 8.73 21.57RIM-5-1-19 1.63 16.05 29.13 76.10 12.04 29.79 8.68 26.87RIM-4-800-50 1.68 16.01 24.56 70.65 10.01 22.32 8.48 41.52RIM-84-75-34 1.73 16.06 29.34 75.49 9.56 28.33 7.56 23.12RIM-5-100-22 1.71 15.90 29.08 84.6 12.03 34.24 8.51 21.12RIM-2-1400-19 1.64 16.09 26.85 72.94 11.44 33.40 8.11 25.32
RIM-2-800-42 1.67 13.77 31.22 78.48 11.29 25.14 7.93 24.57RIM-44-30-54 1.67 15.09 29.11 78.09 11.56 23.41 8.41 38.57RIM-22-30-38 1.70 15.73 29.68 74.79 12.67 36.96 7.86 21.32RIM-89-600-33 1.73 14.63 24.96 61.38 10.43 29.69 7.96 37.95RIM-4-600-52 1.69 17.17 29.29 77.35 11.49 29.25 7.88 30.12RIM-5-200-59 1.69 17.56 25.43 64.78 12.12 36.01 7.98 21.22RIM-108-90-35 1.66 14.73 31.54 75.85 13.30 36.73 7.16 19.12RIM-224-30-45 1.65 14.21 29.46 75.61 11.02 24.77 7.46 24.77

Journal of Progressive Agriculture, Vol.4, No. 2: October, 2013
22
(a)*b/w two check mean, (b)*b/w two mutant line of same block, (c)*b/w checks and mutant line mean
REFERENCES
Aishwath, O.P. and Ram, C. 2008. Response of blondpsyllium (Plantago ovata) to split application ofnitrogen on growth, yield and quality, Indian J. Agric.Sci. 78: 323-327
Arnon, D.I. 1949. Copper enzymes in isolated chloroplast;I. polyphenol oxidase in Beta vulgaris. Pl. Phy. 24:1-15.
Bassett, I.J. and Baum, B.R. 1969. Co specificity ofPlantago fastigiata of north America with P. ovata ofthe old world. Can J. Bot. 47:1865-68.
Bhagat, N.R. and Hardes, M.W. 1980. Studies onvariation and association among seed yield and somecomponent traits in Plantago ovata Forsk. Indian Drugs17: 376-381.
Chevallier, A. 1996. The Encyclopedia of MedicinalPlants. Dorling Kindersley, London, UK.
Dubois, M., Gilles, K.A., Hemilton, J.K., Robbersand,P.A. and Smith, F. 1956. Calorimetric method fordetermination of sugars and related substances. Analyte.Chem. 28:350-356.
Federer, W.T. 1956. Augmented Design. Hawain PlantersRecord. 20: 191-207.
Hyde, B. 1953. Differential chromosomes in Plantagoovata. Amar J. Bot. 40: 8-15.
Gupta, R. 1987. Medicinal and Aromatic Plants. Handbookof Agriculture, Indian Council of Agriculture Research,New Delhi, India, pp. 1188-1224.
Galindo, P.A., Gómez, E., Feo, F., Borja, J., Rodriguez,R.G. 2000. Occupational Asthma Caused by PsylliumDust (Plantago ovata). In: The 6th Internet WorldCongress for Biomedical Sciences.pp.67.
Galova, Z., Smolkova H. and Michalik, I. 1999.Formation of protein complex during grain wheatmaturation. Rostlinna vyro. 45(4): 183-188.
Jamal, S.I, Ahmad, R. Agrawal, Ahamed, M. and,Osman, S. 1987. A novel oxo fatty acid in Plantagoovata seed oil. Phytochemistry. 26(11): 3067-3069.
Karnick, C.R.1976. Studies on cultivation of Indianmedicinal plant series 1: Isabgol (Plantago ovata) inPoona. Indian drug and pharmaceuticals industry, Nov.-Dec.: 41-42.
Kalyanasundaram, N.K. and Dalal, K.C. 1981.Correlation between yield components and seed yield inisabgol (Plantago ovata Forsk.). Agric. Sci. Digest. 1:85-86.
Khadar, A., Selvarajan, M., Shanmugavelu, K.G., Peter,G.B. and Vedamuthe 1989. Genetic variability incertain mutant line of coriander (coriandrum staivumL.). Ist national seminar on seed spices held at JaipurOct. 24-25.
Lal, R.K. and Sharma, J.R. 2002. Induction of gammairradiation (60CO), in isabgol characterization andutilization of mutants for economic traits in isabgol(Plantago ovata Forsk). J.M. A. P. S, 24: 689-694.
Maiti, S. and Mandal, K. 2000. Cultivation of Isabgol.National Research Center for Medicinal and AromaticPlants, Anand, Gujarat, Bulletin, pp. 1-8.
Mehra, R., Shukla, D.S. and Pande, P.C. 1991. Studieson the mechanism of temperature tolerance in wheat(Triticum aestivum L.). Indian J. Plant Physio. 34(4):362-368.
Sanchezm, S. and Saavedra, M. 2001. Influence offertilizer on native species development withrevegetation purpose: preliminary results. Acts conreso-2002-Sociedad-Espanola-de-Malherbologio; Leon-Spain, 20, 21, de noviembre, de, 16-64.
Sareen, S. and Koul, A.K. 1991. Gamma ray inducedvariation in Plantago ovata. Crop Improv.18(2):144-147.
Sharma, P.K. and Koul, A.K. 1986. Mucilage in seed ofPlantago ovate and its wild allies. J.Ethopharmacol.17:289-95.
Sivaneson, S. and Ranwah, B.R. 2009. Induced geneticvariability and character association in isabgol(Plantago ovate Forsk.).J.M.A.P.S. 31(4):344-347.
Snell FD and Snell CT 1949. Colorimetric MethodAnalysis. D. Van Nostrand Company, Inc., New York.pp. 804-805.
Wolve, T.M.S., Jenkins, D.J.A., Mueller, S., Boctor, D.L.and Ransom, T.P.P. 1994. Method of administrationinfluences the serum cholesterol-lowering effects ofPsyllium. Am. J. Clinic. Nutri. 59: 1055-1059.
RIM-95-75-55 1.70 15.09 29.11 78.09 11.89 30.99 8.41 23.41ChecksRI-89 1.26 14.76 25.96 69.39 9.12 15.13 4.23 24.18GI-2 1.01 15.07 27.31 69.33 9.68 14.18 4.32 22.14NIHARIKA 1.21 15.34 28.52 74.61 10.34 16.23 4.77 26.56HI-5 1.21 15.34 27.61 71.79 9.37 16.77 3.44 25.84C.D. valuesa* 0.026 0.712 1.479 3.793 0.552 1.527 0.664 2.505
b* 0.091 2.465 5.124 13.139 1.913 5.290 2.300 8.678C* 0.075 2.028 4.217 10.811 1.574 4.353 1.893 7.140

Journal of Progressive Agriculture, Vol.4, No. 2: October, 2013
23
Trickle down effect of community information
1GHADEI, K. AND 2PUSHPENDRA KUMAR1Assistant Professor Deptt. Of Extension Education I. Ag. Sc. BHU Varanasi2Research scholar Deptt. Of Extension Education I. Ag. Sc. BHU Varanasi
Received: August, 2012Accepted: August, 2013
ABSTRACT
The paper is based on the study entitled “Role of NGO in Extension services: An Appraisal ofRamakrishna Ashram, Kalahandi, Orissa, with the objectives to measure socio-personalcharacteristics , attitude towards extension services ,knowledge of farmers on rice cultivation throughtraining, impact of NGO intervention on economic status of the respondents, trickledown effect ofcommunity information, pattern of extension services offered by the NGO and the constraintsencountered by the NGO and the beneficiaries in using the extension services. The patterns ofinformation delivery were classified into six groups namely training and visit approach, group approach,and community leadership approach, involving youth in extension, mass media and traditionalapproach. It was revealed that the NGO, Rama Krishna Ashram used the six systems in single or incombination to convey the massage for acceptance and adoption. The analysis of the informationmethods revealed that the traditional approaches are accepted more followed by T&V, group and youthin Extension. How ever, only mass media was found to be less preferred by the tribal farmers. Whilemeasuring the trickle down effect it was observed that 82.73% of the farmers discuss with their familymembers for adoption technology.
Key words: Discussion, Family, Information, Neighbour and Trickle down.
The objective of extension service is to bring outdevelopment of farm and farm families. Theapproaches of Ramakrishna Ashram are todisseminate technology to others who are not coveredunder programme through contact farmers. Duringand after the training, demonstration, the trainedfarmers are advised to disseminate technologies andknowledge to their fellow farmers.
MATERIALS AND METHODS
The study was conducted using “Ex-post factoresearch design”. The district Kalahandi of Orissastate was selected purposively for the present studybecause Kalahandi is the most backward and thepoorest district of Orissa and very often sufferedfrom drought and starvation. The role NGOs/VOs inthese areas carries meanings for researcher, plannerand Government against the developmentalperspective. The district consists of 13 CD blocks, outof which Ramakrishna Ashram is working in 4 C.Dblocks only. M Rampur was selected purposively outof these four blocks. A number of 12 villages were
selected randomly for experimental group from 23villages where the Ashram is offering maximumservices to the people. A list of all the 110 farmersfrom the above selected 12 villages who havereceived training from the NGO was procured forexperimental group. Same number of respondents ofcontrol group was selected from 12 villages, in whichRamakrishna Ashram was not working by applyingstratified random sampling with proportionateallocation and selecting 8 percent of respondents fromeach selected villages so that the total number ofrespondents (110) would matched with experimentalgroup. Suitable interview schedule was prepared oninformation and communication pattern of NGO andpre-tested prior to active data collection. An attemptwas made to find out role of trained farmers in thisregard to know what they do after receiving trainingfrom the Rama Krishna Ashram. The table reflects thepicture of dissemination of technology throughcontact farmers’ technique. The trickle down effectwas measured by assigning scores against each item.

Journal of Progressive Agriculture, Vol.4, No. 2: October, 2013
24
RESULTS AND DISCSSIONTable .1 .Trickle down effect of Community information
Sl.No Exp. Group(N=110)
Control Group(N=110)
Statements Frequencies Frequencies1 Discus with family members 91(82.73) 95(86.36)2 Discus with neighbours 83(75.45) 40(36.36)3 Discus in general with farmers 55(50.00) 56(50.91)4 Stimulates others for adoption of new technology 85(77.27) 45(40.91)5 Visits other villages 50(45.45) 32(29.09)6 Exhibits own activities 38(34.55) 11(10.00)
From the table.1. It is evident that more than82.73 percent of the farmers of Exp.group and 86.36percent of control group farmer’s discus with theirfamily members and neighbours about gainedknowledge and stimulate other persons to adopt newtechnology for more income.
Near about 50 percent of the farmers both fromExp. and control group discus the subject with thefarmers in general regarding the training they
received from the Ram Krishna Ashram and publicextension.
A look at the table also reveals that near about45 percent of Exp.group farmers visit others villagesto spread the message received form Ram KrishnaAshram. Near about 34.55 percent of theexperimental group farmers exhibits their ownactivities to motivate other farmers for adoption newtechnology. Similar findings have been reported byGhosh (2001) Kumar (2004) and Tripathy(2005).
REFERENCES
Aditya and Jirli Basavaprabhu 2010. ICTmedicated agricultural extension: a survey ofleading models and best practices. Journal ofProgressive Agriculture, 1(1) Oct., pp 75-83.
Ghose D.K. 2001. NGO intervention is povertyalleviation, Kurukshetra, March, pp 2-5.
Kumar, A. and Pandey K.N. 2004. An evaluativestudy of institution- village linkage programme in
Shimla district (HP),Unpub Ph.D. thesis,Department of extension education,I.Ag.Sciences, BHU pp 87-168
Tripathi S.K. 2005. Strategic media mix for effectivequality determination of information among thefarmers. Pp. Abstract and lead papers of nationalseminar on green you evergreen, the challengesbefore extension education, held at Division ofAgricultural extension, IARI, New Delhi, pp197.

Journal of Progressive Agriculture, Vol.4, No. 2: October, 2013
25
Effect of cultivars and nutrient management practices on growth, yield attributes andyield of rice in system of rice intensification
P. SRI RANJITHA, M. SRINIVASA RAJU, R. MAHENDER KUMAR AND G. JAYASREEDepartment of Agronomy, ANGRAU, Hyderabad, AP, India
Received: August, 2013Accepted: Sept., 2013
ABSTRACT
A field experiment was conducted at the Directorate of Rice Research Farm, Rajendranagar,Hyderabad during kharif 2010. The experiment was laid out in a split-plot design replicated thrice withthree rice varieties (Vasumathi, Krishnahamsa and KRH-2) and with six nutrient management practices[100% RDN through inorganic fertilizer; 75% RDN (inorganic) + 25% RDN (organic) throughvermicompost; 50% RDN (inorganic) + 50% RDN (organic) through vermicompost; 25% RDN(inorganic) + 75% RDN (organic) through vermicompost; 100% RDN (organic) through vermicompost;Control (No manure and no fertilizer)] under System of Rice Intensification (SRI). ).The results revealedthat hybrid KRH-2 performed better in terms of growth and development of the crop, yield componentsresulting in significantly higher grain and straw yields. Among the different nutrient managementpractices, application of 50 percent recommended dose of nitrogen (through urea) and remaining 50percent RDN through vermicompost resulted in significantly higher growth parameters and yieldattributes consequently resulting in highest grain and straw yields. This was followed by 100 % RDN(inorganic) and 75 % RDN (through urea) + 25 % RDN (organic) through vermicompost treatments.
Key words: Cultivars, growth, nutrient management practices, system of rice intensification,vermicompost, yield, yield attributes.
Rice, the staple cereal food grain of majority ofIndia’s over one billion population, contributes tonearly 44% of total food grain production. In India, itis grown over an area of 44.1 m.ha with a totalproduction of 105 m t and a productivity of 2393kg/ha (1). India has to produce 114 m t of rice by theyear 2030 to meet the food grain requirement ofburgeoning population. The possible way to increasethe productivity is through formulating betterproduction technologies with improved cultivars andefficient nutrient management practices. The Systemof Rice Intensification (SRI) was introduced in Indiaduring the year 2000 as a viable alternative of ricecultivation that enhances the productivity whileminimizing the inputs. However, while highlightingSRI (2) stated that the best SRI yields can be achievedwith HYV’s or hybrids. Nutrient management mustbe sound for achieving the yield potential of ricehybrids/HYV under SRI. The use of organic manuressuch as application of FYM and vermicompost hasproved to be a viable component for rice across theglobe. The quantities of organics/chemical fertilizerswhen used alone or when they are used in integratedmanner have to be determined for achieving yieldpotential of the crop under SRI. Hence, the presentinvestigation was undertaken to study theperformance of rice entries in relation to the effect ofdifferent nutrient management practices on growth,yield attributes and yield of rice.
MATERIALS AND METHODS
A field experiment was conducted at theDirectorate of Rice Research Farm, Rajendranagar,Hyderabad during the kharif season of 2010. The soilof the experimental site was clayey vertisol in texturewith a medium content of organic carbon andnitrogen, high in available phosphorus and potassiumstatus and slightly alkaline in reaction (pH 8.3). Theexperiment was laid out in a split plot designreplicated thrice with three rice varieties (Vasumathi,Krishnahamsa and KRH-2) and with six nutrientmanagement practices viz., 100% RDN throughinorganic fertilizer, 75% RDN (inorganic) + 25%RDN (organic) through vermicompost, 50% RDN(inorganic) + 50% RDN (organic) throughvermicompost, 25% RDN (inorganic) + 75% RDN(organic) through vermicompost, 100% RDN(organic) through vermicompost and Control (Nomanure and no fertilizer)] under System of RiceIntensification (SRI). Twelve days old seedlings weretransplanted by adopting a spacing of 25 cm x 25 cm.vermicompost were used as sources of organicmanure, was applied as per treatments after fieldlayout and incorporated. Urea, single super phosphateand muriate of potash were used as chemicalfertilizers. Entire dose of phosphorus and half ofpotassium and one third of nitrogen were appliedbasally. The remaining nitrogen was top dressedequally at active tillering and panicle initiation stagesas per the treatments. The remaining half of

Journal of Progressive Agriculture, Vol.4, No. 2: October, 2013
26
potassium was applied at flowering stage. Allrecommended package of practices for cultivationwere followed. The hybrid KRH-2 and scentedvariety Vasumathi were harvested on October 28while HYV Krishnahamsa was harvested on October18, at maturity and observations on growth, yieldattributes and yield were recorded. The data weresubjected to statistical analysis as described byGomez and Gomez (3).
RESULTS AND DISCUSSION
Growth ParametersWhen cultivars were compared (Vasumathi,
Krishnahamsa and KRH-2), the growth parametersi.e., plant height, number of tillers/m2 and dry matterproduction at 30 DAT, 60 DAT and at harvest werehigher with hybrid KRH-2 over the other twocultivars (Table 1). The superiority of hybrid rice hasbeen observed in terms of plant height and dry matteraccumulation at all the crop growth stages due to itshybrid vigour. The profused tillering habit of hybridcontributed to higher dry matter accumulation incomparison to varieties. These results are inconformity with those of Yan Qing quan (4) andRaghuveer Rao et al. (5). Among the differentnutrient management practices, application of 50 %RDN (through urea) + 50 % RDN (organic) throughvermicompost recorded maximum number of tillersand dry matter production at all stages of cropgrowth. The benefit of combined application oforganic + inorganic was more reflected at later cropgrowth stages and performed equal to the treatment of100 percent inorganic source. The slow and steadyrelease of nutrients and synergistic effect of organicsand chemicals in particular ‘N’ from the organicsources, exhibited their influence on plant height atlater crop growth rather than during early crop growthperiod. The results are similar to the findings ofBharathy (6) and Prabhakara Setty et al. (7). Theorganic sources supply not only the major nutrientsbut also they supply minor nutrients which playcrucial role in enzymatic reactions in rhizosphere ofthe plant and thus helped the plant to grow vigorouslyand to produce more dry matter.Yield attributes
Among the yield components (panicles/m2,panicle length, filled grains/panicle and test weight),the better growth as expressed by hybrid KRH-2 hasresulted in recording higher yield components overthe other two cultivars (Table 1). Application of 50 %
RDN (through urea) + 50 % RDN (organic) throughvermicompost recorded significantly higher numberof panicles/m2, filled grains/panicle, panicle lengthand test weight followed by 100 % RDN (throughurea) treatment. The improvement in yield attributesnoticed with the application of manures in addition tothe inorganic source could be attributed to theimprovement in growth parameters observed underthese treatments. Further, the rate of availability ofnutrients in these treatments wherein, manures wereused in conjunction with fertilizers might be well intune with the crop requirement to reflect in terms ofincreased effective tillers (8).Yield
Although the yield components viz., panicles/m2,filled grains/panicle and test weight as well as strawyield were significantly higher with the hybrid KRH-2. The hybrid KRH-2 performed better in terms ofgrowth and development if the crop, yieldcomponents resulting in significantly higher grainyield over the other two cultivars. Among thedifferent nutrient management practices, maximumgrain and straw yield of 5520.8 kg ha-1 was recordedwith the application of 50 % RDN (through urea)+50 % RDN (organic) through vermicompost andwas found to be significantly superior over the rest ofthe treatments. This was followed by 100 % RDN(through urea) and 75 % RDN (through urea) + 25 %RDN (organic) through vermicompost treatments.The yield advantage due to integration of organicsources with inorganic fertilizers over inorganicfertilizers alone might be due to the availability ofnutrients for a shorter period as mineralization ofnitrogen is more rapid and in turn the losses ofinorganic nitrogen due to volatilization, de-nitrification and leaching etc., would be more. But inINM, the availability of nutrients extends upto grainfilling stage and thus enhances the final grain yield.These results are in confirmation with SubbalakshmiLokanadhan et al. (9) and Viraktamath (10). Theinteraction between varieties and nutrientmanagement practices on grain yield was significant.The highest yield (7084 kg ha-1) was recorded by thehybrid KRH-2 when the treatment 50 % RDN(through urea) +50 % RDN (organic) throughvermicompost was applied followed by the treatment100 % RDN (through urea) with the same variety, butsignificantly superior over rest of the treatmentcombinations.
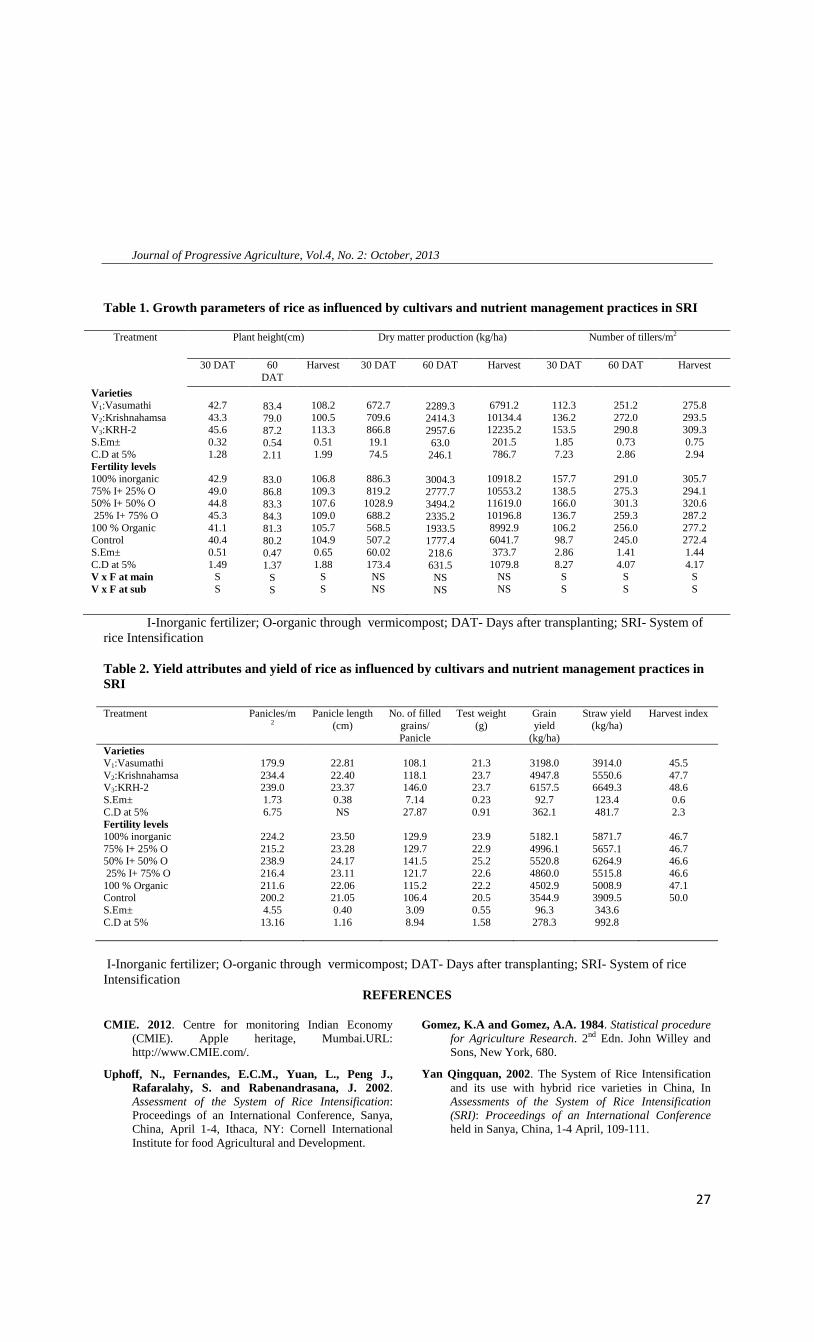
Journal of Progressive Agriculture, Vol.4, No. 2: October, 2013
27
Table 1. Growth parameters of rice as influenced by cultivars and nutrient management practices in SRI
Treatment Plant height(cm) Dry matter production (kg/ha) Number of tillers/m2
30 DAT 60DAT
Harvest 30 DAT 60 DAT Harvest 30 DAT 60 DAT Harvest
VarietiesV1:VasumathiV2:KrishnahamsaV3:KRH-2S.Em±C.D at 5%Fertility levels100% inorganic75% I+ 25% O50% I+ 50% O25% I+ 75% O
100 % OrganicControlS.Em±C.D at 5%V x F at mainV x F at sub
42.743.345.60.321.28
42.949.044.845.341.140.40.511.49
SS
83.479.087.20.542.11
83.086.883.384.381.380.20.471.37
SS
108.2100.5113.30.511.99
106.8109.3107.6109.0105.7104.90.651.88
SS
672.7709.6866.819.174.5
886.3819.2
1028.9688.2568.5507.260.02173.4NSNS
2289.32414.32957.663.0
246.1
3004.32777.73494.22335.21933.51777.4218.6631.5NSNS
6791.210134.412235.2
201.5786.7
10918.210553.211619.010196.88992.96041.7373.7
1079.8NSNS
112.3136.2153.51.857.23
157.7138.5166.0136.7106.298.72.868.27
SS
251.2272.0290.80.732.86
291.0275.3301.3259.3256.0245.01.414.07
SS
275.8293.5309.30.752.94
305.7294.1320.6287.2277.2272.41.444.17
SS
I-Inorganic fertilizer; O-organic through vermicompost; DAT- Days after transplanting; SRI- System ofrice Intensification
Table 2. Yield attributes and yield of rice as influenced by cultivars and nutrient management practices inSRI
Treatment Panicles/m2
Panicle length(cm)
No. of filledgrains/Panicle
Test weight(g)
Grainyield
(kg/ha)
Straw yield(kg/ha)
Harvest index
VarietiesV1:VasumathiV2:KrishnahamsaV3:KRH-2S.Em±C.D at 5%Fertility levels100% inorganic75% I+ 25% O50% I+ 50% O25% I+ 75% O
100 % OrganicControlS.Em±C.D at 5%
179.9234.4239.01.736.75
224.2215.2238.9216.4211.6200.24.55
13.16
22.8122.4023.370.38NS
23.5023.2824.1723.1122.0621.050.401.16
108.1118.1146.07.1427.87
129.9129.7141.5121.7115.2106.43.098.94
21.323.723.70.230.91
23.922.925.222.622.220.50.551.58
3198.04947.86157.592.7
362.1
5182.14996.15520.84860.04502.93544.996.3
278.3
3914.05550.66649.3123.4481.7
5871.75657.16264.95515.85008.93909.5343.6992.8
45.547.748.60.62.3
46.746.746.646.647.150.0
I-Inorganic fertilizer; O-organic through vermicompost; DAT- Days after transplanting; SRI- System of riceIntensification
REFERENCES
CMIE. 2012. Centre for monitoring Indian Economy(CMIE). Apple heritage, Mumbai.URL:http://www.CMIE.com/.
Uphoff, N., Fernandes, E.C.M., Yuan, L., Peng J.,Rafaralahy, S. and Rabenandrasana, J. 2002.Assessment of the System of Rice Intensification:Proceedings of an International Conference, Sanya,China, April 1-4, Ithaca, NY: Cornell InternationalInstitute for food Agricultural and Development.
Gomez, K.A and Gomez, A.A. 1984. Statistical procedurefor Agriculture Research. 2nd Edn. John Willey andSons, New York, 680.
Yan Qingquan, 2002. The System of Rice Intensificationand its use with hybrid rice varieties in China, InAssessments of the System of Rice Intensification(SRI): Proceedings of an International Conferenceheld in Sanya, China, 1-4 April, 109-111.
Journal of Progressive Agriculture, Vol.4, No. 2: October, 2013
28
Raghuveer Rao, P., Mahender K.R., Ram Prasad, A.Sand Ravichandran, S. 2006. System of RiceIntensification (SRI) versus traditional method of ricecultivation (TRC). In: National Symposium on Systemof Rice Intensification (SRI) – Present Status andFuture Prospects, November 17-18, 79.
Bharathy, V.E. 2005. Effect of FYM and rotary weedingon crop yield in the System of Rice Intensification(SRI). M.Sc. (Ag.) Thesis. Acharya N G RangaAgricultural University, Hyderabad, India.
Prabhakara, Setty, T.K., Bandi, A.G., Satnam Singhand Sanjay, M.T. 2007. Influence of IntegratedNutrient Management on growth and yield of hybridrice under System of Rice Intensification (SRI) andAerobic method of cultivation. In: SRI India 2007.Second National Symposium on System of RiceIntensification (SRI) in India – Progress andProspects. Papers and Extended Summaries, 3-5th
October, Agartala, Tripura, India, 82-84.
Berkelaar, 2001.SRI, the system of rice intensification:Less can be more. ECHO Department Notes, EDN,70: 1-7.
Subbalakshmi L., Ravichandran, V., Suresh, S.,Rabindran, R., Thiyagarajan, K. andMohanasundaram, K. 2007. Efficient resourceutilization in SRI method of Rice (CORH3)cultivation – An analysis. In: SRI India 2007. SecondNational Symposium on System of Rice Intensification(SRI) in India – Progress and Prospects. Papers andExtended Summaries, 3-5th October, Agartala,Tripura, India, 79-81.
Viraktamath, B.C. and Mahender K.R. 2007. ResearchExperiences on SRI – A summary of research paperssubmitted for the Symposium. In: SRI India 2007Second National Symposium on System of RiceIntensification (SRI) in India - Progress andProspects. Papers and Extended Summaries, 3-5th
October, Agartala, Tripura, India, 39-41.

Journal of Progressive Agriculture, Vol.4, No. 2: October, 2013
29
Effect of azolla as a feed supplement for economical pig farming in India
1BHARAT MAHTO AND 2DEEPAK S. BHADOURIA1Department of Animal Husbandry, Divyayan Krishi Kendra, Ranchi, Jharkhand, India
2Junior Scientist, Society of Biological Sciences and Rural Development. Allahabad, U.P. India
Received: August, 2013Accepted: Sept, 2013
ABSTRACT
The present study was conducted to see the effect of Azolla based diet on the growthperformance of indigenous piglets. Piglets randomly divided into three equal groups and were offeredcontrol diet in T1 group. Whereas, T2 and T3 were offered 20 per cent and 40 per cent of Azollacontaining diet, respectively. The average initial body weight of the pigs at the start of experiment was13.40±1.00 (T1), 14.00±1.06 (T2) and 14.00±0.68 (T3) in kg. The average body weight was attained atthe end of 13th weeks of experimental periods was 37.33±1.82, 34.45±0.74 and 25.33±0.93 kg in T1, T2and T3 groups, respectively. Significantly lowest body weight at 13th weeks of experiments wasrecorded in T3 group than compare to T1 and T2 groups which did not differ significantly from eachother.
Key words: Azolla, Indigenous and Piglets.
The practice of swine husbandry exists in Indiafor centuries; swine rearing in India is carried outunder variety of adverse social, climatic andenvironmental conditions. Pig is one of the mostefficient food converters among domesticatedanimals. It is a litter bearing animal among the meatproducing livestock having shortest gestation intervaland high feed conversion efficiency. It convertskitchen waste, feed items not edible by people intoproduct of high quality diets for human beings(Prasad, 2010). The protein content ranges from 20-30 per cent on fresh basis which is significantcontribution to the protein quality of the diet. Amonganimal protein, pork is the best source of riboflavinand niacin. It is also an excellent source of mineralslike phosphorus and potassium, iron, zinc, manganeseand magnesium which are essential in humannutrition. In India, at Jharkhand pig farming is verypopular among tribal since long time and here it istaking a shape of an industry as many educated youthare coming up for pig farming but the main constraintin intensive pig farming is cost of feed which accountabout 70-75 per cent of total cost of production. Inorder to decrease the cost of feed, Azolla can be useas a sustainable feed substitute for pigs because it is awonderful plant that can easily be cultivable inJharkhand, India.
Azolla is a floating fern and belongs to the familyAzollaceae. The fern Azolla, hosts a symbiotic bluegreen algae (BGA) anabaena azolloe which isresponsible for the fixation and assimilation ofatmospheric nitrogen. Azolla, in turn, provides thecarbon source and favorable environment for thegrowth and development of the BGA symbiont. InAzolla, the endosymbiont, through the sexual
reproduction phase, perhaps the only one of its kindin plant kingdom. It is this unique symbioticrelationship which makes Azolla, a wonderful plantas Azolla is very rich in protein, essential aminoacids, vitamins such as; vitamin A, vitamin B12, andBeta Carotene. It also contains growth promoterintermediaries and minerals like calcium, phosphorus,potassium, ferrous, copper, magnesium etc. Azolla,on a dry weight basis is constituted of 25-35 per centprotein content, 10-15 per cent mineral content and 7-10 per cent a combination of amino acids, bio-activesubstances and biopolymers. Carbohydrate and oilcontent in Azolla is very low. The bio composition ofthe Azolla makes it economic and efficient feedsubstitutes for livestock. Azolla can be easily digestedby pigs, owing to its high protein and low lignincontent. Therefore the present study entitled “Azolla– a sustainable feed substitute for pigs” wasundertaken to observe the effect of Azolla at differentpercentage level with concentrate feed on palatabilityand growth rate in growing piglets of 3-4 months ofage group.
MATERIALS AND METHODS
Indigenous piglets randomly divided into threeequal groups as shown in Table 1. The experimentalgroup T1 served as control having conventional pigration as per NRC (1988). In T2 and T3 group 20 percent and 40 per cent of total offered ration in T1 wasreplaced by Azolla respectively for 90 days. Dailyfeed intake and weekly body weight of pigs wererecorded. Pigs were weighed at the start of theexperiment and at weekly intervals thereafter up to 13weeks. They were kept without feed for at least 12

Journal of Progressive Agriculture, Vol.4, No. 2: October, 2013
30
hours (overnight) and weighed in the morning beforeoffering feed. The proximate principles of feed andfeacal samples were analyzed as per AOAC (2000).
In order to evaluate the replacement ofconcentrate feed by Azolla on palatability and growthrate in growing piglets, an experiment was conductedduring 2011-12 at Krishi Vigyan Kendra, Ranchi,Jharkhand. Azolla was produced by using anartificial method named Natural ResourcesDevelopment Project (NARDEP) developed byVivekananda Kendra, Kanyakumari - 629 702. InNARDEP method, an artificial water body is made,preferably under the shade of a tree, with the help of asilpauline sheet. Azolla was collected from thedifferent artificially made water body nearby thefarmers houses. Freshly collected Azolla were kept ina bamboo basket for 5-6 hours to drain out the waterand also to reduce moisture content then mixed withconcentrate ration. The concentrate ration was madebased on National Research Council (NRC; 1988)nutrients requirements of pig grower ration are shownin Table 2.
Pigs were fed ad lib. in each group. The weighedquantity of concentrate mixture was offered to themevery day twice daily 9.00 a.m. and 4.00 p.m., feedleft over was weighed back in the next morning andrecord of daily feed intake was maintained.
RESULTS AND DISCUSSION
The average body weight of pigs in differentgroups taken at weekly intervals from start ofexperiment up to 13 weeks has been presented inTable 3. The average initial body weight of the pigs atthe beginning of the experiment was 13.40±1.00,14.00±1.06 and 14.00±0.68 kg in T1, T2 and T3 group,respectively. The difference among the groups werenon significant. The average weekly body weightfrom 1st to 3rd week of age also did not differ
significantly among the groups. During the 4th and 5th
week period the difference in body weight weresignificantly lower in T3 then in comparison to T1 andT2 groups. The average weekly body weight of pigfrom 6th to 12th weeks of age differ significantly(P<0.05) among all the three groups. Pigs in group T1
was having highest body weight and T3 group foundthe lowest body weight. The body weight in T2 groupwas in between T1 and T3 group. The average bodyweight was attained at the end of 13th weeks ofexperimental periods was 37.33±1.82, 34.45±0.74and 25.33±0.93kg in groups T1, T2 and T3
respectively. Significantly lowest body weight at 13th
weeks of experiments was recorded in T3 groupcompare to T1 and T2 groups which did not differsignificantly from each other. The pigs in T3 groupswere fed 40 per cent Azolla having initial bodyweight of 14.00±0.08 kg attained final body weight25.33±0.93 kg at the end of 91 days trial. The totalgain in body weight in 91 days period was recordedas 11.33±0.97 kg. The gain in weight in comparisonto other two groups was found to be 12.60 kg and9.12 kg which was less from T1 and T2, respectively.Wang T.C. and Fuller M F (1989) also noted Azollahave a better amino acid profile than soya bean cakewhich is required for a growing pig. The presentfinding also resembled with reports by Basak et al.(2002). Tamany et al. (1992) and Beckingham et al.(1978) have implicated high levels of acid digestiblefibre (ADF) and lignin as the main factor limiting theefficient of Azolla meal by monogastric animals.
CONCLUSIONOn the basis of above findings, it was
recommended that 20 per cent of Azolla of controlration could be replaced without any effect but 40 percent of Azolla should not recommended in pig rationas it adversely affected all the economic traits of pigs.
Table 1. Distribution of pigs at different experimental groups.
T1 T2 T3
AnimalNo.
Sex Body weight(kg)
Animal No. Sex Body weight(kg)
AnimalNo.
Sex Bodyweight(kg)
818283848586
MFFFFF
13.0017.0010.0014.0012.0015.00
878889909192
MFFFFF
16.0010.0017.0015.0014.0012.00
939495969798
MFFFFF
17.0014.0014.0013.0014.0012.00

Journal of Progressive Agriculture, Vol.4, No. 2: October, 2013
31
Table 2 Per cent composition of various concentrate mixtures (part/ 100 kg) on DM basis.
Ingredients Experimental groupsT1 T2 T3
Crushed MaizeGroundnut cakeFish mealWheat BranAzollaMineral mixtureCommon salt
60.0015.0007.0015.0000.0002.0001.00
50.0007.0005.0015.0020.0002.0001.00
40.0004.0003.0010.0040.0002.0001.00
Total 100.00 100.00 100.00
Table 3 Average weekly weight (kg) of pigs at different periods in various treatment groups.
WeeksExperimental groups
F ValueC.D. value@ 5 %T1 T2 T3
Initial1st
2nd
3rd
4th
5th
6th
7th
8th
9th
10th
11th
12th
13th
Total gain (kg)Weekly gain(kg)Daily gain (g)
13.40 ±1.0015.66±1.0917.83± 1.4020.33± 1.5622.43± 1.68a
25.05± 1.72a
27.62± 1.85a
29.33± 1.76a
30.66± 1.71a
32.16± 1.75a
33.50± 1.83a
34.66± 1.82a
35.83± 1.65a
37.33± 1.82a
23.93± 1.10a
1.84±0.22a
262.85±21.62a
14.00± 1.0616.16± 1.1818.33± 1.4520.00± 1.0820.83± 1.06a
22.75± 1.02a
24.66±0.85b
26.33±0.78b
27.50±0.75b
29.15±0.84b
30.50±0.68b
31.76±0.77b
33.00±0.78b
34.45±0.74a
20.45± 0.50a
1.57±0.16a
224.72±15.16a
14.00±0.6815.41±0.5816.33±0.2417.50±0.3617.75±0.47b
18.75±0.38b
19.75±0.28c
20.25±0.38c
20.75±0.38c
22.00±0.54c
22.50±0.64c
23.20±0.69c
24.01±0.78c
25.33±0.93b
11.33± 0.97c
0.87±0.14b
124.50±14.43b
0.1370.1400.961.924.05*7.32**11.27**16.62**21.26**20.04**22.74**24.09**28.72**24.72**51.8517.2116.72
NSNSNSNS2.792.782.812.682.602.762.822.872.722.983.500.5273.83
Each value is the average of 6 observations.Means under same superscripts in a row did not differ significantly.NS = Non significant; * = P< 0.05; ** = P< 0.01
REFERENCES
AOAC., 2000. Official method of Analysis. 17th edtn.Assoc. Anal. Chem., Arlington, V. A. Washington,D.C.
Basak, B., Pramanik, A. H., Rahmnan, M. S., Taradar,S. U. and Roy, B. C., 2002. Azolla (Azolla pinnata)as a feed ingredient in broiler ration. Int. J. Poult.Sci., 1: 29-34
Beckinghom, K. W., Ela, S. W., Moris, J. G. andGoldman, C. R., 1978. Nutritive value of theNitrogen fixing aquatic fern Azolla filicides. J. Agri.Food Chem. 26: 1230-1234
Kamalasanana Pillai, P., Premalatha, S. and Rajamony,S. Natural Resources Development Project,Vivekananda Kendra, Kanyakumari - 629 702.
NRC., 1988. National Research Council, Nutrientsrequirements of swine. National Academy of sciences,Washington, DC.
Prasad, J., 2010. Swine rearing in India. Goat, Sheep andPig. Kalyani Publishers, Ludhiana. pg. 304
Tamany, Y., Samanta, G., Chokroborty, N., andMondal, L., 1992. Nutritive value of Azolla (Azollapinnata) and its potentiality of feeding in goats.Environment and Ecology, 10: 755-756
Wang, T. C. and Fuller, M. F., 1989. The optimumdietary amino acid pattern for growing pigs.Experiments by amino acid deletion. British Journalof Nutrition 62: 77-89.

Journal of Progressive Agriculture, Vol.4, No. 2: October, 2013
32
Evalution of front line demonstration trials on barley in Dausa district of Rajasthan1B.L.JAT, 2J.K.GUPTA AND 3R.N.SHARMA1Assistant Professor, 2 Technical Assistant,
3Programme Coordinator, KVK, DAUSA
Received: June, 2013Accepted: August, 2013
ABSTRACT
The study was undertaken to investigate the impact of front line demonstration on Barley. A totalof 134 demonstrations having the similar number of traditional practices or local check were conductedin 70 ha area in eleven different village in Dausa district of Rajasthan Yield of front line demonstrationtrials and potential yield of the respective variety and year were compared to estimate the yield gapwhich were further categorized into technology and extension gaps. Technology gap was found highest(1530) in case of Rd-2552 at village Dubbi in 2009-10 and lowest (330) of RD-2660 at village Reta inthe year 2008-09. Technology index shows the feasibility of the evaluated technology on the farmers’fields’. The lower the value of the technology index more feasibility of technology. Technology indexwas highest i.e. 44.61 per cent at village Dubbi in the year 2009-10, and lowest 7.06 per cent at villageReta in 2008-9. The study indicated that average per cent increase in grain yield was 15.05 (558 kg/ha)and straw yield 11.15 (504 Kg/ha). On the basis of present status of area of Barley in Dausa district(6825) farmer can get 3640 metric tons additional production which is essential fulfillment demand andsupply gap. On the basis of net returns (Rs/ha) of various front line demonstrations on Barley indifferent years, the highest percent increase were found 30.94 per cent at village Bhadoli in year 2005-6 with the variety of RD-2552 followed by 28.58 per cent at village Lawan in year 2008-9 with thevariety RD-2552 . Across the years front line demonstrations were found higher productivity rangingfrom 4.93 to 20.92 per cent and higher B: C ratio from 2.24 to 2.84. Front line demonstrations shows inrespect of per cent increase of yield and B:C ratio is sufficient for increasing production of Barley andincreasing living standard of farmers community of Dausa district. The study reveals that overall percent increase in net returns was 21.72(Rs 5250/ha).
Key words: Front line demonstration, barley, evaluation, economics, B: C ratio.
Barley is one of the important cereal crop inRajasthan in Rabi season Which play important rolein supplementing the income of small and marginalfarmers Dausa district due to problematic soil and lessirrigation water .one is the major constraints infarmers practices is low productivity due to unadaptability of package of practices .District Dausafalls in Agroclimatic zone IIIa, namely “Semi AridEastern Plains” covering Dausa, Ajmer, Tonk andJaipur districts. The headquarter of the zone issituated at Rajasthan Agricultural Research Institute,Durgapura, Jaipur. The technologies generated byscientist of Agricultural Research Station, Durgapurawere tested and disseminated through front linedemonstrations to farmers of Dausa district. Itaccount for 6825 hectare area and 20325 metric tonproduction with 2978kg/ha productivity (Anon, 2011-12). The hike in production in recent years has beenpossible due to improvement in productivity andstrategies adopted by the government by launchingfront line demonstration. In view of this front linedemonstration on barley crops was started by krishivigyan Kendra Dausa in order to demonstrate theproduction potential and latest advancement in
package of practices among the farmers with the viewto reduce the time lag between technology generatedand its adoption. This also enable field functionariesto elucidate the production constraints and limitationin the adoption of technology for onwardtransmission to scientists to reorient their researchaccordingly, in order to improve the productivity allthe latest and unfolded technologies were carried outin front line demonstrations plots under the directsupervision of the scientist by supplying the criticalinputs.
Keeping in view the importance of front linedemonstration in Dausa district of Rajasthan inproductivity enhancement and increase the monetaryreturns, the present study was carried out.
MERERIALS AND METHODS
The present study was conducted at the farmersfields of Dausa district of Rajasthan during the rabiseason of consecutive seven years from 2005-06 to2012-13 except the year 2006-07. A total of 134demonstrations and 70 ha area having similar numberof traditional practices or local check was carried outin sandy loam soil under irrigated conditions. The

Journal of Progressive Agriculture, Vol.4, No. 2: October, 2013
33
barley crop was sown in around last October andharvested in last week of March across the years. Thevariety Rd-2552 was used in demonstration in all thevillages and years except in 2008-09 at village Lawanand Reta, here the variety RD-2660 was demonstratedand in 2012-13 at village Salempura variety RD-2592demonstrated. The front line demonstration wereconducted in Sindoli, Bhadoli, Lawan and Jhera inDausa block and Khatwa and Salempura in Lalsotblock of Dausa district and Dubbi, Reta in Sikraiblock. In front line demonstrations especial emphasiswas given to proper seed rate (100Kg/ha), balance useof fertilizers (60 kg/ha N and 30 kg/ha P2O5), highyielding variety (RD-2552, RD-2660 & RD-2592),seed treatment with pesticides and culture, irrigationat critical stages and proper and need based plantprotection measures In traditional or local check plotsfarmers were using higher seed rate (140kg/ha),Imbalance use of fertilizers, local or own seed forsowing, improper seed treatment and plant protectionmeasures. The cross section data on output of barleycrop and input used per hectare have been collectedfrom the front line demonstration trials. In addition tothis in traditional or control plot followed by farmershave also been collected and used for furthercalculation like cost of cultivation, gross returns, netreturns, additional cost, additional returns, B:C ratio.The additional benefit cost ratio (B: C) was calculateddividing the net monetary return by the additionalcost of cultivation.
Yield gap, extension gap and technology indexwere calculated as follows:-Technology gap = Potential yield- DemonstrationyieldExtension gap = Demonstration yield- Farmers/Traditional yieldTechnology index = Pi-Di/Di X 100
Where Pi= Potential yield of the cropDi= Demonstration yield of the crop
RESULTS AND DISCUSSION
Yield gaps:-Yield of front line demonstration trials and
potential yield of the respective variety and year werecompared to estimate the yield gap which werefurther categorized in to technology and extensiongaps. Technology gaps (1530) was highest in case ofRD-2552 at village Dubbi in 2009-10 and lowest(330) of RD-2660 at village Reta in the year 2008-9.The average yield gap was found (728) though; thefront line demonstration trials were laid down underthe supervision of KVK scientists at the farmers’fields’. There exists gap between the potential yieldand trial yield. This may be due to the soil fertilityand weather condition hence, location specificrecommendations are necessary to bridge the gap.
The extension gap emphasized the need toeducate the farmers in adoption of improved
technology to narrow the extension gaps. Among thefront line demonstration on barley in different years,extension gap was highest in variety Rd-2552 (794) atvillage Bhadoli in year 2005-06, and lowest (192) atvillage Khatwa in variety Rd-2552 in year 2009-10.These findings are in line with the findings obtainedby Kaushik in 1993. The average extension gap wasfound (559). Similar findings were also reported bySharma and Sharma (2004).
Technology Index:-Technology index shows the feasibility of the
evalued technology on the farmers fields’. The lowerthe value of the technology index more feasibility oftechnology. Technology index was highest in 44.09per cent at village dubbi in the year 2009-10, andlowest 7.06 per cent at village Reta in 2008-9. Thisindicates that in FLDs a wide gap exists between thetechnology evaluated at research station and farmersfields’. Hence, according to the criterion Rd-2660variety at village Reta in year 2008-9 is best followedby at village Bhadoli in the RD-2552 variety in year2005-06. The average Technology index was found17.04 (H.K Rai et al 2011)Comparison of yield and economics:-
The average barley yield of front linedemonstration were found 4670 kg/ha in 2008-9 atRata village followed by 4625 kg/ha, 4480kg/ha, and4464 kg/ha at villages Bhadoli in 2005-0-6, Lawan in2008-9 and Sindoli in 2005-6, respectively. Andlowest yield were found 3470 kg/ha followed by 4079kg/ha at village Dubbi in year 2009-10, Jhera in year2011-12. The Maximum percentage increase overcontrol or traditional practice recorded 20.92 per centat village Lawan in 2008-09 with the variety of RD-2660, followed by 20.72 per cent at village Bhadoli inyear 2005-06 with the variety RD-2552. Studiesshows that average percentage increase 1-in grainyield and straw yield were found 15.05 per cent and11.15 percent respectively, which show that front linedemonstrations found better than farmers practices orcontrol (Suryawansi and Prakash, 1993), (Rai, et al2011) and (Singh, et al, 2007) for increasing theproductivity of farmers community of Dausa district(Table -1).
On the basis of Table -2 for economics ofvarious front line demonstrations on barley indifferent years, the highest percent increase in grossreturn were found 19.80 per cent at village Bhadoli inyear 2005-06 with the variety of RD-2552 followedby 17.82 per cent at village Sindoli in year 2005-06with the same variety. Average per cent increase ofgross return was found 13.73 per cent which issubstantial for the farming community of Dausadistrict. The highest increase in net return were found30.94 per cent at village Bhadoli in year 2005-06 withthe variety of Rd-2552 followed by 28.58 per cent atvillage Lawan in year 2008-09 with the variety Rd-

Journal of Progressive Agriculture, Vol.4, No. 2: October, 2013
34
2660. Average net return was found 21.72 per centincrease which shows front line demonstrations canbe increasing the living standard of farmingcommunity of Dausa District.
Among all front line demonstrations the highestB:C ratio were found 2.84 in village Bhadoli in year2005-06 with the variety RD 2552 followed by 2.75at village Sindoli in year 2005-06 and Jhera villagein 2011-12 with the variety of RD-2552 and RD-2592respectively. Overall results shows that variety RD-2552 is found better in gross returns ,net return andB:C ratio but RD 2660 were found better in respect
of percent increase in yield ,technology index.Across the years front line demonstrations were foundhigher productivity ranging from 4.93 to 20.92 percent and higher B:C ratio from 2.24 to 2.84 Front linedemonstrations shows in respect of per cent increaseof yield and B: C ratio is sufficient for increasingproduction of barley and increasing living standardof farmers’ community of Dausa district. Presently15.05 per cent increase reveals that if farmers adoptthe demonstrated technologies, they will fetched Rs.5250 /ha in addition to they are getting now intraditional practices will improving their livelihood.
Table:-1. Comparative statement of yield and other parameters of front line demonstrations on Barley indifferent villages of Dausa district of Rajasthan.
Year Village Block Variety No of
Demo
Area
(ha)
Ave. yield
of Demo
(kg/ha)
Average yield of Local
Check
(kg/ha)
% inc. Ave.
yield of
straw
(kg/ha)
Average
yield of
Local
Check
straw
(kg/ha)
% incr. Tec.
gap
Ext.
gap
Technology
index
2005-06 Sindoli Dausa RD-2552 10 5 44.64 37.67 18.50 53.25 46.50 14.57 536 697 12.61
2005-06 Bhadoli Dausa RD-2552 10 5 46.25 38.31 20.72 54.50 47.25 15.34 375 794 8.10
2007-08 Bhadoli Dausa Rd-2552 22 10 43.36 36.36 19.25 51.88 45.26 14.63 664 700 15.31
2008-09 Lawan Dausa Rd-2660 10 5 44.8 37.05 20.92 53.95 51.30 5.17 520 775 11.60
2008-09 Reta Sikrai Rd-2660 10 5 46.7 39.85 17.19 56.15 52.2 7.57 330 685 7.06
2009-10 Dubbi Sikrai RD-2552 10 5 34.7 30.8 12.66 41.8 37.45 11.61 1530 390 44.09
2009-10 Khatwa Lalsot RD-2552 10 5 40.83 38.91 4.93 47.16 44.61 5.71 917 192 22.45
2010-11Different
VillageDausa&Sikrai RD-2552 24 9.8 41.85 36.64 14.22 49.44 41.88 18.05 815 521 19.47
2011-12 Jhera Dausa RD-2552 24 10.2 40.79 35.83 13.84 46.33 41.92 10.52 921 496 22.57
2012-13 Salempura Lalsot RD-2592 24 10 43.29 39.92 8.44 47.67 43.42 9.79 671 337 15.50
Total 134 70 - - - - - - - - -
Average 42.72 37.13 15.05 50.21 45.17 11.15 728 559 17.04
Potential yield -5000 Kg/ha -
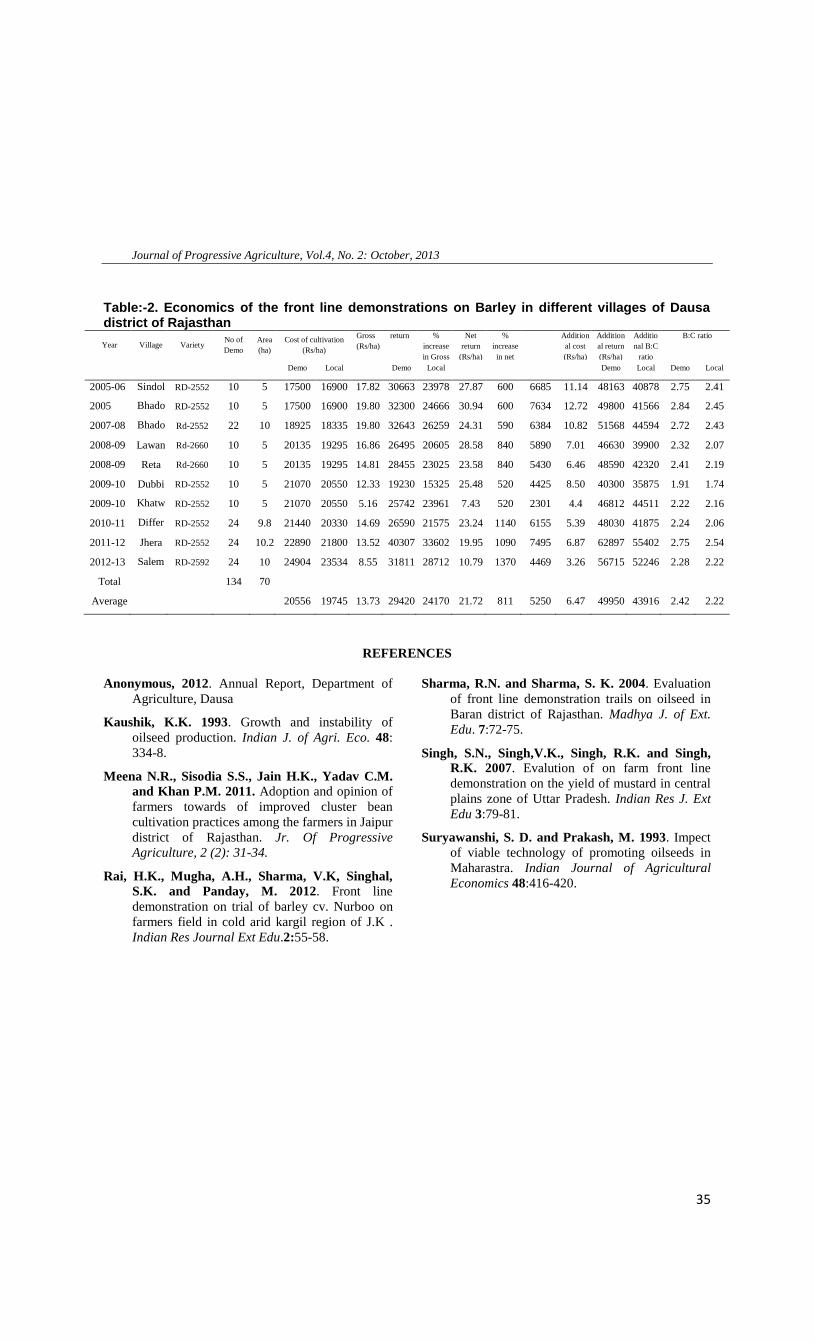
Journal of Progressive Agriculture, Vol.4, No. 2: October, 2013
35
Table:-2. Economics of the front line demonstrations on Barley in different villages of Dausadistrict of RajasthanYear Village Variety
No ofDemo
Area(ha)
Cost of cultivation(Rs/ha)
Gross return(Rs/ha)
%increasein Grossreturn
Netreturn
(Rs/ha)
%increasein netreturn
Additional cost(Rs/ha)
Additional return(Rs/ha)
Additional B:C
ratio(Rs/ha)
B:C ratio
Demo Local Demo Local Demo Local Demo Local
2005-06 Sindol
i
RD-2552 10 5 17500 16900 17.82 30663 23978 27.87 600 6685 11.14 48163 40878 2.75 2.41
2005 Bhado
li
RD-2552 10 5 17500 16900 19.80 32300 24666 30.94 600 7634 12.72 49800 41566 2.84 2.45
2007-08 Bhado
li
Rd-2552 22 10 18925 18335 19.80 32643 26259 24.31 590 6384 10.82 51568 44594 2.72 2.43
2008-09 Lawan Rd-2660 10 5 20135 19295 16.86 26495 20605 28.58 840 5890 7.01 46630 39900 2.32 2.07
2008-09 Reta Rd-2660 10 5 20135 19295 14.81 28455 23025 23.58 840 5430 6.46 48590 42320 2.41 2.19
2009-10 Dubbi RD-2552 10 5 21070 20550 12.33 19230 15325 25.48 520 4425 8.50 40300 35875 1.91 1.74
2009-10 Khatw
a
RD-2552 10 5 21070 20550 5.16 25742 23961 7.43 520 2301 4.4 46812 44511 2.22 2.16
2010-11 Differ
ent
Villag
e
RD-2552 24 9.8 21440 20330 14.69 26590 21575 23.24 1140 6155 5.39 48030 41875 2.24 2.06
2011-12 Jhera RD-2552 24 10.2 22890 21800 13.52 40307 33602 19.95 1090 7495 6.87 62897 55402 2.75 2.54
2012-13 Salem
pura
RD-2592 24 10 24904 23534 8.55 31811 28712 10.79 1370 4469 3.26 56715 52246 2.28 2.22
Total 134 70
Average 20556 19745 13.73 29420 24170 21.72 811 5250 6.47 49950 43916 2.42 2.22
REFERENCES
Anonymous, 2012. Annual Report, Department ofAgriculture, Dausa
Kaushik, K.K. 1993. Growth and instability ofoilseed production. Indian J. of Agri. Eco. 48:334-8.
Meena N.R., Sisodia S.S., Jain H.K., Yadav C.M.and Khan P.M. 2011. Adoption and opinion offarmers towards of improved cluster beancultivation practices among the farmers in Jaipurdistrict of Rajasthan. Jr. Of ProgressiveAgriculture, 2 (2): 31-34.
Rai, H.K., Mugha, A.H., Sharma, V.K, Singhal,S.K. and Panday, M. 2012. Front linedemonstration on trial of barley cv. Nurboo onfarmers field in cold arid kargil region of J.K .Indian Res Journal Ext Edu.2:55-58.
Sharma, R.N. and Sharma, S. K. 2004. Evaluationof front line demonstration trails on oilseed inBaran district of Rajasthan. Madhya J. of Ext.Edu. 7:72-75.
Singh, S.N., Singh,V.K., Singh, R.K. and Singh,R.K. 2007. Evalution of on farm front linedemonstration on the yield of mustard in centralplains zone of Uttar Pradesh. Indian Res J. ExtEdu 3:79-81.
Suryawanshi, S. D. and Prakash, M. 1993. Impectof viable technology of promoting oilseeds inMaharastra. Indian Journal of AgriculturalEconomics 48:416-420.

Journal of Progressive Agriculture, Vol.4, No. 2: October, 2013
36
Constraints perceived the farmers in adoption of coriander production technology inJhalawar district of Rajasthan
1D.K. MEENA, 2D.K. MEENA AND 3L.S. BARETH
1Ph.D Scholar, S.K.N.College of Agriculture, Jobner (SKRAU), Bikaner2Ph.D Scholar, Division of Dairy Extension, NDRI, Karnal, Haryana
3Associate Professor, College of Agriculture, (SKRAU), Bikaner
Received:Dec., 2012Accepted: Feb., 2013
ABSTRACT
The present study was conducted in Jhalawar district of Rajasthan to find out constraints faced bythe farmers in adoption of coriander production technology. As Jhalawar district was purposelyselected under study the district has higher area under major coriander crop. The study found thatmajority of the tribal (57.50%) and non- tribal respondents (72.50%) under medium constraintscategory. unavailability of variety maintaining green color after harvest, minimum support price notfixed by the government and lack of knowledge about the grading , standardization and Cloudyweathers rainfall at the time of flowering and seed formation .for the study,80 tribal & 80 non-tribalcoriander grower were selection as respondents from five villages of Khanpur Panchayati samities.
Key words: Adoption, constraints and coriander production technology.
India has been the ‘Home of Spices’ since timeimmemorial. It is the world largest producer,consumer and exporter of seed spices which are beingcultivated widely in the country over different agroclimatic zones. Seed spices namely coriander,fenugreek, cumin and fennels are very important notonly for home consumption but also for improvingeconomic condition of the farmers at large. Corianderis an important dominant and highly valued spicegrown in India. It is the first probably the first spicesto be used by men as common flavouring substance.The stem leaves and grains have a pleasant aroma.The entire plant used in preparing “Chatany”whereas, leaves are used for flavouring curries, sauceand soups. The dry grains are extensively used inpreparation of curry powder, pickling spices andseasoning. Coriander seed have aromatic odour andtests of coriander fruits is due to an essential oil,which is made up of hydrocarbon and oxygenatedcompounds. Beside the essential oil, the seed contains16.1 % fatty oil, 14.1 % protein, 21.6 % carbohydrate,32.6% fibers, 11.2 % moisture and 4.4 % mineralmatters (Sharma, 1991) and coriander leaves are veryrich in Vitamin A containing 5200 to 12000 IU per100 g as mentioned by various authors.
In India Coriander growing States areRajasthan, Andhra Pradesh, Madhya Pradesh,Tamilnadu, Bihar, Karnataka and Uttar Pradesh. Thestate of Rajasthan has a unique place in seed spicesmap of India which produces 290216 tonnes seedsfrom 363124 hectares. Out of the total seed spices
produce in Rajasthan, coriander contributes 58.51 percent, whereas, in respect of area, coriander covers40.86 per cent. Rajasthan contributes around 44 percent of in the national production. The majorconstraints faced by the coriander grower weredistricts of state are Jhalawar, Baran, Kota,Chittorgarh and Bundi. Kota region alone contributesabout 98 per cent of the area and production ofcoriander crop. The average productivity of coriandercrop is1144 kg/ha and there are possibilities toincrease its productivity up-to 40 to 50 per cent byadoption of improved technologies,(ASDAR, 2011).The requirement of the seed spice in the country israpidly increasing due to increasing population. Thecoriander is widely used as an essential component offood and also as an immediate source of farmer’sincome. The identification of the constraints inadoption of improved cultivation practices ofcoriander will enable the policy makers to prepareplan to rectify these hurdles for mobilizing the quickadoption of coriander production technology.
Keeping all these views in mind, the presentinvestigation was undertaken to identify theconstraints perceived by the farmers in adoption ofcoriander production technology in Jhalawar districtof Rajasthan.
MATERIALS AND METHODS
The study was conducted in Jhalawar district ofRajasthan. Jhalawar district had the highest area(61963 ha) under coriander crop and 5 per cent tribal
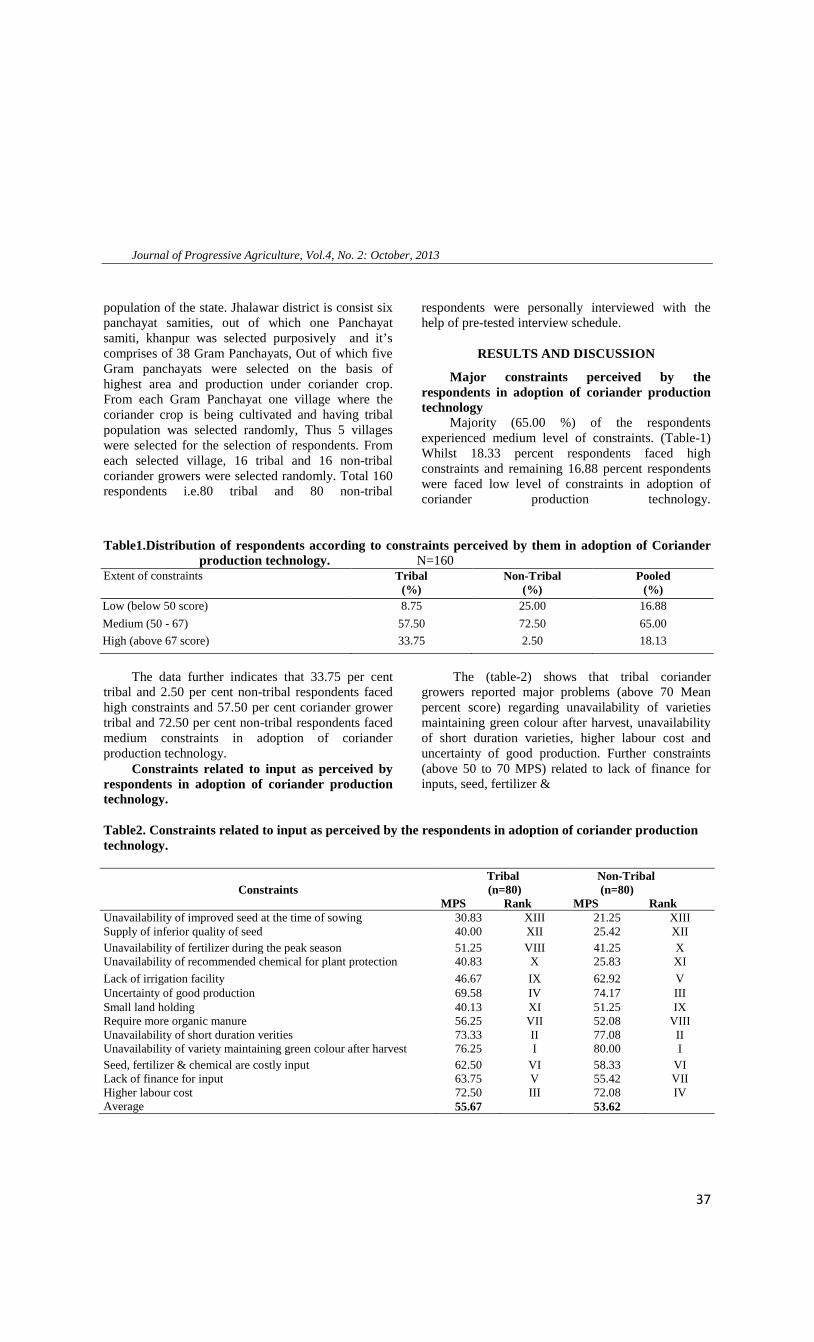
Journal of Progressive Agriculture, Vol.4, No. 2: October, 2013
37
population of the state. Jhalawar district is consist sixpanchayat samities, out of which one Panchayatsamiti, khanpur was selected purposively and it’scomprises of 38 Gram Panchayats, Out of which fiveGram panchayats were selected on the basis ofhighest area and production under coriander crop.From each Gram Panchayat one village where thecoriander crop is being cultivated and having tribalpopulation was selected randomly, Thus 5 villageswere selected for the selection of respondents. Fromeach selected village, 16 tribal and 16 non-tribalcoriander growers were selected randomly. Total 160respondents i.e.80 tribal and 80 non-tribal
respondents were personally interviewed with thehelp of pre-tested interview schedule.
RESULTS AND DISCUSSION
Major constraints perceived by therespondents in adoption of coriander productiontechnology
Majority (65.00 %) of the respondentsexperienced medium level of constraints. (Table-1)Whilst 18.33 percent respondents faced highconstraints and remaining 16.88 percent respondentswere faced low level of constraints in adoption ofcoriander production technology.
Table1.Distribution of respondents according to constraints perceived by them in adoption of Corianderproduction technology. N=160
Extent of constraints Tribal(%)
Non-Tribal(%)
Pooled(%)
Low (below 50 score) 8.75 25.00 16.88
Medium (50 - 67) 57.50 72.50 65.00
High (above 67 score) 33.75 2.50 18.13
The data further indicates that 33.75 per centtribal and 2.50 per cent non-tribal respondents facedhigh constraints and 57.50 per cent coriander growertribal and 72.50 per cent non-tribal respondents facedmedium constraints in adoption of corianderproduction technology.
Constraints related to input as perceived byrespondents in adoption of coriander productiontechnology.
The (table-2) shows that tribal coriandergrowers reported major problems (above 70 Meanpercent score) regarding unavailability of varietiesmaintaining green colour after harvest, unavailabilityof short duration varieties, higher labour cost anduncertainty of good production. Further constraints(above 50 to 70 MPS) related to lack of finance forinputs, seed, fertilizer &
Table2. Constraints related to input as perceived by the respondents in adoption of coriander productiontechnology.
ConstraintsTribal(n=80)
Non-Tribal(n=80)
MPS Rank MPS RankUnavailability of improved seed at the time of sowing 30.83 XIII 21.25 XIIISupply of inferior quality of seed 40.00 XII 25.42 XIIUnavailability of fertilizer during the peak season 51.25 VIII 41.25 XUnavailability of recommended chemical for plant protection 40.83 X 25.83 XI
Lack of irrigation facility 46.67 IX 62.92 VUncertainty of good production 69.58 IV 74.17 IIISmall land holding 40.13 XI 51.25 IXRequire more organic manure 56.25 VII 52.08 VIIIUnavailability of short duration verities 73.33 II 77.08 IIUnavailability of variety maintaining green colour after harvest 76.25 I 80.00 ISeed, fertilizer & chemical are costly input 62.50 VI 58.33 VILack of finance for input 63.75 V 55.42 VIIHigher labour cost 72.50 III 72.08 IVAverage 55.67 53.62
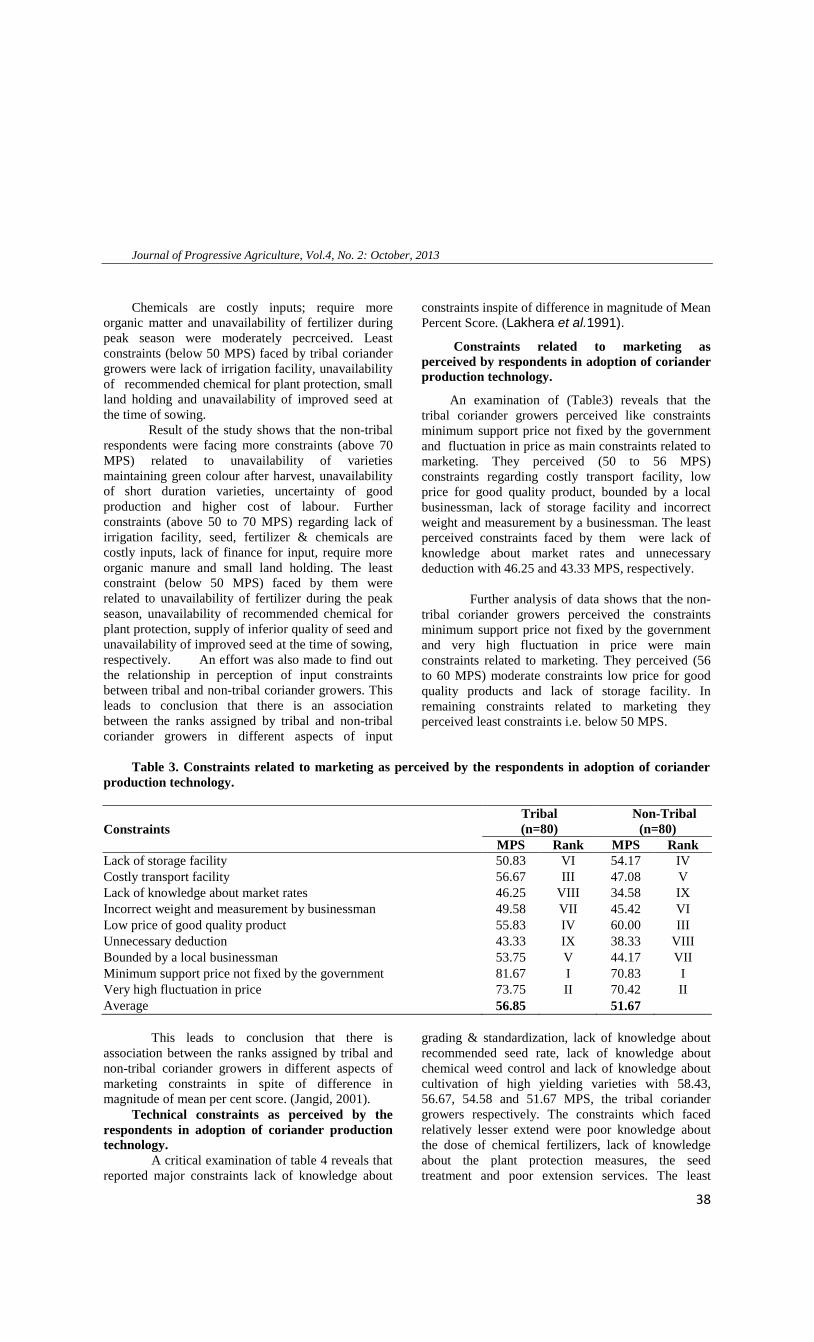
Journal of Progressive Agriculture, Vol.4, No. 2: October, 2013
38
Chemicals are costly inputs; require moreorganic matter and unavailability of fertilizer duringpeak season were moderately pecrceived. Leastconstraints (below 50 MPS) faced by tribal coriandergrowers were lack of irrigation facility, unavailabilityof recommended chemical for plant protection, smallland holding and unavailability of improved seed atthe time of sowing.
Result of the study shows that the non-tribalrespondents were facing more constraints (above 70MPS) related to unavailability of varietiesmaintaining green colour after harvest, unavailabilityof short duration varieties, uncertainty of goodproduction and higher cost of labour. Furtherconstraints (above 50 to 70 MPS) regarding lack ofirrigation facility, seed, fertilizer & chemicals arecostly inputs, lack of finance for input, require moreorganic manure and small land holding. The leastconstraint (below 50 MPS) faced by them wererelated to unavailability of fertilizer during the peakseason, unavailability of recommended chemical forplant protection, supply of inferior quality of seed andunavailability of improved seed at the time of sowing,respectively. An effort was also made to find outthe relationship in perception of input constraintsbetween tribal and non-tribal coriander growers. Thisleads to conclusion that there is an associationbetween the ranks assigned by tribal and non-tribalcoriander growers in different aspects of input
constraints inspite of difference in magnitude of MeanPercent Score. (Lakhera et al.1991).
Constraints related to marketing asperceived by respondents in adoption of corianderproduction technology.
An examination of (Table3) reveals that thetribal coriander growers perceived like constraintsminimum support price not fixed by the governmentand fluctuation in price as main constraints related tomarketing. They perceived (50 to 56 MPS)constraints regarding costly transport facility, lowprice for good quality product, bounded by a localbusinessman, lack of storage facility and incorrectweight and measurement by a businessman. The leastperceived constraints faced by them were lack ofknowledge about market rates and unnecessarydeduction with 46.25 and 43.33 MPS, respectively.
Further analysis of data shows that the non-tribal coriander growers perceived the constraintsminimum support price not fixed by the governmentand very high fluctuation in price were mainconstraints related to marketing. They perceived (56to 60 MPS) moderate constraints low price for goodquality products and lack of storage facility. Inremaining constraints related to marketing theyperceived least constraints i.e. below 50 MPS.
Table 3. Constraints related to marketing as perceived by the respondents in adoption of corianderproduction technology.
ConstraintsTribal(n=80)
Non-Tribal(n=80)
MPS Rank MPS RankLack of storage facility 50.83 VI 54.17 IVCostly transport facility 56.67 III 47.08 VLack of knowledge about market rates 46.25 VIII 34.58 IXIncorrect weight and measurement by businessman 49.58 VII 45.42 VILow price of good quality product 55.83 IV 60.00 IIIUnnecessary deduction 43.33 IX 38.33 VIIIBounded by a local businessman 53.75 V 44.17 VIIMinimum support price not fixed by the government 81.67 I 70.83 IVery high fluctuation in price 73.75 II 70.42 IIAverage 56.85 51.67
This leads to conclusion that there isassociation between the ranks assigned by tribal andnon-tribal coriander growers in different aspects ofmarketing constraints in spite of difference inmagnitude of mean per cent score. (Jangid, 2001).
Technical constraints as perceived by therespondents in adoption of coriander productiontechnology.
A critical examination of table 4 reveals thatreported major constraints lack of knowledge about
grading & standardization, lack of knowledge aboutrecommended seed rate, lack of knowledge aboutchemical weed control and lack of knowledge aboutcultivation of high yielding varieties with 58.43,56.67, 54.58 and 51.67 MPS, the tribal coriandergrowers respectively. The constraints which facedrelatively lesser extend were poor knowledge aboutthe dose of chemical fertilizers, lack of knowledgeabout the plant protection measures, the seedtreatment and poor extension services. The least

Journal of Progressive Agriculture, Vol.4, No. 2: October, 2013
39
perceived constraint faced by them was poorknowledge about irrigation management with 39.17
MPS. Because of lack of marketing as well asknowledge. (Kaid, S. V. 2004)
Table4. Constraints related to technical constraints as perceived by the respondents in adoption ofcoriander production technology.
ConstraintsTribal(n=80)
Non-Tribal(n=80)
MPS Rank MPS Rank
Lack of knowledge about seed treatment 42.50 VII 26.67 VII
Lack of knowledge about cultivation of high yielding variety 51.67 IV 31.67 IV
Lack of knowledge about the grading and standardization 58.43 I 43.75 1
Lack of knowledge about the recommended seed rate 56.67 II 35.75 III
Poor knowledge about the dose of chemical fertilizer 46.67 IV 25.83 VIII
Lack of knowledge about plant protection measures 45.42 VI 30.83 IV
Poor knowledge about the irrigation management 39.17 IX 28.42 VI
Lack of knowledge about the chemical weed control 54.58 III 36.67 II
Unavailability of technical guidance 41.67 VIII 25.00 IX
Average 48.53 31.62
The Table 4 show that the non-tribal coriandergrowers reported that major constraints regardingtechnical aspect perceived were lack of knowledgeabout grading & standardization, lack of knowledgeabout chemical weed control, lack of knowledgeabout recommended seed rate, and lack of knowledgeabout cultivation of high yielding varieties with43.75, 36.67, 35.75 and 31.67 MPS, respectively. Theconstraints which faced lesser extent were lack ofknowledge about plant protection, lack of knowledgeabout irrigation management. The least perceivedconstraints faced by them were lack of knowledgeabout seed treatment, poor knowledge about dose ofchimerical fertilizer and unavailability of technicalguidance with 26.67, 25.83 and 25.0 MPS,respectively.
An effort was also made to find out therelationship in perception of technical constraintsbetween tribal and non-tribal coriander growers. This
leads to conclusion that there is an associationbetween the ranks assigned by non-tribal and tribalcoriander growers in different aspects of technicalconstraints in spite of difference in magnitude ofMean Percent Score. The rank all ready mention inthe table 4.
Miscellaneous constraints as perceived by therespondents in adoption of coriander productiontechnology
The (Table-5) shows that tribal coriandergrowers the major constraints regarding to cloudyweathers, rainfall at the time of flowering & seedformation and early sowned crop affected by lowtemperature with 80.42, and 69.17 MPS, respectively.Further constraints related to which faced relativelyextent were harvested crop affected by wind, poorbearing capacityand more insect pest incidence with64.17, 61.67, and 65.00 MPS, respectively. Jaitawatet al.,(2007).
Table 5.Miscellaneous constraints as perceived by the respondents in adoption of coriander productiontechnology.
ConstraintsTribal(n=80)
Non-Tribal(n=80)
MPS Rank MPS RankCloudy weathers, rainfall at the time of flowering and seed formation 80.42 I 75.83 I
Early sown crop affected by low temperature cold strees 69.17 II 61.25 IIIHarvested crop affected by the wind 64.17 III 59.58 IVUnable to risk bearing capacity 61.67 IV 66.25 IIAverage 66.11 61.39
Journal of Progressive Agriculture, Vol.4, No. 2: October, 2013
40
Further analysis of data shows that the non-tribalcoriander growers were facing major constraintsregarding to cloudy weather, rainfall at the time offlowering & seed formation and unable to riskbearing capacity with 75.83 and 66.25 MPS,respectively. Further constraints like early sown cropaffected by low temperature, harvested crop affectedby wind and late sowing reduce the yield weremoderate constraints. Least perceived constraints
faced by them was more insect pest incidence with49.58 MPS, respectively.
CONCLUSIONAmong the four constraints, constraints related
to miscellaneous was the major constraints perceivedby the coriander growers. This constraint wasfollowed by constraints related to input, marketing.Least perceived constraints were technicalconstraints. There were rank order correlations in allaspects of constraints.
REFERENCES
Jaitawat, G.S., Sisodia, S.S. and Bhimawat, B.S.2007. “Constraints in adoption of improved fennelcultivation technology”. Indian Research ofJournal Extension Education, Vol. VII (2&3): 52-54.
Kaid, S. V. 2004. Technological gap in Kharif fennelcultivation by fennel growers in Punapur Talukaof Banaskantha district of Gujarat state”. M. Sc.(Ag.), Thesis (unpub.), campus - S.K. Nagar.
Jangid, N.L. 2001. “Analysis of constraints in theadoption of recommended cultivation practices ofchilli by the farmers of Panchayat Samiti SambharLake of Jaipur district”. M.Sc. (Ag.) thesis(unpub.), RAU, Bikaner, campus- Jobner.
Lakhera, J.P. and Punjabi, N.K. 1991. Constraintsof fertilizer use. Indian J. of Ext. Edu. 27:114–115.
Sharma, H.K. 1991. "Growth rates input use andprofitability of cumin in Jalore district ofRajasthan". M.Sc. (Ag.) thesis (unpub.), RAU,Bikaner, campus- Jobner.WWW.krishiraj.com
.
Journal of Progressive Agriculture, Vol.4, No. 2: October, 2013
41
Cattle owners and their extent of knowledge about individual animal husbandrypractices
1L. S. SHEKHAWAT, K.C.MAHAJAN AND APARNA JAISWAL1Assistant Professor, College of Agriculture
Jawaharlal Nehru Krishi Vishwavidyalaya, Ganjbasoda, Vidisha (MP)
Received: Dec., 2012Accepted: Feb., 2013
ABSTRACT
The present study was carried in Sehore district of Madhya Pradesh during 2011-12 to ascertainknowledge level of improved animal husbandry practices among 300 dairymen of ten villages. Tendairymen of each category namely small farmers, marginal farmers and agricultural labourers wereselected from each village and their knowledge level about all the broad aspects of improved animalhusbandry practices were tested. The study reveals that majority of dairymen possessed medium levelof knowledge (70%) followed by low level (17.34%) and high level of knowledge (12.66%). Agriculturallabourers were found to have low level of knowledge about improved animal husbandry practices whilesmall farmers possessed more knowledge as compared to marginal farmers. Correlation analysisfurther highlights that age, education, socio-economic status, income, training undergone andextension contact had significant relationship with knowledge level of different categories of dairymen.
Key words: Dairy farming, Improved animal husbandry practices andLevel of Knowledge.
Animal husbandry and dairy is an integral partof sustainable crop livestock production system inIndia. Milk production is an important rural activityproviding supplementary income and food securitywhen agricultural crop fails and creates jobopportunities for weaker section of rural society.
Although India is the top milk producer in theworld,but its productivity per animal is meager 1.5lit/day.It is a challenge to sustain livestock productionand profitability in this area. The technologicaloptions for optimum milk production will need acombination of all the technologies ofbreeding,feeding,health, hygiene and housingmanagement. Dairyman can adopt any technologyonly if they have knowledge about it. Knowledge as abody of understood information possessed by anindividual is one of the important components of theadoption behavior. Therefore it is important for theextension worker to know the knowledge level of thedairyman for effective transfer of technology.
Keeping these points on mind the followingstudy was carried out in Sehore district of MadhyaPradesh with the following objectives:
Objectives: To ascertain the overall knowledge level of
dairymen. To study the extent of knowledge about
individual animal husbandry practices. To study the relationship between
knowledge and selected attributes of the dairymen.
MATERIALS AND METHODS
The present study was conducted inSehoredistrict of Madhya Pradesh during 2011-12.Two blocks of district namely,Budhni and Icchawarwere randomly selected. Total 10 villages, five fromeach block were selected purposively as perconvenience of researcher. A list of small farmers,marginal farmers and agricultural labours wasprepared with the help of patwariof the concernedvillages of the blocks. From the list, 10 respondentsof each category selected randomly from each villageaccounted for 300 total respondents in all. The datawas collected with the help of questionnairedeveloped. A knowledge test was developed to assessthe knowledge of respondents, which was treated asdependent variable for the study purpose. All the fivebroad aspects namely, cattle breeding, cattle feeding,fodder production practices, cattle health andmanagement practices were included in knowledgetest. Further, these broad areas were divided intovarious sub areas. The responses were obtained ontwo point continuum. The score obtained by all therespondents on a particular area was calculated.
RESULTS AND DISCUSSION
Overall knowledge level of dairymenThe data presented in Table-1 reveals that
majority (70%) of the respondents have mediumknowledge level, followed by low (17.34%) and highlevel (12.66%). Among the categories of dairymen,large percentage of small farmers possessed highlevel of knowledge than marginal farmers and

Journal of Progressive Agriculture, Vol.4, No. 2: October, 2013
42
agricultural labours about the recommended practices.The possible reason for majority of the dairymenhavingmedium knowledge level may be due to thecrucial role played by dairy enterprise in the economyof farmers and the special technical competencerequired regarding disease control. Management ofcrossbred cattle necessitated the farmers in theacquisition of knowledge regarding improved dairyfarming practices. The low knowledge amongagricultural labourers may be attributed to theirinability to spare the working hours to seek newknowledge, lack of economic resources to match thenew technology or their lower educational level. Inaddition, being in the lower runkof social economichierarchy of the rural community, they probably havepoor access to the information as compared to theother categories of dairymen. These findings getsupport from the findings of Gill and Singh (1977,Sohal and Tyagi (1978), Singh and Verma (1979),Nikam and Rajamane (1995) and Singh and Godhara(2002), who observed that more than 60% of cattleowners had knowledge about the recommendedanimal husbandry practices.
Extent of knowledge about individual animalhusbandry practices
A. Knowledge about cattle breeding practicesThe data in Table-2 depict that as high as 63
percent of cattle owners had the knowledge about thesymptoms of cow/buffaloes in heat, followed byanimal selection (55.33%)and benefit of A.I. practices(50.66%) while, 45.33percent of dairymen had thebreed knowledge. The analysis of different categoriesof dairymen highlights that the knowledge level ofagricultural labours was lower than small andmarginal farmers about the improved practices.Similar findings were also reported by Nataraju andChannegowda (1986, Danna (1992), Sawarkaret. al(2001) and Singh and Godhara (2002), who pointedout that awareness of cattle breeding practices bydairymen was comparatively higher.
B. Knowledge about cattle feeding practicesTable 2 also highlights that green fodder feeding
practice was known to 65.33 % of dairymen followedby importance of colostrum (63%) and mineralmixture feeding (51%), Whereas, only 38.66 percentof the total respondents who had the knowledge aboutcalf feeding practice. Category-wise analysis revealsthat the agricultural labours possessed much lowerknowledge about all the cattle feeding practices.Small farmers had more knowledge about theseimproved practices as compared to marginal farmers.These findings are at par with results of Kokate andTyagi (1991) who pointed out the absence ofknowledge about balanced diet. The reason for lack ofknowledge about overfeeding may be due to the factthat the dairy extension workers do not highlights the
demerits of overfeeding to the farmers. Lowerknowledge of agricultural labours may be due to theirinability to seek new knowledge by participation inextension activities, as they have to earn theirlivelihood through agricultural wages coupled withlack of resources and illiteracy.
C. Knowledge about fodder productionpractices
Four sub areas were included in this broad areaand the data presented in Table 2 shows that thedairymen had more knowledge about crop rotation(60.66%) followed by chaffing of fodder (49%) andvarieties of fodder crops (41.66%). While, only 29.33% cattle owners had knowledge about the silage.Similar trend was also observed in case of all thedairymen categories. Agricultural labours had lowerknowledge about all these practices as compared tosmall and marginal farmers. However, small farmershad slightly more knowledge about fodder productionpractices. The higher knowledge about theseimproved practices may be due to simplicity and notechnically involved inthese practices and thedairymen learn these practices in routine. Thesefindings are in accordance with the results ofNachiappon (1975) who reported high level (90%)possessedby the cattle owners in fodder production.
D. Knowledge about cattle healthAbout 46.66% of the respondents had
knowledge about clean milk production followed bycare of newly born calf(44.66%),vaccination(40.66%)and de-worming (34.33%).
E. Knowledge about management practicesVery discouraging results were observed in case
of management practices. As high as 29.66% of therespondents had knowledge about housing systemsfollowed by farm record keeping (26%), maintenanceof machinery (20.33%) and farm inventory (18.33%).Itmay be due to the facts that dairymen are not awareof, the importance of dairy management practices.Therefore, the extension personnel engaged in dairyprofession should emphasized on this aspects andinclude this practice in their trainingprogrammes.Present findings get support from thefindings of Singh et al. (1989) who reported themajority of agricultural labours had low to mediumlevel of knowledge about cattle health care andmanagement practices.
Relationship between knowledge andattributes of the dairymen
The results of correlation analysis (Table 3) showthe relationship between knowledge and selectedantecedent variables. It points out that four variablesnamely education, socio economic status,incometraining undergone and extension contact had significantand positive relationship with the knowledge ofdairymen.While the age of respondents was found to

Journal of Progressive Agriculture, Vol.4, No. 2: October, 2013
43
have significant but negative correlation with knowledgeregarding improved animal husbandry practices. Itimplies that younger dairymen tend to have moreknowledge about these practices as compared to olderrespondents. This may be due to the fact that generallyyounger farmers are more exposed to mass media andultimately gained more knowledge. The analysis revealsthat the educated dairymen possessed more knowledgedue to the fact that they tend to have more interactionwith extension agencies and do not hesitate to discusstheir problems related to their animals with the scientistsand veterinarians as compared to old illiteraterespondents. The cattle owners who have attended oneor more trainings regarding improved animal husbandrypractices have ultimately more knowledge. To developsuch knowledge, a systematic training is necessary.Socio-economic status and income of the dairymen areinterlinked aspects. It is presumed that well off farmershave stronglinkage with the scientific bodies due to theone or the other reasons and more exposure about thesepractices. Extension contact is one of themost importantfactor to enhance the knowledge level of dairymen. Thecorrelation analysis reveals that the dairymen havingmore score on these variables tend to have moreknowledge about improved animal husbandry practices.
CONCLUSIONIt can be concluded that agricultural labourers
possessed low level of knowledge about all the
improved animal husbandry practices, whereas smallfarmers possessed more knowledge about thesepractices as compared to marginal farmers andagricultural labourers. Majority of dairymen hadmoreknowledge about cattle feeding followed bycattle breeding then fodder production there aftercattle health and management practices. Minimumpercentage of dairymen (18.33%) had known aboutfarm inventory management, which should be givenmore emphasis by the veterinarians/extensionspecialists in their training programmes. Maximumknowledge of dairymen (65.33%) was recorded inrespect of green fodder feeding. The extensionagencies should gear upto popularize the practiceslike feeding of balanced diet and veterinary first aidthrough their extension programme among cattleowners.
Antecedents’ variables such as education, socio-economic status, income, training undergone andextension contact have profound influence in gainingknowledge about dairying. This implies that if needbased training is imparted to the cattle owners alongwith technical information, supply and servicesthen,even less educated farmers, having lower socio-economic status, old aged and lower incomegroup ofdairymen and also handicapped can be reached inadopting new dairy technologies.
Table 1: Knowledge of Recommend Animal Husbandry Practices among Different Categories of Dairyman
Categories of Dairyman Knowledge levelLow Medium High Total
F % F % F % F %Small farmers 15 15 61 61 24 24 100 100Marginal farmers 18 18 72 72 10 10 100 100Agricultural labours 19 19 77 77 4 4 100 100
Total 52 17.34 210 70 38 12.66 300 100
Table 2: Knowledge level of dairyman about individual animal husbandry practices
Recommended practices Small farmersN=100
Marginal farmersN=100
Agricultural laboursN=100
Total N=300
F % F % F % F %A. Cattle breedingSelection of animal 35 35 32 32 29 29 166 55.33Breed knowledge 45 45 47 47 44 44 136 45.33Heat symptoms 66 66 62 62 61 61 189 63.00A. I. practice 54 54 50 50 48 48 152 50.66Mean 50 50 47.75 47.75 45.5 45.5 160.75 53.58B. Cattle feedingImportance of Colostrum 65 65 63 63 61 61 189 63.00Calf feeding 42 42 39 39 35 35 116 38.66Mineral mixture feeding 53 53 52 52 48 48 153 51.00Green fodder feeding 71 71 65 65 60 60 196 65.33Mean 57.75 57.75 54.75 54.75 51.00 51.00 163.5 54.49C. Fodder production practiceCrop rotation 64 64 61 61 57 57 182 60.662. Varieties of foddercrop
43 43 42 42 40 40 125 41.66
Knowledge of Silage 32 32 30 30 26 26 88 29.33Chaffing of fodder 52 52 48 48 47 47 147 49.00Mean 47.75 47.75 45.25 45.25 42.5 42.5 135.5 45.16

Journal of Progressive Agriculture, Vol.4, No. 2: October, 2013
44
Table 3: Zero order correlation analysis of attributes of dairymen with knowledge of different categories ofdairymen
Antecedent variables categories of dairymanSmall farmers
N=100Marginal farmers
N=100Agricultural labours
N=100Total N=300
Age -0.267* 0.316** -0.421** -0.189*Education 0.499** 0.467** 0.383** 0.210**Socio-Economic status 0.619** 0.569** 0.798** 0.260**Training undergone 0.216* 0.331** 0.213* 0.130*Extension contact 0.631** 0.603** 0.689** 0.188*
* significant at 1% level ** significant at 5 % level
REFERENCES
Dann, S.S. 1992 Livestock owners and their knowledge aboutArtificial Insemination in Livestock.Mah. J. Ext. Edu.11:341-343.
Gill, S.D. and singh, P. 1977. Professional Knowledge of DairyFarmers of Ludhiana District.Indian J.Extn.Edu.13(3&4):77-79.
Kokate, K.D. and Tyagi, K.C. 1991. Dairy Farming Practices ofTribal cattle owners.Indian J.Extn.Edu 27(3&4):70-75.
Nachiappon, P.R. 1975. The Impact of Small FarmersDevelopment Agency on some selected aspect in SouthArcot District of Tamil Nadu, M. Sc. Thesis (inputs) Univ.Agric. Sci. Bangalore.
Nataraju, M.S. and Channegoda, M.B. 1986. Knowledge levelof Dairy Farmers and their PersonalCharacteristics.Indian J.Extn. Edu 31(1-4):15-21.
Nikam, T.R. and Rajamane, B.V. 1995. Training Needs andKnowledge Level of Tribal farmers in Dairy ManagementPractices.Indian J.Extn.Edu. 31(1 to 4):91-93.
Pathodiya O.P., Khadda B.S., Lavania Pankaj and SharmaS.K. 2010. Productive performance of Sirohi goat underfield condition in Southern Rajasthan. Journal ofProgressive Agriculture, 1(1) Oct.: 21-23.
Rogers, E.M. and Sheomakers, F. 1971. Communication ofInnovation-A Cross Cultural Approach.The Free Press MeMillanCo., New York.
Singh, S.P. and Godhara A.K. 2002. Knowledge of ImprovedAnimal Husbandry Practices Among Cattle Owners ofHaryana.Indian J. Dairy Sci. 55(5):294-298.
Sawarkar, S.W., Borkar, M.N., Upaddhya, S.V.and Jodhao,S.B. 2001. Characteristics of dairy owners, their awareness,adoption and constraints in adoption of artificialinsemination practices in Vidarbha Region. Indian J. DairySci. 54(4):194-202.
Singh, J.N. and Verma, A.K. 1979. Factors Affecting Knowledgelevel and Adoption of ArtificialInsemination. Indian J. Extn.Edu. 15(1&2):56-57.
Sharma, N.K.and Riyazuddin 1995. Training needs of sheepfarmers. Indian J. Extn. Edu. 31(1-4):94-97.
Singh, S.P., Narwal, R.S. and Singh.Y.P.1989. Knowledge leveland training needs of agricultural labourers regarding dairymanagement practices. Indian J. Dairy Sci. 43 (4):707-711.
Sohal, T.S. and Tyagi, K.C. 1978. Role of knowledge in adoptionof dairy innovations. Indian J. Extn. Edu 14(3-4):116-125.
Sohi, J.S. and Kherede, R.L. 1980. A study of dairy adoptionbehaviour of small and marginal farmers in Punjab. Indian J.Extn. Edu 16(1&2):84-86.
D. Cattle health1. De-worming 36 36 34 34 33 33 103 34.332. Vaccination 45 45 41 41 36 36 122 40.66
3. Clean milk production 51 51 48 48 41 41 140 46.664. Care of newly born calf 46 46 45 45 43 43 134 44.66Mean
44.5 44.5 42 42 38.25 38.25 124.75 41.57E. Management practices
1. Farm record keeping 26 26 27 27 25 25 78 26.002. Housing systems 31 31 26 26 32 32 89 29.663. Productive life 22 22 20 20 19 19 61 20.334. Farm inventory 20 20 17 17 18 18 55 18.33Mean 24.75 24.75 22.5 22.5 23.5 23.5 70.75 23.58

Journal of Progressive Agriculture, Vol.4, No. 2: October, 2013
45
Effect of different levels of irrigation and dates of sowing on growth characters andyield attributes of summer sunflower
1K. JANA AND 2A. M. PUSTE1Rice Research Station (Govt. of West Bengal), Bankura -722 101, West Bengal, India
2Deptt. of Agronomy, Bidhan Chandra Krishi Viswavidyalaya, Nadia -741 252, West Bengal, India
Received: July, 2013Accepted: Sept., 2013
ABSTRACT
To evaluate the effect of different levels of irrigation and dates of sowing on growth charactersand yield attributes of summer sunflower, a field experiment was conducted at the Instructional farm,Bidhan Chandra Krishi Viswaviyalaya (B. C. K. V.), Nadia, West Bengal, India during January to June,2004. The soil of experimental field was sandy loam in texture with medium in fertility status. Theexperiment was laid out in a split plot design in 3 replications with four levels of irrigation [I0 = un-irrigated/control, I1 = Irrigated at flowering stage, I2 = Irrigated at seedling and flowering stage, I3 =Irrigation at seedling, flowering and seed development stage] randomly allotted in the four main plots;while four dates of sowing [S1 = 13th January, S2 = 28th January, S3 = 12th February and S4 = 27th
February] were randomly allotted in the four sub plots of each main plot. Highest plant height, drymatter accumulation, leaf area index (LAI), crop growth rate (CGR), head diameter, number of seedshead-1, seed weight head-1, respectively were recorded from the treatment I3, where irrigations wereapplied at seedling (21 DAS), flowering and seed development stages, respectively. The treatment S2(28th January date of sowing) proved best performance, that date of sowing influenced significantlygrowth characters and yield attributes of summer sunflower.
Key words: Dates of sowing, Growth characters, Irrigation levels, summer sunflower and Yieldattributes.
The oilseed scenario in the country has undergonechange in recent years. In terms of value of out-put aswell as employment potential, the oilseed sector is farmore important than many other large industry puttogether. Oil seed form the second largest agriculturalcommodity after cereals in India, sharing 13 percentof the country’s gross cropped area and accountingfor nearly 5% of gross national product and 10% ofthe value of all agricultural products. Sunflower is animportant oil-yielding crop and can be a promisingcrop under such circumstances. In India, sunflower isrelatively a recent introduction towards 70’s and thepresent area is 2.7 m ha with a production of 10.86lakh tonnes during 2003-04 (Hedge, 2005). Now ithas been found that sunflower is the suitablealternative for mustard. Sunflower seed contain 40-45% high quality oil, which is light yellow in colourwith pleasant flavours and excellent keeping quality.The oil is high poly-unsaturated fatty acids (68%linoleic acid). Sunflower is recommended as a dietaryconstituent to patient suffering from physiologicaldisorders of the arteries which result heart attack.Sunflower has several desirable attributes: Shortduration crop and hence suitable for multiplecropping system and rotation, photo-insensitive,grown in coastal saline lands, drought evading abilityand does well under dry farming tracts. It has shown
great prospects for growing in different parts of India(Chaterjee et al, 1972; Singh and Singh, 1972;Jensma, 1973 and Dauley et al, 1974).
MATERIALS AND METHODS
To evaluate the effect of different levels ofirrigation and dates of sowing on growth charactersand yield attributes of summer sunflower, a fieldexperiment was conducted at the Instructional farm,B. C. K. V., Nadia, West Bengal, India duringJanuary to June, 2004. The soil of experimental fieldwas sandy loam in texture with medium in fertilitystatus. The experiment was laid out in a split plotdesign in 3 replications with four levels of irrigation[I0 = un-irrigated/control, I1 = Irrigated at floweringstage, I2 = Irrigated at seedling and flowering stage, I3
= Irrigation at seedling, flowering and seeddevelopment stage] randomly allotted in the fourmain plots; while four dates of sowing [S1 = 13th
January, S2 = 28th January, S3 = 12th February and S4
= 27th February] were randomly allotted in the foursub plots of each main plot. Hybrid sunflower (cv.MSFH 17) was used. The fertilizer was applied @ 60,40 and 40 kg ha-1 of N, P2O5 and K2O asrecommended practice. The source of N, P2O5 andK2O were urea, S.S. P. and M.O.P., respectively. Halfdose of N and full dose of P2O5 and K2O were applied

Journal of Progressive Agriculture, Vol.4, No. 2: October, 2013
46
as basal at the last ploughing operation but beforeseeding in the field. Rest hall (50%) was top dressedjust after 1st weeding operation (21 DAS) and ureawas well mixed with the soil after application.
RESULTS AND DISCUSSION
It was revealed from the experimental results thatall the growth characters and yield attributes, except100-seed weight were found to differ significantlyunder different levels of irrigation and dates ofsowing (Table 1 and Table 2).
Effect of different levels of irrigation:Application of irrigation at seedling (21 DAS),
flowering and seed development stages (I3 treatment)gave the highest plant height (152.4 cm), maximumvalue of dry matter accumulation (132.36 g per plant)at harvest, highest leaf area index (1.24) at 90 DAS,maximum crop growth rate (2.87 g per plant per day)at 60-90 DAS, highest diameter of head (18.4 cm),maximum number of seeds head -1 (662.7) andhighest seed weight head -1 (36.4 g) at harvest, whichstatistically significant over other levels of irrigation(Table 1 and Table 2). All the irrigation treatmentsrecorded better results over no irrigation treatment i.e.control (I0 treatment). The positive effect of irrigationon growth characters and yield attributes waspossibility due to availability of irrigation water,which helped in better utilization of nutrients from thesoil, greater photosynthetic activity and also due tobetter translocation of photo-synthates from source tosink.
Effect of dates of sowing:Among the different of dates of sowing, January
28 sowing (S2 treatment) proved the best performanceand recorded highest plant height (155.4 cm),maximum dry matter accumulation (98.89 g perplant) at harvest, highest LAI (1.28) at 90 DAS,maximum CGR (2.06 g per plant per day) at 60-90DAS, highest diameter of head (17.8 cm), maximumno. of seeds head-1 (675.5) and highest seed weighthead-1 (35.1 g) at harvest, which was statisticallysignificant over the crop sown on other dates ofsowing. Least plant height (122.9 cm), DMaccumulation (75.76 g per plant) at harvest, LAIvalue (0.98) at 90 DAS, CGR (1.51 g per plant perday) at 60-90 DAS, head diameter (9.6 cm), lowest
no. of seeds head-1 (300.1), seed weight head-1 (12.4g) were obtained with treatment S4, when crop wassown on February 27 (Table 1 and Table 2).Sunflower crop sown on February 27 (treatment S4),which affect the growth of crop due to hightemperature at germination stage. As this crop requirelow temperature i.e. cool climate at ground levelduring germination stage. Otherwise, it will affect thegrowth. Late sown crop received bright sunshine for ashort period accomplished by cloudy days whichrestrict the photosynthetic rate of the crop particularlyduring grain filling period and ultimately producedthe lowest number of seeds head-1 and lowest seedweight head-1. 100-seed weight did not influencedsignificantly by the levels of irrigation applied on thecrop and variation in dates of sowing (Table 2).
CONCLUSION
There was significant influence of different levelsof irrigation and dates of sowing on growth and yieldattributing characters of summer sunflower.Application of irrigation at seedling stage (21 DAS),flowering and seed development stages (I3 treatment)was superior in case of both growth and yieldattributing characteristics. The lowest yield attributingcharacters were resulted from February 27 sowingmight be due to high temperature during floweringperiod. When, the atmospheric temperature is morethan 350C during flowering period, which results inpoor seed-setting. It may be concluded that aftermiddle of February, sowing of summer sunflowershould not be advocated. As because there may bechance of on setting of pre-monsoon showers, whichmay hamper the post harvest operation of this crop.
ACKNOWLEDGEMENT
The authors would like to thanks Prof. B. K.Mandal, Prof. S. S. Mondal: retired Professor &former Head, respectively and Prof. P.Bandyopadhyay, Prof. R. K. Ghosh, Dr. B. C. Patraand Dr. K. Brahmachari, Department of Agronomy,Bidhan Chandra Krishi Viswavidyalay, Mohanpur,Nadia, West Bengal, India for their valuable guidanceand encouragement during the period of this researchprogramme.
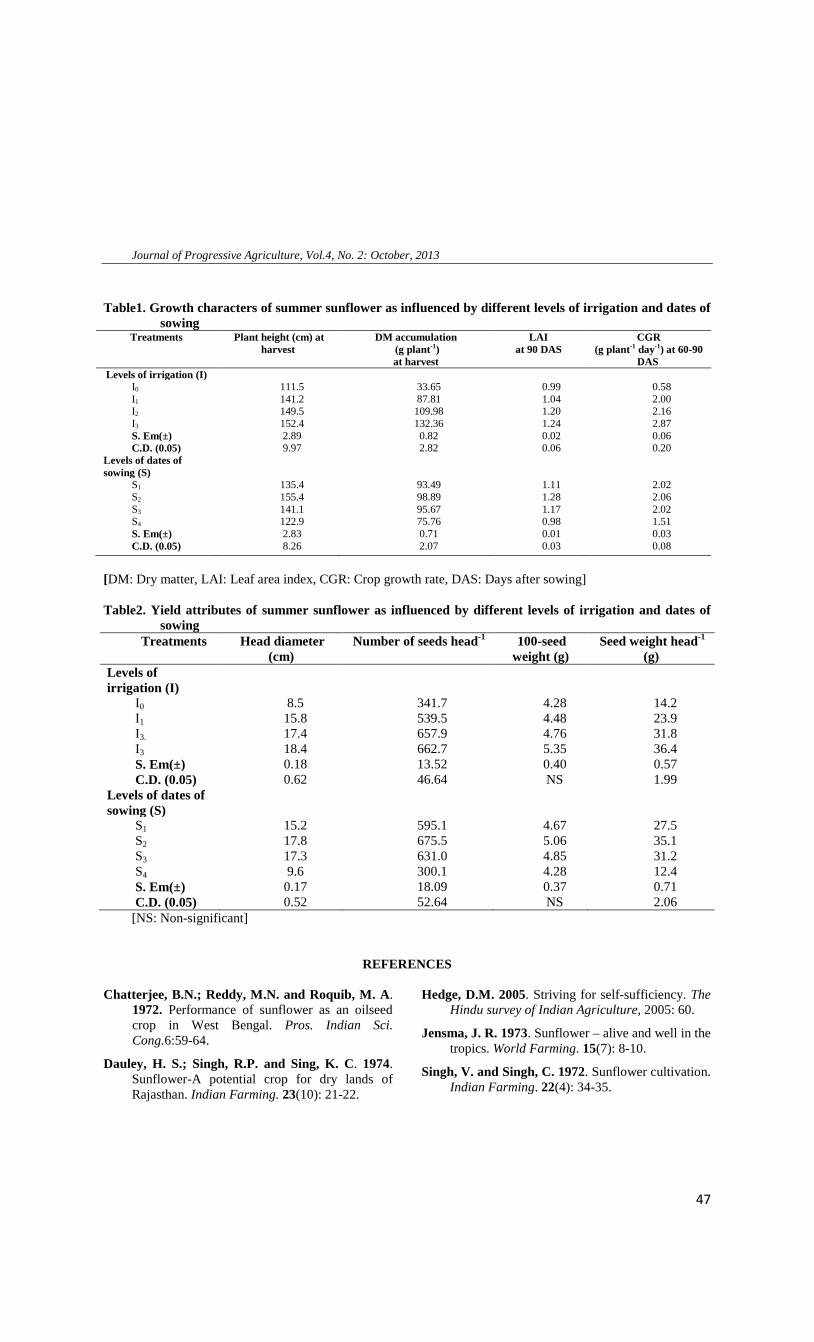
Journal of Progressive Agriculture, Vol.4, No. 2: October, 2013
47
Table1. Growth characters of summer sunflower as influenced by different levels of irrigation and dates ofsowing
Treatments Plant height (cm) atharvest
DM accumulation(g plant-1)at harvest
LAIat 90 DAS
CGR(g plant-1 day-1) at 60-90
DASLevels of irrigation (I)
I0 111.5 33.65 0.99 0.58I1 141.2 87.81 1.04 2.00I2 149.5 109.98 1.20 2.16I3 152.4 132.36 1.24 2.87S. Em(±) 2.89 0.82 0.02 0.06C.D. (0.05) 9.97 2.82 0.06 0.20
Levels of dates ofsowing (S)
S1
S2
S3
S4
S. Em(±)C.D. (0.05)
135.4155.4141.1122.92.838.26
93.4998.8995.6775.760.712.07
1.111.281.170.980.010.03
2.022.062.021.510.030.08
[DM: Dry matter, LAI: Leaf area index, CGR: Crop growth rate, DAS: Days after sowing]
Table2. Yield attributes of summer sunflower as influenced by different levels of irrigation and dates ofsowing
Treatments Head diameter(cm)
Number of seeds head-1 100-seedweight (g)
Seed weight head-1
(g)Levels ofirrigation (I)
I0 8.5 341.7 4.28 14.2I1 15.8 539.5 4.48 23.9I3. 17.4 657.9 4.76 31.8I3 18.4 662.7 5.35 36.4S. Em(±) 0.18 13.52 0.40 0.57C.D. (0.05) 0.62 46.64 NS 1.99
Levels of dates ofsowing (S)
S1
S2
S3
S4
S. Em(±)C.D. (0.05)
15.217.817.39.6
0.170.52
595.1675.5631.0300.118.0952.64
4.675.064.854.280.37NS
27.535.131.212.40.712.06
[NS: Non-significant]
REFERENCES
Chatterjee, B.N.; Reddy, M.N. and Roquib, M. A.1972. Performance of sunflower as an oilseedcrop in West Bengal. Pros. Indian Sci.Cong.6:59-64.
Dauley, H. S.; Singh, R.P. and Sing, K. C. 1974.Sunflower-A potential crop for dry lands ofRajasthan. Indian Farming. 23(10): 21-22.
Hedge, D.M. 2005. Striving for self-sufficiency. TheHindu survey of Indian Agriculture, 2005: 60.
Jensma, J. R. 1973. Sunflower – alive and well in thetropics. World Farming. 15(7): 8-10.
Singh, V. and Singh, C. 1972. Sunflower cultivation.Indian Farming. 22(4): 34-35.

Journal of Progressive Agriculture, Vol.4, No. 2: October, 2013
48
Genotype by environment interaction and grain yield stability analysis of rice (Oryzasativa L.) genotypes under drought
1R. SELLAMMAL AND 2S. ROBIN
1Research Scholar, Department of Rice, Centre for Plant Breeding and Genetics2Professor and Head, Department of Rice, Centre for Plant Breeding and Genetics, TNAU,
Coimbatore -641003, Tamil Nadu
Received: August, 2013Accepted: Sept., 2013
ABSTRACT
Genotype-environment interaction and stability performance were investigated on grain yield with67 rice backcross inbred lines in three environments. The experiment was conducted usingRandomized Complete Block Design with three replications. The combined ANOVA showed that themean sum of square due to genotype (G), environment (E) and G × E interaction were significant forgrain yield. This suggests a number of variability among the genotypes and environments as and theindicated genotypes interacted significantly with environments. The AMMI (Additive Main Effects andMultiplicative Interaction) analysis of variance of plot yield of the sixty seven genotypes tested in threeenvironments showed that 6.387 per cent of the total sum of squares was attributable to genotypiceffects, 85.8 per cent to environmental effects and 7.69 per cent to genotype x environment interactioneffects. The biplot technique was used to identify appropriate genotype to special locations. Thisconsideration on the basis of average yield for specific genotype to the specific location The AMMIbiplot for yield clearly indicated that the CB-0015-52, CB-0015-26, CB-0015-47, CB-0015-35 and CB-0015-66 were high yielding, stable and had general adaptability across the environment due to IPCAscore near zero which had no interaction effect.
Key words: Additive main effects and multiplicative interaction, BILs, drought, rice, stability.
Rice (Oryza sativa L.) is the most importantfood of the world and more than half of the globalpopulation subsists on it. It is also the majorlivelihood of rural population living in subtropicaland tropical Asia and hundreds of millions peopleliving in Africa and Latin America. It contains anumber of energy rich compounds such ascarbohydrates, fat, protein and reasonable amount ofiron, calcium, thiamine, riboflavin and niacin (Akbaret al., 2010). Plant growth and productivity aregreatly affected by environmental stresses such asdrought, high salinity, and low temperature (Zheng etal., 2010). Drought is a major factor limiting growthand development in higher plants. Since drought is acommon occurrence in many environments, manyperennial plant species have developed mechanismsto cope with a restricted water supply (Arndt et al.,2001 and Hossein et al., 2012).
Varietal adaptability to environmentalfluctuations is important for the stabilization of cropproduction. Information on genotype × environmentinteraction leads to successful evaluation of stablegenotype, which could be used for general cultivation.Yield is a complex quantitative character and isgreatly influenced by environmental fluctuations;hence, the selection for superior genotypes based on
yield per se at a single location in a year may not bevery effective (Shrestha et al., 2012). Thus,evaluation of genotypes for stability of performanceunder varying environmental conditions for yield hasbecome an essential part of any breeding program(Kulsum et al., 2013).Several methods have been proposed to analyzegenotype × environment interaction and phenotypicstability. These methods can be divided into twomajor groups: univariate and multivariate stabilitystatistics (Lin et al., 1986). A combined analysis ofvariance can quantify the interactions and describe themain effects. However, it is uninformative forexplaining genotype × environment interaction.Among multivariate methods, the additive main effectand multiplicative interaction analysis (AMMI) hasbeen extensively applied in the statistical analysis ofmulti-environment cultivar trials (Kempton, 1984;Crossa, 1990; Gauch and Zobel, 1997).
The AMMI model (Gauch,1993) is moreefficient in determining the most stable and highyielding genotypes in multi-environment trialscompared to earlier procedures (Finlay andWilkinson, 1963, Eberhart and Russel, 1966). Biplotanalysis is possibly the most powerful interpretivetool for AMMI models. Biplots are graphs where

Journal of Progressive Agriculture, Vol.4, No. 2: October, 2013
49
aspects of both genotypes and environments areplotted on the same axes so that interrelationships canbe visualized. The AMMI biplot where the maineffects (genotype mean and environment mean) in Xaxis and IPCA1 scores for both genotypes andenvironments are plotted in Y axis. The effectivenessof AMMI procedure has been clearly demonstrated(Crossa et al. 1991, Das et al. 2009, Tarakanovas andRuzgas 2006, Kulsum et al., 2013)
This method has been shown to be effectivebecause it captures a large portion of the genotype ×environment interaction sum of squares, it clearlyseparates main and interaction effects that presentagricultural researchers with different kinds ofopportunities and the model provides agronomicallymeaningful interpretation of the data (Ebdon andGauch, 2002 and Tariku et al., 2013). The results ofAMMI analysis are useful in supporting breedingprogram decisions such as specific and broadadaptation and selection of environment (Gauch andZobel, 1997). Therefore, the objectives of this studywere to assess the extent of genotype × environmentinteraction for grain yield, to evaluate rice genotypesfor their yield performance and stability and to selectgenotypes with high grain yield with droughtresistance.
MATERIALS AND METHODS
The research works were carried out at the Riceresearch station, Coimbatore. A backcross inbredpopulation derived from the cross IR 64/Norungan//IR64///IR 64 and fixed in BC2 F7 generation was used forthe study.Field analysis
Experiments were conducted using arandomized complete block design with threereplications for two year. In irrigated control theexperiment was maintained as irrigated till harvest.The crop was raised during summer season (2008-2009). Under moderate stress condition, stress wasimposed by making buffer channels to avoid seepagefrom adjoining plots. Irrigation withheld in on 60 daysafter transplanting. During stress period intermittentrainfall affected the intensity of drought and hence thistrail was treated as moderate stress. In severe stress thetrail was raised as a delayed wet season crop duringend of October 2009 to February 2010. Uptovegetative stage the irrigation was applied. From 40th
day after transplanting severe stress was imposed bywithholding irrigation. During this season no rain wasrecorded and stress was maintained till harvest.Statistical analysis
Data on grain yield for the 67 genotypes of ricein two year-location environments were subjected tostability analysis. To implement the stability analysesby AMMI model the data was input into the CROPSTAT 6. The AMMI statistical model (Zobel et al.,1988) is a hybrid model. It makes use of standard
analysis of variance (ANOVA) procedures to separatethe additive variance from the multiplicative variance(GxE interaction) and then uses a multiplicativeprocedure. Principal components Analysis (PCA) isto extract the pattern from the G x E portion of theANOVA analysis. The results of least squareanalysis, which with further graphical representationof the numerical results (Biplot analysis) often allowsa straight forward interpretation of the underlyingcauses of GxE interaction. The AMMI biplot isdeveloped by placing both genotype and environmentmeans on the x- axis and the respective PCA axisEigen vectors on the y- axis.
RESULTS AND DISCUSSION
Present study was carried out to determine theplot yield performance of sixty seven genotypesacross three water stress treatments. The analysis ofvariance for grain yield showed highly significantdifferences for genotypes, environments and theirinteraction. Data of the analysis of variance showedthat grain yield was influenced by the environmentsof testing, genotypes and their interactions (Table 1).The presence of a significant genotype x environmentinteractions (p<0.05) allows further analysis. This isin accordance with previous reports on rice by Sawantet al. (2005) and Panwar et al. (2008), Tariku et al,2013 and Mahalingam et al, 2013. The estimates ofstability parameters of sixty seven genotypes andthree environments for plot yield are presented inTable2. The AMMI analysis of variance of plot yieldof the sixty seven genotypes tested in threeenvironments showed that 6.387 per cent of the totalsum of squares was attributable to genotypic effects,85.8 per cent to environmental effects and 7.69 percent to genotype x environment interaction effects(Table 1).
Results from AMMI analysis also showed thatthe first principal component axis (IPCA I) of theinteraction captured 65.04 per cent of the interactionsum of squares and the second principal componentaxis (IPCA II) explained further 34.96 per cent of thegenotype x environment interaction sum of squares.These two principal component axis (IPCA I andIPCA II) accounted for 100 per cent of the genotype xenvironment interaction sum of squares and usedentire degrees of freedom available in the interaction.The obtained data confirmed adequacy to the AMMImodel. This has presented a possibility ofconstructing the biplot and calculating the genotypeand environment effects. In biplot 1, (Mean withIPCA1) moderate stress (E2), control (E1) had low andmedium interaction and severe stress (E3) had highinteraction with genotypes. The IPCA scores ofgenotypes in the AMMI analysis is an indication ofstability or adaptation over environments (Gauch andZobel, 1996). The greater the IPCA scores, the morespecifically adapted is a genotype to certain
Journal of Progressive Agriculture, Vol.4, No. 2: October, 2013
50
environments (Sanni et al., 2009). The more theIPCA scores approximate to zero, the more stable oradapted the genotype is over all the environmentssampled. Genotypes like CB-0015- 52, 32, 34, 37, 43, 29,33, 49 and 25 differs only in main effects. Thesegenotypes had low interaction with environments.However the BILs viz., CB-0015-06, 26, 35, 11 had highmean values. In biplot 2, (IPCA1 with IPCA2) E1 andE2 had low interactive effects and E3 had high interactiveeffects with genotypes. Genotypes CB-0015-15, 33, 30,66, 23, 31, 47, 37 and 39 had low interaction compared toothers. Genotypes CB-0015-18, 41, 57, 34, 37, 59 and 12differs only in interaction effects. So these genotypes aresuitable for favourable environment. Among those CB-0015-37 had IPCA score is nearing zero as unaffected byenvironments.
The first principal component axis (IPCA I) ofthe interaction of AMMI analysis accounted for 65.94percent of the genotype x environment interactionsum of square, the second principal component axis(IPCA II) accounted for 34.96 percent using sixtyseven and sixty five degrees of freedom respectively.These results showed AMMI with two principalcomponent axis (IPCA I and IPCA II) to be the bestpredictive model. A large sum of squares forgenotypes indicated that the genotypes were diversewith large differences among genotypic meanscausing variation in grain yield. Crossa et al. (1989)and Crossa et al. (1990) used AMMI model with additiveeffects for genotypes and environments and multiplicativeterms for GxE interaction. They suggested that in plantbreeding the approximate gain in precision achieved withAMMI provides a tool for selecting better genotypes andtherefore achieving higher realized progress fromselection. In the biplot I, showing main effect meanson the abscissa and IPCA 1 values as the ordinates,genotypes (or environments) that appear almost on aperpendicular line have similar means and those thatfall almost on a horizontal line have similarinteraction patterns. Genotypes (or environments) withlarge IPCA 1 scores (either positive or negative) havehigh interactions whereas genotypes (orenvironments) with IPCA 1 scores near zero havesmall interactions. As pointed out by Zobel et al.(1988), the AMMI expected yield for any genotype
and environment combination can be calculated frombiplot 1. The genotype and environment with IPCA Iscores of the same sign produce positive interactioneffects, where as combination of IPCA I scores ofopposite signs have negative specific interactions. Mostof the variation in the genotype- by- environment(GxE) analysis was due to environmental effects,which accounted for over 85.8% of the total variance.The direct effect of genotype was small (6.387%),and about 7.69% of the total variation was due tointeractions between genotype and environment. Thisresult was similar to the findings of Lafitte et al. (2007)and Sanni et al. (2009). Norungan was found to bestable across three environments; IR 64 always innegative quarter, which indicated the susceptiblenature of IR 64. With regard to biplot 1 (mean withIPCA1), moderate stress (E2), control (E1) had lowand medium interaction and severe stress (E3) hadhigh interaction with genotypes. Genotypes like CB-0015-52 (G 52), CB-0015-32 (G 32), CB-0015-34 (G34), CB-0015-37 (G 37), CB-0015-43 (G 43), CB-0015-29 (G 29), CB-0015-33 (G 35), CB-0015-49 (G49) and CB-0015-25 (G 25) differs only in maineffects and had low interaction with environments.Among them CB-0015-6 (G 6), CB-0015-26 (G 26),CB-0015-35 (G 35), CB-0015-11 (G 11) had highmean value also (Fig 1).
In biplot 2 (Fig 2) (IPCA1 with IPCA2), E1 andE2 had low interactive effects as in biplot 1 and E3 hadhigh interactive effects with genotypes. Genotypes CB-0015-15 (G 15), CB-0015- 66 (G 66), CB-0015- 33 (G33), CB-0015- 30 (G 30), CB-0015- 23 (G 23), CB-0015-31(G 31), CB-0015- 47 (G 47), CB-0015- 37 (G 37) andCB-0015- 39 (G 39) had low interaction compared toothers. Genotypes CB-0015-18 (G 18), CB-0015- 41 (G41),CB-0015-57 (G 57), CB-0015 34 (G 34), CB-0015-12(G 12) differed only in interaction effects. So thesegenotypes are suitable for favorable environment. Amongthose CB-0015-37 (G 37) had IPCA score nearing zeroand is assumed to be unaffected by environments.
Conclusively a set of five genotypes namely,CB-0015-52, CB-0015-26, CB-0015-47, CB-0015-35and CB-0015-66 exhibited stable performance acrossdifferent moisture regimes to be selected as stablegenotypes.

Journal of Progressive Agriculture, Vol.4, No. 2: October, 2013
51
Table 1. Additive main effects and multiplicative Interaction analysis of variance for plot yield of sixtyseven genotypes
* %GxE S.S = Percentage of GxE interaction sum of squares to AMMI components* df = degrees of freedom*, ** Significant at 0.05 and 0.01 probability level
Table 2. Estimates of stability parameters (AMMI) for plot yield.
Genotype Predicted mean(PY/g) IPCA 1 IPCA 11CB-0015-01 32.95*** -4.683 -2.024 ***CB-0015-02 -3.216*** -3.322*** -1.681 ***CB-0015-03 -20.35 4.319*** -2.891 ***CB-0015-04 -1.549*** 2.208*** 2.635CB-0015-05 23.47*** -0.1975*** 0.729 ***CB-0015-06 23.83*** 1.916*** -1.265CB-0015-07 59.83 -1.783*** 1.756 ***CB-0015-08 44.82 -5.441*** 1.639CB-0015-09 -32.88 4.585 -1.159 ***CB-0015-10 -47.91*** 4.133*** -1.827CB-0015-11 5.017*** 1.639 -4.196 ***CB-0015-12 1.851*** 2.342*** 2.470CB-0015-13 34.55*** -1.129 -0.496 ***CB-0015-14 -8.338*** 0.369*** 0.104CB-0015-15 -14.06*** 2.897*** 0.020CB-0015-16 -22.94 2.440*** 0.842CB-0015-17 -14.93*** 5.075*** -0.545 ***CB-0015-18 -2.661*** 3.089*** 0.855CB-0015-19 -29.68 0.367*** 0.411 ***CB-0015-20 -24.97*** -0.096 1.842 ***CB-0015-21 46.39*** -2.728 -0.877 ***CB-0015-22 -48.25*** 4.270*** -1.821 ***CB-0015-23 -10.43 1.133*** -0.114 ***CB-0015-66 -7.172 1.451*** -0.385CB-0015-25 -68.04*** -0.308*** 1.881 ***CB-0015-26 14.36 2.410*** -0.611CB-0015-27 28.23 -1.824*** -1.479 ***CB-0015-28 27.26 -1.399*** -0.692 ***CB-0015-29 2.528*** -2.775 -2.661 ***CB-0015-30 -39.03*** 0.869*** -0.103CB-0015-31 -11.08*** -1.199 -0.244 ***CB-0015-32 34.43*** 0.205*** 1.895CB-0015-33 -0.9828*** 0.024 -1.170 ***CB-0015-34 11.16 0.306*** 1.015CB-0015-35 19.05 1.734 -1.458 ***
*** Significant at 0.001 probability level
(Contd.,)
Sources dfSum ofsquares
Mean sum ofsquares %GxE S.S F
Pr (F)(5%)
Pr(F )(1%)
Genotypes (g-1) 66 163838 2482.39 2.339** 1.507 1.789Environment ( e-1) 2 2.20E+06 1.10E+06 103.7** 3.138 4.947GxE interaction (g-1)(e-1) 132 197283 1494.57 1.408* 1.350 1.530AMMI component 1 67 128316 1915.17 65.04 1.805** 0.009 1.505AMMI component 2 65 68967.2 1061.03 34.96 ******** 1.000Total (r(ge-1) 200 2565340

Journal of Progressive Agriculture, Vol.4, No. 2: October, 2013
52
Table 2. Estimates of stability parameters (AMMI) for plot yieldGenotype Predicted mean(PY/g) IPCA 1 IPCA 11CB-0015-36 -15.59*** -0.891*** -1.418CB-0015-37 1.595*** 0.135*** -0.042CB-0015-38 -27.09 -0.331*** 0.941CB-0015-39 -4.016 0.485 0.552 ***CB-0015-40 35.61*** -3.111*** 0.566 ***CB-0015-41 -53.87*** 3.077 1.535 ***CB-0015-42 -0.505*** 0.734*** -1.521CB-0015-43 -11.97 -0.059 1.445 ***CB-0015-44 -28.05 -0.246*** 3.088 ***CB-0015-45 -9.761 -2.504*** -2.973 ***CB-0015-46 21.16 -0.229*** -3.256 ***CB-0015-47 15.36*** -3.567*** 0.194 ***CB-0015-48 -5.138 -0.8669*** -1.691 ***CB-0015-49 -4.694*** 0.1235*** 6.123 ***CB-0015-50 11.86 -0.8147*** -1.463 ***CB-0015-51 -21.88*** -1.626 1.012 ***CB-0015-52 35.01*** -0.0311 -0.517 ***CB-0015-53 30.18 -0.9594*** 5.659 ***CB-0015-54 59.94 -5.034*** -1.997 ***CB-0015-55 16.12 -1.167 -1.652 ***CB-0015-56 26.57 -2.256*** -0.959 ***CB-0015-57 1.317*** 1.38*** 0.4469 ***CB-0015-58 -51.46 0.491*** -2.237 ***CB-0015-59 -20.17*** 0.929 2.013 ***CB-0015-60 -15.53 -2.198*** -0.393 ***CB-0015-61 -35.73*** 0.921 -0.441 ***CB-0015-62 47.33 -1.362*** 1.894 ***CB-0015-63 -17.81*** -2.655*** -.6178 ***CB-0015-64 -38.28 2.286*** -1.661 ***CB-0015-65 40.68*** -2.191*** -0.718 ***Norungan 21.08 2.436*** 3.028 ***IR 64 -6.538*** -2.039 4.868 ***Mean 2.526 0.054 -0.506
Environment Mean IPCA 1 IPCA2
E1 106.6 -9.570 10.385E2 35.08 -5.715 -12.293E3 -142.4 15.292 1.908
*** Significant at 0.001 probability level

Journal of Progressive Agriculture, Vol.4, No. 2: October, 2013
53
REFERENCES
Akbar, N., Iqbal, A., Zaman, H., Khan, M., Hanif, K.and Bashir, M.U. 2010. Effect of different sowingdates on the yield and yield components of amongspring and winter (Triticum aestivum L.)accessions. South African J. Bot. 73:60-75.
Arndt, S.K., Clifford, S.C., Wanek, W. Jones, H.G. andPopp, M. 2001. Physiological and morphologicaladaptations of the fruit tree Ziziphus rotundifolia inresponse to progressive drought stress. Tree Physiol.21:705-715.
Crop Stat 6.1 for Windows.Tutorial Manual, 2007. CropResearch Informatics Laboratory. International RiceResearch Institute. pp. 360.
Crossa, J. 1990. Statistical analysis of multi-location trials.Adv Agron. 44:55-85.
Crossa, J., Gauch, H.G., Zobel, R.W. 1990. Additivemain effects and multiplicative interaction analysis oftwo international maize cultivar trials. Crop Sci. 30:493-500.
Crossa, J., Westcott, B. and Gonzalez. 1989. The yieldstability of CIMMYT’S maize germplasm. Euphytica.40: 245-251.
Crossa, J., Gauch, H.G. and Zobel, R.W. 1990. Additive maineffects and multiplicative interaction analysis of twointernational maize cultivar trails. Crop Sci. 30: 493-500.
Das, S., Misra, R.C. and Patnaik, M.C. 2009. G×Einteraction of mid-late rice genotypes in LR andAMMI model and evaluation of adaptability and yieldstability. Environment and Ecology. 27:529-535.
Ebdon, J.S. and Gauch, H.G. 2002. Additive main effectand multiplicative interaction analysis of nationalturfgrass performance trials. II. Cultivarrecommendations. Crop Sci. 42:497-506.
Eberhart, S.A. and Russell, W.A. 1966. Stabilityparameters for comparing varieties. Crop Sci. 6:36–40.
Finlay, K.W. and Wilkinson, G.N. 1963. The analysis ofadaptation in a plant-breeding program. Aust. J.Agric. Res. 14:742–754.
Gauch HG. 1993. Matmodel version2.0. AMMI andrelated analysis for two-way data matrices. Microcomputer power, Ithaca, New York, USA.
Gauch, H.G. and Zobel, R.W. 1997. Identifying mega-environments and targeting genotypes. Crop Sci.37:311-326.
Gauch, H.G. 1988. Model selection and validation foryield trials with interaction. Biometrics 44:705–715.
Hosseini, S.R., Sarvestani, Z.T. and Pirdashti, H.T.2012. Responses of some rice genotypes to droughtstress. Int. J. Agricul. Res. Rev. 2 (4):475-482.
Kempton, R.A. 1984. The use of biplots in interpretingvariety by environment interaction. J Agric Sci.103:123-135.
Kulsum, M., Jamil Hasan, M., Akter, A., Rahman, H.and Biswas, P. 2013. Genotype-environmentinteraction and stability analysis in hybrid rice: anapplication of additive main effects and multiplicativeinteraction. Bangladesh J. Bot. 42(1): 73-81.
Lin, C.S., Binns, M.R. and Lefkovitch, L.P. 1986.Stability analysis, where do we stand? Crop Sci.26:894-900.
Mahalingam, A., Saraswathi, R., Robin, S., Marimuthu,T., Jayaraj, T. and Ramalingam, J. 2013. Geneticsof stability and adaptability of rice hybrids (Oryzasativa L.) for grain quality traits. Afric. j. Agrl. Sci.8(22):2673-2680.
Sanni, K.A., Ariyo, O.J., Ojo, D.K., Gregorio, G.,Somado, E.A., Sanchez, I., Sie, M., Futakuchi, K.,Ogunbayo, S.A., Guei, R.G., and Wopereis, M.C.S.2009. additive main effects and multiplicativeinteractions analysis of grain yield performances inrice genotypes across environments. Asian J. of PlantSci. 8:48-53.
Shrestha, S.P., Asch, F., Dusserre, J.,Ramanantsoanirine, A. and Brueck, H. 2012.Climate effects on yield components as affected bygenotypic responses to variable environmentalconditions in upland rice systems at differentaltitudes. Field Crops Res. 134:216-228.
Tariku, S., Lakew, T., Bitew, M. and Asfaw, M. 2013.Genotype by environment interaction and grain yieldstability analysis of rice (Oryza sativa L.) genotypesevaluated in north western Ethiopia. Net.J.Agrl.Sci.1(1):10-16.
Zheng J, Fu J, Gou M, Huai J, Liu Y, Jian M, Huang Q,Guo X, Dong Z, Wang H, and Wang G. 2010.Genome-wide transcriptome analysis of two maizeinbred lines under drought stress. Plant Mol. Biol.72:407-423.
Zobel, W., Wright, M.J. and Gauch, H.G. 1988.Statistical analysis of yield trials. Agron. J., 80: 388-393.

Journal of Progressive Agriculture, Vol.4, No. 2: October, 2013
54
Genetic variation, association and path coefficient analysis for grain yield and itscomponents in RILs derived population of rice
PRABHARANI CHAUDHARI1, D.K.MISHRA2 AND G.K. KOUTU3
Plant Breeding & Genetics, Jawaharlal Nehru Krishi Vishwa Vidyalaya,Jabalpur 482004 (MP)
Received: August, 2013Accepted: Sept., 2013
ABSTRACT
One hundred twenty one japonica x indica derived F10 Recombinant Inbred Lines (RILs) wereplanted in Alpha lattice design with two replications during kharif 2012 at Seed Breeding Farm,Department of Plant Breeding and Genetics, J.N.K.V.V., Jabalpur. Significant variation due togenotypes for all the characters revealed that the genotypes differ significantly for all the charactersunder study. In present study high heritability coupled with high genetic advance was exhibited forcharacters viz.., number of tillers per plant, number of filled spikelets per panicle, number of unfilledspikelets per panicle, number of spikelets per panicle, grain yield per plant, panicle index and harvestindex. It was also observed that number of tillers per plant, plant height, biological yield per plant,panicle index and harvest index were positively correlated with grain yield and also had positive directeffect and therefore these traits should be given due importance while practicing selection, aimed forimprovement of grain yield. These RILs can be used as parents for hybrid production in rice.
Key words: Correlation, Genetic variability, Path analysis and Rice.
Rice (Oryza sativa L.) is one of the importantcereal crops and is central to the lives of billions ofpeople around the world. Rice is predominant staplefood for 17 countries in Asia and the pacific, ninecountries in North and South America and eightcountries in Africa. India rank 1st in area (43.92million ha) and 2nd in production (91.61 milliontonnes) after China.9 The current world populationof 6.1 billion is expected to reach 8.0 billion by 2030and rice production must increase by 50 percent inorder to meet the growing demand. If this goal is tobe met, it is necessary to use rice varieties with higheryield potential, durable resistance to diseases andinsects and tolerance to abiotic stresses.
Yield of rice is a complex quantitativecharacters controlled by many genes interacting withenvironment. Population of Recombinant InbredLines can serve as a powerful tool to cover thecomplexity of yield related traits. They are therecombinant output from which superior stabilizedsegregants can be directly used as breeding lines.Considering the above facts the RILs population wereused to assess the variability of yield and itscomponent traits and there association.
MATERIALS AND METHODS
Japonica x Indica derived F11, one hundredtwenty one Recombinant Inbred lines along withtwo parents (JNPT 89 & IR 64) were planted in anAlpha lattice design with two replications duringKharif 2012 at Seed Breeding Farm, Department ofPlant Breeding and Genetics, J.N.K.V.V., Jabalpur.
Twenty one days seeding of each genotype wasplanted in five rows of three meter length with 20 cmrow spacing keeping single seedling per hill.Recommended package of practices were followed toa raise a good crop.
The observations of yield and yieldattributing characters were recorded as per standardprocedure. The data were subjected to statisticalanalysis to workout GCV, PCV, heritability,correlation and path coefficient analysis as perstandard methods.
RESULTS AND DISCUSSION
The mean, range, phenotypic and genotypicco-efficient of variation, heritability estimates andgenetic advance percentage of mean are presented intable 1. Significant variation due to genotypes for allthe characters revealed that the genotypes differsignificantly for all the characters under study.Considering the magnitude of phenotypic andgenotypic coefficient of variation it was revealed thatnumber of unfilled spikelets per panicle, number oftillers per plant, panicle index, harvest index, numberof spikelets per panicle, number of filled grains perpanicle panicle weight per plant had relatively largeamount of genetic variability. In present study highheritability coupled with high genetic advance wasexhibited for characters viz.., number of tillers perplant, number of filled spikelets per panicle, numberof unfilled spikelets per panicle, number of spikeletsper panicle, grain yield per plant, panicle index andharvest index. Such values indicated, predominantly

Journal of Progressive Agriculture, Vol.4, No. 2: October, 2013
55
the presence of additive gene action in the expressionof these traits and consequently, greater chance ofimproving these traits through simple selection. Highheritability coupled with low genetic advance wasalso observed for days to 50% flowering, culm height,plant height and test weight. Such values indicatednon-additive gene action and influenced by thefavourable environment rather than genotypes. Theseresults are in agreement with result reported by 6, 3, 5and 9.
It was observed that grain yield per plantwas positively associated with number of tillers perplant, culm height, plant height, biological yield perplant, panicle index and harvest index (Table 2). Thepath coefficient analysis (Table 3) revealed that plantheight, harvest index, panicle index, biological yield
per plant, panicle weight per plant, filled spikelets perpanicle, unfilled spikelets per panicle, total tillers perplant and test weight had positive direct effect ongrain yield per plant therefore, these traits should begiven due importance while practicing selection,aimed for improvement of grain yield in rice. Theseresults agree with the findings reported by 4,1, 2 and8.
On the basis of finding, the selection ofRILs for higher yield may be given due importanceon the basis of good number of tillers per plant,moderate plant height, high biological yield per plant,high panicle index and high harvest index. TheseRILs can be used as parents for Hybrid production inrice.
Table 1. Parameters of genetic variability and its attributes in recombinant inbred lines of rice
CharactersMean
Range H2(bs)(%)
GA as %of meanMin. Max. GCV (%) PCV (%)
Days to 50 percent flowering (X1) 95.22 72.50 114.50 9.98 10.03 98.89 20.44Culm height (cm) (X2) 76.16 56.10 133.20 10.95 11.40 92.29 21.68Panicle length (cm) (X3) 25.73 21.00 31.20 5.87 7.84 56.16 9.07Pant height (cm) (X4) 101.89 81.80 160.10 8.56 8.97 91.12 16.83Number of tillers /plant (X5) 6.62 2.90 12.75 34.14 36.10 89.42 66.50No. of filled grains / panicle (X6) 168.04 90.05 291.70 25.86 26.75 93.47 51.51No. of unfilled spikelets /panicle (X7) 50.98 5.51 236.50 65.20 66.36 96.54 131.97No. of spikelets /panicle (X8) 219.44 121.31 452.40 30.01 30.41 97.39 61.01Panicle weight /plant (gm) (X9) 26.78 16.25 53.30 22.82 23.72 92.56 45.23Test weight(gm) (X10) 24.77 18.80 31.45 9.41 9.66 94.90 18.89Biological yield / plant (gm) (X11) 57.53 36.05 79.90 15.68 17.39 81.26 29.12Grain yield /plant (gm) (X12) 25.99 8.40 49.15 27.01 29.29 85.02 51.30Panicle index (X13) 100.70 35.92 235.43 31.70 34.84 82.78 59.41Harvest index (X14) 45.90 16.18 90.06 29.75 30.00 98.36 60.79
Table 2. Phenotypic correlation between yield and its attributes in recombinant inbred lines of rice
X1 X2 X3 X4 X5 X6 X7 X8 X9 X10 X11 X12 X13 X14
X1 1.0000 -0.2961** 0.0138 -0.2783** -0.3709** 0.3992** 0.4134** 0.4692** 0.3963** -0.0084 0.0005 -0.3389** -0.1446* 0.1163**
X2 1.0000 0.114* 0.975** 0.0808 0.118* -0.2116** -0.0214 0.0256 0.0673 0.0600 0.158* 0.194** 0.1980**
X3 1.0000 0.3293** -0.0220 0.1450* -0.0209 0.0880 0.0219 0.1593* -0.0933 0.0660 0.1323* 0.1057*
X4 1.0000 0.0719 0.1448* -0.2058** -0.0009 0.0292 0.0991 0.0364 0.1648** 0.2134** 0.2115**
X5 1.0000 -0.5914** -0.5105** -0.6582** -0.2134** -0.0989 0.1038* 0.3484** 0.1651* 0.2538**
X6 1.0000 0.4315** 0.8802** 0.5379** 0.1380* 0.0060 -0.3269** -0.0115 0.0068
X7 1.0000 0.7992** 0.4978** 0.0195 0.0747 -0.3555** -0.1974** -0.1058*
X8 1.0000 0.6146** 0.0968 0.0404 -0.4046** -0.1093* -0.0535
X9 1.0000 0.0324 0.0784 -0.4443** 0.0693 0.1566*
X10 1.0000 0.0439 0.0920 0.0899 0.1503**
X11 1.0000 0.1851** -0.3520** 0.2985**
X12 1.0000 0.6262** 0.7764**
X13 1.0000 0.7296**
X14 1.0000
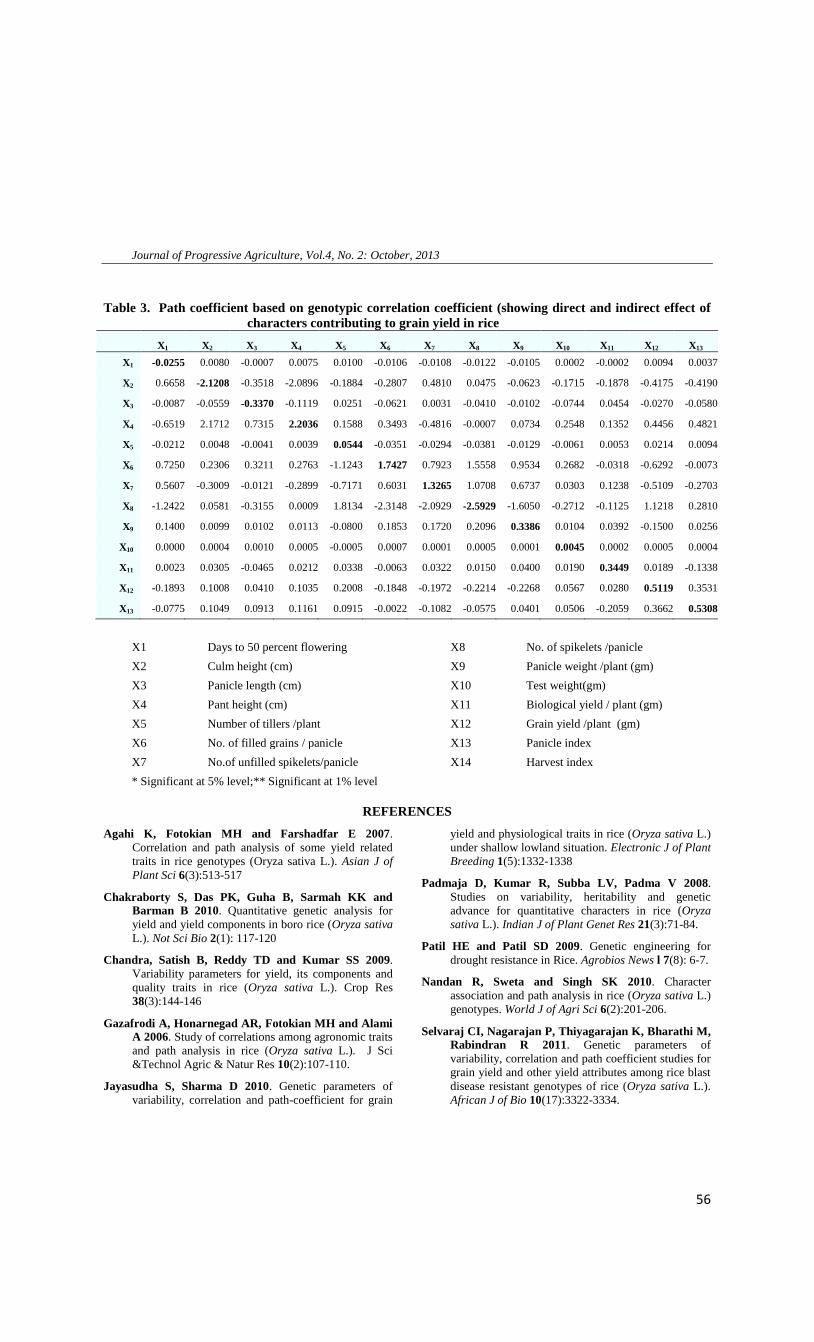
Journal of Progressive Agriculture, Vol.4, No. 2: October, 2013
56
Table 3. Path coefficient based on genotypic correlation coefficient (showing direct and indirect effect ofcharacters contributing to grain yield in rice
X1 X2 X3 X4 X5 X6 X7 X8 X9 X10 X11 X12 X13
X1 -0.0255 0.0080 -0.0007 0.0075 0.0100 -0.0106 -0.0108 -0.0122 -0.0105 0.0002 -0.0002 0.0094 0.0037
X2 0.6658 -2.1208 -0.3518 -2.0896 -0.1884 -0.2807 0.4810 0.0475 -0.0623 -0.1715 -0.1878 -0.4175 -0.4190
X3 -0.0087 -0.0559 -0.3370 -0.1119 0.0251 -0.0621 0.0031 -0.0410 -0.0102 -0.0744 0.0454 -0.0270 -0.0580
X4 -0.6519 2.1712 0.7315 2.2036 0.1588 0.3493 -0.4816 -0.0007 0.0734 0.2548 0.1352 0.4456 0.4821
X5 -0.0212 0.0048 -0.0041 0.0039 0.0544 -0.0351 -0.0294 -0.0381 -0.0129 -0.0061 0.0053 0.0214 0.0094
X6 0.7250 0.2306 0.3211 0.2763 -1.1243 1.7427 0.7923 1.5558 0.9534 0.2682 -0.0318 -0.6292 -0.0073
X7 0.5607 -0.3009 -0.0121 -0.2899 -0.7171 0.6031 1.3265 1.0708 0.6737 0.0303 0.1238 -0.5109 -0.2703
X8 -1.2422 0.0581 -0.3155 0.0009 1.8134 -2.3148 -2.0929 -2.5929 -1.6050 -0.2712 -0.1125 1.1218 0.2810
X9 0.1400 0.0099 0.0102 0.0113 -0.0800 0.1853 0.1720 0.2096 0.3386 0.0104 0.0392 -0.1500 0.0256
X10 0.0000 0.0004 0.0010 0.0005 -0.0005 0.0007 0.0001 0.0005 0.0001 0.0045 0.0002 0.0005 0.0004
X11 0.0023 0.0305 -0.0465 0.0212 0.0338 -0.0063 0.0322 0.0150 0.0400 0.0190 0.3449 0.0189 -0.1338
X12 -0.1893 0.1008 0.0410 0.1035 0.2008 -0.1848 -0.1972 -0.2214 -0.2268 0.0567 0.0280 0.5119 0.3531
X13 -0.0775 0.1049 0.0913 0.1161 0.0915 -0.0022 -0.1082 -0.0575 0.0401 0.0506 -0.2059 0.3662 0.5308
X1 Days to 50 percent flowering X8 No. of spikelets /panicle
X2 Culm height (cm) X9 Panicle weight /plant (gm)
X3 Panicle length (cm) X10 Test weight(gm)
X4 Pant height (cm) X11 Biological yield / plant (gm)
X5 Number of tillers /plant X12 Grain yield /plant (gm)
X6 No. of filled grains / panicle X13 Panicle index
X7 No.of unfilled spikelets/panicle X14 Harvest index
* Significant at 5% level;** Significant at 1% level
REFERENCES
Agahi K, Fotokian MH and Farshadfar E 2007.Correlation and path analysis of some yield relatedtraits in rice genotypes (Oryza sativa L.). Asian J ofPlant Sci 6(3):513-517
Chakraborty S, Das PK, Guha B, Sarmah KK andBarman B 2010. Quantitative genetic analysis foryield and yield components in boro rice (Oryza sativaL.). Not Sci Bio 2(1): 117-120
Chandra, Satish B, Reddy TD and Kumar SS 2009.Variability parameters for yield, its components andquality traits in rice (Oryza sativa L.). Crop Res38(3):144-146
Gazafrodi A, Honarnegad AR, Fotokian MH and AlamiA 2006. Study of correlations among agronomic traitsand path analysis in rice (Oryza sativa L.). J Sci&Technol Agric & Natur Res 10(2):107-110.
Jayasudha S, Sharma D 2010. Genetic parameters ofvariability, correlation and path-coefficient for grain
yield and physiological traits in rice (Oryza sativa L.)under shallow lowland situation. Electronic J of PlantBreeding 1(5):1332-1338
Padmaja D, Kumar R, Subba LV, Padma V 2008.Studies on variability, heritability and geneticadvance for quantitative characters in rice (Oryzasativa L.). Indian J of Plant Genet Res 21(3):71-84.
Patil HE and Patil SD 2009. Genetic engineering fordrought resistance in Rice. Agrobios News l 7(8): 6-7.
Nandan R, Sweta and Singh SK 2010. Characterassociation and path analysis in rice (Oryza sativa L.)genotypes. World J of Agri Sci 6(2):201-206.
Selvaraj CI, Nagarajan P, Thiyagarajan K, Bharathi M,Rabindran R 2011. Genetic parameters ofvariability, correlation and path coefficient studies forgrain yield and other yield attributes among rice blastdisease resistant genotypes of rice (Oryza sativa L.).African J of Bio 10(17):3322-3334.
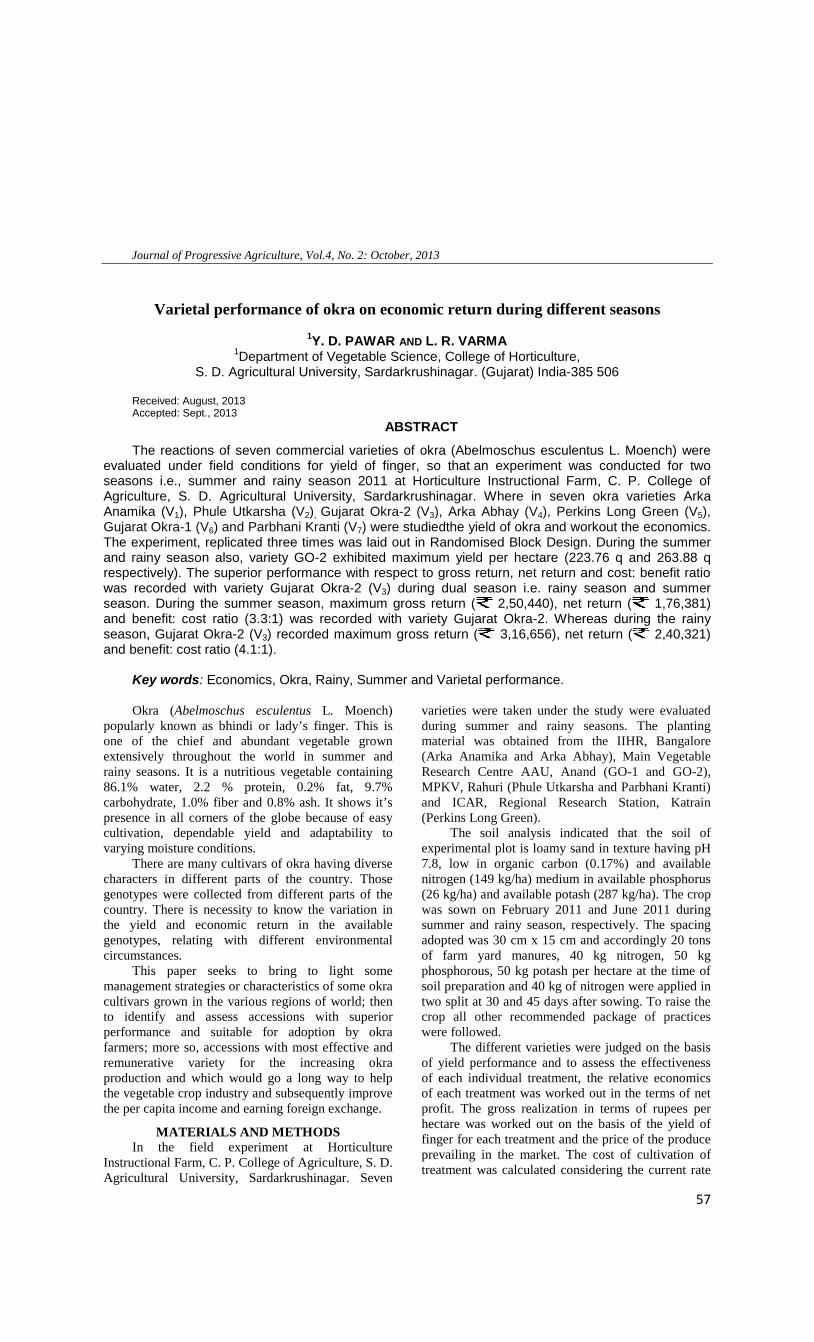
Journal of Progressive Agriculture, Vol.4, No. 2: October, 2013
57
Varietal performance of okra on economic return during different seasons
1Y. D. PAWAR AND L. R. VARMA1Department of Vegetable Science, College of Horticulture,
S. D. Agricultural University, Sardarkrushinagar. (Gujarat) India-385 506
Received: August, 2013Accepted: Sept., 2013
ABSTRACT
The reactions of seven commercial varieties of okra (Abelmoschus esculentus L. Moench) wereevaluated under field conditions for yield of finger, so that an experiment was conducted for twoseasons i.e., summer and rainy season 2011 at Horticulture Instructional Farm, C. P. College ofAgriculture, S. D. Agricultural University, Sardarkrushinagar. Where in seven okra varieties ArkaAnamika (V1), Phule Utkarsha (V2), Gujarat Okra-2 (V3), Arka Abhay (V4), Perkins Long Green (V5),Gujarat Okra-1 (V6) and Parbhani Kranti (V7) were studiedthe yield of okra and workout the economics.The experiment, replicated three times was laid out in Randomised Block Design. During the summerand rainy season also, variety GO-2 exhibited maximum yield per hectare (223.76 q and 263.88 qrespectively). The superior performance with respect to gross return, net return and cost: benefit ratiowas recorded with variety Gujarat Okra-2 (V3) during dual season i.e. rainy season and summerseason. During the summer season, maximum gross return ( 2,50,440), net return ( 1,76,381)and benefit: cost ratio (3.3:1) was recorded with variety Gujarat Okra-2. Whereas during the rainyseason, Gujarat Okra-2 (V3) recorded maximum gross return ( 3,16,656), net return ( 2,40,321)and benefit: cost ratio (4.1:1).
Key words: Economics, Okra, Rainy, Summer and Varietal performance.
Okra (Abelmoschus esculentus L. Moench)popularly known as bhindi or lady’s finger. This isone of the chief and abundant vegetable grownextensively throughout the world in summer andrainy seasons. It is a nutritious vegetable containing86.1% water, 2.2 % protein, 0.2% fat, 9.7%carbohydrate, 1.0% fiber and 0.8% ash. It shows it’spresence in all corners of the globe because of easycultivation, dependable yield and adaptability tovarying moisture conditions.
There are many cultivars of okra having diversecharacters in different parts of the country. Thosegenotypes were collected from different parts of thecountry. There is necessity to know the variation inthe yield and economic return in the availablegenotypes, relating with different environmentalcircumstances.
This paper seeks to bring to light somemanagement strategies or characteristics of some okracultivars grown in the various regions of world; thento identify and assess accessions with superiorperformance and suitable for adoption by okrafarmers; more so, accessions with most effective andremunerative variety for the increasing okraproduction and which would go a long way to helpthe vegetable crop industry and subsequently improvethe per capita income and earning foreign exchange.
MATERIALS AND METHODSIn the field experiment at Horticulture
Instructional Farm, C. P. College of Agriculture, S. D.Agricultural University, Sardarkrushinagar. Seven
varieties were taken under the study were evaluatedduring summer and rainy seasons. The plantingmaterial was obtained from the IIHR, Bangalore(Arka Anamika and Arka Abhay), Main VegetableResearch Centre AAU, Anand (GO-1 and GO-2),MPKV, Rahuri (Phule Utkarsha and Parbhani Kranti)and ICAR, Regional Research Station, Katrain(Perkins Long Green).
The soil analysis indicated that the soil ofexperimental plot is loamy sand in texture having pH7.8, low in organic carbon (0.17%) and availablenitrogen (149 kg/ha) medium in available phosphorus(26 kg/ha) and available potash (287 kg/ha). The cropwas sown on February 2011 and June 2011 duringsummer and rainy season, respectively. The spacingadopted was 30 cm x 15 cm and accordingly 20 tonsof farm yard manures, 40 kg nitrogen, 50 kgphosphorous, 50 kg potash per hectare at the time ofsoil preparation and 40 kg of nitrogen were applied intwo split at 30 and 45 days after sowing. To raise thecrop all other recommended package of practiceswere followed.
The different varieties were judged on the basisof yield performance and to assess the effectivenessof each individual treatment, the relative economicsof each treatment was worked out in the terms of netprofit. The gross realization in terms of rupees perhectare was worked out on the basis of the yield offinger for each treatment and the price of the produceprevailing in the market. The cost of cultivation oftreatment was calculated considering the current rate

Journal of Progressive Agriculture, Vol.4, No. 2: October, 2013
58
of Agricultural operations and market price of inputinvolved. The total cost of cultivation was subtractedfrom the gross realization to obtain benefit: cost ratio(BCR).
Gross realizationBCR = ------------------------
Cost of cultivationThe mean data were subjected to statistical
analysis following analysis of variance technique(Gomez and Gomez, 1984).
RESULTS AND DISCUSSION
Perusal of table 1 suggested that all the varietiesbehaved differently in different seasons with respectto yield of finger. During the summer seasonmaximum yield per hectare (208.70 q) were recordedwith variety Gujarat Okra-2 (V3) and which wasstatistically at par with Gujarat Okra-1 (V6), ArkaAbhay (V4), Arka Anamika (V1) and V5 (PerkinsLong Green), respectively. Whereas, minimum yieldper hectare (134.62 q) was recorded with varietyPhule Utkarsha (V2). During the rainy seasonsignificantly maximum yield per hectare (236.29 q)were recorded with variety Gujarat Okra-2 (V3) andwhich was statistically at par with Arka Abhay (V4),Arka Anamika (V1), V7 (Parbhani Kranti) andGujarat Okra-1 (V6), respectively. Whereas,
minimum yield per hectare (137.46 q) were recordedwith variety Phule Utkarsha (V2). Katung (2007) andAdejoye (2009) also obtained the results in same lineof okra.
As regards economic status the further view oftable 1 reported that during summer season,maximum gross return ( 2,50,440), net return (1,76,381) and benefit: cost ratio (3.3:1) was recordedwith variety Gujarat Okra-2 (V3) and it was followedby variety Gujarat Okra-1 (V6). Whereas during therainy season, Gujarat Okra-2 (V3) recorded maximumgross return ( 3, 16,656), net return ( 2, 40,321)and benefit: cost ratio (4.1:1), it was followed byvariety Arka Abhay (V4). These finding are in closeconformity with the earlier findings of Lawal andRahman (2007) in okra.
Magar et al. (2010) there was less diseaseincidence in summer season that might be due to non-availability of vectors and environmental conditions,prevailed during summer season. Considering theabove fact ultimately the reduction in cost ofcultivation occurred due to minimizing the cost onplant protections.
Considering above parameters this paperconcluded that the variety Gujarat Okra-2 is mostpromising and remunerative variety which providedrevenue gain with affordable input costs.
Table 1: Influence of different okra varieties on economic return during different seasons.
Varieties Yield of finger perhector (q)
Cost of cultivation( /ha)
Gross returns( /ha)
Net returns( /ha)
B: C ratio
Summerseason
(S1)
Rainyseason
(S2)
Summerseason
(S1)
Rainyseason
(S2)
Summerseason
(S1)
Rainyseason
(S2)
Summerseason
(S1)
Rainyseason
(S2)
Summerseason
(S1)
Rainyseason
(S2)V1 (Arka Anamika) 176.88 220.81 73759 76034 2,12,256 2,64,972 1,38,497 1,88,938 2.8:1 3.4.:1V2 (Phule Utkarsha) 134.62 137.46 73759 75734 1,61,544 1,64,952 87,785 89,218 2.1:1 2.1:1V3 (Gujarat Okra-2) 208.70 263.88 74059 76334 2,50,440 3,16,656 1,76,381 2,40,322 3.3:1 4.1:1V4 (Arka Abhay) 179.75 252.53 74059 76034 2,15,700 3,03,036 1,41,641 2,27,002 2.9:1 3.9:1V5 (Perkins LongGreen)
170.49 105.80 73759 75734 2,04,948 1,26,960 1,31,189 51,226 2.7:1 1.6:1
V6 (Gujarat Okra-1) 191.84 201.04 74059 76034 2,30,208 2,41,248 1,56,149 1,65,214 3.1:1 3.1:1V7 (Parbhani Kranti) 153.21 218.14 74059 76334 1,83,852 2,61,768 1,09,793 1,85,434 2.4:1 3.4:1C.D. at 5% 46.55 74.72
The sale price of okra was 12/kg.REFRENCES
Adejoye OD, Awokoya JO and Emmanuel OE 2009.Effect of seasonal changes on growth and yield ofokra (Abelmoschs esculentus L. Moench). Res. J. Agriand Biological Sci. 5(6): 940-943.
Gomez KA and Gomez AA 1984. Statistical proceduresfor agricultural research. 2nd edition. John Wiley andSons, New York 680 p.
Katung MD 2007. Productivity of okra varieties asinfluenced by seasonal changes in Northern Nigeria.Notulae Botanicae, Horti. Agro. botanici, Cluj-Napoca 35 (1): 65-71.
Lawal AB and Rahman SA 2007. Effect of irrigation,fertiliser and manure on yield and economic return ofokra/pepper intercrops. Trop. Sci. 47 (1): 45-48.
Magar RG and Madrap IA 2010. Performance of okra inrelation to yellow vein mosaic virus in differentseasons. Int. Jr. Pl. Sci. 5(1): 33-35.

Journal of Progressive Agriculture, Vol.4, No. 2: October, 2013
59
Evaluation of eco-friendly treatments against bollworms
V.S. ACHARYA, A. P. SINGH AND M. C. BHARGAVACollege of Agriculture, S. K. Rajasthan Agricultural University, Bikaner-334 004
Received: July, 2013Accepted: Sept., 2013
ABSTRACT
An experiment was conducted at Agricultural Research Station, Sriganganagar to study the effectof some eco friendly treatments on bollworms. The pooled data of two years revealed that theminimum boll and locule damage was recorded in the treatment of triazophos followed by thiocloprid(Calypso) and Econeem. The maximum boll damage was recorded in the treatment of water sprayfollowed by fish oil rosin + teepol, castor oil + teepol, and all these treatments were at par with thecontrol. The treatments of Neemgold, nimbicidine, B. bassiana, cotton seed oil + teepol and NSKE 5%existed in middle order of effectiveness against the bollworm. The maximum seed cotton yield wasobtained in the treatment of triazophos while minimum in the treatment of water spray.
Key words: Cotton, Eco-friendly, boll and locule damage, seed cotton yield.
Cotton (Gossypium spp) is the most extensivelycultivated commercial crop of the world. It is alsoknown as white gold and fulfills the cloth needs of thehuman being which is next to the food. In Rajasthan,the crop is also grown on about 0.34 million ha andthe production is around 0.75 million bales. Theaverage productivity of cotton in Rajasthan is 379 kglint per hectare which is very low as compared toother states of India and world average (Anonymous,2003).Many factors are responsible for lowproductivity and production with time but themagnitude of insect pest have been reported todamage the cotton crop from sowing to maturity ismost important. Hitherto, the control insect pest wasmainly achieved through the use of insecticides butexcessive and indiscriminate use of insecticides hascreated may pest problems like development ofresistance to most of the available insecticides(Dhawan et al., 1999), a insecticide inducedresurgence (Butter and Kular, 1999) and disruption ofthe population of predators and parasitoids(Natarajan, 1992). This situation warrants search formore effective alternate strategy to manage this pestand over come the crisis.
The naturally occurring phytochemicals obtainedfrom neem, cotton seed, fishes exert a wide range ofbehavioural and physiological effects on the insectsand therefore, it is difficult for insect to developresistance against pesticides. The number of studiesconducted, so for indicate that neem and other biopesticides are comparatively safe to natural enemiesand higher organisms. A systematic studied on theseaspects are lacking particularly in semi arid region ofRajasthan, Keeping this in view the present study wasundertaken to saw the effect of eco-friendlymanagement of the pest.
MATERIALS AND METHODS
Evaluation of eco-friendly treatmentsThe experiment was conducted in simple
randomized block design. There were 11 treatmentsincluding control and each replicated four times(Table 1). The seeds of cotton variety RST-9 weresown in plots size 6.0 x 4.5 m, keeping row to rowand plant to plant distance of 0.675 m and 0.30m,respectively. The recommended package of practiceswas followed to raise the crop. The spraying wasdone by using pre-calibrated knapsack sprayer. Thefirst spray of all the eco-friendly chemical taken inexperiment was done in 1st September during firstyear and 7th September during second year afterexamining the economic threshold level. The secondand third spray was given just after the when ETLwas observed. The quantity of water at the rate of 500lit. per hectare was used in each spray.
The observations bollworm infestation in all theeco-friendly treatments was recorded in open bolls onboll and locule basis. For this purpose ten plants weretagged at random in each plots and all the open bollswere plucked near harvest and per cent infestationwas worked out by the following formula:
Number of boll infestedBollworm infestation (%) = -------------------------------x 100
(Boll basis) Total no of bolls
Number of loculi infestedBollworm infestation (%) = ---------------------------------x 100
(Locule basis) Total no of loculi

Journal of Progressive Agriculture, Vol.4, No. 2: October, 2013
60
YieldThe seed cotton yield of all the pickings per plot
including the seed cotton yield of samples of 10 plantwere cumulated and converted to hectares basis andthen statistically analysed.
RESULTS AND DISCUSSION
Effect of eco-friendly treatment against bollwormThe pooled data presented in Table–2 indicated
that minimum per cent bollworm damage wasrecorded in the treatment of triazophos followed bythiocloprid (Calypso) (12.36%) and Econeem(14.37%) however all these treatments were at par.The maximum boll damage was observed in waterspray (32.93%) while it was at par with fish oil rosin+teepol, (30.83%) and castor oil + teepol (32.21%).The treatments of Neemgold Nimbicidine, NSKE5%,B. bassiana and cotton seed oil + teepol registeredboll damage ranging form 16.99 to 24.03 per centexisted in middle order of efficacy. However, thetreatments of Neemgold, Nimbicidine and B.bassiana were statistically comparable to each other.The similar trend was observed incase of loculidamage in both the years. These results regarding theefficacy of triazophos against bollworm corroborateswith that of Lohar and Nahyoon (1995) who reportedthat triazophos caused maximum reduction in damagedone by bollworm. However various workers viz.,Dhawan et al. (1992), Butter and Kular (1997) andPatel and Vyas (2000) studied the effect of cottonneem formulation against bollworm of cotton andfound low to high effect support the present findings.Regarding the effect of thiocloprid (Calypso), waterspray, fish oil rosin + teepol, caster oil + teepol,cotton seed oil + teepol no work is available,therefore, the results could not be compared anddiscussed.Effect of eco-friendly treatments on seed cottonyield
All the eco-friendly treatments increased the seedcotton yield over control in both the years. Thepooled data of both the years indicated that the
maximum seed cotton yield was obtained in thetreatment of triazophos (Table-3). The present resultsare in conformity with that of study conducted atSriganganagar where significant increase in seedcotton yield was recorded (Anonymous, 2002). Theseed cotton yield in thiocloprid (Calypso) was foundsecond highest after triazophos, however, the yield ofboth these treatments were comparable to each other.As indicated in efficacy the thiocloprid (Calypso) hasnot been tested against cotton pest and no work onseed cotton yield of this insecticide is available,therefore the results could not be compared anddiscussed. After triazophos and thiocloprid (Calypso),the seed cotton yield of 15.75 q/ha was recorded fromthe plots treated with Econeem 10000 ppm. Thepresent results are in agreement with Mann et al.(2001) who reported significantly higher yield in theplots treated with Neemazal (1.0%). The seed cottonyield in the plots treated with Econeem recordedsignificantly higher in study conducted atSriganganagar, support the present findings(Anonymous, 2002).
The minimum seed cotton yield (9.10 q/ha) wasrecorded in the treatment of water spray followed byfish oil rosin + teepol (10.20 q/ha), castor oil + teepol(10.70 q/ha), cotton seed oil + teepol (12.14 q/ha).The present investigations are in agreement with thatof study conducted at Sirsa in which seed cotton yieldin the treatment of water spray and cotton seed oil +teepol were found at par with control (Anonymous,2001). The work on the effect of fish oil rosin +teepol and castor oil + teepol treatment are notavailable, therefore, the results of these treatmentscould not be compared and discussed. The treatmentof Neemgold, nimbicidine, NSKE 5% and B.bassiana existed in middle order and results in theyield ranging from 13.22 to 14.70 q/ha. The presentresults are in conformity with that a study conductedat Sriganganagar in which seed cotton yield in thetreatments of nimbicidine and B. bassiana recordedsignificantly higher than control (Anonymous, 2001).
Table: 1. Effect of eco-friendly treatments on seed cotton yield.Treatments Dose/ lit. of waterNSKE 50 gmNimbicidine 300 ppm 5 mlNeemgold 3,000 ppm 5 mlEconeem 10,000 ppm 2 mlBeuveria bassiana 2.5 mlCottonseed oil + teepol 5 mlThiocloprid 1.5 mlFish oil rosin + teepol 5 mlCastor oil + teepol 5 mlTriazophos 40 EC 3 mlWater spray -Control -

Journal of Progressive Agriculture, Vol.4, No. 2: October, 2013
61
Table. 2. Effect of eco-friendly treatments against bollworms.
Treatments Dose/lit ofwater
% Boll damage % Locule damageI Year II Year Pooled I Year II Year Pooled
NSKE 50 gm 21.83(27.83)
26.24(30.79)
24.03(29.34)
10.57(19.00)
13.92(21.89)
12.24(20.44)
Nimbicidine 300 ppm 5 ml 18.51(25.47)
22.13(28.04)
20.32(26.78)
9.40(17.85)
13.20(21.30)
11.30(19.64)
Neemgold 3,000 ppm 5 ml 15.33(23.03)
18.66(25.55)
16.99(24.35)
8.35(16.85)
9.25(17.66)
8.80(17.26)
Econeem 10,000 ppm 2 ml 12.63(20.79)
16.11(23.66)
14.37(22.30)
5.31(13.31)
8.28(16.74)
6.79(15.12)
Beuveria bassiana 2.5 ml 18.32(25.33)
21.69(27.76)
20.00(26.57)
9.11(17.57)
10.00(18.44)
9.55(17.95)
Cottonseed oil + teepol 5 ml 20.77(27.06)
25.17(30.13)
22.97(28.66)
8.31(16.74)
13.85(21.89)
11.08(19.46)
Thiocloprid 1.5 ml 10.73(19.09)
14.00(21.97)
12.36(20.62)
4.67(12.52)
7.25(15.56)
5.96(14.06)
Fish oil rosin + teepol 5 ml 29.44(32.83)
32.23(34.57)
30.83(33.77)
15.75(23.34)
16.12(23.66)
15.93(23.50)
Castor oil + teepol 5 ml 26.95(31.24)
29.78(33.09)
28.36(32.21)
14.72(22.54)
15.10(22.87)
14.91(22.71)
Triazophos 40 EC 3 ml 9.89(18.34)
13.17(21.30)
11.53(19.80)
4.31(11.97)
6.95(15.23)
5.63(13.69)
Water spray - 30.93(33.77)
34.94(36.27)
32.93(35.00)
15.80(23.42)
17.33(24.55)
16.56(24.04)
Control - 32.46(34.76)
36.11(36.93)
34.28(35.85)
16.96(24.35)
18.19(22.25)
17.57(24.80)
SEm+ 0.87 0.85 0.98 0.63 0.73 0.80CD 2.51 2.93 2.81 1.80 2.11 2.33
Figure in parenthesis are angular transformed values
Table: 3. Effect of eco-friendly treatments on seed cotton yield.
Treatments Dose/ lit. ofwater
Seed yield (q/ha)I Year II Year Pooled
NSKE 50 gm 13.4 11.80 12.60Nimbicidine 300 ppm 5 ml 14.10 12.50 13.30Neemgold 3,000 ppm 5 ml 15.80 13.60 14.70Econeem 10,000 ppm 2 ml 16.80 14.70 15.75Beuveria bassiana 2.5 ml 14.32 12.32 13.32Cottonseed oil + teepol 5 ml 13.0 11.28 12.14Thiocloprid 1.5 ml 19.2 17.40 18.30Fish oil rosin + teepol 5 ml 10.6 9.80 10.20Castor oil + teepol 5 ml 11.0 10.40 10.70Triazophos 40 EC 3 ml 19.8 17.60 18.70Water spray - 69.4 8.81 9.10Control - 8.2 8.48 8.34SEm+ 1.75 2.04 1.71CD at 5% 5.36 6.25 5.22
REFERENCES
Anonymous, 2001. Project report entitled “Control of leafcurl virus disease in cotton and development ofprotocols for man multiplication of predators, parasitesand insect pathogen (PSR-26)” National AgriculturalTechnology Project. Central Institute for cottonResearch, Nagpur.
Anonymous, 2002. Annual progress report : All IndiaCoordinated Cotton Improvement Project. Pub byAgricultural Research Station (Raj. Agri. Uni.)Sriganganagar.
Anonymous, 2003. Annual progress report: All Indiacoordinated cotton improvement project pp –2-3.Central Institute for cotton Research Region station,Coimbatore.

Journal of Progressive Agriculture, Vol.4, No. 2: October, 2013
62
Butter, N.S. and Kular, J.S. 1997. Efficacy of GodrajAchook containing Azadirachtin against cottonbollworms. J. Insect Sci. 10: 2, 198-199.
Butter, N.S. and Kular, J.S. 1999. Resurgence of whiteflyin cotton and its management. Indian J. Ent. 61: 85-90.
Dhawan, A.K. and Simwat, G.S. 1992. Field evaluation ofneemrich 20 EC for management of insect pest ofcotton during reproductive phase. In Tauro P andNarwal S.S. (ed) 1st Nat Symp on Allelopathy inAgroecosystem Agric. And Forestry. pp. 127-135.(Indian Society of Allelopathy, Hisar, India.
Dhawan, A.K.; Simwat, G.S. and Prakash, R. 1999.Evaluation of decidan for the control of bollwormcomplex on upland cotton. Pestology 23(4): 55-62.
Jeewaram, Bhati D.S., Sidhu B.S. and Singh Vichitter,2011. Survey and surveelance of partheniumhysterophorus major alternate host of cotton mealy bugin Rajasthan. Journal of Progressive Agriculture 2(2)April: 35-38.
Lohar, M.K. and Nahyoon, Y.N.1995. Comparativeefficacy of Hostathion, Sumicidin and Sevin XLRagainst cotton bollworms under field condition. SorhadJ. agric. 11: 363-368.
Mann, G.S., Dhaliwal, G.S. and Dhawan, A.K. 2001.Field efficacy of neem based insecticides againstwhitefly and their impact on insect pest complex ofcotton. Pest Res. J. 13 (1): 79-85.
Natarajan, P. 1992. Pyrethroids in management of insectpests of cotton and strategies to sustain their efficacyagainst pests of cotton. In : All India CoordinatedCotton Improvement Project (Silver Jubilee Souvenir).pp. 17-18. Central Institute for Cotton Research,Nagpur.
Patel, M.C. and Vyas, R.N. 2000. Field bio efficacy ofBacillus thuringiensis var kurstaki and neem basedformulations against cotton bollworms. Indian J. Pl.Prot. 28(1): 78-83.

Journal of Progressive Agriculture, Vol.4, No. 2: October, 2013
63
Constraints analysis of dairy farm women in animal husbandry
1SANGEETA UPADHYAY, 2MANMEET KAUR AND 3C.P. DESAI1Research Scholar, Anand Agricultural University, Anand-388110, Gujarat
2 Assistant Professor, College of Agriculture, SK RAU, Bikaner, 334 0063Extension Educationist, Anand Agricultural University, Anand-388110, Gujarat
Received: August, 2013Accepted: Sept., 2013
ABSTRACT
In India, women’s involvement in livestock management is a long standing tradition and livestockrearing has been as integral part of homestead farming system. Animal husbandry occupation is animportant source of income among rural households. Most of the important tasks in animal husbandryactivities are performed by dairy farm women besides fulfilling their responsibilities as home makers.This study was an attempt to analyze the constraints faced by dairy farm women in animal husbandryand seek the suggestions offered by them to overcome these constraints. The study was conducted inAnand district of Gujarat state. Data were collected with the help of pre-tested semi-structuredinterview schedule on 120 farm women. The constraints were studied under five categories viz.,economical, technological, input-supply, marketing and administrative. The results of the study showedthat the major constraints faced by farm women were; high cost of concentrate feed, lack ofknowledge about recommended practices of animal husbandry, non-availability of roughages, lack ofproper training on animal husbandry, and non-availability of remunerative prices of milk and milkproducts.
Key words: Animal Husbandry, Constraints, Dairy farm women and Livestock.
Livestock sector assumes an important role inIndian economy and is an important sub-sector ofIndian agriculture. India ranks first in buffalopopulation and second in cattle population(Anonymous, 2008) and has vast resources oflivestock, which play a vital role in providingnutritive food, rich in animal protein to the generalpublic and in supplementing family income, andgenerating gainful employment through production ofmilk, meat, wool and eggs in rural sector particularlyamong the landless, small land marginal farmhouseholds. This proves efficiency of animalhusbandry sector for doorstep availability of domesticemployment and thereby employment of women(Anonymous, 2009). Women provide much of theunpaid family labour to agriculture including animalhusbandry occupation, but they are virtually notrecognized as producer within their own.
A farm woman does more than sixty per cent ofanimal husbandry operations like feeding, milking,sale of milk etc and about seventy five per cent ofrural women are engaged in animal husbandryoccupation.
Caring of animals is considered as an extensionof domestic activities in Indian social system andmost of the animal husbandry activities like bringingfodder from field, chaffing the fodder, preparing feedfor animals, offering water to animals, protection ofanimals from ticks and lice, cleaning of animals andsheds, preparation of dung cakes, milking, ghee-
making, and marketing of produce are performed by alarge majority (77.50 %) of dairy farm women. Thissituation underlines the economic importance of thefunctions carried out by the farm women in the ruraleconomy and in livestock farming. Thus, involvementof farm women in farming activities is a commonfeature in Indian rural setting. Women perform avariety of roles, of which many are of greatereconomic significance (Bhople and Palki, 1998).
The participation of dairy farm women arecontinued to be given lesser importance whileformulating livestock/ rural developmentprogrammes. Though the contribution of dairy farmwomen in terms of time and effort is not low or lessthan man, they remain as most of vulnerable and leastdeveloped even today. Development of dairy farmwomen requires women empowerment and their full,equal and beneficial involvement in decision-makingprocess and requires their full participation asplanners, managers, scientists and technical advisorsin all aspects of animal husbandry occupation,because most of the work related to animal husbandryare looked after by rural women but their knowledgeabout the technology related to various aspects oflivestock farming is very low. They are the silentworkers, labouring hard from dawn to dusk in theinterest of their farms and homes.
Keeping in view the above problems, the presentstudy was undertaken with the following specificobjectives:

Journal of Progressive Agriculture, Vol.4, No. 2: October, 2013
64
To study the socio-personal profile of dairy farmwomen.
To identify the perceived constraints of dairyfarm women in animal husbandry management.
To seek suggestions from dairy farm women toovercome the perceived constraints.
MATERIALS AND METHODS
The present study was conducted in Ananddistrict of Gujarat state. The district comprises ofeight blocks. Out of eight blocks, one block waspurposively selected for the present study. A list ofvillages was obtained from the Amul Dairy, Anand.Out of them ten villages viz. Sarsa, Napad, Bedwa,Chikhodra, Vadod, Samarkha, Kasor, Adas, VehraKheri, Gamdi were selected where large number offarm women were engaged in animal husbandry sincelast five years. One hundred twenty farm women wereselected by the proportionate sampling method. Thedata of the study were collected by semi-structuredinterview schedule which were then classified,tabulated and analyzed in order to draw meaningfulfindings. The interview schedule was preparedkeeping in view the objectives of the study. Before,its actual use, it was pre-tested and translated intoGujarati. The statistical procedures such asfrequency, percentage, mean score, mean weightedscore and rank were used to analyze the data.
RESULTS AND DISCUSSION
Socio-economic profile of farm womenThe socio-economic profile of dairy farm
women is presented in Table 1. From the table, itcould be revealed that more than 60.83 per cent of thedairy farm women belonged to middle age groupcategory and were having secondary to highersecondary level of education. A large majority (80.83%) of the dairy farm women had medium to highlevel of experience in animal husbandry occupation.A majority (60.83 %) of the dairy farm women werehaving membership in one or more than one ruralsocial organizations. Exactly half (50.00 %) of therespondents were found to possess marginal to smallsize of land holding. Nearly 71.00 per cent of thefarm women spent on an average more than fourhours per day for performing the task related tolivestock keeping. A large majority (85.83 %) of thedairy farm women had medium herd size and hadmedium level of expenditure (ranging from Rs.1,501/- to Rs. 3,000/-) on dairy animals. More than75.00 per cent of the respondents were havingfarming+ animal husbandry + business as their mainoccupation and majority of the respondents (78.34 %)reported that they had low to medium level of annualincome (upto Rs. One lakh). More than eighty percent women were found to have medium to high levelof mass media exposure and extension agencycontact. A vast majority (61.67 % and 55.00 %) of thedairy farm women had expressed that they hadmedium level of scientific orientation and riskorientation.
Table 1. Socio-economic profile of farm women involved in animal husbandryN=120
Particulars Category Frequency Per centAge Young age (up to 35 years) 20 16.67
Middle age (36 to 50 years) 73 60.83Old age (above 50 years) 27 22.50
Education Illiterate 06 05.00Primary education (up to 7th std.) 14 11.67Secondary education (8th to 10th std.) 52 43.33Higher secondary education (11th & 12th std.) 29 24.17College education (above 12th std.) 19 15.83
Experience inanimal husbandry
Low (up to 10 years) 23 19.17
Medium (11 to 20 years) 82 68.33High (above 20 years) 15 12.50
Social participation No membership 35 29.17Membership in one organization 48 40.00Membership in more than one organizations 25 20.83Holding position in an organization 12 10.00
Size of land holding Marginal (up to 1.00 ha) 26 21.66Small (1.01 to 2.00 ha) 34 28.34Medium (2.01 to 4.00 ha) 36 30.00Large (above 4.00 ha) 24 20.00
Time spent in animalhusbandry activities
3 to 4 hrs/day 35 29.17
4.01 to 5 hrs/day 59 49.17More than 5 hrs/day 26 21.66
Herd size Small herd size (up to 2 milch animals) 17 14.17

Journal of Progressive Agriculture, Vol.4, No. 2: October, 2013
65
Particulars Category Frequency Per centMedium herd size (3- 4 milch animals) 83 69.17Large herd size (more than 4 milch animals) 20 16.66
Expenditure on animalhusbandry
Low (up to Rs. 1,500/-) 26 21.66
Medium (Rs. 1,501/- to Rs. 3,000/-) 55 45.83High (above Rs. 3,000/-) 39 31.51
Occupation Farming + Animal husbandry 51 42.50Farming + Animal husbandry + Business 41 34.17Farming + Animal husbandry + Business + Service 16 13.33Farming + Animal husbandry + Business + Service+ Labour work
12 10.00
Annual income Low (up to Rs. 50,000/-) 55 45.83Medium (Rs. 50,001 to Rs.1,00,000/-) 39 32.51High (above Rs. 1,00,000/-) 26 21.66
Mass media exposure Low (below 12.37 score) 21 17.50Medium (12.38 to 17.53 score) 72 60.00High (above 17.53 score) 27 22.50
Scientific orientation Low scientific orientation (below 18.70 score) 12 10.00Medium scientific orientation (18.70 to 23.80score)
74 61.67
High scientific orientation (above 23.80 score) 34 28.33Risk orientation Low risk orientation ( below 12.69 score) 23 19.17
Medium risk orientation (12.69 to 20.97 score) 66 55.00High risk orientation ( above 20.97 score) 31 25.83
Perceived Constraints encountered by dairy farmwomen
In the present investigations constraints wereoperationalzed as problems or barriers faced by farmwomen while performing their roles. The respondentsexpressed many constraints which were grouped into
five categories viz., (i) economical, (ii) technological,(iii) input-supply, (iv) marketing and (v)administrative. The constraints were ranked on thebasis of mean weighted scores. The responses of therespondents with regard to the constraints arepresented in Table 2.
Table 2. Distribution of dairy farm women according to perceived constraints in animal husbandryoccupation N =120
Constraints Meanweighted
Score*
Rank order
Economical ConstraintsHigh cost of milch animals 2.10 IIIHigh rates of interest on loans 2.33 IIHigh cost of construction of cattle shed 1.93 IVLack of loan facilities 1.75 VHigh cost of concentrate feed 2.50 ITechnological ConstraintsLack of knowledge about recommended practices of animal husbandry 2.15 ILack of technical know-how about feed, fodder and health management aspects 1.95 IILack of knowledge about latest technology related to milk and milk processing 1.64 IVInadequate knowledge of vaccination schedule 1.58 IIIInput-Supply ConstraintsLack of supply of crossbred cows 1.87 IINon-availability of roughages 2.45 I
Non-availability of medical aids for animal treatments 1.46 III
Marketing ConstraintsNon-availability of remunerative prices of milk and milk products 2.32 IIrregular collection of milk 1.45 IIIHigh cost of preparation of milk products 2.05 IIAdminstrative ConstraintsLack of veterinary services in time 1.36 IIILack of proper training on animal husbandry 2.40 ILack of artificial insemination facility in villages 1.65 II
*Weighed mean score range 1-3

Journal of Progressive Agriculture, Vol.4, No. 2: October, 2013
66
The data regarding economical constraints showedthat respondents had assigned first rank to high costof concentrate feed, followed by high rates of intereston loans (Rank II), high cost of milch animals, (RankIII), high cost of construction of cattle shed (Rank IV)and lack of loan facilities (Rank V). The findings arein line with the findings of Devaki and Senthilkumar(2011) and Patil (2012) who reported that thefinancial constraints experienced by the dairy farmerswere; delay in milk payments from dairy co-operativesocieties, followed by inadequate money and lack ofloan facility and high cost of feeds and high yieldingbreeds of animals. Under technological constraintscategory, lack of knowledge about recommendedpractices of animal husbandry (Rank I), lack oftechnical know-how about feed, fodder and healthmanagement aspects (Rank II), inadequate knowledgeof vaccination schedule (Rank III) and lack ofknowledge about latest technology related to milk andmilk processing (Rank IV) were the most importantconstraints mentioned by dairy farm women. Thefindings get the support of the findings of Kumar etal. (2009) who found that majority of the farmershave inadequate knowledge about proper feeding ofmilch animal or under feeding due to limited financialresources and finally poor balance ratio retards thehealth growth and reproduction of animal and poorquality of produced milk. Among input-supplyconstraints, the dairy farm women endorsed majorconstraints such as non-availability of roughages(Rank I), lack of supply of crossbred cows (Rank II)and non-availability of medical aids for animaltreatments (Rank III), respectively. The probable
cause of Shrinking and degrading pastures is coupledwith limitations of fodder due to urbanization of land,deforestation of land as compare to earlier years in thestudy area. The findings are in line with the findingsof Patil et al. (2009) who reported that constraint asshortage of green fodder particularly during summermonths or even if available, it costs more. In case ofmarketing constraints, non-availability ofremunerative prices of milk and milk products wasmajor constraint (Rank I) followed by high cost ofpreparation of milk products (Rank II) and irregularcollection of milk (Rank III) respectively. This is inaccordance with the findings of Jayalakshmi et al.(1997) who observed that the constraints faced bylack of artificial insemination facility in villages(Rank II) and lack of veterinary services in time(Rank III), respectively. These findings were similarto the observation of Singh et al. (2008) and Rathoreet al. (2009) who opined that the dairy farmers hadexpressed infrastructural constraints as the mostsevere impediments, whereas technical constraintswere hampering the dairying to the least extent.
Suggestions offered by dairy farm women toovercome the perceived constraints
An attempt was made to ascertain suggestionsfrom dairy farm women to overcome variousconstraints faced by them in animal husbandryoccupation. The suggestions offered by the dairy farmwomen to overcome the perceived constraints arepresented in Table 3.
Table. 3. Suggestions offered by dairy farm women to overcome the perceived constraints.N=120
Suggestions Frequency Per cent RankSupply of good quality of crossbred cows should be regular 88 73.34 IIITechnical guidance regarding latest technology related to milk and milk
processing should be provided.68 56.67 VII
Supply of roughages and concentrate feed should be made available atcheaper rates.
100 83.34 I
Provisions should be made for regular training to dairy farm women 82 68.33 IVLoan/subsidy facilities should be made available for construction of cattleshed and purchase of dairy animals
93 77.50 II
At least five members of dairy co-operative society should be trained tosolve the problems in animal husbandry
73 60.83 VI
Veterinary health care and cattle camp should be organized time to time. 80 66.67 V
The data given in Table 3 revealed that themajor suggestions offered by dairy farm women insequential order were supply of roughages andconcentrate feed should be made available at cheaperrates (Rank I) followed by loan/subsidy facilitiesshould be made available for construction of cattleshed and purchase of dairy animals (Rank II), supplyof good quality of crossbred cows should be regular(Rank III), provisions should be made for regular
training to dairy farm women (Rank IV), veterinaryhealth care and cattle camp should be organized timeto time (Rank V), five members of dairy co-operativesociety should be trained to solve the problems inanimal husbandry (Rank VI) and technical guidanceregarding latest technology related to milk and milkprocessing technology should be provided to dairyfarm women (Rank VII), respectively. These findingare in line with the

Journal of Progressive Agriculture, Vol.4, No. 2: October, 2013
67
findings of Bhatt (2006), Khokhar (2007) andRani (2009) who found that rural youth for dairybusiness encouraged by easy availability of loans withreasonable interest or providing subsidies to dairyfarmers by dairy development department forpromoting dairy business. Similarly, Rathod et al.(2011) revealed that the women felt that preparationof milk products added to their existing labour. Theyalso perceived that women required more time forprocessing of milk and hence, only few women tookup processing on only small scale. They producedmilk products like ghee, butter and khoa only for theirhousehold consumption.
CONCLUSIONThe present study has highlighted that farm
women handle wide range of work related to animalhusbandry management. Inspite of involvement ofhuge number of human resources the expected levelof efficiency has not been achieved for obtainingefficient animal production. The results of presentinvestigation revealed numerous constraints asperceived by dairy farm women. The majorconstraints were high cost of concentrate feed, milchanimal and high rates of interest on loans, lack oftechnical knowledge about recommended practices of
animal husbandry and feed fodder and healthmanagement of animals, non-availability ofroughages of crossbred cows, non-remunerative priceof milk and milk products and high cost ofpreparation of milk products, lack of proper trainingon animal husbandry and lack of artificialinsemination facility in the villages. Since, dairying isa household enterprise in India. It is usuallyconsidered to a great extent as a responsibility ofmainly women of the farm house. As they havesignificant involvement in animal husbandryactivities, there is need to organized training focusedon dairy farm women regarding scientificrecommendations of nutrition, hygiene ration, healthcare, vaccination schedule, etc. Efforts should befocus to develop entrepreneurial activities viz.processing of milk based products, and educate themabout the new technologies like milk productiontechniques, record keeping practices, artificialinsemination practices and section of good quality ofbreeds. They should be access to involve theirparticipation and knowledge by extension agencieslike loan/ credit facility procedure from banks,insurance policy, market facilities and cooperativesociety, as to develop their decision-making skill.
REFERENCES
Anonymous. 2008. Annual report, National Bank forAgriculture and Rural Development, Mumbai, pp: 28-29.
Anonymous. 2009. A paper presented in seminar on“contribution of livestock sector in rural prosperityof Gujarat state” held at college of Veterinary Scienceand Animal Husbandry, AAU, Anand on 20th
December, 2009, pp: 5-6.
Bhatt, P.M. 2006. A study on effect of mass mediaexposure on dairy farmers regarding animalhusbandry practices, Ph.D. thesis (unpublished),AAU, Anand.
Bhople, R.R. and Palki, A. 1998. Socio-economicdimensions of farm women labour, Rural India,September- October, pp: 192-196.
Dabas, Y.P.S., Bardhan, D. and Shabeena, M. 2004.Constraints in adoption of dairy technology by ruralwoman in Tarai area of Uttranchal. Indian Dairyman.56(5): 25-28.
Devaki, K and Senthilkumar, K. 2011. Farm WomenAdoption Constraints In Livestock Farming. Indian J.of Fundamental and Applied Life Sciences, 1(4): 361-363.
Jayalakshmi, G., Shilaja, S. and Sobhana, G. 1997.Constraints experienced by women entrepreneurs. J.of Ext. Edu. 8(3) 1752-1754.
Khokhar, S R. 2007. A study on adoption of dairyinnovations by dairy farm women in Anand district,M.Sc. (Agri.) thesis (unpublished), AAU, Anand.
Kumar, S., Hindustani, S., Kateryar, K.M. andSankhala, S. 2009. Constraints perceived by farmersin adopting scientific dairy farming practices inBanka district of Bihar. Indian J. Dairy Sci. 62: 131-134.
Patil, A.P., Gawande, S.H., Nande, M.P. and Gobade,M.R. 2009. Constraints faced by the dairy farmers inNagpur district while adopting animal Managementpractices. Veterinary World. 2(3):111-112
Rani, D.V. 2009. Crisis management practices adopted inDairy Farming by the farmers of Anand district ofGujarat state, Ph. D. thesis (unpublished), AAU,Anand.
Rani, D.V. and Subhadra, M.R. 2009. Problems Relatedto Farm Operations as Perceived by the Farm Womenin Dairy Farming, Seminar on “ParticipatoryApproach and Recent Trends in Rural Development,JAU, Junagarh, Published on 31st August, 2009, pp:89.
Singh, M.J. and Sharma, V.P. 2008. Constraints in dairyfarming in Jammu district and Kashmir. IndianJournal of Animal Research 42(1):19-27.

Journal of Progressive Agriculture, Vol.4, No. 2: October, 2013
68
Genetic diversity within a range of varieties elite lines and land races of linseed
M.P. CHAUHAN, 1A.K. SINGH AND VINOD SINGHDepptt. of Genetics and Plant Breeding, NDUA&T, Kumarganj, Faizabad-224229
1ICAR, Research Complex for Eastern Region, Sabjpura, Patna – 801105
Received: July, 2013Accepted: Sept., 2013
ABSTRACT
Genetic diversity was assessed in a collection of 203 genotypes of linseed in respect of yield andrelated traits. The genotypes fell into 15 clusters. The cluster VII and X had highest number ofgenotypes. The inter cluster distance ranged from 57.87 between cluster I and XV to 555.65 betweenIX and XIII. Considering cluster distances NDL 2005-32, NDL 2002, Hira, Parwati, BAU 2004-0, LMS2007-07, NDL 2005-28, LCK 8029, Mukta, NDL 2007-15 and Shekhar may be chosen for hybridizationprogramme to evolve higher yielding linseed varieties.
Key words: Cluster, Euclidean-cluster analysis, Genetic divergence, Linseed and Seed yield.
In India, among the oilseeds crop grown duringRabi season, linseed is next in importance torapeseed-mustard in area as well as production.Linseed belongs genus Linuin is the largest genus offamily Linaceae with about 200 species displayinggreat diversity in karyotype. Linum usitatissimum L.is an annual, self pollinating and non-edible oil crop.It is the sole species of agricultural importance withinthe family Linaceae and belongs to group of foundercrops that initiated agriculture in ‘old world’ (Zohary,1999). All parts of linseed plant have extensive andvaried uses. Out of total linseed oil 20% is used foredible and domestic purpose and rest of 80% goes forindustrial utilization. Linseed oil is extensively usedin the industry for the manufacturing of high qualitypaints and varnishes. It is also used in for making oilcloth, printers ink, soap, patent leather antibiotic andother products. Linseed cake is very richproteinacious feed for live stock and quick growinganimals. Dual purpose flax linseed is also grown forfiber. Recent advances in medical research havefound linseed as best herbal source of Omega-3 andOmega-6 fatty acids which have immensenutritionally medicinal effect on human body system.Globally linseed production is 21.23 lack tonnes from21.12 lack ha with an average yield of 1006 kg/ha,with our national productivity of 449 kg/ha(Anonymous, 2012). India ranks second in area afterCanada in the world, but is at 4th place in terms ofproduction after Canada, China and USA. In Indiamajor linseed growing states are, Madhya Pradesh,Chhatisgarh, Maharastra, Uttar Pradesh, Bihar,Orissa, Jharkhand, Nagaland, Karnataka and Assam.The major causes behind low production are due tocultivation of linseed mainly in marginal/submarginal lands suffered with diseases, insect pestsproblem and also poor crop management. Thevariation available in germplasm is very useful fordevelopment of high yielding highly adaptable the
disease and insect resistance cultivars. The selectionof suitable divergent parents for hybridization isrequired because the cross involving diverse parentsoffer great possibility of obtaining desirablesegregants in the segregating generations (Moll andRobinson, 1962). Non –hierarchical Euclidean clusteranalysis is a powerful tool in qualifying the degree ofdivergence among biological populations. The presentstudy aims at the assessment of genetic diversity in acollection of 203 genotypes of linseed on the basis of11 yield related traits.
MATERIALS AND METHODS
Field experiment was conducted at Genetics &Plant Breeding Farm of N.D. University ofAgriculture and Technology, Kumarganj, Faizabad(U.P.) during rabi 2011-12 using 203 genotypes oflinseed (Table-1). The two hundred germplasm linesalong with three checks (T 397, Rashmi and Shekhar)were planted in augmented block design. Theexperimental field was divided into ten blocks of 23plots. The checks were distributed randomly in eachblock. Each plot consisted of a genotype of single rowof 5 meter length spaced 30 cm apart with plant toplant distance of 10 cm. Five plants in each plot of agenotype were sampled for taking observation on 11characters viz., days to flowering, plant height (cm),days to maturity, number of primary branches/plant,number of secondary branches per plant, number ofcapsules/ plant, biological yield per plant (g), seedyield per plant (g), harvest index (%), test weight (g)and oil content (%). Mean data for each trait was usedfor statistical analysis. Genetic divergence amonggenotypes planted in Augmented Block Design wasstudied through Non hierarchical Euclidean clusteranalysis (Beale, 1969, Spark, 1973).

Journal of Progressive Agriculture, Vol.4, No. 2: October, 2013
69
RESULTS AND DISCUSSION
In the present study 203 genotypes of linseedwere grouped into 15 (Table-1) distinct nonoverlapping clusters using non hierarchical Euclideanshowing wide diversity in population for all thecharacters. Chawla and Prakash (1984) and Kumarand Asawa (1984) have also reported substantialdiversity in linseed materials. An examination of theclustering pattern of the studied linseed genotypes in15 cluster revealed that the genotypes ofheterogeneous origin were frequently present in thesame cluster. Cluster 1 had 10 genotypes which werecharacterized by lowest cluster mean for oil contentand moderate for other traits. The cluster II having 17entries possessed moderate cluster mean for all thecharacters (Table-2). Eight genotypes falling incluster III resulted in lowest value for days tomaturity, plant height, capsules per plant, biologicalyield per plant. Cluster IV comprising 5 genotypeshad highest mean performance for plant height,capsules per plant, biological yield per plant andmoderate mean performance rest of the characters.Cluster V having seven genotypes had second highestcluster mean for oil content and possessed mediumcluster mean for all the traits. Cluster VI representedby the twelve genotypes showed lowest mean fordays to 50% flowering and second lowest value fornumber of primary branches per plant, secondarybranches per plant, seed yield per plant and oilcontent. Cluster VII comprising 28 genotypesexhibited moderate cluster mean for all the traits,cluster VIII comprising 6 genotypes having highcluster mean for days to 50% flowering, days tomaturity, plant height and oil content and lowestcluster mean for harvest-index, cluster IX representedby 13 genotypes showed lower cluster mean fornumber of primary branches per plant, number ofsecondary branches per plant, seed yield per plant,harvest index and moderate mean performance forremaining characters. Cluster X containing 28genotypes exhibited moderate cluster mean for all thecharacters, cluster XI represented by 15 genotype hadhighest number of primary branches per plant,biological yield per plant alongwith second highestmean for number of secondary branches per plant andremaining all the characters were represented with theaverage mean performance. Cluster XII representedby the 8 genotypes which showed highest clustermean for days to 50% flowering and second highestmean for days to maturity. Cluster XIII representedby 6 genotypes showed highest mean for plant height,number of secondary branches per plant, number ofcapsules per plant, biological yield per plant, seedyield per plant and lowest cluster mean for test
weight. The 11 lines of cluster XIV werecharacterized by highest cluster mean performancefor harvest index alongwith highest mean for seedyield per plant and test weight. The mean forremaining characters were moderate in case of clusterXV. The 19 genotypes falling in cluster XV werecharacterized by medium yield performance foralmost all the characters under study.
The fifteen clusters in the aforesaid divergenceanalysis contain genotypes of heterogenous originfrequently. Although genotypes originated in sameplace are geographic region were also found to begroup together in same cluster. The instance ofgrouping of geographic of different origin orgeographic region also in same cluster were observedin case of all the fifteen clusters. The grouping ofgenotypes from different geographic region in onecluster could be attributed either to homogeneity inenvironment are free exchange of breeding materialsamong breeders in different regions. Chawla andPrakash, 1984 also did not find any relationshipbetween genetic diversity and geographic diversity intheir studies.
The estimates of intra and inter cluster distancefor 11 characters are presented in Table-3. Thehighest intra cluster distance was observed in case ofcluster XI (65.09) followed by cluster IX (63.82). Thelowest intra cluster distance was noted for cluster VIII(24.31) followed by cluster XV (28.83). Thus 15genotypes in cluster XI and 13 genotypes in clusterIX were most heterogeneous. The maximum intercluster distance was observed between IX and XIII(555.65) followed by cluster IX and XI (497.73). Theinter cluster distance between cluster IV and XIII(470.33) and cluster X and XIII (436.71) were also ofhigh order. The minimum inter-cluster distance wasobserved between cluster I and XV (57.87). Itsuggested wide diversity of these groups having highinter cluster distances. It is therefore suggested thatcrosses should be attempted between cluster X andVIII as well as X and XI to get desirable segregates.The crosses between genotype belonging to theclusters separated by low inter cluster differences areunlikely to generate promising recombinants insegregating generations. Anand and Murty (1968)also proposed hybridization between lines belongingto cluster separated by large inter cluster distances inlinseed. Considering the high mean performance thegenotype NDL-2005-32, NDL-2006-2, LMS-2007-1,NDL-2005-28, LCK-8029, Mukta, Hira, Parvati,Meera, BAU-2004-07, NDL-2002, NDL-2007-15,Shekhar which belong to the different cluster are ofhigh potential in breeding.

Journal of Progressive Agriculture, Vol.4, No. 2: October, 2013
70
Table-1: Clustering pattern of 203 linseed genotypes on the basis of non-hierarchical Euclidean Clusteranalysis for 11 characters.
No.Cluster
No. ofGenotype
Genotype
1 10 L-42, LC-208, Kanpur 5/7, Mukta, Ireland, L-94, Jabalpur-367, ILS-154, IC-54, Hira
2 17 PCL-40, L-112, LCK-7035, JLST-1, NDL-2005-22, JRF-5, ILS-153, KP10, Jawargi-1-11, L-67,HY-262, HY-31, HY-641-1, L-53, ILS-293, NDL-2005-23, L-120
3 8 L-93, NDL-2005-29, LC-206, JLT-84-5-1, NDL-2005-33, LMS-23-6, L-40, RL-270054 5 L-59, L-118, NDL-2005-28, L-56, LCK-80295 17 L-51, LCP-1, IC-15888, L-103, NDL-2006-10, IC-1062, L-36, RL-26016, LCP-202, Jaspri-21, L-
13, BAU-04-07, H-660, IC-4948, H-49, ILS-150, JRF-46 12 L-3, IC-49936, L-117, L-9, KP-8, HYB-6032, NDL-2005-21, ILS-56, ILS-61, L-80, HY-397, L-287 28 LC-1044, ILS-77, L-74, L-1 Parvati (zc), NDL-2005-26, LCK-7002, ILS-252, NDL-2008-09, SLS-
77, RL-2600, NDL-2005-24, L-23, NDL-2005-30, L-49, L-104, L-43, L-4, KL-232, L-10, L-126,LC-54, Kanpur 2/1, L-29, L-63, LC-273, L-51, NL-259
8 6 Meera (zc), L-52, LCP-147, L-91, Karnama, PKDL-62
Table-2: Cluster mean of 15 Cluster for different characters in linseed
ClusterNo.
Days to50%
flowering
Days tomaturity
Plantheight(cm)
Primarybranches
plant-1
Secondarybranches
plant-1
Capsulesplant-1
Biologicalyield plant-
1 (g)
Seedyieldplant-
1 (g)
Harvestindex(%)
Testweight
(g)
Oilcontent
(%)
I 81.96 129.73 55.31 3.29 22.78 49.53 13.85 3.13 22.73 7.66 33.00
II 84.33 131.00 53.05 3.38 22.28 45.11 11.97 2.95 24.87 7.27 34.40
III 81.65 129.21 50.63 3.00 18.43 41.51 11.54 2.87 24.95 7.79 35.43
IV 88.80 130.50 50.39 3.01 19.34 40.52 9.79 2.87 28.39 8.22 36.25
V 83.61 130.96 55.18 3.17 20.78 45.80 14.05 2.80 19.87 7.41 36.78VI 81.22 130.80 54.69 2.85 16.73 41.77 12.97 2.37 18.41 7.26 33.08VII 88.08 134.99 57.58 3.42 21.96 46.35 13.04 2.94 22.54 7.40 35.50VIII 90.36 136.80 61.61 3.21 21.21 44.07 13.79 2.38 17.24 6.89 37.27IX 84.96 132.04 50.72 2.75 15.48 37.15 11.78 2.16 18.27 7.69 36.02X 89.18 134.39 52.85 3.10 18.85 40.65 12.74 2.49 19.53 7.65 35.49
XI 88.37 134.68 60.20 3.76 25.58 58.25 15.66 3.76 24.03 7.88 33.23
XII 90.24 134.92 53.56 3.64 23.58 53.28 12.70 3.56 28.06 7.25 34.77
XIII 81.92 129.80 60.21 3.71 26.16 60.44 15.64 3.86 24.64 6.86 35.15
XIV 82.53 129.36 55.35 3.50 24.877 55.52 13.00 3.84 29.54 7.94 34.50
XV 84.41 131.68 58.57 3.56 24.07 51.88 13.90 3.42 24.89 7.57 36.19
Table-3: Estimates of average intra and inter-cluster distances for the 15 clusters in linseed.
. I II III IV V VI VII VIII IX X XI XII XII XIV XVI 29.04 63.65 105.04 206.74 63.92 103.49 115.97 224.42 221.04 182.63 167.10 140.77 127.83 90.48 57.87
II 41.11 63.28 100.67 71.29 104.91 92.92 203.30 152.65 119.16 224.89 109.41 231.54 125.02 86.81III 29.90 92.87 93.25 84.22 169.90 293.85 105.42 140.94 385.67 220.82 353.22 200.69 171.01IV 63.83 177.87 201.03 170.72 295.43 154.74 137.27 411.33 172.23 470.33 261.98 226.70
V 30.78 68.36 84.32 127.66 125.42 102.14 219.26 168.57 212.83 180.65 82.52VI 34.03 153.85 201.49 82.26 112.66 355.78 277.07 350.09 283.92 185.96
VII 52.26 83.02 185.87 89.91 156.82 88.85 242.56 200.93 90.73VIII 24.31 208.51 98.92 222.29 193.60 356.15 378.38 178.48IX 41.11 79.69 497.73 325.63 555.65 424.40 293.36
X 40.17 318.50 182.85 436.71 341.45 200.43XI 65.09 119.83 119.55 168.96 102.09XII 34.24 211.83 130.93 89.46XIII 41.34 101.77 87.09XIV 45.83 77.26XV 28.83
Bold figures represent intra-cluster distance

Journal of Progressive Agriculture, Vol.4, No. 2: October, 2013
71
REFERENCES
Ananda, I.I. and Murty, B.R. 1968. Genetic divergenceand hybrid performance in linseed. Indian J. Genet.28: 178-185.
Anonymous, 2012. Annual Progress Report 2011-12.Linseed, ICAR PC Unit (Linseed) CSAU&T, Kanpur.
Beale, E.M.L. (1969). Euclidean cluster analysis. A papercontributed to 37th session of International StatisticalInstitute.
Chawla, B.K. and Singh, P. 1984. Genetic divergence inlinseed. Indian J. Agric. Sci. 54 (4): 266-268.
Kumar, V.S. and Asawa, B.M. 1984. Note on the geneticdivergence in linseed. Indian J. of Agric. Sci. 55(3):1999-2000.
Moll, R.H. and Robinson, R.F. 1962. Heterosis andgenetic diversity in variety crosses of maize. CropSci. 2: 197-209.
Spark, D.N. 1973. Euclidean cluster analysis, AlgorithmAs-58. Applied Statistics. 22: 126-130.
Zohary, D. 1999. Monophyletic and polyphyletic origin ofthe crops on which agriculture was formed in the neareast. Genetic Resource and Crop Evolution. 46:133-142.

Journal of Progressive Agriculture, Vol.4, No. 2: October, 2013
72
Performance of quality protein maize (QPM) on quality, yield and yield components asinfluenced by nutrient management
NANDITA JENA, K.P. VANI, PRAVEEN RAO, A. SRINIVAS AND SIVA SANKARCollege of Agriculture, Acharya N G Ranga Agricultural University
Rajendranagar, Hyderabad-500 030, Andhra Pradesh.
Received: August, 2013Accepted: Sept., 2013
ABSTRACT
A field experiment was carried out at College Farm, College of Agriculture, Rajendranagar,Hyderabad to find out the response of quality protein maize hybrid (HQPM-1) to various N and P levelswas studied at during kharif 2012. Experiment with four nitrogen levels (0, 120, 180 and 240 kg N ha-1)and four phosphorus levels (0, 60, 80 and 100 kg P2O5 ha-1) were laid out in randomized block designwith three replications having a plot size of 6m × 5m with plant spacing of 60 × 20 cm. Results showedthat application of 240 kg N ha-1 gave maximum cob length (17.50 cm), cob girth (13.91 cm), number ofgrains cob-1(324), test weight (31.48 g), grain yield (6383 kg ha-1), stover yield (7050 kg ha-1), harvestindex (47.5%) and protein content (11.35 %) followed by 180, 120 kg N ha-1and control. Similarly, 100kg P2O5 ha-1 resulted significantly more cob length (16.25 cm), cob girth (12.99 cm), number of grainscob-1(290), test weight (29.34 g), grain yield (5010 kg ha-1), stover yield (5562 kg ha-1), harvest index(47.3%) and protein content (11.06 %) followed by lower levels of phosphorus. Hence N and P can beapplied at the rate of 240 kg ha-1 and 100 kg ha-1 to obtain higher yield.
Key words: Nitrogen, Phosphorus, Quality protein maize, Yield components and Yield Quality.
Among cereals, Maize (Zea mays) is animportant food and feed crop which ranks third afterwheat and rice in the world. Because of its expandeduse of the agro industries, it is recognized as a leadingcommercial crop of great agro-economic value. But,conventional maize is a poor quality food staple as itlacks the full range of amino acids viz, lysine andtryptophan needed to produce proteins. Globallymaize is cultivated in an area of 170.39 Million hawith a production of 883.46 Million tonnes and 5.18Million tonnes ha-1 productivity (FAO, 2012). InIndia, grown in an area of 8.55 Million ha with aproduction of 21.73 Million tonnes and an averageproductivity of 2540 kg ha-1. In Andhra Pradesh itcovers an area of 0.82 Million ha with a production of4.51 Million tonnes at an average productivity of5317 kg ha-1 (CMIE, 2011). Quality Protein Maize(QPM) is an improved version, which contains higheramount of lysine and tryptophan with lower amountof leucine and isoleucine in the endosperm than thosecontained in normal maize. Such balanced conditionof amino acids in the endosperm resulted to its higherbiological value ensuring more availability of proteinto human and animals than normal maize (Kaul et al.,2012). Maize have high productiveness, but someproduction constrains lower its quantity and quality ofproduction. Among these constraints for maizeimbalance and inadequate nutrition is consider to beone of the important factors .Therefore, a field studywas undertaken to study the effect of nitrogen andphosphorus yield attributes and yield of QPM.
MATERIALS AND METHODS
The field experiment was conducted on QualityProtein Maize during kharif 2012, at College Farm,College of Agriculture, Rajendranagar, Hyderabad.The experiment consisted of four levels N (0,120, 180and 240 kg ha-1) and P (0, 60, 80 and 100 kg ha-1)with three replications in Randomized Block Design.The soil was classified as sandy loam, neutral in soilreaction (pH 6), rich in organic carbon (0.43%),medium in available nitrogen (309 kg ha-1),phosphorus (31.23 kg ha-1) and potassium (320 kgha-1). The annual rainfall of the region is 532.8 mm.Nitrogen, phosphorus and potassium was appliedaccording to the graded levels. Quality Protein Maizehybrid (HQPM-1) was sown 9th July 2012 with a seedrate of 20 kg ha-1 at a spacing of 60 × 20 cm.Crop was harvested on Oct 18th 2012.
RESULTS AND DISCUSSION
Days to 50% floweringDays to 50% flowering was significantly
influenced by different levels of nitrogen andphosphorus (Table.1). It was observed that 50%flowering was attained earlier in the treatmentswithout fertilizer (N and P). The abundant supply offertilizers to the crop will promote vegetative growthfor long duration, there by delaying floweringcompared to the crop supplied with less or withoutfertilizers which attains flowering earlier (Kumar,2008).

Journal of Progressive Agriculture, Vol.4, No. 2: October, 2013
73
Yield componentsWith increase in N and P levels yield
components linearly and significantly increasedexcept number of cob per plant (Table. 1). Treatmentwith higher dose of N (240 kg ha-1) resulted insignificantly higher cob length (17.5 cm), cob girth(13.91 cm), number of grains cob-1 (324) and testweight (31.48 g) followed by 180 kg N ha-1, 120 kg Nha-1 and control. Phosphorus @ 100 kg P2O5 ha-1 hadshown longer cob length (16.25 cm), cob girth (12.99cm), more number of grains cob-1 (290) and testweight (29.34 g) significantly superior over controland followed by 80, 60 kg P2O5 ha-1.
Nitrogen and Phosphorus are essentialnutrients required for the promotion of themeristematic and physiological activities such as leafspread, root development, plant dry matterproduction, leading to efficient absorption andtranslocation of water and nutrients and interceptionof solar radiation. These activities promote higherphotosynthetic process which is translocate toassimilates into various sink producing various sinkcomponents like cob length, cob girth, number ofgrains cob-1 and test weight. (Singh and Nepalia,2009).Yield
QP maize fertilized with 240 kg N ha-1 hadresulted grain yield (6383 kg ha-1) and stover yield
(7050 kg ha-1) which was significantly higher by12.50% and 11.39% with 180 kg N ha-1, 33.32% and30.21% with 120 kg N ha-1 and 71.43% and 68.82%with control. Significantly higher grain and stoveryield (5010 and 5562 kg ha-1) was recorded withapplication of highest phosphorus doses (100 kg P2O5
ha-1) and minimum with control followed by otherlower levels. Maximum HI (47.5%) was observed at240 kg N ha-1. Phosphorus @ 100 kg P2O5 ha-1 hadrecorded higher HI (47.3%) (Table. 2).
The highest grain yield, stover yield andharvest index was due to better translocation ofphotosynthates from source to sink and higher growthattributing characters into different parts of plant andyield attributing characters like cob length, cob girth,number of grains per cob, test weight etc. (Naik et al.,2012)Protein content (%)
Significantly highest Protein content (11.35% and 11.06 %) recorded with 240 kg N ha-1 andphosphorus 100 kg P2O5 ha-1 compared to othertreatments, while lowest Protein content was obtainedwith control plot of nitrogen (9.14%) and phosphorus(9.68%) (Table.2). Increased N and P fertilizationincreases available N and P, which in turn increases Nconcentration in the grain which is integral part ofprotein synthesis and there by accelerating the proteincontent (Jaliya et al., 2013).
Table.1: Effect of nitrogen and phosphorus on yield components of QPM.
Treatment 50% Flowering Number ofcobs plant-1
Cob length(cm)
Cob girth(cm)
No. ofgrains per
cob
Test weight(100 grain)
(g)50%Tasseling
50% Silking
Nitrogen Levels (kg ha-1)0 50.50 53.50 1.00 10.60 8.57 195 18.63
120 52.00 55.00 1.00 13.05 10.22 243 25.76
180 54.00 57.50 1.33 15.71 12.24 294 29.13
240 56.50 59.50 1.33 17.50 13.91 324 31.48
SE m± 0.34 0.16 0.11 0.36 0.35 5.49 0.50
CD (P=0.5) 1.00 0.46 NS 1.05 1.03 15.87 1.45
Phosphorus Levels (kg ha-1)
0 51.75 55.50 1.16 11.47 9.32 237 22.29
60 52.75 56.50 1.16 13.99 10.70 257 25.73
80 54.25 57.75 1.16 15.15 11.94 273 27.64
100 55.25 58.75 1.16 16.25 12.99 290 29.34
SE m± 0.34 0.16 0.11 0.36 0.35 5.49 0.50
CD (P=0.5) 1.00 0.46 NS 1.05 1.03 15.87 1.45
Interaction (N×P)SE m± 0.68 0.32 0.22 0.73 0.71 10.98 1.00
CD (P=0.5) NS NS NS NS NS NS NS

Journal of Progressive Agriculture, Vol.4, No. 2: October, 2013
74
Table.2: Effect of nitrogen and phosphorus on yield, harvest index and protein content of QPM.
REFERENCES
CMIE. 2011. Centre for Monitoring Indian Economy.RL:http://www.CMIE.com.
FAO. 2012. FAO online database http://www.fao.org.
Jaliya, M.M, Ibrahim, A., Babaji, B.A., Sani, B.M. andAminu, D. 2013. Effect of nitrogen and sulphurfertilizers on maize grain protein content of QPMmaize varieties at Samaru Zaria. Global J. of Bio-Science and Biotech. 2(1): 132-134.
Kaul, J., Sekhar, J.C., Kumar, R.S. and Dass, S. 2012.Studies on variability in elite inbred lines of qualityprotein maize. Maize J. 1(1): 27-29.
Kumar, A. 2008. Productivity, economics and nitrogen useefficiency of speciality corn (Zea mays) as influencedby planting density and nitrogen fertilization. IndianJ. of Agronomy. 53(4): 306-309.
Naik, K.P.S., Mavarkar, N.S., Naik, T.B.,Krishnamurthy, N. and Dinesh, M.S. 2012.Production potential and economics of rainfed maizeas influenced by FYM and biodigester liquid manureunder southern transitional zone of Karnataka. CropRes. 44(3): 274-278.
Singh, D. and Nepalia, V. 2009. Influence of integratednutrient management on QPM productivity & soil ofsouth rajasthan. Indian J. of Agri. Sc. 79(12): 1020-22.
Treatment Grain yield(kg ha-1)
Stover yield(kg ha-1)
Harvex Index(%)
Protein content(%)
Nitrogen Levels (kg ha-1)0 1823 2198 45.3 9.14120 4256 4920 46.3 9.96180 5585 6247 47.3 10.67
240 6383 7050 47.5 11.35SE m± 93 105 - 0.22CD (P=0.5) 269 304 - 0.66Phosphorus Levels (kg ha-1)0 3798 4378 46.0 9.6860 4490 5126 46.3 9.88
80 4749 5348 46.8 10.49100 5010 5562 47.3 11.06SE m± 93 105 - 0.22CD (P=0.5) 269 304 - 0.66Interaction (N×P)SE m± 186 211 - 0.45CD (P=0.5) NS NS - NS

Journal of Progressive Agriculture, Vol.4, No. 2: October, 2013
75
Runoff capture through vegetative barriers to reduce soil erosion: A crirical review
MANISH JHA, ASHUTOSH GAUTAM AND ARBIND KUMAR GUPTAM.Sc. Scholar, College of Agriculture, Acharya N G Ranga Agricultural University
Rajendranagar, Hyderabad-500 030, Andhra Pradesh.
Received: Feb., 2013Accepted: August, 2013
ABSTRACT
The vegetative barriers in combination with small trench-cum-bund can be used for reducing therunoff, soil and nutrient losses, building up soil fertility and enhancing soil moisture retention and cropyield. The obvious yield loss in the short distances from the barrier can be overcome by the yield grainsfrom the remaining area of the plot. The benefits of vegetative barriers in terms of resourceconservation make these barriers a suitable conservation technology to prevent water erosion andimpart natural sustainability to the production potential of land for a long-term. Among the three grassbarriers under study, Sambuta (a local grass) barrier proved more effective than vetiver andlemongrass in the sub-humid region having predominance of red lateritic soils. This barrier incombination with a trench-cum-bund resulted in significantly less runoff, soil and nutrient losses andproduced higher crop yield compared to other two barriers.
Key words: Runoff capture, vegetative barriers and soil erosion
Soil conservation technique is the application ofprocesses to the solution of soil managementproblems. The conservation of soil implies utilizationwithout waste so as to make possible a continuoushigh level of crop production while improvingenvironmental quality. Soil conversation, in practicerefers to the protection of all surface deposits, notmerely the near-surface, organic layers that aresubject to present-day weathering (Schwab et al,1993). Some of the methods used to maintain soilfertility include the following: shifting cultivation,land rotation, crop rotation, mixed cropping, plantingof cover crops and use of manure. Reducing erosionis one of the most-studied conservation goals andvarious means to achieve it are widely practiced.Many of these conservation practices have beenshown to consistently reduce soil erosion (Ghidey andAlberts 1998).
METERIALS AND METHODS
Attempts have been made for many years toquantify the soil erosion effect in various purposeslike cropping practices in numerical form whichwould allow erosion to be predicted for givencircumstances (Wischmeier and Smith, 1965). Datafor derivation and field use equations were obtainedfrom the runoff plots. Zingg (1940) proposed arelationship of soil loss to slope length raised to apower. In 1947, a committee chaired by Musgraveproposed a soil loss equation having some similarityto the present day Universal Soil Loss Equation(USLE). This equation was later refined with morerecent data from same runoff plots and rainfallsimulations from field experience (Wischmeier andSmith, 1978).
The soil loss equation is: A= RKLSCP
where A is the average annual soil loss per unitof area (t ha−1 yr−1), R is the rainfall–runoff erosivityfactor (MJ mm ha−1 h−1 yr−1), K is the soil erodibilityfactor (t h MJ−1 mm−1), LS is the topographic factor(dimensionless) which includes slope length factor(dimensionless) and slope steepness factor(dimensionless), C is the cover management factor(dimensionless), and P is the support practice factor(dimensionless).
Use of perennial grasses as vegetativebarriers to reduce soil erosion from and non-farmlands is increasing world-over. A number of perennialgrasses have been identified for their soil conservingproperties, but their effectiveness varies with locationand method of planting. Installing vegetative barriersin combination with suitable mechanical measures,like bunds or trenches or both, on the appropriatelyspaced contours may enhance their conservationpotential. Hence, the effect of vegetative barriers,viz., Sambuta (Saccharum spp.) a local grass, vetiver(Vetiveria zizanioides) and lemongrass (Cymbopogonciratus) planted in combination with trench-cum-bund, on runoff and soil loss was studied inKokriguda watershed in southern Orissa, Indiathrough 2001–2005 (Dass et al. 2010).
Hung et al., (1996) conducted a series ofexperiments in a 5 m long, 1.2 m wide, 0.3 m deepsoil pan with slope gradient adjustment to study theeffects of hill slope on soil erosion for clay loam.Different seepage levels and drainage gradients werecreated at the soil surface by supplying water to thebottom of the soil base with capacity to maintain aconstant water level at any position relative to the soilsurface. Results indicated that seepage conditionsgreatly increased the soil surface erosion withsediment delivery 2.5 times more under rainfall and 6

Journal of Progressive Agriculture, Vol.4, No. 2: October, 2013
76
times higher under concentrated flows with 20 cmseepage pressure as compared to a free drainedcondition. The data collected under 55 mm/hr rainfallat 5 per cent slope shows that differences in the near -surface hydraulic gradient had significant effect onrunoff and sediments. The rapid change from anexfiltration to infiltration condition reduces sedimentdelivery to 70 percent.
Ranade et al., (1997) conducted study onrunoff plots of size 100 x 15 sq m with varying slopesi.e. 1.0, 1.5 and 2.0 per cent in vertisols at theResearch Farm, College of Agriculture, Indore(M.P.). It has been observed that mechanical andvegetative barriers are effective in reducing seasonalrunoff and soil loss by about 20 to 25 per cent overcontrol under moderate slope category (up to 2 % ).At the same time, it was observed that vegetativebarriers are also effective as mechanical measure andthey can be considered suitable alternative tomechanical measures in the region.
Nalatwadmath et al., (2004) studied therainfall, runoff and soil loss relationship for differentdegree and length of slope in runoff plots from plotsof four lengths i.e. 22.12,44.26, 66.39and 88.52 m.The runoff and soil losses were almost constant after50 m. The smallest length (22.12m) has, producedmaximum runoff and sqil loss. As length of the slopeincreased runoff percentage as well as soil loss perunit area decreased due to trap efficiency. Runoff andsoil loss increases with increase in per centage ofslope. These results confer with those of Wischemeirand Smith (1978) studies.
RESULTS AND DISCUSSION
Steepness of slope is more dominant overlength of slope in black soil region towards causingsoil erosion. Under slope range between 0 to 1 percent vegetative barriers are more effective than
mechanical measures, if they are well established andmaintained in agricultural lands (Singh et al., 2007).
Lowest average runoff (8.1%) and soil loss(4.0 Mg ha-1)were observed in the sambuta + trench-cum-bund followed by vetiver + trench-cum-bundtreatment (runoff 9.77%, soil loss 12.95 Mg ha-1). Thelemongrass barrier, owing to its significantly lowersurvival, lower number of slips clump-1, small clumpsize (clump girth), larger gaps between successiveclumps and poor root growth, allowed significantlyhigher runoff than sambuta and vetiver. whereas,significantly higher values of aboveground growthparameters coupled with better root proliferations insambuta and vetiver resulted in significantly lowerrunoff and soil loss (table 1 & 2) (Dass et al. 2010).
CONCLUSIONThe vegetative barriers in combination with
small trench-cum-bund can be used for reducing therunoff, soil and nutrient losses, building up soilfertility and enhancing soil moisture retention andcrop yield. The obvious yield loss in the shortdistances from the barrier can be overcome by theyield grains from the remaining area of the plot. Thebenefits of vegetative barriers in terms of resourceconservation make these barriers a suitableconservation technology to prevent water erosion andimpart natural sustainability to the productionpotential of land for a long-term. Among the threegrass barriers under study, Sambuta (a local grass)barrier proved more effective than vetiver andlemongrass in the sub-humid region havingpredominance of red lateritic soils. This barrier incombination with a trench-cum-bund resulted insignificantly less runoff, soil and nutrient losses andproduced higher crop yield compared to other twobarriers.
Table. 1. Effect of vegetative barriers on runoff.Treatment Runoff (%)
2002 2003 2004 AverageSambuta + bund 7.83 8.26 8.10 8.06Sambuta + berm 10.50 11.42 11.22 11.04Vetiver + bund 8.96 10.44 9.90 9.77Vetiver + berm 12.50 13.26 13.14 12.95Lemongrass + bund10.78 12.35 12.23 11.78Lemongrass + berm 13.67 15.54 14.80 14.67LSD (0.05) 1.10 2.10 1.75 1.68
(Source: Dass et al. 2010)Table. 2. Effect of vegetative barriers on soil loss.
Treatment Soil loss (Mg ha-1)2002 2003 2004 Average
Sambuta + bund 3.69 4.30 4.10 4.03Sambuta + berm 4.95 5.32 5.23 5.16Vetiver + bund 3.9 4.87 4.74 4.49Vetiver + berm 6.8 7.52 7.42 7.24Lemongrass + bund 5.18 6.01 6.21 5.80Lemongrass + berm 7.5 8.58 8.70 8.26LSD (0.05) 0.42 0.55 0.52 0.65
(Source: Dass et al. 2010)

Journal of Progressive Agriculture, Vol.4, No. 2: October, 2013
77
REFERENCES
Dass, A., Sudhishri, S., Lenka, N. K and Patnaik, U.S. 2010. Runoff capture through vegetative barriersand planting methodologies to reduce erosion, andimprove soil moisture, fertility and cropproductivity in southern Orissa, India. Nutr CyclAgroecosyst. 89:45–57.
Ghidey, F and Alberts, E.E. 1998. Temporal andSpatial Patterns of Nitrate in a CIaypan SoD.Journal of Environmental Quality.
Nalatwadmath, S.K. et a/. 2004. Indian J. Dry landAgric Res and Develop. 19(1) : 31-37.
Ranade, D.H. et al. 1997. Indian J. Soil Conser. 25(3):182- 185.
Schwab, G. O., Fangmeier, D. D., Elliot, W. J., andFrevert, R. K. 1993. Soil and Water ConservationEngineering. John Willey & Sons, Inc., New York,NY USA, 4 edition.
Singh, A.K., Kothari, M., Mishra, P.K., Kumar, V.,Reddy, S.G.V and Purohit, R.C. 2007. Soilerosion research under simulated conditions forblack soils of southern india - a review. Agric. Rev.28(l) :63-68.
Wischmeier, W.H., and Smith, D.D. 1965. Predictingrainfall-erosion losses from cropland east of theRocky Mountains: Guide for selection of practicesfor soil and water conservation. U.S. Dep. Agric.,Agric. Handb. No. 282.
Wischmeier, W.H., and Smith, D.D. 1978. Predictingrainfall erosion losses: A guide to conservationplanning. U.S. Dep. Agric., Agric. Handb. No.537.
Zingg, A.W. 1940. Degree and length of land slope as itaffects soil loss in runoff. Agric. Eng. 21:59-64.
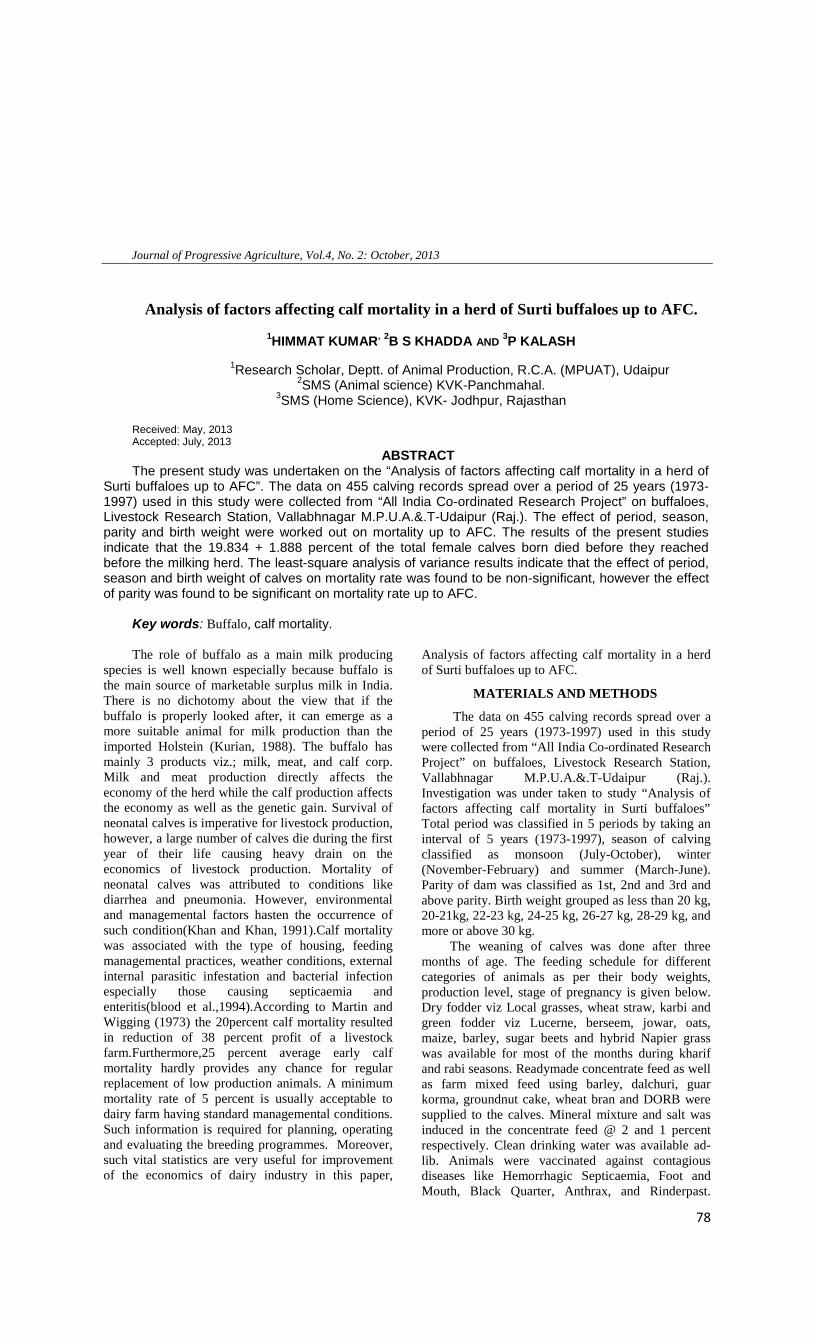
Journal of Progressive Agriculture, Vol.4, No. 2: October, 2013
78
Analysis of factors affecting calf mortality in a herd of Surti buffaloes up to AFC.
1HIMMAT KUMAR, 2B S KHADDA AND 3P KALASH1Research Scholar, Deptt. of Animal Production, R.C.A. (MPUAT), Udaipur
2SMS (Animal science) KVK-Panchmahal.3SMS (Home Science), KVK- Jodhpur, Rajasthan
Received: May, 2013Accepted: July, 2013
ABSTRACTThe present study was undertaken on the “Analysis of factors affecting calf mortality in a herd of
Surti buffaloes up to AFC”. The data on 455 calving records spread over a period of 25 years (1973-1997) used in this study were collected from “All India Co-ordinated Research Project” on buffaloes,Livestock Research Station, Vallabhnagar M.P.U.A.&.T-Udaipur (Raj.). The effect of period, season,parity and birth weight were worked out on mortality up to AFC. The results of the present studiesindicate that the 19.834 + 1.888 percent of the total female calves born died before they reachedbefore the milking herd. The least-square analysis of variance results indicate that the effect of period,season and birth weight of calves on mortality rate was found to be non-significant, however the effectof parity was found to be significant on mortality rate up to AFC.
Key words: Buffalo, calf mortality.
The role of buffalo as a main milk producingspecies is well known especially because buffalo isthe main source of marketable surplus milk in India.There is no dichotomy about the view that if thebuffalo is properly looked after, it can emerge as amore suitable animal for milk production than theimported Holstein (Kurian, 1988). The buffalo hasmainly 3 products viz.; milk, meat, and calf corp.Milk and meat production directly affects theeconomy of the herd while the calf production affectsthe economy as well as the genetic gain. Survival ofneonatal calves is imperative for livestock production,however, a large number of calves die during the firstyear of their life causing heavy drain on theeconomics of livestock production. Mortality ofneonatal calves was attributed to conditions likediarrhea and pneumonia. However, environmentaland managemental factors hasten the occurrence ofsuch condition(Khan and Khan, 1991).Calf mortalitywas associated with the type of housing, feedingmanagemental practices, weather conditions, externalinternal parasitic infestation and bacterial infectionespecially those causing septicaemia andenteritis(blood et al.,1994).According to Martin andWigging (1973) the 20percent calf mortality resultedin reduction of 38 percent profit of a livestockfarm.Furthermore,25 percent average early calfmortality hardly provides any chance for regularreplacement of low production animals. A minimummortality rate of 5 percent is usually acceptable todairy farm having standard managemental conditions.Such information is required for planning, operatingand evaluating the breeding programmes. Moreover,such vital statistics are very useful for improvementof the economics of dairy industry in this paper,
Analysis of factors affecting calf mortality in a herdof Surti buffaloes up to AFC.
MATERIALS AND METHODS
The data on 455 calving records spread over aperiod of 25 years (1973-1997) used in this studywere collected from “All India Co-ordinated ResearchProject” on buffaloes, Livestock Research Station,Vallabhnagar M.P.U.A.&.T-Udaipur (Raj.).Investigation was under taken to study “Analysis offactors affecting calf mortality in Surti buffaloes”Total period was classified in 5 periods by taking aninterval of 5 years (1973-1997), season of calvingclassified as monsoon (July-October), winter(November-February) and summer (March-June).Parity of dam was classified as 1st, 2nd and 3rd andabove parity. Birth weight grouped as less than 20 kg,20-21kg, 22-23 kg, 24-25 kg, 26-27 kg, 28-29 kg, andmore or above 30 kg.
The weaning of calves was done after threemonths of age. The feeding schedule for differentcategories of animals as per their body weights,production level, stage of pregnancy is given below.Dry fodder viz Local grasses, wheat straw, karbi andgreen fodder viz Lucerne, berseem, jowar, oats,maize, barley, sugar beets and hybrid Napier grasswas available for most of the months during kharifand rabi seasons. Readymade concentrate feed as wellas farm mixed feed using barley, dalchuri, guarkorma, groundnut cake, wheat bran and DORB weresupplied to the calves. Mineral mixture and salt wasinduced in the concentrate feed @ 2 and 1 percentrespectively. Clean drinking water was available ad-lib. Animals were vaccinated against contagiousdiseases like Hemorrhagic Septicaemia, Foot andMouth, Black Quarter, Anthrax, and Rinderpast.

Journal of Progressive Agriculture, Vol.4, No. 2: October, 2013
79
Dehorning and deworming in calves and disinfectionof sheds were done regularly.
The overall means, standard error andcoefficient of variation on the basis of periods,seasons, and parity of dam and birth weight of calfwere computed for mortality rate and its variouscomponents using conventional statistical procedure(Snedecor and Cochran, 1968). In order to overcomenon- orthogonality of data due to unequal sub-classfrequencies, least-squares technique (Harvey, 1989)was used to estimate the effect of the tangible factors.
RESULTS AND DISCUSSION
In this study 19.834 ± 1.888 percent of the totalfemale calves born died before they reached themilking herd. These results are supported by thefindings of many workers Ram and Tomar, 1989;Tomar and Ram, 1993; and Tomar and Rawal 1996.On the contrary, Ram and Tomar (1993) reportedlower and Tomar and Tripathi (1991) reported highermortality in Murrah buffalo calves up to AFC. Thefactors affecting to calf mortality are given in Table -1
The mortality rate was highest at 23.81 ±2.853per cent in 4th period and lowest at 15.37 ± 3.956 percent in 5th period. The differences between periodswere non-significant, contributing only 1.406 per centto the total variability. These results are supported bythe findings of Srivastava and Agarwala (1973), andKulkarni et al. (1994). While Katoch et al. (1993),and Tomar and Rawal (1996) reported significanteffect of periods on mortality
The mortality rate for calves born in the rainy,winter and summer season were 22.35 ± 2.27, 21.81 ±2.589 and 15.33 ± 3.541 per cent respectively.However, the differences in mortality rate due toseason were non-significant, contributing only 0.762per cent towards total variability. These results aresupported by the reports of Katoch et al. (1993),Kulkarni et al. (1994) and Roy et al. (1997). On theother hand Verma et al. (1980), Tomar and Ram(1993) and Ghosh et al. (1995) reported significanteffect of season of birth on mortality rate.
The mortality rate was highest at 23.89 ±3.079percent among the female calves born of 1st paritybuffalo and lowest at 14.50 ±2.944 among the calvesborn of buffalo of 2nd parity. The differences inmortality rate among the female calves born indifferent parities were found to be significant, afindings in agreement with the reports of Lathwal etal. (1993) in Red Sindhi cows. The mortality rate waslow among calves born from older dam’s of 7th and8th parity (4.0 and 8.8 percent) and 3rd parity (5.6percent) and high among those which were born todam’s of 2nd (20.2 percent) and 4th (20.9 percent)parity.
The least-squares means for mortality rateamong calves weighing less than 20 kg, 20-21 kg, 22-23 kg, 24-25 kg, 26-27 kg, 28-29 kg and above or 30kg groups were 16.37 ± 6.035, 21.80 ± 3.553, 24.87± 6.113, 23.38 ± 2.650, 19.92 ± 3.674, 22.04 ±3.174 and 10.43 ± 5.207 per cent respectively (Table-1). The effect of birth weight of calves on mortalityrate was found to be non-significant. Non-significanteffect of birth Weight on mortality rate was alsoreported by Verma et al. (1980), and Katoch et al.(1993). Contrary to this Kulkarni (1994), Santra andPachalag (1995) and Roy et al. (1997) reportedsignificant effect of birth weight on mortality.
The highest mortality occurred on account ofPneumonia at 24.10 per cent followed by enteritis(17.10%), Septicemia (16.79%), H.S. (4.74%),Hepatitis (3.65%), and Toxaemia (3.47%) Generaldebility (3.28%) snake bite (2.74%) Calf scour andother (6.75%) and miscellaneous (16.79%)
CONCLUSIONFrom the present study it is concluded that period
of calving and parity plays a very important role incalf mortality. The mortality was also lowest forsummer calves. Though, buffalo are seasonal calvesand maximum calving occurs between September-January, efforts should be made so that buffaloescalves during summer month by efficientmanagement.
Table -1: Least-Squares means of mortality of female calves up to AFC across different non-genetic effects.
No. of observations Mortality Mean + SE (%)Overall 455 19.834 + 1.888Period
P1 (1973-77) 64 23.38 + 3.904P2 (1978-82) 100 20.70 + 3.208P3 (1983-87) 103 15.89 + 3.239P4 (1988-92) 126 23.81 + 2.853P5 (1993-97) 62 15.37 + 3.956SeasonS1 (Monsoon) 211 22.35 + 2.270S2 (Winter) 160 21.81 + 2.589S3 (Summer) 84 15.33 + 3.541

Journal of Progressive Agriculture, Vol.4, No. 2: October, 2013
80
No. of observations Mortality Mean + SE (%)ParityL1 ( 1st) 112 23.89 + 3.079 aL2 (2nd) 127 14.50 + 2.944 bL3 (3rd & above) 216 21.10 + 2.303aBirth WeightW1 (< 20 kg) 25 16.37 + 6.035W2 ( 20 – 21 kg) 75 21.80 + 3.553W3 ( 22 – 23 kg) 24 24.87 + 6.113W4 ( 24 – 25 kg) 139 23.38 + 2.650W5( 26 – 27 kg) 70 19.92 + 3.674W6( 28 – 29 kg) 89 22.04 + 3.174W7( 30 & above kg) 33 10.43 + 5.207
Means with same superscript do not differ significantly (P < 0.05)
Table -2: Causes of mortality in female calves up to age at first calving.Cause of Mortality Percentage of calves died up to AFCPneumonia 24.10Enteritis 17.70Septicaemia 16.79H.S. 04.74Hepatitis 03.65Toxaemia 03.47General Debility 03.28Snake Bite 02.73Calf Scour and others 06.75Miscellaneous 16.79Total 100
REFERENCES
Bood, D.C., Radostits, O.M. Gay, C.C. Arundel, J.H.Ikede, B.O. and Mekenzie, R.A.B.C.1994.Vet.Med.Eighth Ed. ELBS,London.
Ghosh, S.K.; Roy, S.K.; Pyne, A.K. and Dattagupta, R.1995. Effect of yearly periodicity and age on calfmortality in west Bangal. Indian J. of Anim. Hlth.34(1):19-22.
Harvey, W.R. 1989. User’s Guide for LSMLMW andMIXMDL PC-2 version. Mixed model least-squaresand maximum likelihood computer programme.Mumford drive, Columbus, Ohio, 43220, U.S.A.
Khan,A. And Khan, M.Z. 1991. Aetiopathology ofneonantal calf mortality. J.of Islamic Acadmy Sc.4:159-165.
Katoch, S., Manuja, N.K., Thakur, Y.P. and Singh, S.1993. Factors affecting calf mortality in organizeddairy herd, Indian J. Dairy sci. 46:592-594.
Kulkarni, M.D.; Kale, K.M. and Deshmukh, V.D. 1994.Effect of birth weight and growth rate on calfmortality in crossbred calves. Indian Vet. J. 71:569-571.
Kurian, V. 1988. Experience in dairy development inIndia. Proceeding of II World buffalo congress heldat New Delhi, between 12-16 December, 1988.
Lathwal, S.S. Tomar, S.S.; Verma, G.S. and Malik,R.K. 1993. Factors affecting replacement rate in aherd of Red Sindhi cows. Indian J. Dairy Sci.46:649-352.
Martin,S.W.and Wiggin. 1973. Prenatal diseases.Am.J.Vet.Res. 34:1027-1034.
Ram, R.C. and Tomar, S. S. 1989. Quantification ofreplacement rate and its components in Murrahbuffaloes. Indian J. Dairy Sci. 42:619-621.
Ram, R.C. and Tomar, S. S. 1993. Replacement index inMurrah buffaloes. Indian J. Dairy Sci. 46(3):135-136.
Tomar, S.S. and Tripathi, V.N. 1991. Quantification ofmortality in Murrah buffalo female calves at differentages. Indian J. Dairy. Sci. 44:392-394. .
Tomar, S.S. and Ram, R.C. 1993. Factors affectingreplacement rate in a herd of Murrah buffaloes.Indian J. Dairy Sci., 46:340-342.
Tomar, S.S. and Rawal, S.C. 1996. Incidence ofinheritance or mortality and culling rates inTharparkar female calves upto maturity. Indian J.Dairy Sci., 49(10):685-688.
Srivastava, S.P. and Agarwala, O.P. 1973. Factors inaffecting mortality in crossbred female calves. IndianJ. Anim. Prodi., 4(1):25-29.
Roy, P.K.; Ghosh, A.; Pal, P.K. and Basu, S.B. 1997.Mortality pattern in Jersey X Tharparkar crossbredscalves. Indian Vet. J. 74:673-676.
Santra, A.K.; Pachalag, S.V. 1995. Studies on somefactor associated with calf mortality in Murrahbuffaloes-season, birth weight and age. Indian J.Anim. Prod. Mgnt. 11(1):58-61.
Verma, G.S.; Sadana, D.K.; Basu, S.B. and Sarma, P.A.1980. Studies on mortality in buffalo calves. Indian J.Dairy Sci. 33(1):87-90.

Journal of Progressive Agriculture, Vol.4, No. 2: October, 2013
81
Perception of women beneficiaries about home science training programmes ofKrishi Vigyan Kendra, Sriganganagar (Rajasthan)
1SEEMA CHAWLA, 1CHANDER BHAN,2D.S. BHATI AND 3B.S. SIDHU1Assistant professor, KVK (SKRAU), Sriganganagar (Rajasthan)
2 Assistant professor, KVK, Dausa (Rajasthan)3Programme Coordinator, KVK (SKRAU), Sriganganagar (Rajasthan)
Received: March, 2013Accepted: May, 2013
ABSTRACT
In agricultural history of India, the first landmark came in 1960, when the agricultural universityconcept was came into existence while the second landmark came in 1974 when the first Krishi VigyanKendra (KVK) was established by the Indian Council of Agricultural Research (ICAR) at Pondicherry inTamilnadu. The KVK has been conceived as a vocational training institution of practicing farmers,village youth, farm women and girls. The principle of training of KVK is “Learning by Doing”. The “skilltraining” and “need based training” are the two important components of KVK training programmes.The Krishi Vigyan Kendra’s are grass root level institutions designed to bridge the gap between theavailable technology and actions for achieving high production. The success of these KVK’s dependsupon the quality of its teaching and training which win the people’s self confidence and maximizingtheir inherent ability and efforts. The staff of KVK also provides free advisory services and vocationaltraining for farmers, rural youth, school dropouts and farm women. The institutional linkage with templeof learning for solving their problems may be one of the motivating factor for drawing them to the centreof training.
Key words: Krishi Vigyan Kendra, Respondents, Training programme and Women beneficiaries.
Although, KVK’s are functioning since 1974 butin literature very few efforts have been made to knowthe perception of women beneficiaries regardinghome science training programmes organized byKVK. Hence, the present study was planned withfollowing objectives:1. To study the perception of women beneficiaries
towards home science trainings organized byKVK, Sriganganagar.
2. To find out the association between independentvariables and level of perception ofbeneficiaries.
METERIALS AND METHODS
The study was conducted in Sriganganagardistrict. The KVK of Sriganganagar was workingsince 2004. Hence working about nine years in thedistrict, this KVK was appropriate to be selected asstudy area. A total sample of 180 respondents(women beneficiaries) from three villages namelySadhuwali, Birthaliawali and Kaluwala were selectedrandomly. Sixty women respondents were selectedfrom each village, who have attended the homescience trainings organized by KVK, Sriganganagarduring the last five years 2007-2012. The data werecollected with the help of pre-tested interviewschedule. After statistical analysis following findingswere revealed.
RESULTS AND DISCUSSION
Profile of the respondentsOut of total sample, 38 percent respondents were
in 25-37 years of age, had general caste (42%) andschedule caste (21%) belong to equally distributednuclear and joint families (50%) with five members inthe family (53.74%) and educated up to secondaryclass, one third of the respondents were working aslabour (34.44%) and 43.34 respondents were landless.Majority of them had no social participation(87.20%).
Perception about home science trainingsPerception of the beneficiaries were studied
through five aspects of trainings viz., trainingprograms, course content, time and duration,evaluation and supporting activities, physicalfacilities and overall usefulness of the trainingprograms. Results in Table 1 revealed thatirrespective of villages most of the beneficiaries werefound to be satisfied with the many aspects of trainingviz., training programs, course content and time andduration. In case of evaluation and supportingactivities and physical facilities, majority of thetrainees of all the villages were not found to besatisfied. Regarding overall usefulness of trainingprograms, beneficiaries of Kaluwala village wereobserved to be more satisfied (weighted mean 2.90).It was followed by village Sadhuwali (weighted mean2.60) and village Birthaliawali (weighted mean 2.00).

Journal of Progressive Agriculture, Vol.4, No. 2: October, 2013
82
Level of perceptionData in Table 2 revealed that out of total sample,
37.22 per cent beneficiaries had high level ofperception followed by medium (36.11%) and low(26.66%). When villages were taken into account, noremarkable difference was found in case of all thevillages where 41.66 and 38.33 per cent women hadhigh followed by medium (36.66 and 33.33%) andlow (21.66 and 28.33%) level of perception ,respectively.
Association between profile variable and level ofperception
A cursory look at the Table 3 revealed thatvariables like age, caste, family size, occupation andland holding of all the respondents had been found tobe significantly associated with their level ofperception about home science training programs.
CONCLUSIONFindings indicate that majority of the women
beneficiaries of Kaluwala village were found tosatisfied with all the specific aspects of the trainingprogram taken for analysis except evaluationtechniques used and supporting activities (40.00%).Whereas in case of Sadhuwali village 45.00 and 41.66per cent respondents showed their low perceptiontowards unsuitable time and duration of training andphysical facilities. In regard to Birthaliawali village,sufficient numbers of respondents were not satisfiedwith the way the training programmes were organizedfor them. Thus in the light of results it is suggestedthat training programs in KVK must be designedaccording to the needs, availability of time andduration. They must be provided proper transport,lodging and boarding facilities so that they can attendthese training programmes for upliftment of theirliving standard and self-empowerment.
Table 1. Perception of respondents regarding specific aspects of home science training programmes ofKrishi Vigyan Kendra, Sriganganagar.
TrainingAspects
Village Sadhuwali( n=60)
Village Birthaliawali( n=60)
Village Kaluwala( n=60)
High Medium Low WeightedMean*
High Medium Low WeightedMean*
High Medium Low WeightedMean*
TrainingProgramme
27(45.00)
18(30.00)
15(25.00) 2.95
27(45.00)
9(15.00)
24(40.00) 2.68
30(50.00)
24(40.00)
6(10.00) 3.01
CourseContent
24(40.00)
15(25.00)
21(35.00) 2.80
24(40.00)
27(45.00)
9(15.00) 2.50
33(55.00)
21(35.00)
6(10.00) 3.10
Time andDuration
15(25.00)
18(30.00)
27(45.00) 2.60
13(21.66)
24(40.00)
23(38.33) 2.10
39(65.00)
18(30.00)
3(5.00) 3.10
Evaluation& supportingActivities
24(40.00)
15(25.00)
21(35.00) 2.00
23(38.33)
18(30.00)
19(31.66) 1.60
15(25.00)
27(45.00)
18(30.00) 1.78
PhysicalFacilities
23(38.33)
12(20.00)
25(41.66) 1.76
19(31.66)
24(40.00)
17(28.33) 1.60
45(75.00)
9(15.00)
6(10.00) 2.06
OverallUsefulness of
trainingprogramme
21(35.00)
20(33.33)
19(31.66) 2.60
18(30.00)
18(30.00)
24(40.00) 2.00
24(40.00)
21(35.00)
15(25.00) 2.90
Table 2. Level of perception of beneficiaries.
Category
Krishi Vigyan Kendra, Sriganganagar
Village Sadhuwali(n=60)
Village Birthaliawali(n=60)
Village Kaluwala(n=60)
Total(n=180)
High 23(38.33)
19(31.66)
25(41.66)
67(37.22)
Medium 20(33.33)
23(38.33)
22(36.66)
65(36.11)
Low 17(28.33)
18(30.00)
13(21.66)
48(26.66)

Journal of Progressive Agriculture, Vol.4, No. 2: October, 2013
83
Table 3. Association between independent variables and beneficiaries level of perception about H.Sc.training programmes.Category Villages
Total(n=180)
Sadhuwali(n=60)
Birthaliawali( n=60)
Kaluwala(n=60)
d.f.
Age 16.249* 14.328* 19.134* 4 9.48Caste 11.143* 11.738* 20.852* 4 9.48Type of family 4.265 3.988 1.708 2 5.99Size of family 12.832* 16.651* 30.124* 4 9.48Education 5.991 7.444 4.568 4 9.48Occupation 21.662* 22.629* 20.625* 9 16.92Average monthly income 7.115 5.841 9.052 4 9.48Social participation 3.820 3.214 0.530 4 9.48Land holding 14.860* 15.862* 12.881* 4 9.48
REFERENCES
Chawla Seema, Bhati D.S. and Khan I.M. 2013.Empowerment of rural women through Self helpgroups. Journal of Progressive Agriculture, 4 (1)April: 139-143.
Jayanti and Mehta, S. 2002. Perception of womenbeneficiaries of different KVK’s about H.Sc. trainingprogrammes. Maharashtra J of Ext. Edu.21 (2):74-78.
Pandey, S.N. 1998. Analytical study of training programsof Krishi Vigyan Kendra. Ph. D. thesis, CCS Haryanaagricultural university, Hisar.
Singh, S. 1993. A study on altitude, knowledge and trainingneeds of farm women in Rewa district, M.P. M.Sc.Thesis, JNKKV, Jabalpur.

Journal of Progressive Agriculture, Vol.4, No. 2: October, 2013
84
Genetic divergence for grain yield in pigeon pea (CajanuscajanL. Millspaugh)germplasm
S.RAMESH KUMAR, N.R.RANGARE AND G.ESWARA REDDYDepartment of Genetics and Plant Breeding, Allahabad School of Agriculture
Sam Higginbottom Institute of Agriculture, Technology and Sciences Deemed-to-be-UniversityAllahabad-211007, Uttar Pradesh, India
Received: August, 2013Accepted: Sept., 2013
ABSTRACT
Genetic divergence of twenty seven genotypes of pigeon pea was studied for thirteen quantitativecharacters. Genetic divergence was estimated using Mahalanobis’s statistics (D2) and principalcomponent analysis. Cluster analysis revealed 27 genotypes were grouped into 6 clusters. The lineschosen from the same ecogeographic region were found scattered in different clusters which indicatedthat genetic diversity and geographic distribution were not necessarily related. The interclusterdistances were higher than the intra-cluster distance reflecting wider genetic diversity among thegenotypes of different groups. The highest inter-cluster distance was observed between cluster I &IVwhereas the highest intra-cluster distance was found in the cluster II indicated that the highly divergenttypes existed in these clusters. Days to maturity was found to be the maximum contributors towardsthe total divergence. The genotypes from these clusters may be used as potential donors for futurehybridization programme to develop early pigeon pea variety with good grain yield.
Key words: Cluster analysis, Genetic divergence, Transgressivesegregants, Pigeon pea
Pigeonpea is the second most important pulsecrop of India and grown in about 3.86 million ha areawith 2.9 million ton of production with average yieldof 7.51 q/ha accounting for 78% of the global output.In Uttar Pradesh it is being cultivated in an area of3.20 lakh ha. with 2.02 lakh ton production. In India,Pigeonpea occupies an important place in terms ofarea and production among pulses for its high proteincontent and dietary significance. Pigeonpeaproduction in world is 3.25 million ton (FAO, 2011-2012).Genetic improvement mainly depends upon theamount of genetic variability present in thepopulation. Arunachalam (1981) reported that thegreater are the chances of obtaining higher amount ofheterotic expression in F1s and broad spectrum ofvariability in the segregating generations in anyvarietal improvement programme depend on thegenetic divergence of combining parents. Hybridsshowing strong heterosis developed from the parentallines that are diverse in relatedness, ecotype,geographic origin etc. (Lin and Yuan, 1980).
Genetic diversity is a powerful tool fordetermination for genetic discrimination among thegenotypes which is used to select appropriate plantgenotype(s) for hybridization to develop high yieldingpotential variety (Bhatt, 1970). With the developmentof advanced biometrical methods such as Multivariateanalysis (Rao, 1952) based on Mahalonobis’s D2
statistics and principal component analysis (PCA), ithas become possible to quantify the magnitude ofgenetic diversity among the germplasm for theirevaluation in respect of breeding program. For thedevelopment of any genotype with desirable traits, it
is necessary to include diverged parents in crossingprogram.
MATERIALS AND METHODS
A field experiment was conducted with twenty-seven pigeon pea genotypes during kharif 2011 at theField Experimentation Centre, Department ofGenetics and Plant Breeding, Allahabad School ofAgriculture, SHIATS, Allahabad in RandomizedBlock Design (RBD) with three replications.Genotypes spaced with a spacing of 90 cm and 50 cmbetween rows and hills, respectively. Fiverepresentative hills for each genotypes in eachreplications were randomly selected to record theobservations for thirteen quantitative traits viz., Daysto initial flowering, days to flowering, plant height,number of primary branches per plant, number ofpods per cluster, number of pods per plant, biologicalyield per hill, number of grains per pod, days tomaturity, harvest index, seed index, pod length andgrain yield per hill. Two characters viz., days to 50per cent flowering and days to maturity werecomputed on plot basis. Data were utilized for D2analysis (Mahalanobis, 1936) and grouping of thegenotypes in to different clusters (Rao, 1952).
RESULTS AND DISCUSSION
The analysis of variance revealed significantdifferences among 27 genotypesfor all the charactersunder study, indicating considerable variationamongthe genotypes. On the basis of D2 valuesgenotypes were grouped into 6 clusters (Table 1).Clustering pattern indicated that cluster IV is the

Journal of Progressive Agriculture, Vol.4, No. 2: October, 2013
85
largest cluster comprising 9 out of 27 genotypes. Onthe other hand, cluster I comprised of 5 genotypes,cluster III and IV comprised of 4 genotypes each,cluster II comprised of 3 genotypes, cluster VIcomprised of 2 genotypes. The pattern of groupconstellation proved the existence of significantamount of variation.The distribution of genotypesindicated that the geographical diversity and geneticdiversity were not related and there are forces otherthan geographical separation which are responsiblefor diversity such as natural and artificial selection,exchange of breeding material, genetic drift andenvironmental variation. Similar results were reportedby Satish Kumar et al (2005), Firoz-Mahamad et al(2006) and Singh et al (2008).
In the present study the highest inter clusterdistance (13344.11) was found between clusters I andIV followed by clusters I and VI (11697.81), cluster Iand cluster V (10105.07), cluster I and cluster III(8150.83), cluster II and cluster VI (4673.51) andcluster I and cluster II (4027.49). The smallest intercluster distance (1454.23) was observed betweencluster III and cluster IV which differed mainly forthe character pods per plant.The smallest inter clusterdistance indicates less diversity between thegenotypes contained in these clusters. It indicatesclose relationship and similarity of the genotypes formost of the characters. However, these genotypes canbe undertaken for hybridization in order to exploitvariation for the specific characters for which thegenotypes of the two clusters shown markeddifference.For successful breeding program, selectionof genetically diverse parents is an important
prerequisite so as to obtain better and desirablerecombinants. Similar results were reported by Singhand Gumber (1996) and Thombre et al (2000).
The cluster mean was presented in Table 3. Itwas depicted that there was considerable difference inthe cluster mean for different characters. Genotypesof short duration were grouped in cluster I and alsoshown highest mean for pod length. Cluster IIrecorded maximum valued for number of pods percluster. Cluster III recorded maximum values for seedindex. Cluster V having desirable mean for plantheight and number of primary branches per plant.Similarly, the genotypes of cluster VII shownincreased mean values for number number of podsper plant, days to maturity, number of grains per pod,biological yield per plant, harvest index and grainyield per plant.
The utility of D2 analysis, which is a potent toolto quantify the extent of divergence in biologicalpopulations at genetic level, is further enhanced by itsapplicability to estimate the relative contribution ofthe various plant characters to genetic divergence.The selection and choice of parents mainly dependsupon contribution of characters towards divergence(Nayak et al, 2004). The more the number of timesthat each of the 13 characters appeared in first rankthe more it contributed towards diversity. The presentstudy revealed that days to maturity (39.32 %), daysto initial flowering (22.22%) and days to 50%flowering (11.97%) contributed to 73% of totaldivergence followed by plant height (9.12%) andnumber of pods per plant (8.55 %) (Table 4).
Table 1: Distribution of 27 pigeon pea genotypes into different clusters
Table 2. Intra and inter cluster distance in pigeonpea germplasm
Cluster No. No. of genotypes Genotypes includedI 5 ICPL-88039, ICPL-87091, ICPL-88034, ICPL-87, ICPL-161
II 3 ICPL-85063, ICP-8863, ICPL-84031III 4 ICPL-96061, ICPL-96058, ICPL-96053, ICPL-87119
IV 9 ICPL-332, ICPL-7035, Jaunpur local-2, Laxmi, Jaunpur local-1, M.P. local-5, Jaunpur local-4,Malaviyachamatkar, Jaunpur local-3
V 4 M.P. local-1, M.P. local-2, M.P. local-3, M.P. local-4VI 2 Narendra-1 (National check), Bahar (Local check)
Cluster I Cluster II Cluster III Cluster IV Cluster V Cluster VI
Cluster I 892.587 4027.492 8150.833 13344.11 10107.05 11697.810
Cluster II 1219.715 1814.122 4371.522 3501.248 4673.515
Cluster III 227.421 1454.232 1597.197 2754.805
Cluster IV 929.516 1615.093 2596.421
Cluster V 153.476 2260.646
Cluster VI 256.186
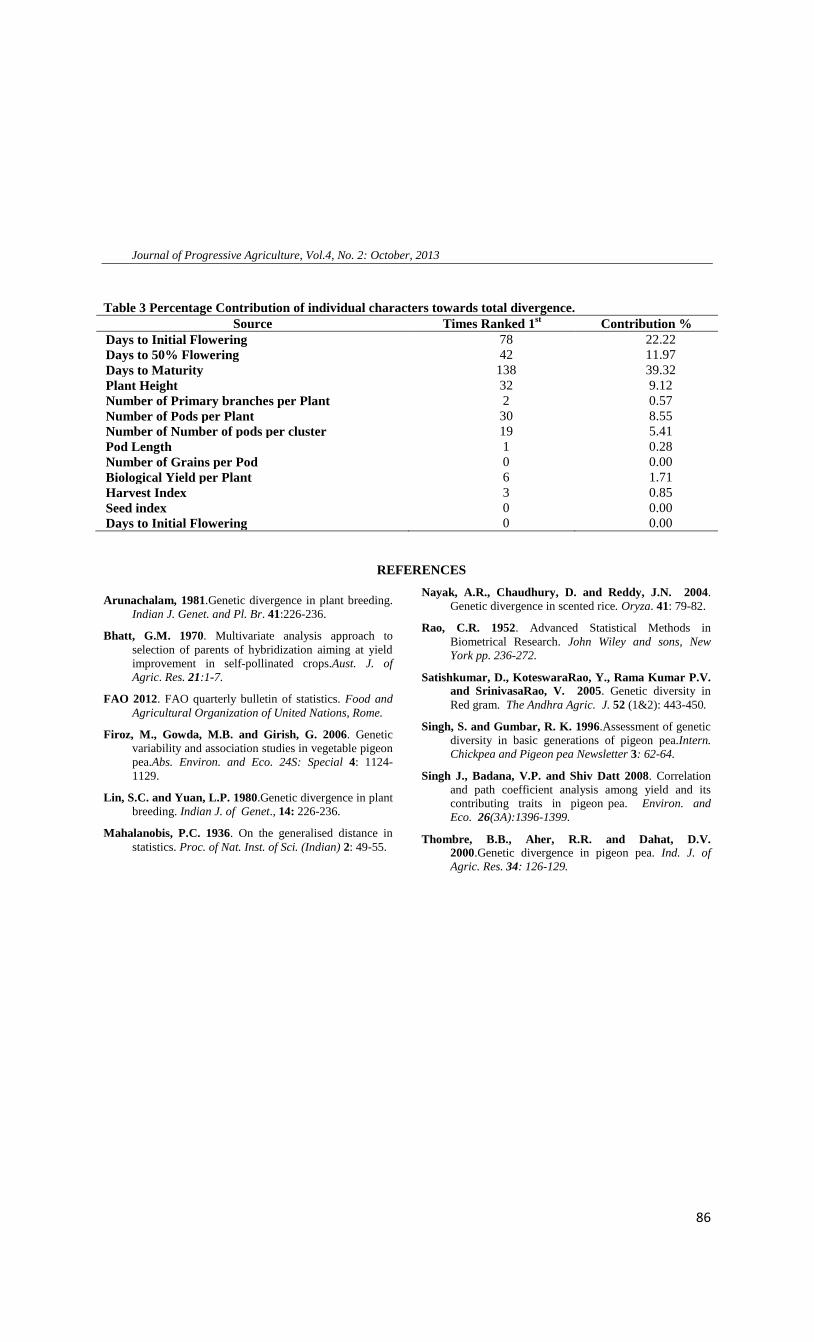
Journal of Progressive Agriculture, Vol.4, No. 2: October, 2013
86
Table 3 Percentage Contribution of individual characters towards total divergence.Source Times Ranked 1st Contribution %
Days to Initial Flowering 78 22.22Days to 50% Flowering 42 11.97Days to Maturity 138 39.32Plant Height 32 9.12Number of Primary branches per Plant 2 0.57Number of Pods per Plant 30 8.55Number of Number of pods per cluster 19 5.41Pod Length 1 0.28Number of Grains per Pod 0 0.00Biological Yield per Plant 6 1.71Harvest Index 3 0.85Seed index 0 0.00Days to Initial Flowering 0 0.00
REFERENCES
Arunachalam, 1981.Genetic divergence in plant breeding.Indian J. Genet. and Pl. Br. 41:226-236.
Bhatt, G.M. 1970. Multivariate analysis approach toselection of parents of hybridization aiming at yieldimprovement in self-pollinated crops.Aust. J. ofAgric. Res. 21:1-7.
FAO 2012. FAO quarterly bulletin of statistics. Food andAgricultural Organization of United Nations, Rome.
Firoz, M., Gowda, M.B. and Girish, G. 2006. Geneticvariability and association studies in vegetable pigeonpea.Abs. Environ. and Eco. 24S: Special 4: 1124-1129.
Lin, S.C. and Yuan, L.P. 1980.Genetic divergence in plantbreeding. Indian J. of Genet., 14: 226-236.
Mahalanobis, P.C. 1936. On the generalised distance instatistics. Proc. of Nat. Inst. of Sci. (Indian) 2: 49-55.
Nayak, A.R., Chaudhury, D. and Reddy, J.N. 2004.Genetic divergence in scented rice. Oryza. 41: 79-82.
Rao, C.R. 1952. Advanced Statistical Methods inBiometrical Research. John Wiley and sons, NewYork pp. 236-272.
Satishkumar, D., KoteswaraRao, Y., Rama Kumar P.V.and SrinivasaRao, V. 2005. Genetic diversity inRed gram. The Andhra Agric. J. 52 (1&2): 443-450.
Singh, S. and Gumbar, R. K. 1996.Assessment of geneticdiversity in basic generations of pigeon pea.Intern.Chickpea and Pigeon pea Newsletter 3: 62-64.
Singh J., Badana, V.P. and Shiv Datt 2008. Correlationand path coefficient analysis among yield and itscontributing traits in pigeon pea. Environ. andEco. 26(3A):1396-1399.
Thombre, B.B., Aher, R.R. and Dahat, D.V.2000.Genetic divergence in pigeon pea. Ind. J. ofAgric. Res. 34: 126-129.

Journal of Progressive Agriculture, Vol.4, No. 2: October, 2013
87
Influence of abiotic and biotic factors on the seasonal incidence of major sucking pests ofbrinjal
1S. OMPRAKASH, 1S.V.S. RAJU AND 2B.V. RAJKUMAR1Department of Entomology and Agricultural Zoology, IAS, BHU, Varanasi - 221005, India
2Department of Horticulture, Institute of Agricultural Sciences, BHU, Varanasi - 221005, India
Received: July, 2013Accepted: Sept., 2013
ABSTRACTField trials were conducted to study the influence of abiotic and biotic factors on the seasonal
incidence of major sucking pests of brinjal, whitefly (Bemisia tabaci) and leaf hopper (Amrascadevastans) during rabi 2010-11 and 2011-12. The incidence of whitefly population started from firstweek after transplanting in both the years and peak incidence was observed during the final week ofOctober to first week of November and decreased gradually up to crop maturity. The leaf hopperincidence was also observed during first week after transplanting in both the years and populationreached peak in fourth week of October. The major sucking pest incidence had a non-significantassociation with abiotic factors like maximum and minimum temperatures, relative humidity and rainfall.The incidence of sucking pests showed a positive and significant correlation with biotic factors likecoccinellid beetles as well as spiders.
Key words: Abiotic factors, Biotic factors, Brinjal, Seasonal incidence and Sucking pests.
Brinjal or egg plant (Solanum melongena L.)occupies a distinct place in the realm of vegetablecrops and is one of the most popular and importantvegetable crops grown in India and many parts of theworld. Brinjal features in the dishes of virtually everyhousehold in India, irrespective of food preferences,income levels or social status. Due to its versatility inuse in Indian food, brinjal is often described as the‘King of vegetables’ (Choudhary and Gaur, 2009).Based on its highest production potential andavailability of the produce to consumers, it is alsotermed as common man’s vegetable. Brinjal hasayurvedic medicinal properties, especially, whitebrinjal is said to be good for diabetic patients (Fageriaet al., 2006). In India brinjal is cultivated over an areaof 6.80 million hectares with an annual production of118.96 lakh tonnes (Anonymous, 2011). Althoughbrinjal is widely grown, income from its output is lowdue to infestation by a large number of insect pestsincluding shoot and fruit borer (L. orbonalis),whitefly (B. tabaci), leaf hopper (A. devastans),epilachina beetle (H. vigintioctopunctata), aphid (A.gossypii), lace wing bug (Urentius hystricellus) andnon insect pest, red spider mite (Tetranichusmacfurlanei) which cause severe damage and hugeloss in yield, necessitating the initiation of controlmeasures quite quickly (Vevai, 1970). Infestation dueto whitefly, leaf hopper and shoot and fruit borerresults in about 70-92 per cent loss in yield of brinjal(Rosaiah, 2001). Pest abundance and distribution,changes with various abiotic and biotic factors.Hence, it is necessary to gain thorough knowledge ofseasonal incidence of different sucking pests withrespect to abiotic and biotic factors, which helps indeveloping efficient pest management strategies byforecasting the pest incidence.
MATERIALS AND METHODS
The experiment was carried out under fieldconditions at the Vegetable Research Farm, Instituteof Agricultural Sciences, BHU, Varanasi on brinjalvariety, Punjab Barsati during rabi 2010-11 and 2011-12. For sowing the seed, nursery bed was prepared tofine tilth and raised to about 15 cm height with 1mwidth and convenient length. Seeds were sown onfirst week of August about 6 cm apart in lines andcovered with fine soil and watered immediately. Forseasonal incidence study, the transplanting ofseedlings was done in the first week of September.One month old seedlings were transplanted at twoseedlings per hill in a bulk plot of 100 m2 by adopting75 cm x 50 cm spacing. All recommendedagronomical practices were followed from time totime to raise the crop successfully.
The data were recorded on pest population inthe field of brinjal at 7 days interval from theinitiation of the pest infestation and was continued upto crop maturity. A total of 25 plants from fiverandom locations in the bulk plot at 5 plants per eachlocation were selected and tagged for recording theobservations on sucking pests and also their naturalenemies like coccinellid predatory beetles andspiders. The population of both nymphs and adults ofleaf hopper and whitefly was counted during earlymorning hours on six leaves (each 2 from top, middleand bottom canopy) from each of the 5 selected andtagged plants. Weekly data on different abiotic factorswere also recorded. Data so obtained were thensubjected to statistical analysis for correlation and testof significance.

Journal of Progressive Agriculture, Vol.4, No. 2: October, 2013
88
RESULTS AND DISCUSSION
Seasonal incidence of whitefly (B. tabaci) inrelation to weather parameters and naturalenemies
The data were recorded on the incidence ofwhitefly (B. tabaci) nymphs and adults population(Table 1). The initial incidence was observed at sevendays after transplanting with a mean population of10.14 and 24.24 per six leaves respectively during2010-11 and 2011-12. Coccinellids and spiders werenot observed during this period. The pest population
reached to peak by last week of October in 2010-11and first week of November in 2011-12 with mean of101.38 and 124.24 per six leaves respectively. Theaverage maximum and minimum temperatures duringpeak period were 28.4˚C and 16.8˚C in 2010-11,30.3˚C and 16.0˚C in 2011-12 respectively. Theaverage morning and evening relative humiditieswere 82 and 47 in 2010-11, 90 and 34 per cent in2011-12 respectively during peak period. Thepopulation of coccinellids and spiders was 2.4 and0.96, 2.60 and 1.62 per plant, respectively.
Table 1: Influence of abiotic and biotic factors on seasonal incidence of various insect pests on brinjal(2010-11).
Thereafter the pest population has declinedgradually and reached to 6.21 and 10.08 in respectiveyears. There were no coccinellids and spidersobserved at this time during both years. Theseobservations are in accordance with the studiesreported by Prasad et al. (2008) who observed that theactivity of whitefly was more during the 44th to 48th
standard week (November). Yadav et al. (2007) alsoreported the similar results.
Correlation was worked to find out the relationshipbetween whitefly population and the major weatherparameters and natural enemies. The results indicatedthat whitefly population had a positively non-significant association with maximum temperature (r= 0.258, 0.451), minimum temperature (r=0.082,0.053) and rainfall (r = 0.391, 0.346) during both theyears 2010-11 and 2011-12. Morning relativehumidity (r=0.393) and evening relative humidity (r =
0.400) recorded a positive and non-significantrelationship with whitefly population during 2010-11.These results are in conformity with the findings ofMuthukumar and Kalyanasundaram (2003). On thecontrary to this, the correlation of whitefly populationwas found to be negatively non-significant withmorning relative humidity (r= -0.299) and negativelysignificant with evening relative humidity (r= -0.789)during 2011-12. Whitefly population recorded apositive and significant association with thepopulation of coccinellids (r = 0.949, 0.915) andspiders (r = 0.789, 0.934) during both the years.These results are in accordance with Naik et al.(2009) who reported that whitefly population showednon-significant relationship with abiotic factors butsignificant relationship with abundance of coccinellidpredatory beetles and spiders.
Week ofobservation
Temperature Relative humidity Rainfall Natural enemies Whitefly (B.tabaci)
Leafhopper(A.devastans)
Maxtemp.(˚C)
Mintemp.(˚C)
MorningRH (%)
EveningRH (%)
mm Coccinellidsper plant
Spidersper plant
MeanPopulation
per sixLeaves
Meanpopulation
per sixleaves
Sep 3-9 33.2 27 84 71 24.4 0 0 0 0Sep 10-16 31.8 25.4 92 77 56.0 0 0 10.14 6.02Sep 17-23 31.0 25.3 87 74 150.20 0 0 5.28 3.14
Sep 24-30 32.7 24.0 81 56 31.80 0.12 0.10 12.74 5.88Oct 1-7 32.6 24.2 80 57 0 0.18 0.62 34.14 12.10Oct 8-14 32.7 22.2 79 51 0 0.96 0.94 51.62 26.42Oct 15-21 31.2 24.2 89 66 0 1.24 1.12 78.48 34.74Oct 22-28 31.1 19.4 79 44 17.21 1.48 1.42 98.23 52.42Oct 29-Nov 04 28.4 16.8 82 47 0 2.40 0.96 101.38 48.36Nov 5-11 30.7 19.3 82 46 0 2.21 0.82 96.13 51.94Nov 12-18 30.1 18.4 85 44 0 2.00 0.56 84.12 36.28Nov 19-25 28.0 16.5 80 40 0.6 1.62 0.24 72.86 33.14Nov 26-Dec2 25.3 15.7 81 31 5.60 0.98 0.18 68.40 21.23Dec 3-9 24.9 12.1 86 36 0 0.62 0.12 56.56 11.42Dec10-16 23.7 11.0 83 38 0 0.44 0 38.96 9.16Dec 17-23 23 7.9 79 31 305 0.14 0 24.67 5.28Dec 24-31 24.7 9.4 84 35 0 0 0 12.32 2.14Jan 1-7 14.2 7.2 89 56 0 0 0 9.78 0.94Jan 8-14 17.5 4.8 94 50 0 0 0 6.21 0.12

Journal of Progressive Agriculture, Vol.4, No. 2: October, 2013
89
Seasonal incidence of leaf hopper (A.devastans) in relation to weather parameters andnatural enemies
The incidence of A. devastans nymphs andadults population was observed during crop growingperiod of 2010-11 and 2011-12. The initial incidencewas observed at 7 days after transplanting with amean population of 6.02 and 8.08 per six leavesrespectively during 2010-11 and 2011-2012. Themaximum, minimum temeparatures were 31.8˚C,25.4˚C and 30.5˚C, 26.3˚C respectively in both theyears. Coccinellids and spiders were not observedduring this period. The pest population reached topeak by fourth week of October in 2010-11 and lastweek of October in 2011-12 with mean of 52.42 and68.24 per six leaves respectively. The averagemaximum and minimum temperatures were 31.1˚Cand 19.4˚C in 2010-11, 30.8˚C and 16.0˚C in 2011-12respectively. The average morning and eveningrelative humidities were 79 and 44 in 2010-11, 88 and33 per cent in 2011-12 respectively. The populationof coccinellids and spiders was 1.48, 1.42 and 2.48,1.84 per plant, respectively. The present study is inclose agreement with Anitha and Nandanhalli (2008)who reported that Peak leafhopper incidence wasnoticed during the last week of October. There after
the pest population has declined gradually andreached to 0.12 and 0.24 in respective years. Therewere no coccinellids and spiders observed at this timeduring both years.
The infestation of leafhopper started at sevendays after transplanting (Table 1 and 2). Correlationwas worked to find out the relationship between A.devastans population and the major weatherparameters and natural enemies (Table 3). Maximumtemperature (r = 0.373, 0.441) and minimumtemperatures (r = 0.214, 0.062) were found to bepositively and non-significantly associated with thepopulation of leaf hopper during both the years 2010-11 and 2011-12. Negative and non-significantassociation was observed for morning relativehumidity (r = -0.421, -0.418) and evening relativehumidity (r = 0.228, 0.144) with the leaf hopperpopulation during 2010-11 and 2011-12. Significantlypositive correlation was observed for leaf hopperpopulation with the population of coccinellids (r =0.950, 0.876) and spiders (r = 0.862, 0.934) duringboth the years. Similar results were obtained by Naiket al. (2009) and Meena et al. (2010). The associationof leaf hopper population was positive and non-significant with rainfall during 2010-11, while, it wasnegative and significant during 2011-12.
Table 2: Influence of abiotic and biotic factors on seasonal incidence of various insect pests on brinjal(2011-12)
Sep 3-9 32.0 26.2 88 71 42.80 0 0 0 0Sep 10-16 30.5 26.3 88 77 28.60 0 0 24.24 8.08Sep 17-23 30.7 29.0 93 74 68.80 0.43 0.14 38.32 11.72Sep 24-30 30.0 24.3 88 74 90.12 0.98 0.26 18.28 6.48Oct 1-7 31.1 23.8 84 55 0 1.10 0.64 69.72 33.36Oct 8-14 33.1 23.5 83 49 0 1.30 0.98 78.36 36.68Oct 15-21 31.7 20.4 84 38 3.60 1.93 1.22 84.20 49.96Oct 22-28 31.6 19.9 84 53 0 2.20 1.52 96.24 56.86Oct 29-Nov 04 30.8 16.0 88 33 0 2.48 1.84 115.32 68.24Nov 5-11 30.3 16.0 90 34 0 2.60 1.62 124.24 52.46Nov 12-18 29.6 16.1 90 41 0 2.80 1.28 116.28 40.24Nov 19-25 29.9 15.4 93 43 0 2.42 1.02 98.48 32.28Nov 26-Dec2 26.1 12.9 90 41 0 2.16 0.96 64.66 24.68Dec 3-9 26.8 14.0 94 49 0 1.92 0.84 52.56 17.08Dec10-16 21.5 10.3 95 64 0 1.20 0.72 36.44 8.96Dec 17-23 16.5 7.5 96 65 0 0.64 0.48 29.30 4.36Dec 24-31 22.3 7.2 91 41 0 0.22 0.23 16.66 3.88Jan 1-7 20.3 13.0 92 79 28.20 0.20 0.12 12.56 2.56Jan 8-14 18.6 10.6 89 56 0 0 0 10.08 0.24
Week ofobservation
Temperature Relative humidity Rainfall Natural enemies Whitefly (B.tabaci)
Leafhopper(A.devastans)
Maxtemp.(˚C)
Mintemp.(˚C)
MorningRH (%)
EveningRH (%)
mm Coccinellidsper plant
Spidersper plant
MeanPopulation
per sixLeaves
Meanpopulation
per sixleaves

Journal of Progressive Agriculture, Vol.4, No. 2: October, 2013
90
Table 3: Correlation coefficient of major sucking pest population with abiotic and biotic factors.
Variable whitefly leafhopper2010-11 2011-12 2010-11 2011-12
X1-maximum temperature 0.258NS 0.451NS 0.373NS 0.441NSX2-minimum temperature 0.082NS 0.053NS 0.214NS 0.062NSX3-morning relativehumidity 0.393NS -0.299NS -0.421NS -0.418NSX4-evening relative humidity 0.400NS -0.789 -0.228NS -0.144NSX5-rainfall 0.391NS 0.346NS 0.283NS -0.483 NSX6-coccinillids 0.949 0.915 0.95 0.876X7-spiders 0.789 0.934 0.862 0.934NS – Non significant
REFERENCES
Anitha, K.R. and Nandihalli, B.S. 2008. Seasonalincidence of sucking pests in okra ecosystem.Karnataka J. of Agric. Sciences. 21(1): 137-138.
Anonymous, 2011. Indian Horticulture Database.
Meena, N. K., Kanwat, P. M., Meena, A. and Sharma, J.K. 2010. Seasonal incidence of jassids and whiteflieson okra, Abelmoschus esculentus (L.) Moench insemi-arid region of Rajastan. Annals of Agri BioResearch, 15(1): 25-29.
Muthukumar, M. and Kalyanasundaram, M. 2003.Influence of abiotic factors on the incidence of majorinsect pests in brinjal (Solanum melongena L.). SouthIndian Horti. 51(1/6): 214-218.
Naik, V.C.B., Rao, P.A., Krishnayya, P.V. and Chalam,M.S.V. 2009. Seasonal incidence and management ofBemisia tabaci (Gennadius) and Amarasca bittulabiguttula (Ishida) of brinjal. Annals of PlantProtection Sciences. 17(1): 9-13.
Prasad, N.V.V.S.D., Rao, N.H.P. and Mahalakshmi,M.S. 2008. Population dynamics of major suckingpests infesting cotton and their relation to weatherparameters. J. of Cotton Research and Develop.22(1): 85-90.
Rosaiah, B. 2001. Evaluation of different botanicals againstthe pest complex of brinjal. Pestology, 25(4): 14-16.
Vevai, E.J. 1970. Know your crop, its pest problems andcontrol- 25: Brinjal. Pesticides, 4(10):26-33.
Yadav, J.B., Singh, R.S. and Tripathi, R.A. 2007. Effectof weather parameters on incidence of pest complexof okra. Annals of Plant protection scinces, 15(2):477-478.
Choudhary, B. and Gaur, K. 2009. The Development andRegulation of Bt Brinjal in India(Eggplant/Aubergine). ISAAA Brief No.38. ISAAA:Ithaca, NY.
Fageria, M.S., Choudhary, B.R. and Dhaka, R.S. 2003.Vegetable crops (3rd Ed.). Kalyani publishers, NewDelhi, pp.41-49.
Journal of Progressive Agriculture, Vol.4, No. 2: October, 2013
91
Perspectives of agroforestry: present and future facets
B. H. KITTUR1 AND S.S. BARGALI2
1Depptt. of Silviculture and Agroforestry, COF, KAU,Vellanikkara, Thrissur-6806562Department of Botany, DSB Campus, Kumaun University, Nainital, Uttarakhand-263001
Received: July, 2013Accepted: August, 2013
ABSTRACT
In order to stabilize forest degradation, the most important tasks is to systematically understandthe intensive farming systems. Hence the farming arrangement is utmost criterion for farming practices.It is important to note that imitation of natural farming ecosystems have to be advanced for thesustainable development of agriculture. Since agroforests are stereotypically less diverse than nativeforest, but they support a substantial number of plant and animal species. Agroforestry can ultimatelyusurp increased productivity, social outcomes, economic benefits, and in providing of ecological goodsand services. So the uplipment of ecosystem sustainability can be further improved through rightpolicies that promote agroforestry that can increase carbon sequestration in agro-ecosystems, therebyproviding climate change mitigation assistances. Thus, agroforestry if properly developed, have thepotential to improve socio-economically more sustainable and make the landscape more better.
Key words: Agriculture, Agroforestry, C-sequestration and Interactions.
The agro-forestry system is one of the bestknown traditional practices for livelihood, suitableland management and sustainable development. Inthis system the farmers grow various crops with treesin mixture on the same land along with animal rearing(Figure 1). To maintain the sustainable agriculturalproduction system and to alleviate forest deprivation,it is essential to systematically understand theintensive farming arrangement. For this, we chose toespouse the ‘farming arrangement’ approach. Thebasic task of approach is to develop a farming systemthat can be agreed and maintained by farmers. Thereis a shortage of empirical evidence on the factors thatinfluence crop improvements (Feder and Umali,1993; Feder et al., 1985; Lindner, 1987). Therefore,it is important to note that imitation ofnatural/traditional farming ecosystems have toadvance for the sustainable development ofagriculture (Pannell, 1999, Bargali et al., 2004, 2009).Since agroforests are stereotypically less diverse thannative forest, but they do contain a substantial numberof plant and animal species. This diversity canprovide ecological resilience to maintain thebeneficial ecological functions. In practice, in aconsensus, the sustainable agriculture is not dependeddirectly on socities power, since the forcing offarmers to adapt the chosen system is not operative.Rather we are constrained by the effectiveness of thevarious tools that can be used to encourage adoption.Although development and refinement of agriculturalinnovations are yet to be modulated in the presentsituation and for support of agroforestry research thatwill bring greater socio-economic benefit to ruralpeoples without detriment to the environment arescares (Steppler and Nair, 1987, Bargali et al.,2007,Pandey et.al., 2011). There are enormous amount ofresearch and development work has been made in
agroforestry, yet the further studies need to be carriedout for better combination of tree-crops.
Socio-economic issues concerning Agroforestrydevelopment
There is sturdy evidence that, over the world,poor farmers are dicey due to ever increasingpopulation and unsustainable management of naturalecosystems. Infact a general consensus thatagriculture has the proficiency to feed 8–10 billionpeople, but a little unanimity is how this can beachieved by ecological means. How, then, society canachieve the sustainable way of improving yield levels(Tilman, et al., 2002) for food stability and ofpreserving the quality of ecosystem services?. Soclearly, appropriate incentives are suddenly neededfor the justification. Several small land holdingfarmers are diffident to adapt the risky newtechnologies due to uncertainty of success and moreinitial investment (Bargali et al 2007). Roughly 5.5%of agricultural gross domestic product (GDP) indeveloped countries but less than 1% in developingcountries. Under this condition there should be needfor innovative public and private partnershipapproaches, which can uplift the agriculturaldevelopment all over the world. The additionalinsercumprise of increasing gap (Tewari, 2008) forthe supply of timber, pulp and paper industry, lead thesociety became further scurf, so appropriation ofagroforests have important role and can possiblysolve some of these problems.
The first step deploying for agroforestrydevelopment is lesser participatory, poor analyticaland multidisciplinary depiction at different spatialscales (Sanchez, 1995). A large investment costs maydiscourage adoption to the new agroforestry modulesand also the perceived risk may serve as obstacle in

Journal of Progressive Agriculture, Vol.4, No. 2: October, 2013
92
land management. But the barricade of long gestationperiods for the benefits to farmers with short-termplanning horizons is possible solution.
Adaption of evergreen agricultureThe deliberate use of trees allows us to glimpse
a future of more valuable farming system where,much of our annual food crop production occursunder a full canopy of trees. So the evergreenagriculture is an integrated approach of using theinteractive benefits from combining trees and shrubswith crops and/or livestock. In this way agroforestrysystems can be expedient over conservativeagricultural and forest production methods (FAO,2008). It can ultimately usurp increased productivity,social outcomes, economic benefits, and in providingof ecological goods and services. In recent times moreemphasis are given by the forest research institutesand agricultural research centers for increasinglydevelopment of programmes for standardization ofeducation on agroforestry, its research and training inall over the world. Hence there are possibilities ofdetermining of agroforestry profitability can beintricated.Towards understanding of interactions inagroforestry
Several studies have been testified on substantialincrease in crop yield in tree-crop combination, moststudies have assessed the system based on annual orbiannual trials and a great proportion of trials reportedin increased yields from hedgerow intercropping(Young, 1989). The potential of hedgerow have beeninvestigated under different agroclimatic conditionsand the consequences have been revised by manyresearchers. So the most important factor for thecompatibility of agroforestry (Tewari, 2008, Mishraet al., 2010) is the selection of suitable tree andagricultural crops combination, usually trees havingmultipurpose benefits like nitrogen fixing, fastgrowing, adaptable to harsh conditions andeconomically important trees are preferred (Bargali etal., 2009). Although sometimes trees, through theirindirect effects on the nutrition of the crop, may alsoinfluence demographic parameters of crop pests suchas natality, longevity, and mortality. This in turn maytrigger changes in the migration, host location,feeding, and demographic patterns of natural enemies.
In specific to tropical region the legumesnodulate with Rhizobium enhances the nitrogen levelin the soil, this leads to more availability of nitrogenin the understorey crops when grown underagroforestry combinations. Several trees noticed to fixatmospheric nitrogen, the important tree growneverywhere in arid, semi-arid and humid regions isthe Leucaena leucocephala fixes nitrogen upto 100-500 kg N2 ha-1 yr-1 (Steppler and Nair, 1987) and theother trees like Acacia sp. Prosopis sp. Poplus sp,etc. have also the ability to fix the atm. nitrogen inboth plant and soil system. Hence agroforestrysystems are anticipated to lead a more closed nutrient
cycling and to a soil amplification of organic matterand nutrients through root turnover and other means.Yet another factor affecting field crop productivity inmixed species system is root competition. The belowground interactions enrich soil with organic matter,microbial biomass, reduced nutrient leaching, trap thenutrients from the subsoil below the crop rooting zone(Rao et al., 1997). The importance of below-groundinteractions clearly indicated that critical differencesbetween intercropping and agroforestry are apparentlylinked owing to the methodological simplicityinvolved in the assessment of belowgroundinteractions, such studies are much limited in treebased intercropping systems. The methods, viz.,applied 32 P uptake, 13C isotope analyses, a modifiedlogarithmic spiral trenches enables a large portion ofthe root system to be clearly examined for rootactivity.Agroforestry for soil and water conservation: Wayahead
In a complementary way, trees and crops utilizethe soil water in the soil suction dynamics. The croputilize the water within the 150 cm depth beyond thisthe tree roots absorb the remaining water which flowsthrough the soil horizons. Several studies haveattempted to partition water use in agroforestrysystems by determining total community water use,using the soil-water balance approach inspite ofseveral limitations (Black and Ong, 2000). Theperennial vegetation possibly controls the soil erosionthrough the incorporation of trees in variousagroforestry systems was evaluated by Narain et al.,(1998) for runoff and soil loss. Agroforestryconceivably encompasses some of these properties ofperennial vegetation in controlling erosion fromagricultural fields. Though there might be acompetition for water between trees and crops may beunavoidable in water scarce environment unless treeshaving deep roots. Constantly changing canopyarchitecture in mixed cropping systems due to differin growth rates and canopy durations of thecomponent species results in variation in soilmoisture, soil temperature and litter deposition(Vandermeer et al., 1998). The trees in agroforestrycan provide leaves for mulching and the favorableeffect of mulching with crop or tree residues on soiland water conservation has been demonstrated undera range of circumstances.
Agroforestry for Environmental SubsistenceAgroforestry practices have the potential to
restore atmospheric carbon through enhanced growthof trees and shrubs and Carbon sequestration benefitscan also be maximized further by linking thebioenergy routes with CDM. It was estimate that over2 billion ha. of degraded land exists globally(Izaurralde et al., 2001), of which 1.5 billion ha.located within tropical lands. Restoration of thesedegraded lands can be brought through various

Journal of Progressive Agriculture, Vol.4, No. 2: October, 2013
93
afforestation and agroforestry practices to sequester8.7×109 Mg C year−1 in the tropical and 4.9 × 10⁹ MgC year−1 in the temperate aboveground C pools(Dixon and Turner, 1991).
Over the next three decades, the land usemanagement activities that augment the uptake ofCO2 or reduce its emissions have the potential toremove a significant amount of CO2 from theatmosphere. To manage carbon storage durationcarbon sink is an imperative consideration for thedesign of strong strategies, in addition policies thatpromote agroforestry will help to increasesequestration in agroecosystems, thereby providingclimate change mitigation assistances. The futurestrategies for carbon sinks can be enhanced inagroecosystems, through appropriate policies, bywhich consequently we may reduce the carbonconcentration in the atmosphere. Hence thecombining information on aboveground, time-averaged C stocks and the soil C values for theestimation of C-sequestration potentials inagroforestry systems is an obligatory (Nair et al.,2008, Arora et al., 2011). It is also noted thatsustainable agroforestry can upsurge resilienceagainst environmental change, to enhance carbonsequestration and also to generate income, which willresult in improved livelihood of small and subsistencefarmers (Buchman, 2008). Investments in landmanagement leading to increased soil fertility andcarbon sequestration can often be justified throughcontributions from agronomic productivity, nationaleconomic growth, food security and biodiversityconservation. The changing of one system of
practices to another system through land coverchanges often increase carbon storage. For instance,the conversion of arable cropland to grasslandtypically results in the increase of soil carbon andreduced carbon removal in harvested products (IPCC,2007).Future Visions for Agroforestry Development
Agroforestry if properly developed, have thepotential to improve socio-economically moresustainable and thus make the landscape morebetterment. The gap between the proper selection ofagriculture and forest crop is to be minimized throughproper evaluation and selection process foragroforestry purpose. Hence the research anddevelopment in agroforestry has to be furtherstandardized, so that biasness between the farmersand researchers could be minimized through riskevaluation. The government incentives and policiesare the main tasks for the success of intensivefarming, so the appropriate incentives are needed forsustainable farming practices that can be feasiblyassessed. Newer the-less socio-economic needs tosupport development of suitable policies, assisted byrobust country-wide scientific studies aimed at betterunderstanding the potential of agroforestry andethnoforestry for climate change mitigation andhuman well-being, provide the right incentives thatshould help to maximize the total return to the societyfor the net benefits of agriculture and forestproduction. Area specific agroforestry models, remotesensing and GIS for agroforestry evaluation andmodeling, that can strengthen the farming systemsregionally are required.
Fig.1. Traditional agroforestry system
REFERENCES
Arora, V.P.S., Bargali, S.S. and Rawat, J.S. 2011.Climate change: challenges, impacts, and role ofbiotechnology in mitigation and adaptation.Progressive Agriculture 11: 8-15.
Bargali S S, S P Singh, S K Shrivastava and S S Kolhe2007. Forestry plantations on rice bunds: Farmers’perceptions and technology adoption. InternationalRice Research Notes. 32(2): 40-41.
Bargali, S.S., Bargali, K., Singh, L., Ghosh, L. andLakhera, M.L. 2009. Acacia nilotica based
traditional agroforestry system: effect on paddy cropand management. Current Science 96(4): 581-587.
Bargali, S.S., Singh, S.P. and Pandya, K.S. 2004. Effectsof Acacia nilotica on gram crop in a traditionalagroforestry system of Chhattisgarh plains.International Journal of Ecology and EnvironmentalSciences. 30(4):363-368.
Black. C. and Ong, C. 2000. Utilisation of light and waterin tropical agriculture. Agricultural and ForestMeteorology. 104:25–47.

Journal of Progressive Agriculture, Vol.4, No. 2: October, 2013
94
Buchmann, N. 2008. Agroforestry for carbon sequestrationto improve small farmers’ livelihoods, From theNorth-South Centre Research for development.
Dixon, R.K. and Turner, D.P. 1991. The global carboncycle and climate change: Responses and feedbackfrom below-ground systems. Environ. Pollut. 73:245–261.
FAO. 2008. Climate Change and Food Security: aframework document. 93pp.
Feder, G. and Umali, D. L. 1993. The adoption ofagricultural innovations: A Review. Technol.Forecasting and Social Change 43: 215-239.
Feder, G., Just, R.J. and Zilberman, D. 1985. Adoptionof agricultural innovations in developing countries: ASurvey. Economic Development and Cultural Change33(2): 255-98.
IPCC, 2007. Agriculture in Climate Change: Mitigation.Contribution of Working Group III to the FourthAssessment Report of the Intergovernmental Panel onClimate Change [B. Metz, O.R. Davidson, P.R.Bosch, R. Dave, L.A. Meyer (eds.)], CambridgeUniversity Press, Cambridge, United Kingdom andNew York, NY, USA.
Izaurralde, R.C., Rosenberg, N. and Lal, R. 2001.Mitigation of climatic change by soil carbonsequestration: issues of science, monitoring anddegraded lands. Adv. Agron. 70: 1–75.
Lindner, R.K. 1987. Adoption and diffusion of technology:an overview. In: Champ BR, Highley, E. andRemenyi, J. V (eds.) Technological Change inPostharvest Handling and Transportation of Grains inthe Humid Tropics, 144–151 pp. ACIAR ProceedingsNo. 19.
Mishra, A., Swamy, S.L., Bargali, S.S. and Singh, A.K.2010. Tree growth, biomass and productivity of wheatunder five promising clones of Populus deltoids.International Journal of Ecology and EnvironmentalSciences. 36(2-3):167-174.
Nair, P.K.R., Kumar, B.M. and Nair, V. D. 2008.Agroforestry as a strategy for carbon sequestration. J.of Plant Nutrition and Soil Science. 172(1): 10–23.
Narain, P., Singh, R.K., Sindhwal, N.S. and Joshie, P.1998. Agroforestry for soil and water conservation inthe western Himalayan Valley Region of India.Agroforestry Systems 39: 175–189.
Pandey, K., Bargali, S.S. and Kolhe, S.S. 2011. Adoptionof technology by rural women in rice basedagroecosystem. International Rice Research Notes36: 1-4
Pannell, D.J. 1999. Social and economic challenges in thedevelopment of complex farming systems,Agroforestry Systems 45(1-3): 393–409.
Rao, M. R., Nair, P. K. R. and Ong, C. K. 1998.Biophysical interactions in tropical agroforestrysystems. Agroforestry Systems 38(1-3): 3-50.
Sanchez, P.A. 1995. Science in agroforestry. AgroforestrySystems. 30(1-2): 5-55.
Steppler, H. A. and Nair, P. K. 1987. Agroforestry adecade of development. International Council forResearch in Agroforestry Nairobi, Kenya, 325 pp.
Tewari, S. K. 2008. Farm Forestry, Agro-forestry Project,G.B. Pant University of Agriculture and Technology,Pant nagar – 263145.
Tilman, D., Cassman, K.G., Matson P.A., Naylor, R. andPolask, S. 2002. Agricultural sustainability andintensive production practices, Nature. 418: 671-677.
Vandermeer, J., Noordwijk, M., Anderson, J., Ong, C.and Perfecto, I. 1998. Global change and multi-species agroecosystems: Concepts and Issues,Agriculture. Ecosystems and Environment. 67: 1-22.
Young, A. 1989. Agroforestry for Soil Conservation, CABInternational, Walling Ford, Oxon, U K.

Journal of Progressive Agriculture, Vol.4, No. 2: October, 2013
95
Variation in leaf macro nutrient status of pear orchards of Kashmir with altitudes
M.A.DAR, J. A. WANI, M.Y.BHAT AND IMTIYAZ A.WANISher-e- Kashmir University of Agriculture sciences and Technology Kashmir
Email: [email protected]: August, 2013Accepted: Sept., 2013
ABSTRACT
The present study was undertaken to find out the concentration of macronutrients in the foliage of“Bartlett” cultivar of pear orchards in Kashmir valley located at different altitudes so that site specificnutrient management programme can be developed. The study revealed that phosphorus, potassium,calcium, magnesium and sulphur were in adequate amounts in all the orchards while nitrogen was lowin 14 per cent orchards. The nutrients under study varied significantly among the orchards in threealtitudes. The leaf magnesium showed negative relationship with all macronutrients; howeverpotassium was antagonistic only to calcium.
Key words: Altitude, leaf, Kashmir, macro-nutrient, and pear
Pear is next to apple in importance, acreage,production and varietal diversity among the temperatefruits of world. Due to its wider adaptability underdifferent agro-climatic conditions, it is grown indifferent parts of the world. The Jammu and Kashmirhas been famous for the production of large varietiesof fruits and it has very good potential for pearcultivation. Although demand of pear India isincreasing due to its nutritional and medicinalimportance but, the productivity is still very low ascompared to other European countries. There severalfactors responsible for its low productivity, one ofwhich may improper nutrient management. However,very little is known about the nutrient requirements ofpear under Jammu and Kashmir conditions. Properfruit-tree nutrition is required to maximize fruit yield,improve fruit quality, and maximize productionefficiency (Singha et al., 1982). Inadequateknowledge of the tree’s nutrient status can frequentlyresult in excessive fertilizer applications and nutrientimbalances as well as undetected deficiencies orexcesses within the tree. Foliar analysis is widelyused to determine the nutrition of perennial fruitcrops. It is considered to be a better indicator of thenutrient status of fruit trees than soil analysis (Cline,1990; Singha et al., 1982). Soil samples that arerepresentative of the entire rooting zone of the tree aredifficult to obtain. As well, tree performance hasoften been poorly correlated with soil test values(Cline, 1990). However, reference standards of foliarnutrient concentrations are required in order tointerpret foliar analysis results. No such standardsexist for pear in Jammu and Kashmir climate. Thesurvey method is commonly used to establish nutrientstandards for fruit trees. It is considered to be aquicker and more economical method for establishingfoliar nutrient ranges of fruit trees than field trials(Webster, 1991). The objective of this study was to
determine the macro nutrient concentration atdifferent altitudes so that site nutrient managementprogramme can be developed.
MATERIALS AND METHODS
The leaf samples of pear cultivar “Bartlett” werecollected from twenty one pear orchards of Kashmirvalley at different altitudes, seven each in high, midand low altitudes. The sampling was done byfollowing the sampling procedure outlined byChapman (1964). The leaf samples were washed withtap water to make dust and dirt free. Then sampleswere dipped in dilute Hcl followed by furtherwashing with single and double distilled water. Thesamples were then air dried on filter paper followedby oven drying at 60± 50C for 24 hours. The leafnitrogen was estimated by Micro-Kjeldahl’sdistillation method as described by Jackson (1973).Phosphorus was determined by vanadomolybedophosphoric acid yellow colour method out lined byJackson (1973). Potassium in the extract wasdetermined on flame photometer described byJackson (1973). Calcium and magnesium wereestimated by versenate titration method given byJackson (1973). Sulphur in the extract wasdetermined by turbidity method given by Chesnin andYien (1951). The leaf nutrient status was evaluated onthe basis of critical concentrations reported byVanden- Ende and Leece (1975) presented in table -1.
RESULTS AND DISCUSSION
Analysis of leaf samples (Table-2) revealed thatnitrogen content in the leaves of “Bartlett” cultivarsranged from 2.44 to 2.68, 2.32 to 2.58 and 2.12 to2.54 percent with mean value of 2.55, 2.41 and 2.29per cent in pear orchards of high, mid and lowaltitudes respectively. The concentration of leafphosphorus in high, mid and low altitude orchards
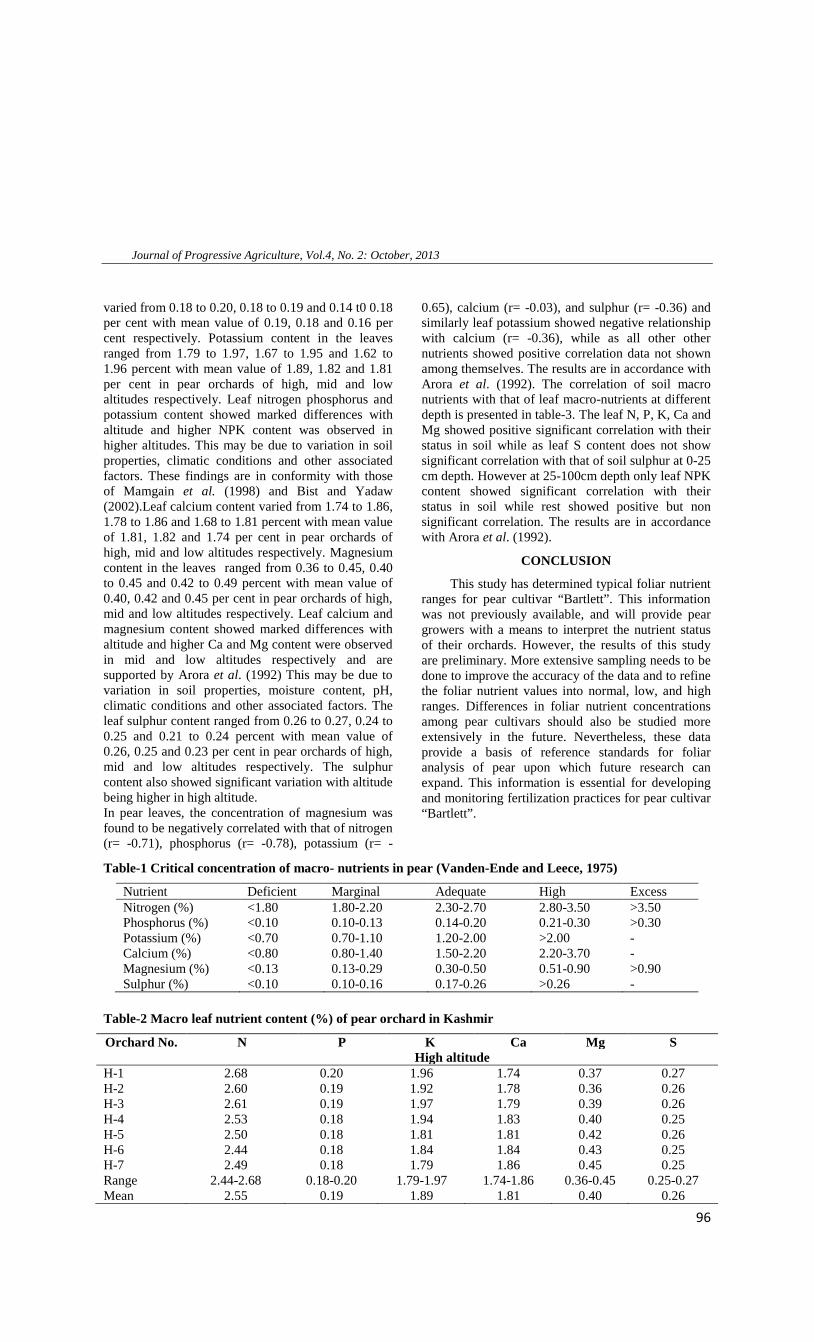
Journal of Progressive Agriculture, Vol.4, No. 2: October, 2013
96
varied from 0.18 to 0.20, 0.18 to 0.19 and 0.14 t0 0.18per cent with mean value of 0.19, 0.18 and 0.16 percent respectively. Potassium content in the leavesranged from 1.79 to 1.97, 1.67 to 1.95 and 1.62 to1.96 percent with mean value of 1.89, 1.82 and 1.81per cent in pear orchards of high, mid and lowaltitudes respectively. Leaf nitrogen phosphorus andpotassium content showed marked differences withaltitude and higher NPK content was observed inhigher altitudes. This may be due to variation in soilproperties, climatic conditions and other associatedfactors. These findings are in conformity with thoseof Mamgain et al. (1998) and Bist and Yadaw(2002).Leaf calcium content varied from 1.74 to 1.86,1.78 to 1.86 and 1.68 to 1.81 percent with mean valueof 1.81, 1.82 and 1.74 per cent in pear orchards ofhigh, mid and low altitudes respectively. Magnesiumcontent in the leaves ranged from 0.36 to 0.45, 0.40to 0.45 and 0.42 to 0.49 percent with mean value of0.40, 0.42 and 0.45 per cent in pear orchards of high,mid and low altitudes respectively. Leaf calcium andmagnesium content showed marked differences withaltitude and higher Ca and Mg content were observedin mid and low altitudes respectively and aresupported by Arora et al. (1992) This may be due tovariation in soil properties, moisture content, pH,climatic conditions and other associated factors. Theleaf sulphur content ranged from 0.26 to 0.27, 0.24 to0.25 and 0.21 to 0.24 percent with mean value of0.26, 0.25 and 0.23 per cent in pear orchards of high,mid and low altitudes respectively. The sulphurcontent also showed significant variation with altitudebeing higher in high altitude.In pear leaves, the concentration of magnesium wasfound to be negatively correlated with that of nitrogen(r= -0.71), phosphorus (r= -0.78), potassium (r= -
0.65), calcium (r= -0.03), and sulphur (r= -0.36) andsimilarly leaf potassium showed negative relationshipwith calcium (r= -0.36), while as all other othernutrients showed positive correlation data not shownamong themselves. The results are in accordance withArora et al. (1992). The correlation of soil macronutrients with that of leaf macro-nutrients at differentdepth is presented in table-3. The leaf N, P, K, Ca andMg showed positive significant correlation with theirstatus in soil while as leaf S content does not showsignificant correlation with that of soil sulphur at 0-25cm depth. However at 25-100cm depth only leaf NPKcontent showed significant correlation with theirstatus in soil while rest showed positive but nonsignificant correlation. The results are in accordancewith Arora et al. (1992).
CONCLUSION
This study has determined typical foliar nutrientranges for pear cultivar “Bartlett”. This informationwas not previously available, and will provide peargrowers with a means to interpret the nutrient statusof their orchards. However, the results of this studyare preliminary. More extensive sampling needs to bedone to improve the accuracy of the data and to refinethe foliar nutrient values into normal, low, and highranges. Differences in foliar nutrient concentrationsamong pear cultivars should also be studied moreextensively in the future. Nevertheless, these dataprovide a basis of reference standards for foliaranalysis of pear upon which future research canexpand. This information is essential for developingand monitoring fertilization practices for pear cultivar“Bartlett”.
Table-1 Critical concentration of macro- nutrients in pear (Vanden-Ende and Leece, 1975)
Nutrient Deficient Marginal Adequate High ExcessNitrogen (%) <1.80 1.80-2.20 2.30-2.70 2.80-3.50 >3.50Phosphorus (%) <0.10 0.10-0.13 0.14-0.20 0.21-0.30 >0.30Potassium (%) <0.70 0.70-1.10 1.20-2.00 >2.00 -Calcium (%) <0.80 0.80-1.40 1.50-2.20 2.20-3.70 -Magnesium (%) <0.13 0.13-0.29 0.30-0.50 0.51-0.90 >0.90Sulphur (%) <0.10 0.10-0.16 0.17-0.26 >0.26 -
Table-2 Macro leaf nutrient content (%) of pear orchard in Kashmir
Orchard No. N P K Ca Mg SHigh altitude
H-1 2.68 0.20 1.96 1.74 0.37 0.27H-2 2.60 0.19 1.92 1.78 0.36 0.26H-3 2.61 0.19 1.97 1.79 0.39 0.26H-4 2.53 0.18 1.94 1.83 0.40 0.25H-5 2.50 0.18 1.81 1.81 0.42 0.26H-6 2.44 0.18 1.84 1.84 0.43 0.25H-7 2.49 0.18 1.79 1.86 0.45 0.25Range 2.44-2.68 0.18-0.20 1.79-1.97 1.74-1.86 0.36-0.45 0.25-0.27Mean 2.55 0.19 1.89 1.81 0.40 0.26

Journal of Progressive Agriculture, Vol.4, No. 2: October, 2013
97
Orchard No. N P K Ca Mg SHigh altitude
Mid altitudeM-1 2.58 0.19 1.95 1.80 0.41 0.25M-2 2.40 0.18 1.78 1.78 0.42 0.25M-3 2.41 0.18 1.82 1.82 0.40 0.25M-4 2.38 0.18 1.86 1.81 0.44 0.24M-5 2.35 0.18 1.74 1.83 0.45 0.24M-6 2.32 0.18 1.67 1.85 0.43 0.24M-7 2.42 0.18 1.89 1.86 0.41 0.24Range 2.32-2.58 0.18-0.19 1.67-1.95 1.78-1.86 0.40-0.45 0.24-0.25Mean 2.41 0.18 1.82 1.82 0.42 0.25Low altitudeL-1 2.54 0.17 1.95 1.70 0.45 0.24L-2 2.28 0.17 1.88 1.68 0.43 0.23L-3 2.36 0.17 1.96 1.71 0.44 0.22L-4 2.21 0.16 1.82 1.73 0.42 0.22L-5 2.34 0.16 1.77 1.75 0.49 0.22L-6 2.16 0.15 1.69 1.78 0.47 0.22L-7 2.12 0.14 1.62 1.81 0.48 0.22Range 2.12-2.54 0.14-0.17 1.62-1.96 1.68-1.81 0.42-0.49 0.22-
0.24Mean 2.29 0.16 1.81 1.74 0.45 0.23LSD altitude(p=0.05)
0.07 0.007 0.08 0.02 0.02 0.003
±SED 0.03 0.003 0.04 0.01 0.01 0.01
Table-3 correlation of soil macro nutrients with that of leaf macro-nutrients at different depth
N P K Ca Mg S0-25cm 0.393* 0.835* 0.932* 0.504* 0.457* 0.28625-100cm 0.824* 0.659* 0.553* 0.248 0.231 0.347
*Significance at 5% level.REFERENCES
Arora, C L, Brar, M S and Dhatt, A S 1992. Secondaryand micronutrient status of pear orchards inPunjab. Indian journal of horticulture 49 (2): 150-154.
Bist , L D and Yadav, A 2000. long term effect of nitrogenin Babugosha pear. Progressive horticulture 32 (1):1-9.
Chapman, H D 1964. Suggested foliar sampling andhandling techniques for determing the nutrient statusof some field, horticultural and plantation crops.Indian journal of horticulture 21 (2): 97-119.
Chesnin ,L and Yien, C H. 1951. turbidimetricdetermination of Sulphur. Proceedings of soilScience society of America 15, 149-151.
Cline, R A 1990. Thirty years of diagnosing nutritionalstatus of deciduous orchards and vineyards byleaf analyses in Ontario, Canada. Acta Horticulturae274: 107–112.
Jackson,M L 1973. Soil Chemical Analysis. 2nd edition.Printice Hall of India. New Delhi, pp 498.
Mamgain,S, Verma, H S and Kumar, J 1998.Relationship between fruit yield and foliar and soilnutrient status of apple. Indian journal of horticulture55(3): 226-231.
Singha, S, Auxt T L, Blizzard S H, and Townsend E C.1982. A survey of the nutritional status of WestVirginia apple orchards, Bulletin No. 681. Morgantown,W.V.:West Virginia University Agricultural andForestry Experiment Station.
Vanden-Ende, B. and Leecee, D R 1975. Leaf analysis forpear: development of standards and the nutritionalstatus of orchards in the Goulburn valley andMurrumbidgee Irrigation areas. Australian journal ofExperimental Agriculture and Animal Husbandry 15;129-135.
Webster, D H 1991. Role of field trials in development andrefinement of soil and tissue diagnostic criteria. ActaHorticulturae 274: 509–513.

Journal of Progressive Agriculture, Vol.4, No. 2: October, 2013
98
Performance and genetic variability in eggplant germplasm
S. PRABAKARAN1, S.BALAKRISHNAN1, S. RAMESH KUMAR2, T. ARUMUGAM1 ANDV.PREMALAKSHMI1
1 Department of Horticulture, AC&RA, TNAU, Madurai-625 104, Tamil Nadu, India2 Department of Horticulture, VIA, Manakkadavu, Pollachi-642 103, TNAU, Tamil Nadu, India
Received: July, 2013Accepted: Sept, 2013
ABSTRACT
Eggplant (Solanum melongena L.) genotypes are different in color, shape, size and taste from thehybrids which are available in the market. The introduction and exploitation of traditional eggplantlandraces/genotypes can increase biodiversity of this crop. This project evaluated 33 eggplantgenotypes (mainly of Indian origin) to identify genetically divergent local genotypes for high fruit yieldand desirable quality traits. The highest fruit yield was for genotype EP 27. Maximum ascorbic acidcontent was in genotype Keerikai. Genotypes Palamedu Local and EP 3 had minimum little leafincidence. A relatively high estimate of phenotypic coefficient of variation and genotypic coefficient ofvariation occurred for number of primary branches per plant, internodal length, leaf area index, numberof long styled flowers per plant, fruit length, number of fruit per plant, average fruit weight, fruit yield perplant, total number of harvests, little leaf incidence and fruit borer infestation. High heritability, coupledwith high genetic advance as percent of mean, occurred for characters plant height, number of primarybranches per plant, days to first flowering, leaf area index, internodal length, number of long styledflowers per plant, fruit length, fruit width, average fruit weight, number of fruit per plant, fruit yield perplant, ascorbic acid content, total phenols content, little leaf incidence and fruit borer infestation,indicating these traits are governed by additive genes. Selection among genotypes can increaseimprovement in fruit yield and component characters.
Key words: screening, multivariate analysis, Solanum melongena, selection parameters.
Eggplant (Solanum melongena L.) is animportant vegetable crop grown in various macro-environments (EGGNET, 2005; Lawande andChavan, 1998). Even though self-pollinated, a widerange of variation exists in the morphologicalcharacters plant type, flower and fruit characters. Ineggplant, pedigree method of breeding is generallyadopted for crop improvement (Chen et al., 2001). Forbreeding programs information on the nature andmagnitude of variability and association of plantcharacters is useful as a basis for selection of desirableparents (Sherly, 2007). In crop improvement, informationon the range of variability present in quantitative characteris of great importance as the success of phenotypicselection depends upon the range of genetic variability inthe population (Prakash et al., 1990).
Evolving superior genotypes would be effectivewhen existing variability in the chosen material is wide.The variability for any character is the result of interactionof hereditary effects of concerned genes and the influenceof environment. It is necessary to partition overallphenotypic variability into heritable and non-heritablecomponents to have an effective selection for superiorgenotypes (Prabhu, 2004). Estimation of coefficient ofvariation helps to assess variability in the population.Heritable variation can be effectively used with greaterdegree of accuracy when heritability is studied inconjunction with genetic advance. Thorough evaluationof genotypes is needed to understand performance of
genotypes for yield and yield attributing characters sopromising genotypes can be identified. Wellperforming genotypes can be released as a variety, orput to further use as a breeding line. A comprehensiveknowledge on genetic parameters is indispensable forcrop improvement. The present investigation wasundertaken in eggplant to: i) identify high yieldinglocal types with earliness and desirable qualities; ii)assess pest and disease tolerance among local types ofeggplant, and iii) determine the nature and magnitudeof variation among local types for growth and yieldcharacters.
MATERIALS AND METHODS
The experiment was conducted during the rainyseason (June to October) in 2009 and 2010 atCollege Orchard, Agricultural College and ResearchInstitute, Madurai, Tamil Nadu, India, situated at9°5'N latitude and 78°5'E longitude at an elevation of147 m above MSL. Thirty-three indigenous eggplantland race germplasm were collected from in, andaround, Tamil Nadu state with a wide range ofdiversity and variability and evaluated under fieldconditions for yield, quality and other traits (Table 1).
Nursery and cultivation aspects:Seedlings were raised in raised nursery beds and
precautionary measures were taken to avoid incidenceof damping off by drenching 0.1% Carbendaziem.Seedlings were sprayed with systemic insecticide to

Journal of Progressive Agriculture, Vol.4, No. 2: October, 2013
99
control sucking pests. The eggplantlandraces/germplasm were arranged in a RandomizedComplete Block Design with three replications. Theexperimental plot for seedling transplantation wasbrought to fine tilth by ploughing and harrowing.Cow manure at the rate of 25 tonnes per ha wasapplied 20 days before transplanting. Thirty-five daysold seedlings were transplanted with therecommended spacing of 60×60 cm to the main fieldduring May 2011. Each cross consisted of 60 plantswhich were transplanted into a well drained loamysoil. Cultural operations were per the TNAU CropProduction Guide, 2005, under irrigation.
Observations were recorded from randomlyselected plants in each replication. Data wererecorded for plant height, number of primarybranches, days to first flowering, leaf area index,intermodal length, number of long styled flowers perplant, fruit length, fruit width, fruit circumference,calyx length, fruit pedicel length, shoot borerinfestation, fruit borer infestation, little leaf incidence,ascorbic acid content, total phenols content, numberof fruit per plant, average fruit weight, and fruit yield
per plant to estimate the genetic parameters. Ascorbicacid content was estimated by a volumetric method(AOAC, 2001). The Folin-Ciocalteau reagent wasused to estimate total phenols (Bray and Thrope,1954). Selections were made in eggplant genotypesbased on fruit shape, color, size and fruit yield perplant. Superior plants were selected and selfed. Theseed were collected from selfed fruit and stored forfurther breeding.
Data analysis:The assumption of null hypothesis was tested for
differences among genotypes (Panse and Sukhatme,1967). Genotypic and phenotypic coefficient ofvariation were calculated using the formulaesuggested by Burton (1952). Broad sense heritabilitywas calculated as per Lush (1949) and geneticadvance was estimated by the method suggested byJohnson et al. (1955). Categorization of GCV, PCVand GA were done as per Sivasubramanian andMenon (1973) and heritability was categorized assuggested by Robinson et al. (1949). Statisticalanalyses were carried out using GENRES software.
Table 1. Salient features of different local genotypes of eggplant.Name of Local type Calyx spinyness Fruit shape Fruit colorKariapatty Local Spiny Round GreenSedapatty Local (Ramakkai Blue) Spiny Round BlueSedapatty Local (Ramakkai Green) Spiny Oval Purplish greenAlavayal Local Spiny Round BluePalamedu Local Spiny Round Light blueMelur Local Spiny Round PurpleKallampatty Local Non spiny Round PurpleAlagarkovil Local Non spiny Round GreenSingampunari Local 1 Spiny Round GreenSingampunari Local 2 Spiny Round BlueVeerakkal Local (Sempatty Authur) Spiny Oblong Light greenKeerikai Spiny Oblong GreenNilakottai Local Non spiny Oblong Dark greenSM 1 Spiny Round GreenSM 2 Spiny Round Whitish blueSM 3 Spiny Oblong Whitish blueSM 4 Spiny Round GreenSM 5 Non spiny Round GreenEP 3 Spiny Round BlueEP 4 Spiny Round BlueEP 5 Spiny Round BlueEP 7 Non spiny Round WhiteEP 9 Spiny Round PurpleEP 10 Non spiny Round PurpleEP11 Non spiny Round PurpleEP 17 Spiny Round PurpleEP 20 Non spiny Round PurpleEP 21 Non spiny Round BlueEP 23 Non spiny Round BlueEP 27 Spiny Round BlueEP 28 Non spiny Round BlueEP 29 Spiny Long PurpleEP 30 Non spiny Round Blue

Journal of Progressive Agriculture, Vol.4, No. 2: October, 2013
100
Table 2. Analysis of variance for yield and quality charactersSource df X1a X2 X3 X4 X5 X6 X7 X8 X9 X10
Replication1 4.306 0.310 60.134 6.7538 1.359 3.739 0.117
0.384
1.152
2.781
Genotypes32
305.19**
7.850**
13.404**
6876.0**
256.80**
88.864**
4.128**
1.060 **
9.898 **
0.407**
Error32 4.283 0.119 1.230 2.163 3.718 2.325 0.640
0.204
2.918
0.138
Source df X11 X12 X13 X14 X15 X16 X17 X18 X19Replication
1 1.046 6.40 3.892 -0.0023 -0.129 4.208 0.293 1.227 0.026
Genotypes32 0.439**
782.90**
111.83**
4.486**4014.2*
*58.314*
*160.85*
*205.93
**0.058*
*Error 32 0.222 2.880 4.610 0.0004 0.0060 19.944 36.066 53.272 0.014** Significant at 1% level, ANOVA.a X1 = Plant height; X2 = Number of primary branches per plant; X3 = Days to first flowering; X4 = Leaf area index; X5 =Internodal length; X6 = Number of long styled flowers per plant; X7 = Fruit length; X8 = Fruit width; X9 = Fruitcircumference; X10 = Calyx length;X11 = Fruit pedicle length; X12 = Average fruit weight; X13 = Number of fruit per plant;X14 = Ascorbic acid content; X15 = Total phenols content; X16 = Little leaf disease incidence; X17 = Fruit borer infestation;X 18 = Total numbers of harvests; X19 = Fruit yield pert plant.
Table 3. Mean performance of local genotypes of eggplant for growth parameters.
Name of the local typePlant height
(cm)Number of primary
branches/plant
Days to firstflowering
(days)
Leaf areaindex
Internodallength (cm)
Kariapatty Local 145.35* 8.03 81.50* 145.28* 5.53*Sedapatty Local (Ramakkai Blue) 119.13 10.90* 81.50* 122.92 7.70*Sedapatty Local (Ramakkai Green) 124.12 10.10* 78.50* 116.09 10.34Alavayal Local 149.97* 7.94 78.50* 108.37 9.17*Palamedu Local 146.65* 5.49 80.00* 153.29* 9.72Melur Local 122.50 8.06 78.50* 93.40 9.17*Kallampatty Local 125.78 8.18 78.00* 100.67 7.86*Alagarkovil Local 140.73* 7.59 77.00* 96.05 9.41*Singampunari Local 1 120.61 6.53 77.00* 97.50 9.44*Singampunari Local 2 117.44 7.65 77.50* 76.54 10.71Veerakkal Local (Sempatty Authur) 112.56 7.73 82.00* 85.82 8.64*Keerikai 133.50* 10.12* 75.00* 107.31 7.69*Nilakottai Local 125.73 9.53* 81.00* 70.22 6.65*SM 1 125.36 10.83* 77.00* 94.74 6.27*SM 2 100.74 10.34* 76.50* 91.51 6.89*SM 3 113.64 10.94* 81.00* 95.17 5.62*SM 4 121.17 10.17* 78.50* 96.18 6.63*SM 5 116.13 9.33* 78.00* 104.83 6.49*EP 3 144.44* 5.68 83.00 201.97* 12.37EP 4 131.92* 5.75 82.00* 186.39* 8.54*EP 5 116.43 7.63 82.00* 133.53* 11.09EP 7 118.95 6.76 81.50* 79.73 9.20*EP 9 141.21* 4.55 82.50* 180.59* 13.09EP 10 134.59* 5.12 82.50* 272.80* 12.51EP11 121.81 4.94 81.50* 311.81* 8.84*EP 17 132.19* 4.75 82.50* 141.20* 10.22EP 20 142.12* 5.89 84.00 248.49* 11.73EP 21 143.74* 5.57 84.00 189.10* 9.45*EP 23 104.71 6.98 84.00 102.00 6.32*EP 27 128.81 6.20 82.00* 82.14 7.55*EP 28 136.53* 7.55 85.00 106.61 8.76*EP 29 129.62 5.35 82.50* 137.13* 10.43EP 30 121.48 6.95 81.50* 93.89 9.09*Mean 127.56 7.55 80.53 131.39 8.88SEd 2.070 0.346 1.109 1.471 0.341CD (P =0.05) 4.216 0.704 2.259 2.996 0.694*Significant at 5% level

Journal of Progressive Agriculture, Vol.4, No. 2: October, 2013
101
Table 4. Mean performance of local genotypes of eggplant for yield attributesName of the local type Number of long styled
flowers per plantFruit
length (cm)Fruit width
(cm)Fruit
circumference(cm)
Calyxlength (cm)
Kariapatty Local 27.5 6.52 4.69 13.98 3.09Sedapatty Local (Ramakkai Blue) 26.92 6.90 4.19 14.19 3.49Sedapatty Local (Ramakkai Green) 22.4 6.55 4.27 13.71 3.06Alavayal Local 23.74 6.61 4.72 14.95 3.55Palamedu Local 26.8 6.71 5.30 18.61 3.21Melur Local 25.43 7.09 5.03 15.03 3.87Kallampatty Local 20.2 6.55 5.05 16.82 3.85Alagarkovil Local 18.77 6.80 4.50 14.55 2.90Singampunari Local 1 29.2 6.02 4.18 14.00 3.24Singampunari Local 2 32.17* 5.77 4.57 13.95 3.70Veerakkal Local (Sempatty Authur) 36.8* 9.98* 3.25 10.39 3.44Keerikai 34.12 7.68 4.08 14.41 4.19*Nilakottai Local 27.2 7.54 4.34 14.73 2.97SM 1 25.98 7.19 4.35 13.62 2.98SM 2 32.14* 6.88 4.60 14.80 2.78SM 3 31.79* 7.10 5.01 14.94 3.24SM 4 21.2 7.76 4.17 13.47 3.05SM 5 18.46 7.00 4.46 14.88 3.33EP 3 23.2 7.34 6.29* 18.41 2.90EP 4 21.79 9.96* 6.72* 20.31* 3.52EP 5 20.2 5.32 5.66 16.07 3.59EP 7 19.33 5.77 5.46 17.40 3.01EP 9 26.6 7.31 5.28 17.77 3.70EP 10 24.33 7.42 5.52 16.27 3.77EP11 16.8 6.97 4.94 16.83 3.97EP 17 16 6.95 5.38 18.50 3.73EP 20 20.8 8.89 6.01* 19.40* 3.86EP 21 18.84 7.52 5.34 17.71 4.39*EP 23 33.6* 9.01* 6.04* 19.95* 3.38EP 27 31.18 6.00 4.66 17.24 2.33EP 28 22.5 8.50 5.55 17.56 3.26EP 29 26.86 12.64* 4.72 14.26 3.27EP 30 30.2 6.61 4.58 14.76 2.73Mean 28.27 7.36 4.94 15.87 3.38SEd 1.525 0.800 0.453 1.708 0.371CD (P =0.05) 3.106 1.630 0.922 3.480 0.757
*Significant at 5% level
RESULTS AND DISCUSSION
Evaluation of GenotypesThe success of crop improvement lies in
selection of suitable parents. While evaluatinggenotypes, high mean value is considered anacceptable procedure. The 33 eggplant genotypesassembled from different geographical locations wereevaluated for 19 characters and given scores based ontheir significance over the general mean for all 19characters. Genotypes affected all traits (Table 2).Ananthalakshmi (2001) and Preneetha (2002)reported similar results in eggplant.
Based on Mean PerformanceGenotype Alavayal Local was tallest (Tables 3,
4, 5 and 6). 'SM 3' had more branches followed by'Sedapatty Local' ('Ramakkai blue'), 'SM 1', 'SM 2','Sedapatty Local' ('Ramakkai green'). Genotypes orvarieties with high yield and earliness are preferred.Genotype Keerikai had the earliest flowering. GenotypesSM 2, Alagarkovil Local, Singampunari Local 1, SM1, also had early flowering. Patel et al. (2004) reportedsimilar trend of earliness. Long fruit occurred ingenotype EP 29 followed by Veerakkal Local(Sempatty Authur), EP 4, and EP 23. Patil et al.
(2001), Preneetha (2002) and Thangamani (2003) alsoreported the importance of fruit length in eggplant.
Greater fruit circumference was recorded in roundtype fruit in genotype EP 4, followed by EP 23, EP 20.Number of fruit per plant is the most important criterion foryield contributing charactersy. Genotype SM 5 was thebest performing genotype followed by the genotypes EP30, EP 28, EP 27, EP 23, and Alagarkovil Local foryield attributes. The highest fruit weight occurred ingenotype EP 11, while the lowest was in 'KariapattyLocal'. Smaller size eggplant fruit are preferred by someand genotypes or varieties with lower fruit weight like SM5, Singampunari Local 2, Veerakkal Local (SempattyAuthur), Nilakottai Local, could be accomplished.
Genotypes EP 27 and EP 3 had the highest yield perplant., and 'Veerakkal Local' ('Sempatty Authur') was least.Sridhar et al. (2001) and Preneetha (2002) obtained similarresults of round type with high marketable fruit yield. Totalnumber of harvest contributes to yield in eggplant.Seventeen genotypes had 11 harvests, and SingampunariLocal 1, EP 9 had in 8.5 harvests.
Quality is an important factor in vegetables.Generally, higher ascorbic acid content wouldincrease nutritive value of fruit, which would help

Journal of Progressive Agriculture, Vol.4, No. 2: October, 2013
102
in retention of color and flavor (Sasikumar,1999). The genotype Keerikai had higher ascorbicacid content, followed by 'Kallampatty Local', 'SM 2','SM 3', 'SM 4', and 'Singampunari Local 1'. Totalphenols affect resistance in eggplant, for the pest fruitborer (Preneetha, 2002). High total phenols content ingenotype EP 28 had the highest for phenol contentfollowed by genotypes EP 17, EP 11, EP 4; EP 9 had alow incidence of fruit borer. Genotype EP 4 was adjudgedbest since it had superior performance for 10 of 19characters: plant height, days to first flowering, leaf area
index, internodal length, fruit length, fruit width, fruitcircumference, average fruit weight, total phenol content,fruit borer infestation, and disease incidence. The genotypesKariapatty Local, Alagarkovil Local, SM 5, EP 3, EP 9, EP20, EP 21, EP 23, were superior for 8 characters.Genotypes Alavayal Local, Kallampatty Local,Keerikai, Veerakkal Local (Sempatty Authur),Palamedu Local, SM 1, EP 10, EP 11, EP 17, EP 28,and EP 29 were superior for 7 characters. Thesegenotypes could be utilized for further breeding forimprovement of fruit yield.
Table 5. Mean performance of local genotypes of eggplant for yield attributes.
Name of the local typeFruit pedicellength (cm)
Number of fruitper plant
Averagefruit
weight (g)
Fruit yieldper plant
(kg)
Totalnumber of
harvestKariapatty Local 4.29 30.05* 29.86 0.90 12.5Sedapatty Local (Ramakkai Blue) 5.12 22.38 43.76 0.98 9.5Sedapatty Local (Ramakkai Green) 4.18 27.87 43.65 1.22 11Alavayal Local 5.26 17.88 74.35* 1.33 13.5Palamedu Local 5.50 25.94 58.26 1.51* 9.5Melur Local 4.95 30.48* 43.88 1.34 14Kallampatty Local 4.04 21.52 59.65* 1.28 11.5Alagarkovil Local 4.45 32.38* 34.00 1.10 11Singampunari Local 1 4.20 21.63 38.11 0.82 8.5Singampunari Local 2 4.60 26.20 32.31 0.85 10.5Veerakkal Local (Sempatty Authur) 5.26 23.95 31.87 0.76 12.5Keerikai 4.79 24.79 57.36 1.42 14.5*Nilakottai Local 4.63 24.59 33.07 0.81 12.5SM 1 4.39 20.60* 57.19 1.18 13.5SM 2 4.39 30.13* 43.91 1.32 12.5SM 3 4.60 26.24 50.86 1.33 12.5SM 4 4.20 27.99 52.72 1.48 13.5SM 5 4.20 50.95* 31.96 1.62* 10.5EP 3 4.77 19.42 69.20* 1.83* 10.5EP 4 5.12 21.96 83.70* 1.83* 11.5EP 5 4.81 24.63 58.75 1.52* 14EP 7 4.68 30.34* 50.09 1.54* 12EP 9 6.20* 18.71 82.50* 1.49 8.5EP 10 4.70 14.55 102.39* 1.22 9EP11 4.51 11.54 105.94* 1.41 10EP 17 5.75* 18.12 78.07 1.19 9EP 20 5.01 14.86 80.07* 1.30 10.5EP 21 5.88* 24.39 53.38 1.47 14EP 23 3.99 32.43* 45.35 1.32 9.5EP 27 3.99 48.39* 39.88 1.93* 10EP 28 5.22 34.05* 56.70 1.80* 11EP 29 4.99 30.58* 58.96 1.78* 14EP 30 4.10 34.50* 51.56 1.33 11.5Mean 4.72 25.72 55.55 1.33 11.47SEd 0.472 2.147 1.697 0.085 1.290CD(P =0.05) 0.961 4.374 3.457 0.174 2.628*Significant at 5% level

Journal of Progressive Agriculture, Vol.4, No. 2: October, 2013
103
Table 6. Mean performance of eggplant land races for pest, disease and quality attributes.Name of the local type Percent fruit
borer infestationPercent disease
incidenceAscorbic acid content
(mg / 100g)Total phenols
Content (mg/100g)Kariapatty Local 43.75* 22.92* 11.54* 67.28Sedapatty Local (Ramakkai Blue) 47.92* 18.75* 10.24* 51.77Sedapatty Local (Ramakkai Green) 47.92* 20.83* 10.84* 50.54Alavayal Local 56.25 14.58* 11.34* 46.04Palamedu Local 56.25* 10.42* 9.86* 58.30Melur Local 39.58* 18.75* 11.47* 82.60Kallampatty Local 41.67* 14.58* 12.58* 61.47Alagarkovil Local 54.17* 25.00* 11.13* 40.37Singampunari Local 1 43.75* 14.58* 11.88* 72.23Singampunari Local 2 43.75* 20.83* 10.96* 48.28Veerakkal Local (Sempatty Authur) 31.25* 10.42* 10.69* 49.37Keerikai 39.58* 18.75* 13.47* 55.41Nilakottai Local 35.42* 18.75* 10.86* 29.32SM 1 47.92* 27.08* 11.70* 56.05SM 2 37.50* 20.83* 12.16* 73.65SM 3 56.25* 25.00* 11.66* 70.25SM 4 60.42 14.58* 11.38* 74.11SM 5 58.33* 22.92* 10.68* 72.24EP 3 52.08* 10.42* 9.86 61.40EP 4 60.41 18.75* 9.38 152.07*EP 5 58.33* 16.67* 8.85 135.03*EP 7 52.08* 14.58* 9.88 52.93EP 9 33.33* 16.67* 8.85 148.31*EP 10 45.83* 20.83* 8.13 100.40*EP11 58.33* 29.17 9.57 185.67*EP 17 37.50* 25.00* 8.85 193.42*EP 20 41.67* 14.58* 7.88 89.08*EP 21 52.08* 27.08* 9.35 86.73*EP 23 37.50* 27.08* 8.86 80.75EP 27 52.08* 12.50* 9.56 88.34EP 28 58.33* 18.75* 8.84 198.44*EP 29 31.25* 14.58* 7.71 63.26EP 30 47.92* 10.42* 7.38 60.93Mean 47.29 18.69 10.22 83.51SEd 6.006 4.466 0.019 0.078CD(P =0.05) 12.233 9.097 0.039 0.158
*Significant at 5% level
Table 7. Variability parameters for different characters in eggplant.
Character PCV GCV HeritabilityGA as percent
of meanPlant height (cm) 9.75 9.61 97.23 19.53Number of primary branches 26.45 26.05 97.00 52.85Days to first flowering 3.35 3.06 83.19 5.75Leaf area index 44.76 44.75 99.94 92.15Internodal length (cm) 22.72 22.39 97.15 45.46Number of long styled flowers per plant 26.30 25.62 94.90 51.42Fruit length (cm) 20.99 17.95 73.14 31.62Fruit width (cm) 16.11 13.25 67.61 22.45Fruit circumference (cm) 15.96 11.77 54.45 17.90Calyx length (cm) 15.48 10.88 49.40 15.75Fruit pedicel length (cm) 12.20 6.98 32.75 8.23Number of fruit per plant 29.66 28.46 92.08 56.27Average fruit weight (g) 35.68 35.54 99.27 72.96Fruit yield per plant (kg) 22.91 21.99 92.13 43.48Total number of harvests 17.54 13.46 58.90 21.28Fruit borer incidence (%) 20.98 16.70 63.37 27.39Little leaf disease incidence (%) 33.47 23.43 49.03 33.80Ascorbic acid content (mg/100g) 14.66 14.65 99.98 30.18Total phenol content (mg/100g) 53.64 53.33 99.66 92.97
Contribution of traits towards geneticdivergence
The ranking of genotypes based on the methodof Zeng et al. (2002) indicated that genotypes couldbe ranked more appropriately than by the commonlyemployed method of using mean and critical
difference values for all traits, without consideringtheir magnitude of contribution towards the totalgenetic divergence. This method relies on thecontribution of characters to genetic divergence forranking of genotypes. The combined ranking, resultsin identification of superior genotypes for further

Journal of Progressive Agriculture, Vol.4, No. 2: October, 2013
104
exploitation as potential parents in hybridization.Combined ranking based on yield per plant, totalphenols, fruit diameter, days to first flowering andascorbic acid content which contributed the most togenetic divergence resulted in identification of EP 29,EP 4, EP11, EP 17, EP 20, EP 21, EP 23, EP 27andEP 30 as superior genotypes for further utilization asparents for hybridization.
Comparison of ranking based on averageperformance and contribution of characterstowards genetic divergence
Ranking based on mean performance andcontribution of characters towards divergence resultedin identification of genotypes EP 4, EP11, EP 17, EP20, EP 23, EP 27and EP 28 as better genotypes andwhich could be utilized as parents in hybridization forimprovement of fruit yield and quality.
Variability, heritability and genetic advanceImprovement in crop yield depends upon the
magnitude of genetic variability available in breedingmaterial and the extent to which the determining yieldcomponent traits are heritable from generation togeneration. Genetic variability can be used forselecting suitable parents; however, the quantitativecharacters are prone to environmental influence thatnecessitates partitioning of overall variances asheritable and non-heritable components for efficientbreeding (Hiremath and Rao, 1974). The extent ofvariability in the genotypes collected from differentsources and the amount of selection throughheritability and genetic advance estimates wasanalysed. Analysis of variance revealed significantdifferences among the 33 genotypes for all traitsstudied.
Absolute variability in characters can not bethe decisive factor for deciding which character is themost variabile. Relative values of phenotypic andgenotypic coefficient of variation gives an idea of themagnitude of variability in a population since theestimate of genotypic and phenotypic coefficient ofvariation, heritability and expected genetic advanceare useful for yield improvement and the abovevalues were estimated to know the scope ofimprovement in the yield of eggplant genotypes.Measures of genotypic and phenotypic coefficient ofvariation are necessary to understand the role ofenvironmental influence on traits. Genotypesexhibited considerable variability for all traits studied.
VariabilityA relatively high estimate of genotypic and
phenotypic coefficient of variation occurred fornumber of primary branches per plant, internodallength, leaf area index, number of long styled flowersper plant, fruit length, number of fruit per plant,average fruit weight, fruit yield per plant, totalnumber of harvests, little leaf incidence and totalphenols content (Table 7).
Moderate phenotypic and genotypic coefficientsof variation occurred for fruit width, fruitcircumference, calyx length, and ascorbic acidcontent. This agrees with the findings of Vadivel andBabu (1993) for fruit girth and Patil and Ajri (1993) forcalyx length. Low estimates of phenotypic andgenotypic coefficients of variation occurred for plantheight, days to first flowering, pedicel length. Thecoefficient of phenotypic and genotypic variation forall characters were similar in magnitude suggestingthat the characters are not much affected byenvironmental factors; the selection may be based onphenotypic values.
Heritability and genetic advance as percent ofmean
Genotypic coefficient of variation does not givean idea of total heritable variation. It may not befeasible to determine amounts of heritable variationand relative degree to which a character is transmittedfrom parent to offspring by estimate of heritability.Heritability estimate in broad sense alone, does notserve as the true indicator of genetic potential ofgenotypes since the potential is restricted by theinteraction with environment. It is advisable toconsider predicted genetic advance as percent ofmean in conjunction with heritability estimate as areliable tool in selection (Johnson et al., 1955).Heritability value was high for all characters,indicating that most variability was due to genotypiccauses. High heritability indicated that there wasmore additive genes for these characters.
High heritability, coupled with high expectedgenetic advance, occurred for plant height, number ofprimary branches, days to first flowering, leaf area index,internodal length, number of long styled flowers per plant,fruit length, fruit width, average fruit weight, number offruit per plant, ascorbic acid content, total phenols content,little leaf incidence, fruit borer infestation, fruit yield perplant, which indicates that selection among genotypes canbring about significant improvement in the fruit yield andits component characters. Further high heritabilitycoupled with high expected genetic advance indicatedinvolvement of additive genetic variance, thereforeselection may be effective. Ascorbic acid had highheritability and high expected genetic advance, whichconfirms predominance of additive and non-additivegene action. Total number of harvests had moderateheritability and low genetic advance indicating therole of non-additive gene action which includesdominance and epistasis. It is inferred that allcharacters, except total number of harvest exhibitedmoderate heritability and high genetic advance andascorbic acid exhibited high heritability and highgenetic advance indicating the predominance ofadditive gene action and selection is more effective.For improvement of these traits, simple pedigreemethod of breeding followed by selection should bepromising. Ascorbic acid, which is under influence ofadditive, and non-additive, gene action as evidenced

Journal of Progressive Agriculture, Vol.4, No. 2: October, 2013
105
from high heritability with moderate genetic advance,may be improved through selection. Total numbers ofharvests is influenced by non-additive gene actionwhich include dominance as epistasis as evidenced bymoderate heritability with low genetic advance.Selection for this character might not be veryeffective.
Genotype, EP 4 was best since it hadsuperior performance in 11 characters. The genotypeEP 11 was desirable followed by genotypes EP 17,EP 20, EP 23, EP 27,EP 29, and EP 30. Highheritability coupled with high genetic advanceoccurred indicating that traits are governed by
additive genes. Simple selection will be effective forthese characters. Screening and evaluation of landraces for yield, quality and their tolerance to pest anddiseases should be investigated to improve eggplant.ACKNOWLEDGEMENTThe authors thank the Vegetable Research StationPalur, Agricultural College and Research Institute,Killikulam, Madurai and TNAU, Coimbatore, Indiafor providing germplasm to carry out the work. Dr. V.Premalakshmi, Assistant Professor (Horticulture),Agricultural College and Research Institute, Maduraiis acknowledged for valuable suggestions during theresearch.
REFERENCES
Association of Official Analytical Chemists (AOAC) 2001.Official methods of analysis. Association of OfficialAnalytical Chemists, Washington, DC.
Ananthalakshmi, A. 2001. Genetic studies of yield and qualityparameters in egg plant (Solanum melongena L.). MS(Hort.) Thesis, Tamil Nadu Agricultural University,Coimbatore, India.
Bray, H.G. and W.V. Thrope.1954. Analysis of phenoliccompounds of interest in metabolism. Meth. Biochem. Anal.1: 27-52.
Burton, G.W. 1952. Quantitative inheritance in grasses. Proc. 6thInt. Grassld. Congr. 1: 277-283.
Chen, N.C., H.M. Li, and T. Kalb, 2001. Eggplant production.Available on-line at:http://avrdc.org/LC/eggplant/eproduction/01title.htmal.
Collonnier, C., I. Fock, V. Kashyap, G.L. Rotino, M.C.Daunay,Y. Lian, I.K. Marishka, M.V. Rajam, A. Servaes,G. Duereux and D. Sihachakar. 2001. Applications ofbiotechnology in eggplant. Plant Cell, Tiss. Organ Cult.65:91-107.
EGGNET. 2005. Available on-line at:http://www.bgard.science.rn.ul/eggnet/eggnet01.htmal1
999-2005
FAOSTAT. 2005. Available on-line at: http://apps.fao.org
Hiremath, K.G. and M. G. Rao. 1974. Genetic variability andcorrelation studies in Solanum melongena L. Mysore J.Agric. Sci. 8(2): 197-202.
Johnson, W.W., H.F. Robinson and R.E. Comstock. 1955.Genotypic and phenotypic correlation in soybeans and theirimplications in selection. Agron. J., 47: 477-482.
Lawande, K.E and J.K.Chavan 1998. Eggplant (brinjal), In:D.K. Salunkhe and S.S. Kadam (eds.). Handbook ofvegetable science and technology. Production,
Composition and Storage,
Lush, J.L. 1949. Intro-site correlation and regression of off springon corn as a method of estimating heritability of characters.Proc. Amer. Soc. Animal Prodn. 33: 293-301.
Panse, V.C. and P.V. Sukhatme. 1967. Statistical methods foragricultural workers, Indian Council of AgriculturalResearch, New Delhi.
Patel, K.K., D.A. Sarnaik, B.S. Asati and T. Tirkey. 2004.Studies on variability, heritability and genetic advance ineggplant (Solanum melongena L.). Agric, Sci. Digest. 24(4):256-259.
Patil, B.R. and D.S. Ajri. 1993. Studies on the biophysical factorsassociated with resistance to shoot and fruit borer(Leucinodes orbonalis G.) in brinjal (Solanum melongenaL.). Maharashtra J. Hort. 7(2): 75-82.
Patil, S.D., S.D. Warade and C.D. Badgujar. 2001. Heterosisstudies in brinjal (Solanum melongena L.). J. Soil Crops. 11(1): 47- 51.
Prabhu, M. 2005. Breeding for high yield with shoot and fruitborer (Leucinodes orbonalis Guen.) resistance inbrinjal (Solanum melongena L.), PhD (Hort.) Diss., TamilNadu Agricultural University, Coimbatore, India.
Prakash, O., G.M. Mishra and D.N. Choudhary. (1990).Heritability, genetic advance and correlation studies in eggplant (Solanum melongena L.). Adv. Horticult. For. 1: 171-177.
Preneetha, S. 2002. Breeding for shoot and fruit borer (Leucinodesorbonalis G.) resistance in brinjal (Solanum melongena L.).PhD (Hort.) Diss., Tamil Nadu Agricultural University,Coimbatore.
Robinson, H.F., R.E. Comstock and B.H. Harvey. 1959.Estimation of heritability and the degree of dominance incorn. Agron. J. 42: 353-359.
Sasikumar, A. 1999. Screening of egg plant (Solanum melongenaL.) genotypes for quality and yield. MS (Hort.) Thesis,Tamil Nadu Agricultural University, Coimbatore.
Sherly, J. 2007. Evaluation of local types of brinjal (Solanummelongena L.). MS (Hort.) Thesis, PanditJawaharlal Nehru College of Agriculture and ResearchInstitute, Karaikal, India.
Sivasubramanian, S. and P.M. Menon. 1973. Genotypic andphenotypic variability in rice. Madras Agric. J. 60(9-13):1093-1096.
Sridhar, V., O.P. Vijay and G. Naik. 2001. Field evaluation ofbrinjal (Solanum spp L.) germplasm against shoot and fruitborer (Leucinodes orbonalis G.). J. Insect Env. 6(4): 155-156.
Thangamani, C. 2003. Evaluation of F1 brinjal (Solanummelongena L.) for yield and quality. MS (Hort.) Thesis,Tamil Nadu Agricultural University, Coimbatore, India.
Vadivel, E. and J.R.K. Babu 1993. Variability and heritability insegregating generation of egg plant. Madras Agric. J. 80(12): 670-672.
Zeng, L., M.C. Shannon and C.M. Grive. 2002. Evaluation ofsalt tolerance in rice genotypes by multiple agronomicparameters. Euphytica 127: 235-245.
Journal of Progressive Agriculture, Vol.4, No. 2: October, 2013
106
Coheritability in wilt tolerant maize hybrids
SHOBHA RANI. T. AND SUMALINI. K.Department of Genetics and Plant Breeding, Agricultural Research Station,
Karimnagar, Andhrapradesh, India, 505 002.Email: shobhamao @ yahoo.co.in
Received: August, 2013Accepted: Sept., 2013
ABSTRACT
Intra-group co-heritability of different pairs of characters involving days to 50% silking, days to50% tasselling, days to 75% dryhusk, plant height(cm), ear height(cm), shelling percentage, earlength(cm), ear girth(cm), kernel rows, kernels per row, test weight(g) and grain yield per hectare(kg) in55 hybrids of maize of varied wilt tolerance was determined. Further, coefficients of variability andbroad sense heritabilities were estimated. The results showed co-heritability values depended upon thematerial chosen. Nevertheless, selection criteria on the basis of high co-heritability value exhibited by afew character pairs involving yield was formed. The highest value of co-heritability was found betweengrain yield with shelling percentage followed by ear height (cm), kernels per row and test weight (g). Onthe other hand, highest heritability estimates were found in test weight (g) followed by shellingpercentage and ear girth (cm). The simultaneous selection of these characters would lead to increasein grain yield and that the selection should lead to fast genetic improvement of the material.
Key words: Co-heritability, Heritability, Coefficient of variation, Wilt tolerance, Maize, Grain yield.
Corn being an important crop, has wideadaptation and is able to grow in regions ranging fromsemiarid with annual rainfall of 20-25 cm to thosewhere annual rainfall may exceed 400cm.Appreciating fully its importance in Indianagriculture, considerable efforts to its economicproduction are constantly underway. Considering itsimportance being a cereal crop, the present study wasundertaken to measure the co-heritability estimatesfor response to joint inheritance for various attributes.Further, other genetic studies on maize wereundertaken in Agricultural Research Station,Karimnagar district, Andhrapradesh to estimate theco-heritability, coefficients of variation andheritability for different plant traits.
MATERIALS AND METHODS
The study was conducted at AgriculturalResearch Station, Karimnagar district during rabi,2010. In total, 55 maize hybrids possessing a widegenetic background with varied tolerance to late wiltdisease caused by Cephalosporium maydis weregrown in a randomized block design with threereplications. Each plot consisted of six rows of fourmeter length with row spacing and plant spacing of 75and 20 cm respectively. Data on days to 50% silking,days to 50% tasselling, days to 75% dryhusk, plantheight (cm), ear height (cm), shelling percentage, earlength (cm), ear girth (cm), kernel rows, kernels perrow, test weight (g), and grain yield per hectare (kg)were recorded during cropping season and afterharvest. Co-heritability was calculated by the formulasuggested by Nei(1960). Analysis of variance for allthe plant traits recorded was carried out according toSteel and Torrie(1980). The heritability estimate of a
trait was computed as ratio between the estimate ofgenetic variance and phenotypic variance(Singh andChoudhary, 1985).
RESULTS AND DISCUSSION
Co-heritability ascribed to the co-inheritance ofdifferent character pairs and indicates the geneticprogress which could result from the joint selectionfor these characters. It is a better genetic parameterthan genetic correlation as correlation does not takeaccount of environmental variance which is alsocomponent of phenotypic variance to which selectionis applied (Mehan and Sainy, 1962). Further, theheritability provides the precise information about thedegree to which a given character is controlled byinheritance. It provides confidence in selectionstrategies and the breeder has often exploited it toincorporate desirable attributes in crop plants.Therefore, to raise the efficiency of plant selection anattempt has been made in this paper to present co-heritability estimates, co-efficiency of variance andheritability estimates among different economic traitsin a group of 55 maize hybrids.
Co-heritability estimates appearing in Table 1show that grain yield per hectare exhibited positiveco-heritability with all the traits except days to 50 %tasselling and days to 50% silking. Highest co-heritability was found between grain yield per hectarewith shelling percentage (6828.3) followed by earheight (5324.9), kernels per row (1232.3) and testweight (1111). Shelling percentage of normal earsusually about 80 percent when fields are ready forharvest. This gives idea about ratio between the grainsand the shank. More grain weight always favourablefor contributing towards higher yields. Similarly for

Journal of Progressive Agriculture, Vol.4, No. 2: October, 2013
107
ear height trait, long ears accommodate more numberof kernels per row. Further, simultaneous selection fornumber of kernels per row and test weight contributestowards higher yields. Similar results were reported ingreengram (Bashir et al., 1985) for seed yield with
pod length and number of clusters per plant and inBarley (Jalal et al., 2012) for grain yield with numberof spikelets per spike and number of internodes permain stem.
Table 1: Coheritability among yield and yield components in wilt tolerant hybrids of maize at ARS,Karimnagar, Andhrapradesh.
Characters Days totasselling
(50%)
Days tosilking(50%)
Days to75%dry
husk
Plantheight(cm)
Earheight(cm)
Shelling(%)
Earlength(cm)
Eargirth(cm)
Kernelrows
Kernels/row
Testweight
(g)
Days tosilking(50%) 3.792Days to 75% dryhusk 0.147 0.205Plant height(cm) 10.268 5.762 4.424
Ear height (cm) 4.034 1.730 4.044 160.652
Shelling (%) -2.415 -2.253 0.362 -0.888 4.392
Ear length (cm) -0.250 -0.339 0.190 2.586 -0.089 0.325
Ear girth (cm) -0.200 -0.282 0.232 1.288 -0.738 -0.115 0.835
Kernel rows 0.097 -0.002 0.207 2.600 1.051 -0.015 0.444 0.417
Kernels/ row -0.304 -0.631 -0.111 10.948 2.549 1.758 2.863 1.152 0.510
Test weight (g) -1.445 -1.385 1.283 -8.304 -5.405 -0.251 2.028 2.687 0.645 2.524
Grain Yield /ha -720.44 -954.11 507.356 756.657 5324.9 6828.3 466.2 473 340.392 1242.3 1111
Among the yield components, test weight (g)showed highest positive co-heritability with ear girth(2.687) followed by kernels per row (2.524), earheight (2.028) and kernel rows (0.645). This indicatesthat test weight is more influenced by the cob andkernel characters rather than the plant characters.Shelling percentage showed positive co-heritabilitywith ear height (4.392) and kernels per row (1.758).As the trait shelling percentage highly correlated withyield of the hybrid, simultaneously selection for earheight and kernels per row will improve the shellingpercentage. Kernels per row had highest coheritability with ear length (2.863), ear height (2.549)and ear girth(1.152). More ear length and ear girthfavor more number of kernels per row.Simultaneously, ear height trait, presence of ear at 45-55 percent height of the plants favor the accumulationof more photosynthates in kernels.
The results from the heritability estimatesare presented in Table 2. High heritability estimateswere obtained for test weight (0.958), Shellingpercentage (0.950) and ear girth (0.810). Choudhariand Choudhari, 2002, Om Prakash et al., 2006 andSumathi et al., 2005 were also reported highheritability for test weight and Mani and Bisht, 1996for cob girth and shelling percentage. These estimatesindicates that the test weight and shelling percentageare comparatively least effected by the environmentover ear girth.
Moderate heritability estimates recorded for days to50 % tasselling (0.680), plant height (0.609), days to50% silking (0.591), kernels per row (0.545), ear girth(0.544) and ear height (0.515). This indicates thesecharacters are comparatively more influenced by theenvironment, which reveals the importance of timelyattending the package of practices especially,weeding, fertilizer applications and frequency ofirrigations contributes to the environment. Co-heritability estimates also revealed high correlationbetween the characters such as ear height and kernelsper row which are more influenced by theenvironment. Any deviation from the cropmanagement aspects will definitely attributed to thesecharacters, thereby change in the yield component.Simultaneous selection for shelling percentage, testweight based on parental line performance is morefavorable. Thus as selection for number of kernels perrow and ear height needs to be selected based onperformance of genotypes with constant environmentfactors.
Among all the characters kernel rows(0.0312) and days to 75 % dryhusk (0.172) recordedlowest heritability estimates which reveals highinfluence of environment on these characters. Robinand Subramanian, 1994 and Mani and Bisht, 1996also recorded lowest heritability for number ofkernels per row.

Journal of Progressive Agriculture, Vol.4, No. 2: October, 2013
108
Table 2: Genotypic and phenotypic coefficient of variations and heritability for yield and components in
wilt tolerant hybrids of maize.
Characters MSS CD(1%) S.Em. CV PCV GCV Heritability(Broad Sense)
Days to tasselling(50%) 9.879 2.47 0.659 1.70 3.05 2.530 0.680Days to silking(50%) 9.034 2.82 0.751 1.93 3.01 2.310 0.591Days to 75% dryhusk 2.355 2.61 0.694 1.18 1.294 0.530 0.172Plant height (cm) 598.276 22.301 5.928 6.37 10.183 7.940 0.609Ear height (cm) 275.067 17.59 4.67 10.95 15.67 11.250 0.515Shelling (%) 31.914 NS NS NS 4.08 4.080 1.000Ear length (cm) 4.42 2.13 0.56 5.90 8.74 6.440 0.544Ear girth (cm) 2.456 0.91 0.24 3.04 6.98 6.280 0.810Kernel rows 1.479 1.71 0.45 6.08 7.325 4.090 0.312Kernels/ row 29.501 5.501 1.46 8.49 12.59 9.290 0.545Test weight(g) 52.073 1.86 0.49 3.14 15.46 15.140 0.958Cob yield/ha (kg) 5891167.1 1298.37 345.14 8.08 19.9 18.210 0.837Grain Yield / ha 4222431.9 1046.31 278.14 8.07 20.92 19.310 0.851
Data given in Table 2 depicted that sufficientgenetic variability existed in most of the characters.The magnitude of genotypic variances for mostcharacters lower than those of phenotypic (genotypicx location) variances. Yousaf Mahammad and SaleemMahammad, 2002 also reported similarly forquantitative characters in maize. Highest coefficientof genotypic variance was observed in grain yield perhectare(19.31) followed by cob yield(18.21), testweight(15.14) and kernels per row(9.19). Almostsimilar pattern was recorded for phenotypiccoefficient of variance for different plant characters.Grain yield per hectare exhibited greater magnitude ofcoefficient of phenotypic covariance (20.92) followedby cob yield per hectare (19.9) and ear height(15.67).High GCV and PCV reported by Jha and Ghosh, 2001
for grain yield, Mani and Bisht, 1996 and Omprakashet al., 2006 for test weight and kernels per row.
More consistency was observed in test weightand ear girth. Minimum level of genotypic coefficientof variance was found for days to 50 %tasselling(2.530) and days to 50 % silking(2.310).Similarly, minimum level of phenotypic co-variancewas recorded for days to 75% dry husk (1.29), days to50% silking (3.01) and days to 50% tasselling (3.05).Similar results were noticed by Pradeepkumar andSatyanarayana (2001) for days to 50% tasseling, daysto 50% silking. The other characters differed in theextent of their variation as measured by thecoefficients of variation. The magnitude of genotypiccoefficient of variation was low as compared to thatof phenotypic coefficients of variation in all the traitsstudied.
REFERENCES
Avinash Chandra and Makde, K.H., 1992. Coheritabilityamong different economic traits in bread wheat.Pakistan Journal of Agriculture Sciences, 29(2): 185-187.
Bashir et al., 1985. Coheritability among yield and yieldcomponents in greengram, Pakistan Journal ofAgricultural Research. 6(3): 171-172.
Choudhary, A.K. and Chaudhary, L.B., 2002. Geneticstudies in some crosses of maize (Zea mays L.).Journal of Research (BAU). 14(1):87-90.
Jalal et al., 2012. Genetic variation, Heritability,Phenotypic and Genotypic correlation studies foryield and yield components in promising Barleygenotypes. Journal of Agricultural Science 4(3): 195-210
Jha, P.B. and Ghosh, J., 2001. Variability and componentanalysis for fodder or dual purpose
maize (Zea mays L.). Journal of Research 13(1):65-67.
Mani, V. P. and Bisht, G.S., 1996. Genetic variability inlocal maize (Zea mays L.) germplasm of UttarPradesh hills. Journal of Hill Research, 9(1): 131-134.
Mehan, D.K. and Saini, S.S., 1962. Coheritabilityvariation in rice. Indian Journal of Genetics and PlantBreeding. 42(2): 296-301.
Nei,M.1960. Studies on the application of biometricalgenetics to plant breeding. Mem.Coll. Agri. KyotoUniv., Japan, No.82.
Om Prakash, Shanthi, P., Satyanarayana, E. andSaikumar, R., 2006. Studies on genetic variability

Journal of Progressive Agriculture, Vol.4, No. 2: October, 2013
109
exploitation for quality traits and agronomiccharacters on quality protein Maize (QPM)germplasm (Zea mays L.). Ann. Agric. Res.,27(2):147-153.
Pradeep Kumar, P. and Satyanarayana, E., 2001.Variability and correlation studies of full seasoninbred lines of maize. Journal of Research, AcharyaN. G. Ranga Agric. Unvi., Hyderabad, India, 29: 71-75.
Singh, R.K. and Choudhary, B.D., 1985. BiometricalMethods in Quantitative Genetic Analysis. Pp: 38-54.Kalyani Publishers, New Delhi, India.
Steel, R.G.D. and J.H. Torrie, 1980. Principles andProcedures of Statistics. Mc Graw Hill Book Co. Inc.,NY, USA.
Sumathi, P., Nirmalakumari, A. and Mohanraj, K.,2005. Genetic variability and traits interrelationshipstudies in industrially utilized oil rich CYMMIT linesof maize (zea mays l). Madras Agriculture Journal.92 (10-12): 612 – 617.
Robin, S. and Subramanian, M., 1994. Genetic variabilitystudy in biparental progenies in maize (Zea mays L.).Crop Research, 7(1):79-83.
Yousaf Mahammad and Saleem Mahammad, 2002.Estimates of heritability for some quantitativecharacters in maize. International Journal ofAgriculture and Biology. 4(1):103-104.
Journal of Progressive Agriculture, Vol.4, No. 2: October, 2013
110
Efficacy of pest management modules against mango hopper (Amritodus atkinsoni)on langra mango in zone III of Bihar
S. N. RAY, T. SAHA AND NITHYA CDepartment of Agricultural Entomology
Bihar Agricultural University, Sabour 813210, Bhagalpur, Bihar, IndiaEmail: [email protected]
Received: July, 2013Accepted: Sept., 2013
ABSTRACT
Studies on efficacy of pest management modules against mango hopper, Amritodus atkinsoniLeth. on mango were carried out during 2010-2011 and 2011-12. The results showed that module 4(first spray at panicle emergence with Spinosad 0.004%, second spray of Thiamethoxam 0.008% after21 days of 1st spray and third spray (need based) of Neem Azal 1000 ppm when fruits were at peasize) was found to be most effective in reducing (5.13 hoppers / panicle/week, 63%) mango hopperpopulation in Zone III of Bihar. This was followed by module 3 (first spray of Thiamethoxam 0.008% atpanicle emergence, second spray of Profenophos 0.05% after 21 days of 1st spray and third spray(need based) of Carbaryl 0.15% when fruits were at pea size) (5.84 hoppers / panicle/week, 58%).While maximum (113.68 / 100 panicle) fruit set per 100 panicle at marble stage was recorded inmodule 4. Considering yield and cost-benefit ratio against management of mango hopper over theperiod of investigation, module 4 (88.20 kg/tree, 49%) was found most economical and it was followedby module 3 (80.38 kg/tree, 45%).
Key words: Mango hopper, Management, Modules
Mango is one of the major fruit crop of SouthAsia from time immemorial and still remains aprominent horticultural crop of India. Bihar standsfourth in India in the production of mango with anarea of 3944 ha. Mango hopper is a serious pest ofmango which may cause up to 50 per cent crop loss incases of severe infestation. This pest is expected toemerge from the last week of February to first weekof March. This is the most important pest recordedduring the flowering seasons throughout Bihar.Among many species of hoppers reported, Ideoscopusclypealis L., Ideoscopus niveosparsus L. and A.atkinsoni L. are of major importance, persistent onpanicles and leaves, respectively (Soomro et al.,1987). Mohyuddin and Mahmood, 1993 reported thatA. atkhinsoni and I. niveosparsus are found on theupper canopies of mango trees at different times ofthe year. Mango hoppers were found colonized duringboth vegetative and reproductive phase of the crop.Peak incidence was noticed during full bloom stage ofthe crop after which the insects migrated to cracksand crevices of the trunk (Babu et al., 2002). Hoppersare a serious problem in mango production. Hence,the present studies were designed and executed.
MATERIALS AND METHODS
The experiment was conducted during 2010-2011 and 2011-12 at the AICRP Research Centre,Sabour, Bhagalpur, Bihar. Mango variety Langra wastaken for conducting the trial. The plots were set outin a randomized block design with six modulesincluding an untreated check (M1:first spray atpanicle emergence with Beauveria basiiana (1 × 10
7 spores/ml), second spray of Verticillium lecanii (1 ×10 7 spores/ml) after 10 days of 1 st spray and thirdspray with Neem Azal 1000 ppm (10 days after 2 nd
spray); M2:first spray at panicle emergence withNeem Azal (1000 ppm), second spray ofNimbecedene (1500 ppm) after 10 days of 1st spray,third spray with Neem Azal 1000 ppm (10 days after2nd spray) and fourth spray of Nimbecedene (1500ppm) after 15 days of 3rd spray; M3: first spray ofThiamethoxam (0.008%) at panicle emergence,second spray of Profenophos (0.05%) after 21 days of1st spray and third spray (need based) of Carbaryl(0.15%) when fruits were at pea size; M4: first sprayat panicle emergence with Spinosad (0.004%),second spray of Thiamethoxam (0.008%) after 21days of 1st spray and third spray (need based) ofNeem Azal (1000 ppm) when fruits were at pea size;M5: first spray at panicle emergence with Acephate(0.04%), second spray of Spinosad (0.004%) after 21days of 1st spray and third spray (need based) ofCarbaryl (0.15%) when fruits were at pea size; M6:untreated check). Five replications were done. Theobservations were recorded on mean of hopperpopulation/ Panicle at weekly interval, No. of fruitsset/ 100 panicles at marble stage and Yield (Kg/ tree).The data on different aspects of experiment werestatistically analyzed after appropriatetransformations according to Gomez and Gomez(1984) to test the level of significance of treatments.
Increase (%) - Treatment yield-Control yield × 100Control yield

Journal of Progressive Agriculture, Vol.4, No. 2: October, 2013
111
RESULTS AND DISCUSSION
Results (Tables 2,3) indicated that all themodules were effective against the mango hopper,though varied in their efficacies and weresignificantly superior to the check. Module 4(Spinosad 0.004% + Thiamethoxam 0.008% + NeemAzal 1000 ppm) were superior to M 3(Thiamethoxam 0.008% + Profenophos 0.05% after +Carbaryl 0.15%), M 5 (Acephate 0.04% + Spinosad0.004% + Neem Azal 1000 ppm), M 2 (Neem Azal1000 ppm + Nimbecedene 1500 ppm + Neem Azal1000 ppm + Nimbecedene 1500 ppm) and M 1(Beauveria basiiana 1 × 10 7 spores/ml +Verticillium lecanii 1 × 10 7 spores/ml + Neem Azal1000 ppm). M 4 recorded lowest (5.13 hoppers /
panicle/week) hopper population which was at parwith M 3 (5.84 / hoppers / panicle/week) (Table 2).Next best module was M 5 (6.50 / hoppers /panicle/week). While M 2 was least (7.65 hoppers /panicle/week) effective in controlling hopperpopulation and it was followed by M 1 (8.54 hoppers/ panicle/week) (Table 2). Data pertaining to numberof fruits set per 100 panicles at marble stage presentedin table no 1 indicated that maximum fruit set atmarble stage was recorded with M 4 (113.68 / 100panicle) which was followed by M 3 (97.55 / 100panicle) and M 5 (89.90 / 100 panicle). Howeverminimum fruit set at marble stage was observed in M2 (76.21 / 100 panicle) and M 1 (72.95 / 100 panicle).
Table 1. Pest management module tested on cv. Langra against mango hopperPest management
modulesDeatails
Module 1 First spray at panicle emergence with Beauveria basiiana (1 × 10 7 spores/ml), Second spray ofVerticillium lecanii (1 × 10 7 spores/ml) after 10 days of 1 st spray, Third spray with Neem Azal 1000ppm (10 days after 2 nd spray)
Module 2 First spray at panicle emergence with Neem Azal (1000 ppm), Second spray of Nimbecedene (1500ppm) after 10 days of 1st spray, Third spray with Neem Azal 1000 ppm (10 days after 2nd spray),Fourth spray of Nimbecedene (1500 ppm) after 15 days of 3rd spray
Module 3 First spray of Thiamethoxam (0.008%) at panicle emergence, Second spray of Profenophos (0.05%)after 21 days of 1st spray, Third spray (need based) of Carbaryl (0.15%) when fruits were at pea size
Module 4 First spray at panicle emergence with Spinosad (0.004%), Second spray of Thiamethoxam (0.008%)after 21 days of 1st spray, Third spray (need based) of Neem Azal (1000 ppm) when fruits were at peasize
Module 5 First spray at panicle emergence with Acephate (0.04%), Second spray of Spinosad (0.004%) after 21days of 1st spray, Third spray (need based) of Carbaryl (0.15%) when fruits were at pea size
Module 6 Untreated check
Table 2. Effect of different pest management module on hopper populationModule Mean no. of hopper population / Panicle
/week% reduction ofhopperpopulation overcontrol
No. of fruits set/ 100 panicles at marblestage
2010-11 2011-12 Pooled dataof two years
2010-11 2011-12 Pooled dataof two years
M1 8.63 (3.01) 8.45 (2.97) 8.54 38.47 76.70 69.20 72.95M2 7.80 (2.87) 7.50 (2.80) 7.65 44.88 80.13 72.30 76.21M3 5.55 (2.31) 6.13 (2.41) 5.84 57.93 105.10 90.00 97.55M4 4.90 (2.45) 5.35 (2.56) 5.13 63.04 119.50 107.85 113.68M5 6.05 (2.55) 6.96 (2.72) 6.50 53.17 96.40 83.40 89.90M6 14.10 (3.81) 13.65 (3.76) 13.88 - 50.75 56.23 53.49S. Em (±) 0.12 0.16 0.57 - 3.51 3.37 2.43C.D (p- 0.05) 0.36 0.49 1.17 - 10.82 10.39 4.97Mean of four replications, Figures in the parentheses are √ x + 0.5 transformed values, CD (p-0.05)
Table 3. Effect of different pest management module on yieldModule Yield (Kg/ plant) % increase in
yield overcontrol
Cost-benefitratio2010-11 2011-12 Pooled data of
two yearsM1 59.00 62.48 60.73 26.72 2.46M2 62.50 66.00 64.25 30.74 3.51M3 79.25 81.50 80.38 44.64 4.20M4 85.75 90.65 88.20 49.55 4.65M5 73.10 77.83 75.46 41.03 3.90M6 41.75 47.25 44.50 - -
S. Em (±) 3.43 2.55 2.14 - -C.D (p-0.05) 10.57 7.87 4.37 - -

Journal of Progressive Agriculture, Vol.4, No. 2: October, 2013
112
Economic effectiveness of various pestmanagement modules were also evaluated aspresented in Table 3. It shows that all the modulesrecorded increase in marketable yield over untreatedcheck. M 4 recorded highest marketable yield (88.20kg plant-1) and percentage increase in marketableyield of (49.55 %) over control. This was followed byM 3 (80.38 kg plant-1 and 44.64 %) and M 5 (75.46 kgplant-1 and 41.03). While lowest marketable yieldwere recorded with M 1 (64.25 kg plant-1 and 44.64%) and M 2 (60.73 kg plant-1 and 44.64 %). The costbenefit ratio calculated on the basis of cost ofprotection for different modules revealed that M 4was found superior as it recorded a profit of Rs. 4.65per rupee invested followed by M 3 (1: 4.20) and M 5(1: 3.90). Sushil Kumar et al., (2005) also found thatimidacloprid (0.005%), thiamethoxam (0.0084%),profenophos (0.1%) and lambda-cyhalothrin(0.003%) were effective in controlling hoppercomplex on alphonso mango in south Gujarat.Gajendra Singh (2000) reported that freshly preparedneem seed kernel extract (4%) and nimbecidine(0.2%) gave significant reductions in hopperpopulation (16.00 and 15.5 hopper per 5 panicles).The Module-I consisting of first spray at panicleemergence with imidacloprid 17.8 SL @ 0.32 ml/l,second spray with NSKE (5%) at 21 days after firstspray, and third spray (need based) with Endosufan35 EC @ 2.00 ml/l when fruits were at pea size andModule-II having first spray with thiomethoxam 25WG @ 0.32 g/l of water, second spray withazadirachtin 1500 ppm @ 5 ml/l of water at 21 daysof first spray, and third spray (need based) withethofenprox 10 EC @ 0.5 ml/l were found to be mosteffective in reducing the hopper population and gavehighest yield in Module-II followed by Module-I with76.96 and 73.35 kg tree/tree, respectively (Anitha etal., 2009). Thus, the present studies suggested that
considering pest reduction, yield and cost economics,module 4 (Spinosad 0.004% + Thiamethoxam0.008% + Neem Azal 1000 ppm) was mostreasonable and it was closely followed by module3(Thiamethoxam 0.008% + Profenophos 0.05% after+ Carbaryl 0.15%).
Fig 1: Effect of different module on mango hopperpopulation and yield during 2010-11
Fig 2: Effect of different module on mango hopperpopulation and yield during 2011-12
Acknowledgement:The authors are thankful to Bihar Agricultural
University, Sabour, Bhagalpur for providingnecessary facilities in carrying out the presentinvestigations.
REFERENCES
Babu LB, Maheshwari T and Rao N V 2002. Seasonalincidence and biology of the mango hopperAmritodus Atkinsoni (Homopetra: Cicadellidae).Entomon 27: 35-42.
Gajendra Singh 2000. Efficacy of neem formulationscompared to chemical insecticides against hoppersand leaf webber. Acta. Hort. 509: 745-749.
Gomez KA and Gomez AA. 1984. Statistical Procedurefor Agricultural Research, John Wiley and Sons, NewYork.
Kumari AD, Lakshmi BKM, Reddy GS and Reddy L2009. Influence of abiotic factors on the incidence of
hopper and chemical control strategies in mango.Karnataka J. Agric. Sci. 22: 601-602.
Mohyuddin AI and Mahmood R 1993. Integrated controlof mango pests in Pakistan. Acta. Hor. 341: 467-483.
Soomro, A., Khuhro, R. & Ansari, H. 1987. Status ofinsects associated with mango blossom. Proceedingof Pakistan Congress Zoology, 5: 123-125.
Sushil Kumar, Raghvani BR and Bhatt RI 2005.Bioefficacy of newer insecticides against hoppercomplex on alphonso mango in humid tropics ofsouth. Gujarat J. Appl. Zool. Res. 16: 64-66.

Journal of Progressive Agriculture, Vol.4, No. 2: October, 2013
113
Inter-relationship between pod characteristics, nutritional and anti-nutritional factors infrench bean
NAGENDRA RAI, 1KRISHNA KUMAR RAI, U. SINGH AND SANJEEV KUMAR1Principal Scientist, Indian Institute of Vegetable Research, Varanasi (U.P)
2SRF, Indian Institute of Vegetable Research, Varanasi (U.P);3 SRF, Indian Institute of Vegetable Research, Varanasi (U.P.),
4 Senior Scientist, Crop Improvement Division, IIRI, Varanasi (U.P.),
Received: August, 2013Accepted: Sept., 2013
ABSTRACT
French bean (Phaseolus vulgaris L.) is one of the most important sources of proteins,carbohydrates, fibres, certain minerals and vitamins, and adds specific nutritional value to human diet.In this study inter-relation between number of pods per plant and pod size (length and width) and nu-tritional (protein, carotenoids, sugar, lipid, ascorbic acid and chlorophyll) and anti-nutritional (phenol,proline, hydrogen peroxidise and catalase) factors was analysed. The analysis revealed that number ofpods per plant had a highly significant positive correlation with reducing and total sugar. Pod lengthappeared to be the most important trait for enhancing nutritional qualities owing to their highlysignificant positive correlation with protein, chlorophyll, carotenoids, proline, and non-reducing sugar.Interestingly, no significant correlation was observed between pod width and nutritional qualities suchas protein, sugars, chlorophyll, carotenoids, ascorbic acid and lipid. The study suggested that attributeslike number of pods per plant and pod length must be taken into consideration for selection of anutritionally rich French bean genotype.
Key words: Correlation, Nutritional factors, Pod characters, French bean.
Plant products provide ~65% of the proteins, ofwhich 45-50% coming mainly from legumes andcereals [10]. Among the legumes, French bean(Phaseolus vulgaris L.) is one of the most importantsources of proteins, carbohydrates, fibres, certainminerals and vitamins, and adds specific nutritionalvalue to human diet. French beans are often steamed,boiled, stir-fried, or baked, and are marketed ascanned, frozen, and fresh vegetable. French bean iscultivated in different cropping systems includinghighly mechanized, irrigated and intensive mono-cropped bush beans, and indeterminate or climbingbeans with maize, sugarcane, and coffee [24]. Beanshave been grown as human food, and animal feedsince centuries. But due to presence of anti-nutritionalfactors, viz., enzyme (trypsin, chymotrypsin, α-amylase) inhibitors, phytic acid, flatulence factors,saponins and toxic factors such as lectins, prolongedcooking is required [9]. Such anti-nutritional factorsdecrease the nutritive value, and may cause healthproblems to both human and animals if takenregularly in larger amounts [11].
French bean varieties are mainly bred for thefleshiness, flavor, and sweetness of their pods. But inrecent past breeding efforts have included to identifygenotypes having lower content of anti-nutritionalfactors. French bean population generally showsignificant differences for pod curvature, length/widthand width/thickness ratios of pod and seed, pod and
seed texture, hardness, seed coat, crude protein, sugarand starch content. Earlier, several morphologicaltraits of French bean have been studied and yield wasfound to be positively correlated with pod length,seed per pod and for other architectural traits such asnumber of branch, nodes on main stem, stem andinternode lengths, except branches per plant[16,20,21]. Presently, strong emphasis is given todevelop nutritionally rich French bean andinformation on the association between yieldattributes and qualitative traits could help breeders togo for simultaneous improvement of yield withnutritional/anti-nutritional factors. The correlationcoefficient can be helpful in determining charactersthat have little or no importance in selectionprogramme. The presence of correlation may be dueto the presence of either linked or pleiotropic genes,morphological and physiological relationship orenvironmental effect or a combination of all thesefactors. In view of this, concerted efforts are neededto enhance the productivity and acceptability ofFrench bean by selecting genotypes having low anti-nutritional factors with stable yield. In this context,the present investigation was done to knowrelationship between pod characters (e.g., pod numberand pod size) with nutritional/anti-nutritional qualitieswhich may be useful to identify nutritionally richFrench bean genotypes.

Journal of Progressive Agriculture, Vol.4, No. 2: October, 2013
114
MATERIALS AND METHODS
Plant material consisted of eight geneticallydiverse genotypes, viz., VRFBB-1, EC595960,HAFB-3, HAFB-4, VLP-9, IIHR-909, Pant B-3 andArka Komal. Field experiments were conducted inrandomized block design with three replicationsduring November to March of 2010-2011 and 2011-2012 at Indian Institute of Vegetable Research,Varanasi, UP, India. The experimental site is locatedbetween 82.52ºE longitude and 25.10ºN latitude at anelevation of 128.93 m from mean sea level andreceives annual rainfall of 1113.3 mm. The soil ofexperimental field was sandy loam, neutral in reaction(pH 6.6-7.8), non-saline and poor in organic carboncontent (0.39-0.84%). Seeds were sown at row-to-rowspacing of 30 cm, and plant-to-plant spacing of 20cm. For a good crop growth, 100 kg nitrogen (N), 60kg phosphorus (P) and 60 kg potassium (K) wasapplied in addition to 200 q/ha well-rotten farm yardmanure. The crop was irrigated as and when
required. The recommended intercultural practiceswere followed to have a good crop stand.
Number of pods per plant was recorded fromrandomly selected 20 plants in each plot. Pod widthand length were measured using a meter scale from40 pods randomly picked from 20 plants from eachplot. Initially, the pods were used for recording podcharacters, and later, they were used for analysis ofnutritional/anti-nutritional factors. Standard analyticalmethods were used for the analysis of lipidperoxidation [4], catalase [14], hydrogen peroxide [6],reducing sugar [23], non-reducing sugar [12],ascorbic acid [5], proline [3], protein [8], chlorophylland carotenoids [2], and phenol content [13].
For statistical analysis, data was pooled over thetwo year. All the analysis was conducted usingsoftware SPSS. The correlation coefficients betweenpod number, pod length and pod width withnutritional/anti-nutritional factors was done as per themethod of [1].
Table 1.Nnutritional and anti-nutritional levels among eight genotypes of French bean.
Genotype PR (mg/g) PH (mg/g) CH (mg/g) CA (mg/g) RS (g/100g)
NRS (g/100g)
PL (µg/g) H2O2 (µMmin-1)
CT (µMH2O2 min-1)
LPO(MDA/ mgprotein)
ArkaKomal 1.07±0.22 0.01±0.05 2.36±0.08 0.10±0.05 1.62±0.23 0.55±0.09 0.04±0.03 0.02±0.02 0.02±0.02 0.27±0.08
EC595960 1.12±0.30 0.03±0.04 3.56±0.10 0.23±0.03 0.80±0.17 0.54±0.06 0.05±0.04 0.04±0.06 0.03±0.05 0.20±0.07
VRFBB-1 1.01±0.15 0.02±0.02 2.34±0.47 0.19±0.08 0.54±0.04 0.44±0.05 0.06±0.03 0.02±0.03 0.01±0.02 0.23±0.08
HAFB-3 0.99±0.21 0.02±0.01 2.01±0.09 0.23±0.03 0.53±0.05 0.42±0.04 0.06±0.03 0.02±0.04 0.02±0.03 0.22±0.06
HAFB-4 1.08±0.25 0.04±0.05 1.99±0.37 0.11±0.04 0.77±0.07 0.54±0.03 0.05±0.01 0.02±0.05 0.03±0.05 0.20±0.05
VLP-9 0.88±0.19 0.05±0.09 1.87±0.34 0.12±0.08 0.68±0.03 0.59±0.01 0.08±0.08 0.03±0.01 0.04±0.02 0.18±0.02
IIHR-909 1.01±0.21 0.10±0.07 1.63±0.43 0.21±0.09 0.60±0.09 0.50±0.08 0.09±0.01 0.04±0.03 0.02±0.01 0.16±0.01
Pant B-3 1.02±0.18 0.09±0.05 1.89±0.32 0.21±0.04 0.67±0.09 0.51±0.07 0.07±0.03 0.04±0.07 0.03±0.02 0.14±0.02
Note: PR: protein, PH: phenol, CH: chlorophyll, CA: carotenoid, RS: reducing sugar, NRS: non reducing sugar, PL: proline, H2O2: hydrogenperoxide, CT: catalase, LPO: lipid peroxidation, AA: ascorbic acid
RESULTS AND DISCUSSION
Variability in levels of nutritional and anti-nutritional factors:
In the case of nutritional factors, the genotypeEC595960 was recorded to be superior as it possesthe highest amount of protein (1.12 mg/g),chlorophyll (3.56 mg/g), carotenoids (0.23 mg/g), andreducing sugar (1.62 g/100 g F.W.) (Table 1).Whereas, anti-nutritional factor phenol was recordedto be the highest (0.09 mg/g F.W.) in the genotypePant B-3. There was insignificant difference in thelevel of rest of the factors (Table 1).
Correlation between number of pods perplant vs nutritional and anti-nutritional factors:
The correlation values for number of pods andnutritional/anti-nutritional factors are presented inTable 2. Reducing sugar and total sugar amongnutritional factors and phenol among the anti-nutritional factors showed significant positivecorrelation with number of pods per plant. On theother hand, proline and non-reducing sugar exhibited
a significant negative correlation with number of podsper plant (Table 2). This indicates that number ofpods per plant play an important role on bothnutritional and anti-nutritional factors in French bean.These findings are in agreement to the observations ofJoshi and Mehra [7]. These findings clearly indicatethat both nutritional and anti-nutritional factors ofFrench bean are significantly affected by number ofpods. Previously, in French bean, a similarobservation was made by Rastogi and Malik [22].
Pod length vs nutritional and anti-nutritionalfactors:
The relationship between pod length withnutritional and antinutritional factors as presented inTable 2. The analysis revealed that pod length hadsignificant positive correlation with all the nutritional(protein, chlorophyll, carotenoid, non-reducing sugar)and anti-nutritional factors except catalase. Pod lengthhad significant positive correlation with nutritionalqualities such as anti-nutritional trait proline. Thus, inthis investigation, it was concluded that nutritional

Journal of Progressive Agriculture, Vol.4, No. 2: October, 2013
115
and anti-nutritional qualities of French bean wereclosely and positively related with pod length.Nienhuis and Singh [16] reported that increase in podlength in common bean could be one of the evaluationindex for selecting high nutritive value genotypes.Similar results in French bean were also recorded byNimbalkar et al. [17] and Nath and Korla [15].
Correlation between pod width vs nutritionaland anti-nutritional factors:
Correlation coefficients of nutritional and anti-nutritional factors with pod width revealed that noneof the factors had a significant positive correlationwith pod width (Table 2). This indicates that the podwidth in French bean is not of much importance, andthis trait can be omitted while selecting a nutritionallyrich genotype. Such a non-significant relation of podwidth with nutritional qualities in French bean wasalso reported by Natarajan and Arumugam [18].
Correlation between nutritional and anti-nutritional factors:
The data presented in Table 2 also explain thatamong nutritional factors, protein had a significantpositive correlation with chlorophyll, carotenoids, andH2O2 whereas, it showed a significant negativecorrelation with lipid peroxidise and ascorbic acid.Chlorophyll showed a significant positive correlationwith carotenoids and non-reducing sugar, whereas, itshowed a significant negative correlation withreducing sugar and total sugar. Similarly,carotenoides had a significant positive correlationwith non-reducing sugar, whereas, it showed asignificant negative relation with reducing sugar, totalsugar, lipid peroxidase, and ascorbic acid. In case oftotal sugar, which showed a significant positivecorrelation with ascorbic acid, and it showed asignificant negative correlation with proline.
Table 2: Correlation between pod characteristics and nutritional factors in French bean.
Trait PH PR CH CA RS NRS TS PL H2O2 CL LPO AAPR -0.46CH -0.72 0.95**CA -0.69 0.96** 0.99**RS 0.98** -0.64 -0.85* -0.83*NRS -0.98** 0.62 0.842* 0.82* -1.0**TS 0.97** -0.65 -0.86* -0.83* 1.0* -0.99**PL -0.99** 0.57 0.80* 0.78 -0.99** 0.99** -0.99**H2O2 0.12 0.82* 0.60 0.64 -0.09 0.07 -0.11 0.01CL 0.60 0.42 0.11 0.15 0.42 -0.44 0.41 -0.50 0.86*LPO 0.48 -1.0** -0.95** -0.97** 0.66 -0.64 0.67 -0.59 -0.81* -0.40AA 0.74 -0.94** -1.0** -0.99** 0.86* -0.85* 0.87* -0.82* -0.58 -0.09 0.95PN 0.99** -0.41 -0.68 -0.64 0.96** -0.97** 0.95** -0.98** 0.18 0.65 0.43 0.69
PL -0.88* 0.82* 0.96** 0.95** -0.96** 0.95** -0.96** 0.93** 0.36 -0.16 -0.84* -0.97*PW -0.61 -0.42 -0.11 -0.15 -0.42 0.44 -0.40 0.50 -0.86* -1.0** 0.40 0.09
*Significant at 5% level **Significant at 1% 0.01 level.Note: PH: phenol, PR: protein, CH: chlorophyll, CA: carotenoid, RS: reducing sugar, NRS: non reducing sugar, TS: total sugar, PL: proline,
H2O2: hydrogen peroxide, CA: catalase, LPO: lipid peroxidation, AA: ascorbic acid, PL: pod length, PN: pod number, PW: pod width,
In the case of anti-nutritional factors, phenolsshowed a significant positive correlation withreducing and total sugar, whereas, it recorded asignificant negative correlation with non-reducingsugar and proline. Catalase did not show anysignificant correlation with other factor except asignificant positive relation with H2O2. Lipid
peroxidation had a significant negative interactionwith protein, chlorophyll, carotenoids and H2O2.
Overall, it could be concluded from this studythat an increase in pod length and number of pods perplant should be one of the evaluation index forselecting nutrition-rich genotypes in French bean.
REFERENCES
Al-Jibouri, H.A., Miler, P.A. and Robinson, H.F. 1958.Genotypic and environmental variance and co-variance in an upland cotton cross of inter-specificorigin. Agron. J. (50): 633-636.
Arnon, D.L. 1949. A copper enzyme is isolated chloroplastpolyphenol oxidase in Beta vulgaris. Plant Physiol.24: 1-15.
Bates, L-S., Waldren, R.P. and Teare, I.D., 1973. Rapiddetermination of free proline for water stress studie.,Plant Soil 39, 205-208
Heath, R.L., Mathur, G., Kaul, S. and Sarin, N.B. 1968.Photoperioxidation in isolated chloroplast, kineticsand stoichiometry of fatty acid perioxidation. Arch.Biochem. Biophy. 125: 189-198.

Journal of Progressive Agriculture, Vol.4, No. 2: October, 2013
116
Harris, L. J., and Ray, S. N. 1935. Diagnosis of vitamineC sub nutritional by urine analysis with a note onascorbate value of human milk. Lancet 225: 71-77.
Jana, S.A. and Chaudhari, M.A. 1981. Glycolatemetabolism of three sub-merged aquatic angiospermduring aging. Botany 12: 345-354.
Joshi, B.D. and Mehra, K.L. 1983. Genetic variability inFrench bean. Prog. Hort. 15: 109-111.
Lowry, O.H., Rosenbrough, N.J., Farr, A.L., Randall,R.J. 1951. Protein measurement with Folin phenolreagent. J. Biol. Chem. 193: 265-275.
Lyimo, M., Mugula, J. and Elias, T. 1992. Nutritivecomposition of broth from selected bean varietiescooked for various periods. J. Sci. Food Agric. 58:535-539.
Mahe S, Gausseres N and Tome D 1994. Legume proteinfor human requirements. Grain Leg. 7: 15-17.
Matic, R., Nagel, S., Robertson, S., Young, I.,Mihailovic, V., Mikic, A. and Kirby, G. 2005.Vetch (Vicia spp.) expansion and use in Australia.Biotechnol. Animal Husbandry 21(5-6): 203-207.
Malhotra, S.S. and Sarkar, S.K. 1979. Effects of sulphurdioxide on sugar and free amino acid content of pineseedlings. Physiol. Plant. 47(4): 223-228.
McDonald, S., Prenzler, P.D., Autolovich, M. andRobards, K. 2001. Phenolic content and antioxidantactivity of olive extracts. Food Chem. 73: 73-84.
McKersie, B.D., Hoekstra, F. and Krieg, L. 1990.Differences in the susceptibility of plant membranelipids to peroxidation. Biochem. Et Biophy. Acta1030: 119-126.
Nath, S. and Korla, B.N. 2004. Path analysis of somequantitative characters in dwarf French bean
(Phaseolus vulgaris L.) in relation to pod yield.Legume Res. 27(3): 228-230.
Nienhuis, J. and Singh, S.P. 1988.Genetics of seed yieldand its components in common bean (Phaseolusvulgaris L.) of middle-American origin. II. Geneticvariance, heritability and expected response fromselection. Plant Breed. 101: 155-163.
Nimbalkar, C.A., Baviskar, A.P. and Desai, V.T., 2002.Selection strategy for yield improvement in rajmash(Phaseolus vulgaris L.). Indian J. Genet. 62(4): 349-351.
Natarajan, S. and Arumugam, R. 1980. Inter-relationshipof quantitative traits with pod yield in French bean.Prog. Hort. 12: 43-47.
Prasad, V.S.R., Karmakar, P.G. and Singh, D.P. 1993.Yield stability in bush bean (Phaseolus vulgaris L.).Indian J. Hort. 50(3): 269-272.
Rai, N., Asati, B.S., Yadav, D.S. and Singh, A.K. 2004.Genetic analysis in French bean ( Phaseolus vulgarisL. ). Veg. Sci. 31:138-141.
Rai, N., Singh P.K, Verma, P.K, Yadav, A. andChoubey, T. 2010. Hierachial analysis for geneticvariability in pole type French bean. Indian J. Hort.68: 150-153.
Rastogi, K.B. and Malik, V.P. 1990. Heritability, genetic-advance and inter-relationship on yield and itscomponents in french bean. Adv. Hort. Forestry 1:170-184.
Sadasivam, S. and Manickam, A. 1992. Biochemicalmethod for agriculture sciences. Wiley EasternLimited, New Delhi, pp. 187-191.
Schoonhovern A, Vosyest O (eds.) 1991 Common Beans:Research for Crop Improvement. C.A.B. Int.,Wallingford, UK.
Journal of Progressive Agriculture, Vol.4, No. 2: October, 2013
117
Genetic divergence in greengram (Vigna radiata (l.) Wilczek)
SRIKANTH THIPPANI, ESHWARI, K. B., AND BRAMHESHWAR RAO, M. VDepartment of Genetics and Plant Breeding, College of Agriculture,
Rajendranagar, ANGRAU.Email: [email protected],
Received: August, 2013Accepted: Sept., 2013
ABSTRACT
The present investigation was undertaken to provide information on nature and magnitude ofgenetic diversity among the sixty promising greengram germplasm by using Multivariate analysis.Cluster analysis indicated the presence of considerable genetic divergence among the genotypes. Thegenotypes were grouped into 8 clusters using Toucher Method. Cluster V showed maximum Intraclusters distance while the highest inter clusters distance was observed between clusters VII and VIII.The cluster VIII has high mean for days to maturity, plant height, number of clusters per plant and seedyield per plant. Therefore, it was concluded that more emphasis should be given on cluster VIII forselecting genotypes as parents for crossing with the genotypes of cluster VII which may produce newrecombinants with desired traits.
Key words: Greengram, cluster, diversity divergence.
Green gram [Vigna radiata (L.) Wilczek] is anessential crop in developing countries of Africa, Asiaand Latin America where it is consumed as dry seeds,fresh green pods or leaves. Because of its highproteins, vitamins and minerals contain, green gramplays an important role in human consumption andanimal feeding. It is cultivated in rotation with cerealsand therefore important as a nitrogen fixer formaintaining soil fertility. However, the average yieldof 384 kg ha-1 worldwide is very low (Jaiwal andGulati, 1995). Many biotic and abiotic stresses suchas disease, insects, drought, high temperature, salinityand heavy metals limit green gram yields. Despite theefforts of plant breeders during the past few decades,the yield of green gram has not increasedsubstantially due to lack of sufficient genetic diversityfor desirable traits in the germplasm used forimprovement. It is imperative to further explore thegenetic diversity available in this crop for betterutilization of genetic resources in yield improvement.For improvement of existing greengram varieties theselection of suitable parents for hybridization is animportant step for getting desired recombinants in thesegregating generations (Moll et al., 1962).
Multivariate analysis by means of MahalanobisD2 statistic is a powerful tool in quantifying thedegree of divergence at genotypic level. Therefore, anattempt has been made in the present investigationwith a view to estimate genetic divergence among aset of sixty genotypes of mungbean. It classifies thegenotypes into homogeneous groups/clusters withlittle diversity within cluster while, diversity betweentwo clusters is usually high. Thus, descriptive
genotypes from diverse clusters can be eanmarked forexploitation in hybridization programme dependingupon breeding intention.
MATERIALS AND METHODS
The experimental materials for the presentinvestigation consisted of sixty greengram genotypesfrom different locations in india. The experiment wasconducted in randomized block design (RBD) withthree replications at the College Farm, College ofAgriculture, ANGRAU, Hyderabad, India duringkharif- 2012-2013. Each genotype was grown as athree rows 5 m length with a distance of 30 cm and 15cm between rows and plants, respectively.Observations were recorded on five randomlyselected plants per replication for quantitative traitsnamely days to 50 percent flowering, days tomaturity, plant height, number of branches per plant,number of clusters per plant, number of pods percluster, number of pods per plant, pod length (cm),number of seeds per pod, 100 seed weight (g) andseed yield per plant (g). The mean of five plants wassubjected to statistical analysis. Wilk’s criterion wasused to test the significance of difference in meanvalues for all the eleven characters. The data weresubjected to Multivariate analysis as per Mahalonobis(1936) D2 method as and genotypes were groupedinto different clusters following Toucher's method assuggested by Rao (1952).
Statistical analysis was done by usingWINDOSTAT program.

Journal of Progressive Agriculture, Vol.4, No. 2: October, 2013
118
Table 1. Composition of D2 clusters in greengram genotypes
ClusterNo.
No. ofgenotypes
Names of the Genotypes
I 21 MADHIRA MUNG, TLM-24, IPM-302-02, RM-9-122, TJM-3, PM-10-13, TLM-10-109, PM-723, KM-11-564, ML-16-28, MGG-322, MGG-361, RM-8-665, LGG-450, KM-8-657, HUM-1, KM-8-651, PDM-
54, LGG-522, KM-200, LGG-547II 15 LGG-410, LGG-450, LGG-407, MGG-351, MGG-348, WGG-37, LGG-521, LGG-491, LGG-541,
MGG-359, MGG-330, RM-9-136, ASHA, LGG-549, MGG-295
III 1 NM-1IV 15 DGGC-4, TM-96-2, GM-06-08, PM-11-3, COGG-912, IPM-2K-14-19, OUM-145, PDM-993, TRM-1,
WGG-2, NDMK-10-35, MGG-477, LGG-544, RM-9-128, CO-6V 5 MGG-335, RM-9-126, MGG-360, MGG-347, MGG-341VI 1 UPM-84-178VII 1 TMV-37VIII 1 LGG-479
Table 2. Average intra and inter cluster distances among eight clusters in greengram
RESULT AND DISCUSSION
The cluster analysis of Toucher methodproduced sixty genotypes grouped into eight clusters(Table 1). The genotypes within each cluster werecloser to each other than the genotypes grouped intodifferent clusters. Cluster I was the largest onecomprising of twenty one genotypes followed bycluster II and IV with fifteen genotypes, cluster Vwith five genotypes and cluster III, VI, VII and VIIIwere having only single genotype each. Henry andMathur (2007), Singh et al. (2009), Rahim (2010) andGokulakrishnan et al. (2012).
Average inter and intra cluster distances areshown in Table 2. Maximum intra cluster distancewas observed in cluster V (81.90) followed by clusterIV (75.5) indicating wide genetic variability withinthe genotypes of these clusters. Higher inter clusterdistances were observed between cluster VII andcluster VIII (459.86) followed by cluster VI and
cluster VII (398.83) and cluster VI and cluster VIII(364.33), suggesting wide diversity betweengenotypes of these of these clusters. Therefore,genotype belonging to these clusters may be used inhybridization programme for improvement ofgreengram.
The diversity was also supported by substantialamount of variation among the cluster means (Table3) for 11 characters are presented in Fig. 1 in order tohave a clear picture of relationships among theclusters. Cluster VIII showed by the maximum clustermean values for Days maturity (68.00), plant height(56.00), number of clusters per plant (18.20) and seedyield per plant (12.72), cluster VII for pod length(8.90) and 100-seed weight (4.83), Cluster VI forDays to 50 percent flowering (38.00), number of podsper cluster (5.70) and number of pods per plant(27.80). These results are showed that differentclusters were superior for different characters.
Table 3. Cluster means and percent contribution of different characters in greengram
Cluster Cluster I Cluster II Cluster III Cluster IV Cluster V Cluster VI Cluster VII Cluster VIII
Cluster I 27.8 70.6 42.67 70.7 126.1 168.2 166.7 167.3Cluster II 32.1 102.1 167.2 94.7 270.4 255.6 132.2Cluster III 0.000 89.2 192.8 247.2 160.7 170.1Cluster IV 75.5 203.4 124.3 217.3 252.9Cluster V 81.9 222.8 240.8 248.1Cluster VI 0.000 398.8 364.3Cluster VII 0.000 459.8Cluster VIII 0.000
Cluster No. Days to50%
flowering
Day toMaturity
Plantheight(cm)
Primarybranchesper Plant
No. ofClusters
per plant
No. ofPods percluster
No. of Podsof plant
No. ofSeeds per
pod
Podlength(cm)
100 seed wt(gm)
Seed yieldper plant
(gm)Cluster I 35.09 61.04 35.22 1.251 6.06 3.46 12.73 10.82 6.887 3.42 9.31
Cluster II 34.06 61.93 37.31 1.158 5.91 4.12 12.58 10.98 6.760 3.43 12.60
Cluster III 35.33 67.00 46.80 1.000 6.30 4.40 7.53 11.90 6.880 3.58 8.277
Cluster IV 35.53 62.00 35.09 1.218 6.46 3.61 15.52 10.76 6.630 3.22 7.33
Cluster V 35.73 57.20 38.54 0.973 5.28 4.40 22.01 11.10 6.813 3.74 12.15
Cluster VI 38.00 57.50 42.60 1.000 6.20 5.70 27.80 11.40 6.600 2.69 7.53
Cluster VII 35.00 58.50 23.50 1.067 4.90 2.70 13.20 11.10 8.900 4.81 6.89

Journal of Progressive Agriculture, Vol.4, No. 2: October, 2013
119
Fig 1. Divergence based on clustering pattern (D2
values)among mungbean genotypes
The selection and choice of parents mainly dependupon contribution of character towards divergence(Loganathan et al., 2001) and the contributiontowards genetic divergence is represented in Table 3.Amongst the characters, maximum contribution
towards genetic divergence is by seed yield per plant(50.00%) followed by number of pods per plant(19.44%) and 100-seed weight (17.63%). Theseresults are in accordance with Appalaswamy andReddy (2004), Henry and Mathur (2007),Gokulakrishnan et al. (2012).
It is well known that crosses betweendivergent parents usually produce greater heteroticeffect than closely related ones. Considering theimportance of character towards total divergence, thepresent study indicated that parental lines selectedfrom cluster VIII (LGG 479) for days to maturity,plant height, number of clusters per plant and seedyield per plant, from cluster VII (TMV-37) pod lengthand 100-seed weight and from cluster VI (UPM-84-178) for days to 50 per cent, number of pods perclusters and number of pods per plant could be usedin crossing programme to achieve desired segregants.
REFERENCES
Appalaswamy, A. and Reddy G.L.K. 2004. Geneticdivergence and heterotic studies on mungbean ( Vignaradiata L. Wilczek). Legume Research., 27(2):115 -118.
Gokulakrishnan, J., Sushil Kumar, B. and Prakash, M.2012. Studies on genetic diversity in mungbean(Vigna radiata (L.) Wilczek). Legume Research. 35(1): 50-52
Henry, A. and Mathur, B. K. 2007. Correlation studiesof quality parameters, seed yield and maturity periodin cluster bean. Journal of Arid Legumes, 5(1):70 -74.
Jaiwal, P.K. and Gulati, A. 1995. Current status and futurestrategies of in vitro culture techniques for geneticimprovement of mung bean (Vigna radiata (L.)Wilczek). Euphytica 86: 167-181.
Moll, R.N. et al. 1962. Crop sciences. 2:197-198.
Mahalanobis, P. C. 1936. On the generalized distance instatistics. In: Proc. Nation Acad. Sci., India. 2:49-55.
Rahim, M.A. 2010. Genetic variability, characterassociation and genetic divergence in mungbean (Vigna radiata L. Wilczek). Plant Omics. 3(1):1 -6.
Rao, C. R. 1952. Advanced Statistical Methods inBiometrical Research, John Wiley and Sons, pp 390.
Singh, S.K., Singh, I.P, Singh, B.B. and Onkar Singh2009. Genetic divergence in mungbean greengram(Vigna radiata (L.) Wilczek). Legume Research.,32(2): 98-102.
Cluster VIII 33.00 68.00 56.00 1.200 18.20 5.50 10.83 11.00 6.270 3.38 12.72
Contributionto diversity(%)
0.57 0.68 2.03 5.03 2.66 0.11 19.44 0.11 1.75 17.63 50.00

Journal of Progressive Agriculture, Vol.4, No. 2: October, 2013
120
A study on relationship job performance and different traits of model farmers
N.KISHOR KUMAR AND A.SAILAJADepartment of Agricultural Extension, College of Agriculture
Acharya N.G Ranga Agriculture University (ANGRAU), Rajendranagar, Hyderabad.
Received: July, 2013Accepted: Sept., 2013
ABSTRACT
The Government of Andhra Pradesh took an important decision to appoint about “AdarshaRythus” (Model Farmers) referred to as Farm Science Managers in Prof. Swaminathan’s Report andthe National Policy for farmers to improve the agricultural situvation. The main objective behind theidentification of adarsha rythus is to introduce a nodal functionary between the farmers and theextension staff of agriculture and other line departments to help in bridging the gap between theresearch and extension. The success of the important intervention of the government lies upon thedevelopment of mindset of the adarsha aythus as well as the extension staff by recognizing each otheras a part of the extension system through regular process of sharing information and knowledge.Correlation analysis of independent variables with managerial abilities revealed that age, farm size,farm experience, training received, innovativeness and achievement motivation were positively andsignificantly correlated and that of independent variables with job performance revealed that age,farming experience, extension contact, mass media exposure and achievement motivation werepositively and significantly correlated. The respondents suggested that need and skill based trainingprogrammes are essential for improvement of their managerial abilities and job performance to makethem more effective and purposeful.
Key words: performance and different traits of model farmers
During first five decades of independence, thefocus of Indian agriculture remained on improvingproduction and productivity of food grains to meet thegrowing demands of its increasing population. Theextension approaches and methodologies in all theseyears thus focused on supporting more productionand on maintaining the required pace. Agriculturetoday is, however, seen as a profit oriented enterprisewith farmer taking up many new cash crops ofcommercial value. Under changed situation, the focusof agriculture extension has to be on developingcapacities and capabilities of farmer to acquire andabsorb new knowledge of improved practices. Thechanging economic scenario in India and the need forappropriate agricultural technologies and agriculturalmanagement practices to respond food and nutritionalsecurity, poverty ‘alleviation, diversifying marketdemands, export opportunities and environmentalconcerns is posing new challenges to the technologydissemination system
Keeping in view all the points listed above, astudy on managerial abilities and job performance ofadarsha rythus in Mahaboobnagar District of AndhraPradesh. The results of the study would be ofimmense value to adarsha rythus, administrators andextension agencies in planning and conducting theprogramme successfully at the village level. Hence,the present study was undertaken,to study jobperformance of adarsha rythus in relation to job chartand to study relationship of profile characteristics of
adarsha rythus with their managerial abilities and jobperformance.
MATERIALS AND METHODS
The state of Andhra Pradesh was chosen forstudy as this is the only state in India where adarsharythus were in operation. Mahaboobnagar districtwhich ranks first with highest number of adarsharythus in Andhra Pradesh was purposively selectedfor study. Out of sixty four mandals inMahaboobnagar district, three mandals were selectedrandomly.From each mandal, forty adarsha rythuswere selected randomly thus one hundred and twenty(120) respondents were selected for study.
Job performance was the dependentvariables selected for study while age, education,farming experience, farm size, extension contact,social capital, training received, mass mediaexposure, innovativeness and aachievementmotivation were independent variables selected forstudy.
Job performance is operationally defined as themanner in which adarsha rythus carried out job tasksassigned to him.
A structured schedule consisting of nineteenitems on three point continuum i.e. good (3), average(2), poor (1). with corresponding weightages wasused to measure the perception regarding jobperformance. Total score of a respondent was workedout by summing up the scores on all statements. The
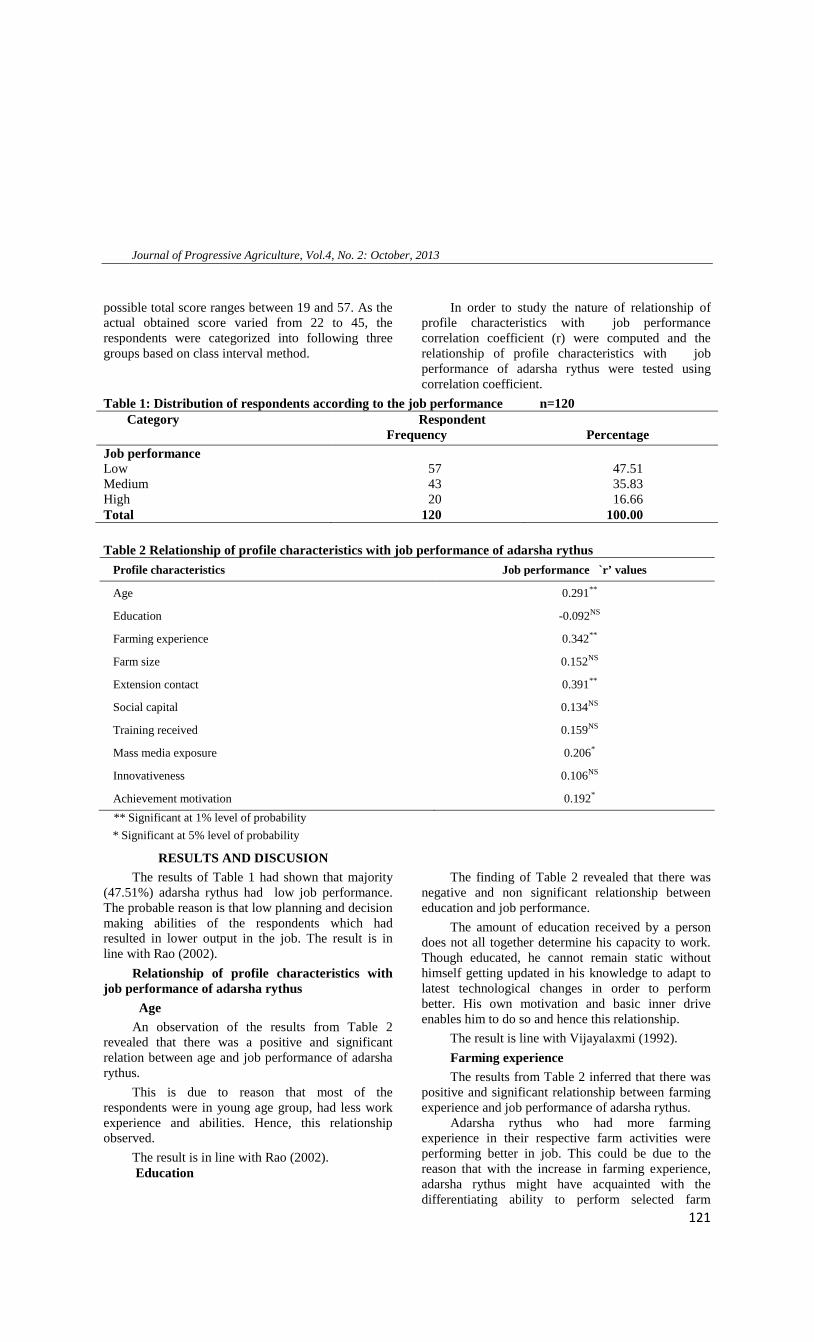
Journal of Progressive Agriculture, Vol.4, No. 2: October, 2013
121
possible total score ranges between 19 and 57. As theactual obtained score varied from 22 to 45, therespondents were categorized into following threegroups based on class interval method.
In order to study the nature of relationship ofprofile characteristics with job performancecorrelation coefficient (r) were computed and therelationship of profile characteristics with jobperformance of adarsha rythus were tested usingcorrelation coefficient.
Table 1: Distribution of respondents according to the job performance n=120Category Respondent
Frequency PercentageJob performanceLow 57 47.51Medium 43 35.83High 20 16.66Total 120 100.00
Table 2 Relationship of profile characteristics with job performance of adarsha rythus
Profile characteristics Job performance `r’ values
Age 0.291**
Education -0.092NS
Farming experience 0.342**
Farm size 0.152NS
Extension contact 0.391**
Social capital 0.134NS
Training received 0.159NS
Mass media exposure 0.206*
Innovativeness 0.106NS
Achievement motivation 0.192*
** Significant at 1% level of probability
* Significant at 5% level of probability
RESULTS AND DISCUSIONThe results of Table 1 had shown that majority
(47.51%) adarsha rythus had low job performance.The probable reason is that low planning and decisionmaking abilities of the respondents which hadresulted in lower output in the job. The result is inline with Rao (2002).
Relationship of profile characteristics withjob performance of adarsha rythus
AgeAn observation of the results from Table 2
revealed that there was a positive and significantrelation between age and job performance of adarsharythus.
This is due to reason that most of therespondents were in young age group, had less workexperience and abilities. Hence, this relationshipobserved.
The result is in line with Rao (2002).Education
The finding of Table 2 revealed that there wasnegative and non significant relationship betweeneducation and job performance.
The amount of education received by a persondoes not all together determine his capacity to work.Though educated, he cannot remain static withouthimself getting updated in his knowledge to adapt tolatest technological changes in order to performbetter. His own motivation and basic inner driveenables him to do so and hence this relationship.
The result is line with Vijayalaxmi (1992).
Farming experienceThe results from Table 2 inferred that there was
positive and significant relationship between farmingexperience and job performance of adarsha rythus.
Adarsha rythus who had more farmingexperience in their respective farm activities wereperforming better in job. This could be due to thereason that with the increase in farming experience,adarsha rythus might have acquainted with thedifferentiating ability to perform selected farm

Journal of Progressive Agriculture, Vol.4, No. 2: October, 2013
122
activities with available resources and man power.Based on experience gained by adarsha rythus, theycould better understand and solve the problems facedby farmers effectively. Hence, this type ofrelationship was observed.
Farm sizeAn observation of the results from Table 2
revealed that there was a positive and non significantrelationship between farm size and job performance.
Farm size of adarsha rythus does not matter if hewishes to perform the job assigned to him well.Hence, this type of relationship was observed.
Extension contactIt was observed from the results of Table 2 that
there was a positive and significant relationshipbetween extension contact and job performance ofadarsha rythus.
The possible reason for the above relationshipmight be due to the fact that adarsha rythus who havegot more contacts with extension agencies will havemore knowledge and they may be motivated toperform better.
Social capitalAn insight into the results of Table 2 revealed
that there was a positive non significant relationshipbetween social capital and job performance of adarsharythus.
This indicates that with increase of socialcapital, there is no significant increase in jobperformance. Moreover, majority of respondents hadlow level of trust and solidarity gained and mediumextent of trust of farmers. Hence, this type ofrelationship was observed.
Training receivedThe finding of Table 2 revaled that there was
positive and non significant relationship betweentraining received and job performance.
This trend might be due to that the quality of thetraining imparted might be poor. The job performanceof adarsha rythus was found to be very low. Theseabove facts might be the reason for the relationshipnoticed.
Mass media exposureAn observation of the results Table 2 revealed
that there was a positive and significant relationshipbetween mass media exposure and job performance ofadarsha rythus.
The exposure of adarsha rythus to differentprint and electronic media to updates his knowledgeabout latest technologies and the same will be transferto the farmers in the village in easly andunderstandable manner and thus performs his jobwell.
InnovativenessAn observation of the results of Table 2 revealed
that there was a positive and non significantrelationship between innovativeness and jobperformance of adarsha rythus.
Due to low innovativeness, they failed to applythe learnt practice and he had poor job performance.
Achievement motivationIt can be viewed from results of Table 2 that
there was a positive and significant relationshipbetween achievement motivation and job performanceof adarsha rythus.
An adarsha rythu with achievement motivationwill have the trust with self to compete with othersand show his standard of excellence. Inherent motiveforce to achieve more things in the job and more zealto do lot in their job could have increased theirperformance.
CONCLUSION
Farmer participation and feedback should becomean integral part of agricultural resource and technologytransfer. Considering that majority of our farmers aresmall and resource poor and depend heavily on publicgood technologies and information, the public sectoragricultural extension men and women should beempowered and sensitized to meet the demandsparticularly by forging research-extension-education-farmer-market linkages.
As majority of respondents were found to be non-practicing farmers with low farming experience and lowachievement motivation, state department of agricultureneed to strictly adhere to guidelines in selectionprocedure of adarsha rythus. Therefore, it is proposed toselect farmers who have at least a minimum of 5 yrs offarming experience to serve as a model farmer intransfer of technology.
As a part of screening in selection procedure,achievement tests need to be conducted to select bestperformers as adarsha rythus.
As majority of adarsha rythus had less farm sizedue to which they were unable to practice thetechnologies in their own situation and hence it isproposed to consider large farming size, as one of thecriteria for selection of adarsha rythus as it helps intesting the technology feasibility before dissemination.
The respondents suggested that need and skillbased training programmes are essential forimprovement of their managerial abilities and jobperformance to make them more effective andpurposeful. Participatiory training need assessment ofadarsha rythus needs to be done. It should form the basisfor content formulation. Skill based training programmeswith demonstrations included should teach him a newskill (or) an old skill in a better way besides giving himopportunity to practice the same under supervision oftrainer which helps him to boost his confidence andperformance.
Journal of Progressive Agriculture, Vol.4, No. 2: October, 2013
123
REFERENCES
Agarwal, S K 1998. Organizational factors affecting jobperformance of agricultural extension personnel intraining and visit system. Madhya Pradesh, Journal ofExtension Education Vol. (1), No.1,pp: 31-34.
Aghazia, 2008. Training needs of onion cultivatiors inAfghanistan. M.Sc. (Ag.) Thesis, Acharya N. G.Ranga Agricultural University, Hyderabad.
Aung, K. N 2005. Managerial capabilities of assistanttownship managers of agricultural services inMandalay division of Myanmar country. M.Sc. (Ag.)Thesis, Acharya N.G. Ranga Agricultural University,Hyderabad.
Bhagyalakshmi, K 2002. A critical study on micro-enterprise management by rural women in RangaReddy district of Andhra Pradesh. Ph.D. Thesis,Acharya N. G. Ranga Agricultural University,Hyderabad.
Gopal Sataya, P V 1995. Managerial Abilities of ScientistHeading the Research Station of Andhra PradeshAgricultural University. M.Sc.(Ag) Thesis, APAU,Rajendranagar, Hyderabad.
Rao Venkata, P 2004. A study on conflict managementbehavior of extension personnel in the Department of
Agriculture in A.P., Ph.D thesis, ANGRAU,Hyderabad.
Sailaja, A 1996. A study on the assessment of Trainingneeds of Farm Women of Andhra Pradesh. Ph.D.Thesis, Andhra Pradesh Agricultural University,Rajendranagar, Hyderabad.
Sreedevi, R 1996. A study on gender analysis inmanagerial abilities and farming performance inKrishna Godavari Zone of Andhra Pradesh. Ph.D.Thesis, Acharya N. G. Agricultural University,Hyderabad.
Venkatesh Prasad, G and Hanumanthappa, H S 1992.Job performance of seed farm managers. IndianJournal of Extension Education Vol. (28), No. 1&2,pp: 10-11.
Waris, 1990. Role perception and role performance ofextension personnel from single window system.Maharastra Journal of Extension Education Vol. (21),pp: 280-285.
Ziaul Karim, A S M and Mahboob, S G 1992. Factors ofjob performance of subject matter officers. IndianJournal of Extension Education Vol. (28), No.1&2,pp: 20-24.
.

Journal of Progressive Agriculture, Vol.4, No. 2: October, 2013
124
Suitable varieties and agro-chemicals for yield optimization of wheat in arid Rajasthan
N. K. SHARMADirectorate of Research
S. K. Rajasthan Agricultural University, Bikaner-334006Received: July, 2013Accepted: Sept., 2013
ABSTRACT
Twenty eight wheat varieties were evaluated for four years (2009-10 to 2012-12) under irrigatedsituation at Agricultural Research Station, Keshwana, Jalore (Rajasthan). The seed yield of differentvarieties ranged between 44.49 q/ha to 64.51 q/ha with the average of 53.20 q/ha and maximum wasfound in Raj-4079 followed by Raj-4083, KRL 1-4, Raj-4037, Raj-4161, Raj-4188, Raj-3765, Raj-3077,DBW-50, KRL-213, Lok-1 and WH-1021 with 60.98, 58.60, 57.53, 57.13, 56.68, 55.60, 54.60, 54.03and 53.92 q/ha, respectively. In another experiment, seed soaking in thiourea 500 ppm or ascorbic acid100 ppm for 6-8 hrs; and foliar spray of thioglycolic acid 100 ppm or ascorbic acid 100 ppm or thiourea500 ppm at grain filling stage enhanced seed yield of wheat. Participatory action research undersalinity conditions at farmer’s fields indicate that seed soaking in 3% Na2SO4 for 6-8 hrs improved seedgermination and crop establishment; and foliar spray of 0.2% K2SO4 along with thiourea 500 ppm orascorbic acid 100 ppm at tillering and flowering stages provided better growth and productionenvironment and ultimately enhanced seed yield of wheat.
Key words: Agro-chemicals, foliar spray, seed soaking, seed yield, varietal evaluation, wheat
The wheat productivity in India has witnessedsignificant increase during last 50 years with the useof improved varieties coupled with better soil, waterand fertilizer management practices and technologies.During 2011-12, India has recorded all time high94.88 million tonnes of wheat production from anarea of 29.90 million hectare. It is projected that bythe year of 2030, India needs to produce 100 milliontonnes of wheat to feed the ever growing population,which is a major challenge under changing climaticscenario (Anonymous, 2012-13). In Rajasthan, wheathas occupied an area of 2.32 million hectare with theproduction of 6.75 million tonnes and productivity of2912 kg/ha (Anonymous, 2009-10). The availabilityof water in western Rajasthan is meagre and qualityof water in general is also not good enough. Usually,farmers apply 7-8 irrigations to wheat crop because ofhigh temperature and poor water holding capacity ofthe soil. The environmental factors such astemperature, fertility status, soil characteristics andrainfall play an important role in the varietalperformance (Asif et al., 2003).
Wheat improvement programme in India issuccessfully developing many commercial varietiesfor different agro-ecological situations. But despite ofthe availability of newly developed high potentialvarieties, many of the old varieties are still occupyinglarge area under cultivation due to poor extension andweek seed production and distribution system. Theseobsolete varieties are characterised by their low yieldand disease susceptibility and therefore there is anurgent need to replace them (Ortiz-Ferrara, et al,2007). Behara (1994) reported that differentgenotypes of cereal respond differently in agro-climatic conditions of a particular area due todifference in their genetic makeup and
physiological process. Agro-chemicals play animportant role in photosynthesis and growthregulation.
Therefore, looking to the importance, threeseparate field trials on varietal evaluation and cropmanagement through agro-chemicals were conductedfor yield optimization of wheat under irrigatedsituation of arid Rajasthan.
MATERIALS AND METHODS
A field experiment has been conducted for fouryears at experimental farm of Agricultural ResearchStation, Keshwana, Jalore. The site is situated atlatitude of 25o 23.115’ N and longitude of 72o 30.726’E, elevation 149.9 msl and has a tropical arid climatewith mean annual rainfall of 421 mm. Soil at the sitewas clay loam slightly saline in reaction (pH 8.7) andlow in organic carbon (0.23 %). A total number of 28varieties were tested in a randomised block designwith 3 replications. The sowing was done onNovember 11th, 29th, 14th and 22nd in 2009, 2010,2011 and 2012 respectively. Plot size was kept as2.5m x 4.0m accommodating 10 rows at 22.50 cmspacing with seed rate of 100 kg/ha. A fertilizer doseof N 120 kg, P 40 kg and K 30 kg/ha was applied tothe crop. A half dose of N and full dose of P and Kwere applied at the time of sowing, in the form ofurea, DAP and muriate of potash. The remaining halfof the N was top dressed in the form of urea in twosplits at crown root initiation and tillering stagesalong with second and third irrigation. Additionalfoliar spray of zinc sulphate 0.2% at tillering stage,1% soluble NPK (19:19:19) at flowering and thiourea500 ppm at grain development stage was also appliedto the crop for harvesting the higher yield.

Journal of Progressive Agriculture, Vol.4, No. 2: October, 2013
125
One more experiment with 10 treatmentcombinations was also conducted to see the effect ofseed soaking and foliar spray of agro-chemicals onwheat under irrigated situation. The trial was laid outin randomised block design with 4 replications.Sowing was done on 14.11.2011 and 20.11.2012,respectively. Wheat variety KRL-1-4 was used forexperimentation. A fertilizer dose of N 120 kg, P 40kg and K 30 kg/ha was applied to the crop.
Another experiment was conducted undersalinity irrigated conditions at farmer’s fields during2011-12 with the objectives to see the effect of seedsoaking and foliar spray of agro-chemicals on wheatyield. Five treatment combinations of seed soakingand foliar spray of different agro-chemicals weretested in strips of 0.40 ha at five farmer’s fields.Variety KRL 1-4 was used for experimentation. Theexperimental inputs like seed, fertilizers and agro-chemicals as per requirement of the treatments wereprovided to farmers. However, other managementpractices adopted by farmers might be varied fromplace to place.
In station trials, eight flood irrigations, each ofabout 6 cm depth, were applied through check basinmethod at 15, 25, 45, 55, 70, 85, 95 and 110 daysafter sowing. Two hand weeding were carried out at30 and 50 days after sowing to have the crop freefrom weeds. The observations were recorded on seedand biological yield were analyzed using standardanalysis of variance (ANOVA) technique throughExcel software of Microsoft Office.
RESULTS AND DISCUSSION
Varietal performanceDifferences among varieties for seed and
biological yield were found statistically significantduring all four years. Year wise average seed yieldranged between 42.91 and 62.72 q/ha. This widevariation in the productivity might be affected bychange in sowing time as well as fluctuation inenvironmental factors.
Variety wise average seed yield varied between44.49 q/ha to 64.51 q/ha with the average of 53.20q/ha and maximum was found in Raj-4079 followedby Raj-4083 and KRL 1-4 with 60.98 and 58.60 q/ha,respectively. However, other varieties performedabove average are Raj-4037, Raj-4161, Raj-4188,Raj-3765, Raj-3077, DBW-50, KRL-213, Lok-1 andWH-1021 with the seed yield of 57.53, 57.13, 56.68,55.60, 54.60, 54.03 and 53.92 q/ha, respectively(Table-1). The minimum seed yield was recorded invariety Sujata. The biological yield of varietiesranged between 117.90 and 152.67 q/ha with theaverage of 135.40 q/ha and maximum was found inRaj 4161 followed by DBW-16, Raj-4079, Raj-3077,PBW-621, KRL-213 with 145.67, 144.34, 143.56,142.50, 142.45 q/ha, respectively. Therefore, allvarieties superior to the average may be cultivated forenhancing the production and productivity as well as
varietal diversity for sustainable production in aridRajasthan. Khan et al. (2011) evaluated wheatvarieties and reported similar results.
Effect of seed soaking and foliar spray ofagro-chemicals
Differences among treatments for seed yieldwere found statistically significant during both theyears. Year wise average seed yield ranged between33.86 q/ha and 43.96 q/ha. The high degree offluctuation in the seed yield might be affected by thechange in climatic conditions. However, treatmentwise, seed yield varied between 35.69 q/ha and 41.42q/ha with the average of 38.92 q/ha; and maximumyield was found in the treatment of seed soaking inascorbic acid 100 ppm for 6-8 hrs followed by foliarspray of ascorbic acid 100 ppm at grain filling stage(Table-2). Among seed soaking treatments, maximumyield was found in thiourea followed by ascorbic acid.However, foliar spray of all three agro-chemicals hasenhanced the seed yield of wheat and degree ofenhancement was more or less same.
Therefore, seed soaking in thiourea 500 ppm orascorbic acid 100 ppm for 6-8 hrs followed by foliarspray of thioglycolic acid 100 ppm or ascorbic acid100 ppm or thiourea 500 ppm at grain filling stage isbeneficial in yield optimization of wheat.
Effect of seed soaking and foliar spray ofagro-chemicals under salinity conditions
Results revealed that seed yield among differenttreatments ranged between 20.26 and 23.03 q/ha withthe average of 22.26 q/ha and maximum was foundwith seed soaking in thiourea 500 ppm for 6-8 hrsfollowed by foliar spray of thiourea 500 ppm alongwith K2SO4 0.2% at flowering and grain developmentstage. The yield enhancement by foliar spray ofascorbic acid 100 ppm along with 0.2% K2SO4 wasalso more or less same. The foliar spray of agro-chemicals is expected to induce tolerance againstenvironmental stresses. Mixed application of theseagro-chemicals may have synergistic effect on cropyield. These agro-chemicals play an important role inphotosynthesis and growth regulation. Theirapplication support stomata mechanism for enhancingwater use efficiency and also as an antioxidant whichprotects plants against oxidative stress (Gething,1990; Smirnoff, 1996). At farmer’s fields, yield levelsranged between 13.25 and 36.12 q/ha; which indicateshigh degree of heterogeneity in the soil and waterparameters as well as management practices of thefarmers. Therefore, seed soaking in 3% Na2SO4 for 6-8 hrs may be done for enhancing germination andestablishment; and foliar spray of thiourea 500 ppmalong with K2SO4 0.2% or ascorbic acid 100 ppmalong with 0.2% K2SO4 may be applied for providingbetter growth and production environment for wheatunder salinity conditions.

Journal of Progressive Agriculture, Vol.4, No. 2: October, 2013
126
Table-1. Seed and biological yield of wheat varieties under irrigated situation
Varieties Seed yield (q/ha) Biological yield (q/ha)2012-13 2011-12 2010-11 2009-10 Mean 2012-13 2011-12 2010-11 2009-10 Mean
Raj-1482 42.43 53.97 38.40 62.50 49.33 104.53 139.00 99.62 128.43 117.90Raj-3077 53.02 60.20 44.83 68.68 56.68 136.67 163.50 125.87 148.20 143.56Raj-3765 - 63.73 48.22 59.43 57.13 - 151.67 122.13 121.87 131.89Raj-4037 52.00 67.73 43.12 67.28 57.53 130.00 145.33 124.87 140.70 135.23Raj-4079 54.55 74.47 - - 64.51 135.00 153.67 - - 144.34Raj-4083 53.23 72.27 44.90 73.51 60.98 126.67 161.67 118.07 145.13 137.89Raj-4120 46.30 62.73 46.25 49.40 51.17 100.80 147.67 123.80 118.75 122.76Raj-4161 51.03 63.63 - - 57.33 141.33 164.00 - - 152.67Raj-4188 44.63 65.27 39.80 75.70 56.35 112.67 166.33 124.02 161.93 141.24Raj-6560 49.70 63.33 42.27 56.45 52.94 101.13 152.67 118.60 133.33 126.43Raj MolyaRodhak-1
46.93 54.87 - - 50.90 110.07 139.33 - - 124.70
PBW-550 45.07 65.80 32.57 59.51 50.74 100.67 158.47 98.02 117.47 118.66PBW-590 34.93 56.37 45.95 62.55 49.95 106.87 146.67 124.93 133.10 127.89PBW-343 41.70 53.33 43.87 62.34 50.31 117.83 151.67 120.87 163.50 138.47PBW-373 37.30 58.00 45.10 65.76 51.54 112.67 159.67 125.20 134.67 133.05PBW-621 41.85 59.47 - - 50.66 132.33 152.67 - - 142.50KRL 1-4 49.60 63.03 47.52 74.26 58.60 120.33 158.33 125.82 146.50 137.75KRL 19 39.37 56.73 46.45 63.77 51.58 115.33 143.67 133.68 152.93 136.40KRL 210 38.43 61.33 37.57 68.45 51.45 127.33 146.33 120.08 157.93 137.92KRL 213 40.90 67.40 42.27 67.83 54.60 146.50 153.33 108.42 161.53 142.45WH 1021 46.63 61.88 42.95 64.22 53.92 136.67 160.33 123.78 146.63 141.85DBW-16 40.37 61.17 - - 50.77 141.33 150.00 - - 145.67DBW-17 39.33 60.80 43.73 56.56 50.11 131.33 154.00 122.90 141.57 137.45DBW-50 47.12 64.07 - - 55.60 138.67 143.83 - - 141.25HD-2967 44.07 58.60 - - 51.34 124.67 138.67 - - 131.67LOK-1 48.47 61.53 49.73 56.38 54.03 114.33 149.83 132.88 125.80 130.71Sujata 36.87 54.10 37.73 49.27 44.49 144.33 157.33 112.90 125.00 134.89K-65 33.03 56.70 37.80 53.20 45.18 133.67 161.50 105.13 135.80 134.03Mean 44.40 61.52 42.91 62.72 53.20 123.84 152.54 119.60 140.04 135.40SEm+ 1.78 2.12 1.69 1.98 - 5.55 4.50 4.19 6.41 -CD (p=0.05) 5.06 6.00 4.82 5.64 - 15.75 12.76 11.95 18.28 -CV (%) 6.89 5.96 6.89 5.49 - 7.76 5.11 6.10 7.89 -
Table-: Seed yield of wheat as affected by seed soaking & foliar spray of agro-chemicalsTreatments Seed yield (q/ha)
2011-12 2012-13 MeanSeed soaking in thiourea 500 ppm for 6-8 hrs 33.45 43.19 38.32Seed soaking in ascorbic acid 100 ppm for 6-8 hrs 33.52 42.79 38.16Seed soaking in thioglycolic acid 100 ppm for 6-8 hrs 30.15 41.23 35.69Seed soaking in water for 6-8 hrs 31.95 41.11 36.53Foliar spray of thiourea 500 ppm at grain filling stage 34.38 45.09 39.74Foliar spray of ascorbic acid 100 ppm at grain filling stage 34.58 45.96 40.27Foliar spray of thioglycolic acid 100 ppm at grain filling stage 35.08 45.98 40.53Seed soaking in thiourea 500 ppm for 6-8 hrs + foliar spray of thiourea 500 ppm at grainfilling stage 35.90 45.54 40.72Seed soaking in ascorbic acid 100 ppm for 6-8 hrs + foliar spray of ascorbic acid 100 ppm atgrain filling stage 37.25 45.58 41.42Seed soaking in thioglycolic acid 100 ppm for 6-8 hrs + foliar spray of thioglycolic acid 100ppm at grain filling stage 32.35 43.23 37.79Mean 33.86 43.97 38.92SEm+ 1.09 1.07 -CD (p=0.05) 3.18 3.12 -CV (%) 6.47 4.89 -
Table-: Seed yield of wheat as affected by seed soaking and foliar spray of agro-chemicals under salinity irrigated conditions at farmer’s fieldsTreatments Seed yield (q/ha)
Far.-1 Far.-2 Far.-3 Far.-4 Far.-5 MeanSeed soaking in Na2SO4 3% for 6-8 hrs 22.73 12.50 22.87 16.62 35.81 22.11Seed soaking in thiourea 500 ppm +Foliar spray of thiourea 500 ppm & ZnSO4
0.2% at flowering and grain development stage 23.51 13.50 22.62 16.31 37.04 22.59Seed soaking in thiourea 500 ppm for 6-8 hrs + foliar spray of thiourea 500ppm & K2SO4 0.2% at flowering and grain development stage 23.21 14.37 24.87 16.73 37.40 23.32Seed soaking in thiourea 500 ppm for 6-8 hrs + foliar spray of 0.2% K2SO4 +100 ppm ascorbic acid at tillering and flowering stage 23.43 14.25 24.50 16.12 36.84 23.03Control 21.07 11.62 21.37 13.76 33.50 20.26Mean 22.79 13.25 23.25 15.91 36.12 22.26Far.-1: Shaitan Singh- Balwara, Sayala, Jalore Far.-2: Gopal Singh- Dhansa, Bhinmal, Jalore Far.-3: Tola Ram Meena Narawna- Ahore,Jalore Far.-4: Rata Ram Lohar- Keshwana, Jalore Far.-5: Vala Ram Chaudhary- Keshwana, Jalore

Journal of Progressive Agriculture, Vol.4, No. 2: October, 2013
127
CONCLUSION
Wheat varieties Raj-4079, Raj-4083, KRL 1-4,Raj-4037, Raj-4161, Raj-4188, Raj-3765, Raj-3077,DBW-50, KRL-213, Lok-1 and WH-1021 appearsuitable for cultivation in arid Rajasthan. Cropmanagement practices including seed soaking inthiourea 500 ppm or ascorbic acid 100 ppm for 6-8hrs and foliar spray of thioglycolic acid 100 ppm orascorbic acid 100 ppm or thiourea 500 ppm at grainfilling stage is beneficial in yield optimization ofwheat. Under salinity conditions, seed soaking in 3%Na2SO4 for 6-8 hrs improved seed germination andcrop establishment; and foliar spray of 0.2% K2SO4
along with thiourea 500 ppm or ascorbic acid 100ppm at tillering and flowering stages provided bettergrowth and production environment and ultimatelyenhanced seed yield of wheat.
AcknowledgementsFinancial support received from RKVY project
and seed material of different varieties of wheatprocured from Agricultural Research Station,Durgapura, Jaipur and Central Soil Salinity ResearchInstitute, Karnal for experimentation is thankfullyacknowledged.
REFERENCES
Anonymous, 2009-10. Rajasthan Agricultural Statistics at aGlance. Commissionerate of Agriculture to Government ofRajasthan, Jaipur, 147 p.
Anonymous, 2012-13. Annual Report. Directorate of WheatResearch, Karnal, 112 p.
Asif M, Mustafa SZ, Asim M, Kisana NS, Mujahid MY,Ahmad I and Ahmed Z 2003. Stability of wheat genotypesfor grain yield under diverse rainfed ecologies of Pakistan.Asian J. Plant Sci. 2(4): 400-402.
Behera AK 1994. Response of wheat varieties tosowing dates. Ind. J.Agric., 42: 247-253.
Gething PA 1990. Potassium and water relationships. In: Potashfacts. IPI, Bern.
Khan S, khan J, Islam N and Islam M 2011. Screening andevaluation of wheat germplasm for yield, drought anddisease resistance under rainfed conditions of uplandBaluchistan. Pak. J. Bot. 43(1): 559-563.
Ortiz-Ferrara G, Joshi AK, Chand R, Bhatta MR, Mudwari A,Thapa DB, SuWan MA, Saikia TP, Chatrath R,Witcombe JR, Virk DS, and Sharma RC 2007. Partneringwith farmers to accelerate adoption of new technologies inSouth Asia to improve wheat productivity. Euphytica 157:399–407.
Smirnoff N 1996. The function and metabolism of ascorbic acid inplants. Annals of Botany 78: 661-669.

Journal of Progressive Agriculture, Vol.4, No. 2: October, 2013
128
DECLARATIONForm IV
(See Rule 8)
Statement about ownership and other particular of Journal of Progressive Agriculture
Place of publication : Ajmer, Rajasthan, India
Periodicity of publication : Half Yearly
Printer’s Name : Shree Offset, Printing Press, Ajmer.
Nationality : Indian
Address : M/S Shree Offset, Printing Press,Kesar Ganj, Ajmer (Raj.)
Publisher’s name : Sh. Ram Singh BhatiPresident of Samaj Kalyan Avam Samannvit VikasSanstha, Ajmer (Rajasthan)
Address : 316/A, Christian Ganj, Ajmer (Raj.) India
Editor’s name : Sh. Ram Singh BhatiPresident of Samaj Kalyan Avam Samannvit VikasSanstha, Ajmer (Rajasthan)
Nationality : Indian
Address : 316/A, Christian Ganj, Ajmer (Raj.) India
Name and address of individual who ownthe newspapers/journal partners andshareholders holding more than 1% of thetotal capital
Samaj Kalyan Avam Samannvit Vikas Sanstha, Ajmer(Rajasthan) India
.I, Ram Singh Bhati, publisher, printer and owner of this journal hereby declare that particular given are true to thebest of my knowledge and belief.
Sd/-
Dated: 26th Oct. 2013 (Ram Singh Bhati)