LOCOMOTIVE DATA ACQUISITION PACKAGE - eScholarship
133
Lawrence Berkeley National Laboratory Lawrence Berkeley National Laboratory Title LOCOMOTIVE DATA ACQUISITION PACKAGE Permalink https://escholarship.org/uc/item/9n39r4nb Author Abbott, Robert K. Publication Date 2011-04-18 eScholarship.org Powered by the California Digital Library University of California
-
Upload
khangminh22 -
Category
Documents
-
view
2 -
download
0
Transcript of LOCOMOTIVE DATA ACQUISITION PACKAGE - eScholarship

Lawrence Berkeley National LaboratoryLawrence Berkeley National Laboratory
TitleLOCOMOTIVE DATA ACQUISITION PACKAGE
Permalinkhttps://escholarship.org/uc/item/9n39r4nb
AuthorAbbott, Robert K.
Publication Date2011-04-18
eScholarship.org Powered by the California Digital LibraryUniversity of California
I I I I
lBl-7945UC-96
1K.Abbott
KirstenMullenmer
Locomo/ive
Dolo Recorder Mognel!c Tope Playback Unit
Commercial Off-SiteTelephone Lines Digital Computer GraphicalOulpul
Large Prinlours
Computer Terminal Reduced 0010
1r
Not to be taken from this room
Prepared for the U. S. Department of Transportation under Interagency AgreementAR-74348 with the U. S. Department of Energy by the Lawrence Berkeley Laboratory
under Contract W-7405-ENG-48.
~~~~~~~-"~~ L.b'LAr\L NOTICE~~~~~~~~
This report was as an account of work sponsored by theUnited States Government. Neither the United States nor the Department of nor any of their employees, nor any of their con-
subcontractors, or their employees, makes any warranty,express or implied, or assumes any legal liability or responsibility forthe accuracy, or usefulness of any information, apparatus, product or process disclosed, or represents that its use wouldnot infringe privately owned rights.
in the States of America
Available fromNatlC)]1cU Technical Information ServiceU. S. Department of Commerce
5 Port Royal RoadSpringfield , VA 22161Price: , $ 6.50 Domestic; $13.00 Foreign
$ 3.00 Domestic; $ 4.50 Foreign
1. Report No. 2. Government Accession No.
T~chl'licai R~port Documentation Page
3. Recipient's Catalog No.
4. Title and Subtitle
Locomotive Data Acquisition Package
7. Author1s) F.A, Kirsten, R,K. Abbott,D,R, Mullen. D,B. Turner
9. Performing Organi zation Name and Address
Lawrence Berkeley LaboratoryOne Cyclotron RoadBerkeley, California 94720
12. Sponsoring Agency Nome and Address
U.S, Department of TransportationFederal Railroad AdministrationOffice of Research and DevelopmentWashington, D.C. 20540
15. Supp I..mentory Note s
16. Abstract
5. Report Date
July 19786. Performing Organi zation Code
~~
8. Performing Organization Report No.
LBL~7945
10. Work Unit No. (TRAIS)
11. Contract or Gront No.
AR~74348
13. Type of Report and Period Covered
Phase I Final ReportOctober 1977 - July 1978
14. Sponsoring Agency Code
DOT!FRA!OR&D!RRD-12
A preliminary examination of the problems associated with railroad locomotivedata acquisition is presented. An approach toward the design of a microprocessorbased locomotive data recorder is also presented. Special attention is placedon determining the functional characteristics and environmental specificationsrequired for the system. The system described consists of a magnetic tapedigital data recorder, an ensemble of transducers, and analysis software.The system described is to be used as a research tool.
17. Key Words
Railroad Locomotive, Microprocessor,
Data Acquisition
18. Distribution Statement
Document is available to the publicthrough the National Technical InformatiorService, Springfield, Virginia 22161
19. Securily Classil. (of lhis reparl)
Unclassified
20. Security Classif. (of lhi s page)
Unclassified
21. No. of Pages 22. Price
Form DOT F (8-72) Reproduction of completed page authorized

ACKNOWLEDGMENT
The authors would like to acknowledge the following: 1) Dr. Andrew M.
Sessler, Director of Lawrence Berkeley Laboratory, and Walter D. Hartsough,
Associate Director and Division Head, Engineering and Technical Services
Division, for their encouragement; 2) Dr. D. Theodore Scalise, Department
Head, Engineering Sciences Department, for his guidance and encouragement;
3) the Federal Railroad Administration, the Transportation Systems
Center, and the Transportation Test Center, for their help and encourage
ment; and 4) the following railroads, for their time and insight,
which helped to keep this work relevant -- Southern Pacific Transportation
Company, Union Pacific Railroad, Atchison, Topeka and Santa Fe Railway
Company, Burlington Northern, Illinois Central Gulf Railroad, Canadian
National Railways.

-iii-
PREFACE
The effort described in this report was carried out under Inter
agency Agreement AR-74348 between the U.S. Department of Energy and the
U.S. Department of Transportation. It is part of a larger program to
provide a technical basis for improving transportation service,
efficiency and productivity. This program is sponsored by the Federal
Railroad Administration, Office of Freight Systems.
During Phase I of this project, the functional requirements of the
Locomotive Data Acquisition Package (LDAP) were studied. In order to
verify the feasibility of designing a system to meet these requirements,
a preliminary design has been formulated. In this report, details of
this preliminary design are discussed. It should be borne in mind that
the architecture of the prototype to be designed and built in Phase II
may differ from that described in the Phase I report. However, the
functional and operational characteristics will be essentially similar.

LOCOMOTIVE DATA ACQUISITION PACKAGE
PHASE I ~ FINAL REPORT
Definition of Functional Requirements
Table of Contents
1. Introduction 1
1.1 Purpose of this Report • • • • 11.2 An Overview of the Locomotive Performance Analysis
(LPA) Program • • • • • • • • • • • • • • • 21.3 Locomotive Data Acquisition Package (LDAP) System
Element S G Q e e€!o 0 €I t!I 0 I) G e 0 I) 0 €I 41.4 Factors Influencing LDAP Project ••••• 61.5 The LDAP Project Plan. • • • • • • • • • • 6
2. Measuring Capability Requirements ••••••••
2.1 Need for an LDAP • • • • • • • •••2.2 Typical Locomotive Testing Programs • • •••2.3 Locomotive Parameters to be Measured ••••
3. Locomotive Data Recorder Design Concepts •••••
.11
.11
• 12• 15
• 19
3.13.2
3.33.43.53.6
Introduction • • • • • • • •Physical Characteristics of the Locomotive Data Recorder(LDR) e €I (I 0 0 e 0 G "
LDR FunctionsLDR Sensor InterfaceThe Digital Cartridge RecorderControl and Data Memory • • • •
• • 19
• 19• 23• 25• 29• 30
4. Packaging for the Locomotive Shock and Vibration Environment •• 33
4.14.24.34.44.54.6
4.7
Introduction ••• • • • • • • • • •Input Shock and Vibration SpecificationsEquipment Fragility; the Need for Isolation • • • • •Isolation ~ A Center of Gravity Approach • • • • • •Shock and Vibration - General Hardware ConsiderationsShock and Vibration Isolation ~ Specific HardwareConsiderations • • • • • • • • • • • •Shock and Vibration Tests ••
• 33• 33• 41• 43• 47
• 53• 63
5. Transducers • • •
5.1 Availability of Transducers5.2 General Comments on Transducers5.3 Transducers, Buff-Draft Forces ••5.4 Instrument Transducers for LDAP - Fuel Flow
. . . 69
69707282
6. Data Processing Considerations 95
6.1 Introduction. • • • • • 956.2 Information Flow and Processing Functions • • • •. 956.3 Sources of Data • • • • • • • • • • • • • • • 966.4 Recording Algorithms and Formats • • • • • • 996.5 Analysis Functions and Computer Programs • 1016.6 Predetermined/Interactive Programming • 105
7... References e 6 €I I) €I e g e {) €I Ii'> €I e '" €I €I I} {) \lI (11 " () €I €I Q e 107
Appendix A: LDAP Functional Specification • • • • • • • . • • • • 109
-vii-
FIGURES
L Block Diagram of the Major System Elements of theLocomotive Data Acquisition Package (LDAP) •• 5
2. Preliminary Design for Physical Packaging of theLocomotive Data Recorder (LDR). • • • • • • ••••••• 20
3. Conceptual Design of a Front Panel for the LDR.Operator Controls and Indicators Are Shown. • • • • • • 22
4. Block Diagram of the Digital Bus Structure of LDR ••• 24
5. LDR Sensor Interface: a) LDR Sensor Connection, andb) Multiplexer and Analog-to-Digital Converter. • • • • • 27
6. Source Vibration Specification for LDAP: X, Y,and Z Directions. • • ••• • 38
7. Shock Specification for LDAP: X, Y, and Z Directions ••••• 40
8. Source and Fragility Envelopes. • • 42
9. Basic Isolation System•••
10. Suspended LDAP Unit on Four Isolators •
11. Transfer Ratio Related to Frequency.
12. Ideal Transmissibility for a Single Degree ofFreedom, Viscously Damped, Linear System. • •
13. Viscous-Damped, All-Attitude Vibration Isolator
• 44
• 46
• • 49
• 51
• • 56
14. U-Type Leaf Spring Isolator • • • • 57
15. Friction and Air-Damped Vibration Isolators.
16. "Box-Inside-A-Box" Case Design•••
• 58
• 59
17.
18.
Example of MiI~Std-21200 Enclosure.
Fragility Surfaces ••
• 61
• • 64
19. Random Vibration Test Envelope ••
20. Four Basic Coupler Loading Modes.
21. Locomotive Coupler Shank Strain ••
• 66
• 76
• 78
22. Force Transducer Scheme •
-viii-
o (II 0 0 0 (') 0 0 €I Q 0 (lI 00 83
23. Two Classes of Flowmeters for Use forLocomotive Fuel Flow Measurements • • • • 0 • 86
24. Two Methods for Obtaining Mass Flow Rate. • • 89
25. Vertical Vibration Tests of theFour-Piston Flowmeter • • • • 0 • • • 0 • • • • 0 • • • 93
26. Vertical and Horizontal VibrationTests of the Four-Piston Flowmeter. • • • • • • • • • • ••• 0 94
27. Information Flow and ProcessingFunctions of the LDAP • • • • • • • • • • • • • • • • • • • 0 • 97
L LDAF Project Plan ••
TABLES
7
2. Locomotive Parameters Expected to Be Measured 16
3. Magnitudes and Spectrum of the VibrationSpecifications Listed for LDAP • • • • • 37
4. Measurands Requiring Special Transducers to Be Addedto Existing Locomotive Equipment •••••••••• 70
5. Transducing Possibilities That Are Applicable to LDAP • 73
6. Data/Information Sources 98
7. Some Sampling and Recording Algorithms (Sequences)That May Be Employed in the LDAP System • • • • • • 100
8. Types of Processing to be Performed by Computer Programs • 102

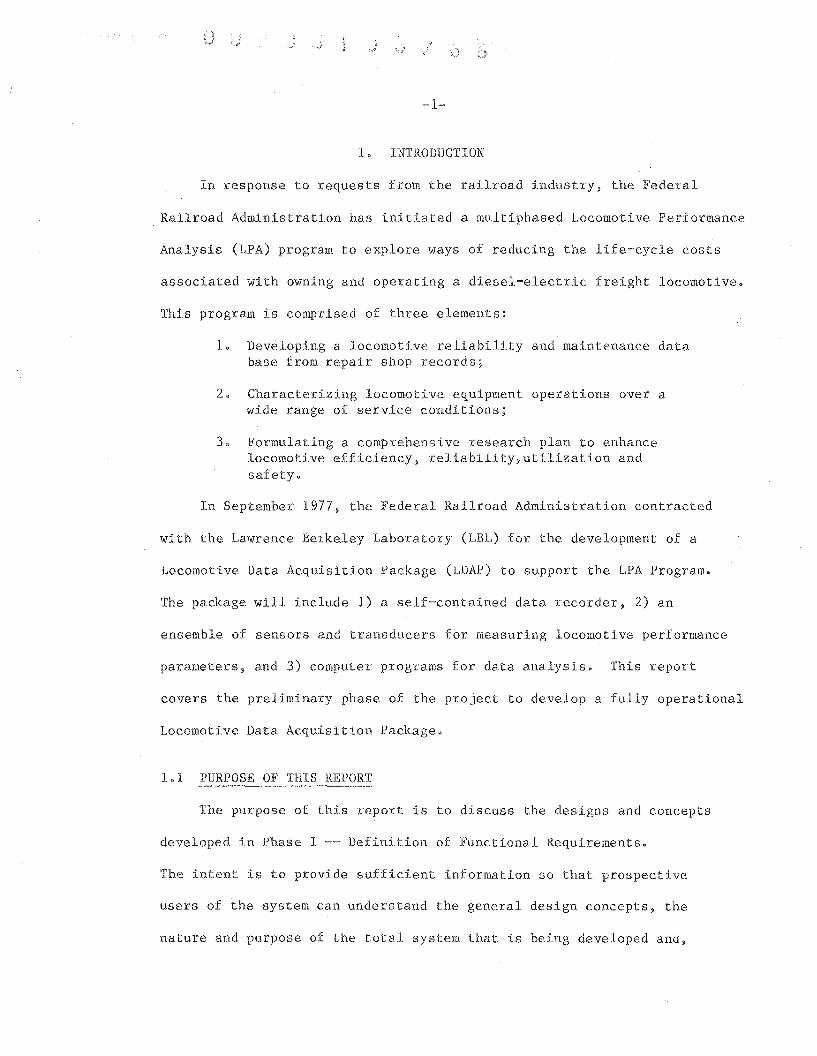
1. INTRODUCTION
In response to requests from the railroad industry, the Federal
Railroad Administration has initiated a multiphased Locomotive Performance
Analysis (LPA) program to explore ways of reducing the life-cycle costs
associated with owning and operating a diesel-electric freight locomotive.
This program is comprised of three elements:
1. Developing a locomotive reliability and maintenance database from repair shop records;
2. Characterizing locomotive equipment operations over awide range of service conditions;
3. Formulating a comprehensive research plan to enhancelocomotive efficiency, reliability~utilizationandsafety.
In September 1977, the Federal Railroad Administration contracted
with the Lawrence Berkeley Laboratory (LBL) for the development of a
Locomotive Data Acquisition Package (LDAP) to support the LPA Program.
The package will include 1) a self-contained data recorder, 2) an
ensemble of sensors and transducers for measuring locomotive performance
parameters, and 3) computer programs for data analysis. This report
covers the preliminary phase of the project to develop a fully operational
Locomotive Data Acquisition Package.
1.1 PURPOSE OF THIS REPORT
The purpose of this report is to discuss the designs and concepts
developed in Phase I ~- Definition of Functional Requirements.
The intent is to provide sufficient information so that prospective
users of the system can understand the general design concepts, the
nature and purpose of the total system that is being developed and,
to a limited extent, how it can be applied to locomotive research prob
lems. Technical implementation details are limited to those necessary
to properly understand the functions of the system components. Sections
1 and 2 discuss functional characteristics of the system, system
constraints and the overall approach. Section 3 discusses the electronic
structure for the system. Since the locomotive environment is known
to be harsh to electronic equipment, it is important that the LDAP
be sufficiently rugged to withstand the shocks and vibrations that are
typically present on an operating locomotive. This aspect is discussed
in detail in Section 4. The subject of transducers is covered in
Section 5, and some aspects of the analysis of measurement data are
in Section 6.
1.2 AN OVERVIEW OF THE LOCOMOTIVE PERFORMANCE ANALYSIS PROGRAM
It is not difficult to substantiate the need for the LPA program.
A large u.S. railroad may have a locomotive fleet with a present value
of approximately $300 million. It may face annual bills for locomotive
maintenance of approximately $100 million. 1 Fuel costs alone often
approach or exceed $100 million. 1 This clearly indicates the magnitude
of the potential economic impact of fleet-wide decisions affecting
operations, maintenance or equipment modifications, and substantiates
the need for a statistically valid base of operating data for making
those decisions.
Recent studies have estimated the cost of maintaining a line-haul
diesel~electric locomotive to be only slightly less than $100,000 a
year, exclusive of fuel and predispatch servicing. 1 The LPA program
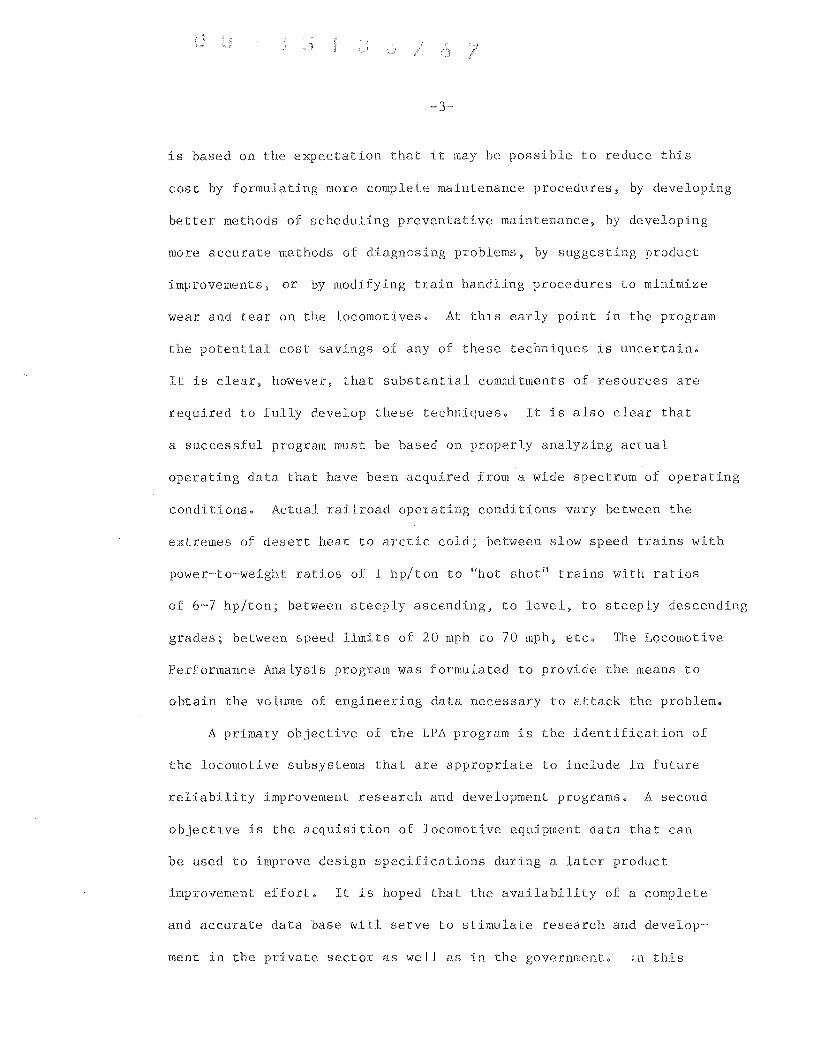
is based on the expectation that it may be possible to reduce this
cost by formulating more complete maintenance procedures, by developing
better methods of scheduling preventative maintenance, by developing
more accurate methods of diagnosing problems, by suggesting product
improvements, or by modifying train handling procedures to minimize
wear and tear on the locomotives. At this early point in the program
the potential cost savings of any of these techniques is uncertain.
It is clear, however, that substantial commitments of resources are
required to fully develop these techniques. It is also clear that
a successful program must be based on properly analyzing actual
operating data that have been acquired from a wide spectrum of operating
conditions. Actual railroad operating conditions vary between the
extremes of desert heat to arctic cold; between slow speed trains with
power-to~weight ratios of 1 hplton to Hhot shot H trains with ratios
of 6~7 hp/ton; between steeply ascending, to level, to steeply descending
grades; between speed limits of 20 mph to 70 mph, etc. The Locomotive
Performance Analysis program was formulated to provide the means to
obtain the volume of engineering data necessary to attack the problem.
A primary objective of the LPA program is the identification of
the locomotive subsystems that are appropriate to include in future
reliability improvement research and development programs. A second
objective is the acquisition of locomotive equipment data that can
be used to improve design specifications during a later product
improvement effort. It is hoped that the availability of a complete
and accurate data base will serve to stimulate research and develop~
ment in the private sector as well as in the government. In this

context, the present LPA effort can be considered to represent the
problem definition phase of a longer range program.
A third objective of the LPA program concerns the subject of this
report, i.e., the development and use of several Locomotive Data
Acquisition Packages. At present, research quality instrumentation
packages suitable for direct attachment to a locomotive do not exist.
The research and test departlnents of individual railroad companies
and the American Association of Railroads have indicated the need for
such a package. They have also indicated an interest in purchasing a
small number of packages, if developmental costs could be borne by
others. Therefore, the design philosophy for LDAP has recognized the
need for the package to be useful and available to individual railroads
and others to use in dedicated research efforts.
1.3 LOCOMOTIVE DATA ITION PACKAGE SYSTEM ELEMENTS
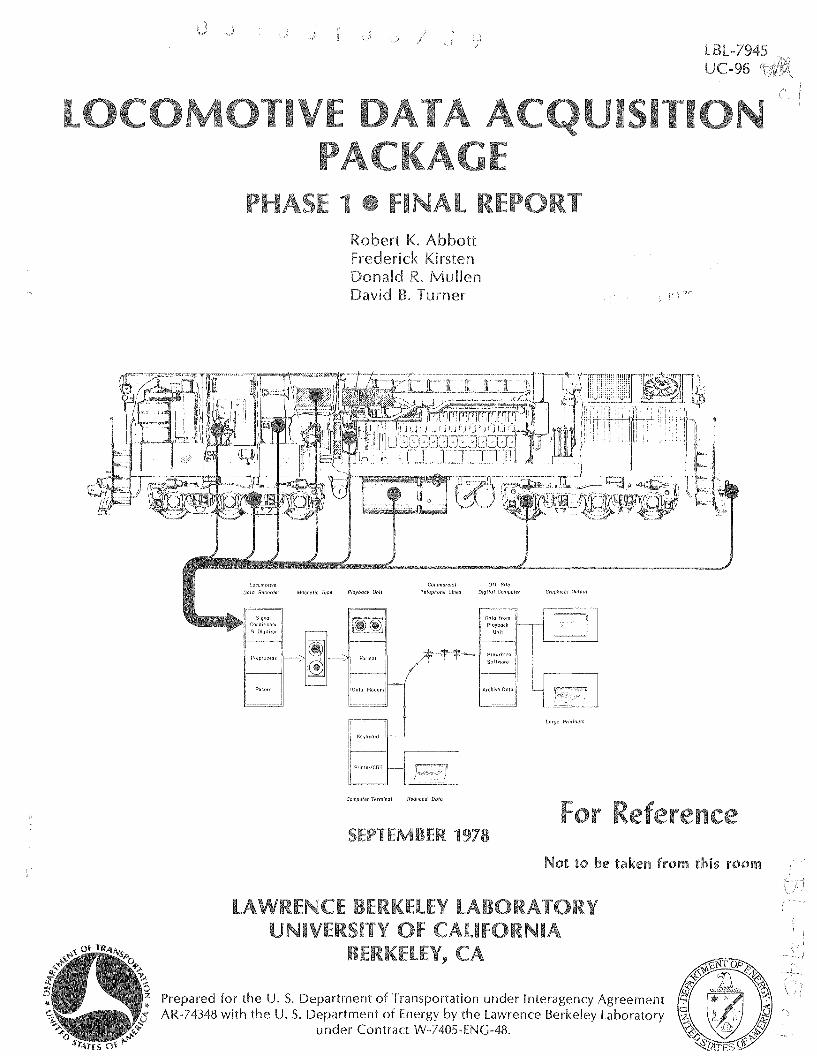
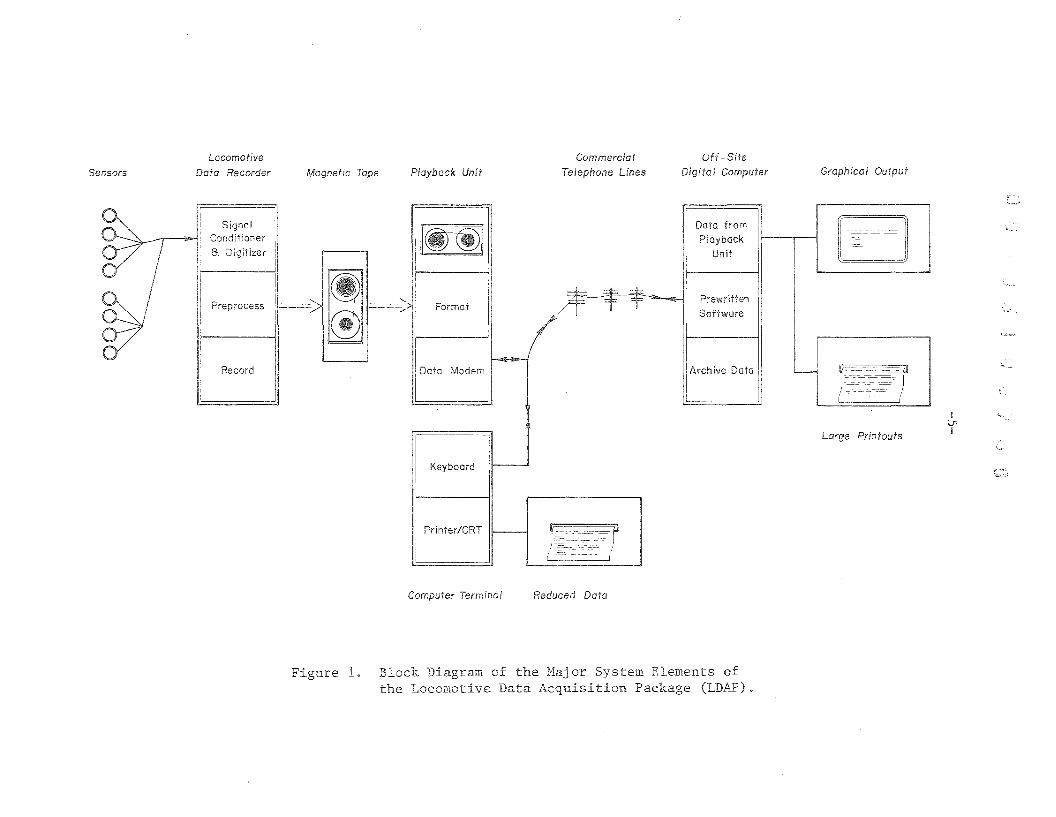
The LDAP instrumentation system is comprised of the following
elements, as shown in Figure 1:
a. A network of transducers that have been selected or designedto provide sufficiently accurate measurements of the physicalphenomena under test.
b. A rugged, portable, on-board locomotive data recorder suitablefor direct attachment to a locomotive and capable of recordinga wide spectrum of transducer-generated electrical signals onmagnetic tape.
c. A playback unit that will convert the tape recorded data intoa format compatible with a digital computer.
d. A data modem for transmission of locomotive-recorded data toa computer facility.
e. The use of a medium- or large-scale digital computer for datareduction, analysis, report preparation, and long-term storageof data files.
Sensors
Locomotive
Data Recorder Magnetic Tape Playback Unit
Commercial
Telephone Lines
Off- Site
Digital Computer Graphical Output
Ilrl!Large Printouts
Data fromPlayback
Unit
SoHware
Data ModemRecord
SignalConditionera Digitizer
Preprocess
'''yuuul U
Printer/CRT
Computer Terminal Reduced Data
Figure 1. Block Diagram of the Major System Elements ofthe Locomotive Data Acquisition Package .
f. A library of computer programs for data analysis and reportpreparation.
1.4 FACTORS INFLUENCING THE LDAP PROJECT
The LDAP project plan was influenced by the following factors:
a. The attainment of a high level of LDAP equipment reliability,in an extremely harsh railroad operating environment, is likelyto be the most difficult and the most important design objective.
b. Complete documentation that accurately characterizes the railroadoperating environment simply does not exist. A complete charac~
terization would include shock and vibration power spectraldensities; electromagnetic interference power spectral densities;and the frequency, duration and repetition rates of voltagetransients on power supplies.
c. Complete descriptions of all tests that LDAP will be requiredto perform during its lifetime are not available. Therefore,care must be taken to provide capability to expand or modifythe facilities of the package to cope with future requirements.
d. The exact number of recorder units to be constructed eventuallyhas not yet been determined. To date three major U.s. railroadshave shown interest in the project and have indicated a potentialinterest in purchasing some finished units. The Federal RailroadAdministration (FRA) desires to support that interest andanticipates the purchase and use of recorders by privatecompanies.
e. A research engineer's time is most productively spent designingtests and analyzing the results. LDAP will therefore be designedto permit the engineer to minimize the time spent in modifying,operating, or repairing the equipment.
f. Many of the building blocks needed in LDAP are already commercially available, well supported, and documented. This includesitems such as microprocessor single-board computers, dataterminals, data modems, memory buffers, and digitizers. Duringthe design process, efforts will be made to avoid custom designswhere such commercial modules can meet the operating andenvironmental requirements.
1.5 THE LDAP PROJECT PLAN
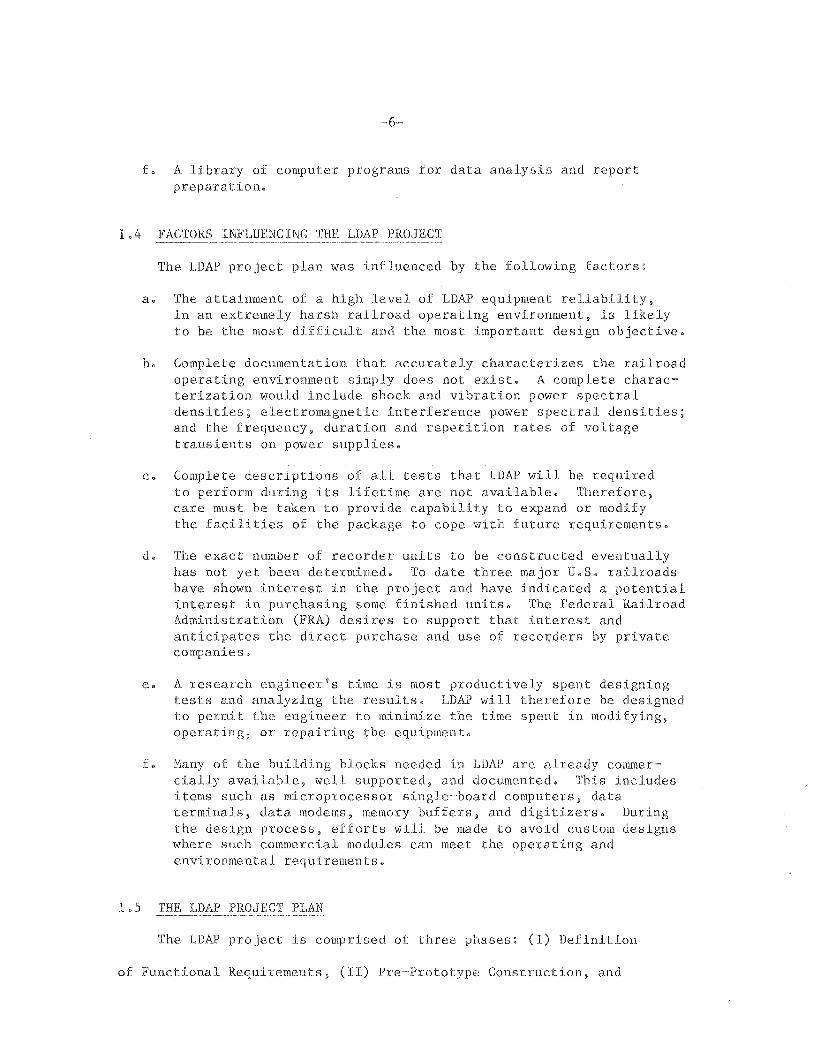
The LDAP project is comprised of three phases: (I) Definition
of Functional Requirements, (II) Pre-Prototype Construction, and
(III) Private Manufacturing. The tasks under each phase are listed in
Table 1.
Table I. LDAP PROJECT PLAN
Phase I -- Definition of Functional Requirments/Preliminary Design(Fall 1977 - Winter 1977)
~ Define Functional Needs- Determine Project Approach- Develop Design Specifications
Phase II -~ Pre-Prototype Construction (Spring 1978 - Winter 1978)
- Design Prototype Locomotive Data Recorder (LDR)- Fabricate, Test and Operate One LDR Unit- Gather Data on Operating Environment in a Locomotive- Value Engineer for Subsequent Manufacture- Document Final Configura ton- Select and Procure Sensors- Design, Write and Document Software- Assemble and Test a Complete System
Phase III - Private Manufacturing (Spring 1979 - Fall 1979)
- A private electronics manufacturing company will manufacture asmall number of recorders from prototype drawings, for FRA
Phase I (Definition of Functional Requirements/Preliminary
Design). This phase was started in the fall of 1977, completed in
April of 1978, and is the subject of this report. During this phase
the project approach was defined, the functional requirements determined,
and a performance specification developed.
Phase II (Pre-Prototype Construction). Initiated in May 1978,
this phase will be completed during the spring of 1979. Phase I
investigations made it clear that definitive data on the harshness
of the locomotive environment do not exist. Estimates of worst-case
shock, vibration, transient voltages and electromagnetic effects varied,
in some cases, by a factor of ten, depending upon the source In
addition, both the literature and personal communications with railroad
officials revealed that many previous attempts to adapt new data
acquisition and measurement technology to the railroad environment had
failed because of poor reliability. We believe that those attempts
resulted in low reliability because the equipment designers did not
fully understand the environment in which the equipment would be used.
On the basis of these facts, we decided to construct the prototype
LDR unit to withstand the most severe environment possible. It is
expected that the data obtained during the first few tests will focus
on the locomotive environment and that this will lead to the development
of a less severe set of environmental specifications for subsequent
commercial manufacture of LDR units.
During Phase II, the data recorder and the playback unit will
be developed, fabricated, and tested by LBL. The off~site digital
computer will not be provided as part of the package. Instead, the
system will be designed to accept as wide a range of computer installa~
tions as practical. Initial testing will be performed using the CDC
7600 computer system at LBL, which can be accessed from remote locations
by phone lines. The computer terminal is a commercial item that will
be purchased. The software routines necessary for proving the operation
of the total LDAP system and for carrying out a preliminary measurement
task will be designed and written. Complete documentation for the use
of the software will be prepared.

Phase III (Private Manufacturing). Phase III involves the manu~
facturing of a small number of LDAPs for FRA and provides for their
purchase from the manufacturer by others desiring them. The manufacture
will be done by a private electronics fabrication company yet to be
selected by FRA. They will manufacture the instrument in accordance
with LBL drawings developed under Phase II.

2. MEASURING CAPABILITY REQUIREMENTS
2.1 NEED FOR AN LDAP
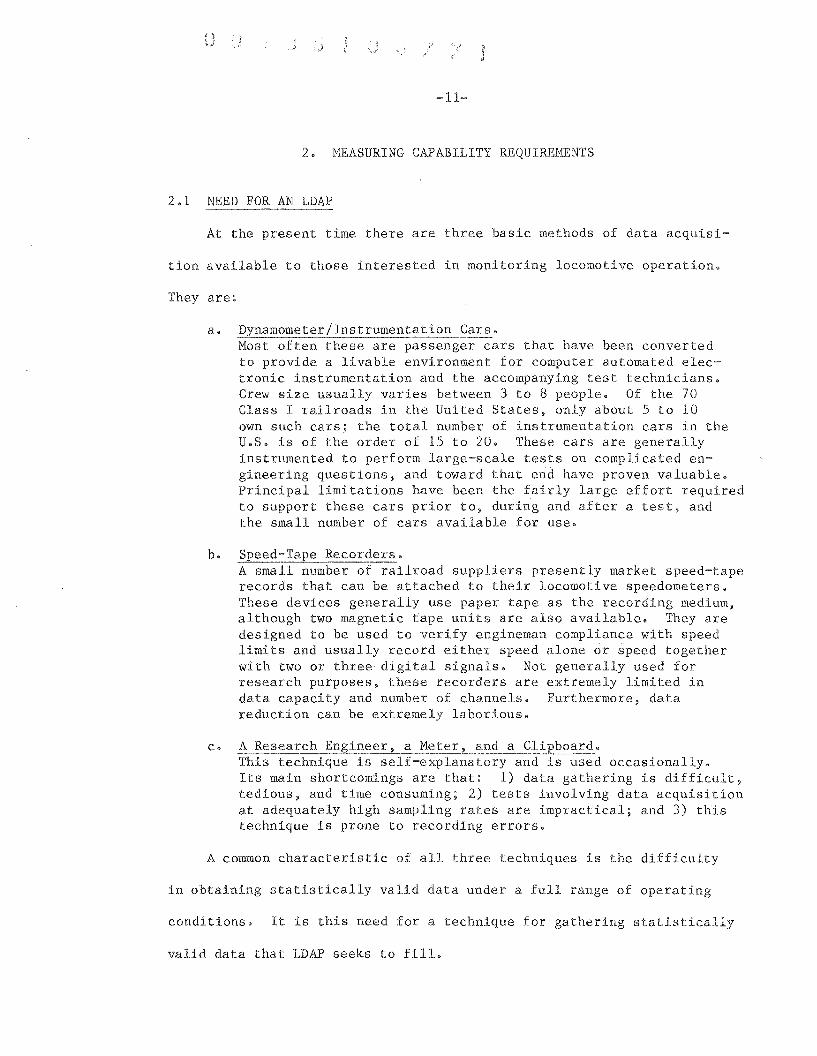
At the present time there are three basic methods of data acquisi-
tion available to those interested in monitoring locomotive operation.
They are:
a. Dynamometer/Instrumentation Cars.Most often these are passenger cars that have been convertedto provide a livable environment for computer automated electronic instrumentation and the accompanying test technicians.Crew size usually varies between 3 to 8 people. Of the 70Class I railroads in the United States, only about 5 to 10own such cars; the total number of instrumentation cars in theU.S. is of the order of 15 to 20. These cars are generallyinstrumented to perform large-scale tests on complicated engineering questions, and toward that end have proven valuable.Principal limitations have been the fairly large effort requiredto support these cars prior to, during and after a test, andthe small number of cars available for use.
b. Speed~Tape Recorders.A small number of railroad suppliers presently market speed-taperecords that can be attached to their locomotive speedometers.These devices generally use paper tape as the recording medium,although two magnetic tape units are also available. They aredesigned to be used to verify engineman compliance with speedlimits and usually record either speed alone or speed togetherwith two or three digital signals. Not generally used forresearch purposes, these recorders are extremely limited indata capacity and number of channels. Furthermore, datareduction can be extremely laborious.
c. A Research Engineer, a Meter, and a Clipboard.This technique is self-explanatory and is used occasionally.Its main shortcomings are that: 1) data gathering is difficult,tedious, and time consuming; 2) tests involving data acquisitionat adequately high sampling rates are impractical; and 3) thistechnique is prone to recording errors.
A common characteristic of all three techniques is the difficulty
in obtaining statistically valid data under a full range of operating
conditions. It is this need for a technique for gathering statistically
valid data that LDAP seeks to fill.
The LDAP instrumentation system has been planned to augment the
three existing choices mentioned above. It will represent a level of
capability greater than existing speed tape recorders, but less than
conventional dynamometer cars. The recorder portion of the system is
being designed to be rugged, portable, and programmable. It will have
a capacity of monitoring up to 48 transducers or sensors, although
only about 20 channels would be needed for a typical application. The
capacity of the tape cartridge in terms of operating hours is determined
by the total number of samples taken. The unit may be programmed for
a tape capacity of as much as two weeks of operation if the number
of channels and sample rates are held to a minimum. Typical recording
capacities are expected to be on the order of 48-72 hours.
The LDAP instrumentation system will be designed to be compatible
with the operational constraints of the railroad; It is recognized
that railroads are operating properties, not research organizations.
The proportion of railroad personnel familiar with current electronic
technology is probably much less than one percent of the work force.
Research and test activities are usually constrained to minimize any
adverse impact on transportation operations.
2.2 TYPICAL LOCOMOTIVE TESTING PROGRAMS
The scopes and details of all of the tests that will be performed
are not usually known at the beginning of most experimental programs.
However, it is important to develop test equipment that is both flexible
and adaptable, and to anticipate functional requirements. To do that,
one must anticipate the general nature of the tests for which LDAP

-13~
will be used. From discussions held with railroad test engineers, rail-
road engineering managers and government officials, a list of potential
tests was developed. This list as detailed below is not intended to
be complete, but rather to serve as a guide to the spectrum of tests
for which LDAP may be employed. The list is as follows:
1. Consist terminal-to-terminal run time and schedulecompliance as a function of hp/ton ratios and train handlingprocedures.
2. Freight ride quality as a function of track location andtrain handling procedures.
3. Buff/Draft and Lateral/Vertical force ratios as a function oftrain handling, train make-up, and/or track location.
4. Characterization of the locomotive environment (parameterssuch as shock, vibration, noise, etc.).
5. Characterization of locomotive component equipment operation.
6. Locomotive voltage transients, their causes, magnitudes,frequencies, and the effects of attempts to reduce them.
7. Slip/slide circuitry efficiencies and performance.
8. Causes of intermittent alarms such as ground fault, hotengine, etc.
9. Causes of traction motor flashover.
10. Locomotive fuel economy as a function of locomotive equipment.
11. Locomotive fuel economy as a function of train handling.
In terms of specific requirements, tests 1 and 6 are likely to
require sample rates on the order of one sample per second for most
of the parameters of interest. Accuracies of approximately ±5% will
probably be adequate for most parameters. The minimum required time
between tape changes is likely to be on the order of 2~3 days.
Tests 2, 3, 4 and 5, while similar to tests 1 and 6, are likely
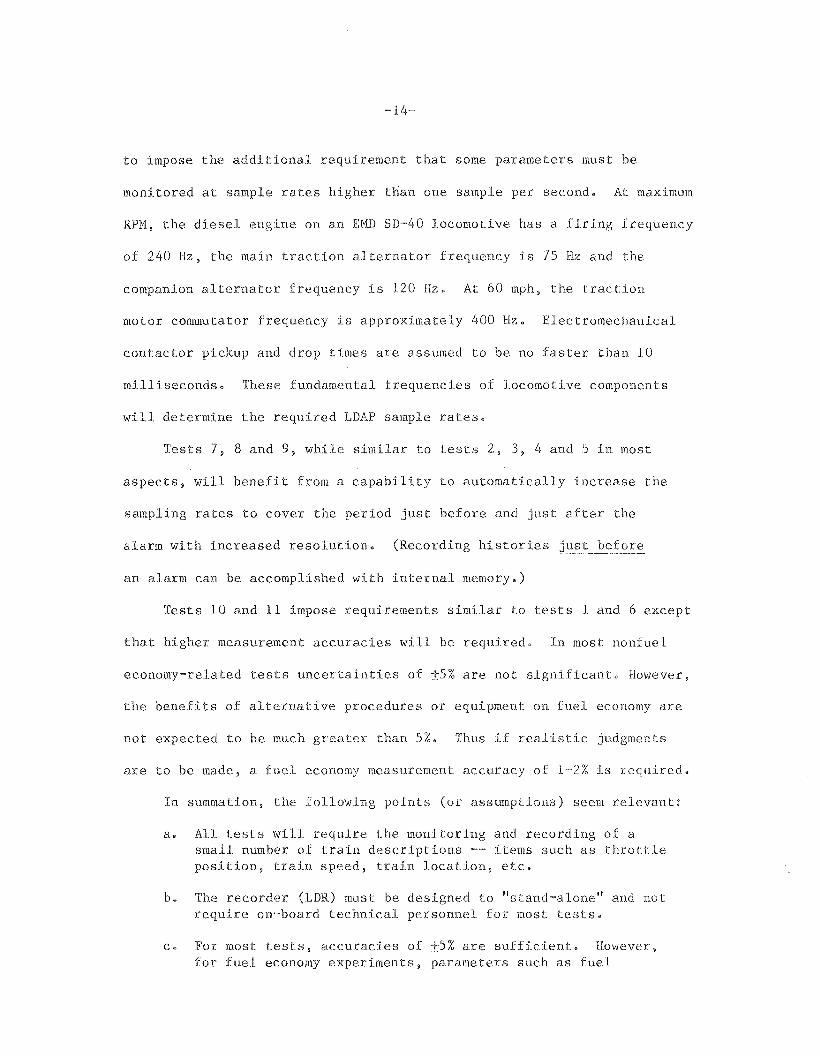
to impose the additional requirement that some parameters must be
monitored at sample rates higher than one sample per second. At maximum
RPM, the diesel engine on an EMD SD~40 locomotive has a firing frequency
of 240 Hz, the main traction alternator frequency is 75 Hz and the
companion alternator frequency is 120 Hz. At 60 mph, the traction
motor commutator frequency is approximately 400 Hz. Electromechanical
contactor pickup and drop times are assumed to be no faster than 10
milliseconds. These fundamental frequencies of locomotive components
will determine the required LDAP sample rates.
Tests 7, 8 and 9, while similar to tests 2, 3, 4 and 5 in most
aspects, will benefit from a capability to automatically increase the
sampling rates to cover the period just before and just after the
alarm with increased resolution. (Recording histories
an alarm can be accomplished with internal memory.)
t before
Tests 10 and 11 impose requirements similar to tests 1 and 6 except
that higher measurement accuracies will be required. In most nonfuel
economy~related tests uncertainties of ±5% are not significant. However,
the benefits of alternative procedures or equipment on fuel economy are
not expected to be much greater than 5%. Thus if realistic judgments
are to be made, a fuel economy measurement accuracy of 1-2% is required.
In summation, the folloWing points (or assumptions) seem relevant:
a. All tests will require the monitoring and recording of asmall number of train descriptions ~- items such as throttleposition, train speed, train location, etc.
b. The recorder (LDR) must be designed to "stand-alone" and notrequire on~board technical personnel for most tests.
c. For most tests, accuracies of ±5% are sufficient. However,for fuel economy experiments, parameters such as fuel
~15-
flow, prime mover RPM, and fuel temperature must each be knownto ±1% or better.
d. Some tests will require sample rates as low as one sample persecond, others higher than 240 per second.
e. Some tests will require the capability to sample some parametersat a slow rate and other parameters at a different (higher) rate.
f. Some tests will require the capability to change sample ratesduring a test as a result of some special event.
g. Some tests will require the capability to look back in time,that is, to record certain information only if a specifiedevent occurs subsequently.
h. Some tests will require the system (LDAP) to compare its resultswith other data sources such as previously recorded test dataor track maps.
Each of these points will be discussed in greater detail in sub-
sequent sections.
2.3 LOCOMOTIVE PARAMETERS TO BE MEASURED
As a result of a study of the requirements cited above, it has been
concluded that LDAP should accommodate up to 48 channels. It has also
been concluded that 16 of these channels should be dedicated to a basic
set of parameters that appear to be fundamental to a majority of con-
templated testing programs. These 16 parameters are listed in Table 2,
which also lists the sampling rate expected to be used for each.
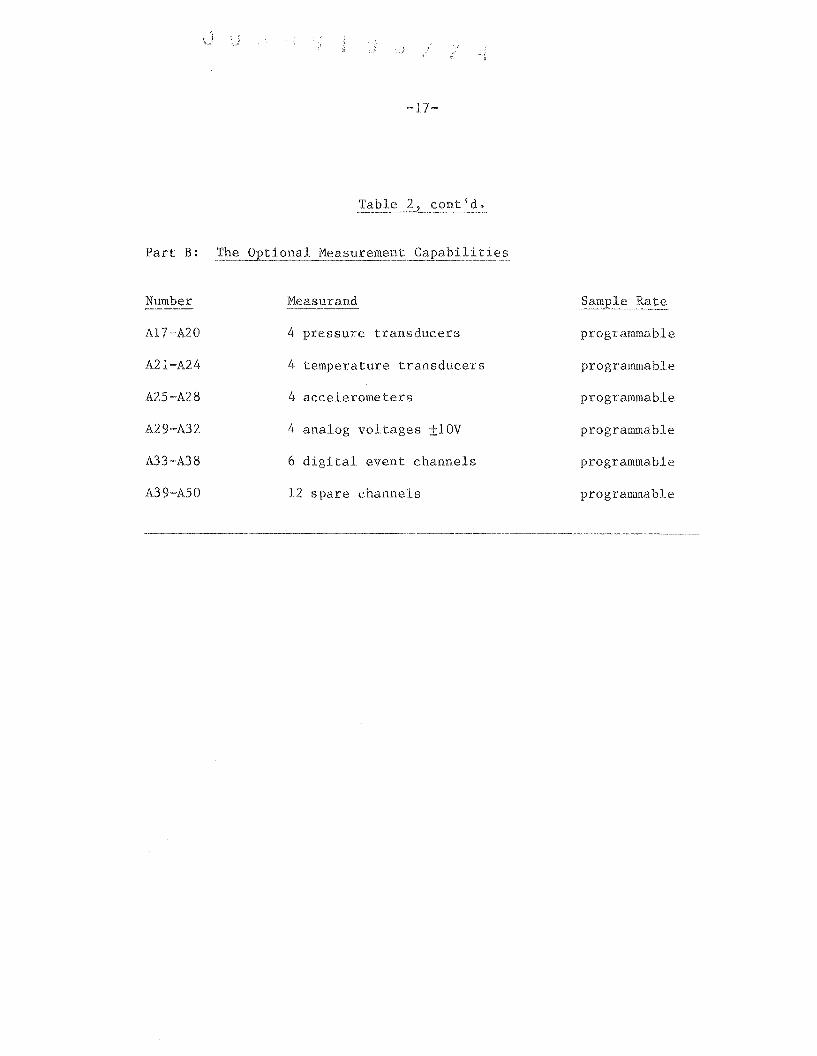
In addition, to accommodate the special requirements of individual
tests, 34 other channels are planned. These are also listed in Table 2.
Specific assignments for the use of these channels can be made when
programming LDR for the specific test. As described within, it is
also planned that the sampling rates for these can be chosen either
when programming the LDR, or by instructions entered by the operator.
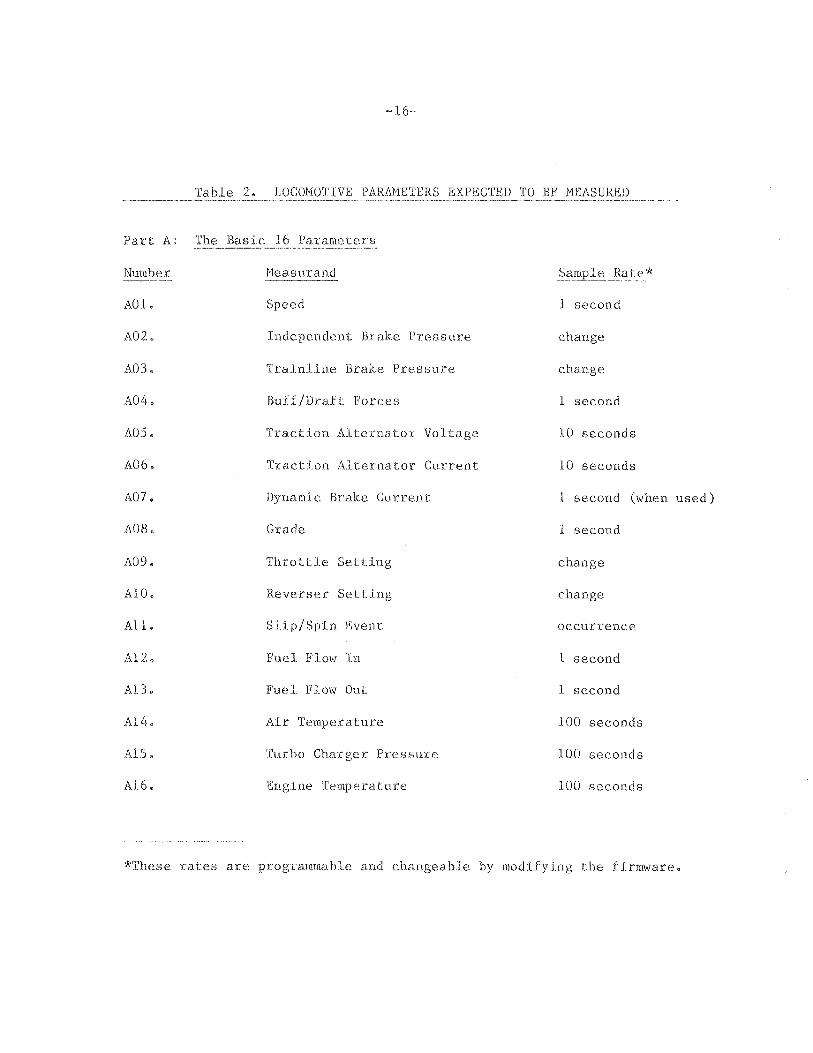
Table 2. LOCOMOTIVE PARA}fETERS EXPECTED TO BE MEASURED-----~~----~ .._---
Part A: The Basic 16 Parameters
Number
AOL
A02.
A03.
A04.
AOS.
A06.
A07.
A08.
A09.
AIO.
All.
A12.
Al3.
A14.
AIS.
A16.
Measurand
Speed
Independent Brake Pressure
Trainline Brake Pressure
Buff/Draft Forces
Traction Alternator Voltage
Traction Alternator Current
Dynamic Brake Current
Grade
Throttle Setting
Reverser Setting
Slip/Spin Event
Fuel Flow In
Fuel Flow Out
Air Temperature
Turbo Charger Pressure
Engine Temperature
Sample Rate*
1 second
change
change
1 second
10 seconds
10 seconds
1 second (when used)
1 second
change
change
occurrence
1 second
1 second
100 seconds
100 seconds
100 seconds
*These rates are programmable and changeable by modifying the firmware.
-17~
Table 2, contld.
Part B: The Optional Measurement Capabilities
Number Measurand
A17-A20 4 pressure transducers
A21-A24 4 temperature transducers
A25-A28 4 accelerometers
A29-A32 4 analog voltages ±10V
A33-A38 6 digital event channels
A39~A50 12 spare channels
Rate
programmable
programmable
programmable
programmable
programmable
programmable

-19-
3. LOCOMOTIVE DATA RECORDER DESIGN CONCEPTS
3.1 INTRODUCTION
The Locomotive Data Recorder (LDR) of the Locomotive Data Acquisi
tion Package (LDAP) is the collection of sensor interfaces, control
electronics, and data storage which monitors and records locomotive
performance parameters of interest. It should be designed and packaged
to withstand a broad range of conditions including the temperature,
humidity, dust, smoke, shock, vibration. and handling extremes of the
diesel-electric locomotive environment. Its selection of monitored and
recorded parameters should be expandable and programmable by a built-in
keyboard. The selected parameters should be recorded on a digital
data tape cartridge that could hold up to 1,000,000 data samples.
To verify the feasibility of designing an LDR to meet these
requirements. a preliminary design has been formulated. In this
section. details of this preliminary design are discussed. It should
be borne in mind that the architecture of the pre-prototype to be
designed and built in Phase II may differ from that described. However.
the functional and operational characteristics will be essentially
similar.
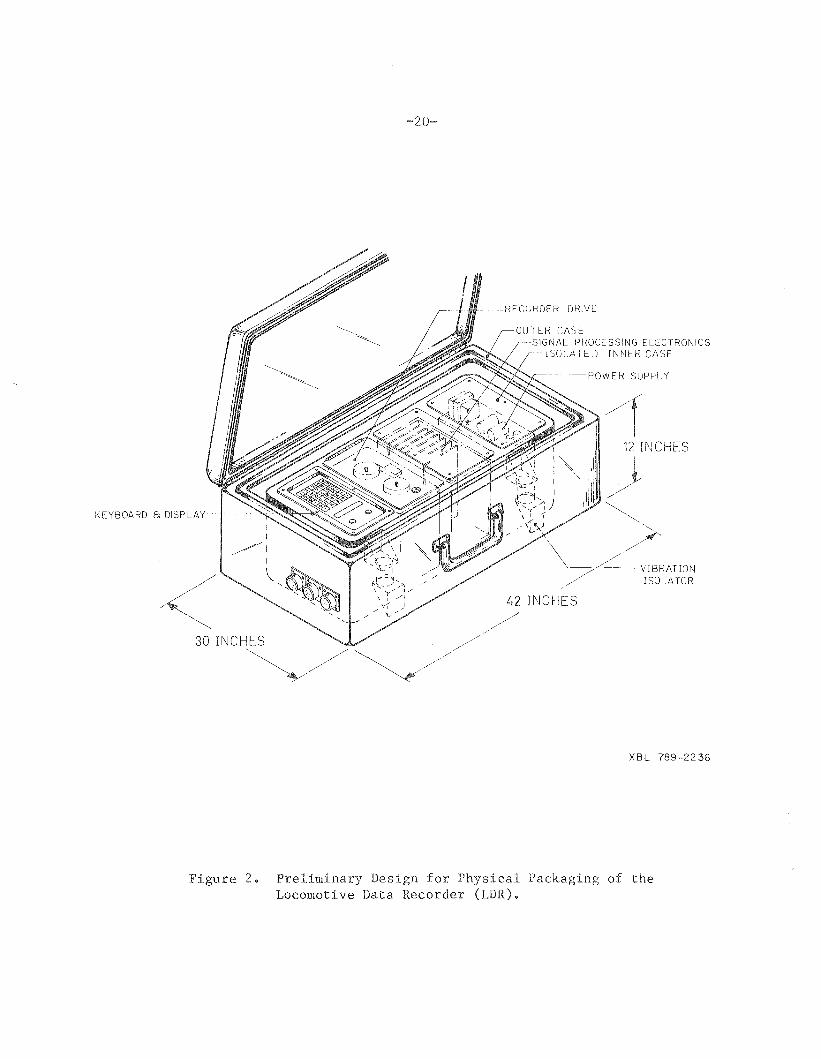
3.2 PHYSICAL CHARACTERISTICS OF THE LOCOMOTIVE DATA RECORDER (LDR)
Figure 2 is a sketch of a conceptual design of the physical
packaging of the LDR. Visible from the top are the four main electronic
components of the LDR: the power supply. the digital magnetic tape,
cartridge recorder, the keyboard/display, and the control electronics.
Visible on the side is the connector panel, where connections to the
-20-
KEYBOARD a DISPLAY-
30 INCHES
~/~/
-RECl,kDER DRIVE
OUTER CASESIGNAL PROCESSING ELECTRONICS
rSOl.ATEJ rN~IER CASE
"-~---~POWER SUPPI_ Y
42 INCHES
//
XBL 789-2236
Figure 2. Preliminary Design for Physical Packaging of theLocomotive Data Recorder (LDR).
power source and the sensors are made. In addition, one connector
interfaces a remote hand-held keyboard which can be used to enter
milepost or event~related information. In normal operation the cover
protects the electronics, keyboard and recorder from dust and
physical damage. The shock and vibration absorbing aspects of the LDR
package are covered in Section 4.
This instrument is designed to be used by operators from various
backgrounds. For this reason special care will be taken in the design
of the operator interface -- defined as that collection of knobs and
switches by which an operator communicates with or controls the instru
ment. In its basic mode of operation the instrument need only be started,
and will then run unattended until the termination of the run. It will
also have the facility to allow operator interaction for those types
of tests where interaction is needed. Such interaction can be of several
types:
a. Minor modification of measuring sequence;
b. Entering sensor calibration data;
c. Monitoring the measured data;
d. Entering "event" information, such as mileposts, etc.
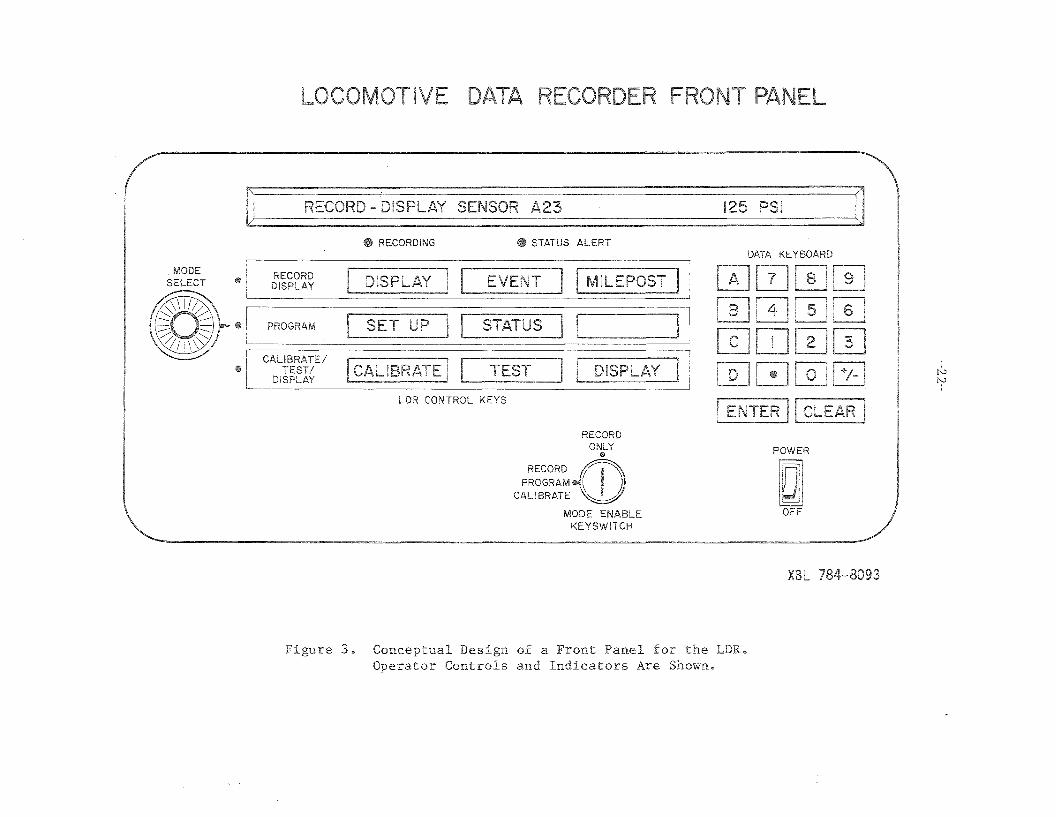
Figure 3 is a view of one possible design for the LDR front panel.
The front panel includes most of the controls by which LDR is tested
and operated, and by which minor program modifications can be made.
The controls include the Master Power Circuit Breaker, the Mode Enable
Key switch, the Mode Select switch, the~ Control Keys, the Data Keyboard,
the Indicator LEDs, and the Display. The uses of these controls are
further described below.
- A23 I I
• RECORDING • STATUS ALERTDATA KEYBOARD
MODESELECT •
iIIl
"LDR CONTROL KEYS
ItvtvI
RECORDONLY
@
RECORD{j)OJPROGRAM
CALIBRATE
MODE ENABLEKEYSWITCH
POWER
Figure 3. Conceptual Design of a Front Panel for the LDR.Operator Controls and Indicators Are Shown.
~23-
3.3 LDR FUNCTIONS
The basic function of LDR "is to record designated locomotive
parameters onto magnetic tape in accordance with a preprogrammed
sequence. To enable this to be done conveniently, it provides the
controls and features to permit an operator to modify certain aspects
of the preprogrammed sequence, to initiate and terminate operations,
to monitor the progress of the test, and to manually input certain
pieces of data.
To accomplish these functions the LDR will consist of one or
more microprocessor~based* system controllers, a set of compatible data
acquisition and conversion modules, a digital cartridge magnetic tape
recorder, front panel controls and display, and a power supply.
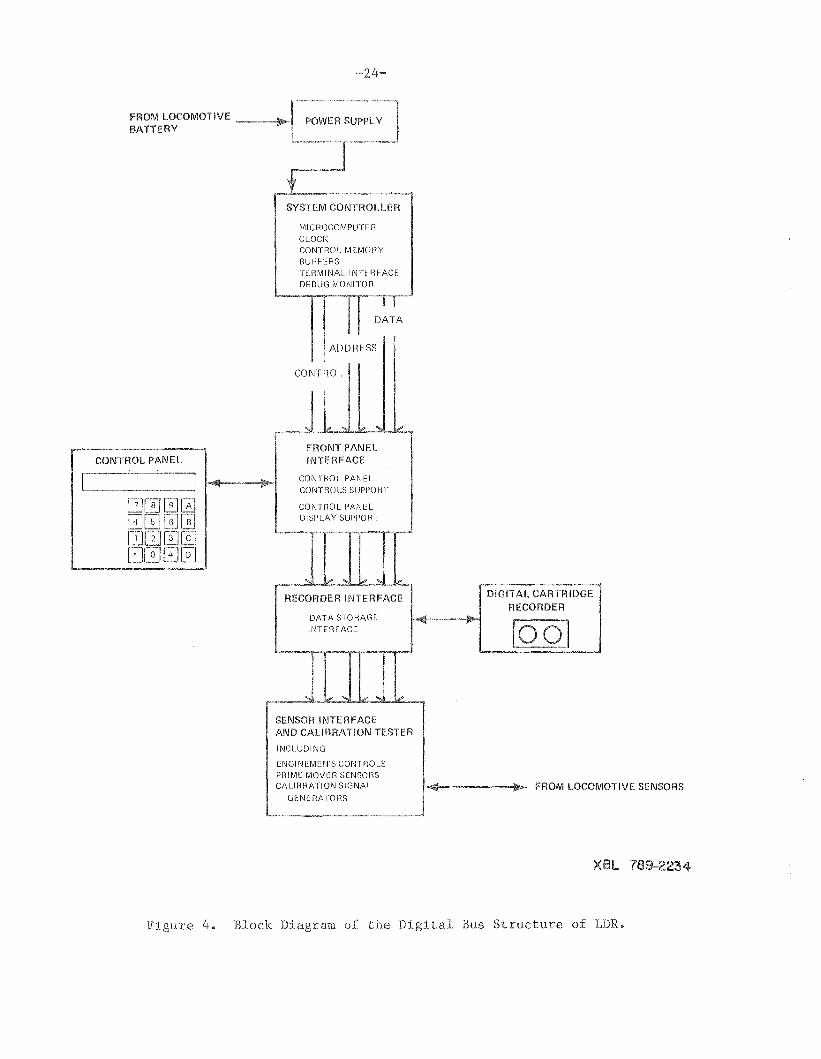
In typical microprocessor fashion, these components are elec~
trically interconnected inside the LDR package by means of a digital
bus structure. A block diagram illustrating this configuration is in
Figure 4. The broad line represents the digital bus. It consists
of a number of wires carrying digital signals. Control of the entire
ensemble is exercised by the microprocessor (via the digital bus) in
response to the execution of instructions contained in its preprogrammed
control memory. In response to these instructions, other signals,
in the form of digital (binary) data, are carried (again via the bus)
from sensor interface to data memory and from data memory to the digital
recorder interface.
The majority of signals generated by sensors and transducers are
* The terms microprocessor and microcomputer are used more or lessinterchangeably in this report.
FROM LOCOMOTIVE ~~~4~1BATTERY
RESS
CONTROL I
ICONTROL PANEL
FRONT PANELINTERFACE
CONTROL PANEL
CONTROLS SUPPORT
CONTROL PANELDISPLAY SUPPORT
RECORDER INTERFACE
DATA STOI1AGE
INTEI1FACE
DIGITAL CARTRIDGERECORDER
INTERFACECALIBRATION TESTER
1'1(' ,n",r,NEMEN'S CONTI10LS
MOVER SENSORS.IDfi~\ IU SIGNAL
GENEI1ATOI1S1~"~~~---lI"'io>- FROM LOCOMOTIVE SENSORS
XBL 789-2234
Figure 4. Block Diagram of the Digital Bus Structure of LDR.
-25~
of analog variety. Analog signals carry information in terms of the
magnitude of the signal voltage@" For example, a one-volt signal might
indicate 100 lbs of brake~line pressure, a two-volt signal might indicate
200 lbs, etc. For convenience in reliably transmitting and recording
the information contained in such a signal, the information is converted
to digital form as early in the processing as possible. The analog
to-digital conversion is one of the functions of the Sensor Interface
element shown in Figure 5.
The basic sequence of operations is as follows. In response to
a command transmitted by the microcomputers, the sensor interface will
select a particular sensor signal, perform an analog-to-digital conver
sion on the signal, and store the resulting digital number temporarily.
In response to a second microcomputer command, the digital number is
transferred to the portion of memory used to store data. When sufficient
data are stored in the memory, they are transferred in a block to the
magnetic tape. Successive blocks are stored on tape until the run
is completed.
Details of certain aspects of this process are given below.
3.4 LDR SENSOR INTERFACE
The sensor interface of the LDR provides the electronics necessary
to operate and measure the transducers which in turn are connected to
the locomotive parameters of interest. The sensor interface must be
able to accommodate each of the dedicated sensors for the basic 16
parameters as well as the optional measurement types shown in
Table 2.
The interface allows the system controller to initiate a measure-
ment of any sensor, and to transfer the result of the measurement, in
digital form, from the interface to the controller for further
processing.
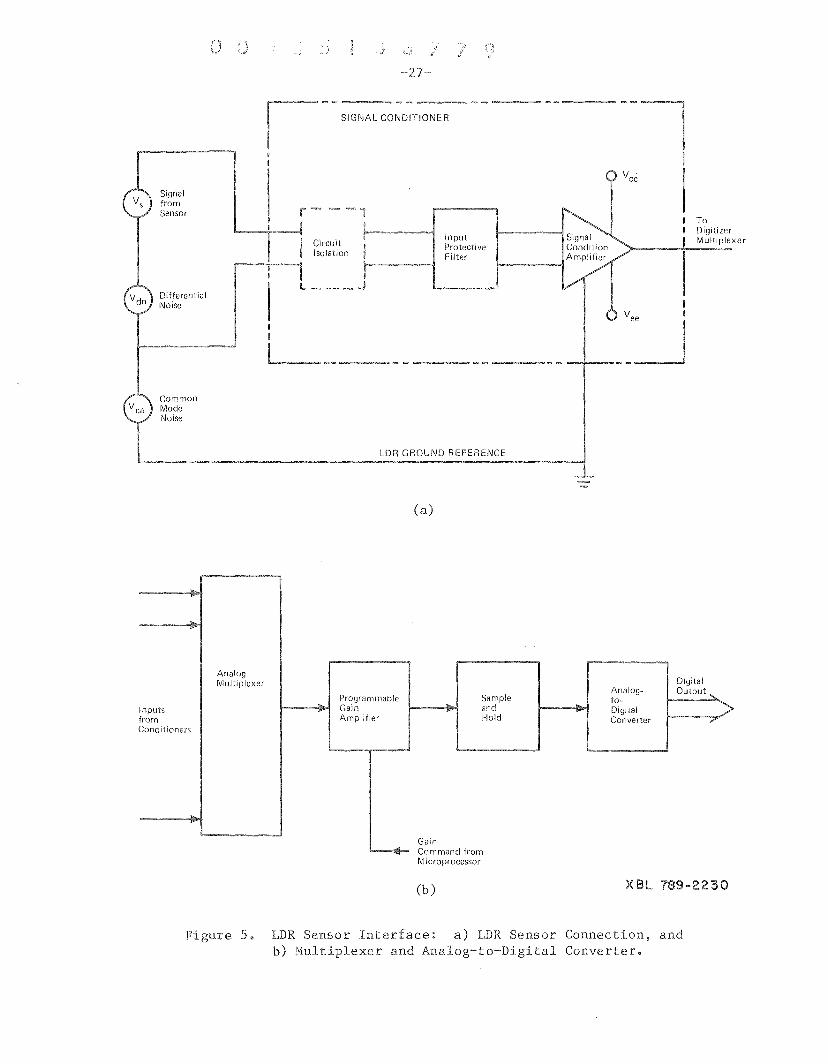
The block diagram of the input (signal conditioner) section of such
a sensor interface is shown in Figure Sa. The output of the sensor
is represented by the voltage generators on the left. Transducer exci-
tation voltage is provided by the interface if required.
The signal conditioner provides two functions. First, the input
protection filter rejects noise on the analog signal and protects the
following delicate circuitry from the very large transients* that may
be induced by the locomotive power circuits. The filtered signal is
then amplified or detected by an appropriate signal conditioning
amplifier. Transducers that require special signal processing, such as
ac detectors or very high~gain amplification, will receive that processing
at this point.
In the digitizer, shown in Figure Sb, the amplified signal is
applied to a multiplexer, along with other inputs. Since the signals
generated by different sensors will have different voltage ranges (spans)
a programmable gain amplifier may be used to normalize the ranges before
the signals are applied to the converter. This amplifier is programmable
in the sense that its gain can be controlled by the microcomputer.
The signal voltage is thereby amplified to the appropriate level for
the sample~and~hold amplifier, which freezes the input signal on command.
* Transients as large as several thousand volts on open wiring havebeen reported to us by railroad personnel.
SIGNAL. CONDITIONER
ToDigitizerMultiplexerInput
ProtectiveFilter
SignalfromSensor
DifferentialNoise
CommonVcn Mode
Noise
L.DR GROUND REFERENCE
(a)
AnalogDigitalMultiplexer
Programmable SampleAnalog- Output "-to-
Inputs Gain p and Digitalfrom Amplifier Hold Converter ,/
Conditioners
GainCommand fromMicroprocessor
(b) XBL 789-2230
Figure 5. LDR Sensor Interface: a) LDR Sensor Connection, andb) Multiplexer and Analog-to~Digital Converter.

-28-
The analog~to~digital converter converts the analog input signal to a
digital output.
Digitizers having these characteristics are commercially available
in rnicroprocessor~compatibleversions. A certain amount of signal
conditioning is provided on these digitizers, though by themselves they
may not offer protection against strong electrical interference.
Two types of interferences are typically encountered: commonlffiode
and differentiallffiode interference. To illustrate, in Figure Sa the
signal conditioning amplifier is shown with three voltage sources. They
are:
a. Vs ' the signal source from the transducer. This is the signalthat the LDR is designed to measure;
b. Vdn ' the differentiallffiode noise source. This noise is appliedto the signal conditioner along with Vs ' the signal of interest.It can be generated in the sensor, or anywhere in the cablesand connections between LDR and sensor; and
c. Vcn ' the commonlffiode noise source. This noise is appliedbetween the LDR ground reference and the signal reference.It can be induced in the connecting cables, or it can beinherent in the sensor signal, as with the measurement ofthe locomotive main alternator current by using a currentshunt in series with the alternator output.
Vdn and Vcn interfere in two respects. They rnay cause errors in
the measurement. If the values of Vdn and Vcn are sufficiently large,
they can damage the equipment. Circuit protection must therefore be
designed so that neither Vdn nor Vcn in Figure Sa exceed the specifi~
cations given for the signal conditioning amplifier. Typical
commercially available amplifiers allow neither voltage to exceed the
power supplies Vcc and Vee' which are often ±IS V. Greater protec~
tion range for differential noise can be provided by the input
-29~
protective filter. It may include suitable attenuation of full-scale
signals, low pass filtering to reject high amplitude-short duration
noise spikes. and special protective devices such as varistors or fuses.
Greater protection for common-mode noise can be achieved in some cases
by suitable amplifier and cable connections. Extreme conditions. such
as measuring a 10-V signal with a 600-V common-mode component. require
a special circuit isolator to be installed in front of the amplifier.
Opto-isolators and transformers are common techniques used to implement
isolation of large common-mode voltages. Such techniques can easily
isolate interference greater than 10,000 V. However, they are not
compact or cheap, and so should be used only as required.
3.5 THE DIGITAL CARTRIDGE RECORDER
The digital recorder is the key element of the LDR, in that it
performs the ultimate function of the device the recording of the
time history of the locomotive parameters. To satisfy the system
performance requirements, the recorder must offer high storage capacity
and high reliability in the locomotive environment.
To fulfill this function we are investigating the use of a recorder
that employs the 3M-type DC300A cartridge. Such recorders are made
by several manufacturers to ANSI/ECMA/ISO standards, and can store up
to 2.5 million bytes* of data. This is about three days of recording
for the basic 16 locomotive parameters shown in Table 2. This
standard device was designed specifically as a high density, compact
digital recording medium. It has advantages in terms of reliability
* A "byte" is a group of eight bits of information.
~30-
and capacity over the Phillips-type data cassette and in terms of size
and power burden over conventional seven-track or nine-track reel-to
reel digital tape recorders.
Manufacturers of recorders that use the DC300A cartridge offer
a range of levels of environmental protection. Even so, the recorder
is, still. the most delicate component of the LDR. For this reason
tests must be performed to determine what additional measures must be
applied to assure reliable recorder performance in the locomotive
environment. Factors of concern are the susceptibility to airborne
oil, smoke. and dust; shock and vibration; electromagnetic interference;
temperature; and humidity.
In addition to the mechanical protection, the reliability of the
recorder can be augmented by the program with which the system controller
operates it. This is done by calculating a number, called the Cyclic
Redundancy Character (CRC). which is uniquely dependent on the block
of data being recorded. The CRC is recorded on the tape along with
the data. When the data is read back from the tape, the CRC can be
recalculated to determine whether the data was correctly recorded. If
an error is found, the data can be re~recorded until no errors are
indicated.
3.6 CONTROL AND DATA MEMORY
The sequence of operations that the LDR will perform in any loco
motive test is determined by the control program of the microcomputer
system controller. The control program is written in advance of the
test and is loaded into the control memory of the microcomputer.
-31-
Because it is essential that the control program remain intact and
unaltered during the complete locomotive test, essentially all of it
will be stored in non-volatile, programmable read-only memories (PROMs).
These are digital integrated-circuit memories that can only be read,
i.e., their contents cannot inadvertently be changed by writing into
them (except during the time the program is being initially loaded).
They are non~volatile in the sense that the stored program is not lost
when power is turned off.
The control programs that are to be loaded into the PROMs will
usually be prepared in advance on a microcomputer development system.
During Phase II of the LDAP program, this development system will be
commissioned, some of the preliminary locomotive test programs will be
developed, and complete instructions for developing other programs will
be written.
The changing of the control program from one test to another can
be as simple as unplugging one set of PROMs and plugging in another set
which has been loaded with the control program for the new test.
The microcomputer will also contain a certain amount of read-write
memory, typically called RAM. This will be used for storing certain
control program information that is entered (via keyboard) at the time
the test is run. RAM is also used for storing the data resulting
from measurements. At one time this data is written into the RAM;
at another time it is read from the memory and put onto magnetic
tapes.

-33~
4. PACKAGING FOR THE LOCOMOTIVE SHOCK AND VIBRATION ENVIRONMENT
4.1 INTRODUCTION
The problem of vibration isolation is concerned with the inter~
relationship of three subsystems: the vibration source, the equipment
to be isolated (receiver), and the vibration isolator which is interposed
between the source and receiver. The vibration source at the point
in the locomotive where the equipment is mounted is characterized mainly
by its vibratory motion and by its pertinent mechanical properties.
These properties include the mechanical impedance, which is determined
by the mass, stiffness, and damping factors of the car body structure
at the mounting location. Since all the potential mounting locations
for LDAP in the locomotive car body have finite rigidity, the motion
of the source (which is the input to the isolator-receiver combination)
is affected by the load impedance (mass, stiffness, etc.).
In subsection 4.2 we discuss the environmental specification (the
vibration source) selected for LDAP and our reasoning in arriving at
that specification. Subsection 4.3 discusses equipment (the receiver)
fragility and the need for isolation, subsection 4.4 the planned
mounting technique, and subsections 4.5 and 4.6 the isolators themselves.
Lastly, subsection 4.7 discusses our test program.
4.2 INPUT SHOCK AND VIBRATION SPECIFICATIONS
The mechanical vibration environment for the LDAP is defined by
two basic vibratory inputs to the locomotive car body structure
that from the track and that from on-board rotating machinery
(diesel engine and auxiliaries) which is typically hard-mounted to
-34~
the car body. On-board equipment can cause structural excitations in
all directions at many frequencies;' for example, a single rotating
imbalance present in a diesel engine idling at 315 rpm could cause
significant vibration at 5Hz, and, at the higher end of the spectrum,
the firing frequency of a 16~cylinder, two~stroke~cycle diesel engine
is 240 Hz at maximum speed.
Road~bed caused excitations are primarily in the vertical (from
track irregularities) and transverse (from wheel hunting) directions.
Rail joints and special work (e.g., frogs) are a major source of vertical
vibration input to the locomotive suspension and car body structure.
For example, at 50 miles per hour speed, the rail-joint-contact frequency
is approximately 1.9 Hz for a 39-foot rail, and, since the joints are
staggered, the actual contact frequency would be nominally doubled,
the inputs alternating between the right and left wheel-sets. In
addition to the translational modes excited by the road bed, the loco
motive car body can roll and pitch on its suspension from both track
unevenness and mode-coupling because the center of gravity of a typical
locomotive is located high above the elastic center of the suspension.
The literature indicates that the typical spectrum for the car body
forcing frequencies are 2.5 to 7.5 Hz from the suspension system, 50
to 70 Hz from car body structural resonance, and 5 to 300 Hz from
the rotating machinery. Average road bed~caused amplitude is listed
as 0.25 G with peaks reaching 1.5 G. 2 Rotating-machinery-caused
amplitude will probably be less than 0.05 G. 3
Longitudinal (fore-aft) vibration is primarily attributed to the
shock transmitted through the locomotive draft gear. Velocity shock
-35~
can be used as a model to approximate the sudden "bottoming" of a
locomotive draft gear. 4 Velocity shock (also called a velocity step
or an acceleration impulse) occurs in equipment when a sudden change
occurs in the magnitude and/or direction of linear velocity. For example,
a package dropped on the floor experiences a sudden velocity change
at the instant the package is stopped by contact with the floor. Typical
values for longitudinal velocity shock encountered in railroad equipment
range from 50 to 100 inches per second. 4 The former value would be
approximately equivalent to dropping a body three inches onto a fixed
support with no rebound and the later value would be attained by a
similar IS-inch free fall.
The literature-based4 shock vibration values are summarized below:
a. Shock (buff and draft)50-100 inches per second velocity shock
b. Vibration (road-bed input)0.25 - 1.5 G in all directions;
c. Vibration (prime mover input)0.05 G all directions;
2.5-7.5 Hz harmonic50-70 Hz harmonic
5-300 Hz harmonic
The above literature-based shock and vibration data was supplemented
with estimates of the locomotive shock and vibration environment provided
by several railroad properties. A summary of the worst cases estimated
is tabulated below:
a. Shock (buff and draft)3 G longitudinal, 300 msec, half-sine pulse
b. Vibration (road-bed input)0.3 G longitudinal, 0-10 Hz harmonic1.5 G transverse, 0-10 Hz harmonic1.0 G vertical, 0-10 Hz harmonic
The 3 G, 300 msec, half-sine pulse is severe because of the long duration.
For example, to obtain a shock transmissibility of 0.5 (-6 dB) for
the 300 msec pulse duration, a passive isolator system (assuming it has
enough travel not to bottom) would need a horizontal undamped natural
frequency of approximately 0.25 Hz for a laO-pound suspended package
weight. For a suspension using four isolative units, the horizontal
spring rate of each isolator would need to be approximately 0.16 pounds
per inch. This "soft" rate would not be practical for a passive system
to support, in a stable manner, the static weight of 100 pounds. In
one reference a 10 G, 30 msec shifted-cosine pulse (gives less velocity
change than a same~duration half~sine pulse) is a recommended shock
level for the design of equipment to be shipped by rail. 5 An isolator
system designed to attenuate this input pulse down -16.5 dB (which
is the same as 3 G attenuated 6 dB from above) would need an undamped
horizontal natural frequency of approximately 2 Hz. For the same package
weight and number of isolators as in the above case, the horizontal
spring rate of each isolator would be approximately 10 pounds per inch,
a spring rate near the practical limit attainable (for this specific
application) by metal coil springs. If the same spring rate is used
in the vertical direction (assume all six vibration modes are decoupled),
the package would experience a 2.45-inch static displacement. This
figure is a very large static deflection, comparable to deflections
of low-natural~frequencyautomotive suspensions. However, through proper
design, the isolator system could be configured to minimize the large
spring size, surge, and lateral instability that can be typical of
low-natural-frequency passive isolator systems.
In an attempt to unify the literature and field data for the input
-37-
shock and vibration specification a recognized military standard was
selected to at least equal the levels and spectrum of literature and
field vibration data. For shock pulse duration and low frequency
accelerations, the standard is less severe than the levels of reported
field data. However. in those cases the standard's levels were more
in agreement with what the rail equipment was capable of producing
(e.g., suspension travel or reasonable coupler impact velocity for a
locomotive). The shock (with increased pulse duration) and vibration
specifications in Military Standard S10C for equipment installed in
ground vehicles met the above requirements for a general specification.
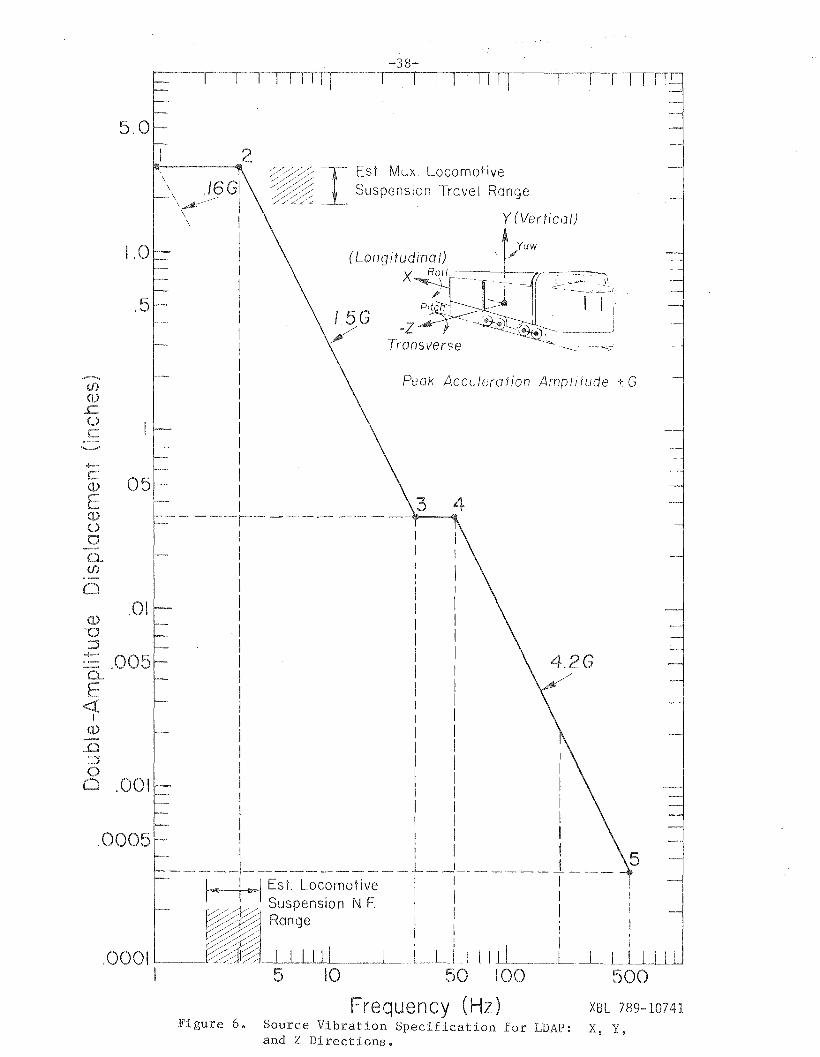
Of the three test curves in the specification for ground vehicles.
test curve W, extended down to 1 Hz frequency (see Figure 6). was
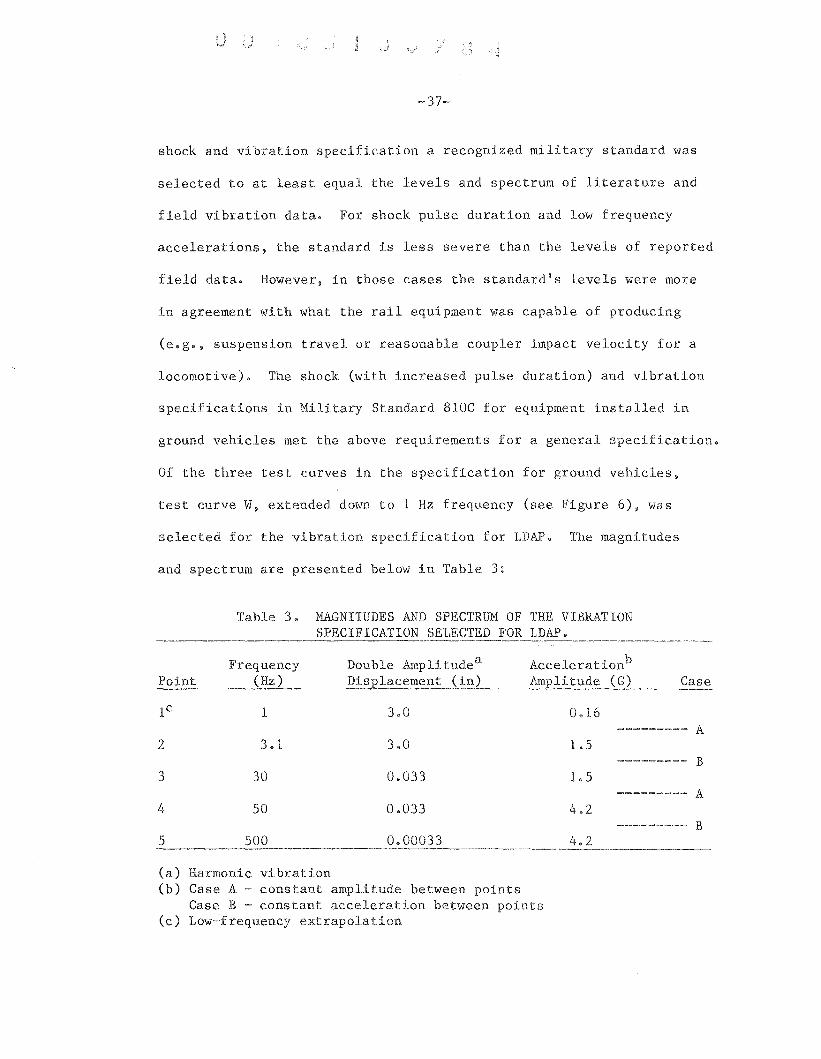
selected for the vibration specification for LDAP. The magnitudes
and spectrum are presented below in Table 3:
Table 3. MAGNITUDES AND SPECTRUM OF THE VIBRATIONSPECIFICATION SELECTED FOR LDAP.
Point
2
3
4
5
Frequency Double Amplitudea Accelerationb
(Hz) Displacement (in) Amplitude (G) Case
1 3.0 0.16--~=~~~=- A
3.1 3.0 1.5~~~~=-~=- B
30 0.033 1.5~~~=~=~~- A
50 0.033 4.2==~~~~-~~ B
500 0.00033 4.2
(a) Harmonic vibration(b) Case A ~ constant amplitude between points
Case B ~ constant acceleration between points(c) Low~frequency extrapolation
II I I I 11
~38-
I I 1 I II I I I I rT
5.0
500
XBL 789-10741x, Y,
4.2G
I
IIIIII
- 1 _I
Peak Accdero tion Amp! i tude ± G
Est MllX. LocomotiveSuspension Trove I Range
\
.5
,01
05-
1.0
.001
2.....--~ ~'l~
~~6 GI /;/;;;:;I ///L~
IIIIIIIIIIIIIIIIIII------r--·-------IIIIIIIII II II II I
I II II II II II II II II I____ __~ L_
1""'1 I ll>1 Est. Locomotive :V/~~ Suspension NF I
~./X. Range I I~; ! I I
.000I L.-.~_§§; ~ - I I I I I I l-L~J-ilJ~ L _--'---_-'----'--'--L..-l--'--'
I 5 10 50 100
Frequency (Hz)Figure 6. Source Vibration Specification for LDAP:
and Z Directions.
.0005
(J)ooQ(j)
o(1)
u::::s-- .005Q
E«I
(1)
D
--(j)(1)£:oC
~39-
The test curve extends above the normal 200-Hz limit (specified for
ground vehicles) to include the higher frequency inputs from, in the
locomotive case for example, the firing-frequency of multicylinder
locomotive engines (approximately 300 Hz max).
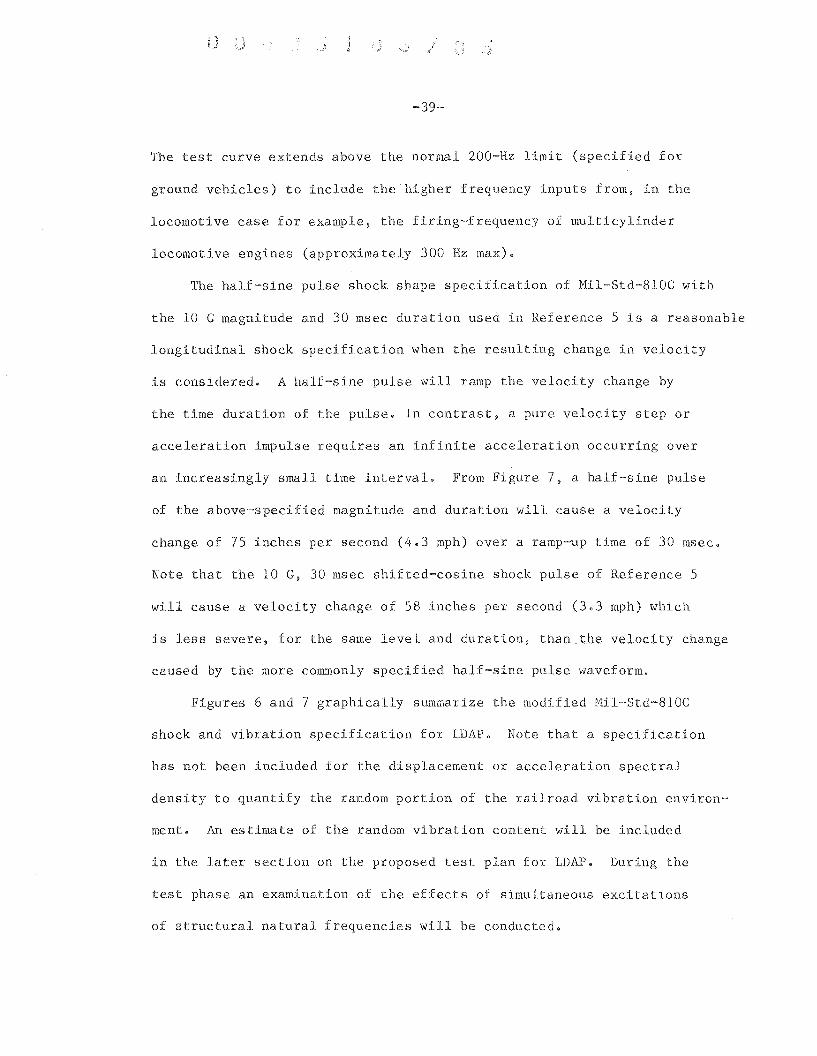
The half~sine pulse shock shape specification of Mil~Std-810C with
the 10 G magnitude and 30 msec duration used in Reference 5 is a reasonable
longitudinal shock specification when the resulting change in velocity
is considered. A half-sine pulse will ramp the velocity change by
the time duration of the pulse. In contrast, a pure velocity step or
acceleration impulse requires an infinite acceleration occurring over
an increasingly small time interval. From Figure 7, a half~sine pulse
of the above-specified magnitude and duration will cause a velocity
change of 75 inches per second (4.3 mph) over a ramp~up time of 30 msec.
Note that the 10 G, 30 msec shifted-cosine shock pulse of Reference 5
will cause a velocity change of 58 inches per second (3.3 mph) which
is less severe, for the same level and duration, than the velocity change
caused by the more commonly specified half-sine pulse waveform.
Figures 6 and 7 graphically summarize the modified Mil-Std-810C
shock and vibration specification for LDAP. Note that a specification
has not been included for the displacement or acceleration spectral
density to quantify the random portion of the railroad vibration environ
ment. An estimate of the random vibration content will be included
in the later section on the proposed test plan for LDAP. During the
test phase an examination of the effects of simultaneous excitations
of structural natural frequencies will be conducted.
~40-
---1-- - INITIAL VELOCITY
Translated Down
Ij-l 3ms ±7.4 in/sec
\ 738 ic/"lLimit of Integration I
\A--+--------L- DATUM LINE 0 G.
I§10:::
i~
FINAL VELOCITY
·_-.~~~-~~~------45ms----
VELOCITY -TIME
I
IACCELERATION - TIME
&-----TlME
!1
II
-+-----~ _~ l~ ~ ~~I
ACCELERATION
XBL 789-10737
Figure 7. Shock Specification for LDAP: X, Y, and Z Directions.
4.3 FRAGILITY THE NEED FOR ISOLATION
In isolator system design it is important to characterize the
mechanical impedance and fragility of the equipment being isolated.
To make the design problem manageable, an initial approach will consider
the receiver impedance to be adequately represented by a simple mass
load. Consideration must also be given to the location of fragile
components inside the receiver. Defining the environment as the
vibration source, both the source and the fragility of the receiver
can be described as surfaces of hills and valleys on a three~dimensional
plot. In such a plot length and width of the surface correspond to
the axis directions of vibration frequency and time. The height of
the surface and the thickness of the undulations respectively represent
the mean amplitude of the vibration and its standard deviation.
Probability of receiver damage is minimized when the "fragility surface"
is much higher than the "environmental surface" (vibration source) and
both surfaces are relatively thin.
For analysis of the LDAP mounting system, the source admittance
is assumed to be zero and therefore, the source impedance will be
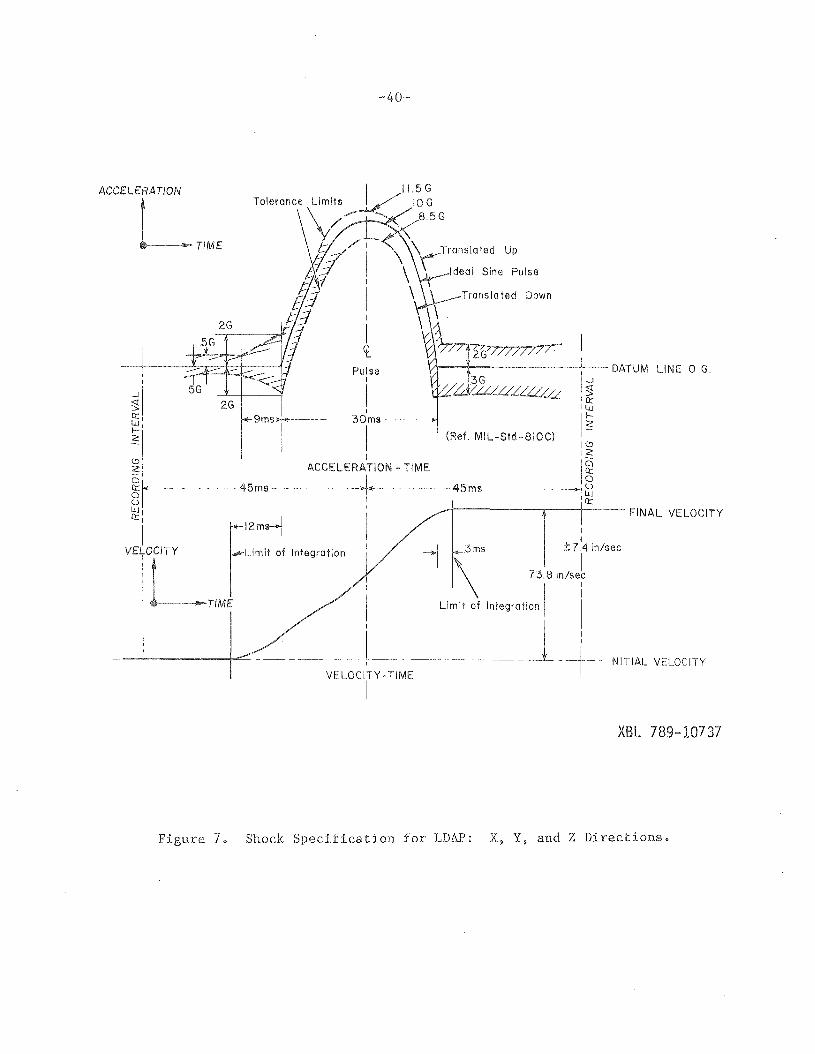
infinite. The fragility plot for the receiver is based on the vibration
tolerances for the digital magnetic tape recorder and is shown in
Figure 8. Note that the fragility envelopes shown in the figure do
not cover the full expected frequency range of the environment. In
order to make a more detailed assessment of equipment fragility, the
data supplied by the two recorder manufacturers (Tandberg and D.E.I.)
will need to be extended in both frequency and amplitude. This is
of particular importance in evaluating the dynamics of the tape-to~
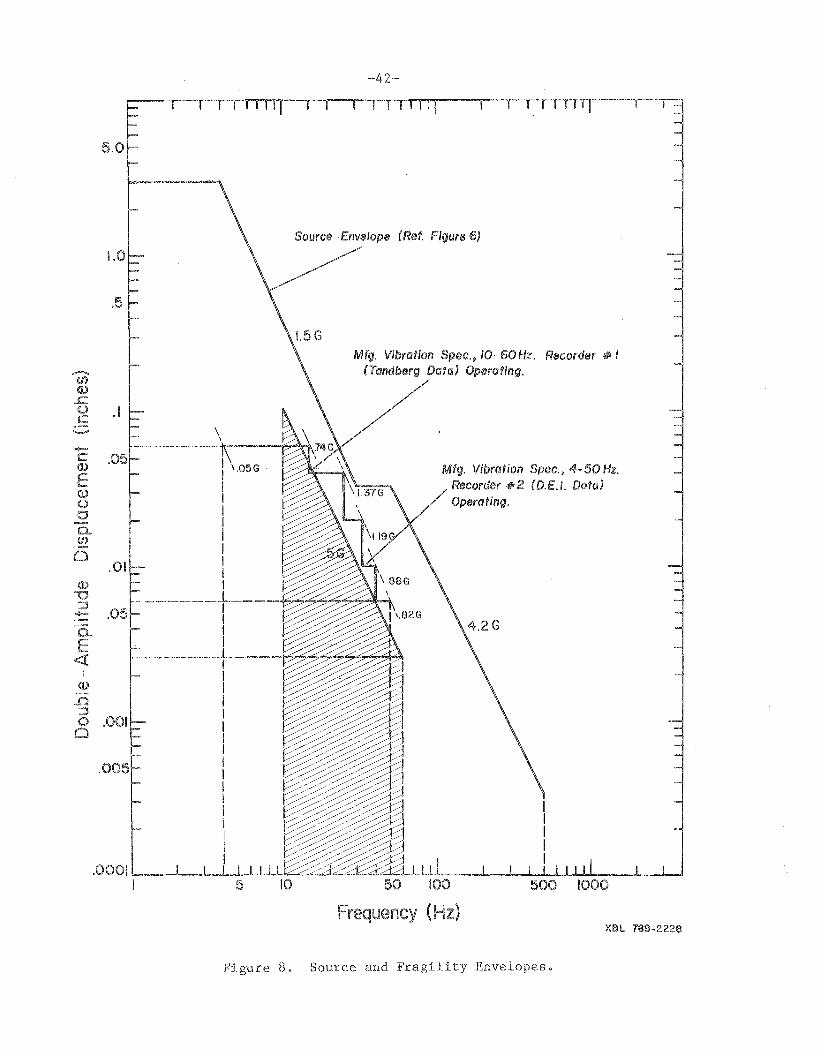
5.0
Mfg. Vibration Spec., 4-50 HI.Recorder #2 W.E./. Data)Operating.
Mfg. Vibration Spec., 10-60HI. Recorder # I(Tandberg Data) Operating.
\
\
1\05GIIIIIIIII
~-----t----~~~~~~~III
~ L ~~~~~~~~
IIIIIIIIIIIIIIIII
.I
.01
1.0
IQ)
--
Frequency (Hz)XBL 789-2228
Figure 8. Source and Fragility Envelopes.
-43~
recorder-head mechanical interface).
4.4 ISOLATION - A CENTER OF GRAVITY APPROACH
The following additional assumptions will be made in the design
process of the LDAP isolator system. 6
1. The major effects in a given direction of motion can beassessed by considering pure translation of the equipment inthe given direction only. This consideration requires thatthe motions and admittances of the equipment support pointsare so nearly enough alike that they do not cause significantrotations of the equipment.
2. The vibration isolation system will be a "center of gravity"configuration to allow individual treatment of each of thethree mutually perpendicular directions of motion.
3. Each of the vibration isolators may be described dynamicallyby a linear massless spring and an ideal viscous damper thatare mechanically parallel.
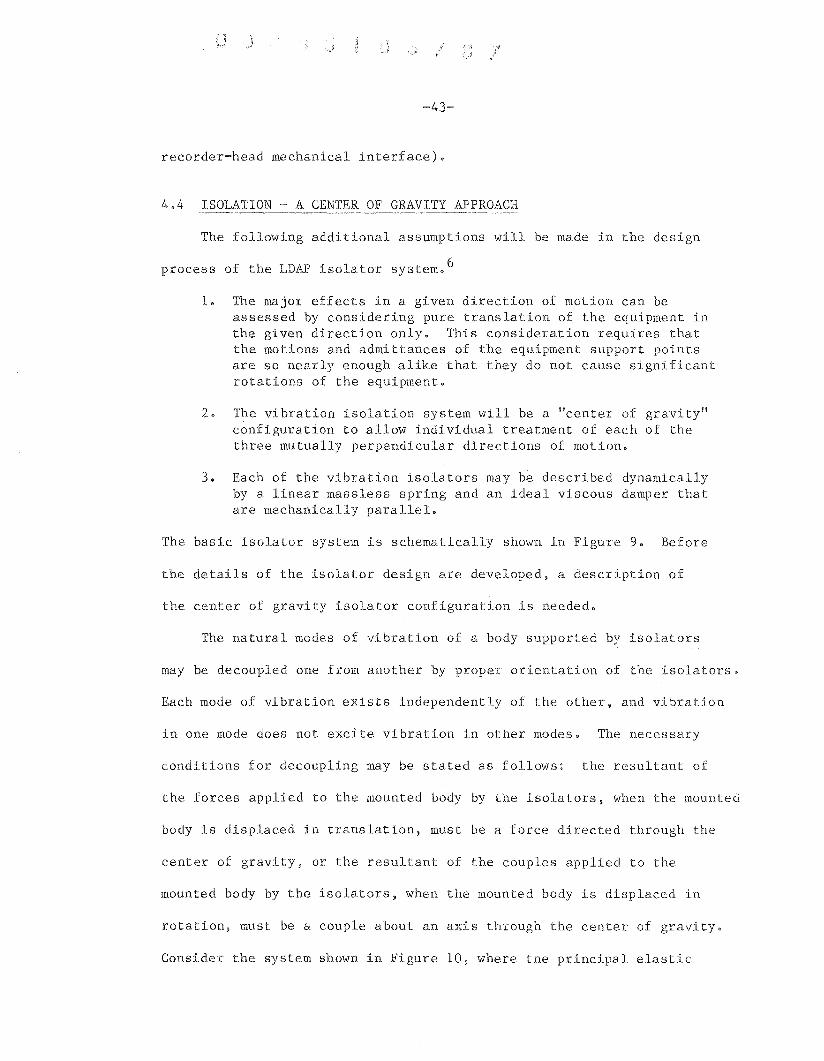
The basic isolator system is schematically shown in Figure 9. Before
the details of the isolator design are developed, a description of
the center of gravity isolator configuration is needed.
The natural modes of vibration of a body supported by isolators
may be decoupled one from another by proper orientation of the isolators.
Each mode of vibration exists independently of the other, and vibration
in one mode does not excite vibration in other modes. The necessary
conditions for decoupling may be stated as follows: the resultant of
the forces applied to the mounted body by the isolators, when the mounted
body is displaced in translation, must be a force directed through the
center of gravity, or the resultant of the couples applied to the
mounted body by the isolators, when the mounted body is displaced in
rotation, must be a couple about an axis through the center of gravity.
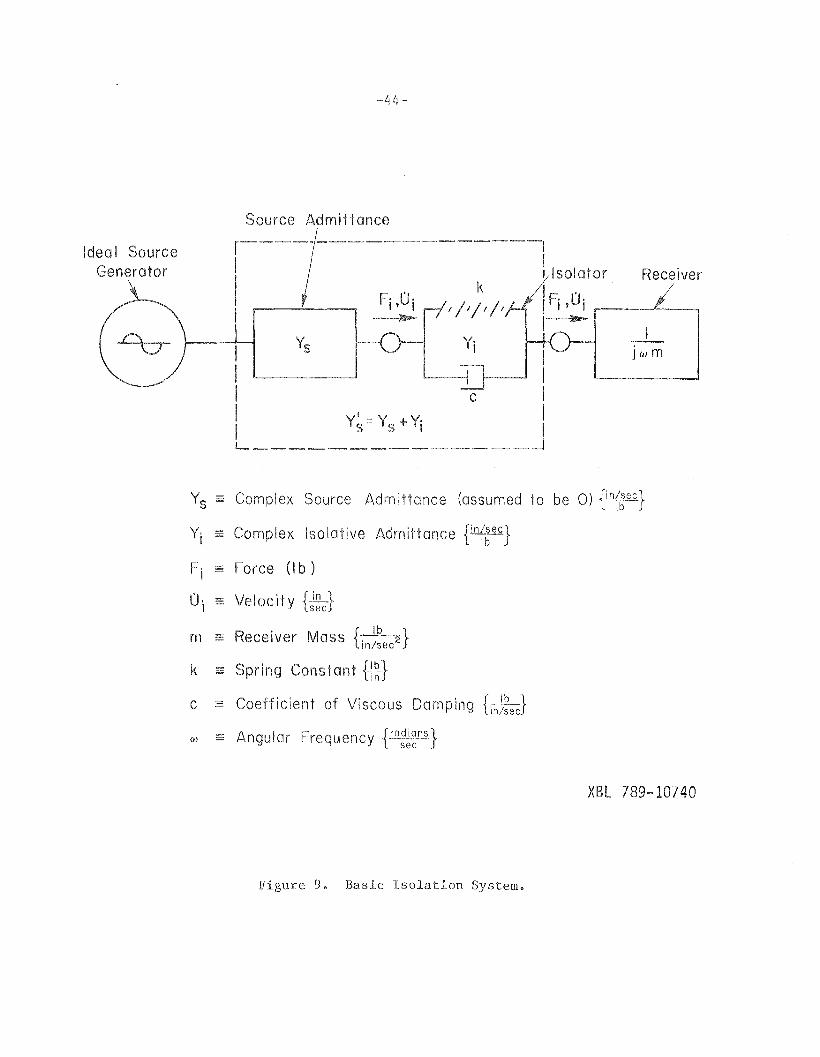
Consider the system shown in Figure 10, where the principal elastic
Receiver
c
Source Admittancer-~-~j------~-~-~~~l
I I k! Isolator
I Fj ,OJ 1/1/1/1 IFj ,OJ r----L------.,
I :.w I ...
III
I I _ II Ys - Ys + Yj IL~ ~__~__~~~~_J
Idea I SourceGenerator
Ys =: Complex Source Adm ittance (assumed to be 0) {in{~ec}
Yi ~ Complex Isolative Admittance rnf~ec}
Fi - Force (Ib)
0i - Velocity G~J
m ~ Receiver Mass {in~~ec2}
k - Spring Constant {\~}
c - Coefficient of Viscous Damping tn~~eJ
w - Angular Frequency {ra~~~ns}
XBL 789-10740
Figure 9. Basic Isolation System.

-45-
axes of the isolators are parallel and there exist two planes of
symmetry (plane XY and ZY). The forces resulting from a deflection
in the Y direction alone are symmetrical with respect to the center
of gravity in both the XY and ZY planes. This symmetry in two planes
automatically makes the resultant vertical force pass through the center
of gravity and, therefore, automatically provides for decoupling of the
Y-coordinate mode of vibration. In Figure 10 the forces resulting
from an X deflection or a Z deflection are symmetrical with respect
to the center of gravity only in the top view. The result of this
is that the ~-coordinate mode is also automatically decoupled, whereas
the X- and Z- and ¢~coordinate modes are coupled. Decoupling the
X~ and the 6~coordinate modes in the XY plane requires that the forces
in the X direction be symmetrical about the center of gravity in the
XY and XZ planes. This would imply that the only additional require
ment for the system is that b = O. However, d must also be zero to
allow displacement in the X direction to be decoupled from the angle
of rotation, 6. Therefore, since physically b cannot practically be
made equal to d, it is apparent that complete decoupling of the coordinate
modes is not possible when using typical isolator configurations (coil
springs and the like). Nevertheless, if b = -d, the coupling will be
minimal and in most cases if either b or d equals zero, the effect
of coupling can still be ignored.? Note that the above discussion
applies also to the Z- and ~~coordinate modes in the ZY plane. Now
having nominally "three planes of symmetry," the isolation system has
all six vibration modes decoupled and can be designed to have the same
natural frequency in all six modes (make the spring rates equal in the
~46-
z
TOP VIEW
Assume:
kx :;: kz :;: "7ky
_ HORIZONTAL STIFFNESS"7 = VERTICAL STIFFNESS
yy LDAP
C.G.SIDE VIEWS r-X
b d kI.........,--~--~ Y
J. ..L. -t--kXW ////~~ .I-- a a -1 LocomotIveCarbody (LDAPOuter Case)
I
I
7771 i 7777r-cTc~
--z
isolator
XBL 789-2233
Figure 10. Suspended LDAP Unit on Four Isolators.
-47-
horizontal and vertical directions and locate the isolator positions
relative to the center of gravity, at distances equal to the cor-
responding radii of gyration). Thus designing the isolator system for
three planes of symmetry can be useful when it is desired to keep the
six natural frequencies close together.
4.5 SHOCK AND VIBRATION - GENERAL HARDWARE CONSIDERATIONS
The following categories of the isolator properties are significant
for the proper design of the isolator subsystem:
a. Linear dynamic performance along and about three axes.
b. Load and deflection capacity.
c. Strength and endurance.
d. Resistance to deterioration in adverse environments (temperature,oil, etc.).
e. Installation features.
With the selection of the center of gravity mounting scheme, each
of the vibration modes can be analyzed independently. This greatly
simplifies the analytical work required to design the isolator system
when compared to that of a fully coupled system. The following dis-
cussion will briefly describe the methodology used to define the stiffness
and damping parameters of the isolators. 8 By assuming that each of the
six modes can be analyzed as a single-degree-of-freedom system with the
above two parameters, each isolator can be specified to a manufacturer
by using three alternative methods:
1. Range of natural frequency and fraction of critical damping.
2. An envelope of transmissibility for the range of permittedparameters.
3. Ranges of spring constant and viscous damping coefficient.
-48-
Methods 1 and 2 are the most common, with method 2 having the advantage
of not being affected by slight nonlinearities present in all "linear"
practical isolators.
To begin the definition of the isolation parameters, the actual
need for isolation of the equipment has to be verified. It is possible
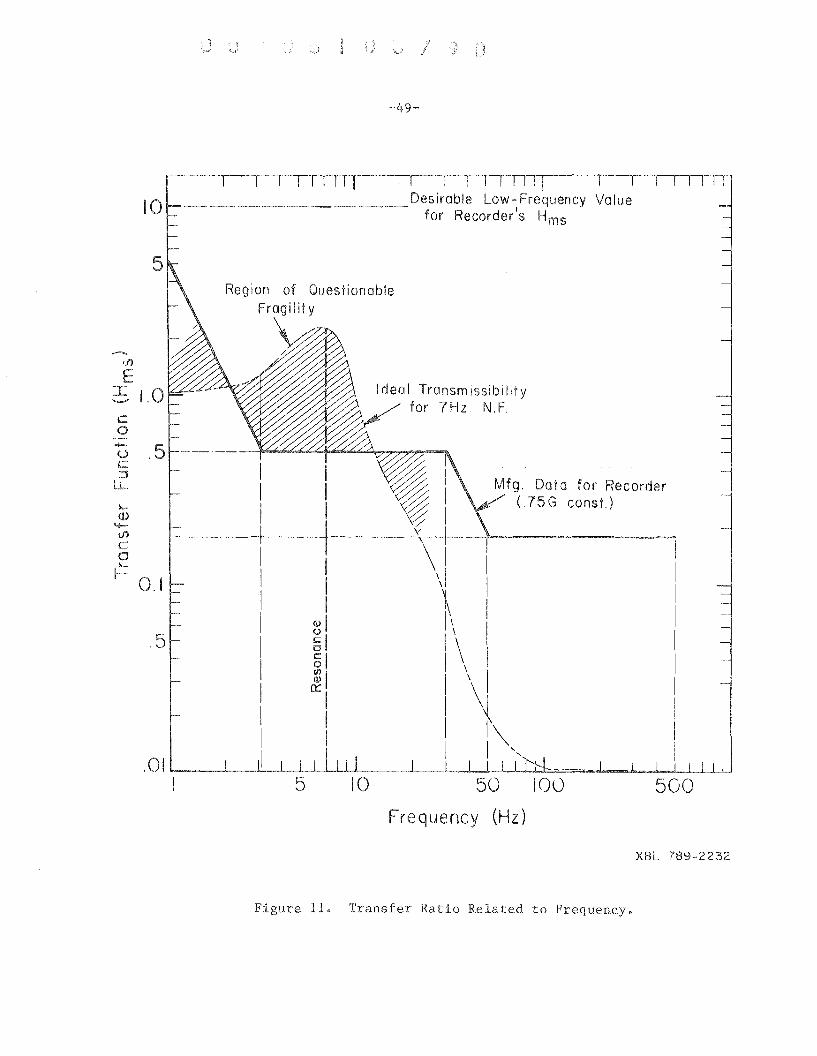
that the equipment could be "hard" mounted. On Figure 11 is shown
a plot of the maximum allowable "transfer function", Hms versus
frequency. Hms for harmonic input is defined as:
, where
Uf complex amplitude of input harmonic displacement expressingthe fragility limit of the equipment, and
Us complex amplitude of output harmonic displacement of thesource vibration.
This calculation becomes less complicated than that for the general
case, since the source admittance is assumed to be zero. Any value
of Hms less than 1.0 implies a need for vibration isolation. Note
that the values of Hms were calculated from the averaged recorder
manufacturer's specifications so that the values at the higher and
lower ends of the frequency spectrum are extrapolations; tests will
be done to insure that the actual equipment fragility limits will not
be exceeded.
Now that it has been determined that isolation is required, a
minimum natural frequency has to be established for the isolation systeru
and the inertial properties of the suspended mass have to be defined
(mass, center of mass, moments of inertia, and products of inertia) to
establish the location of the mounts. From practical considerations,
-49-
Desirable Low-Frequency Value-----~------ for Recorder's H
ms
'-"
c0
0+-
.5uc:::J
lL.
I-Q)-tflC0I-
~0.1
.5
5 10
Ideal Transmissibilityfor 7Hz N.F.
50
Frequency (Hz)
100 500
XBL 789-2232
Figure 11. Transfer Ratio Related to Frequency.
-50~
the system natural frequency has been selected at 7 Hz, ±15%. This
frequency will give a static deflection of approximately 0.2 inches.
Isolation begins at approximately 10 Hz and attains 90% efficiency at
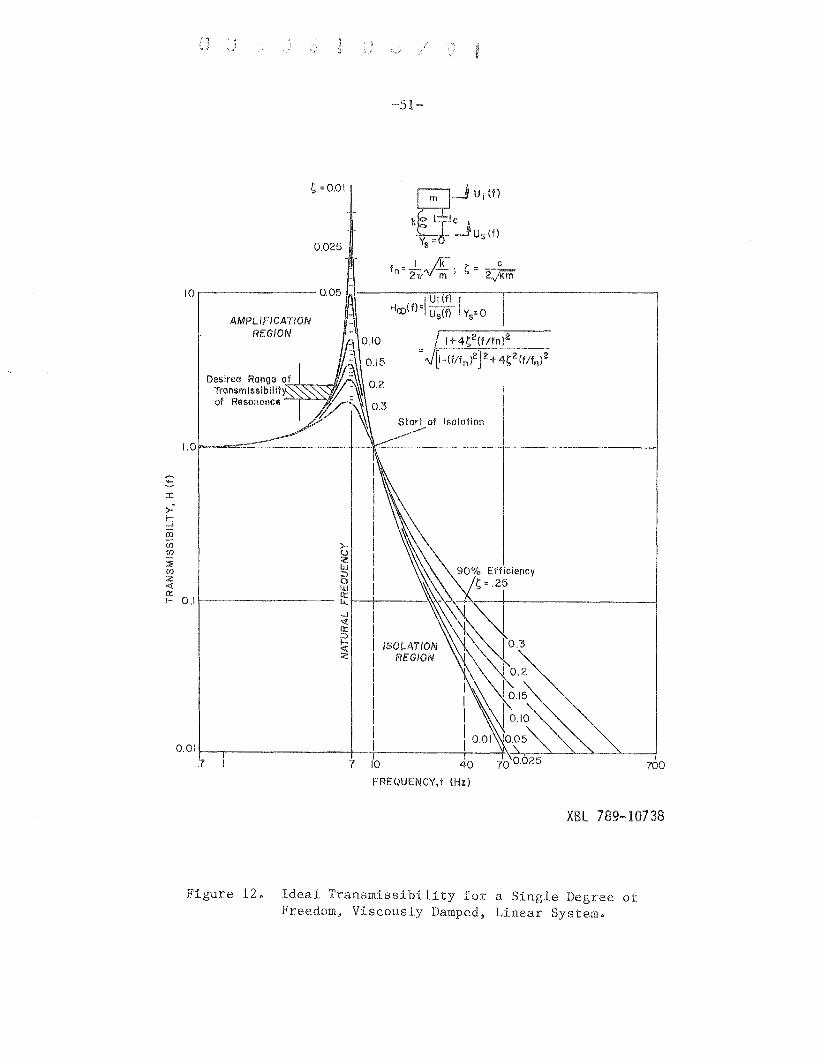
approximately 40 Hz (see Figure 12). A lower natural frequency would,
of course, be more efficient over the full spectrum but would risk
resonance with the range of locomotive suspension natural frequencies
and the 300 cycle-per~inute engine idling frequency. To illustrate
the problem of low~frequency resonance. assume that the LDR isolator
system has a natural frequency of 2 Hz and is driven at resonance
with damping 25% of critical to control the maximum resonant amplitude.
If a two-inch double-amplitude displacement is input at 2 Hz, the system
will try to respond with approximately 5.0 inches of double-amplitude
displacement which would be difficult to accommodate in a passive system
without a large "rattle~space" or overstressing the spring element of
the isolator. In contrast, at 7 Hz the typical input amplitude will
be limited to approximately 0.25 inches so that a similar resonance
condition will produce approximately 0.5 to 0.75 inches travel in the
suspended mass.
One difficulty with the 7 Hz natural frequency is that the equipment
will need to be able to withstand the direct coupling and amplification
of the source displacement below approximately 10 Hz. With the manu
facturer's recorder fragility specification of only 0.75 G at low fre
quency. the 7 Hz natural frequency of the isolator system will allow
sufficient attenuation of the 1.5 G input starting at 20 Hz. A desired
equipment fragility at low frequency, less than 15 Hz, would be at
least 10 GiS peak amplitude. If the recorder manufacturer's
-51-
700
Isolation
ISOLATIONREGION
7 10 40
FREQUENCY,f (Hz)
AMPLIFICATIONREGION
10 ,..........------ 0.05IA\----~1U7."iTi(f)~I--'-----------'
H(l)(f)~ u;TIf Ys~O
1+4~2(f1fn)2
O,OIl----r--------+-t--------+--t\-:~:_::_~-"---"--~-_t,7
Desired Range ofTransmlssibilit-*",~~7!Jof Resonance
~ =0.01
0.025
:J:
)-
:iCD
w ~w u~ ~w ~z 0
g0.11---------- ~+-+-----'\\\...J'<t0:::::lI'<t<:
XBL 789-10738
Figure 12. Ideal Transmissibility for a Single Degree ofFreedom, Viscously Damped, Linear System.
-52-
conservative low-frequency vibration specification is actually verified
by testing (specifically of the recorder head-to-tape interface). ad-hoc
ruggedizing of specific weak components would be more desirable than
designing a low-natural~frequency, high displacement, "FREE-FREE" type
of suspension.
Besides the vibration environment, the shock conditions on the
locomotive will define a part of the isolator specification. Since
shock is normally a transient phenomenon, the isolation of shock input
is considerably different from that of a vibration input. The shock
isolator is a storage device where input energy. usually with a very
steep wave front. is instantaneously absorbed. The energy is stored
in the isolator and released at the natural frequency of the spring-mass
system. By assuming a damping coefficient of 0.25, the shock
transmissibility of the 7 Hz isolator system responding to a 30 msec
half~sine pulse would be about 0.8. 9 When considered from the standpoint
of a velocity shock. a step change in velocity of 75 inches-per-second
would cause the most rigid parts of the equipment suspended on a 7 Hz
isolator system to experience approximately 8.5 G peak with a 1.5 inch
excursion. The shock specifications supplied by the recorder manu
facturers for non-operating equipment correspond to velocity changes
in the 125 to 200 inches~per~second range. Testing will be necessary
a) to establish the shock limits while the recorder is running to insure
that the 7 Hz isolation system will provide adequate protection. and
b) to evaluate effects of snubbing since an actual isolator system will
need a snubber transition region to avoid "hard bottoming" for severe
velocity changes.
-53-
Although the exact inertial properties have not been established
for the suspended equipment (tests will be required for accurate values),
initial estimates place the suspended mass at ~ 0.3 Ib-sec 2/in.* and the
radius of gyration in the length dimension at ~ 10 inches and those
in the height-width dimension at ~ 4 inches.
4.6 SHOCK AND VIBRATION ISOLATION -- SPECIFIC HARDWARE CONSIDERATIONS
Since the proposed isolator system can be classified as a low
natural frequency system, metal coil springs are being considered for
the elastic elements of the isolator system. Metal springs are readily
designed with ability to undergo large deflections without exceeding the
safe working stress for the spring material. In contrast, a rubber
isolator capable of sustaining large deflections is generally required
to have large dimensions to attain a low unit strain. Metal springs
also can endure large excursions of temperature without material
degradation or large changes in stiffness.
However, a metal spring exhibits little internal damping when
compared to that available in an elastomeric spring. Auxiliary damping
is thus required in conjunction with a metal spring when operation
at resonance is expected. A common damper used in the general class
of viscous dampers is the dashpot. A piston is attached to the suspended
body and is arranged to move axially through a liquid in a cylinder
mounted to the source of input displacement. Through proper design,
the force required to shear the fluid can be made nominally proportional
to velocity, the magnitude of the damping force being controlled by
* Approximately 100 pounds.
~54-
the viscosity of the liquid and the radial clearance (requires precision
tolerance) between the piston and cylinder walls. Although dashpots
are probably the best behaved discretized dampers from the standpoint
of analysis, they have several limitations: a) they typically act along
a single axis, b) they tend to restrict motions not along that axis
(unless additional equipment as spherical~end bearings are added),
c) they require seals to prevent fluid leakage, d) damping properties
vary with temperature (from fluid viscosity change), and e) they tend
to be costly. Air can be used as the damping fluid to minimize the
sealing problem and the viscosity change with temperature. With air
damping a piston drives air through an orifice, and the work expended
in forcing air through the orifice extracts energy from the vibrating
system.
Energy can also be extracted from a dynamic system by allowing
sliding contact between two members, one being attached to the suspended
mass and the other to the source of motion. Dry~friction or coulomb
damping elements are less complex to construct than the precision-fitted
components of a viscous system. However, on the the minus side the
characteristics of coulomb damping are less adapted to analysis than
those of viscous damping. Also, a coulomb damper will tend to reach
a "transmissibility floor" at high frequency because the small deflection
at high frequency makes the spring-force contribution small. At this
point the nominally constant-force (amplitude independent) friction
damper will tend to dominate the response of the suspended mass. With
time passage the damping characteristics can change from wear and
contamination of the rubbing surfaces with materials that alter the
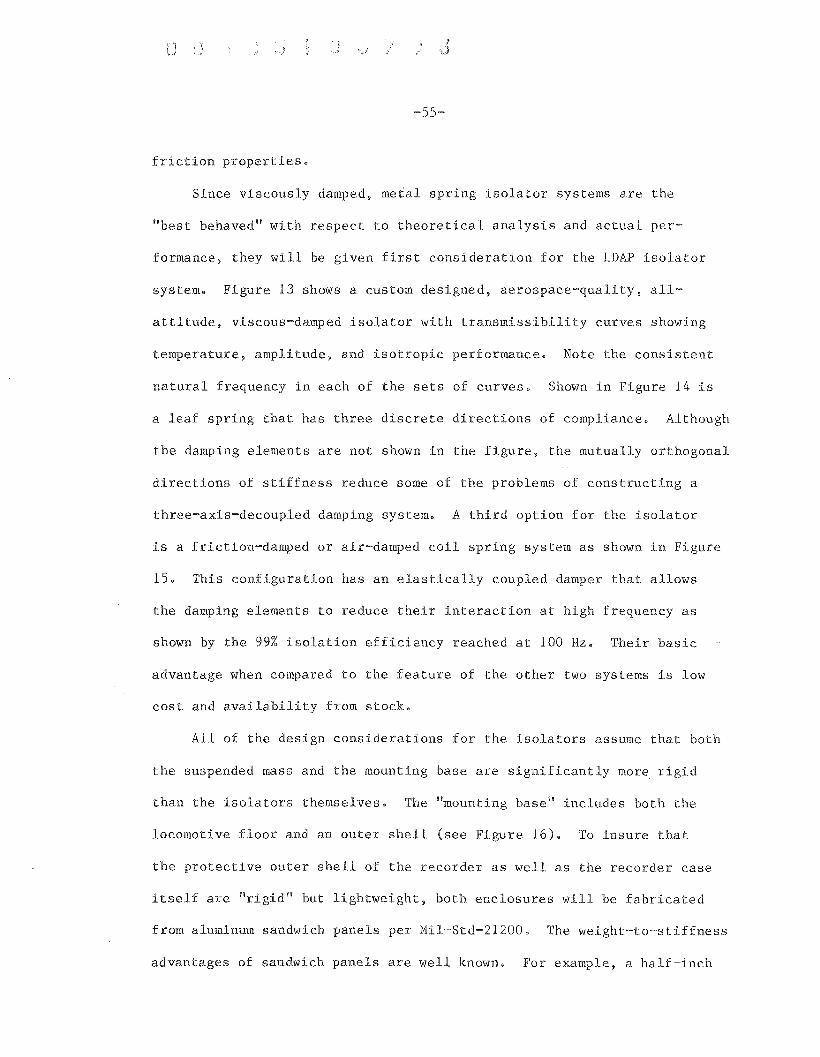
-55-
friction properties.
Since viscously damped, metal spring isolator systems are the
"best behaved" with respect to theoretical analysis and actual per
formance, they will be given first consideration for the LDAP isolator
system. Figure 13 shows a custom designed, aerospace-quality, all
attitude, viscous-damped isolator with transmissibility curves showing
temperature, amplitude, and isotropic performance. Note the consistent
natural frequency in each of the sets of curves. Shown in Figure 14 is
a leaf spring that has three discrete directions of compliance. Although
the damping elements are not shown in the figure, the mutually orthogonal
directions of stiffness reduce some of the problems of constructing a
three-axis-decoupled damping system. A third option for the isolator
is a friction-damped or air-damped coil spring system as shown in Figure
15. This configuration has an elastically coupled damper that allows
the damping elements to reduce their interaction at high frequency as
shown by the 99% isolation efficiency reached at 100 Hz. Their basic
advantage when compared to the feature of the other two systems is low
cost and availability from stock.
All of the design considerations for the isolators assume that both
the suspended mass and the mounting base are significantly more rigid
than the isolators themselves. The "mounting base" includes both the
locomotive floor and an outer shell (see Figure 16). To insure that
the protective outer shell of the recorder as well as the recorder case
itself are "rigid" but lightweight, both enclosures will be fabricated
from aluminum sandwich panels per Mil-Std-21200. The weight-to-stiffness
advantages of sandwich panels are well known. For example, a half-inch
LORDCO DATA
~ 2
i I'ii :<l ,1~
~ 6
"2
o
1.0l D.A.--""'-,-
? u ~. f------- --1
~ --
IA \
4' ,1
'1\'7 DA•
.WllD)~~_. _.- ----1---- --
""~~2 6 Il 10 12 14 16 Ie 2
i----~:==:.-,
1\\
f----_ ..~- . ~~
-~ --~-
~--- - -;---------~~-- -- -
"" "1----.-f----- --.~~
$~F-- -~
2 " 10 I'X> II 100
Temperature effect onnatural frequency
Displacement effecton natural frequency
1000
Direction effect onnatural frequency
d
-- '--=F=F'f---- .-
~-=F~~-f-------
1--- .--I----~ - ...._--. --_._--
""f------- ---
" ""-- ........ -
1-----. - '-----I--AXIAL
........ RADIAL-
~
2 10 2 " II Il 100 2 4 II II
dashpot
-~-~.~ Silicon
Constantnatural frequencycoil spring
Figure 13. Viscous-Damped, All-Attitude Vibration Isolator.
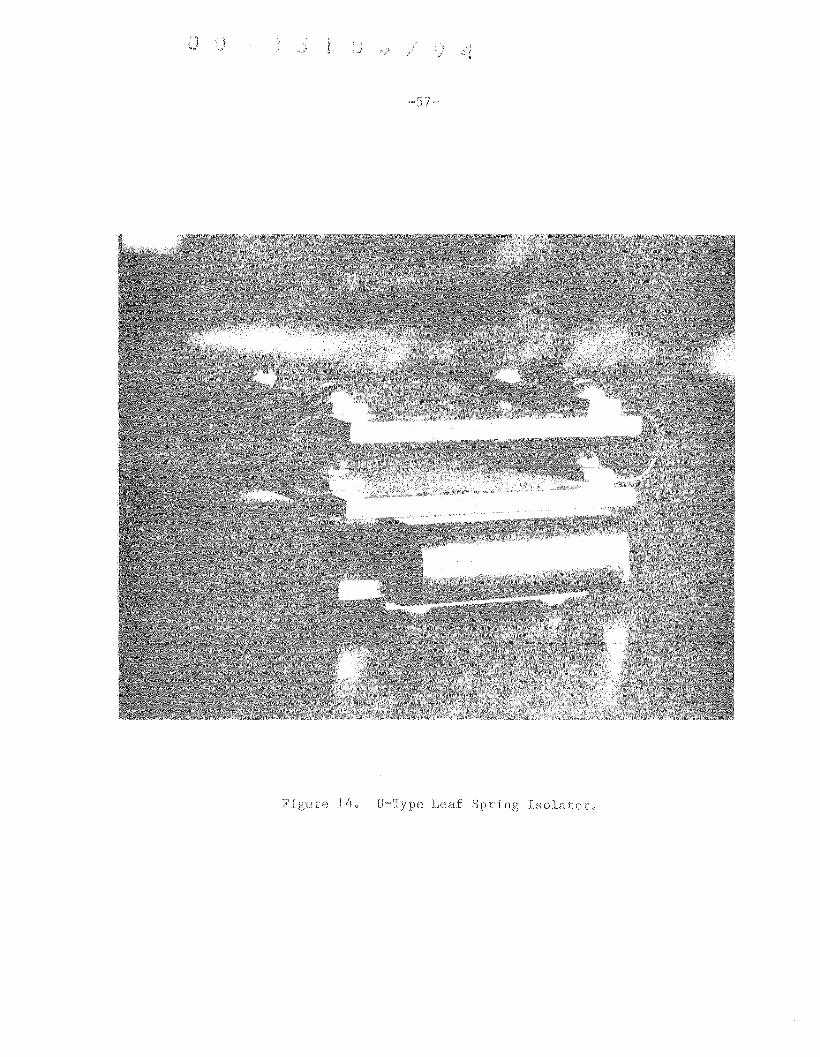
F 140 Leaf Isola oro
Barry Wright Corp.
Auxiliary lood anddamping ~pring
Friction-damped
Balloon cop
.Damper balloon
Spring sea!
Air~damped
10
>r:::Jill(f)(f)
:2(f)z« 01 ~n::r
10
rI--
~ 0.1(jjif)
~if)
Z<J:0::I-- 0.01
IIOOMILS T020 HzINPUT
VIBRATION RESPONSE OF AN EOUIPMENTMOUNTED ON BARRY H-MOUNTS
(VIBRATION INPUTS SHOWN ARE FROMMIL -STD-BIO fOR HELICOPTER)
5 10 100
FREQUENCY (Hz)
\,,-HORIZONTAL\\\\
500
XBL 789-2235
.0ILLwJ~-----l--l----l..Ll~L~~~~5 10 50 100 500
FREQUENCY (hertz)
XBl 789-2231
Figure 150 Friction and Air~Damped Vibration Isolators.
Vertical
~n ., Horizontal
Viscoelasticallyaluminum outer case
Ilf1'-0I
I!
I!
Plugs and necessaryr----- heat exchanger interfaces
]----- Movemen tspaceapprox.1.5 in.
LDAP: Mounted in aviscoelastically dampedaluminum case
Carstructure
- Sec -
NOTE: Location of isolators with respect toLDAP C.G. to be positioned to provide
control of natural frequencies (decoupled response)
Figure 16. "Box-Inside-A-Box" Case Des
-60-
thick sandwich panel with O.032~inch thick aluminum faces has the
effective stiffness of ~ 0.35~inchthick geometrically similar solid
aluminum plate. However, the sandwich panel has less than 5% of the weight
of the solid plate, assuming an aluminum honeycomb core is used in
the sandwich. Figure 17 shows a cross section of a typical enclosure
made to Mil-Std-21200 that utilizes sandwich panels with extruded
aluminum edge closeouts and aluminum corner castings. For additional
insurance against panel resonance deflections, the faces of the sandwich
assembly can be treated with damping material.
A similar approach will be used to construct the inside shell
that will be directly attached to the recorder equipment. All of the
edge closeouts will be glued tb the panels, and a conductive adhesive
will be used to insure continuity in the electromagnetic interference
(EMI) shielding provided by the two cases. Also, both the inner and
outer shells will be modified in selected areas for cable routings
and heat exchanging equipment for the waste-heat from the electronics.
Within the recorder package itself, the printed circuit (PC) boards
are probably the next most vulnerable component to be fatigued by
vibration, after the recorded tape-head and drive. Typical printed
circuit boards are thin, flexible plates that vibrate easily, often
resulting in loose components, cracked solder joints and broken leads.
Three methods are available to help the boards survive a severe vibratory
environment10 : increase the board's stiffness, shift its natural frequency
out of the range of excitation, or damp the board structure. For example,
an 8 x 12 inch, 1.2~pound PC board made of O.06~inch thick epoxy fiber
glass (typical of microprocessor boards) has a fundamental-mode vibratory
'\ 51(·$·933 WITH AIR VALVE
'\ SI(·H·124 LESS AIR VALVE
51(·1'11·750 FOR V. PANEL
SK·M·776 FOR lI2 PANEl
"W"INSIDE EDGE
FRAME
_J-T
~61-
~ L INSIDE EDGE FRAME .94 R.TYPICAL
51(·1'11·808 FOR '12 PANEL 'I. 8. ¥.!51(·1'11·559 FOil 'I. PANEL CORE5 51(·1'11·549
Sl(·M-829 51(.1'11.550r 51(·5--2430Sl(·5-24119 FOIl AUTO VALVE~~~~~._=":,::,,,:,,:,:,,-n
HI----+o....,l'-----+~
51(·5·2428I 51(·1'11,502 FOR V. PANEL
l' SI(·M·705 FOR lI2 PANEL
5K·M·790 FOR 'I. PANEL
SI(·M·778 FOR lI2 PANEL
Skydyne Company
The watertight seal used in all Skydyne closures ismore reliable and longer lasting because all pres·sure and ,abrasion is made along metal·to·metalsurfaces. relieving the wear on the D·ring seal.
fhicknollS of Aluminum Plat@Roquired to Obtain SUMeRigidity (.Ii Sandwich PaMIEffect of COtO Mot0riQI NeghH'od
i .3IJ!l f-..+--+-+-+-1-+--+--jf--ilfi!-;t:~1:"-1igIi~ :I .:lUlll f-..+--+--+--+--l-
~'"
.375
Figure 17. Example of Mil-Std-21200 Enclosure.
frequency of ~ 30 Hz. According to Steinberg,10 after the board's
center displacement exceeds ~ 0.3% of the board's width, the reliability
tends to be reduced. Therefore, 1.5 G at 30 Hz harmonic would cause
~ 0.02 inches S.A. displacement. Neglecting attenuation of the isolator
for a conservative design approach and assuming a resonance transmissi
bility of 5, the board could experience upwards of 0.10 inches (1.3%
of width) displacement at the center. By bonding three 0.6 inch-high,
0.06-inch thick longitudinal steel ribs to the board, the natural
frequency can be increased 10 times where the input amplitude at 4.2 G
is ~ 0.01 inches. At resonance this deflection at the board center
could be approximately 0.005 inches, which is a conservative one-fifth
of the maximum recommended safe deflection limit. Similar epoxy fiber~
glass ribs could be used to stiffen the board but the maximum natural
frequency gain would be to ~ 150 Hz. In this case the possible
mid~board deflection would be closer to the maximum allowable deflection
of 0.025 inches.
Since the board stiffening method requires careful installation,
fitting and attachment, the third method of displacement attenuation
can be done more simply. One approach is to adhere a viscoelastic
damping layer and fiberglass constraining layer to form a "damped
sandwich" assembly with the circuit board substrate. Resonance
amplitude can be reduced up to 90% by this method based on a
manufacturer's test data. However, testing is required to insure
satisfactory performance for specific board configurations.
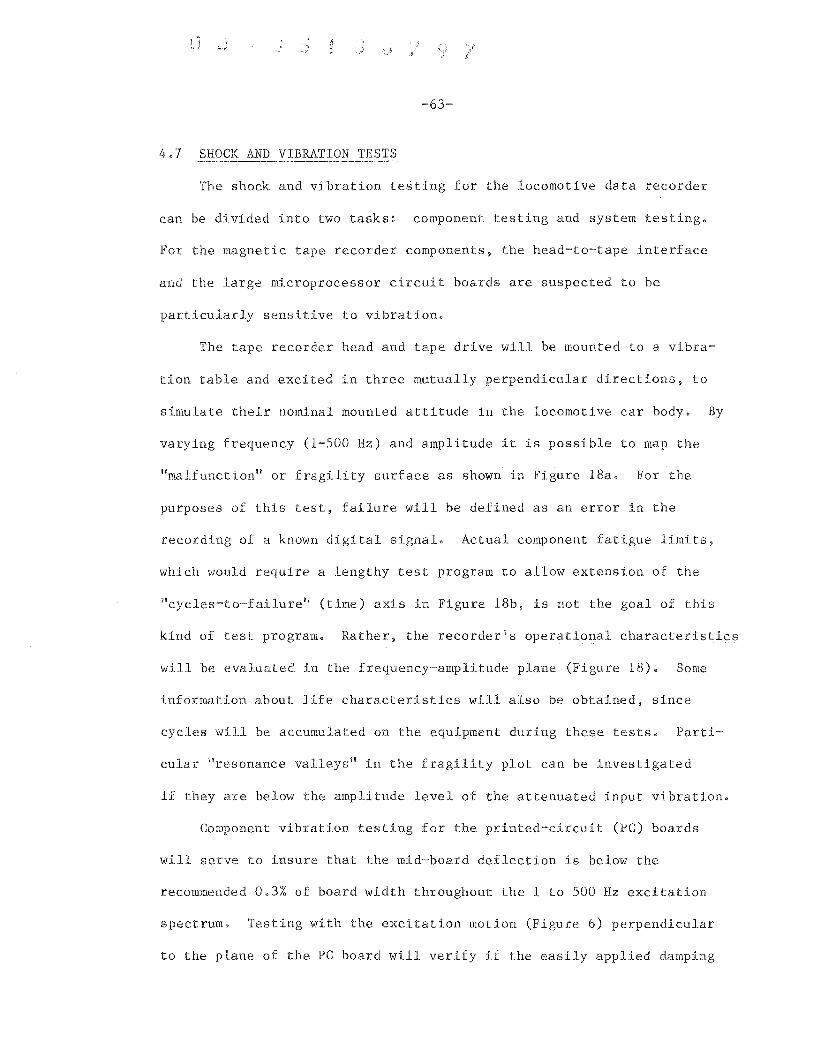
-63-
4.7 SHOCK AND VIBRATION TESTS
The shock and vibration testing for the locomotive data recorder
can be divided into two tasks: component testing and system testing.
For the magnetic tape recorder components, the head~to-tape interface
and the large microprocessor circuit boards are suspected to be
particularly sensitive to vibration.
The tape recorder head and tape drive will be mounted to a vibra-
tion table and excited in three mutually perpendicular directions, to
simulate their nominal mounted attitude in the locomotive car body. By
varying frequency (I~SOO Hz) and amplitude it is possible to map the
llmalfunctionll or fragility surface as shown in Figure 18a. For the
purposes of this test, failure will be defined as an error in the
recording of a known digital signal. Actual component fatigue limits,
which would require a lengthy test program to allow extension of the
!lcycles~to-failure" (time) axis in Figure 18b, is not the goal of this
kind of test program. Rather, the recorder's operational characteristics
will be evaluated in the frequency~amplitude plane (Figure 18). Some
information about life characteristics will also be obtained, since
cycles will be accumulated on the equipment during these tests. Parti-
cular "resonance valleys" in the fragility plot can be investigated
if they are below the amplitude level of the attenuated input vibration.
Component vibration testing for the printed-circuit (PC) boards
will serve to insure that the mid~board deflection is below the
recommended 0.3% of board width throughout the 1 to 500 Hz excitation
spectrum. Testing with the excitation motion (Figure 6) perpendicular
to the plane of the PC board will verify if the easily applied damping
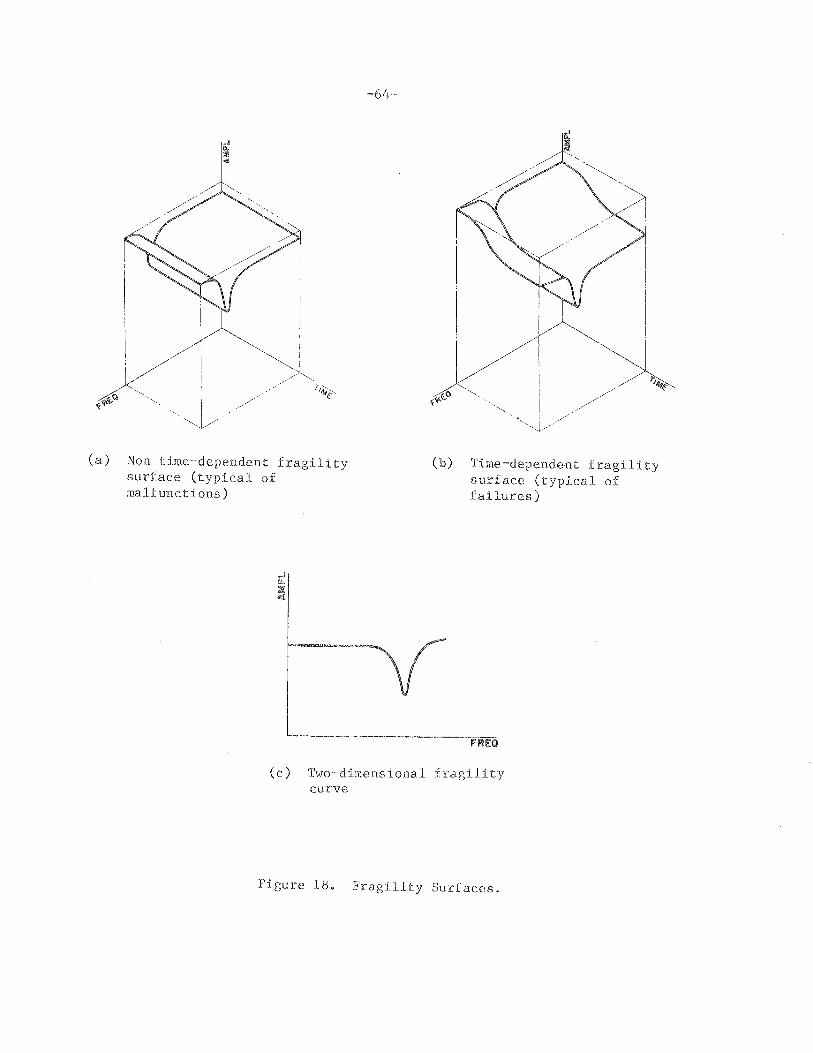
(a) Non time~dependent fragilitysurface (typical ofmalfunctions)
(b) Time-dependent fragilitysurface (typical offailures)
(c) Two~dimensional fragilitycurve
Figure l~. Fragility Surfaces.
-65-
layer will reduce resonance amplitude of the board sufficiently or if
the more involved stiffening method will be required. The displacement
data will be reduced from the output of a small accelerometer mounted
at the center of the board.
For evaluation of the locomotive data recorder system? the complete
recorder package mounted on vibration isolators inside the protective
outer case will be installed on a shaker table and excited to the
frequency and amplitude plot shown in Figure 6. The up-down frequency
sweep will be logarithmic over a period of about 18 minutes for a total
of 12 complete cycles in each of three mutually perpendicular directions.
The recorder will be operating during the test and will be continuously
monitored for faults. A tri-axial accelerometer will be mounted to a
rigid portion of the suspended mass to evaluate the tri-directional
transmissibility of the vibration isolation system. In addition to
the steady-state harmonic vibration testing? the isolator system of the
recorder system will be subjected to a resonance search per Mil-Std-810C
and a random vibration test per the specifications in Figure 19.* A
random vibration input? simulating the statistical geometric variation
in the railroad right-of-way? will be used to evaluate the effects
of exciting simultaneous resonances in the equipment. The shaker that
will be used for all the vibration tests will be electro-hydraulic
to obtain the low-frequency, high-amplitude response that is typically
not attainable with other types of shakers.
Shock-testing for the equipment will be per MI1-Std-~10C. The
*High and low frequency ends of the APSD may be respectively rampedup and down based on the requirements of a specific shaker system.
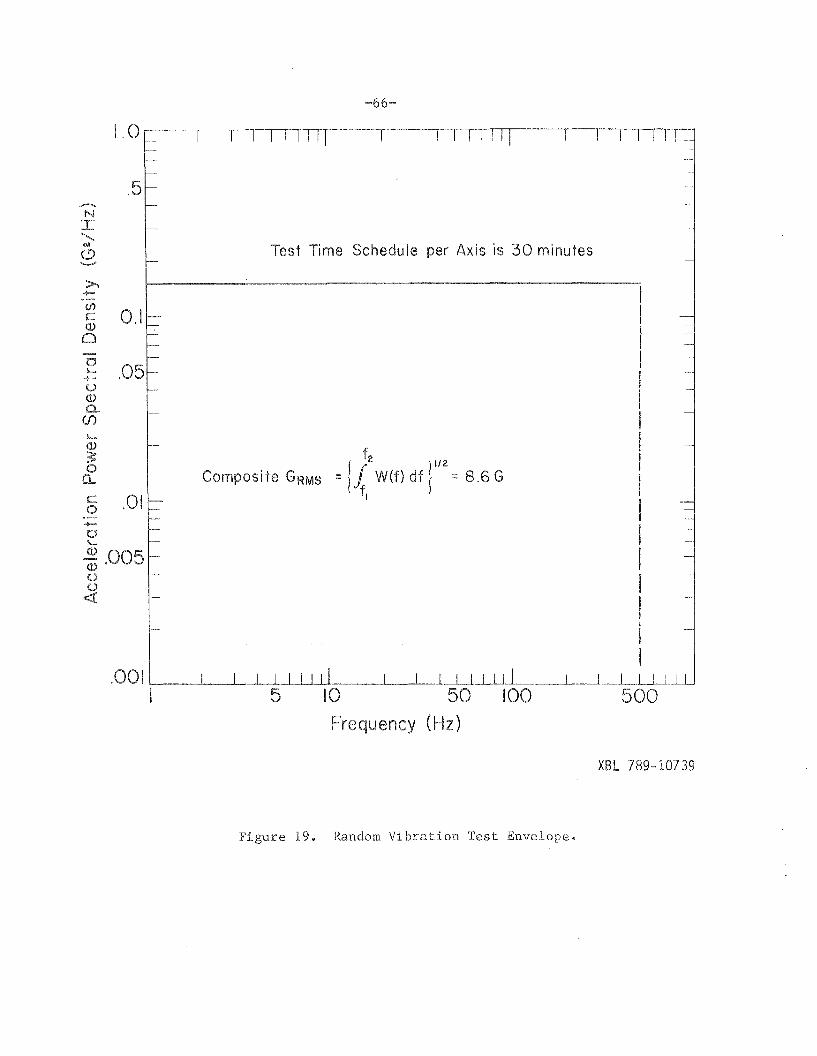
-66-
.5
lfj
~ 0.1oCJ~ .05o(])
a.U)
\-,
(])
3:on..§ .01
-ob
~ .005oo<!
Test Time Schedule per Axis is 30 minutes
fz I/Z
Composi te GRMS :: {.£ W(f) df I :: 8.6 Gfl
Frequency
Figure 19. Random Vibration Test Envelope.
500
XBL 789-10739

-67-
pulse shape and time interval are shown in Figure 7. During all
tests, the equipment will be operating during the tests and monitored
for errors in recording.

-69~
5. TRANSDUCERS
5.1 AVAILABILITY OF TRANSDUCERS
Table 2 lists the set of 16 measurands that are considered to
be part of the basic LDAP system. This list is repeated in Table 4,
together with some characteristics of the transducers expected to be
used. As shown in the last column of the table, the transducers for
most of the applications are stock items, i.e., readily available as a
standard commercial product. However, for the measurement of buff/draft
forces and fuel flow, it is not expected that commercial transducers
will be suitable in terms of the required accuracy of measurement.
Several railroad equipment manufacturers have built coupler load cells
for measuring buff/draft forces. However, they were custom-made for
specific applications such as impact tests.
Therefore, we plan to expend effort during Phase II on
designing and fabricating transducers that are suitable for measuring
these two quantities. Most of this section discusses in detail the
problems associated with this effort.
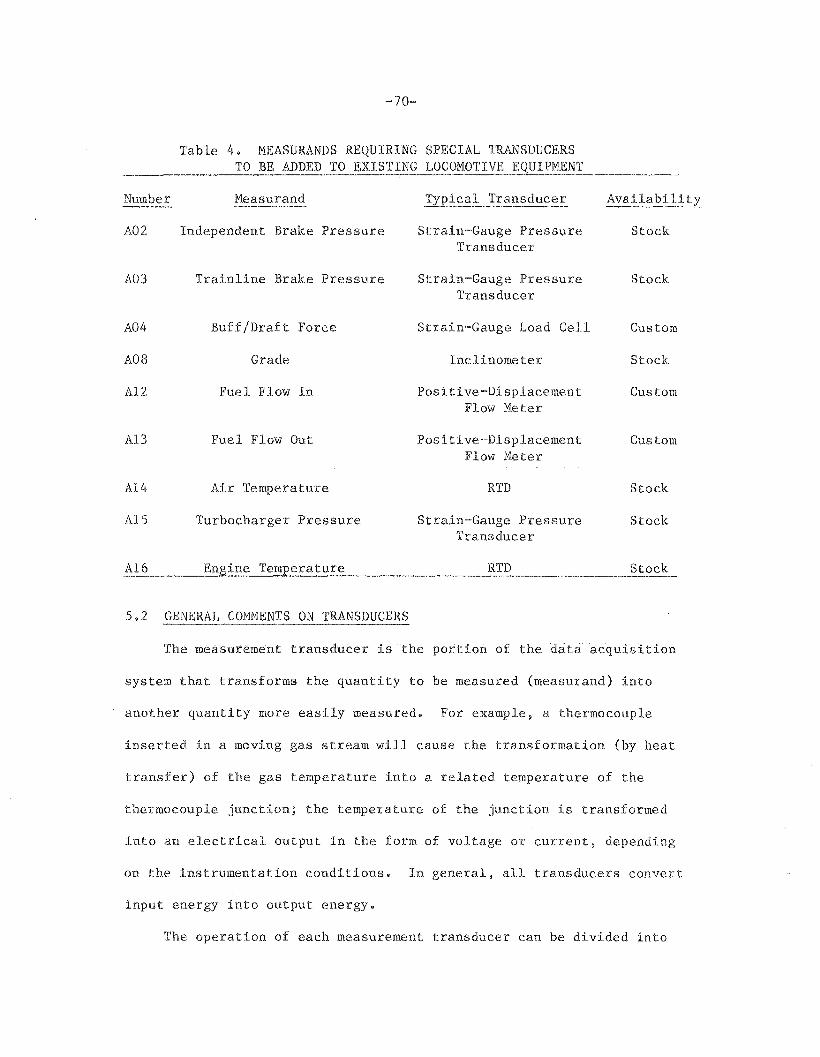
-70-
Table 4. MEASURANDS REQUIRING SPECIAL TRANSDUCERSTO BE ADDED TO EXISTING LOCOMOTIVE EQUIPMENT
Number Measurand ~ypical Transducer Availabili
A02 Independent Brake Pressure Strain-Gauge Pressure StockTransducer
A03 Trainline Brake Pressure Strain-Gauge Pressure StockTransducer
A04 Buff/Draft Force Strain-Gauge Load Cell Custom
A08 Grade Inclinometer Stock
A12 Fuel Flow In Positive-Displacement CustomFlow Meter
Al3 Fuel Flow Out Positive-Displacement CustomFlow Meter
A14 Air Temperature RTD Stock
A15 Turbocharger Pressure Strain~Gauge Pressure StockTransducer
A16 RTD Stock
5.2 GENERAL CO~IENTS ON TRANSDUCERS
The measurement transducer is the portion of the data acquisition
system that transforms the quantity to be measured (measurand) into
another quantity more easily measured. For example, a thermocouple
inserted in a moving gas stream will cause the transformation (by heat
transfer) of the gas temperature into a related temperature of the
thermocouple junction; the temperature of the junction is transformed
into an electrical output in the form of voltage or current, depending
on the instrumentation conditions. In general, all transducers convert
input energy into output energy.
The operation of each measurement transducer can be divided into

~71~
five sub-topics:
1. Measurand(s)
a. Primary (usually a single parameter)b. Extraneous (undesired inputs~ usually many)
2. Sensor
3. Transduction element (including any signal conditioning internalto the transducer)
4. Excitation
5. Output
With these topics defined, the single difference between the two basic
types of transducers, self~generating and non-self-generating~ can be
distinguished; excitation is required for non-self-generating transducers.
An example of a non-self-generating transducer would be a strain-gauge
pressure transducer with the following typical operational parameters:
1. Measurand(s)
a. Primary measurand - Pressureb. Extraneous measurands - Temperature, moisture,
mechanical vibration
2. Sensor - Metal diaphragm flexure
3. Transduction element ~Foil strain gauges
4. Excitation ~ Voltage/current
5. Output - Voltage/current
The previously mentioned thermocouple transducer is a self-generating
transducer since the transduction element/sensor (bimetallic junction)
does not require an excitation to produce an output voltage/current.
When evaluating the possible combinations of transducer parameters
i.e., the kinds of energy available for measurands~ excitations, and
outputs -- the numbers are large. Starting with just eight classes of
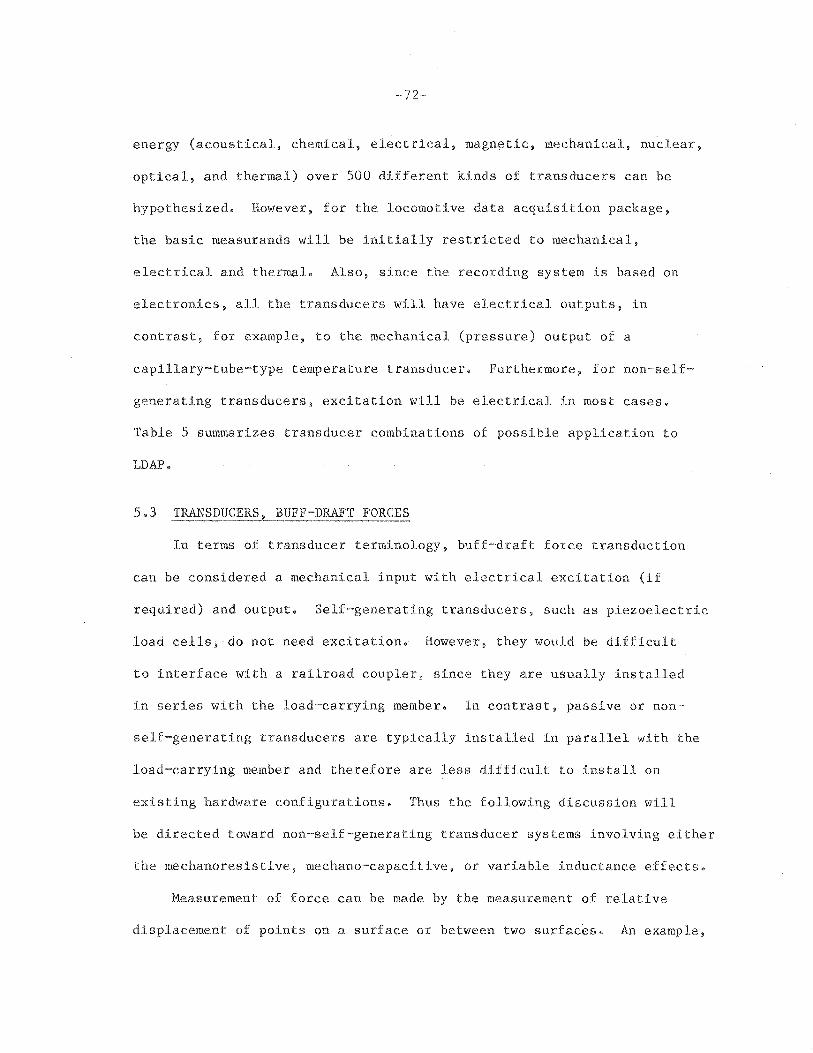
-72-
energy (acoustical, chemical, electrical, magnetic, mechanical, nuclear,
optical, and thermal) over 500 different kinds of transducers can be
hypothesized. However, for the locomotive data acquisition package,
the basic measurands will be initially restricted to mechanical,
electrical and thermal. Also, since the recording system is based on
electronics, all the transducers will have electrical outputs, in
contrast, for example, to the mechanical (pressure) output of a
capillary~tube-type temperature transducer. Furthermore, for non-self
generating transducers, excitation will be electrical in most cases.
Table 5 summarizes transducer combinations of possible application to
LDAP.
5.3 TRANSDUCERS, BUFF-DRAFT FORCES
In terms of transducer terminology, buff-draft force transduction
can be considered a mechanical input with electrical excitation (if
required) and output. Self-generating transducers, such as piezoelectric
load cells, do not need excitation. However, they would be difficult
to interface with a railroad coupler, since they are usually installed
in series with the load-carrying member. In contrast, passive or non
self~generating transducers are typically installed in parallel with the
load~carrying member and therefore are less difficult to install on
existing hardware configurations. Thus the following discussion will
be directed toward non-self-generating transducer systems involving either
the mechanoresistive, mechano-capacitive, or variable inductance effects.
Measurement of force can be made by the measurement of relative
displacement of points on a surface or between two surfaces. An example,
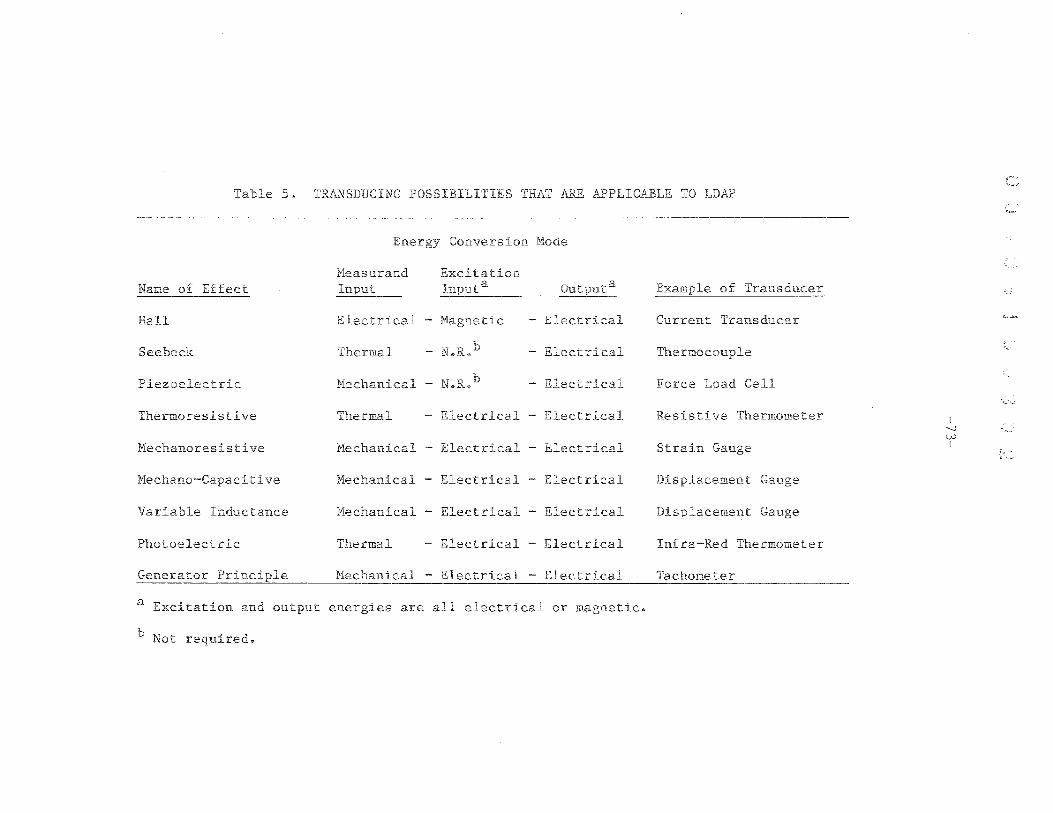
Table 5. TRANSDUCING POSSIBILITIES THAT ARE APPLICABLE TO LDAP
Energy Conversion Mode
Measurand Excitation
-Inputa Outputa
:ical - - Electrical
II - N.R. h - Electrical
dcal - N.R. h - Electrical
Hall Elect]
Mechanical - Electrical - Electrical
Thermoresistive
Mechanoresistive
Thermal - Electrical - Electrical Resistive Thermometer
Strain Gauge
I~
wI
Mechano-Capacitive Mechanical - Electrical - Electrical Gauge
Variable Inductance Mechanical - Electrical - Electrical Displacement Gauge
Photoelectric Thermal - Electrical - Electrical Infra-Red Thermometer
Generator Principle Mechanical - Electrical - Electrical Tachometer __
a Excitation and output energies are all electrical or magnetic.
h Not required.
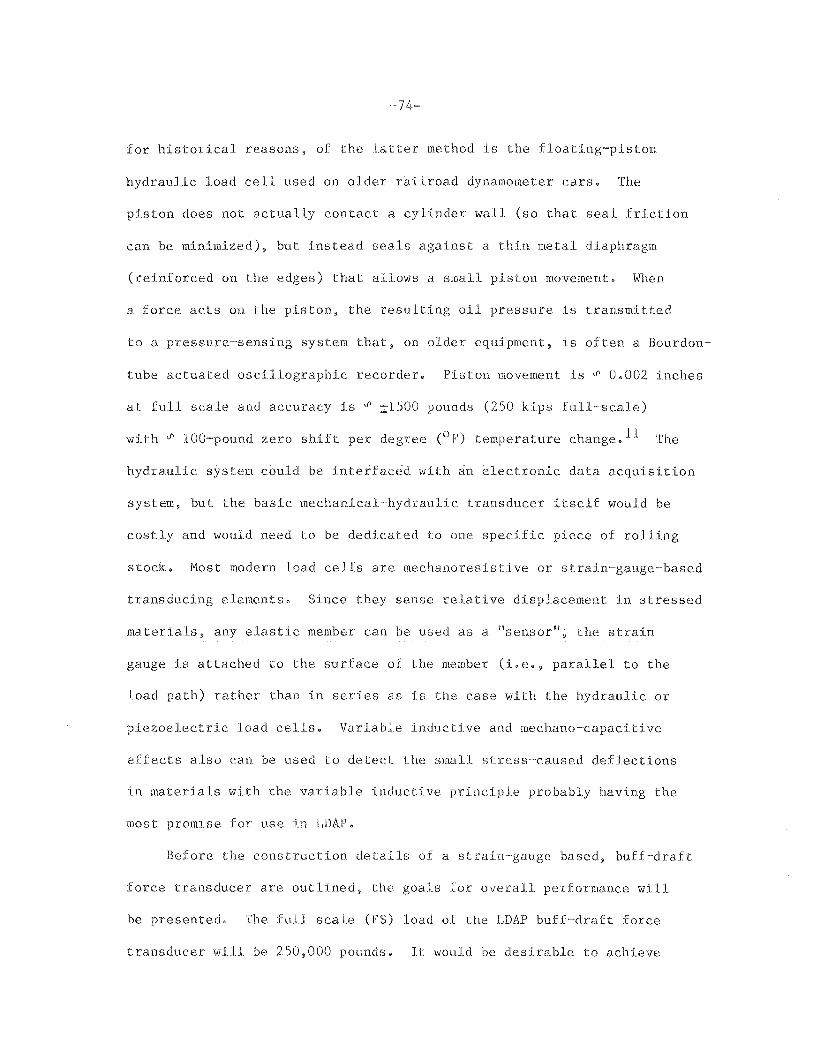
for historical reasons, of the latter method is the floating~piston
hydraulic load cell used on older railroad dynamometer cars. The
piston does not actually contact a cylinder wall (so that seal friction
can be minimized), but instead seals against a thin metal diaphragm
(reinforced on the edges) that allows a small piston movement. When
a force acts on the piston, the resulting oil pressure is transmitted
to a pressure~sensing system that, on older equipment, is often a Bourdon~
tube actuated oscillographic recorder. Piston movement is ~ 0.002 inches
at full scale and accuracy is ~ ±1500 pounds (250 kips full~scale)
with ~ 100-pound zero shift per degree (oF) temperature change. ll The
hydraulic system could be interfaced with an electronic data acquisition
system, but the basic mechanical~hydraulic transducer itself would be
costly and would need to be dedicated to one specific piece of rolling
stock. Most modern load cells are mechanoresistive or strain-gauge-based
transducing elements. Since they sense relative displacement in stressed
materials, any elastic member can be used as a "sensor"; the strain
gauge is attached to the surface of the member (i.e., parallel to the
load path) rather than in series as is the case with the hydraulic or
piezoelectric load cells. Variable inductive and mechano~capacitive
effects also can be used to detect the small stress~caused deflections
in materials with the variable inductive principle probably having the
most promise for use in LDAP.
Before the construction details of a strain-gauge based. buff-draft
force transducer are outlined, the goals for overall performance will
be presented. The full scale (FS) load of the LDAP buff-draft force
transducer will be 250,000 pounds. It would be desirable to achieve
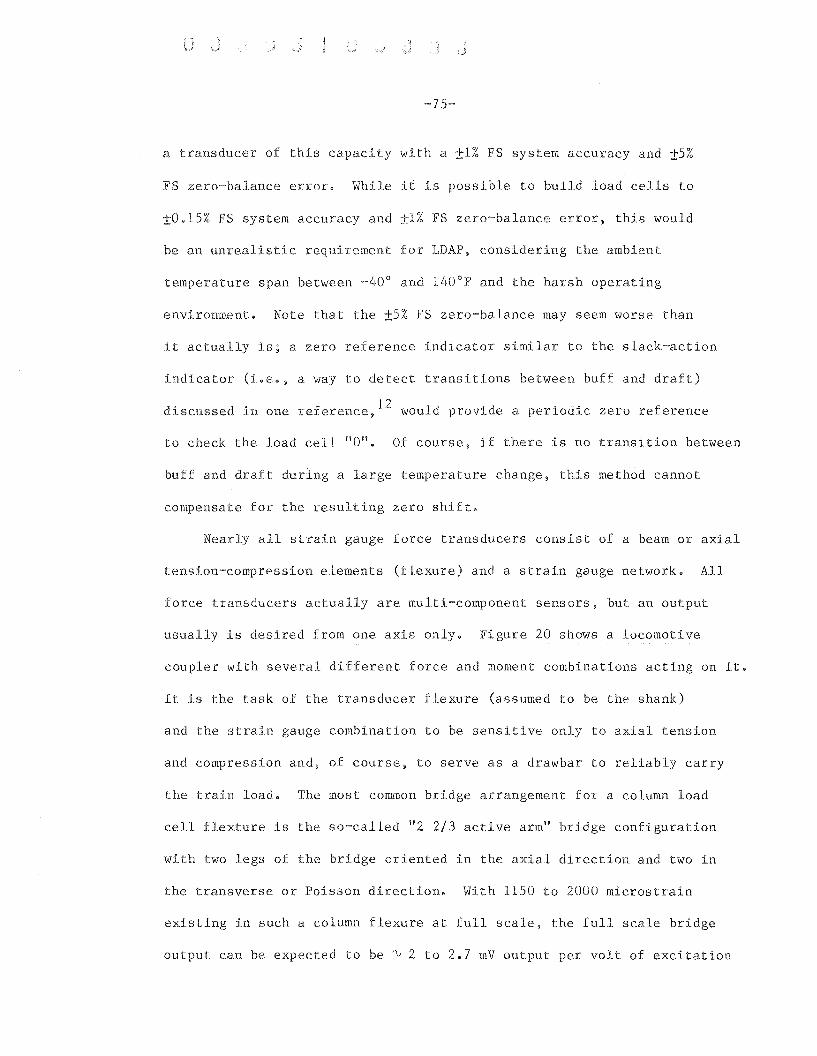
a transducer of this capacity with a ±1% FS system accuracy and ±5%
FS zero-balance error. While it is possible to build load cells to
±0.15% FS system accuracy and ±1% FS zero-balance error, this would
be an unrealistic requirement for LDAP, considering the ambient
temperature span between ~40° and 140°F and the harsh operating
environment. Note that the ±5% FS zero~balance may seem worse than
it actually is; a zero reference indicator similar to the slack-action
indicator (i.e •• a way to detect transitions between buff and draft)
discussed in one reference. 12 would provide a periodic zero reference
to check the load cell 1l0". Of course, if there is no transition between
buff and draft during a large temperature change. this method cannot
compensate for the resulting zero shift.
Nearly all strain gauge force transducers consist of a beam or axial
tension-compression elements (flexure) and a strain gauge network. All
force transducers actually are multi-component sensors, but an output
usually is desired from one axis only. Figure 20 shows a locomotive
coupler with several different force and moment combinations acting on it.
It is the task of the transducer flexure (assumed to be the shank)
and the strain gauge combination to be sensitive only to axial tension
and compression and, of course, to serve as a drawbar to reliably carry
the train load. The most common bridge arrangement for a column load
cell flexture is the so-called "2 2/3 active arm ll bridge configuration
with two legs of the bridge oriented in the axial direction and two in
the transverse or Poisson direction. With 1150 to 2000 microstrain
existing in such a column flexure at full scale, the full scale bridge
output can be expected to be ~ 2 to 2.7 mV output per volt of excitation
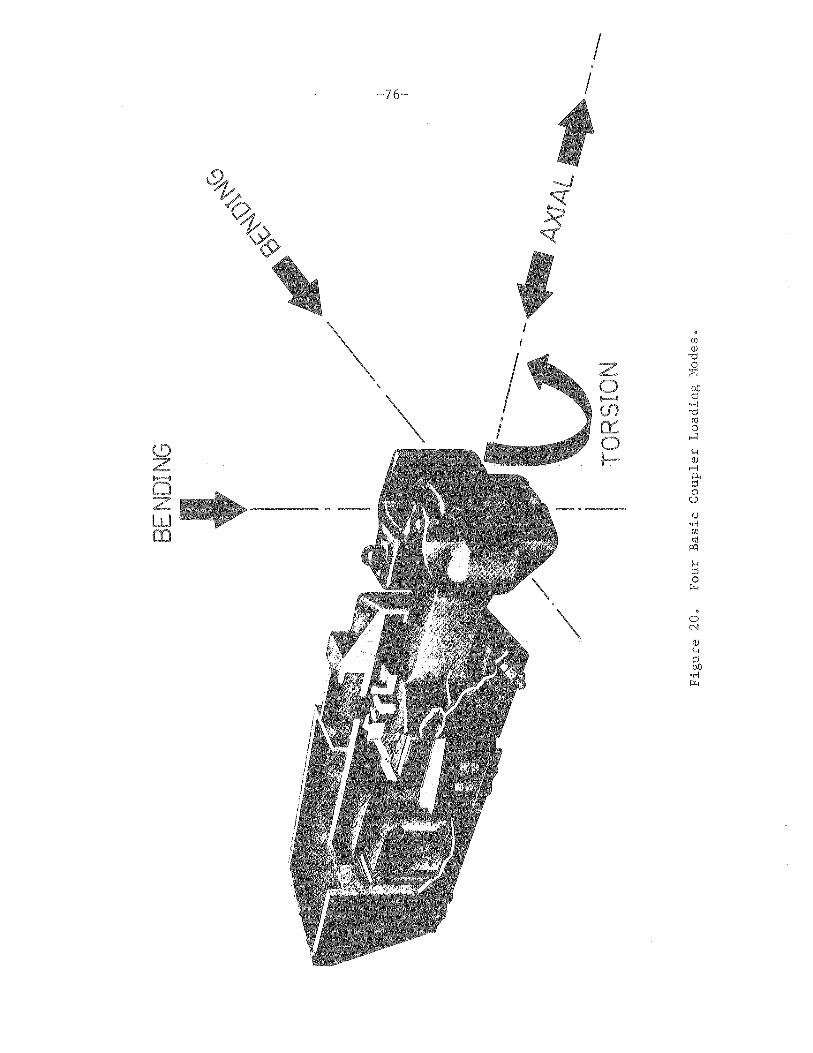
//
II (fJ
Q)
'U,£,Li
Ol)
1--4 P(f) 'F!
'U
cr: (1j0
,..:i
'"'Q)
.-40..;:l0u()
'F!(fJ
(1jP:::l
'"';:l0
i=r-<
.0N
Q)
'"';:lOl)
'F!i=r-<

(for gauge factors of 200). This configuration of strain gauges can be
connected in the bridge to: 1) minimize the sensitivity of the system
to and torsion inputs and, 2) assuming that the flexure is
uniform in , make the output nominally independent of
displacements@ It is pOSSible, by using beam
elements in a thrust~sensitive load cell flexure, to obtain a "4 active
and to therefore obtain up to 4 mV output per volt of
excitation at 2000 microstrain; however, this kind of specially designed
flexure probab
a
would not be well suited to the load carrying task of
With 2000 microstrain established as the upper-limit full scale
strain for the load cell flexure and for % FS system accuracy (not
inc electronics) requirements, a strain value in the 10 microstrain
range is significant in defining the performance of the load cell.
Therefore, material responses leading to spurious strains on the order
of 10 microstrain must be addressed in the load cell design. Material
related effects such as micro~yielding, anelastic (recoverable) deforma
tions, dimensional instabili , creep, and environmental responses all
can provide undesired strains in the 10 micros train range. To minimize
the above
as well as
exist
an
careful control of the flexure metallurgy is required,
upper stress limit of ~ 30% of yield. 12 By using the
shank as a column-type transducer flexure, the full-
scale strain at the 250,000-pound design load would be ~ 420
microstrain (based on a 20 in. 2 shank area). This calculated value
is in good agreement with the data (shown on Figure 21) from a report
by Anderson and Cramer 13 on the stiffness of coupler shanks conforming
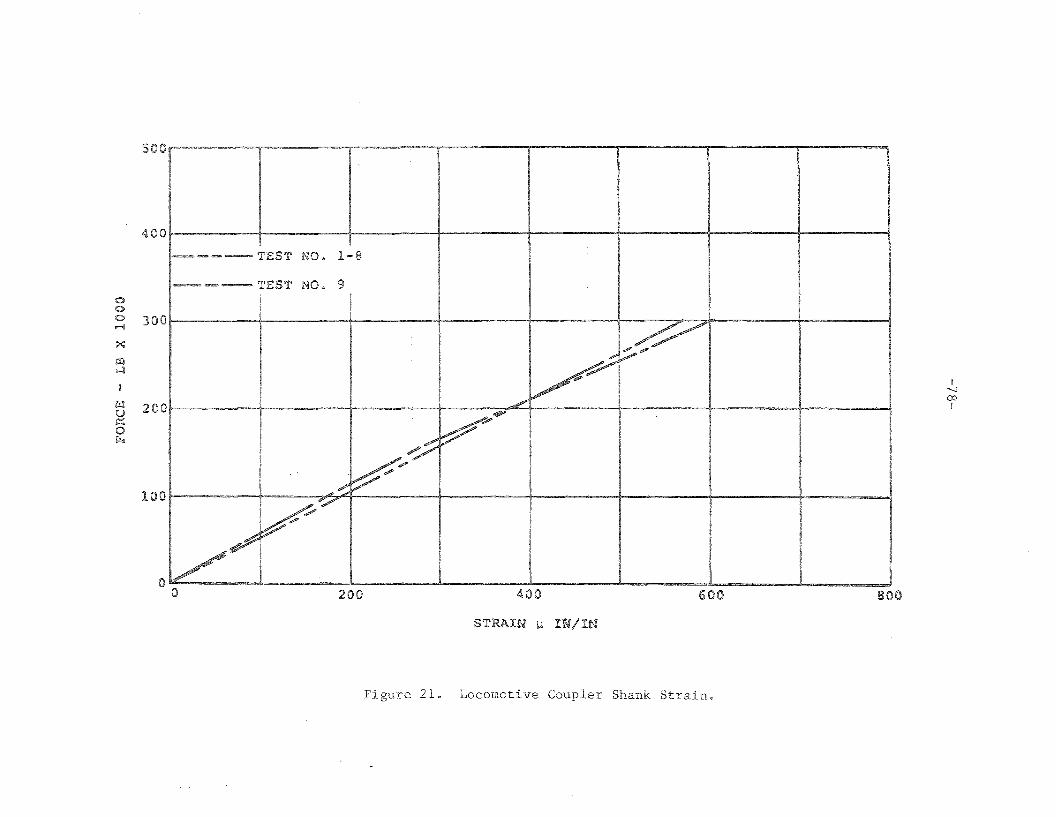
i'-Icoi
800600400200
---- TEST NO. 1-8
---TEST NO.9
V~
~
V~~ -
,;:::;
'"V~
I/~V'l
400
oo
500
100
l:<l 200uIXoI:&.
ooo 300~
xIn...lI
STRAIN Ii
Figure 21. Locomotive Coupler Shank Strain.
-79-
to specifications of American Association of Railroads (AAR). This low,
full~scale strain level in the coupler shank indicates the coupler
is a conservative design from the standpoint of pulling trains but has
only 25% of the full~scale strain level output desirable for a well
designed transducer flexure. It could be possible to design ultra-stable
signal processing electronics to deal with the 0.6 mV/V FS signal from
such a "stiff" flexure, but spurious strains (introduced from the micro
mechanical aspects of the flexure material) of 1 micros train magnitude
would be significant for maintaining ±1% FS overall accuracy. The
locomotive drawbar material is not classified as an ultraprecision,
transducer~flexurematerial. so that a transducer made directly by using
the coupler shank as a flexure would probably tend to be a ±5% FS device.
Another approach to improve bridge output and still allow direct
use of the coupler casting as a flexure would be to locate: 1) sym~
metrical regions on the coupler body that are more highly stressed
than those of the shank and/or 2) elements of the casting undergoing
bending (allows a 4 active arm bridge without constructing a ring or
other type of special flexure). Brittle lacquer or photoelastic coatings
would be useful in mapping the strain field on a coupler loaded in
several modes (tension, compression, bending, and torsion) so that
relatively highly strained regions, that would still allow loading:mode
separation by proper placement of strain gauges, could be located.
Areas of high stress gradients around sharp corners would not be
desirable gauge locations because of difficulty of installing
transducer~sized strain gauges on sharp discontinuities and the
micro-yielding of the material that could occur at such a stress
-80-
concentrations. Artificial addition of stress concentrations in the
coupler shank by drilling holes, for example, could be used to boost
the full~scale transducer output in the ~ 1 mV/V range. However,
analysis would be required to insure protection against drawbar ultimate
failure or yield. High output semiconductor strain gauges could also
be used, but they introduce a whole new set of temperature-related
problems.
Probably the best approach to obtain a reasonable transducer
output would be to build a special drawbar flexure that would be
strained high enough to give 2 to 3 mV/V FS output with conventional
resistance strain gauges, but not fail in the task of pulling the
train or when experiencing hard couplings. Two thousand micros train
in steel translates to ~ 60,000 lb/in. 2 stress and, in aluminum,
~ 20,000 Ib/in. 2 With the maximum~stress requirement of 30% yield at
full scale, a steel having a 200,000 Ib/in. 2 yield stress would be
required, which is slightly over the upper limit obtainable with 4340
alloy steel or 17~4 PH stainless steel tempered in the SOO°F range
(to avoid "brittleness"). For similar stress requirements in aluminum,
certain heat treatments of 2024 alloy steel will nominally meet the
specification.
Since 2,000 microstrain specification tends to crowd the upper
limits of material performance (particularly in a large cross section),
a 1,500 microstrain full~scale strain limit will give a more conservative
design for any of the three materials mentioned above and still provide
~ 2 mV/V output at full scale for a "2 2/3 active arm bridge." If
steel is used for the 250,000-pound flexure, ~ 5.6 in. 2 would be needed

for the column and if aluminum is used, ~ 16.8 in. Z is required. Of
course, more sophisticated flexures can be used to increase the bridge
output into the 3 mV/V range, but the need for the flexure to also
reliably pull a train and to easily mount to a locomotive pilot
structure makes the simple column flexure more attractive.
It is clear that design of a high output, structurally integral
load~cell ~ransducer flexure is not a trivial problem. However, even
after the flexure design is optimized from the standpont of elasticity,
a number of other problems relating to the strain gauges themselves
and non~mechanically caused strains (particularly temperature) must
be considered.
After all of the known best practices of strain gauge selection,
installation, wiring, and environmental~proofinghave been carefully
adhered to, two principal temperature~change effects on the strain-gauge
bridge circuit remain to be dealt with: shift of bridge zero~balance
point and change in span (voltage per pound). Zero shift is caused by
unsymmetrical, thermally produced resistance changes within the bridge
circuit. Even after careful symmetrical wiring and gauge placement,
zero shift with temperature will occur because no two strain gauges
exhibit exactly the same temperature~induced apparent strain charac~
teristics. To compensate for this shift, an opposing temperature~
dependent resistance imbalance can be placed in the bridge circuit.
Span changes with temperature because of two distinct effects. First,
the elastic modulus of the spring element decreases as the temperature
increases (causing a greater bridge output for a given load), and
second, the gauge factor changes with temperature. If it is assumed
that output increases with temperature, a resistor with a positive
thermal coefficient can be introduced into a bridge power supply;
therefore, as the temperature rises, the compensating resistor reduces
the voltage input to the bridge and the span change is minimized.
Additional compensating resistors can be added to establish an initial
zero balance (for a given temperature) and an initial span. Figure 22
pictorially summarizes a possible configuration for a "2 2/3 active
arm" strain~gauge-based buff~draft force transducer.
Initial calibration of the transducer should be done on a dead
weight calibrator (NBS traceable) and field calibration checks can be
accomplished with a commercial, precision~class, load cell. Dead weight
calibration capability and load cells are available in the 250,000
pound range from BLH Electronics in Waltham, Massachusetts. The fre
quency and amplitude response of the transducing system (including load
cell, draft gear, and electronics) can be evaluated on a tensile testing
machine that has programmable amplitude, wave shape, and frequency
capability. Dynamic testing (step function response) is also useful
for verifying the overall time constant, natural frequency, ringing
period, damping ratio, rise time, response time, and overshoot of the
transducing system. Further testing could be performed to verify the
ability of the flexure and strain gauges to cancel bending and
torsional inputs.
5.4 INSTRUMENT TRANSDUCERS FOR LDAP FUEL FLOW
The measurement of locomotive fuel consumption with reasonable
(e.g., ±1%) accuracy has some special requirements not shared by other
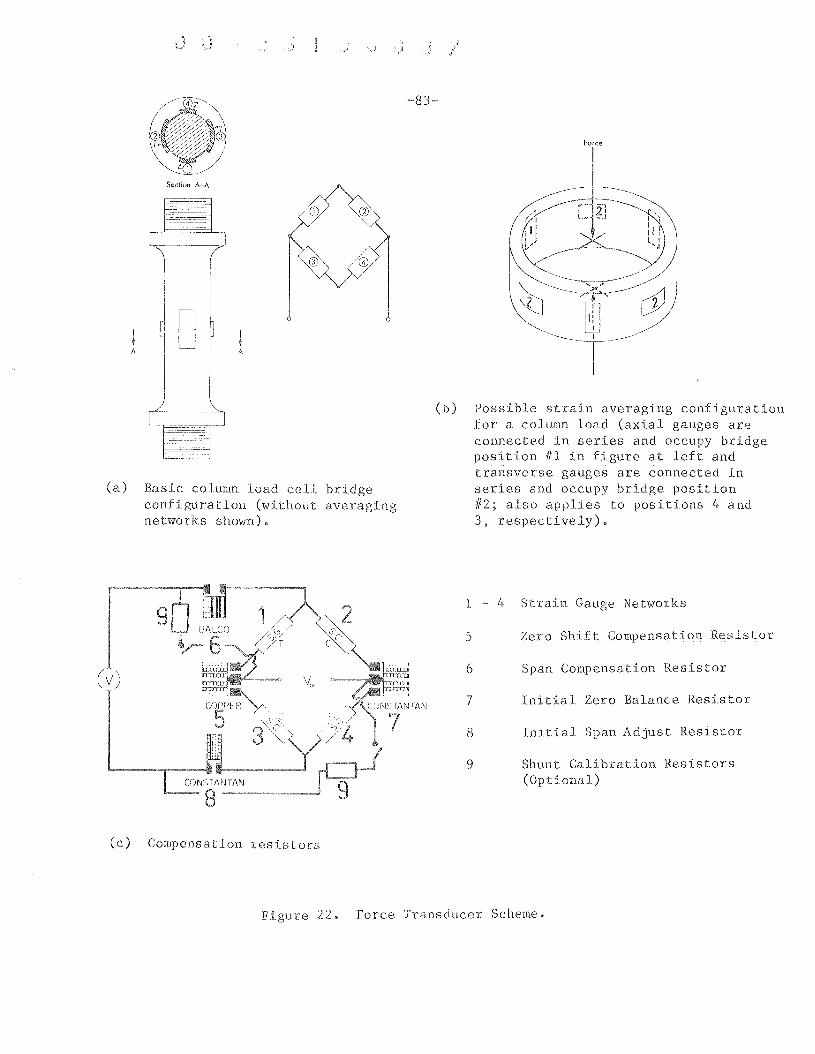
Force
Section A-A
CD
CD 0//
D bI IV VA A.
(a) Basic column load cell bridgeconfiguration (without averagingnetworks shown).
(b) Possible strain averaging configurationfor a column load (axial gauges areconnected in series and occupy bridgeposition #1 in figure at left andtransverse gauges are connected inseries and occupy bridge position#2; also applies to positions 4 and3, respectively).
7 Initial Zero Balance Resistor
8 Initial Span Adjust Resistor
1 ~ 4 Strain Gauge Networks
Span Compensation Resistor6
9 Shunt Calibration Resistors(Optional)
5 Zero Shift Compensation Res tor
(v
(c) Compensation resistors
Figure 22. Force Transducer Scheme.
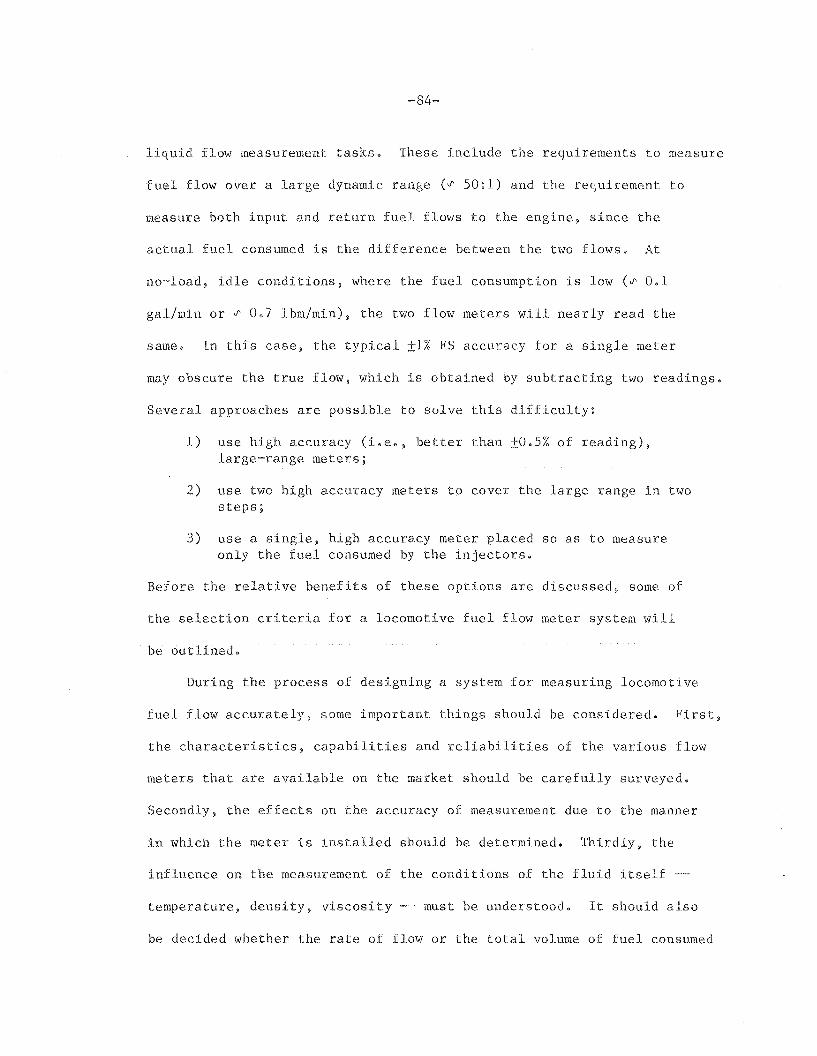
liquid flow measurement tasks. These include the requirements to measure
fuel flow over a large dynamic range (~ 50:1) and the requirement to
measure both input and return fuel flows to the engine, since the
actual fuel consumed is the difference between the two flows. At
no~load, idle conditions, where the fuel consumption is low (~ 0.1
gal/min or ~ 0.7 Ibm/min), the two flow meters will nearly read the
same. In this case, the typical ±1% FS accuracy for a single meter
may obscure the true flow, which is obtained by subtracting two readings.
Several approaches are possible to solve this difficulty:
1) use high accuracy (i.e., better than ±O.5% of reading),large~range meters;
2) use two high accuracy meters to cover the large range in twosteps;
3) use a single, high accuracy meter placed so as to measureonly the fuel consumed by the injectors.
Before the relative benefits of these options are discussed, some of
the selection criteria for a locomotive fuel flow meter system will
be outlined.
During the process of designing a system for measuring locomotive
fuel flow accurately, some important things should be considered. First,
the characteristics, capabilities and reliabilities of the various flow
meters that are available on the market should be carefully surveyed.
Secondly, the effects on the accuracy of measurement due to the manner
in which the meter is installed should be determined. Thirdly, the
influence on the measurement of the conditions of the fluid itself --
temperature, density, viscosity ~- must be understood. It should also
be decided whether the rate of flow or the total volume of fuel consumed
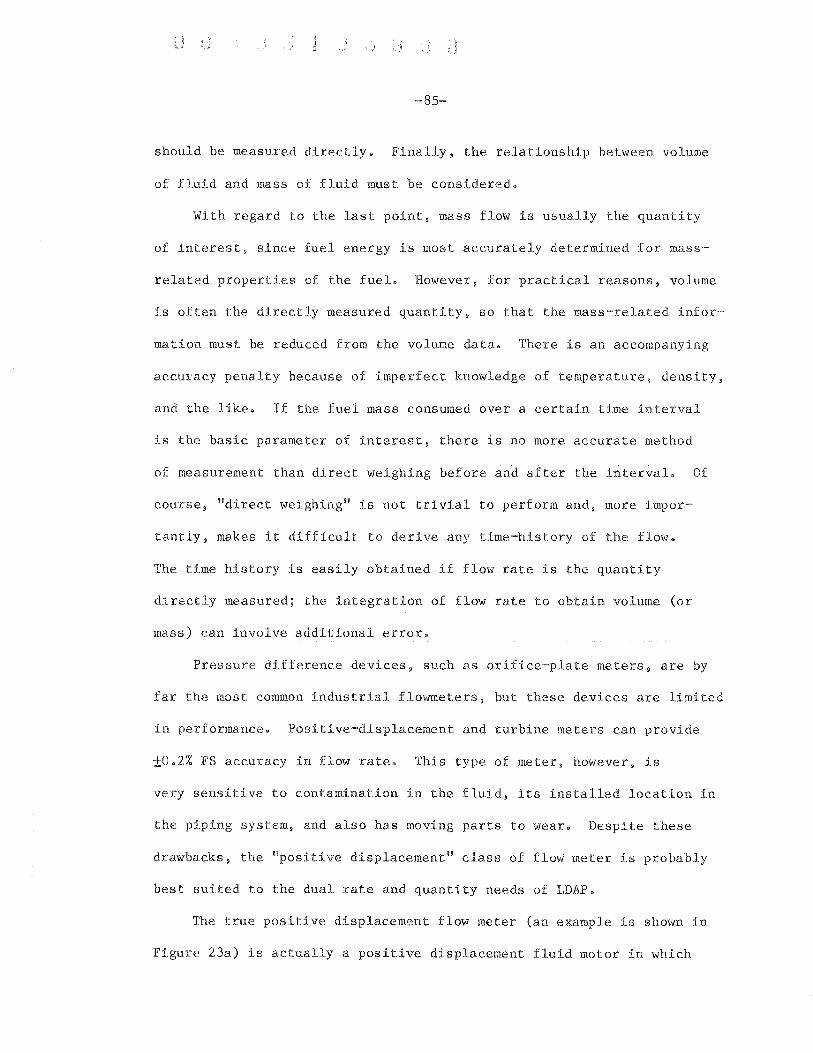
-85-
should be measured directly. Finally, the relationship between volume
of fluid and mass of fluid must be considered.
With regard to the last point, mass flow is usually the quantity
of interest, since fuel energy is most accurately determined for mass
related properties of the fuel. However, for practical reasons, volume
is often the directly measured quantity, so that the mass-related infor
mation must be reduced from the volume data. There is an accompanying
accuracy penalty because of imperfect knowledge of temperature, density,
and the like. If the fuel mass consumed over a certain time interval
is the basic parameter of interest, there is no more accurate method
of measurement than direct weighing before and after the interval. Of
course, "direct weighing lV is not trivial to perform and, more impor
tantly, makes it difficult to derive any time-history of the flow.
The time history is easily obtained if flow rate is the quantity
directly measured; the integration of flow rate to obtain volume (or
mass) can involve additional error.
Pressure difference devices, such as orifice-plate meters, are by
far the most common industrial flowmeters, but these devices are limited
in performance. Positive-displacement and turbine meters can provide
±O.2% FS accuracy in flow rate. This type of meter, however, is
very sensitive to contamination in the fluid, its installed location in
the piping system, and also has moving parts to wear. Despite these
drawbacks, the IVpositive displacement lV class of flow meter is probably
best suited to the dual rate and quantity needs of LDAP.
The true positive displacement flow meter (an example is shown in
Figure 23a) is actually a positive displacement fluid motor in which
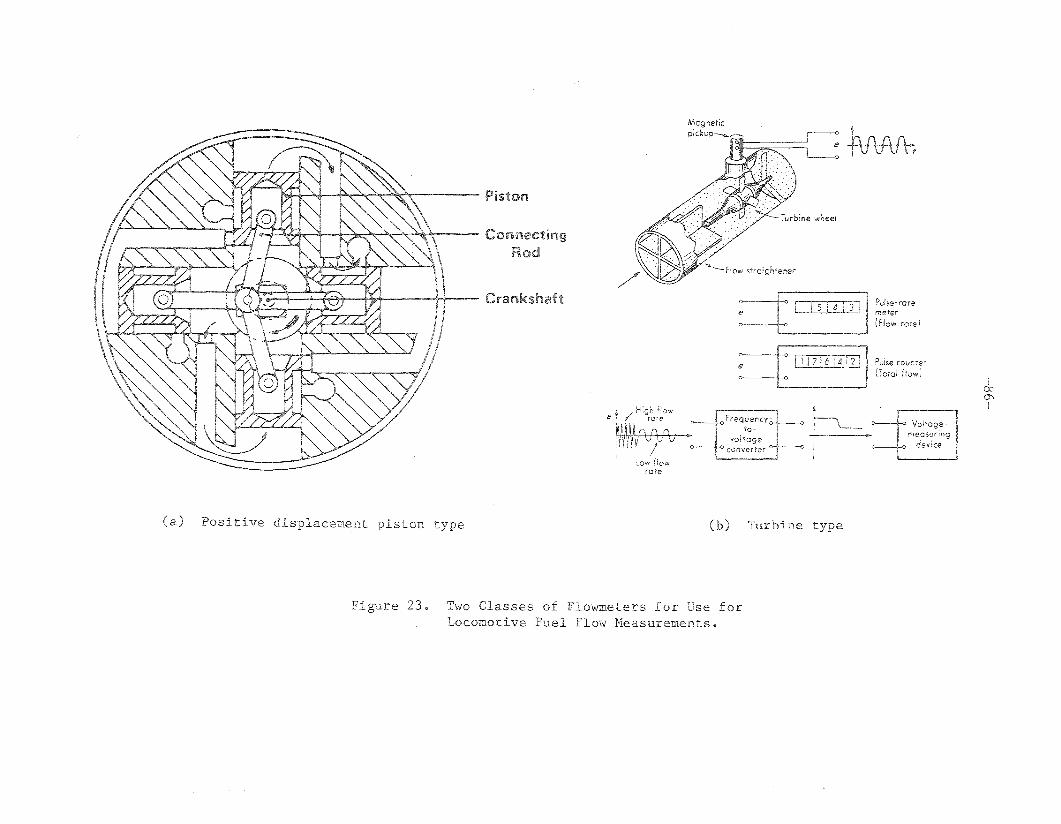
I(X)C1'I
Pulse-rotemeter(Flow role)
Pube coun1erno!oi liow)
Lowrate
e
(a) Positive displacement piston type ( Turbine type
Figure 23. Two Classes of Flowmeters for Use forLocomotive Fuel Flow Measurements.
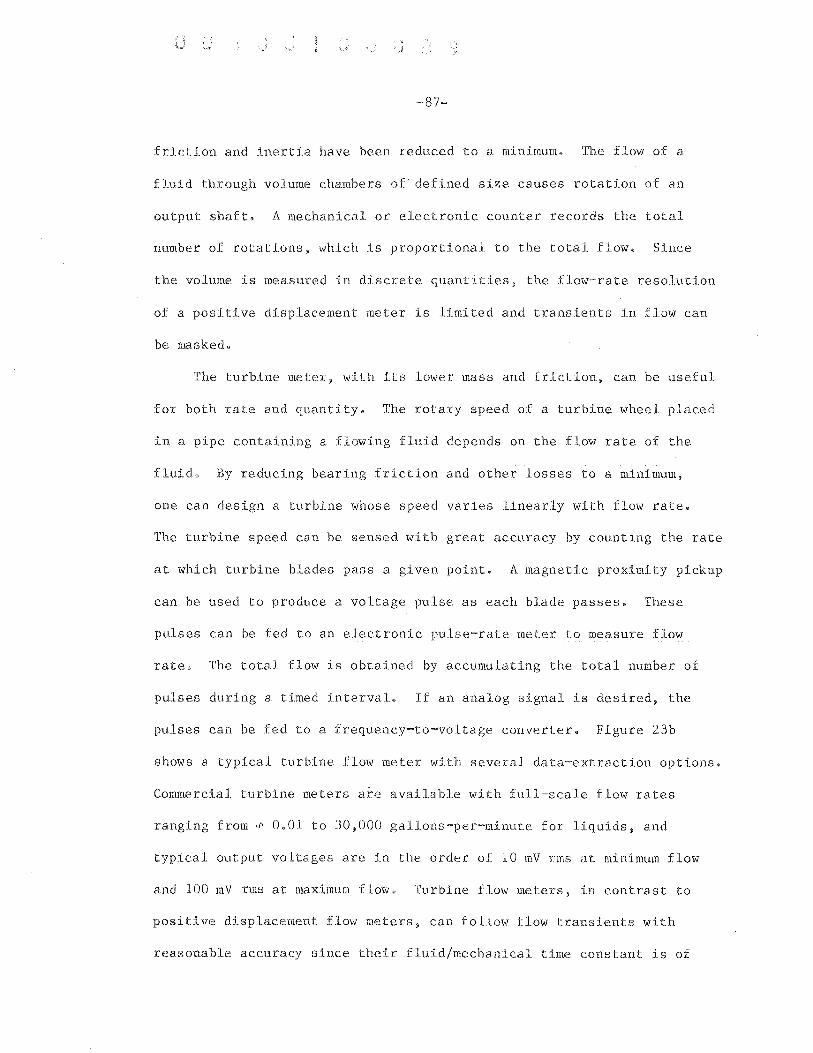
-87-
friction and inertia have been reduced to a minimum. The flow of a
fluid through volume chambers of defined size causes rotation of an
output shaft. A mechanical or electronic counter records the total
number of rotations, which is proportional to the total flow. Since
the volume is measured in discrete quantities, the flow-rate resolution
of a positive displacement meter is limited and transients in flow can
be masked.
The turbine meter, with its lower mass and friction, can be useful
for both rate and quantity. The rotary speed of a turbine wheel placed
in a pipe containing a flowing fluid depends on the flow rate of the
fluid. By reducing bearing friction and other losses to a minimum,
one can design a turbine whose speed varies linearly with flow rate.
The turbine speed can be sensed with great accuracy by counting the rate
at which turbine blades pass a given point. A magnetic proximity pickup
can be used to produce a voltage pulse as each blade passes. These
pulses can be fed to an electronic pulse~rate meter to measure flow
rate. The total flow is obtained by accumulating the total number of
pulses during a timed interval. If an analog signal is desired, the
pulses can be fed to a frequency-to-voltage converter. Figure 23b
shows a typical turbine flow meter with several data-extraction options.
Commercial turbine meters are available with full~scale flow rates
ranging from ~ 0.01 to 30,000 gallons~per-minute for liquids, and
typical output voltages are in the order of 10 mV rms at minimum flow
and 100 mV rms at maximum flow. Turbine flow meters, in contrast to
positive displacement flow meters, can follow flow transients with
reasonable accuracy since their fluid/mechanical time constant is of
the order of ~ 2 to 10 msec. 14
As previously mentioned. in the many possible applications of LDAP
involving fuel-flow measurement, the mass flow rate is actually more
significant than volume flow rate. Two general approaches are used to
measure mass flow rate. One involves the use of a volume flow meter.
some means of density measurement, and a computer to compute the mass
flow rate. The other, more basic approach, is to use a flow meter
design philosophy that is inherently sensitive to mass flow rate.
Figure 24a shows a schematic of a "computed-mass-flow" measurement
system (for orifice~plate and turbine meter types). Figure 24b is
an example of a direct mass~flow rate meter using the "moment-of
momentum law" of turbomachines. Both computed and direct mass flow
systems are applicable to LDAP ~- system reliability being a basic
consideration for the selection of one over the other.
As mentioned above, the problem of the large dynamic range of
flows needs to be addressed. Of the three options discussed earlier,
the first approach (a single high~accuracy meter) seems the most
reasonable. Typical flow rates for SW-1500 and SD-45 locomotives have
been quoted as: minimum flow (idle) -- ~ 0.07 gal/min (0.5 Ibm/min);
maximum flow (run-B) -- ~ 3.3 gal/min. (24 Ibm/min). 15 During a typical
daily operation schedule for an EMD SD-40 locomotive, about 50% of the
time is spent idling, 15% in run-B, and the remaining 35% of the time
evenly divided among the other throttle settings. 1S Because of the large
amount of time spent in idle at low fuel flows, significant errors in
total fuel quantity are possible if the flow meter is selected only
for its performance at higher flows. Positive displacement flow meters
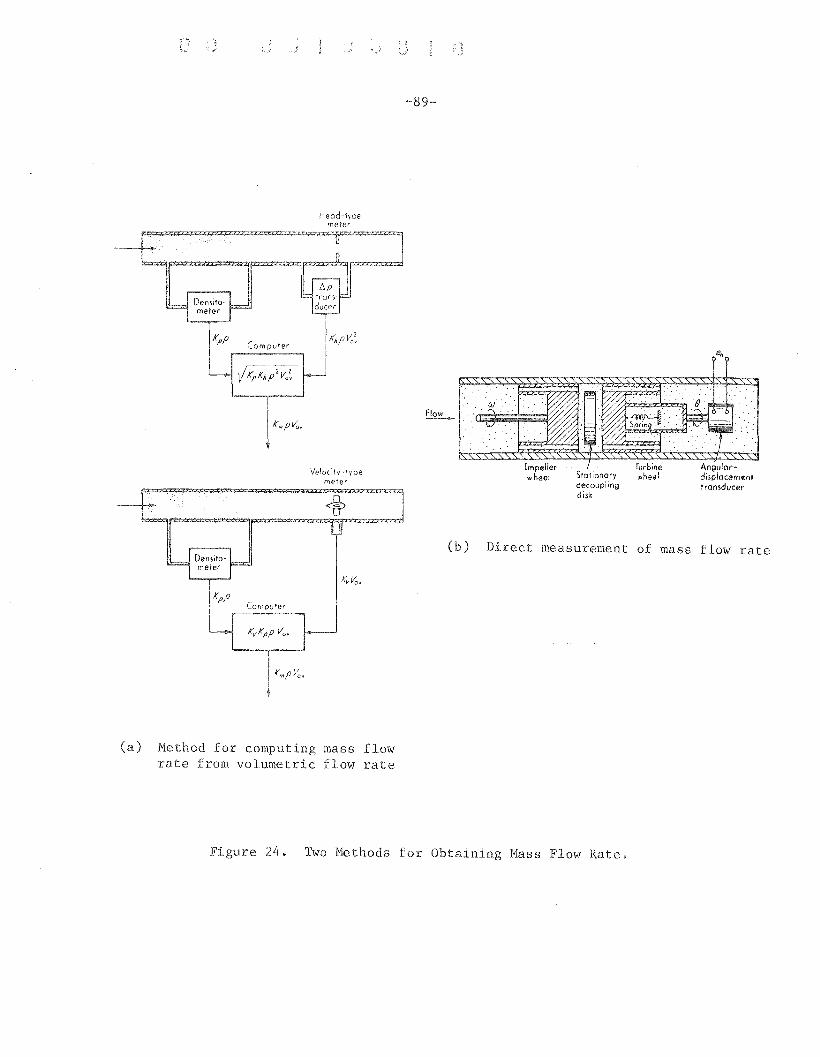
Head-typemeter
TurbineStationary ",heeldecouplingdisk
Impellerwheel
(b) Direct measurement of mass flow rate
Ve!o(itY~'ype
meter
(a) Method for computing mass flowrate from volumetric flow rate
Figure 24@ Two Methods for Obtaining Mass Flow Rate.
~90~
have the best capability of covering the 50:1 range while still main
taining accuracy in total flow indication. Typical positive-displacement
flow meters that are designed specifically for hydrocarbon fuel-flow
measurements can, in fact, cover a flow range of 500:1 (for 5 centipoise
viscosity diesel fuel) with to.5% overall accuracy. Of course, to
obtain this accuracy, the installation has to be carefully done to
address the problems of air entrapment in the fuel, the large temperature
change (~ 20°-40°F) between incoming and outgoing fuel (typical of
locomotives using unit~type fuel injectors that bypass a large quantity
of fuel ~- ~ 98% at idle, for example), and the influence the flow
measurement device has on the fuel system. A positive displacement
flow measuring system should have a bypass so that if the pressure drop
across the flow is excessive (as would be the case for a seized piston),
fuel flow to the engine will not be interrupted. To make the trans
lation between volume and mass flows, a temperature sensing probe can be
installed at the inlet of the flow meter to allow mass-flow compensation
for the flow transducer.
Calibration will be necessary for any flow sensing system used
on LDAP. Flow~rate calibration depends on standards of volume (length)
and time, or mass and time. Primary calibration is, in general, based
on the establishment of steady flow through the flow meter and subse
quent measurement of the volume or mass of fluid that passes through
in an accurately timed interval. If steady flow exists, the volume or
mass flow rate may be inferred from such a procedure. Of course, sig
nificant deviations of the conditions of use from those at calibration
will invalidate the calibration. Possible sources of error in an
~91~
installed flow meter's calibration include variations in fluid properties
(density~ viscosity, and temperature), orientation of the meter, pressure
level, and, in particular, flow disturbances (such as elbows, tees,
valves) upstream and downstream of the meter.
There are two basic types of primary liquid flow calibrators in
present use:
I. Mass~time type
A. Static~weigh methodB. Dynamic~weigh method
II. Volume~time type
A. Level~sensing (standpipe method)B. Positive~displacement method
Of the mass~time techniques, the dynamic~weigh method is preferred since
a static~weigh flow calibration program can be very time consuming.
However, gravimetric~calibration,while permitting high accuracy, has
some basic drawbacks in portability, variations of the weigh system's
dynamic response between initial and final balance, and problems in
handling volatile, flammable hydrocarbon liquids. For these reasons,
sealed volumetric systems, particularly those based on the positive
displacement technique, are very useful for calibrating flow transducer
systems used for hydrocarbon liquids. One such commercial system uses
a gas~pressurized free piston to displace a quantity of test liquid
through the flow transducer under test. The piston's linear displace-
ment and the flow transducer's output are very precisely measured and
electronically processed to generate a calibration curve. Small, field-
sized positive displacement units are available as secondary standards
to cover low-flow ranges in the 0.01 to 10 gallons per minute range,
-92-
to ~ O.1~O.2% accuracy.
Environmental considerations are also important in determining the
application of a flow meter's calibration data. In Robertson and
Baumgarten, 16 different flow meters, including a four-orifice,
four~piston, positive displacement~pump, and turbine flow meter types,
were tested in a laboratory-simulated automotive environment. Figure
25a, which is a graph from Robertson and Baumgarten, demonstrates an
apparent resonance effect at 16 Hz resulting from vertical harmonic
vibration acting on a piston flow meter. Figure 25b is a blowup of
the suspected resonance area. Figures 26a and 26b are respectively
plots of a resonance dwell in the vertical and horizontal directions.
These data clearly indicate that vibration can influence the output
of a piston~type positive displacement flow meter; the other three
kinds of meters tested in Robertson and Baumgarten16 suffered similar
degradation of performance at suspected resonance points when excited
by mechanical vibration. The mounting scheme in the locomotive engine
compartment will be the major control on vibration transmission to
the flow meter.
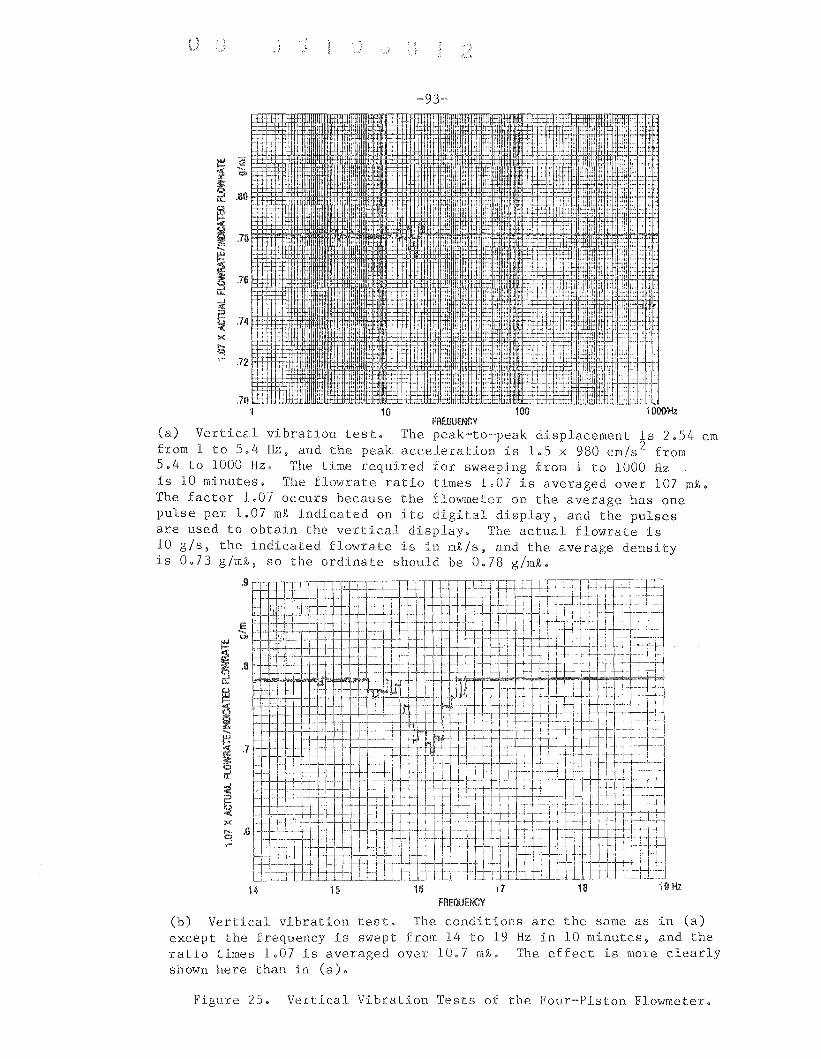
1'--: ....
~ .1.-I-l-I+-++-I-+-H-c-j--·t-+-i-+1 +I·~ 1 --
i e--.<:>l
~ .00
I .73--.
i .76rC;l
~ .74x....""!
.72
FREQUENCY(a) Vertical vibration test. The peak-to-peak displacement is 2.54 cmfrom 1 to 5.4 Hz, and the peak acceleration is 1.5 x 980 cm/s 2 from5.4 to 1000 Hz. The time required for sweeping from 1 to 1000 Hzis 10 minutes. The flowrate ratio times 1.07 is averaged over 107 m~.
The factor 1.07 occurs because the flowmeter on the average has onepulse per 1.07 mi indicated on its digital display, and the pulsesare used to obtain the vertical display. The actual flowrate is10 gis, the indicated flowrate is in m~/s, and the average densityis 0.73 glmi, so the ordinate should be 0.78 g/mi.
.9 k-l-+--I~+-I-++-++ .i-+'-+--I_~+-++-+c...++++++""I--1T+_..l.....j.. ~~~1-f..+ .. i +1....++;
el
+ I H---. Wr=
i." -j- ~+-
I +-+....1 c 1-· tI.11 +- +- +1+ ~- t-J I T ._c .i. __
IU.
" ' t- 'it
~'t"
-~
-~.,.
--. ...... c·- -I-~ .7
I
~-+- ._L -J---.,_ ...
rC;l f+~ 1'-1 _1< -i.e-. Hx.... .6""! '1
I. r+- +
14 15 16 17 18 19 Hz
FREQUENCY
(b) Vertical vibration test. The conditions are the same as in (a)except the frequency is swept from 14 to 19 Hz in 10 minutes, and theratio times 1.07 is averaged over 10.7 mi. The effect is more clearlyshown here than in (a).
Figure 25. Vertical Vibration Tests of the Four-Piston FloWDleter.
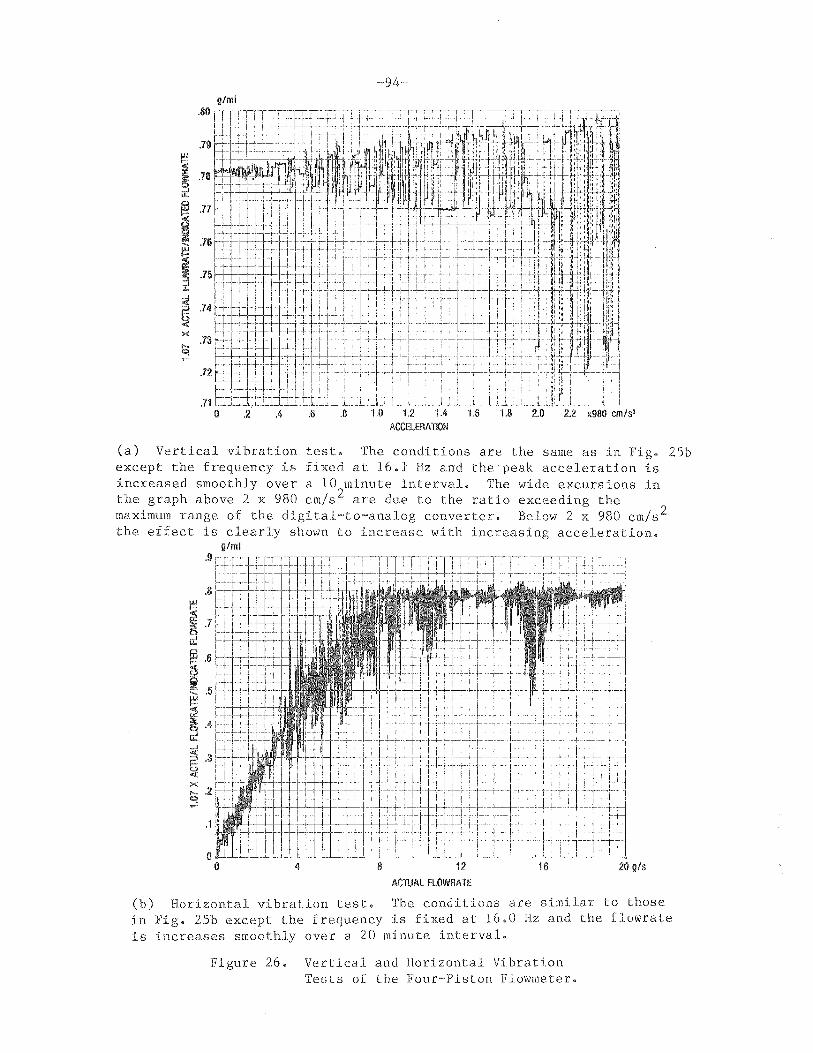
g/ml
.71I-'-l-'-L-nL-J,).-..J.'_-L-L'-+-.Li -.L't-t:C_J_ L_L •o .2 .4 .6 .8 1.0
IT1.4
-:-
1 I : -
l I: + .'.., . -_.1.6 1.8 2.0 2.2 )(980 em I S2
AGCaERATION
(a) Vertical vibration test. The conditions are the same as in Fig. 25bexcept the frequency is fixed at 16.1 Hz and the peak acceleration isincreased smoothly over a 10 minute interval. The wide excursions inthe graph above 2 x 980 cm/s 2 are due to the ratio exceeding themaximum range of the digital~to~analog converter. Below 2 x 980 cm/s 2
the effect is clearly shown to increase with increasing acceleration.g/ml
20 g/s164
.1
.8 f~+---++·+++i-+~+-c+-!-rhI, :-+.!._--+++++-++.+-++
~ .6 f-H·~+-H-+-·H-
irI;-f-+--I-H'+
;;;!f3 .3«xI'-. .2C!
8 12
ACTIJAL FLOWRATE
(b) Horizontal vibration test. The conditions are similar to thosein Fig. 2Sb except the frequency is fixed at 16.0 Hz and the flowrateis increases smoothly over a 20 minute interval.
Figure 26. Vertical and Horizontal VibrationTests of the Four~Piston Flowmeter.
~95-
6. DATA PROCESSING CONSIDERATIONS
6.1 INTRODUCTION
The basic purpose of the LDAP system is to acquire data about
diesel-electric locomotive conditions and to make the resulting in-
formation available in a form that people can assimilate. The value
of the total project, therefore, hinges on the success in making the
information available in a meaningful form. In this section we review
some of the processes involved in the flow of information from initial
acquisition to ultimate use. This will include discussion of sources
and destinations of data and control; the major processing steps, both
hardware and software; and the means and format by which processed
information is made available to the user.
The intention is that all data processing will be handled auto-
matically, with a minimum of human intervention, and with previously
prepared computer programs. For this to be successful the various
functional parts of the total system must be properly integrated and
the information be properly communicated from one function to the next.
This section discusses some of these considerations.
6.2 INFORMATION FLOW AND PROCESSING FUNCTIONS
Our discussion of information flow will, in broad terms, include:
a. the points at which data comes into the system and thecontent and significance of each of these data sources;
b. the points at which the user may interact with the systemto control the flow of information or its processing;
c. comments on the hardware and software facilities neededto process the data as it flows through the system.
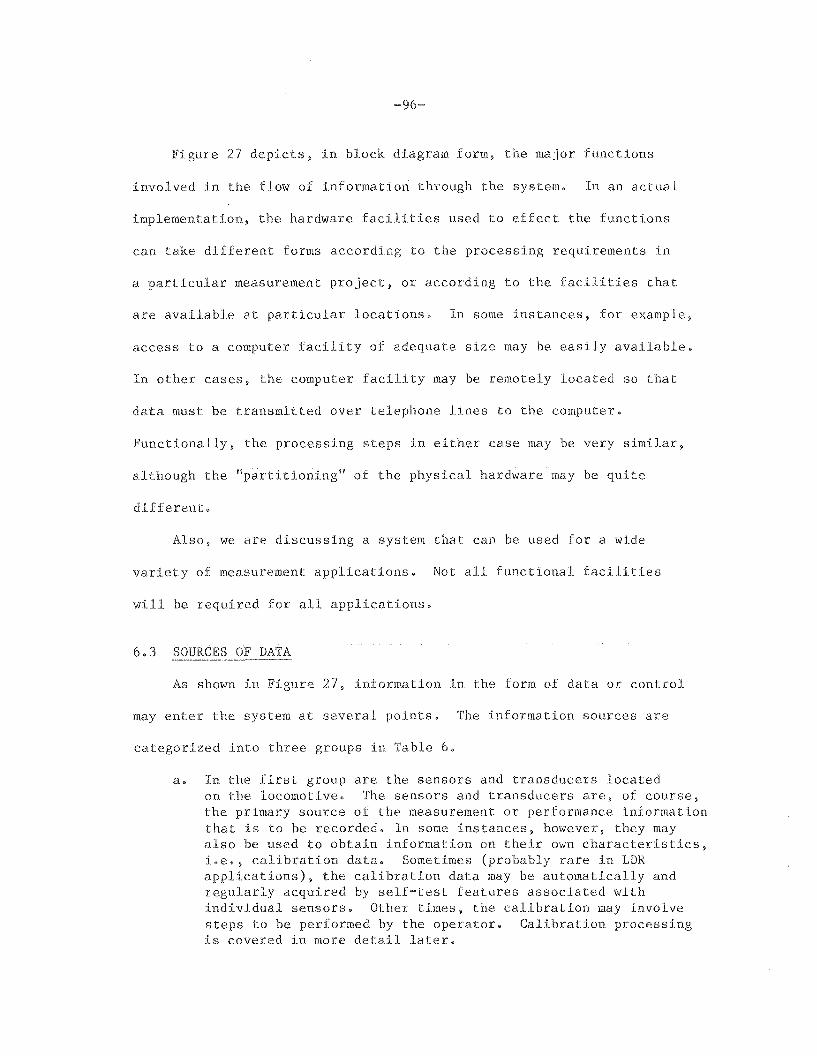
Figure 27 depicts, in block diagram form, the major functions
involved in the flow of information through the system. In an actual
implementation, the hardware facilities used to effect the functions
can take different forms according to the processing requirements in
a particular measurement project, or according to the facilities that
are available at particular locations. In some instances, for example,
access to a computer facility of adequate size may be easily available.
In other cases, the computer facility may be remotely located so that
data must be transmitted over telephone lines to the computer.
Functionally, the processing steps in either case may be very similar,
although the "partitioning" of the physical hardware may be quite
different.
Also, we are discussing a system that can be used for a wide
variety of measurement applications. Not all functional facilities
will be required for all applications.
6.3 SOURCES OF DATA
As shown in Figure 27, information in the form of data or control
may enter the system at several points. The information sources are
categorized into three groups in Table 6.
a. In the first group are the sensors and transducers locatedon the locomotive. The sensors and transducers are, of course,the primary source of the measurement or performance informationthat is to be recorded. In some instances, however, they mayalso be used to obtain information on their own characteristics,i.e., calibration data. Sometimes (probably rare in LDRapplications), the calibration data may be automatically andregularly acquired by self-test features associated withindividual sensors. Other times, the calibration may involvesteps to be performed by the operator. Calibration processingis covered in more detail later.
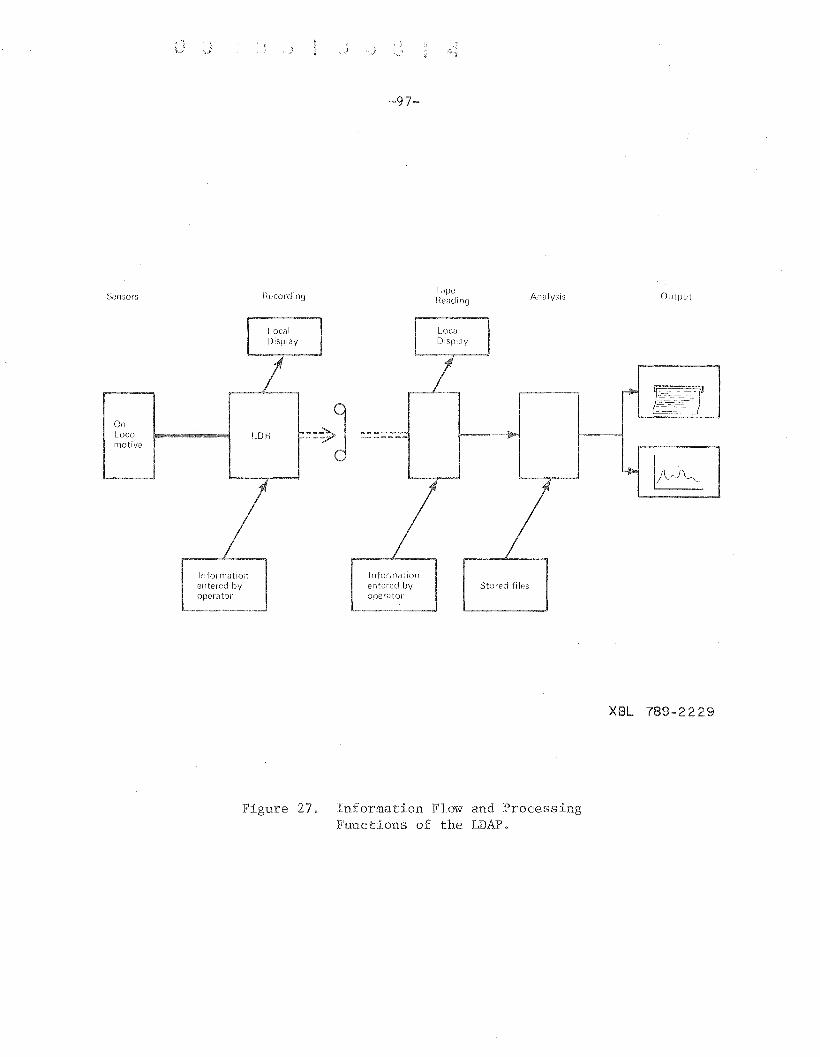
Sensors RecordinCj
~97-
TapeReadinCj Analysis Output
OnLocornotive
Informationentered byoperator
Infornlationentered byoperator
Stored fi les
XBL 789-2229
Figure 27. Information Flow and ProcessingFunctions of the LDAP.
-98-
b. A second source of information is that generated by theoperator(s) of the equipment. The term "operator" includesanyone who interacts with the LDAP system at some point inthe total process. As mentioned above, the operator(s) maybe involved in calibration processes by setting-up and recordingstandard conditions for some variable to be measured, andinitiating the recording of the measurement.
The operator may also be involved with entering "fiducial"information into the system, i.e., inforluation describingsignificant measurement conditions that is not recordedautomatically. This could include a record of the types ofsensors connected to LDAP, or of external conditions (e.g.,weather, consist, date, etc.). The operator may also issuecommands to the LDR. These could include instructions onsampling rates for various sensors, for example.
During the run, the operator may himself generate andmeasurement data to supplement that from the sensors.data may include "significant events" such as passingor readings from gauges, etc.
recordSuch
mileposts
After a run, additional operator interaction may be requiredto read the magnetic tapes generated by the LDR into theanalysis systelu, and to cause the analysis system to performthe proper processing.
In order for the information and/or commands entered by theoperator to be properly interpreted by the analysis computer,protocols by which the operator enters information must bedesigned.
c. A third source of information is indicated in Table 6 by theterm "Stored Files." This refers to bulk files of informationtoo large to be handled in the same way as the recorded data,and which are therefore stored in a place and manner thatmake them accessible to the analysis computer.
One of the key members of this category is the set of computerprograms used for the analysis and processing of LDR data.Depending on the particular computer installaton, these wouldbe stored on magnetic tape, disks, or other bulk-storage media.They would be called into the computer memory at the time theanalysis job is to be run. These programs would have beenprepared in advance using precise specifications of the natureand format of the input data, the analyses to be performed,and the nature and format of data to be output. Normally,a number of programs would be stored; the particular programto be executed would be commanded by an operator.
Another class of stored files includes ancillary data needed
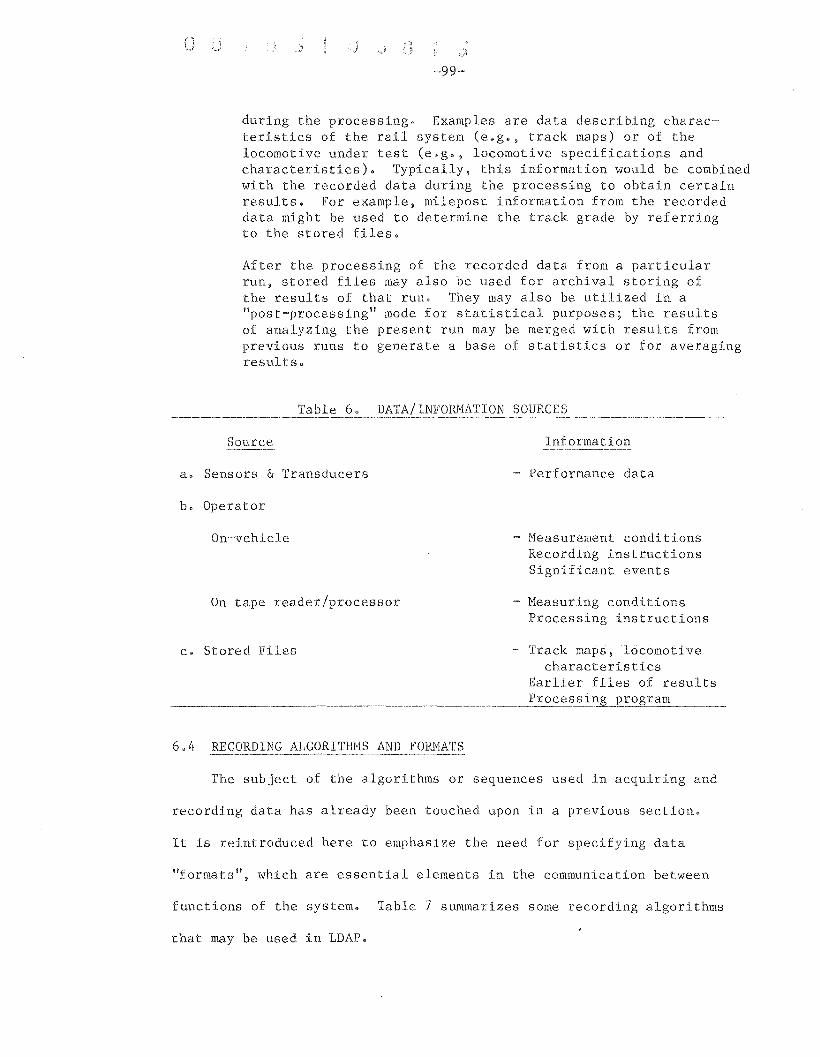
u-99-
during the processing. Examples are data describing characteristics of the rail system (e.g., track maps) or of thelocomotive under test (e.g., locomotive specifications andcharacteristics). Typically, this information would be combinedwith the recorded data during the processing to obtain certainresults. For example, milepost information from the recordeddata might be used to determine the track grade by referringto the stored files.
After the processing of the recorded data from a particularrun, stored files may also be used for archival storing ofthe results of that run. They may also be utilized in a"post-processing" mode for statistical purposes; the resultsof analyzing the present run may be merged with results fromprevious runs to generate a base of statistics or for averagingresults.
Table 6.
Source
a. Sensors & Transducers
b. Operator
On-vehicle
On tape reader/processor
c. Stored Files
INFORMATION SOURCES
Information
- Performance data
- Measurement conditionsRecording instructionsSignificant events
- Measuring conditionsProcessing instructions
- Track maps, locomotivecharacteristics
Earlier files of resultsProcess
6.4 RECORDING ALGORITlli1S AND FORMATS
The subject of the algorithms or sequences used in acquiring and
recording data has already been touched upon in a previous section.
It is reintroduced here to emphasize the need for specifying data
"formats", which are essential elements in the communication between
functions of the system. Table 7 summarizes some recording algorithms
that may be used in LDAP.
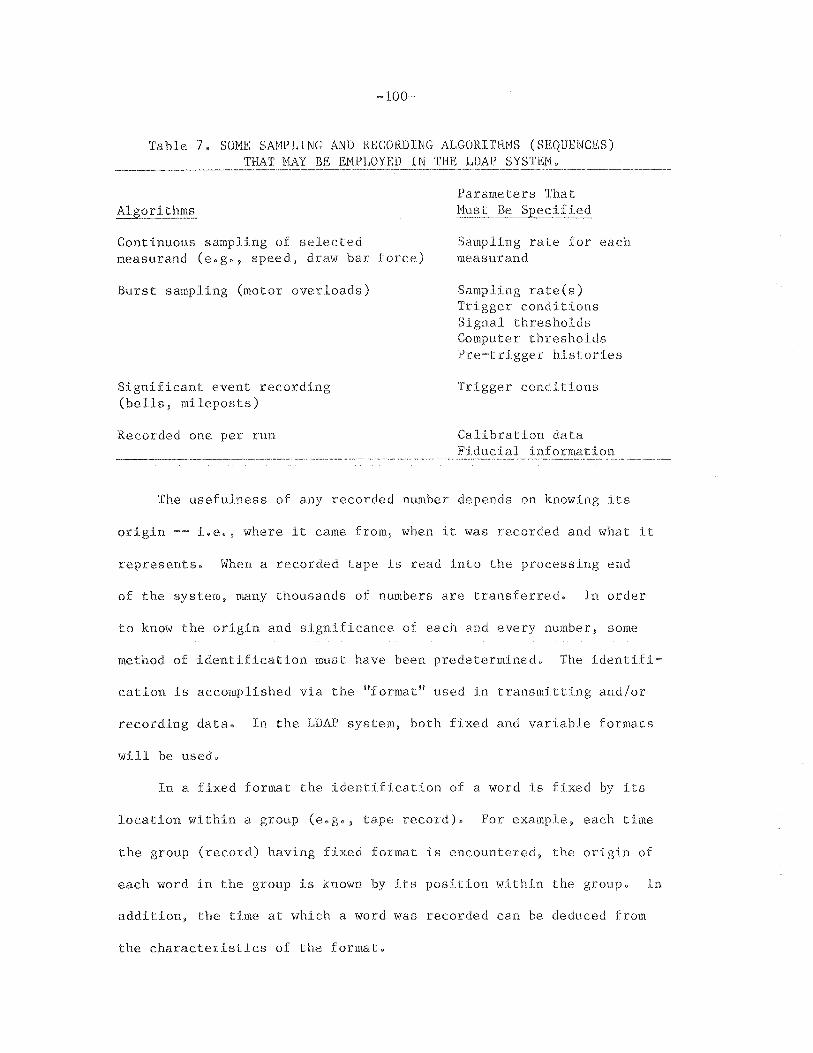
Table 7. SOME SAMPLING AND RECORDING ALGORITHMS (SEQUENCES)THAT MAY BE EMPLOYED IN THE LDAP SYSTEM.
--------~----- --~~-~ ~-~----_._-
Algorithms
Continuous sampling of selectedmeasurand (e.g., speed, draw bar force)
Burst sampling (motor overloads)
Significant event recording(bells, mileposts)
Recorded one per run
Parameters ThatMust Be ied
Sampling rate for eachmeasurand
Sampling rate(s)Trigger conditionsSignal thresholdsComputer thresholdsPre-trigger histories
Trigger conditions
Calibration dataFiducial information
The usefulness of any recorded number depends on knowing its
origin -- i.e., where it came from, when it was recorded and what it
represents. When a recorded tape is read into the processing end
of the system, many thousands of numbers are transferred. In order
to know the origin and significance of each and every number, some
method of identification must have been predetermined. The identifi-
cation is accomplished via the "format" used in transmitting and/or
recording data. In the LDAP system, both fixed and variable formats
will be used.
In a fixed format the identification of a word is fixed by its
location within a group (e.g., tape record). For example, each time
the group (record) having fixed format is encountered, the origin of
each word in the group is known by its position within the group. In
addition, the time at which a word was recorded can be deduced from
the characteristics of the format.
~101~
In a variable format. each datum is accompanied by an identifier.
The identifier may carry information such as the time of origin and
the sensor or location from which it is originated.
Generally, fixed formats are preferred, where data is recorded
at regular intervals, and hence the amount of recording medium that
will be needed to record the data can be arranged in advance. When
data is "sparse," i.e, is recorded at random or infrequent intervals,
space in the recording media can usually be conserved by use of a
variable format.
As shown in Table 7, various parameters will be sampled and
recorded using various recording algorithms (sequences). The sequence
used is a function largely of the time dependence of the sampling.
Parameters recorded with a constant sampling rate will probably be
recorded with a fixed format; those sampled at a non~constant rate
(the last three categories in Table 7) will more likely fit better
into a variable formaL
The main point in this section is not to catalog these items
specifically, but rather to point out some of the situations that must
be considered in recording and analyzing the data. Again, the analysis
program cannot use a datum unless it knows the significance of that
datum.
6.5 ANALYSIS FUNCTIONS AND COMPUTER PROG~AMS
The analysis function consists of processing the raw numerical
(or alphanumeric) data recorded by the LDR into a useful form. The
definition of what is useful, and therefore what analysis is required,
will vary from one experiment to another.
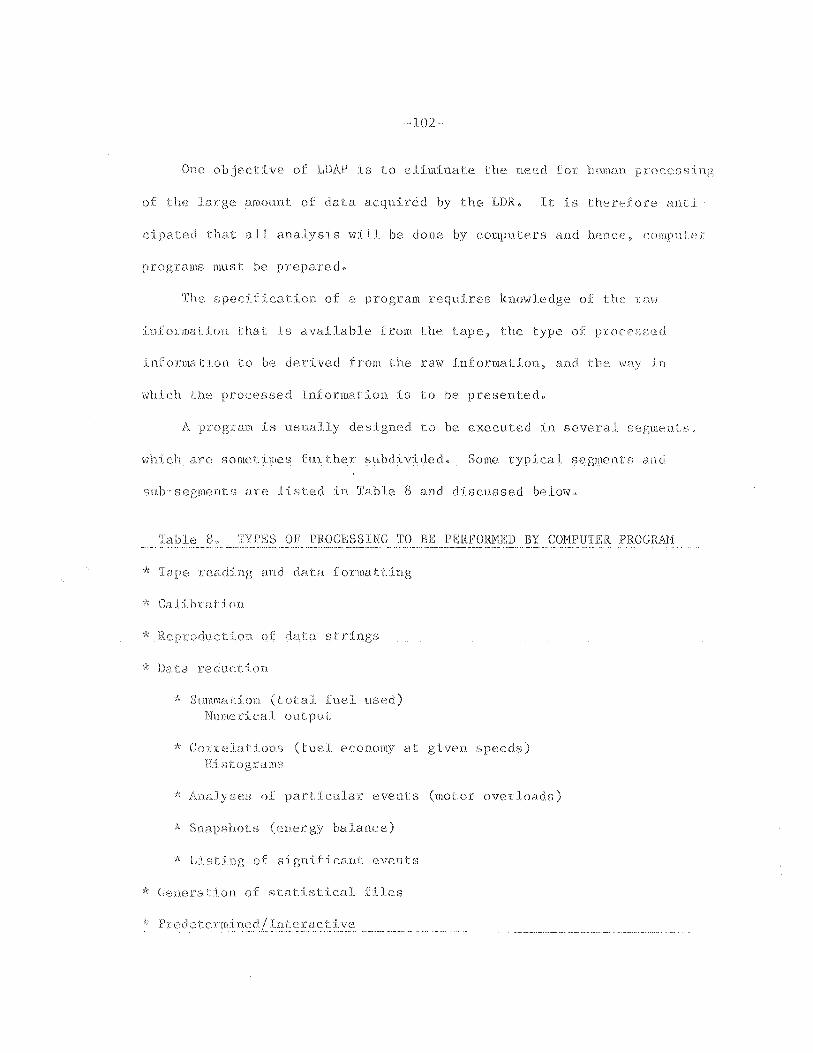
One ob tive of LDAP is to eliminate the need for human
of the of data the LDR. It is therefore
that all Sl s wLU be done computers and hence,
programs must be prepared.
The ication of a program knm'>lle of the
information that i available from the e~ the of prOCeGEW
informa ion 0 be derived from the raw information and the way
which the processed information is to be presented.
A program des to be executed in several segmen s,
are segments and
sub"'o"'s s are listed In Table 8 and discussed be 10\\7 c
Table 8. TYPES OF PROCESSING TO BE PERFORMED BY COMPUTER PROGRAM
and data fonnatt
* Calib:ration
ta st
Da duct ion
Summation ( otal fuel used)Numerical out
economy at cnn0ri<.,)
icular events or overloads)
s gy balance)
of ieant events
of tatistical files
Intera.c tive
~l03-
a. Tape reading and formatting. The digital information on themagnetic tape will typically be in a form that cannot be useddirectly by the programs in the processing computer. Forexample, the typical word size used by 1DR will probably notbe the same as the word size of the computer; additionally,to conserve tape, 1DR may use different word sizes for differentvariables. The computer processing will typically be donein several steps: it is convenient for illustrative purposesto consider the information on the tape to be a string ofbits. In the tape reading and formatting process, groups ofbits must be separated into words that are compatible withprograms written in higher level languages, such as FORTRAN.
Typically, this formatting cannot be done using ASCII~standard
FORTRAN. Many computer systems, however, have FORTRAN~callable
functions or subprograms that can do the formatting. In theabsence of these, an assembly language routine may be necessary.In general, the forulatting routines will need to be specialto the particular computer type or installation.
The end result of the tape reading and formatting is to haveeach individual datum in a form accessible to a processingprogram written in a higher-level language.
b. Calibration. Calibration refers to the process of convertingnumbers recorded from sensors or transducers into engineeringunits. This requires having some auxiliary information on thecharacteristics of the transducers, i.e., calibration constants.As discussed earlier, calibration constants can be supplied tothe processing program in various ways; for example, by calibration activities performed on the locomotive, or by informationsupplied to, or embedded in, the processing program.
A typical calibration algorithm is:
E = A + B x 1,
where
1 the raw measurement datum recorded by 1DAP;
E the value of the measured parameter, in engineering units;
A,B = calibration constants.
This algorithm is appropriate where linear conversions are valid.More complex algorithms, such as:
E A + B x 1 + C x 1 2 + D x 1 3
may be necessary for non~linear corrections. Where the conver-

~104~
sian cannot easily be specified in closed form, it may benecessary to store an array of conversion constants in areference table.
c. is These programs perform mathematical orgical manipulations on the data and produce the information
that is of interest. Part of this procedure may be thoughtof as lVdata reduction,lV since it will typically take largenumbers of individual measurements and reduce them to a smallerset of numbers that each carry more significant information.
It is expected that analysis programs will be written in a"higher~level" language such as FORTRAN or BASIC. Such programshave the advantage of being easier to write and understandthan programs written in assembly languages. They are also"transportable" in that a majority of computer systems canutilize them directly without translation.
It is also expected that a number of such transportable programswill eventually be written to cope with the various types ofanalysis to be done. Part of the ongoing work in this projectwill be to determine the number and capabilities of theseprograms. As an illustration of this point, Table 7 listssome of the types of analysis that may be performed on LDRdata. Not all of these will be required in any given problem.
1) Reproduction of Data Strings. This refers to the reproduc~
tion of a history of one or more individual variablesAn example is the plotting, on a strip~chart, of the speedof the locomotive as a function of time. The processingis minimal. The program would typically provide for thechoice of a variable to be plotted and the scale to whichit is plotted.
2) Data Reduction. This refers to producing an output set ofdata that is less populous than the input set ~~ this issometimes referred to as "number-crunching".
A good example to illustrate the use of data reduction isthe problem of total amount of fuel used in a specified
LDR would record the instantaneous fuel flow rateat periodic sampling times. The processing program woulddetermine the total fuel used by integration, i.e., summingall the fuel flow rate nwnbers and multiplying by the samplinginterval. The result, in this example, would be a singlenumber obtained by reducing a large set of numbers Theprogram would, within reasonable limits, allow for thechoice of variable to be summed, and the interval overwhich the summation takes place.
A subset of this procedure would be correlation, in which
-105~
the functional relationships between variables is explored.These procedures often lead to output in the form of histograms or tables. An example is the calculation of a setof numbers that describe fuel economy at various speeds.Since the speed of the train varies during a run, theprogram must sort the calculated results according to theinstantaneous recorded speed.
Results of a set of calculations such as this are meaningfulonly if other conditions that could affect the result areconstant ~- if, for example, the above calculations weremade on flat track. When other variables, such as grade,are important, the calculated results may need to be sortedaccording to combinations of variables.
The preparation of programs must be based on a prioridecisions to select the variables that will be analyzedfor functional dependence on other selected variables, andalso regarding the resolution (size of bins) used in thesorting process.
As shown in Table 7, there are a number of other types ofanalyses that can be classified as data reduction. Thesame comments regarding a priori decisions on the programsto be analyzed are applicable.
3) Statistical Manipulations. It is expected that, in manycases, the results of a single run will be insufficientto draw meaningful conclusions. Typically, this may be sobecause measurements cannot be made to sufficient accuracyor because of the possible influence of unmeasured oruncontrolled variables.
For this reason it may be necessary to develop and storefiles of information that may be used to provide an expandeddata base over the data available from a single run. Thispermits the accumulation of results from a number of runs,and allows the generation of output data based on thisaccumulation. Essentially all computer systems that couldbe used for this purpose will have the facility to storeand retrieve such files, either on disc or magnetic tapestorage. In this case, since the files are written andretrieved by the high~level language program, formatting ofthe files for reading and writing is handled automaticallyby the computer system. Problems may arise, however, ifthese files are transported from one system to another.
6.6 PREDETERMINED/INTERACTIVE PROGRAMMING
The preceding sections contained remarks about the need

-l06~
to decide in advance what the analysis programs are to do. It should
be pointed out, however, that provision can be made for certain decisions
to be made at the time the program is run. In other words, the operator
can be given the power to interact, to some degree, with the program.
The most practical level, for our purposes, is probably to develop a
rudimentary "very high-level" language. Such a language would be used
to control the execution of the high~level (FORTRAN) language programs
by specifying the names of variables, time intervals, resolutions, etc.,
used in the calculations.

~107-
7. REFERENCES
1. E.G. Schwarm. is for RailroadElectrification, report for Transportation Systems Center,U.S. Dept. of Transportation, under Contract DOT~TSC~1156, October16, 1976.
2. E.M. Harris, and C.E. Crede. Shock and Vibration Handbook (McGraw~
Hill Book Co., New York, 1961), pp. 45-28 through 45-31.
3. R.L. Baxter and D.L. Bernard. Vibration Tolerances for IndusASME paper 67~PEM~14 (1967).
4. C.E. Crede. Vibration and Shock Isolation (John Wiley and Sons,Inc.) New York, 1
5. Impact as Related to Freight Car and Lading Damage, ASME paper59-A~249 (1959).
6. S. Rubin. Vibration Isolation on Nonrigid Supporting Stru~tures,
SAE Transactions, Vol. 6B (1960).
7. R.M. Phelan. Dynamics of Machinery (McGraw~Hill Book Co., NewYork, 1967), p. 214.
8. S. Rubin. Design of Vibration Isolation Systems, Society of Automotive Engineers (Pergamon Press, Ltd., Oxford, England, 1962).
9. E.M. Harris and C.E. Crede. Shock and Vibration Handbook (McGrawHill Book Co., New York, 1961~p~-8~48 through 8~--
10. D.S. SteinberG "Taking the Shake out of Circuit Boards,"Design, September 22, 1977, pp. 96-99.
Jvlachine
11. "Industrial Load Cells," Product Engineer, March 1949, p. 11.
12. J. Vrabel, E. Sussman, and D. Ofsevit. Development of~__~stemto Display and Record Slack Actions in Freight Trains, ReportFRA/ORD~77-53, U.S. Dept. of Transportation, T.S.C-:;-August 1977.
13. R. Anderson and P. Cramer. Train~to-Train Rear EndVol. I ~- Pre-Impact Determination Properties, ReportFRA/ORD-73-303, I, U.S. Dept. of Transportation, T.S.C., March1977 •
14. J. Grey. "Transient Response of the Turbine Flowmeter," JetPropulsion, Feb. 1958, p. 98.
15. J.N. Cetinich. Fuel Efficiency Improveme~~ in Rail_!_~ight
Transportation, Report FRA-OR and D-76~136, U.s. Dept. ofTransportation, December 1975.

16.
~108~
B. Robertson and G. Baumgarten.Flow Meters,ll National Bureau ofJune 1977, pp. 42-45.
"Evaluation of Automotive FuelStandards Technical Note 943,
~l09-
APPENDIX A
LOCOMOTIVE DATA ACQUISITION PACKAGE (LDAP) FUNCTIONAL SPECIFICATION
INTRODUCTION
This specification outlines the functional characteristics of a
Locomotive Data Acquisition Package to be used for the recording and
subsequent analysis of locomotive operating parameters.
The LDAP is divided into three sections. The first section. which
will be carried on-board a locomotive. shall contain the recording
mechanism. the signal conditioning and processing hardware. sensors. the
enclosure and additional apparatus necessary to ensure that the system
operates in accordance with this specification. The first section
will hereafter be referred to as the "Locomotive Data Recorder (LDR)."
The second section. which will be used in an office environment, shall
contain the magnetic tape playback unit. a data modem, a computer
terminal. plus equipment necessary to read a previously recorded digital
magnetic tape and transmit the information to an off-site digital com-
puter. This second section will also contain a means of accessing the
off-site digital computer used for data analysis. This second section
is referred to as the LDAP Playback unit. The third section shall
contain the software necessary to reconstruct and manipulate the data
as required to perform a selected measurement task. The software will
be used initially on the LBL-CDC~7600 computer. but will be written
so as to facilitate its use on other suitable computers.
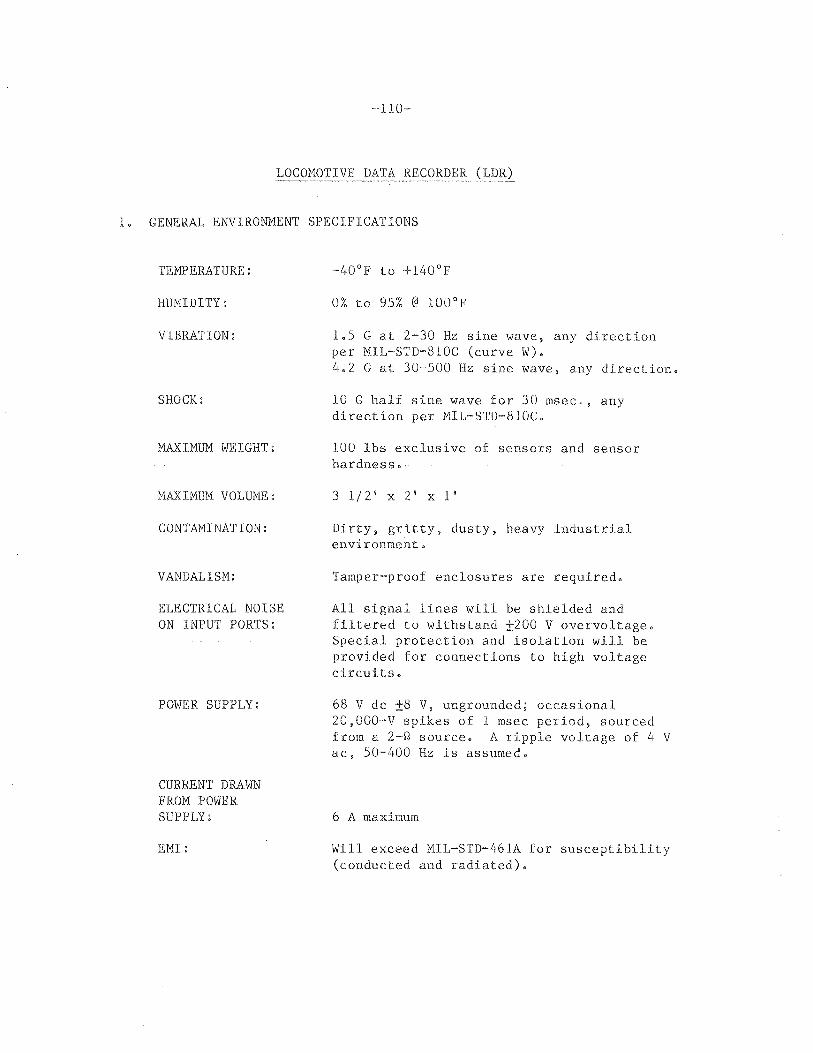
-1l0~
LOCOMOTIVE DATA RECORDER
1. GENERAL ENVIRONMENT SPECIFICATIONS
TEMPERATURE:
HUMIDITY:
VIBRATION:
SHOCK:
MAXIMUM WEIGHT:
MAXIMIJM VOLUME:
CONTAMINATION:
VANDALISM:
ELECTRICAL NOISEON INPUT PORTS:
POWER SUPPLY:
CURRENT DRAWNFROM POWERSUPPLY:
EMI:
0% to 95% @ 100°F
1.5 G at 2-30 Hz sine wave, any directionper MIL~STD-810C (curve W).4.2 G at 30-500 Hz sine wave, any direction.
10 G half sine wave for 30 msec., anydirection per MIL-STD-810C.
100 lbs exclusive of sensors and sensorhardness.
3 1/2' X 2' x I'
Dirty, gritty, dusty, heavy industrialenvironment.
Tamper-proof enclosures are required.
All signal lines will be shielded andfiltered to withstand ±200 V overvoltage.Special protection and isolation will beprovided for connections to high voltagecircuits.
68 V dc ±8 V, ungrounded; occasional20,000-V spikes of 1 msec period, sourcedfrom a 2-Q source. A ripple voltage of 4 Vac, 50-400 Hz is assumed.
6 A maximum
Will exceed MIL-STD~461A for susceptibility(conducted and radiated).
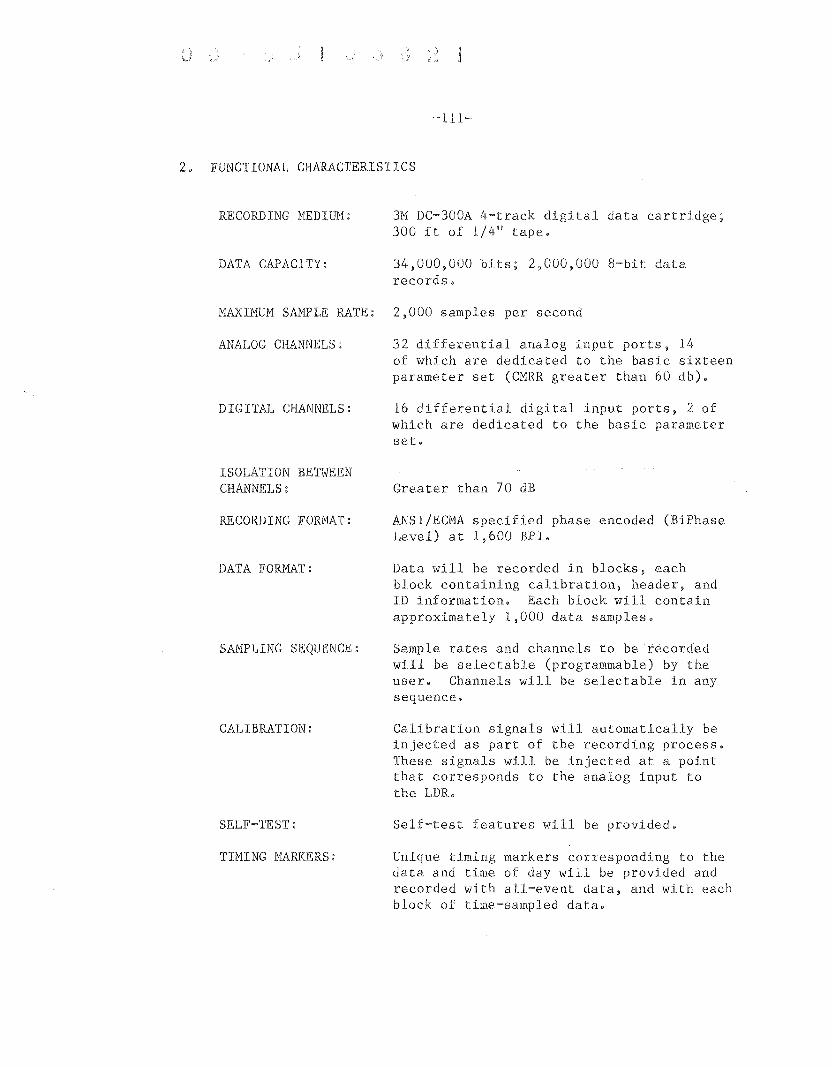
-111-
2. FUNCTIONAL CHARACTERISTICS
RECORDING MEDIill1: 3H DC-300A 4-track digital data cartridge;300 ft of 1/4" tape.
DATA CAPACITY: 34,000,000 bits; 2,000,000 8~bit datarecords.
MAXIMUM SAMPLE RATE: 2,000 samples per second
ANALOG CHANNELS: 32 differential analog input ports, 14of which are dedicated to the basic sixteenparameter set (CMRR greater than 60 db).
DIGITAL CHANNELS: 16 differential digital input ports, 2 ofwhich are dedicated to the basic parameterset.
ISOLATION BETWEENCHANNELS:
RECORDING FORMAT:
DATA FORMAT:
SAMPLING SEQUENCE:
CALIBRATION:
SELF-TEST:
TIMING MARKERS:
Greater than 70 dB
ANSI/ECMA specified phase encoded (BiPhaseLevel) at 1,600 BPI.
Data will be recorded in blocks, eachblock containing calibration, header, andID information. Each block will containapproximately 1,000 data samples.
Sample rates and channels to be recordedwill be selectable (programmable) by theuser. Channels will be selectable in anysequence.
Calibration signals will automatically beinjected as part of the recording process.These signals will be injected at a pointthat corresponds to the analog input tothe LDR.
Self~test features will be provided.
Unique timing markers corresponding to thedata and time of day will be provided andrecorded with all-event data, and with eachblock of time-sampled data.
POST TRIGGERING:
KEYBOARD/UMBILICAL:
3. MEASURANDS
-1l2~
The capability to record up to 1,000 datasamples that occurred pri_~r to a specificevent will be provided. That is, it willbe possible to record the history of aparameter over a time interval from 1000samples before an event trigger until aspecified time thereafter.
A keyboard will be provided. Use of thekeyboard will allow sample rates to bechanged, channels to be assigned to sensors,and transducer values monitored. It willalso provide for the input of event or mile~
post information. Provisions will be madefor either a separate, smaller keyboard onan umbilical, or the full keyboard on anumbilical for event and status typeinput/output.
The following parameters shall be recorded and transducers and
cabling be provided where necessary.
Measurand
Speed
Independent Brake Pressure
Trainline Brake Pressure
Buff/Draft Forces
Traction Alternator Voltage
Traction Alternator Current
Dynamic Brake Current
Grade
Throttle Setting
Reverser Setting
Slip~Spin
Fuel Flow In
Sampled
Sampled
Sampled
Sampled
Sampled
Sampled
Sampled when used
Sampled
Event when changed
Event when changed
Event
Sampled
Fuel Flow Out
Air Temperature
Turbo Charger Pressure
Engine Temperature
-113-
Sampled
Sampled
Sampled
Sampled
The following parameters will be derived from the original 16 listed
above:
Distance traveled
Total work done
Time in Notch
Time in Motion
Sampled means the measurand will be sampled and recorded at a
rate that may be adjusted between 1 sample/hr to 100 samples/sec,
within the limitation of 2,000 total samples/sec for all parameters.
Event means the time history of selected parameters can be
recorded for a pre-determined time before and after a trigger based
on some pre-selected conditions of the measurand.
Event when sampled means the time history consists of one sample
of the indicated measurand.
PLAYBACK UNIT
The LDAP playback unit will include a playback tape recorder, a
commercial computer data terminal and a data modem. It will provide
for the transmission of previously recorded locomotive data and operator
commands to an off-site digital computer and for the reception and
display of information from that computer.

~114~
ANALYSIS SOFTWARE
Software routines to execute a pre~selected measurement task will
be written and fully documented. These will be initially used on the
LBL CDC~7600 computer complex. They will be written in a way to
facilitate their use at other suitable computers and to facilitate the
expansion of application to other tasks.
FORTRAN ACCESSIBLE ARRAYS:
CALIBRATION CHECKS:
SUMMATIONS:
CORRELATIONS:
COMPUTATIONS:
SNAPSHOT VIEWS:
EVENTS:
Software will be provided (in the formof subroutines callable from FORTRAN)that will program a selected off-sitecomputer to accept the stream of datasamples from the Playback Unit. Thesesubroutines will structure and formatthe data samples into fixed arraysaccessible by a high level computerlanguage, such as FORTRAN.
The capability to verify LDR calibrationwill be provided where applicable to thepre~selected task; the following typesof software routines will be provided.
The capability to perform numericalsummations will be provided. Forexample, total fuel used from pointto point, time in notch, etc.
The capability to correlate twoparameters and to generate histogramswill be provided. For example, fueleconomy as a function of speed, speedas a function of time, etc.
The capability to perform arithmeticcomputations will be provided.
The capability to examine all ofa selected group of parameters at aparticular location, or at a particulartime, will be provided.
The capability to search. for and listsignificant events will be provided.For example, time of occurrence of allbrake pipe reductions greater than 20 psi,or of slip/spin activity, etc.
STATISTICAL FILES:
-115-
The capability to merge LDAP datawith existing data files of a fixedformat will be provided. For example,track map information, or previouslyanalyzed LDAP data. The software willbe designed so as to be compatible andusable with statistical analysis routines.


This was done with support from the Department of Energy.conclusions or opinions expressed in this report represent solely
those of the author(s) and not necessarily those of The Regents of theUniversity of California, the Lawrence Berkeley Laboratory or the

TECHNICAL
LAWRENCE LABORATORY
UNIVERSITY CALIFORNIA
BERKELEY, CALIFORNIA 94720