Dialogue Journal Keeping to Scaffold Five- Paragraphing Writing

ÔÑÝßÔ ßÒÜ ÎÛÙ×ÑÒßÔ ÓÛÝØßÒ×ÝßÔ
ÝØßÎßÝÌÛÎ×ÍßÌ×ÑÒ ÑÚ ß ÝÑÔÔßÙÛÒó
ÙÔÇÝÑÍßÓ×ÒÑÙÔÇÝßÒ ÍÝßÚÚÑÔÜ ËÍ×ÒÙ Ø×ÙØó
ÎÛÍÑÔËÌ×ÑÒ Ú×Ò×ÌÛ ÛÔÛÓÛÒÌ ßÒßÔÇÍ×Í
ͬ±° ßÖÚ ïô îô Ø¿®®·±² ÒÓ ïô îô Ø¿«¹¸ ÓÙ íô ìô Ñ�Þ®·»² ÚÖ íô ìô ӽث¹¸ ÐÛ ïô
îò
ïò Ü»°¿®¬³»²¬ ±º Ó»½¸¿²·½¿´ ¿²¼ Þ·±³»¼·½¿´ Û²¹·²»»®·²¹ô
Ò¿¬·±²¿´ ˲·ª»®·¬§ ±º ×®»´¿²¼ Ù¿´©¿§ô Ù¿´©¿§ô ×®»´¿²¼
îò Ò¿¬·±²¿´ Ý»²¬®» º±® Þ·±³»¼·½¿´ Û²¹·²»»®·²¹ ͽ·»²½»ô Ò¿¬·±²¿´
˲·ª»®·¬§ ±º ×®»´¿²¼ Ù¿´©¿§ô Ù¿´©¿§ô ×®»´¿²¼
íò Ü»°¿®¬³»²¬ ±º ß²¿¬±³§ô α§¿´ ݱ´´»¹» ±º Í«®¹»±² ·² ×®»´¿²¼ô
Ü«¾´·²ô ×®»´¿²¼
ìò Ü»°¿®¬³»²¬ ±º Ó»½¸¿²·½¿´ ¿²¼ Ó¿²«º¿½¬«®·²¹ Û²¹·²»»®·²¹ô
Ì®·²·¬§ Ý»²¬®» º±® Þ·±»²¹·²»»®·²¹ô ͽ¸±±´ ±º Û²¹·²»»®·²¹ô
Ì®·²·¬§ ݱ´´»¹»ô Ü«¾´·²ô ×®»´¿²¼ò
ݱ®®»°±²¼·²¹ ¿«¬¸±®æ ß¼¿³ ͬ±°ò ß¼¼®»æ ÒÝÞÛÍô Ñ®¾»² Þ«·´¼·²¹ô
Ò¿¬·±²¿´ ˲·ª»®·¬§ ±º ×®»´¿²¼ Ù¿´©¿§ô Ù¿´©¿§ô ×®»´¿²¼ò Ì»´»°¸±²»æ õíëí øð÷çï
ìçíèìçò Û³¿·´æ ¿ò¬±°ïಫ·¹¿´©¿§ò·»ò
Ì·¬´» п¹»Ý´·½µ ¸»®» ¬± ª·»© ´·²µ»¼ λº»®»²½»

1
ï ×ÒÌÎÑÜËÝÌ×ÑÒ
The in-vitro engineering of tissue requires an artificial environment that can promote the desired
evolution of cellular processes. Many processes influence cell proliferation and differentiation,
though the strain environment maybe the most important as it dictates the path by which the
mechano-sensitive systems lead cell evolution [McMahon et al., 2008]. As a cell-seeded scaffold is
often strained in-vitro [Ignatius et al., 2005], the amount of strain imparted onto the cells dictates
the level of tissue growth. To achieve engineered tissue suitable for in-vivo implantation, the tissue
needs to demonstrate homogenous mechanical and architectural properties so that the rate of cell
proliferation and differentiation, as governed by the forces imparted by the local strain environment,
occur at equal magnitudes throughout the entire scaffold [Hollister et al., 2002; McMahon et al.,
2008; et al., et al., 2005].
A Collagen-glycosaminoglycan (CG) scaffold, a construct biologically suited to promoting tissue
growth [Chang and Yannas, 1992; Chamberlain et al., 1998; et al., 2004; Yannas et al.,
1989; Yannas 2001], has already been described mechanically from classic experimental
measurements [Harley et al.,2007; Harley et al.,2008; Lee et al.,2001]. However, apparent
mechanical properties do not provide an appreciation of microscale or regional strain environments
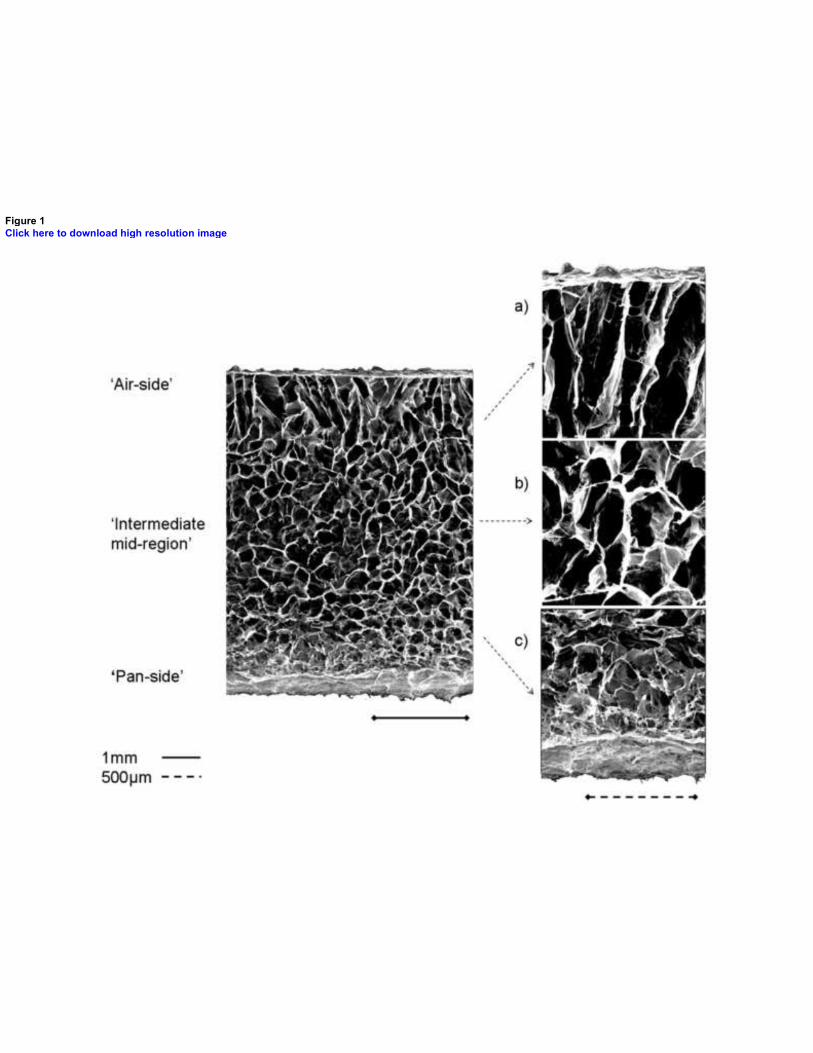
important to mechano-sensitive cell systems (see Figure 1). It is important to note that Figure 1
illustrates a varying pore morphology along the longitudinal axis (z-axis). Though this Scanning
Electron Microscope (SEM) image clearly depicts a regional variance in architecture, and has been
mentioned in previous investigations [Harley et al., 2007], there is no quantitative data to explain
the influence on cell activity. Consequently, in an attempt to quantify microscale deformations,
Stops et al. (2008) used microscale Finite Element (FE) modelling to show how a strained CG
scaffold imparts a large range of strains onto the seeded cells. Though this recent study helped
demonstrate the influence of macroscopic scaffold strain on the microscale strain environment, the
implementation of an idealised geometry did not allow an insight into regional differences. Ideally,
scaffold-specific geometry should be characterised from high resolution imaging [Hollister et al.,
2002]. In accord with this proposal, Sandino et al. (2008) used µComputed Tomography (µCT)
imaging to construct a representative model of a calcium-phosphate scaffold. The effect of the
internal architecture on the resulting mechanical deformations and fluid dynamics were found to
vary according to the morphology of the material. Significantly, Sandino et al. (2008) suggested
that any non-uniformity in the scaffold architecture will create localised areas of high strain, stress
and/or fluid flow, that in-turn will create localised hotspots of mechanical stimuli imparted onto the
cells
®»ª·»¼ ³¿²«½®·°¬Ý´·½µ ¸»®» ¬± ª·»© ´·²µ»¼ λº»®»²½»
2
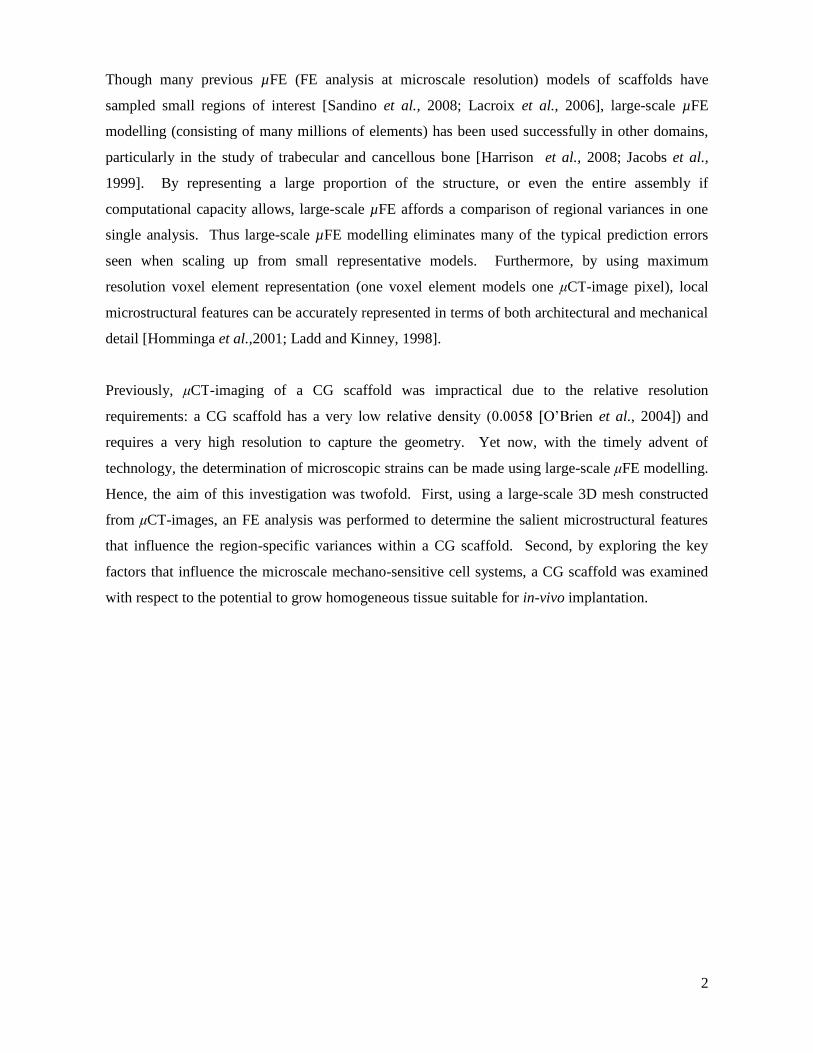
Though many previous µFE (FE analysis at microscale resolution) models of scaffolds have
sampled small regions of interest [Sandino et al., 2008; Lacroix et al., 2006], large-scale µFE
modelling (consisting of many millions of elements) has been used successfully in other domains,
particularly in the study of trabecular and cancellous bone [Harrison et al., 2008; Jacobs et al.,
1999]. By representing a large proportion of the structure, or even the entire assembly if
computational capacity allows, large-scale µFE affords a comparison of regional variances in one
single analysis. Thus large-scale µFE modelling eliminates many of the typical prediction errors
seen when scaling up from small representative models. Furthermore, by using maximum
resolution voxel element representation (one voxel element models one CT-image pixel), local
microstructural features can be accurately represented in terms of both architectural and mechanical
detail [Homminga et al.,2001; Ladd and Kinney, 1998].
Previously, CT-imaging of a CG scaffold was impractical due to the relative resolution
requirements: a CG scaffold has a ver et al., 2004]) and
requires a very high resolution to capture the geometry. Yet now, with the timely advent of
technology, the determination of microscopic strains can be made using large-scale FE modelling.
Hence, the aim of this investigation was twofold. First, using a large-scale 3D mesh constructed
from CT-images, an FE analysis was performed to determine the salient microstructural features
that influence the region-specific variances within a CG scaffold. Second, by exploring the key
factors that influence the microscale mechano-sensitive cell systems, a CG scaffold was examined
with respect to the potential to grow homogeneous tissue suitable for in-vivo implantation.
3
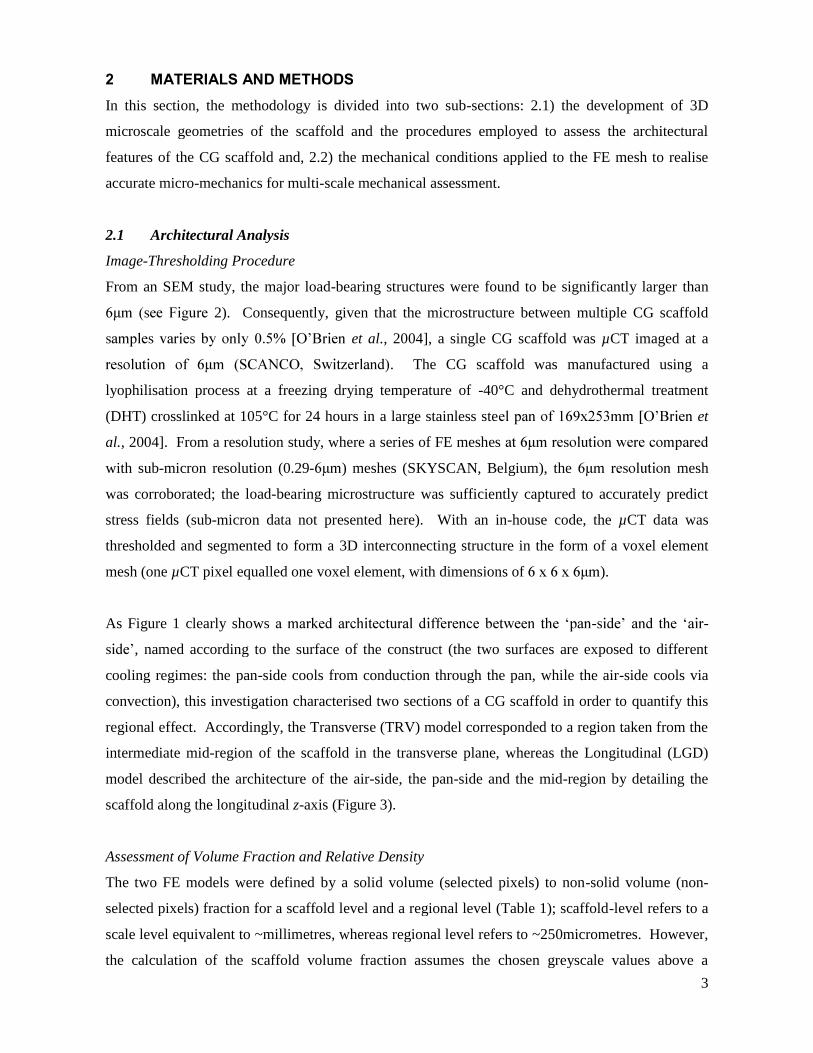
î ÓßÌÛÎ×ßÔÍ ßÒÜ ÓÛÌØÑÜÍ
In this section, the methodology is divided into two sub-sections: 2.1) the development of 3D
microscale geometries of the scaffold and the procedures employed to assess the architectural
features of the CG scaffold and, 2.2) the mechanical conditions applied to the FE mesh to realise
accurate micro-mechanics for multi-scale mechanical assessment.
2.1 Architectural Analysis
Image-Thresholding Procedure
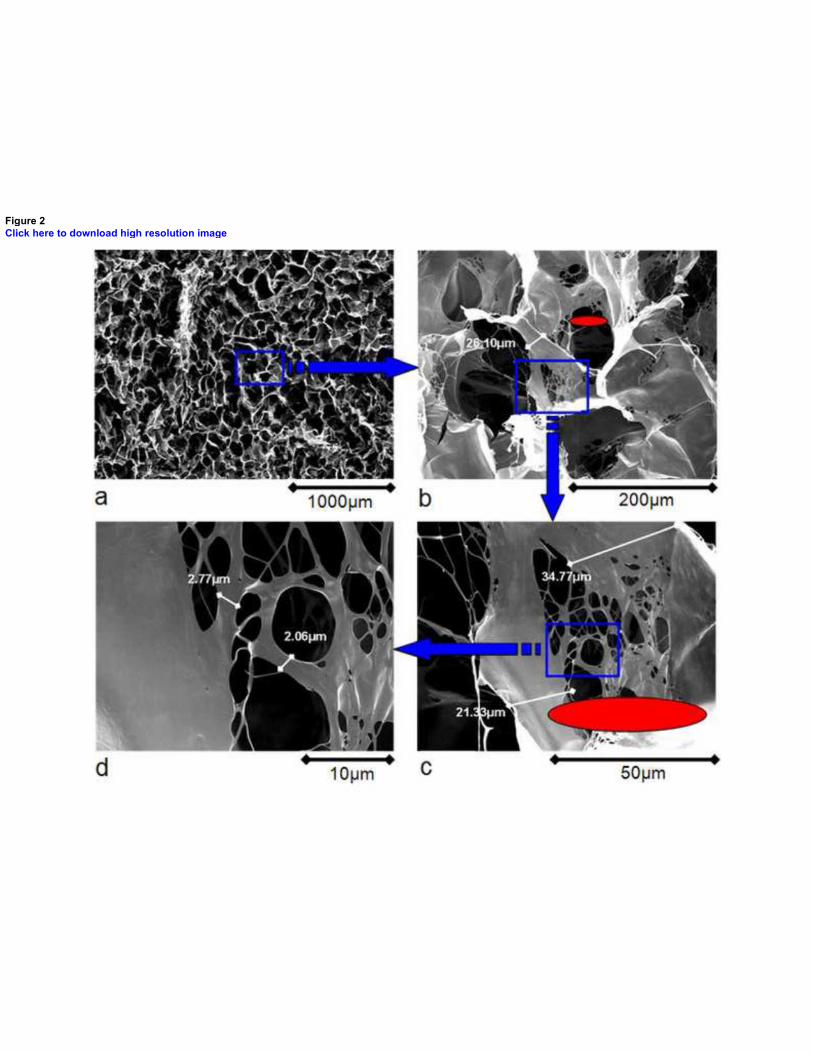
From an SEM study, the major load-bearing structures were found to be significantly larger than
2). Consequently, given that the microstructure between multiple CG scaffold
et al., 2004], a single CG scaffold was µCT imaged at a
. The CG scaffold was manufactured using a
lyophilisation process at a freezing drying temperature of -40°C and dehydrothermal treatment
(DHT) crosslinked at 105°C for 24 hours in a large stainless ste et
al., 2004]. From a resolution study, where a series of FE meshes
with sub-micron resolution (0.29- ) meshes (SKYSCAN, Belgium), the mesh
was corroborated; the load-bearing microstructure was sufficiently captured to accurately predict
stress fields (sub-micron data not presented here). With an in-house code, the µCT data was
thresholded and segmented to form a 3D interconnecting structure in the form of a voxel element
mesh (one µCT pixel equalled one voxel element, with dimensions of ).
As Figure 1 clearly shows - -
, named according to the surface of the construct (the two surfaces are exposed to different
cooling regimes: the pan-side cools from conduction through the pan, while the air-side cools via
convection), this investigation characterised two sections of a CG scaffold in order to quantify this
regional effect. Accordingly, the Transverse (TRV) model corresponded to a region taken from the
intermediate mid-region of the scaffold in the transverse plane, whereas the Longitudinal (LGD)
model described the architecture of the air-side, the pan-side and the mid-region by detailing the
scaffold along the longitudinal z-axis (Figure 3).
Assessment of Volume Fraction and Relative Density
The two FE models were defined by a solid volume (selected pixels) to non-solid volume (non-
selected pixels) fraction for a scaffold level and a regional level (Table 1); scaffold-level refers to a
scale level equivalent to ~millimetres, whereas regional level refers to ~250micrometres. However,
the calculation of the scaffold volume fraction assumes the chosen greyscale values above a

4
threshold value to be solid. In reality, each individual pixel has a unique greyscale value, or in
other terms, each pixel has a unique density. This partial volume effect has also been observed
when CT scanning bone [Homminga et al., 2001]. Consequently, to quantify the effect of these
pixel densities on the volume fraction calculation, and to identify if localised regions of densities
occur within the scaffold, the greyscale values were normalised relative to the base constituent of
the scaffold, e.g. collagen.
A solid sample of bovine collagen, extracted at source, was freeze dried at a temperature of -40°C
for 24 hours to remove the water content. Subsequently, the sample was µCT imaged at the same
scan settings of the aforementioned CG scaffold (SCANCO, Switzerland). With a purpose written
Matlab® code, was determined from the µCT-images.
Subsequently, the greyscale values of the scaffold mesh were normalised with respect to the mean
collagen pixel greyscale value. This described the relative density of each individual voxel element
in the scaffold mesh, thus allowing a true scaffold density to be calculated. Furthermore, regional
properties were also evaluated in two forms: 1) regional volume fractions (the scaffold volume as a
fraction of the total volume scanned), and 2) regional relative densities (the product of the volume
fraction and the corresponding voxel densities). The two forms of regional properties can be
interpreted such that, the volume fraction defines the space in which a cell can occupy, while the
relative density is associated with the specific rate of synthesis and scaffold degradation [Pek et al.,
2004].
Pore Geometry Assessment
To further explore the admissible space available for cells, 3D pore geometry was examined. A
purpose written algorithm was used to identify pore geometries by determining the equatorial and
polar boundaries of the non-solid space(s) at multiple angles rotated around the principal axes. The
unique intersections of these equatorial and polar centroids denote the centre of the scaffold pores.
The pore geometry was characterised in the form of an ellipsoidal volume, whereby
12
2
2
2
2
2
c
z
b
y
a
x
(1)
where a and b are the equatorial radii (along the x and y axes) and c is the polar radius (along the z-
axis). Note if all three radii are equal, the body is a sphere. Average pore sizes for a region were
used to define the mean, maximum and minimum values reported in Table 1. In addition to this 3D
ellipsoid method, a linear intercept length analysis [ et al. (2005)], was used to measure the
mean 2D pore sizes from multiple plane sections. Briefly, by identifying the frequency that a series
5
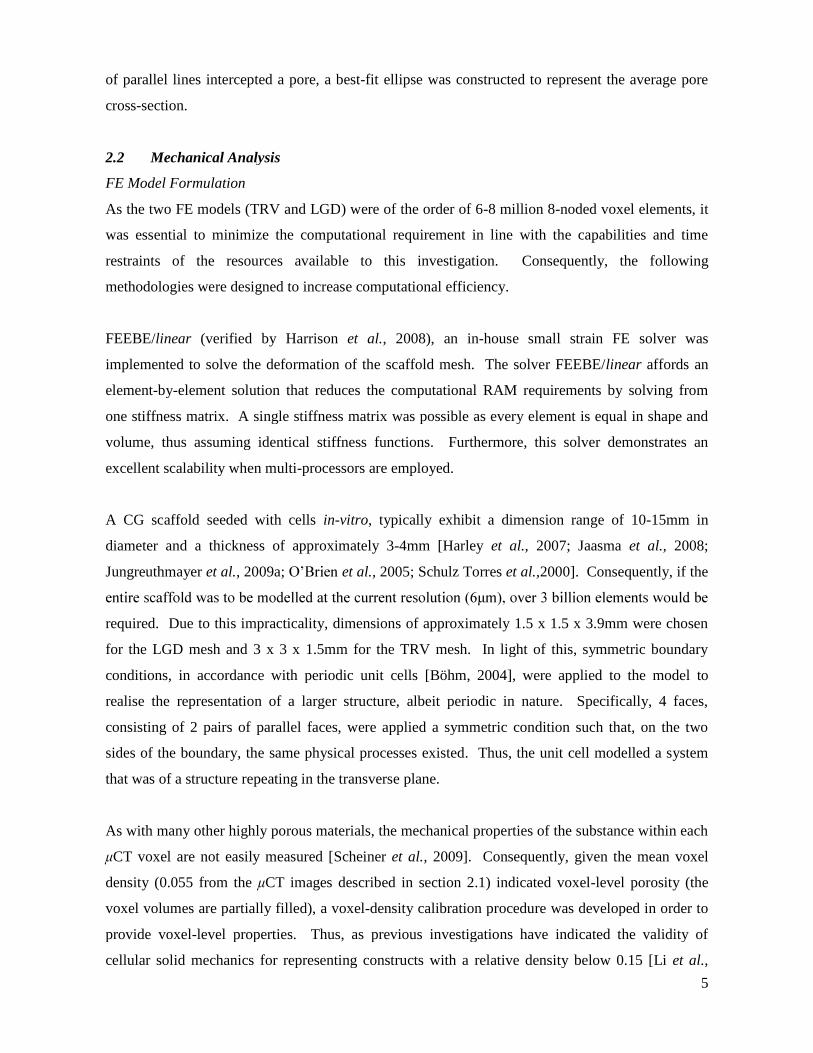
of parallel lines intercepted a pore, a best-fit ellipse was constructed to represent the average pore
cross-section.
2.2 Mechanical Analysis
FE Model Formulation
As the two FE models (TRV and LGD) were of the order of 6-8 million 8-noded voxel elements, it
was essential to minimize the computational requirement in line with the capabilities and time
restraints of the resources available to this investigation. Consequently, the following
methodologies were designed to increase computational efficiency.
FEEBE/linear (verified by Harrison et al., 2008), an in-house small strain FE solver was
implemented to solve the deformation of the scaffold mesh. The solver FEEBE/linear affords an
element-by-element solution that reduces the computational RAM requirements by solving from
one stiffness matrix. A single stiffness matrix was possible as every element is equal in shape and
volume, thus assuming identical stiffness functions. Furthermore, this solver demonstrates an
excellent scalability when multi-processors are employed.
A CG scaffold seeded with cells in-vitro, typically exhibit a dimension range of 10-15mm in
diameter and a thickness of approximately 3-4mm [Harley et al., 2007; Jaasma et al., 2008;
Jungreuthmayer et al., 2009a; et al., 2005; Schulz Torres et al.,2000]. Consequently, if the
required. Due to this impracticality, dimensions of approximately 1.5 x 1.5 x 3.9mm were chosen
for the LGD mesh and 3 x 3 x 1.5mm for the TRV mesh. In light of this, symmetric boundary
conditions, in accordance with periodic unit cells [Böhm, 2004], were applied to the model to
realise the representation of a larger structure, albeit periodic in nature. Specifically, 4 faces,
consisting of 2 pairs of parallel faces, were applied a symmetric condition such that, on the two
sides of the boundary, the same physical processes existed. Thus, the unit cell modelled a system
that was of a structure repeating in the transverse plane.
As with many other highly porous materials, the mechanical properties of the substance within each
CT voxel are not easily measured [Scheiner et al., 2009]. Consequently, given the mean voxel
density (0.055 from the CT images described in section 2.1) indicated voxel-level porosity (the
voxel volumes are partially filled), a voxel-density calibration procedure was developed in order to
provide voxel-level properties. Thus, as previous investigations have indicated the validity of
cellular solid mechanics for representing constructs with a relative density below 0.15 [Li et al.,

6
2003; Warren and Kraynik, 1997] and our voxels have a relative density of 0.055, the Gibson and
Ashby equation [Gibson, 2005] was employed. The voxel modulus Ev was related to the known
material modulus Em of a strut by,
m
s
vV EE
2
(2)
where Em = 5.28MPa [Harley et al., 2007] and 0550.s
v . Thus, EV was calculated to be
16.32kPa. This method enabled a relationship between an experimentally measured mechanical
property (the strut modulus) [Harley et al., 2007], and the representative voxels at this given scale-
level. Note, an homogeneous elastic modulus was assigned to all of the elements.
Mechanical Assessment
To investigate the apparent mechanics of the two FE models, a 1% compressive uniaxial strain in
the z-axis (see Figure 3 for axis conventions) was applied. This afforded a comparison between the
mid-region, as simulated by the TRV model, and the entire construct, as represented by the LGD
model. Additionally, an elastic modulus was calculated for each principal direction (Table 2).
Micro-mechanical Elastic Stability
The stress strain relationship of a CG scaffold under uniaxial compression can be described in
terms of three regimes: a linear elastic regime in which bending of the internal struts occur; a stress
plateau wherein a progressive collapse of the struts results from elastic buckling; and densification,
which corresponds to the subsequent impacting of the struts against one another [Gibson, 2005;
Harley et al., 2007]. Note the earliest indication of strut buckling occurs at the elastic buckling
stress. At this point of scaffold strain, a critical magnitude of microscopic stress exists within the
interconnecting strut-structure that defines the initiation of elastic buckling. Consequently, the
apparent elastic buckling stress of the entire scaffold, calculated to be 13.56Pa, was determined
using the offset method (0.2%) from the initial linear portion of the stress-strain curve [data
extracted from Harley et al. 2007]. Accordingly, at an apparent scaffold strain of 5.6%, the voxel-
level stresses were used as a criterion for microstructural failure.
- -architecture of the load-bearing structures within the scaffold (see
Figure 4), a critical elastic stress magnitude, cr, was defined in accord with plate mechanics
[Bulson, 1970] such that,
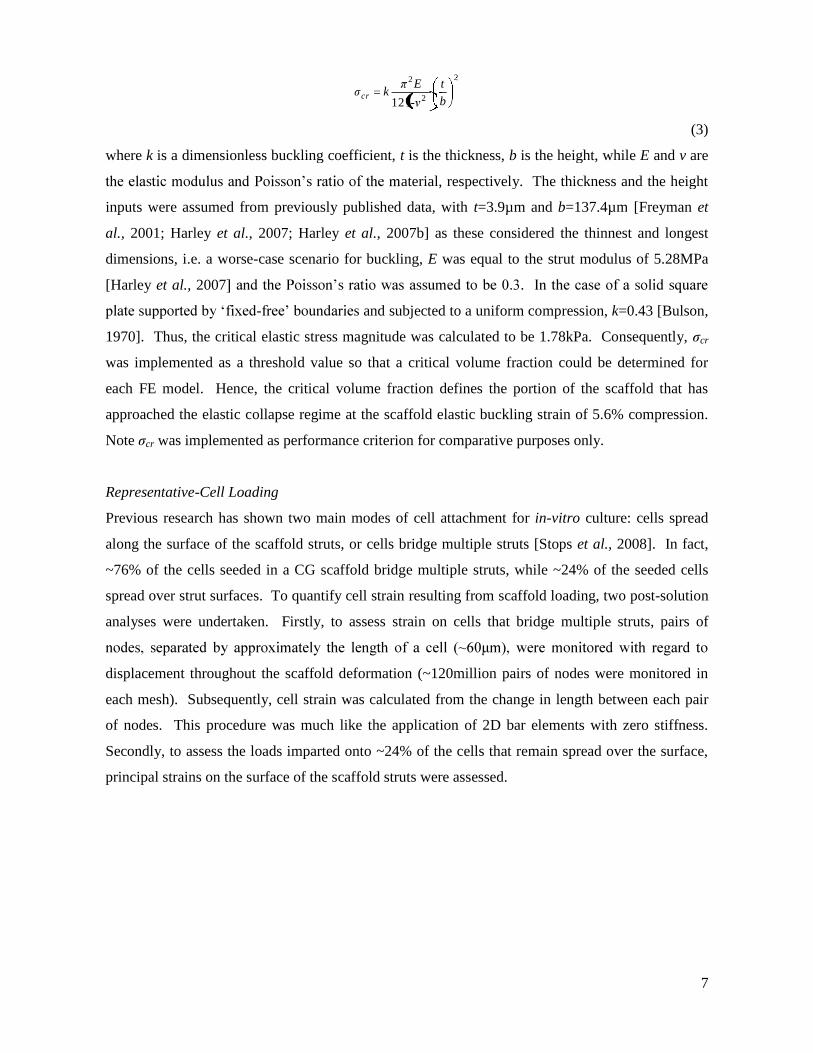
7
2
2
2
112 b
t
-
Ekcr
(3)
where k is a dimensionless buckling coefficient, t is the thickness, b is the height, while E and v are
aterial, respectively. The thickness and the height
inputs were assumed from previously published data, with t=3.9µm and b=137.4µm [Freyman et
al., 2001; Harley et al., 2007; Harley et al., 2007b] as these considered the thinnest and longest
dimensions, i.e. a worse-case scenario for buckling, E was equal to the strut modulus of 5.28MPa
[Harley et al., 2007
- and subjected to a uniform compression, k=0.43 [Bulson,
1970]. Thus, the critical elastic stress magnitude was calculated to be 1.78kPa. Consequently, cr
was implemented as a threshold value so that a critical volume fraction could be determined for
each FE model. Hence, the critical volume fraction defines the portion of the scaffold that has
approached the elastic collapse regime at the scaffold elastic buckling strain of 5.6% compression.
Note cr was implemented as performance criterion for comparative purposes only.
Representative-Cell Loading
Previous research has shown two main modes of cell attachment for in-vitro culture: cells spread
along the surface of the scaffold struts, or cells bridge multiple struts [Stops et al., 2008]. In fact,
~76% of the cells seeded in a CG scaffold bridge multiple struts, while ~24% of the seeded cells
spread over strut surfaces. To quantify cell strain resulting from scaffold loading, two post-solution
analyses were undertaken. Firstly, to assess strain on cells that bridge multiple struts, pairs of
displacement throughout the scaffold deformation (~120million pairs of nodes were monitored in
each mesh). Subsequently, cell strain was calculated from the change in length between each pair
of nodes. This procedure was much like the application of 2D bar elements with zero stiffness.
Secondly, to assess the loads imparted onto ~24% of the cells that remain spread over the surface,
principal strains on the surface of the scaffold struts were assessed.

8
í λ«´¬
Volume Fraction and Relative Density
The volume fraction and the relative density measurements of the two meshes compared well with
previously published data [Harley et al., 2007; Nehrer et al., 1997 et al., 2005].
Specifically, the TRV model volume fraction exhibited a value of 0.12, while the LGD model
demonstrated 0.16 (Table 1); Nehrer et al. (1997) measured a volume fraction of 0.13-0.17. While
the mean relative densities of 0.0059 and 0.0096 (Table 1), for the TRV and the LGD models
respectively, compare well with the value of 0.0058 measured by Harley et al. (2007). However, on
a regional basis, there appeared to be a substantial variation, up to 10% difference in some cases,
between the pan-side and the air-side (Figure 5a). At ~1mm below the air-side region (regions 7-8
in Figure 5a), the volume fraction was highest, while at approximately 1mm above the pan-side
region (region 3 in Figure 5a), the volume fraction was the lowest. This trend continues when
examined in terms of relative density: the TRV model and the LGD model have similar mean
relative densities (Table 1), but the highest relative density occurs in the regions proximal to the air-
side (regions 8 and 9 in Figure 5b), while the lowest relative density was found just above the pan-
side (region 3 in Figure 5b) in the in LGD model.
Pore Architecture
The mean pore sizes corresponded well with previous data for this type of CG scaffold [Harley et
al., 2007; Brien et al., 2005]. Specifically, with a mean pore sizes (TRV)
(LGD) et
al. (2005) et al. (2005), a
s measured for the transverse region, which concurs with the
ly observed in a CG
scaffold [Harley et al., 2007]. However, it is important to note that these particular CG scaffolds
measured by Harley et al. (2007) had much higher densities than the ones modelled in this
investigation. Yet as the maximum density measured in this investigation is comparable with the
average relative density in the aforesaid study (0.0103 from Table 1, compared to 0.012 from
Harley et al. 2007), it is likely that the occurrence of these large holes is density dependent.
Apparent Mechanics
The elastic moduli of ~135Pa (TRV) and ~392Pa (LGD) compared well with that of previously
data: ~206Pa [Harley et al., 2007], ~40Pa (140 et al., 2001], ~500Pa
[Haugh et al., 2008]. As seen from Table 2, the variation observed between the three principal

9
elastic moduli is consistent for both models, i.e. Ex and Ey are approximately 60% of Ez. Thus, CG
scaffold anisotropy is consistent.
The principal stress distribution and the displacements within the LGD model is shown to be much
more heterogeneous than the TRV model (Figure 6 and 7). The stress contours demonstrate distinct
stress concentrations within the LGD model, whereas the TRV model displays much less variance
(Figure 6). Also, the displacement magnitudes (Figure 7) show the LGD model to experience a
pronounced magnitude variance, as shown by the displacement range. Furthermore, not only are
the stress magnitudes much more widely spread in the LGD model, but the mean principal stress of
-156.53 ±228.71Pa is a significantly (p<0.001) higher magnitude of compression than the -58.19
±120.21Pa calculated for the TRV model (for an apparent compressive strain of 5.6%).
Micro-mechanical Elastic Stability
The critical volume fraction that exceeded the critical elas cr (for an apparent compressive
strain of 5.6%) differed for the two FE models (Figure 9). Approximately 0.2% of the total LGD
model experienced an elastic stress above 1.78kPa, whereas the TRV model had 0.02% of its total
solid part exceeding the critical elastic value.
high stress: the region that experienced the highest percentage of stress magnitudes above the
critical elastic stress value was the pan-side (1.64% of solid above cr); the second highest
percentage was the air-side region (0.75% above cr); and the third highest region was ~1mm below
the air-side region (0.46% above cr). Consequently, the potential for elastic instability varied in a
regional-level basis within the LGD model.
Inferred Cell Loading
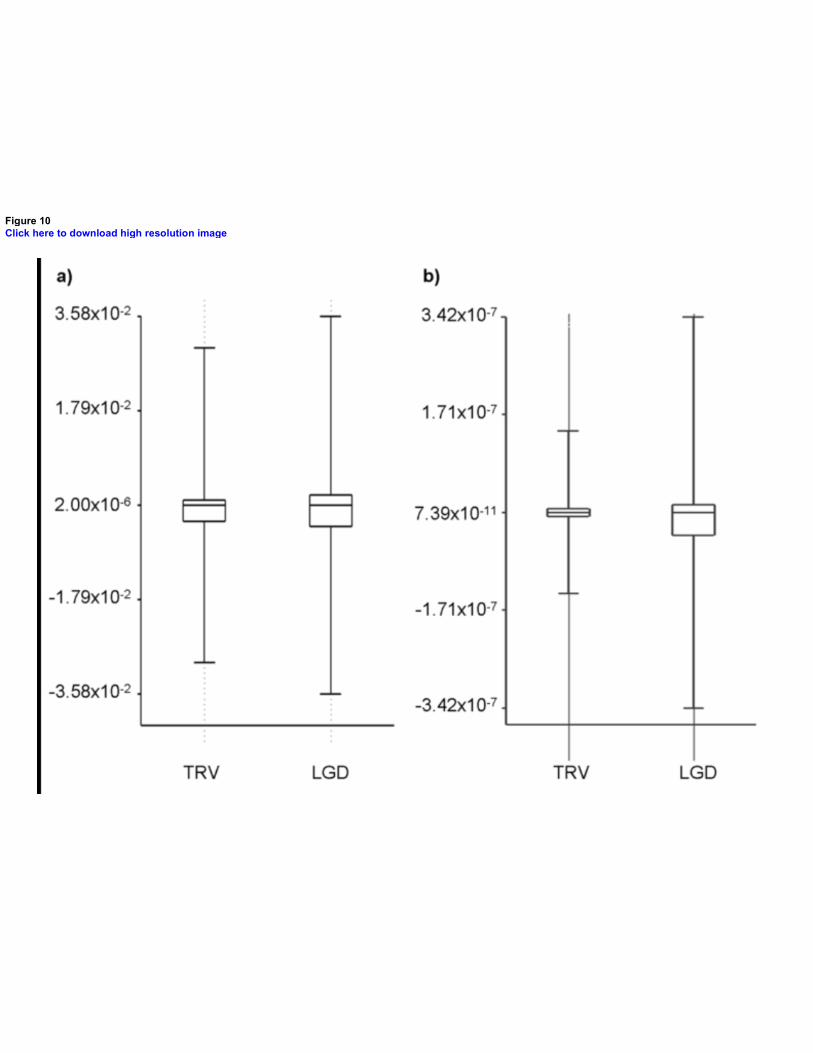
The cell strains for an apparent scaffold compressive strain of 1%, were found to be normally
distributed, for both the surface cells and the strut-bridging cells in both of the two FE models.
From Figure 10, the attachment type greatly influenced the strain on the cells. Namely, the strut-
bridging cells underwent much larger strains with much more variety than the surface cells (Figure
10a and 10b). In terms of mean cell strain, the surface cells experienced a strain very close to zero;
-4.17x10⁻⁷% and -2.06x10⁻⁶% for the TRV and the LGD model respectively, while the mean strain
on the strut-bridging cells was much higher with values of -0.176% and -0.155%, for the TRV and
the LGD respectively.

10
While there was a minimal disparity between the TRV and the LGD models in strain on the surface
cells (Figure 10a), the two FE models did produce different strain levels in the strut-bridging cells
(Figure 10b). Although the TRV and the LGD models imparted similar mean strains, -0.176% and
-0.155%, the range of strains were very different: the TRV model exerted a range of -16 to 15%,
while the LGD model range was much larger, -35 to 28%.

11
ì Ü·½«·±²
This investigation employed a multi-scale methodology to assess the salient architectural and
mechanical features of a CG scaffold. From µCT characterisation, the unique implementation of
large-scale FE analysis (models had in excess of 6-7 million elements) allowed the mechanical
response of the CG scaffold to be realised via symmetric boundary conditions. The accumulation of
these procedures allowed localised micro-mechanics to be evaluated, e.g. cell-level strains and
macro-mechanical properties, so that an understanding of how regional level characteristics within a
CG scaffold may influence the function of the seeded cells.
Procedural Limitations
Unlike studies that have modelled small regions of interest [Lacroix et al., 2006; Sandino et al.,
2008], the work herein modelled a substantial volume and to provided a region-to-region account of
mechanics. However, the use of 6µm FE meshes meant that some of the sub-micron microstructure
was omitted. Although sub-micron meshes are available, they do not permit modelled volumes in
excess of 100 x 100 x 100µm dimensions due to current computational and imaging capabilities.
Furthermore, from Figure 2, it is evident that the major components responsible for structural
integrity can be captured from resolutions above micron level. Furthermore, recent work by
Jungreuthmayer et al. (2009a) and Jungreuthmayer et al. (2009b) corroborated the current
resolution (6 ) by accurately modelling fluid dynamics in a CG scaffold. Thus, w
resolution may have omitted the very thin struts seen in Figure 2, these thin struts can be considered
relatively un-influential to the overall mechanics. Therefore, given that the major load-bearing
structures were successfully represented, i.e. pore size and strut spacing, which in turn meant that
the structures to which the cells attached were represented, and the many metrics that matched
previous data,
investigation.
In reality, an in-vitro CG scaffold is submersed in an aqueous medium. Consequently, in a cyclical
strain environment, fluid movement could deform the microstructure of a porous material; this
fluid-solid interaction was not modelled herein. However, previous studies have shown interstitial
fluid flow within porous materials to have a minimal influence on apparent modulus when the
<5%) [Dawson et al., 2008]. Furthermore, as the lowest flow rates are
typically observed at the strut surfaces of porous materials [Porter et al.,2005, the influence of the
inertial forces on mechanical deformation can be expected to be minimal [Comiti et al., 2000].
Consequently, the simulation of low apparent strains justifies a solid mechanics approach for
12
modelling a CG scaffold; the low apparent strains also justifies the use of small strain kinematics as
there was no significant volume of the material that underwent large local strains.
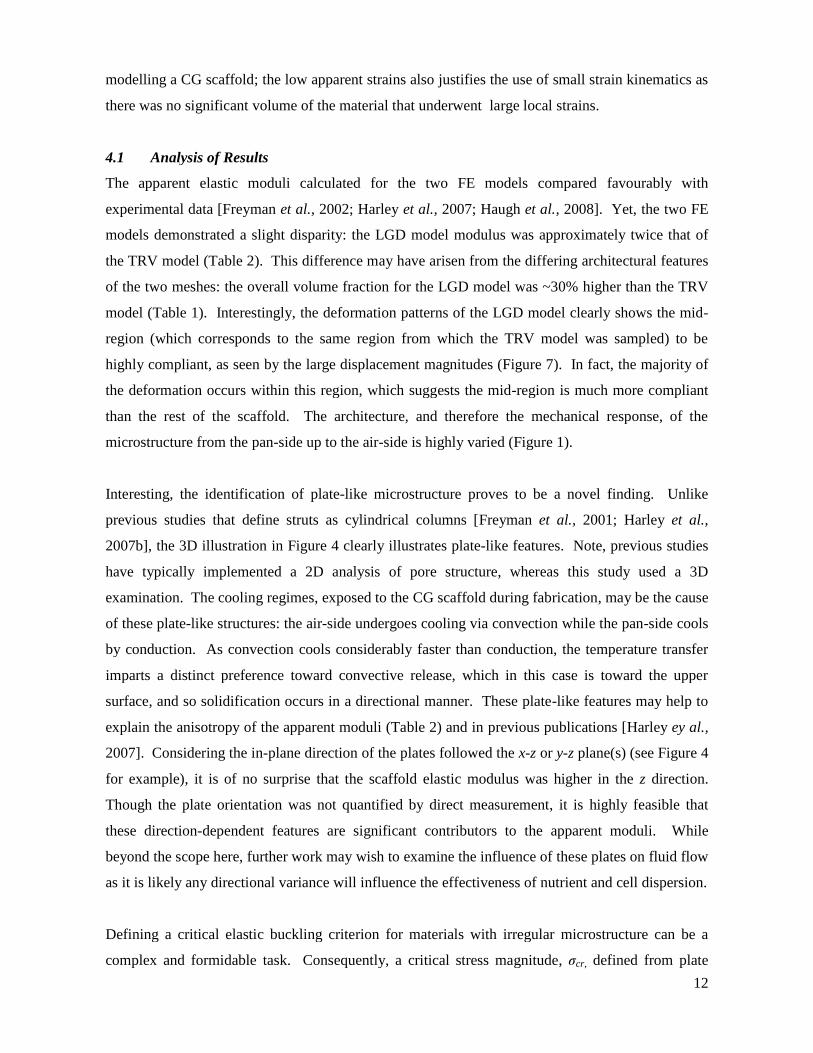
4.1 Analysis of Results
The apparent elastic moduli calculated for the two FE models compared favourably with
experimental data [Freyman et al., 2002; Harley et al., 2007; Haugh et al., 2008]. Yet, the two FE
models demonstrated a slight disparity: the LGD model modulus was approximately twice that of
the TRV model (Table 2). This difference may have arisen from the differing architectural features
of the two meshes: the overall volume fraction for the LGD model was ~30% higher than the TRV
model (Table 1). Interestingly, the deformation patterns of the LGD model clearly shows the mid-
region (which corresponds to the same region from which the TRV model was sampled) to be
highly compliant, as seen by the large displacement magnitudes (Figure 7). In fact, the majority of
the deformation occurs within this region, which suggests the mid-region is much more compliant
than the rest of the scaffold. The architecture, and therefore the mechanical response, of the
microstructure from the pan-side up to the air-side is highly varied (Figure 1).
Interesting, the identification of plate-like microstructure proves to be a novel finding. Unlike
previous studies that define struts as cylindrical columns [Freyman et al., 2001; Harley et al.,
2007b], the 3D illustration in Figure 4 clearly illustrates plate-like features. Note, previous studies
have typically implemented a 2D analysis of pore structure, whereas this study used a 3D
examination. The cooling regimes, exposed to the CG scaffold during fabrication, may be the cause
of these plate-like structures: the air-side undergoes cooling via convection while the pan-side cools
by conduction. As convection cools considerably faster than conduction, the temperature transfer
imparts a distinct preference toward convective release, which in this case is toward the upper
surface, and so solidification occurs in a directional manner. These plate-like features may help to
explain the anisotropy of the apparent moduli (Table 2) and in previous publications [Harley ey al.,
2007]. Considering the in-plane direction of the plates followed the x-z or y-z plane(s) (see Figure 4
for example), it is of no surprise that the scaffold elastic modulus was higher in the z direction.
Though the plate orientation was not quantified by direct measurement, it is highly feasible that
these direction-dependent features are significant contributors to the apparent moduli. While
beyond the scope here, further work may wish to examine the influence of these plates on fluid flow
as it is likely any directional variance will influence the effectiveness of nutrient and cell dispersion.
Defining a critical elastic buckling criterion for materials with irregular microstructure can be a
complex and formidable task. Consequently, a critical stress magnitude, cr, defined from plate

13
buckling mechanics, was implanted as a threshold for elastic instability. From the fraction of the
scaffold above the critical elastic stress magnitude, the critical volume fraction, the LGD model
proved prone to microstructural buckling compared to the TRV model (Figure 9). In fact, the
potential for buckling, as interpreted by the critical volume fraction, is an order of magnitude
greater in the LGD model. Interestingly, a regional-level variance indicated a heightened potential
for elastic buckling in the periphery (the air-side and the pan-side of the LGD model). The
architectural features of the peripheries are clearly distinct: the air-side region has elongated
elliptical pores (Figure 1a), the intermediate mid-region has relatively equiaxed spherical pores
(Figure 1b) and the pan-side has an irregular network of struts (Figure 1c). Hence, the elongated
elliptical pores and the irregular strut network of the air-side and the pan-side, respectively, are less
conducive to stress dissipation than the intermediate mid-region (the spherical pores of the mid-
region dissipate stress evenly via bending, compression and tension, while conversely the columns
or plates of the air-side axially compress causing localised hotspots at strut junctions, and the
irregular network within the pan-side has disconnected and incoherent struts causing high stress
localisations).
The regional architecture also influenced the predicted cell strains (Figure 10): the LGD model
imparted a maximum strain over two times higher than the TRV model for surface cells, while also
imparting a maximum strain again almost two times higher than the TRV model for strut-bridging
cells. These cell strains compare well with CG scaffold data [Isaksson et al., 2006; Lacroix et al.,
2006; Stops et al., 2008]. For example, Lacroix et al. (2006) also found surfaces strains to be close
to zero, while Stops et al. (2008) predicted a similarly large range of cell strains for cells bridging
struts (-26% to 49%). As with the conclusions made by Stops et al. (2008), two distinct
mechanisms influence cell strain: the strain on cells elongated along single struts are dependent on
scaffold surface strain, while secondly, the strain on cells bridging across struts are dictated by a
hinge-like re-arrangement of the scaffold microstructure. Thus, the strut-bridging cells are hugely
sensitive to the cell length to pore size ratio and it is therefore likely that any changes to the pore
dimensions will greatly affect cell strain. Importantly, the strut bridging cells represent 76% of the
seeded cells in a CG scaffold [Stops et al., 2008], and so the strain on these cells are arguably the
most representative of a cell population. So, it is important to note that the mean strains on the strut
bridging cells undergwent 1/10th of the apparent scaffold strain. Furthermore, the typically range of
strains experienced by these cells demonstrates -1.24 to 0.89% for the TRV model and -1.40 to
1.09% for the LGD model for 1% compression of the scaffold 95%
interval calculated from the mean and the standard deviation). Thus, the LGD model imparted a
larger maximum strain and a larger range of strains on the cell population that the TRV model.

14
Finally, the LGD model demonstrated different volume fractions and different relative densities
compared to the TRV model (Table 1). While the relative densities of the TRV model concurred
with previous experiments, the LGD model had a relative density some 50% higher [Harley et al.,
2007]. This disparity may arise due to localised hotspots of high density within the LGD model.
Given that this LGD relative density is comparable to the density measured for larger pore size CG
scaffolds [Harley et al., 2007], it is likely that these hotspots are a product of the fabrication
process. The volume fractions of 0.12 and 0.16, TRV and LGD respectively, did however both
concur with experimental data of 0.13-0.17 [Nehrer et al., 1997]. Importantly, these two descriptors
define two cell characteristics: cell movement and fluid flow patterns, as defined by the local
volume fraction, and cell synthesis and scaffold degradation rates, as defined by the local relative
densities. From the results, it appears that within either the air-side or the pan-side, cell movement
and fluid flow may be highest as these two areas demonstrated the lowest volume fraction (regions
1-4 and 10 in Figure 5a). Conversely, the mid-region appears to have the highest relative densities
(regions 6-9 in Figure 5b), thus suggesting relatively slow synthesis and degradation rates. The
impact of these regional variances on localised tissue growth is unknown. However, on a scaffold-
level, previous investigations have demonstrated that scaffold volume fraction can influence cell
infiltration: the larger the pore size (lower volume fraction) the more the cells disperse throughout
the scaffold due the increased fluid movement [Byrne et al., 2008; Tierney et al., 2008]; though
interestingly without fluid influences, and when contact guidance is measured (cell motility along
scaffold struts), cells migrate less in larger pores (151µm to 96µm) [Harley et al., 2008]. Similarly,
biosynthesis and degradation rates have also been shown to vary according to scaffold properties,
such as cross-link densities and stiffness, which in part is related to relative density [Chevallay et
al., 2000; Lee et al., 2001; Petite et al., 1994; Powell et al., 2006; Vickers et al., 2006; Weadcock et
al., 1996]. Thus, it is likely the regional variances do impact on cell activity and tissue growth.
Further work should look to explore and quantify the influence of these CG scaffold characteristics
on tissue growth patterns.
15
ë ÝÑÒÝÔËÍ×ÑÒÍ
This investigation has examined the salient mechanical and architectural characteristics of a CG
scaffold. The findings suggest that a regional-level environment exists within a CG scaffold. For
example, the intermediate region (TRV) exhibited a lower structural modulus (~40%), a lower
volume fraction (~30%), a lower relative density (~38%) but a larger average pore size (~25%),
compared to the entire scaffold (LGD). Regional level cell strain also occurred: the entire scaffold
(LGD) imparted a higher maximum strain (~200%) and a much more diverse range of strains than
the intermediate region alone (TRV). Yet, to what extent these regional variances influence
localised tissue growth is uncertain and future studies may wish to explore this avenue further by
sampling specific regions of interest. However, we can speculate that the regional architectural and
mechanical characteristics will influence cell differentiation and proliferation rates. While the
mechanical stimuli imparted onto the cells via the micro-mechanical deformation of the scaffold
will vary from region to region, it is also likely that the architectural variances will impact on fluid
flow. Without an in-depth analysis of cell activity within each region, the potential for
homogeneous tissue grown from a CG scaffold cannot be fully appreciated.
This study has provided a platform for future studies to generate idealised computational models
based on the geometric and mechanical descriptors found herein. Furthermore, this investigation
offers current in-vitro mechanical stimulation protocols a better understanding of micro-mechanical,
or cell-level, deformation magnitudes. As the intermediate mid-region demonstrated the most
homogeneous environment, future in-vitro procedures may wish to either adjust the manufacturing
process to deliver an entire construct in line with the intermediate mid-region, or alternatively,
isolate the intermediate mid-region for cell culture.
Acknowledgements
Funding for this work was provided by the Programme for Research in Third Level Institutions
(PRTLI), administered by the Higher Education Authority (HEA) and a SFI Foundation Ireland
on the SGI Altix high performance computer at NUI, Galway under an academic license from Intel
Fortran, Inc. Furthermore, the authors wish to acknowledge the SFI/HEA Irish Centre for High-
End Computing (ICHEC) for the provision of computational facilities and support.
ê ÎÛÚÛÎÛÒÝÛÍ
Böhm H.J, (2004). A Short Introduction to Continuum Micromechanics; inMechanics of Microstructured Materials (Ed.: H.J.Böhm) 1-40; CISM Courses andLectures Vol.464, Springer-Verlag, Vienna.
Bulson PS, (1970. and Windus: London: 104-168.
, (2008). Gene expression by marrow stromal cells in aporous collagen glycosaminoglycan scaffold is affected by pore size and mechanicalstimulation. Journal of Materials Science: Material Medicine; 19: 3455 3463.
Causa F, Netti PA, Ambrosio L (2007). A multi-functional scaffold for tissueregeneration: The need to engineer a tissue analogue. Biomaterials; 28(34): 5093-5099.
Chamberlain LJ, Yannas IV, Hsu HP, Strichartz G, Spector M (1998). Collagen-GAG substrate enhances the quality of nerve regeneration through collagen tubes upto level of autograft. Experimental Neurology; 154(2): 315 29.
Chang AS, Yannas IV (1992). Peripheral nerve regeneration. In: Smith B, AdelmanG, editors. Encyclopedia of neuroscience:. Boston: Birkhauser: 125 6.
Chevallay B, Abdul-Malak N, Herbage D (2000). Mouse fibroblasts in long-termculture within collagen three-dimensional scaffolds: influence of crosslinking withdiphenylphosphorylazide on matrix reorganization, growth, and biosynthetic andproteolytic activities. Journal of Biomedical Materials Research; 49: 448 59.
Comiti J, Sabiri N, and Montillet A (2000) of FlowRegimes in Various Porous Mediafor Newtonian and Purely Viscous Non- hemical EngineeringScience; 55: 3057 3061.
Dawson JI, Wahl DA, Lanham SA, Kanczler JM, Czernuszka JT, Oreffo ROC (2008).Development of specific collagen scaffolds to support the osteogenic andchondrogenic differentiation of human bone marrow stromal cells. Biomaterials; 29:3105 3116.
Farrell E, Prendergast PJ, O'Brien FJ, Campbell VA (2006). Temporal expression ofosteogenic markers in mesenchymal stem cells when cultured in monolayer and oncollagen glycosaminoglycan scaffolds. Journal of Biomechanics; 39(1): S215.
Freyman TM, Yannas IV, Pek Y-S, Yokoo R, Gibson LJ (2001). Micromechanics offibroblast contraction of a collagen-GAG matrix. Experimental Cell Research; 269:140-153.
Freyman TB, Yannas IV, Yokoo R, Gibson LJ (2002). Fibroblast contraction of acollagen-GAG matrix. Experimental Cell Research; 272: 153 162.
λº»®»²½»Ý´·½µ ¸»®» ¬± ª·»© ´·²µ»¼ λº»®»²½»
Gibson LJ (2005). Biomechanics of Cellular Solids. Journal of Biomechanics; 38:377 399.
Gotterbarm T, Niska J, Capito RM, Vickers SM, Spector M (2007). P115 IGF-1gene-supplemented type II collagen scaffolds for mesenchymal stem cell-drivenchondrogenesis in vitro. Osteoarthritis and Cartilage; 15(2): B116.
Harley BA, Leung JH, Silva E, Gibson LJ (2007). Mechanical characterization ofcollagen-glycosaminoglycan scaffolds. Acta Biomaterialia; 3: 463 474.
Harley BA, Freyman TM, Wong MQ, Gibson LJ (2007b). A New Technique forCalculating Individual Dermal Fibroblast Contractile Forces Generated withinCollagen-GAG Scaffolds. Biophysical Journal; 93: 2911 2922.
Harley BA and Gibson LJ (2008). In vivo and in vitro applications of collagen-GAGscaffolds. Chemical Engineering Journal; 137: 102 121.
Harley BAC, Kim H-D, Zaman MH, Yannas IV, Lauffenburger DA, Gibson LJ(2008). Microarchitecture of Three-Dimensional Scaffolds Influences Cell MigrationBehavior via Junction Interactions. Biophysical Journal; 95: 4013 4024.
Harrison NM, McDonPE (2008). Heterogeneous linear elastic trabecular bone modelling using micro-CTattenuation data and experimentally measured heterogeneous tissue properties.Journal of Biomechanics, 41(11), 2589-2596.
(2009). The effect of dehydrothermal treatmenton the mechanical and structural properties of collagen-GAG scaffolds. Journal ofBiomedical Materials Research A: 89(2):363-9.
Hollister SJ, Maddox RD, Taboas JM (2002). Optimal design and fabrication ofscaffolds to mimic tissue properties and satisfy biological constraints. Biomaterials;23: 4095 4103.
Homminga J, Huiskes R, Van Rietbergen B, Ruegsegger P, Weinans H (2001).Introduction and evaluation of a gray-value voxel conversion technique. Journal ofBiomechanics; 34: 513 517.
Ignatius A, Blessing H, Liedert A, Schmidt C, Neidlinger-Wilke C, Kaspar D,Friemert B, Claes L (2005). Tissue Engineering of Bone: Effects of Mechanical Strainon Osteoblastic Cells in Type, I. Collagen Matrices. Biomaterials; 26: 311 318.
Isaksson H, Donkelaar CCv, Huiskes R, Ito K (2006). Corroboration of mechano-regulatory algorithms for tissue differentiation during fracture healing: comparisonwith in vivo results. Journal of Orthopaedic Research; 24(5): 898 907.
(2008). Design and validation of a dynamicflow perfusion bioreactor for use with compliant tissue engineering scaffolds. Journalof Biotechnology; 133: 490 496.
Jacobs CR, Davis BR, Rieger CJ, Francis JJ, Saad M, Fyhrie DP (1999). The impactof boundary conditions and mesh size on the accuracy of cancellous bone tissuemodulus determination using large-scale finite-element modelling. Journal ofBiomechanics; 32: 1159-1164.
Jungreuthmayer C, Donahue SW, Jaasma MJ, Al-Munajjed AA, Zanghellini J, Kelly(2008). A Comparative Study of Shear Stresses in Collagen-
Glycosaminoglycan and Calcium Phosphate Scaffolds in Bone Tissue-EngineeringBioreactors. Tissue Engineering: Part A; 14(00).
Jungreuthmayer C, Jaasmaa MJ, Al-Munajjeda AA, Zanghellinid J, Kelly DJ,-GAG
scaffold in a flow perfusion bioreactor using a sequential 3D CFD-elastostatics model.Medical Engineering & Physics; 31: 420 427.
Lacroix D, Chateau A, Ginebra M-P, Planell JA (2006). Micro-finite element modelsof bone tissue-engineering scaffolds. Biomaterials; 27: 5326 5334.
Ladd AJC, Kinney JH (1998). Numerical errors and uncertainties in finite-elementmodeling of trabecular bone. Journal of Biomechanics; 31: 941-945.
Lee CR, Grodzinsky AJ, Spector M (2001). The effects of cross-linking of collagen-glycosaminoglycan scaffolds on compressive stiffness, chondrocyte-mediatedcontraction, proliferation and biosynthesis. Biomaterials; 22(23): 3145-3154.
Li K, Gao X-L, Roy AK (2003). Micromechanics model for three-dimensional open-cell foams using a tetrakaidecahedral unit cell and Castigliano's second theorem.Composites Science and Technology; 63(12): 1769-1781.
McMahon LA, Reid AJ, Campbell VA, Prendergast PJ (2008). Regulatory Effects ofMechanical Strain on the Chondrogenic Differentiation of MSCs in a Collagen-GAGScaffold: Experimental and computational Analysis. Annals in BiomedicalEngineering; 36(2): 185 194.
Meyer U, Kruse-L¨osler B, Wiesmann HP (2006). Principles of bone formationdriven by biophysical forces in craniofacial surgery. British Journal of Oral andMaxillofacial Surgery; 44(4): 289-295.
Nehrer S, Breinan HA, Ramappa A, Young G, Shortkroff S, Louie LK, Sledge CB,Yannas IV, Spector M (1997). Matrix collagen type and pore size influencebehaviour of seeded canine chondrocytes. Biomaterials; 16: 769-776.
(2004). Influence of freezing rate onpore structure in freeze-dried collagen-GAG scaffolds. Biomaterials; 25: 1077 1086.
(2005). The effect of pore size on celladhesion in collagen-GAG scaffolds. Biomaterials; 26: 433 441.

Pek YS, Spector M, Yannas IV, Gibson LJ (2004). Degradation of a collagenchondroitin-6-sulfate matrix by collagenase and by chondroitinase. Biomaterials; 25:473 482.
Petite H, Frei V, Huc A, Herbage D (1994). Use of diphenylphosphorylazide forcross-linking collagen-based biomaterials. Journal of Biomedical Materials Research;28: 159 65.
Pfeiffer E, Vickers SM, Frank E, Grodzinsky AJ, Spector M (2008). The effects ofglycosaminoglycan content on the compressive modulus of cartilage engineered intype II collagen scaffolds. Osteoarthritis and Cartilage; 16(10): 1237-1244.
Porter B, Zauel R, Stockman H, Guldberg R, Fyhrie D (2005). 3-D computationalmodeling of media flow through scaffolds in a perfusion bioreactor. Journal ofBiomechanics; 38: 543 549.
Powell HM, Boyce ST (2006). EDC cross-linking improves skin substitute strengthand stability. Biomaterials; 27: 5821 5827.
Scheiner S, Sinibaldi R, Pichler B, Komlev V, Renghini C, Vitale-Brovarone C,Rustichelli F, Hellmich C, (2009). Micromechanics of bone tissue-engineeringscaffolds, based on resolution error-cleared computer tomography. Biomaterials;30(12): 2411-2419.
Sandino C, Planell JA, Lacroix D. A finite element study of mechanical stimuli inscaffolds for bone tissue engineering. Journal of Biomechanics 2008; 41(5): 1005-1014.
Schulz Torres D, Freyman T, Yannas I, Spector M. Tendon cell contraction ofcollagen-GAG matrices in vitro: effect of crosslinking. Biomaterials 2000; 21: 160719.
endergast PJ, McHugh PE (2008). AFinite Element Prediction of Strain on Cells in a Highly Porous Collagen-Glycosaminoglycan Scaffold. Journal of Biomechanical Engineering; 130(6): 1001-1011.
(2008). Osteoblast activity on collagen-GAGscaffolds is affected by collagen and GAG concentrations. Journal of BiomedicalMaterials Research Part A; 2(2): 202-209.
Vickers SM , Squitieri LS, Spector M (2006). Effects of Cross-linking Type IICollagen-GAG Scaffolds on Chondrogenesis In Vitro: Dynamic Pore ReductionPromotes Cartilage Formation. Tissue Engineering; 12(5): 1345 -1355.
Warren WE, and Kraynik AM (1997). The linear elastic behavior of a low-densityKelvin foam with open cells. ASME Journal of Applied Mechanics; 64: 787 795.

Weadcock KS, Miller EJ, Keuffel EL, Dunn MG (1996). Effect of physicalcrosslinking methods on collagen-fiber durability in proteolytic solutions. Journal ofBiomedical Materials Research; 32: 221 6.
Yannas IV (2001). Tissue and organ regeneration in adults. New York: Springer.
Yannas IV, Lee E, Orgill DP, Skrabut EM, Murphy GF (1989). Synthesis andcharacterization of a model extracellular matrix that induces partial regeneration of adultmammalian skin. Procedures of National Academic Science USA; 86(3): 933 7.
Figure 1. A CG scaffold has regional architectural characteristics due to the manufacturing technique. The aboveSEM images highlight the three significant regions referred to throughout this investigation with a) the air-side layer, b)the intermediate mid-region and c) the pan-side region. All images were taken from a dry CG Scaffold samplefabricated at a freeze drying temperature of -40oc.
Figure 2. An SEM study was undertaken to highlight the micro-structural dimensions of a CG scaffold. Aboveshows a sequential series of zoomed-in images taken from the intermediate region of the scaffold. Selections of strutthicknesses are indicated within images b, c and d. Also, tellipse for images b and c; note a typical cell scaled to fit image d was too large to fit within the image dimensions.
Figure 3. Two unit cell FE models were constructed so that the architectural variances observed between the air-sideand the pan-side of a CG scaffold could be examined. Accordingly, the TRV model corresponded to a region takenfrom the intermediate mid-region in the transverse plane (x-y), whereas the LGD model represented the architecture ofboth the air- and pan-side by detailing the scaffold along the entire longitudinal axis (z). Note all the subsequent FEanalyses follow the same axis conventions stated here and represent a uniaxial compressive strain in the z direction.
Figure 4. Two sections extracted from the LGD model displaying te-like configuration of the microstructureas signified by the highlighted surfaces.
Figure 5. The regional characteristics of the CG scaffold from the LGD model mesh are defined here in terms of a)the volume fraction and b) the density relative to pure collagen. The vertical axes denote the region from which thedata expresses; the corresponding region number refers to the region in the vertical axis of the model from which thedata expresses; note region 1 relates to the most pan-side region, while region 10 refers to the most air-side region.Note the images adjacent to the vertical axes depict the corresponding regions within the CG scaffold (i.e. the air -sidecorresponds to region 10: volume fraction = 0.1539; relative density = 0.0096).
Figure 6. The maximum principal stresses (Pa) are depicted for a) the TRV model and, b) the LGD model for anapparent uniaxial compressive strain of 1% along the z axis.
Figure 7. The total displacement magnitudes, i.e. square root(ux2 + uy
2 + uz2), (µm) experienced for a) the TRV
model and b) the LGD model for an apparent uniaxial compressive strain of 1% in the z axis (the maximumdisplacement corresponds to the respective 1% strain). Note, for an homogeneous, isotropic solid material, thedisplacement contours would display horizontal iso-bands.
Figure 8. The peak principal stress distributions are depicted as a fraction of the scaffold solid for both the TRVmodel and the LGD model for an apparent uniaxial compressive strain of 5.6% in the z axis. A comparison of themeans showed a significant (p<0.001) difference between the LGD and the TRV model respectively.
Figure 9. The number of voxels that exceed the pre-defined critical stress magnitude of 1.78kPa is depicted as a) theregional volume fraction in the TRV model and b) the regional volume fraction in the LGD model. For both models,an apparent uniaxial compressive strain of 5.6% along the z axis was applied. The vertical axis numbers (1-10)correspond to the contiguous regions in the adjacent image, i.e. region 1 relates to the most pan-side region and region10 refers to the most air-side region.
Figure 10. The inferred cells strains are depicted here as boxplots for a) the cells cross-bridging multiple struts and,b) the cells spread along a single strut surface. Both the TRV and the LGD model were given an apparent uniaxialcompressive strain of 1% strain along the z axis. Note the above boxplots are for illustrative purposes only as themaximum and minimum values depicted by the whiskers of the boxplots are the statistical maximum and minimumvalues, not the actual maximum and minimum values quoted within the text. The dots represent the statistical outliers,as defined by a z score equal to or above to 5 standard deviationsas this would have resulted in a scale with illegible boxplot dimensions.
Ú·¹«» Ý¿°¬·±²Ý´·½µ ¸»®» ¬± ª·»© ´·²µ»¼ λº»®»²½»
Ú·¹«®» ïÝ´·½µ ¸»®» ¬± ¼±©²´±¿¼ ¸·¹¸ ®»±´«¬·±² ·³¿¹»
Ú·¹«®» îÝ´·½µ ¸»®» ¬± ¼±©²´±¿¼ ¸·¹¸ ®»±´«¬·±² ·³¿¹»

Ú·¹«®» íÝ´·½µ ¸»®» ¬± ¼±©²´±¿¼ ¸·¹¸ ®»±´«¬·±² ·³¿¹»

Ú·¹«®» ìÝ´·½µ ¸»®» ¬± ¼±©²´±¿¼ ¸·¹¸ ®»±´«¬·±² ·³¿¹»

Ú·¹«®» ëÝ´·½µ ¸»®» ¬± ¼±©²´±¿¼ ¸·¹¸ ®»±´«¬·±² ·³¿¹»

Ú·¹«®» êÝ´·½µ ¸»®» ¬± ¼±©²´±¿¼ ¸·¹¸ ®»±´«¬·±² ·³¿¹»

Ú·¹«®» éÝ´·½µ ¸»®» ¬± ¼±©²´±¿¼ ¸·¹¸ ®»±´«¬·±² ·³¿¹»

Ú·¹«®» èÝ´·½µ ¸»®» ¬± ¼±©²´±¿¼ ¸·¹¸ ®»±´«¬·±² ·³¿¹»

Ú·¹«®» çÝ´·½µ ¸»®» ¬± ¼±©²´±¿¼ ¸·¹¸ ®»±´«¬·±² ·³¿¹»
Ú·¹«®» ïðÝ´·½µ ¸»®» ¬± ¼±©²´±¿¼ ¸·¹¸ ®»±´«¬·±² ·³¿¹»
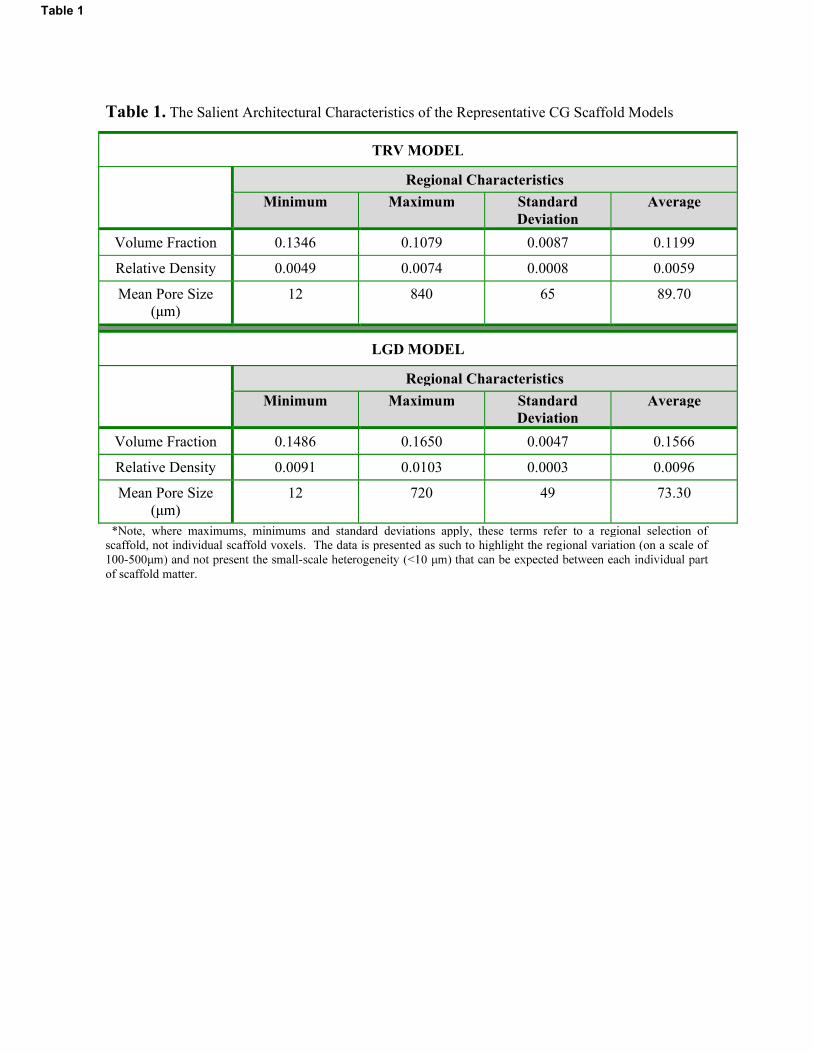
Ì¿¾´» ïò ̸» Í¿´·»²¬ ß®½¸·¬»½¬«®¿´ ݸ¿®¿½¬»®·¬·½ ±º ¬¸» λ°®»»²¬¿¬·ª» Ý٠ͽ¿ºº±´¼ Ó±¼»´
ÌÎÊ ÓÑÜÛÔ
λ¹·±²¿´ ݸ¿®¿½¬»®·¬·½
Ó·²·³«³ Ó¿¨·³«³ ͬ¿²¼¿®¼
Ü»ª·¿¬·±²
ߪ»®¿¹»
ʱ´«³» Ú®¿½¬·±² ðòïíìê ðòïðéç ðòððèé ðòïïçç
λ´¿¬·ª» Ü»²·¬§ ðòððìç ðòððéì ðòðððè ðòððëç
Ó»¿² б®» Í·¦» ïî èìð êë èçòéð
ÔÙÜ ÓÑÜÛÔ
λ¹·±²¿´ ݸ¿®¿½¬»®·¬·½
Ó·²·³«³ Ó¿¨·³«³ ͬ¿²¼¿®¼
Ü»ª·¿¬·±²
ߪ»®¿¹»
ʱ´«³» Ú®¿½¬·±² ðòïìèê ðòïêëð ðòððìé ðòïëêê
λ´¿¬·ª» Ü»²·¬§ ðòððçï ðòðïðí ðòðððí ðòððçê
Ó»¿² б®» Í·¦» ïî éîð ìç éíòíð
öÒ±¬»ô ©¸»®» ³¿¨·³«³ô ³·²·³«³ ¿²¼ ¬¿²¼¿®¼ ¼»ª·¿¬·±² ¿°°´§ô ¬¸»» ¬»®³ ®»º»® ¬± ¿ ®»¹·±²¿´ »´»½¬·±² ±º
½¿ºº±´¼ô ²±¬ ·²¼·ª·¼«¿´ ½¿ºº±´¼ ª±¨»´ò ̸» ¼¿¬¿ · °®»»²¬»¼ ¿ «½¸ ¬± ¸·¹¸´·¹¸¬ ¬¸» ®»¹·±²¿´ ª¿®·¿¬·±² ø±² ¿ ½¿´» ±º
ïððó ¸» ³¿´´ó
±º ½¿ºº±´¼ ³¿¬¬»®ò
Ì¿¾´» ï
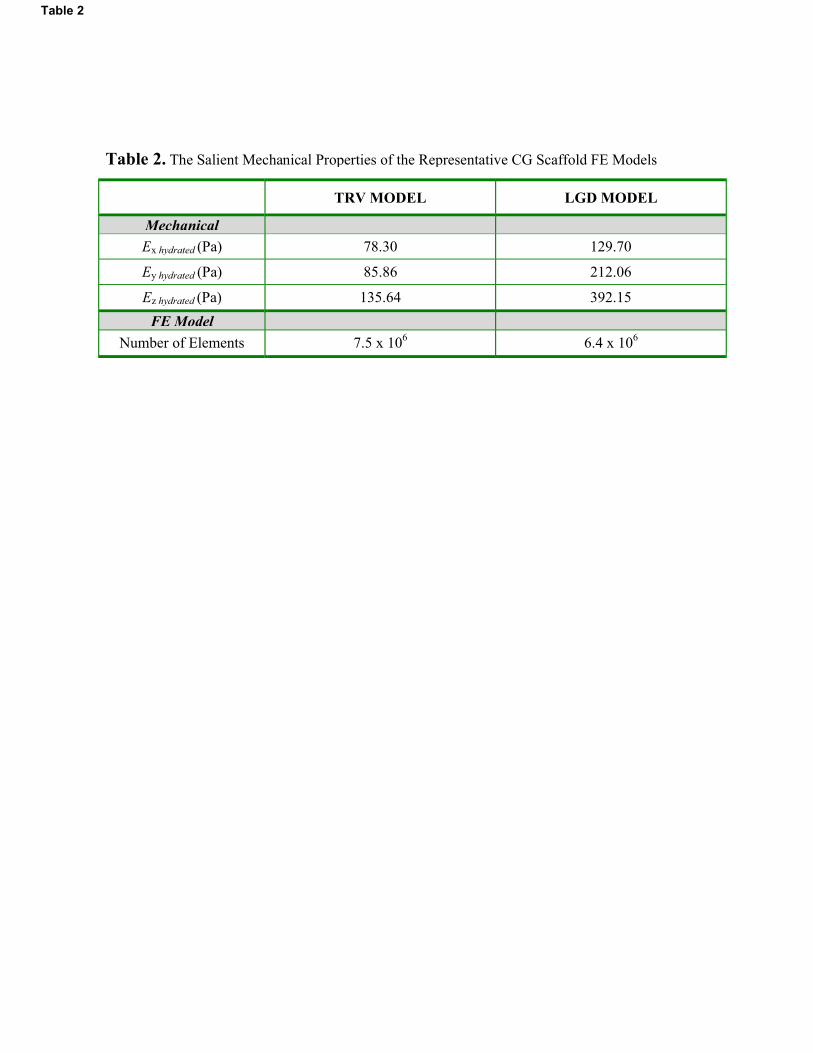
Ì¿¾´» îò ̸» Í¿´·»²¬ Ó»½¸¿²·½¿´ Ю±°»®¬·» ±º ¬¸» λ°®»»²¬¿¬·ª» Ý٠ͽ¿ºº±´¼ ÚÛ Ó±¼»´
ÌÎÊ ÓÑÜÛÔ ÔÙÜ ÓÑÜÛÔ
Ó»½¸¿²·½¿´
Û¨ ¸§¼®¿¬»¼ øп÷ éèòíð ïîçòéð
Û§ ¸§¼®¿¬»¼ øп÷ èëòèê îïîòðê
Û¦ ¸§¼®¿¬»¼ øп÷ ïíëòêì íçîòïë
ÚÛ Ó±¼»´
Ò«³¾»® ±º Û´»³»²¬ éòë ¨ ïðê
êòì ¨ ïðê
Ì¿¾´» î
We thank the reviewers for raising important questions regarding the work from this manuscript. In thefollowing we attempt to deal with the concerns of the reviewers and in the process of doing so, webelieve that the clarifications and justifications that have been added to the manuscript nowstrengthen the paper. We have responded to each question individually with commentary and a smallsummary of the changes made to the manuscript, and where possible, indicated the location of thesechanges.
In particular, we would note the significant effort made to accommodate what appeared to us to bediffering views of the two reviewers in relation to the written style: Reviewer#1 praised the languagestyle while Reviewer#2 suggested the wording was too verbose; we hope we have managed toaccommodate both opinions.
Note, all commentary by the authors is in red arial font.
place). W the manuscript with the revisions highlighted in red to helpthe reviewer locate the changes.
Reviewer #1: This paper is about making finite element models oftissue engineering scaffolds. The work involved constructing twomodels of parts of a CG scaffold. Results include analysis ofporosity, scaffold shape factors (e.g. struts, plates etc), elasticmodulus and strains experienced by cells attached in different ways.
This is a significant achievement given the size of the meshinvolved and the practical difficulties in measuring the abovequantities. I have only a few comments:
1) They say there was significant variation in porosity: actually Iwas surprised that the variation was so small, around 10%. Anywayit's good that they can visualise and quantify the regionaldifferences in porosity which occur due to processing methods.We agree that 10% may seem relatively small, but we have attempted to use the volume fraction asone method in a system of methods to describe the scaffold. We believe that this level of detail isvital in contributing towards the understanding of the scaffold as a whole.
2) The criterion for elastic buckling is simplistic and the authorsadmit this and discuss it. It's probably better just to say that youare recording the %age of the material which exceeds a certainstress, arbitrarily chosen but possibly related to the stress atwhich failure by buckling occurs.
We agree that this is a criterion based on a simplified value, but we chose this buckling criterion toadd a functional, or a - Following much considerationand discussion, we decided to keep the buckling criteria description within the methods section as webelieve that it deserves a reasonable description of how we came to the critical stress magnitude (itwould have been too long for the discussion section). We believe this description in the methodssections enables the reader to appreciate that the critical stress magnitude is based on reasonablelogic, though simplified input values. We do feel that this criterion does enable the reader to betterappreciate the value of the stress magnitudes within the scaffold and so believe it should receivesome attention within the methods section.
3) As regards the strain experienced by the cells, I don't
öÜ»¬¿·´»¼ λ°±²» ¬± λª·»©»®
Copyright © 2022 FDOKUMEN