Transmission of Vibrio cholerae is antagonized by lytic phage and entry into the aquatic environment
Upload
independentCategory
view
3download
0
Linking the lytic and lysogenic bacteriophage cycles toenvironmental conditions, host physiology and theirvariability in coastal lagoons
C. F. Maurice,† C. Bouvier, R. de Wit and T. Bouvier*Université de Montpellier 2, Laboratoire Ecologie desSystèmes Marins Côtiers ECOSYM UMR5119CNRS-Ifremer-IRD, case 093. Place Eugène Bataillon,34095 Montpellier cedex 5, France.
Summary
Changes in environmental conditions and pro-karyote physiology can strongly affect the dynamicsof both the lysogenic and lytic bacteriophage re-plication cycles in aquatic systems. However, itremains unclear whether it is the nature, amplitudeor frequency of these changes that alter the phagereplication cycles. We performed an annual surveyof three Mediterranean lagoons with contrastinglevels of chlorophyll a concentration and salinity toexplore how these cues and their variability influ-ence either replication cycle. The lytic cycle wasalways detected and showed seasonal patterns,whereas the lysogenic cycle was often undetectedand highly variable. The lytic cycle was influencedby environmental and prokaryotic physiologicalcues, increasing with concentrations of dissolvedorganic carbon, chlorophyll a, and the proportion ofrespiring cells, and decreasing with the proportionof damaged cells. In contrast, lysogeny was notexplained by the magnitude of any environmental orphysiological parameter, but increased with theamplitude of change in prokaryote physiology. Ourstudy suggests that both cycles are regulated bydistinct factors: the lytic cycle is dependent onenvironmental parameters and host physiology,while lysogeny is dependent on the variability ofprokaryote physiology. This could lead to the con-trasting patterns observed between both cycles inaquatic systems.
Introduction
Viruses are the most abundant biological entities inaquatic systems, outnumbering prokaryotic cells by atleast one order of magnitude (Bergh et al., 1989;reviewed by Weinbauer, 2004). This high abundance issustained by two principal replication cycles, the lytic andthe lysogenic cycles. The lytic cycle is characterized by arapid production of new viral particles in the system uponthe host’s lysis, whereas the lysogenic cycle allows theintegration of the viral genome as a prophage within thebacterium (Ackermann and Dubow, 1987; reviewed byWeinbauer, 2004). This prophage will remain in the lys-ogenic bacteria until an inducing event takes place, trig-gering the onset of viral production. Through lysogeny, thehost gains immunity to superinfection by closely relatedphages and acquisition of antibiotic resistance and/ortoxin encoding sequences through phage conversion.Such acquired traits increase prokaryotic fitness underspecific environmental conditions (reviewed by Wommackand Colwell, 2000; Chibani-Chennoufi et al., 2004;Weinbauer, 2004). However, lysogenic cells become sus-ceptible to a variety of inducing agents, and it is oftensuggested that there could be a metabolic cost associatedwith the replication of the integrated viral genome(reviewed by Paul, 2008).
Studies with cultured isolates and natural bacterio-plankton communities indicate that lytic infection is gen-erally found in productive environments, characterized byhigh host abundance and activity, allowing for the fastproduction of numerous new viral particles. In contrast,lysogeny is proposed to enable the survival of the hostand prophage under unfavourable conditions, such as lowprokaryote abundance and primary production (reviewedby Wommack and Colwell, 2000; Chibani-Chennoufiet al., 2004). Studies that address simultaneously bothcycles and their prevalence in aquatic systems are lessnumerous, and have resulted in contrasting ecologicalscenarios. Temporal and spatial studies have demon-strated an inverse correlation between the lytic andlysogenic cycles, suggesting that environmental charac-teristics allow the predominance of one cycle (Weinbaueret al., 2003; Colombet et al., 2006; Pradeep Ram andSime-Ngando, 2010); others have reported a positive
Received 7 June, 2012; accepted 5 March, 2013. *For correspond-ence. E-mail [email protected]; Tel. (+33) 4 67 14 40 32; Fax(+33) 4 67 14 37 19. †Present address: FAS Center for SystemsBiology, Harvard University, 52 Oxford Street, Cambridge, MA 02138,USA.
bs_bs_banner
Environmental Microbiology (2013) 15(9), 2463–2475 doi:10.1111/1462-2920.12120
© 2013 John Wiley & Sons Ltd and Society for Applied Microbiology
correlation, suggesting that continuous induction eventsaliment the pool of visibly infected cells (Bettarel et al.,2008; Maurice et al., 2010); and finally others havereported no correlation between these cycles (Boraset al., 2009). These results highlight our limited under-standing of the natural processes regulating phage repli-cation cycles.
Changes in environmental conditions can alter viraldynamics and replication cycles (reviewed by Wommackand Colwell, 2000; Weinbauer, 2004), but it is unclearwhether this is due to the nature of the environmentalperturbation, its amplitude and/or frequency, or through itsimpact on the prokaryote host. In addition, a given vari-able can affect the lytic and lysogenic cycles in dissimilarways. For example, high growth rates generally associ-ated with lytic replication can also correspond to an induc-tion signal for the prophage, in order to maximize viralproduction (Gottesman and Oppenheim, 1994; Paul,2008). Similarly, low levels of prokaryote activity usuallyassociated with lysogeny can also lead to the induction ofthe prophage before the host’s lysis and loss of the viralgenome (Clarke, 1998; Maurice et al., 2010). These dis-crepancies emphasize that the variables regulating thelysogenic and the lytic replication cycles in aquaticsystems remain poorly understood.
Observing the dynamics of phage replication cycles innatural systems with strong environmental variabilitywould provide an initial framework to characterize therelationship between environmental variability and phagereplication cycles. These systems harbour prokaryotecommunities that are very diverse in their physiology,activity and community structure (as observed in estuar-ies or coastal waters; del Giorgio and Bouvier, 2002;Riemann and Middelboe, 2002; Hewson and Fuhrman,2004). Constant fluctuations in the host physiology andactivity could constitute unfavourable conditions for thephage communities and promote the establishment oflysogeny (Paul, 2008). Alternatively, these environmentalfluctuations could promote inducing events and high ratesof successful viral and host encounters, thereby favouring
lytic infections. However, to our knowledge, there is no insitu evidence linking environmental variability and phagereplication cycles so far.
Mediterranean lagoons are shallow water bodiessubject to major periodic nutrient inputs from humanactivities [agriculture, extensive urbanization (Castelet al., 1996; Ifremer, 2008)], as well as irregular andstrong periods of rainfall in autumn and spring, followedby long periods of dryness in summer. These systemsthus go through great temporal and spatial environmentalchanges, differing in their amplitude and nature, andthereby constitute model ecosystems to study the impor-tance of environmental variability in phage replicationcycles. Over the course of 1 year, we sampled threeMediterranean coastal lagoons characterized by contrast-ing annual variability in: salinity; dissolved organic carbon(DOC); total nitrogen (TN) and phosphorus (TP); andchlorophyll a (Chl a) concentrations. These variables areall recognized for their impact on prokaryote physiology(del Giorgio and Bouvier, 2002; Hewson and Fuhrman,2004) and viral replication cycles (Cochran and Paul,1998; Weinbauer, 2004; Bettarel et al., 2009). We aimedto determine: (i) the type of pattern (negative/positivecorrelation or no pattern) occurring between the lytic andlysogenic cycles in coastal lagoons, and (ii) how environ-mental variables, the host’s physiology, and their variabil-ity over short (seasonal) and long (annual) timescalesmight explain the patterns of occurrence and proportionsof both cycles.
Results
Environmental variables and annual variability
Three coastal Mediterranean lagoons, Leucate, Bagesand Gruissan, were sampled every 3 weeks, and themeans and ranges of values of all environmentalvariables measured are reported in Table 1. Meanannual DOC concentrations were significantly differentamong lagoons (ANOVA, F = 5.060, P = 0.011; Table 1),with higher concentrations in Bages (Tukey Kramer,
Table 1. Annual means and ranges of environmental and chemical parameters in the three lagoons.
LagoonTemperature(°C)
Oxygenconcentration(% saturation) Salinity TP (mM) TN (mM)
Chl a(mg Chl a l-1)
DOCconcentration(mg C l-1)
Leucate 15.5 84.2 35.1 0.5 23.2 1 258.4(4.5–26.8) (23.7–168.0) (28.6–38.1) (0.3–0.9) (17.5–29.0) (0.12–2.21) (121.8–531.7)
Bages 15 88.1 34.7 2.4 46.3 4.2 442.2(4.7–25.3) (25.3–192.5) (24.5–39.4) (0.5–6.4) (25.9–86.0) (0.4–19.6) (194.8–930.6)
Gruissan 16.2 98.9 32.1 2.1 38.6 4.3 309.4(5.7–27.7) (27.6–190.6) (20.0–42.7) (0.3–13.1) (14.8–102.6) (0.4–17.3) (123.7–601.7)
ANOVA (F, P value) 0.140, 0.870 0.643, 0.531 1.577, 0.219 2.736, 0.077 3.070, 0.057 3.884, 0.028 5.06, 0.011
Chl a: chlorophyll a concentration; DOC: dissolved organic carbon; TP: total phosphate concentration; TN: total nitrogen concentration. ANOVAs(F and P values) for the effect of lagoon on the environmental and chemical parameters during the annual survey are also reported.
2464 C. F. Maurice, C. Bouvier, R. Wit and T. Bouvier
© 2013 John Wiley & Sons Ltd and Society for Applied Microbiology, Environmental Microbiology, 15, 2463–2475
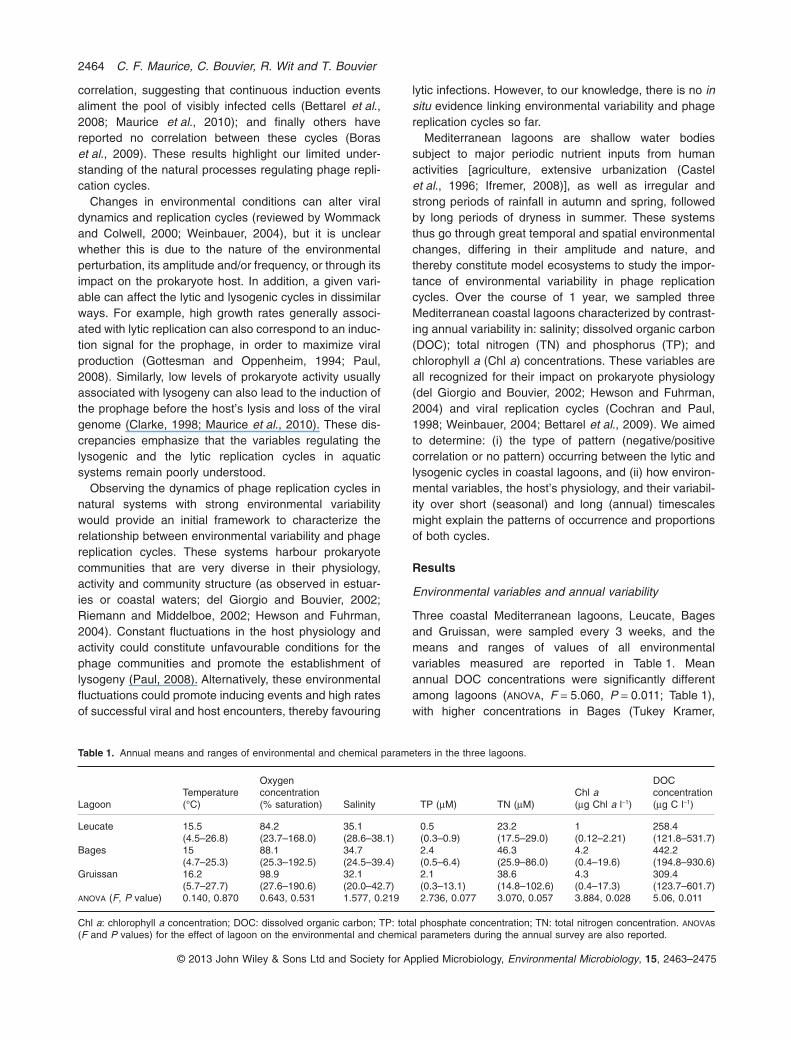
P = 0.009). As expected, the range and variability of salin-ity and Chl a values were distinct across lagoons (Fig. 1Aand B). Leucate remained in an oligotrophic state,whereas Bages and Gruissan fluctuated from oligotrophicto eutrophic conditions, as reflected by the Chl a concen-trations. Chl a concentrations were significantly differentamong lagoons (ANOVA, F = 3.884, P = 0.028; Table 1)with higher concentrations in Bages than in Leucate(Tukey Kramer, P = 0.027). All three lagoons were mix-opolyhaline according to the Venice system (Anonymous,1959), and showed seasonal salinity fluctuations. Salinityfluctuated most in Gruissan (from 20 to 43). The meanvalues of the other environmental variables were not sig-nificantly different among the three lagoons (Table 1). Theindex of annual environmental variability (see Experimen-tal procedures) increased from 2.5 in Leucate to 3.5 inBages, and reached a maximum of 4.6 in Gruissan(Fig. 1C). This index was significantly different amonglagoons (Bartlett test, P = 0.014). Collectively, theseresults indicate a ranking of the lagoons based on theirenvironmental variability from low (Leucate), to interme-diate (Bages), to high variability (Gruissan).
Viral and prokaryote community dynamics
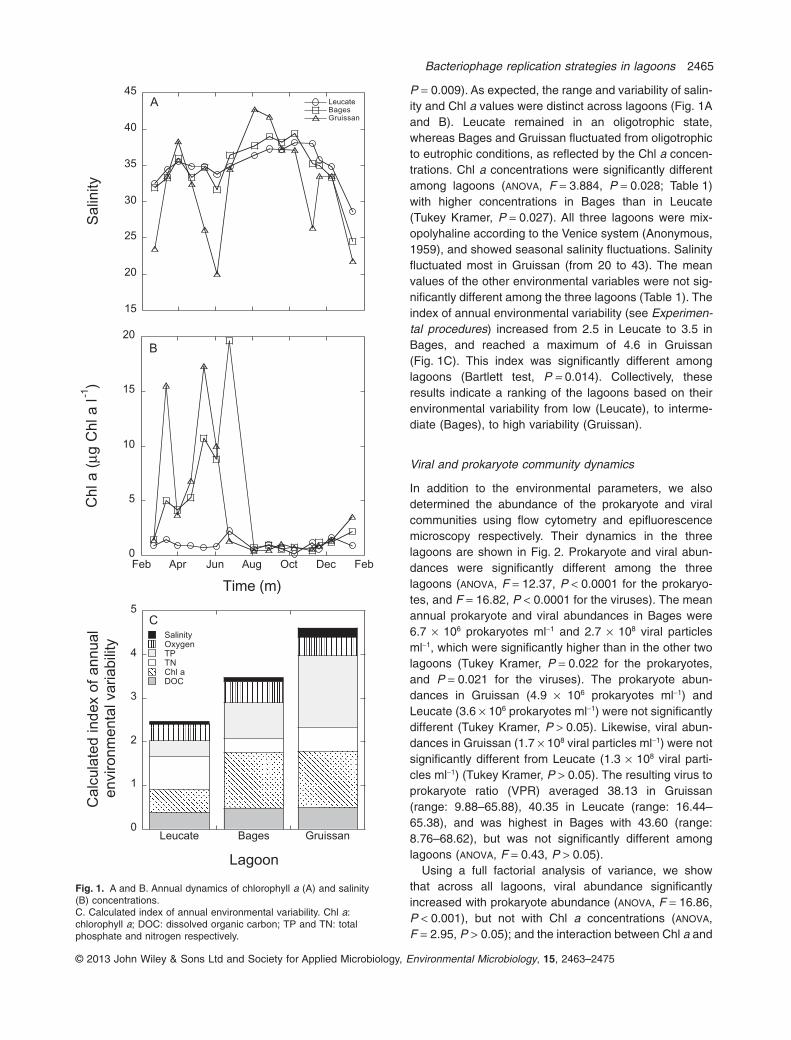
In addition to the environmental parameters, we alsodetermined the abundance of the prokaryote and viralcommunities using flow cytometry and epifluorescencemicroscopy respectively. Their dynamics in the threelagoons are shown in Fig. 2. Prokaryote and viral abun-dances were significantly different among the threelagoons (ANOVA, F = 12.37, P < 0.0001 for the prokaryo-tes, and F = 16.82, P < 0.0001 for the viruses). The meanannual prokaryote and viral abundances in Bages were6.7 ¥ 106 prokaryotes ml-1 and 2.7 ¥ 108 viral particlesml-1, which were significantly higher than in the other twolagoons (Tukey Kramer, P = 0.022 for the prokaryotes,and P = 0.021 for the viruses). The prokaryote abun-dances in Gruissan (4.9 ¥ 106 prokaryotes ml-1) andLeucate (3.6 ¥ 106 prokaryotes ml-1) were not significantlydifferent (Tukey Kramer, P > 0.05). Likewise, viral abun-dances in Gruissan (1.7 ¥ 108 viral particles ml-1) were notsignificantly different from Leucate (1.3 ¥ 108 viral parti-cles ml-1) (Tukey Kramer, P > 0.05). The resulting virus toprokaryote ratio (VPR) averaged 38.13 in Gruissan(range: 9.88–65.88), 40.35 in Leucate (range: 16.44–65.38), and was highest in Bages with 43.60 (range:8.76–68.62), but was not significantly different amonglagoons (ANOVA, F = 0.43, P > 0.05).
Using a full factorial analysis of variance, we showthat across all lagoons, viral abundance significantlyincreased with prokaryote abundance (ANOVA, F = 16.86,P < 0.001), but not with Chl a concentrations (ANOVA,F = 2.95, P > 0.05); and the interaction between Chl a and
0
1
2
3
4
5
Leucate Bages Gruissan
SalinityOxygenTPTNChl aDOC
Ca
lcu
late
d in
de
x o
f a
nn
ua
l
en
viro
nm
en
tal va
ria
bili
ty
Lagoon
C
15
20
25
30
35
40
45LeucateBagesGruissan
Sa
linity
A
0
5
10
15
20
Feb Apr Jun Aug Oct Dec Feb
Ch
l a
(μg
Ch
l a
l-1
)
Time (m)
B
Fig. 1. A and B. Annual dynamics of chlorophyll a (A) and salinity(B) concentrations.C. Calculated index of annual environmental variability. Chl a:chlorophyll a; DOC: dissolved organic carbon; TP and TN: totalphosphate and nitrogen respectively.
Bacteriophage replication strategies in lagoons 2465
© 2013 John Wiley & Sons Ltd and Society for Applied Microbiology, Environmental Microbiology, 15, 2463–2475
prokaryote abundance was not significant either (ANOVA,F = 0.13, P > 0.05). Jointly, these data suggest that mostof the viruses in these systems are bacteriophages.
Collectively, the proxies of prokaryotic activity deter-mined by vital staining and flow cytometry showed coher-ent seasonal patterns during the survey. The proportionsof respiring cells (CTC+ cells) were high during spring andsummer in the three lagoons, seasons with relatively lowproportions of depolarized cells (DiBAC+ cells); whereasthe proportions of depolarized cells were highest duringwinter (Table 2). On average, fractions of depolarized and
respiring cells both accounted for 20% of the totalprokaryote communities respectively. The variability of thedifferent physiological categories, determined by theircoefficient of variation (CV), was not significantly dif-ferent among the three lagoons (ANOVA, F = 0.78,P > 0.05 and F = 1.31, P > 0.05, for the CVs of CTC+ cellsand DiBAC+ cells respectively), with CV values rangingfrom 0.23 to 1.03 for CTC+ cells and from 0.17 to 0.89 forDiBAC+ cells.
Viral replication cycle dynamics
Lysogeny, determined using incubations with mitomycinC, was detected in all three lagoons, although on manysampling occasions it remained below the detection limit.Lysogeny was observed on 13% of the sampling dates inGruissan (2/15 sampling dates), 27% of the samplingdates in Leucate (4/15) and 47% of the sampling dates inBages (7/15; Fig. 3). When detected, the frequency oflysogenic cells (FLC) was highly variable, ranging from0.5% to over 65%. Lysogeny did not follow any seasonalpattern in the three lagoons, and its occurrence wasdynamic and transient (Fig. 3). The annual average FLCvalues were lowest in Leucate (3.9%), intermediate inGruissan (5.2%) and highest in Bages (6.4%), but did notdiffer significantly across lagoons (ANOVA, F = 0.146,P > 0.05).
In contrast to lysogens, visibly infected cells weredetected on almost all sampling occasions, with theexception of the January 2009 sampling in Leucate. Thefrequency of visibly infected cells (FVIC) showed a sea-sonal pattern, with maximum values observed duringspring and autumn. The annual mean FVIC values
0
1
2
3
4
Feb Apr Jun Aug Oct Dec FebVir
al a
bu
nd
an
ce
(1
08 p
art
icle
s m
l-1)
Time (m)
1
3
5
7
9
LeucateBagesGruissan
Pro
ka
ryo
te a
bu
nd
an
ce
(1
06 c
ells
ml-1
)
Fig. 2. Dynamics of prokaryote (¥106 cells ml-1) and viral (¥108
particles ml-1) abundances in the three lagoons. Error barsrepresent standard errors from triplicate samples.
Table 2. Prokaryote community physiology in the three lagoons.
Lagoon CTC+ (%) DiBAC+ (%)
Leucate 14.8 (0.7) 21.7 (0.8)Winter 9.1 � ND 40.9 � 32.9Spring 14.3 � 3.3 17.3 � 12.1Summer 14.4 � 14.8 10.3 � 5.1Fall 17.0 � 13.5 23.0 � 8.3Bages 17.3 (1.0) 21.3 (0.9)Winter 8.2 � ND 43.3 � 34.7Spring 29.4 � 25.5 21.9 � 13.3Summer 11.2 � 6.8 12.6 � 2.1Fall 13.5 � 11.2 12.9 � 4.2Gruissan 15.7 (0.5) 21.7 (0.9)Winter 6.9 � ND 42.9 � 32.0Spring 21.1 � 5.9 16.4 � 11.5Summer 17.7 � 9.7 9.8 � 3.9Fall 10.4 � 5.0 22.9 � 20.3
Mean annual values of the proportions of CTC+ and DiBAC+ cellsdetected by flow cytometry are in bold, with the annual coefficient ofvariation in parenthesis. Within each lagoon, seasonal average pro-portions of each physiological feature (� SD) are also given. CTC+:respiring cells; DiBAC+: depolarized cells. ND: not determined.
2466 C. F. Maurice, C. Bouvier, R. Wit and T. Bouvier
© 2013 John Wiley & Sons Ltd and Society for Applied Microbiology, Environmental Microbiology, 15, 2463–2475
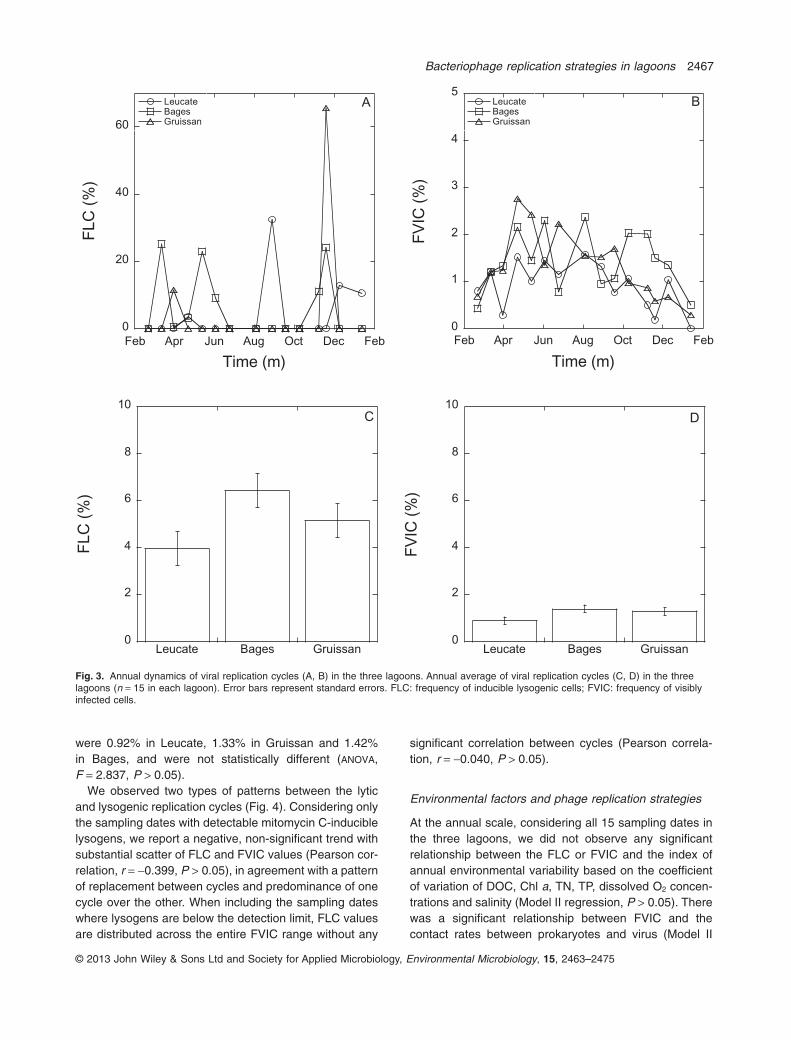
were 0.92% in Leucate, 1.33% in Gruissan and 1.42%in Bages, and were not statistically different (ANOVA,F = 2.837, P > 0.05).
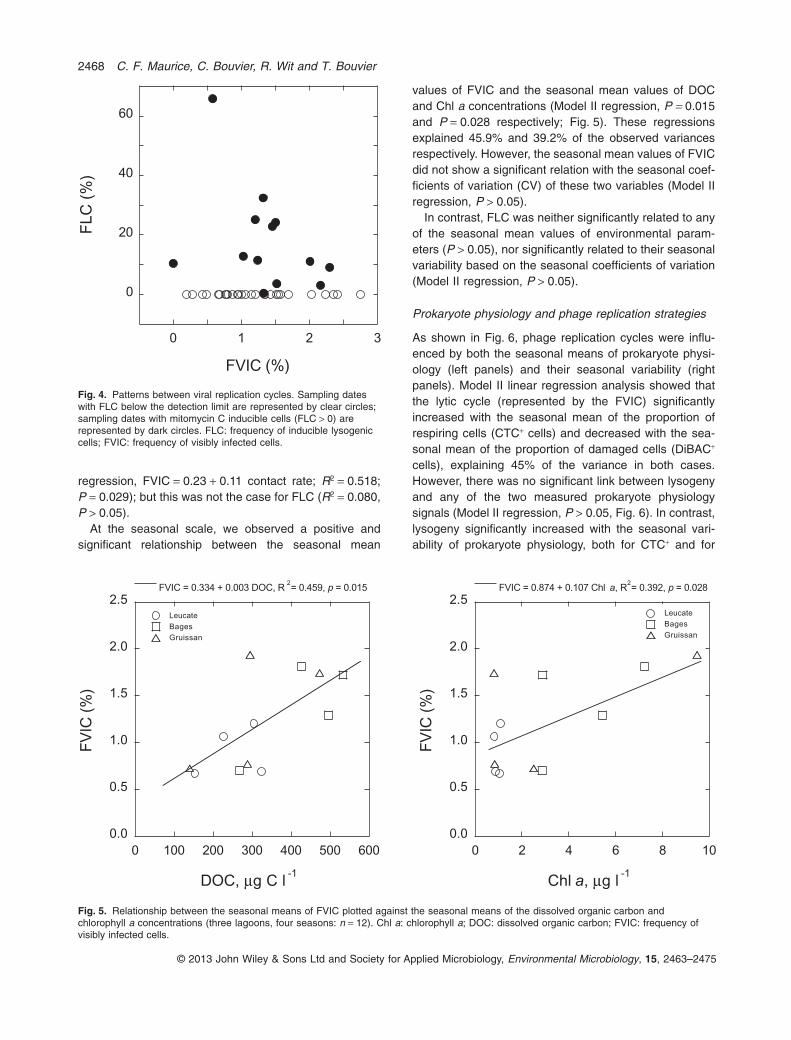
We observed two types of patterns between the lyticand lysogenic replication cycles (Fig. 4). Considering onlythe sampling dates with detectable mitomycin C-induciblelysogens, we report a negative, non-significant trend withsubstantial scatter of FLC and FVIC values (Pearson cor-relation, r = -0.399, P > 0.05), in agreement with a patternof replacement between cycles and predominance of onecycle over the other. When including the sampling dateswhere lysogens are below the detection limit, FLC valuesare distributed across the entire FVIC range without any
significant correlation between cycles (Pearson correla-tion, r = -0.040, P > 0.05).
Environmental factors and phage replication strategies
At the annual scale, considering all 15 sampling dates inthe three lagoons, we did not observe any significantrelationship between the FLC or FVIC and the index ofannual environmental variability based on the coefficientof variation of DOC, Chl a, TN, TP, dissolved O2 concen-trations and salinity (Model II regression, P > 0.05). Therewas a significant relationship between FVIC and thecontact rates between prokaryotes and virus (Model II
0
2
4
6
8
10
Leucate Bages Gruissan
FLC
(%
)
C
0
2
4
6
8
10
Leucate Bages Gruissan
FV
IC (
%)
D
0
20
40
60
Feb Apr Jun Aug Oct Dec Feb
LeucateBagesGruissan
FL
C (
%)
Time (m)
A
0
1
2
3
4
5
Feb Apr Jun Aug Oct Dec Feb
LeucateBagesGruissan
FV
IC (
%)
Time (m)
B
Fig. 3. Annual dynamics of viral replication cycles (A, B) in the three lagoons. Annual average of viral replication cycles (C, D) in the threelagoons (n = 15 in each lagoon). Error bars represent standard errors. FLC: frequency of inducible lysogenic cells; FVIC: frequency of visiblyinfected cells.
Bacteriophage replication strategies in lagoons 2467
© 2013 John Wiley & Sons Ltd and Society for Applied Microbiology, Environmental Microbiology, 15, 2463–2475
regression, FVIC = 0.23 + 0.11 contact rate; R2 = 0.518;P = 0.029); but this was not the case for FLC (R2 = 0.080,P > 0.05).
At the seasonal scale, we observed a positive andsignificant relationship between the seasonal mean
values of FVIC and the seasonal mean values of DOCand Chl a concentrations (Model II regression, P = 0.015and P = 0.028 respectively; Fig. 5). These regressionsexplained 45.9% and 39.2% of the observed variancesrespectively. However, the seasonal mean values of FVICdid not show a significant relation with the seasonal coef-ficients of variation (CV) of these two variables (Model IIregression, P > 0.05).
In contrast, FLC was neither significantly related to anyof the seasonal mean values of environmental param-eters (P > 0.05), nor significantly related to their seasonalvariability based on the seasonal coefficients of variation(Model II regression, P > 0.05).
Prokaryote physiology and phage replication strategies
As shown in Fig. 6, phage replication cycles were influ-enced by both the seasonal means of prokaryote physi-ology (left panels) and their seasonal variability (rightpanels). Model II linear regression analysis showed thatthe lytic cycle (represented by the FVIC) significantlyincreased with the seasonal mean of the proportion ofrespiring cells (CTC+ cells) and decreased with the sea-sonal mean of the proportion of damaged cells (DiBAC+
cells), explaining 45% of the variance in both cases.However, there was no significant link between lysogenyand any of the two measured prokaryote physiologysignals (Model II regression, P > 0.05, Fig. 6). In contrast,lysogeny significantly increased with the seasonal vari-ability of prokaryote physiology, both for CTC+ and for
0
20
40
60
0 1 2 3
FLC
(%
)
FVIC (%)
Fig. 4. Patterns between viral replication cycles. Sampling dateswith FLC below the detection limit are represented by clear circles;sampling dates with mitomycin C inducible cells (FLC > 0) arerepresented by dark circles. FLC: frequency of inducible lysogeniccells; FVIC: frequency of visibly infected cells.
0.0
0.5
1.0
1.5
2.0
2.5
0 100 200 300 400 500 600
Leucate
Bages
Gruissan
FVIC = 0.334 + 0.003 DOC, R2= 0.459, p = 0.015
FV
IC (
%)
DOC, μg C l-1
0.0
0.5
1.0
1.5
2.0
2.5
0 2 4 6 8 10
Leucate
Bages
Gruissan
FVIC = 0.874 + 0.107 Chl a, R2= 0.392, p = 0.028
FV
IC (
%)
Chl a, μg l-1
Fig. 5. Relationship between the seasonal means of FVIC plotted against the seasonal means of the dissolved organic carbon andchlorophyll a concentrations (three lagoons, four seasons: n = 12). Chl a: chlorophyll a; DOC: dissolved organic carbon; FVIC: frequency ofvisibly infected cells.
2468 C. F. Maurice, C. Bouvier, R. Wit and T. Bouvier
© 2013 John Wiley & Sons Ltd and Society for Applied Microbiology, Environmental Microbiology, 15, 2463–2475
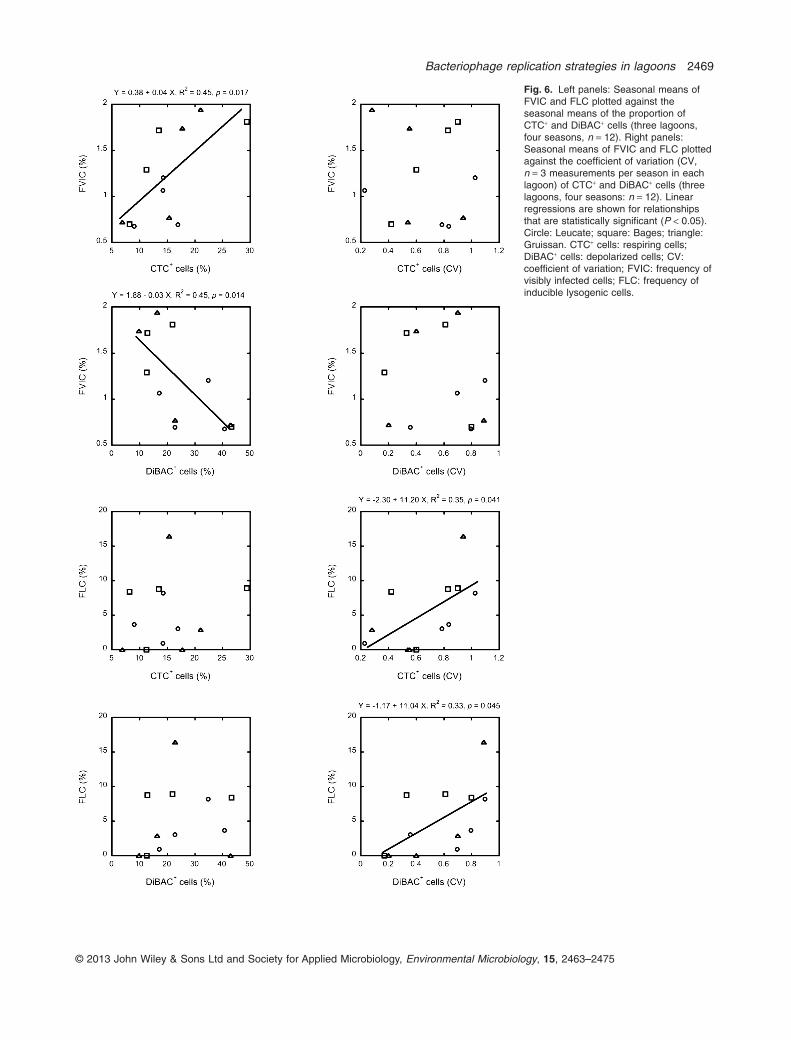
Fig. 6. Left panels: Seasonal means ofFVIC and FLC plotted against theseasonal means of the proportion ofCTC+ and DiBAC+ cells (three lagoons,four seasons, n = 12). Right panels:Seasonal means of FVIC and FLC plottedagainst the coefficient of variation (CV,n = 3 measurements per season in eachlagoon) of CTC+ and DiBAC+ cells (threelagoons, four seasons: n = 12). Linearregressions are shown for relationshipsthat are statistically significant (P < 0.05).Circle: Leucate; square: Bages; triangle:Gruissan. CTC+ cells: respiring cells;DiBAC+ cells: depolarized cells; CV:coefficient of variation; FVIC: frequency ofvisibly infected cells; FLC: frequency ofinducible lysogenic cells.
Bacteriophage replication strategies in lagoons 2469
© 2013 John Wiley & Sons Ltd and Society for Applied Microbiology, Environmental Microbiology, 15, 2463–2475
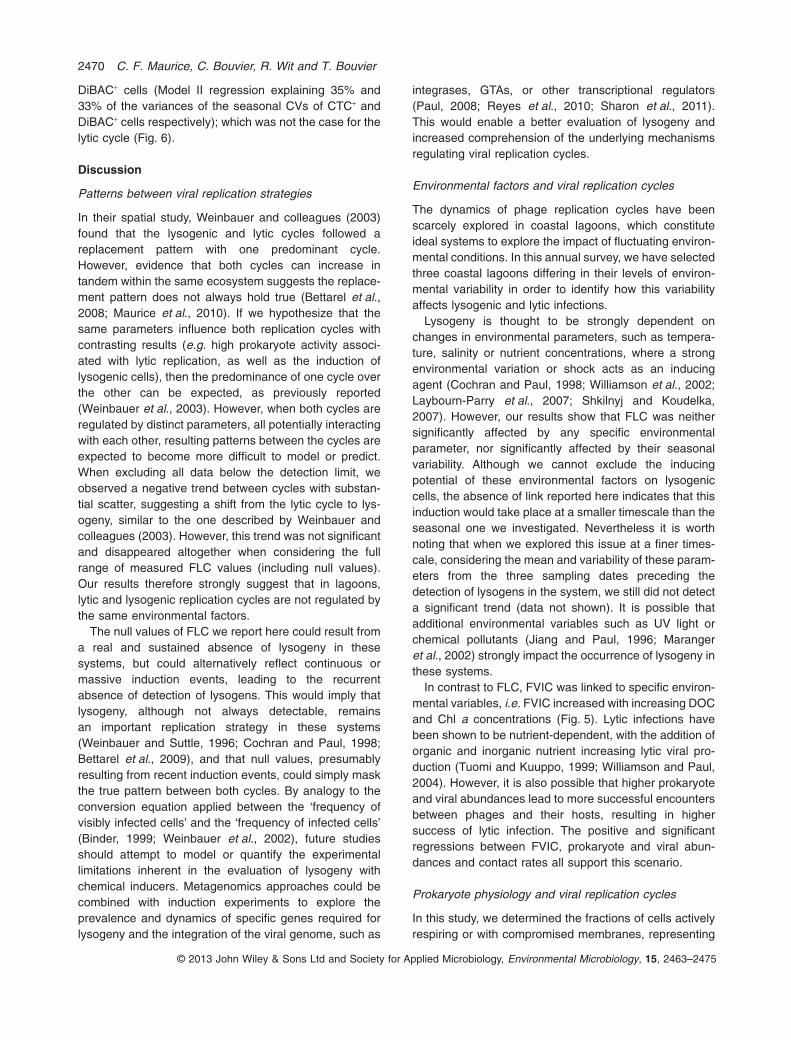
DiBAC+ cells (Model II regression explaining 35% and33% of the variances of the seasonal CVs of CTC+ andDiBAC+ cells respectively); which was not the case for thelytic cycle (Fig. 6).
Discussion
Patterns between viral replication strategies
In their spatial study, Weinbauer and colleagues (2003)found that the lysogenic and lytic cycles followed areplacement pattern with one predominant cycle.However, evidence that both cycles can increase intandem within the same ecosystem suggests the replace-ment pattern does not always hold true (Bettarel et al.,2008; Maurice et al., 2010). If we hypothesize that thesame parameters influence both replication cycles withcontrasting results (e.g. high prokaryote activity associ-ated with lytic replication, as well as the induction oflysogenic cells), then the predominance of one cycle overthe other can be expected, as previously reported(Weinbauer et al., 2003). However, when both cycles areregulated by distinct parameters, all potentially interactingwith each other, resulting patterns between the cycles areexpected to become more difficult to model or predict.When excluding all data below the detection limit, weobserved a negative trend between cycles with substan-tial scatter, suggesting a shift from the lytic cycle to lys-ogeny, similar to the one described by Weinbauer andcolleagues (2003). However, this trend was not significantand disappeared altogether when considering the fullrange of measured FLC values (including null values).Our results therefore strongly suggest that in lagoons,lytic and lysogenic replication cycles are not regulated bythe same environmental factors.
The null values of FLC we report here could result froma real and sustained absence of lysogeny in thesesystems, but could alternatively reflect continuous ormassive induction events, leading to the recurrentabsence of detection of lysogens. This would imply thatlysogeny, although not always detectable, remainsan important replication strategy in these systems(Weinbauer and Suttle, 1996; Cochran and Paul, 1998;Bettarel et al., 2009), and that null values, presumablyresulting from recent induction events, could simply maskthe true pattern between both cycles. By analogy to theconversion equation applied between the ‘frequency ofvisibly infected cells’ and the ‘frequency of infected cells’(Binder, 1999; Weinbauer et al., 2002), future studiesshould attempt to model or quantify the experimentallimitations inherent in the evaluation of lysogeny withchemical inducers. Metagenomics approaches could becombined with induction experiments to explore theprevalence and dynamics of specific genes required forlysogeny and the integration of the viral genome, such as
integrases, GTAs, or other transcriptional regulators(Paul, 2008; Reyes et al., 2010; Sharon et al., 2011).This would enable a better evaluation of lysogeny andincreased comprehension of the underlying mechanismsregulating viral replication cycles.
Environmental factors and viral replication cycles
The dynamics of phage replication cycles have beenscarcely explored in coastal lagoons, which constituteideal systems to explore the impact of fluctuating environ-mental conditions. In this annual survey, we have selectedthree coastal lagoons differing in their levels of environ-mental variability in order to identify how this variabilityaffects lysogenic and lytic infections.
Lysogeny is thought to be strongly dependent onchanges in environmental parameters, such as tempera-ture, salinity or nutrient concentrations, where a strongenvironmental variation or shock acts as an inducingagent (Cochran and Paul, 1998; Williamson et al., 2002;Laybourn-Parry et al., 2007; Shkilnyj and Koudelka,2007). However, our results show that FLC was neithersignificantly affected by any specific environmentalparameter, nor significantly affected by their seasonalvariability. Although we cannot exclude the inducingpotential of these environmental factors on lysogeniccells, the absence of link reported here indicates that thisinduction would take place at a smaller timescale than theseasonal one we investigated. Nevertheless it is worthnoting that when we explored this issue at a finer times-cale, considering the mean and variability of these param-eters from the three sampling dates preceding thedetection of lysogens in the system, we still did not detecta significant trend (data not shown). It is possible thatadditional environmental variables such as UV light orchemical pollutants (Jiang and Paul, 1996; Marangeret al., 2002) strongly impact the occurrence of lysogeny inthese systems.
In contrast to FLC, FVIC was linked to specific environ-mental variables, i.e. FVIC increased with increasing DOCand Chl a concentrations (Fig. 5). Lytic infections havebeen shown to be nutrient-dependent, with the addition oforganic and inorganic nutrient increasing lytic viral pro-duction (Tuomi and Kuuppo, 1999; Williamson and Paul,2004). However, it is also possible that higher prokaryoteand viral abundances lead to more successful encountersbetween phages and their hosts, resulting in highersuccess of lytic infection. The positive and significantregressions between FVIC, prokaryote and viral abun-dances and contact rates all support this scenario.
Prokaryote physiology and viral replication cycles
In this study, we determined the fractions of cells activelyrespiring or with compromised membranes, representing
2470 C. F. Maurice, C. Bouvier, R. Wit and T. Bouvier
© 2013 John Wiley & Sons Ltd and Society for Applied Microbiology, Environmental Microbiology, 15, 2463–2475
two distinct levels of prokaryote physiology and activity(del Giorgio and Gasol, 2008). These fractions remainedwithin the range of previously published observations(Gasol et al., 1999; Sherr et al., 1999; Davidson et al.,2004), irrespective of the environmental fluctuationobserved in each lagoon.
The positive regression observed between the lyticcycle and the proportion of CTC+ cells (Fig. 6, explaining45% of the variance) indicates that phage replication isdependent on host metabolism, with lytic viral infectionsincreasing with higher host activity. This is further sup-ported by the negative regression observed with the pro-portion of DiBAC+ cells (Fig. 6). These results areconsistent with previous findings obtained either at thecommunity level or with isolated phage host systems(Maranger et al., 1994; You et al., 2002; Säwström et al.,2007).
Lysogeny is thought to be predominant in starvingcells, i.e. cells with a physiology that does not allow effi-cient phage production (Echols, 1972; Levin et al., 1977;Jiang and Paul, 1998), but our data did not supporta link between lysogeny and prokaryote physiology.However, lysogeny did increase with increasing sea-sonal variability in prokaryote physiology, both indepolarized and in respiring cells (Fig. 6). These resultssuggest that lysogeny is not affected directly by thelevel of prokaryote activity or membrane damage, butrather responds to the amplitude of variability in key fea-tures of prokaryote physiology. This is particularly rel-evant in transition systems such as coastal lagoons,where highly fluctuating environmental conditions canrapidly and significantly modulate prokaryote physiology,and thus the occurrence of lysogeny. This is also sug-gested by the transient and acute dynamics of FLC weobserved in all three systems. Whether variability in hostphysiology is a signal to enter the lysogenic replicationcycle or to remain in the lysogenic state remains to beexplored.
The objectives of our work were to determine the typeof pattern between the lytic and lysogenic replicationcycles in coastal lagoons, and to explore how environ-mental factors, host physiology and their variabilityaffect the occurrence and dynamics of these cycles. Thisannual survey indicates that replication cycles are regu-lated by different signals of prokaryote physiology: thelytic cycle is directly dependent on prokaryote activity,whereas the lysogenic cycle increases with the ampli-tude of change in prokaryote physiology. Using phage-host systems, one could modulate the level of variabilityin the host’s physiology, in order to identify how thisvariability translates into a signal for lysogeny at themolecular level. This would provide further insight intothe dynamics of lysogeny in natural bacterioplanktoncommunities.
Experimental procedures
Sampling
Three Mediterranean lagoons, Leucate (+42°48′23.4″N,+2°59′11.2″E), Bages (+43°03′40.8″N, +3°00′12.6″E) andGruissan (+43°06′53.1″N, +3°04′56.5″E), were sampledevery 3 weeks during a yearlong survey, from February 2008to January 2009. These lagoons were selected according totheir salinity and Chl a concentrations from previous reports(Bec et al., 2011). The first lagoon, Leucate, generally showssmall seasonal variations of Chl a and salinity (between 1 and3 mg Chl a l-1, and 33 and 38 respectively). The secondlagoon, Bages, shows strong seasonal variations of Chl aand low fluctuations of salinity (between 0.8 and 23.6 mg Chla l-1, and 29 and 40 respectively), whereas the last lagoon,Gruissan, shows strong seasonal variations of both Chl a andsalinity (between 0.3 and 24.5 mg Chl a l-1, and 17 and 44respectively). Water was sampled between 0.5 and 1 mdepth, using 5 l acid-washed dark bottles thoroughly rinsedwith milliQ water. Samples were kept cool and stored for lessthan 4 h before processing. Temperature, salinity, pH andoxygen measurements were measured directly on site with acalibrated multi-parameter Multi 350i instrument (WTW).
Environmental and chemical variables
Triplicate 50 ml samples were filtered on GF/F filters fordetermination of Chl a concentration, according to Yentschand Menzel (1963), with a Trilogy fluorometer (Turner). Toassess total nitrogen and phosphate concentrations (TN andTP respectively), triplicate samples were oxidized with per-sulfate before being analysed with a Technicon AutoanalyserAA3 (Menzel and Corwin, 1965; Raimbault and Slawik,1991).
Viral enumeration
Viral abundance was determined by epifluorescence micros-copy, following Chen and colleagues (2001). Triplicate fixedsamples (formaldehyde, 1% final concentration) were filteredonto 0.02-mm-pore-size Anodisc membranes (Whatman) andstained for 15 min with the SYBR®Gold Nucleic Acid Stain(Molecular Probes), at 2.5¥ final concentration. Sampleswere enumerated using an Olympus Provis-AX70 epifluores-cence microscope at 488 nm excitation, and a minimum of300 viruses and 20 fields per filter were counted.
Prokaryote abundance and single-cell analysisof physiology
The abundance and physiological characteristics of theprokaryote communities were determined by flow cytometry(FCM) on fresh, unfixed samples. All analyses were per-formed using a FACSCalibur Flowcytometer (Becton Dickin-son) equipped with an air-cooled argon laser providing15 mW at 488 nm and with standard filter set-up. Totalprokaryote abundance was determined after nucleic acidstaining by the SYBR®GreenI dye (Molecular Probes).Briefly, 0.5 ml subsamples were incubated with 0.5 ml of
Bacteriophage replication strategies in lagoons 2471
© 2013 John Wiley & Sons Ltd and Society for Applied Microbiology, Environmental Microbiology, 15, 2463–2475
SYBR®GreenI (10 000¥) for 15 min at room temperature inthe dark (del Giorgio et al., 1996). Stained prokaryotes thenwere discriminated and enumerated by using right angle lightscatter (SSC) and green fluorescence (FL1).
We used two different cellular characteristics, membranepolarity and respiratory enzyme activity, to describe the physi-ological state of the prokaryote cells and their level of activity.Depolarized cells were identified using the anionic membranepotential-sensitive dye DiBAC4 (Molecular Probes, 1 ml in0.5 ml sample, 10 min incubation). DiBAC4 accumulateswithin cells that have lost their membrane potential (Novoet al., 2000), and will consequently show bright green fluo-rescence (Jepras et al., 1995; Lopez-Amoros et al., 1995;Nebe-von-Caron et al., 2000). Cells with high respiratoryenzyme activity were determined after staining with 5-cyano-2,3-ditolyl tetrazolium chloride (CTC), an indicator of the res-piratory electron transport system activity (Sherr et al., 1999).Freshly prepared stock solution of 50 mmol l-1 CTC (tebu-bio)was filtered through 0.1 mm, added to 0.45 ml of sample(5 mmol l-1 final concentration) and incubated for 3 h at roomtemperature in the dark. Active cells reduce the tetrazoliumsalt CTC into its red fluorescent formazan detectable by FCM(del Giorgio et al., 1997; Sieracki et al., 1999).
The proportions of the different physiological categories(CTC+ and DiBAC+) were calculated relative to the totalprokaryote counts obtained by SYBR®GreenI staining. Fluo-rescent latex beads (0.94 mm diameter, Polysciences) weresystematically added to each sample as internal standard forcell counts, cell fluorescence and light scatter measure-ments. Bead stock solution concentration was determined byepifluorescence microscopy prior to every FCM analysis. Alldata were obtained and analysed with the CellQuest Prosoftware (BD Biosciences).
Frequency of lysogenic cells (FLC)
The proportion of mitomycin C-inducible lysogens, classicallyreferred to as the frequency of lysogenic cells (FLC), wasobtained with triplicate incubations of untreated samples(control incubations) and samples treated with the most com-monly used chemical inducer, mitomycin C (1 mg ml-1 finalconcentration; Sigma). All systems sampled were alkaline,precluding the instability of this antibiotic under acidic condi-tions (Windholz et al., 1976). Preliminary 24 h time-seriesincubations indicated that incubations longer than 17 h wereunnecessary. Three subsamples (6 h, 8 h and 17 h) of theseincubations were fixed with formaldehyde (2% final concen-tration for prokaryote and viral enumeration, as detailedpreviously). Induction took place when we observed simulta-neously significantly (P < 0.05) lower prokaryote abundanceand significantly higher viral abundance in the mitomycin Ctreatment relative to controls (Cochran and Paul, 1998;Tapper and Hicks, 1998). To calculate the frequency of lys-ogenic cells (FLC), we used the average published value ofburst size of 24 acquired from studies in marine systems(Parada et al., 2006). When induction was not detected, weconsidered that FLC = 0.
Frequency of visibly infected cells (FVIC)
The frequency of visibly infected cells FVIC was determinedby transmission electron microscopy (TEM). Briefly, 500 ml
of fixed sample (formaldehyde, 2% final concentration) werecentrifuged using an AirFuge® Ultracentrifuge (BeckmanCoulter) at 30 000 g for 10 min at 20°C on duplicate 400-mesh copper formvar, carbon-coated electron microscopegrids (Delta Microscopies). Samples were then stained withuranyl acetate (final concentration 0.5%) for 20 s and rinsedtwice in distilled water. At least 1000 prokaryote cells pergrid were observed at 40 000¥ magnification, and at anacceleration voltage of 120 kV. A cell was considered visiblyinfected when five virus-like particles could be seen in itscytoplasm (Weinbauer and Hofle, 1998; Bettarel et al.,2004).
Data treatment and statistical analyses
The contact rate between the prokaryotic hosts and viruseswas calculated using the mathematical model from Murrayand Jackson (1992): R = (Sh 2p d Dv) ¥ VP; where R is thenumber of virus attached ml-1 s-1, Sh is the Sherwood number(1), d is the prokaryote cell diameter (0.42 mm), Dv is thediffusivity of virus (eqn 9 in Murray and Jackson, 1992), andV and P are the virus and prokaryote abundance respectively.We used the average prokaryote cell size determined byepifluorescence microscopy in Thau lagoon (n = 1800 cells;measured in January, April and August); whereas the averageviral diameter was set to 45 nm, based on data from coastalsystems (Weinbauer, 2004).
To determine the effect of the annual ecosystem environ-mental variability on phage replication cycles, we calculatedan index of annual variability encountered within each lagoonby summing the coefficients of variation (CV) of the DOC, Chla, TN, TP, dissolved O2 concentration and salinity variablesmeasured over the year (n = 15 points per lagoon). However,because of the very dynamic nature of Mediterraneanlagoons, this global annual index of variability could mask thevariability of environmental variables occurring at seasonalscales (Winter: February 2008–March 2008 and December2009–January 2009; Spring: March 2008–June 2008;Summer: June 2008–September 2008; Fall: September2008–December 2008). Thus, we also calculated the sea-sonal coefficients of variation of the DOC, Chl a, TN, TP,dissolved O2 concentration and salinity, as well as the sea-sonal coefficients of variation of the prokaryote physiologicalcategories measured (CTC+ and DiBAC+ cells), and com-pared this seasonal level of variability to the seasonal meanvalues of FLC and FVIC for the lysogenic and lytic cyclesrespectively (see above).
Statistical analyses were made using the JMP 5.01 soft-ware (SAS institute). All data were checked for normality.The homoscedasticity of the variances of the abiotic andbiotic variables among lagoons were tested with Bartlett’stest, and one-way ANOVAs were performed. A posterioripairwise comparisons of means between lagoons weremade using Tukey-Kramer’s post-hoc analysis (alphalevel = 0.05). One-way ANOVAs were performed betweencontrol and mitomycin C treatment samples at each timepoint to determine whether induction took place. We alsoused a full factorial analysis of variance (ANOVA) to identifythe combined effects of prokaryote abundance and Chl aconcentration on viral abundance. We used correlationanalyses to test the links between FVIC and FLC, and
2472 C. F. Maurice, C. Bouvier, R. Wit and T. Bouvier
© 2013 John Wiley & Sons Ltd and Society for Applied Microbiology, Environmental Microbiology, 15, 2463–2475

performed regression analyses in order to test whether theFLC and FVIC were dependent of abiotic and biotic factors.Because both variables were not fixed but scattered ran-domly, we applied Model II reduced major axis regression(Sokal and Rohlf, 1995).
Acknowledgements
The authors are grateful to Dr E. Rochelle-Newall for theDOC measurements and the technical support on Chl aanalyses. Total nitrogen and phosphorus analyses weremade with the help of Dr D. Munaron and G. Messiaen fromthe Ifremer laboratory (Sète). We thank Dr M. Agis for thepreparation of TEM grids, and the Service de Microscopieélectronique et analytique (UM2) for technical support. Weacknowledge HJH and RC for editing earlier versions of thismanuscript. This work was supported by the French ANRAquaphage 07 BDIV 015-02.
References
Ackermann, H.W., and DuBow, M.S. (1987) Viruses ofProkaryotes: General Properties of Bacteriophages. BocaRaton, FL: CRC Press.
Anonymous (1959) Symposium on the classification ofbrackish waters. Venice 8–14th April 1958. Arch OceanogrLimnol 11: 243–248.
Bec, B., Collos, Y., Souchu, P., Vaquer, A., Lautier, J., Fian-drino, A., et al. (2011) Distribution of picophytoplankton andnanophytoplankton along an anthropogenic eutrophicationgradient in French Mediterranean coastal lagoons. AquatMicrob Ecol 63: 29–45.
Bergh, O., Børsheim, K.Y., Bratbak, G., and Heldal, M. (1989)High abundance of viruses found in aquatic environments.Nature 340: 467–468.
Bettarel, Y., Sime-Ngando, T., Amblard, C., and Dolan, J.(2004) Viral activity in two contrasting lake ecosystems.Appl Environ Microbiol 70: 2941–2951.
Bettarel, Y., Arfi, R., Bouvier, T., Bouvy, M., Briand, E.,Colombet, J., et al. (2008) Virioplankton distribution andactivity in a tropical eutrophicated bay. Estuar Coast ShelfSci 80: 425–429.
Bettarel, Y., Bouvier, T., and Bouvy, M. (2009) Viral persist-ence in water as evaluated from a tropical/temperatecross-incubation. J Plankton Res 31: 909–916.
Binder, B. (1999) Reconsidering the relationship betweenvirally induced bacterial mortality and frequency of infectedcells. Aquat Microb Ecol 18: 207–215.
Boras, J.A., Montserrat Sala, M., Vazques-Dominguez, E.,Weinbauer, M.G., and Vaque, D. (2009) Annual changes ofbacterial mortality due to viruses and protists in an oligo-trophic coastal environment (NW Mediterranean). EnvironMicrobiol 11: 1181–1193.
Castel, J., Caumette, P., and Herbert, R. (1996) Eutrophica-tion gradients in coastal lagoons as exemplified by theBassin d’Arcachon and the Etang du Prevost. Hydrobio-logia 329: 9–28.
Chen, F., Lu, J.R., Binder, B.J., Liu, Y.C., and Hodson, R.E.(2001) Application of digital image analysis and flow cytom-
etry to enumerate marine viruses stained with SYBR gold.Appl Environ Microbiol 67: 539–545.
Chibani-Chennoufi, S., Bruttin, A., Dillmann, M.L., andBrüssow, H. (2004) Phage-host interaction: an ecologicalperspective. J Bacteriol 186: 3677–3686.
Clarke, K.J. (1998) Virus particle production in lysogenic bac-teria exposed to protozoan grazing. FEMS Microbiol Lett166: 177–180.
Cochran, P.K., and Paul, J.H. (1998) Seasonal abundance oflysogenic bacteria in a subtropical estuary. Appl EnvironMicrobiol 64: 2308–2312.
Colombet, J., Sime Ngando, T., Cauchie, H.M., Fonty, G.,Hoffman, L., and Demeure, G. (2006) Depth-related gradi-ents of viral activity in Lake Pavin. Appl Environ Microbiol72: 4440–4445.
Davidson, A.T., Thomson, P.G., Westwood, K., and van denEnden, R. (2004) Estimation of bacterioplankton activity inTasmanian coastal waters and between Tasmania and Ant-arctica using stains. Aquat Microb Ecol 37: 33–45.
Echols, H. (1972) Developmental pathways for temperatephage – lysis vs lysogeny. Annu Rev Genet 6: 157–190.
Gasol, J.M., Zweifel, U.L., Peters, F., Fuhrman, J.A., andHagstrom, A. (1999) Significance of size and nucleic acidcontent heterogeneity as measured by flow cytometry innatural planktonic bacteria. Appl Environ Microbiol 65:4475–4483.
del Giorgio, P.A., and Bouvier, T.C. (2002) Linking the physi-ologic and phylogenetic successions in free-living bacterialcommunities along an estuarine salinity gradient. LimnolOceanogr 47: 471–486.
del Giorgio, P.A., and Gasol, J.M. (2008) Physiological struc-ture and single-cell activity in marine bacterioplankton. InMicrobial Ecology of the Oceans. Kirchman, D.L. (ed.).Hoboken, NJ, USA: Wiley-Blackwell, pp. 243–285.
del Giorgio, P.A., Bird, D.F., Prairie, Y.T., and Planas, D.(1996) Flow cytometric determination of bacterial abun-dance in lake plankton with the green nucleic acid stainSYTO 13. Limnol Oceanogr 41: 783–789.
del Giorgio, P.A., Prairie, Y.T., and Bird, D.F. (1997) Couplingbetween rates of bacterial production and the abundanceof metabolically active bacteria in lakes, enumerated usingCTC reduction and flow cytometry. Microb Ecol 34: 144–154.
Gottesman, M., and Oppenheim, A. (1994) Lysogeny andprophage. In Encyclopedia of Virology. Webster, R.G., andGranoff, A. (eds). San Diego, CA, USA: Academic Press,pp. 814–823.
Hewson, I., and Fuhrman, J.A. (2004) Richness and diversityof bacterioplankton species along an estuarine gradient inMoreton Bay, Australia. Appl Environ Microbiol 70: 3425–3433.
Ifremer (2008) Réseau de suivi lagunaire du Languedoc-Roussillon: Bilan des résultats 2007. Ifremer. p. 363.
Jepras, R.I., Carter, J., Pearson, S.C., Paul, F.E., and Wilkin-son, M.J. (1995) Development of a robust flow cytometricassay for determining numbers of viable bacteria. ApplEnviron Microbiol 61: 2696–2701.
Jiang, S.C., and Paul, J.H. (1996) Occurrence of lysogenicbacteria in marine microbial communities as determined byprophage induction. Mar Ecol Prog Ser 142: 27–38.
Bacteriophage replication strategies in lagoons 2473
© 2013 John Wiley & Sons Ltd and Society for Applied Microbiology, Environmental Microbiology, 15, 2463–2475

Jiang, S.C., and Paul, J.H. (1998) Significance of lysogenyin the marine environment: Studies with isolates and amodel of lysogenic phage production. Microb Ecol 35:235–243.
Laybourn-Parry, J., Marshall, W.A., and Madan, N.J. (2007)Viral dynamics and patterns of lysogeny in saline Antarcticlakes. Polar Biol 30: 351–358.
Levin, B.R., Stewart, F.M., and Chao, L. (1977) Resource-limited growth, competition, and predation – a model andexperimental studies with bacteria and bacteriophage. AmNat 111: 3–24.
Lopez-Amoros, R., Mason, D.J., and Lloyd, D. (1995) Use oftwo oxonols and a fluorescent tetrazolium dye to monitorstarvation of Escherichia coli in sea water. J MicrobiolMethods 22: 165–176.
Maranger, R., Bird, D.F., and Juniper, S.K. (1994) Viral andbacterial dynamics in Arctic Sea-ice during the spring algalbloom near Resolute, Nwt, Canada. Mar Ecol Prog Ser111: 121–127.
Maranger, R., del Giorgio, P.A., and Bird, D.F. (2002) Accu-mulation of damaged bacteria and viruses in lake waterexposed to solar radiation. Aquat Microb Ecol 28: 213–227.
Maurice, C.F., Bouvier, T., Comte, J., Guillemette, F.,and del Giorgio, P.A. (2010) Seasonal variations of phagelife strategies and bacterial physiological states in threenorthern temperate lakes. Environ Microbiol 12: 628–641.
Menzel, D.W., and Corwin, N. (1965) The measurement oftotal phosphorus in seawater based on the liberation oforganically bound fractions by persulfate oxidation. LimnolOceanogr 10: 280–282.
Murray, A.G., and Jackson, G.A. (1992) Viral dynamics – amodel of the effects of size, shape, motion and abundanceof single-celled planktonic organisms and other particles.Mar Ecol Prog Ser 89: 103–116.
Nebe-von-Caron, G., Stephens, P.J., Hewitt, C.J., Powell,J.R., and Badley, R.A. (2000) Analysis of bacterial functionby multiparameter flow cytometry and single cell sorting.J Microbiol Methods 42: 97–114.
Novo, D.J., Perlmutter, N.G., Hunt, R.H., and Shapiro, H.M.(2000) Multiparameter flow cytometric analysis of antibioticeffects on membrane potential, membrane permeability,and bacterial counts of Staphylococcus aureus and Micro-coccus luteus. Antimicrob Agents Chemother 44: 827–834.
Parada, V., Herndl, G.J., and Weinbauer, M.G. (2006) Viralburst size of heterotrophic prokaryotes in aquatic systems.J Mar Biol Assoc UK 86: 613–621.
Paul, J.H. (2008) Prophages in marine bacteria: dangerousmolecular time bombs or the key to survival in the sea?ISME J 2: 579–589.
Pradeep Ram, A.S., and Sime-Ngando, T. (2010) Resourcesdrive trade-off between viral lifestyles in the plankton: evi-dence from freshwater microbial microcosms. EnvironMicrobiol 12: 467–479.
Raimbault, P., and Slawik, G. (1991) A semiautomatic, wetoxidation method for the determination of particulateorganic nitrogen collected on filters. Limnol Oceanogr 36:405–408.
Reyes, A., Haynes, M., Hanson, N., Angly, F.E., Heath, A.C.,
Rohwer, F., and Gordon, J.I. (2010) Viruses in the faecalmicrobiota of monozygotic twins and their mothers. Nature466: 334–338.
Riemann, L., and Middelboe, M. (2002) Stability of bacterialand viral community compositions in Danish coastal watersas depicted by DNA fingerprinting techniques. AquatMicrob Ecol 27: 219–232.
Säwström, C., Anesio, M.A., Granéli, W., and Laybourn-Parry, J. (2007) Seasonal viral loop dynamics in two largeultraoligotrophic Antarctic freshwater lakes. Microb Ecol53: 1–11.
Sharon, I., Battchikova, N., Aro, E.M., Giglione, C., Meinnel,T., Glaser, F., et al. (2011) Comparative metagenomics ofmicrobial traits within oceanic viral communities. ISME J 7:1178–1190.
Sherr, B.F., del Giorgio, P., and Sherr, E.B. (1999) Estimatingabundance and single-cell characteristics of respiring bac-teria via the redox dye CTC. Aquat Microb Ecol 18: 117–131.
Shkilnyj, P., and Koudelka, G.B. (2007) Effect of salt shock onstability of lambda imm434 lysogens. J Bacteriol 189:3115–3123.
Sieracki, M.E., Cucci, T.L., and Nicinski, J. (1999) Flow cyto-metric analysis of 5-cyano-2,3-ditolyl tetrazolium chlorideactivity of marine bacterioplankton in dilution cultures. ApplEnviron Microbiol 65: 2409–2417.
Sokal, R.R., and Rohlf, F.J. (1995) Biometry, the Principlesand Practice of Statistics in Biological Research, 3rd edn.New York: W.H. Friedman and Company.
Tapper, M.A., and Hicks, R.E. (1998) Temperate viruses andlysogeny in Lake Superior bacterioplankton. Limnol Ocea-nogr 43: 95–103.
Tuomi, P., and Kuuppo, P. (1999) Viral lysis and grazing lossof bacteria in nutrient- and carbon-manipulated brackishwater enclosures. J Plankton Res 21: 923–937.
Weinbauer, M.G. (2004) Ecology of prokaryotic viruses.FEMS Microbiol Rev 28: 127–181.
Weinbauer, M.G., and Hofle, M.G. (1998) Distribution and lifestrategies of two bacterial populations in a eutrophic Lake.Appl Environ Microbiol 64: 3776–3783.
Weinbauer, M.G., and Suttle, C.A. (1996) Potential signifi-cance of lysogeny to bactériophage production and bacte-rial mortality in coastal waters of the gulf of Mexico. ApplEnviron Microbiol 62: 4374–4380.
Weinbauer, M.G., Winter, C., and Hofle, M.G. (2002)Reconsidering transmission electron microscopy basedestimates of viral infection of bacterioplankton using con-version factors derived from natural communities. AquatMicrob Ecol 24: 103–110.
Weinbauer, M.G., Brettar, I., and Hofle, M.G. (2003) Lysog-eny and virus-induced mortality of bacterioplankton insurface, deep, and anoxic marine waters. Limnol Oceanogr48: 1457–1465.
Williamson, S.J., and Paul, J.H. (2004) Nutrient stimulation oflytic phage production in bacterial populations of the Gulf ofMexico. Aquat Microb Ecol 36: 9–17.
Williamson, S.J., Houchin, L.A., McDaniel, L., and Paul, J.H.(2002) Seasonal variation in lysogeny as depicted byprophage induction in Tampa Bay, Florida. Appl EnvironMicrobiol 68: 4307–4314.
Windholz, M., Budavari, S., Stroumtsos, L.Y., and Fertig,
2474 C. F. Maurice, C. Bouvier, R. Wit and T. Bouvier
© 2013 John Wiley & Sons Ltd and Society for Applied Microbiology, Environmental Microbiology, 15, 2463–2475
M.N. (1976) The Merck Index: An Encyclopedia ofChemicals and Drugs, 9th edn. Rahway, NJ, USA: Merck &Co.
Wommack, K.E., and Colwell, R.R. (2000) Virioplankton:viruses in aquatic ecosystems. Microbiol Mol Biol Rev 64:69–114.
Yentsch, C.S., and Menzel, D.W. (1963) A method for deter-mination of phytoplankton chlorophyll and pheophytin byfluorescence. Deep Sea Res 10: 221–231.
You, L., Suthers, P.F., and Yin, J. (2002) Effects ofEscherichia coli physiology on growth of phage T7 in vivoand in silico. J Bacteriol 184: 1888–1894.
Bacteriophage replication strategies in lagoons 2475
© 2013 John Wiley & Sons Ltd and Society for Applied Microbiology, Environmental Microbiology, 15, 2463–2475
Copyright © 2022 FDOKUMEN