Bacteriophage targeting of gut bacterium attenuates alcoholic ...
47
Bacteriophage targeting of gut bacterium attenuates alcoholic liver disease Yi Duan #1,2 , Cristina Llorente #1,2 , Sonja Lang 1 , Katharina Brandl 3 , Huikuan Chu 1 , Lu Jiang 1,2 , Richard C. White 4 , Thomas H. Clarke 4 , Kevin Nguyen 4 , Manolito Torralba 5 , Yan Shao 6 , Jinyuan Liu 7 , Adriana Hernandez-Morales 8 , Lauren Lessor 9 , Imran R. Rahman 10 , Yukiko Miyamoto 1 , Melissa Ly 11 , Bei Gao 1 , Weizhong Sun 1 , Roman Kiesel 1 , Felix Hutmacher 1 , Suhan Lee 1 , Meritxell Ventura-Cots 12 , Francisco Bosques-Padilla 13 , Elizabeth C. Verna 14 , Juan G. Abraldes 15 , Robert S. Brown Jr 16 , Victor Vargas 17,18 , Jose Altamirano 17 , Juan Caballería 18,19 , Debbie L. Shawcross 20 , Samuel B. Ho 1,2 , Alexandre Louvet 21 , Michael R. Lucey 22 , Philippe Mathurin 21 , Guadalupe Garcia-Tsao 23 , Ramon Bataller 12 , Xin M. Tu 7 , Lars Eckmann 1 , Wilfred A. van der Donk 10,24,25 , Ry Young 8,9 , Trevor D. Lawley 6 , Peter Stärkel 26 , David Pride 1,11,27 , Derrick E. Fouts 4 , Bernd Schnabl 1,2,27 1 Department of Medicine, University of California San Diego, La Jolla, CA, USA 2 Department of Medicine, VA San Diego Healthcare System, San Diego, CA, USA 3 Skaggs School of Pharmacy and Pharmaceutical Sciences, University of California San Diego, La Jolla, CA, USA 4 J. Craig Venter Institute, Rockville, MD, USA 5 J. Craig Venter Institute, La Jolla, CA, USA 6 Host-Microbiota Interactions Laboratory, Wellcome Sanger Institute, Wellcome Genome Campus, Hinxton, UK 7 Division of Biostatistics and Bioinformatics, Department of Family Medicine and Public Health, University of California San Diego, La Jolla, CA, USA Users may view, print, copy, and download text and data-mine the content in such documents, for the purposes of academic research, subject always to the full Conditions of use:http://www.nature.com/authors/editorial_policies/license.html#terms Correspondence and requests for materials should be addressed to Bernd Schnabl, M.D., Department of Medicine, University of California San Diego, MC0063, 9500 Gilman Drive, La Jolla, CA 92093, Phone 858-822-5311, Fax 858-822-5370, [email protected]. Author contributions Y.D. was responsible for acquisition, analysis and interpretation of data, and drafting of the manuscript; C.L. was responsible for study concept and design, acquisition, analysis and interpretation of data and key preliminary experiments; S.L., K.B., J.L. and X.M.T. provided assistance on statistical analysis; H.C., L.J., B.G., W.S., R.K., F.H. and S.L. provided assistance on data acquisition; R.C.W., T.H.C., K.N., M.G.T. and D.E.F. were responsible for 16S rRNA sequencing, bacteriophage genome sequencing and data analysis; Y.S. and T.D.L. were responsible for bacterial genome sequencing and data analysis; A.H., L.L. and R.Y. provided assistance on bacteriophage studies and were responsible for electron microscopy data; R.Y. provided critical revision of the manuscript; I.R.R. and W.A.D. were responsible for cytolysin expression and purification; Y.M. and L.E. provided assistance in the design and conduct of the gnotobiotic mouse studies; M.L. and D.P. provided assistance on bacteriophage isolation; M.V., F.B., E.C.V., J.G.A., R.S.B., V.V., J.A., J.C., D.L.S., S.B.H., A.L., M.R.L., P.M., G.G., R.B. and P.S. were responsible for collection of human samples; D.E.F. and B.S. were responsible for the study concept and design, and editing the manuscript; B.S. was responsible for study supervision. Reprints and permissions information is available at www.nature.com/reprints Competing interests B.S. is consulting for Ferring Research Institute. However, there is no competing interest with regard to this study. All other authors declare no competing interests. Europe PMC Funders Group Author Manuscript Nature. Author manuscript; available in PMC 2020 May 13. Published in final edited form as: Nature. 2019 November ; 575(7783): 505–511. doi:10.1038/s41586-019-1742-x. Europe PMC Funders Author Manuscripts Europe PMC Funders Author Manuscripts
-
Upload
khangminh22 -
Category
Documents
-
view
2 -
download
0
Transcript of Bacteriophage targeting of gut bacterium attenuates alcoholic ...

Bacteriophage targeting of gut bacterium attenuates alcoholic liver disease
Yi Duan#1,2, Cristina Llorente#1,2, Sonja Lang1, Katharina Brandl3, Huikuan Chu1, Lu Jiang1,2, Richard C. White4, Thomas H. Clarke4, Kevin Nguyen4, Manolito Torralba5, Yan Shao6, Jinyuan Liu7, Adriana Hernandez-Morales8, Lauren Lessor9, Imran R. Rahman10, Yukiko Miyamoto1, Melissa Ly11, Bei Gao1, Weizhong Sun1, Roman Kiesel1, Felix Hutmacher1, Suhan Lee1, Meritxell Ventura-Cots12, Francisco Bosques-Padilla13, Elizabeth C. Verna14, Juan G. Abraldes15, Robert S. Brown Jr16, Victor Vargas17,18, Jose Altamirano17, Juan Caballería18,19, Debbie L. Shawcross20, Samuel B. Ho1,2, Alexandre Louvet21, Michael R. Lucey22, Philippe Mathurin21, Guadalupe Garcia-Tsao23, Ramon Bataller12, Xin M. Tu7, Lars Eckmann1, Wilfred A. van der Donk10,24,25, Ry Young8,9, Trevor D. Lawley6, Peter Stärkel26, David Pride1,11,27, Derrick E. Fouts4, Bernd Schnabl1,2,27
1Department of Medicine, University of California San Diego, La Jolla, CA, USA
2Department of Medicine, VA San Diego Healthcare System, San Diego, CA, USA
3Skaggs School of Pharmacy and Pharmaceutical Sciences, University of California San Diego, La Jolla, CA, USA
4J. Craig Venter Institute, Rockville, MD, USA
5J. Craig Venter Institute, La Jolla, CA, USA
6Host-Microbiota Interactions Laboratory, Wellcome Sanger Institute, Wellcome Genome Campus, Hinxton, UK
7Division of Biostatistics and Bioinformatics, Department of Family Medicine and Public Health, University of California San Diego, La Jolla, CA, USA
Users may view, print, copy, and download text and data-mine the content in such documents, for the purposes of academic research, subject always to the full Conditions of use:http://www.nature.com/authors/editorial_policies/license.html#terms
Correspondence and requests for materials should be addressed to Bernd Schnabl, M.D., Department of Medicine, University of California San Diego, MC0063, 9500 Gilman Drive, La Jolla, CA 92093, Phone 858-822-5311, Fax 858-822-5370, [email protected].
Author contributionsY.D. was responsible for acquisition, analysis and interpretation of data, and drafting of the manuscript; C.L. was responsible for study concept and design, acquisition, analysis and interpretation of data and key preliminary experiments; S.L., K.B., J.L. and X.M.T. provided assistance on statistical analysis; H.C., L.J., B.G., W.S., R.K., F.H. and S.L. provided assistance on data acquisition; R.C.W., T.H.C., K.N., M.G.T. and D.E.F. were responsible for 16S rRNA sequencing, bacteriophage genome sequencing and data analysis; Y.S. and T.D.L. were responsible for bacterial genome sequencing and data analysis; A.H., L.L. and R.Y. provided assistance on bacteriophage studies and were responsible for electron microscopy data; R.Y. provided critical revision of the manuscript; I.R.R. and W.A.D. were responsible for cytolysin expression and purification; Y.M. and L.E. provided assistance in the design and conduct of the gnotobiotic mouse studies; M.L. and D.P. provided assistance on bacteriophage isolation; M.V., F.B., E.C.V., J.G.A., R.S.B., V.V., J.A., J.C., D.L.S., S.B.H., A.L., M.R.L., P.M., G.G., R.B. and P.S. were responsible for collection of human samples; D.E.F. and B.S. were responsible for the study concept and design, and editing the manuscript; B.S. was responsible for study supervision.
Reprints and permissions information is available at www.nature.com/reprints
Competing interestsB.S. is consulting for Ferring Research Institute. However, there is no competing interest with regard to this study. All other authors declare no competing interests.
Europe PMC Funders GroupAuthor ManuscriptNature. Author manuscript; available in PMC 2020 May 13.
Published in final edited form as:Nature. 2019 November ; 575(7783): 505–511. doi:10.1038/s41586-019-1742-x.
Europe PM
C Funders A
uthor Manuscripts
Europe PM
C Funders A
uthor Manuscripts

8Department of Biochemistry and Biophysics, Texas A&M University, College Station, TX, USA
9Center for Phage Technology, Texas A&M AgriLife Research and Texas A&M University, College Station, TX, USA
10Department of Biochemistry, University of Illinois at Urbana-Champaign, Urbana, IL, USA
11Department of Pathology, University of California San Diego, La Jolla, CA, USA
12Division of Gastroenterology, Hepatology and Nutrition, Department of Medicine, University of Pittsburgh Medical Center, Pittsburgh Liver Research Center, Pittsburgh, PA, USA
13Hospital Universitario, Departamento de Gastroenterología, Universidad Autonoma de Nuevo Leon, Monterrey, México
14Division of Digestive and Liver Diseases, Department of Medicine, Columbia University College of Physicians and Surgeons, New York, NY, USA
15Department of Medicine, University of Alberta, Edmonton, Alberta, Canada
16Division of Gastroenterology and Hepatology, Weill Cornell Medical College, New York, NY, USA
17Liver Unit, Hospital Universitari Vall d'Hebron, Universitat Autònoma de Barcelona, Barcelona, Spain
18Centro de Investigación en Red de Enfermedades Hepáticas y Digestivas (CIBEREHD), Barcelona, Spain
19Liver Unit, Hospital Clinic, Barcelona, Spain
20Liver Sciences, Department of Inflammation Biology, School of Infectious Diseases and Microbial Sciences, King's College London, London, UK
21Service des Maladies de L'appareil Digestif et Unité INSERM, Hôpital Huriez, Lille, France
22Division of Gastroenterology and Hepatology, Department of Medicine, University of Wisconsin School of Medicine and Public Health, WI, USA
23Section of Digestive Diseases, Yale University School of Medicine, New Haven, CT, USA, and Section of Digestive Diseases, VA-CT Healthcare System, West Haven, CT, USA
24Department of Chemistry, University of Illinois at Urbana-Champaign, Urbana, IL, USA
25Howard Hughes Medical Institute, University of Illinois at Urbana-Champaign, Urbana, IL, USA
26St. Luc University Hospital, Université Catholique de Louvain, Brussels, Belgium
27Center for Innovative Phage Applications and Therapeutics, University of California San Diego, La Jolla, CA, USA
# These authors contributed equally to this work.
Summary
Chronic liver disease due to alcohol use disorder contributes markedly to the global burden of
disease and mortality1–3. Alcoholic hepatitis is a severe and life-threatening form of alcohol-
Duan et al. Page 2
Nature. Author manuscript; available in PMC 2020 May 13.
Europe PM
C Funders A
uthor Manuscripts
Europe PM
C Funders A
uthor Manuscripts

associated liver disease. The gut microbiota promotes ethanol-induced liver disease in mice4, but
little is known about microbial factors responsible for this process. We identified cytolysin, a two-
subunit exotoxin secreted by Enterococcus faecalis (E. faecalis)5,6, to cause hepatocyte death and
liver injury. Compared with controls, patients with alcoholic hepatitis have increased fecal
numbers of E. faecalis. The presence of cytolysin-positive (cytolytic) E. faecalis correlated with
liver disease severity and mortality in patients with alcoholic hepatitis. Using humanized mice
colonized with bacteria from feces of patients with alcoholic hepatitis, we investigated the
therapeutic effects of bacteriophages that target cytolytic E. faecalis. We found these phages to
decrease cytolysin in the liver and abolish ethanol-induced liver disease in humanized mice. Our
findings link cytolysin-positive E. faecalis with worse clinical outcomes and mortality in patients
with alcoholic hepatitis. We show that bacteriophages can specifically target cytolytic E. faecalis,
providing a method to precisely edit the intestinal microbiota. A prospective clinical trial with a
larger cohort is required to validate human relevance of our findings and to test whether this new
therapeutic approach is effective for patients with alcoholic hepatitis.
The most severe form of alcohol-related liver disease is alcoholic hepatitis; mortality ranges
from 20% to 40% at 1–6 months, and as many as 75% of patients die within 90 days of a
diagnosis of severe alcoholic hepatitis7−9. Therapy with corticosteroids is only marginally
effective9. Early liver transplantation is the only curative therapy, but is offered only at select
centers, to a limited group of patients10.
Alcohol-related liver disease can be transmitted via fecal microbiota4. We investigated
microbes and microbial factors responsible for this transmissible phenotype and for
progression of alcohol-related liver disease.
Cytolysin presence associates with increased mortality
To determine whether chronic alcohol use and alcoholic hepatitis are associated with an
altered composition of the fecal microbiota, 16S ribosomal RNA (rRNA) gene sequencing
was performed. Differences in fecal microbiota composition were noted in patients with
alcohol use disorder and alcoholic hepatitis, compared to subjects without alcohol use
disorder (controls) (Fig. 1a; Extended Data Fig. 1a–1b; Supplementary Tables 1 and 2). One
significant difference we observed was an increase in the proportion of Enterococcus spp. In
patients with alcoholic hepatitis, 5.59% of fecal bacteria were Enterococcus spp, compared
with almost none in controls (0.023%; 0.004% of all reads in the Human Microbiome
Project) or patients with alcohol use disorder (0.024%). Fecal samples from patients with
alcoholic hepatitis had about 2,700-fold more Enterococcus faecalis (E. faecalis) than
samples from controls, measured by quantitative PCR (qPCR) (Extended Data Fig. 1c),
consistent with 16S rRNA sequencing results. About 80% of alcoholic hepatitis patients are
E. faecalis positive in feces (Extended Data Fig. 1d).
Colonization of mice with E. faecalis induces mild hepatic steatosis and exacerbates ethanol-
induced liver disease11 by unclear mechanisms. Cytolysin is a bacterial exotoxin
(bacteriocin) produced by E. faecalis12 that contains two post-translationally modified
peptides, CylLL” and CylLS”, in its bioactive form6. The two peptides are encoded by two
separate genes, cylLL and cylLS12. Cytolysin has lytic activity against not only Gram-
Duan et al. Page 3
Nature. Author manuscript; available in PMC 2020 May 13.
Europe PM
C Funders A
uthor Manuscripts
Europe PM
C Funders A
uthor Manuscripts

positive bacteria but also eukaryotic cells13. We detected cylLL and cylLS genomic DNA
(cytolysin-positive) in fecal samples from 30% of patients with alcoholic hepatitis; none of
the fecal samples from controls and only one sample from a patient with alcohol use
disorder was cytolysin-positive, detected by qPCR (Fig. 1b). Importantly, 89% of cytolysin-
positive patients with alcoholic hepatitis died within 180 days after admission compared to
only 3.8% of cytolysin-negative patients (P<0.0001) (Fig. 1c). Among those cytolysin-
positive patients, 72.2% died due to liver failure (including liver failure related
complications such as gastrointestinal bleeding) (Supplementary Table 2). Infection was not
associated with 30-day, 90-day or 180-day mortality (P=0.403, 0.234 or 0.098) in patients
with alcoholic hepatitis.
Univariate logistic and Cox regression of laboratory and clinical parameters associated
detection of cytolysin-encoding genes in feces with international normalized ratio (INR),
platelet count, model for end-stage liver disease (MELD) score, sodium MELD (MELDNa)
score, age, serum bilirubin, INR, and serum creatinine (ABIC) score, and death
(Supplementary Table 3). In the multivariate Cox analysis, detection of cytolysin-encoding
genes in feces was still associated with 90-day (P=0.004) or 180-day mortality (P=0.001)
(Supplementary Table 3), after we adjusted for the geographic origin of the patients;
antibiotic treatment; platelet count; and creatinine, bilirubin, and INR as components of the
MELD score. We found no serious multicollinearity between detection of fecal cytolysin
and these cofactors (variance inflation factor (VIF) <1.6), indicating that cytolysin is an
independent predictor of mortality in patients with alcoholic hepatitis. When we performed
receiver operating characteristic (ROC) curve analysis for 90-day mortality, cytolysin had an
AUC of 0.81, which was superior to other widely used predictors for mortality in clinical
practice (Extended Data Fig. 1e). Based on our findings, we propose that the detection of
cytolysin may be a prognostic factor for worse liver-related outcomes and death, and a
stronger predictor of mortality than MELD, ABIC, and discriminant function (DF).
To determine phylogeny of E. faecalis in patients with alcoholic hepatitis, we performed
targeted culturing from stool samples. Whole-genome sequencing of 93 E. faecalis isolates
revealed broad phylogenetic diversity of cytolysin-positive E. faecalis from patients with
alcoholic hepatitis (Fig. 1d), indicating that cytolysin production is a variable trait among E. faecalis isolates and that cytolysin is carried in mobile (genetic) elements, which include
both chromosomally-encoded pathogenicity islands (PAI) and plasmids14. Detection of any
other antimicrobial resistance genes or virulence genes in E. faecalis isolates did not
correlate with disease severity or mortality in patients with alcoholic hepatitis
(Supplementary Table 4).
The total amount of fecal E. faecalis or fecal E. faecalis positivity did not correlate with
disease severity or mortality in patients with alcoholic hepatitis (Supplementary Tables 5 and
6). Cytolysin-positive and cytolysin-negative patients with alcoholic hepatitis had similar
amounts of fecal E. faecalis (Extended Data Fig. 1f). Although there were differences in the
composition of the gut microbiota in patients with alcoholic hepatitis from different
geographic regions (Extended Data Fig. 1g), the proportion of cytolysin-positive patients,
total amount of fecal E. faecalis, fecal E. faecalis positivity (Extended Data Fig. 1h–1j),
treatment, and clinical outcomes (30 day and 90 day mortality) did not differ significantly
Duan et al. Page 4
Nature. Author manuscript; available in PMC 2020 May 13.
Europe PM
C Funders A
uthor Manuscripts
Europe PM
C Funders A
uthor Manuscripts

among the regions/centers (Supplementary Table 7). In addition, cirrhosis was not associated
with cytolysin-positivity, the total amount of fecal E. faecalis, or fecal E. faecalis positivity
in alcoholic hepatitis patients (Extended Data Fig. 1k–1m; Supplementary Tables 4–6).
These results confirm our findings that the presence of cytolysin producing E. faecalis,
rather than the total amount or presence of E. faecalis, determines the severity of alcoholic
hepatitis and mortality.
Cytolysin promotes ethanol-induced liver disease
To determine whether cytolysin contributes to liver damage mediated by E. faecalis, we
gavaged mice with a cytolytic E. faecalis strain (FA2-2(pAM714)) or a non-cytolytic E. faecalis strain (FA2-2(pAM771))5; the mice were then placed on a chronic–binge ethanol
diet15. Compared to mice given phosphate-buffered saline (PBS), mice fed ethanol after they
were gavaged with cytolytic E. faecalis developed more severe liver injury, indicated by
higher level of alanine amino-transferase (ALT) (Extended Data Fig. 2a) and increased
hepatic steatosis (Extended Data Fig. 2b and 2c). Mice fed ethanol after they were gavaged
with cytolytic E. faecalis also had more liver inflammation with higher expression levels of
mRNAs encoding inflammatory cytokines and chemokines (Il1b, Cxcl1, and Cxcl2)
(Extended Data Fig. 2d–2f) compared with mice given PBS. Mice fed ethanol after they
were gavaged with non-cytolytic E. faecalis had significantly less ethanol-induced liver
injury, steatosis, and inflammation (Extended Data Fig. 2a–2f) and longer survival times
(Extended Data Fig. 2g), compared with mice fed ethanol after they were administered
cytolytic E. faecalis.
To explore the mechanism of cytolysin-associated liver damage, we measured cytolysin in
the liver. CylLS was significantly increased in livers of mice given cytolytic E. faecalis but
not mice that were not given E. faecalis or mice gavaged with non-cytolytic E. faecalis following chronic ethanol administration (Extended Data Fig. 2h). E. faecalis was detectable
in the liver of mice given cytolytic and non-cytolytic E. faecalis and fed an ethanol diet, but
not when fed an isocaloric (control) diet (Extended Data Fig. 2i), indicating that ethanol-
induced changes in the gut barrier are necessary for translocation of cytolytic E. faecalis from the intestine to the liver. Livers of ethanol-fed mice given cytolytic and non-cytolytic E. faecalis had positive E. faecalis cultures (Extended Data Fig. 2j). We observed increased
intestinal permeability in ethanol-fed mice compared with isocaloric diet-fed mice, but this
was independent of gavaging cytolytic or non-cytolytic E. faecalis following chronic ethanol
administration (Extended Data Fig. 2k), indicating that cytolysin does not affect intestinal
barrier function.
Administration of cytolytic or non-cytolytic E. faecalis to mice did not significantly change
the composition of the intestinal microbiota, based on 16S rRNA gene sequencing
(Extended Data Fig. 2l). Cytolytic E. faecalis did not affect intestinal absorption or hepatic
metabolism of ethanol, based on serum levels of ethanol and hepatic levels of Adh1 and
Cyp2e1 mRNAs (encoding the two primary enzymes that metabolize ethanol in the liver)
(Extended Data Fig. 2m and 2n). These results indicate that E. faecalis that produce
cytolysin promote ethanol-induced liver disease in mice.
Duan et al. Page 5
Nature. Author manuscript; available in PMC 2020 May 13.
Europe PM
C Funders A
uthor Manuscripts
Europe PM
C Funders A
uthor Manuscripts

To extend our findings to humans, we colonized germ-free mice with feces from cytolysin-
positive and -negative patients with alcoholic hepatitis (Supplementary Table 8). Consistent
with our findings from mice colonized with cytolytic E. faecalis, gnotobiotic C57BL/6 mice
colonized with feces from two different cytolysin-positive patients developed more severe
ethanol-induced liver injury, steatosis, inflammation, and fibrosis than mice given feces from
two different cytolysin-negative patients (Fig. 2a–2f; Extended Data Fig. 3a–3d).
Transplantation of feces from cytolysin-positive patients reduced survival time of the mice
(Extended Data Fig. 3e) and increased translocation of cytolytic E. faecalis to the liver
following ethanol administration (Fig. 2g). Overall composition of the intestinal microbiota
was not different between mice colonized with feces from cytolysin-positive or -negative
alcoholic hepatitis donors following the control diet, based on 16S rRNA gene sequencing.
Mice transplanted with feces from one cytolysin-positive alcoholic hepatitis patient (#2)
showed a microbiota significantly different from the other mouse groups following ethanol
administration (Extended Data Fig. 3f). Interestingly, non-cytolytic E. faecalis was not
detected in stool samples from donors with cytolytic E. faecalis (Extended Data Fig. 3g). We
did not observe differences in intestinal absorption or hepatic metabolism of ethanol
between mice colonized with feces from cytolysin-positive vs cytolysin-negative patients
(Extended Data Fig. 3h and 3i). Together, these results provide further evidence that
cytolysin promotes ethanol-induced liver disease.
To determine the mechanism by which cytolysin increases liver disease, we isolated
hepatocytes from mice on ethanol or control diets and stimulated them with pure bioactive
cytolysin peptides (CylLL” and CylLS”)6. Incubation of the primary mouse hepatocytes with
two cytolysin subunits caused a dose-dependent increase in cell death compared to
hepatocytes incubated with vehicle or with one subunit alone (Fig. 2h). Interestingly, when
we isolated hepatocytes from ethanol-fed mice and then incubated those hepatocytes with
ethanol, we did not observe increased levels of cytolysin-induced cell death compared to
hepatocytes isolated from mice on the control diet, indicating that cytolysin-induced
hepatocyte cell death was independent of ethanol. The cytotoxic effects of cytolysin are
likely mediated by pore formation, resulting in cell lysis14.
Bacteriophage treatment attenuates alcohol-related liver disease in mice
To further demonstrate the potential causative role of cytolytic E. faecalis for the
development of ethanol-induced steatohepatitis, we investigated the effects of treatment with
bacteriophages. Bacteriophages (phages) are ubiquitous in bacteria-rich environment,
including the gut16. E. faecalis phages that are highly-strain specific can be isolated17,
potentially making direct editing of gut microbiota feasible. We have shown that Atp4aSl/Sl
mice, which lack gastric acid, have overgrowth of intestinal enterococci, associated with
increased susceptibility to alcohol-induced steatohepatitis11. Gavaging of wild-type mice
with an E. faecalis strain isolated from Atp4aSl/Sl mice increased ethanol-induced
steatohepatitis11. We found that this E. faecalis strain expressed cytolysin. We then isolated
four distinct bacteriophages from sewage water. These bacteriophages lyse the cytolytic E. faecalis strain isolated from Atp4aSl/Sl mice. All four phages were podophages of the
virulent Picovirinae group (Extended Data Fig. 4). Atp4aSl/Sl mice and their wild-type
littermates were then placed on the chronic–binge ethanol diet and gavaged with the lytic
Duan et al. Page 6
Nature. Author manuscript; available in PMC 2020 May 13.
Europe PM
C Funders A
uthor Manuscripts
Europe PM
C Funders A
uthor Manuscripts

bacteriophage cocktail (Extended Data Fig. 5). Bacteriophages directed against Caulobacter crescentus (C. crescentus), a bacterium that is present in fresh water lakes and streams18, but
does not colonize humans or rodents19,20, were used as controls. Compared to Atp4aSl/Sl
mice gavaged with control bacteriophage or vehicle, Atp4aSl/Sl mice gavaged with
bacteriophages that target cytolytic E. faecalis had less liver injury, steatosis, and
inflammation following chronic ethanol feeding (Extended Data Fig. 5a–5f). Administration
of E. faecalis bacteriophage significantly reduced levels of cytolysin in the liver (Extended
Data Fig. 5g) and fecal amounts of Enterococcus (Extended Data Fig. 5h). Bacteriophage
administration did not affect the overall composition of the fecal microbiome, intestinal
absorption or hepatic metabolism of ethanol (Extended Data Fig. 5i–5k).
To develop a novel therapeutic approach to precisely edit the intestinal microbiota, cytolytic
E. faecalis strains were cultured from fecal samples of patients with alcoholic hepatitis. We
then isolated lytic bacteriophages from sewage water against these cytolytic E. faecalis strains and these phages had siphophage or myophage morphology (Fig. 3a; Extended Data
Fig. 6). Gnotobiotic mice were colonized with feces from two different cytolysin-positive
patients with alcoholic hepatitis (Supplementary Table 8) and given 3–4 different, but
patient-specific lytic phages against cytolytic E. faecalis. The phages against cytolytic E. faecalis abolished ethanol-induced liver injury and steatosis, based on lower levels of ALT,
percentage of TUNEL-positive hepatic cells, hepatic triglycerides and oil red O-staining
(Fig. 3b–3d; Extended Data Fig. 7a–7b), decreased hepatic levels of Il1b, Cxcl1, Cxcl2, Col1a1 and Acta2 mRNAs, and reduced hepatic levels of cylLs, compared with mice given
control phages (against C. crescentus) (Fig. 3e–3h; Extended Data Fig. 7c–7d). Treatment
with phages against cytolytic E. faecalis also reduced fecal amounts of Enterococcus (Extended Data Fig. 7e) without affecting the overall composition of the gut microbiota
(Extended Data Fig. 7f). Intestinal absorption of ethanol and hepatic metabolism were
similar in all groups (Extended Data Fig. 7g–7h).
To demonstrate that the effect of bacteriophage treatment occurs via targeting of cytolysin-
positive E. faecalis, rather than reduction in cytolysin-negative E. faecalis, we colonized
gnotobiotic mice with feces from cytolysin-negative patients with alcoholic hepatitis
(Supplementary Table 8). Bacteriophages against non-cytolytic E. faecalis from patients
were isolated from sewage water, and they had siphophage or podophage morphology (Fig.
4a; Extended Data Fig. 8). These phages did not reduce features of ethanol-induced liver
disease compared with control phages (Fig. 4b–4g; Extended Data Fig. 9a–9h), despite the
reduction of fecal Enterococcus (Fig. 4h). Our findings indicate that lytic bacteriophage
treatment can selectively attenuate ethanol-induced liver disease caused by cytolysin-
positive E. faecalis in humanized mice.
Discussion
Phage-based therapies have been studied predominantly in patients with bacterial infections
in the gastrointestinal tract21−23, urinary tract24,25 and other organ systems26−28. The results
of these studies, while mixed in terms of efficacy, strongly suggest that phage treatment
offers a safe alternative to antibiotics26,27. However, safety studies are required for complex
populations such as patients with alcoholic hepatitis, since phages can induce a strong
Duan et al. Page 7
Nature. Author manuscript; available in PMC 2020 May 13.
Europe PM
C Funders A
uthor Manuscripts
Europe PM
C Funders A
uthor Manuscripts

immune reaction29. Future work is required to determine if bacteriophages that target
cytolytic E. faecalis might be used to treat patients with alcoholic hepatitis, a life-threatening
disease with no effective treatment. Our data also suggest that cytolysin may be used as a
predictive biomarker of severe alcoholic hepatitis; So an independent, prospective cohort is
now needed to validate cytolysin as a biomarker and to extend the bacteriophage findings to
human patients.
Eradication of this specific bacterial strain might produce better outcomes than current
treatments. Remarkably, environmental sources can be used to easily isolate phages that
target cytolysin-positive E. faecalis. We provide the first example of the efficacy of phage-
based approaches in mice for a disease that is not considered a classic infectious disease. A
clinical trial with a larger cohort is required to validate human relevance of our findings and
to test this new therapeutic approach for patients with alcoholic hepatitis.
Methods
Patient cohorts
Patient cohorts have been described30−32. We evaluated 26 subjects without alcohol use
disorder (controls; social drinkers consuming less than 20 g/day), 44 patients with alcohol
use disorder, and 88 patients with alcoholic hepatitis. Patients with alcohol use disorder
fulfilling the DSM IV criteria33 of alcohol dependence and with active alcohol consumption
(self-reported > 60 g/day) presented with various stages of liver disease (21% had advanced
F3/4 fibrosis based on fibrosis-4 index (FIB-4); Supplementary Table 1). Patients with
alcohol use disorder were recruited from an alcohol withdrawal unit in San Diego, USA and
Brussels, Belgium where they followed a detoxification and rehabilitation program. At
admission to the hospital, a complete medication and medical history is taken, and a
complete physical examination is performed, including collection of biospecimens, basic
demographic data, such as age, gender, weight and height, and self-reported daily alcohol
consumption. Patients were actively drinking until the day of admission. Controls or patients
with alcohol use disorder did not take antibiotics or immunosuppressive medication during
the two months preceding enrollment. Other exclusion criteria were diabetes, inflammatory
bowel disease, known liver disease of any other etiology, and clinically significant cardio-
vascular, pulmonary or renal co-morbidities. Alcoholic hepatitis patients were enrolled from
the InTeam Consortium (ClinicalTrials.gov identifier number: NCT02075918) from centers
in the USA, Mexico, United Kingdom, France and Spain. Inclusion criteria were active
alcohol abuse (> 50 g/day for men and > 40 g/day for women) in the last 3 months, aspartate
aminotransferase (AST) > alanine aminotransferase (ALT) and total bilirubin > 3 mg/dl in
the past 3 months, liver biopsy and/or clinical picture consistent with alcoholic hepatitis.
Exclusion criteria were autoimmune liver disease (ANA > 1/320), chronic viral hepatitis,
hepatocellular carcinoma, complete portal vein thrombosis, extrahepatic terminal disease,
pregnancy, and lack of signed informed consent. In all patients, the clinical picture was
consistent with alcoholic hepatitis and in patients who underwent liver biopsy, the histology
was in line with the diagnosis of alcoholic hepatitis. Liver biopsies were only done if
clinically indicated as part of routine clinical care for diagnostic purposes of alcoholic
hepatitis. Biospecimens were collected during their admission to the hospital. The median
Duan et al. Page 8
Nature. Author manuscript; available in PMC 2020 May 13.
Europe PM
C Funders A
uthor Manuscripts
Europe PM
C Funders A
uthor Manuscripts

time of specimen collection was 4 days following admission to the hospital (range 0-24,
n=82). For one patient who underwent liver transplantation, the transplantation date was
considered as date of death. Patients were censored at the time point they were last seen
alive. The baseline characteristics are shown in Supplementary Tables 1 and 2. Fecal 16S
rRNA sequencing, Enterococcus culture and qPCR were performed. The MELD score,
ABIC score and DF were calculated from all alcoholic hepatitis patients from whom
respective laboratory values were available. The protocol was approved by the Ethics
Committee of Hôpital Huriez (Lille, France), Universidad Autonoma de Nuevo Leon
(Monterrey, México), Hospital Universitari Vall d'Hebron (Barcelona, Spain), King's College
London (London, UK), Yale University (New Haven, USA), University of North Carolina at
Chapel Hill (Chapel Hill, USA), Weill Cornell Medical College (New York, USA),
Columbia University (New York, USA), University of Wisconsin (Madison, USA), VA San
Diego Healthcare System (San Diego, USA), University of California San Diego (La Jolla,
USA) and Université Catholique de Louvain (Brussels, Belgium). Patients were enrolled
after written informed consent was obtained from each patient.
Mice
C57BL/6 mice were purchased from Charles River and used in Figure 2h and Extended Data
Figure 2. C57BL/6 germ-free mice were bred at UCSD and used in Figure 2a-2g, Figure 3,
Figure 4, Extended Data Figure 3, Extended Data Figure 7, and Extended Data Figure 9.
Sublytic Atp4aSl/Sl mice on a C57BL/6 background have been described11,34 and
heterozygous mice were used for breeding; sublytic Atp4aSl/Sl littermate mice and their
wild-type littermates were used in Extended Data Figure 5.
Female and male mice (age, 9–12 weeks) were placed on a chronic–binge ethanol diet
(NIAAA model) as described15. Mice were fed with Lieber-DeCarli diet and the caloric
intake from ethanol was 0% on days 1–5 and 36% from day 6 until the end of the study
period. At day 16, mice were gavaged with a single dose of ethanol (5 g/kg body weight) in
the early morning and sacrificed 9 hours later. Pair-fed control mice received a diet with an
isocaloric substitution of dextrose.
Stool samples from patients with alcoholic hepatitis (see Figure 1) were used for fecal
transplantation in germ-free mice. Mice were gavaged with 100 μl of stool samples (1 g
stool dissolved in 30 ml Luria-Bertani (LB) medium containing 15% glycerol under
anaerobic conditions), starting at an age of 5–6 weeks and repeated two weeks later. Two
weeks after the second gavage, mice were placed on the ethanol or control (isocaloric) diet.
In studies of the effects of cytolysin, 5 × 10⁸ colony forming units (CFUs) of a cytolytic E. faecalis strain (FA2-2(pAM714)), a non-cytolytic E. faecalis strain (FA2-2(pAM771))5 (E. faecalis Δcytolysin) (kindly provided by Dr. Michael S. Gilmore), or PBS (vehicle control)
were fed to mice by gavage every third day, starting from day 6 through day 15 of ethanol
feeding (see above). Administration every third day was necessary, given that E. faecalis does not colonize mice11 (Extended Data Fig. 2o). To determine the effect of bacteriophage
treatment, 1010 plaque forming units (PFUs) E. faecalis phages (or C. crescentus phage
phiCbK as control)35 were gavaged to the mice one day before the ethanol binge (at day 16).
Duan et al. Page 9
Nature. Author manuscript; available in PMC 2020 May 13.
Europe PM
C Funders A
uthor Manuscripts
Europe PM
C Funders A
uthor Manuscripts

All animal studies were reviewed and approved by the Institutional Animal Care and Use
Committee of the University of California, San Diego.
Bacteriophages isolation and amplification
E. faecalis strain from Atp4aSl/Sl mice feces was isolated before11 and was used to isolate
phages Efmus1, Efmus2, Efmus3 and Efmus4. E. faecalis strains from human stool samples
were isolated using methods described below and the corresponding phages were named as
Ef with patient number plus a digit (Ef for E. faecalis, last digit for isolation order). All E. faecalis strains were grown statically in brain heart infusion (BHI) broth or on BHI agar at
37°C. C. crescentus phage phiCbK was purified as previously described35.
E. faecalis phages were isolated from untreated raw sewage water obtained from North City
Water Reclamation Plant in San Diego, California. Fifty milliliter raw sewage water was
centrifuged at 8,000 x g for 1 min at room temperature (RT) to pellet large particles. The
supernatant was passed through a 0.45 μm and then a 0.2 μm syringe filter (Whatman, PES
membrane). One hundred microliter of the clarified sewage was mixed with 100 μl overnight
E. faecalis culture and then added to BHI broth top agar (0.5% agar) and poured over a BHI
plate (1.5% agar). After overnight growth at 37°C, the resulting plaques were recovered
using a sterile pipette tip in 500 μl PBS. Phages were replaqued on E. faecalis three more
times to ensure that the phages were clonal isolates.
High-titer phage stocks were propagated by infecting 200 ml of exponentially growing E. faecalis at a multiplicity of infection (MOI) of 0.1 in BHI broth containing 10 mM MgSO4.
Lysis was allowed to proceed for up to six hours at 37°C with shaking. The lysates were
centrifuged at 10,000 x g for 20min at RT to remove the remaining bacterial cells and debris.
Supernatant was then vacuum filtered through a 0.2 μm membrane filter and kept at 4°C
until use.
Before mice were gavaged, 10–20 ml lysates were concentrated using Corning Spin-X UF
Concentrators with 100,000-molecular-weight-cutoff (MWCO) to a volume of
approximately 1 ml. Following concentration, the culture medium was replaced with PBS
via diafiltration. The resulting lysate was further concentrated to a final volume of 0.5 ml
and adjusted to the required PFUs.
Whole-genome sequencing for bacteriophages
For all phages except Efmus4, 10 ml of lysates were treated with 10 μg/ml each of DNase
and RNase at 37°C for 1 hour and phages were precipitated by adding 1M NaCl and 10%
(w/v) polyethylene glycol 8000 (PEG 8000) and incubated at 4°C overnight. Precipitated
phages were then pelleted by centrifugation at 10,000 x g for 10 min at 4°C and resuspended
in 500 μl of resuspension buffer (5 mM MgSO4). Phage DNA was then extracted using
Promega Wizard DNA Clean-up kit (Promega). Phage genomes were sequenced using a
combination of Illumina and Oxford Nanopore Technologies (ONT) MinION platforms.
Illumina sequencing libraries were prepared using the Nextera XT library kit with bead-
based size selection prior to loading onto Illumina flow cells. Sequencing was performed
with either Illumina MiSeq Reagent Kit v3 in 2 × 300-bp or NextSeq 500 Mid Output Kit in
2 × 150-bp paired-end formats. ONT MinION sequencing libraries were prepared using the
Duan et al. Page 10
Nature. Author manuscript; available in PMC 2020 May 13.
Europe PM
C Funders A
uthor Manuscripts
Europe PM
C Funders A
uthor Manuscripts

Rapid Barcoding Kit (SQK-RBK004) and loaded onto MinION R9.4 flow cells. ONT reads
were basecalled with Albacore v2.3.4 (ONT). The sequence reads were demultiplexed and
adapters trimmed from ONT reads using Porechop v0.2.336. A hybrid Illumina-ONT de novo assembly was performed using the Unicycler v0.4.7 pipeline37. Subsequently, Pilon
v1.2238 was used iteratively to polish the assemblies with Illumina reads until no additional
corrections could be made.
For phage Efmus4, 109 PFUs of the phage was filtered sequentially using 0.45 μm and 0.2
μm filters (VWR) and purified on a cesium chloride (CsCl) density gradient39. One milliliter
of the CsCl fraction was purified on Amicon YM-100 protein columns (Millipore) and
treated with DNase I. DNA was isolated using a Qiagen UltraSens virus kit (Qiagen),
amplified using GenomiPhi V2 (GE Healthcare), and fragmented to 200 to 400 bp using a
Bioruptor (Diagenode). Libraries were created using the Ion Plus fragment library kit and
sequenced using a 316 Chip on an Ion Torrent Personal Genome Machine (Life
Technologies). Reads were trimmed according to modified Phred scores of 0.5 using CLC
Genomics Workbench 4.9 (Cambridge), and the remaining reads were assembled using CLC
Genomics Workbench 4.9 based on 98% identity with a minimum of 50% read overlap39.
Reads were assembled into a single contig of 18,186 bp (20,118 x coverage).
Mapping of ONT reads to the hybrid assemblies was used to determine the orientation and
terminal ends of linear phage genomes while reference genomes served as guides to orient
circular phage genomes. Phage genome assemblies were annotated using the NCBI
Prokaryotic Genome Annotation Pipeline (PGAP)40,41.
Phage raw sequence reads and annotated genomes are available at NCBI under the following
consecutive BioSample IDs (SAMN11089809– SAMN11089827). GenBank accession
numbers include: Efmus1 (MK721195), Efmus2 (MK721197), Efmus3 (MK721185),
Efmus4 (MK721193), Ef2.1 (MK693030), Ef2.2 (MK721189), Ef2.3 (MK721192), Ef5.1
(MK721199), Ef5.2 (MK721186), Ef5.3 (MK721200), Ef5.4 (MK721191), Ef6.1
(MK721187), Ef6.2 (MK721188), Ef6.3 (MK721196), Ef6.4 (MK721190), Ef7.1
(MK721194), Ef7.2 (MK721183), Ef7.3 (MK721184) and Ef7.4 (MK721198).
Genetic maps of bacteriophage genomes were generated by LinearDisplay.pl (https://
github.com/JCVenterInstitute/LinearDisplay), a PERL script that uses Xfig (https://
sourceforge.net/projects/mcj/) to render high-quality images. Preliminary annotation of
genes was derived from the automated annotation and from Phage_Finder42, which uses
curated HMMs and databases of core phage gene to annotate core gene functions.
Annotation was then manually reviewed to assign the final colors.
Bacteriophage phylogenetic tree
A phage whole genome phylogeny tree was generated from a pairwise distance matrix
calculated with the MASH program, which approximates average nucleotide identity
(ANI)43. First, a sketch file was created from all the 19 E. faecalis phage genomes isolated
and sequenced in this study plus 54 Enterococcus phage genomes obtained from GenBank,
with 5000 12mers generated per genome (mash sketch -k 12 -s 5000). The sketch file was
then compared to all the initial phage genome sequences to generate the ANI matrix using
Duan et al. Page 11
Nature. Author manuscript; available in PMC 2020 May 13.
Europe PM
C Funders A
uthor Manuscripts
Europe PM
C Funders A
uthor Manuscripts

the mash distance command using default settings. The GGRaSP R-package was used to
calculate the UPMGA phylogeny from the ANI distance matrix, after redundant phage
genomes (genomes ANI > 99.985) were removed using the GGRaSP R-package with a user
defined cutoff of 0.015 (ggrasp.cluster (threshold = 0.015)). The resulting dendrogram was
translated into newick format using the APE R package44, loaded into the iTOL tree
viewer45, and annotated with taxonomic information and manually-entered clade
identification.
Electron microscopy
Bacteriophage morphology was examined by transmission electron microscopy of
negatively stained grids, prepared using the valentine method46 with either 2% uranyl-
acetate or 2% phosphotungstic acid, and examined at an acceleration voltage of 100KV in
the JEOL 1200 EX Transmission Electron Microscope.
Bacterial DNA extraction and 16S rRNA sequencing
DNA from human stool samples, mouse liver sections or bacterial culture was extracted as
described before11, and DNA from mouse feces was extracted using QIAamp Fast DNA
Stool kit (QIAGEN). 16S ribosomal RNA (rRNA) PCR was completed using Illumina
adaptor and barcode ligated 16S primers targeting the V4 region of the 16S rRNA gene47,48.
Amplicons were purified using the Qiaquick PCR purification kit (QIAGEN) using
manufacturer’s specifications. Purified amplicons were then quantified via TECAN assay
(Tecan, Switzerland), normalized, and pooled in preparation for 16S rRNA sequencing.
Pooled library was quantified and checked for quality using Agilent 2100 Bioanalyzer
(Agilent Technologies). Library was sequenced on Illumina MiSeq (Illumina) using V2
reagent chemistry, 500 cycles, 2 x 250bp format using manufacturer’s specifications. 16S
sequence reads were processed and OTUs were determined using our MOTHUR-based 16S
rDNA analysis workflow as described previously11,49. Raw 16S sequence reads can be
found in the NCBI SRA associated with Bioproject PRJNA525701.
Real-time quantitative PCR
Bacterial genomic DNA was extracted from human stool samples and mouse liver11. RNA
was extracted from mouse liver and cDNAs were generated11. Primer sequences for mouse
genes were obtained from the NIH qPrimerDepot. Primer sequences for E. faecalis 16S
rRNA gene, E. faecalis cylLS and cylLL genes were described before50,51. All primers used
in this study are listed in Supplementary Table 9. Mouse gene expression and amplification
of bacterial genes were determined with Sybr Green (Bio-Rad Laboratories) using ABI
StepOnePlus real-time PCR system. The qPCR value of mouse genes was normalized to
18S.
E. faecalis isolation and whole-genome sequencing
To isolate E. faecalis strains from human subjects, 50–300 mg of human stool was
resuspended in 500 μl PBS, serial dilutions were made, and 100 μl was placed on plates with
selective medium, BBL Enterococcosel broth (Becton Dickinson). Enterococci colonies
were identified by the production of dark brown or black color generated by hydrolysis of
Duan et al. Page 12
Nature. Author manuscript; available in PMC 2020 May 13.
Europe PM
C Funders A
uthor Manuscripts
Europe PM
C Funders A
uthor Manuscripts

esculin to esculetin that reacts with ferric ammonium citrate. Each Enterococcus colony was
then picked, and qPCR was performed to identify E. faecalis, using specific primers against
the E. faecalis 16S rRNA gene50. For each subject, 1 – 6 E. faecalis colonies were analyzed
and bacterial genomic DNA was then extracted as described in above section.
DNA sequencing was performed on the Illumina HiSeq Ten X generating paired-end reads
(2 x 151bp). Bacterial genomes were assembled and annotated using the pipeline described
previously52. Antimicrobial resistance and virulence genes including cytolysin (cyl) genes
carried by E. faecalis isolates were identified by comparing individual genome assemblies
against the CARD and VFDB databases using abricate v0.8.10 (https://github.com/
tseemann/abricate), respectively53,54.
For the phylogeny of E. faecalis, the genome assemblies of the study isolates were annotated
with Prokka55, and a pangenome estimated using Roary52. A 95% identity cut-off was used,
and core genes were defined as those in 99% of isolates. A maximum likelihood tree of the
SNPs in the core genes was created using RAxML56 and 100 bootstraps. The resulting tree
was visualized using iTOL45. Genome sequence data of E. faecalis strains isolated in this
study have been deposited in the European Nucleotide Archive (ENA) under the accession
number PRJEB25007. Sequence reads are available at ENA under Run accession IDs
ERR3200171-ERR3200263.
E. faecalis culture
All E. faecalis strains were grown statically in brain heart infusion (BHI) broth or on BHI
agar plate at 37°C. 50 μg/ml erythromycin was added when cytolytic and non-cytolytic E. faecalis strains were grown (Extended Data Figure 2).
Fecal Enterococcus level determination
To determine fecal enterococci level in mice, 10–30 mg of mouse feces was resuspended
into 500 μl PBS and serial dilutions were made. Five microliters of each dilution from each
sample were spotted onto a plate with a selective medium, BBL Enterococcosel broth
(Becton Dickinson) and the plates were then incubated at 37°C overnight. For Extended
Data Fig. 2o, agar plates contained 50 μg/ml erythromycin. Enterococci colonies were
identified by the production of dark brown or black color generated by hydrolysis of esculin
to esculetin that reacts with ferric ammonium citrate. Colony numbers of each sample were
then counted and CFUs were calculated.
Cytolysin expression and purification
To purify bioactive CylLL” and CylLS”, an E. coli heterologous expression system was used.
Briefly, either Hisx6-CylLL or Hisx6-CylLS were co-expressed with CylM (enzyme that
performs dehydration and cyclization reactions on cytolysin) in E. coli to yield fully
dehydrated and cyclized full-length peptides. The His-tag and leader peptide were then
removed using recombinant CylA (27-412), the soluble domain of the native peptidase used
in cytolysin maturation, to yield bioactive CylLL” or CylLS”. The resulting core peptides
were further purified by reversed-phase HPLC.
Duan et al. Page 13
Nature. Author manuscript; available in PMC 2020 May 13.
Europe PM
C Funders A
uthor Manuscripts
Europe PM
C Funders A
uthor Manuscripts

The cylLL and cylLS genes were previously cloned into the MCSI of a pRSFDuet-1
backbone vector which contained the cylM gene in MCSII6. The cylA (27–412) gene was
previously cloned into MCSI of a pRSFDuet-1 backbone vector57. E. coli BL21 Star™
(DE3) cells (50 μl) were transformed with 100 ng of either the cylLL_cylM:pRSFDuet,
cylLS_cylM:pRSFDuet or cylA (27-412):pRSFDuet plasmids via KCM chemical
transformation. The cells were plated on LB agar plates supplemented with kanamycin (50
μg/ml) and grown at 37°C overnight. One colony was picked to inoculate 15 ml of LB broth
supplemented with kanamycin overnight at 37°C. The culture was used to inoculate 1.5
liters of terrific broth supplemented with kanamycin. Cultures were grown with shaking at
37°C to an OD600 of 0.8. The temperature of the incubator was lowered to 18°C and
expression was induced with the addition of 0.3 mM final concentration of isopropyl β-D-
thiogalactoside. The cultures were allowed to incubate at 18°C for 18 hours. The cells were
collected by centrifugation at 5000 x g for 12 min. The cell paste was collected and frozen at
-70°C.
For the purification of the protease CylA (27–412), the cell paste was thawed and
resuspended in 50 ml LanP buffer (20 mM HEPES, 1 M NaCl, pH 7.5). The cell suspension
was lysed by homogenization. The lysate was clarified by centrifugation at 13,000 x g for 45
min and filtered through a 0.45 μm centrifugal filter (Thermo Scientific). The clarified lysate
was applied to a pre-equilibrated HisTrap HP 5 ml column (GE Healthcare) through a
peristaltic pump. The loaded column was connected to an ÄKTA pure 25 M system. The
protein was eluted by a linear gradient of LanP buffer to Elution Buffer (20 mM HEPES, 1
M NaCl, 500 mM imidazole, 10% glycerol, pH 7.5) over 30 min. The purest fractions, as
determined by 4%–20% SDS-PAGE, were combined, concentrated to 1 mg/ml by Amicon
Ultra Centrifugal Filters (30 kDa MWCO), and buffer exchanged into storage buffer (20mM
HEPES, 300 mM KCl, 10% glycerol, pH 7.5) by PD-10 desalting column (GE Healthcare).
Protein concentration was determined by absorbance at 280 nm.
For the purification of CylLL” and CylLS” peptides, the cell paste was thawed and
resuspended in 50 ml of LanA Buffer B1 (6 M guanidine HCl, 20 mM NaH2PO4, 500 mM
NaCl, 0.5 mM imidazole, pH 7.5). The cell suspension was lysed via sonication (2 sec pulse
on, 5 sec pulse off, 7 min total pulse on time). The cell lysate was clarified by centrifugation
at 13,000 x g for 45 min. The clarified cell lysate was filtered through a 0.45 μm centrifugal
filter and applied via gravity flow to a pre-equilibrated, 2 ml bed volume of His60 Ni
Superflow Resin (Clonetech). After the lysate had been applied, the resin was washed with
15 ml of LanA Buffer B2 (4 M guanidine HCl, 20 mM NaH2PO4, 500 mM NaCl, 30 mM
imidazole, pH 7.5). The resin was washed again with 15 ml of LanA Wash Buffer (20 mM
NaH2PO4, 500 mM NaCl, 30 mM imidazole, pH 7.5) to remove the guanidine HCl. The
peptides were eluted with 10 ml of LanA Elution Buffer (20 mM NaH2PO4, 500 mM NaCl,
500 mM imidazole, pH 7.5). A 0.02 mg/ml final concentration of CylA (27–412) was added
to the elution fraction and allowed to incubate at room temperature overnight to remove the
leader peptide.
The digestion was quenched by adding 2% (v/v) final concentration of trifluoroacetic acid.
The solution was centrifuged at 4,500 x g for 10 min and filtered through a 0.45 μm syringe
filter (Thermo Scientific). The core peptides were purified by semi-preparative reverse phase
Duan et al. Page 14
Nature. Author manuscript; available in PMC 2020 May 13.
Europe PM
C Funders A
uthor Manuscripts
Europe PM
C Funders A
uthor Manuscripts

HPLC using a Phenomenex Jupiter Proteo column (10 mm x 250 mm, 4 μm, 90 Å)
connected to an Agilent 1260 Infinity II liquid chromatography system. The peptides were
separated using a linear gradient of 3% (v/v) solvent B (acetonitrile + 0.1% trifluoroacetic
acid) in solvent A (water + 0.1% trifluoroacetic acid). The fractions were spotted on a
MALDI target plate by mixing 1 μl of sample with 1μl of a 25 mg/ml solution of Super-
DHB (Sigma) in 80% acetonitrile/water + 0.1% trifluoroacetic acid. The fractions were
analyzed by MALDI-TOF MS on a Bruker UltrafleXtreme MALDI-TOF/TOF operating in
positive ionization, reflector mode.
Primary mouse hepatocytes
Hepatocytes were isolated from C57BL/6 female mice fed the chronic–binge ethanol diet
(NIAAA model)15. Livers were perfused in situ with 0.5 mM EGTA containing calcium-free
salt solution and then perfused with a solution containing 0.02% (w/v) collagenase D (Roche
Applied Science). Livers were then carefully minced and filtered using a 70 μm nylon cell
strainer. Hepatocytes were centrifuged at 50 x g for 1 min after three times washing.
Hepatocyte viability was assessed by Trypan Blue (Thermo Fisher Scientific). 1.5 × 10⁵
hepatocytes were seeded on 12-well plates coated with rat collagen type I in DMEM-F12
(Thermo Fisher Scientific) with insulin-transferrin-selenium (1% v/v) (Thermo Fisher
Scientific) and 40 ng/ml dexamethasone (MP Biomedicals) containing 10% (v/v) fetal
bovine serum (FBS; Gemini Bio-Products) and antibiotics. After 4 hours, the culture was
washed with DMEM-F12 media and changed to the same complemented media without
FBS58. Then 16 hours later, hepatocytes were cultured with 0 or 25 mM ethanol and
stimulated with 0, 200 or 400 nM CylLS” and/or CylLL” in the same culture medium
without FBS. After 3 hours stimulation, hepatocyte cytotoxicity was assessed using Pierce
LDH Cytotoxicity Detection Kit (Thermo Fisher Scientific).
Biochemical analysis
Serum levels of ALT were determined using Infinity ALT kit (Thermo Scientific). Hepatic
triglyceride levels were measured using Triglyceride Liquid Reagents kit (Pointe Scientific).
Levels of serum LPS and fecal albumin were determined by ELISA kits (Lifeome Biolabs
and Bethyl Labs, respectively). Serum levels of ethanol were measured using Ethanol Assay
kit (BioVision).
Staining procedures
Formalin-fixed tissue samples were embedded in paraffin and stained with hematoxylin-
eosin. To determine lipid accumulation, liver sections were embedded in OCT compound. 8
μm frozen sections were then cut and stained with Oil Red O (Sigma-Aldrich).
Representative pictures from each group of mice were shown in each figure. The terminal
deoxynucleotide transferase-mediated dUTP nick-end labeling (TUNEL) assay was
performed using an in situ cell death detection kit (Sigma-Aldrich). We randomly selected
five high-power fields for counting TUNEL-positive cells and normalized numbers to total
cells.
Duan et al. Page 15
Nature. Author manuscript; available in PMC 2020 May 13.
Europe PM
C Funders A
uthor Manuscripts
Europe PM
C Funders A
uthor Manuscripts

Data availability
Raw 16S sequence reads can be found in the NCBI SRA associated with Bioproject
PRJNA525701. Bacteriophage raw sequence reads and annotated genomes are available at
NCBI under the following consecutive BioSample IDs (SAMN11089809 –
SAMN11089827). Genome sequence data of E. faecalis strains isolated in this study were
registered at ENA under Study PRJEB25007.
Code availability
The PERL script for making the genetic maps of bacteriophage genomes can be found at
https://github.com/JCVenterInstitute/LinearDisplay.
Statistical analysis
Results are expressed as mean ± s.e.m. (except when stated otherwise). Univariate and
multivariate Cox regression analysis was used to detect associations of cytolysin with overall
mortality. The multivariate model was adjusted for geographic origin of the patients;
antibiotic treatment; platelet count; and creatinine, bilirubin and INR as components of the
MELD score. Univariate logistic regression analysis of laboratory and clinical parameters
associated with the detection of cytolysin and E. faecalis was performed. Univariate linear
regression analysis of laboratory and clinical parameters associated with the log-transformed
total amount of fecal E. faecalis measured with qPCR was performed. To associate log-
transformed total E. faecalis and E. faecalis positivity with mortality, univariate Cox
regression was used. P values from Univariate and Multivariate Cox regression, Univariate
logistic regression and Univariate linear regression were determined by Wald test.
Multicollinearity was examined using the variance inflation factor (VIF). Kaplan-Meier
curves were used to compare survival between cytolysin-positive and cytolysin-negative
alcoholic hepatitis patients. Fecal E. faecalis, bacterial diversity and richness from controls
and patients were compared using Kruskal-Wallis test with Dunn’s post-hoc test. Region/
center specific clinical characteristics of alcoholic hepatitis patients were compared with
Kruskal-Wallis test for continuous and Fisher’s exact test for categorical variables. Fecal E. faecalis in alcoholic hepatitis patients with or without cytolysin, and with or without
cirrhosis, were compared with Mann-Whitney-Wilcoxon rank-sum test. Fecal E. faecalis in
alcoholic hepatitis patients from different region/centers were compared with Kruskal-Wallis
test. Percentage of subjects with fecal samples positive for E. faecalis and cytolysin was
compared using Fisher’s exact test, followed by FDR procedures for multiple group
comparisons. Jaccard dissimilarity matrices were used for principal coordinate analysis
(PCoA) and P values were determined by permutational multivariate analysis of variance
(PERMANOVA) followed by FDR procedures to correct for multiple comparisons.
For mouse and cell culture studies, significance of multiple groups was evaluated using one-
way or two-way analysis of variance (ANOVA) with Tukey’s post-hoc test. Fisher’s exact
test was used in the analysis of liver E. faecalis and cytolysin with FDR correction for
multiple comparisons. Kaplan-Meier curves were used to compare survival between
experimental mouse groups. PCoA based on Jaccard dissimilarity matrices was performed
between experimental mouse groups and the P values were determined by PERMANOVA
followed by FDR procedures to correct for multiple comparisons.
Duan et al. Page 16
Nature. Author manuscript; available in PMC 2020 May 13.
Europe PM
C Funders A
uthor Manuscripts
Europe PM
C Funders A
uthor Manuscripts

Exact P values for all comparisons, together with group size for each group, were listed in
Supplementary Table 10. Statistical analyses were performed using R statistical software, R
version 3.5.1, 2018 the R Foundation for Statistical Computing and GraphPad Prism v6.01.
A P < 0.05 was considered to be statistically significant (adjusted for multiple comparison
when performing multiple tests).
Extended Data
Duan et al. Page 17
Nature. Author manuscript; available in PMC 2020 May 13.
Europe PM
C Funders A
uthor Manuscripts
Europe PM
C Funders A
uthor Manuscripts

Extended Data Figure 1. Intestinal dysbiosis in patients with alcoholic hepatitis.(a) 16S rRNA sequencing of fecal samples from controls (n=14), patients with alcohol use
disorder (AUD; n=43), or alcoholic hepatitis (n=75). The graph demonstrates the relative
abundance of sequence reads in each genus. (b) Bacterial diversity (Shannon-Index and
Simpson-Index) and richness (Chao-Richness) was calculated in controls (n=14), patients
with AUD (n=43), or alcoholic hepatitis (n=75). (c) E. faecalis in fecal samples from
controls (n=25), patients with AUD (n=38), or alcoholic hepatitis (n=82), assessed by qPCR.
(d) Percentage of fecal samples positive for E. faecalis in controls (n=25), patients with
AUD (n=38), or alcoholic hepatitis (n=82), assessed by qPCR. E. faecalis was detected in
Duan et al. Page 18
Nature. Author manuscript; available in PMC 2020 May 13.
Europe PM
C Funders A
uthor Manuscripts
Europe PM
C Funders A
uthor Manuscripts
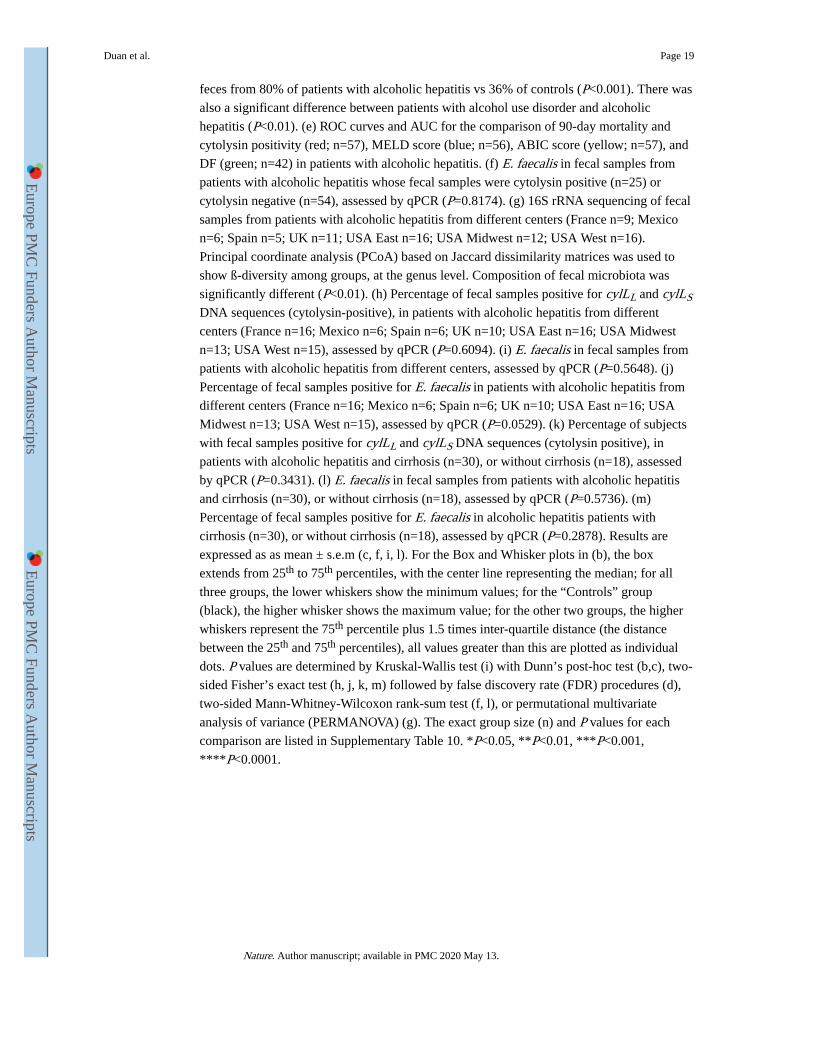
feces from 80% of patients with alcoholic hepatitis vs 36% of controls (P<0.001). There was
also a significant difference between patients with alcohol use disorder and alcoholic
hepatitis (P<0.01). (e) ROC curves and AUC for the comparison of 90-day mortality and
cytolysin positivity (red; n=57), MELD score (blue; n=56), ABIC score (yellow; n=57), and
DF (green; n=42) in patients with alcoholic hepatitis. (f) E. faecalis in fecal samples from
patients with alcoholic hepatitis whose fecal samples were cytolysin positive (n=25) or
cytolysin negative (n=54), assessed by qPCR (P=0.8174). (g) 16S rRNA sequencing of fecal
samples from patients with alcoholic hepatitis from different centers (France n=9; Mexico
n=6; Spain n=5; UK n=11; USA East n=16; USA Midwest n=12; USA West n=16).
Principal coordinate analysis (PCoA) based on Jaccard dissimilarity matrices was used to
show ß-diversity among groups, at the genus level. Composition of fecal microbiota was
significantly different (P<0.01). (h) Percentage of fecal samples positive for cylLL and cylLS
DNA sequences (cytolysin-positive), in patients with alcoholic hepatitis from different
centers (France n=16; Mexico n=6; Spain n=6; UK n=10; USA East n=16; USA Midwest
n=13; USA West n=15), assessed by qPCR (P=0.6094). (i) E. faecalis in fecal samples from
patients with alcoholic hepatitis from different centers, assessed by qPCR (P=0.5648). (j)
Percentage of fecal samples positive for E. faecalis in patients with alcoholic hepatitis from
different centers (France n=16; Mexico n=6; Spain n=6; UK n=10; USA East n=16; USA
Midwest n=13; USA West n=15), assessed by qPCR (P=0.0529). (k) Percentage of subjects
with fecal samples positive for cylLL and cylLS DNA sequences (cytolysin positive), in
patients with alcoholic hepatitis and cirrhosis (n=30), or without cirrhosis (n=18), assessed
by qPCR (P=0.3431). (l) E. faecalis in fecal samples from patients with alcoholic hepatitis
and cirrhosis (n=30), or without cirrhosis (n=18), assessed by qPCR (P=0.5736). (m)
Percentage of fecal samples positive for E. faecalis in alcoholic hepatitis patients with
cirrhosis (n=30), or without cirrhosis (n=18), assessed by qPCR (P=0.2878). Results are
expressed as as mean ± s.e.m (c, f, i, l). For the Box and Whisker plots in (b), the box
extends from 25th to 75th percentiles, with the center line representing the median; for all
three groups, the lower whiskers show the minimum values; for the “Controls” group
(black), the higher whisker shows the maximum value; for the other two groups, the higher
whiskers represent the 75th percentile plus 1.5 times inter-quartile distance (the distance
between the 25th and 75th percentiles), all values greater than this are plotted as individual
dots. P values are determined by Kruskal-Wallis test (i) with Dunn’s post-hoc test (b,c), two-
sided Fisher’s exact test (h, j, k, m) followed by false discovery rate (FDR) procedures (d),
two-sided Mann-Whitney-Wilcoxon rank-sum test (f, l), or permutational multivariate
analysis of variance (PERMANOVA) (g). The exact group size (n) and P values for each
comparison are listed in Supplementary Table 10. *P<0.05, **P<0.01, ***P<0.001,
****P<0.0001.
Duan et al. Page 19
Nature. Author manuscript; available in PMC 2020 May 13.
Europe PM
C Funders A
uthor Manuscripts
Europe PM
C Funders A
uthor Manuscripts

Extended Data Figure 2. Cytolytic E. faecalis causes progression of ethanol-induced liver disease in mice.(a–n) C57BL/6 mice were fed oral isocaloric (control) or chronic–binge ethanol diets and
gavaged with vehicle (PBS), a cytolytic E. faecalis strain (FA2-2(pAM714)) (E. faecalis)
(5x10⁸ colony forming units (CFUs)), or a non-cytolytic E. faecalis strain
(FA2-2(pAM771))5 (E. faecalis Δcytolysin) (5x10⁸ CFUs) every third day. (a) Serum levels
of ALT. (b) Hepatic triglyceride content. (c) Representative oil red O-stained liver sections.
(d–f) Hepatic levels of mRNAs. (g) Kaplan-Meier curve of survival of mice on chronic–
binge ethanol diets (day 0, start of ethanol feeding). Mice gavaged with PBS all survived and
Duan et al. Page 20
Nature. Author manuscript; available in PMC 2020 May 13.
Europe PM
C Funders A
uthor Manuscripts
Europe PM
C Funders A
uthor Manuscripts
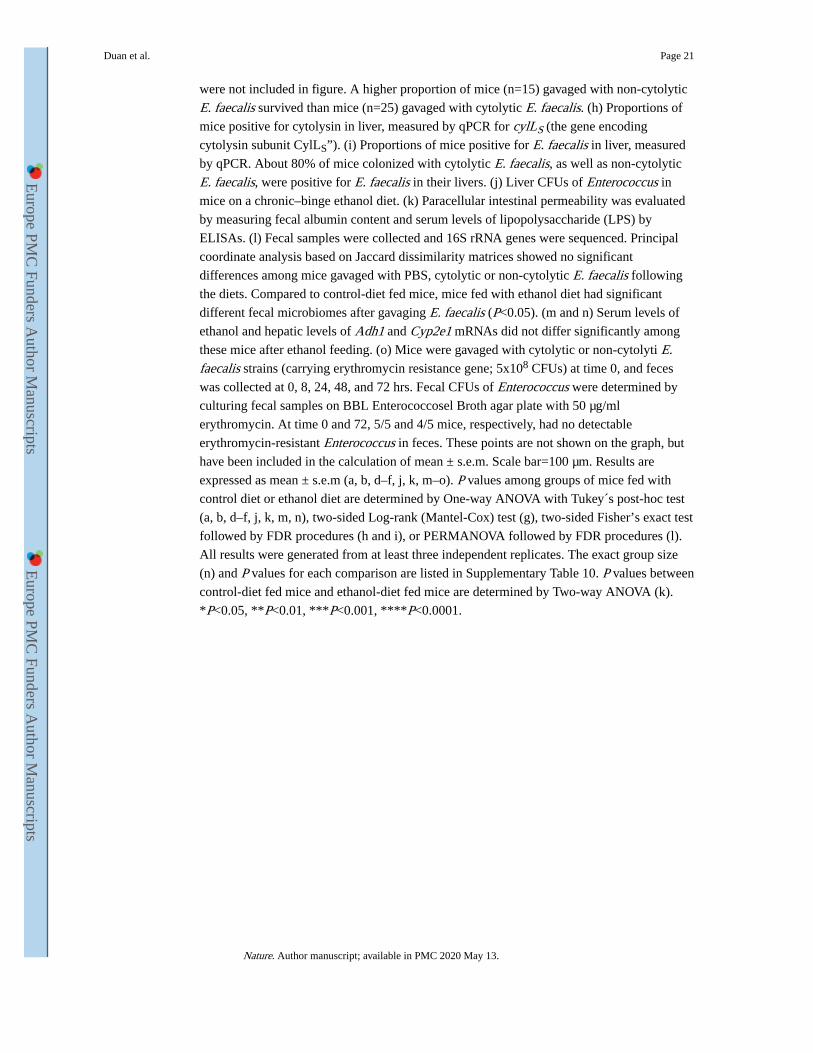
were not included in figure. A higher proportion of mice (n=15) gavaged with non-cytolytic
E. faecalis survived than mice (n=25) gavaged with cytolytic E. faecalis. (h) Proportions of
mice positive for cytolysin in liver, measured by qPCR for cylLS (the gene encoding
cytolysin subunit CylLS”). (i) Proportions of mice positive for E. faecalis in liver, measured
by qPCR. About 80% of mice colonized with cytolytic E. faecalis, as well as non-cytolytic
E. faecalis, were positive for E. faecalis in their livers. (j) Liver CFUs of Enterococcus in
mice on a chronic–binge ethanol diet. (k) Paracellular intestinal permeability was evaluated
by measuring fecal albumin content and serum levels of lipopolysaccharide (LPS) by
ELISAs. (l) Fecal samples were collected and 16S rRNA genes were sequenced. Principal
coordinate analysis based on Jaccard dissimilarity matrices showed no significant
differences among mice gavaged with PBS, cytolytic or non-cytolytic E. faecalis following
the diets. Compared to control-diet fed mice, mice fed with ethanol diet had significant
different fecal microbiomes after gavaging E. faecalis (P<0.05). (m and n) Serum levels of
ethanol and hepatic levels of Adh1 and Cyp2e1 mRNAs did not differ significantly among
these mice after ethanol feeding. (o) Mice were gavaged with cytolytic or non-cytolyti E. faecalis strains (carrying erythromycin resistance gene; 5x10⁸ CFUs) at time 0, and feces
was collected at 0, 8, 24, 48, and 72 hrs. Fecal CFUs of Enterococcus were determined by
culturing fecal samples on BBL Enterococcosel Broth agar plate with 50 μg/ml
erythromycin. At time 0 and 72, 5/5 and 4/5 mice, respectively, had no detectable
erythromycin-resistant Enterococcus in feces. These points are not shown on the graph, but
have been included in the calculation of mean ± s.e.m. Scale bar=100 μm. Results are
expressed as mean ± s.e.m (a, b, d–f, j, k, m–o). P values among groups of mice fed with
control diet or ethanol diet are determined by One-way ANOVA with Tukey´s post-hoc test
(a, b, d–f, j, k, m, n), two-sided Log-rank (Mantel-Cox) test (g), two-sided Fisher’s exact test
followed by FDR procedures (h and i), or PERMANOVA followed by FDR procedures (l).
All results were generated from at least three independent replicates. The exact group size
(n) and P values for each comparison are listed in Supplementary Table 10. P values between
control-diet fed mice and ethanol-diet fed mice are determined by Two-way ANOVA (k).
*P<0.05, **P<0.01, ***P<0.001, ****P<0.0001.
Duan et al. Page 21
Nature. Author manuscript; available in PMC 2020 May 13.
Europe PM
C Funders A
uthor Manuscripts
Europe PM
C Funders A
uthor Manuscripts

Extended Data Figure 3. Transplantation of cytolysin-positive feces increases ethanol-induced liver disease in gnotobiotic mice.(a–f, h, i) C57BL/6 germ-free mice were colonized with feces from two different cytolysin-
positive and two different cytolysin-negative patients with alcoholic hepatitis, and then fed
isocaloric (control) or chronic–binge ethanol diets. (a) Percentage of terminal
deoxynucleotide transferase-mediated dUTP nick-end labeling (TUNEL) positive hepatic
cells. (b) Representative oil red O-stained liver sections. (c and d) Hepatic levels of mRNAs
encoding the inflammatory cytokine Cxcl2, and Acta2 (marker of activated hepatic stellate
cells). (e) Kaplan-Meier curve of survival of mice on chronic–binge ethanol diets (day 0,
Duan et al. Page 22
Nature. Author manuscript; available in PMC 2020 May 13.
Europe PM
C Funders A
uthor Manuscripts
Europe PM
C Funders A
uthor Manuscripts

start of ethanol feeding) gavaged with feces from cytolysin-positive (n=48 mice) or
cytolysin-negative (n=32 mice) patients with alcoholic hepatitis. (f) Fecal samples were
collected and 16S rRNA genes were sequenced. The graph shows principal coordinate
analysis of fecal microbiomes. No significant difference was observed between mice
colonized with feces from cytolysin positive or negative alcoholic hepatitis donors following
the control diet. Mice transplanted with feces from cytolysin-positive alcoholic hepatitis
patient #2 showed a significantly different microbiota than the other mouse groups following
ethanol administration (P<0.01). (g) Percentage of cytolysin-positive E. faecalis in 4 patients
with alcoholic hepatitis. Stool samples from the four patients were placed on plates with
selective medium and Enterococcus colonies were identified by the production of dark
brown or black color generated by hydrolysis of esculin to esculetin that reacts with ferric
ammonium citrate. Enterococcus colonies were confirmed to be E. faecalis by qPCR.
Cytolysin status of each E. faecalis colony was determined by qPCR. (h) Serum levels of
ethanol were comparable among colonized mice after ethanol feeding. (i) Hepatic levels of
Adh1 and Cyp2e1 mRNAs did not differ significantly among colonized mice on control or
ethanol diets. Scale bar=100 μm. Results are expressed as mean ± s.e.m (a, c, d, h, i). P values are determined by One-way ANOVA with Tukey´s post-hoc test (a, c, d, h, i), two-
sided Log-rank (Mantel-Cox) test (e), or PERMANOVA followed by FDR procedures (f).
All results were generated from at least three independent replicates. The exact group size
(n) and P values for each comparison are listed in Supplementary Table 10. *P<0.05,
**P<0.01, ***P<0.001.
Duan et al. Page 23
Nature. Author manuscript; available in PMC 2020 May 13.
Europe PM
C Funders A
uthor Manuscripts
Europe PM
C Funders A
uthor Manuscripts

Extended Data Figure 4. Isolation and amplification of bacteriophages against cytolytic E. faecalis isolated from mice.(a) BHI agar plate showing bacteriophage plaque morphology. Bacteriophage cocktail (100
μl, 102–103 PFUs) was mixed with overnight grown E. faecalis culture (100 μl) and then
added to BHI broth top agar (0.5% agar) and poured over a BHI plate (1.5% agar). After
overnight growth at 37°C, images were captured on an Epson Perfection 4990 Photo
scanner. (b) Simplified illustration of different bacteriophage morphology. Siphophages have
long, flexible, noncontractile tails (left), myophages have contractile tails (middle), and
podophages have short, noncontractile tails (right). (c) Transmission electron microscopy
Duan et al. Page 24
Nature. Author manuscript; available in PMC 2020 May 13.
Europe PM
C Funders A
uthor Manuscripts
Europe PM
C Funders A
uthor Manuscripts

revealed that bacteriophages isolated were all podophages (Efmus1, Efmus2, Efmus3 and
Efmus4). Phages specific to E. faecalis strain isolated from mouse feces were named as
Efmus with a number (Ef for E. faecalis, mus for mouse, digit for isolation order). (d)
Genetic map of phage genomes. The linear maps are based on nucleotide sequences of the
phage genomes and predicted open reading frames. The name and length (bp) of each
genome are indicated to the left of each phage map. Protein-coding sequences are colored
based on functional role categories (see box). Scale bar=50 nm. All results were generated
from at least three independent replicates.
Duan et al. Page 25
Nature. Author manuscript; available in PMC 2020 May 13.
Europe PM
C Funders A
uthor Manuscripts
Europe PM
C Funders A
uthor Manuscripts

Extended Data Figure 5. Phages reduce translocation of cytolysin to the liver and reduce ethanol-induced liver disease in Atp4aSl/Sl mice.(a–k) Wild-type (WT) and their Atp4aSl/Sl littermates were fed oral isocaloric (control) or
chronic–binge ethanol diets and gavaged with vehicle (PBS), control phages against C. crescentus (1010 plaque forming units (PFUs)), or a cocktail of 4 different phages targeting
cytolytic E. faecalis (1010 PFUs) 1 day before ethanol binge. (a) Serum levels of ALT. (b)
Hepatic triglyceride content. (c) Representative oil red O-stained liver sections. (d–f)
Hepatic levels of mRNAs. (g) Proportions of mice positive for cytolysin in liver, measured
by qPCR for cylLS. (h) Fecal colony forming units (CFUs) of Enterococcus. (i) Fecal
Duan et al. Page 26
Nature. Author manuscript; available in PMC 2020 May 13.
Europe PM
C Funders A
uthor Manuscripts
Europe PM
C Funders A
uthor Manuscripts

samples were collected and 16S rRNA genes were sequenced. Principal coordinate analysis
based on Jaccard dissimilarity matrices found no significant difference in fecal microbiota
among mice given PBS, control phage, or phages targeting cytolytic E. faecalis in each
group. (j and k) Serum levels of ethanol and hepatic levels of Adh1 and Cyp2e1 mRNAs did
not differ significantly among colonized mice after ethanol feeding. Scale bar=100 μm.
Results are expressed as mean ± s.e.m (a, b, d–f, h, j, k). P values are determined by Two-
way ANOVA with Tukey´s post-hoc test (a, b, d–f, h, j, k), two-sided Fisher’s exact test
followed by FDR procedures (g), or PERMANOVA followed by FDR procedures (i). All
results were generated from at least three independent replicates. The exact group size (n)
and P values for each comparison are listed in Supplementary Table 10. *P<0.05, **P<0.01,
***P<0.001, ****P<0.0001.
Duan et al. Page 27
Nature. Author manuscript; available in PMC 2020 May 13.
Europe PM
C Funders A
uthor Manuscripts
Europe PM
C Funders A
uthor Manuscripts

Extended Data Figure 6. Isolation and amplification of bacteriophages against cytolytic E. faecalis isolated from patients with alcoholic hepatitis.(a) BHI agar plates showing bacteriophage plaque morphology. (b) Transmission electron
microscopy graphs of myophages Ef2.1 and Ef2.3, stained with phosphotungstic acid
showing contracted tails. (c) Genetic map of phage genomes. The linear maps are based on
nucleotide sequences of the phage genomes and predicted open reading frames. The name
and length (bp) of each genome are indicated to the left of each phage map. Protein-coding
sequences are colored based on functional role categories (see box). Sequences encoding
Duan et al. Page 28
Nature. Author manuscript; available in PMC 2020 May 13.
Europe PM
C Funders A
uthor Manuscripts
Europe PM
C Funders A
uthor Manuscripts

tRNA genes are indicated by a cloverleaf structure. Scale bar=50 nm. All results were
generated from at least three independent replicates.
Duan et al. Page 29
Nature. Author manuscript; available in PMC 2020 May 13.
Europe PM
C Funders A
uthor Manuscripts
Europe PM
C Funders A
uthor Manuscripts

Extended Data Figure 7. Phages that target cytolytic E. faecalis reduce ethanol-induced liver disease in gnotobiotic mice.(a–h) C57BL/6 germ-free mice were colonized with feces from two different cytolysin-
positive patients with alcoholic hepatitis (feces from 1 patient is used in Figure 2). The mice
were then fed oral isocaloric (control) or chronic–binge ethanol diets, and gavaged with
control phages against C. crescentus (1010 plaque forming units (PFUs)), or a cocktail of 3
or 4 different phages targeting cytolytic E. faecalis (1010 PFUs) 1 day before an ethanol
binge. (a) Percentage of TUNEL-positive hepatic cells. (b) Representative oil red O-stained
liver sections. (c and d) Hepatic levels of mRNAs encoding the inflammatory cytokine
Duan et al. Page 30
Nature. Author manuscript; available in PMC 2020 May 13.
Europe PM
C Funders A
uthor Manuscripts
Europe PM
C Funders A
uthor Manuscripts

Cxcl2, and Acta2 (marker of activated hepatic stellate cells). (e) Fecal colony forming units
(CFUs) of Enterococcus. (f) Fecal samples were collected and 16S rRNA genes were
sequenced. Principal coordinate analysis based on Jaccard dissimilarity matrices shows no
significant differences in fecal microbiota of mice gavaged with control phage and phages
targeting cytolytic E. faecalis in each group. (g and h) Serum levels of ethanol and hepatic
levels of Adh1 and Cyp2e1 mRNAs did not differ significantly among colonized mice after
ethanol feeding. Scale bar=100 μm. Results are expressed as mean ± s.e.m (a, c–e, g, h). P values are determined by Two-way ANOVA with Tukey´s post-hoc test (a, c–e, g, h), or
PERMANOVA followed by FDR procedures (f). All results were generated from at least
three independent replicates. The exact group size (n) and P values for each comparison are
listed in Supplementary Table 10. *P<0.05, ***P<0.001.
Duan et al. Page 31
Nature. Author manuscript; available in PMC 2020 May 13.
Europe PM
C Funders A
uthor Manuscripts
Europe PM
C Funders A
uthor Manuscripts

Extended Data Figure 8. Isolation and amplification of bacteriophages against non-cytolytic E. faecalis isolated from patients with alcoholic hepatitis.(a) BHI agar plates showing bacteriophage plaque morphology. (b) Genetic map of phage
genomes. The linear maps are based on nucleotide sequences of the phage genomes and
predicted open reading frames. The name and length (bp) of each genome are indicated to
the left of each phage map. Protein-coding sequences are colored based on functional role
categories (see box). Sequences encoding tRNA genes are indicated by a cloverleaf
structure. (c) Phylogenetic tree of Enterococcus bacteriophages. A whole-genome average
nucleotide distance tree was constructed for 73 available Enterococcus phage genomes, 54
Duan et al. Page 32
Nature. Author manuscript; available in PMC 2020 May 13.
Europe PM
C Funders A
uthor Manuscripts
Europe PM
C Funders A
uthor Manuscripts

from GenBank (black letters), 19 from this study (4 phages against cytolysin-positive E. faecalis isolated from mice in blue letters, 7 phages against cytolysin-positive E. faecalis isolated from alcoholic hepatitis patients in pink letters, and 8 phages against cytolysin-
negative E. faecalis isolated from alcoholic hepatitis patients in green letters) with Mash43
using a sketch size of s=5000 and k-mer size of k=12 and GGRaSP59 (see Methods).
Colored branches denote specific phage genera: Sap6virus, P68virus and Spounavirinae. The
scale bar represents percent average nucleotide divergence. All results were generated from
at least three independent replicates.
Duan et al. Page 33
Nature. Author manuscript; available in PMC 2020 May 13.
Europe PM
C Funders A
uthor Manuscripts
Europe PM
C Funders A
uthor Manuscripts

Extended Data Figure 9. Phages that target non-cytolytic E. faecalis do not reduce ethanol-induced liver disease in gnotobiotic mice.(a–h) C57BL/6 germfree mice were colonized with feces from two different cytolysin-
negative patients with alcoholic hepatitis. Transplanted gnotobiotic mice were fed oral
isocaloric (control) or chronic–binge ethanol diets and gavaged with control phages against
C. crescentus (1010 plaque forming units (PFUs)), or a cocktail of 4 different phages
targeting non-cytolytic E. faecalis (1010 PFUs) 1 day before an ethanol binge. (a) Percentage
of TUNEL-positive hepatic cells. (b) Representative oil red O-stained liver sections. (c and
d) Hepatic levels of mRNAs encoding the inflammatory cytokine Cxcl2, and Acta2 (marker
Duan et al. Page 34
Nature. Author manuscript; available in PMC 2020 May 13.
Europe PM
C Funders A
uthor Manuscripts
Europe PM
C Funders A
uthor Manuscripts

of activated hepatic stellate cells). (e) Proportions of mice positive for cytolysin in liver,
measured by qPCR for cylLS. (f) Fecal samples were collected and 16S rRNA genes were
sequenced. Principal coordinate analysis based on Jaccard dissimilarity matrices found no
significant difference in fecal microbiota among mice gavaged with control phages and
phages targeting cytolytic E. faecalis in each group. (g and h) Serum levels of ethanol and
hepatic levels of Adh1 and Cyp2e1 mRNAs did not differ significantly among colonized
mice after ethanol feeding. Scale bar=100 μm. Results are expressed as mean ± s.e.m (a, c,
d, g, h). P values are determined by Two-way ANOVA with Tukey´s post-hoc test (a, c, d, g,
h), two-sided Fisher’s exact test followed by FDR procedures (e), or PERMANOVA
followed by FDR procedures (f). All results were generated from at least three independent
replicates. The exact group size (n) and P values for each comparison are listed in
Supplementary Table 10.
Supplementary Material
Refer to Web version on PubMed Central for supplementary material.
Acknowledgements
S.L. was supported by a DFG fellowship (LA 4286/1-1). This study was supported in part by a Biocodex Microbiota Foundation Grant, NIH grants R01 AA24726, U01 AA026939, by Award Number BX004594 from the Biomedical Laboratory Research & Development Service of the VA Office of Research and Development (to B.S.), the Wellcome Trust (WT098051) (to T.D.L.), NIH grant U01AA021908 (to R.B.) and services provided by P30 DK120515 and P50 AA011999. Y.S. is supported by a Wellcome Trust PhD Studentship. I.R.R was funded by National Institute of General Medical Sciences (NIGMS)–NIH Chemistry–Biology Interface Training Grant (T32-GM070421).
Abbreviations
ABIC Age, serum bilirubin, INR, and serum creatinine score
Acta2 smooth muscle actin alpha 2
Adh1 alcohol dehydrogenase 1
AH alcoholic hepatitis
ALT alanine amino-transferase
ANOVA analysis of variance
AUC area under the curve
AUD alcohol use disorder
BHI broth, brain heart infusion broth
C. crescentus Caulobacter crescentus
CFUs colony forming units
CI confidence interval
Duan et al. Page 35
Nature. Author manuscript; available in PMC 2020 May 13.
Europe PM
C Funders A
uthor Manuscripts
Europe PM
C Funders A
uthor Manuscripts

Col1a1 collagen, type I, alpha 1
Cxcl chemokine (C-X-C motif) ligand
Cyp2e1 cytochrome P450 family 2 subfamily E polypeptide 1
DF discriminant function
E. coli Escherichia coli
E. faecalis Enterococcus faecalis
FDR false discovery rate
FIB-4 fibrosis-4 index
HR hazard ratio
Il1b interleukin 1 beta
INR international normalized ratio
LB medium Luria-Bertani medium
LDH lactate dehydrogenase
LPS lipopolysaccharide
MELD model for end-stage liver disease
MELDNa sodium MELD
MOI multiplicity of infection
PBS phosphate-buffered saline
PCoA principal coordinate analysis
PERMANOVA permutational multivariate analysis of variance
PFUs plaque forming units
qPCR quantitative PCR
ROC receiver operating characteristic
rRNA ribosomal RNA
RT room temperature
SNP single nucleotide polymorphism
TUNEL terminal deoxynucleotide transferase-mediated dUTP nick-
end labeling
VIF variance inflation factor
Duan et al. Page 36
Nature. Author manuscript; available in PMC 2020 May 13.
Europe PM
C Funders A
uthor Manuscripts
Europe PM
C Funders A
uthor Manuscripts

References
1. Lozano R, et al. Global and regional mortality from 235 causes of death for 20 age groups in 1990 and 2010: a systematic analysis for the Global Burden of Disease Study 2010. Lancet. 2012; 380:2095–2128. [PubMed: 23245604]
2. Lee BP, Vittinghoff E, Dodge JL, Cullaro G, Terrault NA. National trends and long-term outcomes of liver transplant for alcohol-associated liver disease in the United States. JAMA Intern Med. 2019; 179:340–348. [PubMed: 30667468]
3. Rehm J, et al. Burden of disease associated with alcohol use disorders in the United States. Alcohol Clin Exp Res. 2014; 38:1068–1077. [PubMed: 24428196]
4. Llopis M, et al. Intestinal microbiota contributes to individual susceptibility to alcoholic liver disease. Gut. 2016; 65:830–839. [PubMed: 26642859]
5. Ike Y, Clewell DB, Segarra RA, Gilmore MS. Genetic analysis of the pAD1 hemolysin/bacteriocin determinant in Enterococcus faecalis: Tn917 insertional mutagenesis and cloning. J Bacteriol. 1990; 172:155–163. [PubMed: 2152897]
6. Tang W, van der Donk WA. The sequence of the enterococcal cytolysin imparts unusual lanthionine stereochemistry. Nat Chem Biol. 2013; 9:157–159. [PubMed: 23314913]
7. Maddrey WC, et al. Corticosteroid therapy of alcoholic hepatitis. Gastroenterology. 1978; 75:193–199. [PubMed: 352788]
8. Dominguez M, et al. A new scoring system for prognostic stratification of patients with alcoholic hepatitis. Am J Gastroenterol. 2008; 103:2747–2756. [PubMed: 18721242]
9. Thursz MR, et al. Prednisolone or pentoxifylline for alcoholic hepatitis. N Engl J Med. 2015; 372:1619–1628. [PubMed: 25901427]
10. Mathurin P, Lucey MR. Management of alcoholic hepatitis. J Hepatol. 2012; 56(Suppl 1):S39–S45. [PubMed: 22300464]
11. Llorente C, et al. Gastric acid suppression promotes alcoholic liver disease by inducing overgrowth of intestinal Enterococcus. Nat Commun. 2017; 8
12. Gilmore MS, et al. Genetic structure of the Enterococcus faecalis plasmid pAD1-encoded cytolytic toxin system and its relationship to lantibiotic determinants. J Bacteriol. 1994; 176:7335–7344. [PubMed: 7961506]
13. Cox CR, Coburn PS, Gilmore MS. Enterococcal cytolysin: a novel two component peptide system that serves as a bacterial defense against eukaryotic and prokaryotic cells. Curr Protein Pept Sci. 2005; 6:77–84. [PubMed: 15638770]
14. Van Tyne D, Martin MJ, Gilmore MS. Structure, function, and biology of the Enterococcus faecalis cytolysin. Toxins (Basel). 2013; 5:895–911. [PubMed: 23628786]
15. Bertola A, Mathews S, Ki SH, Wang H, Gao B. Mouse model of chronic and binge ethanol feeding (the NIAAA model). Nat Protoc. 2013; 8:627–637. [PubMed: 23449255]
16. Ogilvie LA, Jones BV. The human gut virome: a multifaceted majority. Front Microbiol. 2015; 6:918. [PubMed: 26441861]
17. Chatterjee A, et al. Bacteriophage resistance alters antibiotic-mediated intestinal expansion of enterococci. Infect Immun. 2019; 87:e00085–19. [PubMed: 30936157]
18. Poindexter JS. Biological properties and classification of the Caulobacter group. Bacteriol Rev. 1964; 28:231–295. [PubMed: 14220656]
19. Shin J, et al. Analysis of the mouse gut microbiome using full-length 16S rRNA amplicon sequencing. Sci Rep. 2016; 6
20. The Human Microbiome Project Consortium. Structure, function and diversity of the healthy human microbiome. Nature. 2012; 486:207–214. [PubMed: 22699609]
21. Marcuk LM, et al. Clinical studies of the use of bacteriophage in the treatment of cholera. Bull World Health Organ. 1971; 45:77–83. [PubMed: 4946956]
22. Sarker SA, et al. Oral phage therapy of acute bacterial diarrhea with two coliphage preparations: a randomized trial in children from Bangladesh. EBioMedicine. 2016; 4:124–137. [PubMed: 26981577]
Duan et al. Page 37
Nature. Author manuscript; available in PMC 2020 May 13.
Europe PM
C Funders A
uthor Manuscripts
Europe PM
C Funders A
uthor Manuscripts

23. Dalmasso M, Hill C, Ross RP. Exploiting gut bacteriophages for human health. Trends Microbiol. 2014; 22:399–405. [PubMed: 24656964]
24. Ujmajuridze A, et al. Adapted bacteriophages for treating urinary tract infections. Front Microbiol. 2018; 9:1832. [PubMed: 30131795]
25. Khawaldeh A, et al. Bacteriophage therapy for refractory Pseudomonas aeruginosa urinary tract infection. J Med Microbiol. 2011; 60:1697–1700. [PubMed: 21737541]
26. Schooley RT, et al. Development and use of personalized bacteriophage-based therapeutic cocktails to treat a patient with a disseminated resistant Acinetobacter baumannii infection. Antimicrob Agents Chemother. 2017; 61:e00954–17. [PubMed: 28807909]
27. Dedrick RM, et al. Engineered bacteriophages for treatment of a patient with a disseminated drug-resistant Mycobacterium abscessus. Nat Med. 2019; 25:730–733. [PubMed: 31068712]
28. Fish R, et al. Compassionate use of bacteriophage therapy for foot ulcer treatment as an effective step for moving toward clinical trials. Methods Mol Biol. 2018; 1693:159–170. [PubMed: 29119440]
29. Gorski A, et al. Phages and immunomodulation. Future Microbiol. 2017; 12:905–914. [PubMed: 28434234]
30. Brandl K, et al. Dysregulation of serum bile acids and FGF19 in alcoholic hepatitis. J Hepatol. 2018; 69:396–405. [PubMed: 29654817]
31. Gao B, et al. Serum and fecal oxylipins in patients with alcohol-related liver disease. Dig Dis Sci. 2019; 64:1878–1892. [PubMed: 31076986]
32. Lang S, et al. Intestinal fungal dysbiosis and systemic immune response to fungi in patients with alcoholic hepatitis. Hepatology. 2019; doi: 10.1002/hep.30832
33. Ball SA, Tennen H, Poling JC, Kranzler HR, Rounsaville BJ. Personality, temperament, and character dimensions and the DSM-IV personality disorders in substance abusers. J Abnorm Psychol. 1997; 106:545–553. [PubMed: 9358685]
34. Krieg L, et al. Mutation of the gastric hydrogen-potassium ATPase alpha subunit causes iron-deficiency anemia in mice. Blood. 2011; 118:6418–6425. [PubMed: 21976678]
35. Gill JJ, et al. The Caulobacter crescentus phage phiCbK: genomics of a canonical phage. BMC Genomics. 2012; 13:542. [PubMed: 23050599]
36. Wick RR, Judd LM, Gorrie CL, Holt KE. Completing bacterial genome assemblies with multiplex MinION sequencing. Microb Genom. 2017; 3:e000132. [PubMed: 29177090]
37. Wick RR, Judd LM, Gorrie CL, Holt KE. Unicycler: resolving bacterial genome assemblies from short and long sequencing reads. PLoS Comput Biol. 2017; 13:e1005595. [PubMed: 28594827]
38. Walker BJ, et al. Pilon: an integrated tool for comprehensive microbial variant detection and genome assembly improvement. PLoS One. 2014; 9:e112963. [PubMed: 25409509]
39. Santiago-Rodriguez TM, et al. Transcriptome analysis of bacteriophage communities in periodontal health and disease. BMC Genomics. 2015; 16:549. [PubMed: 26215258]
40. Haft DH, et al. RefSeq: an update on prokaryotic genome annotation and curation. Nucleic Acids Res. 2018; 46:D851–D860. [PubMed: 29112715]
41. Tatusova T, et al. NCBI prokaryotic genome annotation pipeline. Nucleic Acids Res. 2016; 44:6614–6624. [PubMed: 27342282]
42. Fouts DE. Phage_Finder: automated identification and classification of prophage regions in complete bacterial genome sequences. Nucleic Acids Res. 2006; 34:5839–5851. [PubMed: 17062630]
43. Ondov BD, et al. Mash: fast genome and metagenome distance estimation using MinHash. Genome Biol. 2016; 17:132. [PubMed: 27323842]
44. Paradis E, Schliep K. Ape 5.0: an environment for modern phylogenetics and evolutionary analyses in R. Bioinformatics. 2019; 35:526–528. [PubMed: 30016406]
45. Letunic I, Bork P. Interactive tree of life (iTOL) v3: an online tool for the display and annotation of phylogenetic and other trees. Nucleic Acids Res. 2016; 44:W242–W245. [PubMed: 27095192]
46. Valentine RC, Shapiro BM, Stadtman ER. Regulation of glutamine synthetase. XII. Electron microscopy of the enzyme from Escherichia coli. Biochemistry. 1968; 7:2143–2152. [PubMed: 4873173]
Duan et al. Page 38
Nature. Author manuscript; available in PMC 2020 May 13.
Europe PM
C Funders A
uthor Manuscripts
Europe PM
C Funders A
uthor Manuscripts

47. Haas BJ, et al. Chimeric 16S rRNA sequence formation and detection in Sanger and 454-pyrosequenced PCR amplicons. Genome Res. 2011; 21:494–504. [PubMed: 21212162]
48. Caporaso JG, et al. Global patterns of 16S rRNA diversity at a depth of millions of sequences per sample. Proc Natl Acad Sci U S A. 2011; 108(Suppl 1):4516–4522. [PubMed: 20534432]
49. Chen P, et al. Supplementation of saturated long-chain fatty acids maintains intestinal eubiosis and reduces ethanol-induced liver injury in mice. Gastroenterology. 2015; 148:203–214. [PubMed: 25239591]
50. Ryu H, et al. Development of quantitative PCR assays targeting the 16S rRNA genes of Enterococcus spp. and their application to the identification of Enterococcus species in environmental samples. Appl Environ Microbiol. 2013; 79:196–204. [PubMed: 23087032]
51. Haas W, Shepard BD, Gilmore MS. Two-component regulator of Enterococcus faecalis cytolysin responds to quorum-sensing autoinduction. Nature. 2002; 415:84–87. [PubMed: 11780122]
52. Page AJ, et al. Robust high-throughput prokaryote de novo assembly and improvement pipeline for Illumina data. Microb Genom. 2016; 2:e000083. [PubMed: 28348874]
53. Chen L, et al. VFDB: a reference database for bacterial virulence factors. Nucleic Acids Res. 2005; 33:D325–D328. [PubMed: 15608208]
54. Jia B, et al. CARD 2017: expansion and model-centric curation of the comprehensive antibiotic resistance database. Nucleic Acids Res. 2017; 45:D566–D573. [PubMed: 27789705]
55. Seemann T. Prokka: rapid prokaryotic genome annotation. Bioinformatics. 2014; 30:2068–2069. [PubMed: 24642063]
56. Stamatakis A. RAxML version 8: a tool for phylogenetic analysis and post-analysis of large phylogenies. Bioinformatics. 2014; 30:1312–1313. [PubMed: 24451623]
57. Tang W, Bobeica SC, Wang L, van der Donk WA. CylA is a sequence-specific protease involved in toxin biosynthesis. J Ind Microbiol Biotechnol. 2019; 46:537–549. [PubMed: 30484123]
58. Iwaisako K, et al. Protection from liver fibrosis by a peroxisome proliferator-activated receptor delta agonist. Proc Natl Acad Sci U S A. 2012; 109:E1369–E1376. [PubMed: 22538808]
59. Clarke TH, Brinkac LM, Sutton G, Fouts DE. GGRaSP: a R-package for selecting representative genomes using Gaussian mixture models. Bioinformatics. 2018; 34:3032–3034. [PubMed: 29668840]
Duan et al. Page 39
Nature. Author manuscript; available in PMC 2020 May 13.
Europe PM
C Funders A
uthor Manuscripts
Europe PM
C Funders A
uthor Manuscripts

Figure 1. E. faecalis cytolysin associates with mortality in patients with alcoholic hepatitis.(a) 16S rRNA sequencing of fecal samples from controls (n=14), patients with alcohol use
disorder (AUD; n=43), or alcoholic hepatitis (n=75). Principal coordinate analysis (PCoA)
based on Jaccard dissimilarity matrices was used to show ß-diversity among groups, at the
genus level. Composition of fecal microbiota was significantly different between each group
(P<0.01). (b) Percentage of subjects with fecal samples positive for cylLL and cylLS DNA
sequences (cytolysin-positive), in controls (n=25), patients with AUD (n=38), or alcoholic
hepatitis (n=82), assessed by qPCR. Statistically significant differences were detected
between controls and alcoholic hepatitis patients (P<0.01), and between patients with
alcohol use disorder and alcoholic hepatitis patients (P<0.001). (c) Kaplan-Meier curve of
survival of patients with alcoholic hepatitis whose fecal samples were cytolysin-positive
(n=25) or cytolysin-negative (n=54) (P<0.0001). (d) Core genome single nucleotide
Duan et al. Page 40
Nature. Author manuscript; available in PMC 2020 May 13.
Europe PM
C Funders A
uthor Manuscripts
Europe PM
C Funders A
uthor Manuscripts

polymorphism (SNP) tree of E. faecalis strains isolated from patients with alcoholic hepatitis
(n=93 from 24 patients), showing phylogenetic diversity of cytolysin-positive (red) E. faecalis. Genomically identical isolates from the same patient were combined and are shown
as one single dot. Scale bar represents the nucleotide substitutions per SNP site. P values are
determined by permutational multivariate analysis of variance (PERMANOVA) followed by
false discovery rate (FDR) procedures (a), two-sided Fisher’s exact test followed by FDR
procedures (b), or two-sided Log-rank (Mantel-Cox) test (c). The exact group size (n) and P values for each comparison are listed in Supplementary Table 10.
Duan et al. Page 41
Nature. Author manuscript; available in PMC 2020 May 13.
Europe PM
C Funders A
uthor Manuscripts
Europe PM
C Funders A
uthor Manuscripts

Figure 2. Transplantation of feces from cytolysin-positive patients with alcoholic hepatitis exacerbates ethanol-induced liver disease in gnotobiotic mice.(a–g) C57BL/6 germfree mice were colonized with feces from two different cytolysin-
positive and two different cytolysin-negative patients with alcoholic hepatitis and subjected
to the chronic–binge feeding model. (a) Serum levels of ALT. (b) Hepatic triglyceride
content. (c) Representative H&E-stained liver sections. (d–f) Hepatic levels of mRNAs
encoding Il1b, Cxcl1, and Col1a1. (g) Proportions of mice positive for cytolysin in liver,
measured by qPCR for cylLS. (h) LDH assay to measure cytotoxicity of hepatocytes isolated
from mice fed oral isocaloric (control) diet (5 groups, left) or chronic–binge ethanol diet (5
Duan et al. Page 42
Nature. Author manuscript; available in PMC 2020 May 13.
Europe PM
C Funders A
uthor Manuscripts
Europe PM
C Funders A
uthor Manuscripts

groups, right) and incubated with vehicle, CylLS”, CylLL”, or both cytolysin subunits, at
indicated concentrations, without (–) or with (+) ethanol (25mM) for 3 hours. Survival of
hepatocytes was determined in 3 independent experiments. Scale bar=100 μm. Results are
expressed as mean ± s.e.m (a, b, d–f, h). P values are determined by One-way ANOVA with
Tukey´s post-hoc test (a, b, d–f), two-sided Fisher’s exact test followed by FDR procedures
(g), or Two-way ANOVA with Tukey´s post-hoc test (h). All results were generated from at
least three independent replicates. The exact group size (n) and P values for each comparison
are listed inSupplementary Table 10. *P<0.05, **P<0.01, ***P<0.001, ****P<0.0001.
Duan et al. Page 43
Nature. Author manuscript; available in PMC 2020 May 13.
Europe PM
C Funders A
uthor Manuscripts
Europe PM
C Funders A
uthor Manuscripts

Figure 3. Phage therapy against cytolytic E. faecalis abolishes ethanol-induced liver disease in gnotobiotic mice.(a) Transmission electron microscopy revealed that bacteriophages isolated were either
siphophages (Ef5.1, Ef5.2, Ef5.3, Ef5.4 and Ef2.2) or myophages (Ef2.1 and Ef2.3). Scale
bar=50 nm. (b–h) C57BL/6 germfree mice were colonized with feces from two different
cytolysin-positive patients with alcoholic hepatitis (feces from 1 patient also used in Figure
2) and subjected to chronic–binge feeding model, gavaged with control phages against C. crescentus (1010 PFUs), or a cocktail of 3 or 4 different phages targeting cytolytic E. faecalis (1010 PFUs) 1 day before an ethanol binge. (b) Serum levels of ALT. (c) Hepatic triglyceride
Duan et al. Page 44
Nature. Author manuscript; available in PMC 2020 May 13.
Europe PM
C Funders A
uthor Manuscripts
Europe PM
C Funders A
uthor Manuscripts

content. (d) Representative H&E-stained liver sections. Scale bar=100 μm. (e–g) Hepatic
levels of mRNAs encoding Il1b, Cxcl1 and Col1a1. (h) Proportions of mice positive for
cytolysin in liver, measured by qPCR for cylLS. Results are expressed as mean ± s.e.m (b, c,
e–g). P values are determined by Two-way ANOVA with Tukey´s post-hoc test (b, c, e–g) or
two-sided Fisher’s exact test followed by FDR procedures (h). All results are generated from
at least three independent replicates. The exact group size (n) and P values for each
comparison are listed in Supplementary Table 10. *P<0.05, **P<0.01, *** P<0.001.
Duan et al. Page 45
Nature. Author manuscript; available in PMC 2020 May 13.
Europe PM
C Funders A
uthor Manuscripts
Europe PM
C Funders A
uthor Manuscripts

Figure 4. Phages that target non-cytolytic E. faecalis do not reduce ethanol-induced liver disease in gnotobiotic mice.(a) Transmission electron microscopy revealed that bacteriophages isolated were either
podophages (Ef6.2, Ef6.3, Ef7.2, Ef7.3 and Ef7.4) or siphophages (Ef6.1, Ef6.4 and Ef7.1).
Scale bar=50 nm. (b–h) C57BL/6 germfree mice were colonized with feces from two
different cytolysin-negative patients with alcoholic hepatitis and subjected to chronic–binge
feeding model, gavaged with control phages against C. crescentus (1010 PFUs), or a cocktail
of 4 different phages targeting non-cytolytic E. faecalis (1010 PFUs) 1 day before an ethanol
binge. (b) Serum levels of ALT. (c) Hepatic triglyceride content. (d) Representative H&E-
Duan et al. Page 46
Nature. Author manuscript; available in PMC 2020 May 13.
Europe PM
C Funders A
uthor Manuscripts
Europe PM
C Funders A
uthor Manuscripts

stained liver sections. Scale bar=100 μm. (e–g) Hepatic levels of mRNAs encoding Il1b, Cxcl1, and Col1a1. (h) Fecal colony forming units (CFUs) of Enterococcus. Results are
expressed as mean ± s.e.m (b, c, e–h). P values are determined by Two-way ANOVA with
Tukey´s post-hoc test (b, c, e–h). All results were generated from at least three independent
replicates. The exact group size (n) and P values for each comparison are listed in
Supplementary Table 10. *P<0.05.
Duan et al. Page 47
Nature. Author manuscript; available in PMC 2020 May 13.
Europe PM
C Funders A
uthor Manuscripts
Europe PM
C Funders A
uthor Manuscripts