LIMIT DESIGN OF REINFORCED CONCIDJ.PE SLABS - CORE
257
LIMIT DESIGN OF REINFORCED CONCIDJ.PE SLABS - OPENINGS AND SLAB-COLUMN CONNECTIONS A thesis presented for the degree of Doctor of Philosophy in Civil Engineering in the University of Canterbury, Christchurch, New Zealand. by S. ISLAM 1973
-
Upload
khangminh22 -
Category
Documents
-
view
0 -
download
0
Transcript of LIMIT DESIGN OF REINFORCED CONCIDJ.PE SLABS - CORE
LIMIT DESIGN OF REINFORCED CONCIDJ.PE SLABS -
OPENINGS AND SLAB-COLUMN CONNECTIONS
A thesis presented for
the degree of Doctor of Philosophy
in Civil Engineering
in the University of Canterbury,
Christchurch, New Zealand.
by
S. ISLAM
1973

ABSTRACT
This thesis is concerned with two aspects of the limit design
methods of reinforced concrete slabs.
The first part deals with a theoretical investigation of
uniformly loaded two-way rectangular slabs with four positions of
rectangular openings, namely the slab centre, the slab corner,
the centre of a short side and the centre of a long side. Yield
line theory was used to derive equations and design charts suitable
for the limit design of such slabs reinforced orthotropically with
edges either all fixed or all simply supported.
The second part involves theoretical and experimental
investigations on the transfer of shear and unbalanced moments at
interior flat plate-column connections. Tests were conducted on
half scale reinforced concrete models under monotonic and cyclic
loading to determine the deterioration of load carrying capacity
and ductility which would occur under earthquake loadings. Ultimate
strength procedures were developed to predict the load carrying
capacity of slab-column connections with and without shear reinforce-
ment. Good agreement was obtained between the experimental and
theoretical strength of such connections. Of the various types of
shear reinforcement tested (cranked bars, structural steel shearheads
and vertical closed stirrups) the use of closed stirrups passing
round the top and bottom slab bars in the vicinity of the column
faces proved to be most effective.
i

ACKNOWLEDGEMENTS
I gratefully acknowledge the assistance received during the
course of this project and extend my thanks to:
Professor H.J. Hopkins, Head of Civil Engineering Department,
under whose overall guidance this study was ma.de;
Professor R. Park, supervisor for this study, for his
continued encouragement and valuable guidance throughout the project,
and for his helpful advice during the preparation of this thesis;
Messrs. H.T. Watson and P.C. Dawson, Technical Officers, and
the Technical Staff of the Civil Engineering Department for their
assistance in the experimental programme. I wish to particularly
thank Mr. A.G. Foot, Senior Technician, for his conscientious
preparation of the test equipment and test specimens and Mr. N.W.
Prebble, Senior Technician, for preparing the formwork;
Mrs. A. Watt for typing the manuscript;
Mr. W. McClelland for draughting assistance;
Mr. H. Patterson for photographic work;
The University Grants Committee, for financial assistance in
the form of a Commonwealth Scholarship;
Certified Concrete (Christchurch) Ltd, for their assistance
in casting the specimens and the concrete blocks.
Finally I wish to thank my wife for her encouragement and
help.
ii

CONTENTS
1. INTRODUCTION AND SCOPE OF RESEARCH
1.2
1.3
2.
2.1
2.2
2.4
2.6
2.8
3.,..,
3.1
3.2
................................. INTRODUCTION
SCOPE OF RESEARCH ~ e • • • • • • • • • • • • • • • • • • • • o • • • • • • • •
FORMAT ......................................... PART I: UNIFORMLY LOADED TWO WAY REINFORCED CONCREl'E SLABS WITH OPENINGS
SUMMARY ......................................... INTRODUCTION .................................... YIELD-LINE THEORY APPROACH ..................... ULTIMATE LOAD EQUATIONS FOR SLABS WITH OPENINGS •••
MINIMIZATION OF ULTIMATE LOAD .................... DESIGN CHARTS ................................... ACCURACY OF DERIVED CHARl'S ...................... EFFECT OF OPENINGS ON ULTIMATE LOAD ............. CONCLUSIONS••••••••••••••••••••••••••••••••••••••
PART II: TRANSFER OF UNBALANCED MOMENT AND SHEAR FROM REINFORCED CONCREI'E FLAT PLATES TO INTERIOR COLUMNS
SUMMARY .......................................... INTRODUCTION • , •••••••• .-••••••••••••••••••••••••••.
REVIEW OF PREVIOUS WORK ••••••••••••••••••••••••••
Summary •••••••••••••••••••••••••••••••••••••••••
3,2.1 Introduction .....•.•.•.....••.•••.•..••......•...
3.2.2 Investigations Without Shear Reinforcement•••••••
( i) Di Stasio and Van Buren••••••••••••••••••••
(l.. i) Moe •••••••••••••••••••••••••••••••••••••••
Page
1
2
3
5
5
6
9
25
25
26
39
44
45
49
49
49
50
51
iii

(iii) ACI-ASCE Committee 326 •••••••••••••••••••••••••••
(iv) Commentary on ACI Building Code (ACI 318-63) •••••
(v) Hanson and Hanson .............................. (vi) Revised Building Code Requirements for
Reinforced Concrete (ACI 318-71) ••••••·••••·••••
(vii) Hawkins and Corley •••• 0 ••••••••••••••••••••••••
3.2.3 Discussion of Methods of Analaysis Without Shear Reinforcement ..................................
3.2.4 Investigations With Shear Reinforcement •••••••••••••e
(i) Full Scale Test by Hollings •••••••••••••••••• 0 •
(ii) PCA Tests •••••••••••••••••••••••••• 0 •••••••••••
3.2.5 Effectiveness of Shear Reinforcement in Resisting Punching Shear •••••·•••••••••··••••••••••••
(i) Recommendation by ACI Building Code (ACI 318-71) ••
(ii) New Evaluation of Punching Shear Tests by Herzog ••
(iii) Discussion of Effectiveness of Shear Reinforcement
3.2.6 Tests at British Research Station
3.2.7 Seismic Resistance of Flat Plates
•••••••••••••••••••• 0
O O O O O O O • O O O O o o o o o & 0 0
3.2.8 Conclusions •••••••••••••••••••••••••••••••••••• 0 •••••
EXPERIMENTAL STUDY OF INTERIOR FLAT PLATE-COLUMN CONNECTIONS •••••••••••••••••••••••••••••••••••
Summary .............................................. Introduction ..........................................
3.3.2 Design of Test Specimens .............................. (i)
(ii)
Selection of Test Specimen •••••••••••••••••••••
Discussion of Method of Loading •••••••••••••••••
(iii) The Prototype Structure
(iv) Details of Test Specimens
3.3.3 Test Equipment and Procedure
.................. ,, ..... . •••••••••••••••••••••••
•••••••••••••••••••••••••
3.3.4 Test Results ••••••••••••••••••••••••••••••••••••••••••
(i) Description of Loading Cycle •••••••••·••••••••••
Page
57
58
61
62
66
71
71
74
76
76
77
79
80
84
86
86
88
97
103
104
iv
3.3.5
(ii) Strength and Ductility of Connections ........ (iii)Behaviour of Specimen 1 ...................... (iv) Behaviour of Specimen 2 ..................... (v) Behaviour of Specimen 3C ..................... (vi) Behaviour of Specimen 4s ..................... (vii)Behaviour of Specimen 5S •••••• 0 ••••••••••••••
(viii)Behaviour of Specimen 6cs .................... (ix) Behaviour of Specimen 7CS .................... (x) Behaviour of Specimen 8cs .................... Discussion of Test Results ~• ...................... (i) Strength
(ii) Ductility
................................... ••••• 0 •••••••••••••••••••••••••••••
(iii) Stresses in Slab Bars and Shear Reinforcement
(iv) Effect of Bending Moment Reversals
(v) Effectiveness of Various Shear Reinforcement Arrangements •••••••••••••••••
(vi) Junction Failure Mechanisms ................ (vii) Effective Width and Stiffness of Slab-Column
Specimens .................................. 3.3.6 Conclusions 0 • • 0 • • • • • • • , • • • • o e e • • • • • • • • • • • • • • • • • • •
3.4 THEORY FOR SHEAR-FLEXURE FAILURE OF SLAB-COLUMN CONNECTIONS WITHOUT SHEAR REINFORCEMENT ••••••••••
Summary
3.4.1 Introduction
3.4.2 Assumptions
•••••••••••••••••••••••••••••••••••••
••••••••••••••••••••••••••••••••••••••
3.4.4
3,4.6
3.4.7
Moment Transfer by Flexure
Effect of Membrane Action
••••••••••••••••••••••••
•••••••••••••••••••••••••
Moment Transfer by Vertical Shear Stresses•••••••••
Moment Transfer by Torsion•••••••••••••••••••••••••
Strength Equations ••••••••••••••••••••••••••••••••
...
Page
104
106
111
116
122
127
134
141
152
152
153
154
157
157
158
160
170
172
173
174
V

3.4.8 Comparison with Test Results •••••••••••••••• 0 •••••
Discussion of the Theory Presented ................ 3.4.10 Conclusions •••••••••••••••••••••••••••••••• 0 • •••••
3.6.1
3.6.2
THEORY FOR SHEAR-FLEXURE FAILURE OF SLAB-COLUMN CONNECTIONS WITH SHEAR REINFORCEMENT
Summary .................. • ......................... . Introduction ...................................... Inclined Cranked Bars ' ............................. Vertical Closed Stirrups
Structural Steel Shearhead
.......................... ........................
Comparison with Test Results ...................... Discussion of the Theory Presented••••••••••••••••••
Conclusions ....................................... THEORY FOR FLEXURAL FAILURE OF SLAB-COLUMN CONNECTIONS ••••••••••••••••••••••••••••••••••••• 0 •
Summary •••••ee.00$et•e11t•••••••••••••••••••••••••••••
Introduction ••••••••••••••• 0 ••••••••••••••••••••••
Development of Equations•••••••••••·•••••••·•·••••••
Comparison with Test Results •• " ••••••••••• 0 ••••••••
Conclusions ....................................... CONCLUSIONS AND SUGGESTED FUTURE RESEARCH .......... General ••••.••••...• ·• •.••••••••.•...•••.•••.•••.••
Summary of Conclusions•••••·••••••••••••••••••••••••
Suggested Future Research •••••••••••••••••••••••••
APPENDIX A BIBLIOGRAPHY ••••••••••••••••••••••••••••••••
APPENDIX B MATERIALS, EQUIPMENT AND TESTING PROCEDURE•••
B.1 MATERIALS ••••••••••••••••••••••••••••••••••
Page
175
187
188
189
189
193
194
197
200
201
202
202
202
203
208
211
21'2
212
212
213
A1
B1
B1
vi
B.1.1 B.1.,2 B.2
B.2.1
B.3.4
Concrete ............. ' ........................ . ........................................... Steel FABRICATION ..................................... Formwork o o o o o o • • o • o o o e e • • • • o o o o • o o • o o • • o • • • • o • •
Placing Reinforcement .......................... Placing Concrete ............................... TEST EQUIPMENT AND PROCEDURE •••• .... a•••~,•~•••••
Test Frame ••••••••••oeoeooooooooooooooo••••••••
Load Application and Measurement ............... Deflections .................................... Steel Strains .................................. Crack Detection ................................ Sequence of Operations .........................
Page
B1 B3 B7
B7
BB
BB
B12
B12
B12
B14
B14
B20
B20
vii
Figure
2.1
2.2
2.4
2.8
2.10
2.11
2.12
2.13
2.15
3 .. 1
3.4
LIST OF FIGURES
Slabs with Openings ................................. Yield-line Patterns for Central Openings 0 •••••••••••
Yield-line Patterns for Corner Opening ........ - • = = •
Yield-line Patterns for Opening at a Short Side .... Yield-line Patterns for Opening at a Long Side ..... Central Opening r' = 0 ........................... Central Opening r' = 1 ........................... Central Opening r' = 2 ........................... Corner Opening r' = 0 ........................... Corner Opening r' = 1 ........................... Corner Opening r' = 2 • • • • • • • • • • e • • • • • • • • o • • • • • • •
Opening at Centre of Short Edge r' = 0 ........... Opening at Centre of Short; Edge r• = 1 ........... Opening at Centre of Short Edge r' = 2 ........... Opening at Centre of Long Edge r' = 0 ........... Opening at Centre of Long Edge r' = 1 ........... Opening at Centre of Long Edge r' = 2 ........... Effect of Opening Size and Position on Ultimate Load of a Slab .................................... Interior Slab-Column Connection ................... Assumed Critical Sections and Shear Stress Distributions ••••••••••••••••••••••••••••••••·••••
Hanson and Hanson's Test Specimen and Loading Methods • ~ •••••••••••••••••••••••••••••••••• ~ •••••••
Hawkins and Corley's Analysis •••••••••••••• 0 ••••••
Details of Hollings' Test Structure • • • • • • • • • • o • e e •
PCA Test Specimens
BRS Model Slabs
................................ ...................................
viii
Page
7
10
14
19
22
27
28
29
30
31
32
33
35
37
46
52
59
73
75
81
3.8
3.9
3.10
3.11
3.12
3.13
3.14
3.15
3.16
3.17
3.18
3.19
3.20
3.21
3.22
3.23
3.24
3.25
3.26
3.27
3.28
3.29
3.30
3.31
3.32
3.33
3.34
3.3.5
Selection of Slab-Column Test Specimen ............. Slab-Column Test Specimen •••••••••••••••·•••••·••••
Details of Reinforcement .......... . ) .............. . Details of Joint without Shear Reinforcement••••••••
Inclined Cranked Bars for Specimen 4s .............. Shearhead for Specimen 5S ......................... Closed Stirrups for Specimen 6cs ••••••·••••••·•·••
Closed Stirrups for Specimens 7CS and Bes ••••••••••
Slab-Column Specimen in the Test Rig •••••••••••••••
Upward Load-Displacement Curve for Specimen 1 ••••••
Downward Load-Displacement Curve for Specimen 1 ••••
Stresses in Slab Bars of Specimen 1 ••••••••••••••••
Crack Pattern of Specimen 1 at 2 in. deflection•••••
Failure Surface of Specimen 1
Deflected Shape of Specimen 1
...................... ••••••••••••• 0 ••••••••
Upward Load-Displacement Curve for Specimen 2
Downward Load-Displacement Curve for Specimen 2
...... ••••
Stresses in Slab Bars of Specimen 2 ................ Crack Pattern of Specimen 2 at failure ............. Failure Surface of Specimen 2 ••••·•••••••••·•••••••
View of Specimen 2 after Removal of Broken Concrete ••
Loading Cycles for Specimen 3C •••••••••••••••·••··••
Load-Displacement Curve for Edge A of Specimen 3C ••••
Load-Dis_placement Curve for Edge B of Specimen 3C ••••
Stresses in Slab Bars of Specimen 3C ••••••••••••••••
Crack Pattern of Specimen 3C after Cycle 1 ••••••••••
Crack Pattern of Specimen 30 after Cycle 5 ••••••••••
Crack Pattern of Specimen 3C after Cycle 9 ••••••••••
Page
87
91
92
93
94
95
98
99
100
107
107
109
110
110
114
112
112
113
114
115
115
117
118
118
119
120
120
121
ix

3.36
3.37
3.38
3.39
3.40
3.41
3.42
3.43
3.44
Failure Surface of Specimen 3C ..................... Upward Load-Displacement Curve for Specimen 4s ••••• 0
Downward Load-Displacement Curve for Specimen 4s •••••
Stresses in Slab Bars of Specimen 4s ••••••••·••••••
Stresses in Cranked Bars of Specimen 4s ••••••·••••••
Crack Pattern of Specimen 4s ••••••••••••••••••••••••
Failure Surface of Specimen 4s ...................... Load-Displacement Curve for Edge A of Specimen 5S ••••
Load-Displacement Curve for Edge B of Specimen 5S ••••
Page
121
123
123
124
125
126
126
128
129
3.45 Stresses in Slab Bars of Specimen 5S ••••••·•••·•••••• 130
3.46 Stresses in Shearhead of Specimen 5S ••••••••••••••••• 131
3.47
3.48
3.49
3.50
3.51
3.52
3.53
3.54
3.55
3.56
3.5?
3.58
3.59
3.60
3.61
3.62
3.63
3.64
Crack Pattern of Specimen 5S ••••••••••••••••••••••••
Specimen 5S at 4 in. Edge Displacement •·••••••••••••
Loading Cycles for Specimens 6CS, 7CS and 8CS ....... Load-Displacement Curves for Edge A of Specimen 6CS ••
Load-Displacement Curves for Edge B of Specimen 6CS ••
Stresses in Slab Bars of Specimen 6CS 0 ••••••••••••••
Stresses in Stirrups of Specimen 6CS ••••••••••••••••
Crack Pattern of Specimen 6cs at Cycle 5 ••·••••••••••
Crack Pattern of Specimen 6CS at Cycle 5
Specimen 6CS at Edge Displacement of 7.2
............. in. • •.••••••
Specimen 6CS at the End of Testing .................. Load-Displacement Curves for Edge A of Specimen 7CS o•
Load-Displacement Curves for Edge B of Specimen 7CS ••
Stresses in Slab Bars of Specimen 7CS •••••••••••••••
Stresses in Stirrups of Specimen ?CS ••••••••••···•••
View of Specimen 7CS after Test ••••••••••••••••••·••
Deflected Shape of Specimen 7CS after Test .......... Load-Displacement Curves for Edge A of Specimen Bes ••
132
132
135
136
136
137
138
139
139
140
140
142
142
144
145
146
146
148
X
3.65
3.66
3.67
3.,68
3.70
3.73
3.75
3.79
3.80
3.81
3.82
3.83
3.84
B.1
B.2
B.3
B.4
B.5
B.6
Load-Displacement Curves for Edge B of Specimen Bes •••
Stresses in Slab Bars of Specimen Bes ................ •••••••• 0 •••••••• Stresses in Stirrups of Specimen Bes
Crack Pattern of Specimen Bes after Test ............. View of Specimen Bes after Removal of Broken Concrete ••
Computation of Edge Displacement ••·•••••••·••••••••••
Moments and Forces at Slab-Column Connection ......... Membrane Action ...................................... Interaction Diagrams for Hanson and Hanson's Specimens A1, A2 and A12 ••••••••••••••••••••••••••••••••••••••
Interaction Diagrams for Hanson and Hanson's Specimens B7 and B16 ••••••••••••••••••••••••••••••••••••••••••
Interaction Diagrams for Hanson and Hanson's Specimens C8 and C17 •••••••••••••••• • • • ••• •. • •• •. • 0 • • • • • • • • • • • •
Interaction Diagrams for Moe's Specimens M2, M2A, M3 and M4A •••••••••••••••••••••••••••••••••••••••••••••
Interaction Diagrams for Moe's Specimens M6, M7 and M9
Interaction Diagrams for Moe's Specimens M8 and M10 •••
Interaction Diagrams for Author's Specimens 1, 2 and 3C
Inclined Cranked Bars ••••••••••••••••••••••••••••••• 0
Shearhead Reinforcement
Yieid-line Pattern A1
Yield-line Pattern A2
.............................. ............................... ...............................
Yield-line Pattern B1 for Moe's Specimens ••••••••••••
Stress-Strain Curves for Steel ••••••••••••••••••••••••
Load-deflection Curve for Shearhead •••••••••••••••••••
Formwork and Reinforcement ••••••••••••••••••A•••••••••
Inclined Cranked Bars in Specimen 4s •••••·••••·•••••••
Shearhead in Specimen 58 •••••••••••••••••••••••••••••
Closed Stirrups in Specimen 6CS ••••••••••••••••••••••
Page
148
150
151
151
161
166
171
178
179
180
181
182
183
184
190
196
204
206
210
B5
B6
B9
B9
B10
B11
xi
B.7
B.8
B.9
B.10
B.11
B.12
B.13
B.14
B.15
Closed Stirrups in Specimens 7CS and Bes•••••••
Test Frame .................................... Method of A:pplying Line Load at Edge•••••••••••
Method of Applying Edge Load Through 4 Points ••
Application of Column Load •••••••·••••••••••••
Application of Upward Edge Load ••••••••••••·••
Application of Downward Edge Load ............. Load-Strain Plot for High Tensile Bar ......... Dial Gauge Locations ...........................
Page
B11
B15
B16
B16
B15
B17
B17
B18
B19
xii
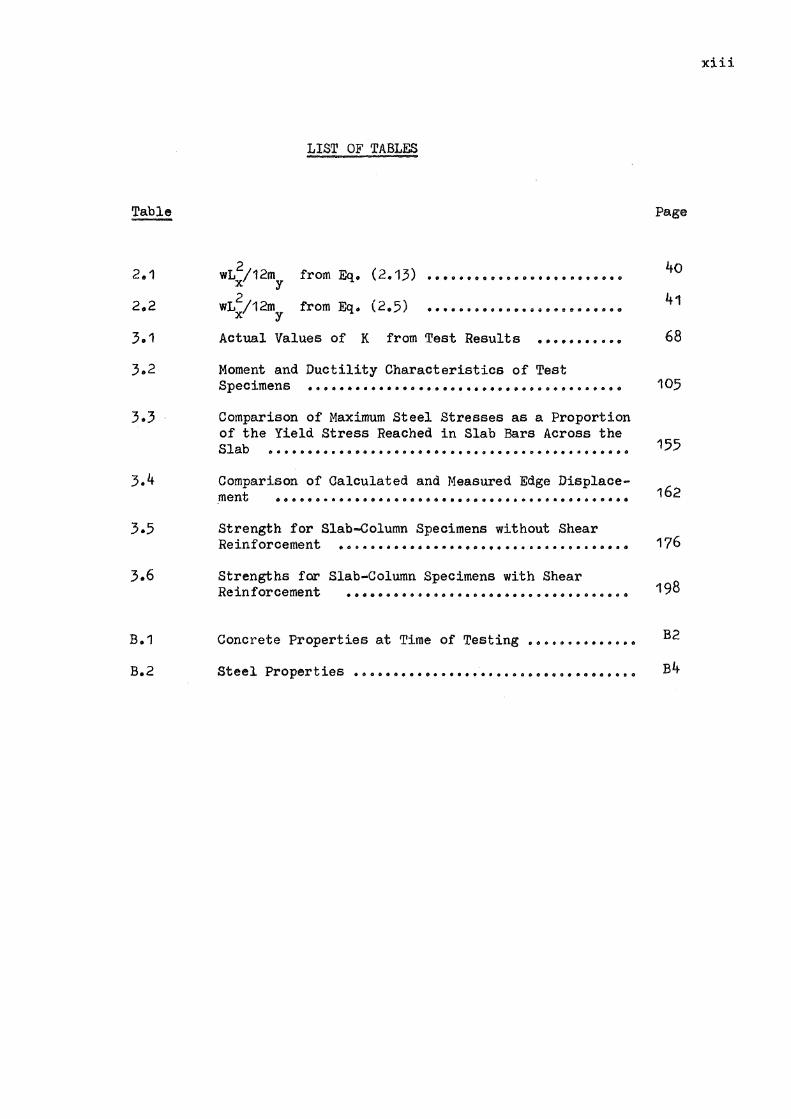
Table -2.1
3.1
3.4
3.6
B.1
B.2
LIST OF TABLES
wL2/12m from Eq. (2.13) • • • • • • o e • o o o • • • o o • o • 0 • • o 0 X y 2 (2.5) wL;/12my from Eq. •••••••••••••••~~e!f@•o•••
Actual Values of K from Test Results ........... Moment and Ductility Characteristics of Test Specimens ••.••••.•••.•••..••..••••••••..••...•.••
Comparison of Maximum Steel Stresses as a Proportion of the Yield Stress Reached in Slab Bars Across the Slab •....•••..•••...•.••••.......•.•..••.•..••••••
Comparison of Calculated and Measured Edge Displace-ment ••••••..•••• • • ••• • • • • • • • • • • • • • • • • • • • • • • • • • • • •
Strength for Slab-Column Specimens without Shear Reinforcement ••··•·•••••••••••••••••···•··•··•••·•
Strengths for Slab-Column Specimens with Shear Reinforcement ••••••••••••••••••••••••••••••••·•·•
Concrete Properties at Time of Testing•••••·•••·••••
Steel Properties•••••••••••·••••••··••••••••••••••••
Page
40
41
68
105
155
162
176
198
B2
B4
xiii
A s
A V
a
b
C
d
d' 1
d'
d II
fl C
f Sp
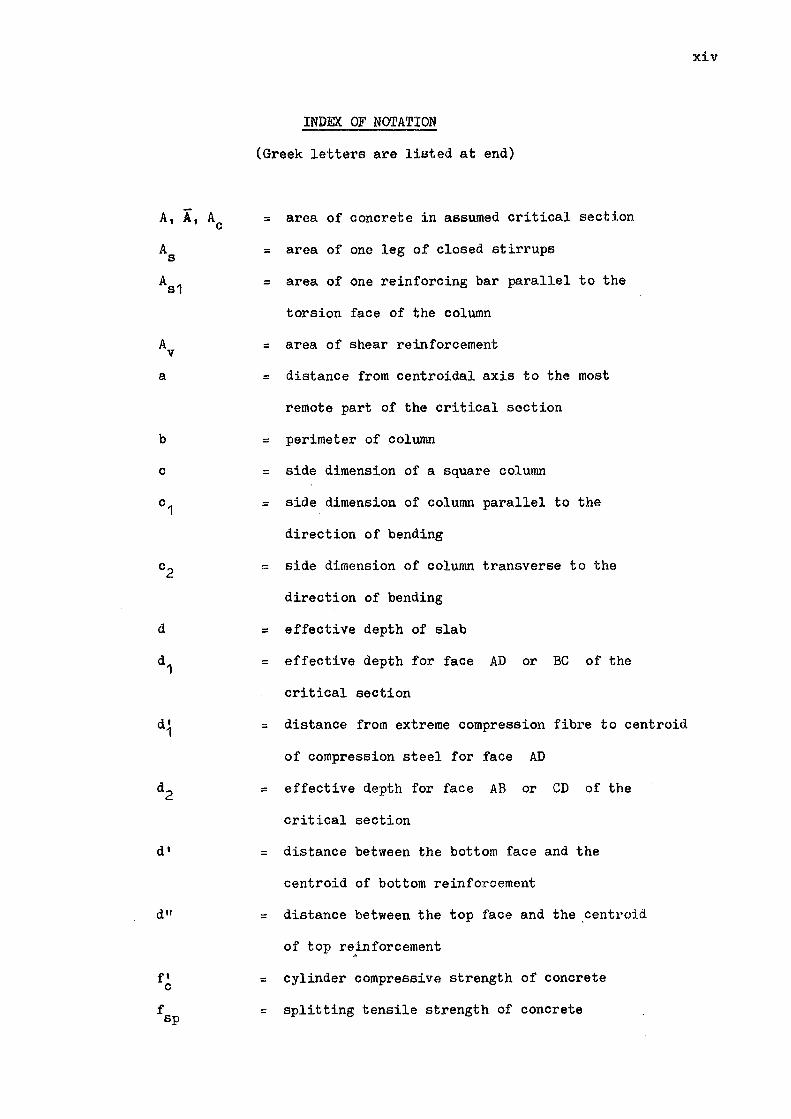
INDEX. OF NOTATION
(Greek letters are listed at end)
=
=
=
area of concrete in assumed critical section
area of one leg of closed stirrups
area of one reinforcing bar parallel to the
torsion face of the column
= area of shear reinforcement
= distance from centroidal axis to the most
remote part of the critical section
= perimeter of column
= side dimension of a square column
= side dimension of column parallel to the
direction of bending
= side dimension of column transverse to the
direction of bending
= effective depth of slab
= effective depth for face AD or BC of the
critical section
= distance from extreme compression fibre to centroid
of compression steel for face AD
= effective depth for face AB or CD of the
critical section
= distance between the bottom face and the
centroid of bottom reinforcement
= distance between the top face and the centroid
of top r9.inforcement
= cylinder compressive strength of concrete
= splitting tensile strength of concrete
xiv

K
M
M u
m r
kL y
= yield stress of reinforcement
= depth of structural steel shapes in shearhead
= polar moment of inertia of the surface described
by the critical section passing through the slab
thickness about its centroid
= moment reduction factor that specifies the part
of unbalanced moment producing shear stress on the
critical section
= dimension of the opening in the x and y directions
= length of shearhead arm measured from the column face
= spans of the slab in the x and y directions
(t > L ) y X
= total unbalanced moment
= bending moment acting on face AB, BC, etc. of
the critical section
= ultimate resisting moment for face AB, BC, etc. of
the critical section
= ultimate flexural capacity of the slab
= ultimate unbalanced moment capacity without shear
transfer
= total ultimate unbalanced moment capacity
= service load unbalanced moment capacity without
shear transfer
= part of moment resisted by shear stresses acting on
faces AB and CD of the critical section
= maximum measured unbalanced moment
= working stress design moment acting on faces
AB and CD of the critical section
= sum of flexural moments acting on faces AB and
CD of critical section., calculated by working
stress design method
xv
m u
m' u
m , m X y
m' X
r
r'
s
T
T u
t
u e
v•
m' y
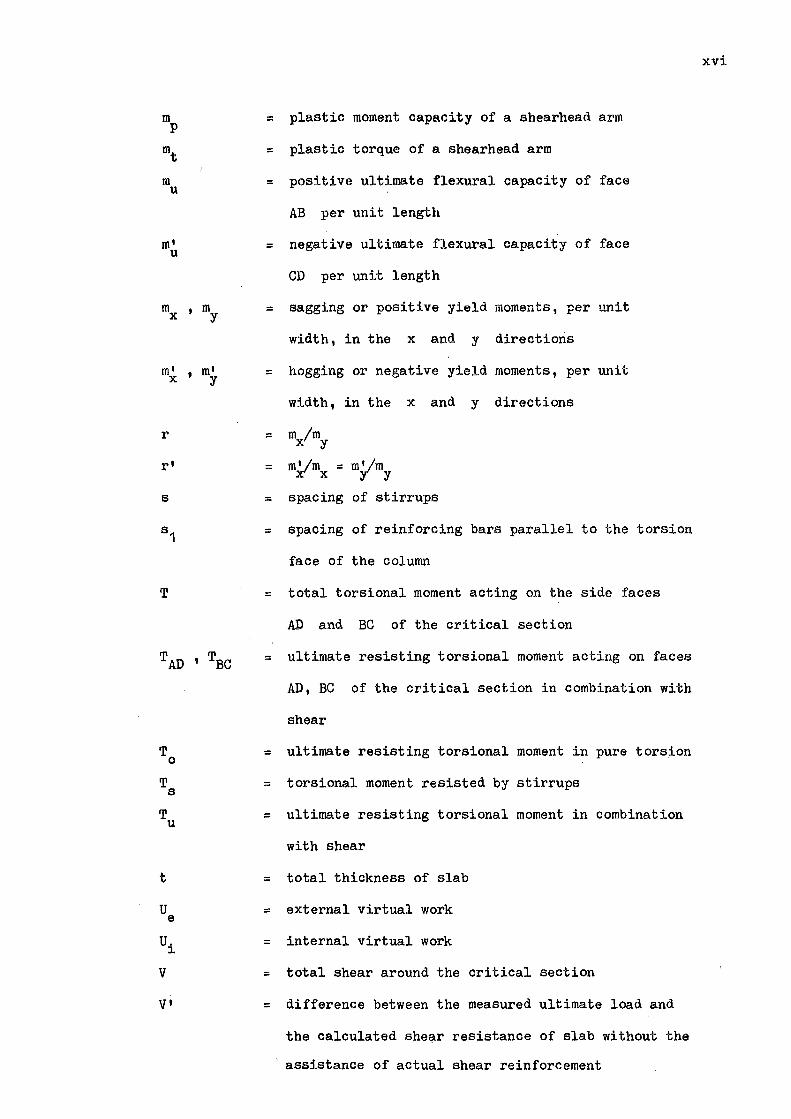
= plastic moment capacity of a shearhead arm
= plastic torque of a shearhead arm
= positive ultimate flexural capacity of face
AB per unit length
= negative ultimate flexural capacity of face
CD per unit length
= sagging or positive yield moments, per unit
width, in the x and y directions
= hogging or negative yield moments, per unit
width, in the X and y directions
= m /m X y
= m~mx = m;Jmy
= spacing of stirrups
= spacing of reinforcing bars parallel to the torsion
face of the column
= total torsional moment acting on the side faces
AD and BC of the critical section
= ultimate resisting torsional moment acting on faces
AD, BC of the critical section in combination with
shear
= ultimate resisting torsional moment in pure torsion
= torsional moment resisted by stirrups
= ultimate resisting torsional moment in combination
with shear
= total thickness of slab
= external virtual work
= internal virtual work
= total shear around the critical section
= difference between the measured ultimate load and
the calculated she~r resistance of slab without the
assistance of actual shear reinforcement
xvi
vflex
Vo
vs
vu
vw
VAB 'VBC
v1 ' V max
V u
VAB
w
X 0
~1
11
p
P'
1AD
0
'
v2
t VBC
~2 '
1BC
~3
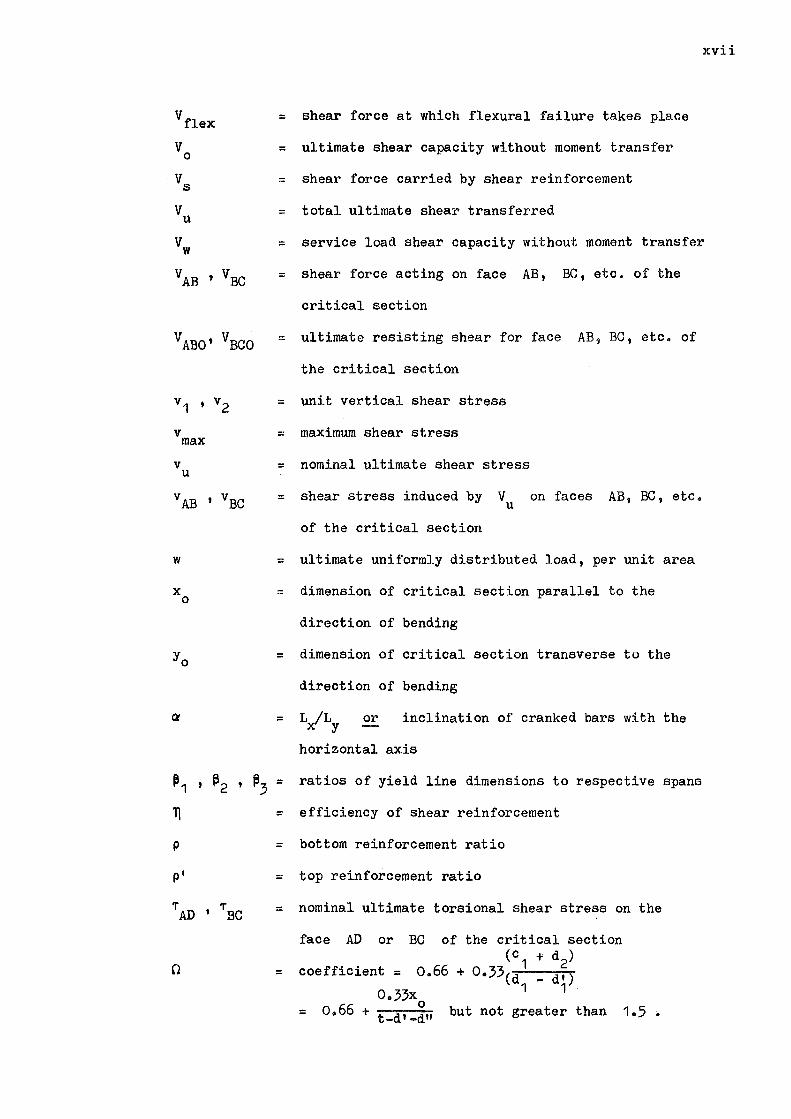
= shear force at which flexural failure takes place
= ultimate shear capacity without moment transfer
= shear force carried by shear reinforcement
= total ultimate shear transferred
xvii
= service load shear capacity without moment transfer
= shear force acting on face AB, BC, etc. of the
critical section
= ultimate resisting shear for face AB, BC, etc. of
the critical section
= unit vertical shear stress
= maximum shear stress
= nominal ultimate shear stress
= shear stress induced by
of the critical section
V u on faces AB, BC, etc.
= ultimate uniformly distributed load, per unit area
= dimension of critical section parallel to the
direction of bending
= dimension of critical section transverse to the
=
= =
=
=
=
=
direction of bending
L,/Ly or inclination of cranked bars with the
horizontal axis
ratios of yield line dimensions to respective spans
efficiency of shear reinforcement
bottom reinforcement ratio
top reinforcement ratio
nominal ultimate torsional shear stress on
face AD or
coefficient=
BC of the critical section (C1 + d2)
o.66 + o.33(d _ d')
= o.33x
o.66 + t-d'-~"
1 1
but not greater than
the
1. INTRODUCTION AND SCOPE OF RESEARCH
1.1 INTRODUCTION
In the design of reinforced concrete slabs most codes of practice
allow approximate meth~ds based on the elastic plate theory and give
moment coefficients for regular panels. The use of the actual elastic
theory distribution of moments is too complicated for practical design.
Further,once concrete is cracked and strains in the concrete and steel
1
get into the inelastic region,the assumptions of the elastic theory
remain no longer valid. A more rational method to be used in
conjunction with ultimate strength proportioning of reinforced concrete
slabs is one which is based on their actual behaviour at failure and takes
inelastic strains into consideration when determining the distribution
of bending moments and forces in the entire floor system. Such a design
approach is called limit design which recognises that due to plasticity
the distribution of moments in the slab may be different at failure or
collapse from the elastic distribution. By using this method simple
accurate solutions can be obtained, even when designing slabs of unusual
shape and boundary conditions.
Although in recent years the limit design method has become widely
recognised as an accepted design procedure for reinforced concrete slabs,
several aspects of the theory require further investigation and
clarification. Two such aspects are slabs with openings and flat plate-
column connections transferring shear and unbalanced moment.
To meet the functional requirements of architects and planners for
service ducts in buildings, openings of considerable siz~ are often
placed at various positions in the floor slabs. The analysis of such
slabs always presents a problem to structural designers. An investigation
is needed to study the effect of openings on the ultimate strength of
slabs.
The use of beamless flat plate construction has become a popular
structural system because of its aesthetic features and economical
considerations resulting from reduced floor heights and simplified
formwork. The design of a flat plate structure is generally controlled
by the behaviour of the slab-column connection which is the most critical
part of such a structure and is vulnerable to premature shear failure in
the slab around the column. When a flat plate floor is subjected to
unbalanced gravity loads, wind or earthquake loadings, there may be a
transfer of substantial unbalanced moment in addition to shear between
2
the slab and the column. For such connections only a limited theoretical
and experimental work has been done. Very little information is available
on test data or design procedures for connections containing some form of
shear reinforcement. Further in countries requiring design for earthquake
loading design engineers have generally been cautious regarding the seismic
resistance.of flat plate structures. The main reason for caution is the
shortage of experimental evidence on the behaviour and performance of
slab-column connections under earthquake conditions. A study is necessary
to obtain further insight into these aspects of the slab-column connection
behaviour.
1.2 SCOPE OF RESEARCH
The first part of this investigation concerned the limit design of
uniformly loaded two-way slabs with openings. Rectangular slabs with a
range of rectangular openings were considered. The openings occupied
four positions, namely, central opening,, corner opening, opening at the
centre of a short side and opening at the centre of a long side. The
edges of the slab were assumed to be either all fixed or all simply
supported. The slab reinforcement was considered to be orthotropic.
The second part of the investigation concerned the transfer of shear
and unbalanced moment at interior flat plate-column connections.
3
Experimental work was carried out on one-half scale reinforced concrete
models of slab-column specimens with square columns. Methods to increase
the shear strength of slab-column connections by using various types of
shear reinforcement in the form of cranked bars, shearheads and closed
vertical stirrups were investigated. Two types of loading methods were
used. In order to make an appraisal of the existing design procedures
and to substantiate the theory developed here the slab-column connections
were loaded to failure with dead load plus live load and with monotonically
increasing moment. The deterioration of load carrying capacity and
ductility which would occur under seismic loading conditions were examined
by subjecting the connections to cycles of bending moment reversals with
the same vertical loading. Theoretical procedures were developed for
predicting the unbalanced moment capacity of interior slab-column
connections with and without shear reinforcement.
1.3 FORMAT
The chapters of this thesis have been limited to three and arranged
as follows:
Part I of the thesis appears under Chapter 2 which covers all the
work including derivation of ultimate load equations and design charts
executed in connection with the limit design of uniformly loaded two-way
slabs with openings.
Chapter 3 contains Part II of the thesis and is divided into several
sections. In Section 3.2 a review of previous investigations on the
transfer of shear and moment is presented and the need for an improved
theory is pointed out.
The experimental work and test results are contained in Section 3.3.
The variables in the test sequence included the use of various types of
shear reinforcement and loading methods which are of monotonic and cyclic
types.

Sections 3.4 and 3.5 present theories developed for shear-flexure
failures of slab-column connections with and without shear reinforcement
and Section 3.6 considers the flexural failure of such connections.
These theories are compared with test results reported in this thesis
as well as with those reported by other investigators.
The conclusions that have been reached are summarised in Section 3.7
and suggestions are made for future research. Generally the conclusions
for each section of the work appear at the end of appropriate sections,
and consequently the formal conclusions in this section are comparatively
brief.
4

2.
SUMMARY
PART I UNIFORMLY LOADED TWO-WAY
REINFORCED CONCRETE SLABS
WITH OPENINGS
Yield-line theory is used to derive equations and charts
suitable for the limit design of uniformly loaded rectangular
reinforced concrete slabs with rectangular openings. Four
positions of openings are considered: the slab centre, the
slab corner, the centre of a short side and the centre of a
long side. The ratios of the corresponding lengths of the
sides of the opening and the slab are kept the same and sizes
of opening of up to o.6 of the length of the slab sides are
considered. The edges of the slab are assumed to be either
all fixed or all simply supported. Design charts are plotted
for various values of the ratio of negative to positive yield
moments and for the ratio of the yield moments in the two
directions.
2.1 INTRODUCTION
5
Two-way reinforced concrete slabs often contain openings of
considerable size for ducts, pipes, and other services. Elastic
theory analysis indicates high peaks of bending moment in the
corners of such openings but in reinforced concrete slabs such
peaks of bending moment are reduced by moment redistribution and
a limit design incorporating an isotropic or orthotropic
reinforcement arrangement may be used. The ultimate strength of
such slabs may be conveniently determined using the yield-line
1 theory due to Johansen. The draft British Code 2 recommends
yield-line theory as one of the possible methods of slab design.
Lash and Banerjee3 and Zaslavsky4 have produced ultimate load
equations for uniformly loaded slabs with central openings, and
Johansen5 has produced some equations for openings in various
positions. Here design equations and charts are produced for
uniformly loaded two-way rectangular slabs with edges either all
fixed or all simply supported and with a range of rectangular
openings.
In Fig. 2.1 four possible positions of the opening are shown:
(a) central opening, (b) corner opening, (c) opening at the centre
of a short side and (d) opening at the centre of a long side.
Various sizes of opening are considered and in order to simplify
the plotting of design charts the ratios of the lengths of the
sides of the opening and the lengths of the sides of the slab are
kept the same. The design charts are plotted for orthotropic
reinforcement with various values for the ratio of negative to
positive yield moments and for the ratio of the yield moments in
the two directions.
2.2 YIELD-LINE THEORY APPROACH
6
When a reinforced concrete slab reaches ultimate load it is
converted into a mechanism by a system of lines of intense cracking
across which the tension steel has yielded. Once the system of
yield lines at collapse has been postulated the ultimate load of
the slab may be determined by using either the virtual work
equation or the equations of equilibrium for the segments between
the yield lines. Here the virtual work method will be used since
the ultimate load is not particularly sensitive to small changes
in the dimensions defining the positions of the yield lines and

D~L. I .. kly ~
Ly ---~
(a) Central opening.
·r-_ __JJL, :~~
~ Ly ~ (c) Opening at Centre of
Short Edge.
Free (unsupported) Edge.
xxxxxxx Fixed edge.
LX
LX
UOC XX XJ(J{JC X
ikLX - __i
e---- I kLX_-j
-~~--__j (b) Corner opening.
xxxxxxxx
kl 1· y --1
1-Ly ~
(d) Opening at Centre of Long Edge.
r:xes. X
FIG. 2.1 SLABS WITH OPENINGS
I I
!Lx
-.,J

the method suits well the numerical procedure of solution that
will be used.
8
The ultimate load is found by giving the slab in the
collapse con-di tion a small virtual displacement in the direction
of the loading and equating the external work done by the load in
moving through the virtual displacements to the internal work
done by the bending moments at the yield lines as the segments
rotate about the support axes.
be written as
The virtual work equation may
JJw.6(x,y)dx.dy = \ ( m e y 1
+ m e x1
) L X X y y •••• (2.1)
where
m X
e X
m y
e y
= ultimate load per unit area
= virtual displacement in the direction of the
loading at the element of area of dimensions
dx by dy
= yield moments per unit width in the x and y
directions
= components of the virtual rotation of the slab
segments in the x and y directions
= the projected lengths of the yield lines in
x and y directions.
When Eq. (2.1) is written for a particular slab it will
generally include terms ~1 , ~2
, ~3
etc. which define the
positions of the node points of the yield lines. The values of
~1 , ~2 , ~3
etc. to be used in the equation are those which give
the minimum load to cause failure.
Since yield-line theory is an upper bound method care must

9
be taken to examine all the possible yield-line patterns to ensure
that the most critical collapse mode is considered because other
wise the load carrying capacity of the slab will be overestimated.
There are several possible yield-line patterns associated with the
four types of openings to be investigated.
The effect of corner levers will be ignored. In each corner
region the yield line will be considered to run straight into the
corner. Corner levers theoretically cause a small reduction in
the ultimate load but it is felt that their effect can justifiably
be neglected since tests have generally shown yield-line theory to
be conservative because of the neglect of the effect of membrane
action.
ULTIMATE LOAD EQUATIONS FOR SLABS ~ITH OPENINGS
Uniformly loaded two-way rectangular slabs with the exterior
edges either fixed or simply supported and with the four types of
rectangular openings shown in Fig. 2.1(a),(b),(c) and (d) will be
investigated. The slab will be considered to be reinforced
orthotropically by steel in the top and the bottom running parallel
to the edges except that in the case of simply supported edges it
will be assumed that no top steel is present. The following
equations are derived for slabs with fixed edges but the case of
simply supported edges may be obtained by putting r' = o •
The uniform load is only considered to be acting over the region
of the slab where there is no opening, i.e. the slab is not
carrying load over the. area of the opening.
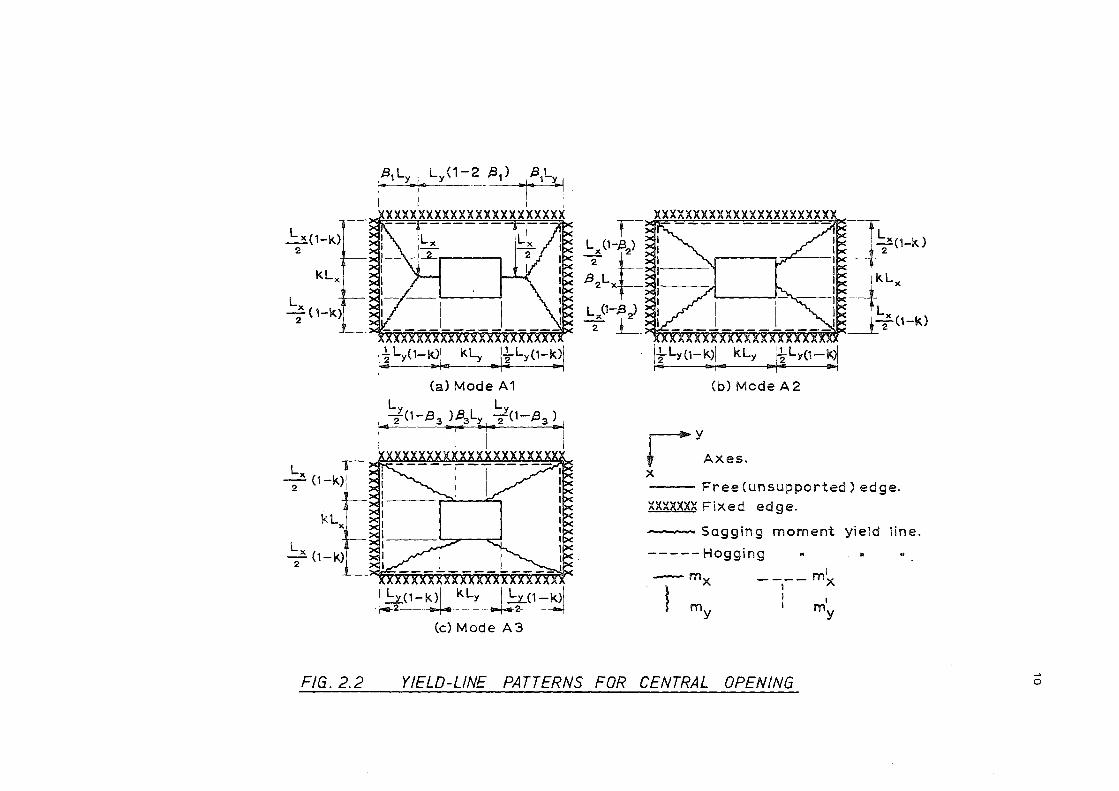
Central Opening
The three yield-line patterns considered for a slab with a
central opening are shown in Fig. 2.2. Only one unknown
L x (1-k) 2
LX ( 1-k) 2
Lx {1-k) 2
~ (1-k) 2
FIG. 2.2
,t31Ly, L/1-2 /3 1) /31Ly • Dl4 -- .. ,.. .., I I I
xxxxxxxxxxxxxxxxxxxxxx I E= ~
Ii Ly(1-~14 kLy .. li-Ly(1-~
(a) Mode A1
Ly Ly 2<1-.B3 )/33LY 2<1-.B3) 1· --1-- .,. ..!
xx
~(1-k.:I .. kl~ -1~<1-=-~ (c) Mode A3
-fl ' xc --t 2 1-k)
ikL
~.-.o,r---~tL • vVVV:- - _t X vvVV ---VVvVvvvvr 7(1-k)
~Ly(1-~I • kLy .. \iLy(l-~I
(b) Mode A2
ryAxes. X --- Free (unsupported) edge.
XXXXXXX Fixed edge.
~ Sagging moment yield line.
----- Hogging b
-mx
l my
m' --,-- X I I
I my
YIELD-LINE PATTERNS FOR CENTRAL OPENING _,. 0
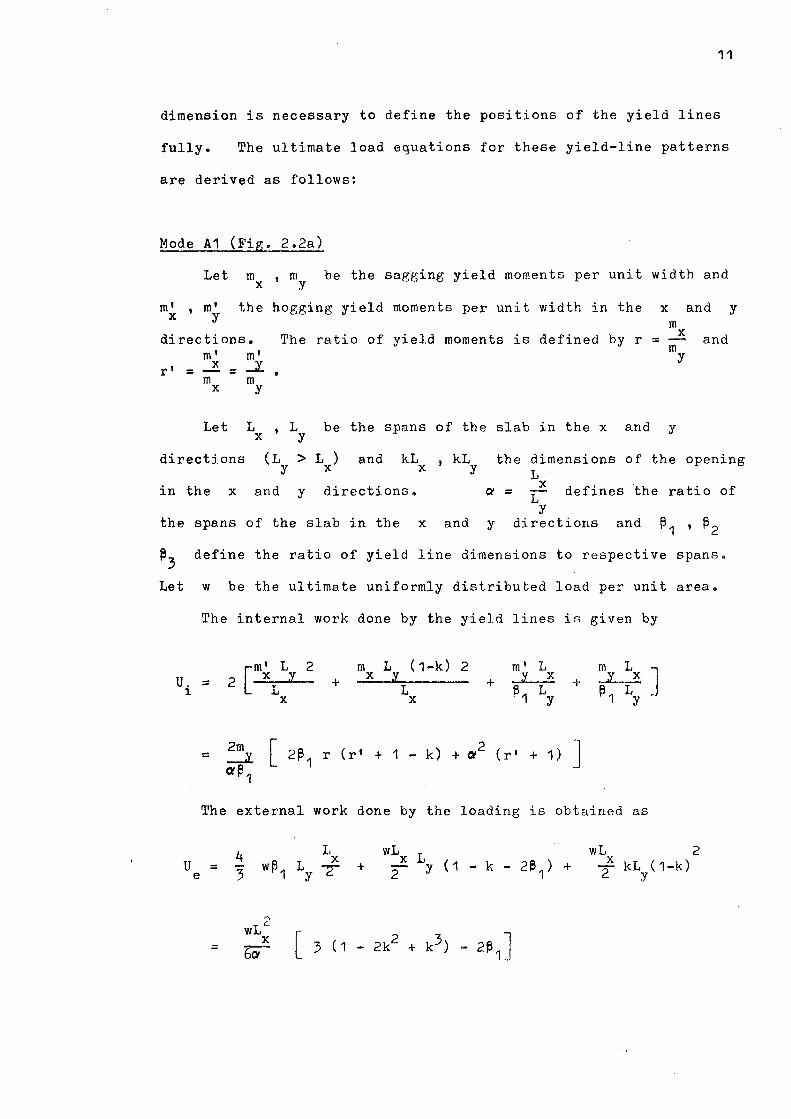
11
dimension is necessary to define the positions of the yield lines
fully. The ultimate load equations for these yield-line patterns
are derived as follows:
Mode A1 (Fig. 2.2a)
Let m , m be the sagging yield moments per unit width and X y.
m1 m' X ' y
the hogging yield moments per unit width in the x and
di rec ti ons. m' m'
r' X J. = = m m X y
Let L X
The ratio of yield moments is defined by r =
.
' L be the spans of the slab in the x and
y
m X
m y
y
and
y
directions (L > L ) and kL t kL the dimensions of the opening y X X y L in the X and y directions. Of
X defines the ratio of = L y
the spans of the slab in the X and y directions and ~1 ' ~2
~3
define the ratio of yield line dimensions to respective spans.
Let w be the ultimate uniformly distributed load per unit area.
u. 1
u e
The internal work done by the yield lines is given by
==
=
The
=
=
[m' L 2 m L (1-k) 2 m' L m 2 X y + X y y X y + + L L ~1 L ~1 X X y
2m [ 2~ 1 r {r' + 1 - k) + a2 (r' + 1) ] _J_ a~1
external work done by the loading is obtained
4 3
L X
w~1 Ly 7
')
wLL X
~
wL + 2
L wL X (1 - k - 21,) + X
y 2 1
L ] X
L y
as
kL (1-k) y
2

Equating u. = u ' one obtains 1 e
~[ 2~1 r(r 1 + 1 - k) + cl ( r' + 1)] w =
12 2k2 + k3) 2(,2 ....
3~1 (1 - -X 1
Mode A2 (Fig. 2.2b)
The internal work done by the yield line is given by
2 [ m' L 2 m L (1-k) 2 m' L 2 m L X ( 1-~2)
u. X Y.. X -:I. + Y. X -:t. (1-~2) + ( 1-k) + = L LX (1-(,2) Ly L (1-k) 1
X y
4m [r(1 - k) (r' + 1 - k) + 0t2 (1 - ~ ) (r' + 1 - (,2)] _JI.. 2
= Ol (1 - (, 2 ) (1 - k)
The external work done by the loading is given by
4 w L ( 1-k) L (1-(,2) + w (,2 L
L (1-k) u J. X x_:f..
e = 3 2 2 2
+ wkL L (1-k) (1-k) y X
2 (1-(,2)
6a
[2(1-k)(1-(,2 )2 + 3~2(1-k)(1-~2) + 3k(1-k) 2]
(1 - ~2)
Equating U. = U l e
Mode A3 (Fig. 2.2c)
[m' L 2 m L (1-k) 2 m' L 2 m L (1-~3
) u. 2 y X -:t. X X y + X Y:_
= (1-~3) + (1-(,3) + L (1-k) L ( 1-k) l L L
y y X X
2]
12
(2.2)
2 ]
4m 2 k)(r• + 1 - k) + r(1 - ~ )(r' ~2) [ 0/ (1 - + 1 -2 = --3..
OI
4 w 5! (1 - f; ) L
u X = 3 2 3 2 e
L ( 1 - ~ ) kL w + 2
y 3 X
2
= wLX [ b(Y
2(1 - ~2)(1
Equating u. = 1
u e
(1 - ~3)(1 - k)
(1 - k) + ~ L (1 - k)~3
L X y
2
(1 - ~ ) ~
(1 - k)
- kl + 3~2(1 - kl 3k (1 - ~ >2 + 2
( 1 k)
13
]
]
24m w = _J..
12
[ 0t2 (1 - k)(r' + 1 - k) + r(1 - ~ )(r' + 1 - ~ )
2(1 - ~3
)2 (1 - k) 2 + 313
(1 - k) 2 (1-~3
) + 3k(1-~3
) 3] X
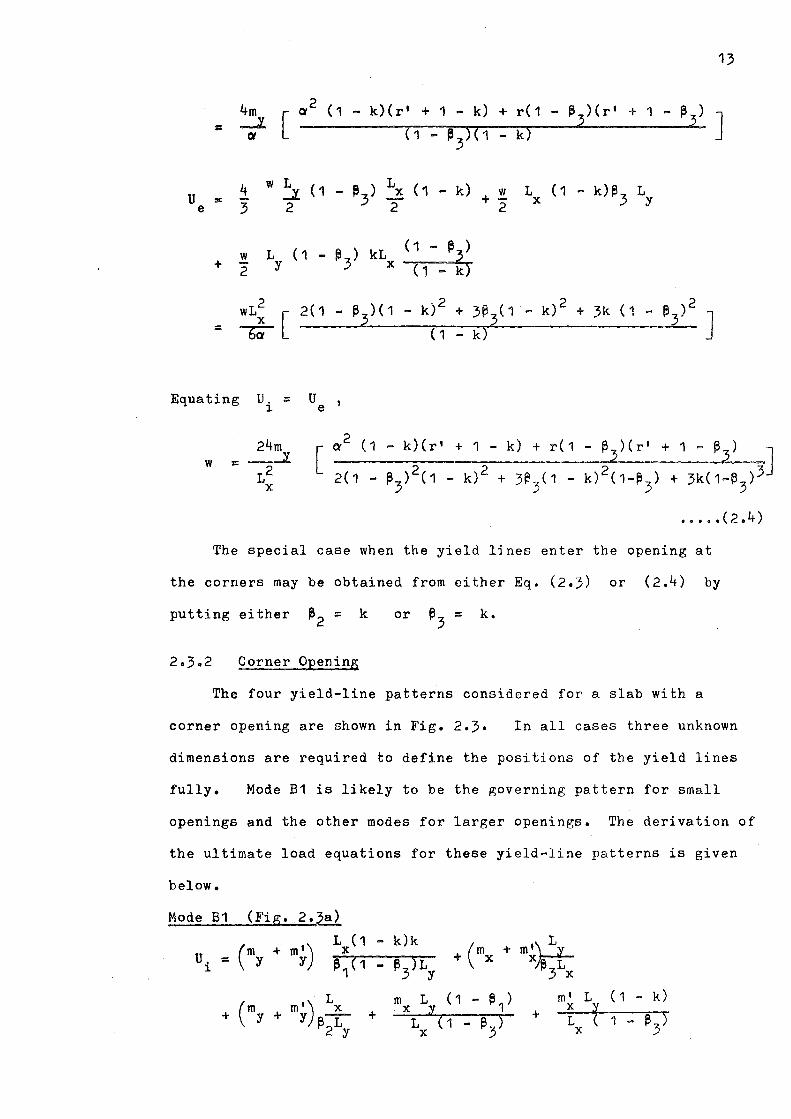
••••• (2.4)
The special case when the yield lines enter the opening at
the corners may be obtained from either Eq. (2.3) or (2.4) by
putting either ~2
= k or ~3
= k.
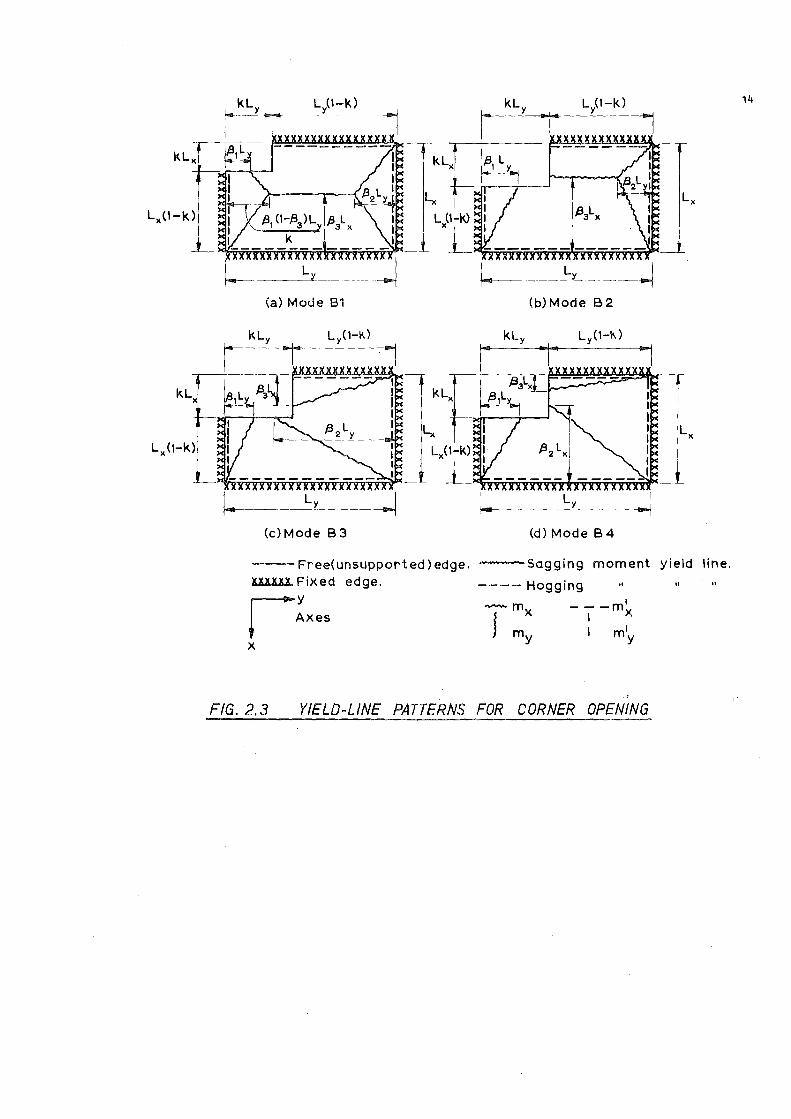
Corner Opening
The four yield-line patterns considered for a slab with a
corner opening are shown in Fig. 2.3. In all cases three unknown
dimensions are required to define the positions of the yield lines
fully. Mode B1 is likely to be the governing pattern for small
openings and the other modes for larger openings. The derivation of
the ultimate load equations for these yield-line patterns is given
below.
Mode B1 (Fig. 2.3a)
L (1 - k)k X
·L +(my+ m') x + y ~T
2 y
+ (mx + m'\ LY x~
3 X
m' L ( 1 - k) +
X y
r kly -1 ..
L}l-k)
1 klxt ~ 1 Ly
··~
h ~ Lx l.s3LX L (1-k) XL
~ Ly.~.----~
(a) Mode B1 (b)Mode B2
1-- -1 .. E:::;~~~.
Lx
Lx(1-k)
_L~~~,ni,r
(c) Mode B 3
---Free(unsupported)edge. xxxxxx Fixed edge.
r:xes X
(d) Mode B 4
--·~-sagging moment yield line.
---- Hogging
---m' I X
I m1 y
FIG. 2.3 YIELD-LINE PATTERNS FOR CORNER OPENING
14

= m [(1+r 1 )(1-k)ak
y ~ (1 - ~) + 1 3
_ ! ~1
L kL k 3 Y x1-~
=
From Ui
6m y
= u e
w kL
3 - - X 2
+ a-(1+r 1 )
~2 +
15
r(1-~ 1 + r' - r' k)] 0'(1 - ~ )
3
+ r(1-~ +r'-r'k)~ ~ ~ J 1 1 2 3
~1 ~2 ~3[(3-~2)(1-~3)k - ~1 (1-~3)2 - k3 (3k-~1)]
•••••• (2.5)
Mode B2 (Fig. 2,3b)
m' L + X y +
~3 LX
m ~1
L X y + ~3 1x
m L (1-k) X y

m [a(1+r') = y ~ +
2
w + -3 ~1
( 1 +r 1 )( 1-k) 2a
~1: ~3
L L ( 1-k) y X
wL2
[ ~3
(3-3k-~ 2 ) ( 1-k>2 X + = ~
From U. = U l. e ,
6m w = _J__
12 X
+ ! 2
( 1 - k)
~3
(3k-~1
)
16
r(1+r 1 )(1-k)]
+ er ( 1-~ 3
)
]
••••••• (2.6)
Mode B3 (Fig. 2.3c)
m' L y +
~2 L
= my [
X +
y
L (1-k) X
m L (1-µ) y X
~2 Ly
c.i(1-k)(1+r 1 )
~1 +
m' L m ~1
L m ~2 L X y X ~ X ~ + L (1-k) + L (1-k + L (1-k X X X
· m ~ L ) L (1-k)(1-k) + Y 3 X + (m + ffi I -:!_
X -~ L X ~3 1x ~2 2 y
a(r'+1-k+~3
) r(r•+~1+~2) 2 r(1+r 1 )(1-k)
] ~2
+ a (1-k) + Cc'~2 ~3

17
wL; (1-k) [<3-~ 1 - ~2)~2 + 3(k-~3)(1-k) + 2~3(1-k) J = 6&_~2
From U. = U 1 e
[a2(1+r')~2~3
(1-k) 2 + a2(r'+1-k+~3
)~ 1~3
(1-k)
+ r(r'+~1+~2)~1~2~3 + r(1+r')(1-k)3 ~1]
••••••• (2.7)
Mode B4 (Fig. 2.3d)
(m + m') Lx(1-k) (1-k) m' L m ~
1 L
X y + X y + m L (1-k)
U .. = y y ~ L ~ 1 1 y 2 +
~2 LX ~2 1x X y
m' L m ~2 L m ~3 Lx Y X Y X Y _ + L (1-k) + L (1-k) + _,L......._.(-1--k ..... )
y y y
2 m [(1+r 1 )CY(1-k)
= y ~1 ~2
CY(r•+~2+~3)
+ (1 - k)
r(r 1 +1+~ 1-k) + ----- +
C\'~2
U w L (1-k) ~
1L (1-k)
e = 3 X y ~2
w L (1-~ -~) L (1-k) + 2 X 2 3 y
From U. = U l. e
+ w L (k-~
1) L (1-k)(1-k)
2 y X ~
w L ( 1-k) ~ 3
Lx + - y 3
2
r(1-k)(1+r')]
0'~3
18
[a2(1+r')(1-k)3~3-t0'2(r•+~2+~3)~1~2~3+r(r'+1+~1-k)~1~3(1-k)
+ r(1+r')~ 1~2 (1-k) 2 ]
w =
......... (2.8)
The special cases where one or more yield lines enter the opening
at the corner may be obtained from the above equations.
Opening at a Short Side
The three yield-line patterns considered for a slab with an opening
at the centre of a short side are shown in Fig. 2.4. Only two unknown
dimensions are required to define the positions of the yield lines fu}ly
in each case. Mode C1 will govern if the opening is of small size;
modes C2 and C3 will govern for larger size openings. The ultimate
load equations derived for these yield-line patterns using the virtual
work Eq. (2.1) are as follows:
Mode C1 (Fig. 2.4a)
u. == 1
+
+ m' L ( 1-k)
y X ( m + m')L 2 + X X y L
X
L (m + m') x
+ y YfL"" 2 y
_ my [ a2(1+r'-r'k)~2 + 4r~ 1~2(1+r 1
) + ~2
~1(1+r')]
- a~l2
w w L L w L L ( 1-~ -~ ) w u = 3 ~1 L L + 3 ~2 + - kL e y X y X 2 X y 1 2 2 y
wL2
3k3] = 6&~1 [ ~1 (3 - ~ - ~) -1 2
kL _L X ~1
,,.. .82 Lyj
:xxxxxxxx
'2_ ( 1-K) I lx t I
lx -(1-K) 2
~L-t 2
klx
Lx ~ (1-K)
-(1-K) 2 L
l~~CI Ly(1-k) .. 1 ~ kly ~-
Ly{1-k) ... 1
(a) Mode C1 (b) Mode C2
1--Ly
i ryAxes
Lx ~ t X -
2- (1-K) Fr-ee (unsupported) edge.
i uxxxx Fixed edge.
kLx IL ~ --- Sagging moment yield line. I
X
Lx t- l --- Hogging " N
-(1-K), I 2 L -mx ---m
\ my
I X
1 ...
kly ...1. ly(l-k) .j I I my
(c) Mode C 3
FIG. 2. 4 YIELD-LINE PATTERNS FOR OPENING AT A SHORT SIDE
.... -a

20
From u. = u l e
6m [a2~2 (1+r 1 -r 1 k) + 4r~i2 (1+r') + a2~ ( 1+r') ] _J_ 1
w = L2 [ ~1 ~2 <3-~1-~2) - 3~2 k3J X
••••• (2.9)
Mode C2 (Fig. 2.4b)
2(my + m;) L (1-k) (1-k) 2 2 U_ X + 2m ~1 L + 2m L (1-k) = 2 ~1Ly L L l X y X y
+ 2m 1
X
= m y
w u = 3 ~2 e
+ 2 :Y. 3
From U. l
6m w = _J_
12 X
2 L y L X
L L y
~1 L
= u e
+
X
y
X
L (my + m;) ~:Ly
L (1-k) 2 ! L L ( 1-k-~ ) + 2 :Y. L ( k-~1)
X + 2 X y 2 2 y 2
L (1-k) 2 X
2
[a2(1+r 1 )(1-k)
2~
2 + 4r~
1~
2(1+~ 1+r 1 -k) + a 2 (1+r•)~
1]
~1 ~2 [3(1-k) + (1-k)2
(3k-~ 1) - ~2 ]
X
•••••••• (2.10)
Mode c3 (Fig. 2.4c)
L (1-k) (1-k) X
[ m ~ 1 L m L ( 1-k) m I L ]
+ 2 ~ L y + X y + X y 2 x ~2 1x ~2 1x
u e
+ m' L
y X + L (1-k)
y
my [ ll'(1+r 1 )(1-k) 2
= 2~1 ~2
w = 2 3 ~1 Ly
w + 2 3
= wL2
( 1-k) X
L (1-k) X
2
+
( 1-k)
2~2
From U. = U l e
21
2r (1+~1-k+r') 0'(2~2 + r I)
] Q'~ .
+ ( 1 - k) 2
L (1-k) L/ k-~ 1 ) (1-k) W X + 2 22 2e 2
w = ~ [0' 2 (1+r 1 )(1-k) 3 + 4r(1+~ 1-k+r•)~ 1 (1-k) + 2a 2 (2~ 2+r•)~ 1~2 ]
1! ~1 (1-k)2
[<1-k) (3k-~ 1 ) + 2~ 2 (3-2~ 2 )]
••••• (2.11)
Opening at a Long Side
The three yield-line patterns considered for a slab with an
opening at the centre of a long side are shown in Fig. 2.5. Only
two unknown dimensions are required to define the positions of the
yield lines fully in each case. The ultimate load equations derived
for these yield-line patterns using the virtual work Eq. (2.1) are as
follows:
Mode D1 (Fig. 2.5a)
U. = (m + m•\ 1x l \ Y Y)rr:- +
1 y +
(m m') + X + X
m1 L (1-k) X y
(m + + y
L m•\ X y )rr:-
1 y

Lx(1-k)
klx
~(1 kll .. kly .. I -~(1-~I (a) Mode D1
i Ly
1
I L y(1-k)I kl I Ly(1-k)1 J-= 2 • • y '" • 2 ----.j
Cc) Mode D3
f L (1-k)
:Lt~• ~~ """"yyyyyy;j~ \jyyyyy\¥"'"
kly ~1-~1 (b) Mode D2
ry --- Free (unsupported) edge.
xnnn l="ixed edge.
Lx ~sagging moment yield line.
---Hogging I ,..__m
} X my
---m I X
I m' y
FIG. 2.5 YIELD-LINE PATTERNS FOR OPENING AT A LONG SIDE
1\.1 I\)
From
w =
u. J.
6m
2a( 1+r')
~1
= u t e
+ r(r'-r'k + 1)
a~2
23
r(1+r')
+ a( 1-~2
) J
__z [2a2 (1+r 1 ) ~ 2 (1-~2 ) + r(r'-r 1 k+1)~ 1(1-~ 2 ) + r(1+r•)~ 1~2]
~1 (1-~2) [<3-2~1) ~2 - 3k3J L2 X
•••••• (2.12)
Mode D2 (Fig. 2.5b)
L (1-k) (1 - k) [II ~2 L m L (1-k) u. 2 (mx + m~)
Y.. Y,_ X Y. X =
2 ~2 LX 2~1 + 2 ~ L + ~1 Ly
+ J. 1 y
m' L ] l. X
~1 L y
2m ~1 L m' L + X
(1-k! X I
L + L (1-k) X X
2 2a(1+~2+r 1 -k) r(2~ 1 + r')] m [r(1+r')(1-k) + :c
Y 2~1 ~2 a + ~1 a (1-k)
U = [2 !3
~2
(1-k) ~2
Lx + 2 ! L (k-~) ~ (1-k)J< 1-k) e 2 X 2 2 2~ 1
+ 2 ! ~1 Ly L ( 1-k) + ! L (1-2~1) L ( 1-k) 3 X 2 y X
wL2 ( 1-k) [ (3-2~1>] X ( 1-k) ( 3k-~2 ) + 2~1 = 12 a ~1
24
From U. = U , i e
w = 6m _.z L2
X
[r(1+r 1 )(1-k) 3 + Lia- 2(1+~2+r 1 -k)~2(1-k) + 2r(2~ 1+r•)~ 1~2]
~2(1-k)2 [<1-k) (3k-~2 ) + 2~ 1(3-2~ 1)]
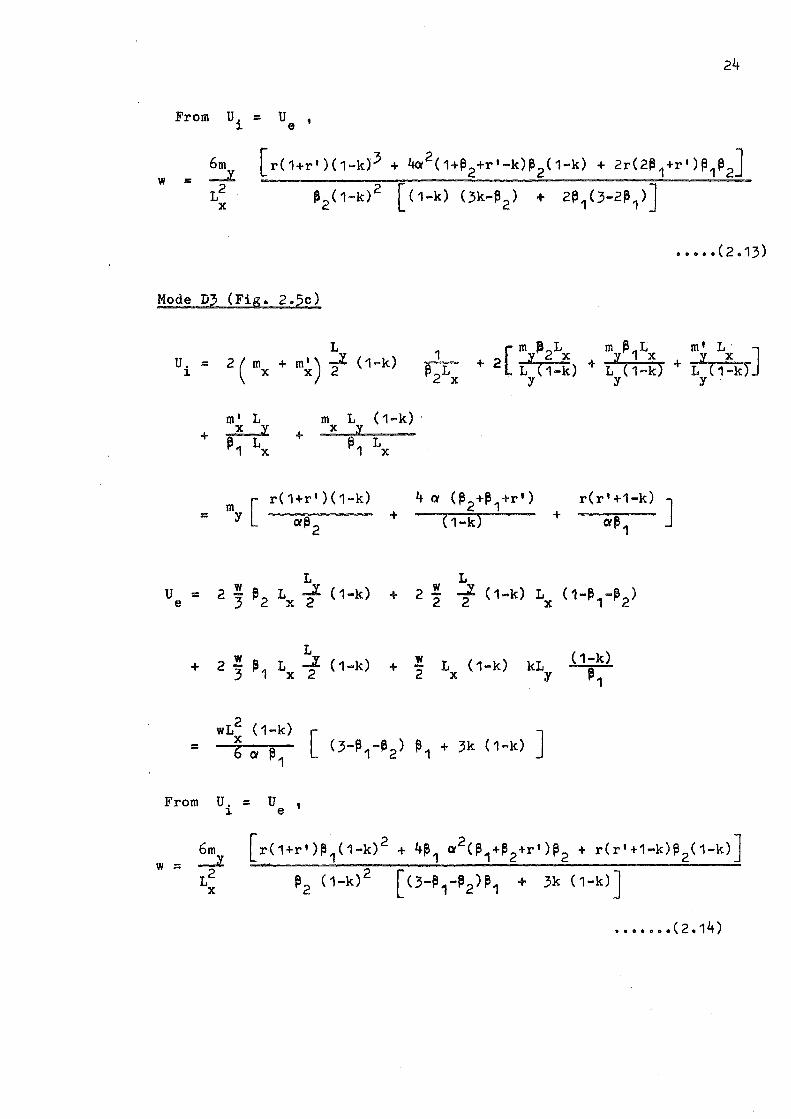
• •••• (2.13)
Mode D3 (Fig. 2.5c)
L u. = 2(m +m')-I l. X X 2
m' L m X y +
X +
~1 1x
( 1-k)
L ( 1-k) · 'l
~1 1x
4 a ( ~ 2 +~ 1 +r, )
+ ( 1-k)
+ .?! L (1-k) 2 X
kL y
+ r(r'+1-k)]
a~1
(1-k)
~1
From U. = U , i e
w ::: [r{1+r 1 )~
1(1-k) 2 + 4~
1 a 2 (~ 1+~ 2+r 1 )~ 2 + r(r'+1•k)~ 2(1-k)]
~2 (1-k)2 [<3-~ 1-~2 )~1 + 3k (1-k)]
••••••• (2.14)
25
2.4 MINIMIZATION OF ULTIMATE LOAD
The ultimate load equations (2.2) to (2.14) contain the unknown
terms ~1 9 J2 and ,3
which define the positions of the yield
lines. The values of ~1 , ~2 and ~3
which make the ultimate
load in each case a minimum are sought. The required values of
these unknown terms may be found by solving simultaneously the
equations ()W
0 ow = 0 and ~w = 0 for each expression w= ' 21~2 0~3 1
for w '
but the resulting simultaneous equations are non=linear
and the algebraic work involved is lengthy. Also, for some yield-
line patterns, for example modes A2 and C2, the minimum ultimate
load given by the equations may not occur when the magnitude of the
unknown dimension lies within the allowable range of variation.
Because of these difficulties a numerical procedure has been adopted. wL2
Computer programmes were written to calculate the values of 12: from y
Equs. (2.2) to (2.14) for various values of the dimensions ~1 , ~2
and~~ wL
within their allowable ranges thus allowing the minimum value
X of 12m for the yield-line patterns considered to be determined. In y
this analysis the values of ~1 , ~2 and ~3
were varied at
increments of either 0.01 or 0.02.
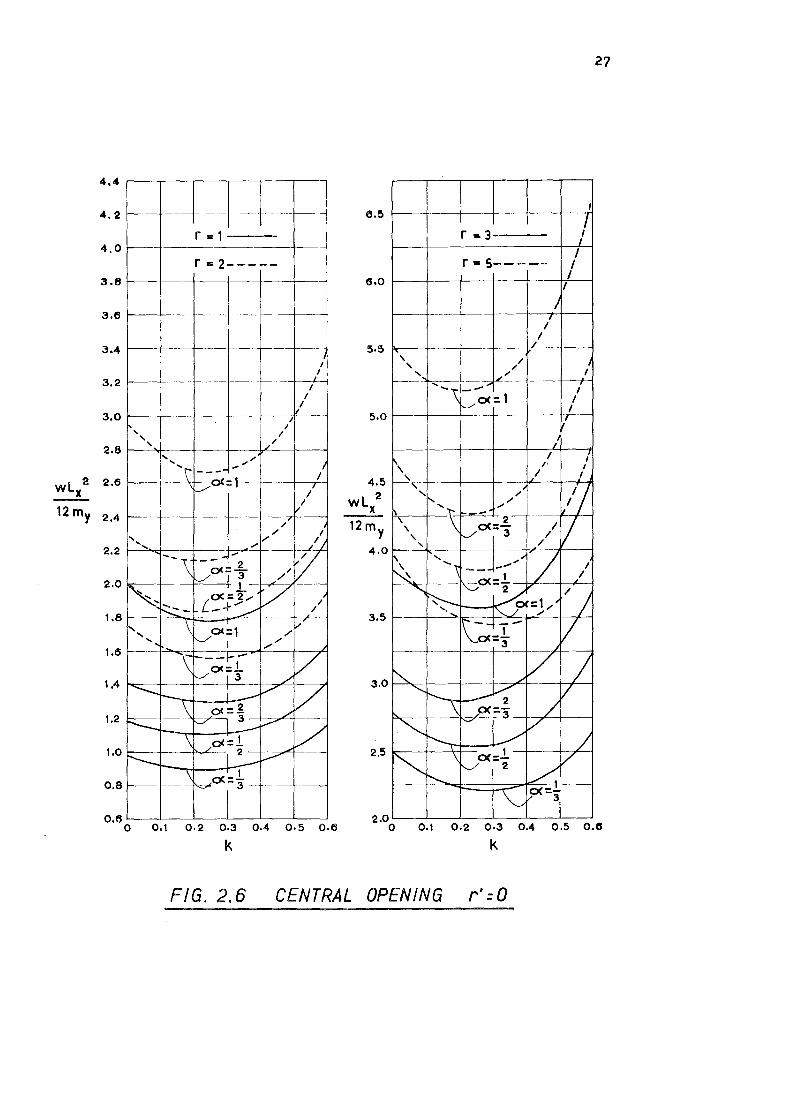
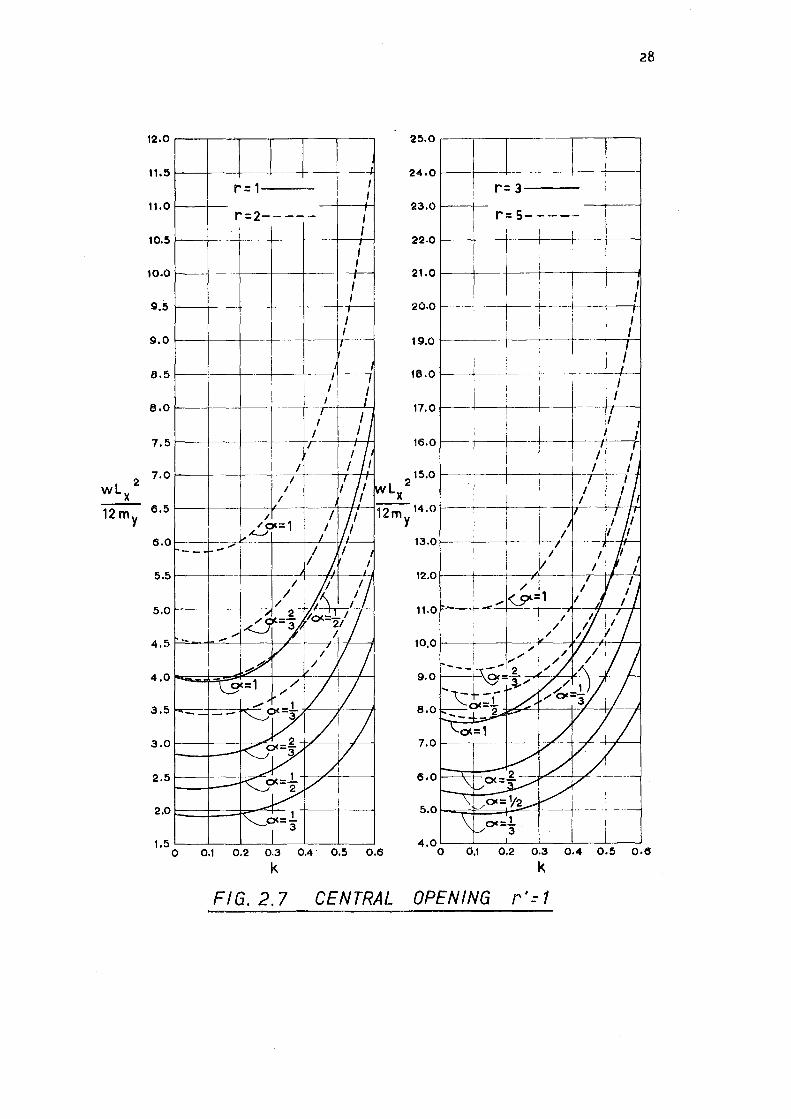
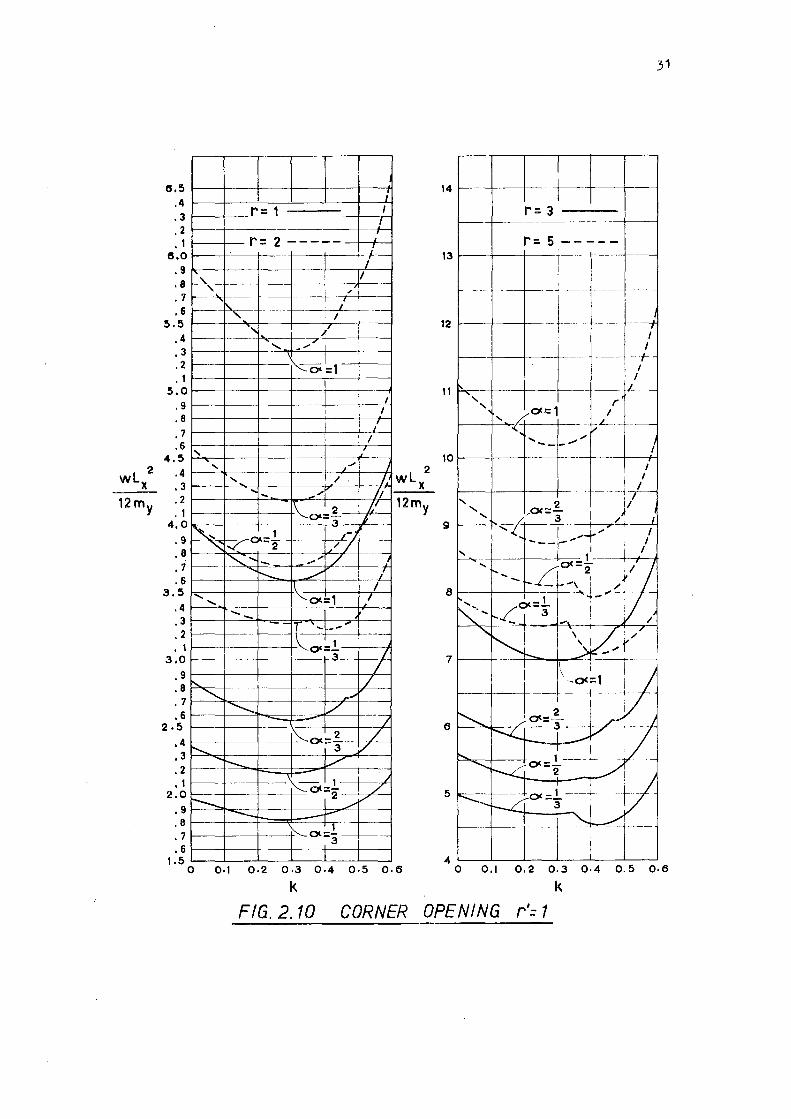
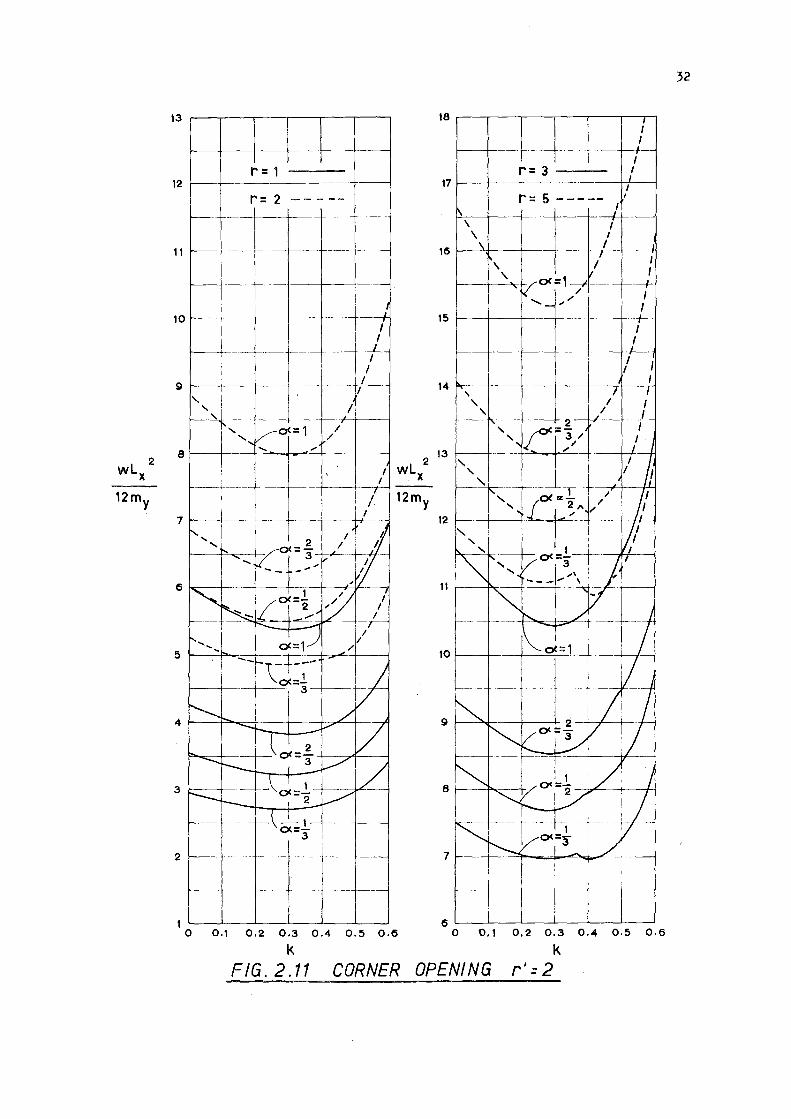
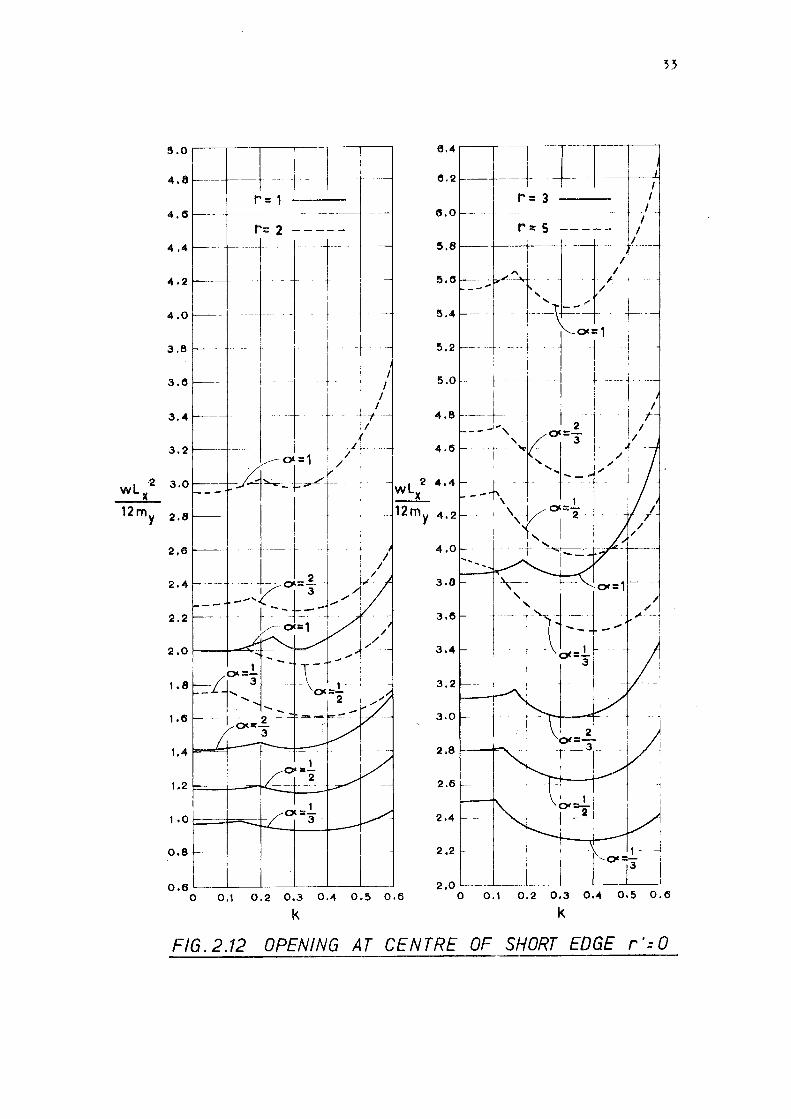
2.4 DESIGN CHARTS
Using the above method for determining the ultimate load, design
charts have been prepared for slabs for each of the four types of
opening considered. The charts are shown in Figs. 2.6 to 2.17 and
wL2 X k the ratio of opening size to slab for plot 12m versus
' span
y L m m' m' various ratios of a ....! X and r' X J. The = r = = - = • L t m m m y y X- y range of a values plotted varies between 1 and j" • The r values
plotted vary between 1 and 5 thus ensuring that the greater yield
26
moment is in the direction of the short span. This is in accordance
with the elastic theory distribution of bending moments. The
values of r' plotted are O (applying to the case of simply
supported edges) and 1 and 2 (~pplying to the case of fixed edges).
In order to ensure that the crack widths and deflections of the slab
at working load are not excessive it is important that the ratios of
the resisting moments at the various sections do not show large
differences from the elastic theory distribution of moments.
of
For
In the preparation of the design charts only the minimum values
wL2 X 12m from all the possible yield-line patterns have been plotted.
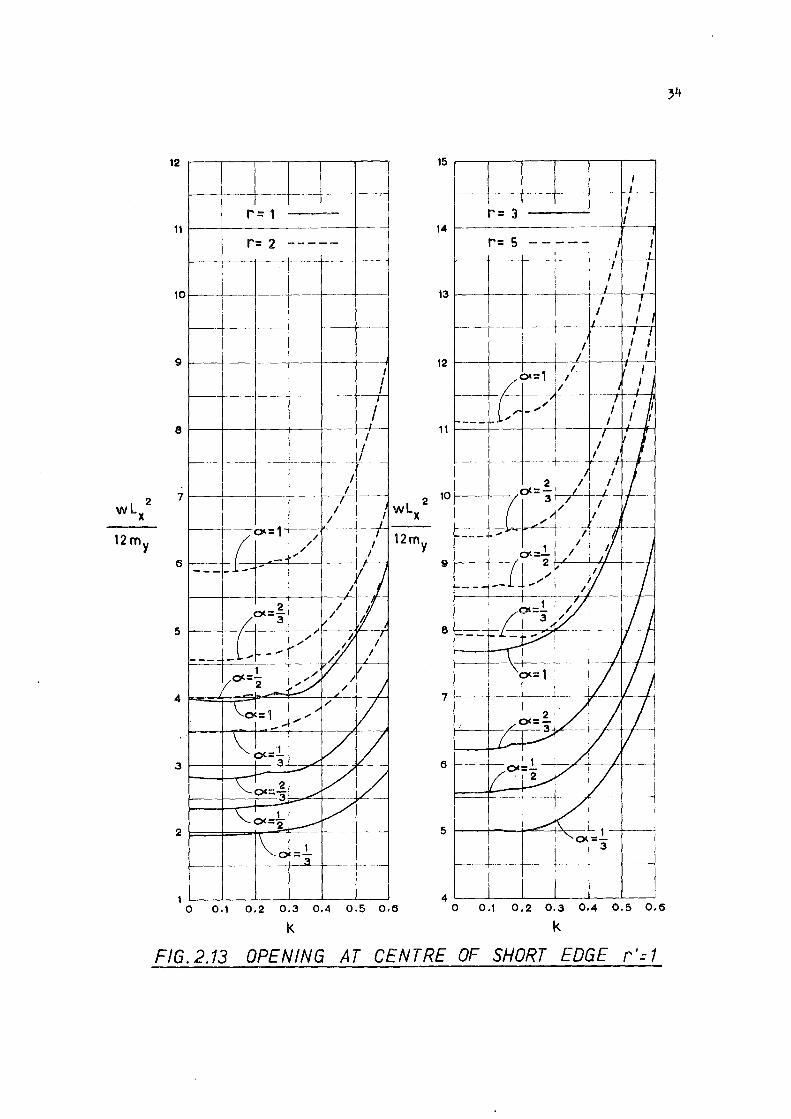
y example, in the case of a slab with the opening at a short side
(Fig. 2.4), for particular values of 2 r = 2.0, r' = 1.0, a= -3 w~
and k = 0.3, the minimum value of 12; gi¥en by Mode C1 (Eq.2.9) y
by Mode 02 (Eq. 2.10) is
4.743 (~ 1 = 0.18 , ~2 = 0.30), and by Mode 03 (Eq. 2.11) is 5.376
Hence Mode C2 is the governing yield-line wL2
pattern and the value of 12: = 4.743 has been plotted in the design y
chart shown in Fig. 2.13. Thus the design charts can be used
directly without knowing the governing modes. The discontinuities
in the slope which occur at various points in the curves of the
charts arise when the governing yield-line pattern changes from one
mode to another. Some of the curves show· a distinct cusp where
the governing pattern changes.
2.6 ACCURACY OF DERIVED CHARTS
The magnitude of the ultimate load calculated by the virtual work
method is relatively insensitive to small changes of the yield line
positions from the correct yield-line pattern. The equations derived
for slabs with a central opening contain one unkhown dimension which
27
4,4
4,2 ·--t------ --- . - ---•-I--- 6.5
r = 1 r ... 3 4,0 I
r "'2----- r•s----- I 3.8 6,0 I
I
3,6 --
I I
3.4
3,2
3.0
I
,1 /1
I I
1/ I
5,5
' /
' /
' /
... , -- I o<= 1 I
5,0 I
2,8
wL 2 2.6 X
12 my 2.4
2.2
2,0
1.8
1.6
1.4
1.2
1,0
', I
' /
' ,//
' ' ,,, --, -- -- __,.
.,. I
__.,..OC:1 I I
I 1/ ,
/ I
I / I
' ,/ , / / ', ,,,.
-, --\ - .... ,V -~- 2
~ j3 /
~ I
1/ {_o<. :2,,,,. I
K,-- --f ..... __,,.,. I /
, ..... \_/0<:1 1,/
/ ..... ,/
~-- 1-. I .,., -\ 1----f-- v o<-1 i
f--/ 13 /
--- -l.,....--"' V -\ 0( :::1. /
i'-- I---/ 3 l./"' - V \ .,0( :l I'---._ -- 2 - L--" 1--
I \ /'
I 4,5 '
wl 2 ' X --
12 my \ 2 \ 0(:3
' 4,0 '
3,5
2.5
0,8 \ O(r½ -
0,6 0 0,1 0,2 0.3 0,4 0,5 o.es 2.0'----'----'-----'----'---'---'
0 0,1 0.2 0-3 0.4 0.5 0.6
k k
FIG. 2.6 CENTRAL OPENING r' =0
12,0
11,5
11,0
10,5
10,0
9.5
9,0
8,5
8,0
7.5
2 1.0
wlx
12my 6,5
6,0
5,5
5.0
4.5
4.0
3,5
3.0
. 2,5
2,0
1.5
' r=1 l I
I I
r=2-----I
I ' I
I
I I
I
I I ·---,---
t I I
I/ ·---~
j I
! -,~------, / / --,--
I I I I )
I ,, l i
i I I I I
I Ii I I I I I I I
/ I I' I 1 oc=1 I I .,(_J
I k. 1- ___ -.,, I I
I j
I /, V I I
I
I /4' /I I // I /
! / 6(-_g_ 1o<.!.!. I I - ,i -<._J - y -21
- I
V , VI I i~ .#
I
v1 I - oc=l /
~ /
.,,,. _1 --- --~~ y -K,_P,' ~~o<=2 V\
i
oc=.!. I 3
25,0
24,0
23,0
22,0
21,0
20,0
19,0
18,0
17.0
16,0
w 15,0
L 2 X
1 2m 14,0 y
13,0
11,0
28
r= 3
r= s- - ---
i I I +------
I I I
··- .L-
I I I
/ ,.., <_91,=l
4.0'---L.._-'------"'------"'---'--------' 0 0,1 0,2 0,3 0.4 · 0.5 0.6 o 0.1 0.2 o.3 0.4 o.5 o.e
k k
FIG. 2. 7 CENTRAL OPENING r' = 1

' \ .
29
25 2,
I 24 28 I
I r = 1 r=3 I
23 -----·---~ ·- 27 --· ------· -- ·-·- ----r=2----- r=S-----
I 22 26
I I I I
21 25 I I
20 24 I I I I
19 23 I I
18 22 I I I I
17 21 I I I I
115 20 I
I I 15 19
I
2 I 2 I
wlx 1-4 wlx 18 ---6<=1~ -I
12my I 12my )
13 -7·- 17 /•
I I I
12 16 I
I 11 --· - 15
I 10 c:,, 14
9 --12
11
6
9
4
3 7
2 6 0 0,1 0,2 0.3 0,4 0.5 0.6 0 0.1 0,2 0.3 0.4 0,5 0.6
k k
FIG. 2.8 CENTRAL OPENING r'=2

3,0 I I I
2,9
2,8
'. r= 1 i
\ r=2----- I \ I
' I \ I
' ,--" ' I
2.7
2,6
... .... _ ... ,/ \_~=1
I 2,5
2.4 I
2.3 t-._
' 2.2
2,1
' Of- 2 , ..... y -3 ' ,,,"', I '~ I
~ - ' / ...... 2.0
1,9
1,8
1.7
1.6
I
I~ J,-oc:..!.. I ..... 2
·"" ........ < '~ - _.._., .. ........... ,/ ,
-\_o<=l ,.,_ _ ....
..... .... .... \-- --- -, 1 \ oc.=- --3 \
\
1,5 ,,--.... __ ...
' 1,4
1,3
~ :'.....
o<=_g_ V 3 -.........._ ~
1,2
1,1
1.0
I'--....... 0(- 1 r-....._ / -2 I
I ,,
~ -~ v
- 1 1-----lfoc1=3 0.9 '
I ;--....._ L---I
8,2 ~~-~~,.-------,-~!---, r•3---
6.0l-------.ji---1-------------1
r= s-----5,81--~f---l-----jl---t---t--------l
' ' s .4 .__ __ ,,,._,___ __ /:or= 1 ~,./ I
... ' 5.21---1----~'l.---l----!r---+------ri, '- '- _,/ ', I .._ _,, \ I
' ,/ 5.0 l---1----1----1------l----'II.-L---J
4,81---+---+---l---+--+--------I
4.2 't-- ... 2 I oc:.!. \
-, '
w L X 4,. 0 - - ./ j 3 -~---~, --+----1-------1
12 t-... - - I - - -. \ my 3.8 ' 1 ', ' .7-"i--.. I ', I / 1, \ .... _,,
0,8 0 0.1 0,2 0,3 0,4 0.5 0,6 0.1 0.2 0,3 0,4 0.5 0,6
k k
FIG. 2.9 CORNER OPENING r' = 0
30
wLX 2
12my
(5,5
.4
.3
. 2
. 1 e.o
. 9 ,8 • 7 ,6
5,5 ,4
. 3
. 2
.1 5,0
.9 • 8
• 7 . 6
4.5 .4 . 3 . 2 . 1
4,0
.9 • 8
• 7 .6
3,5
. 4
.3 • 2 . 1
3,0
,9 .8 • 7 .6
2-5
• 4 • 3 • 2 . 1
2.0
• 9 • 8 • 7 • 6
1 ,5
I
r= 1 I I
I
r= 2 ----- : /
"' I I I
'· ,, ·'---I I
" I ·-· ---
"· I ·-..... / 1-------· _.,..
_,,,.,,,. I '- I QC =1
I I I
,' I
' I --' '
_.,. J 2 ,_ / I wLX ... _,,,.r I; ...
\ 12 l' 12my oc=- J
¾ 3
o,.-1 ,-, ----::z- -2 /-/ , ... / / - - .,,.
.... ......__ ,/ / I
' ~~=1 I .... - .... - -- f'--~--o<::.!. I 3
I r-... I ....___.., --......... I/
I
L'--.~::2 / t--..... I 3 V
.... r--... I_,.,,,, \_I, : ·,
,"--, 0( =2 -Y--r-- I ,,,.
---- -i--1
-oc.=3
0 0,1 0,2 0,3 0,4 0,5 0,6
k
r=J ---1----1--------~------ - ---+---<
r=S-----13 1---1-----1----+;--r
-~ ---+- ---12 1-------1--.__ --l--- -+-- ·-
11 1.:..---+---+----I--
...... _______ ,,,,
r I
L-..
I I
I I
101---...---+---+---+---!--,H
7 ~---J...- ·-+=-j,_\ ........,,C 1 ·~1-· -\ I
I---+---+ --~ ~o< _;_1 __ J 2 i
0':3 --
4 ,..___.,___..__ _ _.__ _ __,__ _ _._ _ _, 0 0.1 0.2 0,3 0,4 0.5 0,6
k
FIG. 2.10 CORNER OPENING r'= 1
wLX 2
12my
13 18 I I
I r = 1 r= 3 I
12 17 ---------
r= 2 -- - -- r= s ------ ------ -
\ I \ ' 11 1<5 \ I
\ I I
\ C)(' =1
I
---+ ,,· / I ......
-'j I
10 - - - - -- - ----- 15 I I
--· --i/ I I I
g ·---y 14 I
I I
' I \ \
>1~t/ I '4---- /, \ I
' o<= 1 I I
' / I 8 ..... 13
2 ' I wLX ' I '\
12my ' 1-- ~:- + I I
.... j 2 ... /
7 l- -- 12 ., /
, I '
(5 11
-- .. -- - - 1 ·- -c:x=3
2 7~-+--.....:::::~--J..-~...6-~
1 '----'----'-----'---.J..._---L..._._J 6 L---L---'----'---__...__.J..._ _ _,
0 0.1 0.2 0,3 0.4 0.5 0,6 0 0.1
k FIG. 2.11 CORNER OPENING
0,2 0.3 0,4 o.s 0,6
k r' =2
32
wl~ ·2
12my
s.o
4,8 -
4,6
4,4
4,2
4.0
3,8
3.6
3.4
3.2
3,0
2.8
2,6
2,4
2.2
2.0 I
1 .8
1,6
1.4
1.2
1,0
I"= 2
1 0<=-
2
r
01=..!_ 3-
6.0
S.B
- ---S,4
~.2 --
5,0 -- -+- --
··· ~J, 4,6 ~ -----+•-
!
L 2 4,4
~ --+ ' _ 12my 4 , 2
4,0
3,8
3,6
3,4
3,2
' 3,0 r- -
2,6
2.4 -·
t -2
C)(:-
~-=--j 3 -- / ,,,
1 / Ql.:-2 - .
! I I
I I
1/ ,/ .i~
/.
1
j o.e 2,2
0.6L-----''-----'----'--.....L..-~---' 2.0
I 1 -
I ,o,i3 ____ [ ___
0 0,1 0.2 0.3 0,4 0.5 0,6 0 0,1 0,2 0.3 0,4 o.~ 0.6
k k
FIG. 2.12 OPENING AT CENTRE OF SHORT EDGE r '= 0
(
12
-----~ ,____ ·- --,-
r= 1 11
r= 2 -----i·-- --
\
10
--1--------------- - --- I---------
g I I
---- --~ --+ I I
e ' I
I - -· -~ .. - ~·- -- L._
I 7
6
5
4
3
2
I -------,-I I
I I
{_~=1 I -+ / I / I .,,
--- - ) / 2 ,// ____ ,_a~: ,/I ,,,
V / I,,,, I LL_ ·-,____ --
1/c,c.:.!. ,,, I
1/ I , 2 - ~I J --· \J:1
/ I/ ,,, I - ,.
,,,,,,
\1 1 V V oc.=- .,, ; 3
V I I 2 ~ oc=3 /
O<=t L--' V - -----
\oc=.!.. ,--- I 3 - -- --·-
1 0 0,1 0,2 0.3 0,4 0.5 0,6
k
15 ,---,-----,,-------.-----r---r---,
- _____ j __ r= 3
14 ~-----
r= s - - - - --:_ I /
13 1-------+-----+ t_J,,' I /
I I I
12 ~-.+-------1--------l--'--4----+I----~ 1 ' /
{
Ot= :/
- ,,,,,,
--- -- +-
---t--- l 4 ,____,_______,c___._ _ __,__~ _ __,
0 0.1 0,2 0,3 0,4 0.5 0.6
k
FIG.2.13 OPENING AT CENTRE OF SHORT EDGE r'=1
23 T
I,
22 I r=1
21
r= 2 -----20
19
18 ---~
17
16
15
14 I
I , 2 13 wlx
I 2 I wlx
I 12my 12 I 12my
' I '
11
10
g
8
7
6
5
4
3
I I ! I I I I I I
I I /
' / I I 11.;oc.=1
/ I I / ,/ ,,
~
, I -,__ - --r I I ,j,
I / II I
12 / I V/ / // o=- ,,, v~_ ~ ,3_ ...
~ --1 ,,, V7 / o<_ 1 I ~ -2~ .... /
'.____1/ ,,, V ~-=~--r;< .... _1 / / 2- o<--
lr= iJ -~vv / -'---1 --
oc =~ --;-------_ i--- /
L---"" ' 'oc=..!..-I 3
2 I I 0 0.1 0.2 0.3 0,4 0.5 0,6
k
35
28 -----------~
27 I-----+--+--+--+--+--
r = 3 I I
26 1-----+---------+-----+l,
r= s I I
25 1-----+--+---+---+---+--<,r--1
I I
24 1--------l--+--+--+----l-~' I
! 23 1--------l--+---+--+--++------I I I
22 1-----+---+---+---+---.!----.--l/ I I
I I
21 1------+--+--+--+-----'1<------+---.;1----a
I ,' I I
201------+--+--+--+--+--+----+1- 1
I I I • I I
19 1------+-1 ---+----+---4-1--------l.'-'---'-'-'lj -, I I / I I I
18 l-----+---'---+-+1 ---'---+--.'--1
+c"-I --J1'-+-11
c::x:1 I/ / / .'/ t / I I 'I 17 :-:-1.t - ,,, / / / '/'
I I I I I I
16 l-----+--+--+--/c-'-+-/-c---1+/-+---------l
2 / / / 15 -;:O<:- I I
~l\--~3
,,,/ ,/',,// I 14 I
13 i..-l--1.=½_ L.,-----bf1-/1 / J' 1 1 _)'' ! I/
ex=- " i
12 e--J-;-· (...- I/ I I 11 ~\oc=1 vj/
! 2 / :
101r=~l-/ /v I 9 ~- 1 -+---1.£-----~+--------+---i
a<.=2-----:::l.,/[ /v
a ~--4--rr -7ik-':\._ 1"'=½ ~ 7 L---'--------'----'--------'--------'-------'
0 0.1 0.3 0-4 0.5 0,6
k
FIG. 2.14 OPENING AT CENTRE OF SHORT EDGE r'=2

4,8
4,6
4,4
4,2
4,0
3,8
3,6
3,4
3,2
3,0
wlx 2 2.8
12my 2,6
2,4
2,2
2,0
1.8
1.6
1.4
1.2
1,0
0,8
0 .cs
1 I r = 1 -
r= 2 -----'--~ ----1-
I
i I
••r-----------~ -~~
--
I I
--voc=1 I
I I
I I I/
. -""') , /
----- , ____ ~"" + --
I
I o=¾ t, '--7 -~)r----1---i
I ' ', /
, .,...
' _,,. ~ \ ... _,
\I \...----;cc=..!.. <><=1 . -LJ' ' ., ----c- \ ' ,/ ..._ _i-
1 I \
cx=i \, [7 ------... ,,.,,,,,, - ,,
i ~~=1
I
- ~
"I"'--.. I _v '~ \~<=½ ~
o.:.!... 3
r=3 ---5.8 1----1-----1--1\
/ \ r=S -----
I 0( =1 / 5,4 1------a'-----'----a~-1----1---~,'--l
\ I 5,2 f---f---f--~J--Jl---~~l--..'-1----1
\ \ ,,/,
5,01-----4----l------l- -------''l--c:__!------1
4.8
4.4
wl 2 4,o X
12my 3,8
3,2
2.15
2 • 4 ,_________,__
I 2,2 ·- -+----
' ! 2.0 -- ----- -·+-~
I
1. 8 .____,.___,.___,.___,___,._____, 0 0,1 0,2 0,3 0,4 0,5 0,(5 0 0.1 0,2 0,3 0,4 0,5 0.6
k k
FIG.2.15 OPENING AT CENTRE OF LONG EDGE r'=O
r= 1
r= 2 10f----l-----lf-------!-----+--+--j
I I
f--~1-----1~---+-·--~-----·~·-l-l
I 7 1--------,1--------4-- --+---4---...,_1 '--I
r= 3
r= s
I I
I I
37
13 t-----11-------1---+---+--+-I-I
I I
I I
12 ~-1----+---+----+---+-+-----l
0'=1 I\ I
11 1--""-.L--.----+-."-/-+-\-1,.---+---L/--+-----l
\ / -- --1.-------"----- - ----~- -
10 1---1---
5
4 L--'--------''--------'----'----L---.J 0 0,1 0,2 0,3 0,4 0,5 0,6
k
FIG. 2.16 OPENING AT CENTRE OF LONG EDGE r'= 1


39
defines the pattern fully. Those for slabs with an opening at the
short or long side contain two unknown dimensions and those for slabs
with a corner opening contain three unknown dimensions. When
determining the ultimate loads the unknown ~ values were varied
at increments of 0.01 for patterns with a single unknown and at
0.02 for patterns with two or more unknowns. To illustrate the
magnitude of error involved in determining the minimum ultimate load
from these increments, the effect of small variations in the unknown
dimensions on the minimum ultimate load is shown for two cases in
Tables2.1 and 2.2. The variations in the ultimate load in the
tables near the minimum ultimate load are small and it is evident
that the chosen increments result in negligible error. For example,
in Table 2.2 the minimum ultimate load calculated using an increment
of 0.02 is only approximately 0.2 percent different from the minimum
using an increment of 0.01.
2.7 EFFECT OF OPENINGS ON ULTIMATE LOAD
Openings in two-way slabs tend to attract the yield lines to them
since they represent regions of zero flexural strength in the slab.
On the other hand the slab is not required to carry load over the
area of the opening and hence the total load to be carried is smaller
than for a slab without openings. Hence the ultimate load per
unit area of a slab with an opening may be either smaller or greater
than that of a slab without an opening. The effect of opening size
on the ultimate load per unit area is illustrated in Figs. 2.6 to
2.17. The reduction in load carrying capacity per unit area is
greatest for slabs with simply supported edges bec~use for this case
openings cause a greater reduction in the total lengths of yield
lines than in fixed-edge slabs.
For slabs with central openings the largest reduction in the
ultimate load per unit area is about 13 percent occurring when

40
TABLE 2.1
2 wL;f12my from Equation (2.13) when r = 1.0, r 1 = 1.0 ,
a= 0.5 and k = 0.5.
~1 ~2 w~12m . y
0.30 o.45 2.5349
0.30 o.46 2.5342
0.30 o.47 2.5339
0.31 o.45 2.5342
0.31 o.46 2.5334•
0.31 o.47 2.5332**
0.32 o.45 2.5353
0.32 o.46 2.5345
0.32 o.47 2.5343
* Result plotted
** Minimum for 0.01 increment
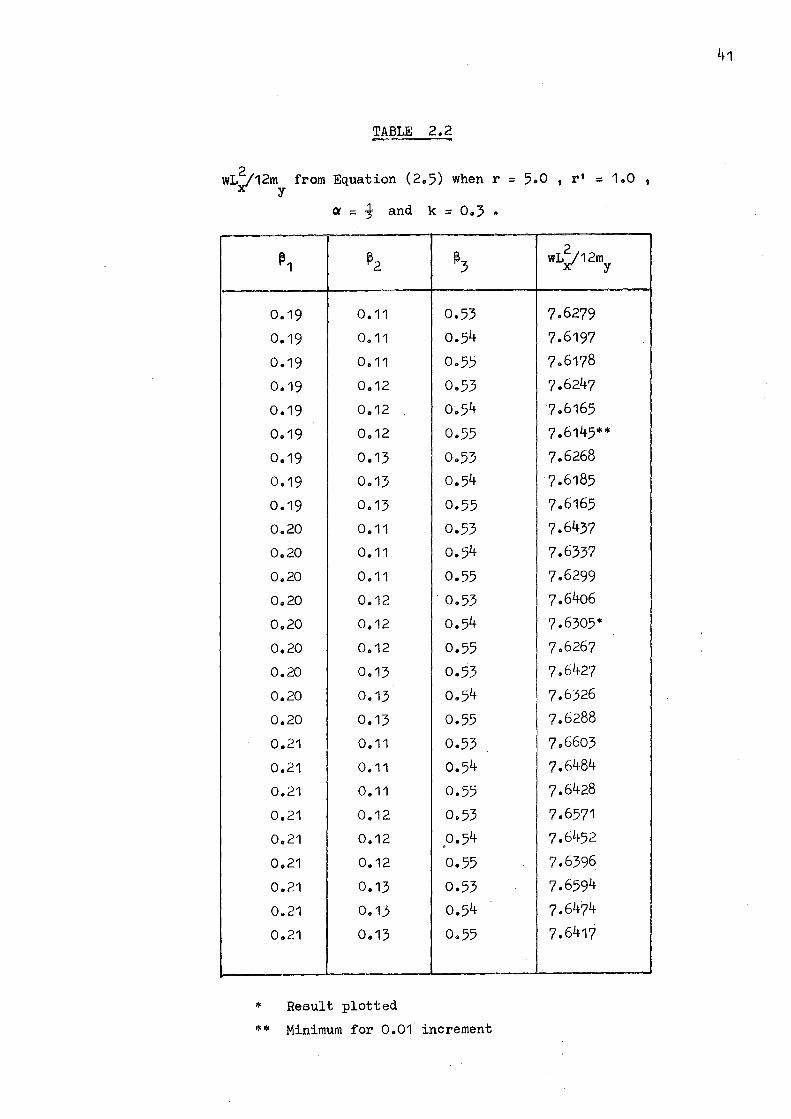
TABLE 2.2
wL;J12m from Equation (2.5) when r = 5.0, r' = 1.0 9 y
a= i and k = 0.3.
~1 ~2 ~3 2
wL;J12my
0.19 0.11 0.53 7.6279
0.19 0.11 Oe54 7.6197
0.19 0.11 0.55 7.6178
0.19 0.12 0.53 7.6247
0.19 0.12 0~54 7.6165
0.19 0.12 0.55 7.6145**
0.19 0.13 0.53 7.6268
0.19 0.13 0.54 7.6185
0.19 0.13 0.55 7.6165
0.20 0.11 0.53 7.6437
0.20 0.11 0.54 7.6337
0.20 0.11 0.55 7.6299
0.20 0.12 . 0.53 7.6406
0.20 0.12 0.54 7.6305•
0.20 0.12 0.55 7.6267
0.20 0.13 0.53 7.6427
0.20 0.13 0.54 7.6326
0.20 0.13 0.55 7.6288
0.21 0.11 0.53 7.6603
0.21 0.11 0.54 7.6484
0.21 0.11 0.55 7.6428
0.21 0.12 0.53 7.6571
0.21 0.12 0.54 7.6452 *
0.21 0.12 0.55 7,6396
0.21 0.13 0.53 7.6594
0.21 0.13 0.54 7.6474
0.21 0.13 0.55 7.6417
-
* Result plotted
•• Minimum for 0.01 increment
41

k = 0.2 to 0.3 for simply supported edges; when k > o.4 to o.6
the ultimate load per unit area becomes greater than that for the
case without an opening. For fixed-edge slabs with a central
opening when r' = 1 or 2 , the reduction in ultimate load is much
smaller. At large k values the ultimate load of the slab
increases very significantly.
Corner openings in simply supported slabs cause a reduction in
the ultimate load per unit area of up to 21 percent when k = 0.3 to
0.5. A reduction in the ultimate load of up to 10 percent occurs
even when r' = 2. Slabs with corner openings do not show such
42
a significant increase in load carrying capacity as the opening size
increases.
Openings placed at the short side of a simply supported slab
cause a maximum reduction in the ultimate load per unit area of
about 11 percent when k = 0.3 to o.4. Fixed-edge slabs do not
show any reduction in strength and the ultimate load increases
significantly with large k values.
, When the opening is at the long side of a simply supported slab
the maximum 'reduction in ultimate load per unit area is about 22 per
cent when k = 0.5. The reduction in strength becomes less
significant when the edges of the slab are fixed.
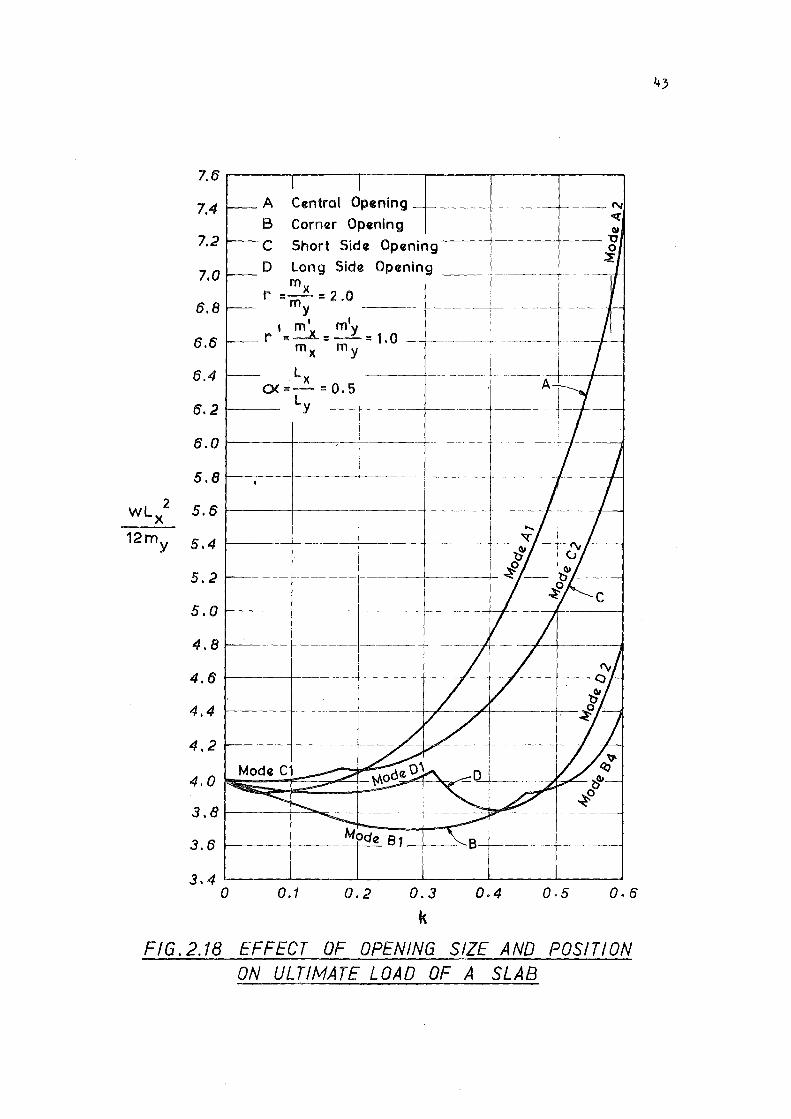
Fig. 2.18 shows the effect of opening size on the ultimate load
of a slab for each of the four types of openings for particular
values of r = 2, r' = 1 and a= 0.5. In this case the only
significant reduction in ultimate load occurs in the case of a
corner opening.
Although only rectangular openings have been considered here
it is evident that the design charts will also give a very good
indication of the effect of openings of other shapes.
7.6
7,4
7.2
7.0
6,8
6.6
6.4
6,2
6.0
5.8
WL 2
X 5.6
12my 5,4
5.2
5.0
4.8
4.6
4,4
4.2
4.0
3.8
3.6
3,4
A Central Opening -+------+- _____ _
B Corner Opening
C Short Side Opening
D Long Sid<Z Opczning ----t--1 -~ mx
r =- = 2.0 m Y -----+-----------\---- - ---
, m' m1 ! -- r ::.:.:..:.ll::_Y = 1,0 -
mx my -------.-- ----------- ·--·-----I>----<
I
L X ----+--~- ----- L ----- -}-----1--1 ,____0<_=-Ly- = 0.5 __ ·--~-A 1---------f
-----+-·-----
0 0.1 0.2 0.3
k 0.4 0,5 0,6
F!G.2.18 EFFECT OF OPENING SIZE AND POSITION ON ULTIMATE LOAD OF A SLAB
44
2.8 CONCLUSIONS
Design charts may be drawn up for uniformly loaded two-way slabs
with openings in various positions. A reduction in the ultimate
load per unit area of up to 22 percent can occur in the case of
slabs with an opening either at a corner or at the centre of a long
side. The reduction in ultimate load is greater for simply
supported slabs than for fixed-edge slabs.
The openings tend to attract yield lines to them since they
represent regions of zero strength in the slab. To improve the
serviceability of the slab the total amount of reinforcement may be
distributed more densely near the opening than near the supports.
PART II:
SUMMARY
TRANSFER OF UNBALANCED MOMENT AND SHEAR FROM REINFORCED CONCRETE FLAT PLATES TO COLUMNS
A review of previous work on the transfer of unbalanced moment and
shear from reinforced concrete flat plates to columns indicates the need
for more test results and improved theory for designing slab-column
45
connections which transfer moment. Tests on half scale reinforced concrete
models simulating interior slab-column connections under monotonic and
cyclic loadings are described. The tests studied the effectiveness of
various shear reinforcement arrangements and their performance under
seismic conditions. Ultimate strength procedures are developed to
determine the shear and moment capacity of such connections with and
without shear reinforcement. Predicted strengths are shown to compare
favourably with test results and the use of closed stirrups proved to be
most effective in increasing the ductility of the connection.
3.1 INTRODUCTION
The slab-column connection is a critical part of a reinforced concrete
flat plate structure because the design is often governed by the shear
strength of the slab around the column. In many cases column capitals
and drop panels are necessary to increase the strength of the connections.
The critical nature of the shear in the slab around the column is further
aggravated when lateral forces due to wind 'or earthquake loadinga cause
substantial unbalanced moments to be transferred between the slab and the
column. In order to examine the manner by which this transfer of moment
can take place a portion of the slab surrounding an interior column as
shown in Fig. 3.1 may be considered. The forces and moments acting on
some critical section ABCD within the slab and contributing to the
transfer of the applied shear V and moment M between the slab and the
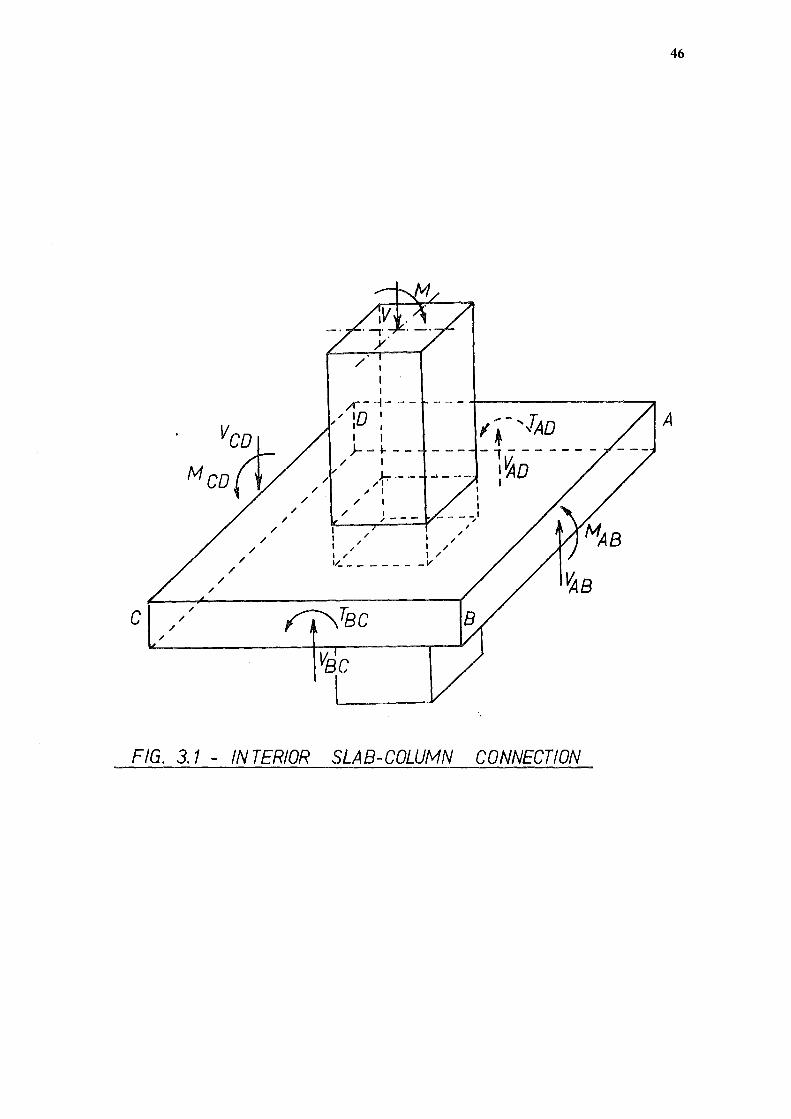
C /
/ /
/
/ /
/
/ /
/
/ /
/
/ /
/
/, I
I I
,A"'- -1- - -/ IQ I
/ I I
I I )--1---
/ I J..,.--
/ I ' / I
/ I I I I
/ J - - - - - - ,1 I " " I ✓ I ,1"
I ,1" I / I ,1 I / •✓------- _v
I •- 'lAo -,-------
1¼0 I
~B
FIG. 3.1 - INTERIOR SLAB-COLUMN CONNECTION
46
A
47
column are indicated in the figure.
Part of the unbalanced moment M is resisted by flexural moments MAB
and MCD acting on faces AB and CD of the critical section and part of
the moment is resisted by the torsional moments TBC and TAD acting on
faces BC and AD. The remainder of the moment is resisted by the
vertical shear forces acting on the faces. Thus moment is transferred
between the slab and the column by three actions, namely (i) flexure,
(ii) torsion and (iii) shear. It is also evident that the shear stresses
induced by the transfer of moment will make shear more critical for this
case than for gravity loads alone. One of the objectives of this study
is to develop an ultimate strength procedure for determining the unbalanced
moment capacity of the slab-column junction by considering the individual
contributions of flexure, torsion and shear in resisting the applied loads,
Since the shear strength of the slab around the column often indicates
the load carrying capacity of flat plate floors some form of shear
reinforcement could be used to increase the shear strength of the connection.~
At present no suitable design methods are available for proportioning shear
reinforcement for slab-column connections which are subjected to both shear
and unbalanced moment loadings. In slabs shear reinforcement may consist
of bars or structural shearheads. The effectiveness of bars, which may be
in the form of stirrups or inclined cranked bars, as shear reinforcement in
thin slabs is still a matter of concern for structural designers and needs
to be examined further. The role of shear reinforcement is to transfer
shear force across a diagonal tension crack and to fulfil this purpose
the shear reinforcement must be securely anchored at both ends. The
anchorage of stirrups or cranked bars can be developed by transferring the
force in the shear bar either to the concrete by bond and ·bearing or to
other reinforcement, such as by rigidly attaching stirrups to longitudinal
reinforcement, or by tightly wrapping stirrups around the longitudinal
reinforcement. In slabs, anchorage of shear reinforcement is a problem

48
which becomes more critical with the decrease in the slab thickness.
The effectiveness of various types of shear reinforcement can only be
determined from tests which will help to develop a guide to their design
provisions. To find methods of increasing the shear strength of slab-
column connections by using various reinforcement arrangements is another
objective of this investigation.
The most important benefit that could be derived from effectively
shear reinforced connections is the enhancement of ductility. In countries
which require design for earthquake loading ductility is an important
consideration. The present standards for seismic design assume that in
the case of a severe earthquake the structure has sufficient ductility
to absorb energy by post-elastic deformation without collapse. Very little
is known about the seismic resistance of flat plate-column connections and
this aspect requires particular attention.
During an earthquake the slab-column connections of a multistorey
flat plate structure will be subjected to repeated reversals of bending
moment. Such reversals may lead to a shear failure in the slab around
the column. Information is needed on the extent of the deformation which
may occur under earthquake conditions and on the deterioration of load
carrying capacity of slab-column connections due to bending moment reversals
so that the designer can take appropriate steps to ensure the integrity
of the structure.

REVIEW OF PREVIOUS WORK
SUMMARY
A review of previous investigations on transfer of shear and
moment from reinforced concrete flat plates to columns is presented.
Existing design methods and test results for slab-column connections
without shear reinforcement and limited work done on connections
with shear reinforcement are discussed.
INTRODUCTION
M t t 6 ,7, 8 ,9, 10 h b f t ' t· t t any es s ave een per ormed o inves iga e he
strength of symmetrically loaded flat plate-column connections
which transfer shear without moment from the slab to the column.
These tests have led to several semi-empirical design
6 7 8 9 10 11 procedures ' ' ' ' ' • For such a symmetrically loaded slab-
column junction the current design practice is to consider a
critical section at a distance d/2 from the face of the column
and to compute a nominal shear stress by assuming that the shear
force is uniformly distributed over a vertical area defined by the
periphery of the critical section and the effective depth of the
slab. This nominal shear stress is then limited to 4/f' psi for C
slabs without shear reinforcement 12t13 .
In contrast, for an eccentrically loaded flat plate-column
junction, which transfers both shear and moment, the amount of
investigation carried out is only limited and can be classified
into two main categories. The first category deals with slab-
column junctions without any shear reinforcement while the second
category deals with junctions containing some form of shear
reinforcement.
14115 as well as
For the first category some methods of analysis 8 , 12 ,
some test data 8116117 are available. For the

second category no method of design or analysis of strength is available
18 19 and only a few test results ' are available.
3.2.2 INVESTIGATIONS WITHOUT SHEAR REINFORCEMENT
50
As late as 1960 when Di Stasio and Van Buren14 first published a paper
for determining stresses at a flat plate floor-column junction transferring
moment and shear, structural designers had no access to any method of
analysis for designing slab to column junctions which transferred moment.
8 In 1961 Moe reported the first test results and proposed an ultimate
strength equation connecting the shear V and the moment M transferred
to the column. The ACI-ASCE Committee 32612 considered these two
investigations and in addition studied 15 more test results, of which 10
were taken from preliminary work by Hanson and Hanson16 and 5 from Frederick
and Pollauf. 1.s work reported by Kreps and Reese 17 • Committee 32612
recommended a design procedure in 1962. Another method appeared in
Commentary on Building Code Requirements for Reinforced Concrete
(ACI 318-63) 15 in 1965.
Afl the four methods referred to so far are somewhat related to
each other as will be shown later. Because of extremely complex stress
distribution on the critical section, these four methods assume a linear
distribution of shear stresses along the critical sections. The concept
of an equivalent polar moment of inertia of the critical peripheral
section is used in all the methods to determine the shear stresses
induced by the moment.
Apart from these four methods, one more new approach to design has
been reported recently by Hawkins and Corley20• A design recommendation
has been included in the new ACI Building Code (ACI 318~71) 13 for the
first time. A brief review of all these methods is given below.
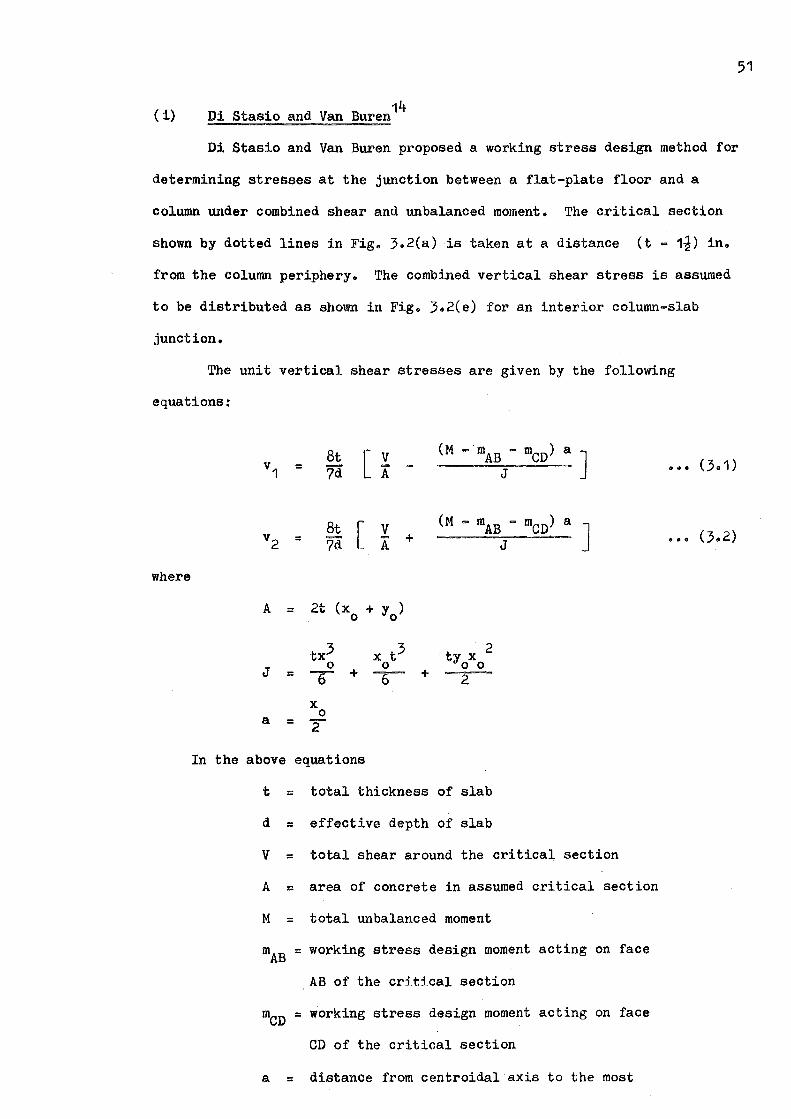
( i) 14 Di Stasio and Van Buren
51
Di Stasio and Van Buren proposed a working stress design method for
determining stresses at the junction between a flat-plate floor and a
column under combined shear and unbalanced moment. The critical section
shown by dotted lines in Fig. 3.2(a) is taken at a distance (t - 1i) in.
from the column periphery. The combined vertical shear stress is assumed
to be distributed as shown in Fig. 3.2(e) for an interior column-slab
junction.
The unit vertical shear stresses are given by the following
equations:
where
In the
8t [ V (M --mAB - mCD) a ] v1 = 7d i - J
v2 = 8t [ 7d
V A +
( M - m A\ - mCD) a ]
A = 2t (x + yo) 0
tx3 X t 3 2 ty X
J 0 0 0 0
= T + -r + 2
X 0
a = 2
above equations
t = total thickness of slab
d = effective depth of slab
V = total shear around the critical section
A = area of concrete in assumed critical section
M = total unbalanced moment
mAB = working stress design moment acting on face
AB of the critical section
mCD = working stress design moment acting on face
CD of the critical section
a = distance from centroidal axis to the most
••• (3.1)
••• (3.2)
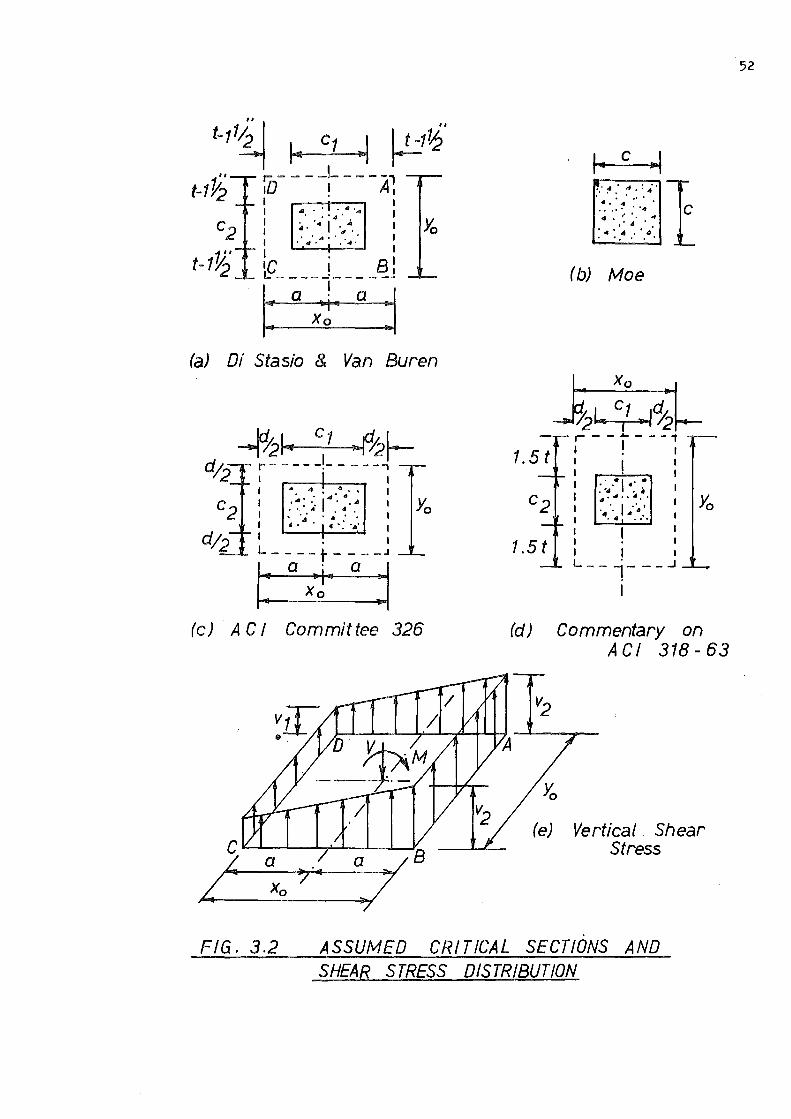
/.7/1Y 1,. Ct ~ ~~•
,, r: - - - -!- - - - -, t-1~ ,D ! A,
I ...----'""l I I '"· ·: !.,·.• .,. I I :, .... I· .. ,'". I Yo I .. '"'. . . I I • ., • • ... I I . I 1C I B, L:: - - - - ·- - - - -·
I: a ;l• a j (a) Di Stasio & Van Buren
~I~ c1 ~~ d; r - - - - -!- - - - -, 2 I ,______ I
... 4 ... ,.-".· ' ..... I . " • •. •• •• . 4'.
I • ·,. • • • • I , • ' • · '. .,.. I
I • I
'-----t----J I a · a ~ : ;~-(c) AC I Committee 326
C ............ ~.__.........,.,.~__,_____,_......r.
L/"
~ C ~ '!.·~.·.,,,:,;· 1 • 4 •• ,,; ••••
.... ·.: ... C .. • • • 4
•• 4 .• ...... ', . . .. . . .
(b) Moe
Xo
Q, .. ~1 -1~
1. 5 t .--- .... ---1 I ! I I I I I · I I • •1 . •
: •4' • ••
I •·."1•·~·. I Y,o I ·•. ; •,' I ... I •••
I
1.5 t I ' I I I L---;---J
I
(d) Commentary on AC/ 318-63
(e) Vertical . Shear Stress
FIG. 3.2 ASSUMED CRITICAL SECTIONS AND SHEAR STRESS DISTRIBUTION
52

remote part of critical section
J = polar moment of inertia of the surface described
by the critical section pa~sing through the
slab thickness about its centroid
x = dimension of critical section parallel to the 0
direction of bending
y0
= dimension of critical section transverse to the
direction of bending
Thus the total unbalanced moment M acting at the centre of the
joint is resisted by flexural moments and acting on the faces
AB and CD of the critical section respectively and a torsional moment T
acting on either side faces AD and BC.
the centre of the joint is
M = + T
The equation of moment about
from which the total torsional moment on the two side faces is obtained as
T = ••• (3.3)
Limiting values of mAB and mCD are taken as resisting moments
of the slab section on sides AB and CD of the critical section and they
are calculated on the basis of working stress design principles.
In Eqs. (3.1) and (3.2) V A represents the average vertical shear
stress due to V and T.a J is the additional vertical shear stress due to
53
the torsional moment T. The factor t d is required to transform A and
J in terms of the effective depth and j = ~ is used to conform to the
21 V design practice current in 1960 of calculating shear stress by bjd.
To allow for additional resistance developed through the dowel action of the
reinforcing bars they recommended an increase in both A and J by
multiplying the individual terms by the factor [1 + (n - 1) Pt], in which
pt is the percentage of total reinforcement crossing the perimeter of the
critical section and n is the modular ratio.
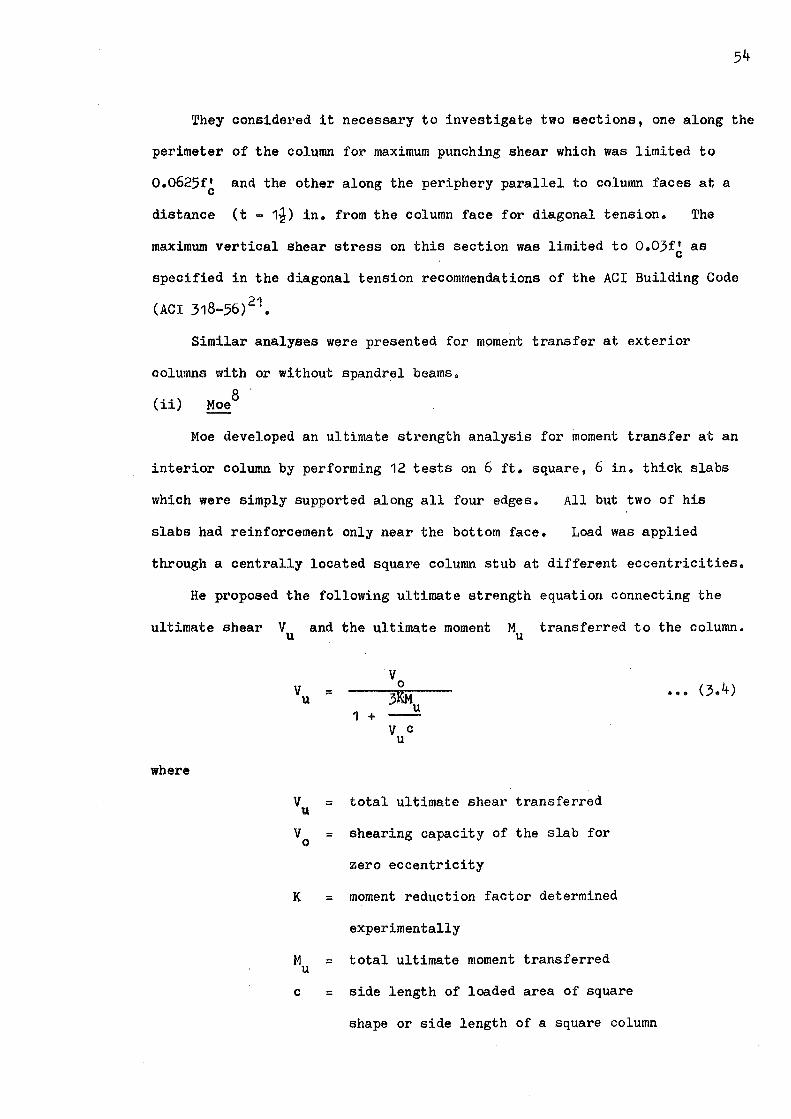
They considered it necessary to investigate two sections, one along the
perimeter of the column for maximum punching shear which was limited to
0.0625f' and the other along the periphery parallel to column faces at a C
distance (t - 1i) in. from the column face for diagonal tension. The
maximum vertical shear stress on this section was limited to 0.03f~ as
specified in the diagonal tension recommendations of the ACI Building Code
(ACI 318-56) 21 •
Similar analyses were presented for moment transfer at exterior
columns with or without spandrel beams.
(ii) 8 Moe
Moe developed an ultimate strength analysis for moment transfer at an
interior column by performing 12 tests on 6 ft. square, 6 in. thick slabs
which were simply supported along all four edges. All but two of his
slabs had reinforcement only near the bottom face. Load was applied
through a centrally located square column stub at different eccentricities.
He proposed the following ultimate strength equation connecting the
ultimate shear Vu and the ultimate moment Mu transferred to the column •
where
V u
V u
V 0
K
M u
C
=
=
=
=
=
=
1 + V C
u
total ultimate shear
shearing capacity of
zero eccentricity
transferred
the slab for
moment reduction factor determined
experimentally
total ultimate moment transferred
side length of loaded area of square
shape or side length of a square column
• • • (3.4)
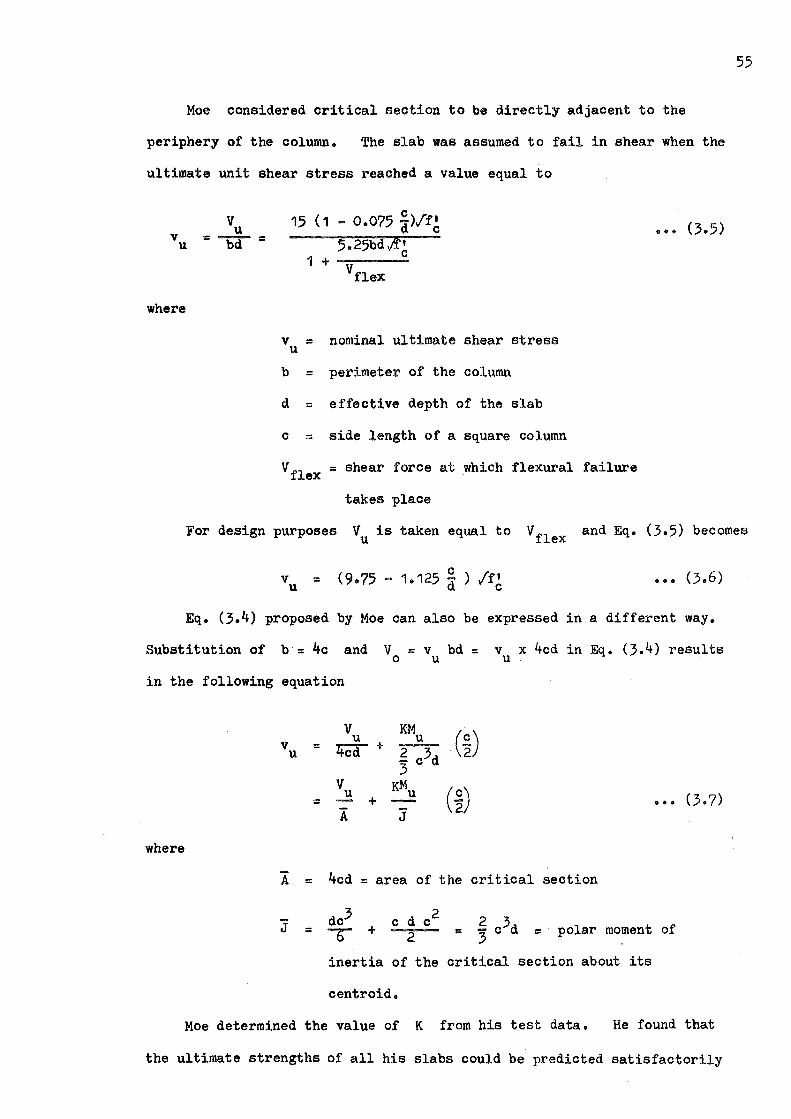
Moe considered critical section to be directly adjacent to the
periphery of the column. The slab was assumed to fail in shear when the
ultimate unit shear stress reached a value equal to
V u
where
15 (1 _ 0.075 a)/f~
5.25bdft'' C
1 +----vflex
V u
b
d
C
=
=
=
=
vflex
nominal ultimate shear stress
perimeter of the column
effective depth of the slab
side length of a square column
= shear force at which flexural
takes place
••• (3.5)
failure
55
For design purposes V is taken equal to vflex and Eq. (3.5) becomes u
V u = (9.75 - 1.125 *) /f~ ••• (3.6)
Eq. (3.4) proposed by Moe can also be expressed in a different way.
Substitution of b = 4c and V = v bd = v x 4cd in Eq. (3.4) results 0 U U
in the following equation
V KM
(~) u u V = ~+
_g c3d u 3
V KM (~) u u • • • (3. 7) = + -
A J
where
A = 4cd = area of the critical section
dc3 c d 2 ~ c3d J C I polar moment of = T + 2 = = 3
inertia of the critical section about its
centroid.
Moe determined the value of K from his test data. He found that
the ultimate strengths of all his slabs could be predicted satisfactorily
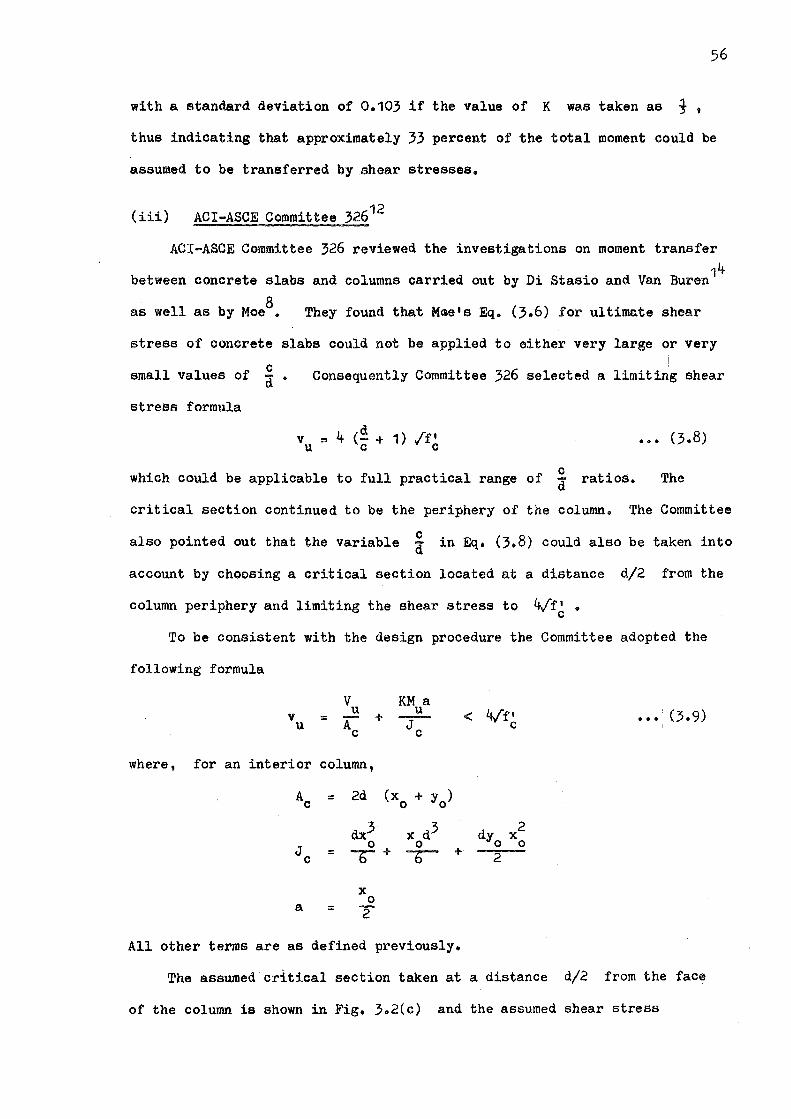
56
with a standard deviation of 0.103 if the value of K was taken as t,
thus indicating that approximately 33 percent of the total moment could be
assumed to be transferred by shear stresses.
(iii) ACI-ASCE Committee 32612
ACI-ASCE Committee 326 reviewed the investigations on moment transfer
14 between concrete slabs and columns carried out by Di Stasio and Van Buren
8 as well as by Moe. They found that Mee 1 s Eq. (3.6) for ultimate shear
stress of concrete slabs could not be applied to either very large or very
small values of
stress formula
C 'ii' • Consequently Committee 326 selected a limit~g shear
••• , (3.8)
C which could be applicable to full practical range of d ratios. The
critical section continued to be the periphery of the column. The Committee
also pointed out that the variable ~ in Eq. (3.8) could also be taken into
account by choosing a critical section located at a distance d/2 from the
column periphery and limiting the shear stress to 4/f~.
To be consistent with the design procedure the Committee adopted the
following formula
where, for an
V u
interior
Ac
Jc
a
=
column,
= 2d (x + y) 0 0
dx3 x d3 0 + 0
= T -r
= X
0
2
+
All other terms are as defined previously.
••• ' (3.9) I
2 dy X 0 0 2
The assumed critical section taken at a distance d/2 from the face
of the column is shown in Fig. 3.2(c) and the assumed shear stress
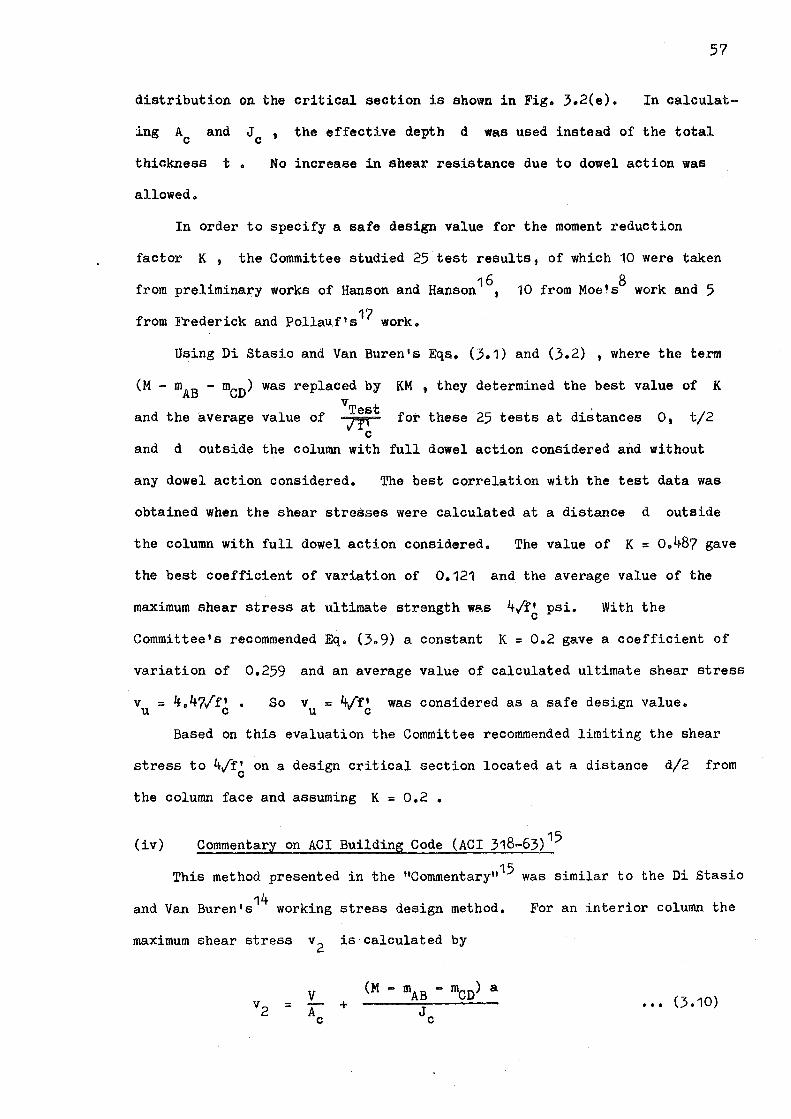
57
distribution on the critical section is shown in Fig. 3.2(e). In calculat-
ing Ac and Jc , the effective depth d was used instead of the total
thickness t.
allowed.
No increase in shear resistance due to dowel action was
In order to specify a safe design value for the moment reduction
factor K, the Committee studied 25 test results, of which 10 were taken
16 8 from preliminary works of Hanson and Hanson , 10 from Moe's work and 5
from Frederick and Pollau.f I s 17 work.
Using Di Stasio and Van Buren's Eqa. (3.1) and (3.2) , where the term
(M - mAB - mCD) was replaced by KM , they determined the best value of K V
and the average value of Test for these 25 tests at distances o, t/2 ~
and d outside the column with full dowel action considered and without
any dowel action considered. The best correlation with the test data was
obtained when the shear stresses were calculated at a distance d outside
the column with full dowel action considered. The value of K = o.487 gave
the best coefficient of variation of 0.121 and. the average value of the
maximum shear stress at ultimate strength was 4/f' psi. C
With the
Committee's recommended Eq. (3.9) a constant K = 0.2 gave a coefficient of
variation of 0.259 and an average value of calculated ultimate shear stress
So v = 4/f' was considered as a safe design value. U C
Based on this evaluation the Committee recommended limiting the shear
stress to 4Jf' on a design critical section located at a .distance d/2 from C
the column face and assuming K = o.2.
(iv) Commentary on ACI Building Code (ACI 318-63) 15
This method presented in the "Commentary1115 was similar to the Di Stasio
and Van Buren•s14 working stress design method.
maximum shear stress v2 is calculated by
:::
For an interior column the
••• (3.10)
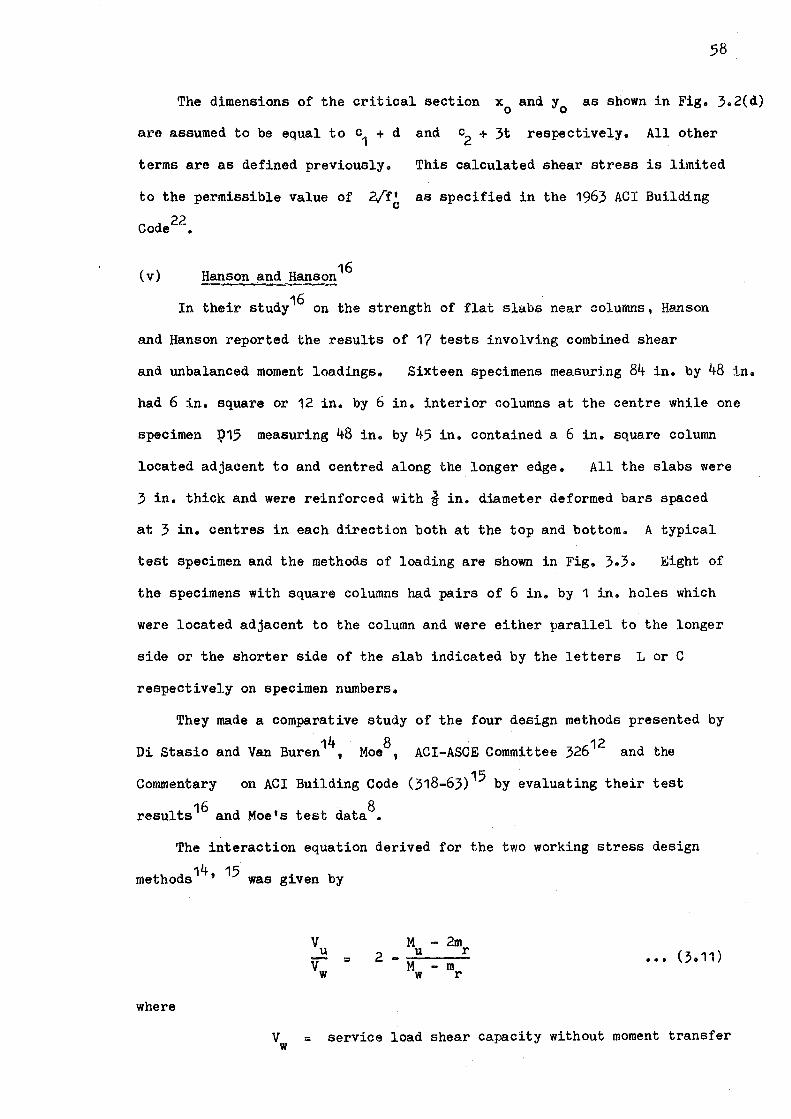
58
The dimensions of the critical section x and y as shown in Fig. 3.2(d) 0 0
are assumed to be equal to c1 + d and c2 + 3t respectively. All other
terms are as defined previously. This calculated shear stress is limited
to the permissible value of 2/f~ as specified in the 1963 ACI Building
Code22•
(v) 16 Hanson and Hanson
16 In their study on the strength of flat slabs near columns, Hanson
and Hanson reported the results of 17 tests involving combined shear
and unbalanced moment loadings. Sixteen specimens measuring 84 in. by 48 in.
had 6 in. square or 12 in. by 6 in. interior columns at the centre while one
spec,imen J;)15 measuring 48 in. by 45 in. contained a 6 in. square column
located adjacent to and centred along the longer edge. All the slabs were
3 in. thick and were reinforced with¾ in. diameter deformed bars spaced
at 3 in. centres in each direction both at the top and bottom. A typical
test specimen and the methods of loading are shown in Fig. 3.3. Eight of
the specimens with square columns had pairs of 6 in. by 1 in. holes which
were located adjacent to the column and were either parallel to the longer
side or the shorter side of the slab indicated by the letters Lor C
respectively on specimen numbers.
They made a comparative study
Di Stasio and Van Buren 14, Moe8,
Commentary on ACI Building Code
results16 and Moe•s test data8•
of the four design methods presented by
12 ACI-ASCE Committee 326 and the
(318-63) 15 by evaluating their test
The interaction equation derived for the two working stress design
14 15 methods ' was given by
where
M - 2m 2
_ u r M - m w r
••• (3.11)
V = service load shear capacity without moment transfer w
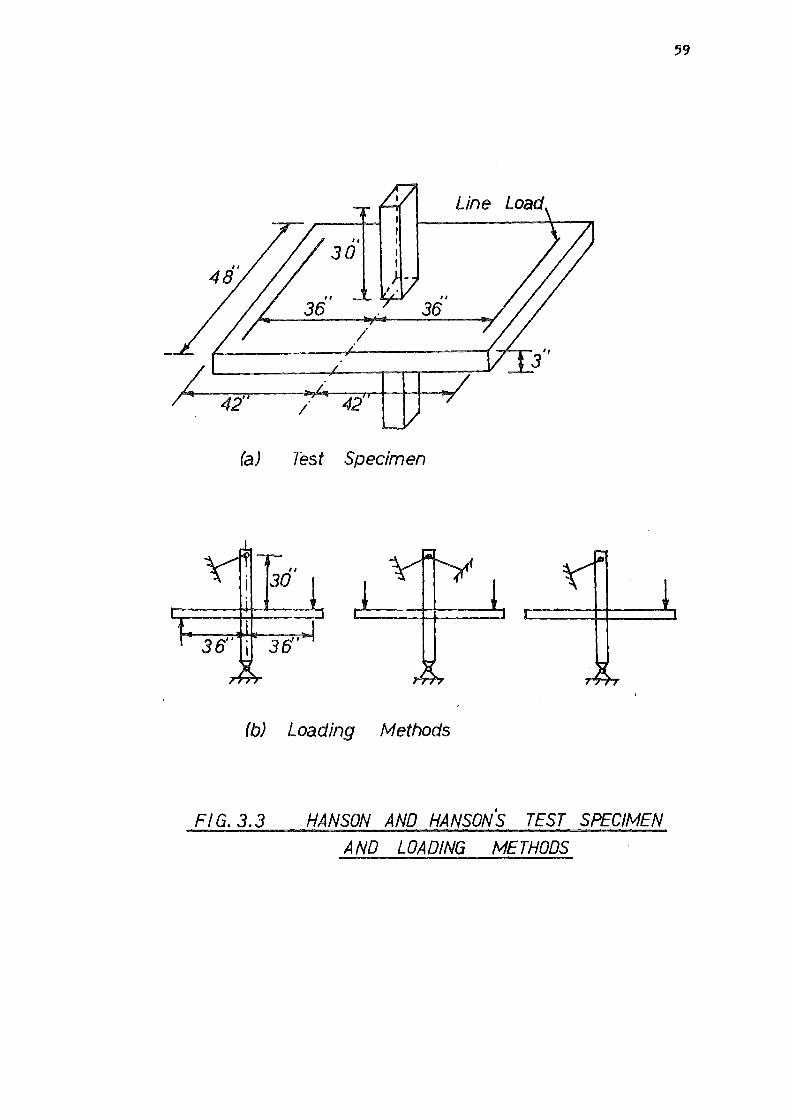
59
II
36 /
42" I 42
(a) Test Specimen
" 30
3(5'
(b) Loading Methods
Fl G. 3.3 HANSON AND HANSONS TEST SPECIMEN
A ND LOADING METHODS

=
=
ultimate shear
service load unbalanced moment capacity
without shear transfer
Mu = ultimate unbalanced moment
m = sum of flexural moments acting on faces AB r
and CD of critical section, calculated by
working stress design method
60
In this derivation of Eq. (3.11) it was assumed that the service load
shear, V and moment, M for the test specimens were one half of the
ultimate shear, V and ultimate moment, u The nominal service load
shear stress was assumed to be 2/f' • Vu Mu - 2mr c 8 16
Values of V and M _ m for the test specimens ' were computed w w r 14 by Di Stasio and Van Buren's method which was modified to conform to the
requirements of the 1963 ACI Building Code22• These values when plotted
as an interaction diagram were all found to be outside the interaction line
representing Eq. (3.11), indicating that a nominal service load shear stress
of 2/f' was conservative for a factor of safety of 2 when using Di Stasio C
and Van Buren•s method.
The method given in the Commentary15 on the 1963 ACI Building Code was
found to be satisfactory for the tests reported by Hanson and Hanson but it
led to a factor of safety less than 2 for all but three of Moe's tests.
The interaction equation derived for the two ultimate strength methods8
' 12
given by Moe and ACI Committee 32612 was
where
V = u
V = 0
M = u
M = Q
=
ultimate
M 1 - u
Mo
shear
••• (3.12)
ultimate shear capacity without moment transfer
ultimate unbalanced • l'Mlent capacity
ultimate unbalanced moment capacity without
shear transfer
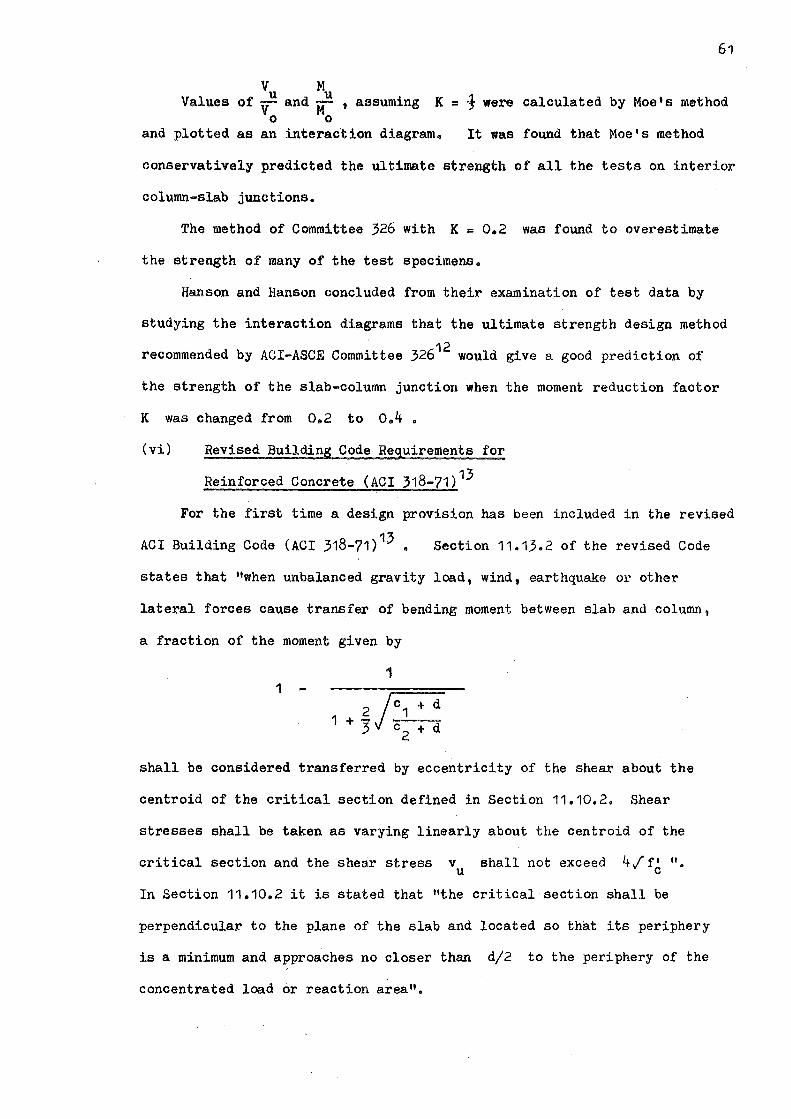
61
V M Values
and plotted
u u of - and - , assuming K = Vo Mo
as an interaction diagram.
j were calculated by Moe's method
It was found that Moe's method
conservatively predicted the ultimate strength of all the tests on interior
column-slab junctions.
The method of Committee 326 with K = 0.2 was found to overestimate
the strength of many of the test specimens.
Hanson and Hanson concluded from their examination of test data by
studying the interaction diagrams that the ultimate strength design method
recommended by ACI-ASCE Committee 32612 would give a good prediction of
the strength of the slab-column junction when the moment reduction factor
K was changed from 0.2 to o.4.
(vi) Revised Building Code Re9uirements for
Reinforced Concrete (ACI 318-71) 13
For the first time a design provision has been included in the revised
ACI Building Code (ACI 318-71) 13 • Section 11.13.2 of the revised Code
states that "when unbalanced gravity load I wind, earthquake or other
lateral forces cause transfer of bending moment between slab and column,
a fraction of the moment given by
1 -1
2~ 1 + 3/ ~
shall be considered transferred by eccentricity of the shear about the
centroid of the critical section defined in Section 11.10.2. Shear
stresses shall be taken as varying linearly about the centroid of the
critical section and the shear stress v shall not exceed 4 / f' 11 U C •
In Section 11.10.2 it is stated that "the critical section shall be
perpendicular to the plane of the slab and located so that its periphery
is a minimum and approaches no closer than d/2 to the periphery of the
concentrated load or reaction area".
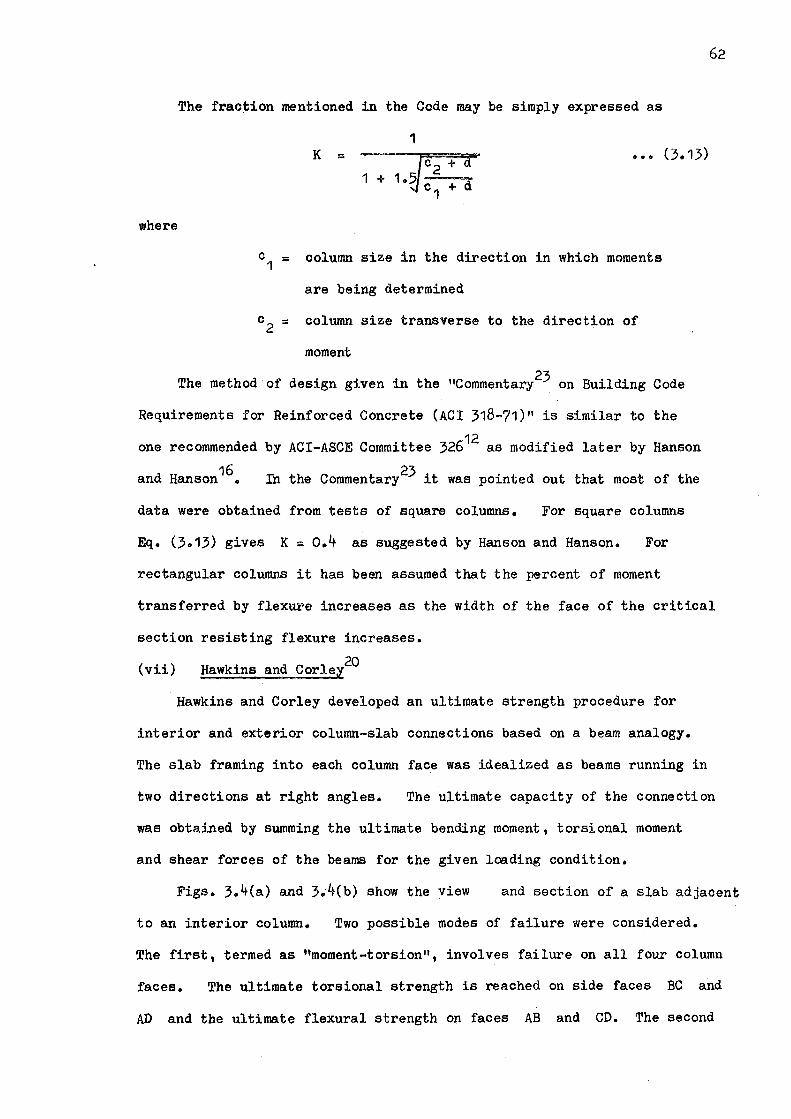
where
The fraction mentioned in the Code may be simply expressed as
1 K = ••• (3.13)
c1 = column size in the direction in which moments
are being determined
c2 = column size transverse to the direction of
moment
The method of design given in the 11Commentary23 on Building Code
Requirements for Reinforced Concrete (ACI 318-71) 11 is similar to the
one recommended by ACI-ASCE Committee 32612 as modified later by Hanson
and Hanson16• In the Commentary23 it was pointed out that most of the
data were obtained from tests of square columns. For square columns
62
Eq. (3.13) gives K = o.4 as suggested by Hanson and Hanson. For
rectangular columns it has been assumed that the percent of moment
transferred by flexure increases as the width of the face of the critical
section resisting flexure increases.
(vii) 20 Hawkins and Corley
Hawkins and Corley developed an ultimate strength procedure for
interior and exterior column-slab connections based on a beam analogy.
The slab framing into each column face was idealized as beams running in
two directions at right angles. The ultimate capacity of the connection
was obtained by summing the ultimate bending moment, torsional moment
and shear forces of the beams for the given loading condition.
Figs. 3.4(a) and 3.4(b) show the view and section of a slab adjacent
to an interior column. Two possible modes of failure were considered.
The first, termed as "moment-torsion", involves failure on all four column
faces. The ultimate torsional strength is reached on side faces BC and
AD and the ultimate flexural strength on faces AB and CD. The second
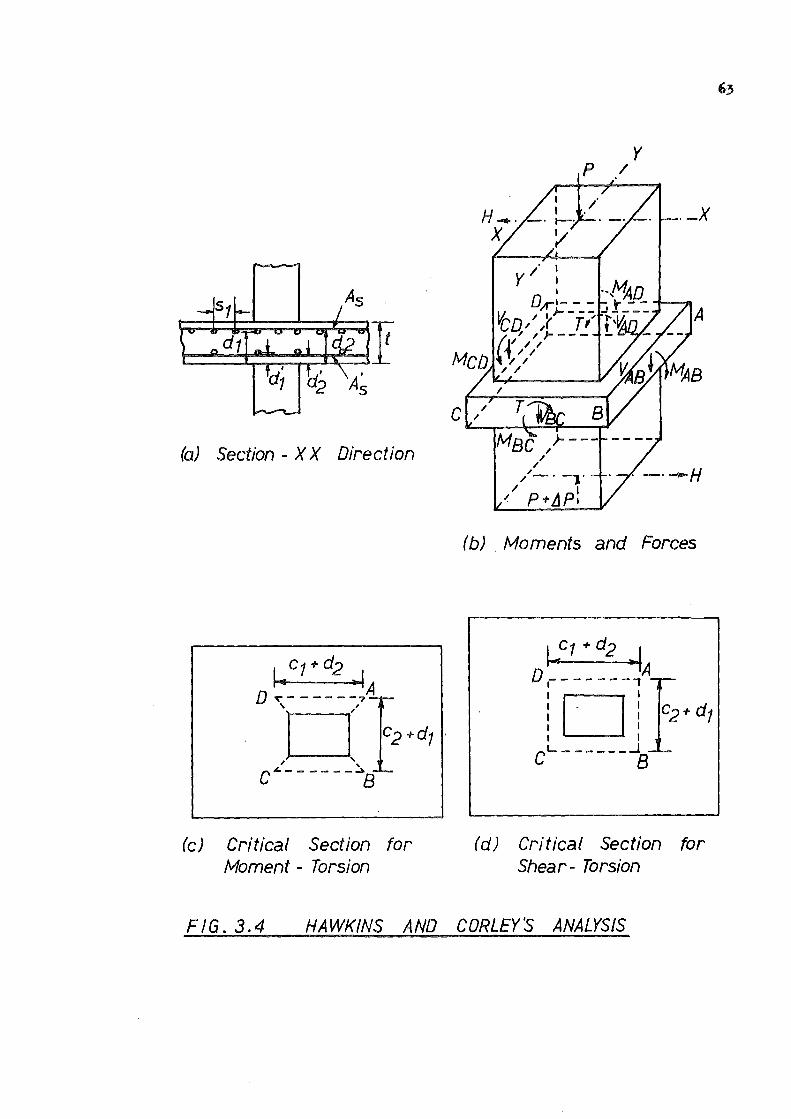
(a) Section - XX Direction
(c) Critical Section for Moment - Torsion
y p /
(b) Moments and Forces
(d) Critical Section tor Shear- Torsion
FIG. 3.4 HAWKINS AND CORLEY's ANALYSIS
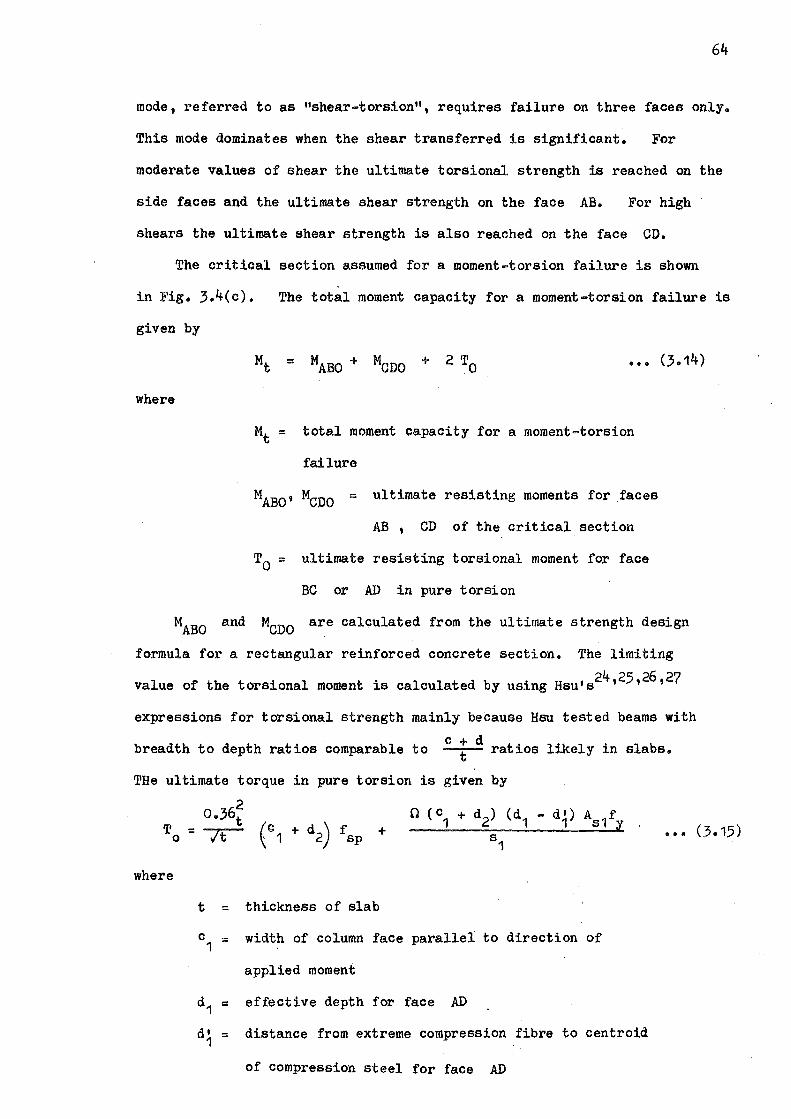
64
mode, referred to as "shear-torsion", requires failure on three faces only.
This mode dominates when the shear transferred is significant. For
moderate values of shear the ultimate torsional strength is reached on the
side faces and the ultimate shear strength on the face AB. For high
shears the ultimate shear strength is also reached on the face CD,
The critical section assumed for a moment-torsion failure is shown
in Fig. 3,4(c).
given by
The total moment capacity for a moment-torsion failure is
where
= • • • (3.14)
Mt= total moment capacity for a moment-torsion
failure
MABO' MCDO = ultimate resisting moments for faces
AB , CD of the critical section
T0 = ultimate resisting torsional moment for face
BC or AD in pure torsion
MABO and MCDO are calculated from the ultimate strength design
formula for a rectangular reinforced concrete section. The limiting
value of the torsional moment is calculated by using Hsu•s24 , 25 , 26 , 27
expressions for torsional strength mainly because Hsu tested beams with
breadth to depth ratios comparable to c; d ratios likely in slabs.
THe ultimate torque in pure torsion is given by
where
+
t = thickness of slab
0 (C1 + d2) (d1 - d1) As1fy
61
c1
= width of column face parallel to direction of
applied moment
d1 = effective depth for face AD
d 1 = distance from extreme compression fibre to centroid 1
of compression steel for face AD
••• (3.15)

f = splitting tensile strength of concrete Sp
0 = coefficient
more than 1.5
= o.66 + 0.33 but not
As1 = area of one reinforcing bar parallel to the torsion
face of the column
f = yield stress of reinforcing bars y
s1 = spacing of reinforcing bars parallel to the torsion
face of the column
For torsion in combination with shear and moment the ultimate torque
assumed is
j, -T T VAD
= VADO u 0
if MAD
< 0.5 MADO
or
1.4 MAD ( VAD )
2
T = T (1.7 - -) 1 -VADO u 0 MADO
••• (3.17)
if MAD
> 0.5 MADO
where
VAD .. shear force acting on face AD
VADO = ultimate resisting shear for face AD
MAD = moment acting on face AD
MADO = ultimate resisting moment for face AD
For a shear-torsion failure a diagonal tension crack is assumed to
extend across the full width of the face AB in Fig. 3.4(d). The load
on the area tributary to this face is equal to or greater than the
ultimate shear strength for this face, which is given by
VABO = o.6 fsp (c 2 + d1)d2 > 4 /f~ (c.2 + d1 )d2 • • • (3.18)
where
VABO = ultimate resisting shear far face AB
fsp = splitting tensile strength of concrete
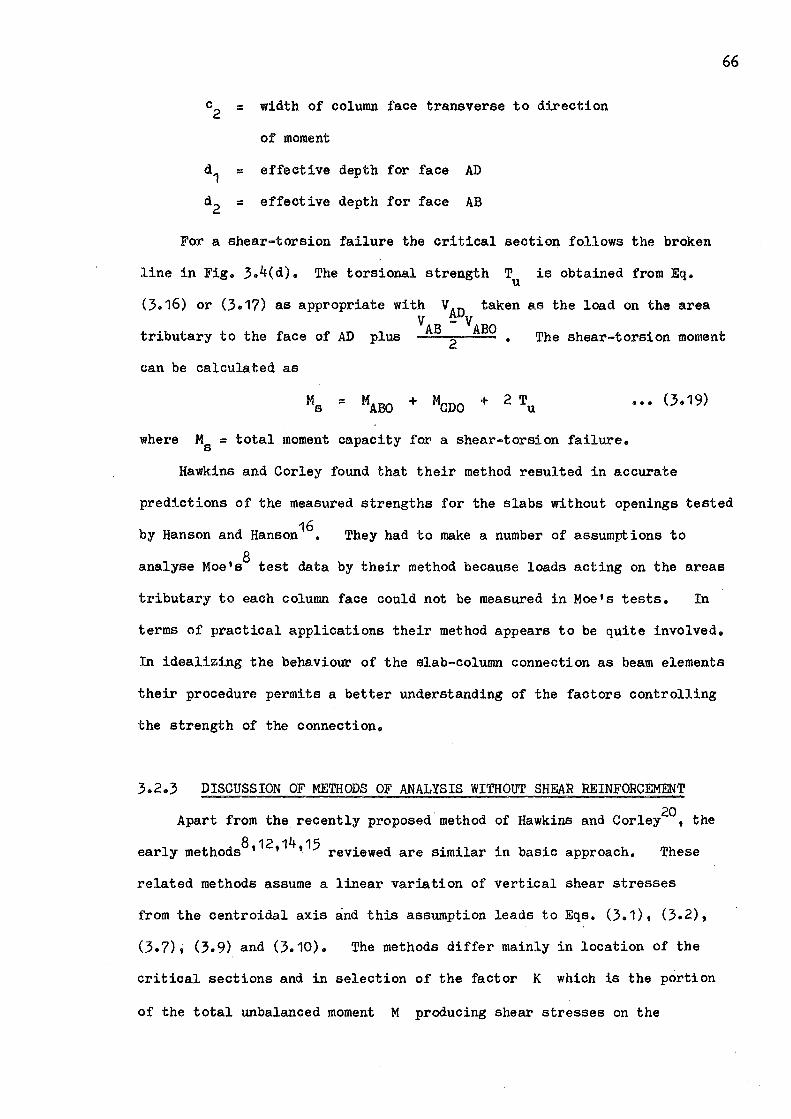
C = width of column face transverse to direction 2
of moment
d1 = effective depth for face AD
d2 = effective depth for face AB
For a shear-torsion failure the critical section follows the broken
line in Fig. 3.4(d). The torsional strength T is obtained from Eq. u
(3.16) or (3.17) as appropriate with VAD taken as the load on the area
66
VAB - VABO tributary to the face of AD plus ---,
2.------- The shear-torsion moment
can be calculated as
= + 2 T u
where Ms= total moment capacity for a shear-torsion failure.
••• (3.19)
Hawkins and Corley found that their method resulted in accurate
predictions of the measured strengths for the slabs without openings tested
16 by Hanson and Hanson • They had to make a number of assumptions to
8 analyse Moe's test data by their method because loads acting on the areas
tributary to each column face could not be measured in Moe's tests. In
terms of practical applications their method appears to be quite involved.
In idealizing the behaviour of the slab-column connection as beam elements
their procedure permits a better understanding of the factors controlling
the strength of the connection.
3.2.3 DISCUSSION OF METHODS OF ANALYSIS WITHOUT SHEAR REINFORCEMENT 20 Apart from the recently proposed method of Hawkins and Corley , the
early methods8112 •14115 reviewed are similar in basic approach. These
related methods assume a linear variation of vertical shear stresses
from the centroidal axis and this assumption leads to Eqs. (3.1), (3.2),
(3.7) 9 (3.9) and (3.10). The methods differ mainly in location of the
critical sections and in selection of the factor K which is the portion
of the total unbalanced moment M producing shear stresses on the

critical section.
14 The two working stress methods of Di Stasio and Van Buren and the
Commentary15 on the 1963 ACI Building Code give K = (M - mAB - m00)/M •
Considering the service load moment M to be one half the ultimate
moment Mu, K can be expressed as
K = ••• (3.20)
8 For square columns Moe suggests K = J and the ACI Building Code
(ACI 318-71) 13 suggests K = o.4. In Moe's method K is that part of
the total moment which produces only vertical shear stresses. In case of
the ACI method K is that part of the total moment which produces both
vertical and horizontal shear stresses and it is, therefore, expected to
be greater than Moe's value.
Values of K calculated from test results are given in Table 3.1 for
the methods recommended by ACI12 , 23 , Moe8 and Di Stasio and Van Buren 14•
8 The ratios of measured to theoretical strengths for the tests by Moe and
16 Hanson and Hanson can be obtained by dividing the recommended value of K
by the actual values of K obtained from test results and these are also
given in Table 3.1.
A study of Table 3.1 reveals the same conclusions as reached by Hanson
16 and Hanson by means of their interaction diagrams. All K values
computed by Moe's method are less than 1, indicating safe results. If
the value of K is taken as 0.2 by the ACI method12t23 , many specimens
will produce unsafe results but a value of K = o.4 will mean that all K
values computed by the ACI method from the test results will be less than
o.4, thus pointing to safe results. The ACI method is also seen to
produce scattered results for the slabs tested by Moe. This is because
67
all but two of Moe's slabs had reinforcement on one face only. The capacity
of the resisting moments of the slab sections should be a factor in
deciding the proportion of moment to be transferred by shear.
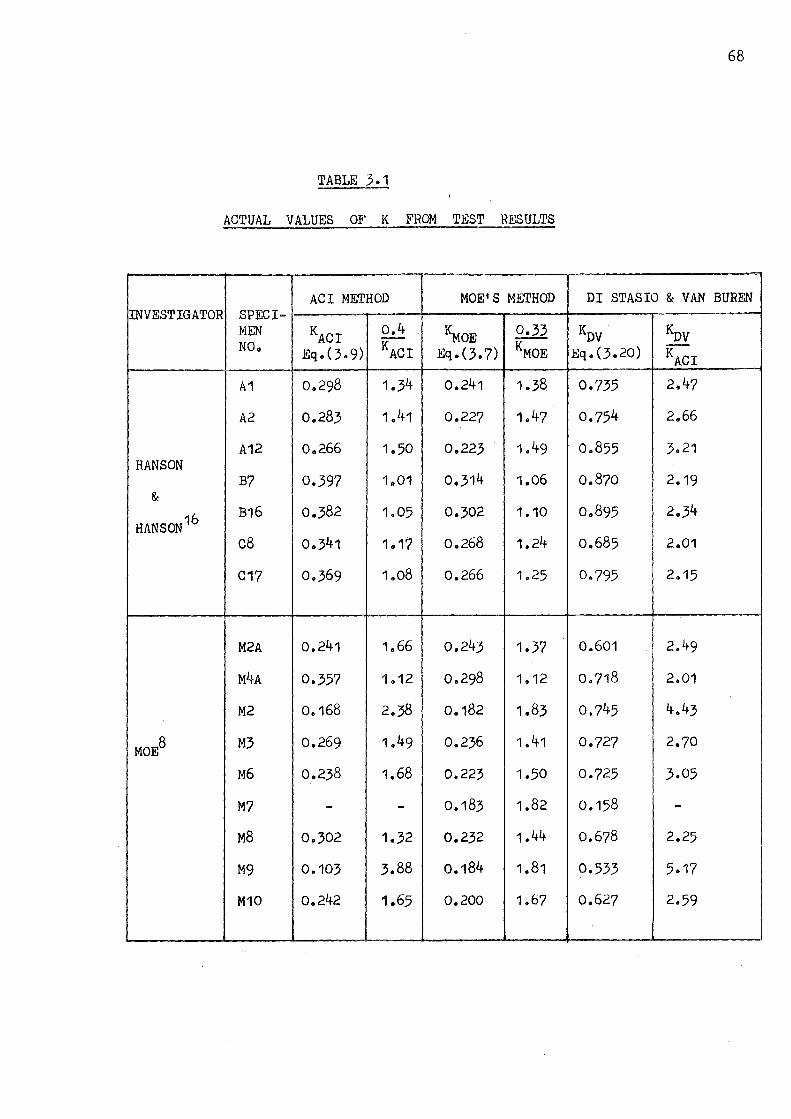
68
TABLE 3.1
ACTUAL VALUES OF K FROM TEST RESULTS
ACI METHOD MOE'S MEI'HOD DI STASIO & VAN BUREN INVESTIGATOR SPECI-
MEN KACI o.4 ¾oE 0.33 KDV KDV NO. Eq. (3.9) KACI Eq. (3. 7) KMOE Eq. (3.20) KACI
A1 0.298 1.34 0.241 1.38 0.735 2.47
A2 0.283 1.41 0.227 1.47 0.754 2.66
A12 0.266 1.50 0.223 1.49 0.855 3.21 HANSON
B7 0.397 1.01 0.314 1.06 0.870 2.19 &
HANSON16 B16 0.382 1.05 0.302 1.10 0.895 2.34
c8 0.341 1.17 0.268 1.24 o.685 2.01
C17 0.369 1.08 0.266 1.25 0.795 2.15
M2A 0.241 1.66 0.243 1.37 0.601 2.49
M4A 0.357 1.12 0.298 1.12 0.718 2.01
M2 0.168 2.38 0.182 1.83 0.745 4.43
MOES M3 0.269 1.49 0.236 1.41 0.727 2.70
M6 0.238 1.68 0.223 1.50 0.725 3.05
M7 - - 0.183 1.82 0.158 -M8 0.302 1.32 0.232 1.44 0.678 2.25
M9 0.103 3.88 0.184 1.81 0.533 5.17
M10 0.242 1.65 0.200 1.67 0.627 2.59
From Table 3.1 it is also seen that the ratios of K values obtained
14 12 23 by Di Stasio and Van Buren 1 s method to those obtained by the ACI method 9
are greater than 2 9 thus indicating a factor of safety greater than 2.
The actual values of K computed by the method given in the Commentary15
on the 1963 ACI Code will be less than those given by the method of Di
Stasio and Van Buren because in the former case mAB and m00 in Eq. (3.20) 0 2 + 3t 16
will be increased by the factor C + d •
2 Hanson and Hanson showed
that this method gave a factor less than 2 for many specimens tested by
Moe.
Regarding the empirical value of K for rectangular sections given
by Eq. (3.13) it may be pointed out that specimens C8 and C17 tested by
16 Hanson and Hanson produce rather lower K values than the recommended
value. For these two specimens with c + d = 8.44 in. and 1
c2 + d = 14.44
in. the value of K given by Eq. (3.13) is 0.34 whereas actual ~alues
of K obtained from tests are 0.34 and 0.37 for c8 and C17 respectively.
Hence Eq. (3.13) when used with the current ACI proposa113123 may not give c2 + d
safe results for c d > 1.7. 1 +
The polar moment of inertia, J , for square and rectangular
sections has been expressed as
dx3 J
0 = +
6
J J and = V2 = a
-- + 6
dx2 0
-3- +
2 dy X 0 0
2
d3 3 + y dx
0 0
dx2
• • • (3. 21)
In balancing the applied moment the first term 0 in 3
Eq. (3.21)
gives the contribution of linearly varying vertical shearing stresses d3
along faces BC and AD of the critical section, the 2nd term T
gives the contribution of horizontal shear stresses acting on faces
BC and AD and the last term Y dx gives the contribution of 0 0
vertical d3
term 3
shear stresses.acting on transverse faces AB and CD. The
is very small compared with the other terms ·and this means
70
that the contribution of horizontal shear stress in balancing
moment may not be duly considered. In Moe's method the term
applied
has been
dropped in calculating J but this has been compensated to some extent by
selecting a lower value of K. Since the overall depths of slabs tested
were equal to or less than half the side dimension, c 1 of the columns,
the contribution of torsional moments were small and as a result there was
not any large discrepancy between the test results and the theoretical
results due to this factor.
On the whole Di Stasio and Van Buren•s14 working stress method has
been found to produce safe results with a factor of safety greater than 2.
Since this method is based on working stress design principles, use of
straight-line variation of stresses and the concept of polar moment of
inertia may be regarded as a useful design tool with some justification.
However, the same cannot be said about the ultimate strength design
8 12 13 23 procedures recommended by Moe and the ACI 1 1 • These methods
predict ultimate strengths with a varying degree of safety but they are in
a true sense regarded as empirical design methods. The concept of
straight-line variations of stresses and use of polar moment of inertia
are not in keeping with the ultimate strength design philosophy.
In contrast the method proposed by Hawkins and Corley20 is in a real
sense an ultimate strength design procedure. They have idealised the·
slab to column connection as intersecting beams for which separate
expressions for moment, shear and torque have been developed. In Eq. (3.15)
the contribution of slab.reinforcement in providing torsional resistance
seems to have been overestimated because this does not comply with the
limitation of maximum nominal ultimate torsional shear stress in concrete
which, due to pure torsion, is given as 12/f~ in the ACI Building Code
(318-71) 13•
In none of the slabs analysed by them closed hoops were provided.
For effective development of torsional resistance in reinforced concrete
71
beams it is essential to provide both closed hoops and adequate longitudinal
reinforcement as can be demonstrated by a space truss analogy. In the
absence of closed hoops, the second term of Eq. (3.15), which gives the
contribution of slab reinforcement towards the ultimate resisting torsional
moment, cannot be considered as fully effective in providing the same
torsional resistance as would be given by the closed stirrups because the
vertical shear stresses may not be balanced within the slab.
Excellent correlations that exist between their theory and the test
results could be attributed to overestimation of steel component in
calculating the torsional moment. It is also believed that the torsional
moment capacity of the slab-section which is assumed to frame into the
column will increase due to warping restraint and the flexural capacity of
the slab section is expected to increase due to inplane compressive forces
imposed on the slab by the restraint of the column.
3.2.4 INVESTIGATIONS WITH SHEAR REINFORCEMENT
The shearing strength of the flat plate-column junction can be
increased by using shear reinforcement formed from bars or shearheads
fabricated from steel I or channel shapes. Although shearhead reinforce-
ment has been in use in flat plate construction for a long time no
detailed test data or design procedure was available until Corley and
Hawkins28 conducted tests and proposed a design procedure for concentrically
loaded slab-column junctions. For a slab-column junction containing
shear reinforcement or a shearhead, which transfers both shear and moment
there would appear to be no design procedures available. Of the few
18 known tests on such a junction one has been carried out by Hollings and
four or five tests have been performed at the Portland Cement Association
Laboratory19 , 29• A review of these tests is given below.
(i) Full Scale Test by Hollings18
A full scale test simulating the large deformations possible in a
very severe earthquake was carried out by Hollings18 on a reinforced
concrete flat plate to column connection containing a steel shearhead.
The object of the test was to prove that the particular flat plate to
column connection used in the construction of a 16 storeyed structure
could survive repeated floor to floor horizontal deflections of 2 in.
without loss of the vertical load carrying capacity of the connection.
The details of the test specimen and the method of testing are shown in
Fig. 3.5.
The steel shearhead made of 2 pairs of I-sections, each of size
3 in. x 2 in. x 4.5 lbs, was selected without calculation to fulfil
the following criteria:
(a) The nominal shear stresses 'on the concrete section outside the
shearhead must be very low for the worst condition of moment and shear.
(b) The shearhead must be easy to build and light in weight.
(c) It must fit between the layers of reinforcing bars.
In his method of testing full vertical load conditions with a small •
load factor were simulated by placing a stack of concrete blocks on the
test slab which together with the concrete blocks weighed 144 psf.
Equal and opposite loads were applied in 0.5 ton increments by hydraulic
jacks at the centre of each slab edge to simulate earthquake loading
conditions.
A total of 4 tests were performed on the same test specimen. Test 1
was discontinued at 8 tons on each jack because of doubtful stability of
the loading strut. At this loading the test slab had reached 85% of its
ultimate moment capacity and an average deflection of 2.3 in. was reached
at the jacks. A pattern of light cracking with a maximum crack width of
0.03 in. and limited to a few square feet around the column could be
72
observed at this stage. In test 2 the load cells were removed and loading
was continued in the same direction to the limit of stability of the
jacking apparatus. This was reached at an average slab edge deflection
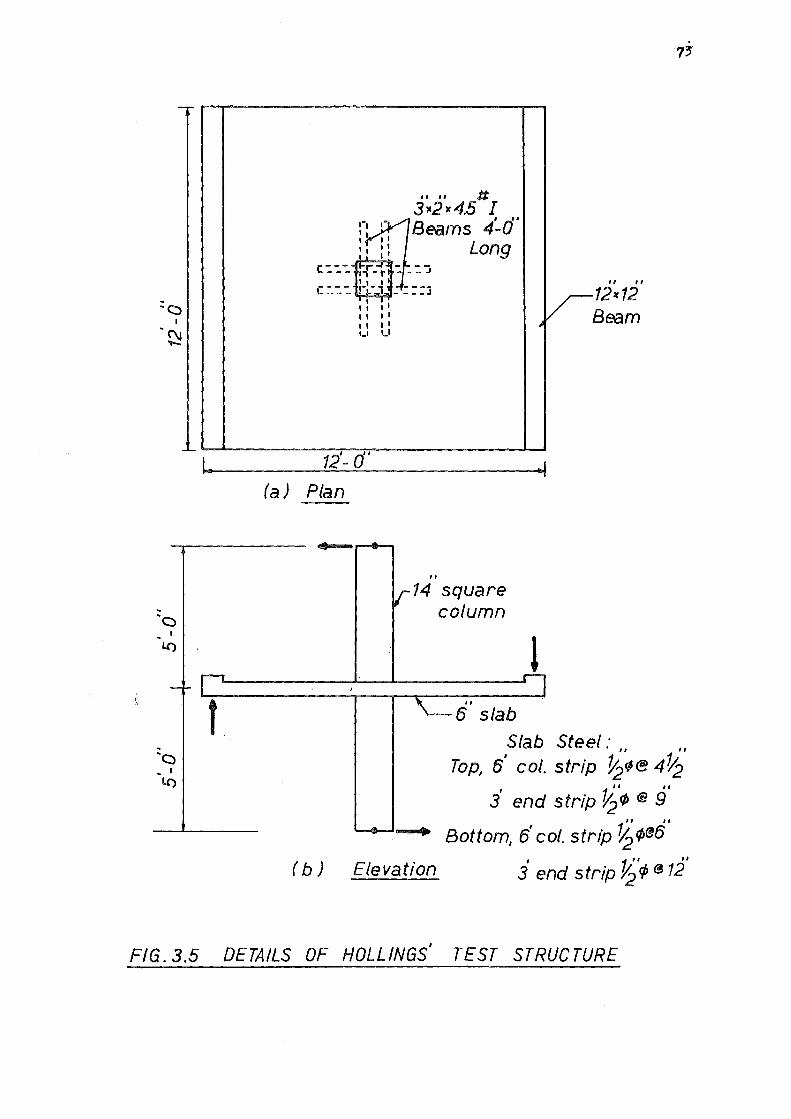
II II It 3x2x4.5 J
I II
Beams 4-0 Long
,-. ,-: I 11 I I 11
r---tn"J"' 1' ----,.. ___ -,-r ___ J
j - - - :-• • JI I ~- - • • ---- - ____ J
I: I I 11 I I 11 1 1 ,_, u
I .. 12'- o" (a) Plan
" 14 square column
l f " 6 slab
Slab Steel: ,, ,, Top, 6
1
col. strip ½c,@ 4~
3' end strip ½'<J, @ 9' II II
Bottom, 61
col. strip ½<1>e6
( b) Elevation i end strip 11;'¢ 0 12'
FIG. 3.5 DETAILS OF HOLLINGS' TEST STRUCTURE

74
of 4.25 in. and the crack pattern was only slightly extended from that of
test 1. On unloading the slab edge recovered 2.25 in. In test 3 the
jacking points were reversed and the permanent deflection left in the slab
after test 2 was jacked back to zero. Then a further edge deflection of
2.5 in. was applied. Similar cracks patterns to those of test 1 appeared
on the reverse faces of the slab. In test 4 both edges of the slab were
jacked downwards to the limit of jack travel, which was 4 in. This
produced wide cracking across the full width of the slab on or near the
column centre line.
The test successfully showed that the particular flat plate to column
connection can survive repeated floor to floor deflections of the order of
3 to 4 in. without loss of the vertical shear capacity of the connection.
(ii) P.C.A.Tests19 •29
Experimental work has been in progress at the Portland Cement
Association Laboratories, U.S.A., on the seismic resistance of the flat
plate to column connection. Results of their tests have not yet been
published except that of the 5th test which appeared in the ACI Journa119
as a discussion of proposed revisions of the 1963 ACI Building Code. Some
details of their specimens and loading arrangements as shown in Fig. 3.6
29 have been obtained from a private communication from the P.C.A.
The test specimens measured 19 ft. x 13 ft. 1 in. with a 7½ in. thick
slab. The size of the column was 18 in. square and 10 ft. 9 in. in height.
Their test procedure was to attach dead weights to the slab to bring the
total shear up to the equivalent of dead load plus partitions plus 15 psf
live load, then to apply equal and opposite deflections at the stiffening
beams placed along the shorter edges to simulate the unbalanced moment.
Seismic loading cycles were simulated by reversing the edge beam
deflections in sign several times.
The main variable in their tests was the use of different shear
reinforcements at the slab-column junction. Their first specimen
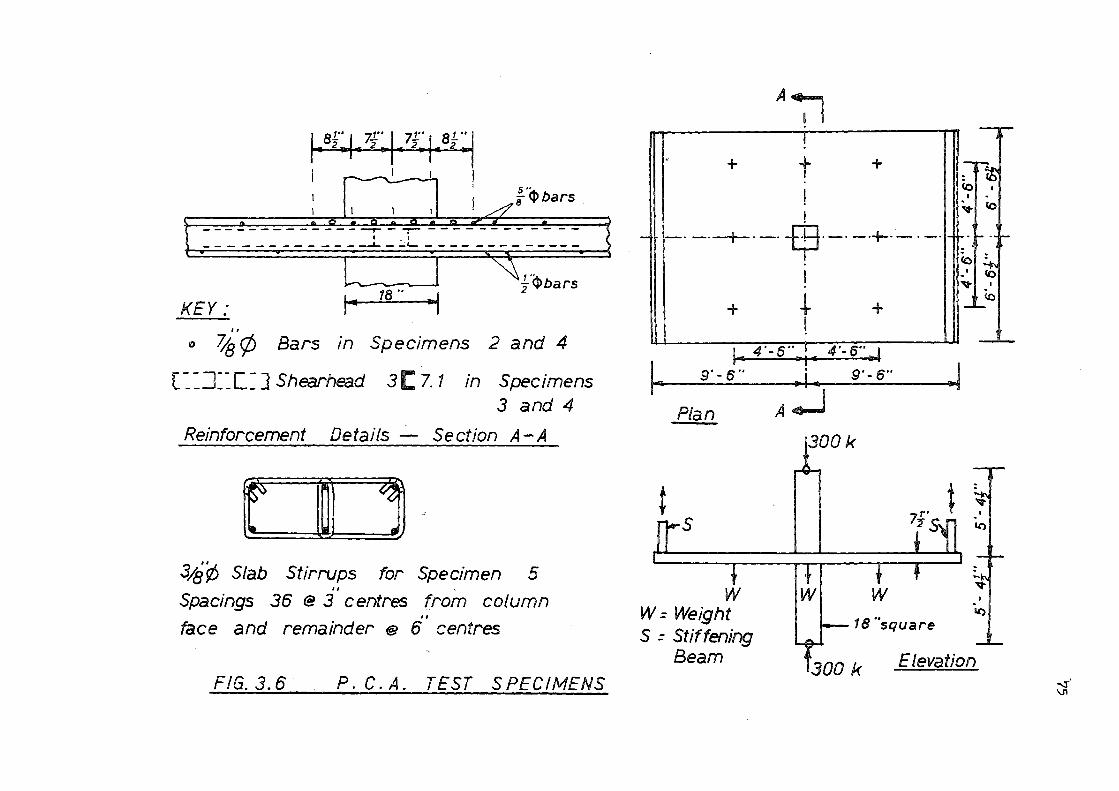
/ a1" 71-" I 71:.· a1 -~ .. 2~- 2. 11 2.,, .. 2 I ~ I
I
~·<l>bars 8
--------------....- - ,- ---- ---- -- --' - ' -------------.J-- . ._ ____________ _
KEY: r- 18 " ., 1 ..
2 <l>bars
" o 7/a ¢ Bars in Specimens 2 and 4
[~:J:~[=] Shearhead 3[ 7.1 in Specimens 3 and 4
Reinforcement Details - Section A-A
r ~ , 3/eizS Slab Stirrups for Specimen 5
" . Spacings 36 @ 3 centres from column
II
face and remainder @ 6 centres
FIG. 3. 6 P. C.A. TEST SPECIMENS
A4;7 I
.- + t +
! I
-· -·-+-·-· -$·-· -·+-·-· -· ...J
I
+ + + I
~ Plan
j 4 . - 6 .. 1 4 ' - 6.. I ~ .,, ~
9'-6" ~ 9'-6"
A.J
t s
w W= Weight
w 18 "square
~
~· <o
<o .• I <o ~ I
(0
~
' . IC)
-. ~
I
IC)
S = Stiffening Beam Elevation
...;:i-' \.n
76
contained only the basic reinforcement pattern without any shear reinforce-
ment. Four¼ in. diameter bars were added each way in the 2nd specimen.
A shearhead made of two pairs of channels was added to the basic pattern
for the 3rd test and both i in. diameter bars and the shearhead were added
for the 4th specimen. All these four specimens failed in shear before
reaching general slab yielding.
about 2 in. in 9 ft.
The maximum edge deflection attained was
In the fifth specimen, the "integral beam" shear reinforcement shown
in Fig. 3.6 was used. Closed hoops made of¾ in. diameter bars at a
maximum spacing of d/2 were used. Under application of unbalanced
moment the. test specimen was intact after sustaining slab end deflections
of 8 in. in 9 ft. The integral beams maintained a high load carrying
capacity in spite of extreme cracking and deformations.
Their test showed that closed stirrups can be adequately anchored in a
slab less than 10 in. thick and that adequately anchored bars can be
considered as fully effective shear reinforcement for slabs. Their
proposal for a change in the shear reinforcement provisions in slabs has
been adopted in Section 11.11.1 of the revised ACI Building Code (ACI 318-
71)13.
EFFECTIVENESS OF SHEAR REINFORCEMENT IN
RESISTING PUNCHING SHEAR
(i) Recommendation by ACI Building Code (318-71) 13
Until the publication of the latest ACI Building Code (ACI 318-71) 13
shear reinforcement formed from bars was considered entirely ineffective
in slabs with a total thickness less than 10 in. This restriction on the
use of shear reinforcement in slabs resulted from inadequately anchored
shear reinforcement in the test specimens6' 8131 considered in the report by
12 ACI-ASCE Committee 326 • As a result of the test carried out at the
Portland Cement Association Laboratory19 on a 7i in. thick flat plate-
77
column specimen with shear reinforcement in the form of closed stirrups
ACI Committee 318 revised the shear reinforcement provisions for slabs in
the new ACI Building Code (ACI 318-71) 13 and Section 11.11.1 of the revised
Code now reads;-
"Shear reinforcement consisting of bars or wires anchored in accordance
with Section 12.13 may be provided in slabs. For design of such shear
reinforcement, shear stresses shall be investigated at the critical section
defined in Section 11.10.2 and at successive sections more distant from the
support; and the shear stress V C
carried by the concrete at any section
shall not exceed a/f' • C
Where v exceeds v the shear reinforcement U C
shall be provided according to Section 11.611 •
(ii) New Evaluation of Punching Shear Tests by Herzog30
30 6 7 8 etc Herzog made a new evaluation of the earlier punching shear tests' '
and derived three empirical equations in order to determine the effectiveness
of shear reinforcement in the form of inclined bars, stirrups or shearheads.
For slabs without shear reinforcement Herzog30 considered the nominal
ultimate shear stress divided by the tensile strength of the concrete and
the relative yield force of the flexural reinforcement as the two principal
variables on which the punching shear strength of the slabs depended. The
nominal ultimate stress in punching shear on a critical section taken at a
distance d from the column face was given as
where
V u
✓r• C
= 2.64 + 0.00477 pf < 6.3 y
v = nominal ultimate shear stress u
f' = cylinder compressive strength of concrete C
p = ratio of area of tension reinforcement to
effective area of concrete
= yield stress of reinforcement
• • • (3.22)
For slabs with shear reinforcement in the form of inclined bars or

stirrups the efficiency of the shear reinforcement was calculated by the
formula
78
A f sin OJ V y
v• ••• (3.23)
where
~ = efficiency of shear reinforcement
Av r1
sin a = vertical component of the yield strength
of the actual shear reinforcement inclined
at an angle CJ with the horizontal
V' = difference between the measured ultimate
load and the punching resistance of the
slab calculated from Eq. (3.22), ignoring
the assistance of the actual shear
reinforcement
From the 57 evaluated punching tests618 •10131 •32 •33 ,34 on slabs with
shear reinforcement ·Herzog found that the efficiency given by Eq. (3.23)
could be taken as 39% with an unsatisfactory accuracy, the coefficient of
variation amounting to 49.5%. Nevertheless, the punching load can be
predicted sufficiently accurately with a coefficient of variation of 18.1%.
It was found possible to increase the resistance to punching by 62% by
providing shear reinforcement in the form of inclined bars or stirrups.
For slabs with shearheads, the calculated punching resistance, ignoring
the assistance of the actual shearheads; was obtained from Eq. (3.22), and
subtracted from the measured ultimate load. The resulting difference,
multiplied by the unsupported length of the shearhead arm measured from the
column face and divided by the sum of the plastic moments of all shearhead
arms, was taken as the efficiency of the shearhead.
Herzog showed that the results of 16 punching tests by Corley and
Hawkins28 could be represented by the following formula
V' L . C
Tl = ~ = p
L . 0.05 + o.6 ( "ff - 2.2) ••• (3.24)
where
V1 = difference between the measured ultimate load
and the punching resistance of the slab
calculated from Eq. (3.22), ignoring the
assistance of the actual shearheads
Lc = length of shearhead arm measured from the
column face
Em = sum of the plastic moments of all sheahead arms p
h = depth of steel shapes in shearhead
The coefficient of variation for the efficiency of the shearhead was
25.9% for these 16 test results. The punching load could be predicted
with a coefficient of variation of 5.9%. In the foregoing tests it was
found possible t.o increase the punching resistance by 68% by providing
shearheads.
(iii) Discussion of Effectiveness of Shear Reinforcement
The main purpose of shear reinforcement in slabs is to increase the
resistance to punching sufficiently in order to secure full utilisation
of the flexural capacity of the slabs. It is also necessary to know the
effectiveness of various systems of shear reinforcement in relatively
thin slabs. The P.C.A. Test 19 has successfully demonstrated that closed
79
stirrups may be regarded as fully effective shear reinforcement. The ACI
Building Code (318-71) 13 recommends shear reinforcement in the form of bars
as 100% effective in .slabs of any thickness, provided the shear reinforcement
is adequately anchored. The effectiveness of this type of shear
reinforcement is yet to be proved in slabs thinner than 7½ in. which was
the thickness of the P.C.A. test specimen.
Herzog•s30 finding that shear reinforcement in the form of bent bars
or stirrups is only 39% effective in slabs may be attributed to the results
of punching shear tests of many slabs6 ,8,31 with inadequately anchored shear
reinforcement. This will also explain the large coefficient of variation
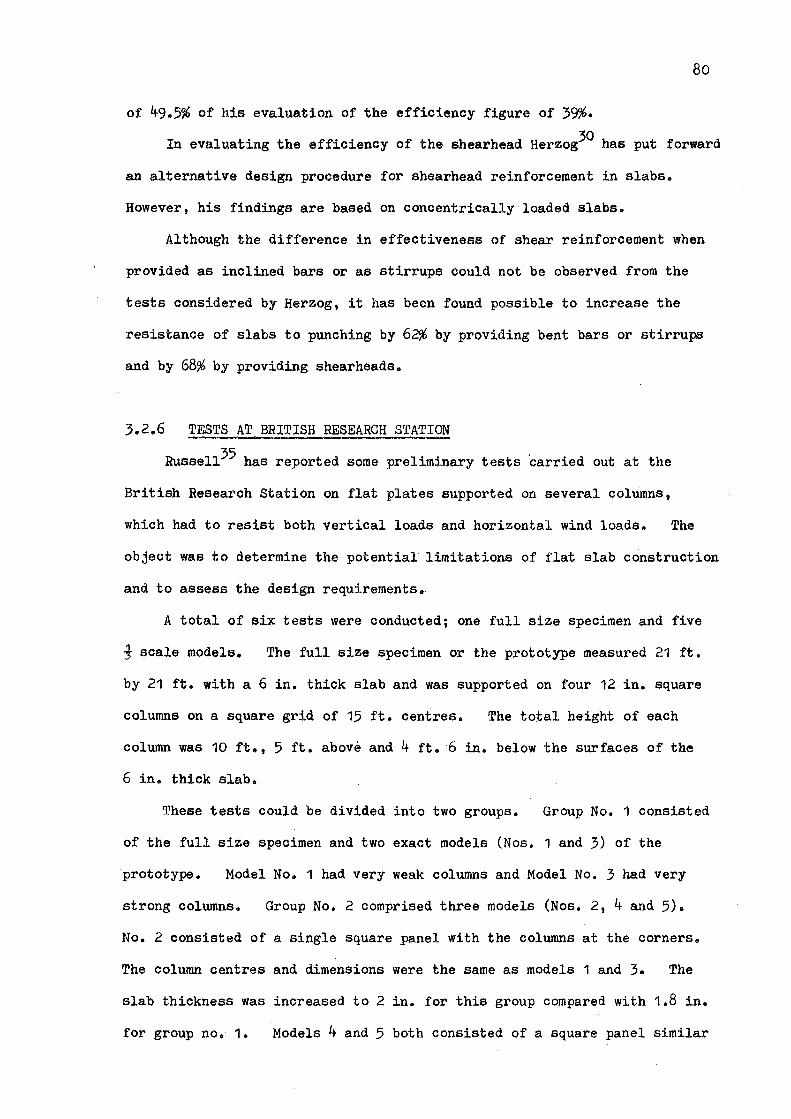
80
of 49.5% of his evaluation of the efficiency figure of 39%.
In evaluating the efficiency of the shearhead Herzog30 has put forward
an alternative design procedure for shearhead reinforcement in slabs.
However, his findings are based on concentrically loaded slabs.
Although the difference in effectiveness of shear reinforcement when
provided as inclined bars or as stirrups could not be observed from the
tests considered by Herzog, it has been found possible to increase the
resistance of slabs to punching by 62% by providing bent bars or stirrups
and by 68% by providing shearheads.
3.2.6 TESTS AT BRITISH RESEARCH STATION
Russe1135 has reported some preliminary tests carried out at the
British Research Station on flat plates supported on several columns,
which had to resist both vertical loads and horizontal wind loads. The
object was to determine the potential limitations of flat slab construction
and to assess the design requirements.
A total of six tests were conducted; one full size specimen and five
J scale models. The full size specimen or the prototype measured 21 ft.
by 21 ft. with a 6 in. thick slab and was supported on four 12 in. square
columns on a square grid of 15 ft. centres. The total height of each
colwnn was 10 ft., 5 ft. above and 4 ft. 6 in. below the surfaces of the
6 in. thick slab.
These tests could be divided into two groups. Group No. 1 consisted
of the full size specimen and two exact models (Nos. 1 and 3) of the
prototype. Model No. 1 had very weak columns and Model No. 3 had very
strong colwnns. Group No. 2 comprised three models (Nos. 2, 4 and 5).
No. 2 consisted of a single square panel with the colwnns at the corners.
The column centres and dimensions were the same as models 1 and 3. The
slab thickness was increased to 2 in. for this group compared with 1.8 in.
for group no. 1. Models 4 and 5 both consisted of a square panel similar
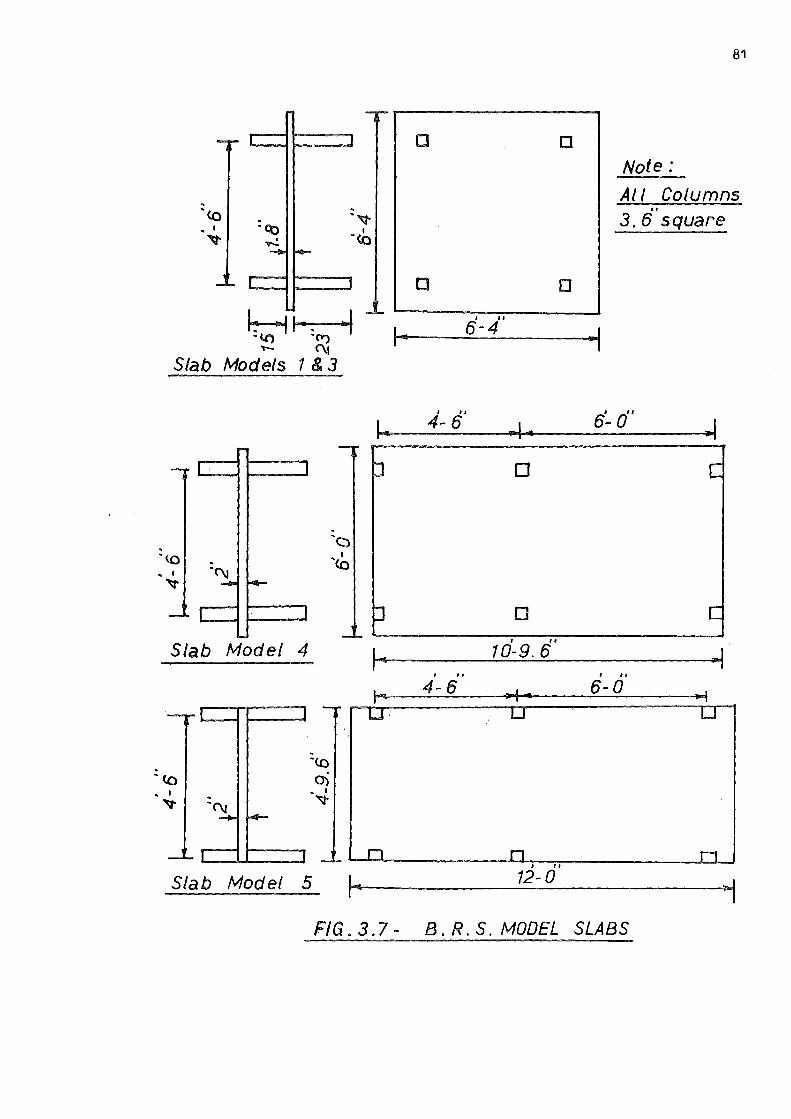
Hi-. ~ • lr) ·rr, ._ C'\I
Slab Models 1 & 3
Slab Model 4
-(Q
0) • I
"l:;t-
I~
f ...
t1
• •
• • I II
6-4
I II
4-6
•
• I II
10-9. 6 I " 4-6 ;s,f d
I II
,
81
Note:
Al I Columns 3. tf'square
6~ o··
I " 6-0 .... ,
Slab Model 5 """'~ ______ 12_-_0 ______ ~~,
FIG. 3. 7 - B. R. S. MODEL SLABS

82
to slab 2 with an adjoining rectangular panel. The column centres and
dimensions of models 4 and 5 were the same but the locations of the slab
edge with respect to columns differed.
given in Fig. 3.7.
The details of the specimens are
All specimens were subjected to three sets of loads - a uniformly
distributed load on the slab, a vertical axial load on the column and a
horizontal load on the column.
The prototype was designed for ultimate loads of 87 psf dead load,
200 psf imposed load and 3035 lb/column wind load on the basis of a collapse
mechanism consisting of two parallel yield lines across the slab - a
negative yield line directly above the leeward supports and a positive
1 yield line on the windward side of the centre line. Failure did not take
place at these loads. The cracks tended to be parallel to the faces of
the columns or to radiate out from them in a manner resembling fan mechanism
but none of the cracks extended the full width of the slab. Further
increase in the loads caused local failure around the columns and the
collapse mechanism consisted of a punching failure on two sides of the
column.
In order to determine the punching shear strength of the prototype two
punching shear slabs measuring 7 ft. square and 6 in. thick with a 12 in.
square column in the centre of the slab were tested. The arrangement of
the reinforcement was identical to the negative reinforcement in the column
strip of the prototype. In punching slab no. 1 the load was applied
axially to the column and the ultimate load of punching was in close
agreement to that predicted by the empirical Ultimate load equations6 ,819110 ,
11 for punching shear strength of concentrically loaded slabs. In punching
slab no. 2 an axial force and a bending moment in the N-S direction were
applied through the upper column and an axial force and bending moments
in both N-S direction and E-W direction were provided at the lower columns.
The collapse mechanism and ultimate loads of the punching slab no. 2 and the

prototype were very similar.
In all but one of the tests the models failed by punching around the
columns, usually on one or two sides but never on four sides. Model 1 failed
in flexure because the columns were undersized for the ultimate bending
moment.
Their tests show that it is possible for flat slab construction to
resist combined vertical and horizontal loads but the omission of lateral
bracing may lead to a very flexible structure and deflections could be
excessive. No design recommendation was put forward for slab-column
junctions transmitting both moment and shear.
From their tests it is also evident that the failure patterns and
the ultimate loads of isolated slab-column tests are similar to those of
multi-panel flat plate structures.
SEISMIC RESISTANCE OF FLAT PLATES
Tsuboi and Kawaguchi36 carried out experimental studies to study the
behaviour of flat slabs under column top moments. Their 100 cm. square
3 cm. thick slabs contained centrally located 20 cm. square column stubs.
Monotonously increasing and reciprocally repeated moment loadings were
applied through the column stub while two opposite slab edges were supported
and the other two edges left free. Three of the nine specimens were made
of plain mortar but the other six slabs had varied distribution of reinforce
ment, the total amount of which was constant in all six specimens. They
found that the distribution of longitudinal reinforcement affected the
punching shear resistance around the column and repeated load reduced the
punching shear resistance. The concept of effective width was found to be
useful for the practical desigp of flat slabs and from test results they
obtained the effective width to be equal to 0.58 to o.61 of the side
dimension of the square slabs in the elastic state.
None of their specimens contained any form of shear reinforcement.

84
They did not propose any theoretical procedure for calculating the ultimate
strength of slab-column connections.
CONCLUSIONS
For flat plate-column junctions without shear reinforcement transferring
moment and shear, Di Stasio and Van Buren•s14 working stress design method
gives a factor of safety greater than 2 when compared with the tests
8 16 reported by Moe , and Hanson and Hanson •
The methods recommended by Moe8, ACI Committee 32612 and ACI Committee
31813 ,23 predict the ultimate strengths of the test specimens8' 16 with a
varying degree of safety and this variation is primarily due to adoption
of a constant value of K by each of these methods. Factors such as
moment to shear ratio, relative stiffness of the column and the slab and
the flexural capacity of the slab are likely to influence the proportion of
moment transferred by shear stresses. These methods are good design tools
but cannot be regarded as true ultimate strength design procedures.
20 Hawkins and Carley's ultimate strength method gives more accurate
results than the previous methods. However, their method needs some
modifications and in its present form it is too involved to be used as a
design method.
Very little is known from the existing literature about the method of
design for flat plate to column connections with shear reinforcement
transferring moment and shear. More investigations are needed to assess
their design requirements and to determine the effectiveness of various
forms of shear reinforcement in preventing punching shear failures.
Seismic resistance of flat plate to column junctions with or without
shear reinforcement needs to be examined in respect of ductility available
at the junctions and loss in load carrying capacity due to reversal of
applied bending moments.
SUMMARY
EXPERIMENTAL STUDY OF INTERIOR FLAT PLATE-COLUMN CONNECTIONS
A series of eight tests were conducted on half scale models of
reinforced concrete interior flat plate-column specimens under combined
vertical and lateral loadings. Three specimens were without any shear
reinforcement at the slab-column junctions while the remaining five
contained various shear reinforcement arrangements. The results
presented include the experimental failure loads, modes of failure,
load deflection graphs, stresses in slab bars and shear reinforcement
and the ductility available at junctions with or without shear reinforce
ment, particularly under seismic loading conditions.
INTRODUCTION
In recent years, with the increase in the popularity of flat plate
concrete structures as a structural system, there is a growing need for
experimental study of the ability of flat plate-column junctions to
transfer moment and shear, particularly under earthquake loading conditions.
The objects of this experimental study are threefold.
Firstly, more test results are sought to substantiate the existing
theories and the theory presented in Section 3.4 on the strength of slab
column junctions transferring moment and shear.
Secondly, tests are required to be carried out to find methods of
increasing the shear strength of junctions by using various reinforcement
arrangements in the form of. bars or structural steel sections. These
tests will enable one to determine the effectiveness of -various types of
shear reinforcement and to develop a guide to their design provisions.
Thirdly, there is a lack of information on the seismic resistance of
86
slab-column junctions with or without shear reinforcement. The deterioration
of the load carrying capacity due to reversal of bending moments and the
ductility that is available at such junctions require a close examination.
Tests need to be conducted to study these aspects of slab-column junctions
under seismic loading conditions.
In order to fulfil these objectives a series of eight tests were
conducted on half scale models of reinforced concrete interior flat plate
column specimens under combined vertical and lateral loadings. Three of
the specimens designated as 1 , 2 and 3C did not contain any shear
reinforcement while the remaining five specimens designated as 4s , 5S 9
6CS, 7CS and Bes had various arrangements of shear reinforcement at the
slab-column junctions in the form of inclined cranked bars, shearheads
fabricated from structural steel shapes and vertical closed stirrups.
Reversals of loa~ing simulating earthquake effects were applied to the
specimens identified by .the letter C following their numbers. The
letter S indicates the specimens with shear reinforcement.
~ detailed description of the material properties, test equipment and
testing procedure used in these tests is given in Appendix B.
3.3.2 DESIGN OF TEST SPECIMENS
(i) Selection of Test Specimen
The test specimens are intended to represent half scale models of an
interior column and the surrounding slab, which form part of a multistorey
flat plate structure, shown shaded in Fig. 3.8(a). The deformed shape
of the structure under vertical and horizontal loadings is shown in Fig.3.8(b).
An isolated view of the internal slab-column junction unqer consideration
is shown in Fig. 3.8(c). An imposed horizontal displacement, A, induces
horizontal and vertical reactions H and X respectively. In Fig. 3.8(d)
the entire slab~column junctior has been rotated until the two column
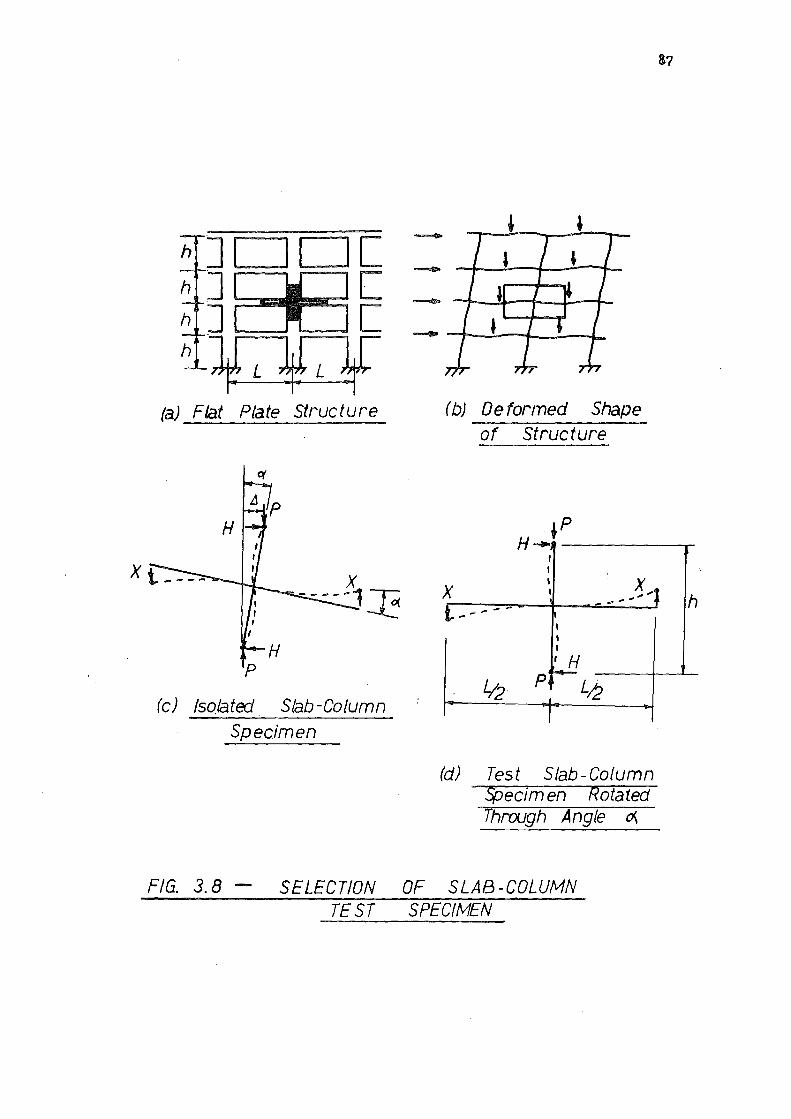
{a) Flat Plate Structure
C(
H p
(c} Isolated Slab-Column
Specimen
( b) De formed Shape
of Structure
I X I . X --i ..... h r----:-:::-:=---+----....-::..:-::..:--=--J l.--,,.------ ' I I I
~• H -l/;2• p L ' t2 I
(d} Test Slab-Column Specimen Rotated Through Angle ~
FIG. 3.8 - SELECTION OF SLAB-COLU/v/N TE ST SPECIMEN
88
inflection points are on the same vertical line, giving a more convenient
orientation for testing purposes. The colunm axial load P represents
the loading due to the weight of the building above the particular junction
as well as due to the overturning moment on the structure. The vertical
load, X, applied at the ends of the slab and the reactive lateral
loads, H, induced at the ends of the column represent the forces applied
by the lateral loading.
The test specimens have been selected on the basis of Fig. 3.8(d) which
is assumed to simulate the behaviour of the real structure.
(ii) Discussion of Method of Loading
The longitudinal plan dimensions of the slab surrounding the interior
column are chosen to coincide with the points of contraflexure, which are
assumed to be located at 0.5 L from the column centre line, where L
denotes the span between columns. In the actual test of the specimens the
upward and downward vertical forces X of Fig. 3.8(d) were applied at the
two opposite ends of the slab. These loads were applied along the edge by
equal and opposite edge displacements. Elastic analysis37 ,41 shows that
internal actions resulting from the applied moment at the slab-column junction
are confined to a localised portion of the slab in the vicinity of the
column and are not greatly influenced' by the outer boundary conditions of
the floor plate. Thus the test results are unlikely to be influenced by
the exact manner of application of theloads at the midspan region of the
slab. The equal and opposite edge displacements consisted of either line
loads applied along the whole width of the slab edges or point loads applied
to the edges through several loading points. In testing specimen 1 line
loads were used (vide Appendix B) but owing to difficulties in spreading
the load uniformly across the entire slab width this method was abandoned
in all subsequent tests. Instead the slab edges were loaded by four equal
point loads in the remaining tests (vide Appendix B).
(iii) The Prototype Structure
The prototype structure on which the test specimens were modelled waa
chosen as representative of a flat plate structure with design loads and
dimensions as used for multistorey apartment buildings. The prototype
consisted of 18 in. square columns at 20 ft. centres on a square grid with
interstorey heights of 10 ft. The slab was designed as an interior flat
plate floor with a service live load of 60 lb/ft2 and a dead load of
87.5 lb/ft2, giving a total service load of 147.5 lb/ft2• The material
strengths used in the design of the slab by the ultimate strength design
method were a concrete cylinder strength of 4,ooo lb/in2 and a steel yield
stress of 4o,ooo lb/in2•
The slab thickness of the prototype was found to be 7 in. and the
following spacings of¾ in. diameter bars were required in each direction:
Column Strip Middle Strip
Top
Bottom
7 in.
14 in.
14 in.
14 in.
In the prototype it was necessary to use¾ in. diameter bars so that
the reduction in scale to the test specimens, in which i in. diameter
deformed bars were used, could be made directly. Otherwise it would not
have been possible to use deformed bars in the test specimens as deformed
bars are not available in smaller diameters than¾ in. in New Zealand.
(iv) Details of Test Specimens
As the test specimens were half scale models of the prototype structure
the overall depth of the model slab became .3½ in. and the size of the column
was reduced to 9 in. x 9 in. with the height as 5 ft. The reinforcement
required for the column strip in the prototype was used as the general
reinforcement pattern in all the test specimens. This resulted in! in.
diameter deformed bars spaced at~ in. centres in the top and at 7 in.
centres in the bottom in each direction.
90
The column was reinforced with eight¾ in. diameter deformed bars which
were necessary to make the ultimate flexural capacity of the column greater
than that of the slab. This ensured that any failure would occur in the
slab and not in the column. Ties made of¾ in. diameter plain bars spaced
at 8 in. centres were used in the column outside the slab region.
Since the test specimens were subjected to an unbalanced moment in one
direction only, the side of the slab transverse to the direction of bending
was condensed to 3/4th of its length for the sake of ease in handling the
specimens in the laboratory as well as reducing the size of the test rig.
The overall size of the slab-column specimens became 10 ft. x 7 ft. 6 in.
in plan with the height of the column as 5 ft. The details of the specimen
dimensions and the basic reinforcement pattern used in.all the eight tests
are shown in Fig.ii. ·3.9 and 3.10.
The details of reinforcement at the slab-column joint regions of the
specimens were as follows:
Specimen Nos. 1 , 2 and 3C
Fig. 3.11 shows the details of reinforcement at the slab-column junctions.
These three specimens did not contain any shear reinforcement at the slab
column junctions.
Specimen No. 4s
This specimen was provided with shear reinforcement in the form of
4 Nos.¾ in. diameter inclined cranked bars placed in each direction.
The details are shown in Figo 3.12. The design was based on shear stresses
computed by the method of ACI 318-71 for a combined vertical load of 8040 lb.
and the ultimate flexural capacity of 527,000 lb.in. The vertical load
represented the prototype dead load and a live load of 20 lb/ft2 • The
ultimate flexural capacity was then arrived at by considering the yield-line
pattern A1 shown in Fig. 3.82. The cranked bars were provided with
sufficient anchorage lengths according to the ACI 318-71 B~ilding Code.
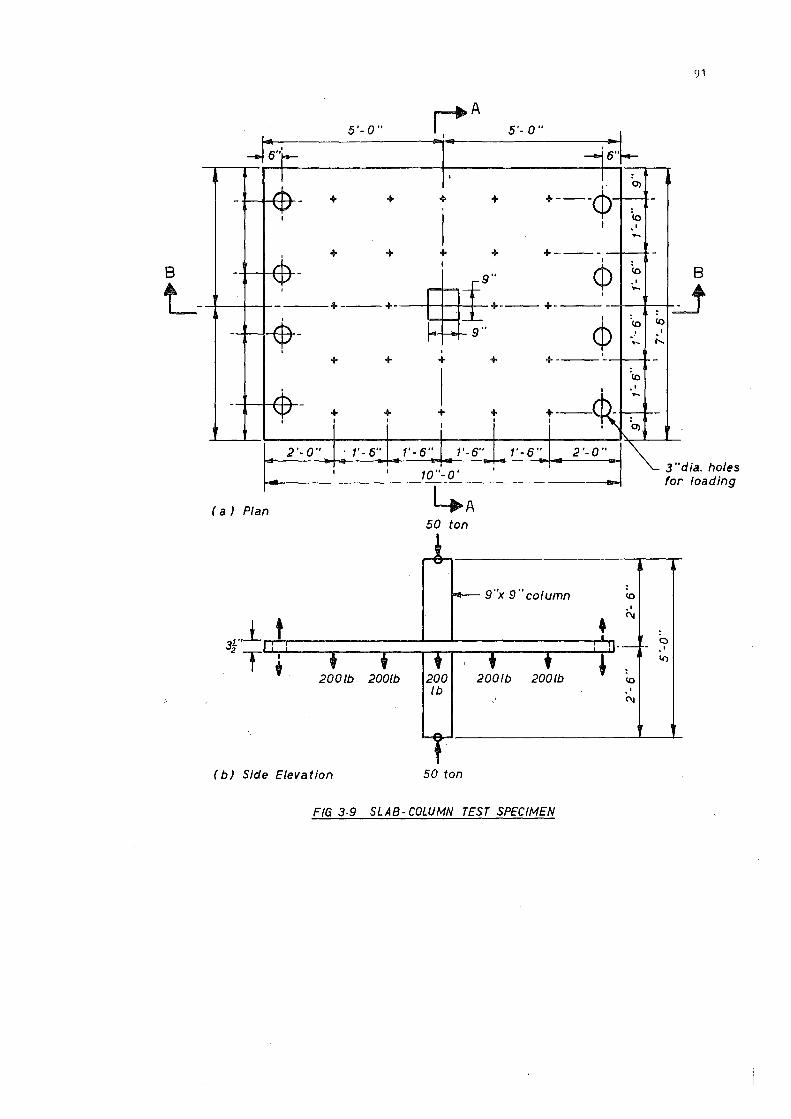
5'- 0" r+A
I 5'- O"
,· + + + + +---(1)
+ + + + +----I
8
L- --------.+-
9" <P +---+- +·-- +·
I I
-t- 9" cp I
+ + + + +·--'-
I + + + + I I
2'-0" · 1'-6" 1'-6" 1'-6" 1' - 6" ' 10"-0'
(a) Plan 50 ton
9"x 9 "column
3L"__t_,..... ________ _,__~----------,........, 2T
( b) Side Elevation 50 ton
FIG 3.9 SLAB- COLUMN TEST SPECIMEN
Co I -
<o ·' .....
"<o ! ....
"<o
<o
: <o
,-.....
91
8
J
J"dia. holes for loading
C) I
LC)
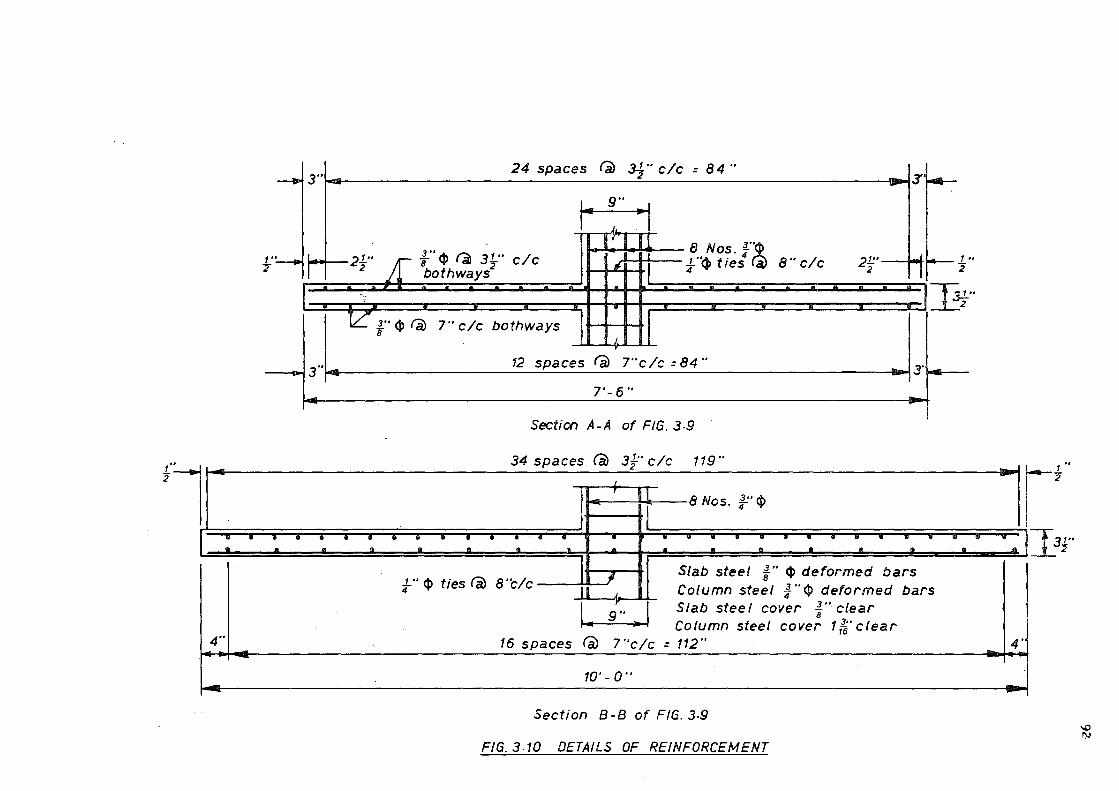
__.., 3"
2 ·~I
I --
3"
-
fl -
. • . . • .. - -
4··
24 spaces (a) 3-f"c/c=84" - 3' ~ -, .. 9"
--1 1, V
8 Nos I'~ 3 .. 1.."<)ti~s
4 B"c/c 21:.· 'i---1..· 21-.. /2 a ¢ (a) 3}" c/c 1$ 2 I 2 2 bothways 4
- - - - - - . ~f
- - , - . .... ... - - - A - - - . .
LL'." 3" ¢ fa) 7" c/c bothways 8
1
12 spaces (a) T'c/c =84" - 3· -
7'-6" -
Section A-A of FIG. 3-9
34 spaces (a) 3f"c/c 119" ~
I , - 8 Nos. J:'<1>
• . . .. .. . • . . • . . . . . . - . .. . - . . . a - . .. - . . . - . a .. II
I Slab steel f' <1> deformed bars .1.." <1> ties (a) I , 4 8 "c/c ¾ .. <1> deformed bars II Column steel
-1-.- ..... I .. ; .... I Slab steel cover r· clear
Column steel cover 1 Ii' clear 16 spaces (a) 7 "c/c = 112"
10'-0"
Section 8-B of FIG. 3-9
FIG. 3-10 DETAILS OF REINFORCEMENT
--
" . JII
4·
r½ I3r
~ ry

93
9,, -
Cover 11-" - r 4 ,...__ 11.." Cover 16 16
L
- 8 Nos. !'° 4) bars
' ..!. " <I> 4
ties (i) 8" c/c 3" ! i Cover if¾ "ct> Ci 3.L'"
2 c/c bothways
.. ~~ . .. .. Ill f . T
~I'- I ,._ .. .. 'I A
'3 .. 8 Cover \J_f'~(a)
tA . tA Al ,.
(a) Slab-Column Junction
9"
I I 17" I I
~ 2"~ 2"!---1!!.."-----· I I --- t2-" 16 16
Ji110 ~.,...
r 4' ties (a> 8" C/C ---4--!..§_'-' --M 16
3" 8Nos. 4 ~
11!.' 16
11!.' 16
0)
( b) Section A-A Column Cross Section
-"'
•
7" C /c bothways
FIG. 3.11 DETAIL OF JOINT WITHOUT SHEAR REINFORCEMENT
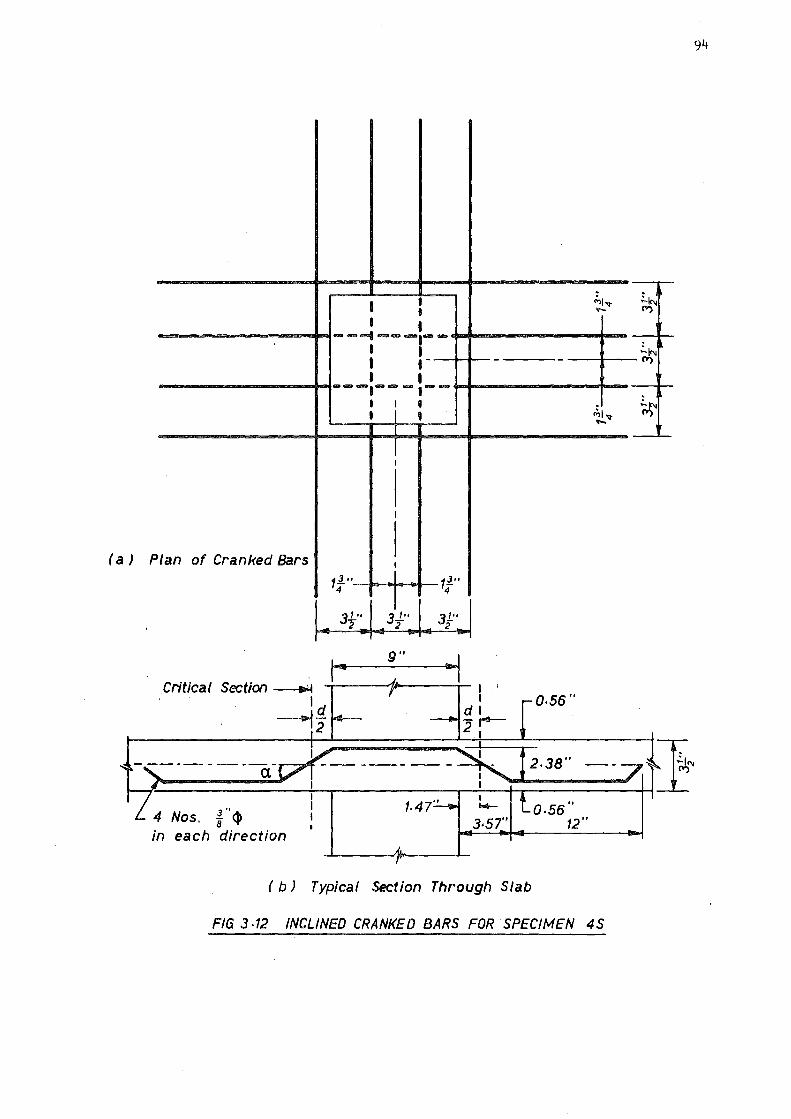
i I
• I I -----1---,---I I I 8 - -I I ---,---.--I I • I 9
I
I I
( a J P Ian of Cranked Bars I I
11." 4
11_ .. 4
3L" J-1" 31" - 2 2 2 -
.Critical Section ---..i ___ _,,,,, ___ -.-- 1 ;
1d d: ------' - - ,--12 2 I
a.
3 .. 4 Nos. 8 <)
1.47''
in each direction
-
0,56"
2,38"
0.55" 12"
( b) Typical Section Through Slab
C:,1'1' -
;,1 'I' -
FIG 3-12 INCLINED CRANKED BARS FOR SPECIMEN 4S
94
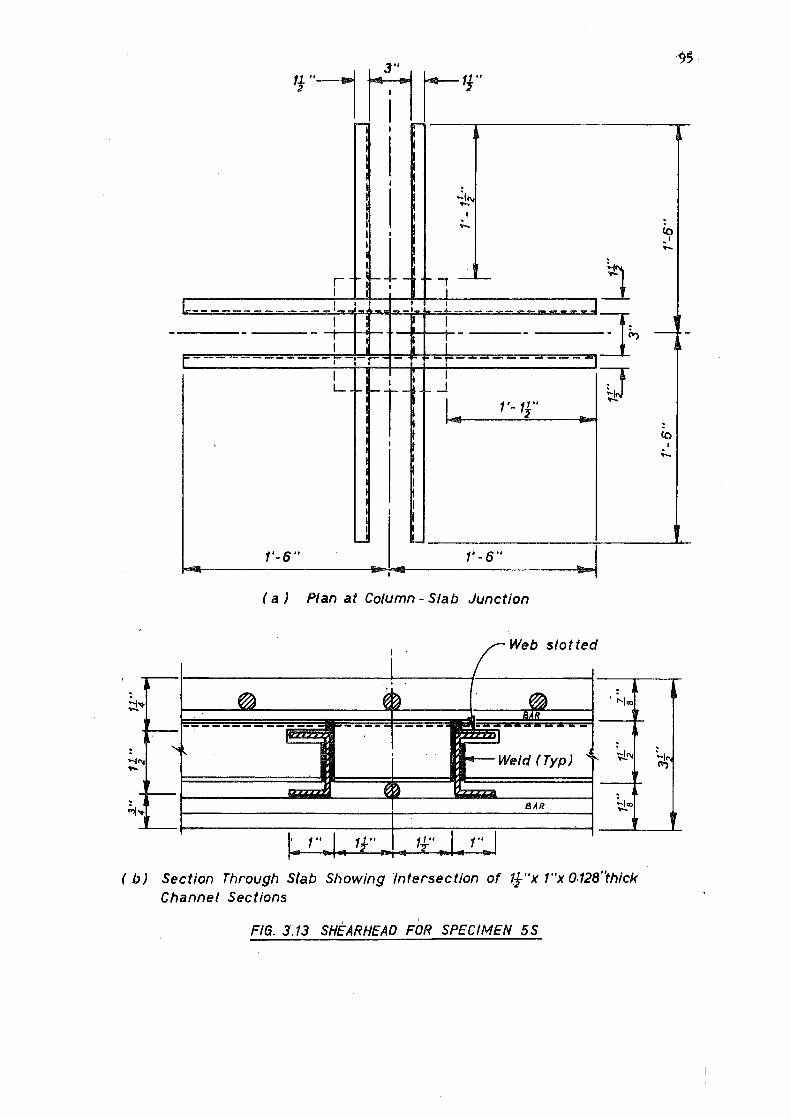
'f"I lt1 l'i" ri I - ---,--------------...-
: I h I I I
I I I ;..,
I I
~-------.....;...r_-_._ ....... t'"'" __ l+--~f----•~------------1 ... I I I I _: __ •_1 __ 1 __ :_L_ 1 --- . -- - _____ J
---------
I I
L --rl i I
I
I I
: I
I • I I I I I
... _J
I - 1' 11" - 2 J -
(0 I
;..,
I
- -•
(0 I .....
- -----------~-------'...__ 1'-6" 1' -6''
(a) Plan at Column - Slab Junction
Web slotted
~ , .. I ,,.. ,, .. I , .. I "' .. -:-- ... , • -;: .., ,. .,. ( b) Section Through Slab Showing ·intersection of 1f'x 1"x 0,128"thick
Channel Sections
FIG. 3'.13 SHEARHEAD FOR SPECIMEN 5S
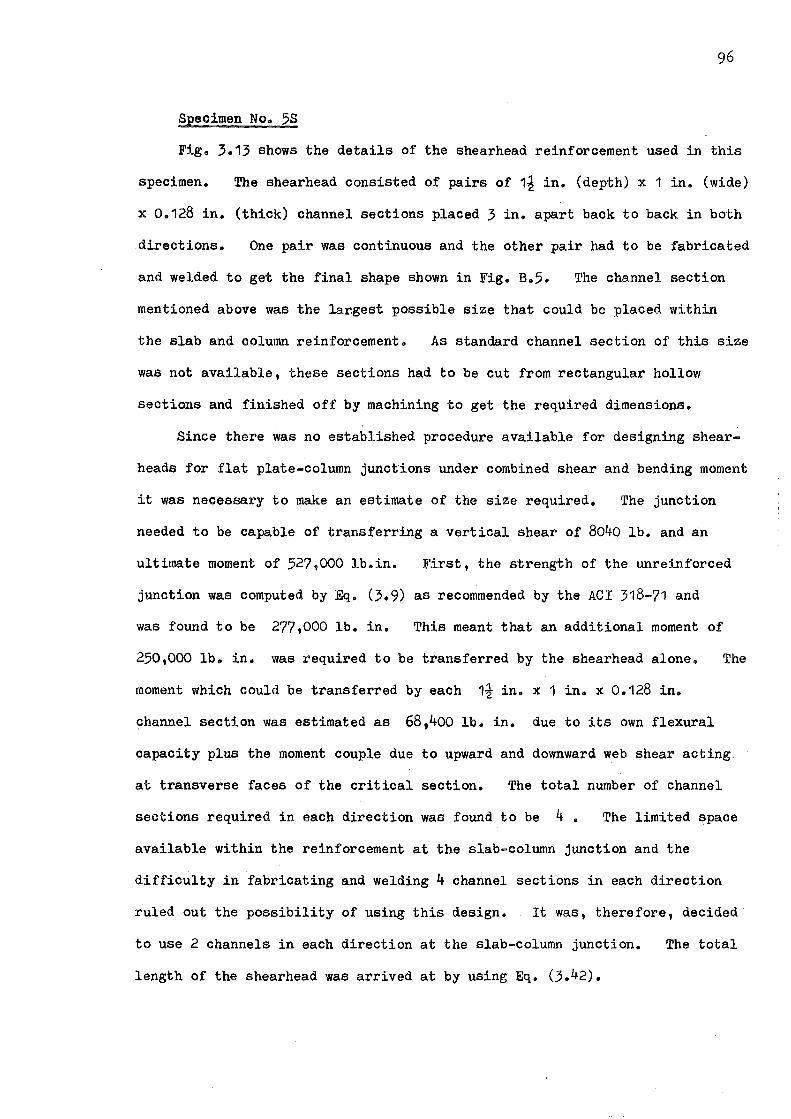
Specimen No. 5S
Fig. 3.13 shows the details of the shearhead reinforcement used in this
specimen. The shearhead consisted of pairs of 1i in. (depth) x 1 in. (wide)
x 0.128 in. (thick) channel sections placed 3 in. apart back to back in both
directions. One pair was continuous and the other pair had to be fabricated
and welded to get the final shape shown in Fig. B.5. The channel section
mentioned above was the lar.gest possible size that could be placed within
the slab and column reinforcement. As standard channel section of this size
was not available, these sections had to be cut from rectangular hollow
sections and finished off by machining to get the required dimensions.
Since there was no established procedure available for designing shear
heads for flat plate-column junctions under combined shear and bending moment
it was necessary to make an estimate of the size required. The junction
needed to be capable of transferring a vertical shear of 8040 lb. and an
ultimate moment of 527,000 lb.in. First, the strength of the unreinforced
junction was computed by Eq. (3.9) as recommended by the ACI 318-71 and
was found to be 277,000 lb. in. This meant that an additional moment of
250,000 lb. in. was required to be transferred by the shearhead alone. The
moment which could be transferred by each 1i in. x 1 in. x 0.128 in.
channel section was estimated as 68,400 lb. in. due to its own flexural
capacity plus the moment couple due to upward and downward web shear acting
at transverse faces of the critical section. The total number of channel
sections required in each direction was found to be 4. The limited space
available within the reinforcement at the slab-column junction and the
difficulty in fabricating and welding 4 channel sections in each direction
ruled out the possibility of using this design. It was, therefore, decided
to use 2 channels in each direction at the slab-column junction. The total
length of the shearhead was arrived at by using Eq. (3.42).

97
Specimen 6CS
For this specimen vertical closed type of stirrups consisting of 4 legged
3/16 in. diameter plain bars were used as shown in Fig. 3.14. The stirrups
enclosed 3 bars at top and 3 bars at bottom where it was necessary to provide
two additional bars. The maximum shear stress was calculated on the
critical section by using Eq. (3.9) of the method of ACI 318-71 due to a
combined shear of 8040 lb. and unbalanced moment of 527,000 lb. in. The
area of shear reinforcement was computed for nominal stresses in excess of
1/f1 psi. C
It was found that 4 legs of 3/16 in. diameter bars placed at a
spacing of 1½ in. centres met the necessary requirements. One additional
stirrup was placed within the column section on each face of the column.
Stirrups were provided up to a distance of half the span of the slab
measured from the column face.
Specimen No. 7CS
In this case the area and the extent of shear reinforcement was kept
the same as those used for specimen No. 6CS. Here 2 legged i in. diameter
plain bars were used in place of 4 legged 3/16 in. diameter bars. The
details are shown in Fig. 3.15.
Specimen No. Bes
As shown in Fig. 3.15. this specimen contained 2 legs of 3/16 in. diameter
plain bars at a spacing of 1i in. centres in each direction. The area of
shear reinforcement required was halved in this case in order to compare
its performance with specimen No. 6CS and ?CS.
TEST EQUIPMENT AND PROCEDURE
The test rig with a slab-column specimen in position is shown in
Fig. 3.16. The top and bottom ends of the column were grouted into steel
caps. The steel caps had semicircular grooves to accommodate steel pins
and the specimen was supported by placing the column vertically between
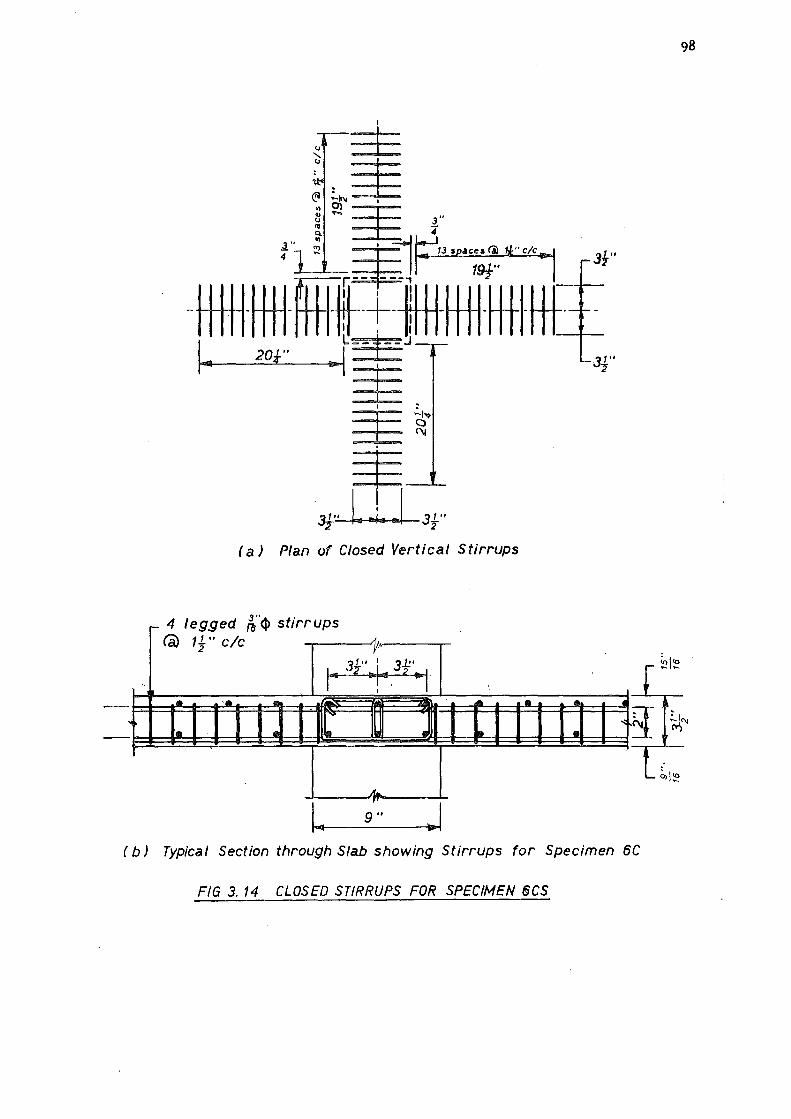
(a) Plan of Closed Vertical Stirrups
- 4 legged ,r<J> stirrups (a) 11" c/c ~
2 Y' 31" I 31!•
.. 1• l t. 2 • 1
' . .. .... . ,_ .. ' II[ JI ,_ • la.
il-,
I~ 9.,
... ..
..
31" 2
98
r ~I~ • ~;r ~
~
l~I~
( b) Typical Section through Slab showing Stirrups for Specimen 6C
FIG 3. 14 CLOSED STIRRUPS FOR SPECIMEN 6CS

!i. ~ ~. :Z:
~
{"<l> (a) 3-i" c/c bothways 7" 2 legged stirrups <a 1 f" c/c b(!thways
13 spaces ® 1-}"c/c = 19-}" 3,.
4
3,.
4
I- 13 spaces (a) 1] "c/c =
9"
Section Through Slab Showing Stir,:.up~-:::::;-~ < . Diameter of stirrups for Specimen 7 CS = :fi;in.
BCS ::.!....in 4
' '\
F/6 3.15 CLOSED STIRRUPS FOR SPECIMENS 7CS AND BCS
• ..-J .......,..._,-..
!:?
'° ~
100
FIG. 3.16 SLAB-COLUMN SPEC!fv/EN IN THE TEST RIG
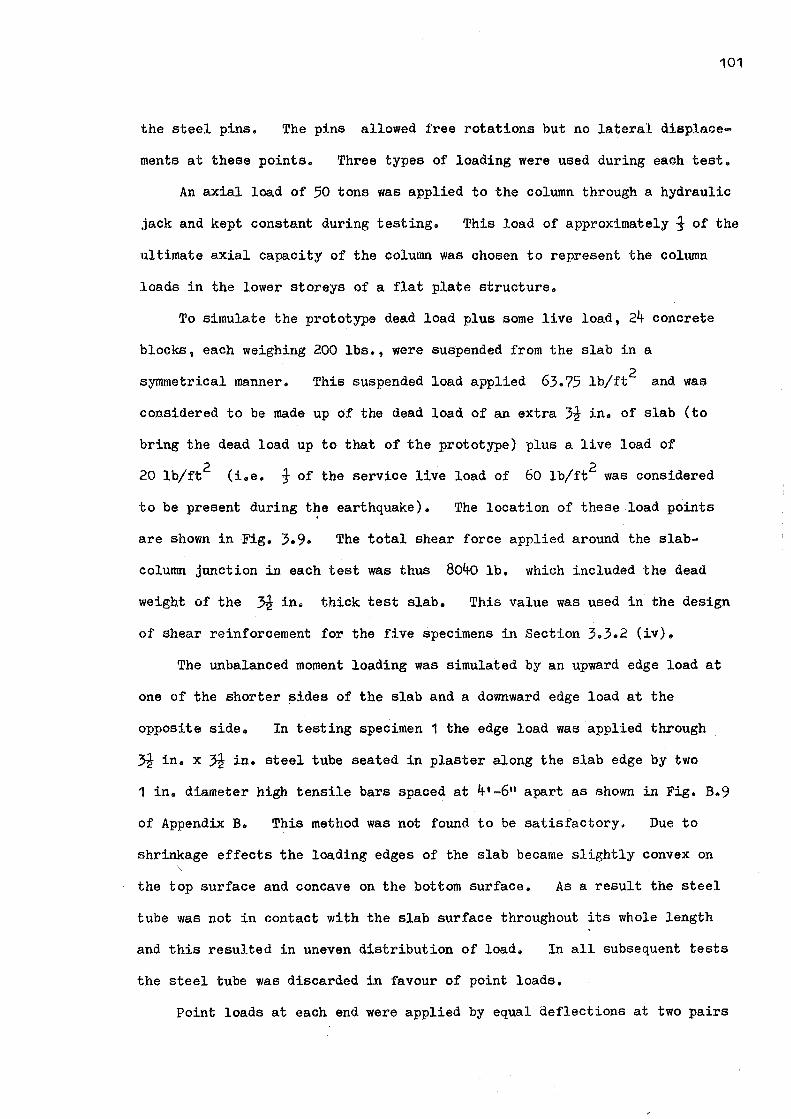
101
the steel pins. The pins allowed free rotations but no lateral displace-
ments at these points. Three types of loading were used during each test.
An axial load of 50 tons was applied to the column through a hydraulic
jack and kept constant during testing. This load of approximately 1 of the
ultimate axial capacity of the column was chosen to represent the column
loads in the lower storeys of a flat plate structure.
To simulate the prototype dead load plus some live load, 24 concrete
blocks, each weighing 200 lbs., were suspended from the slab in a
symmetrical manner. This suspended load applied 63.75 lb/ft2 and was
considered to be made up of the dead load of an extra 3½ in. of slab (to
bring the dead load up to that of the prototype) plus a live load of
20 lb/ft2 (i.e. f of the service live load of 60 lb/ft2 was considered
to be present during t~e earthquake). The location of these load points
are shown in -Fig. 3.9. The total shear force applied around the slab-
column junction in each test was thus 8040 lb. which included the dead
weight of the ~ in. thick test slab. This value was used in the design
of shear reinforcement for the five specimens in Section 3.3.2 (iv).
The unbalanced moment loading was simulated by an upward edge load at
one of the shorter sides of the slab and a downward edge load at the
opposite side. In testing specimen 1 the edge load was applied through
~ in. x ~in.steel tube seated in plaster along the slab edge by two
1 in. diameter high tensile bars spaced at 4•-611 apart as shown in Fig. B.9
of Appendix B. This method was not found to be satisfactory. Due to
shrinkage effects the loading edges of the slab became slightly convex on
the top surface and concave on the bottom surface. As a result the steel
tube was not in contact with the slab surface throughout its whole length
and this resulted in uneven distribution of load. In all subsequent tests
the steel tube was discarded in favour of point loads.
Point loads at each end were applied by equal deflections at two pairs
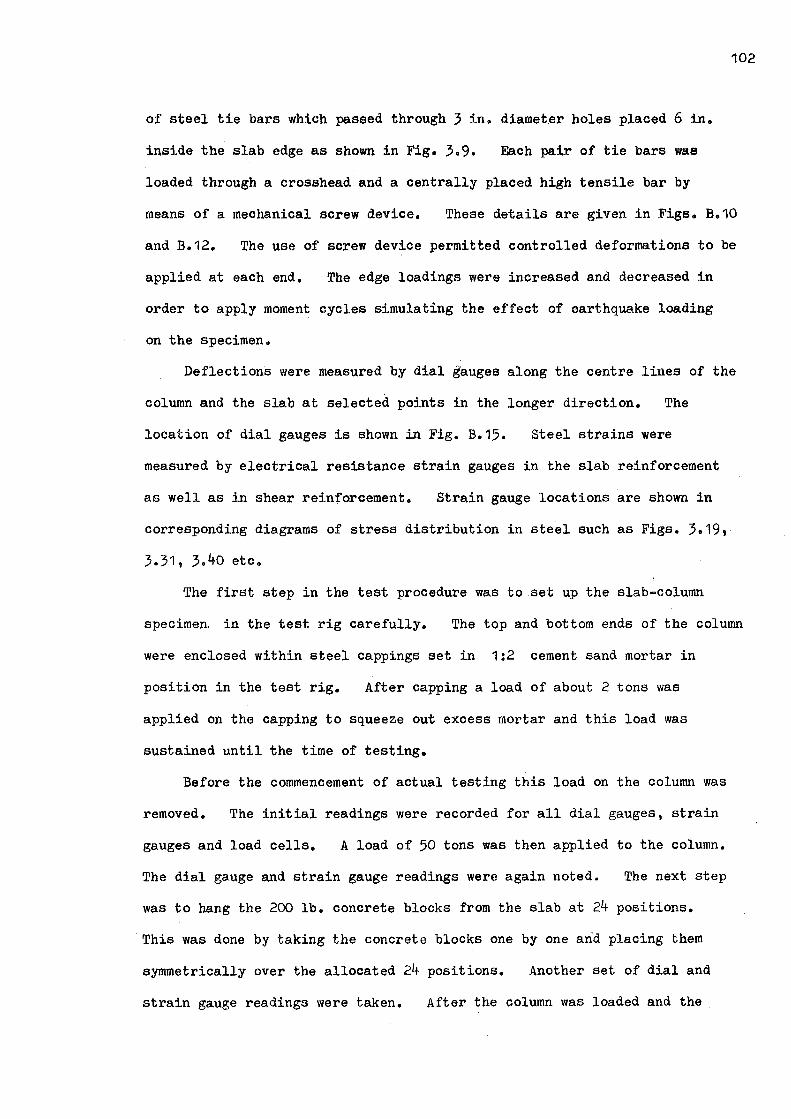
of steel tie bars which passed through 3 in. diameter holes placed 6 in.
inside the slab edge as shown in Fig. 3.9. F.ach pair of tie bars was
loaded through a crosshead and a centrally placed high tensile bar by
102
means of a mechanical screw device. These details are given in Figs. B.10
and B.12. The use of screw device permitted controlled deformations to be
applied at each end. The edge loadings were increased and decreased in
order to apply moment cycles simulating the effect of earthquake loading
on the specimen.
Deflections were measured by dial gauges along the centre lines of the
column and the slab at selected points in the longer direction. The
location of dial gauges is shown in Fig. B.15. Steel strains were
measured by electrical resistance strain gauges in the slab reinforcement
as well as in shear reinforcement. Strain gauge locations are shown in
corresponding diagrams of stress distribution in steel such as Figs. 3.19,
3.31, 3.40 etc.
The first step in the test procedure was to .set up the slab-column
specimen. in the test rig carefully. The top and bottom ends of the column
were enclosed within steel cappings set in 1:2 cement sand mortar in
position in the test rig. After capping a load of about 2 tons was
applied on the capping to squeeze out excess mortar and this load was
sustained until the time of testing.
Before the commencement of actual testing this load on the column was
removed. The initial readings were recorded for all dial gauges, strain
gauges and load cells. A load of 50 tons was then applied to the column.
The dial gauge and strain gauge readings were again noted. The next step
was to hang the 200 lb. concrete blocks from the slab at 24 positions.
This was done by taking the concrete blocks one by one and placing them
symmetrically over the allocated 24 positions. Another set of dial and
strain gauge readings were taken. After the column was loaded and the
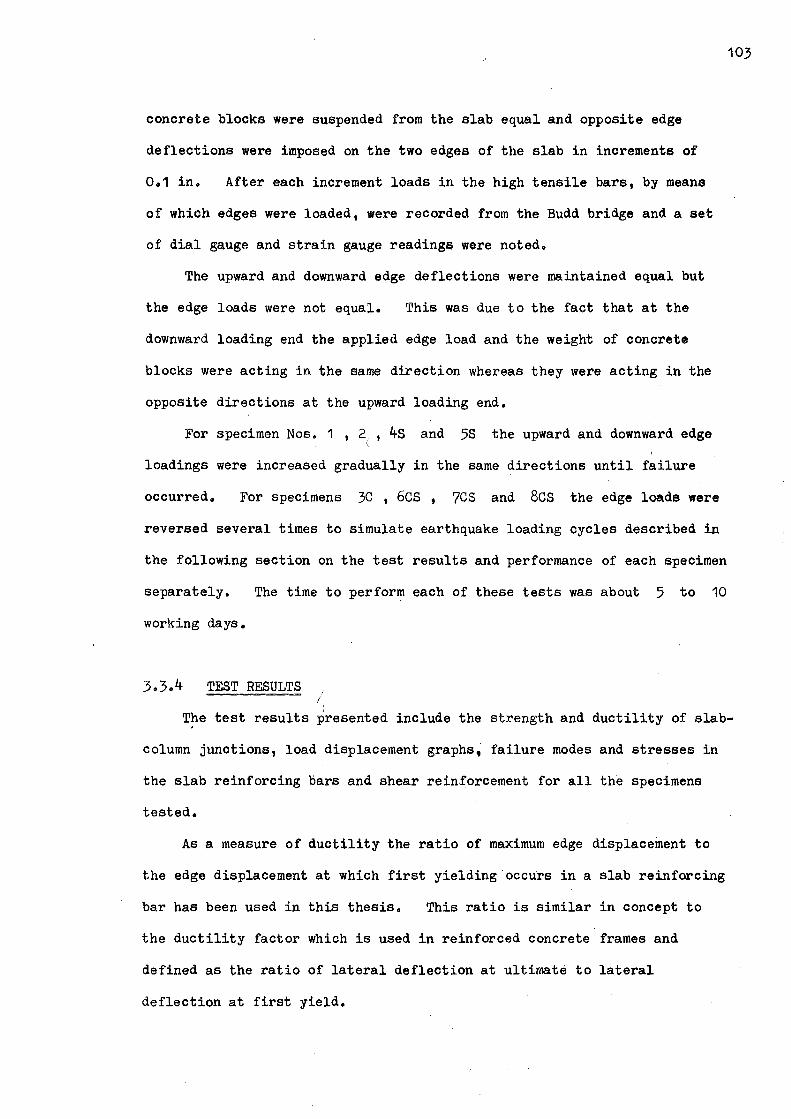
concrete blocks were suspended from the slab equal and opposite edge
deflections were imposed on the two edges of the slab in increments of
0.1 in. After each increment loads in the high tensile bars, by means
of which edges were loaded, were recorded from the Budd bridge and a set
of dial gauge and strain gauge readings were noted.
The upward and downward edge deflections were maintained equal but
the edge loads were not equal. This was due to the fact that at the
downward loading end the applied edge load and the weight of concrete
blocks were acting in the same direction whereas they were acting in the
opposite directions at the upward loading end.
For specimen Nos. 1 , 2(, 4s and 5S the upward and downward edge
loadings were increased gradually in the same directions until failure
occurred. For specimens 3c , 6cs , ?CS and 8cs the edge loads were
reversed several times to simulate earthquake loading cycles described in
the following section on the teat results and performance of each specimen
separately.
working days.
The time to perform each of these tests was about 5 to 10
3.3.4 TEST RESULTS 1
(
103
T~e test results presented include the strength and ductility of slab-
column junctions, load displacement graphs, failure modes and stresses in
the slab reinforcing oars and shear reinforcement for all the specimens
tested.
As a measure of ductility the ratio of maximum edge displacement to
the edge displacement at which first yielding occurs in a slab reinforcing
bar has been used in this thesis. This ratio is similar in concept to
the ductility factor which is used in reinforced concrete frames and
defined as the ratio of lateral deflection at ultimate to lateral
deflection at first yield.

104
(i) Description of Loading Cycle
In testing specimens 1 , 2, 4s and 5S monotonously increasing bending
moment was applied. The specimens 3C, 6CS, 7CS and 8cs were subjected
to several cycles of bending moment reversals. The loading cycle used for
specimen 3C is shown in Fig. 3.29. This loading sequence was not intended
to simulate any particular earthquake but it was rather regulated by the
edge displacements to generate elastic and post-elastic loading history.
Fig. 3.49 shows the loading cycle used for specimens 6cs, 7CS and
8CS , all of which contained shear reinforcement. Edge displacements
imposed on these specimens were considerably larger than those used for
specimen 3C which was without any shear reinforcement. This cycle was
adopted because it was felt that these specimens would exhibit large
ductility and that the important requirement of the loading simulation was
to generate a post-elastic loading history covering the likely range of
deformations from moderate to severe earthquakes.
Static cyclic loading was used because of the convenience of applying
this type of loading. The use of slow reversals of load to represent
dynamic loading is thought to be conservative because the strength of concrete
and steel increases with increasing rates of strain.
(ii) Strength and Ductility of Slab-Column Connections
The ultimate shear force transferred from the slab to the column due
to the self weight of1the slab and the suspended concrete blocks simulating
j of the live load was 8040 lb. in the case of each test specimen. The
experimental moment and the ductility characteristics of all the test
specimens are given in Table 3.2. This Table lists the moment at first
yield, the maximum moment reached during testing and the moment at the
maximum edge displacement. Also shown in the Table are the edge displace-
ments at which first yielding occurs, the edge displacement at maximum
moment and the maximum edge displacement. The ratio of maximum edge
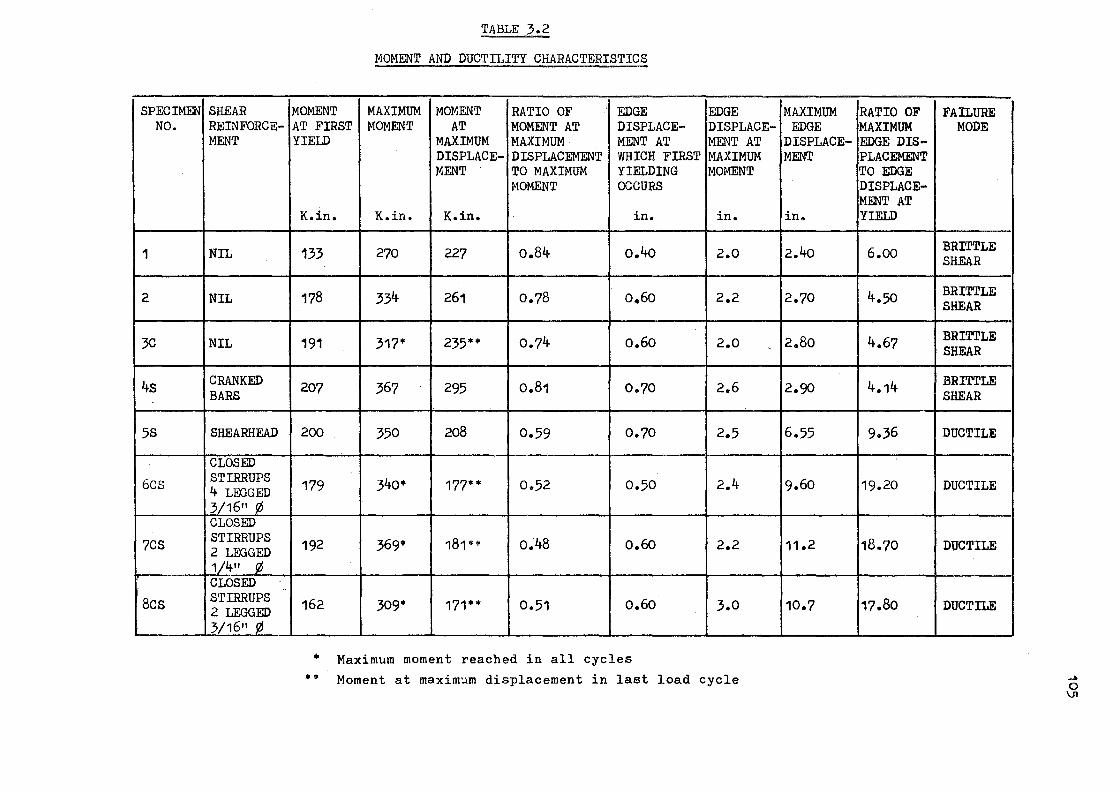
TABLE 3.2
MOMENT AND DUCTILITY CHARACTERISTICS
SPECIMEN SHEAR MOMENT MAXIMUM MOMENT RATIO OF EDGE EDGE NO. REINFORCE- AT FIRST MOMENT AT MOMENT AT DISPLACE- DISPLACE-
MENT YIELD MAXIMUM MAXIMUM- MENT AT MENT AT DISPLACE- DISPLACEMENT WHICH FIRST MAXIMUM MENT TO MAXIMUM YIELDING MOMENT
MOMENT OCCURS
K.in. K.in. K.in. in. in. - .
1 NIL 133 270 227 o.84 o.4o 2.0
2 NIL 178 334 261 0.78 0.60 2.2
3C NIL 191 317* 235** 0.74 0.60 2.0 .
4s CRANKED 207 367 295 0.81 0.70 2.6 BARS
5S SHEARHEAD 200 350 208 0.59 0.70 2.5
CLOSED
6CS STIRRUPS 179 340* 177** 0.52 0.50 2.4 4 LIDGED
3/16 11 0 CLOSED
7CS STIRRUPS 192 369• 181•• o.48 0.60 2.2 2 LIDGED 1/411 0 CLOSED ..
8cs STIRRUPS 162 309• 171** 0.51 0.60 3.0 2 LEGGED 3/1611 0
• Maximum moment reached in all cycles
•• Moment at maxim~m displacement in last load cycle
MAXIMUM RATIO OF EDGE MAXIMUM
DISPLACE- EDGE DIS-MENT PLACEMENT
TO EDGE DISPLACE-MENT AT
in. YIELD
2.40 6.00
2.70 4.5{)
2.80 4.67
2.90 4.14
6.55 9.36
9.60 19.20
11.2 18.70
10.7 17.80
FAILURE MODE
BRITTLE SHEAR
BRITTLE SHEAR
BRITTLE SHEAR
BRITTLE SHEAR
DUCTILE
DUCTILE
DUCTILE
DUCTILE
.... 0 \JI
displacement to edge displacement at first yield gives a measure of the
ductility of slab-column connections. This Table also indicates the
degradation of load carrying capacity which is given as the ratio of moment
at the maximum edge displacement to the maximum moment attained during
testing.
From these edge displacements of the test specimens the interstorey
deflections of the prototYPe structure could be approximately obtained.
Since the height of the column was half the longest span of the slab in the
• test specimens the lateral floor to floor deflections measured between the
top and bottom ends of the column works out to be nearly equal to the edge
106
displacement at one end of the slab. Therefore, the interstorey deflections
of the prototYPe structure which is twice the size of the test specimens
would be twice the edge displacements of the test specimens.
(iii) Behaviour of Specimen No. 1
Type of Loading
This specimen was subjected to an increasing bending moment applied in
one direction only. The applied shear force was constant at 8040 lb.
Load-displacement Curve
The plots of applied upward and downward edge loads versus corresponding
edge displacements of the slab are shown in Fig. 3.17 and 3.18. The
displacements plotted were measured at the centre of the edge. The load
displacement curve becomes non-linear after the first increment of loads. In
both the curves there are several kinks which coincide with the break during
testing and are due to creep effects. The maximum moment was reached when
both the upward and downward edge displacements were 2.0 in. At this
edge displacement the upward edge load was 2780 lb. and the downward edge
load was 2215 lb. The specimen failed when the edge displacement was
being increased from 2.4 in. to 2.6 in. The failure was of a sudden
punching shear type which took place in the slab. At the edge displacement
of 2.4 in. the upward end load was 2540 lb. and the downward end load was
1660 lb.
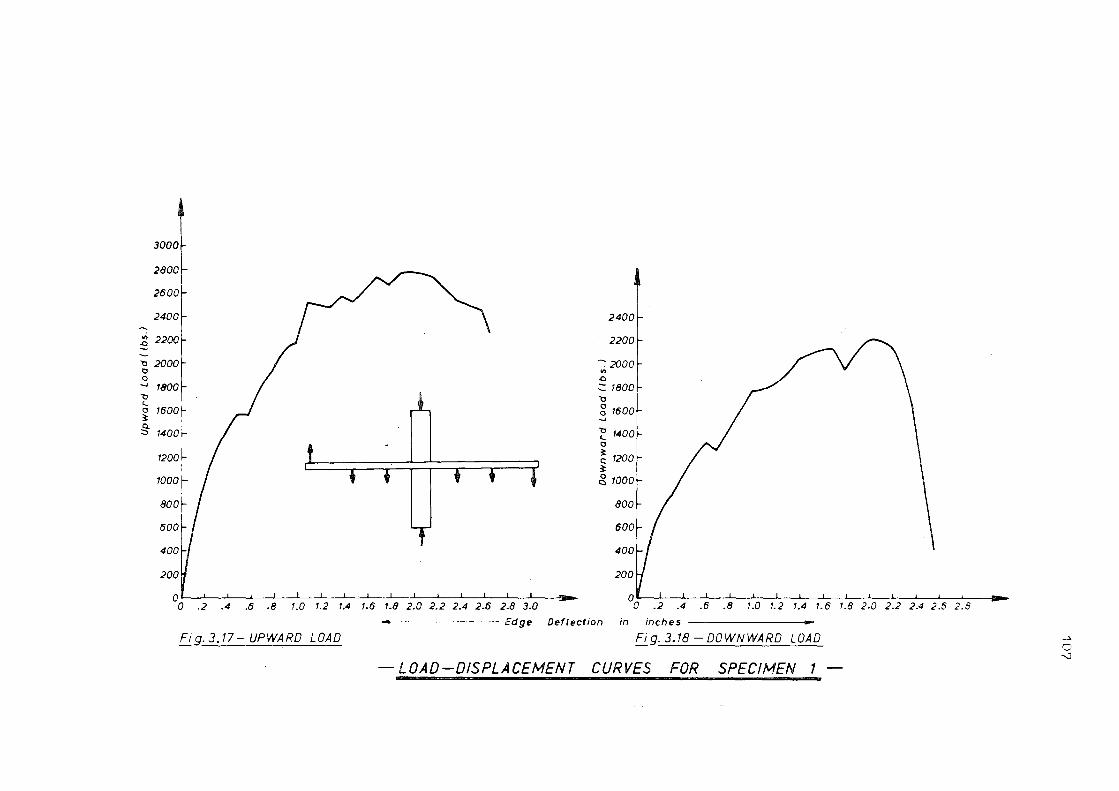
3000
2800
2500
2400 \ 2400
~ 2200 2200 ~
~ 2000 -: 2000 0 "' 0 .Q _, 1800 ::: 1800 ~ ~ '- g 1500 o 1500~ 3: ' -..J
~ 1400r ~ 1400 0
1200~ ~ 1200 3:
1000~ .g 1000
~or I y 800
600t 500
400 400
200 200
0 .____.__...,___L.-__.__...,___....____,_~...,___....____,__...,___....____,__--'--_..,'-----'ia-0 .2 .4 .5 .8 1.0 1.2 1.4 1.5 1.8 2.0 2.2 2.4 2.5 2.8 3.0
0o .2 .4 .5 .8 1.0 1.2 1.4 1.5 1.8 2-0 2.2 2.4 2.5 2.8
------ Edge Deflection in inches
Fig. 3.17- UPWARD LOAD Fig. 3.18 - DOWNWARD LOAD
-LOAD-DISPLACEMENT CURVES FOR SPECIMEN 1 -
~
0 ~
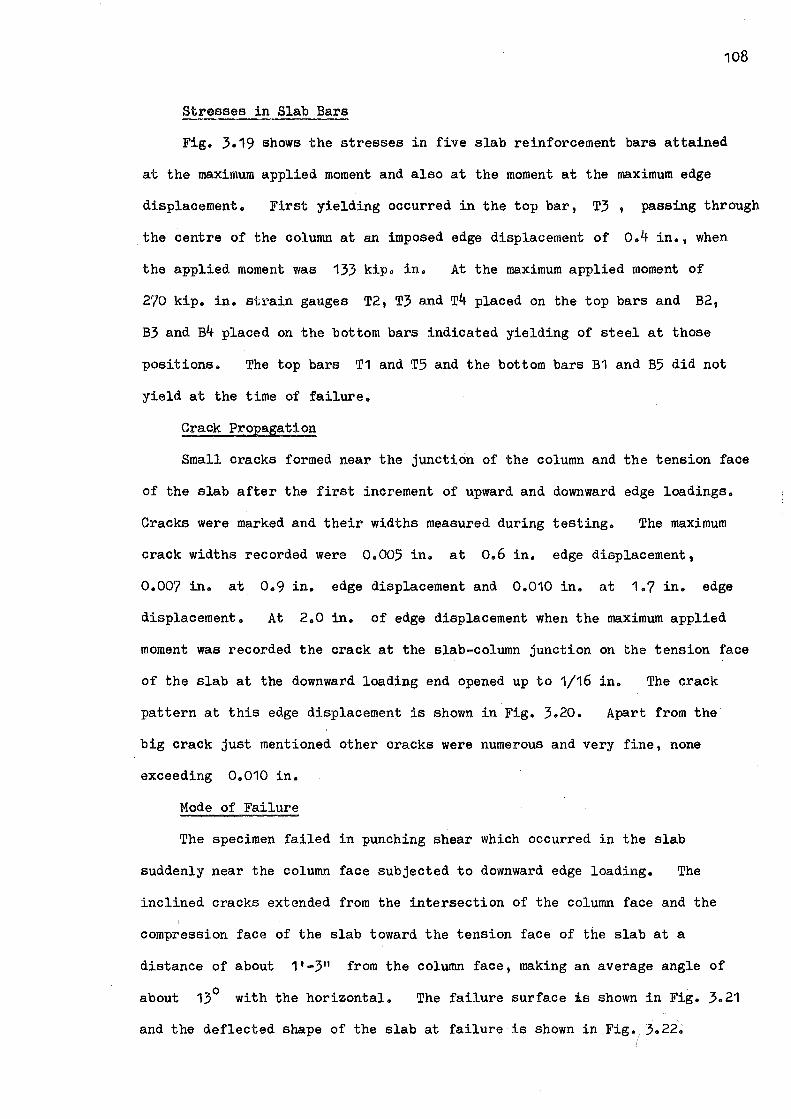
108
Stresses in Slab Bars
Fig. 3.19 shows the stresses in five slab reinforcement bars attained
at the maximum applied moment and also at the moment at the maximum edge
displacement. First yielding occurred in the top bar, T3 , passing through
the centre of the column at an imposed edge displacement of o.4 in., when
the applied moment was 133 kip. in. At the maximum applied moment of
270 kip. in. strain gauges T2, T3 and T4 placed on the top bars and B2 1
B3 and B4 placed on the bottom bars indicated yielding of steel at those
positions. The top bars T1 and T5 and the bottom bars B1 and B5 did not
yield at the time of failure.
Crack Propagation
Small cracks formed near the junction of the column and the tension face
of the slab after the first increment of upward and downward edge loadings.
Cracks were marked and their widths measured during testing. The maximum
crack widths recorded were 0.005 in. at o.6 in. edge displacement,
0.007 in. at 0.9 in. edge displacement and 0.010 in. at 1.7 in. edge
displacement. At 2.0 in. of edge displacement when the maximum applied
moment was recorded the crack at the slab-column junction on the tension face
of the slab at the downward loading end opened up to 1/16 in. The crack
pattern at this edge displacement is shown in Fig. 3.20. Apart from the
big crack just mentioned other cracks were numerous and very fine, none
exceeding 0.010 in.
Mode of Failure
The specimen failed in punching shear which occurred in the slab
suddenly near the column face subjected to downward edge loading. The
inclined cracks extended from the intersection of the column face and the
compression face of the slab toward the tension face of the slab at a
distance of about 1'-3" from the column face, making an average angle of
about 13° with the horizontal. The failure surface is shown in Fig. 3.21
and the deflected shape of the slab at failure is shown in Fig. 3.22~) ,,
~ \'\''
~
q
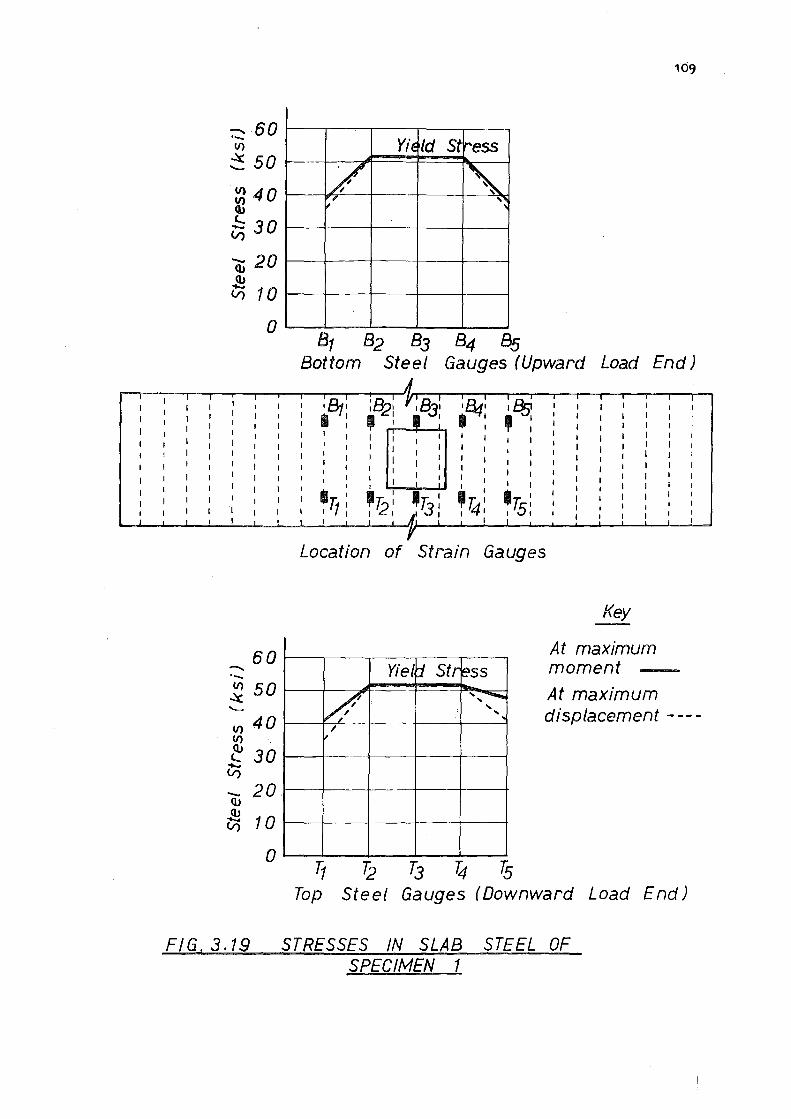
-. 60 ·-V)
~ 50
~ 40 <lJ .!:: 3 0 V)
20 -<lJ ~ V) 10
0
/ v'
B1 B2
109
Yif Id St ""'eSS
' , ... '
B3 B4 Bs Bottom Steel Gauges ( Upward Load End)
,Bt' ~82; ,B3: •a,: .~ I : I I
I I I I I I
I I I I I I I I
•,;: ,72: .Jj: ~74: ~Ts: I I I I I I
Location of Strain Gauges
-. ·-601---~-~~--
Yie/'d St riess v, 5 0 I---+-~~~~~"""'"-=~ ~ V ,,~ V) 4 0 1---~I <-------l---~+-----+----------<
~ 30i--4v----1----e--~-~
- 2 0 I-----+---+--,----+-----+-----+ <lJ <lJ u5 10 ---+-----+----+--+--~
0 1---___,1--_...j...__....,J...._---l.. _ __,I
ft Q T3 7;J Ts
Key
At maximum moment
At maximum displacement----
Top Steel Gauges ( Downward Load End)
FIG. 3.19 STRESSES IN SLAB STEEL OF SPECIMEN 1

I
FIG.3.2O CRACK PATTERN OF SPECIMEN 1 AT 2 IN. DEFLECTION
r FIG. 3.21 FAILURE SURFACE OF SPECIMEN 1
110
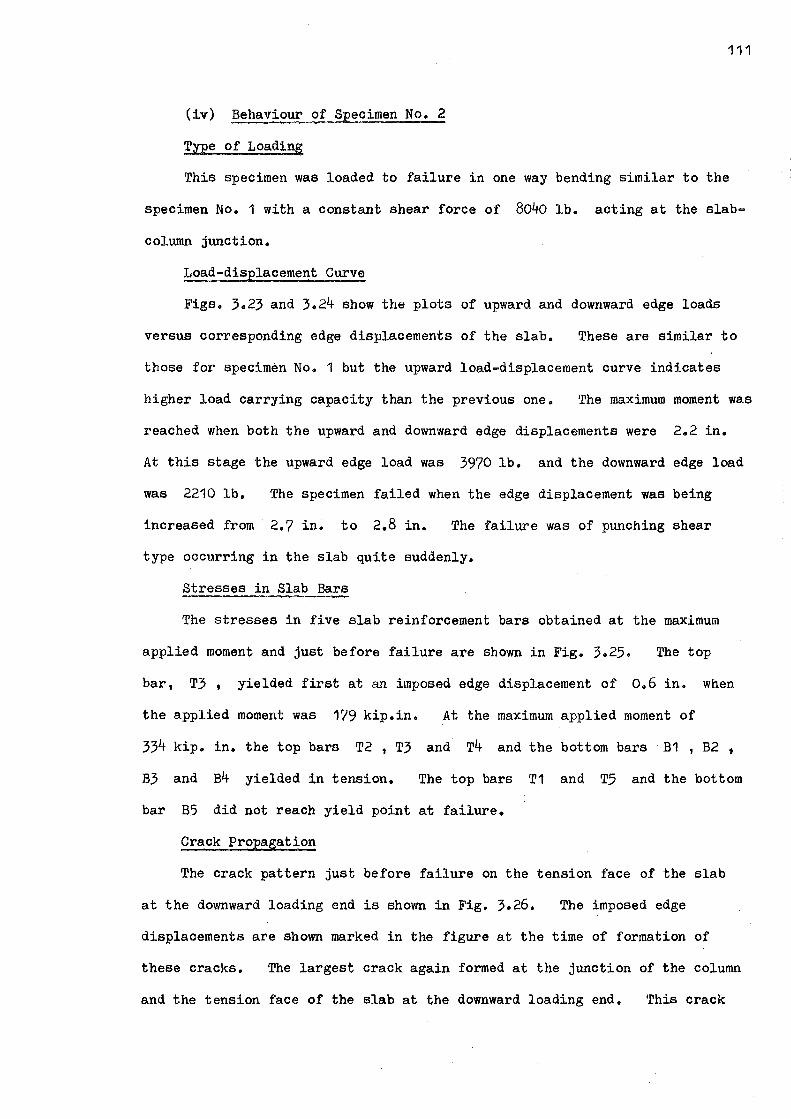
(iv) Behaviour of Specimen No. 2
Type of Loading
111
This specimen was loaded to failure in one way bending similar to the
specimen No. 1 with a constant shear force of 804o lb. acting at the slab
column junction.
Load-displacement Curve
Figs. 3.23 and 3.24 show the plots of upward and downward edge loads
versus corresponding edge displacements of the slab. These are similar to
those for specimen No. 1 but the upward load-displacement curve indicates
higher load carrying capacity than the previous one. The maximum moment was
reached when both the upward and downward edge displacements were 2.2 in.
At this stage the upward edge load was 3970 lb. and the downward edge load
was 2210 lb. The specimen failed when the edge displacement was being
increased from 2.7 in. to 2.8 in. The failure was of punching shear
type occurring in the slab quite suddenly.
Stresses in Slab Ba.rs
The stresses in five slab reinforcement bars obtained at the maximum
applied moment and just before failure are shown in Fig. 3.25. The top
bar, T3, yielded first at an imposed edge displacement of o.6 in. when
the applied moment was 179 kip.in. At the maximum applied moment of
334 kip. in. the top bars T2, T3 and T4 and the bottom bars B1 , B2,
B3 and B4 yielded in tension. The top bars T1 and T5 and the bottom
bar B5 did not reach yield point at failure.
Crack Propagation
The crack pattern just before failure on the tension face of the slab
at the downward loading end is shown in Fig. 3.26. The imposed edge
displacements are shown marked in the figure at the time of formation of
these cracks. The largest crack again formed at the junction of the column
and the tension face of the slab at the downward loading end. This crack
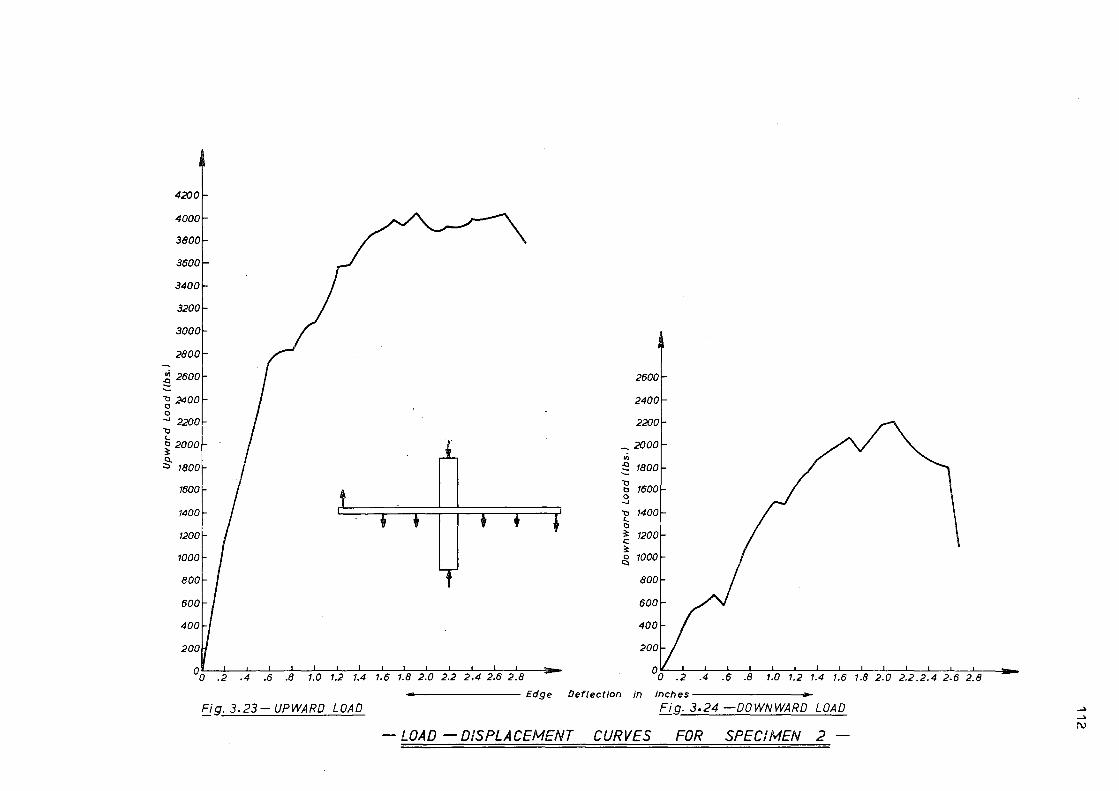
4200
4000
3800
3600
3400
3200
3000
2800
i 26001- I 2600
~ 24001- I 2400 0 _, 22001- I 2200 "O (.
I ~ [20oot ...,. 2000
., :::, 1800 ~ 1800
1600 A ~ 1600 0 _,
14001- I "O 1400 (. 0
12001- I I I ~ 1200 3:
10001- I I I g 1000
800
600
400
0o .2 .4 .6 .8 1.0 1.2 1.4 1.6 1.8 2.0 2.2 2.4 2.6 2.8 0o .2 .4 .6 .8 1.0 1.2 1.4 1.6 1.8 2.0 2.2 .2.4 2-6 2.8
-------- Edge Deflection in inches---------
EJg. 3.23- UPWARD LOAD Fi g. 3.24 -DOWNWARD LOAD
- LOAD - DISPLACEMENT CURVES FOR SPECIMEN 2 -
~
~
r\)
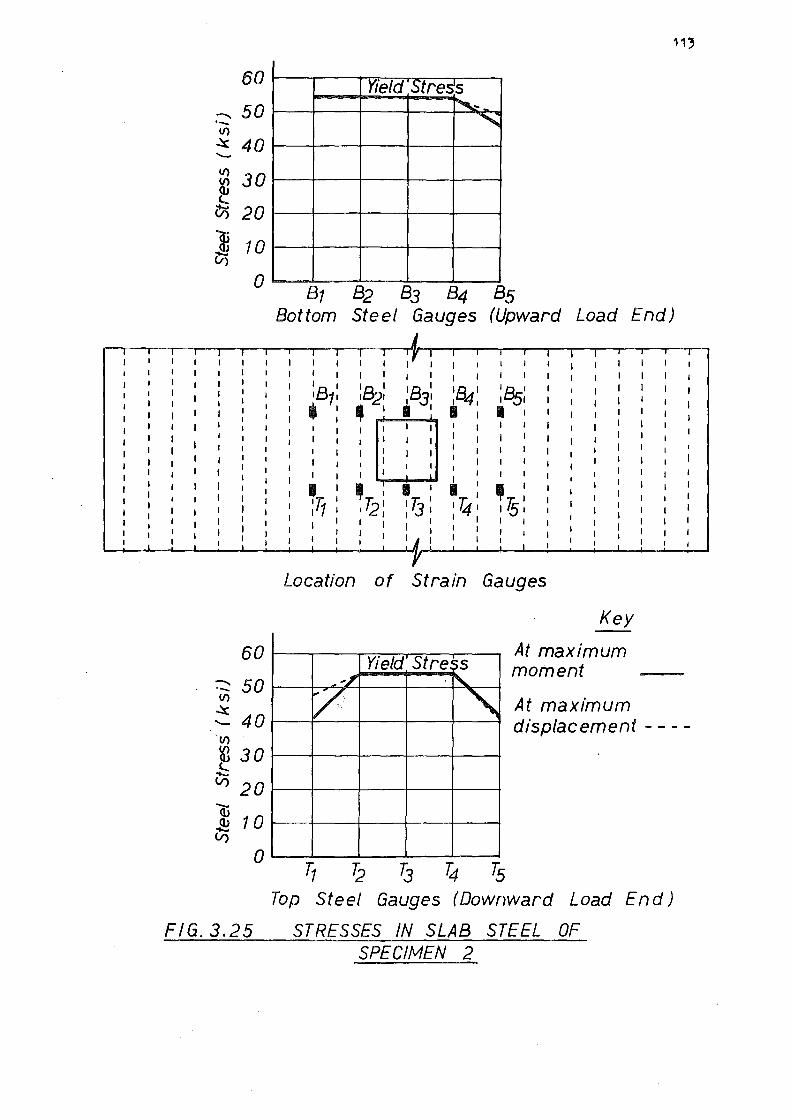
60
-- 50 ..... 1/)
~ 40 -1/) 30
~ ~ 20
] 10 V)
0
60
-- 50 ..... 1/)
~ 40 -
1/)
~ ~
30 V) 20 -(l,
10 ~ V)
0
11 '.,
Yield :stres JS
"" .. -"
81 82 83 84 85 Bottom Steel Gauges (Upward Load End)
I I I
I 18
I
I 11 • I
I I
I I I :r,
I I I
'8 I I 21
• I
I I I I I I
I
I I I I
I I I I I I
I I
17j: I I I I
I
I
I I I
'84' :as: • : I I
I I
I I II I I 'T'
1 74 1 I 5: I I I I
I I I I
Location of Strain Gauges
Yield' Strec iS - .. 7
,, V '\
Key
At maximum moment
At maximum displacement - - - -
Top Steel Gauges (Downward Load End)
FIG. 3.25 STRESSES IN SLAB STEEL OF SPECIMEN 2
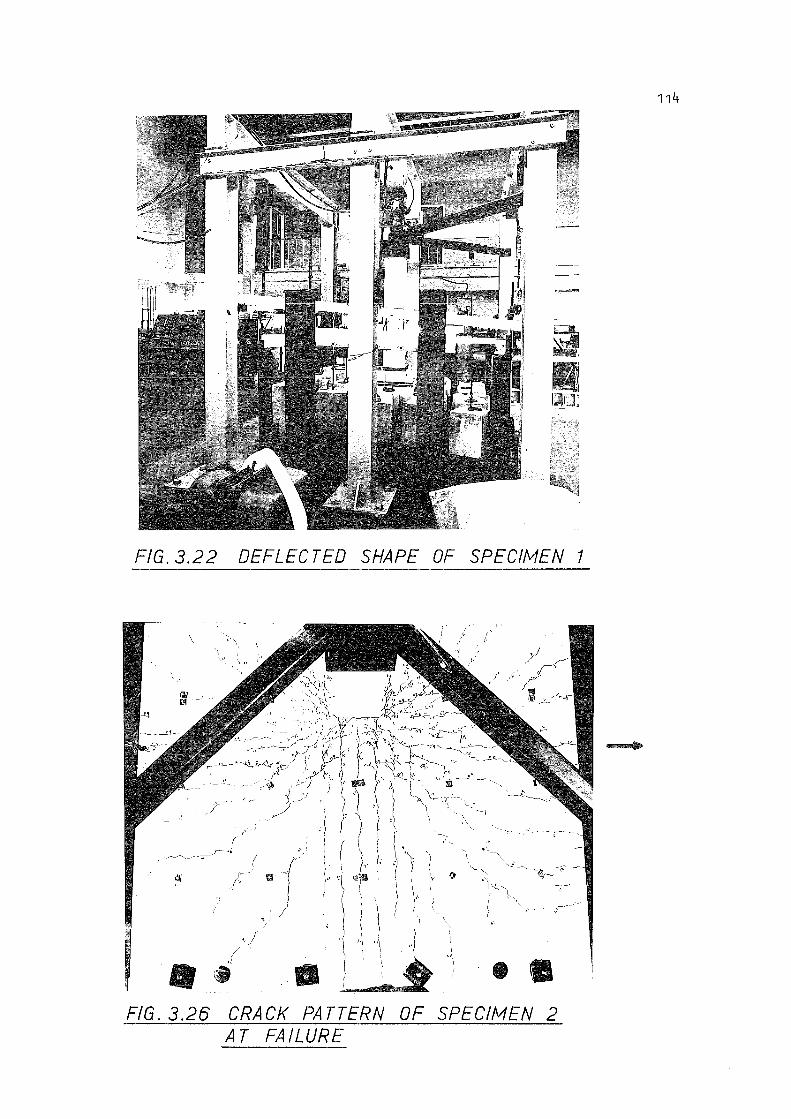
FIG. 3.22 DEFLECTED SHAPE OF SPECIMEN 1
\ I ._ I
(' t,)
II • II FIG. 3.26 CRACK PATTERN OF SPECIMEN 2
AT FAILURE
114
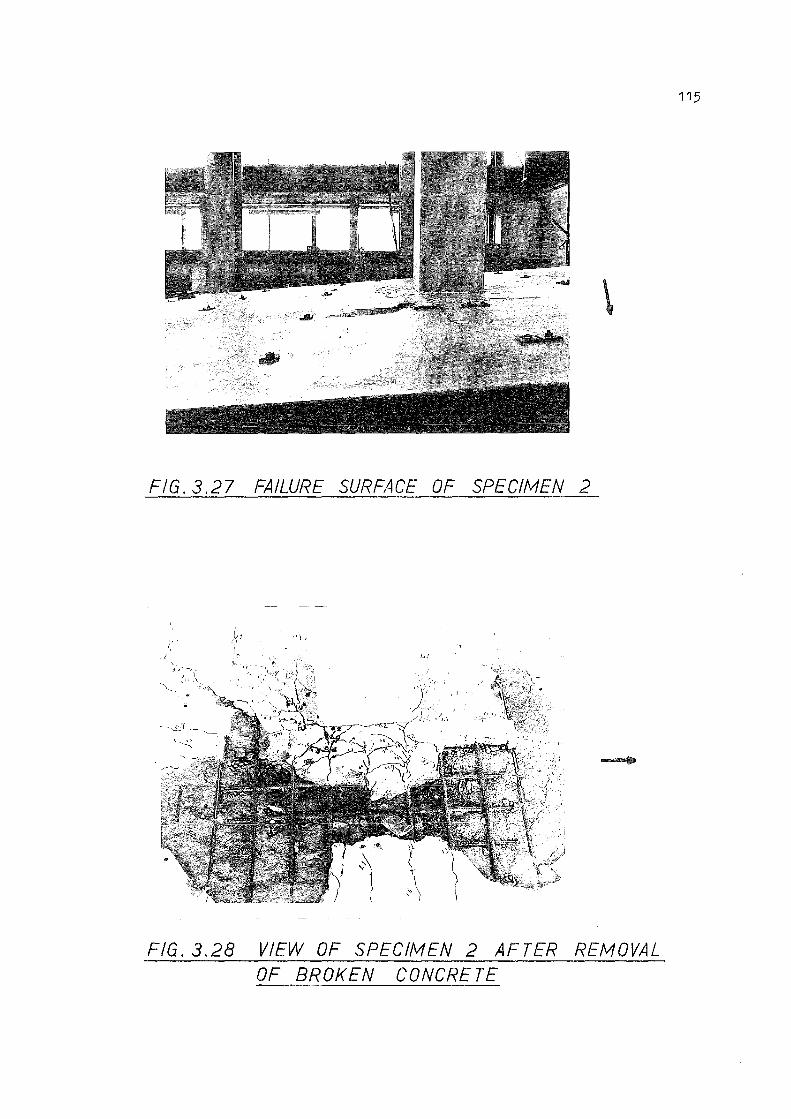
c:.lliit:J· 111111!11".
FIG. 3.27 FAILURE SURFACE OF SPECIMEN 2
''l,
\
FIG. 3.28 VIEW OF SPECIMEN 2 AFTER REMOVAL OF BROKEN CONCRETE
115
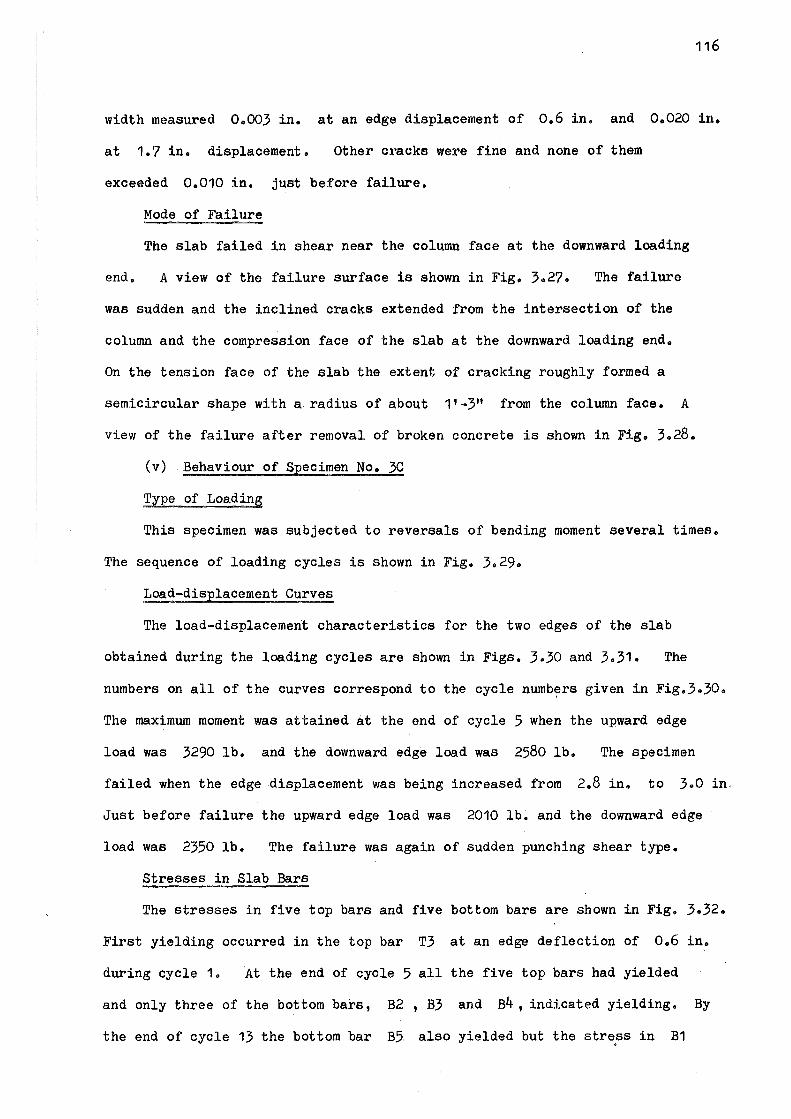
116
width measured 0.003 in. at an edge displacement of o.6 in. and 0.020 in.
at 1.7 in. displacement. Other cracks were fine and none of them
exceeded 0.010 in. just before failure.
Mode of Failure
The slab failed in shear near the column face at the downward loading
end. A view of the failure surface is shown in Fig. 3.27. The failure
was sudden and the inclined cracks extended from the intersection of the
column and the compression face of the slab at the downward loading end.
On the tension face of the slab the extent of cracking roughly formed a
semicircular shape with a radius of about 11 -3" from the column face. A
view of the failure after removal of broken concrete is shown in Fig. 3.28.
(v) Behaviour of Specimen No. 3C
Type of Loading
This specimen was subjected to reversals of bending moment several times.
The sequence of loading cycles is shown in Fig. 3.29.
Load-displacement Curves
The load-displacement characteristics for the two edges of the slab
obtained during the loading cycles are shown in Figs. 3.30 and 3.31. The
numbers on all of the curves correspond to the cycle numb~rs given in Fig.3.30.
The maximum moment was attained at the end of cycle 5 when the upward edge
load was 3290 lb. and the downward edge load was 2580 lb. The specimen
failed when the edge displacement was being increased from 2.8 in. to 3.0 in,
Just before failure the upward edge load was 2010 lb. and the downward edge
load was 2350 lb. The failure was again of sudden punching shear type.
Stresses in Slab Bars
The stresses in five top bars and five bottom bars are shown in Fig. 3.32.
First yielding occurred in the top bar T3 at an edge deflection of 0.6 in.
during cycle 1. At the end of cycle 5 all the five top bars had yielded
and only three of the bottom bars, B2, B3 and B4, indicated yielding. By
the end of cycle 13 the bottom bar B5, also yielded but the str~ss in B1

"
-~ 3.0 ·--2.0 ' I I
' '
l t.~ ~~AA/s\ ~ h\ ~ AmA1~j3 \A Js \ • Cycles .!g o.1.0 -~
Cl 2.0 Cl,
~3.0 l.(J
Fl G. 3.29 LOADING CYCLES FOR SPECIMEN 3C
...,. ~
....:I
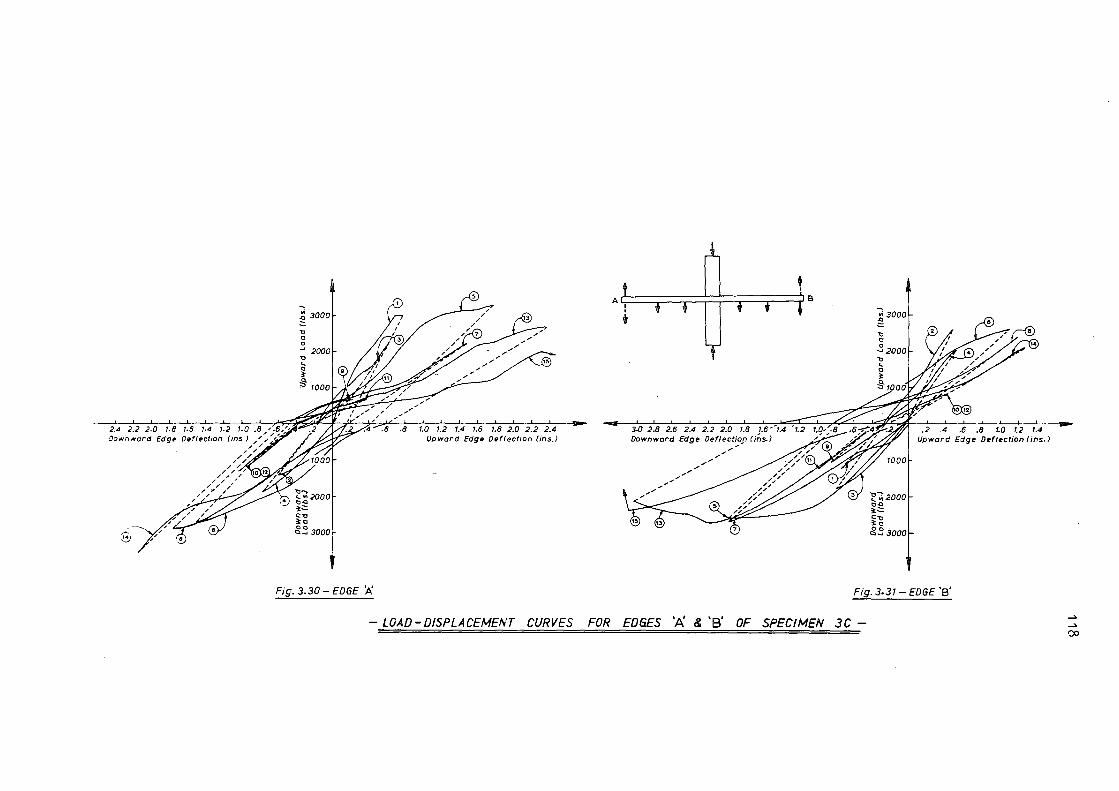
2.4 2.2 2.0 1.8 Downward Edge
,A
~~
1,6 1,4 1,2 1.0 .8 ,';~,,,. D~fl~ct,on (,ns.J _,/,,, ,., · , / , /
/ / , /
,,,,,,,,,/,,1 / , ,
/ / , / / ,,,,
, y , , , , , -
~ 3000
'tl 0 0
C:'t) ~o
2000
.g~ 3000
.8 1.0 1.2 1.4 1.6 1.8 2.0 2.2 2.4 Upward Edge Deflection (ins.!
A I • •
0
B ~3000
'tl 0
~2000
°l:'.~2000 O.Q ~-= C:'t) ~o .g:3 3000
Fig. 3.30 - EDGE 'A. Fig. 3-31- EDGE ·s•
- LOAD-DISPLACEMENT CURVES FOR EDGES 'A & 'B' OF SPECIMEN 3C -
1.0 1.2 1.4 Edge 0•ftection /ins. J
~
-> co
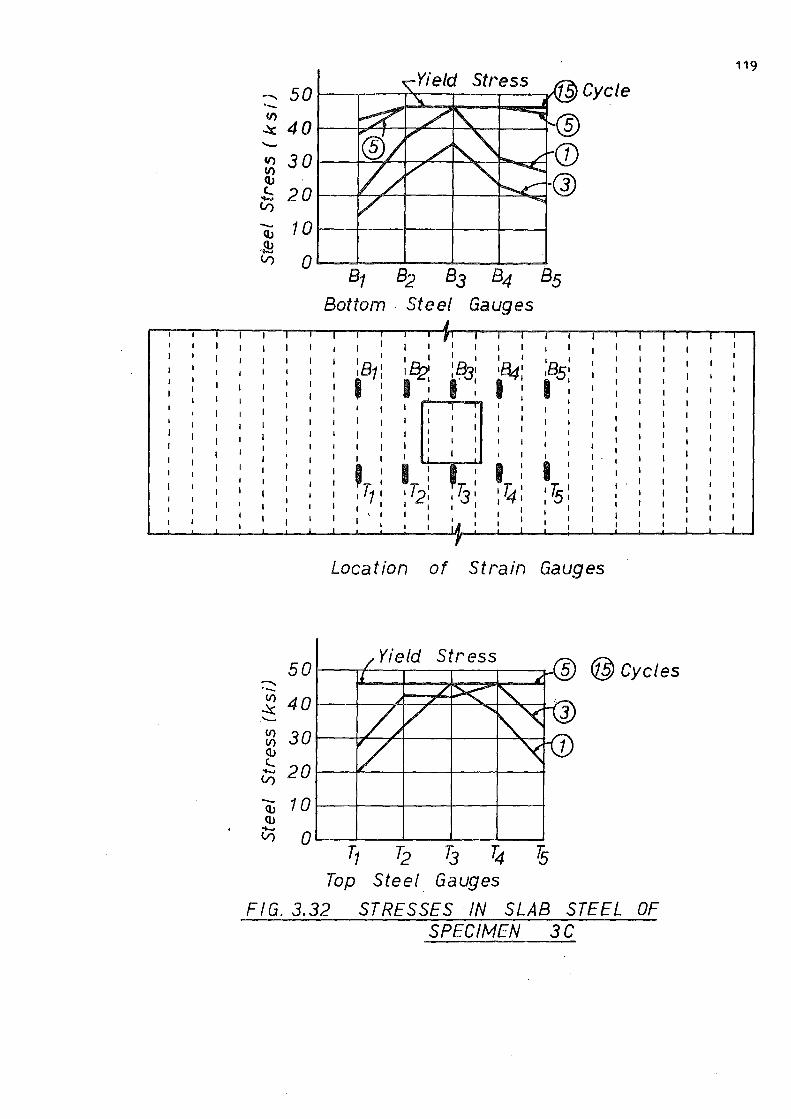
·-V) ~ 4 0 t---1'21""---f--~..___-+--"'r---+--------1 -fl) 3 0 l----+~~-7""-,---...,,,,..--1=-,,,,,~
ID ~ 201---1"'-7''-t--i--i-=~ V)
10t--t---+--t--t-----1
0---------------B1 B2 B3 B4 85
Bottom Steel Gauges
I I I I
,B1: I I
I I I I I I ~ :B-:,, f'c: 1·~: ,...........,._,..
I I I
,atl I
I I I
' I : I 7j:
I : , T1 ,T2: I 74 I
I I I I I I I
I I
1 I
'a,..' ,~: I
I : 7s
Cycle
Location of Strain Gauges
50 -Yield Stress
@cycles ·-U) 40 ~ -U) 30 U)
<l> l...
20 ...... V)
- 10 <l> <l> ......
V) 0 T1 T2 7j 74 Ts
Top Steel Gauges
FIG. 3.32 STRESSES IN SLAB STEEL OF SPECIMEN 3C
119

FIG. 3.33 CRACK PATTERN OF SPECIMEN 3C AFTER CYCLE 1
FIG. 3 .34 CRACK PATTERN OF SPECIMEN 3C AFTER CYCLE 5
120
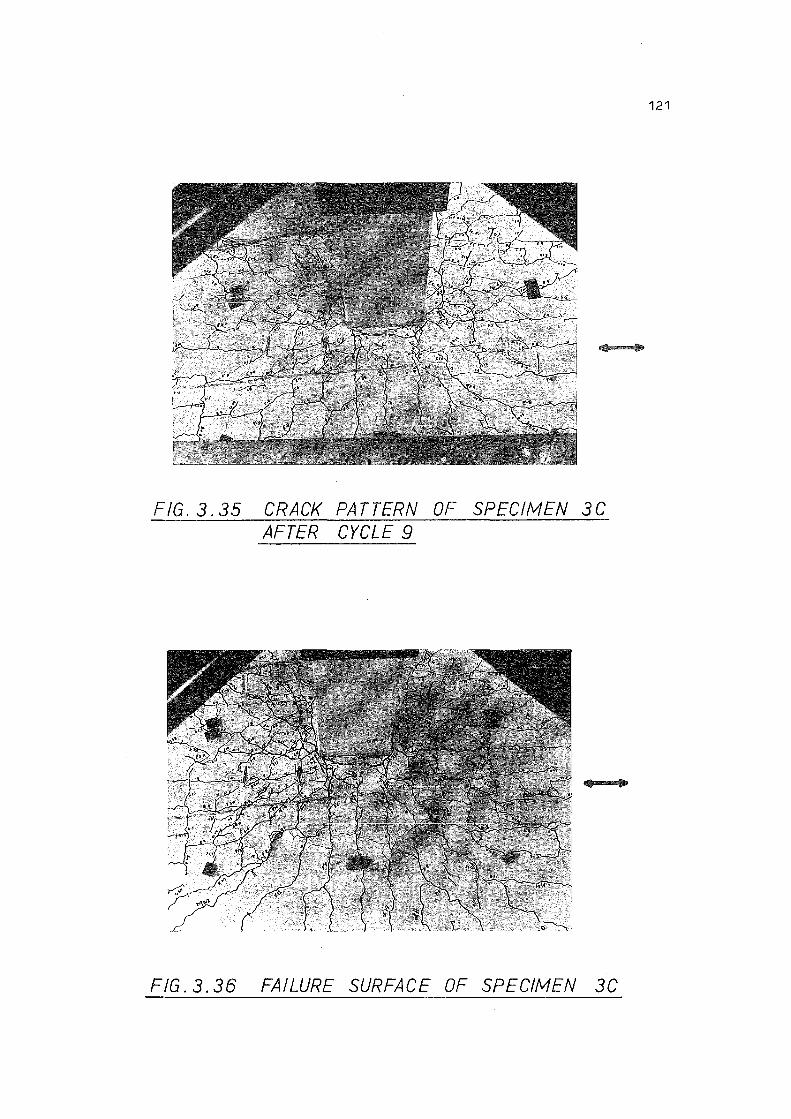
FIG. 3.35 CRACK PATTERN OF SPECIMEN 3C AFTER CYCLE 9
FIG. 3.36 FAILURE SURFACE OF SPECIMEN 3C
121

122
remained below the yield point at the time of failure.
Crack Propagation
Figs. 3.33 to 3,35 show the propagation of cracks on the top surface at
cycles 1 , 5 , and 9. The cracking around the column was extensive and
the largest crack once again developed at the junction of the column and the
tension face of the slab.
Mode of Failure
The failure was by punching shear in the slab around the column face
subjected to downward edge loading. The failure surface after cycle 15 is
shown in Fig. 3.36.
(vi) Behaviour of Speciman 4s Containing Cranked Bars
Type of Loading
This specimen was subjected to one way bending with a constant shear
force of 8040 lb. at the slab-column junction.
Load-displacement Curve
The load-displacement curves for the two loading edges of the slab are
shown in Figs. 3.37 and 3.38. These curves indicate greater load carrying
capacity than those for specimens without any shear reinforcement. The
maximum moment was reached when both the upward and downward edge displacements
were 2.5 in. At this edge displacement the upward edge load was 4050 lb.
and the downward edge load was 2750 lb. The specimen failed when the edge
displacement was being increased from 2.9 in. to 3.0 in. At the edge
displacement of 2.9 in. the upward edge load was 3880 lb. and the downward
edge load was 1580 lb.
Stresses in Slab Bars and Shear Reinforcement
Fig. 3,39 shows the stresses in nine top bars and nine bottom bars
attained at the maximum applied moment and also at the moment at the maximum
displacement. First yielding occurred in the top bar T5 at an imposed
edge displacement of 0.7 in., when the applied moment was 207 kip. in.
At the maximum applied moment of 367 kip. in. top bars T4, T5 _and T6
and bottom bars B3, B4, B5 , B6 and B7 yielded. The stresses in the
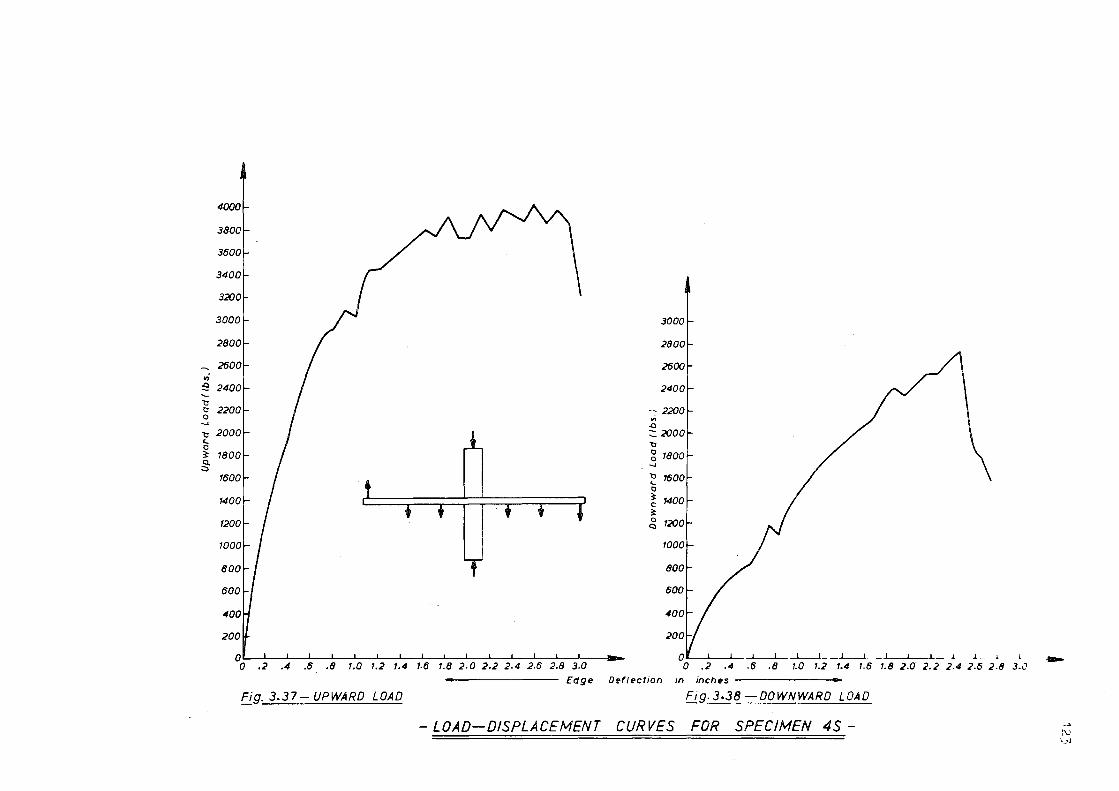
4000
3800
3600
3400
3200
3000 3000
2800 2800
2600 2600 .,; ~ 2400 2400 ~
"tJ o 2200 : 2200 0 "' _,
.Q -c 2000
~ :::: 2000
'- "tJ 0 3: 1800 g 1800 g- _,
1600 . ~ 1600 0
1400r- I ~ 1400 3:
1200r- I I I . .g 1200
1000
800
600
400
200
0L-....L.-L-....L.-L---L.-.L.___J__..L___J__..L____.__...J..____._ _ _.____.1--,------!o .2 .4 .6 .8 1.0 1.2 1.4 1.6 1.8 2.0 2.2 2-4 2.6 2.8 3.0
L--'-_...J... __ _..__~_j ___ _L _.L.._J. --'----'--....L..-- l. .J _ l
.2 .4 .6 .8 1.0 1.2 1.4 1.6 1.8 2.0· 2.2 2.4 2-6 2.8 3.0
Edge Deflection in inches -------
Fig. 3.37- UPWARD LOAD Fig. 3-38 -DOWNWARD LOAD
- LOAD-DISPLACEMENT CURVES FOR SPECIMEN 4S -
--> l\J \_JJ
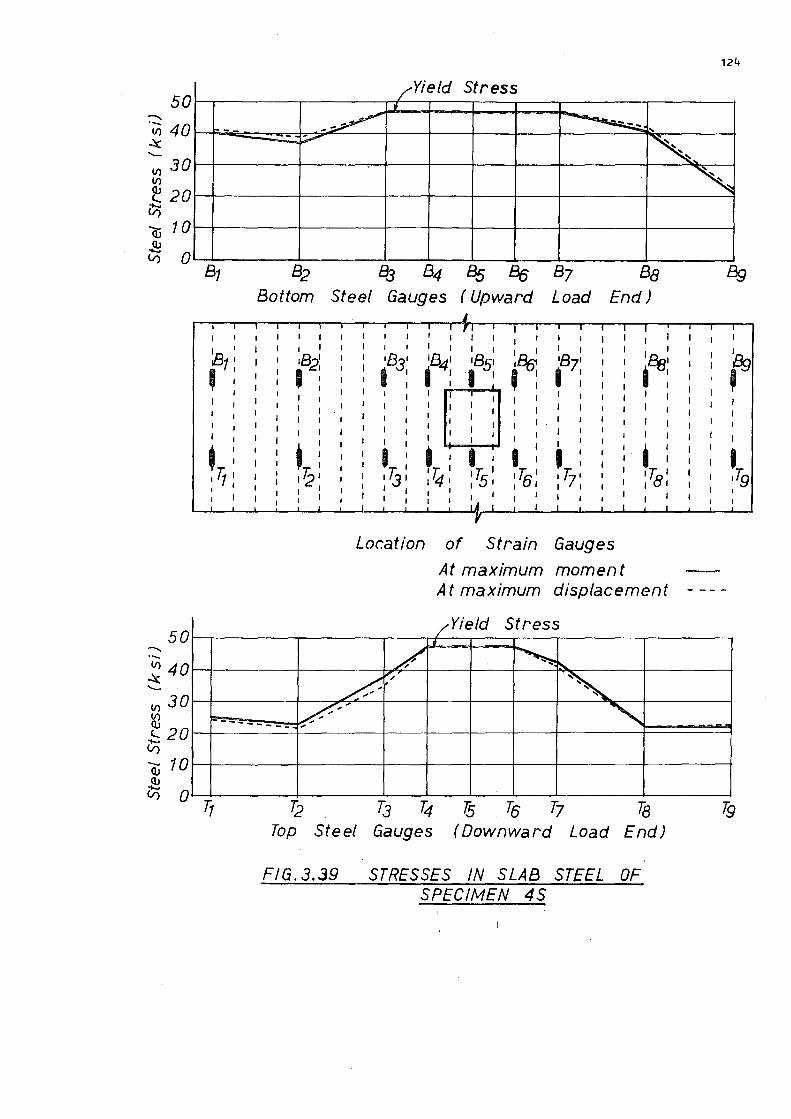
50
1/) 30 1/)
't:_ 20 Cf) -a; 10 ~ V) 0
50 -·-V) 40 -:::c ..__
1/) 30 If)
2!. 20 -V)
-... 10 (1.)
~ 0
124
/Yield Stress "
... -- -~ ----_., --~- '~ 81
I
I I I
81 I
' I
I
I ' : ,r, I I I
I
82 Bottom
I
I I I I
,B,' ' ;::'I
BJ B4 f3s 8fi Steel Gauges ( Upward
87 Load
Be End)
I
I I , lj I I
I I I
'84 i :
I
I
I
I
I
I
I I IT I 1
14 I I I
j
I I
I
I I
I I
I I
I I
17"i. I 15 1
I
I I
:ae, I I I
'87' ' : I I
I
I
I
I I
I I I : 17j/ , T7 1
I I I I I I
Location of Strain Gauges
At maximum moment
I I
I
'ee1 I : I
I
I
I : iTe' I I
I
At maximum displacement
/Yield Stress t
/ ·~ .... p r·
' ,, ,
/-/
'"' ----- ----::: .,,.
r, T3 Tt4 Ts T5 T7 72 Top Steel Gauges (Downward
Ta Load End)
FIG. 3.39 STRESSES IN SLAB STEEL OF SPECIMEN 4S
~
Bg
~
' I ,T9 I
I
---
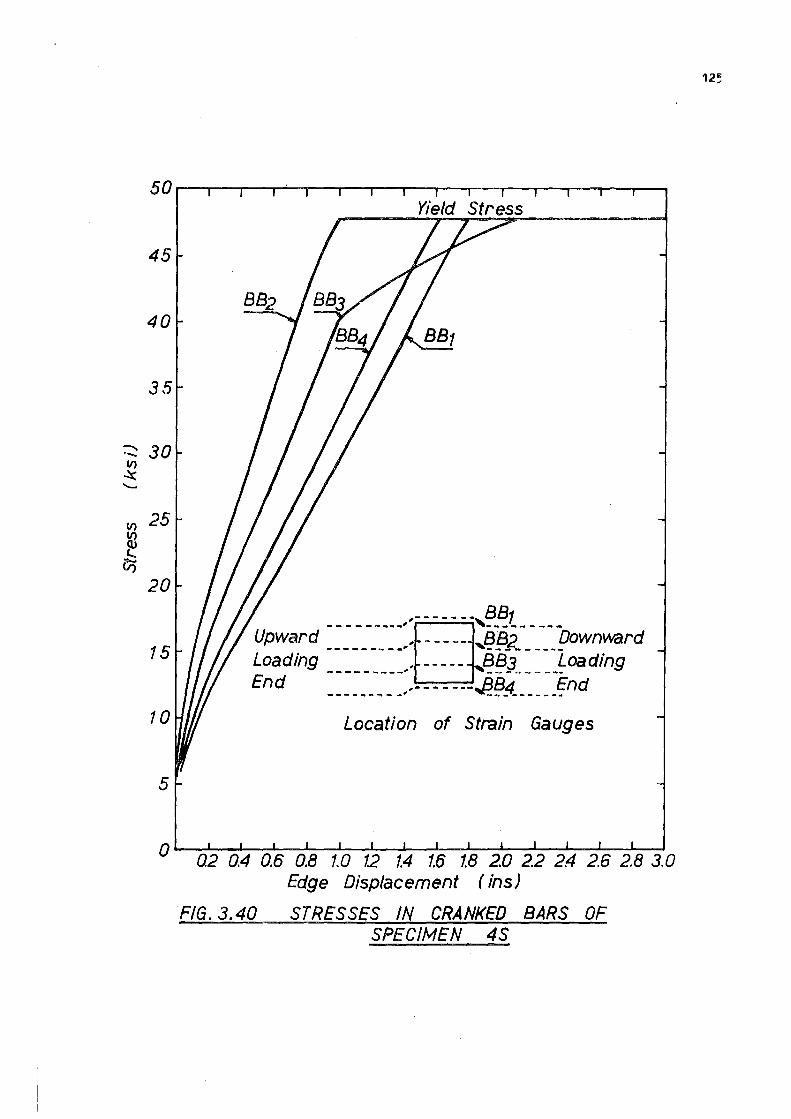
50.----.----.------.--'--.--.---"T"-..----.------r---,---.-----
45
40
35
~ 30 V)
..!( -v, 25 ~ ;:;
Vj
20
15
10
5
Yield Stress
.. - _ _ _ _ _ _ B81
Upward : : : :.~---: :l -. --p~~X. --~~pownward Loading , ----- B83 Loading End ::~~---~-:~:,. _ - - ---._/4"1}~---~~ ~§nd
Location of Strain Gauges
0------------__._----____.,_..........___.,___,__......_.......____.__.....__ _ __, Q2 Q4 0.6 0.8 1.0 1.2 1.4 1.6 1.8 20 2.2 2.4 2.6 2.8 3.0
Edge Displacement ( ins)
FIG. 3.40 STRESSES IN CRANKED BARS OF SPECIMEN 4S
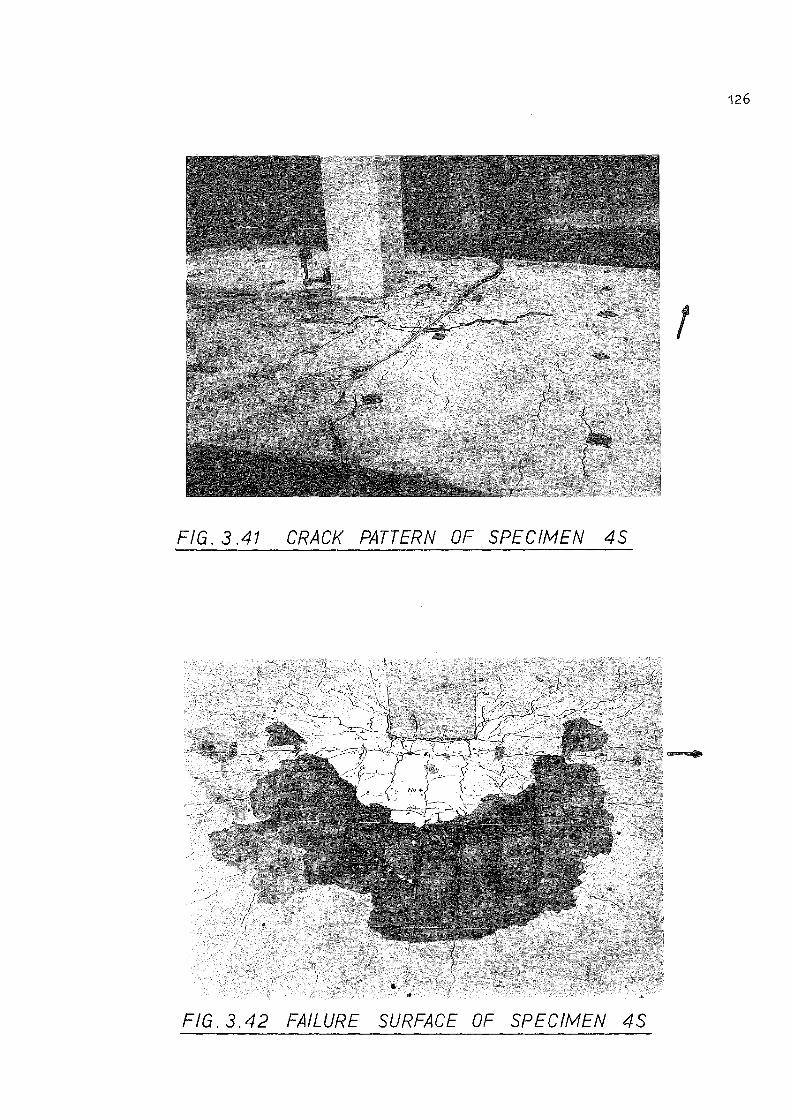
126
I
FIG. 3 .41 CRACK PATTERN OF SPECIMEN 45
FIG. 3. 42 FAILURE SURFACE OF SPECIMEN 4S
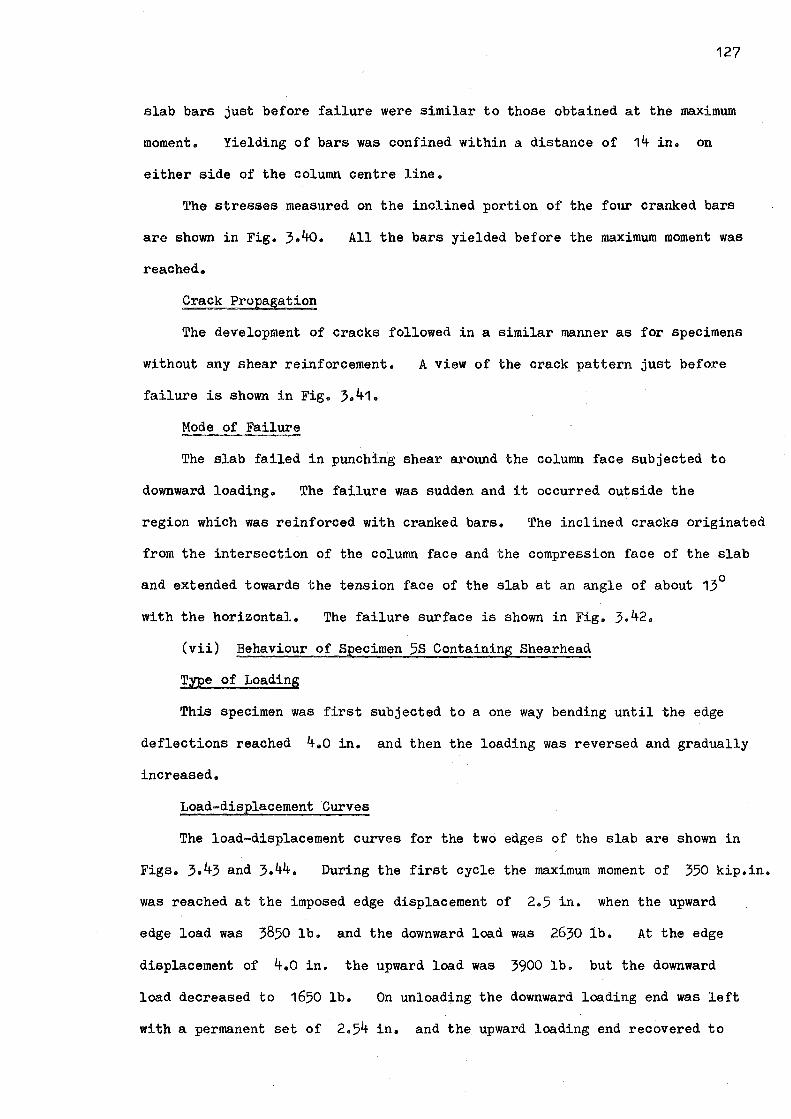
127
slab bars just before failure were similar to those obtained at the maximum
moment. Yielding of bars was confined within a distance of 14 in. on
either side of the column centre line.
The stresses measured on the inclined portion of the four cranked bars
are shown in Fig. 3.4o.
reached.
Crack Propagation
All the bars yielded before the maximum moment was
The development of cracks followed in a similar manner as for specimens
without any shear reinforcement.
failure is shown in Fig. 3.41.
Mode of Failure
A view of the crack pattern just before
The slab failed in punching shear around the column face subjected to
downward loading. The failure was sudden and it occurred outside the
region which was reinforced with cranked bars. The inclined cracks originated
from the intersection of the column face and the compression face of the slab
and extended towards the tension face of the slab at an angle of about 13°
with the horizontal. The failure surface is shown in Fig. 3.42.
(vii) Behaviour of Specimen 5S Containing Shearhead
Type of Loading
This specimen was first subjected to a one way bending until the edge
deflections reached 4.o in. and then the loading was reversed and gradually
increased.
Load-displacement Curves
The load-displacement curves for the two edges of the slab are shown in
Figs. 3.43 and 3.44. During the first cycle the maximum moment of 350 kip.in.
was reached at the imposed edge displacement of 2.5 in. when the upward
edge load was 3850 lb. and the downward load was 2630 ib. At the edge
displacement of 4.o in. the upward load was 3900 lb. but the downward
load decreased to 1650 lb. On unloading the downward loading end was left
with a permanent set of 2.54 in. and the upward loading end recovered to
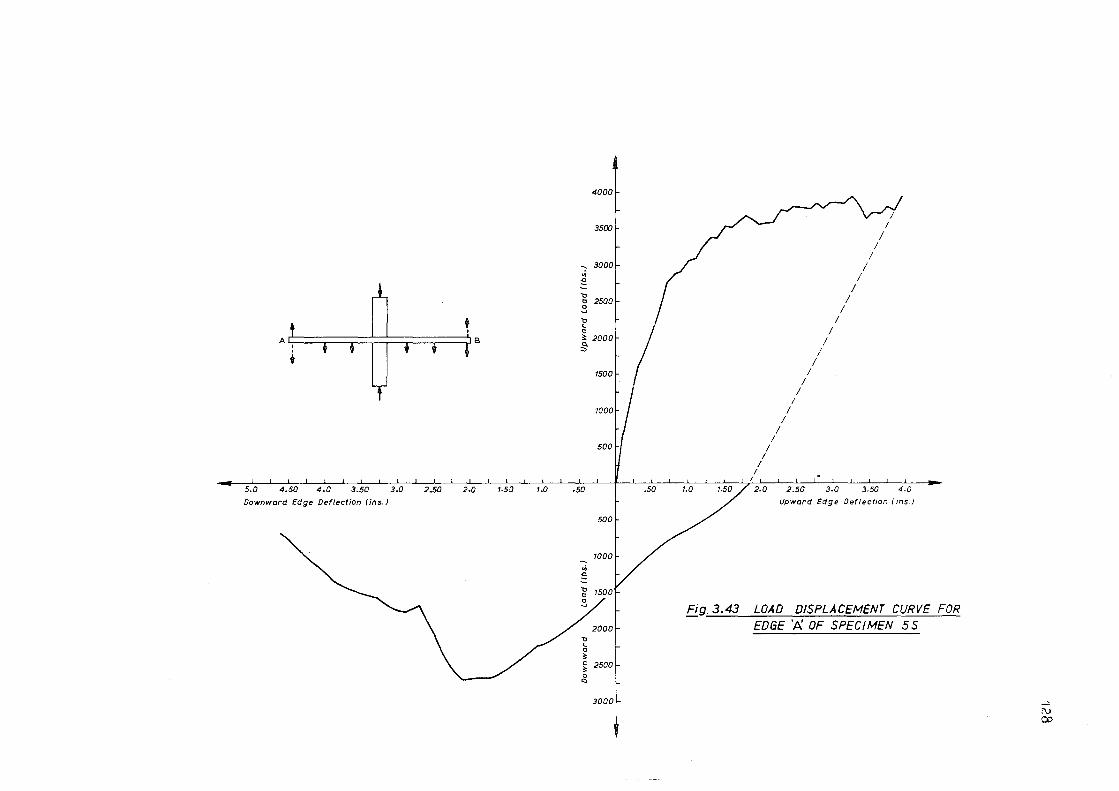
• I
i i l' R Ai
: + + t + • ., I
5.0 4.50 4-0 3.50 3.0 2.50 2.0 1-50 1.0
Downward Edge Deflection (ins.)
4000
3500
3000 .,; ::! .., " 2500 .3 .., '-" 3:: 2000 ,g.
1500
500
-50 .50
500
1.0
I I
I I
I I
I I
I I
I I
I I
I I
I I
I I
I I
I
I I
I I
I
1.50 / 2.0 2.50 3.0 3.50_ 4.0
Upward Edge Deflection ( ins.!
Fig. 3.43 LOAD DISPLACEMENT CURVE FOR EDGE ·t,: OF SPECIMEN 5S
_..;,
f\) 3000r- CX:,

• I I
i i i' ~ Al • • • I • ' •
4.0 3.50 3.0 2.50 2.0 1.50 1-0 .50 Upward Edge Deflection /ins.)
3000
' .; 2500 ~ ,, 0
~2000 ,, <. 0 3: i 1500 0 c:,
1000
5DO .;
~ i:, 1000 ·0 0 .... ,, <. ~ 1500.
:%
2500
3000
.50 1.0 1.50 2.0
/ /
/ /
/
2.50 3.0
/ /
/
/ /
/
3.50 4-0 Downward Edge Deflection (,ns.J
Fig. 3.44 - L DAD-DISPLACEMENT CURVE FOR EDGE '8' OF SPECIMEN SS
~
i\) ,.o
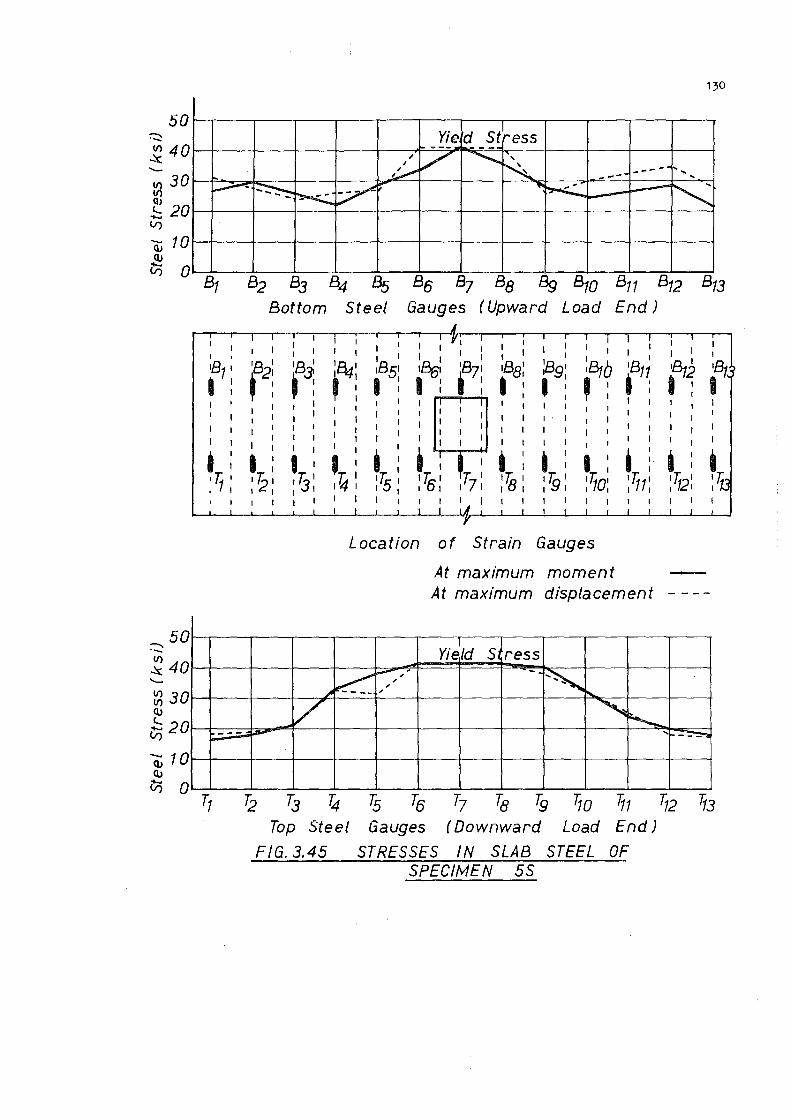
50
V> 40 ~ -V> 30 V)
~ 20 -V)
50 ~
~ 40 ..__
~ 30 (\)
;:;. 20 V)
q;10 (\)
t5 0
130
Yie d .1
st~ess .,_ --- - - _ .. .. ~ ............ ' ,
~ ,',,,, --- -.. ' - ---- .,. '
i..,.---~ -~ v~ ... ~ ... ~ - "'-
B1 B2 83 84 Bs B5 B7 Be Bg 810 B11 8 12 B13
Bottom Steel Gauges (Upward Load End)
I I I I I I I I I I I I I I I
I I I I I I I I I I I I I I I I I I I I I I ' I
:a,b 181 I r2: 18' 1a,1 iB51 1B(;-i 1B71 188' ~I 'B11 •Btf 'Bi -~ I I I : '9: I : ' : I : I : I : ' : I I I
I I I I I I I I I I I I I I I I I I I I
I I I I I I I, I I I I I I I I I I I I I I I I I I I I I
I I I I I I I I I I
I : I I
I ; I I I I I I : I : I I : 'i I I I
' I
I I : I Ti I :2 1 'ljl
I~: 17s I 'ls' l7: 17s I t"lg I :Tia: : r,, :12: ' I I I I I I I I I I I I
I I I I I I I I I I I I I I I I I I I I I I I
Location of Strain Gauges
At maximum moment At maximum displacement - - - -
I I
Yield S, ress
~V. - , , -
' , , , ...
V ~ r"-. --- ~ ... -= -T1 72 T3 i, Ts T5 T7 Ta Tg Tio 11 12 13
Top Steel Gauges ( Downward Load End)
FIG. 3.45 STRESSES IN SLAB STEEL OF SPECIMEN 5S
10,000
9000
8000
; 7000 fl)
~ 6000 .... ~ 5000 E 0 ~ 4000
3000
2000
1000
Deflections
TI - - - -Yield Moment &\\
Shearhead
131
DOWNWARD LOAD
C~~~~~~==~~t~E==32
~ __ i_
(a) Gauge Locations
0 L--L.-.J._.,L___.,L__L____L_..1_.,L_::...:t_~i,.-~c.:::r::::;:i~------0 1 A 2 3 4 5 6 B 7 8 9 10 - 1r c-12- -13 13, 5
...... fl)
.Q
3000
~ 2000 0 (II
.c:: V,
1000
Distance from Column Face (ins.)
(b) Distribution of Moments on Channel Section
Deflections 4.0~
LL Wts.
\ \ \ \ \
\ \
\ \
\ ~
OO 1 A 2 3 4 5 6 B 7 8 9 10 11 C 12 13 13,5 Distance from Column Face (ins.)
(c) Distribution of Shear Force on Channel Sections
Fig.3.46-STRESSES IN SHEARHEAD OF SPECIMEN 55

132
FIG. 3.47 CRACK PATTERN OF SPECIMEN 55
FIG.3.48 SPECIMEN 55 AT 41N. EDGE DISPLACEMENT
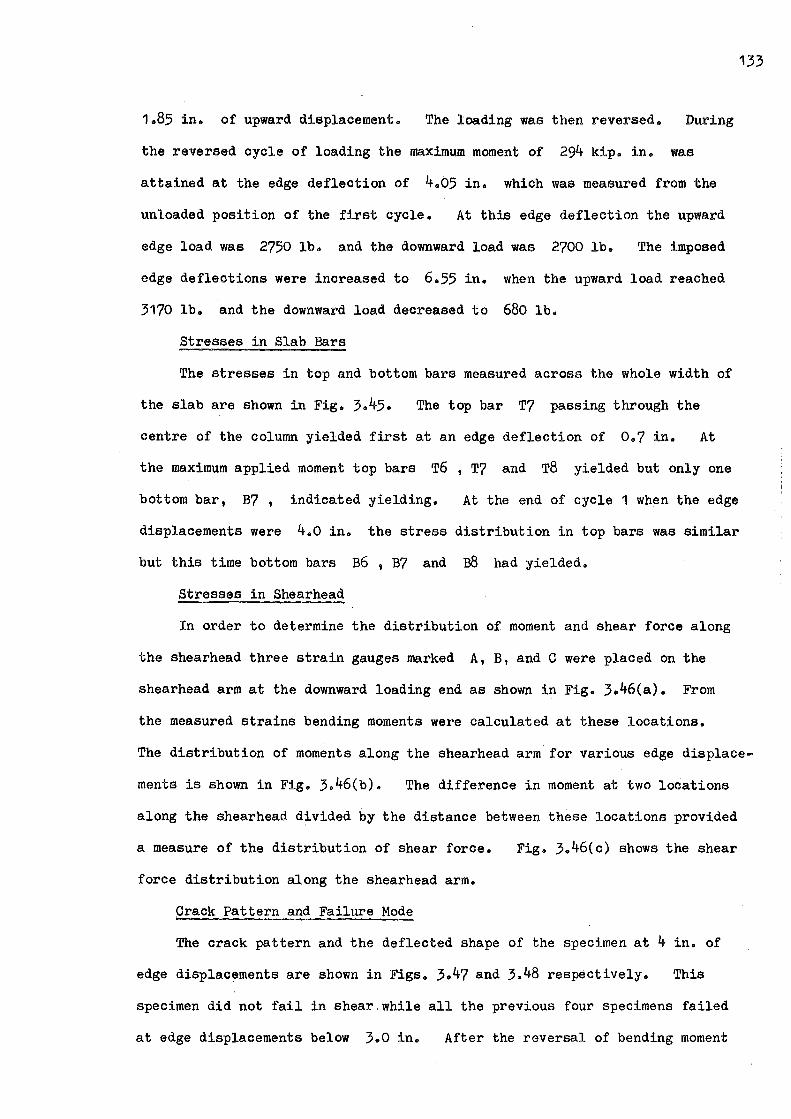
1.85 in. of upward displacement. The loading was then reversed. During
the reversed cycle of loading the maximum moment of 294 kip. in. was
attained at the edge deflection of 4.05 in. which was measured from the
unloaded position of the first cycle. At this edge deflection the upward
edge load was 2750 lb. and the downward load was 2700 lb. The imposed
edge deflections were increased to 6.55 in. when the upward load reached
3170 lb. and the downward load decreased to 680 lb.
Stresses in Slab Ba.rs
The stresses in top and bottom bars measured across the whole width of
the slab are shown in Fig. 3.45. The top bar T7 passing through the
centre of the column yielded first at an edge deflection of 0.7 in. At
the maximum applied moment top bars T6 , T7 and T8 yielded but only one
bottom bar, B7, indicated yielding. At the end of cycle 1 when the edge
displacements were 4.o in. the stress distribution in top bars was similar
but this time bottom bars B6 , B7 and B8 had yielded.
Stresses in Shearhead
In order to determine the distribution of moment and shear force along
the shearhead three strain gauges marked A, B, and C were placed on the
shearhead arm at the downward loading end as shown in Fig. 3.46(a). From
the measured strains bending moments were calculated at these locations.
133
The distribution of moments along the shearhead arm for various edge displace
ments is shown in Fig. 3.46(b). The difference in moment at two locations
along the shearhead divided by the distance between these locations provided
a measure of the distribution of shear force. Fig. 3.46(c) shows the shear
force distribution along the shearhead arm.
Crack Pattern and Failure Mode
The crack pattern and the deflected shape of the specimen at 4 in. of
edge displacements are shown in Figs. 3.47 and 3.48 respectively. This
specimen did not fail in shear.while all the previous four specimens failed
at edge displacements below 3.0 in. After the reversal of bending moment
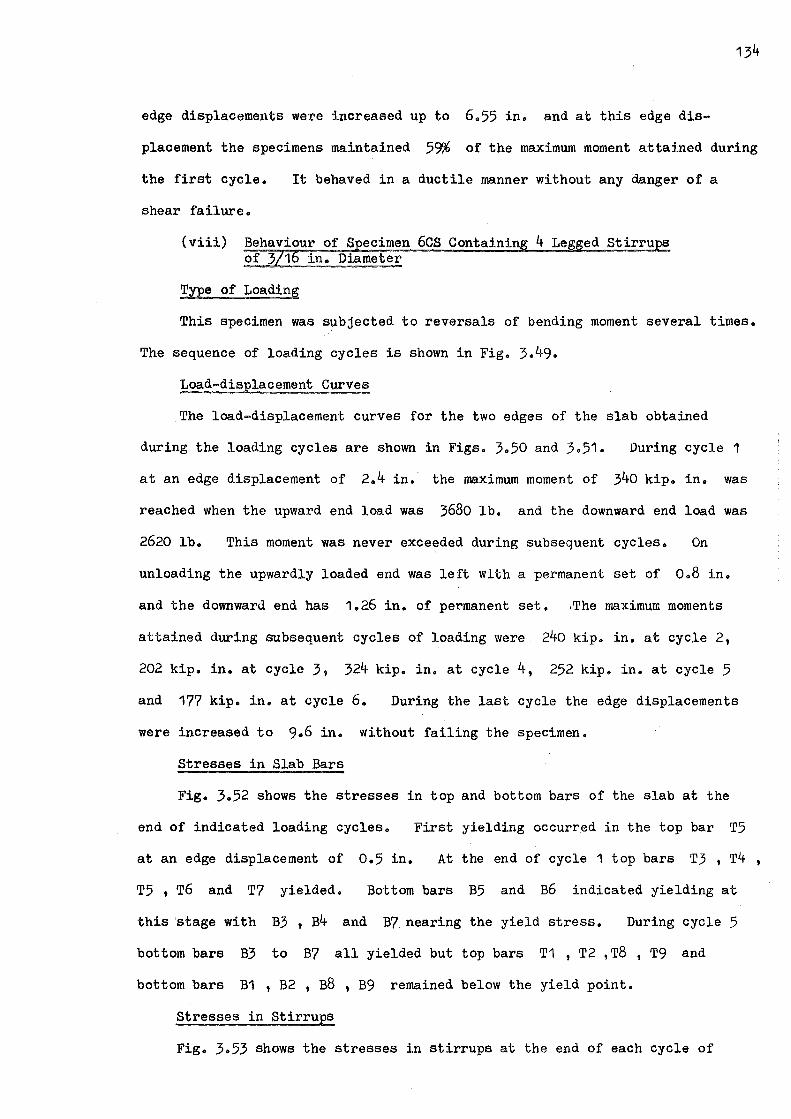
edge displacements were increased up to 6.55 in. and at this edge dis
placement the specimens maintained 59% of the maximum moment attained during
the first cycle. It behaved in a ductile manner without any danger of a
shear failure.
(viii) 6CS Containin ed Stirru
Type of Loading
This specimen was subjected to reversals of bending moment several times.
The sequence of loading cycles is shown in Fig. 3.49.
Load-displacement Curves
.The load-displacement curves for the two edges of the slab obtained
during the loading cycles are shown in Figs. 3.50 and 3.51. During cycle 1
at an edge displacement of 2.4 in. the maximum moment of 340 kip. in. was
reached when the upward end load was 3680 lb. and the downward end load was
2620 lb. This moment was never exceeded during subsequent cycles. On
unloading the upwardly loaded end was left with a permanent set of o.8 in.
and the downward end has 1.26 in. of permanent set. ,The maximum moments
attained during subsequent cycles of loading were 240 kip. in. at cycle 2,
202 kip. in. at cycle 3, 324 kip. in. at cycle 4, 252 kip. in. at cycle 5
and 177 kip. in. at cycle 6. During the last cycle the edge displacements
were increased to 9.6 in. without failing the specimen.
Stresses in Slab Bars
Fig. 3.52 shows the stresses in top and bottom bars of the slab at the
end of indicated loading cycles. First yielding occurred in the top bar T5
at an edge displacement of 0.5 in. At the end of cycle 1 top bars T3 , T4 ,
T5 , T6 and T7 yielded. Bottom bars B5 and B6 indicated yielding at
this ·stage with B3, B4 and B7. nearing the yield stress. During cycle 5
bottom bars B3 to B? all yielded but top bars T1 , T2 ,T8 , T9 and
bottom bars B1 , B2, BB, B9 remained below the yield point.
Stresses in Stirrups
Fig. 3.53 shows the stresses in stirrups at the end of each cycle of
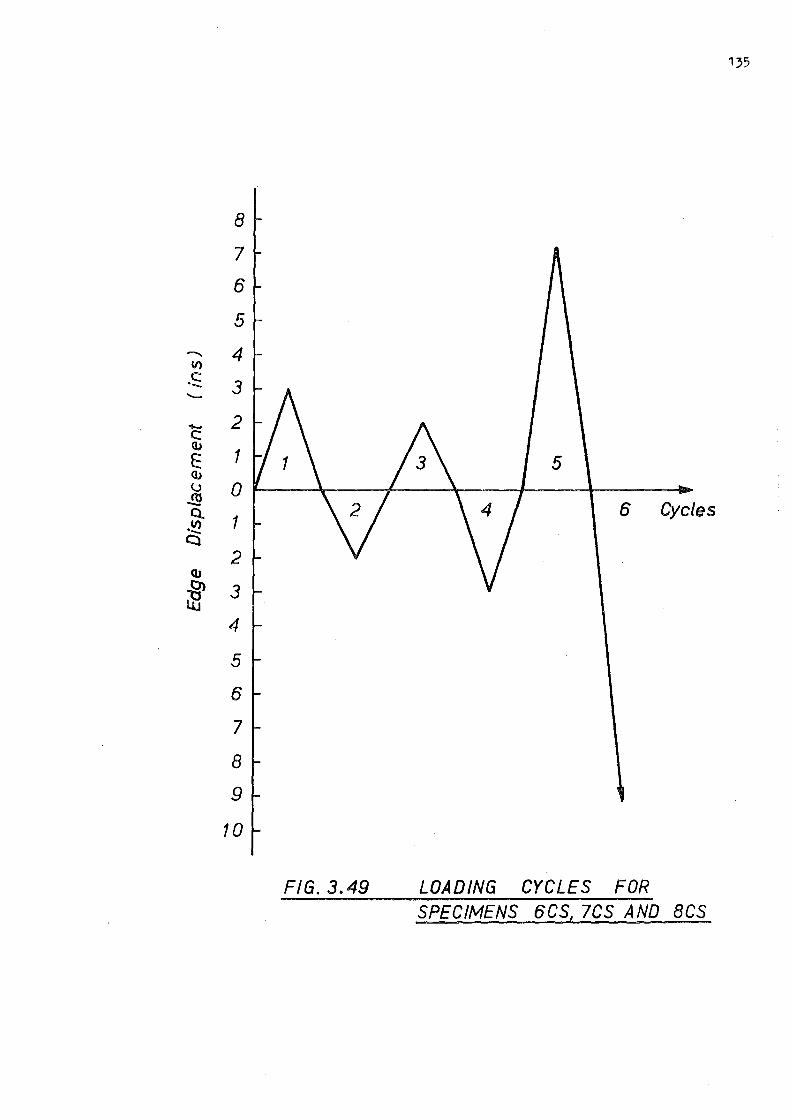
135
8
7
6
5
- 4 V)
.s 3 ...._
- 2 c:: <lJ
1 E 5 <lJ l> 0 -!Y 6 Cycles Q.
1 -~ Cl
2 <lJ
~ 3 lJJ
4
5
6
7
8
9
10
FIG. 3.49 LOADING CYCLES FOR SPECIMENS 6CS, 7CS AND BCS
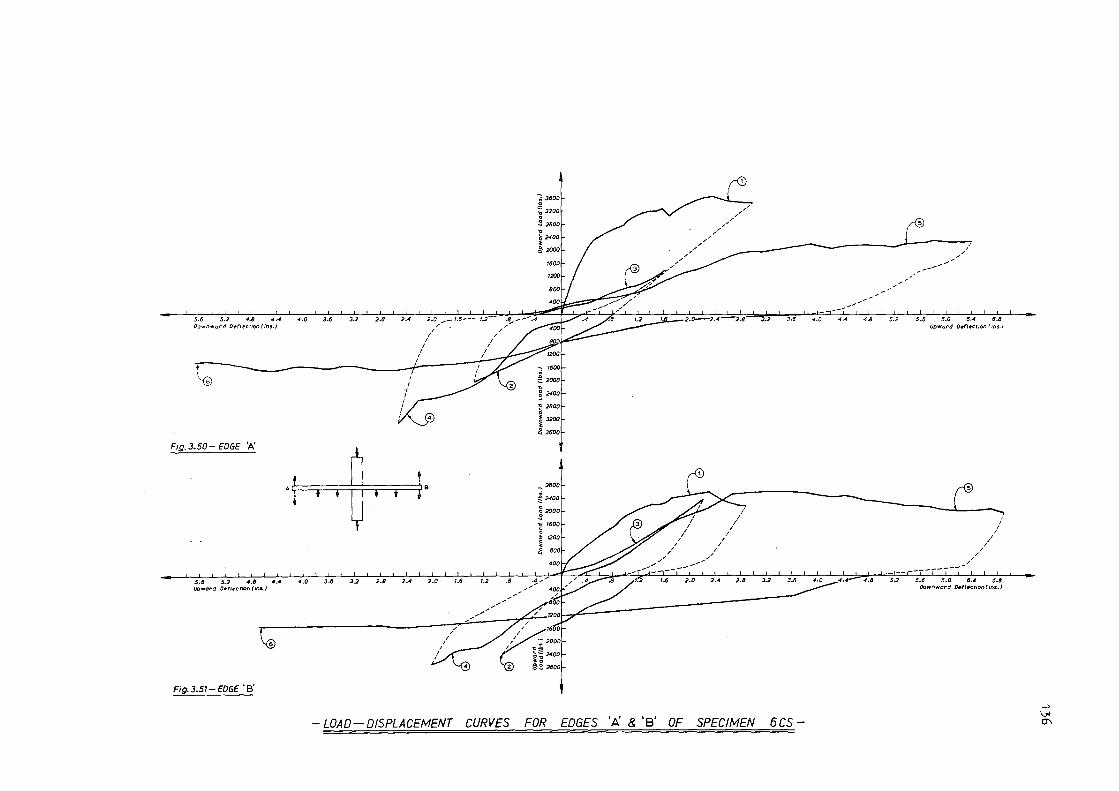
5,6 5,2 4,8 4,4 4,0 Downward Deflection fins.)
~
F,g. 3.50 - EDGE 'A
Al I
•
5-6 5,2 4 .• 4.4 4.0 Upward D•fl•ct,on(Jns.J
6
Fig.3.51-EDGE 'B'
3-6 3-2 2.8 2.4
r1i • • i i t •
3.8 3.2 2.• 2.4
] 3500
'i 3200
~ 2800 .. ~ 2400 • ~ 2000
2.0 --1.6--- 1..2----:o!,---.4 / /
/ / I /
I I I I
I I I
.' _____:..-, - -. 1500 .;
~ \r;:, ~ 2000 .. 2 2400
~ 2800
~ 3200 • g 3600
4 ie ..., 2800
~ 2400
} 2000
! 1600
i 1200
8
2.0 1.6 1.2 .8 ;1-' , , /
/ , / , ,
✓✓-, /
/ I
_-:_ __ _ /
/ /
/'
1-6
I I
I I
I I
2.0 2,4 2-8
- LOAD- DISPLACEMENT CURVES FOR EDGES 'A & 'B' OF SPECIMEN
/ ,'
3.2 3-6 4,0 4-4 4,8
3-2 3.6 4,8
6CS-
,,"',,,.,
--✓
5.2
=-·--·-
/ / _____ .,
5.6 6.0 6-4 6.8 Upward o .. f/ .. ct1on ( ms.)
5,
/ ___ .... /
/ /
/
I I
I
5-2 5.6 6.0 6.4 6.8 Downward D•fl•ct/on(ms.)
__, \.,J O'\
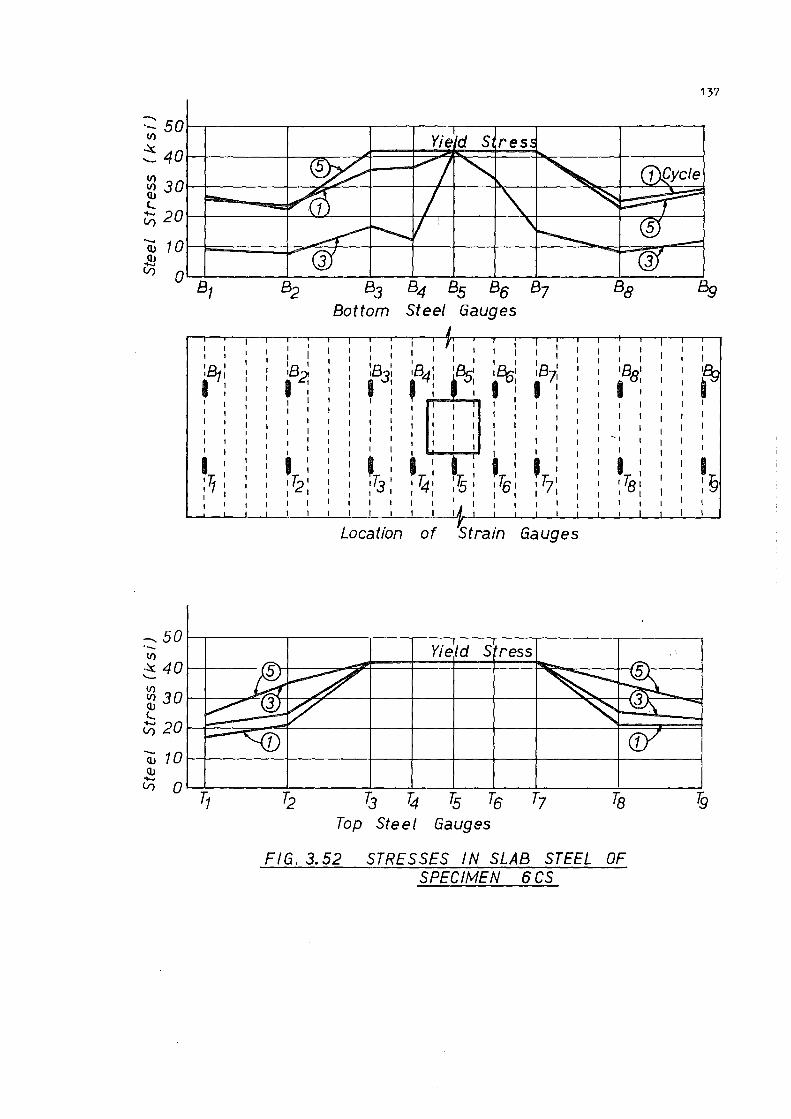
137
--.. ·- 50 V)
::_ 40
~ 30 (l)
'-'t; 20
- 10 (l)
~ V') 0
B1 B2 B3 B4 B5 B5 B7 Bottom Steel Gauges
I I I I I I I I I I I I
I I I I I I I I I I I 'BI
I
'%' 'BI :B1 'BI ,B41 1%: 'Bal '2 I 31 I I I 71
I : ' : I I : I : t I I I I I I I I I
I I I I I I I I
I I ~,
I I I I I
I I I I I
Tt 72 ' : I : '7': • ' : I : ~9 17j I I 741 ,51 I 7i5 ,Ti ,T81
I I I I I I I I I I I I I I
I
Location of Strain Gauges
--.. 50 ·-V) Yield S ress .:::c 40 '-
)2 30 (l)
'-t:, 20
-- 10 (l) QI .....
V') 0 T1
Top Steel Gauges
FIG. 3.52 STRESSES IN SLAB STEEL OF SPECIMEN 6 CS
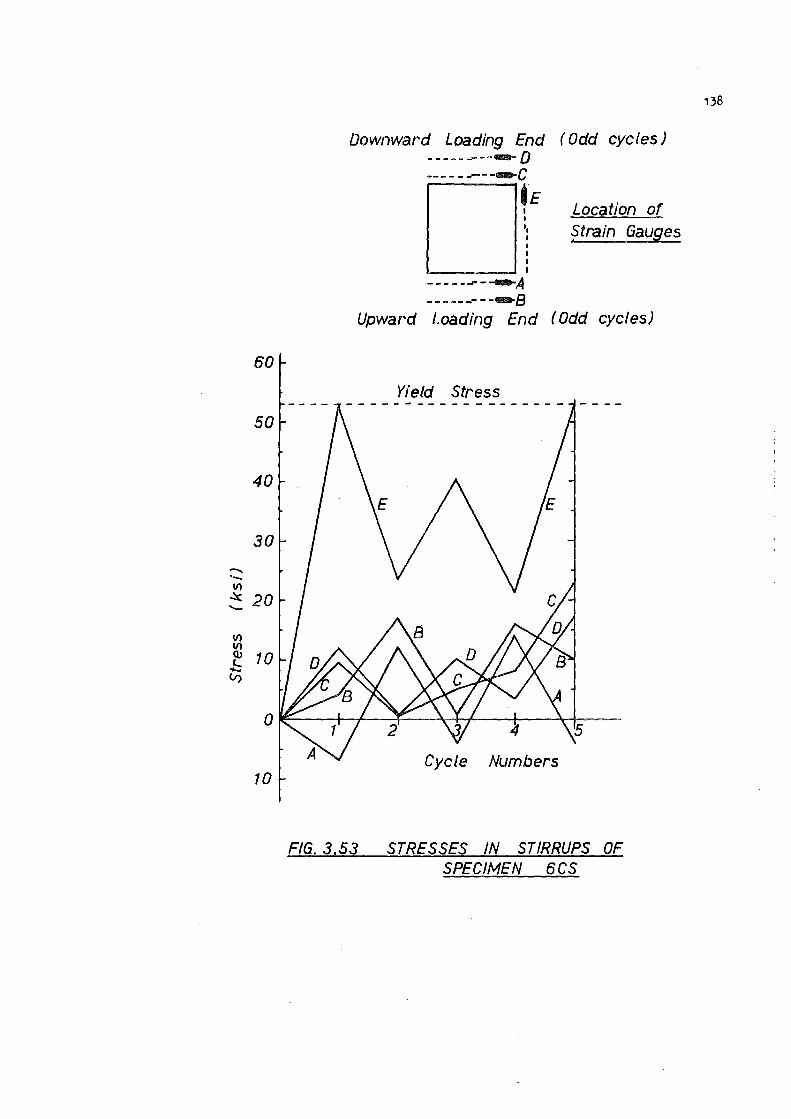
60
50
40
30
-·-V)
~ 20 -V)
~ 10 .b V)
10
Downward Loading End ----- ------o ---------'1llllflllt-c
tE I I ,, I I I I
.,__ __ ---,1 I
----------A ---------~B
Upward Loading End
Yield Stress
(Odd cycles)
Location of $train Gauges
( Odd cycles)
Cycle Numbers
FIG. 3.53 STRESSES IN STIRRUPS OF SPECIMEN 6CS
138
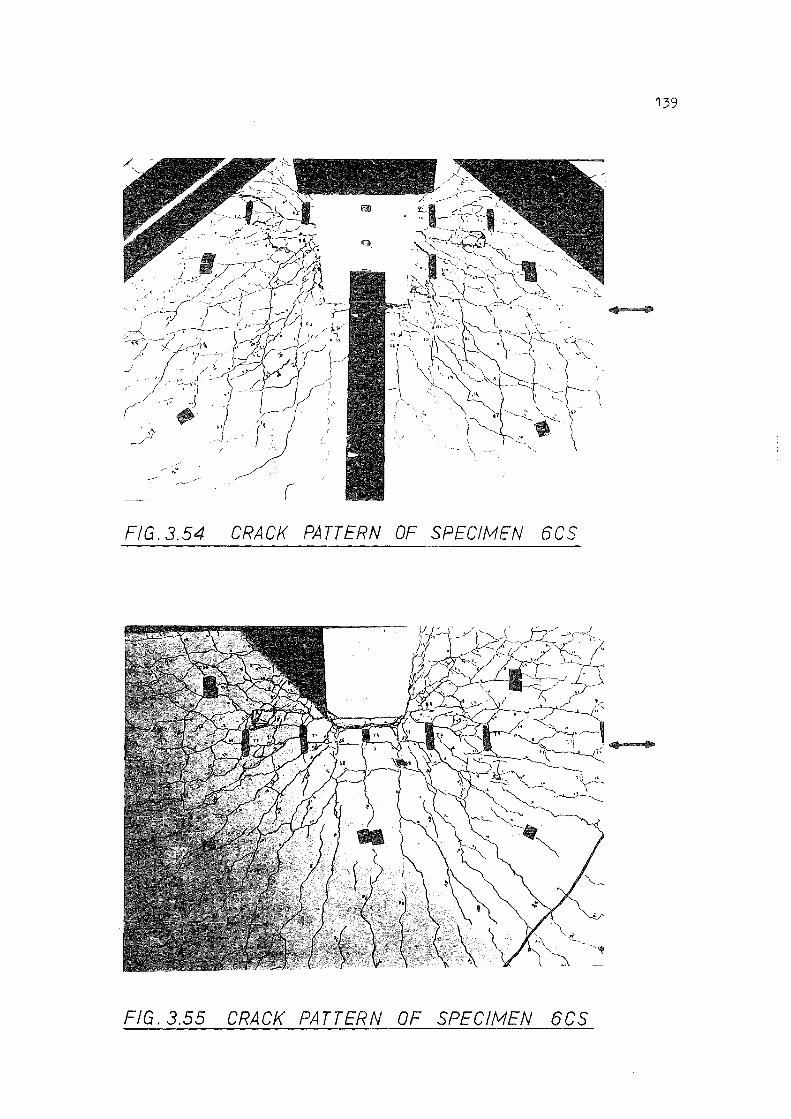
139
FIG. 3.54 CRACK PATTERN OF SPECl/vfEN 6CS
..
FIG. 3.55 CRACK PATTERN OF SPECl/v/EN 6CS
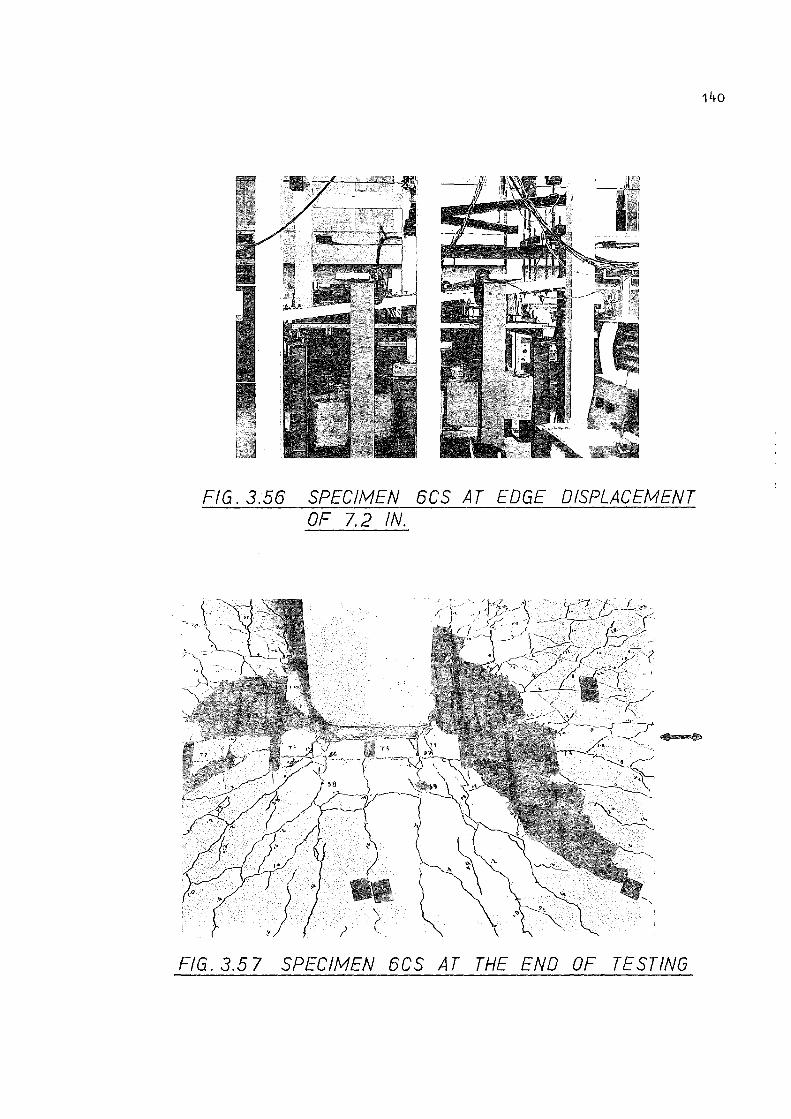
FIG. 3.56 SPECIMEN 6CS AT EDGE DISPLACEMENT OF 7.2 IN.
' ; (
FIG. 3.5 7 SPECIMEN 6CS AT THE END OF TESTING

loading.
loading.
utilised.
Stirrups marked A, B, C and D did not yield at any stage of
This indicates that a smaller area of stirrup steel could be
The stirrup E yielded at the end of cycle 1 indicating high
torsional stresses set up on the column faces parallel to the direction
of bending.
Cracking and Failure Mode
The crack patterns obtained on the top surface of the slab at the end of
cycle 5 are shown in Figs. 3.54 and 3.55. The deflected shape at an edge
displacement of 7.2 in. is shown in Fig. 3.56. This specimen did not
fail in punching shear. The cracking on the slab surface ·was extensive but
the specimen behaved in a ductile manner. A view of the slab-column junction
at the end of the test is shown in Fig. 3.57. It shows that the stirrups of
closed type prevented the punching shear failure in the slab near the column
faces transverse to the direction of bending but the column faces parallel to
the direction of bending are cracked in torsion.
(ix) Behaviour of S ecimen ?CS Containin of in. Diameter
Type of Loading
This specimen was subjected to several cycles of loading reversals as
shown in Fig. 3.49.
Load-displacement Curves
The load-displacement characteristics for the two edges of the slab are
shown in Figs. 3.58 and 3.59. The numbers on the curves correspond to the
cycle numbers given in Fig. 3.49. The maximum moment ef 369 kip. in. was
reached at an edge displacement of 2.2 in. during cycle 1 when the upward
edge load w~s 3900 lb. and the downward edge load was 2940 lb. The
moments attained during subsequent cycles of loading were. 213 kip. in. at
cycle 2, 233 kip. in. at cycle 3, 304 kip. in. at cycle 4, 302 kip. in. at
cycle 5 and 176 kip. in. at cycle 6. During the last cycle the edge
displacements were increased up to 11.2 in. without failing the specimen.
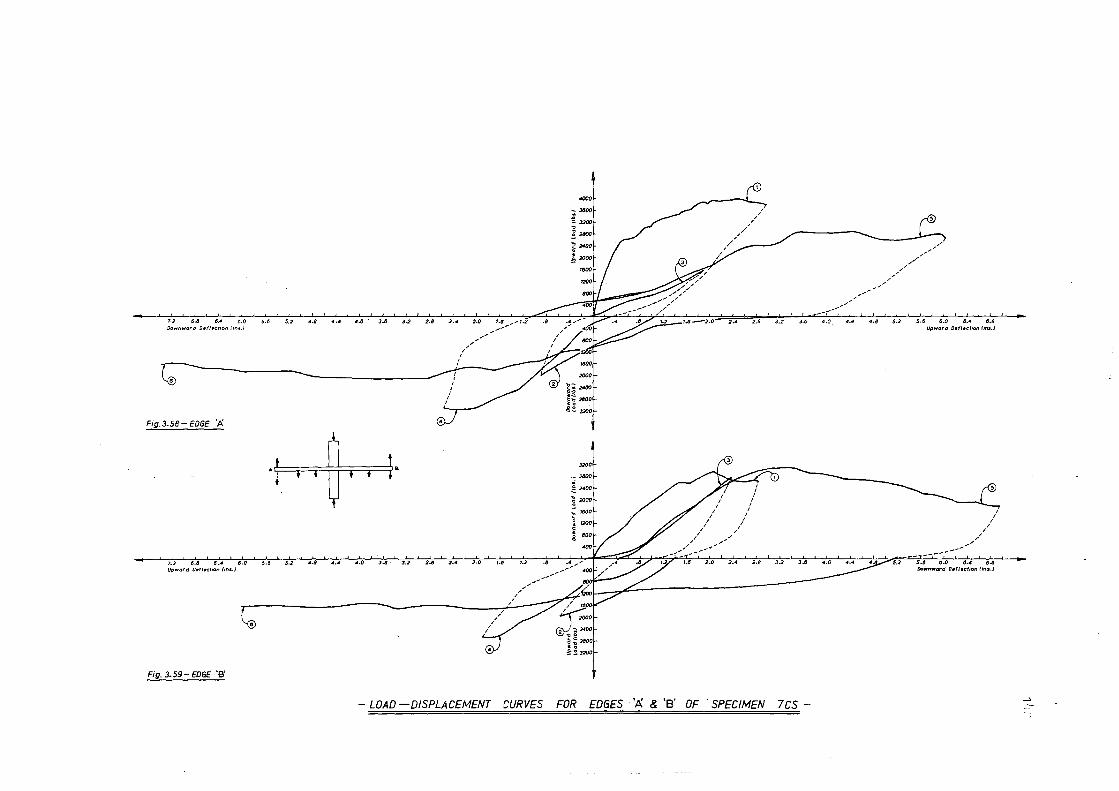
,., 6-8 , .. 6.0 5., 5.> ..• 4.0 • J.6 3-> Downward D•fl•ct,on tm,.J
Fig.3.58-£06£ 'A
I : : Al, l l ,I, ,I, ;1e
7.2 6.8 6 .4 tJ.O - 5.6 5.2 4.8 4.4 4.0 J.ts J.2 Upward 0ttflttet1on (ms J
Fig. 3.59- £DG£ 'B'
, .. 2.4 2.0 1.tf ... - ,-2
/.,.,,.,, ......
:'
2.11 2.4 2-0
,.,. ...........
, ..
I I
I I
I
,.,
,000
~ 3000
~ J200
" 3 aoo
3200
- >800
~ 2400
..
, .. , ..
7 I I I
I I I I
I I I I
I I I I
I I I I
I I I /
, ...... ~,,,,_:~-- ... ,f",,,,..,,,,,
3.>
1.6 2.0 2.4 2-8 J.2
3.6
- LOAD-DISPLACEMENT CURVES FOR EDGES 't:, & 'B' OF SPECIMEN 7CS -
,,,,.,,,,.,,,,, ____ .,,, 4.0,
/ ~--..•
/ ,,,.,,,"''"
..,
.,,..,. .... /
/
5-6 6.0 6.4 6.8 Up word 0ttf/ttct1on (ms.)
// //
_ _,------I
, I
I
ts.4 ,s..a
~

The maximum moment attained during cycle 1 was never exceeded during subsequent
cycles of loading.
Stresses in Slab Bars
Fig. 3.60 shows the stresses in top and bottom bars at selected locations
across the width of the slab during loading cycles 1 , 3 and 5. As before
first yielding occurred in top central bar, T5 , at an imposed edge
displacement of o.6 in. During cycle 1 top bars T3 to T7 and bottom
bars B3 to B7 all yielded. Top bars T1 , T2, T8 , T9 and bottom bars
B1 , B2, B8 , B9 always remained below the yield stress level during all
cycles of loading.
Stresses in Stirrups
The location of strain gauges on stirrups and the stresses attained at
those locations during each loading cycle are shown in Fig. 3.61. During
cycle 1 when the maximum applied moment was recorded stresses in stirrups
A, B, C and D were far below the yield stress level but the stress at E
was quite high. During cycle 5 yielding was observed to occur at A and E
and during the last cycle of loading gauges at C and D also yielded.
Unfortunately the strain gauge B ceased to function after cycle 3 and it was
not possible to see whether this gauge also showed yielding during the last
two cycles. The reason for yielding in 2 legged stirrups of this specimen
may be due to the fact that the bulging action of the central top and bottom
slab bars could have caused bending stresses in the extreme fibres of
stirrup bars to exceed the yield point. In specimen 6CS the use of 4 legged
stirrups prevented the bulging action of the central top and bottom slab bars
and consequently the stresses were restricted below the yield point.
Cracking and Failure Mode
This specimen behaved in a ductile manner and did not fail in punching
shear arour.d the column. A view of the. crack pattern at the end of testing
is shown in Fig. 3.62. Major cracking took place at the side faces of the
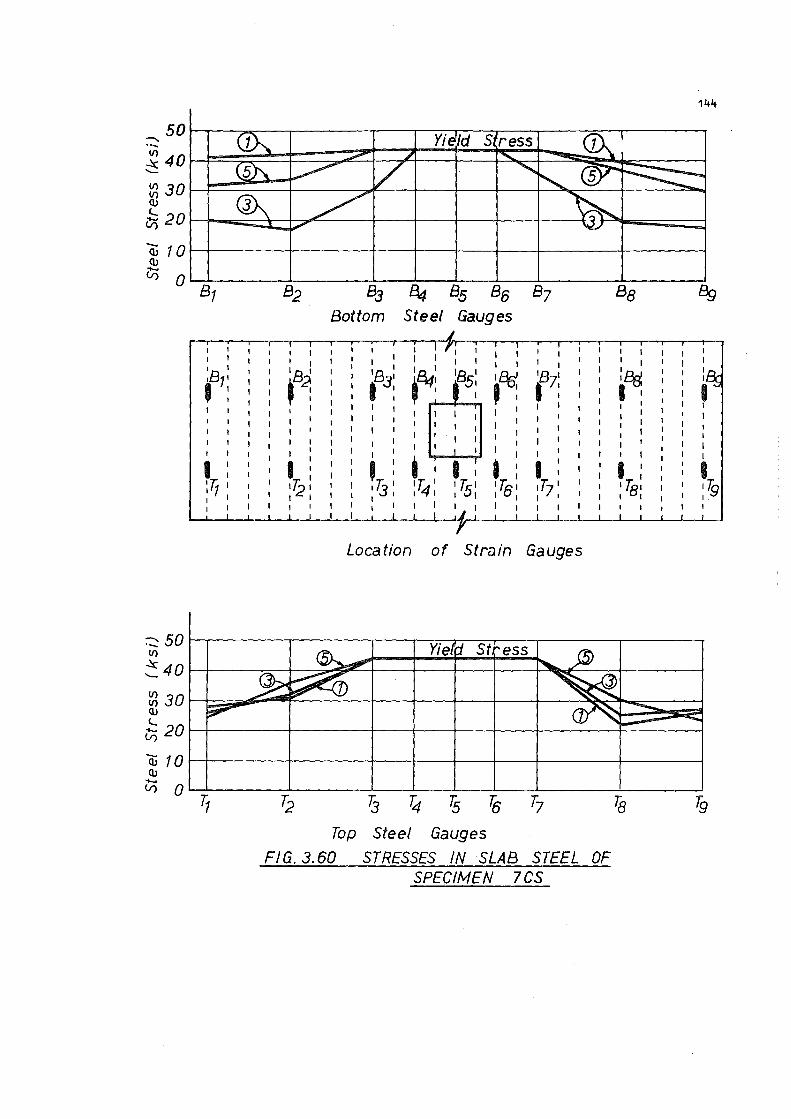
144
50t--r-------,----,r--,--,-:-:-,---,--.----=--r-------, -·-~ 40 w~~~t::~~~=:4=+=~~::t~~;-s~--2'-=1-=---1 ~30W~~~:r=:_---:.,~-+--l--l--~~~~-+----=:~~ (1)
'tr, 20 11-=;;;;;;;;;:t::::t;;;~--,-11- 1 - 1 --\
~10-------1----------------1------+----~ (1)
v5
I I I I I
,B71 ' : I I I
'B' ,~ I I
I I
I
I
I : 172 I I I
Bottom Steel Gauges
I I I
'BI 13
I
I
' ,lj I
Location
I I
,85: I
I
I
I I
'87' I : I I
I
I I
1T7 1
I t
I
of Strain Gauges
I
I I
:eg I I I I
I I
I : 'Ta, I I
~ 50 1----.------.-------.---.--y,-·e-.--S-tr~e-s-s~----~---~
~ 4 0 t--f-----=--+--=~5iiii"'"------1--+---+-----+---+---"'ll~---=-+-----l
~ 3 0 H~~::;;..,,oa~ _ ___::__-t----t--t--t--t------:~~~"::;. '= ;;;;:,=-~-S-::il--jq
~ 20 r--ie-------1-----------+----+-----1------+-------
~ 10 r--ir-----+------i--+---+----+----+-----+------(1) ...... ~ o----------_.._ __ ._ _ _._ _ _._ ________ ._ ___ ~
ft 7j 7j 74 7s ~ T7 Ta lg
Top Steel Gauges FIG. 3.60 STRESSES IN SLAB STEEL OF
SPECIMEN 7CS

50
40
30
-·-20 V)
~ -v, 10 V) <lJ c... .....
V)
10
20
Downward Loading End ( Odd cycles) 145
D..Jffll//!lfl/l------______ ,__ C I
tE Location of I
Strain Gauges.
- - - - - - --A B --- - - - - --
Upward Loading End ( Odd cycles J
Yield Stress
5 6 Cycle Numbers
FIG. 3.61 STRESSES IN STIRRUPS OF SPECIMEN 7C S
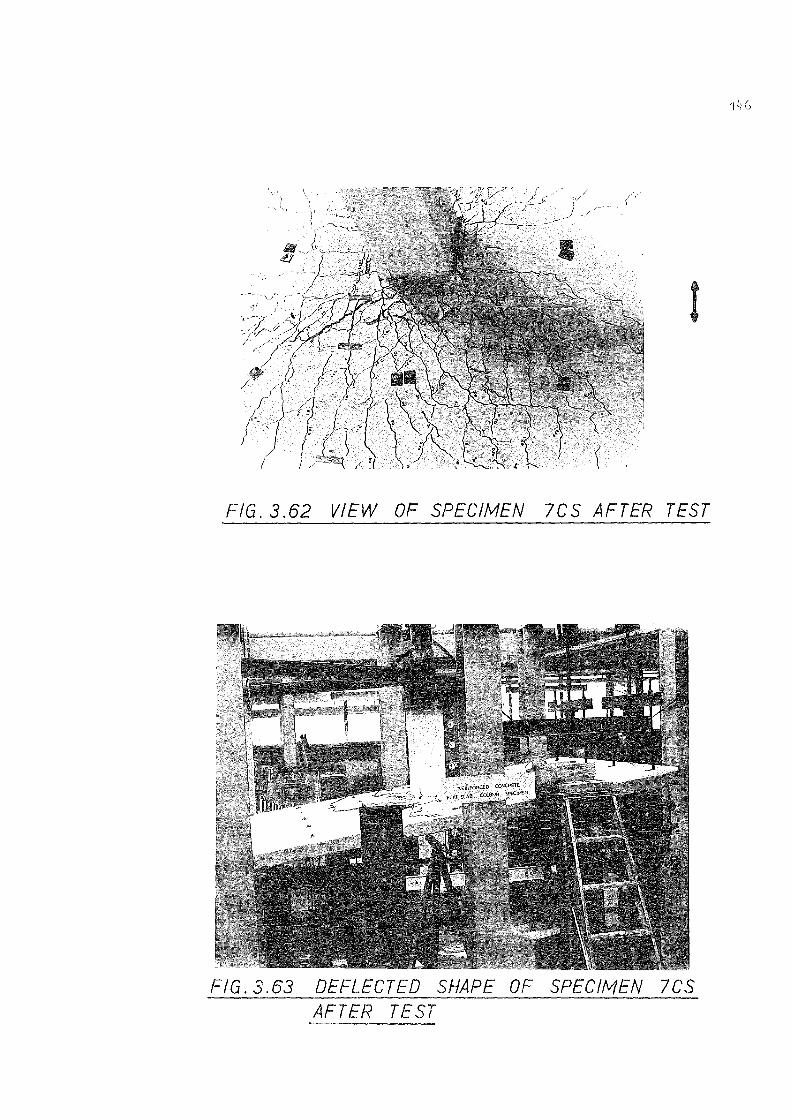
, .,/ {' ____ .. } __ / / - -
l
FIG. 3.62 VIEW OF SPECIMEN 7CS AFTER TEST
FIG. 3.63 DEFLECTED SHAPE OF SPECltv/EN 7CS AFTER TEST
'\1:6

column-slab junction parallel to the direction of bending and also on the top
surface of the slab at the downward loading end. In spite of these cracks
the specimen maintained nearly 50% of the maximum moment attained during
cycle 1 at the end of testing when the edge displacements were increased up to
11.2 in. A view of the deflected shape of the slab is shown in Fig. 3.63
at the end of testing.
(x) Behaviour of Specimen Bes
Type of Loading
This specimen was also subjected to several cycles of loading reversals
similar to those for specimens 6CS and 7cs.
Load-deflection Characteristics
The load-displacement curves for the two loading edges are shown in
Fig. 3.64 and 3.65. The maximum moment of 309 kip. in. was attained at an
edge displacement of 3.0 in. during cycle 1 when the upward edge load was
3280 lb. and the downward load was 2440 lb. The moments reached during
subsequent cycles of loading were 169 kip. in. at cycle 2, 180 kip. in. at
cycle 3, 267 kip. in. at cycle 4, 267 kip. in. at cycle 5 and 171 kip. in.
at cycle 6. During the last cycle the edge displacements were increased up to
10.7 in. without causing failure in the specimen.
Stresses in Slab Bars
Fig. 3.66 shows the ~tresses in slab bars at selected positions during
loading cycles 1, 3 and 5. As observed in other test specimens first
yielding took place in the top central bar T5, at an imposed edge displace
ment of o.6 in. During cycle 1 top bars T3 to T7 and bottom bars B4 to
B6 yielded. At the end of cycle 3 top bars T3 to T7 were past their yield
stress levels but among the bottom bars only B5 indicated yielding. At
the end of cycle 5 the stress distribution was similar to that obtained at
cycle 1. Top bars T1 , T2, T8 1 T9 and bottom bars B1 , B2, B3 , B7 1
B8 , B9 always remained below their yield stress levels during all cycles of
loading.
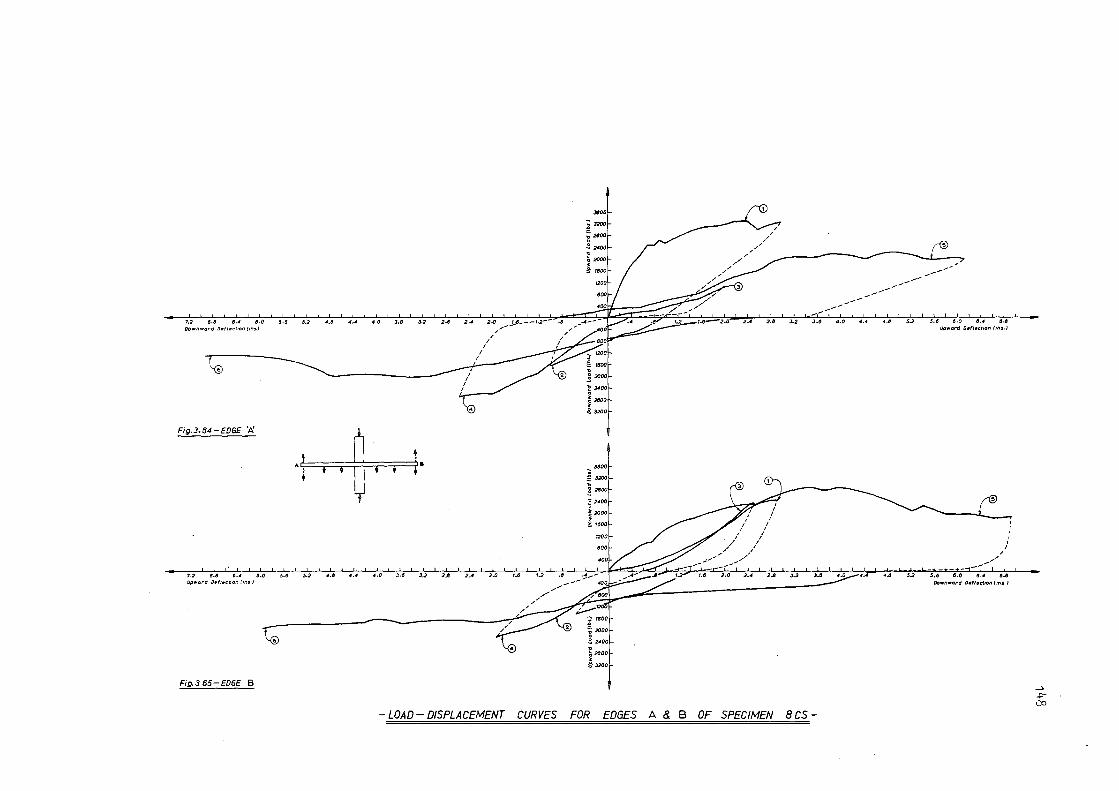
,., o.8 tJ.4 tJ,0 5,0 5,2 4.8 40 , .. 3.2 , .. ,., Downward Drr1rct1on (,n~
Fig.3.64-E0GE 'P,:
,' l 1 : : • • ;, n
I I
2.()✓ ....... J,...JS---1.2--- -8
/ /
I
3'00
: 3200
; 2800
.3 2400
t2000 • .g. moo
~
_; 21'.JOOi
! 2400
~ 2800 • 8 3200
...,,. 3tJOO
i u,o ~
~ 2fJOO
~ 2400
I 2000
8 1800
1200
"'
/,/✓/ /
, ,,✓
,/ /
, ... , ..
,' I
I I
I I
J.2
-------.-, .. 4,0
--------------
4,8 5.2 s.15 e.o tJ • ., a.a Upward D•fl•ct,on f,ns.J
I ' / I , I
/ / , , --1..-...!--L........,L._ _ ...... - ____ .,,,,, - - - - ___ ,,,,
~:.,,,ard ~:fl•eri!~~insl tJ.O 5.tJ 5.2 4./1 4.4 4.0 3.tJ 3.2 2A 2.4 2.0 1.IS 1.2 US 2.0 2-4 2.8 J.2 ~"· 4..4 5.2 s;:,wn•:;: D•fl::,on(,ntJs~
Fig.3 65-E0GE B
~
~ 2600
• :§-3200
- LOAD - DISPLACEMENT CURVES FOR EDGES A & B OF SPECIMEN 8 CS -
-" ~ ,.)0
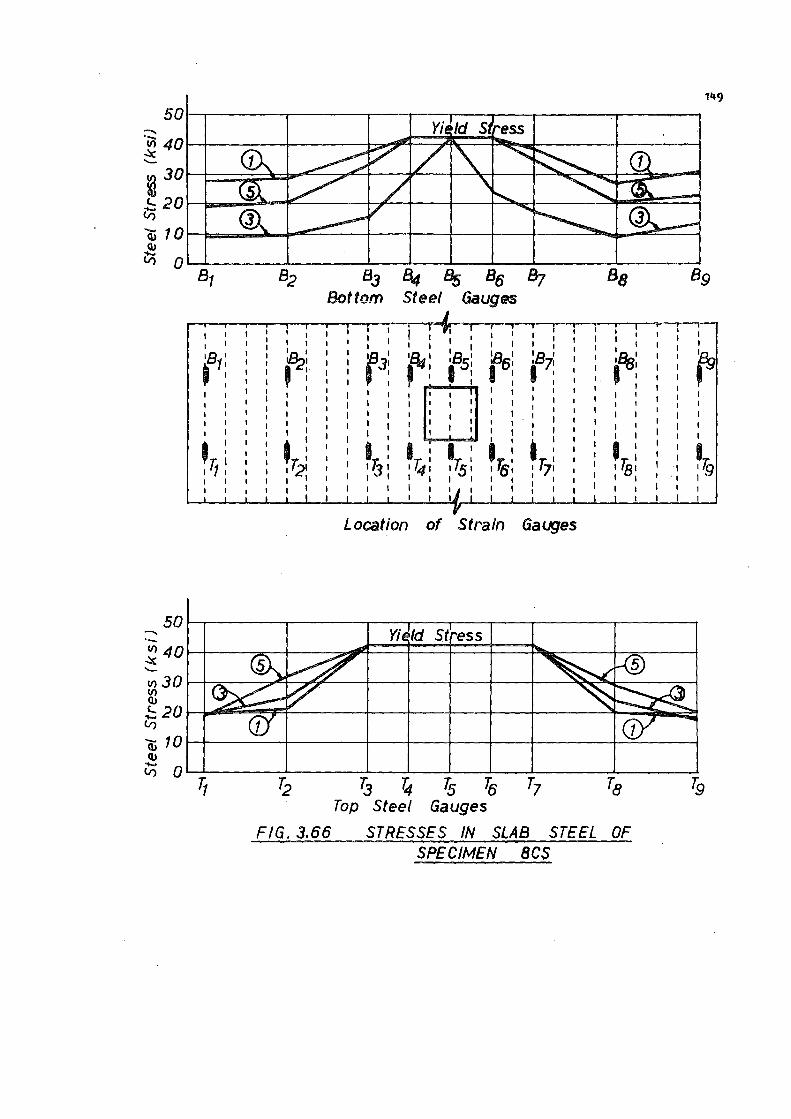
'l49
;---. "vi4ol-+---+----+~~:::;~=::1~.:.J----+--~~ ~ ll 30H:;==;;~~~r---t--r-~tt---t~~~~--'i ~ 20 H-~~~'.:__---i~:_+-+--P~t--~~~~====l ~101-i~-....... ~F""'""'~--;--1r--1r--,r--r--_::,--....,.....-:::,c_--1 (1, t; o.__._ _____ ....._ ____ ........ ________ _._ _ _._ ____ _. _____ __
~ ~ % ~ % % ~ % ~
50 -·-v, 40 .::c '-
v, 30 V) (1,
;:; 20 V) - 10 Cl)
Cl) - 0 V)
r,
I I I
•132· I I ' : I
: I I I I I I I
I t,. : I 12. I I I I
Bot tom Steel Gaugt1S
I I I I
I : 1!3 I I I
I I I I
I I
134----.......• ..... Br .... ' ' - I .J:
1 I
I I ,;, I
I I I I
lB I
I 6: I
I
I
I I I I I I
' I I 'i,: I I I I I
I I I I
18 I I 71 I : I I I I
I I
I I
i : , T7: : I 1
Location of Strain Gauges
Yi Id St ess
7j ~ Ts 7ts Top Steel Gauges
I
I I
'.Q...• •~, ' I
I I I
I I I I
I : I 7B1 I I
FIG. 3.66 STRESSES IN SLAB STEEL OF SPECIMEN BCS
· 1 I I
I I
I ·~ I

60
50
40
30
;_ 20 -
10
20
Downward Loading End ( Odd cycles) 0--------
-----..... c
'E ' location of I , Stf'ain Gauges
' ___ ......... , - -- ----A B ..._.:.. ___ -
Upward Loading End f Odd cycles)
FIG. 3. 67
Yield Stress
Cycle Numbers
B
D
STRESSES IN STIRRUPS OF SPECIMEN BCS
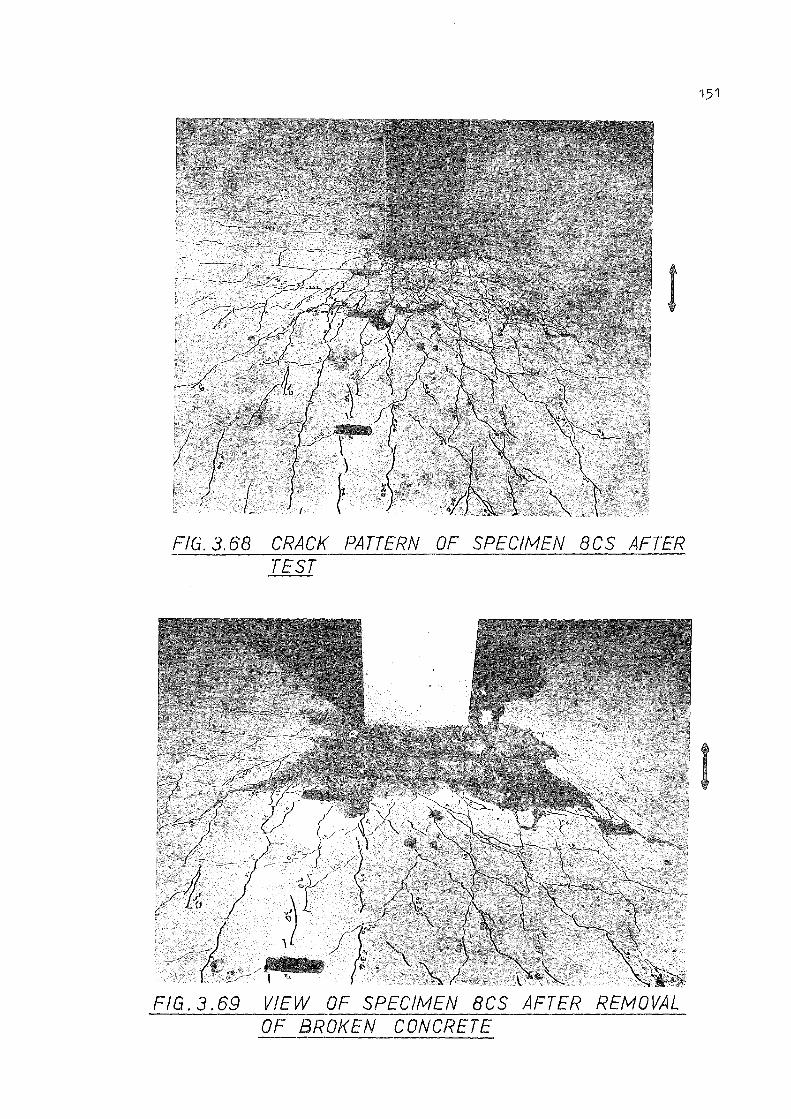
l
FIG. 3.68 CRACK PATTERN OF SPECIMEN BCS AFTER TEST
\.
FIG. 3. 69 VIEW OF SPECIMEN BCS AFTER REMOVAL OF BROKEN CONCRETE
1,51
l
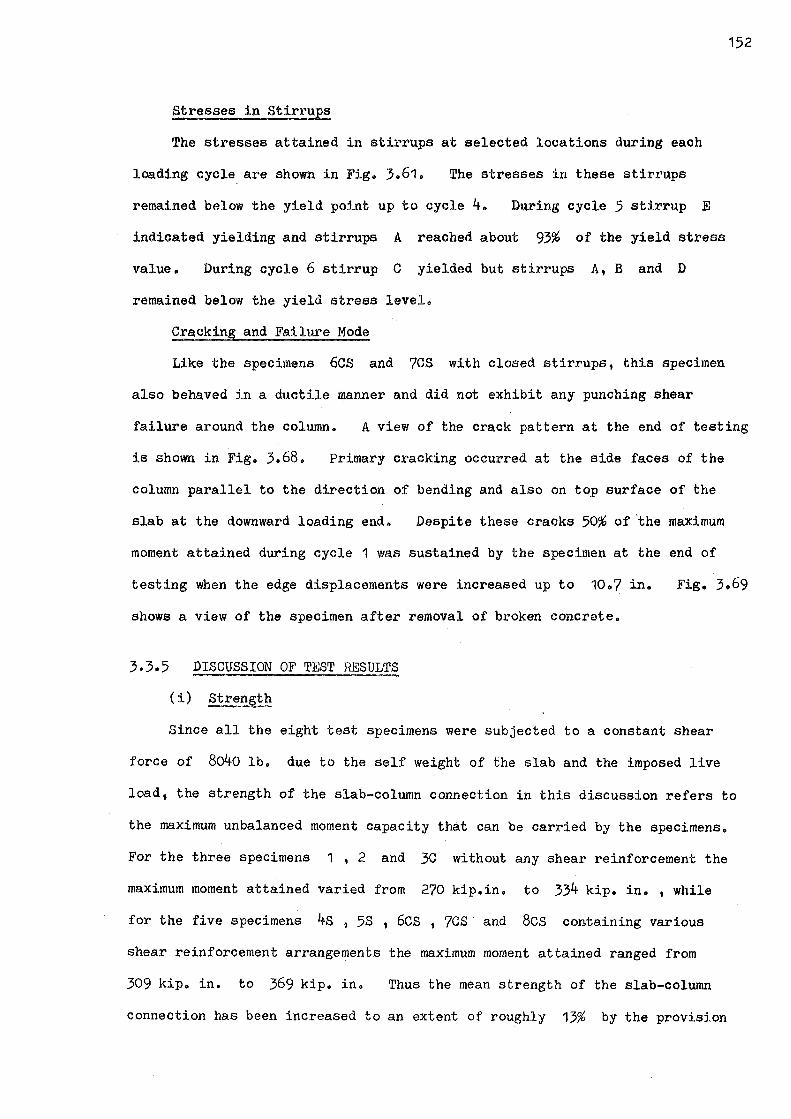
Stresses in Stirrups
The stresses attained in stirrups at selected locations during each
loading cycle are shown in Fig. 3.61. The stresses in these stirrups
remained below the yield point up to cycle 4. During cycle 5 stirrup E
indicated yielding and stirrups A reached about 93% of the yield stress
value. During cycle 6 stirrup C yielded but stirrups A, B and D
remained below the yield stress level.
Cracking and Failure Mode
152
Like the specimens 6CS and ?CS with closed stirrups, this specimen
also behaved in a ductile manner and did not exhibit any punching shear
failure around the column. A view of the crack pattern at the end of testing
is shown in Fig. 3.68. Primary cracking occurred at the side faces of the
column parallel to the direction of bending and also on top surface of the
slab at the downward loading end. Despite these cracks 50% of 'the maximum
moment attained during cycle 1 was sustained by the specimen at the end of
testing when the edge displacements were increased up to 10o7 in.
shows a view of the specimen after removal of broken concrete.
3.3.5 DISCUSSION OF TEST RESULTS
(i) Strength
Fig. 3.69
Since all the eight test specimens were subjected to a constant shear
force of 8o4o lb. due to the self weight of the slab and the imposed live
load, the strength of the slab-column connection in this discussion refers to
the maximum unbalanced moment capacity that can be carried by the specimens.
For the three specimens 1 , 2 and 3C without any shear reinforcement the
maximum moment attained varied from 270 kip.in. to 334 kip. in. , while
for the five specimens 4s , 5S , 6CS, ?CS and 8cs containing various
shear reinforcement arrangements the maximum moment attained ranged from
309 kip. in. to 369 kip. in. Thus the mean strength of the slab-column
connection has been increased to an extent of roughly 13% by the provision
153
of shear reinforcement at the connections. In case of the specimens
without shear reinforcement the concrete compressive strength f' varied C
from 3960 psi to 4630 psi and the yield stress f of slab reinforcing y
bars ranged from 45,820 psi to 54,160 psi. In the specimens with shear
reinforcement the range of fl was from 3210 psi to 4630 psi and that C
of f was from 41,230 psi to 47,740 psi. Due to the variation in the y
material strengths fl and f in each test specimen it is not exactly C y
possible to determine the extent of increase in the strength experimentally.
However, it can be seen that the unbalanced moment capacity of the specimens
with shear reinforcement did not show marked increase over those specimens
without shear reinforcement. The influence of the variation of concrete
strength, f~ , on the strength of slab-column connections may be regarded
as small since theoretically it is the practice to assume direct proportion
ality between the nominal shear stress of concrete and the square root of
its compressive strength. On the other hand the yield stress of slab
reinforcing bars, f , has a marked influence on the strength of the y
connections as the flexural capacity of the slab depends largely on this
value. Since the range of f in the specimens with shear reinforcement y
was lower than that for specimens without shear reinforcement it could be
concluded that the extent of increase in the strength of the reinforced·
connections will be somewhat larger than what could be gauged from
experimental results.
(ii) Ductility
The load-displacement curves indicate very little ductility for the
specimens 1 , 2 and 3C without shear reinforcement. The ratio of
maximum edge displacement to the edge displacement at first yield in a slab
reinforcing bar varied from 4.50 to 6.00. •The maximum edge displace
ments that could be imposed on these specimens were of the order of 2.4 in.
to 2.8 in. The maximum edge displacement to the edge displacement at
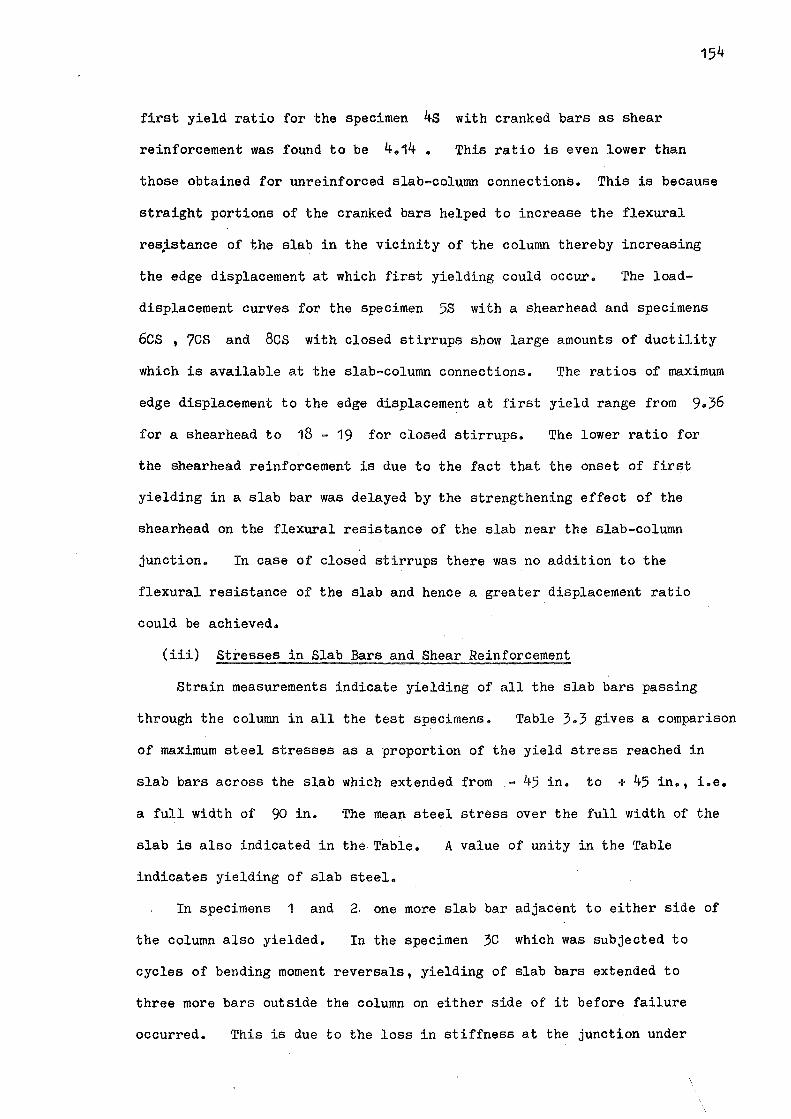
154
first yield ratio for the specimen 4s with cranked bars as shear
reinforcement was found to be 4.14. This ratio is even lower than
those obtained for unreinforced slab-column connections. This is because
straight portions of the cranked bars helped to increase the flexural
reststance of the slab in the vicinity of the column thereby increasing
the edge displacement at which first yielding could occur. The load
displacement curves for the specimen 5S with a shearhead and specimens
6CS , ?CS and 8cs with closed stirrups show large amounts of ductility
which is available at the slab-column connections. The ratios of maximum
edge displacement to the edge displacement at first yield range from 9.36
for a shearhead to 18 - 19 for closed stirrups. The lower ratio for
the shearhead reinforcement is due to the fact that the onset of first
yielding in a slab bar was delayed by the strengthening effect of the
shearhead on the flexural resistance of the slab near the slab-column
junction. In case of closed stirrups there was no addition to the
flexural resistance of the slab and hence a greater displacement ratio
could be achieved.
(iii) Stresses in Slab Bars and Shear Reinforcement
Strain measurements indicate yielding of all the slab bars passing
through the column in all the test specimens. Table 3.3 gives a comparison
of maximum steel stresses as a proportion of the yield stress reached in
slab bars across the slab which extended from - 45 in. to + 45 in., i.e.
a full width of 90 in. The mean steel stress over the full width of the
slab is also indicated in the Table.
indicates yielding of slab steel.
A value of unity in the Table
In specimens 1 and 2. one more slab bar adjacent to either side of
the column also yielded. In the specimen 3C which was subjected to
cycles of bending moment reversals, yielding of slab bars extended to
three more bars outside the column on either side of it before failure
occurred. This is due to the loss in stiffness at the junction under
\
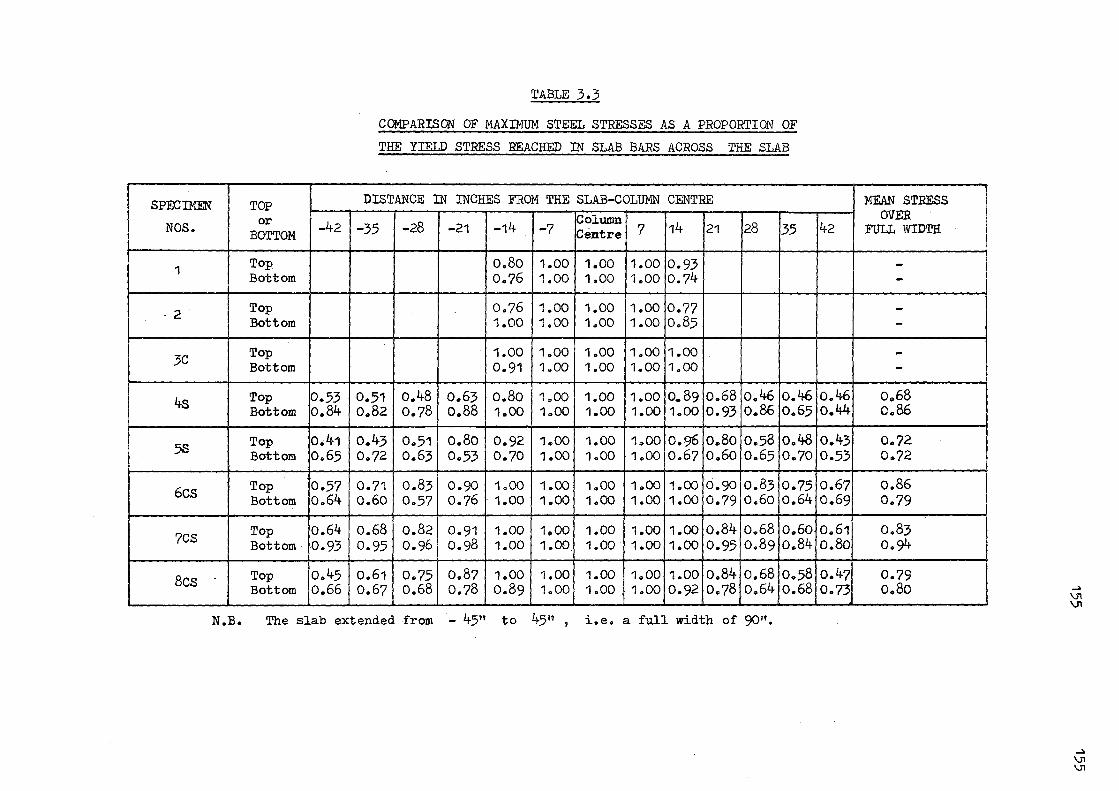
SPECIMEN
NOS.
1
·2
3C
4s
5S
6cs
7CS
8cs
TOP or
BOTTOM -42
Top Bottom
Top Bottom
Top Bottom
Top 0.53 Bottom o.84
Top o.41 Bottom o.65
Top 0.57 Bottom o.64
Top o.64 Bottom 0.93
Top o.45 Bottom o.66
TABLE 3.3
COMPARISON OF MAXIMUM STEEL STRESSES AS A PROPORTION OF
THE YIELD STRESS REACHED IN SLAB BARS ACROSS THE SLAB
DISTANCE IN INCHES FROM THE SLAB-COLUMN CENTRE Column
-35 -28 -21 -14 -7 Centre 7 14 21 28 35
0.80 1.00 1.00 1.00 0.93 0.76 1.00 1.00 1.00 0.74
0.76 1.00 1.00 1.00 0.77 1.00 1.00 1.00 1.00 0.85
1.00 1.00 1.00 1.00 1.00 0.91 1.00 1.00 1.00 1.00
0.51 o.48 o.63 0.80 1.00 1.00 1.00 o.89 o.68 o.46 o.46 0.82 0.78 o.88 1.00 1.00 1.00 1.00 1.00 0.93 o.86 o.65
o.43 0.51 0.80 0.92 1.00 1.00 1.00 0.96 0.80 0.58 o.48 0.72 0.63 0.53 0.70 1.00 1.00 1.00 0.67 0.60 0.65 0.70
0.71 0.83 0.90 1.00 1.00 1.00 1.00 1.00 0.90 0.83 0.75 0.60 0.57 0.76 · 1.00 1.00 1.00 1.00 1.00 0.79 0.60 o.64
o.68 0.82 0.91 1.00 1.00 1.00 1.00 1.00 o.84 o.68 0.60 0.95 0.96 0.98 1.00 1.00 1.00 1.00 1.00 0.95 0.89 o.84
0.61 0.75 0.87 1.00 1.00 1.00 1.00 1.00 o.84 o.68 0.58 0.67 o.68 0.78 0.89 1.00 1.00 1.00 0.92 0.78 o.64 o.68
N .B. The slab extended from - 4511 to 4511 , i.e. a full width of 9011 •
42
o.46 o.44
o.43 0.53
o.67 0.69
0.61 0.80
o.47 0.73
MEAN STRESS OVER
FULL WIDTH
------
o.68 o.86
0.72 0.72
o.86 0.79
0.83 0.94
0.79 0.80 ~
\.11 \.11
-l,
\.11 \.11

156
repeated cyclic loading. In specimens with shear reinforcement the
yielding of slab steel was observed to extend to three bars on either
side of the column. · This means that over the slab width of 90 in.
yielding of steel was confined to a width of 28 in. centred on either
side of the column and straight parallel yield lines never developed
across the whole width of the slab. However, it is confirmed that the
slab bars passing through the critical faces taken at a distance of d/2
from the column face do yield.
A study of Table 3.3 reveals a remarkable extent of slab participation
in resisting moment outside the area of the column. The mean steel stress
over the full width of the slab could be computed from strain measurements
only in specimens with shear reinforcement because in specimens without
shear reinforcement strain gauges were not used in slab bars across the
entire width. The mean steel stress for slab bars in the top face varies
from 0.68 f to o.86 y f whereas that for the bot tom face ranges y
from 0.72 f to 0.94 f • y y
The cranked bars used as shear reinforcement in the specimen 4s all
yielded before failure and in spite of this fact they failed to achieve
their purpose. The shear force distribution obtained from strain
measurements in the shearhead of specimen 5S was found to be nearly
parabolic and this fact was used in the derivation of the theory proposed
for the design of shearhead in Section 3.3.2. The measurement of strains
in closed type stirrups used in specimens 6CS , 7CS and Bes showed
that the stirrups placed adjacent to the column faces parallel to the
direction of bending always yielded indicating their effectiveness in
resisting torsional shear stresses set up on these faces. The stirrups
placed on the column faces transverse to the direction of bending
indicated yielding in specimens ?CS and 8cs but in the specimen 6CS
none of these stirrups yielded. This may be due to the fact that in
specimens ?CS and 8cs two legged stirrups of diameters i in. and 3/16in

157
respectively were used whereas in the specimen 6CS four legged stirrups
of 3/16 in. diameter were used.
(iv) Effect of Bending Moment Reversals
The effect of cycles of bending moment reversals was studied in four
specimens, namely 3C which was without shear reinforcement and 6CS ,
?CS and 8cs which contained closed stirrups as shear reinforcement.
The specimen 3C attained its maximum moment capacity at the end of
cycle 5. In spite of repeated number of load reversals the degradation
of moment capacity, measured as the ratio of the moment at the maximum
displacement in the last load cycle to the maximum moment attained, was
0.74 as compared to o.84 and 0.78 obtained for specimens 1 and 2
respectively under monotonic loading. Although successive loading cycles
helped to spread yielding of slab reinforcing steel over a greater width
of the slab there was no increase in the ductility factor which remained
quite low,similar to those obtained under monotonic loading. Therefore
it may be concluded that if a specimen without any shear reinforcement be
subjected to a number of loading reversals within the same ductility factor
as is obtained under monotonic loading, the deterioration in the load
carrying capacity is not very pronounced.
On the other hand specimens 6CS, 7CS and 8cs exhibited a greater
deterioration in the load carrying capacity under cycles of loading
reversals. The degradation of moment capacity was riearly 0.50 but this
was accompanied by a very large ductility factor of the order of 18 to
19, which is desirable from the point of view of seismic-resistant design.
(v) Effectiveness of Various Shear Reinforcement Arrangements
The specimen 4s with cranked bars as shear reinforcement failed in
punching shear and showed little ductility. There was some increase in
the moment capacity as compared with the unreinforced junctions but other
wise there was very little difference in behaviour between this specimen
and other specimens without any shear reinforcement. Therefore, cranked bar,

are ineffective as shear reinforcement in thin slabs.
The shearhead used in the specimen 5S resulted in an increased
ductility factor as compared to the previous specimens and behaved in
a ductile manner without any danger of a shear failure. This specimen
158
was also subjected to a reversal of bending moment after the first cycle
and it maintained 59% of its maximum moment capacity at a ductility
factor of 9~36. Therefore, a shearhead may be regarded as a satisfactory
type of shear reinforcement in flat plateso
Closed stirrups used in specimens 6CS , 7CS and 8CS were found to
form most suitable shear reinforcement in earthquake resistant flat plate-
column junctions. In all these cases there was no shear failure in the
slab and a large ductility was available at the slab-column junction when
subjected to cyclic loading. The two specimens 7CS and Bes containing
two legged stirrups of diameters ¾ in. and 3/16 in. respectively
behaved in a similar fashion as the specimen 6CS with four legged 3/16 in.
diameter stirrups so far as the ductility and the degradation in the lood
carrying capacity are concerned. Because of reduced area of shear
reinforcement the maximum moment capacity of the specimen 8CS was lower
than that of the specimen 6CS but it achieved the same ductility factor
after similar loading cycles and maintained the same load carrying capacity.
From the practical point of view tests with two legged stirrups were
highly successful. The use of two legged stirrups makes fabrication and
placing of stirrups simpler and quicker. These tests showed that even in
3i in. thick slabs stirrups of closed type can be fully effective in
preventing punching shear failures and in addition they increase the
ductility of the slab-column junctions by effectively confining the
concrete within the slab.
(vi) Junction Failure Mechanisms
Punching shear failures in specimens 1 , 2, 3C and 4s occurred
in the slab near the column face which was subjected to the downward edge

159
loading. Failures took place along inclined ~racks which extended from
the intersection of the column face and the compression face of the slab
toward the tension face of the slab at an angle of about 13° with the
horizontal. The reason for this very flat failure surface may be
splitting of the concrete at the intersection of the inclined cracking and
the tension reinforcement. Unlike symmetrically loaded slab-column
junctions where punching shear failures occur along truncated pyramidal
surfaces around the column failures in eccentrically loaded slab-column
junctions take place in the slab region surrounding only one face of the
column, which is subjected to the maximum shear force. It was observed
that before failure the reinforcing steel passing through the column
had yielded. This shows that yielding of the reinforcing steel at the
column is a necessary requirement for punching shear failure.
The specimens 5S, 6cs , ?CS and 8cs did not fail in punching
shear. Also there was no evidence of flexural failure by the formation
of yield lines developing across the full width of the slab along sections
adjacent to the column faces. On the top surface of the slab at the
downward loading end there were a large number of cracks which originated
radially from the two corners of the slab and some cracks formed at the
intersection of the slab and the column along both directions, transverse
and parallel to the direction of bending. Observed yield-line patterns
followed substantially the theoretical pattern, A2, adopted in Section
3.6 and shown in Fig. 3.83. There is, however, a disparity between the
two patterns and this stems from torsional cracking of the column-slab
interfaces parallel to the direction of bending. In the theoretical
pattern, A2, these column-slab interfaces were assumed to be uncracked
whereas in the observed pattern torsional cracking does occur. This does
not invalidate the theoretical pattern which can be realised if the
torsional cracking could be suppressed by some means.
160
(vii) Effective Width and Stiffness of Slab-Column Specimens
The effective width of the slab is a useful concept for determining the
stiffness of the structure. It is defined as the width of an imaginary
slab strip having the same depth, span and flexural stiffness as the
actual slab under consideration.
In order to determine approximately the effective width of the slab,
load-displacement characteristics at the onset of first yielding of the
slab reinforcing steel have been used. The computed edge displacement
of the slab is assumed to consist of two components as shown in Fig. 3.70.
The first deflection component is due to the column rotation which is
calculated as l.8 , where l
the column rotation computed as
is half the span of the slab and 0 is Mch1 -- Mc, is the moment acting on the 3Eic •
column, h , is the height of the column to midpoint measured from the
slab-column joint and Ic is the moment of inertia of the column.
The second deflection component is due to the elastic deformation
ot slab due to the weight of the concrete blocks and the applied loads.
Fig. 3.70 shows the slab-column specimen deformed elastically and also
the method of computing the displacements. For comparison with the test
results the average of upward and downward displacements has been considered.
In computing the moment of inertia of the slab, Is the cracked
transformed section has been used; for the column the uncracked EI was
used.
The effective width of the section was found by a trial and error
approach. A width of 36 in. gives a good correlation between the
measured and the computed edge displacements as shown in Table 3.4. This
effective width is about (10 times the slab thickness 13.nd\ o.4 of the ·' 1
width of the slab., Thus in computing the lateral deflection of this
flat plate structure within the elastic stage, a width of 36 in. may
be considered as effective.

I· I
H
+ Edge displacement due to downward slab deformation
PcJ 13 W a3 wa2r t-a) W(a+bi3 Wfa+bJ2fl-a-b) ~d = - +- + ---+ --- + -----
3E~. 3£~ 2E~ 3£~ 2E~
Edge displacement due to upward slab deformation
Ff; 13 w a3 wa2{1-a) W(a+bl3 W(a+bl(l-a-b) '1u = 3 E Is - 3 EI s .. 2 E Is 3 E Is 2 EI s
Edge displacement due to column rotation = 1.8
where 9 = Mc ht 3Elc
C t d d d . l t I 9 ~ + ~d ompu e e ge. ,spacemen = . + 2
Notations: flJ = Downward load, Pu = Upward load
W = Weight of 5 concrete blocks = 1000 lb. Mc= Column moment
FIG. 3.70 COMPUTATION OF EDGE DISPLACEMENT

LOAD AT FIRST YIELD
SPECIMEN UPWARD DOWNWARD NO. lb. lb.
lb. lb.
1 1404 1061
2 2476 819
3C 2635 911
4s 2864 967
5S 2762 939
6cs 2260 1060
?CS 2567 986
8cs 2083 911
TABLE 3.4
COMPARISON OF CALCULATED AND MEASURED EDGE DISPLACEMENTS
CALCULATED EDGE DISPLACEMENT DUE TO TOTAL COLUMN UPWARD SLAB DOWNWARD SLAB AVERAGE CALCULATED
EDGE ROTATION DEFORMATION DEFORMATION OF UPWARD DISPLACEMENT in. in. in. AND DOWNWARD in. DEFORMATIONS
in.
0.021 0.295 0.509 o.4o2 o.423
0.026 0.631 o.420 0.526 0.552
0.029 0.689 o.453 0.571 0.600
0.030 0.756 o.467 0.612 o.642
0.030 0.728 o.461 0.595 0.625
0.028 0.571 0.503 0.537 0.565
0.029 o.667 o.478 0.573 0.602
0.028 0.533 o.473 0.503 0.531
MEASURED EDGE
DISPLACEMENT
in.
o.4
o.6
o.6
0.7
0.7
0.5
o.6
o.6
Mean
MEASURED CALCULATED
0.95
1.09
1.00
1.09
1.12
o.88
1.00
1.13
1.03 ~
O'\ N

CONCLUSIONS
This series of tests showed that flat-plate column junctions
reinforced with shearheads and closed stirrups as shear reinforcement
behave in a satisfactory manner as earthquake resistant connections.
Specific conclusions derived from this experimental study are as
follows:
(a) The slab-column specimens without any shear reinforcement failed
in shear and showed little ductility.
(b) Cranked bars as shear reinforcement are ineffective in thin slabs.
Although they increased the moment capacity of the junction to some
extent there was very little difference in behaviour between this
junction and those junctions without any shear reinforcement.
(c) Shearheads and closed stirrups form suitable shear reinforcement in
earthquake resistant flat plate-column connections. They ensure that
the connection behaves in a ductile fashion when subjected to cyclic
loading.
(d) The load carrying capacity with cyclic loading deteriorated by about
50% in junctions reinforced with closed stirrups but this was
accompanied by very large cyclic deformations.
(e) Folding type failure mechanisms by the formation of parallel positive
and negative yield lines running across the full width of the slab
adjacent to the column faces were never realised. Observed yield
line patterns followed closely the theoretical pattern adopted in
Section 3.6.
(f) Two legged closed stirrups were found to be as effective as four
legged stirrups. From the practical constructiopal point of view
two legged stirrups are recommended for seismic resistant flat plate
column connections.

(g) For predicting interstory displacements a slab strip may be
considered effective in computing the flexural stiffness of the
floor.
164
SUMMARY
THEORY FOR SHEAR-FLEXURE FAILURE OF SLAB-COLUMN CONNECTIONS. WITHOUT SHEAR REINFORCEMENT
An ultimate strength procedure is derived for determining the shear
and unbalanced moment capacity of interior column-flat plate junctions
without any shear reinforcement. This theory is based on an extension
of previous investigations. The strength of such junctions predicted
by the theory is shown to give good agreement with test results.
3.4.1 INTRODUCTION
In most cases the strength of flat plate-column junctions without
any shear reinforcement will be governed by a shear-flexure failure on
some critical section surrounding the column before the formation of the
complete yield-line pattern for the slab. On this critical section the
applied shear and unbalanced moment are resisted by three actions within
the slab, namely (i) flexure, (ii) shear, and (iii) torsion. The theory
for the failure mode is based on the evaluation of these three quantities
which are obtained from the results of previous investigations.
165
Fig. 3.71(a) shows the portion of a flat plate surrounding an interior
column. Let Vu be the resultant shear and Mu the unbalanced moment
about the X-X axis acting at the centroid of the slab-column junction
at ultimate loading conditions. The forces and moments acting on some
critical section ABCD within the slab and contributing to the transfer
of the shear V and the moment M are indicated in the figure. u u
The unbalanced moment M is transferred by three actions, namely u
(i) flexure on faces AB and CD,
(ii) vertical shear on faces AB and CD,
(iii) torsion on faces AD and BC.

C
(a) Moments and Fore es
I i I
I I I 0/'2 I · I 7: - - - - -1- - - - -
Cfaj• C7 ,~B
( b) Critical Section
( c) Slab-Column Connection F /G. 3. 71 MOMENTS AND FORCES AT SLAB-COLUMN
CONNECTION
A

The individual contributions of these actions will be determined and
summed to obtain the total unbalanced moment that can be transferred with
shear force at the interior column-flat plate junction.
The distribution of stresses in the slab around the column at the
ultimate load is very complex. Mast37 has obtained the distribution of
stresses in flat plates near columns due to the moment transfer in accord
ance with the theory of elastic plates. This elastic stress distribution
does not apply at the ultimate load because of the effect of inclined
cracking in the slab around the column, which has been ignored in the theory
and is likely to alter the stress distribution very appreciably.
the elastic theory does not account for the influence of the slab
Besides,
reinforcement and the concrete does not act like an elastic homogeneous
material at the ultimate load of the junction. Because of this complex
behaviour it is necessary to make some simplifying assumptions in order to
derive design equations.
3~4.2 ASSUMPTIONS
The assumptions made in the derivation of design equations are as
follows:-
(i) The critical section shown in Fig. 3.71(b) will be assumed to be
located at a distance d/2 from the periphery of the column. For a
concentrically loaded slab-column junction the failure surface takes the
shape of a truncated pyramid with sides sloping roughly at 45°. The
average shear stress in the concrete which fails in this manner can be
taken as that which acts on vertical planes laid through the slab at a
perimeter a distance d/2 I
from the faces of the column. Thie has been
found to give safe results for concentrically loaded slab-column junctions
and was recommended by ACI-ASCE Committee 32612• It has been found by
16 20 . other researchers ' to give good results for eccentrically loaded
columns and has been incorporated in the ACI building code (ACI 318-71) 13•
168
(ii) At failure all the slab reinforcement bars crossing the transverse
faces AB and CD of the critical section are assumed to yield in tension.
The ultimate flexural capacity is reached in positive bending on the face
AB and negative bending on the face CD. The effect of membrane action
on the flexural capacities of the faces AB and CD will be neglected
although compressive membrane forces present in the plane of the slabs may
considerably enhance the flexural strength of the sections. Membrane action
could be taken into account if the extent of membrane forces could be
predetermined.
detail later.
The effect of membrane action will be discussed in more
(iii) The maximum vertical shear stress on the critical faces AB and
CD will be limited to 4/f' psi. This is the same assumption as C
recommended by ACI-ASCE Committee 32612 and incorporated in the ACI Building
Code (ACI 318-71) 13 for computing the shear strength of concentrically
and eccentrically loaded slab-column junctions. The shear stress of 4/f' C
at the critical section at ultimate load for concentrically loaded junction
is twice that used for beams. This higher value for slabs is due to the
strengthening effects of two-way action. At the slab-column junction the
slab concrete is subjected to horizontal compressive stresses due to
negative bending at the column in two perpendicular directions in addition
to vertical compression due to the reaction of the column. The simultaneous
presence of these compressive stresses increases the shear resistance of
the section. Tests12 have indicated that, when punching shear failure
occurs, the shear stress computed on the perimeter of the critical section
is larger than in beams or one-way slabs and is approximately equal to 4/f'. C
(iv) The part of the vertical shear stress due to V u on the faces
AB and CD of Fig. 3.71 is uniformly distributed over the effective depth
of the slab.
(v) The part of the vertical .shear stress induced by the moment M u on
the faces AB and CD of Fig. 3.71 is assumed to be uniformly distributed

over the effective depth of the slab.
assumed to be the difference between
This vertical shear stress is
4/'f• C
and the shear stress induced
by V u
(vi) The ultimate torsional capacity is assumed to be developed on
the side faces AD and BC of the critical section. This is the
torsional capacity taking into account the reduction due to the part of
the vertical shear stress caused by V on the faces AD and BC of u
Fig. 3.71. The ultimate torsional shear stress for the case of torsion
without flexural shear is assumed to be 4.8/f~ , which is twice that
normally recommended for beams in ACI 318-71 Code 13• This enhanced
torsional shear stress is assumed to be available due to the effect of
membrane compressive stresses in the plane of the slab.
3.4.3 MOMENT TRANSFER BY FLEXURE
The ultimate flexural capacities of faces AB and CD of Fig. 3.71
are calculated by using the ultimate strength design formula for a
rectangular reinforced concrete section.
flexure is given by
The moment transferred by
where
= (m + m1 ) y U U 0
For positive bending
m = pf ( t - d 1 ) 2
u y ( _ 0.59 pfy)
1 fl C
For negative bending
m = u
m' = u
m1 = p1 f (t - d 11 )2
u y ( _ 0.59 P' f y)
1 fl C
postive ultimate flexural capacity of face
unit length
negative ultimate flexural capacity of face
unit length
••• (3.25)
••• (3.26)
••• (3. 27)
AB per
CD per

= dimension of faces AB and CD of the critical
section transverse to the direction of bending
p = positive or bottom reinforcement ratio
p' = negative or top reinforcement ratio
t = total depth of slab
f = yield stress of reinforcement bars y
f' = cylinder compressive strength of concrete C
d 1 = distance between the bottom face and the centroid
of bottom reinforcement
d11 = distance between the top face and the centroid of
top reinforcement
170
In each case, the effect of the reinforcement which is in compression
has been ignored as the presence of compression steel does not appreciably
increase the ultimate moment capacity of reinforced concrete sections
failing in tension.
The effect of membrane action on the flexural capacities of the faces
AB and CD has been neglected.
following section.
This aspect is further discussed in the
3.4.4 EFFECT OF MEMBRANE ACTION
It has been shown by Par~8,39 that in slabs with edges restrained
against lateral movement, compressive membrane forces develop in the plane
of the slab and increase the ultimate moments of resistance at the yield
lines. When yielding of the slab reinforcement at the critical sections
occurs under the application of unbalanced moment the slab-column junction
will rotate as shown in an idealised manner in Fig. 3.72. The surrounding
slab will impose a lateral restraint on the portion of the slab within the
failure sections thereby forcing the neutral axis to remain deep in the
critical sections as shown in Fig. 3.72. In the typical lightly
reinforced slab used in practice the neutral axis lies quite close to the
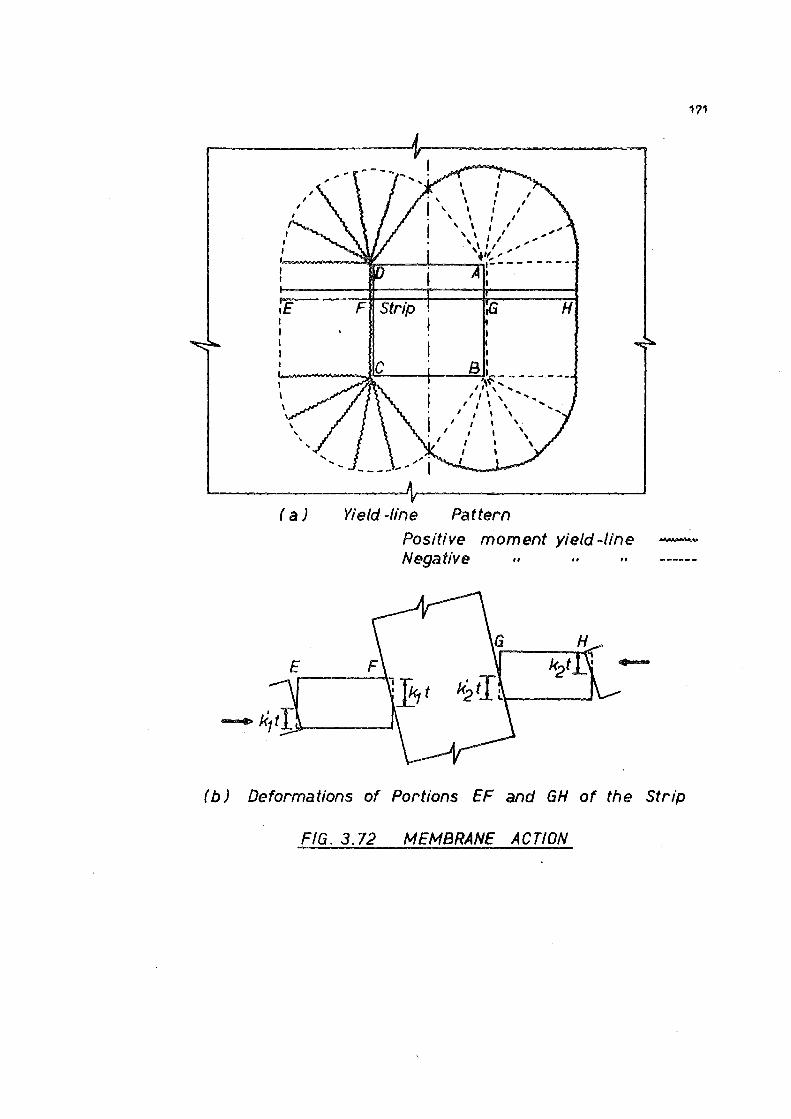
I I I
' I
(a)
E
F Strip
Yield -line
H
I
B' ,~~~~:------/ I \ '
I I I \ ._ I I \ \
I I \ \. I I I \
• I \ I I \
I I
Pattern
Positive moment yield -line -Negative .. .. ,,
( b) Deformations of Portions EF and GH of the Strip
FIG. 3. 72 MEMBRANE ACTION
172
compressed edge of the concrete if no compressive membrane forces are present.
Hence if the lateral restraint imposed by the surrounding slab forces the
neutral axis at the slab sections AB and CD to remain at a greater depth
compressive membrane forces will be induced in the slab. Eccentrically
loaded column theory shows that the ultimate moment of resistance of a
section with moderate axial compression is greater than that of a section
without axial compression. This means that the presence of compressive
membrane forces will increase the flexural capacity of the slab.
Since membrane action has been neglected in computing the contribution
of flexure towards the moment transfer between the slab and the column, the
theory will be on the conservative side in predicting the ultimate strength
of the slab-column junction.
MOMENT TRANSFER BY VERTICAL SHEAR STRESSES
If the vertical shear stress induced on the face AB by the shear
force Vu is vAB, the shear stress induced by the out of balance bending
moment on the faces AB or CD will be (1/f~ - vAB). The face AB is
the critical face for the combined shear stress due to Vu and M • u
Thus the shear force induced by moment on the faces AB and CD will
be given by (4/f~ - vAB)y0
d and the moment due to the shear couple is
where
Mv = part of the moment transferred by shear stress on
faces AB and CD
VAB = shear stress induced by V on face AB u
••• (3.28)
X :: dimension of critical section parallel to the direction 0
of bending
Yo = dimension of critical section transverse to the
direction of bending
d = effective depth of slab measured from the extreme
compression face to the mid depth of the top reinforcing mat

To determine vAB, the shear force acting on the area tributary to
the face AB may be divided by y0d, the sectional concrete area of the
face AB over the effective depth d. In practical cases it is quite
difficult to determine the shear forces acting on the areas tributary to
173
each of the faces AB, BC, CD and AD. For design purposes, where the
floor loading is symmetrical, the shear stress induced by Vu on faces AB,
BC, CD and AD of the critical section may be considered as uniformly
distributed and calculated as
= 2 d (x + y) 0 0
All the terms are as defined previously.
MOMENT TRANSFER BY TORSION
••• (3.29)
The ultimate torsional capacity of the faces AD and BC may be
calculated by using the approach recommended by the ACI Building Code
(ACI 318-71) 13 for the ultimate torque of a reinforced concrete rectangular
section with an enhanced ultimate torsional shear stress.
where
The ultimate torque for the face AD or BC is given by
X t 2 0
3 ••• (3.30)
the nominal ultimate torsional shear stress
on the face AD or BC
= the ultimate resisting torsional moment acting
on the face AD or BC
= vertical shear stress on the face AD or· BC
induced by V u
All other terms are as defined previously.

It may be noted here that vAD is strictly a variable along the
faces AD and BC. In the above equation the uniform mean value has
been assumed.
of
In the derivation of Eq. (3.30) the nominal torsional shear stress
2 1' rf' •"'TV. C used in the ACI Building Code (ACI 318-71) 13 has been
174
increased to 4.8./f' • C
This is in keeping with the reasoning by which the
nominal shear stress of 2/ft C
for a beam type shear failure is raised to
1/f 1 for slabs. C
In view of the triaxial stress conditions that exist in
slabs near the columns, both these increases in the nominal shear stress
and the torsional shear stress appear to be reasonable. Hence the factor
1.2 in the denominator of right hand side of Eq. (3.30) remains unchanged.
The limiting value of the torsional capacity of the face AD or BC
will depend upon the vertical shear VAD or VBC and the moment MAD or
Hae acting on the respective faces. Eq. (3.30) takes into account the
interaction of shear and torsion. In most practical cases the moment
MAD or l\c is small and hence the reduction in the torsional capacity due
to shear only has been considered.
Substituting the value of TAD in Eq. (3.30) and rearranging the terms
the following equation may be obtained:
= 4.8/f~ X t 2
0
3 j -(VAD )2
1 ~ C
All other terms are as previously defined,
STRENGTH EQUATIONS
••• (3.31)
After evaluating the individual contributions of flexure, shear and
torsion using Eqs. (3.25) to (3.31), the ultimate shear and moment
transferred from the flat plate to the column can be calculated as
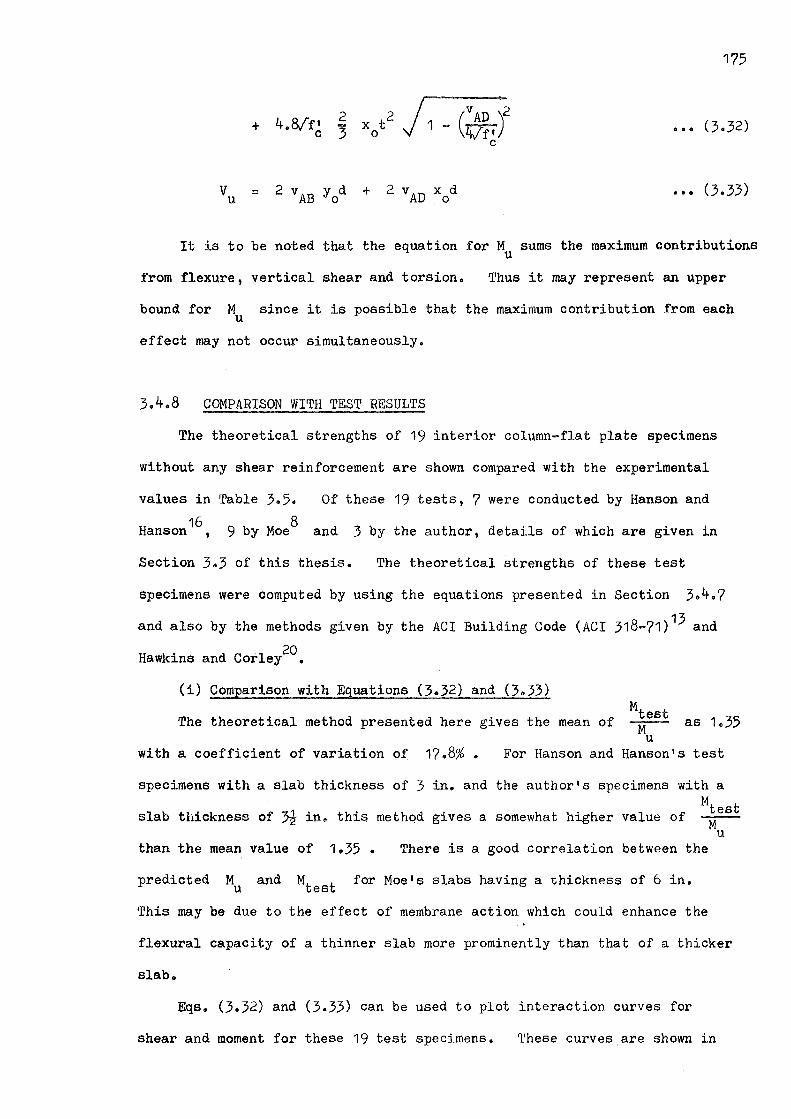
175
••• (3.32)
••• (3.33)
It is to be noted that the equation for M sums the maximum contributions u
from flexure, vertical shear and torsion. Thus it may represent an upper
bound for M since it is possible that the maximum contribution from each u
effect may not occur simultaneously.
3.4.8 COMPARISON WITH TEST RESULTS
The theoretical strengths of 19 interior column-flat plate specimens
without any shear reinforcement are showa compared with the experimental
values in Table 3.5. Of these 19 tests, 7 were conducted by Hanson and
16 8 Hanson , 9 by Moe and 3 by the author, details of which are given in
Section 3.3 of this thesis. The theoretical strengths of these test
specimens were computed by using the equations presented in Section 3.4.7
and also by the methods given by the ACI Building Code (ACI 318-71) 13 and
Hawkins and Corley20•
(i) Comparison with Equations (3.32) and (3.33)
The theoretical method presented here gives the mean of as 1.35
with a coefficient of variation of 17.8%. For Hanson and Hanson's test
specimens with a slab thickness of 3 in. and the author's specimens with a
Mtest slab thickness of~ in. this methqd gives a somewhat higher value of -M--
than the mean value of 1.35. There is a good correlation between the
predicted Mu and Mt t es for Moe's slabs having a thickness of 6 in.
u
This may be due to the effect of membrane action which could enhance the
flexural capacity of a thinner slab more prominently than that of a thicker
slab.
Eqs. (3.32) and (3.33) can be used to plot interaction curves for
shear and moment for these 19 test specimens. These curves are shown in
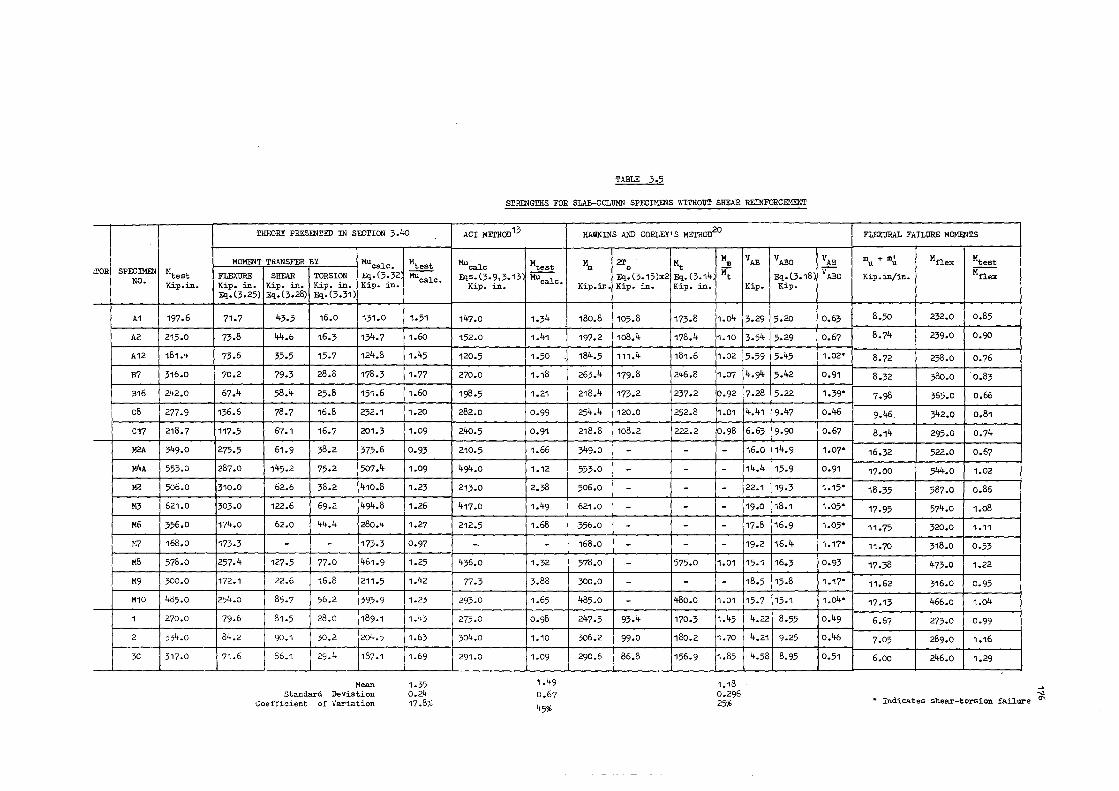
INVESTIGATOR SPECIMEN Mtest NO. Kip.in.
A1 197.6
AZ 215.0
A12 181.4 HANSON
& HANSON 16 B7 316.0
B16 242.0
cs 277-9
C17 218.7
M2A 349.0
M4A 553.0
M2 506.0
MOES M3 621.0
M6 356.0
M7 168.0
MB 578.o
M9 300.0
M10 485.0
1 270.0
AUTHOR 2 334.o
3C 317.0
THEORY PRESENTED IN SECTION 3.4o
MOMENT TRANSFER BY Mucalc. FLEXURE SHEAR TORSION Eq.(3.32 Kip. in. Kip. in. Kip. in. Kip. in. Eq.(3.25) Eq.(3.28) Eq.(3.31)
71.7 43.3 16.0 131.0
73.8 44.b 16.3 134.7
73.6 35.5 15.7 124.8
70.2 79.3 28.8 178.3
67.4 58.4 25.8 151.6
136.6 78.7 16.8 232.1
117.5 67.1 16.7 201.3
275.5 61.9 38.2 375.6
287.0 145.2 75.2 507.4
310.0 62.6 38.2 410.8
303.0 122.6 69.2 494.8
174.o 62.0 44.4 280.4
173.3 - - 173-3
257.4 127.5 77.0 461.9
172.1 22.6 16.8 211.5
254.o 85.7 56.2 395.9
79.6 81.5 28.0 189.1
84.2 90.1 30.2 2o4.5
71.6 86.1 29.4 187.1
Mean Standard Deviation
Coefficient of Variation
Mtest Mucalc.
1.51
1.6o
1.45
1.77
1.60
1.20
1.09
0.93
1.09
1.23
1.26
1.27
0.97
1.25
1.42
1.23
1.43
1.63
1.69
1.35 0.24 17.8;.;
TABLE 3.5
STRENGTHS FOR SLAB-COLUMN SPECIMENS WITHOUT SHEAR REINFORCEMENT
ACI ME.rHOD13
Mucalc F.qs. (3. 9, 3. 13
Kip. in.
147.0
152.0
120.5
270.0
198.5
282.0
24o.5
210.5
494.o
213.0
417.0
212.5
--436.0
77.3
293.0
275.0
304.o
291.0
Mtest Mucalc.
1.34
1.41
1.50
1.18
1.21
0.99
0.91
1.66
1.12
2.38
1.49
1.68
-1.32
3.88
1.65
0.98
1.10
1.09
1.49 0.67
45%
HAWKINS AND CORLEY' S METHOD20
M 2r Mt m 0
Eq. (3.15 )x2 Eq. (3.14 Kip.in. Kip. in. Kip. in.
180.8 105.8 173.8
197.2 168.4 178.4
184.5 111.4 181.6
263.4 179.8 246.8
218.4 173.2 237.2
254.4 120.0 252.8
218.8 108.2 222.2
349.0 - -553.0 - -506.0 - -621.0 - -356.0 - -168.0 - -578.o - 575.0
300.0 - -485.0 - 480.0
247.3 93.4 170.3
306.2 99.0 180.2
290.6 86.8 156.9
M VAB m
¾ Kip.
1.o4 3.29
1.10 3.54
1.02 5.59
1.07 4.94
0.92 !7-28
1.01
0.98
------
1.01
-1.01
1.45
1.70
1.85
1.18 0.296 25%
4.41
6.63
16.0
14.4
22.1
19.0
17.8
19.2
15.1
18.5
15.7
4.22
4.21
4.58
VABO
Eq.(3.18) Kip.
5.20
5.29
5.45
5.42
5.22
9.47
9.90
14.9
15.9
19.3
18.1
16.9
16.4
16.3
15.8
15.1
8.55
9.25
8.95
VAB
VABO
0.63
0.67
1.02•
0.91
1.39•
o.46
o.67
1.07•
0.91
1.15•
1.05•
1.05•
1.17•
0.93
1.17•
1.o4•
o.49
o.46
0.51
FLEX1ffiAL FAILURE MOMENTS
m + m• Mnex Mtest u u Kip.in/in. Mnex
8.50 232.0 0.85
8.74 239.0 0.90
8.72 238.0 0.76
8.32 380.0 0.83
7.98 365.0 o.66
9.46. 342.0 0.81
8.14 295.0 0.74
16.32 522.0 0.67
17.00 544.o 1.02
18.35 587.0 o.86
17.95 574.o 1.o8
11.75 320.0 1.11
11.70 318.0 0.53
17.38 473.0 1.22
11.62 316.0 0.95
17.13 466.o 1.o4
6.67 273.0 0.99
7.05 289.0 1.16
6.oo 246.0 1.29
~
~
• Indicates shear-torsion failure °'
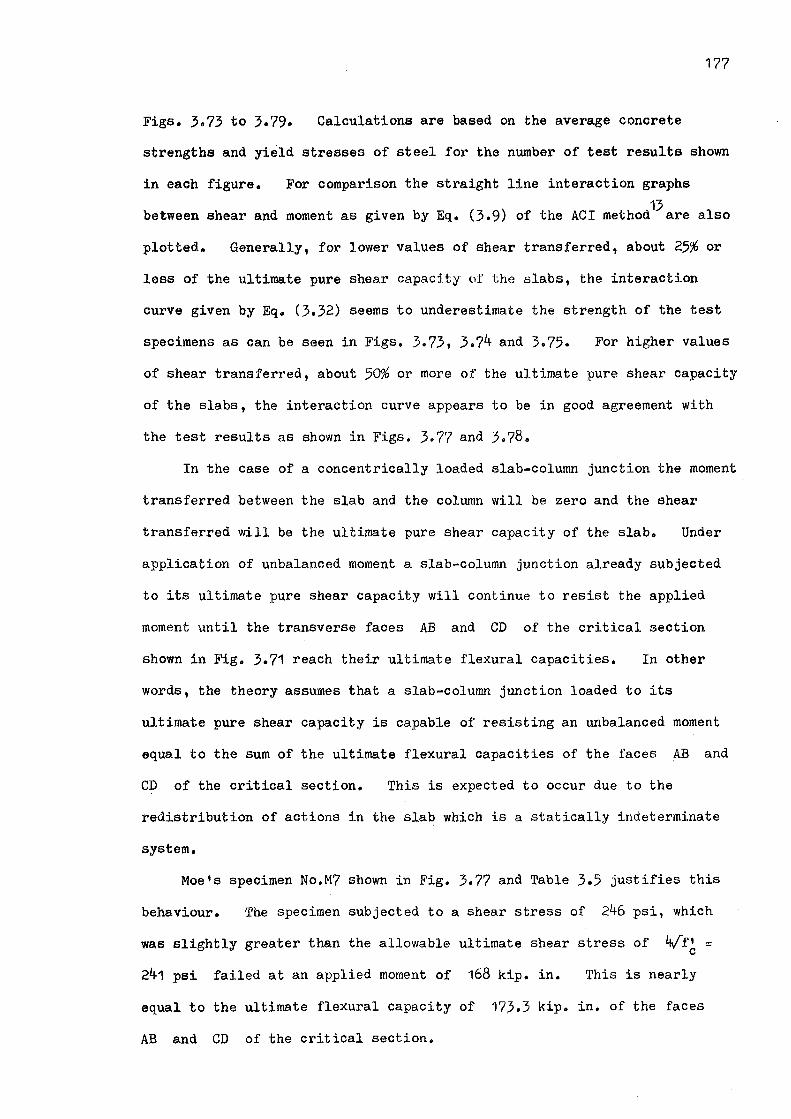
177
Figs. 3.73 to 3.79. Calculations are based on the average concrete
strengths and yield stresses of steel for the number of test results shown
in each figure. For comparison the straight line interaction graphs
. 13 between shear and moment as given by Eq. (3.9) of the ACI method are also
plotted. Generally, for lower values of shear transferred, about 25% or
less of the ultimate pure shear capacity of the slabs, the interaction
curve given by Eq. (3.32) seems to underestimate the strength of the test
specimens as can be seen in Figs. 3.73, 3.74 and 3.75. For higher values
of shear transferred, about 50% or more of the ultimate pure shear capacity
of the slabs, the interaction curve appears to be in good agreement with
the test results as shown in Figs. 3.77 and 3.78.
In the case of a concentrically loaded slab-column junction the moment
transferred between the slab and the column will be zero and the shear
transferred will be the ultimate pure shear capacity of the slab. Under
application of unbalanced moment a slab-column junction already subjected
to its ultimate pure shear capacity will continue to resist the applied
moment until the transverse faces AB and CD of the critical section
shown in Fig. 3.71 reach their ultimate flexural capacities. In other
words, the theory assumes that a slab-column junction loaded to its
ultimate pure shear capacity is capable of resisting an unbalanced moment
equal to the sum of the ultimate flexural capacities of the faces AB and
CD of the critical section. This is expected to occur due to the
redistribution of actions in the slab which is a statically indeterminate
system.
Moe's specimen No.M7 shown in Fig. 3.77 and Table 3.5 justifies this
behaviour. The specimen subjected to a shear stress of 246 psi, which
was slightly greater than the allowable ultimate shear stress of 4./f' = C
241 psi failed a:t an applied moment of 168 kip. in. This is nearly
equal to the ultimate flexural capacity of 173.3 kip. in. of the faces
AB and CD of the critical section.
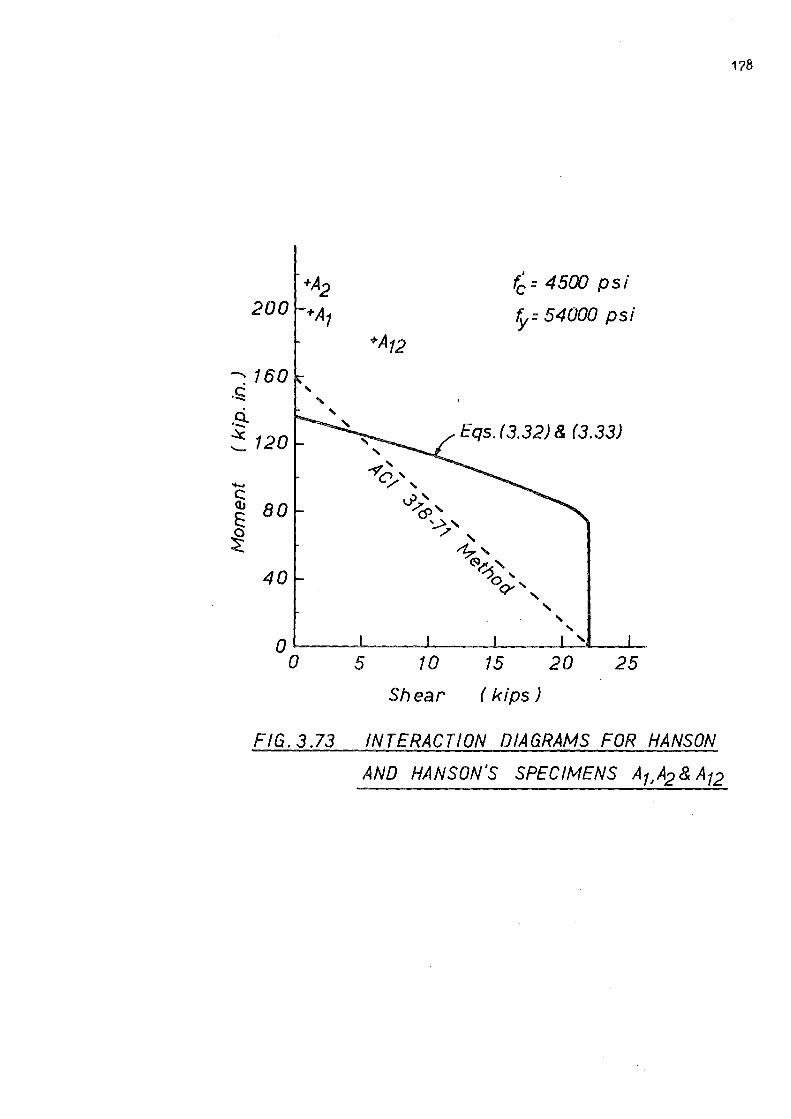
: 160 -~ -~ ~ 120
..... ~ 80 E ~
40
... '
+A12
f = 4500 psi
y= 54000 psi
Eqs. ( 3.32) & (3.33)
' ' ' o-----------------0 5 10 15 20 25
Sh ear ( kips )
FIG. 3.73 INTERACTION DIAGRAMS FOR HANSON
AND HANSON'S SPECIMENS A7,'4.2& A12
178

179
+B7
280
' ' ' ,
' fc = 4600 psi 240 ' +B15
' ' y = 50000 psi ' '
200 ' ' ' ' ' - ' t 160 ' -~ ~ ...._
120 ' - ' C: -?c,, Cl, /'
E 80 t.?),
~ c9 ' '>' .,,,,
40 ~' ~' 0' O"',
' 0 0 5 10 15 20 25 30
Shear ( kips J
FIG. 3.74 INTERACTION DIAGRAMS FOR HANSON AND HA NSON's SPECIMENS B7 AND B16

180
320
' 280 ' f~ = 5000 psi + ' Ca'\ 1y =54500 psi
' ' 240 ' ' ' +Cf' 7, 200
- Eqs.(3.32) & (3.33) C:
' ·-.9- 160 ' ~
,. "'9".' e;.., ...._ ' ~'
120 6)'
...... '...>, C: .>. (IJ ' E:
1:,., ~I"!:'
~ 80 :.:5. ' oc;>-,
' ' ' ' 40 ' ' ' ' ' 00 5 10 15 20 25 30 35
Shear (Kips)
FIG. 3.75 INTERACTION DIAGRAMS FOR HANSON
AND HANSON'S SPECIMENS Ca AND Ctz
181
1000
' ' 900 ' ' ' (: ' = 2600 psi \
800 ' y = 69730 psi \
' \ ' 700 \
' ' \ \ +M3
600 \
' ' ' +/vf4A - 500 'ii
+M2 .s; \ \
-~ ' "Y(")' Eqs.(3.32) & (3.33) ~ _, - 400 \ ~,
CP \ - 'J, +M2A C: ?\
Cl> ' E 300 ~\ ~ ~~,
~o' 9-'
200 \
' ' ' \ \
100 ' \ 0 0 10 20 30 40 50 60
Shear (kips)
FIG. 3.76 INTERACTION DIAGRAMS FOR MOE'S
SPECIMENS M2 ,M2A, M3 & M4
' \ ' \
70

900
800
700
600
500 -c ·-.9- 400 ~ -..... 300 C (1,
E 0
~ 200
100
0 0
' ' ' '
FIG. 3. 77
' ' ' .,.,~' .,,,., ~',
d) ' ,~, ,,,,, '\
~' ~~,
~' OQ--\
' '
10 20 30
'
Shear
~ = 3600 psi
o/ = 47500 psi
' ' ' Eqs. (3 .32) & (3.33)
40 ( kips)
' ' ' '
50
' ' ' ' ' ' 60
INTERACTION DIAGRAMS FOR MOE'S
SPECIMENS M5, fv17 & fv19
' '
182
70

900
800' ' ' '\
' ' 700 ,
500
-.s; 400 .e. ~ -....., C (I)
300
E 200 ~
100
0
' ' ' ' ' ' ' ' \
I
fc = 3300 psi
fy = 47500 psi
'\
' ' ' ' ' 0 10 20 30 40 50 60
Shear (kips)
FIG. 3. 78 INTERACTION DIAGRAMS FOR MOES SPECIMENS Ma & M10
70
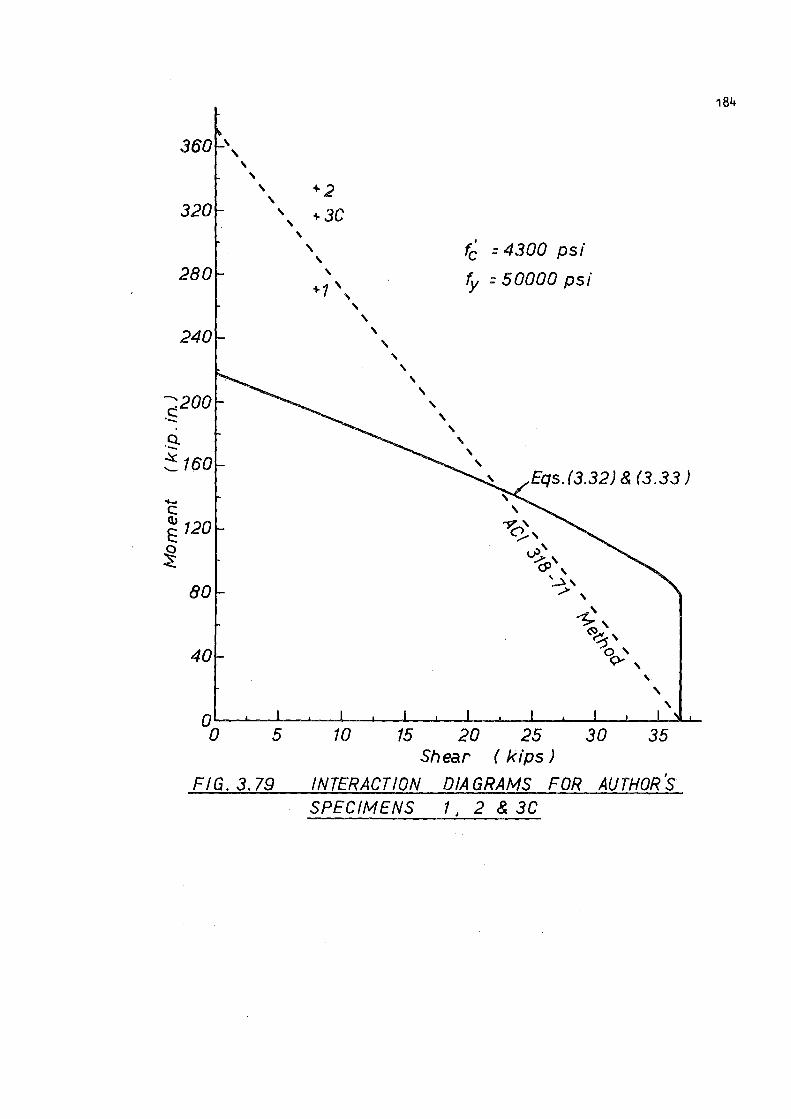
360
320
280
240
?_200 ·--~ ~ 160
...... C a, 120 E ~
80
40
' ' ' ' ' +-2 ' ' +3C
' ' ' '
' ' ' ' ' ' '
,; = 4300 psi
y = 50000 psi
' ' ' Eqs. (3.32) & (3.33)
' ' ' o-----~---------____. __________ ...._ _________ _ 0 5 10 15 20 25 30 35
Shear ( kips)
FIG.3.79 INTERACT ION DIA GRAMS FOR AUTHOR 's SPECIMENS 1, 2 & 3C
184

185
(ii) Comparison with ACI 318-71 Method13
The analysis of 19 test specimens shown in Table 3.5 by the ACI 318-7113
Mtest method gives the mean of - as 1.49 with a coefficient of variation
Mu of 45%. In case of the author's 3 specimens without shear reinforcement
this method predicts very good results. The scatter in the test results
arises mainly from Moe's slabs which, with the exception of the specimens
M8 and M10, had reinforcement on one face only. The likely cause of this
scatter is due to the neglect of the influence of slab reinforcement bars
passing through the column on the proportion of moment assumed to be
transferred by shear stresses. However, as in most practical cases there
will be both top and bottom reinforcement in the slabs over the column
regions, the coefficient of variation will be somewhat lesser than the
indicated figure of 1.49.
20 (iii) Comparison with Method of Hawkins and Corley
20 The method of Hawkins and Corley gives accurate results for all
Hanson and Hanson's specimens 16 and Moe 1 s8 specimens M8 and M10 which
contained top reinforcement. For the author's 3 tests their method is very
much on the conservative side. In Table 3.5 the comparison between the
experimental moment and the predicted moment by their theory is expressed Mm
as the ratio of where Mm is the applied moment on the critical Mt
section and Mt is the computed moment capacity at the critical section Mm
for a moment torsion failure, The mean of for 12 test results is Mt
found to be 1.18 with a coefficient of variation of 25%. Since they are
considering both the applied moment and the computed moment to be acting
on the critical section the moment transferred by shear stresses acting on
the transverse faces AB and CD of the critical section do not enter
their Eq. (3.14) for the total moment capacity for a moment-torsion failure.
Thus with their method it is not possible to determine the additional shear
stresses caused by the application of unbalanced moment.
The torsional moment capacity of the faces AD and BC of the
critical section given by Eq. (3.15) appears to have been overestimated
by them. It is seen in Table 3.5 that the torsional moment 2T0
accounts
186
for nearly 50% to 75% of the total moment Mt for a moment-torsion failure.
As pointed out in Section 3.2.3 this may be partly due to the consideration
of slab reinforcement as fully effective as closed hoops in resisting
torsion and partly due to the neglect of the maximum limit for torsional
capacity of reinforced concrete sections given in the ACI Building Code
(ACI 318-71) 13 • For a moment-torsion failure no reduction in the torsional
moment capacity due to the shear effects has been considered.
For Moe's slabs torsional strengths were calculated for specimens M8
and M1O only and for the remainder which did not contain reinforcement in
both faces of the slab torsional strengths were not shown in their paper2O •
As the accuracy of their method is dependent on the torsional moment
provided by the slab reinforcement the computed moment capacity for these
specimens without top reinforcement will be quite low when compared with
the test results.
According to their method, at loads less than the flexural capacity, V
th ill b t t . f 'l 'f AB < 1 d h t . ere w ea momen - orsion ai ure 1 v-- an as ear orsion VAB ABO
failure if VABO > 1 where VAB is the shear force acting on the face
AB and VABO is the ultimate resisting shear force for the face AB.
In the case of a shear-torsion failure interaction between shear and torsion
is considered in computing the torsional moment capacity as given by
Eq. (3.16).
On the whole Hawkins and Corleys' method gives more accurate prediction
of the theoretical strength than both the method presented here and the
ACI (318-71) 13 method for slab-column specimens containing reinforcement
in both faces of the slab. Their method is difficult to use for design
purposes whereas the method presented here, although not so accurate as

187
their method, is more simplified and can be readily used by designers.
DISCUSSION OF THE THEORY PRESENTED
The theory presented for interior column-flat plate junctions without
any shear reinforcement assumes that the individual maximum contributions
of the three actions, namely, flexure, shear and torsion, can be summed to
obtain the ultimate strength of the slab-column junction. It is implied
that if their governing values are not reached simultaneously sufficient
ductility exists for their maximum values to be sustained. The comparison
of the test results with the theory indicates that this assumption is
reasonable.
The slab is subjected to high moments in the column region and
consequently the tension steel crossing the transverse faces AB and CD
of the critical section will yield before the shear failure commences.
For the typical lightly reinforced slab used in practice the moment
curvature relationship can be expected to show appreciable ductility at
these faces of the critical section at failure. The vertical shears on
the faces AB and CD can build up even if the moments are constant at
the yield moment because the statically indeterminate system in flat plates
will allow redistribution of actions before collapse.
The torsional moments are computed by using the ACI Building Code
(ACI 318-71) 13 equations which are based on the circular interaction curve
for torsion and shear. Torsion and flexure interaction effects have not
been considered because external moments on faces AD and BC are usually
small. The nominal torsional and flexural shear stresses used were twice
those for beams, following existing findings for the flexural shear strength
of concentrically loaded slabs, due to the existence of triaxial stress
conditions at the slab-column junction. This stress condition may also
result in sufficient ductility in the torsion-twist relationship for the
faces AD and BC.

188
The assumptions seem to have been justified by the agreement of theory
with the experimental results, deviations being on the safe side.
3.4.10 CONCLUSIONS
The theory presented gives more consistent and better results than
those predicted by the current ACI Building Code (ACI 318-71) 13 and is more
simplified than Hawkins and Carley's method20 • The agreement with the
test results is reasonably good and verifies the theoretical approach.
With this method it is possible to compute the individual contributions
of flexure, shear and torsion in transferring an unbalanced moment between
a column and a slab.
3.5 THEORY FOR SHEAR-FLEXURE FAILURE OF SLAB-COLUMN CONNECTIONS WITH SHEAR REINFORCEMENT
SUMMARY
An ultimate strength method is presented to determine the shear and
unbalanced moment capacity of interior column-flat plate junctions
containing shear reinforcement in the form of either inclined cranked bars,
vertical closed stirrups or structural steel shearheads. Strengths based
on this theory are compared with test results and a conservative agreement
obtained.
INTRODUCTION
Some type of shear reinforcement may often be necessary in flat plate
floors around the junction of the column and the slab to strengthen the
junction without increasing the slab thickness. Also it is desirable
that a slab-column junction should not fail in a brittle manner but should
show adequate ductility, particularly under earthquake conditions.
As mentioned in Section 3.2 there is no established procedure available
for designing shear reinforcement in slab-column junctions which transfer
both shear and moment. In the design procedures given here three types of
shear reinforcement are considered, namely, (i) inclined cranked bars,
(ii) vertical closed stirrups and (iii) shearheads fabricated from structural
steel shapes. The strength of the junction is found by adding the
contribution of the shear reinforcement in resisting shear and torsion to
the strength of an unreinforced junction.
INCLINED CRANKED BARS
Fig. 3.80 shows an interior slab-column junction containing inclined
bars as shear reinforcement and the assumed critical section ABCD located
at a distance d/2 outside the colwnn periphery. Let Vmax be the
maximum shear force which can be developed on the face AB of the critical

(a J Shear Force Carried by Cranked Bars
d~
(b)
FIG. 3.80
I~ c, -1~1 D,- - - - - - - - - - - - - - , A
I I I
C •- - - - - - - - - - - - - _ J
,.. Xo .. 18' Critical Section
Yo
INCLINED CRANKED BARS
190
Mu
)
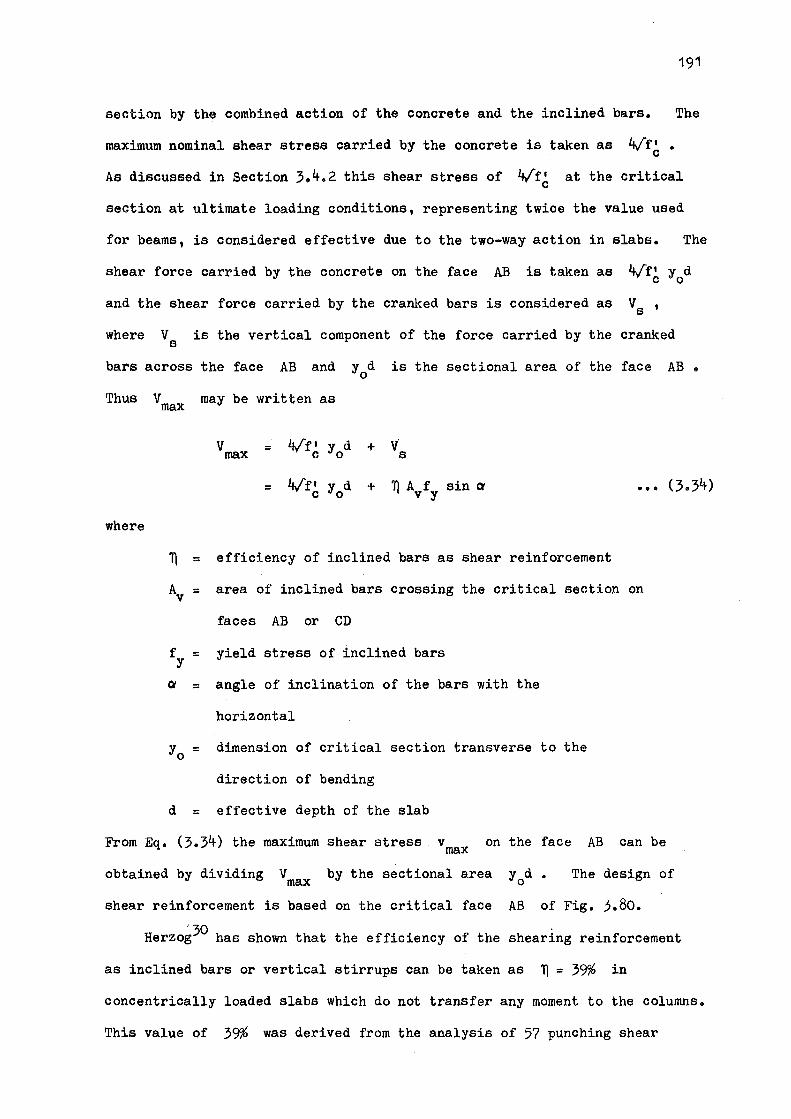
191
section by the combined action of the concrete and the inclined bars. The
maximum nominal shear stress carried by the concrete is taken as 4,/f~.
As discussed in Section 3.4.2 this shear stress of 4/f' C at the critical
section at ultimate loading conditions, representing twice the value used
for beams, is considered effective due to the two-way action in slabs. The
shear force carried by the concrete on the face AB is taken as 4/f' y d C 0
and the shear force carried by the cranked bars is considered as Vs ,
where V is the vertical component of the force carried by the cranked s
bars across the face AB and y d 0
is the sectional area of the face
Thus Vmax may be written as
= 1/f' y d + v·s C 0
AB.
= 4/f' yd + ~ A f sin a C O V y
••• (3.34)
where
~ = efficiency of inclined bars as shear reinforcement
Av= area of inclined bars crossing the critical section on
faces AB or CD
f = yield stress of inclined bars y
~ = angle of inclination of the bars with the
horizontal
dimension of critical section transverse to the
direction of bending
d = effective depth of the slab
From Eq. (3.34) the maximum shear stress vmax on the face AB can be
obtained by dividing Vmax by the sectional area y d • 0
The design of
shear reinforcement is based on the critical face AB of Fig. 3.80.
'30 Herzog has shown that the efficiency of the shearing reinforcement
as inclined bars or vertical stirrups can be taken as ~ = 39% in
concentrically loaded slabs which do not transfer any moment to the columns.
This value of 39% was derived from the analysis of 57 punching shear
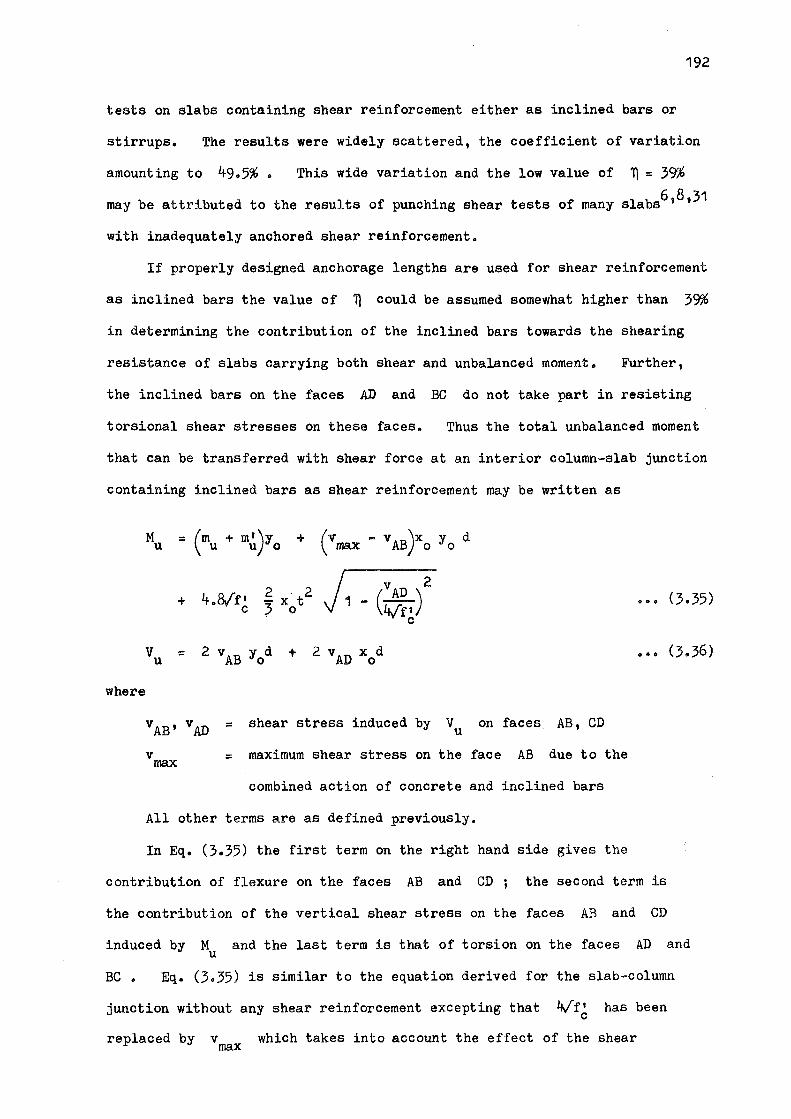
192
tests on slabs containing shear reinforcement either as inclined bars or
stirrups. The results were widely scattered, the coefficient of variation
amounting to 49.5%. This wide variation and the low value of ~ = 39%
may be attributed to the results of punching shear tests of many slabs6 ,8 ,31
with inadequately anchored shear reinforcement.
If properly designed anchorage lengths are used for shear reinforcement
as inclined bars the value of ~ could be assumed somewhat higher than 39%
in determining the contribution of the inclined bars towards the shearing
resistance of slabs carrying both shear and unbalanced moment. Further,
the inclined bars on the faces AD and BC do not take part in resisting
torsional shear stresses on these faces. Thus the total unbalanced moment
that can be transferred with shear force at an interior column-slab junction
containing inclined bars as shear reinforcement may be written as
Mu = (mu+ m')Y + (vrnax - VAB)xo Yo d U 0
2 + 4 0 8/f I 2 . 2
- X t 3 0 }1 _(AD)
4/"f' ••• (3.35)
C C
V = 2 vAB yod + 2 vAD x0
d ••• (3.36) u
where
vAB' vAD = shear stress induced by Vu on faces AB, CD
v = maximum shear stress on the face AB due to the max
combined action of concrete and inclined bars
All other terms are as defined previously.
In Eq. (3.35) the first term on the right hand side gives the
contribution of flexure on the faces AB and CD; the second term is
the contribution of the vertical shear stress on the faces AB and CD
induced by M u and the last term is that of torsion on the faces AD and
BC. Eq. (3.35) is similar to the equation derived for the slab-column
junction without any shear reinforcement excepting that 4/f' has been C
replaced by V max which takes into account the effect of the shear
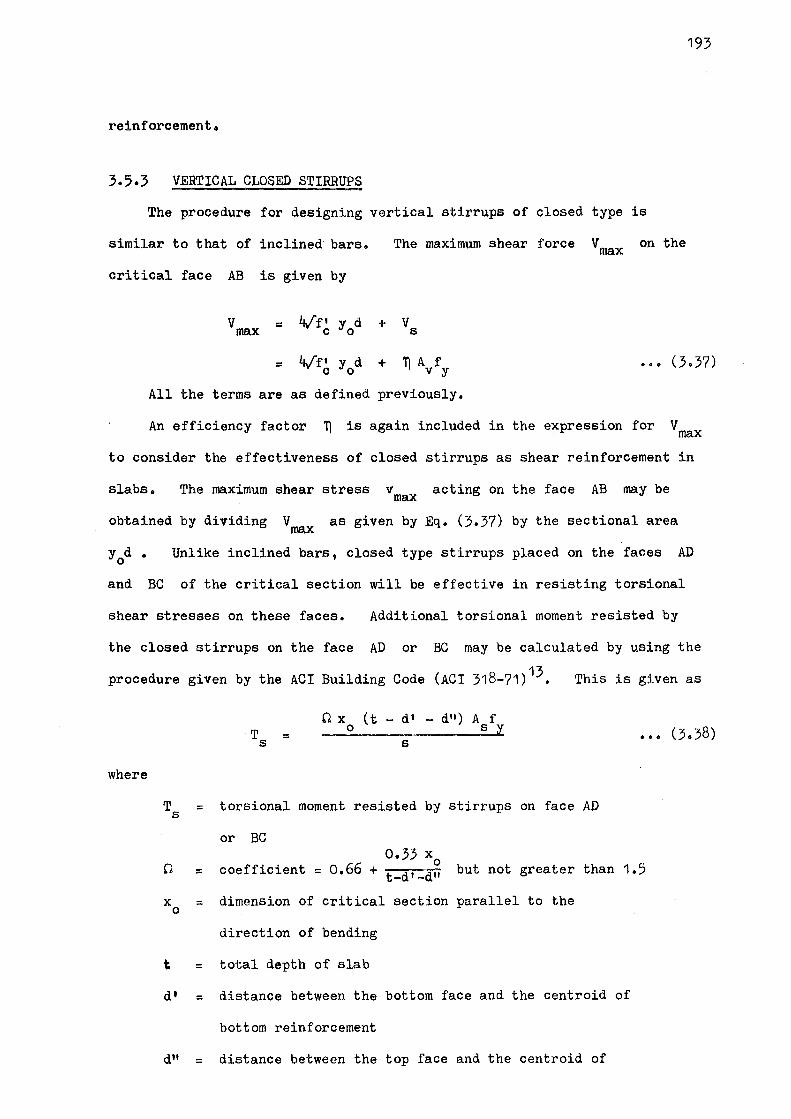
reinforcement.
VERTICAL CLOSED STIRRUPS
The procedure for designing vertical stirrups of closed type is
similar to that of inclined bars.
critical face AB is given by
vmax = 1/f' y d C 0
The maximum shear force Vmax on the
+ V s
193
= 4/f1 yd + ~ A f C O V y
••• (3.37)
All the terms are as defined previously.
An efficiency factor ~ is again included in the expression for Vmax
to consider the effectiveness of closed stirrups as shear reinforcement in
slabs. The maximum shear stress vmax acting on the face AB may be
obtained by dividing V as given by Eq. (3.37) by the sectional area max
y d • 0
Unlike inclined bars, closed type stirrups placed on the faces AD
and BC of the critical section will be effective in resisting torsional
shear stresses on these faces. Additional torsional moment resisted by
the closed stirrups on the face AD or BC may be calculated by using the
procedure given by the ACI Building Code (ACI 318-71) 13• This is given as
where
T = s
0 x ( t - d 1 - d11 ) A f 0 S y
s
T = torsional moment resisted by stirrups on face AD s
or BC
••• (3.38)
0 = coefficient 0.33 X
0 = o.66 + t-d'-d" but not greater than 1.5
x = dimension of critical section parallel to the 0
t =
d' =
direction of bending
total depth of slab
distance between the bottom face and the centroid of
bottom reinforcement
dtl = distance between the top face and the centroid of

top reinforcement
A = area of one leg of stirrup B
s = spacing of stirrups
f = yield stress of stirrups. y
The unbalanced moment and shear capacity of the slab-column junction
provided with closed stirrups may now be calculated by using the following
equations:
= (m + m') y + U U 0
20x (t-d'-d")A f
194
0 S y 6
• • • (3. 39)
V u = 2,vAB yod +
v is given by Eq. (3.37). max
previously.
STRUCTURAL STEEL SHEARHEADS
... (3.40)
All other terms are as defined
The shearing resistance of the flat plate-column junction can be
increased by providing a shearhead made of standard structural steel sections
within the concrete slab. The shearhead will contribute towards the moment
transfer between the slab and the column in three ways, namely, (i) flexure,
(ii) shear, and (iii) torsion.
The flexural contribution of the shearhead is given by 2Em , 'where p
m is the plastic moment capacity of an arm of the shearhead. p Em gives p
the total plastic moment of the arms of the shearhead on one face of the
critical section which is again assumed to be at a distance d/2 from the
column periphery. This is multiplied by 2 to take into account the
contributions of both faces AB and CD of the critical section.
The shearing contribution of the shearhead will be worked out in a
slightly different manner than the previous proposals for inclined bars

195
and vertical closed stirrups. To determine the shear force carried by the
shearhead it would be necessary to know the shear force distribution along
the arm of the shearhead. The assumed idealised shear force distribution
shown in Fig. 3.81 is obtained from the experimental study of a flat plate
column specimen containing a shearhead, which is described in Section 3.3.4
(vii).
Let V5
be the shear force carried by the shearhead at the critical
section. From the idealised shear force diagram the moment at the critical
section may be obtained as
rm = Vs (L - ~) p 3 C 2
3lli • V p (3.41) . . ::
d ... s
L C - 2
where
m :: plastic moment capacity of a shearhead arm p
L = length of C
shearhead arm measured from the column face
d = effective depth of slab.
The maximum shear force on the critical face AB is once again obtained
as the sum of the shear force carried by the concrete and the shear force
carried by the shearhead.
Thus Vmax = 4/'f' yd + Vs C 0
= 1/ft y d + C 0
3I:m p ••• (3.42)
where yd represents the concrete area of the face AB of the critical 0
section.
y d • 0
The maximum shear stress vmax is obtained by dividing V max by
The shearhead arms placed transversely to the direction of bending will
be subjected to torsion. Their resistance to torsion may be calculated
as 2Ilnt , where I:mt is the total plastic torque of the shearhead arms
on the face AD or BC of the critical section.
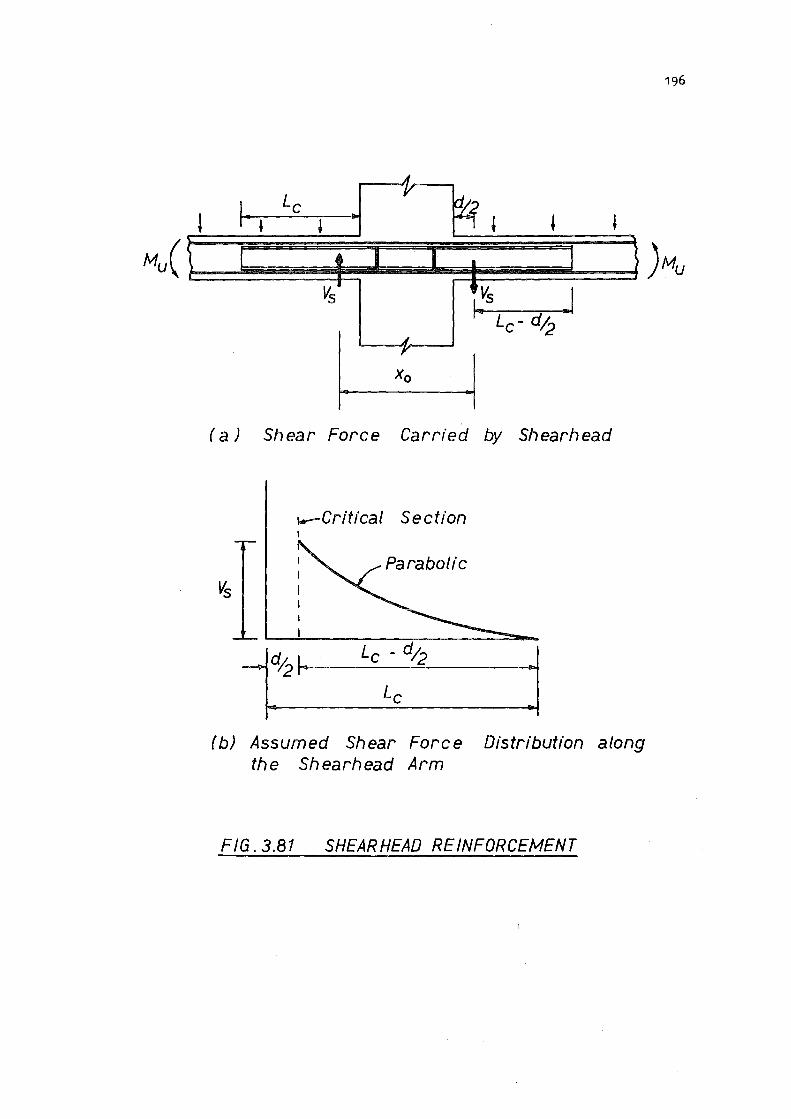
196
Xo
(a) Shear Force Carried by Shearhead
i--Critical Section
i/2~ Le - d;2 j Le
(b) Assumed Shear Force Distribution along the Shearhead Arm
F /G. 3.81 SHEAR HEAD REINFORCEMENT
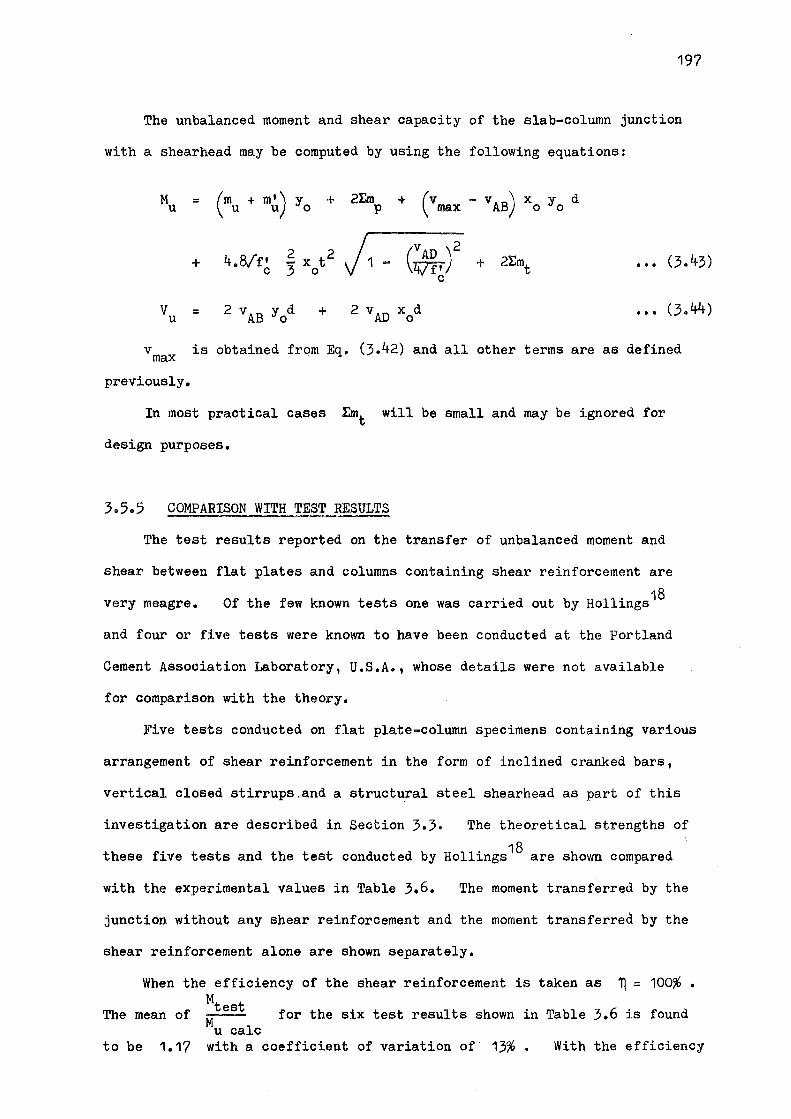
197
The unbalanced moment and shear capacity of the slab-column junction
with a shearhead may be computed by using the following equations:
Mu = (mu+ m') Y + 2r.m + (vmax - vAB) X Yo d U 0 p 0
+ 4.8/f' ~ X t 2 j, (AD )2 + 21:mt ••• (3.43) C 3 0 ~ C
V = 2 vAB yod + 2 vAD x0d ••• (3.44) u
v is obtained from Eq. (3.42) and all other terms are as defined max
previously.
In most practical cases tint will be small and may be ignored for
design purposes.
COMPARISON WITH TEST RESULTS
The test results reported on the transfer of unbalanced moment and
shear between flat plates and columns containing shear reinforcement are
very meagre. Of the few known tests one was carried out by Hollings18
and four or five tests were known to have been conducted at the Portland
Cement Association Laboratory, U.S.A., whose details were not available
for comparison with the theory.
Five tests conducted on flat plate-column specimens containing various
arrangement of shear reinforcement in the form of inclined cranked bars,
vertical closed stirrups.and a structural steel shearhead as part of this
investigation are described in Section 3.3. The theoretical strengths of
these five tests and the test conducted by Hollings18 are shown compared
with the experimental values in Table 3.6. The moment transferred by the
junction without any shear reinforcement and the moment transferred by the
shear reinforcement alone are shown separately.
When the efficiency of the shear reinforcement is taken as Tl = 100%. M
The mean of test for the six test results shown in Table 3.6 is found M u calc
to be 1.17 with a coefficient of variation of 13%. With the efficiency

INVESTIGATOR SPECIMEN TYPE OF SHEAR Mtest NO. REINFORCEMENT
Kip.in.
4s 4 Nos. i" ¢ 367 cranked bars
5S Shearhead 350 2 Nos. 1j" x 111 X .12 11
thick channels
AUTHOR 6cs Closed stirrups 4 legs 3/16" ¢
34o
at 1½" c/c
7CS Closed stirrups 369 2 legs¾"¢ at 1½" c/c
Bes Closed stirrups 309 2 legs 3/16" ¢ at 1½" c/c
HOLLINGS 18
Shearhead 2365 2 Nos. 3" x 211
x 4.5 lb. I-Beams
TABLE 3.6
STRENGTHS FOR SLAB-COLUMN SPECIMENS WITH SHEAR REINFORCEMENT
MOMENT TRANSFERRED WITHOUT .SHEAR REINFORCEMENT
FLEXURE SHEAR TORSION TOTAL Kip.in. Kip.in. Kip. in. Kip. in.
74.9 90.0 31.1 196.0
61.9 87.5 30.4 179.8
62.9 83.2 29.2 175.3
65.9 85.9 30.0 181.8
62.4 70.9 25.6 158.9
410.0 411.0 149.4 970.4
i
MOMENT TRANSFERRED BY SHEAR REINFORCEMENT TOTAL MOMENT TRANSFERRE!
FLEXURE SHEAR TORSION Kip. in • Kip. in. Kip. in.
- 139.1xi] -
38.2 56.9 -
- 71.9xi] 72.4
- 62.0Xi] 124.o
- 37.2xi] 74.4
220.0 432.4 -
il = 1 assumed TOTAL Mu
Kii~1in. Kip. in.
139.1xi] 335.1
95.1 274.9
71.9xi]+72.4 319.6
62.oxi]+124.o 367.8
37.2xi]+74.4 270.5
652.4 1622.8
Mean
Standard Deviation Coefficient of Variation
-
Mtest
Mucalc.
1.10
1.27
1.06
1.00
1.14
1.46
1.17
0.153
13%
FLEXURAL FAILURE MOMENTS
M + m• Mflex Mtest u u Kip.in/in • Kip.in • Mfiex
6.27 257.0 1.43
5.19 251.2 1.39
5.27 216.0 1.57
5.52 226.0 1.63
5.23 214.o 1.44
21.60 1595.0 1.48
~
"' 0,
199
30 Mtest ~ = 39% as recommended by Herzog- the mean of - is found to be
Mu calc 1.30 with a coefficient of variation of 9.7%. Since the shear
reinforcement for the five test specimens listed in the table fulfilled the
requirements for anchorage as given in the ACI Building Code (318-71) 13 a
higher value of ~ can be used with some justification. A value of
~ = 70% for the inclined bars and vertical closed stirrups gives the mean
f Mtest
o ~ as 1.23 with a coefficient of variation of 10%. This brings Mu calc
the mean value down to 1.23 from 1.30 when ~ = 39% and at the same time
reduces the coefficient of variation to 10% from 13% when ~ = 100% •
As there is some uncertainty about the full effectiveness of shear
reinforcement in thin slabs and as the theoretical strength of slab-column
junctions is somewhat underestimated by the theory presented in Section 3.4,
it appears reasonable to accept the efficiency of shear reinforcement as
~ = 70%. With this value the predicted strengths of slab-column junctions
are on the conservative side with a good degree of consistency.
In case of the author•s five tests where the basic slab reinforcement
pattern was unchanged the computed moments carried by the unreinforced
junction do not differ much.
differing values of fl C
and
This slight variation is mainly due to
f y • The moment carried by the various
arrangement of shear reinforcement is seen to vary appreciably. With the
efficiency taken as ~ = 70% for inclined cranked bars and vertical closed
stirrups the shear reinforcement carries 33% of the total computed moment
for specimen No. 4S with cranked bars, 35% for specimen No. 5S with a
shearhead, 41% for specimen No. 6CS with 4 legs of 3/16 in. diameter closed
stirrups, 48% for specimen No. ?CS with 2 legs of¾ in. diameter closed
stirrups and 39°/4 for specimen No. 8cs with 2 legs of 3/16 in. diameter
closed stirrups. In the case of Holling•s specimen, the shearhead carries
4o% of the total computed moment. Of the three types of shear reinforce-
ment investigated it appears that both closed stirrups and the shearhead
are more efficient in carrying additional moment than the cranked bars.
200
DISCUSSION OF THE THEORY PRESENTED
The shear strength problem is complex and even for reinforced concrete
beams a precise and rational analysis of shear behaviour has yet to be
developed. The concepts which underlie present design practice are based
partly on rational analysis, partly on test evidence and partly on success
ful experience with structures in which certain procedures for designing
shear reinforcement have resulted in a satisfactory performance.
The design procedure presented here for slabs follows the same pattern
and logic as those for beams. In order to design shear reinforcement for a
flat plate-column junction carrying an ultimate shear V and an ultimate u
moment Mu , first of all vAB and vAD , which are assumed to be equal,
are computed by using any one of the Eqs. (3.36), (3.40) and (3.44). The
maximum shear stress v is then obtained from Eqs. (3.35), (3.39) and max
(3.43) for the type of shear reinforcement selected. The design of shear
reinforcement may then be carried out by using Eqs. (3.34), (3.37) and (3.42)
as appropriate for the selected type.
In these design equations an efficiency factor of 0.7 has been taken
into account to consider the effectiveness of shear reinforcement in slabs
owing to anchorage problems. Since it is difficult to achieve good
anchorage of shear reinforcement in slabs by bond and bearing the best way
to develop anchorage is to transfer the force in the shear bar to other
reinforcement, such as by rigidly attaching stirrups to longitudinal
reinforcement or by tightly wrapping stirrups around the longitudinal
reinforcement.
In the case of shearhead reinforcement no reduction has been made on
its effectiveness as the problem of anchorage does not arise here. Corley
and Hawkins28 have shown that shearhead reinforcement is fully effective
in thin slabs. A parabolic distribution of shear force has been assumed
along the length of the shearhead arm up to the critical face AB. This
201
has been experimentally verified in Section 3.3. Based on this distribution
the shear force carried by the shearhead at the critical section has been
estimated as given by Eq. (3.41).
Once the shear forces carried by the various shear reinforcement are
known the shear and unbalanced moment capacity of a slab-column junction
can be computed in a similar manner as given for slab-column junctions
without shear reinforcement.
CONCLUSIONS
The predicted strengths computed by using the theoretical approach
outlined here for interior flat plate-column junctions containing shear
reinforcement are found to be on the conservative side with a good degree
of consistency. As verified by the experimental results it would appear
to be quite safe to use these equations for designing shear reinforcement
for slab-column junctions.
Of the three types of shear reinforcement considered closed stirrups
and shearheads are more efficient in carrying additional moment than the
inclined cranked bars.
202
3.6 THEORY FOR FLEXURAL FAILURE OF SLAB-COLUMN CONNECTIONS
SUMMARY
The ultimate flexural strength of interior flat plate-column specimens
under combined shear and unbalanced moment loadings tested by various
investigators is obtained by using the yield-line theory for reinforced
concrete slabs. When compared with the experimental flexural capacity
this is found to be greater in most specimens without shear reinforcement
and lower in all specimens with shear reinforcement.
INTRODUCTION
One important object of the design of flat plate floors is the need
to prevent shear failures of slab-column junctions. In order to achieve
this requirement it is essential to lmow the ultimate flexural strength of
flat plate floors. Once this is known it would be possible to design
for shear reinforcement which may be required to prevent premature shear
failure of slab-column junctions.
The ultimate flexural strength of several different models of interior
flat plate-column specimens subjected to combined shear and unbalanced
16 8 moment loadings and tested by Hanson and Hanson , Moe , Hollings18 and
the author is determined here by using the yield-line theory for reinforced
concrete slabs. As mentioned in Section 2.2 the yield line theory is an
upper bound method and it is always necessary to examine all the possible
collapse mechanisms to ensure that the load carrying capacity of the slab
is not overestimated. Several different yield-line patterns which model
various flat plate-column test specimens will now be analysed. The yield
line flexural capacity of these test specimens is then compared with the
experimental moment capacity obtained from tests for slab-column junctions
with or without shear reinforcement.
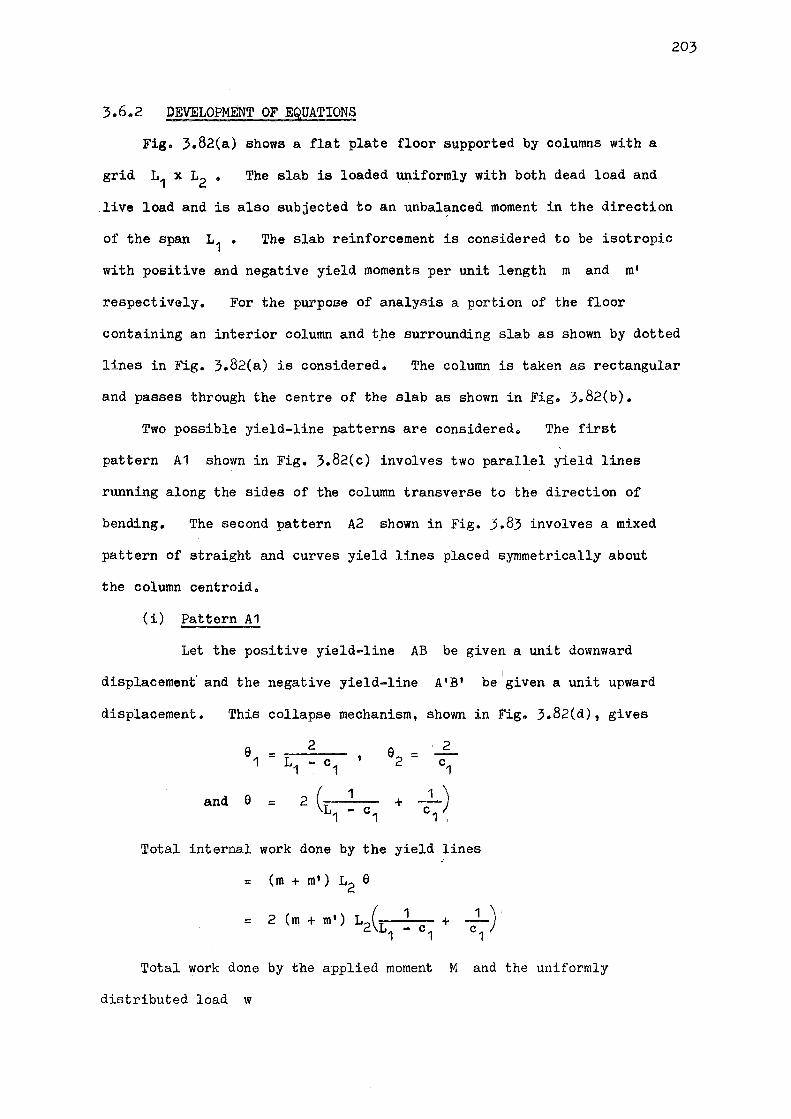
203
3.6.2 DEVELOPMENT OF EQUATIONS
Fig. 3.82(a) shows a flat plate floor supported by columns with a
The slab is loaded uniformly with both dead load and
live load and is also subjected to an unbal~nced moment in the direction
of the span 11 • The slab reinforcement is considered to be isotropic
with positive and negative yield moments per unit length m and m•
respectively. For the purpose of analysis a portion of the floor
containing an interior column and the surrounding slab as shown by dotted
lines in Fig. 3.82(a) is considered. The column is taken as rectangular
and passes through the centre of the slab as shown in Fig. 3.82(b).
Two possible yield-line patterns are considered. The first
pattern A1 shown in Fig. 3.82(c) involves two parallel yield lines
running along the sides of the column transverse to the direction of
bending. The second pattern A2 shown in Fig. 3.83 involves a mixed
pattern of straight and curves yield lines placed symmetrically about
the column centroid.
(i) Pattern A1
Let the positive yield-line AB be given a unit downward
displacement· and the negative yield-line A1B1 I
be given a unit upward
displacement. This collapse mechanism, shown in fig. 3.82(d), gives
81 2
82 2 =
11 = - C c1 1
and e 2 (L 1 c11) = +
- C 1 1
Total internal work done by the yield lines
= (m + m') 12 e
2 (m + m') 1 2(1
1 + _1_): =
- C c1 1 1
Total work done by the applied moment M and the uniformly
distributed load w

204
• I• L7• •I 0
• [:~~]~ • • •
I. ( a J Flat Plate Floor
........
l w /unit length
' I J J i ~ I I
t {b) Isolated St ab-Column
Portion
L7
A I I
•A I I I I I
L2 i'M'li r2 (c J Pattern A1
I I
m •m I I
B :a·
~ ( L7- c7 '1/2
+ c7 ·I ( 4- c1J;2 ~I
,:v~ ._ €8 -=v= ~ (d) Collapse
Mechanism -,-' 2' 1
FIG. 3. 82 YIELD-LINE PATTERN A 1
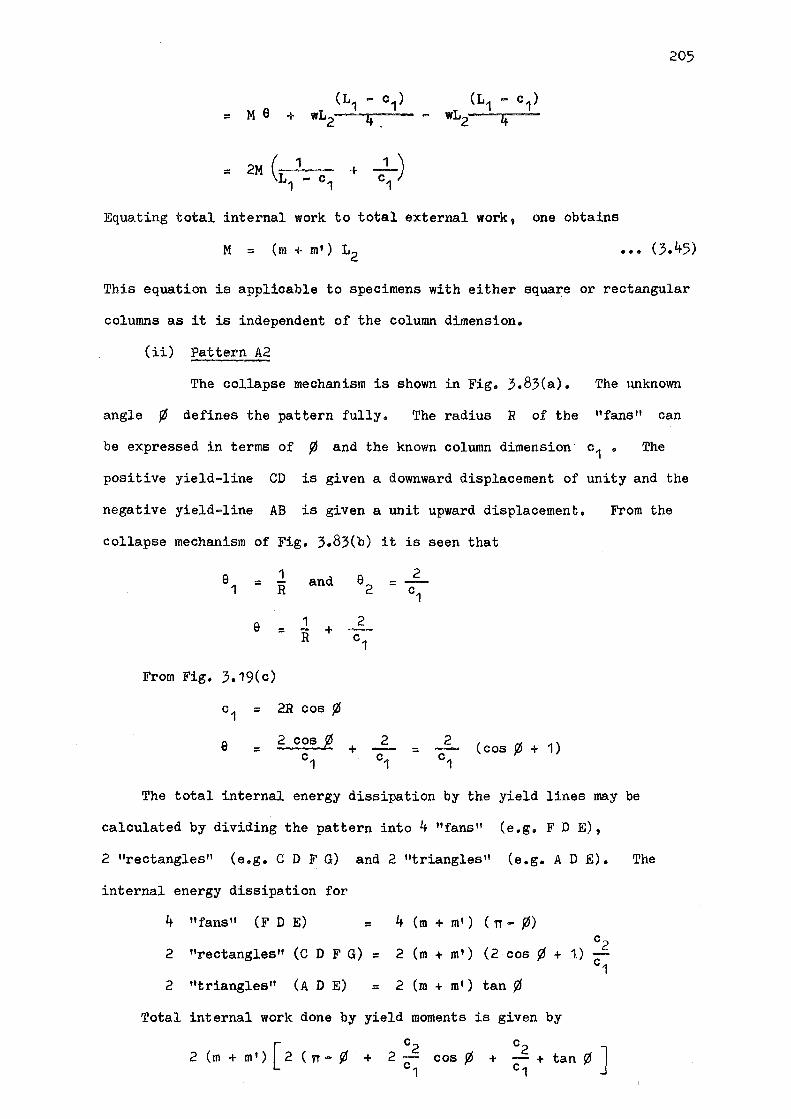
205
= M 8 +
=
Equating total internal work to total external work, one obtains
M = ••• (3.45)
This equation is applicable to specimens with either square or rectangular
columns as it is independent of the column dimension.
(ii) Pattern A2
The collapse mechanism is shown in Fig. 3.83(a). The unknown
angle ¢ defines the pattern fully. The radius R of the II fans II can
be expressed in terms of ¢ and the known column dimension c1 • The
positive yield-line CD is given a downward displacement of unity and the
negative yield-line AB is given a unit upward displacement. From the
collapse mechanism of Fig. 3.83(b) it is seen that
91 1 and 92
2 = R = c1
e 1 2 = + -R c1
From Fig. 3.19(0)
c1 = 2R cos¢
e 2 cos¢ 2 2 (cos¢+ 1) ::: + - = 01 01 c1
The total internal energy dissipation by the yield lines may be
calculated by dividing the pattern into 4 "fans" (e.g. FD E),
2 "rectangles" (e.g. C D F G) and 2 "triangles" (e.g. A D E). The
internal energy dissipation for
4 "fans" (F D E) = 4 (m + m•) ( TT - fb)
2 "rectangles" (C D F G) 2 (m + m') (2 cos ¢ + 1.) C2
= 01
2 "triangles" (ADE) = 2 (m + m') tan¢
Total internal work done by yield moments is given by
2 (m + m') [ 2 ( 'l'T - ¢ 02
cos¢ c2
tan¢ ] + 2- + -+ c1 C1

206
-1
(a) Pattern A2 Positive yield line ~ Negative ,, ,, ----
R c~ I w~ ( b) Col lapse Mechanism
( c) Enlarged View of the Portion A DE
FIG.3.83 YIELD-LINE PATTERN A2

207
Total external work done by the applied moment M = M8 = ~ (1 +cos¢).
Equating internal work done by yield moments to external work done by
loading one finds that
M = [ c2 c2 J 2 ( TT - ¢) + 2c1 cos ¢ + 01 + tan ¢
(m + m•) c1
••• (3.46) 1 +cos¢
where is the column dimension parallel to the direction of bending
and c2 is the column dimension transverse to the direction of bending.
To determine the minimum value of M, Eq. (3.46) needs to be
minimised.
For square columns with c1 = c2 = c , Eq. (3.46) is reduced to
M = (m + rn') c [2 ( rr - ¢) + 2 cos % + 1 + tan ¢) 1 + cos ••• (3.47)
A value of ¢ = 20° gives 'the minimum value of M = 4.551 (m + m•)c
••• (3.48) 0 2 1 For rectangular columns with the ratio of sides - = -2 , Eq. (3.46) c1
is reduced to
M = (m + m') c1
[2 ( 'IT - ¢) ; ~o~0f ¢ 0.5 + tan ~] ••• (3.49)
The minimum value of M is obtained as
••• (3.50)
for a value of ¢ = 17° 30' • c2
For rectangular colums with = 2, the moment is given by c1
( [2 ( TT - ¢) + 4 cos ¢ + 2 + tan gl] M = m + m') 0 1 1 +cos~
The minimum value of M is
M = 6.033 (m + m') c1
when the value of ¢ = 23°.
• • • (3. 51)
••• (3.52)
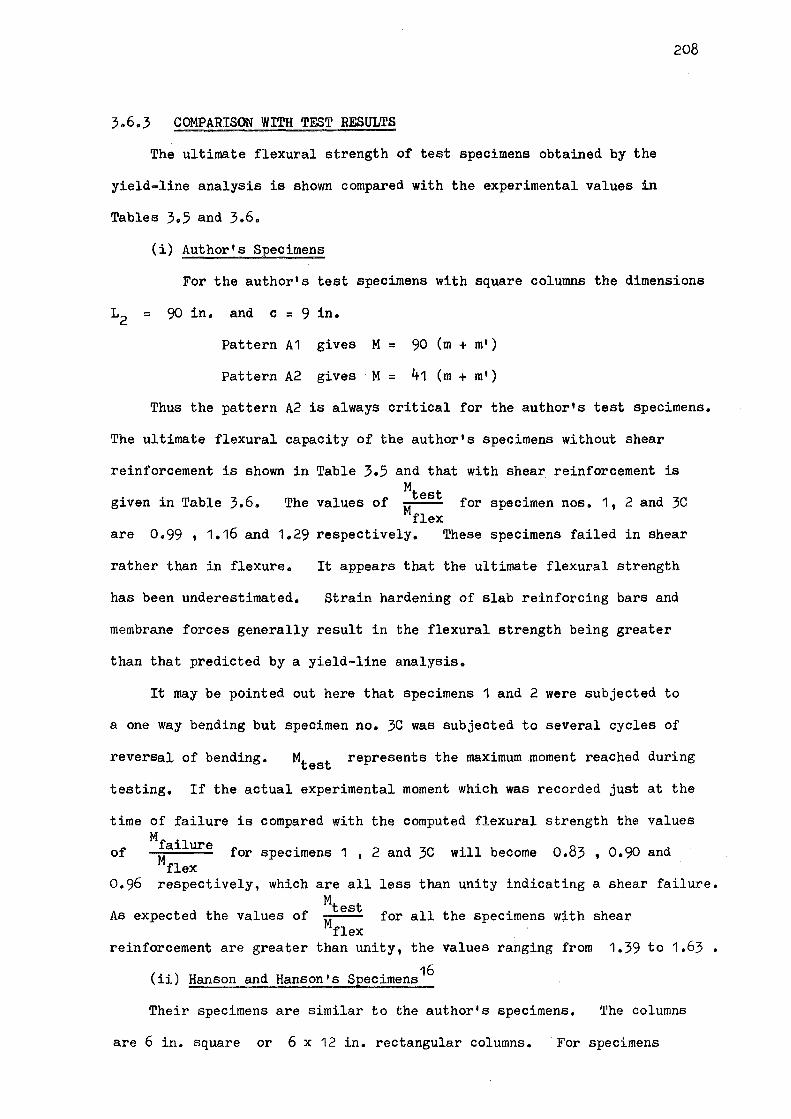
COMPARISON WITH TEST RESULTS
The ultimate flexural strength of test specimens obtained by the
yield-line analysis is shown compared with the experimental values in
Tables 3.5 and 3.6.
(i) Author's Specimens
208
For the author's test specimens with square columns the dimensions
= 90 in. and C = 9 in.
Pattern A1 gives M = 90 (m + m')
Pattern A2 gives M = 41 (m + m1 )
Thus the pattern A2 is always critical for the author's test specimens.
The ultimate flexural capacity of the author's specimens without shear
reinforcement is shown in Table 3.5 and that with shear reinforcement is
f Mtest
given in Table 3.6. The values o -M-- for specimen nos. 1, 2 and 3C flex
are 0.99 , 1.16 and 1.29 respectively. These specimens failed in shear
rather than in flexure. It appears that the ultimate flexural strength
has been underestimated. Strain hardening of slab reinforcing bars and
membrane forces generally result in the flexural strength being greater
than that predicted by a yield-line analysis.
It may be pointed out here that specimens 1 and 2 were subjected to
a one way bending but specimen no. 3C was subjected to several cycles of
reversal of bending. M represents the maximum moment reached during test
testing. If the actual experimental moment which was recorded just at the
time of failure is compared with the computed flexural strength the values
of Mfailure
M for specimens 1 , 2 and 30 will become 0.83, 0.90 and
flex 0.96 respectively, which
As expected the values of
are all
Mtest
Mflex
less than unity indicating a shear failure.
for all the specimens with shear
reinforcement are greater than unity, the values ranging from 1.39 to 1.63.
(ii) Hanson and Hanson's Specimens16
Their specimens are similar to the author's specimens. The columns
are 6 in. square or 6 x 12 in. rectangular columns. For specimens
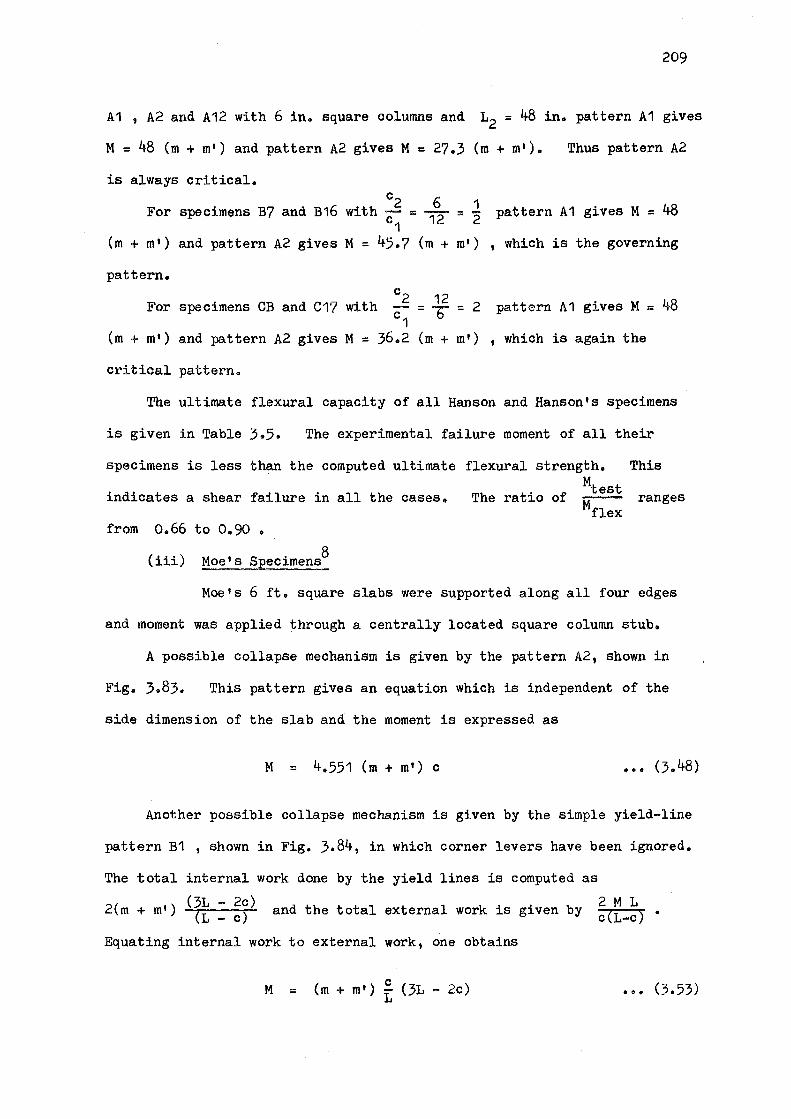
209
A1 , A2 and A12 with 6 in. square columns and L2 = 48 in. pattern A1 gives
M = 48 (m + m1 ) and pattern A2 gives M = 27.3 (m + m•).
is always critical.
Thus pattern A2
For specimens B7 and B16
(m + m•) and pattern A2 gives
pattern.
• 0
2 6 1 with - = - = -01 12 2
M = 45.7 (m + m•)
02 12 For specimens CB and C17 with
01 = b = 2
(m + m•) and pattern A2 gives M = 36.2 (m + m•)
critical patterno
pattern A1 gives M = 48
, which is the governing
pattern A1 gives M = 48
, which is again the
The ultimate flexural capacity of all Hanson and Hanson's specimens
is given in Table 3.5. The experimental failure moment of all their
specimens is less than the computed ultimate
indicates a shear failure in all the cases.
flexural strength. This
Mtest The ratio of M ranges
flex from o.66 to 0.90.
(iii) Moe's Specimens8
Moe's 6 ft. square slabs were supported along all four edges
and moment was applied through a centrally located square column stub.
A possible collapse mechanism is given by the pattern A2, shown in
Fig. 3.83. This pattern gives an equation which is independent of the
side dimension of the slab and the moment is expressed as
M = 4.551 (m + m1 ) c ••• (3.48)
Another possible collapse mechanism is given by the simple yield-line
pattern B1 , shown in Fig. 3.84, in which corner levers have been ignored.
The total internal work done by the yield lines is computed as
Z(m + m•) (3L - 2c) (L - c)
and the total external work is given by
Equating internal work to external work, one obtains
M = (m + m•) ~ (31 - 2c)
2 M L c(L-c) •
••• (3.53)
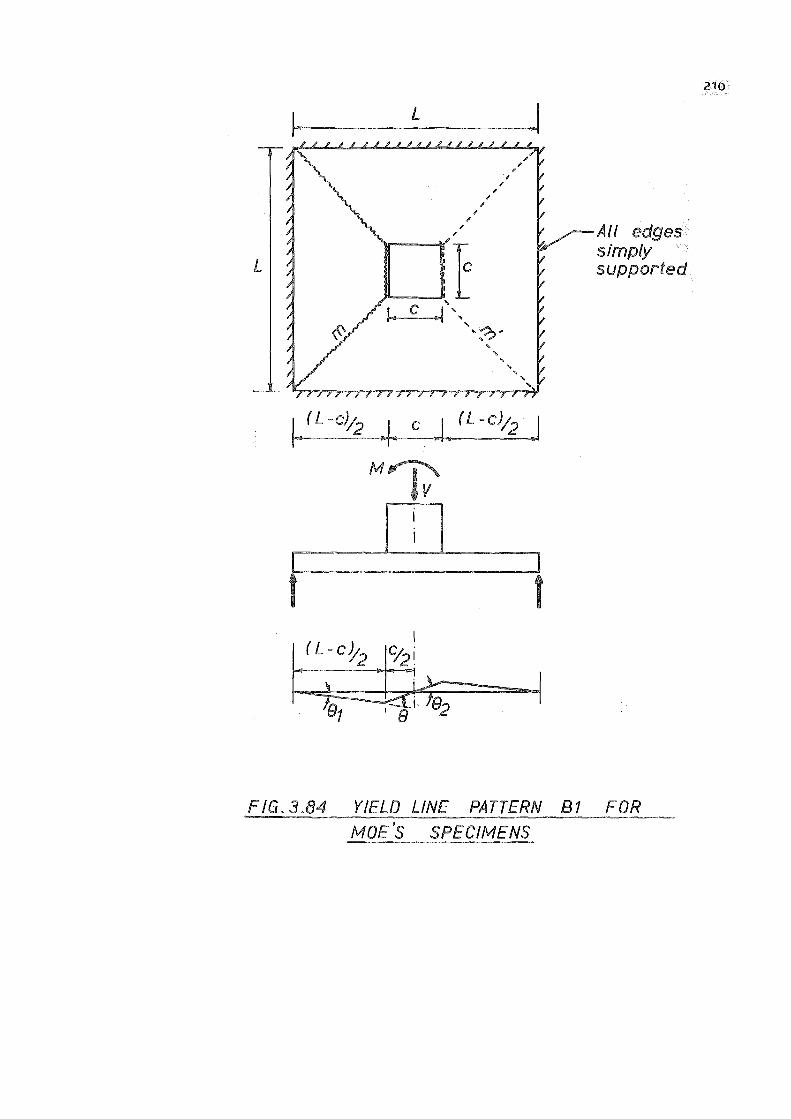
;....
L
L
, .,
·r P------",
--®'"I', ',~-
... '
. I
,,, ( L-c)12 ..,j. C J. (L -c)12 ,.I
M
t t
All edges simply supported
FIG. 3.84 YIELD LINE PATTERN B1 FOR MOE'S SPECIMENS
210
For Moe's specimens with 12 in. square columns and L2 = 72 in., the
governing pattern is that given by the pattern B1 and the moment M = 32
(m + m1 ).
For specimens with 10 in. square columns and L2
= 72 in., pattern
B1 is again the critical pattern, which gives M = 27.2 (m + m1 ).
The yield-line flexural capacity of all Moe's specimens are shown
211
Mtest The ratio of in Table 3.5.
Mflex is less than unity for specimens M2A,
M2, M7 and M9 M test
whereas specimens M4A, M3, M6, M8 and M10 give values of
M flex greater than one indicating a flexural failure. Actually these
specimens failed in shear. This discrepancy may be due to the effect of
strain hardening and membrane forces in the slab.
(iv) 18 Holling's Specimen
Eq. (3.48) for square columns is also applicable to Holling 1 s
specimen with a shearhead. The ultimate flexural capacity of the specimen
is shown in Table 3.6. In this case the plastic moment capacity of the
shear head
ratio of
arms crossing the yield lines has been taken into account. The
Mtest M is found to be 1.48 which indicates a flexural failure. flex
CONCLUSIONS
The ultimate flexural capacity of the slab obtained from the yield-line
theory gives a useful criteria in determining whether the slab-column
junction will fail in shear or in flexure. If this is greater than the
ultimate strength of the slab-column junction under combined moment and
shear loadings appropriate shear reinforcement can be provided at the
junction to prevent a shear failure and thereby achieve the desirable
flexural failure of the junction. Equations derived here give a conservative
indication of the ultimate flexural capacity when shear failure is
prevented.

212
3.7 CONCLUSIONS AND SUGGESTED FUTURE RESEARCH
3.7.1 GENERAL
The experimental investigation shows that flat plate construction
can be used as an earthquake resistant structure if the slab-column
connections are reinforced with shear reinforcement in the form of
shearheads or closed vertical stirrups. The theory presented here
for the prediction of shear and unbalanced moment capacity of flat plate
column connections gives consistent and safe results.
3.7.2 SUMMARY OF CONCLUSIONS
The discussion and conclusions presented at the end of each section
may be summarised as follows:
(a) The recommended ACI 318-71 method for designing flat plate-column
connections transferring shear and unbalanced moment does not
accurately assess the relative contributions to strength from shear,
torsion and flexure at the connection.
(b) Hawkins and Carley's method gives an accurate prediction of the
strength of slab-column connections but their method is too involved
to be used as a practical design method.
(c) The theory presented here is more simplified than Hawkins and Carley's
method and gives better results than the ACI 318-71 method.
(d) The method presented here for determining the strength of slab-column
connections containing shear reinforcement is found to be quite safe
and consistent when compared with test results.
(e) The test results indicate that slab-column connections without any
shear reinforcement have little ductility and failure takes place
suddenly by diagonal tension cracking and splitting away of the
concrete cover.
213
(f) Cranked bars as shear reinforcement result in an increase in the
moment capacity of the connection but do not cause any increase in
the ductility of the connection.
(g) Shearheads and closed stirrups are suitable as shear reinforcement
in earthquake-resistant flat plate-column connections. They ensure
that the connection behaves in a ductile fashion when subjected to
cyclic loading.
(h) For use in practical seismic-resistant flat plate construction two
legged closed stirrups are recommended as they are relatively easy to
fabricate and equally effective as four-legged closed stirrups.
(i) The interstorey deflections of flat plate structures within the
elastic range can be approximately determined using the concept of
effective width.
(j) The deterioration in the load carrying capacity of slab-column
connections reinforced by closed stirrups can be reduced to about 50%
of the maximum value when subjected to repeated cyclic loading well
into the post-elastic range.
(k) Both the experimental and theoretical investigations show that the
folding type failure mechanisms with parallel yield lines across the
full width of the slab adjacent to the column faces may not occur in
flat plate floors. A yield-line pattern involving fan mechanisms
in the slab around the column is the one which will generally govern
the ultimate flexural capacity of the slab-column connection.
SUGGESTED FUTURE RESEARCH
It has been evident from this study that several areas regarding the
behaviour of slab-column connections r~quire further research.
(a) Most of the test data available on the flat plate-column connection
behaviour are on the specimens with square columns only. Experimental
investigations are necessary on specimens with rectangular columns
whose longer side dimension may be parallel or transverse to the
direction of applied bending moment.
214
(b) In the study presented the unbalanced moment capacity of slab-column
connections was determined with a constant level of vertical shear
force at the junction. In future experimental work various levels
of vertical shear force could be used in order to find the moment
capacities of the junctions and to check the interaction equations.
(c) Both the theoretical and experimental work need to be extended to
the case of exterior slab-column connections.

A1
APPENDIX A
BIBLIOGRAPHY
1. JOHANSEN, K.W., "Yield-line Theory", Cement and Concrete Association, London, 1962, p.181.
2. Draft "British Standard Code of Practice for the Structural Use of Concrete", 1969.
3. LASH, S.D. and BANERJEE, A., "Strength of Simply Supported Square Plates with Central Square Openings", Transaction of the Engineering Institute of Canada, , Vol. 10, No. A-5, June, 1967, p.3-11.
4. ZASLAVSKY, A., "Yield-line Analysis of Rectangular Slabs with Central Openings", ACI Journal, Proceedings V.64, December, 1967, p.838-844.
5. JOHANSEN, K.W., 11Pladeformler11 , Kobenhaun, Akademisk Forlag, 1963.
6. ELSTNER, R.C. and HOGNESTAD, E., "Shearing Strength of Reinforced Concrete Slabs", ACI Journal, Proceedings V.53, July, 1956, p.29-58.
7., KINNUNEN, S. and NYLANDER, H., "Punching of Concrete Slabs Without Shear Reinforcement", Transactions of the Royal Institute of Technology, Stockholm, No. 158, 1960.
8. MOE, J., "Shearing Strength of Reinforced Concrete Slabs and Footings Under Concentrated Loads", Development Department Bulletin D47, Portland Cement Association, Skokie, Illinois, April, 1961, 130 pages.
9., TASKER, H.E. and WYATT, K.J., "Shear in Flat Plate Construction Under Uniform Loading", Special Report No. 23, Department of Works, Commonwealth Experimental Building Station, Sydney, 1963.
10. YITZHAKI, D., "Punching Strength of Reinforced Concrete Slabs", Comite Europeen du Beton Bulletin d'Information No. 58, October, 1966, p.83-115.
11. WHITNEY, c.s., "Ultimate Shear Strength of Reinforced Concrete Flat Slabs, Footings, Beams and Frame Members Without Shear Reinforcement", ACI Journal, Proceedings V.54, October, 1957, p.265-298.
12., ACI-ASCE COMMITTEE 326, "Shear and Diagonal Tension", ACI Journal, Proceedings V.59, March, 1962, p.353-395.
13. ACI COMMITTEE 318, "Building Code Requirements for Reinforced Concrete (ACI 318-71) 11 , American Concrete Institute, Detroit, 1971.
14. DI STASIO, J. and VAN BUREN, M.P •, "Transfer of Bending Moment Between Flat Plate Floor and Column", ACI Journal, Proceedings V.57, September, 1960, p.299-314.
15. ACI COMMITTEE 318, "Commentary on Building Code Requirements for Reinforced Concrete (ACI 318-63) 11 , Publication SP-10, American Concrete Institute, Detroit, 1965.
16. HANSON, N.W. and HANSON, J.M., "Shear and Moment Transfer Between Concrete Slabs and Columns", Journal of the PCA Research and Development Laboratories, Vol. 10 9 No. 1, January, 1968, p.2-16. Also PCA Development Department Bulletin D129.
17e KREPS, R.R. and REESE, R.C., Discussion of "Transfer of Bending Moment Between Flat Plate Floor and Column", by Di Stasio and Van Buren, M.P., ACI Journal, Proceedings v.57, March, 1961, p.1261-1263.
18. HOLLINGS, J.P., "The Rotational Capacity of a Reinforced Concrete Flat Slab to Column Connection", Journal of New Zealand Engineering, Vol. 22, No. 8, August, 1967, p.317-320.
19. CARPENTER, J.E., KAAR, P.H. and HANSON, N.W., Discussion of "Proposed Revision of ACI 318-63: Building Code Requirements for Reinforced Concrete", by ACI Committee 318, ACI Journal, Proceedings V.67, September, 1970, p.696-697.
20. HAWKINS, N.M. and CORLEY, W.G., "Transfer of Unbalanced Moment and Shear From Flat Plates to Columns", Tentative Report, PCA R/D Ser. 1482, Portland Cement Association, Skokie, Illinois, October, 1970.
21. ACI COMMITTEE 318., "Building Code Requirements for Reinforced Concrete (ACI 318-56) 11 , ACI Journal, Proceedings V.52, May, 1956, p.913-986.
22. ACI COMMITTEE 318., "Building Code Requirements for Reinforced Concrete (ACI 318-63) 11 , American Concrete Institute, Detroit, June, 1963.
23. ACI COMMITTEE 318., "Commentary on Building Code Requirements for Reinforced Concrete (ACI 318-71)", American Concrete Institute, Detroit, 1971.
24. HSU, T.T.C., "Ultimate Torque of Reinforced Rectangular Beams", Journal of Structural Division, Proceedings, ASCE, Vol.94, ST2, February, 1968, p.485-510. Also PCA Development Department Bulletin D127.
A2
25. HSU, T.T.C., "Torsion of Structural Concrete-Plain Concrete Rectangular Sections", Publication SP-18, American Concrete Institute, Detroit, 1968, p.203-238. Also PCA Development Department Bulletin D134.
26. HSU, T.T.C., "Torsion of Structural Concrete - Behaviour of Reinforced Concrete Rectangular Members", Publication SP-18, American Concrete Institute, Detroit, 1968, p.261-306. Also PCA Development Department Bulletin D135.
27. HSU, T. T .C. , "Torsion of Structural Concrete - Interaction Surface for Combined Torsion, Shear and Bending in Beams Without Stirrups", ACI Journal, Proceedings V.65, January, 1968, p.51-60. Also PCA Development Department Bulletin D138.
A3
28. CORLEY, W .G. and HAWKINS, N .M., 11Shearhead Reinforcement for Slabs", ACI Journal, Proceedings V.65, October, 1968, p.811-824. Also PCA Development Department Bulletin D144.
29. PRIVATE COMMUNICATION from Carpenter, J.E., Portland Cement Association, Skokie, Illinois, May 5, 1969.
30. HERZOG, M., "A New Evaluation of Earlier Punching Shear Tests", Concrete, Journal of the Concrete Society, London, Vol.4, No. 12, December, 1970, p.448-450.
31. GRAF, o., "Strength Tests of Thick Reinforced Concrete Slabs Supported on All Sides Under Concentrated Loads", Deutscher Ausschuss fur Eisenbeton, Bulletin No. 88, Berlin, 1938.
32. ROSENTHAL, I., "Experimental Investigation of Flat Plate Floors", ACI Journal, Proceedings V.56, August, 1959, p.153-166.
33. ANDERSSON, J .L., "Punching of Concrete Slabs With Shear Reinforcement", Transactions of the Royal Institute of Technology, Stockholm, No. 212, 1963.
34. FRANZ, G., "The Column Region of Reinforced Concrete Flat Plates", Comite Europeen du Beton Bulletin d'Information No. 58, October, 1966, p.38-50 (In German).
35. RUSSELL, H.G., "Flat-Slab and Column Construction - A Preliminary Investigation of the Design of Column-Slab Joints With Reference to Punching-Shear and Bending-Moment Transmission", Building Research Station, Garston, England, 1969.
36. TSUBOI, Y. and KAWAGUCHI, M., 110n Earthquake Resistant Design of Flat Slabs and Concrete Shell Structures", Proceedings of the Second World Conference on Earthquake Engineering, Japan, Vol. III, July, 1960, p.1693-1708.
37. MAST, P .E., "Stresses in Flat Plates Near Columns", ACI Journal, Proceedings V.67, October, 1970, p.761-768.
'

38. PARK, R., "Ultimate Strength of Rectangular Concrete Slabs Under Short-Term Uniform Loading with Edges Restrained Against Lateral Movement", Proceedings of the Institution of Civil Engineers, Vol. 28, June, 1964, p.125-150.
39. PARK, R., "The Ultimate Strength and Long-Term Behaviour of Uniformly Loaded Two-Way Concrete Slabs with Partial Lateral Restraint at All Edges", Magazine of Concrete Research, Vol. 16, No. 48, September, 1964, p.139-152.
40e PARK, R., "Ultimate Strength Design of Reinforced Concrete Structures", Vol. 2 - "Limit Design of Reinforced Concrete Slabs", University of Canterbury, Christchurch, 1969.
41. AALAMI, B., "Moment-Rotation Relation Between Column and Slab", ACI Journal, Proceedings V.69, May, 1972, p.263-269.
A4

MATERIALS, EQUIPMENT AND TESTING PROCEDURE FOR SLAB-COLUMN SPEXJIMENS
B01 MATERIALS
B.1.1 Concrete
(a) Mix Properties
The concrete used in all specimens was a specially mixed mortar,
AD-i]:, supplied by Certified Concrete Limited, Christchurch, and was
made with ordinary portland cement and a graded aggregate with a maximum
size of ¾ in. The design strength of the mix was 4000 psi at 28 days.
The mix proportions by weight were:
aggregate cement water = 4.20: 1 : 0.69
The slumps measured for the mix ranged from 3-iJ:- in. to ~ in.
(b) Control Specimens
B1
For the slab and the lower column in each specimen, four 6 in. diameter
x 12 in. cylinders and three 12 in. x 3 in. x 3 in. modulus of rupture
prisms were cast in machined steel forms. Three additional 6 in. diameter x
12 in. cylinders were cast for the concrete in the upper column which was
poured one day after the slab and the lower column were placed. The control
specimens were tested immediately after each slab-column experiment. The
cylinders were capped with plaster at both ends and were loaded at 2000 psi
per minute to failure. The modulus of rupture prisms were tested slowly.
The 12 in. x 3 in. x 3 in. prisms were simply supported over 9 in. point
loads being applied 3 in. from the supports.
The results of the concrete control specimen tests are given in
Table B.1.

B2
TABLE B.1
CONCREI'E PROPERTIES AT TIME OF TESTING
SLAB AND LOWER COLUMN UPPER COLUMN
SPECIMEN AGE CYLINDER MODULUS OF CYLINDER NO. STRENGTH RUPTURE STRENGTH fl f fl
C r C
days psi psi psi
1 110 3960 620 3880
2 39 4630 680 5250
3C 41 4310 687 5080
4s 31 4630 69() 4650
5S 39 4430 562 4520
6CS 42 4090 568 4620
7CS 58 4310 726 5120
Bes 91 3210 506 4160

B3
B.1.2 Steel
(a) Slab Reinforcement
Deformed mild steel reinforcing bars of¾ in. diameter were used as
top and bottom reinforcement in the slab. The reinforcing bars were
obtained from one manufacturer but in different lots. For tension tests
six 18 in. long samples were taken from the batch of reinforcing bars used
in each slab-column specimen. Care was taken to ensure that some of the
test samples came from bars which passed through the column in the longer
direction. Tension tests were conducted on these samples and values of
yield stress f and ultimate stress f' shown in Table B.2 were averages y s
of these tests. In addition, stress-strain curves were found for selected
steel specimens using a Baty mechanical extensometer on a 2 in. gauge length,
and an Avery 25,000 lb. Universal Testing Machine. Fig. B.1 shows the shape
of a representative stress-strain curve for a typical¾ in. diameter bar
used in the slab.
(b) Column Reinforcement
The column was reinforced with 8 Nos. of¾ in. diameter deformed mild
steel bars and ties were made of¾ in. diameter plain mild steel bars. The
reinforcing bars for columns were obtained in two batches and their strengths
are given in Table B.2.
(c) Shear Reinforcement
¾ in. diameter deformed bars used as shear reinforcement in the form
of inclined cranked bars in specimen 4s came from the same batch of
reinforcement as used in the slab. Measured yield and ultimate stresses are
given in Table B.2.
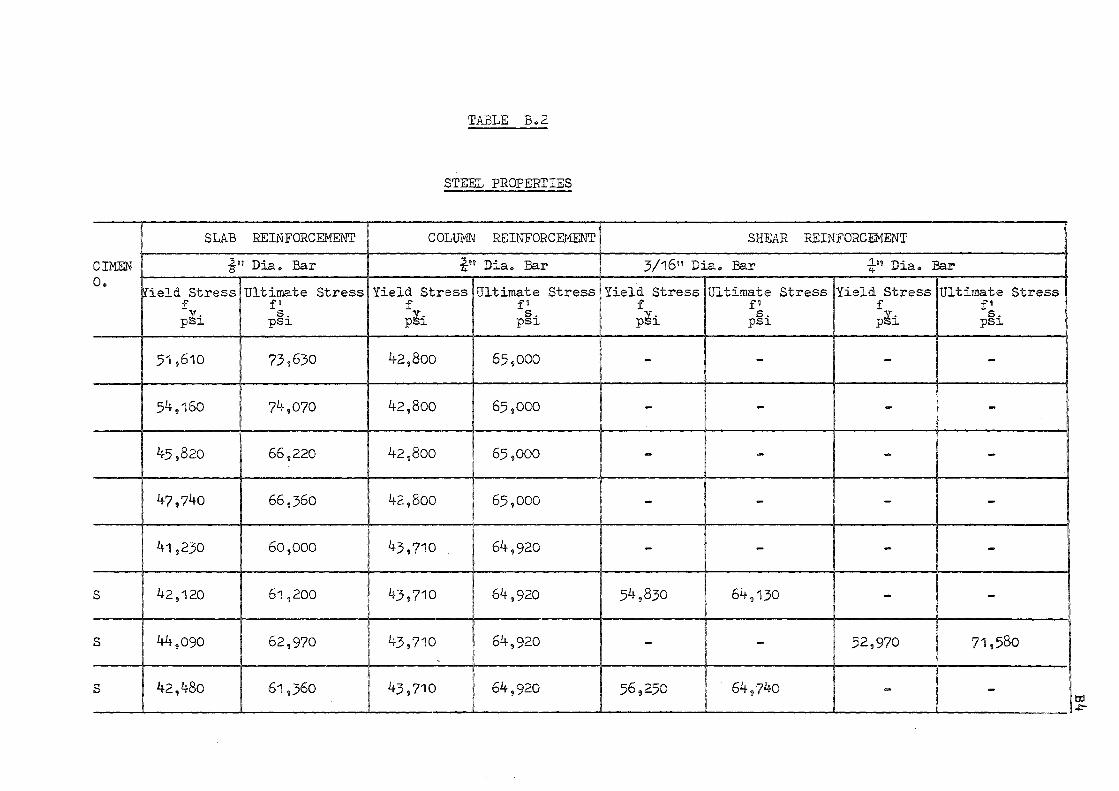
TABLE B.2
STEEL PROPERTIES
SLAB REINFORCEMENT COLUMN REINFORCEMENT
SPECIMEN -§- 11 Dia. Bar ¾u Dia. Bar NO.
~ield Stress Yield Str,ess Ultimate Stress Ultimate Stress f fl f fl p~h s. pli s. psi psi
1 51,610 73,630 42,800 65,000
2 54,160 74,070 42,800 65,000
3C 45,820 66,220 42,800 65,000
4s 47,740 66,360 42,800 65,000
5S 41,230 60,000 43,710 64,920
6CS 42,120 61?200 43,710 64,920
?CS 44,090 62,970 43,710 64,920 0
8cs 42,480 61,360 43,710 64,920
SHEAR REINFORCEMENT
3/16" Dia. Bar ¾" Dia. Bar
Yield Stress Ultimate Stress Yield Stress Ultimate Stress f fl f fl pli s. pli s. psi psi
- - - -
- - - -
- - - -
- - - -
- - - -
54,830 64,130 - -
- - 52,970 71,580
56,250 64,740 - -tld ;
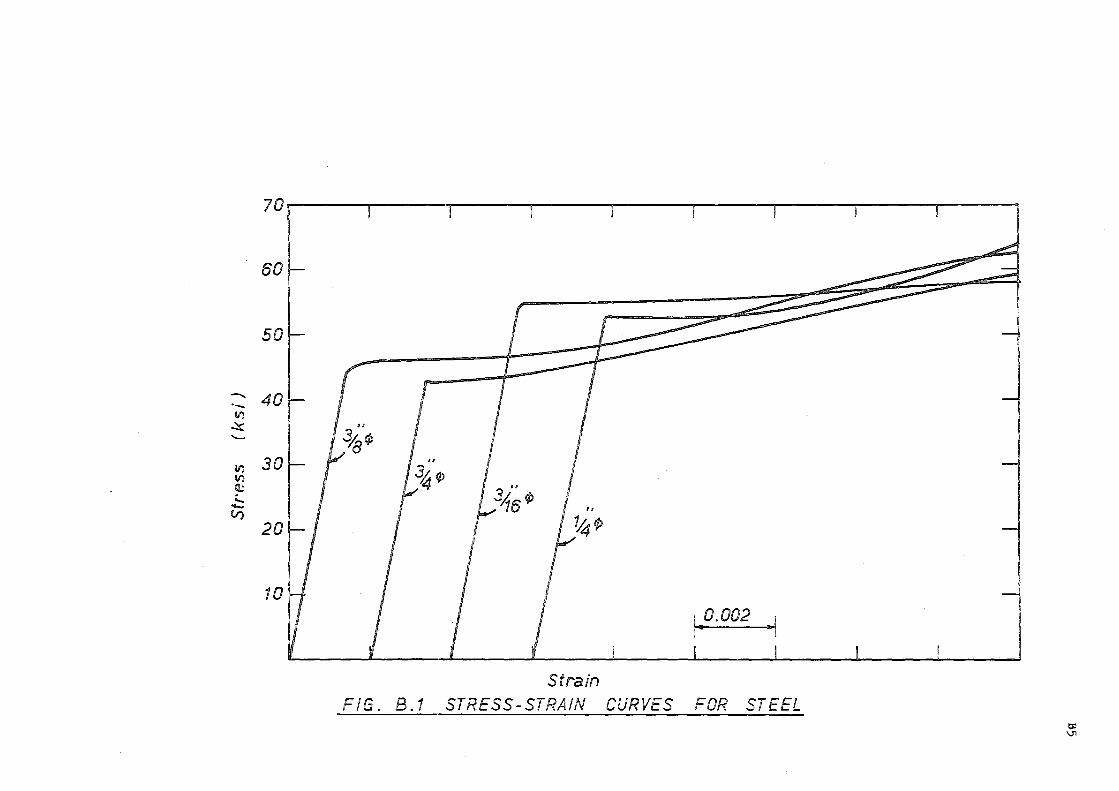
--... ·-V)
~ -II) II) (lJ
'-..... V)
70,---,----,--~--,---~----r------r---.---
60
50
40
30
20
10
1 .. 0.002 .1
Strain FIG. B.1 STRESS-STRAIN CURVES FOR STEEL
tll \J1

-II)
4
3
f~t1
T,'" 0.121L l_ .15 0.128
11
Channel section:
Elastic modulus = 0.188 in3
Plastic modulus:: 0.2 25 in3
1 Pair of channel
.9-, 2 ~
/ placed back to
~======~~~=-====:::::• back ~ a ,I, b ,I, a 1
1
I" 24' bl 9,"
a = 9 06
b:: 4 ~·
o---------_._ __ ..__ _ ___._ __ __.__ __ _._ _ _, 0 0.1 0.2 0.3 0.4
Deflection at centre 0.5 0.6
(ins.)
FIG. B. 2 LOAD-DEFLECTION CURVE FOR SHEARHEAD
0.7
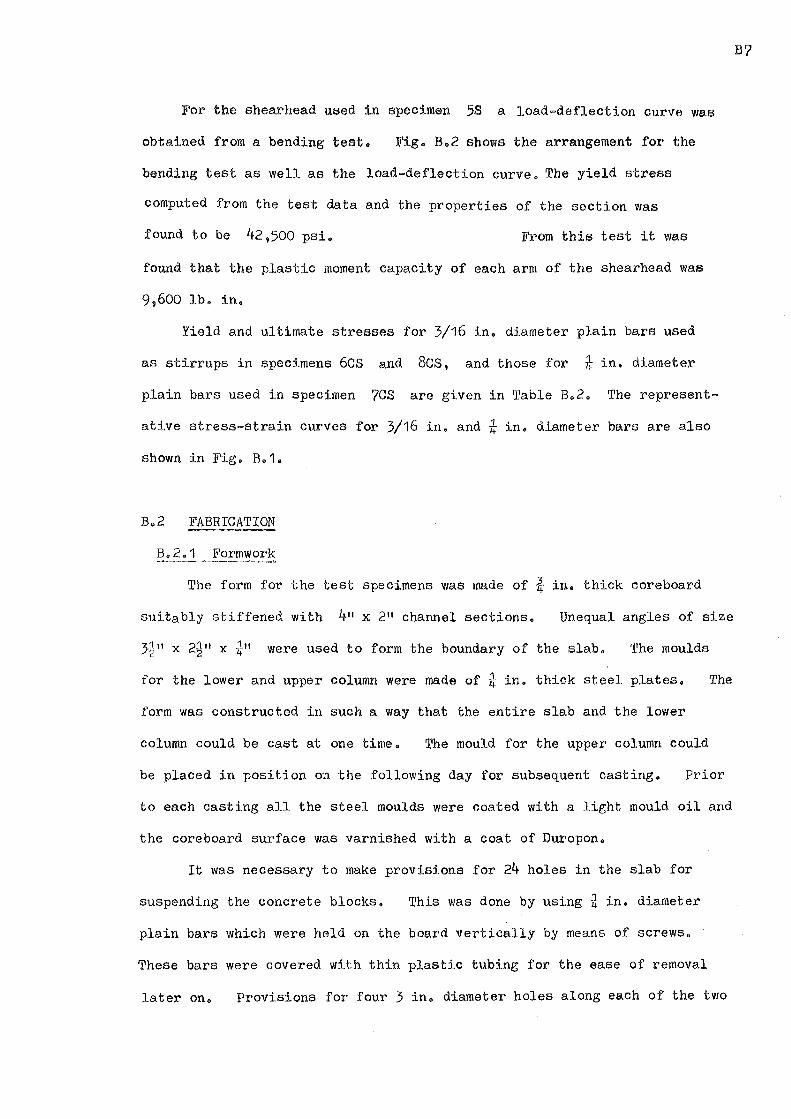
For the shearhead used in specimen 5S a load-deflection curve was
obtained from a bending test. Fig. B.2 shows the arrangement for the
bending test as well as the load-deflection curve. The yield stress
computed from the test data and the properties of the section was
found to be 42,500 psi. From this test it was
found that the plastic moment capacity of each arm of the shearhead was
9,600 lb. in.
Yield and ultimate stresses for 3/16 in. diameter plain bars used
as stirrups in specimens 6CS and 8cs, and those for ¾in.diameter
plain bars used in specimen 7CS are given in Table B.2. The represent
ative stress-strain curves for 3/16 in. and¾ in. diameter bars are also
shown in Fig. B.1.
B.2 FABRICATION
B.2.1 Formwork
The form for the test specimens was made of¾ in. thick coreboard
suitably stiffened with 411 x 211 channel sections. Unequal angles of size
3-J" x 2i 11 x -;J:-11 were used to form the boundary of the slab. The moulds
for the lower and upper column were made of¾ in. thick steel plates. The
form was constructed in such a way that the entire slab and the lower
column could be cast at one time. The mould for the upper column could
be placed in position on the following day for subsequent casting. Prior
to each casting all the steel moulds were coated with a light mould oil and
the coreboard surface was varnished with a coat of Duropon.
It was necessary to make provisions for 24 holes in the slab for
suspending the concrete blocks. This was done by using i in. diameter
plain bars which were held on the board vertically by means of screws.
These bars were covered with thin plastic tubing for the ease of removal
later on. Provisions for four 3 in. diameter holes along each of the two
B?
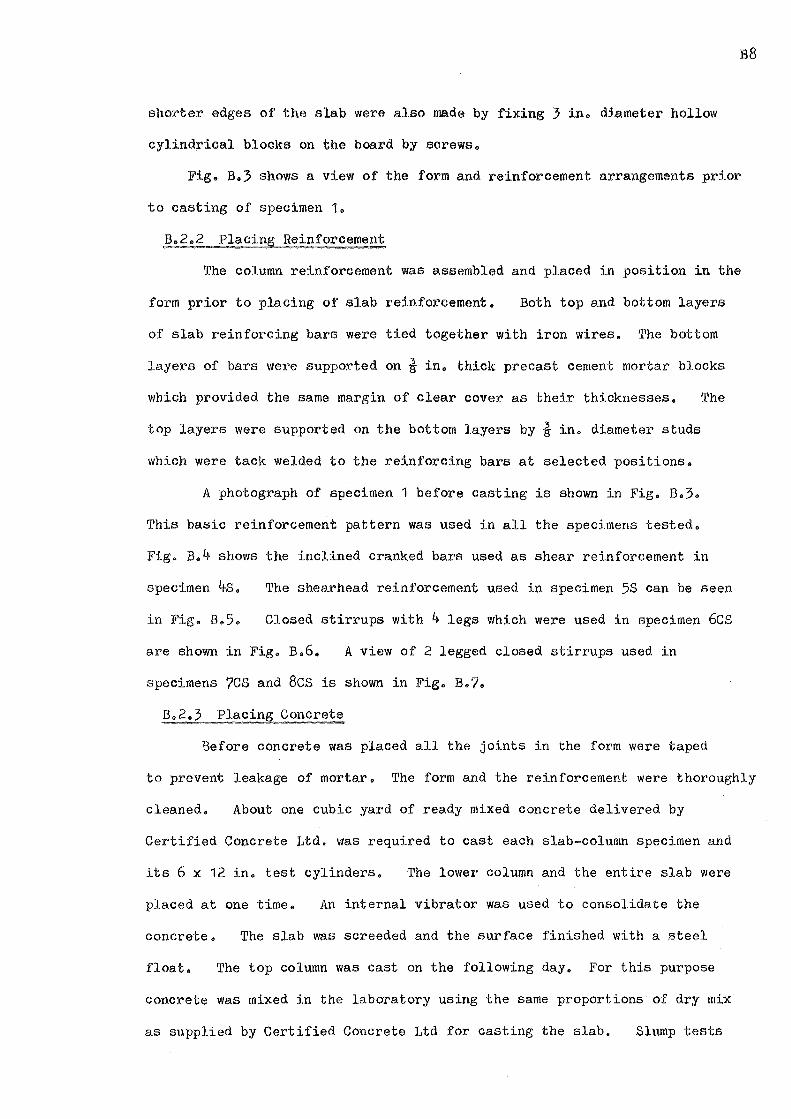
shorter edges of the slab were also made by fixing 3 in. diameter hollow
cylindrical blocks on the board by screws.
BB
Fig. B.3 shows a view of the form and reinforcement arrangements prior
to casting of specimen 1.
B.2.2 Placing Reinforcement
The column reinforcement was assembled and placed in position in the
form prior to placing of slab reinforcement. Both top and bottom layers
of slab reinforcing bars were tied together with iron wires. The bottom
layers of bars were supported on¾ in. thick precast cement mortar blocks
which provided the same margin of clear cover as their thicknesses. The
top layers were supported on the bottom layers by¾ in. diameter studs
which were tack welded to the reinforcing bars at selected positions.
A photograph of specimen 1 before casting is shown in Fig. B.3.
This basic reinforcement pattern was used in all the specimens tested.
Fig. B.4 shows the inclined cranked bars used as shear reinforcement in
specimen 4s. The shearhead reinforcement used in specimen 5S can be seen
in Fig. B.5. Closed stirrups with 4 legs which were used in specimen 6CS
are shown in Fig. B.6. A view of 2 legged closed stirrups used in
specimens ?CS and Bes is shown in Fig. B.7.
B.2.3 Placing Concrete
Before concrete was placed all the joints in the form were taped
to prevent leakage of mortar. The form and the reinforcement were thoroughly
cleaned. About one cubic yard of ready mixed concrete delivered by
Certified Concrete Ltd. was required to cast each slab-column specimen and
its 6 x 12 in. test cylinders. The lower column and the entire slab were
placed at one time. An internal vibrator was used to consolidate the
concrete.
float.
The slab was screeded and the surface finished with a steel
The top column was cast on the following day. For this purpose
concrete was mixed in the laboratory using the same proportions of dry mix
as supplied by Certified Concrete Ltd for casting the slab. Slump tests
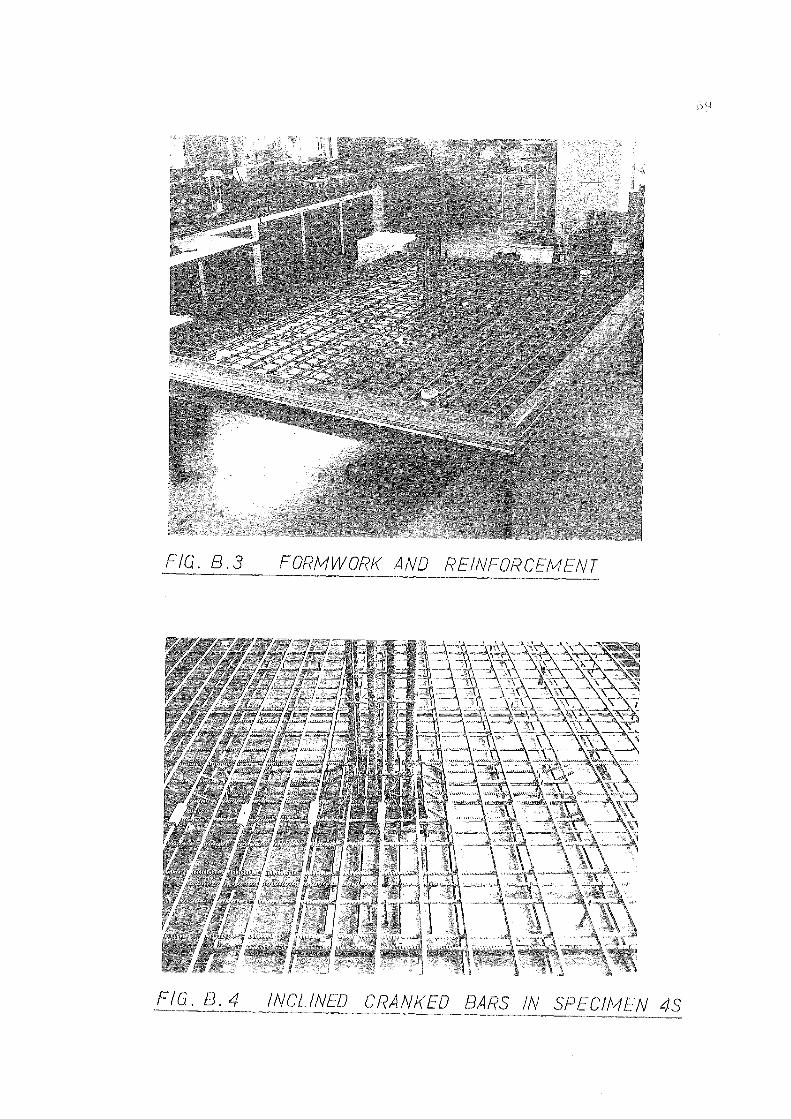
FIG. B. 3 FORMWORK AND REINFORCE/v!ENT
FIG. B. 4 INCLINED CRANKED BARS IN SPECl/v1EN 4S

B10
FlG. B. 5 SHEARHEAD IN SPECIMEN 55
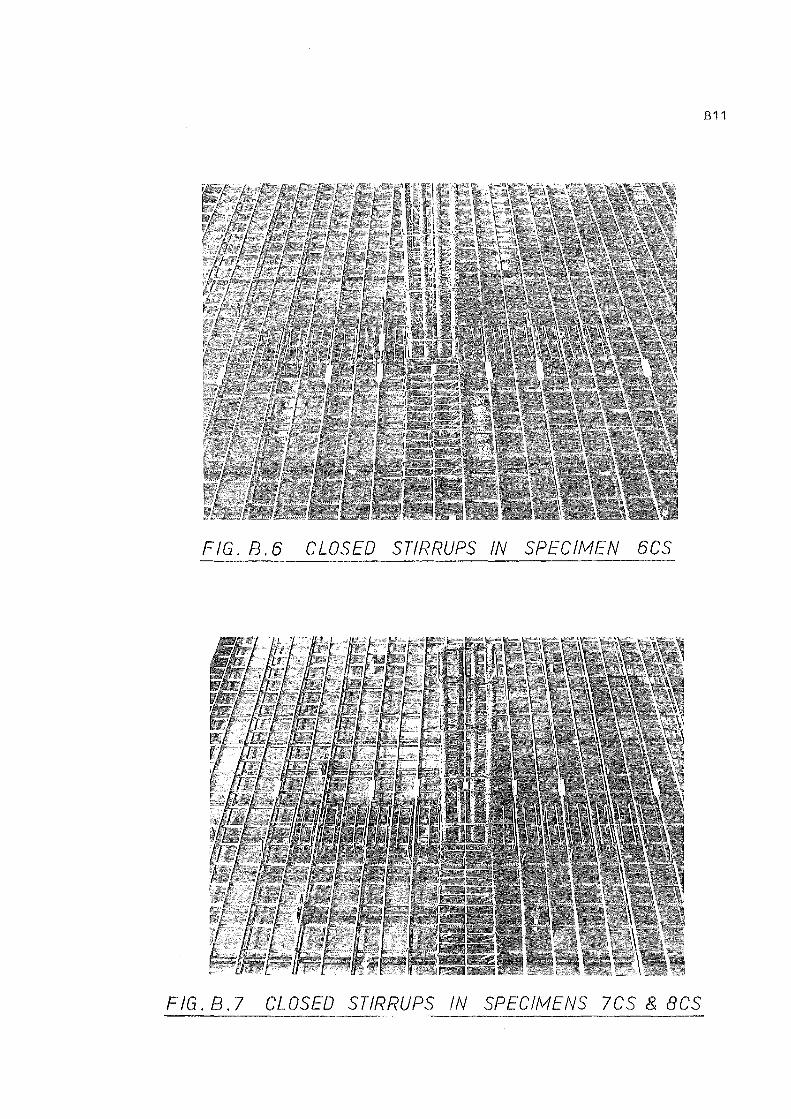
B11
FIG. B.6 CLOSED STIRRUPS IN SPECl/v!EN 6CS
FIG. B. 7 CLOSED STIRRUPS IN SPEC I/vi ENS 7CS & BCS
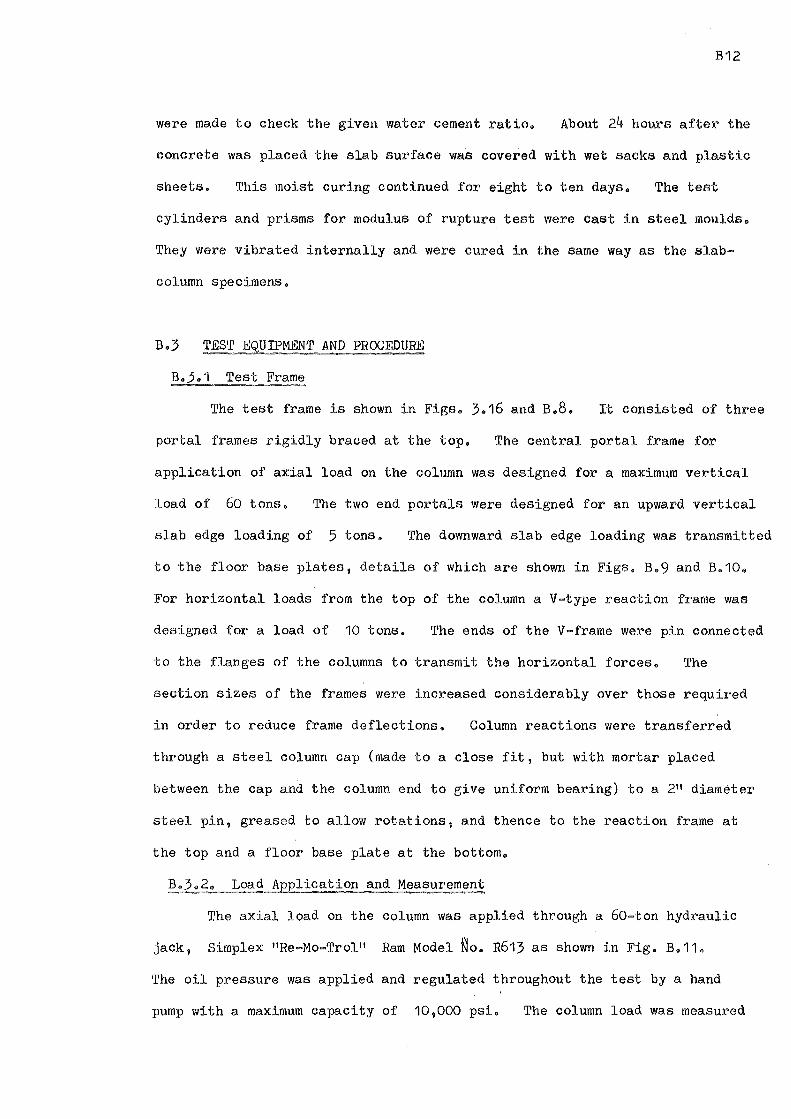
B12
were made to check the given water cement ratio. About 24 hours after the
concrete was placed the slab surface was covered with wet sacks and plastic
sheets. This moist curing continued for eight to ten days. The test
cylinders and prisms for modulus of rupture test were cast in steel moulds.
They were vibrated internally and were cured in the same way as the slab
column specimens.
B.3 TEST EQUIPMENT AND PROCEDURE
B.3.1 Test Frame
The test frame is shown in Figs. 3.16 and B.8. It consisted of three
portal frames rigidly braced at the top. The central portal frame for
application of axial load on the column was designed for a maximum vertical
load of 60 tons. The two end portals were designed for an upward vertical
slab edge loading of 5 tons. The downward slab edge loading was transmitted
to the floor base plates, details of which are shown in Figs. B.9 and B.10.
For horizontal loads from the top of the column a V-type reaction frame was
designed for a load of 10 tons. The ends of the V-frame were pin connected
to the flanges of the columns to transmit the horizontal forces. The
section sizes of the frames were increased considerably over those required
in order to reduce frame deflections. Column reactions were transferred
through a steel column cap (made to a close fit, but with mortar placed
between the cap and the column end to give uniform bearing) to a 211 diameter
steel pin, greased to allow rotations, and thence to the reaction frame at
the top and a floor base plate at the bottom.
B.3.2. Load Application and Measurement
The axial load on the column was applied through a 60-ton hydraulic
jack, Simplex "Re-Mo-Trol" Ram Model ~o. R613 as shown in Fig. B.11.
The oil pressure was applied and regulated throughout the test by a hand
pump with a maximum capacity of 10,000 psi. The column load was measured
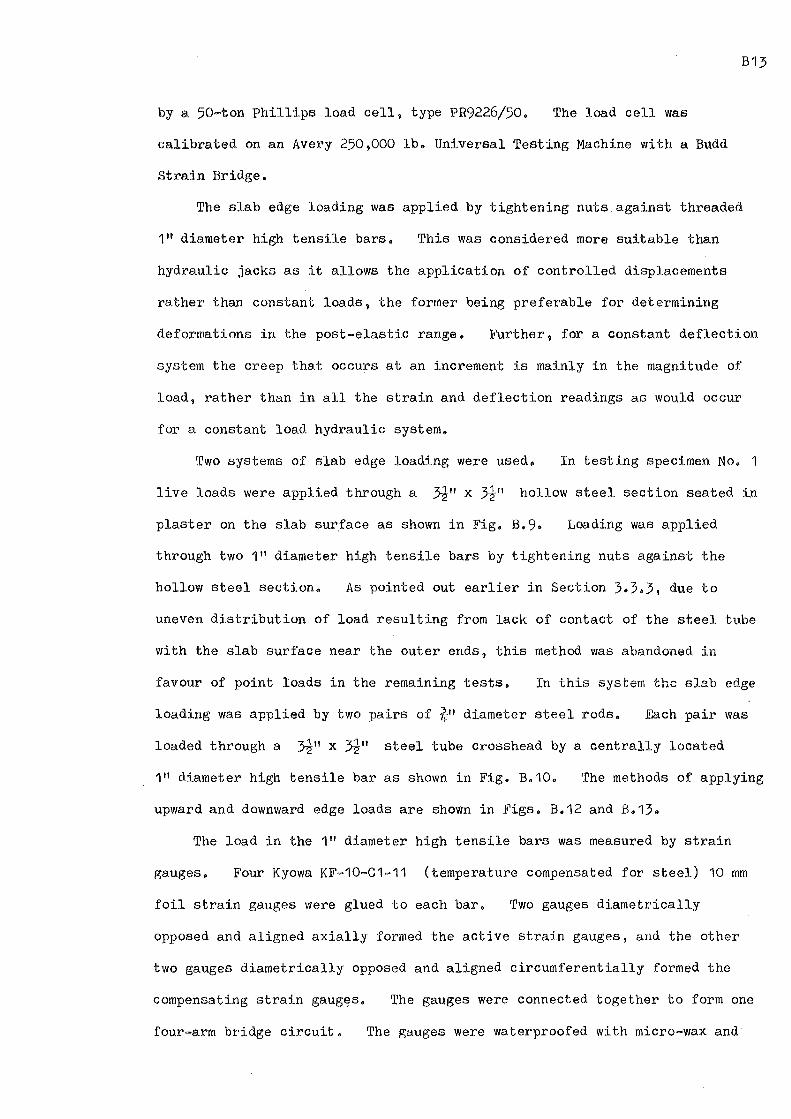
B13
by a 50-ton Phillips load cell, type PR9226/50. The load cell was
calibrated on an Avery 250,000 lb. Universal Testing Machine with a Budd
Strain Bridge.
The slab edge loading was applied by tightening nuts against threaded
111 diameter high tensile bars. This was considered more suitable than
hydraulic jacks as it allows the application of controlled displacements
rather than constant loads, the former being preferable for determining
deformations in the post-elastic range. Further, for a constant deflection
system the creep that occurs at an increment is mainly in the magnitude of
load, rather than in all the strain and deflection readings as would occur
for a constant load hydraulic system.
Two systems of slab edge loading were used. In testing specimen No. 1
live loads were applied through a ~" x 3i" hollow steel section seated in
plaster on the slab surface as shown in Fig. B. 9. Loading was applied
through two 1 11 diameter high tensile bars by tightening nuts against the
hollow steel section. As pointed out earlier in Section 3.3.3, due to
uneven distribution of load resulting from lack of contact of the steel tube
with the slab surface near the outer ends, this method was abandoned in
favour of point loads in the remaining tests. In this system the slab edge
loading was applied by two pairs of¾" diameter steel rods. Each pair was
loaded through a 3i" x ~" steel tube crosshead by a centrally located
111 diameter high tensile bar as shown in Fig. B.10. The methods of applying
upward and downward edge loads are shown in Figs. B.12 and B.13.
The load in the 1" diameter high tensile bars was measured by strain
gauges. Four Kyowa KF-10-C1-11 (temperature compensated for steel) 10 mm
foil strain gauges were glued to each bar. Two gauges diametrically
opposed and aligned axially formed the active strain gauges, and the other
two gauges diametrically opposed and aligned circumferentially formed the
compensating strain gaug~s. The gauges were connected together to form one
four-arm bridge circuit. The gauges were waterproofed with micro-wax and
B14
the bars loaded in direct tension and calibrated with a Budd Strain Bridge
Model P-350. The load-strain plot for each high tensile bar was very
consistent and linear as shown in Fig. B.14.
To apply a uniformly distributed load of 2 63.75 lb/ft on the slab
24 concrete blocks, each weighing 200 lbs were suspended from the slab.
The location of these point loads are shown in Fig. 3.9. The size of each
concrete block was 1211 x 1211 x 1611 (height) and their actual weights were
found to vary slightly, all remaining under weight. Extra weights of
varying amounts had to be placed on these blocks to make the weight of each
block exactly 200 lbs. The concrete blocks were suspended from the slab
by¾ in. diameter plain bars.
The deflections along the centre lines of the column and the slab
in the longer direction were measured by a number of 211-travel and 111-travel,
0.001 11 dial gauges. The dial gauge locations are shown in Fig. B.15.
For loading the slab edges by controlled deformations dial gauges were also
placed at each corner of the slab.
B.3.4 Steel Strains
Steel strains were measured by electrical resistance strain gauges
glued to the surface of both slab reinforcing bars and shear reinforcement.
The strain gauge locations are shown in corresponding stress diagrams for
slab bars and shear reinforcement such as Figs. 3.19, 3.40, 3.45, etc.
The slab reinforcement gauges were placed in position after removing a cork
block fixed between the bar and the mould surface on casting. However,
for the various shear reinforcement arrangements used it was more practicable
to place and waterproof the gauges prior to casting.
The strain gauges used for i" diameter bars and the shearhead were
BLH SR-4 Type A-12 gauges, a wire gauge length of 1". For 3/16 in. diameter
and i in. diameter stirrups it was necessary to use Kyowa KF-15-C8-11 gauges

B15
-------~~---C:~:-~B.C: ~--
TES T FR,~/VIE
'11
1a·
--------~==---• • •JJJ· .•· p, •.,, •• : • 'a• ii .
(diameter high tensile bar
18' 1
-- - - - - ..,. .... - - - -
3~ slab
FIG. B.9 METHOD OF APPLYING LINE LOAD AT EDGE
" ,,
24 24
. ,. ' e , .
• 6 • I
" • .i1 • • ·a· •" " a ~ •• ,. • ~ • 4 •• ••
,. 1 diameter
/ high tensile bar
FIG. B.1O METHOD OF APPLYING EDGE LOAD THROUGH 4 POINTS
B1b
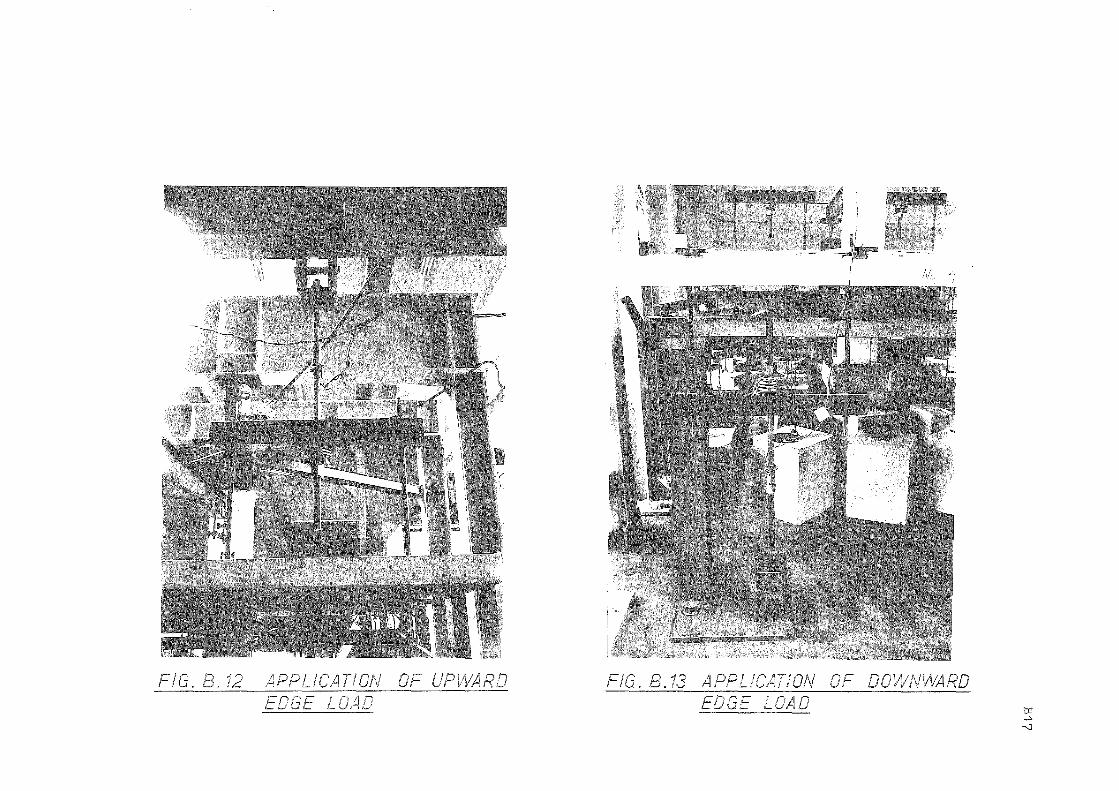
1" 11pp1 irA nur, IL /-ir L-iv /'"'\, RD EDGE LOAD to
-' ---J
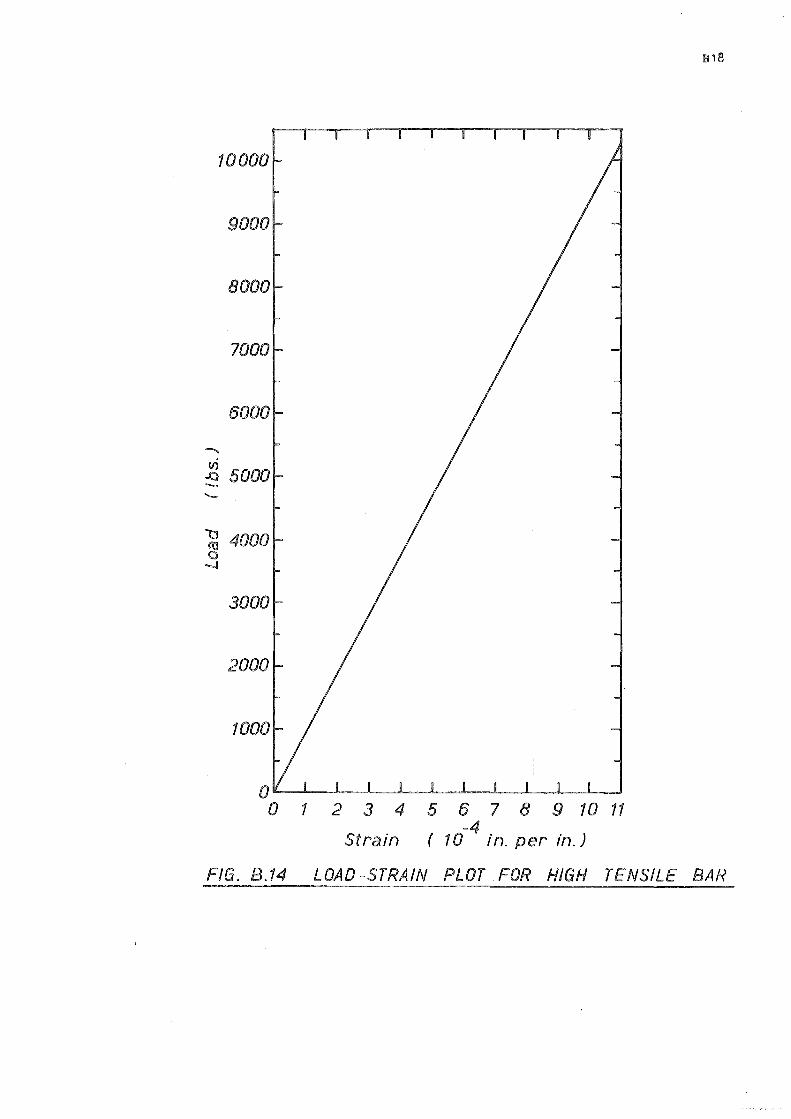
10000
9000
8000
7000
6000
-2 5000 --~ 4000 0 -8
3000
2000
1000
0----------...__ _______ ....._ __
0 1 2 3 4 5 6 7 8 9 10 11 -4
Strain ( 10 in. per in.)
FIG. B.14 LOAD-STRAIN PLOT FOR HIGH TENSILE BAR
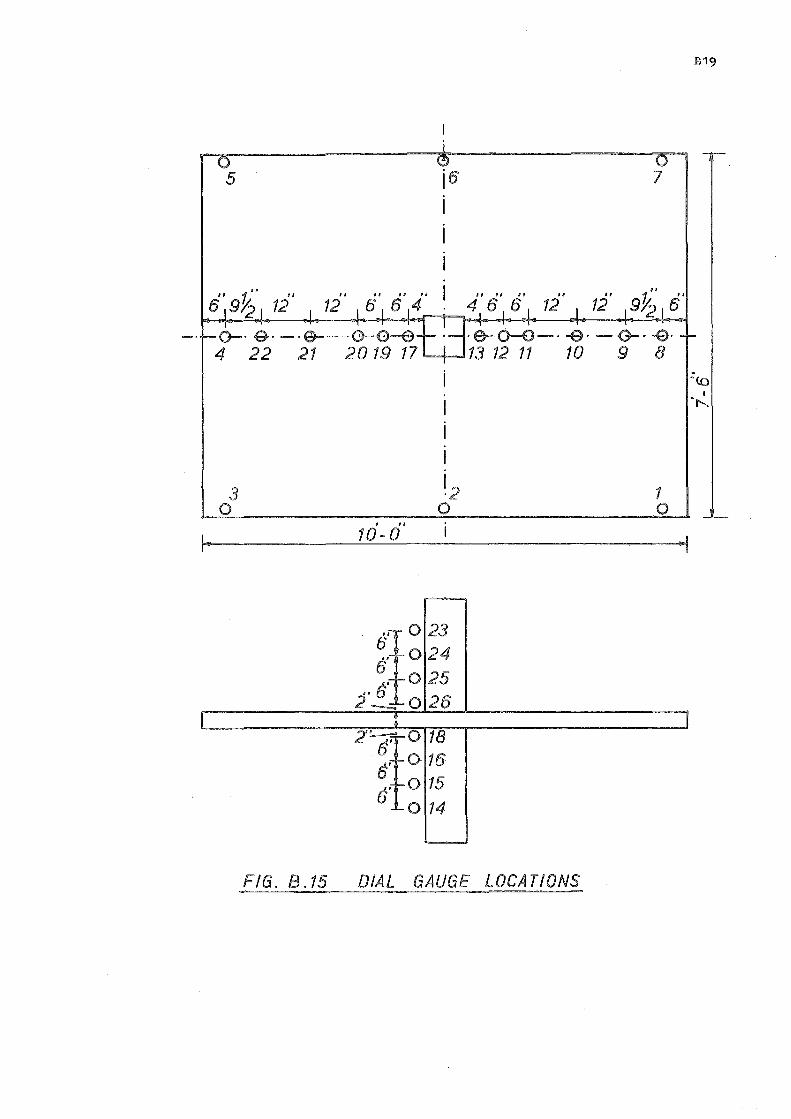
I
5
,, ,, '' ,, 12 6 6 4
j6 i I
7
0-· G· -·8-·-G-0-0 ·8-0-0-· --6· -0---E>· 4 22 21 20 19 17--13 12 11 10 9 8
3 0
1d-d'
61 ° 23
5' 0 24
5' 0 25
2- 0 26 : L,O 18
5' 0 16
er 0 15 0 14
FIG. B.15 DIAL GAUGE LOCATIONS
1 0
I

B20
which could be glued to bars of smaller diameters. Gauges of·these types
were tested initially and found to be satisfactory up to a strain of
8,000 microstrains. A rapid setting adhesive, Eastman 910, was used
and found to be most satisfactory. For waterproofing all strain gauges
petroleum based microcrystalline wax was used.
A 140-channel strain data logger was used to read strains for the
first six slab-column specimens tested. A digital voltmeter incorporated
in the logger provided output, in microstrains, on a typewriter. For the
remaining two tests the data logger was not available. The strain gauges
were wired to a switch box and strains were read by a Budd strain bridge.
The strain gauges behaved satisfactorily throughout all tests.
B.3.5 Crack Detection
Each specimen was painted white prior to testing to aid detection of
cracks. At each load increment cracks were observed with magnifying glasses
and marked with felt-tipped pens to give better definition in the photographs
of the specimen. Crack widths were also measured at selected points with
high magnification microscopes, capable of reading to 0.001 11 •
B.3.6 Sequence of Operations
At the start of each test an initial set of dial gauge and strain
gauge readings was taken before application of any load on the specimen.
The first loading that was applied was the constant axial load of 50 tons
on the column. Another set of dial gauge and strain gauge readings was
taken. The next operation was to suspend the 200 lb. weight concrete
blocks from the slab at 24 points. This loading was applied in a
symmetrical manner so as to avoid any unbalanced moment occurring at the
slab-column connection. Again a set of dial gauge and strain gauge readings
was taken. After this operation equal and opposite displacements were
applied to the edges of the slab. The increment for each edge displacement
was 0.1 in. The procedure at each increment was as follows:

B21
(i) Calculate the dial gauge readings at each corner of the slab
by adding 0.1 in. to the previous readings for the downward
loading end and deducting 0.1 in. from the previous readings
for the upward loading end.
(ii) Check column load.
(iii) Apply edge loads by tightening nuts on the high tensile bars to
bring the dial gauge readings at each corner to the required
marks.
(iv) Read dial gauges.
(v) Record all electrical resistance strain gauge readings.
(vi) Read load in the high tensile bars.
(vii) Mark cracks.